The changing limits and incidence of malaria in Africa: 1939-2009
94
CHAPTER 4 The Changing Limits and Incidence of Malaria in Africa: 1939–2009 Robert W. Snow,* ,† Punam Amratia,* Caroline W. Kabaria,* Abdisalan M. Noor,* ,† and Kevin Marsh* ,† Contents 4.1. Introduction 170 4.2. A Brief History of Malaria Control in Africa 171 4.2.1. Pre-second world war 171 4.2.2. 1948–1960: The global malaria eradication programme (GMEP) in Africa 172 4.2.3. 1960–1999: Post GMEP 173 4.2.4. 2000–2010: Roll Back Malaria 174 4.3. Defining the Absence of Malaria Risk 175 4.3.1. Excluding malaria risk based on reported absence and population density 175 4.3.2. The transmission limiting effects of temperature and aridity 178 4.3.3. Defining transmission stability within the spatial margins of risk in relation to control and elimination 179 4.4. The Changing Margins of Malaria Transmission in Africa 181 4.4.1. Changing boundaries and incidence of malaria in North Africa and Djibouti 181 4.4.2. Changing boundaries and incidence of malaria on the islands of Africa 190 Advances in Parasitology, Volume 78 # 2012 Elsevier Ltd. ISSN 0065-308X, DOI: 10.1016/B978-0-12-394303-3.00010-4 All rights reserved. * Malaria Public Health & Epidemiology Group, KEMRI-Wellcome Trust Collaborative Programme, Nairobi, Kenya { Centre for Tropical Medicine & Vaccinology, Nuffield Department of Medicine, University of Oxford, Oxford, United Kingdom 169 Author's personal copy
-
Upload
kemri-wellcome -
Category
Documents
-
view
0 -
download
0
Transcript of The changing limits and incidence of malaria in Africa: 1939-2009

Author's personal copy
CHAPTER 4
Advances in Parasitology, VISSN 0065-308X, DOI: 10.1
* Malaria Public Health &Kenya
{ Centre for Tropical MediOxford, United Kingdom
The Changing Limits andIncidence of Malaria in Africa:1939–2009
Robert W. Snow,*,† Punam Amratia,* Caroline W.
Kabaria,* Abdisalan M. Noor,*,† and Kevin Marsh*,†
Contents 4.1. Introduction 170
olum016/B
Epidem
cine &
e 78 # 2012978-0-12-394303-3.00010-4 All righ
iology Group, KEMRI-Wellcome Trust Collaborative Program
Vaccinology, Nuffield Department of Medicine, University of O
Elsets
me,
xfo
4.2. A
Brief History of Malaria Control in Africa 1714.2.1.
P re-second world war 1714
.2.2. 19 48–1960: The global malaria eradicationprogramme (GMEP) in Africa
1724.2.3.
19 60–1999: Post GMEP 1734
.2.4. 2 000–2010: Roll Back Malaria 1744.3. D
efining the Absence of Malaria Risk 1754.3.1.
E xcluding malaria risk based on reportedabsence and population density
1754.3.2.
T he transmission limiting effects oftemperature and aridity
1784.3.3.
D efining transmission stability within thespatial margins of risk in relation to control
and elimination
1794.4. T
he Changing Margins of Malaria Transmission inAfrica
1814.4.1.
C hanging boundaries and incidence ofmalaria in North Africa and Djibouti
1814
.4.2. C hanging boundaries and incidence ofmalaria on the islands of Africa
190vier Ltd.reserved.
Nairobi,
rd,
169

170 Robert W. Snow et al.
Author's personal copy
4.4.3.
C hanging boundaries of stable malaria riskand disease incidence in Southern Africa
2064
.4.4. M alaria control in Middle Africa: From GMEPpilots to RBM
2174.5. S
ummary and Discussion 2264.5.1.
C hanging limits in North Africa 2264
.5.2. T he successes and failures of malariaelimination on Africa’s islands
2334.5.3.
E limination and control efforts in SouthernAfrica
2354
.5.4. T he double dip recession 2374.5.5.
T he future 239Ackn
owledgements 239Refer
ences 240Abstract Understanding the historical, temporal changes of malaria risk
following control efforts in Africa provides a unique insight into
what has been and might be archived towards a long-term ambition
of elimination on the continent. Here, we use archived published
and unpublished material combined with biological constraints on
transmission accompanied by a narrative on malaria control to
document the changing incidence of malaria in Africa since earliest
reports pre-second World War. One result is a more informed
mapped definition of the changing margins of transmission in
1939, 1959, 1979, 1999 and 2009.
4.1. INTRODUCTION
Africa is often called the ‘‘heartland’’ of malaria. Certainly, malaria hasplayed a major role in shaping human evolution in Africa and remains amajor public health threat and impediment to economic development.Although malaria in Africa is often spoken of as if it were a single well-characterized situation, in fact, the epidemiology and ecology of malariaare extremely heterogeneous. Over recent years, an increasingly accuratepicture of the scale and heterogeneity of malaria in Africa has emerged.At the same time, there has been an increasing appreciation that themalaria situation is changing in many areas, with reports of falling trans-mission and disease burden in some but by no means all parts of thecontinent. It is assumed that many of these changes are related to deliber-ate intervention, and certainly, there has been a massive increase ininvestment in malaria control over the past 10 years, but it should notbe forgotten that the ecology of malaria is shaped by many factors includ-ing climate, human settlement, human behaviours and factors that may

The Changing Limits and Incidence of Malaria in Africa: 1939–2009 171
Author's personal copy
affect vector populations, all of which are subject to changes for a multi-tude of reasons.
Today, there is an increasing emphasis on the concept of ‘‘shrinkingthe map’’ of malaria with the initial aim of local elimination and the long-term aim of global eradication. To shrink a map, one has to begin byknowing the map accurately and how it may have changed in the past.Several attempts have been made over the last 60 years to define thelimits of malaria transmission using a variety of climate-driven con-straints on parasite and vector survival and reported case incidence(Boyd, 1930; Craig et al., 1999; Dutta and Dutt, 1978; Guerra et al., 2006,2008; Hay et al., 2009; Kiszewski et al., 2004; Le Lannou, 1936; Lysenkoand Semashko, 1968; Macdonald, 1957; Manguin et al., 2008; Pampanaand Russell, 1955; US War Department, 1944). These mapped productshave been difficult to use sequentially to understand the changing mar-gins and intensity of risk as each has used different methodologies andinput data. We aim here to define the boundaries of malaria risk in Africaby reviewing available documented case data together with the applica-tion of biological and human settlement criteria to define malaria risk atits natural extent and record how this has changed over the last century.In doing this, we have brought together for the first time data relating topast attempts to control and eliminate malaria in different parts of Africa.
4.2. A BRIEF HISTORY OF MALARIA CONTROL IN AFRICA
4.2.1. Pre-second world war
Following Sir Ronald Ross’s discovery of the role played by the mosquitoin the transmission of malaria in 1897, he travelled widely, includingAfrica (Egypt, Mauritius, Nigeria, Ghana, Sierra Leone and Zimbabwe),to promote environmental sanitation using "mosquito brigades" (Nye andGibson, 1997; Ross, 1902). Reference to Ross’s recommendations appearin many Colonial Administration Medical Department annual reportsfrom 1900 and the reduction of larval breeding sites became a publichealth priority after the First World War for many of the rapidly expand-ing urban centres in Africa. The discovery by Alphonse Laveran of theblood stages of the malaria parasite in French Foreign Legion troopsstationed in Algeria in 1880 (Bruce-Chwatt, 1981) and the effects of qui-nine as a therapeutic agent served as the second major approach tomalaria prevention among Europeans in Africa, starting before the FirstWorld War (Shah, 2010). ‘‘Quininisation’’ was practiced as a means ofpersonal prophylaxis or through mass drug administration, for example,in Dar es Salaam (Orenstein, 1914), the large towns of the Belgian Congo(Henrard and Van Hoof, 1933; Van den Branden and Van Hoof, 1923),

172 Robert W. Snow et al.
Author's personal copy
Sudan (Henderson, 1934), Tunisia (Husson and Nicolle, 1907) and Algeria(Sergent and Sergent, 1928). The clinical and epidemiological linkbetween sustained use of quinine, malaria and blackwater fever becamea major cause for concern early in the twentieth century, and its use as ameans of malaria prevention slowly declined through the 1950s (Foy andKondi, 1950; Graham, 1912; Shah, 2010).
Despite an early recognition of the economic impact malaria had onproductivity in the European colonies (League of Nations, 1933), a com-mon epidemiological portrayal of malaria at the time was that "Africans"were immune, asymptomatic carriers of infection (Bagster-Wilson, 1939;Bagster-Wilson and Wilson, 1937; Christophers, 1924; Garnham, 1949;James, 1929) and that this posed "threats" to the transmission of theparasite to Europeans. Emphasis was on protecting European settlersand prevention recommendations included the spatial distances neces-sary for separate African housing to limit risks to Europeans in SierraLeone (Christophers and Stephens, 1900) and Kenya (Paterson, 1928).
4.2.2. 1948–1960: The global malaria eradication programme(GMEP) in Africa
The Second World War marked a new era in drug discovery and thedevelopment of residual insecticides notably the 8-aminoquinolines suchas chloroquine (Sweeney, 2000) and dichlorodiphenyltrichloroethane(DDT) (Russell, 1951). These new tools signalled a moment of greatopportunity to tackle the public health burden posed by malaria, andimportantly for the time, the economic growth of colonial Africa(Colbourne, 1966; Macdonald, 1950; WHO, 1948). A report presented tothe World Health Organization (WHO) in 1948 states: ‘‘It is not enough toquote that about 3,000,000 deaths are caused yearly by malaria in theworld, or that every year about 300,000,000 cases of malaria occur. . .. . .that malaria is prevalent in tropical and subtropical areas where foodproduction and agricultural resources are potentially very high, and that,by affecting the mass of rural workers, it decreases their vitality andreduces their working capacity and thus hampers the exploitation of thenatural resources of the country. At a time when the world is poor, itseems that control of malaria should be the first aim to achieve in order toincrease agricultural output’’ (WHO, 1948).
Two years later at a conference in Kampala, the WHO recommended‘‘to governments responsible for the administration of African territoriesthat malaria should be controlled by modern methods as soon as feasible,whatever the degree of endemicity, and without awaiting the outcome offurther experiments’’ (Dobson et al., 2000; Najera et al., 2011; WHO, 1950).Immediately after the Second World War, almost every country in Africabegan using chloroquine and DDT. This varied in application and

The Changing Limits and Incidence of Malaria in Africa: 1939–2009 173
Author's personal copy
coverage but had become universal policy very quickly and adapted indifferent settings to achieve national ambitions of elimination or sub-national pilot elimination projects. However, not long after the launch ofthe Global Malaria Eradication Programme (GMEP), it was decided thatsub-Saharan Africa was not ready for elimination: ‘‘the prolonged periodof the transmission season and the extremely high degree of malariaendemicity in the region. . .’’ combined with weak infrastructure ‘‘. . .arelikely to form an effective barrier to a large-scale eradication programme’’(WHO, 1954).
4.2.3. 1960–1999: Post GMEP
Across Africa, malaria programmes gradually returned to an objective ofcontrolling, rather than eliminating risk and the GMEP defined control as‘‘the reduction of the disease to a prevalence where it is no longer a majorpublic health problem; the concept carries the implication that theprogramme will be unending, control having to be maintained by contin-uous active work’’ sometimes referred to as "pre-elimination" (WHO,1957, 1961). Despite this conclusion, several countries maintained elimi-nation ambitions through to the 1970s through the use chemoprophylaxis(Charmot, 1969; Hamon et al., 1963; Kouznetsov, 1979) and indoor resid-ual house spraying (IRS) with sustained use of DDT and to a lesser degreeother organochlorides such as benzene hexachloride (BHC), hexachloro-cyclohexane (HCH), Gammexane and dieldrin, organophosphates(including malathion and fenitrothion) and carbamates (including pro-poxur) despite mounting threats of vector resistance to these insecticideclasses (Hamon et al., 1963; Kouznetsov, 1976, 1977). Countries maintain-ing elimination strategies tended to be located at the margins of stable,endemic transmission in the northern and southern latitudes of Africaand the islands off the continental coast line. For the rest of central Africa,sustained control largely meant the treatment of febrile illness.
From the mid-1980s, trials began in Africa of a new approach to vectorcontrol based on the personal protection afforded by insecticide-treatedbed nets (ITNs) (Lines et al., 1985; Ranque et al., 1984; Snow et al., 1987;1988). By the mid-1990s, further large-scale trials across Africa had shownthat ITN provided significant, cost-effective protection against child mor-tality (Lengeler, 2004). However, the community coverage of ITN by 2004was minimal (Noor et al., 2009). By the late 1990s, the continent wasgripped by a spiralling decline in chloroquine efficacy, leading to wide-spread treatment failures, evidence of increasing mortality (Snow et al.,2001; Trape, 2001) and hailed as a public health disaster (White et al.,1999). This promoted the accelerated development, registration anddeployment of fast-acting artemisinin-based combination therapy (ACT)(White, 1999). However, in contrast to the rapid adoption after the Second

174 Robert W. Snow et al.
Author's personal copy
World War of chloroquine, a drug that would be difficult to register withregulatory authorities today, protracted policy dialogue (Attaran et al.,2004, 2006), difficulties in manufacture and distribution and nationalprocurement and regulation of ACTs have meant that these new medi-cines reached only a few people who needed them by 2009 (RBM, 2011).
4.2.4. 2000–2010: Roll Back Malaria
Following the recognition that malaria in Africa could not effectively beaddressed by the GMEP, 40 years lapsed before malaria control in Africabecame a significant part of international public health dialogue. A series ofinternational meetings and declarations during the late 1990s (Greenwoodet al., 2008; Kidson, 1992) led to launch of the Roll Back Malaria (RBM)movement in 1998 (Nabarro and Taylor, 1998). In April 2000, Africanleaders, meeting in Abuja, signed a declaration that said they would‘‘Halve the malaria mortality for Africa’s people by 2010, through imple-menting the strategies and actions for Roll BackMalaria’’ (WHO, 2000). Thiswas to be achieved by ensuring that at least 60% of at-risk populations wereprotected or treated with appropriate methods (WHO, 2000); subsequentlyredefined to 80% coverage by 2010 (WHO, 2005) and the bar raised evenhigher with the launch of the Global Malaria Action Plan (GMAP) in 2008that called for universal coverage with some form of vector control (RBM,2008). Where DDT and chloroquine were seen as the magic bullets formalaria elimination during the era of the GMEP, ITNs, ACTs and newrapid diagnostic tests were the exciting new tools during the RBM era.From its inception, RBM concentrated on ‘‘high-burden countries’’, theresult of which was that Africa was for the first time in malaria controlhistory centre stage of an international effort to tackle malaria.
Underpinning the recent wave of international interest in malariacontrol has been a concerted effort to articulate the economic burden andinequities posed by malaria, creating a poverty trap (Gallup and Sachs,2001; Sachs andMalaney, 2002; Sachs andMcArthur, 2005). This evidencebase increased the profile of malaria as a broad development issue, effec-tively levered support from key international partners (World Bank, 1993)and put malaria on the global development map articulated in the Millen-nium Development Goals (MDGs) (Sachs and McArthur, 2005). Despitethe unquestionable health burden posed by malaria, making an economicargument for its control has been necessary during each wave of interna-tional interest in funding its control and elimination since the 1930s.
The Global Fund to fight AIDS, Tuberculosis and Malaria (GFATM)was established in 2002 to make available large-scale funding to helpachieve health-related MDGs (Feachem and Sabot, 2006). In 1998, spend-ing onmalaria control globally was around 100 million USD (NarasimhanandAttaran, 2003). Between 2002 and 2009, the Global Fund had approved

The Changing Limits and Incidence of Malaria in Africa: 1939–2009 175
Author's personal copy
5.6 billion USD for malaria grants to African countries. This has beenaccompanied by a significant increase in direct bilateral support formalaria (Snow et al., 2010a). The launch of the President’s Malaria Initia-tive (PMI) in 2006 massively changed the funding landscape in Africa(PMI, 2009). By 2009, 21 African countries had sufficient combined percapita annual donor assistance to meet the targets established at Abuja in2000 (Snow et al., 2010a). In 2007, a commitment to a global eradicationstrategy re-emerged (BMGF, 2007; Feachem and Sabot, 2008; Roberts andEnserink, 2007) and the GMAP, launched in 2008 by the RBM partnership,reflected this renewed ambition—a malaria free world (RBM, 2008).
4.3. DEFINING THE ABSENCE OF MALARIA RISK
The territories and boundaries of nation states across Africa have changedconsiderably over the past 100 years through colonization by the Otto-mans and Europeans, wars and struggles for independence. Throughoutour descriptions of risk, we have regarded as separate nation states thosethat exist today (Fig. 4.1), but in reviewing reported intervention cover-age, clinical evidence and changing risk, it is important to recognize thechanging governance boundaries over the past century and where appro-priate these are defined throughout.
4.3.1. Excluding malaria risk based on reported absence andpopulation density
Plasmodium falciparum transmission probably reached its natural extent inAfrica around 1900 (Carter and Mendis, 2002), and few African countrieshave been completely free from malaria transmission over the last 100years. The Kingdom of Lesotho (Basutoland pre-1966) is the highestcountry in the world with 80% of the population living higher than1800 m above sea level and has always been regarded as malaria free(Russell, 1956). The Islands of the Seychelles archipelago, Tromelin, Car-gados Carajos, Agalega and Rodriguez, Saint Brandon and Chagos in theMascarene archipelago were documented in the 1950s as being unable tosupport malaria transmission. Similarly, the island of St. Helena, in theAtlantic Ocean, regarded by the UN as part of Africa, has not supportedmalaria transmission (Russell, 1956). The Western Sahara is a barren, aridarea that in 1956 was reported by the Spanish governing authorities to becompletely free from transmission (WHO-Spanish Morocco, 1955).A careful assembly of historical evidence of risk in the Union of SouthAfrica pre-1940s suggests that malaria was absent from large parts of thewestern part of the country (Sharp and Le Sueur, 1996) and the borderingsouthern areas of Namibia and Botswana (De Meillon, 1951; Franco de

FIGURE 4.1 The margins of stable P. falciparum transmission at its presumed natural extent (pre-1939). Dark grey representing no malaria risk;
light grey biologically suitable transmission but population density less than 0.01 people per km2; green represents areas of unstable transmission;
dark pink areas show stable transmission. Although the Western Sahara remains unrecognized by the UN, we consider here as an independent
territory within Africa. The Federation of Rhodesia and Nyasaland formed a semi-autonomous state between 1954 and 1963 before it became three
Author's personal copy

British governed countries of Southern Rhodesia, Northern Rhodesia and Nyasaland but throughout regarded as independent Zimbabwe, Zambia
andMalawi, respectively; Eritrea and Ethiopiawere officially recognized as separate nations in 1993; more recently, South Sudan and The Republic of
Sudan separated in July 2011. Two small territories within the Kingdom of Morocco continue to be occupied by Spain in the North West (Ceuta) and
North-East (Melilla) on the Mediterranean coastline to this day; however, we considered part of the Kingdom approximating to its Ottoman extent
before 1912. The United Arab Republic of Egypt lost the Sinai Peninsula to Israeli forces during the 6-day war of 1967. This disputed territory was not
fully restored to Egypt until after the partial reoccupation by President Sadat as part of the October War in 1973 and negotiated return to Egypt in
1979.We consider the Sinai Peninsula as part of UAR Egypt, and hence the African continent, throughout the entire period under review. In Libya, the
Eastern coastal cities have always been regarded of unstable transmission and this intelligence has been used to indicate this area as unstable (light
pink). The area of present day Namibia became a German Imperial Protectorate in 1884 and was made a South African Mandated Territory after the
First World War. Until independence Namibiawas referred to as German South-West Africa. The war for independence from South Africa intensified
from 1973 with the international recognition of the South-West Africa People’s Organization (SWAPO) that eventually resulted in an end to South
African rule in 1988 and Namibian independence in March 1990.The small territory of Walvis Bay, mid-way along the Namibian coast, was part of the
Union and Republic of South Africa up to 1994, but we treat as part of the Republic of Namibia throughout all presentations of risk. AfriPOP
population surfaces for each country were downloaded from www.afripop.org and re-sampled from 100 m resolution to 5 km in ArcGIS 10 (ESRI,
Redlands, CA, USA). These were then reclassed to identify 5�5 km grid squares that reported less than 1 person per 100 km2 (population
density<0.01 persons per km2). Areas that are biologically suitable for transmission but where populations are less than 0.01 km2 within a
contiguous area are shown in light grey in the figure. These often represent game reserves, conservation areas or deserts. Unsuitable areas for P.
falciparum transmission are shown in dark grey, and based on (a), medical intelligence from Djibouti, South Africa, Namibia and Botswana has been
used to define no risk (see text for details). The Kingdom of Morocco’s range of transmission intensity and risk mapped extensively by Hoeul and
Donadille (1953) and Houel (1954) that mapped pre-elimination extents and the progress of elimination since 1948. These mapped ranges have been
combined with the aridity mask to identify the natural extent of malaria in the Kingdom; (b) Temperature Suitability Indices generated at 1� 1 km
resolutions as described by Gething et al. (2011), and constructed using monthly synoptic mean, maximum, and minimum temperature records
obtained from 30-arcsec (� 1� 1 km) spatial resolution climate surfaces (Hijmans et al., 2005) converted using spline interpolation to a continuous
time series representing a mean temperature profile across an average year incorporated into a biological model of sporogyny.TSI values above zero
for P. vivax are more ubiquitous across Africa suggesting transmission at higher altitudinal and wider latitudinal limits, including the highlands of
Kenya, Reunion, Madagascar and Ethiopia (Gething et al., 2011), but these are harder to interpret given the absence of reported transmission in these
areas even when P. vivax is prevalent in these countries and (c) areas of extreme aridity (Guerra et al., 2008) based on the enhanced vegetation index
(EVI) derived from the MODerate-resolution Imaging Spectroradiometer (MODIS) sensor imagery, available at approximately 1� 1 km spatial
resolution (Guerra et al., 2008; Scharlemann et al., 2008). Temporal Fourier-processed, monthly EVI surfaces were used to develop 12 monthly
surfaces that reclassified EVI�0.1 (arid) and >0.1 (non-arid) (Guerra et al., 2008). All rivers and lakes shown from single source: Global Lakes and
Wetlands Database (GLWD) (Lehner and Doll, 2004).
Author's personal copy

178 Robert W. Snow et al.
Author's personal copy
et al., 1984a; Ministry of Health, 2001; MoHSS, 1996). These sub-nationallimits of risk based on medical intelligence in Southern Africa have beendigitized and excluded as part of the historical range of malaria transmis-sion in Africa.
The presence of human hosts is clearly necessary to perpetuate trans-mission of the four malaria parasites that affect man in Africa. Earlierdescriptions of malaria risk have applied the crude limits of unpopulated,barren areas across the Sahara desert and other low population densitydesert areas in southern Africa (Boyd, 1930; Lysenko and Semashko, 1968;Manguin et al., 2008; Pampana and Russell, 1955). More informedapproaches to excluding human infection risks based on populationdensity (�1 person per km2) were implemented by Guerra and colleaguesusing global population surfaces developed by the Global Rural UrbanMapping Project (GRUMP) (Balk et al., 2006; Guerra et al., 2006). Thesemasks were subsequently felt to be too imprecise due to the resolutionand quality of the population input data used by GRUMP to describe thedistribution of human settlement in Africa (Hay et al., 2009). A newhuman population settlement map has recently been developed employ-ing considerably more input data at higher spatial and temporal resolu-tions that has substantially improved the modelled spatial predictions at0.1�0.1 km resolutions of population density in Africa (Afripop, 2011).Here, we have used these spatial data, re-sampled to 5�5 km, to quanti-tatively define the spatial limits of parasite transmission based on aconservative definition�0.01 people per km2 (Fig. 4.1). This mask servesas a visual guide to the spatial limits of human malaria transmission andpresumes that extremely sparsely populated areas of Africa today corre-spond to similar settlement patterns over the last century where transmis-sion is biologically suitable.
4.3.2. The transmission limiting effects of temperature andaridity
Both altitude (a proxy for low ambient temperature) and deserts havebeen used to define the absence of malaria transmission in most previousiterations of global malaria maps (Boyd, 1930; Dutta and Dutt, 1978).Temperature plays a key role in determining the transmission of humanmalaria based on its relationship with the duration of sporogony and isparticularly relevant to Plasmodium vivax and P. falciparum (Nikolaev,1935). To provide a plausible mask to eliminate the possibility of trans-mission across Africa, we have used a recently developed temperaturesuitability index (TSI) (Gething et al., 2011). The TSI model uses abiological framework based on survival of vectors and the fluctuatingmonthly ambient temperature effects on the duration of sporogony thatmust be completed within the lifetime of a single generation of

The Changing Limits and Incidence of Malaria in Africa: 1939–2009 179
Author's personal copy
Anophelines. This was used to generate at each 1�1 km pixel periods ofan average year when a vector’s lifespan would exceed the time requiredfor sporogony, and hence when transmission was not precluded bytemperature. If this time exceeded the maximum feasible vector lifespan,then the cohort was deemed unable to support transmission and the areaclassified as being at zero risk (Gething et al., 2011). Here, we have used aTSI value of zero for P. falciparum to represent no transmission and TSIvalues above zero as areas able to sustain some parasite transmission. TheP. falciparum temperature mask highlights the highland areas and moun-tains of East Africa, the southern mountains of Tanzania, the mountains atthe junction of Democratic Republic of Congo, Rwanda and Burundi, thehighlands in Ethiopia, Mount Cameroun, the Shimbiris mountains inSomaliland, the Nyika Plateau in Malawi andMount Nyangani in EasternZimbabwe (Fig. 4.1).
The second important environmental constraint on transmission isthe effect of arid conditions on anopheline development and survival(Shililu et al., 2004). Limited surface water reduces the availability ofsites suitable for oviposition and reduces the survival of vectors at allstages of their development through the process of desiccation (Grayand Bradley, 2005). The ability of adult vectors to survive long enoughto contribute to parasite transmission and of pre-adult stages to ensureminimum population abundance thus depends on the levels of aridityand species-specific resilience to arid conditions. We have definedextreme aridity using the enhanced vegetation index (EVI) and useddata from 12 monthly surfaces to classify into areas likely to supporttransmission, defined by an EVI of greater than 0.1 for any two consec-utive months and areas without two or more consecutive months of anEVI>0.1 as unable to support transmission (Guerra et al., 2006, 2008).This aridity mask identifies small foci of risk across the Sahara that arelikely to support transmission because of their proximity to oases andseasonal rivers while retaining a plausible mask of virtual zero trans-mission across the Sahara, in extremely arid areas that make up largeareas of the Horn of Africa and in southern Africa through the ariditylimiting effects of the Kalahari, the Sossusvlei and the Skeleton Coast(Fig. 4.1).
4.3.3. Defining transmission stability within the spatial marginsof risk in relation to control and elimination
The stable–unstable classification was first introduced into malariologyby Sir Ronald Ross (Ross, 1916) and adapted by GeorgeMacdonald for themeasurement of malaria endemicity where stability was defined quanti-tatively by the average number of feeds that a mosquito takes on manduring its life (Macdonald, 1952, 1957). The measurement of Macdonald’s

180 Robert W. Snow et al.
Author's personal copy
stability index demands detailed entomological data that are rarely avail-able. Qualitatively, stable malaria refers to situations that are relativelyinsensitive to natural and man-made changes and unstable malariaincludes areas very sensitive to climatic aberrations and very amenableto control with ranges of intermediate stability between these extremes.These qualitative concepts of stability are still in use today.
Critical to the planning of malaria elimination during the GMEP was aquantitative description of risk for planning control and monitoring prog-ress. During the preparatory phase, large-scale parasite prevalence surveyswere undertaken to examine feasibility of elimination. During the attackphase, the aim was to reduce prevalence and incidence to interrupt trans-mission within 12–18 months and then remove the last reservoir of infec-tions within a further 24–30 months. Towards the end of attack phase,parasite prevalence was deemed impractical to monitor effectively andmalaria incidence became the key monitoring metric. It was suggestedthat when infection prevalence fell below 2%, national programmesshould invest in combinations of passive, active and mass-blood surveysurveillance of new infections, expressed as an annual parasite incidence(API) per 1000 people resident in a reporting administrative area. Addi-tional measures have been variously included but not as regularlyreported including average blood slide examination rates and slide posi-tivity rates (Pampana, 1969; Pull, 1972; Ray and Beljaev, 1984; Yekutiel,1960). When the API was less than 1 per 10,000, the consolidation phasestarted and comprehensive use of prevention was in theory stopped. APIwas originally set at 5 per 10,000, but experience showed that nationalprogrammes often overestimated the coverage and completeness of theirsurveillance. The consolidation phase maintained a targeted control com-ponent, guided by active case detection to eliminate residual foci ofparasite reservoirs. The duration of the consolidation phase was highlyvariable (Russell, 1956), but migration to the maintenance phase was usu-ally initiated after 3 years without local transmission. Theoretically, themaintenance phase included the introduction of measures to prevent thereintroduction of malaria.
Several authors have recently revisited the epidemiological definitionsused to signal transitional points from sustained malaria control and apathway towards elimination (Cohen et al., 2010; Feachem et al., 2010a,b;Hay et al., 2008, 2009). In practical terms, it has been generally consideredthat a parasite prevalence of less than 1% during peak transmission in arepresentative sample of the country, or lower administrative area, withprevalence in sub-populations of less than 5% (allowing for over-disper-sion of risk) would constitute a situation referred to as low-stable endemic-ity and governments may elect to hold this line for disease control (Cohenet al., 2010). Conditions based on parasite prevalence lower than 1%become very difficult to measure and qualitatively represent unstable

The Changing Limits and Incidence of Malaria in Africa: 1939–2009 181
Author's personal copy
conditions. Hay and colleagues regard unstable transmission as repre-sented by an API of less than 1 per 10,000, and this approach is used incurrent mapping of malaria risk worldwide (Guerra et al., 2008; Hay et al.,2009). There is also a growing recognition that zero transmission is bothimpossible to measure and too strict a definition in areas where vectorspersist and immigration of infected hosts is high, especially in areaswhere the environmental criteria necessary to sustain further transmis-sion exist. For example, the United States of America has experiencedmultiple autochthonous transmission events since it was declaredmalariafree in 1956 (Mali et al., 2009). As such elimination is presently regardedas a state where interventions have interrupted endemic transmission andlimited onward transmission from imported infections below a thresholdat which risk of reestablishment is minimized (Cohen et al., 2010).Throughout our current description of risk, we have used API as ameasure of stability and reported documented presence and absence oftransmission to define the margins of risk.
4.4. THE CHANGING MARGINS OF MALARIATRANSMISSIONIN AFRICA
The fixed long-term average climatic conditions together with reportedabsence of transmission provide a natural maximal extent of possiblemalaria transmission in Africa (Fig. 4.1). However, these margins havechanged over the past 100 years through systematic control, eliminationand prevention of resurgent risks. We review the effects of scaled inter-ventions that were mounted since the first reported efforts of aggressivecontrol in North Africa, including the aberrant changes in the Republicof Djibouti, the islands of Africa in the Atlantic and Indian Oceansand countries in Southern Africa (South Africa, Botswana, Namibia,Zimbabwe and Swaziland). These countries represent the historicalmargins of Africa’s stable and unstable transmission, and it is importantto define how these limits have contracted and expanded since 1900.
4.4.1. Changing boundaries and incidence of malaria in NorthAfrica and Djibouti
4.4.1.1. MoroccoFollowing the first world war, focal attempts at using biological control, aprotracted period of quinine prophylaxis from 1929, followed by the use ofatebrineþpraequine (chloroquine-like drugs) in late 1930s and limited useof pyrethrum insecticides deployed in areas of agricultural significancewere variously promoted to control malaria across the country (Gaud andSicault, 1938; Vialatte, 1923). After the Second World War, Hoeul and

182 Robert W. Snow et al.
Author's personal copy
Donadille (1953)mapped the extents of highest transmission along the coastfrom Tanger at the point of the Mediterranean to Casablanca further southon the Atlantic coast stretching inland along rivers and irrigation areas butdeclining in intensity towards the Atlas mountains and the desert fringeareas where foci were identified around oases. The main vectors were An.labrachiae in the north and central parts of Morocco, a vector refractory toP. falciparum and supports only P. vivax transmission (De Zulueta et al.,1975), and An. sergentii perpetuating both P. vivax and P. falciparum acrossthe entire country (Guy and Holstein, 1968). In 1948, DDT had been intro-duced for IRS to supplement radical case treatment and control in 33 peri-urban areas and 28 rural zones augmenting special engineering projectscombined with larviciding in irrigation areas. The case incidence declinedsignificantly by the late 1950s; from this point, the Gharb region contributedmore than a third of all cases; overall transmission had been reduced to onlynine mapped focal areas (Houel, 1954; Hoeul and Donadille, 1953). By theearly 1960s, 70% of clinical infections were caused by P. vivax (Guy, 1963).From 1968, a renewed effort was launched to eliminate malaria from theremaining fociwhich succeeded in reducing case incidenceuntil a resurgentrisk of malaria in the 1980s. At this time, all new cases were reported asvivax, and by 1974, it was assumed that the Kingdom of Morocco wasfalciparum free. Foci of vivax transmission continued to exist through the1990s to 2000 in Al Hoecima, Chefchaouen, Taounate and Khouribga pro-vinces. Chefchaouen, in the rice growing in the North West, 85 km southeast of Tanger remained the last focus of P. vivax transmission by 2000principally transmitted by An. labranchiae (Faraj et al., 2003, 2008, 2009).In 2004, the last case of locally acquired P. vivax infections was reportedfrom this area and theKingdomwas certifiedmalaria free in 2010. The long-termmultiparasite case incidence data have been assembled frommultiplesources and shown in Fig. 4.2.
4.4.1.2. AlgeriaIn 1904, the Antimalaria Department was established under the directionof the Institute Pasteur and headed by Etienne Sergeant (Dedet, 2008).Leading up to the First World War, environmental management domi-nated approaches to prevention around settler’s farms on the Mitidjaplain and the railway. Between the World Wars, quinine prophylaxiswas promoted for French settler populations and their work force withcontinued experimentation with environmental control (drainage, canali-zation, bush clearing and removal of permanent swamps) (Ciavaldini,1917; Foley, 1923; Sergent and Sergent, 1928). These activities systemati-cally expanded across the three Departments of Oran, Constantine andAlgiers until the end of the SecondWorldWar. Between 1948 and 1953, anaverage of 5300 cases of malaria per year were reported in Algeria (WHO-Algeria, 1956). In 1948, DDT was introduced for IRS and became the

Ann
ual m
alar
ia in
cide
nce
(per
10,
000
popu
latio
n)
1928
1933
1938
1943
1948
1953
1958
1963
1968
1973
1974
1979
1984
1989
1994
1999
2004
2009
400
300
200Moroccodeclared
malaria freein 2010
100
600
0
500
Ann
ual m
alar
ia in
cide
nce
(per
100
,000
pop
ula
tion)
4
3
2
1
6
0
5
FIGURE 4.2 Kingdom of Morocco. Annual malaria case incidence (both species) per
10,000 per annum 1928–1973 (left hand panel) and slide-confirmed P. vivaxmalaria 1974–
2010 per 100,000 population (right hand panel). Last confirmed P. falciparum case
detected in 1979. Note case incidence in 1973¼ 1.03 per 10,000 population, 3 vivax
cases detected in 2000 and 19 case in 2002, no cases detected in 2001 and 2003 and one
case notified in 2004. Case data derived for 1930–1933 (Gaud, 1947); 1934–1945 (Hoeul
and Donadille, 1953); 1946–1962 (Guy, 1963); 1963 and 1964 (El Aouad, 2009); 1965, 1978
and 1979 (WHO, 1992); 1966–1977, 1980–1981 and 1998 (El Aouad, 2009); 1982–1997 (WHO,
1999); 2002–2010 (WHO-Morocco, 2010). Population has been sourced for 1925–1955
(Goldewijk and Batthes, 1997); 1960–2010 (H-C au Plan, Royaume du Maroc, 2011).
Intercensal growth rates used to compute non-census year population size.
The Changing Limits and Incidence of Malaria in Africa: 1939–2009 183
Author's personal copy
mainstay of control with supporting larval control and use of atebrine andplasmochine as mass drug administration and prophylaxis (Parrot et al.,1946). The focus continued to be on the reduction of transmission in Oran,Constantine and Algiers to protect areas widely settled by French immi-grants since the 1830s who were able to lobby political support throughdirect government representation in Paris (Guy and Gassabi, 1967). Thebloody Algeria war ended 132 years of French rule in 1962 but delayed adeclaration of malaria elimination ambitions until 1968 when there wereover 95,000 cases reported per year (Fig. 4.3). The eradication programmein the newly independent Algeria was rapidly successful; by 1978, only 30locally acquired cases of P. vivax were reported in foci in the middle ofAlgeria (Benzerrough and Janssens, 1985; Hammadi et al., 2009). Here, weassume that by 1978 P. falciparum and P. vivax had been eliminated in thenorthern territories, focal transmission occurred in the middle of thecountry and both P. falciparum and P. vivax remained through 1980 inthe southern-most regions. In 1981, Khemis el Kechna represented nearlyall of the autochthonous cases detected in Algeria that year (51 cases) andall were P. vivax (Benzeroug and Wery, 1985; Benzerrough, 1990).Between 1980 and 2007, only 300 confirmed, locally acquired cases werereported (Fig. 4.3). Importantly between 1985 and 2007, all cases were

Ann
ual m
alar
ia in
cide
nce
(per
100
,000
pop
ula
tion)
Ann
ual m
alar
ia in
cide
nce
(per
100
,000
pop
ula
tion)
14
12
10
8
6
4
2
16
0
0.5
0.4
0.3
0.2
0.1
0.0
1954
1977
1982
1987
1992
2002
2007
1997
1948
FIGURE 4.3 Algeria: Annual malaria incidence per 10,000 population 1948–1954 (left
hand side) and per 100,000 population 1977–2009 (right hand side). Annual malaria case
data sourced from multiple sources: 1948–1953 (WHO-Algeria, 1956); 1954 (WHO, 1957);
1977–1984 (Benzerrough and Janssens, 1985); 1985–2007 (Hammadi et al., 2009);
2008–2009 (Richard Cibulskis, Personal Communication). Case data converted to annual
incidence between 1948 and 1960 (Goldewijk and Batthes, 1997); 1969–1984 (CICRED,
1974) and census data for the years 1998 and 2008 from ONS, Algeria (2011). Between
census years intercensal growth rates computed to estimate populations. Note no case
data available for review for period 1955–1976; zero cases reported in years 1985, 1989
and 2009; Annual incidence in 2005 and 2006 was 0.003 cases per 100,000 population.
184 Robert W. Snow et al.
Author's personal copy
reported from the southern region among an average annual populationof 100,000 residents and represented an average annualized incidence ofless than 1 locally acquired P. falciparum case per 10,000 population at risk(Boubidi et al., 2010; Hammadi et al., 2009). Small residual foci ofP. falciparum and P. vivax transmission continued to be reported at Tin-zaouatine in the south between 2003 and 2007, thought to be a result ofsuitable local conditions for the vectorAn. sergentii, and the area is locatedon the trans-Saharan highway connecting Algeria to Mali and Niger(Boubidi et al., 2010). There were no locally acquired cases in 2009 and2010 (Richard Cibulskis and Ryan O’Neil, Personal Communication).
4.4.1.3. TunisiaPrior to the First World War larval control, environmental managementand ‘‘quininization’’ were focused in areas of European settlement(Husson and Nicolle, 1907; Sergent and Sergent, 1906). Epidemics in1911 and 1933 in Tunisia served as incentives for government responsesand public health action. The epidemic of 1932–1933 doubled the caseincidence in all provinces compared to 1927–1931 (Chadli et al., 1985) andresulted in 10,000 deaths in the lakeside area of Khelbia (WHO-Tunisia,

The Changing Limits and Incidence of Malaria in Africa: 1939–2009 185
Author's personal copy
1956). During the years 1934–1944, similar approaches to malaria controlto those designed by Algeria were implemented including the use oflarviciding and the mass chemoprophylaxis in the regions of Cap Bonand Gabes with premaline (properties of primaquine/chloroquine)(Decourt et al., 1936; Wassilieff, 1938; WHO-Tunisia, 1956). Over11 years after the Second World War, 1944–1954, an average of 6500cases per year were reported in Tunisia among an average populationof 3.8 million people, approximating to 17 cases per 10,000 population atrisk (WHO-Tunisia, 1956; Fig. 4.4). By 1955, amodiaquine was the pre-ferred drug for prophylaxis. The Tunisian Republic gained independencefrom France in 1957; between 1961 and 1966, an aggressive approach tomalaria control was mounted using DDT and a malaria elimination cam-paign was announced by the Government of Tunisia in 1967. All of theNorthern provinces, where the dominant vectors are An. labranchiae andAn. multicolor, were malaria free by 1968 (Ambroise-Thomas et al., 1976).Between 1968 and 1977 activities included nationwide active case detec-tion and radical treatment alongside focal IRS with DDT and larviciding.By 1972, Tunisia had entered the consolidation phase of elimination andthe foci of remaining transmission were located in most southerly partof Sfax Governorate, and the three southern Governorates of Gafsa,Gabes and Medenine where transmission was predominantly by An.sergentii. The last three autochthonous P. vivax cases of malaria wereofficially recorded in 1979. A large-scale school-based serological surveywas conducted between 1990 and 1991 across 20 Governorates including
60
50
40
30
10
70 3
Last autochthonouscase declared in
1979
2
2
1
1
00No data
1934
1939
1944
1949
1954
1959
1964
1969
1970
1975
1980
1985
1990
1995
Ann
ual m
alar
ia in
cide
nce
(per
10,
000
popu
latio
n)
Ann
ual m
alar
ia in
cide
nce
(per
100
,000
pop
ula
tion)
20
FIGURE 4.4 Tunisia. Annual malaria case incidence per 10,000 1934–1969 (left hand
panel) and slide confirmed, locally acquired case incidence per 100,000 1970–1995 (right
hand panel). Case data from 1935–1938 to 1955–1978 (Chadli et al., 1985); 1944–1954
(WHO- Tunisia, 1956); 1980–1995 (Mondher, 2010); No data available for review for the
periods 1939–1943. Population data for whole country used to reflect national changes in
incidence from 1925 to 1955 (Goldewijk and Batthes, 1997); 1966, 1975, 1984, 1994 and 2004
(National Institute of Statistics, Tunisia, 2011). Non-census years computed using annual
intercensal growth rates.

186 Robert W. Snow et al.
Author's personal copy
approximately 38,000 children none of whom were seropositive forP. falciparum or P. vivax. The 10 years after 1979 covered a maintenancephase that included active case detection in the ‘‘hot-spot’’ areas ofsouthern Tunisia, nationwide passive case detection accompanied byhealth worker awareness and active follow-up of infected travellers.
4.4.1.4. LibyaThe Kingdom of Libya was historically characterized by very focal trans-mission around oases and settled farmlands in the southern region ofFezzan sustained byAn. sergentii andAn. multicolor (Ramsdale, 1990) and inthe less arid areas to theWest in Tripolitania maintained predominantly byAn. multicolor. An. labranchaie is limited in its extent to a small coastal stripwest of Tripoli (Manguin et al., 2008). Following the Italian occupation ofLibya, between 82 and 300 cases of P. vivaxwere reported from Tripolitania(Anon, 1944-1950). In the south, it was presumed that P. falciparum wasmore significant compared to vivax (Gebreel, 1982). The densely populatedMediterranean coastal cities towards the East were not thought to sustainsignificant transmission (Gebreel, 1982). In 1954, the health and sanitationdivision of the United States OperationMission (USOM) initiated a malariacontrol programme (Anon, 1957). The first campaign, using DDT andmassdrug administration with Resochin (chloroquine), began in August 1955covering 31 localities and reaching 51 localities by 1957 protecting approxi-mately 23,300 people across the Fezzan Oases. In 1957, this was extendedfurther to the Taourga Oases. The WHO then began a partnership with theKingdom of Libya to launch a campaign of nationwidemalaria elimination.Following on from the USOM collaboration, the renewed elimination cam-paign achieved rapid success with only 28 cases being reported by 1963(Gebreel et al., 1985). No locally acquired P. falciparum or P. vivax caseswerereported in the Eastern region of Cyrenaica or Tripolitania from 1963. Casescontinued to be reported from Fezzan in theWest including a resurgence offalciparum malaria between 1964–65 through to 1968 when King Idiris Iwas overthrown and the Libyan Arab Jamahiriya was established. Between1968 and 1973, only 14 vivax autochthonous cases were documented inFezzan (Gebreel et al., 1985). There were no locally acquired cases reportedafter 1973, and while the country was declared malaria free, in September1980, an outbreak of vivax malaria, involving 18 subjects, occurred inZuara, a coastal town surrounded bymarshland 70 km east of the Tunisianborder 120 km west of Tripoli and thought to have been introduced bymigrant workers (Gebreel et al., 1985).
4.4.1.5. EgyptAcross Egypt, both the extent and intensity of malaria risk have changedover the past 150 years. The building of the Suez Canal under Frenchcontract in 1869, the rapid irrigation of the Nile for agriculture including
The Changing Limits and Incidence of Malaria in Africa: 1939–2009 187
Author's personal copy
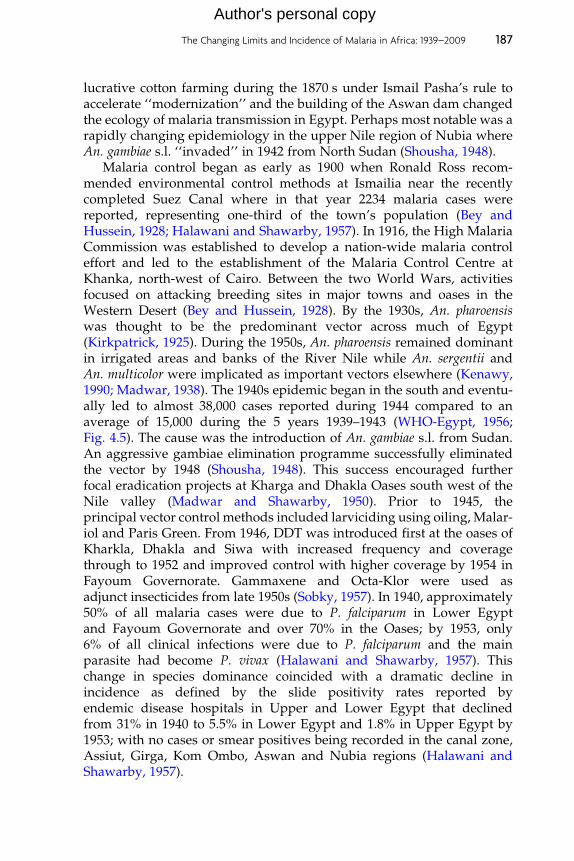
lucrative cotton farming during the 1870 s under Ismail Pasha’s rule toaccelerate ‘‘modernization’’ and the building of the Aswan dam changedthe ecology of malaria transmission in Egypt. Perhaps most notable was arapidly changing epidemiology in the upper Nile region of Nubia whereAn. gambiae s.l. ‘‘invaded’’ in 1942 from North Sudan (Shousha, 1948).
Malaria control began as early as 1900 when Ronald Ross recom-mended environmental control methods at Ismailia near the recentlycompleted Suez Canal where in that year 2234 malaria cases werereported, representing one-third of the town’s population (Bey andHussein, 1928; Halawani and Shawarby, 1957). In 1916, the High MalariaCommission was established to develop a nation-wide malaria controleffort and led to the establishment of the Malaria Control Centre atKhanka, north-west of Cairo. Between the two World Wars, activitiesfocused on attacking breeding sites in major towns and oases in theWestern Desert (Bey and Hussein, 1928). By the 1930s, An. pharoensiswas thought to be the predominant vector across much of Egypt(Kirkpatrick, 1925). During the 1950s, An. pharoensis remained dominantin irrigated areas and banks of the River Nile while An. sergentii andAn. multicolor were implicated as important vectors elsewhere (Kenawy,1990; Madwar, 1938). The 1940s epidemic began in the south and eventu-ally led to almost 38,000 cases reported during 1944 compared to anaverage of 15,000 during the 5 years 1939–1943 (WHO-Egypt, 1956;Fig. 4.5). The cause was the introduction of An. gambiae s.l. from Sudan.An aggressive gambiae elimination programme successfully eliminatedthe vector by 1948 (Shousha, 1948). This success encouraged furtherfocal eradication projects at Kharga and Dhakla Oases south west of theNile valley (Madwar and Shawarby, 1950). Prior to 1945, theprincipal vector control methods included larviciding using oiling, Malar-iol and Paris Green. From 1946, DDT was introduced first at the oases ofKharkla, Dhakla and Siwa with increased frequency and coveragethrough to 1952 and improved control with higher coverage by 1954 inFayoum Governorate. Gammaxene and Octa-Klor were used asadjunct insecticides from late 1950s (Sobky, 1957). In 1940, approximately50% of all malaria cases were due to P. falciparum in Lower Egyptand Fayoum Governorate and over 70% in the Oases; by 1953, only6% of all clinical infections were due to P. falciparum and the mainparasite had become P. vivax (Halawani and Shawarby, 1957). Thischange in species dominance coincided with a dramatic decline inincidence as defined by the slide positivity rates reported byendemic disease hospitals in Upper and Lower Egypt that declinedfrom 31% in 1940 to 5.5% in Lower Egypt and 1.8% in Upper Egypt by1953; with no cases or smear positives being recorded in the canal zone,Assiut, Girga, Kom Ombo, Aswan and Nubia regions (Halawani andShawarby, 1957).

Ann
ual m
alar
ia in
cide
nce
(per
10,
000
popu
latio
n)
Ann
ual m
alar
ia in
cide
nce
(per
100
,000
pop
ula
tion)
1939
1944
1949
1953
1979
1984
1989
1994
2004
1999
5
0.2
0.4
0.6
0.8
Last autochthonouscase declared in
1998
1.0
1.2
0.0
1.4
10
15
20
0
25
FIGURE 4.5 United Arab Republic of Egypt reported malaria case incidence 1939–1953
per 10,000 (left hand side) and 1979–2004 per 100,000 (right hand side). Annual reported
malaria cases sourced for 1939–1953 (WHO-Egypt, 1956); 1979 (Anon, 1981); 1986 and 1987
(WHO, 1989); 1980–1985 (EMRO-WHO, 1987); 1988 and 1991–1997 (WHO, 1999); 1989 and
1990; 1999–2002 (WHO-EMRO, 2011) and 2003 and 2004 (WHO-Egypt, 2010). National
population used throughout to highlight overall changing incidence 1927, 1937, 1947, 1960,
1966, 1976, 1986, 1996, 2006 from CAPMAS, Egypt (2011). Non-census years computed
using annual intercensal growth rates.
188 Robert W. Snow et al.
Author's personal copy
The 1970s witnessed a series of epidemics across the country; how-ever, from 1979, national case incidence had fallen to below 1 case per10,000 population, and by 1987, it was reported that there were only 22locally acquired cases with transmission predominantly in El FayoumGovernorate. Between 1982 and 1991, malaria cases were reported inseven governorates: Port Said, Suez, Shakira, Menofia, Beni Suef, Aswanand Fayoum; however, the cases in all governorates except Fayoum werevery few (Hassan et al., 2003). It seems reasonable therefore to assumethat P. falciparum and P. vivax incidence was unstable for six governoratesbetween 1980 and 1990 and free of malaria from 1990; however, FayoumGovernorate remained a stable endemic focus of P. falciparum malariathrough the 1980s to the 1990s with epidemics in 1989 and 1994–1995.
Fayoum is 1800 Km2 and has a unique ecology situated in an irrigatedarea fed by the Bahr Youssef tributary of the Nile that ends in the KaunLake and the area lies 20 m below sea level which combined providesvery suitable conditions for An. sergentii (Kenawy et al., 1990; Morsy et al.,1995). Between 1991 and 1997, all locally acquired cases in Egypt camefrom Fayoum including an epidemic of 495 and 313 cases in 1994 and

The Changing Limits and Incidence of Malaria in Africa: 1939–2009 189
Author's personal copy
1995, respectively. Since 1998, there have been no officially reportedautochthonous cases in this governorate or elsewhere in Egypt (Fig. 4.5).A serological screen of 2800 children aged 1–5 years living in 12 villages inFayoum for the detection of specific IgG antibody against pan P. falci-parum, P. vivax, P. malariae and P. ovale resulted in a seroprevalence of0.7% but might have been due to cross-reactivity with non-malaria anti-gens (El Mohamady, 2010), and positives were later confirmed as sero-negative in another laboratory (Hoda Atta, personal communication). Wetherefore assume that the United Arab Republic of Egypt had focalP. falciparum and P. vivax risks between 1980 and 1999 but that the entirecountry was malaria free from 1998 (Fig. 4.5) despite a high malariogenicpotential in Fayoum and Aswan.
4.4.1.6. DjiboutiThe French governed territory of the Issa’s and Afar’s (French Somali-land) is likely to have experienced endemic transmission around Amboulibefore 1910 (Bouffard, 1905); however, the entire territory was regardedas malaria free from 1910 up to 1973, 4 years before independence in 1977(Carteron et al., 1978; Mohamed, 1990; Rodier et al., 1995; WHO-Djibouti,1956). This small country borders the Danakil depression, one of thehottest places on earth, and large parts of the country are barren rockydeserts with erratic rainfall averaging 130 mm per year. Anopheles d’thaliwas thought to be the historical, potential vector; however during theearly 1970s, an extensive entomological survey across the country couldnot identify any malaria vectors (Courtois and Mouchet, 1970). Sixtypercent of the population of the Republic live in Djibouti ville, connectedto Ethiopia by the Addis Abba–Dire Dawa–Djibouti Railway that duringthe 1970s served as a route for large refugee populations that expandedthe outskirts of the city and led to urban informal agriculture.
From 1988, malaria epidemics from imported infections began toappear and led to onward transmission among local resident commu-nities (Louis and Albert, 1988; Manguin et al., 2008; Rodier et al., 1995).An. arabiensis is now accepted as the dominant vector of P. falciparumaround Djibouti city particularly among the wadis, agricultural areasand watering holes around the Ambouli region. Some have argued thatboth An. arabiensis and P. falciparum arrived by train from Ethiopia (Foxet al., 1991; Rogier et al., 2005). From all available evidence, the Republicof Djibouti was probably malaria free up to 1980; between 1988 and 2007,reported case incidence ranged between 60 and 120 cases per 10,000population per year (Osman, 2008; PNLP-Djibouti, 2006, 2011). Since2008, case incidence has begun to decline to levels of less than 1 case per10,000 population in 2010 (Hawa Guessod, Personal Communication).This recent change is reflected in declining slide positivity at two hospi-tals in Djibouti ville (Ollivier et al., 2011). A seroprevalence survey in 2009

190 Robert W. Snow et al.
Author's personal copy
among 4687 people across Djibouti found 1.6% seropositives to P. falci-parum AMA-1 and MSP16 antigens and not related to recent travel his-tories (Noor et al., 2011; PNLP-Djibouti, 2009) confirming an unstableendemicity where transmission is possible.
4.4.2. Changing boundaries and incidence of malaria on theislands of Africa
4.4.2.1. Cape VerdeThe Republic of Cape Verde is an archipelago of 10 (only 9 populated)volcanic islands in the Atlantic Ocean off the Coast of Senegal. The islandswere uninhabited until used by Portuguese slavers in the fifteenth cen-tury. The Creole populations across the islands vary considerably inpopulation density; 25% of the Republic’s population today live in thecity of Praia on Santiago Island. The islands are grouped according totheir windward position: the Barlavento Islands (Santo Antao, Sao Vicente,Sta Luzia, Sao Nicolau, Sal and Boavista) and the Sotavento Islands(Maio, Santiago Fogo and Brava). Independence from Portugal wasachieved in 1975. Interest in the epidemiology and elimination of malariaby Portuguese malariologists dated back to the 1930s when extensivesurveys of infection and disease prevalence were undertaken bymembersof the Permanent Mission in Cape Verde from the Instituto de MedicinaTropical, Lisbon (Cambournac and De Meira, 1952; De Meira 1954, 1964;Monteiro, 1952). Between 1938 and 1954, a total of 201,682 malaria caseswere documented representing an average case incidence of 800 per10,000 population (Fig. 4.6). Cases were both falciparum and vivaxalthough predominantly falciparum and were reported from all of theinhabited Islands (WHO-Cape Verde, 1955). An. pretoriensis is a disputedvector on the islands (Joana Alves, personal communication) while An.arabiensis is the widely accepted vector with some doubt over its presenceon Sao Nicolau (Cambournac et al., 1984; Ferriera, 1945; Joana Alves,personal communication).
In 1948, a malaria elimination campaign was launched starting on theisland of Sal using DDT, oiling of larval breeding sites and more latterlywith the introduction of Gambusia affinis predatory fish. The campaignextended to other Islands throughout the 1950s. The campaign was suc-cessful and malaria was felt to have been eliminated through the removalof the vector in Sal (1950), Sao Vicente (1954), Boavista and Maio (1962)and Santiago (1968) (Cambournac et al., 1984; De Meira, 1963). Althoughclaimed, malaria-free Santiago still had cases in 1973. Frequent popula-tion movements between the islands, mainland Africa and Brazil withincreasing air travel always presented a threat to reintroduction of bothvectors and parasites (Cambournac et al., 1984). With the exception ofSantiago, no autochthonous cases were detected for many years on any of

Ann
ual m
alar
ia in
cide
nce
(per
10,
000
popu
latio
n)
Ann
ual m
alar
ia in
cide
nce
(per
100
,000
pop
ula
tion)
100
200
300
400
500
600
700
800
900
0
1000
No data
5
10
15
20
25
30
0
35
1934
1939
1944
1949
1954
1959
1963
1964
0.04
0.04
0.04
0.05
1669
1974
1979
1984
1989
1994
1999
2004
2009
1.69
FIGURE 4.6 Cape Verde: Annual slide-confirmed malaria case incidence per 10,000 population 1934–1963 (left hand side) and annual,
locally acquired, slide-confirmed case incidence per 100,000 population 1964–2010. Data sources used include 1934–1952 (De Meira, 1954);
1960–1983 (Cambournac et al., 1984); 1984–1985 and 1987–2006 (PNLP-Cape Verde, 2009); 2007–2010 (Joana Alves, personal communication).
No reports available for review for the period 1953–1960. Case incidence computed for entire country per year to highlight changing
national incidence and not per remaining islands at risk, denominators derived for census years 1940, 1950, 1960, 1970, 1980, 1990, 2000 and
projections 2001–2010 (INE Cape Verde, 2011) and non-census years computed using intercensal growth rates. The years 1968–1972 and
1983–1986 no locally acquired cases reported.
Author's personal copy

192 Robert W. Snow et al.
Author's personal copy
the islands since they were declared malaria free, despite imported casesbeing detected in almost all islands. In 1973 on the island of Santiago, 148cases were reported leading to onward transmission of both P. vivax andP. falciparum (Fig. 4.6) and served as a stimulus to renewed application ofDDT, use of Gambusia fish to supplement chemical larviciding and the useof chloroquine chemoprophylaxis under a new directorate, the Brigada deLuta contra o Paludismo in 1977.
In 1979, a further national elimination programme was launched andthe focus was on Santiago with renewed efforts targeting the vector withDDT and larvicides (temephos). The entire archipelago was returned tozero incidence between 1983 and 1986. The following year transmissionre-established itself on Santiago and heralded a period of annual casesbeing detected despite increased vigilance (Alves, 1994) through to 1995–1996 when an epidemic occurred in St. Catarina district on Santiagooriginating from sub-patent and chloroquine resistance asymptomaticcarriers (Alves et al., 2006, 2009). Current approaches to eliminate malariaon Santiago include active case detection and case investigation, the use ofartemether–lumefantrine for treatment (since 2008), mefloquine for pro-phylaxis for travellers, temephos for larviciding and very limited use ofIRS (deltamethrin) for epidemic containment and ITN. Currently, locallyacquired case incidence is below 1.0 per 10,000 on Santiago. On Boavista,four possible autochthonous cases were detected in 2003, the first since1962, 10 cases in 2009 and three in 2010. The long-term case incidence dataare shown in Fig. 4.6.
4.4.2.2. Sao Tome and PrıncipeThe Democratic Republic of Sao Tome and Prıncipe is made up of twovolcanic islands 140 km apart in the Gulf of Guinea, 250 km from Gabonon mainland Africa. Like the Cape Verdean islands, they were uninhab-ited before the Portuguese occupied them for trade in the 1470s. Thevolcano topography and plantation agricultural economy define thetransmission of malaria on the two islands (Ceita, 1981). Sao Tomeansachieved independence from Portugal in 1975. Over 96% of the presentpopulation, of 162,000 people, lives on Sao Tome.
Between 1942 and 1944, approximately 5000 cases were documentedon Sao Tome ( Joaquim and de Mesquila, 1946); over the period 1946 and1953 on both islands, an average of 10,000 cases were reported per yearamong a population of only 60,000 people, and 25–37% of slide examina-tions at dispensaries were positive for P. falciparum (WHO-Sao Tome andPrıncipe, 1955). In 1955, IRS using DDT and gammexane was limited tomajor settled, urban and peri-urban areas and larviciding was addition-ally used in the town of Sao Tome. Over 20,000 people were protectedwith mass drug administration/intermittent treatment with chloroquine,atebrin, paludrine and camoquine (WHO-Sao Tome and Prıncipe, 1955).

The Changing Limits and Incidence of Malaria in Africa: 1939–2009 193
Author's personal copy
During the late 1970s, a proposal for malaria elimination was redeve-loped involving epidemiological surveillance with active and passivescreening, radical treatment with chloroquine and primaquine recogniz-ing the presence of P. vivax on the islands (Pinto et al., 2000a,b), weeklyprophylaxis with chloroquine among selected groups, special screeningat airports and the use of DDT for IRS (Ceita, 1981). By 1980, parasiteprevalence on both Islands had declined to less than 5% (Ceita, 1986).Owing to a lack of financial support, the programme became less vigilant,chloroquine resistance emerged and doubts were raised about the sus-ceptibility of the dominant vector An. gambiae s.s. to DDT (Ribeiro et al.,1988, 1992).
From 2004, a renewed effort at country-wide IRS using alphacyperme-thrin was implemented, managed by the Centro National de Endemias,augmented with the use of LLIN from 2005 and application of Bacillusthuringiensis israelensis (BTI) following larval mapping exercises and massscreening and treatment and use of artesunate–amodiaquine for treat-ment (CNE, 2006). On the smaller island of Prıncipe, cases among apopulation of approximately 6500 declined from 2537 in 2003 to 51 in2009 (75 per 10,000 population) (Lee et al., 2010). These successes wererepeated with similar approaches on the island of Sao Tome whichachieved almost 100% coverage of the population with LLIN and IRS(Teklehaimanot et al., 2009; Tseng et al., 2008). On Sao Tome, parasiteprevalence declined from 30% to 2.1% by 2007 (Teklehaimanot et al.,2009), and by 2009, case incidence was 247 per 10,000 population at risk(WHO, 2010). Impressive reductions in infection prevalence, disease andmortality incidence have resulted from aggressive and comprehensivecombinations of vector control, screening and treatment. The decliningmalaria mortality rates since 2000 are particularly impressive, yet it isnotable that malaria mortality on the islands was probably at its peakduring the early 2000s when compared to previous pre-elimination his-torical periods (Fig. 4.7). The recent scaled efforts and reductions indisease incidence are further notable as they have occurred during diffi-cult periods in the islands’ history with two attempted military coups in2003 and 2009. On both islands, malaria incidence reflects a stable trans-mission state by 2009 similar to the late 1970s, neither Island has everreached a malaria free or unstable endemic status but the future cycle ofinvestment in elimination may transform these islands to unstable ormalaria-free conditions.
4.4.2.3. ZanzibarZanzibar is composed of two large islands, Unguja (Zanzibar Island) andPemba (40 km North-East of Zanzibar) and several smaller islands. Theislands are only 25–50 km from mainland Tanzania. The islands weregoverned as part of the Omani Sultanate and as a British Protectorate

Mal
aria
mor
talit
y ra
tes
(per
100
,000
pop
ula
tion)
No
data
1948
1954
1972
1976
1979
2000
2005
2009
50
100
150
200
250
0
FIGURE 4.7 Sao Tome and Prıncipe. Annual malaria-specific mortality per 100,000
population. Mortality data sourced from several publications: 1948–1954 (WHO Sao
Tome and Prıncipe, 1955); 1972–1979 (Ceita, 1981); No data available for review for 1977;
2000–2009 (Teklehaimanot et al., 2009). Population data used for 1955 (WHO Sao
Tome and Prıncipe, 1955) and 1981–2006 (Instituto Nacional de Estatistica, ST&P 2006).
Non-census years computed using intercensal growth rates.
194 Robert W. Snow et al.
Author's personal copy
(1890) until a brief independent Sultanate in 1963 followed by civil warand the overthrow of the Sultan in 1964. Zanzibar then became part of theUnited Republic of Tanzania while retaining its own parliamentary andgovernance system under the Revolutionary Government of Zanzibar. Interms of malaria control, it has always operated independent of mainlandTanzania, and therefore, we consider a separate territory. Between 1923and 1933, an average of 6800 malaria cases were recorded per year acrossa combined Zanzibar and Pemba population of approximately 280,000residents and accounted for over 25% of all clinic consultations (ZanzibarProtectorate, 1923-1966). A larval survey of the island of Zanzibar in 1919identified An. gambiae and An. funestus as principal vectors (Mansfield-Aders, 1920), subsequent investigations have found An. merus on Pembabut not on Unguja (Schwartz et al., 1997). A detailed parasitologicalsurvey among children aged 1–6 years at 26 locations of the island ofZanzibar, including Tumbatu Island in the north, found an overall preva-lence of 67% and noted the presence of both P. falciparum and P. vivaxbetween 1923 and 1926 (Mansfield-Aders, 1927). Spleen rates amongschool children remained in excess of 50% on both Pemba and Zanzibarbetween 1930 and 1966 (Zanzibar Protectorate, 1923-1966). By 1953, onlylimited control was mounted involving larviciding of swamps with oiland use of Paris Green in ‘‘crab holes’’. DDT was only used in privateresidences at a fee and free of charge at all government employees housesin Zanzibar town (WHO-Zanzibar, 1955).

The Changing Limits and Incidence of Malaria in Africa: 1939–2009 195
Author's personal copy
During the 1960s, Zanzibar mounted a campaign of biannual cycles ofIRS using DDT followed by mass drug administration with amodiaquineand primaquine and a combination of chloroquine and pyrimethamine(Delfini, 1969; Dola, 1974; ZMCP, 2009) with a view to interrupting trans-mission. The programme was successful, reducing parasite prevalence to6.8% on Zanzibar and 0.8% on Pemba by 1967 (Delfini, 1969). Vigilance andinterest in the final effort to eliminate transmission waned as malaria wasperceived to no longer be a major public health burden (Schwartz et al.,1997). A second attempt to control, rather than eliminate, malaria wasmounted by the Zanzibar Malaria Control Project (ZMCP) with fundingfrom the United States in 1984 using two rounds of DDT house sprayingeach year by mobile malaria teams and improved use of chloroquine atdispensaries. However, by 1983, chloroquine resistance had begun to esca-late (Schwartz et al., 1983), and between 1981 and 1987, meanmortalities ofexposed An. gambiae s.l to DDT were less than 50% (Schwartz et al., 1997).The programme was abandoned in 1989 after failing to show any percepti-ble changes in parasite rates at clinics (Schwartz et al., 1997).
In 2001, the Ministry of Health and Social Welfare decided to adoptACT, making it one of the first countries to do so in Africa and since 2002secured substantial funding from the GFATM and US PMI to improvecase management and expand coverage of ITN and IRS using lambda-cyhalothrin. This programme did not anticipate elimination but followedinternational recommendations to halve the malaria burden. Coverage ofvector control remained low by 2004. From 2005 onwards, this began tochange with more than 70% of under-fives and pregnant women sleepingunder an ITN and 96% of houses were covered with IRS by 2008. Parasiteprevalence in young children sampled in the community in 2002 was 47%and declined to 0.9% by 2008 (ZMCP, 2009). From 2004, Zanzibar began towitness a precipitous decline in malaria incidence, hospitalizations andblood transfusions (Aregawi et al., 2011; Bhattarai et al., 2007; ZMCP,2009). Between 1999 and 2003, there were between 15,000 and 18,500confirmed cases of malaria each year; in 2005, this declined to 7600cases. By 2010, 5000 parasitologically confirmed cases were identifiedthrough enhanced surveillance, and in two sentinel areas, community-based parasite prevalence remained below 1% (Abdullah Ali, personalcommunication). Using case incidence and parasite prevalence data, it ismost reasonable to assume that the Zanzibari islands are in a state of low-stable endemic control and that at no time in the history of eliminationefforts on the islands had they reached unstable conditions.
4.4.2.4. ReunionThe island of Reunion is 200 km from Mauritius and 700 km from Mada-gascar in the Indian Ocean. This small island is only 63 by 45 km and isdominated by the Piton de la Fournaise (2631 m above sea level) and Piton

196 Robert W. Snow et al.
Author's personal copy
des Neiges (3070 m above sea level) volcanoes. Reunion was colonized bythe French in the 1600s and remains to this day an overseas department ofFrance. Over the past two centuries, there have been large in-migrationsfrom Africa, China, Malaysia, Vietnam and India. The island was thoughtto have been malaria free before a large epidemic, probably fromimported infections from mainland Africa in 1868 that set in motion acycle of frequent, high-burden epidemics ( Julvez et al., 1990a). In 1949,malaria parasite rates in school children suggested a hypoendemic state(parasite prevalence <10%) across the island with transmission of bothP. falciparum (28% of all infections) and P. vivax (66%) (Hamon andDufour, 1954). Nevertheless malaria was a significant cause of morbidityand mortality: 17,459 clinical cases were confirmed in 1946 and 1779deaths from malaria were recorded by the authorities in 1948 (WHO-Reunion, 1955). The mortality rate on the island among all age groups,7.35 per 1000, was equivalent to the presumed malaria mortality in youngchildren in Africa under stable, hyper-to holoendemic conditions (Roweet al., 2006; Snow et al., 1999). Before 1949, larviciding and the presump-tive treatment of school children using chloroquine were the only meth-ods used to control malaria.
In 1949, an elimination strategy was launched (Hamon and Dufour,1954). Following a detailed housing structure and breeding site census ofthe island, two divisions were created to stagger DDT house spraying thatbegan in October 1949 in the first sectors (Sous-le-vent). A year later, itexpanded to all areas on the island and continued annually through to1953 accompanied by sustained use of chloroquine presumptive treat-ment to school attending children. Overall parasite prevalence declinedfrom 2.9% in 1949 to 0.2% in 1952, and malaria mortality declined from 5.6to 0.6 per 1000 population over the same period (Hamon and Dufour,1954). After this initial attack phase, a period of consolidation of elimina-tion efforts were mounted through larviciding of mapped breeding sites,restricted use of DDT in focal transmission areas and active case andentomological surveillance. Twenty-six locally acquired infections wereidentified between 1956 and 1967 (Denys and Isautier, 1991; Riff andIsautier, 1995). A mass screen of over 62,000 residents in 1966/1967identified six possible autochthonous cases in the Mafate area and sur-veillance identified five possible cases in Saint-Paul in 1971 (Picot, 1976;Riff and Isautier, 1995). The WHO concluded that transmission had beeninterrupted in 1973 and certified Reunion malaria free in March 1979.Active surveillance since 1965 has included screening of immigrants andair travellers (Guihard, 2006), and there are on average 150 imported casesof malaria each year notably from neighbouring islands of Madagascar,Comoros and Mayotte. The dominant vector, An. arabiensis, remains widespread and has not been eliminated (Girod et al., 1999; Morlais et al.,2005), and the 810,000 residents of the country remain vulnerable to

The Changing Limits and Incidence of Malaria in Africa: 1939–2009 197
Author's personal copy
imported malaria risks (D’Ortenzio et al., 2009; Denys and Isautier, 1991;Girod et al., 1995; Guihard, 2006; Julvez et al., 1982; Lassalle et al., 2000;Sissoko et al., 2006).
4.4.2.5. MauritiusThe Republic of Mauritius includes the islands of Mauritius, CargadosCarajos, Rodrigues and Agalega. The archipelago is located in the southwestern part of the Indian Ocean 900 km east of Madagascar. Only theisland of Mauritius has been identified as supporting malaria transmis-sion. Mauritius was occupied first by the Dutch and French, who foundthe islands uninhabited. As with Reunion, it is likely that malaria wasintroduced onto the island of Mauritius in the mid-1860s by immigrantlabour (Ross, 1908) and led to a large epidemic in 1867 (Balfour-Kirk, 1934;CDCU, MoH&QL, 2008). Ronald Ross completed an island-wide investi-gation of spleen rates in 1906 and found an overall rate of enlargedspleens of 48% and made recommendations for immediate sanitation toreduce vector breeding sites (Ross, 1908). In 1910, Smith, reporting to theColonial Development Fund, estimated malaria death rates on the islandto be in excess of 12 per 1000 population per year (Smith, 1911).
Before the Second World War, there was very little active preventiondespite some reports of drainage of swamps and wide-spread use ofquinine. Between 1942 and 1943, P. falciparum infection prevalenceamong children was 42%, P. vivax prevalence was 22% (Sippe andTwining, 1946) and An. funestus and An. gambiae s.l. were implicated asthe sole vectors (Colony of Mauritius, 1950). Archived hospital and dis-pensary returns and census interpolations suggest that there were largebetween year variations in the annual incidence of malaria between 1930and 1948, but most years showed more than 10% of the populationsuffering from a clinical attack (Fig. 4.8); the average malaria-specificmortality was 3.63 per 1000 per year among the entire population duringthis period (Colony of Mauritius, 1928–1972).
Immediately after the Second World War, the Ministry of Healthbegan to implement some of the recommendations made by Ross40 years earlier with major environmental works (canalization and clean-ing of streams, drainage of marshes) and oiling of breeding sites. Theseefforts concentrated on the Central Plateau, the town of Port Louis and thedrainage of two extensive marshes in Pamplemousses district. In 1948, totackle the high incidence on the rest of the island, the Colonial InsecticideCommittee proposed in conjunction with the Government of Mauritius aMalaria Eradication Scheme (Colony of Mauritius, 1950; Dowling, 1951a,b, 1952). In November 1948, a detailed housing census led to the creationof three zones for the attack phase of elimination: Zone 1 using DDT (80%pp in Kerosene); Zone 2 using DDT 50% Wettable Powder and Zone 3using Gammexane 50% Wettable Powder. The first round of spraying
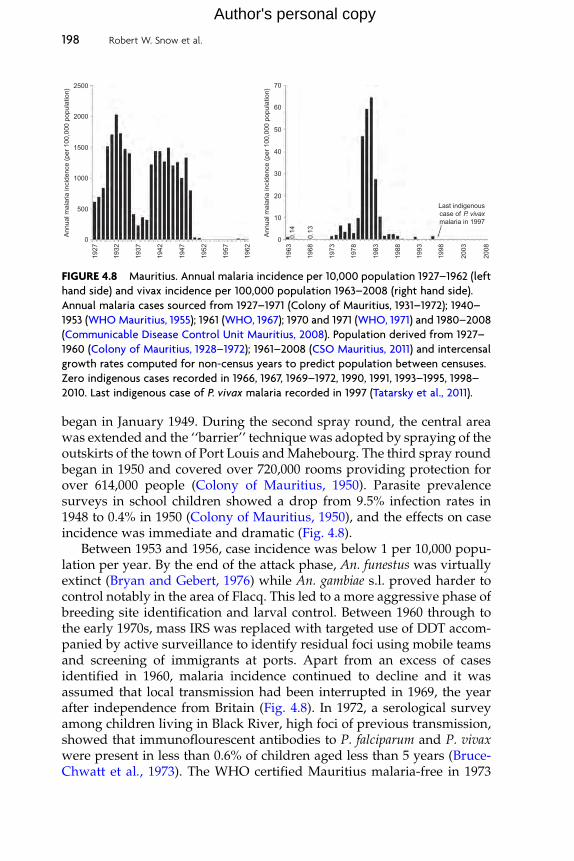
Ann
ual m
alar
ia in
cide
nce
(per
100
,000
pop
ula
tion)
Ann
ual m
alar
ia in
cide
nce
(per
100
,000
pop
ula
tion)
500
1000
1500
2000
0
2500
10
20
Last indigenouscase of P. vivaxmalaria in 1997
30
40
0
50
60
7019
27
1932
1937
1942
1947
1952
1957
1962
1963
1968
1973
1978
1983
1988
1993
1998
2003
2008
0.13
0.14
FIGURE 4.8 Mauritius. Annual malaria incidence per 10,000 population 1927–1962 (left
hand side) and vivax incidence per 100,000 population 1963–2008 (right hand side).
Annual malaria cases sourced from 1927–1971 (Colony of Mauritius, 1931–1972); 1940–
1953 (WHO Mauritius, 1955); 1961 (WHO, 1967); 1970 and 1971 (WHO, 1971) and 1980–2008
(Communicable Disease Control Unit Mauritius, 2008). Population derived from 1927–
1960 (Colony of Mauritius, 1928–1972); 1961–2008 (CSO Mauritius, 2011) and intercensal
growth rates computed for non-census years to predict population between censuses.
Zero indigenous cases recorded in 1966, 1967, 1969–1972, 1990, 1991, 1993–1995, 1998–
2010. Last indigenous case of P. vivax malaria recorded in 1997 (Tatarsky et al., 2011).
198 Robert W. Snow et al.
Author's personal copy
began in January 1949. During the second spray round, the central areawas extended and the ‘‘barrier’’ technique was adopted by spraying of theoutskirts of the town of Port Louis andMahebourg. The third spray roundbegan in 1950 and covered over 720,000 rooms providing protection forover 614,000 people (Colony of Mauritius, 1950). Parasite prevalencesurveys in school children showed a drop from 9.5% infection rates in1948 to 0.4% in 1950 (Colony of Mauritius, 1950), and the effects on caseincidence was immediate and dramatic (Fig. 4.8).
Between 1953 and 1956, case incidence was below 1 per 10,000 popu-lation per year. By the end of the attack phase, An. funestus was virtuallyextinct (Bryan and Gebert, 1976) while An. gambiae s.l. proved harder tocontrol notably in the area of Flacq. This led to a more aggressive phase ofbreeding site identification and larval control. Between 1960 through tothe early 1970s, mass IRS was replaced with targeted use of DDT accom-panied by active surveillance to identify residual foci using mobile teamsand screening of immigrants at ports. Apart from an excess of casesidentified in 1960, malaria incidence continued to decline and it wasassumed that local transmission had been interrupted in 1969, the yearafter independence from Britain (Fig. 4.8). In 1972, a serological surveyamong children living in Black River, high foci of previous transmission,showed that immunoflourescent antibodies to P. falciparum and P. vivaxwere present in less than 0.6% of children aged less than 5 years (Bruce-Chwatt et al., 1973). The WHO certified Mauritius malaria-free in 1973

The Changing Limits and Incidence of Malaria in Africa: 1939–2009 199
Author's personal copy
which prompted what turned out to be a rather premature article hailingmalaria as ‘‘dead as a dodo’’ (Bruce-Chwatt and Bruce-Chwatt, 1974). Atthis point, surveillance vigilance declined as the responsibility for malariawas absorbed into the wider health system (Tatarsky et al., 2011). In 1975,P. vivax transmission established itself in village close to Port Louis likelyto have been imported from India. This initial importation event led to anincreasing vivax transmission across the island peaking in the mid-1980swith over 500 cases each year (Fig. 4.8). Through the use of focal IRS(DDT), widespread larviciding (temephos), passenger screening and anup-regulated active case detection system, transmission was contained by1990. With small vivax outbreaks in 1992 and 1996 (Fig. 4.8), the lastindigenous case recorded in 1997. Since 1998, Mauritius has maintainedthe absence of local transmission. Mauritius therefore was able to elimi-nate P. falciparum and P. vivax transmission in 1969, witnessed re-emer-gence of P. vivax transmission in 1975 and achieved a second eliminationin 1998.
4.4.2.6. ComorosThree islands formed the Federal Islamic Republic of Comoros at inde-pendence from France in 1975, Grand Comore (1024 km2, rising to 2361 mabove sea level with the volcano of Karthala), Anjouan (424 km2 rising to1578 m above sea level) and the lower altitude Moheli island (374 km2) inthe Comorian Archipelago. In 1997, Anjouan and Moheli unsuccessfullysought independence from the union with Grand Comore. Under a newconstitution in 2001, the islands form an unstable Union of the Comoroswith each island having some political autonomy. The people of thisarchipelago, including Mayotte, have been part of the evolving Swahilicorridor since the tenth century and comprise a mixture of Arab andBantu people. Altitude, settlement patterns and agriculture determinethe malaria risks across the three islands including malaria-free areas athigh altitudes on Grand Comore.
The first recorded severe epidemics occurred in 1920 (Raynal, 1928a).An. gambiae and An. funestus are the dominant malaria vectors (Brunhes,1977) of P. falciparum and the less commonly prevalent P. vivax (<1%parasite prevalence) (Blanchy et al., 1987, 1990). Between 1940 and 1943,reported case incidence was approximately 1555 per 10,000 populationper year (WHO-Comoros, 1955). In June 1953, limited use of DDT wasapplied on the islands of Grand Comore and Moheli, and there is asuggested use of chloroquine chemoprophylaxis in the 1950s (WHO-Comoros, 1955). No significant malaria prevention seems to have beenreported up to the 1980s and transmission remained intense and stable.During 1987, 3370 clinical cases were detected on Grand Comores (popu-lation 223,600), 1788 on Anjouan (population 163,900) and 1294 on Moheli(population 20,400); parasite prevalence among children 2–9 years during
200 Robert W. Snow et al.
Author's personal copy
the same year was 51.4%, 23.3% and 44.6% on each of the islands, respec-tively (Blanchy et al., 1987). In January 1987, a campaign to control malariaand filariasis was mounted although details of precise activities andapproaches are difficult to establish. In 1988, the Programme Nationalde Lutte Contre le Paludisme (PNLP) was established. Between 1999 and2001, case incidence remained high on all islands (Tchen et al., 2006), andin 2006, malaria accounted for 36% of all clinic consultations (PNLP-Comoros, 2009).
In 2007, a national plan of action was launched with the aim ofpreparing the Comoros for pre-elimination in 2014 and eventual Inter-ruption of transmission. The new strategy focuses on the wide-scaledistribution of ITN, IRS in selected areas with lambda-cyhalothrin, larvalcontrol with predatory guppies, intermittent presumptive treatment ofpregnant women and enhanced clinical management using artemether–lumefantrine all implemented with funding from the Global Fund andsome bilateral agency support (PNLP-Comoros, 2009). On the island ofMoheli, in collaboration with scientists from China, mass treatment ofcommunities with artemisinin monotherapy (Artequick) and primaquineas a follow-up treatment began in October 2007 reducing infection preva-lence from 23% in September 2007 to 1.4% by January 2008 and a furtherreduction to 0.4% by June 2009 (Anon, 2007; Bacar, 2010). Whether thiswas continued and scaled as an intervention to Grand Comore andAnjouan, despite WHO recommendations not to use artemisinin mono-therapy (WHA, 2007), is unclear. By 2009, the PNLP had distributedalmost 170,000 ITN across the three islands by 2009 (WHO, 2010), andduring a mass-free distribution, campaign between November 2010 andJanuary 2011 on Grand Comore and Anjouan distributed a further 255,000ITN. Among the 640,000 residents in 2009, over 51,000 presumed cases ofmalaria were reported, of which only 10% were confirmed cases (WHO,2010). Following the reduction of transmission on Moheli as a result ofmass drug administration, it is not possible to estimate the stability ofendemicity due to the lack of corresponding case incidence data. ForGrand Comore and Anjouan, clinical incidence has probably remainedintense and stable over the past 100 years.
4.4.2.7. MayotteThe two islands that comprise Mayotte, Mahore (352 km2) and Pamanzi(17 km2), are located within the Comorian Archipelago 320 km fromMadagascar and 70 km from the Comorian island of Anjouan. The islandshave been governed by France since 1841, and when the Federal IslamicRepublic of Comoros secured independence from France in 1975, Mayotteelected to remain a French Territory Overseas. The majority of the popu-lation live in approximately 70 villages that surround the coastline of theisland of Mahore. Malaria has been intense and stable on the islands for

The Changing Limits and Incidence of Malaria in Africa: 1939–2009 201
Author's personal copy
many years, and the only parasite identified among clinical cases hadbeen P. falciparum (Ali Halidi, 1995; Galtier and Blanchy, 1982); however,cases of vivax have more recently been identified (Loos et al., 2006; Soletet al., 2007). An. gambiae s.l. and An. funestus maintain transmission,although An. funestus plays a lesser role (Brunhes, 1977). Some limiteduse of dieldrin for IRS was applied in 1954, but there are few other recordssuggesting much aggressive control until the 1970s. Parasite prevalencewas 36.5% among children living in villages on Pamanzi in 1972 (Galtierand Blanchy, 1982). A programme of chloroquine prophylaxis amongschool children was started on both islands in 1972 ( Julvez et al., 1990b).
A joint effort to eliminate two, high morbidity burden vector-bornediseases, malaria and filariasis, was initiated in 1976. The malaria compo-nent included chloroquine prophylaxis to school children and preschoolchildren attending dispensaries, IRS using DDT and malathion (subse-quently, only malathion as culex vectors of filariasis was shown to beresistant to DDT) and larviciding with temephos (Galtier and Blanchy,1982). By 1981, coverage was high with 91% of households sprayed and60% of school children reached with chemoprophylaxis. Among sentinelvillages, the overall parasite rate in all age groups was 25.5% in 1976 butdeclined to 0.9% by 1980 (Galtier and Blanchy, 1982). Between 1981 and1983, it is likely that malaria transmission on the islands was unstable;however in 1984, early signs of reduced chloroquine efficacy wereobserved from Comorian immigrants, and in this year, there was anepidemic with 64 cases in May ( Julvez et al., 1987) and 394 throughout1984 ( Julvez et al., 1990b). Parasite prevalence rose to 2.5%, and thisprompted an emergency intervention with IRS using quarterly roundsof fenitrothion spraying, use of temephos and predator guppy fish(Lebistes reticulatus) in mapped larval areas and increased active andpassive surveillance including serial, annual serological surveys ( Julvezet al., 1986, 1987, 1990a,b). The use of chloroquine for chemoprophylaxiswas stopped except for pregnant women. By 1985, parasite prevalencehad declined to 0.3% and 75 clinical cases were reported for the year( Julvez et al., 1987, 1990b). For the three years 1986, 1987 and 1988, only8, 44 and 8 cases, respectively, were detected ( Julvez et al., 1990b), and itis reasonable to assume that the islands had returned to an unstabletransmission state. Resurgent waves of transmission continued throughthe early 1990s as identified from age profiles of serological detection offalciparum-specific antibodies ( Julvez, 1993). A large epidemic occurredin 1991 with 1724 cases detected through the active and passive surveil-lance system and parasite prevalence had increased to 1.3% (Receveuret al., 2004).
By 2001, malaria was the cause of over 1000 clinic presentations, 250hospital admissions each year (Receveur et al., 2004; Tchen et al., 2006)and resistance to chloroquine and sulphadoxine–pyrimethamine had

202 Robert W. Snow et al.
Author's personal copy
escalated (Roussin et al., 2002). In an attempt to tackle the high diseaseburden malaria control in the 2000s focussed on the distribution of ITN topregnant women and newborn children, IRS using deltamethrin and thedistribution of rapid diagnostic tests to all clinics (Receveur et al., 2004).Artesunate–mefloquine was recommended as first-line therapy in 2005following documented high levels of resistance to chloroquine, pyrimeth-amine, amodiaquine and quinine (Pettinelli et al., 2004). By 2003, malariaincidence began to decline with a 25–40% reduction in cases detectedcompared to 1999–2002 (Tchen et al., 2006). Cases are more concentratedin the northern districts of the main island of Mahore, most notably atBandraboua (Solet et al., 2007) where re-emergence of An. funestus hasbeen documented (Elissa and Karch, 2005). The complete interruption oftransmission on the islands of Mayotte has never been achieved and thedifficulties associated with elimination have been outlined by Receveuret al. (2004). Brief periods of unstable transmission have been experiencedon the islands since 1939, and the changing status of risk since 1983 wheredata are available is shown in Fig. 4.9.
Ann
ual m
alar
ia in
cide
nce
(per
10,
000
popu
latio
n)
20
40
60
80
100
120
140
160
180
0
200
1983
1988
1993
1998
No
data
2003
2008
2010
FIGURE 4.9 Mayotte malaria case incidence per 10,000 population 1983–2010. Annual
malaria case data derived for period 1984–1988 ( Julvez et al., 1990a); 1983, 1989–1994 (Ali
Halidi, 1995); 1995–2004 (Tchen et al., 2006); 2005 and 2006 (Solet et al., 2007) and 2007–
2010 (Jean-Loius Solet, personal communication). No data available for review for the
year 1997. Population for Mayotte derived from Institut National de la Statistique et des
Etudes Economiques (INSEE) for the French Overseas Department, reviewed between
1985 and 1993 (INSEE, 2011a,b) and non-census years using intercensal growth rates.

The Changing Limits and Incidence of Malaria in Africa: 1939–2009 203
Author's personal copy
4.4.2.8. MadagascarThe Republic of Madagascar is the fourth largest island in the world andincludes smaller islands located off its coastline including Nosy Be andSainte-Marie. The central highland plateau rises to 1341 m above sea level,and this densely populated area is characterized by terraced, rice-grow-ing valleys. It is likely that the first inhabitants arrived from Indonesiabetween 300 and 500 years BC followed in the first millennia by Bantumigrants crossing the Mozambique Channel. Immigrants from Arabia,India, China, East Africa and Europe have led to a diverse population.The island gained independence from France in 1960.
P. vivax has probably existed on the island for several centuries; how-ever, it has been argued that P. falciparum was first introduced by theFrench Foreign Legion during the war with the Kingdom in 1878 leadingto severe epidemics (Blanchy et al., 1993). For the past 100 years, thedistribution and intensity of malaria have been governed by the diversityof ecology across the island, altitude, agriculture and changing humansettlement patterns and population growth (Mouchet et al., 1993). In 1923,parasite prevalences in the northern part of Madagascar, Diego Suarez(Antsiranana), were in excess of 64% (Raynal, 1928b) and the spleen rateamong children in the highlands, at Antananarivo, was over 77% in 1927(Legendre, 1930). P. vivaxwas recorded in 20% of all malaria infections in1927 (Legendre, 1930), but vivax now accounts for 6% of all infections andis concentrated in highlands and the western coastline (PNLP-Madagascar, 2007). An. gambiae s.s., An. arabiensis and An. funestus arereported as the most important vectors (Ayala et al., 2006; Bernard, 1954;Mouchet and Blanchy, 1995); however, their distribution and dominancein transmission have changed with time (Curtis, 2002; Joncour, 1956).
The antimalaria service of Madagascar was reorganized in 1927(Legendre, 1930). Between the two world wars, control focused on limiteddrug prophylaxis, larval control using ‘‘stoxal’’, Paris Green, Gambusiafish and drainage works (Bernard, 1950; Legrende, 1930). In 1948, DDThouse spraying began and by 1949 covered almost 25,000 houses inTananarive Province. This expanded in 1950 to approximately 46,000houses in Tananarive (Antananarivo), Tamatave (Toamasina), Antsirabe,Diego Suarez (Antsiranana) and the island of Santa Marie (Bernard, 1950).By 1952, it was estimated that over 3 million people were protectedthrough the spraying of 680,000 households (Bernard, 1954). In additionto IRS with DDT, the campaign included routine chemoprophylaxis withchloroquine administered to school children and younger children atdispensaries at a total of 4924 distribution sites (Bernard, 1954). Supple-mentary activities included larval control notably in rice irrigation areasincluding the use of Gambussia fish. Spleen rates declined from 40% in1948 to 0.2% by 1953, and by 1952, parasite prevalence among 39,000sampled children was 0.01% (Bernard, 1954). Crude mortality dropped

204 Robert W. Snow et al.
Author's personal copy
by a half between 1948 and 1952 in the town of Tananarive from 21 per1000 residents to 12.8 and malaria mortality declined from 6 per 1000population at risk to 0.4 per 1000 over the same period with only 3.7% ofall deaths attributed to malaria by 1952 (Bernard, 1954). IRS, chemopro-phylaxis and larviciding continued through to 1955 when 50 of the 80districts in Madagascar had become hypoendemic (<10% spleen rates inchildren aged 2–9 years) and 30 districts located largely on theWest of theIsland were mesoendemic, with spleen rates of 10–49% ( Joncour, 1956;WHO-Madagascar, 1955). Transmission in the highland plateau districtswas extremely low, An. funestus had largely disappeared and in Fianaran-tosa district zero infection prevalence was recorded in 1955. By 1957, thehighland plateau was regarded as malaria free (Blanchy et al., 1993).
Continued efforts to maintain spraying were largely successful inmaintaining low levels of case incidence through to 1975 in the highlandplateau (Fig. 4.10; Blanchy et al., 1993; Bouma, 2003; Tchen et al., 2006).Chloroquine prophylaxis (Nivaquinization) was maintained reaching
Ann
ual m
alar
ia in
cide
nce
(per
10,
000
popu
latio
n)
200
400
600
800
0
1200
1000
1400
1972
1973
1974
1975
1976
1977
1978
1979
1980
1981
1982
1983
No
data
1984
1985
1986
1987
1988
1989
FIGURE 4.10 Antananarivo Province malaria case incidence per 10,000 population
1972–1989. Annual malaria case data derived for period between 1972–1974 and 1982–
1983 where data presented only as incidence (Bouma, 2003); 1975–1989(Blanchy et al.,
1993) and 1981 (Tchen et al., 2006). No data available for review for the year 1983.
Population for Antananarivo province derived from census bureau review of province
1975 and 1993 (Razafimanjato et al., 1997) and non-census years using intercensal growth
rates. Note in 1979, chloroquine chemoprophylaxis stopped (Blanchy et al., 1993) and
following rise in late 1980s DDT reintroduced in 1993. No data available for review for the
province after this date.

The Changing Limits and Incidence of Malaria in Africa: 1939–2009 205
Author's personal copy
35% of young children and school children between 1977 and 1978 (Laing,1984) but ended in 1979 (Randrianarivelojosia et al., 2009). About thistime, An. funestus reappeared in the highlands as a result of expandingrice cultivation (Blanchy et al., 1993). Reduced sensitivity to chloroquinewas documented in 1981 (Le Bras et al., 1982) and became more wide-spread by 1983 (Deloron et al., 1984). Epidemics occurred in the highlandplateau between 1985 and 1988 (Fig. 4.10). These epidemics had a devas-tating public health impact and are thought to have doubled malaria-specific mortality increasing during the late 1980s to over 1.9 per 1000population (Mouchet and Baudon, 1988; Mouchet et al., 1998) andprompted the return to routine DDT use in 1993 (Blanchy et al., 1993;Jambou et al., 1998; Mouchet and Blanchy, 1995) accompanied byenhanced surveillance (Albonico et al., 1999; Romi et al., 2002). Despitefocused intervention in the highlands, by 1999, the number of presumedmalaria cases in Madagascar exceeded 1.4 million (Tchen et al., 2006).From 1998, the national malaria programme was reconfigured andbegan the promotion of ITN and continued house spraying with combi-nations of DDT and pyrethroids according to epidemiological stratifica-tion of the island. Malaria in the highlands once again began to decline( Jambou et al., 2001; Rabarijaona et al., 2006).
In 2004, it became policy to offer ITN free-of-charge across the island.Despite day 28 failure rates of over 50% to chloroquine by 2004 (Menardet al., 2008), home-based management of fevers was promoted usingsocially marketed pre-packaged chloroquine. In December 2005, the Min-istry of Health adopted amodiaquine–artesunate as first-line treatment.In 2007, the Ministry launched a malaria elimination strategy thatincluded a preparatory phase and attack phase by 2012, a consolidationphase to be completed by 2017 and maintenance malaria free-phase from2018 (PNLP-Madagascar, 2007). Using funds from the GFATM, US PMIand other bilateral agencies, 6.2 million LLINs were distributed between2007 and 2009, covering an estimated 57% of the population at risk andIRS protected 6.9 million people at risk in 2009. According to the WHO,from 2006 malaria admissions to hospitals declined rapidly through to2009 and there were only 173 reported malaria deaths in 2009 (WHO,2010). However, it is hard to interpret these data without knowing thelocation of the hospitals or the reliability of mortality reporting during theyear when a coup d’etat led to major civil disruption.
Despite remarkable, rapid achievements in reducing transmission inthe Highland Plateau during the first malaria elimination campaign of1948–1955, it is not clear from available evidence whether transmissionhad been interrupted, but it seems reasonable to assume that the area wasrendered unstable through to 1980. The 1980s through to 2005 wereperiods when stable transmission and high disease burdens werereported in the Highland Plateau. P. falciparum risks were country wide,

206 Robert W. Snow et al.
Author's personal copy
while evidence suggests that P. vivax transmission is concentrated in theHighland Plateau and Western districts (PNLP-Madagascar, 2007). Otherthan the small area of temperature limiting transmission in Antsirabe,Antanifotsy and Ambatolampy districts of Vakinankaratra province, atno time has any other location in Madagascar been strictly malaria free.
4.4.3. Changing boundaries of stable malaria risk and diseaseincidence in Southern Africa
4.4.3.1. South AfricaAssembled historical data from a variety of government and researchreports held at the Tzaneen National Institute of Tropical Diseases andthe National Archives in Pretoria were used by various authors to definethe limits of malaria transmission in 1938. Risks before expanded nationalcontrol extended to within Durban’s city limits along the Indian Ocean,included Pretoria in the north and reached the railway crossing point atRamatlabama on the Botswana border (Le Sueur et al., 1993; Sharp and LeSueur, 1996; Strebel et al., 1988). Since the First World War, it is likely thatmalaria transmission has been concentrated in the extended Transvaalareas of the North-East and the wider Natal region in the South East.
Malaria impeded agricultural development from the turn of the lastcentury in Northern and Eastern Transvaal. Anti-larval measures startedin 1924 at irrigation sites south of the Hartbeespoort damwest of Pretoria.Epidemics in 1928 across the Transvaal prompted investigations(Swellengrebel, 1932) that led to the establishment of the Tzaneen MalariaCentre and extensive work on breeding site identification and reduction,education of farmers on personal protection, engaging the national rail-ways to control vector breeding around stations and the promotion of theuse of quinine through 200 ‘‘quinine distributors’’. In 1944, a trial oflarviciding combined with pyrethrum house spraying was undertakenat Springbok Flats. Only after the Second World War was progress madein shrinking the 1938 margins of transmission in the Transvaal using astrategy of focal elimination employing DDT IRS, continued targetedlarviciding and expanded use of quinine treatment. In the Transvaal,4439 malaria cases were detected in 1939–1940 and this declined to only128 by 1949–1950, located along the river tributaries of the Limpopo andbordering the Kruger Game Reserve (Annecke, 1950). Attack and consoli-dation phases continued from Western to Central Transvaal through tothe Lowveld from the 1950s and included a period from 1950 to 1969when BHC was used in preference to DDT (Brink, 1958; Hansford, 1974,1987). During the 1970s, annual and biannual rounds of DDT housespraying and active house-to-house surveillance in the Transvaal regionfocused on high-risk areas around the Limpopo, White and CrocodileRiver valleys, Bushbuckridge, Letaba valley up to Nelspruit (Hansford,

The Changing Limits and Incidence of Malaria in Africa: 1939–2009 207
Author's personal copy
1972, 1974). A WHO sponsored study of intensive active surveillance andIRS was mounted in 1974 at Makonde that reduced autochthonous casesfrom 42 to 10 by 1976 (Smith et al., 1977). Progress across the provinceduring the 1970s varied depending largely on aberrant rainfall patternsthat led to epidemics. The apartheid era was a period when South Africa’sborders were rigorously policed, and very few imported cross-borderinfections were detected relative to locally acquired cases and importedinfections came from bordering areas of Swaziland, Zimbabwe andMozambique. Transvaal was divided in 1994 to Mpumalanga, Limpopo,Gauteng and North Western provinces. By the late 1980s, all local trans-mission was restricted to defined areas of Limpopo and Mpumalangaprovinces. Malaria incidence began to rise during the late 1980s and early1990s (Gerritsen et al., 2008). This increasing clinical burden was coinci-dental with rapidly changing cross-border human population movementfrom Zimbabwe and Mozambique, 5–10% of refugees from the civil warin Mozambique being asymptomatic carriers of infection in 1985 (FrankHansford, personal communication), and emerging chloroquine resis-tance (Bac et al., 1985; Philip Kruger, personal communication).
Epidemics were common in KwaZulu-Natal at the turn of the lastcentury. Hill and Haydon (1905) refer to the epidemic that caused 4177clinical cases and 42 deaths in Durban in 1905. From 1910 screening ofdwellings, use of bed nets and personal protection including the prophy-lactic use of quinine were recommended (Le Sueur et al., 1993). Severeepidemics occurred in 1929 and 1932 and over 22,000 malaria deaths wererecorded by magistrates in 1932 (Le Sueur et al., 1993). Malaria Commit-tees were formed from 1933 among sugar farmers who promoted larvalcontrol, environmental management and the planting of eucalyptus (DeMeillon, 1936). In 1941/1942, experimental use of pyrethroids was usedfor weekly house spraying (Hansford, 1987). From 1945, DDT replacedpyrethrum and by 1956 had extended as far north as Ubombo and Ingwa-vuma districts. Malaria Committees began to be disbanded from 1952; by1965, only 36 autochthonous were detected across the province and rou-tine DDT spraying was discontinued. Case incidence and spatial extentscontinued to decline through the 1970s, although they varied dependingon rainfall (Sharp et al., 1988). By the late 1980s, over 90% of cases werereported from the northern most districts of Ingwavuma and Ubombo(Craig et al., 2004; Kleinschmidt et al., 2001; Mnzava et al., 1998). Cases inKwaZulu-Natal started to increase in 1986–1987 and then began a dra-matic rise from 1991 until over 40,000 cases were reported in 2000(Fig. 4.11; Craig et al., 2004). The rise in case incidence followed thereplacement of DDTwith Deltamethrin for IRS, increasing clinical failuresto chloroquine and rising malaria incidence in southern Mozambique.DDT was re-instated as the preferred insecticide for IRS in 2000 asresistance to pyrethroids was documented in KwaZulu-Natal among

Ann
ual m
alar
ia in
cide
nce
(per
10,
000
Kw
aZul
u po
pula
tion)
45
40
35
30
25
10
5
50
0
20
15
1974
1979
1984
2 1
1989
1994
1999
2004
2009
FIGURE 4.11 Annual malaria case incidence in KwaZulu-Natal Province per 10,000
population 1974–2009. Annual Malaria Cases for KwaZulu-Natal 1974–2005 (Craig et al.,
2004; Marlies Craig, unpublished data); 2006 and 2007 (DoH South Africa, 2008); 2008
and 2009 (Rajendra Maharaj, unpublished data). Population has been estimated using the
1996 population census, 20.7% of South Africa’s population lived in KwaZulu-Natal
Province and intercensal growth rates between 1974 and 1991. Provincial population data
for period post-1991 sourced from STATSA (2011).
208 Robert W. Snow et al.
Author's personal copy
An. arabiensis close to Mozambique border (Maharaj et al., 2005). First-linetreatment policy was changed in KwaZulu-Natal to ACT in 2001 (Barneset al., 2005). Drug policy changes to ACT followed in 2002 inMpumalangaand 2004 in Limpopo.
By 2009/2010, less than 6000 cases were detected across South Africareflecting a decline since 2000 but not a return to case incidence rates thatprevailed in the 1970s (Fig. 4.12). The largest declines were witnessed inKwaZulu-Natal Province and less dramatic declines recorded in Limpopoand Mpumalanga Provinces. By 2010, case incidence was focal and unsta-ble along a restricted margin from Zimbabwe running south through tothe eastern river valleys in Inkumanze district in Mpumalanga (AaronMabuza, personal communication) and the districts Ingwavuma andUbombo in KwaZulu-Natal. There remain practical difficulties in defin-ing locally acquired versus imported cases across South Africa. Over thepast 5 years, there have been increases in cross-border movement amongthe Gaza communities from Mozambique to Gaza settlements in SouthAfrica across the Kruger National Park; increasing migration from Zim-babwe to Mutale sub-district in Limpopo and a more significant threat isposed by the massive immigration that occurs at Beitridge, Limpopo thathas processed, without malaria screening, up to 300,000 economic and

Ann
ual m
alar
ia in
cide
nce
(per
10,
000
resi
dent
Kw
azul
u-N
ata
l, M
pum
alan
ga, L
impo
po p
opul
atio
n)
25
15
5
30
10
35
40
0
20
1970
/197
1
1975
/197
6
1980
/198
1
1985
/198
6
1990
/199
1
1995
/199
6
2000
/200
1
2005
/200
6
2008
/200
9
FIGURE 4.12 South Africa. Annual malaria case incidence per 10,000 population 1970/
1971–2008/2009. Annual malaria incidence in 1970/1971 was 0.12 per 10,000 popula-
tion—not visible on the graph. Malaria case data provided for period 1970/1971–1980/
1981 (DoH South Africa, 2008); 1981/1982–1995/1996 (WHO, 1999); 1996/1997–2008/
2009 (WHO, 2010). Note cases reported in South Africa for periods July–June and graph
shows starting July 1972 and ending June 2009; it has not been possible to define locally
acquired infections from imported infections from the data available, but from 1999, the
more imported infections were likely than locally acquired. No national data were
available for review for the reporting year July 2009–June 2010. To compute incidence
resident populations in Kwazulu-Natal, Mpumalanga and Limpopo provinces have been
used (STATSA, 2011). Estimates prior to 1991 assume that 39.8% of South Africa’s total
population resides in these three provinces.
The Changing Limits and Incidence of Malaria in Africa: 1939–2009 209
Author's personal copy
political migrants from central and horn of Africa in recent years (PhilipKruger, personal communication). Many of these migrants move rapidlyto non-receptive areas of Gauteng Province but some remain in the moremalaria receptive areas of Limpopo and Mpumalanga.
4.4.3.2. NamibiaDe Meillon conducted an opportunistic survey of communities acrossSouth-West Africa in 1950 and used information on vectors, spleenrates, parasite rates and reports from local school, railways and missionauthorities to define four zones of transmission (De Meillon, 1951). Areasin the north including the Ovamboland, Bushmanland and Caprivi wereregarded as intense, stable transmission, while the most southerly areasfrom Grootfontein and Franzfontein to the Orange River were likely to befree of transmission or very focal pockets of occasional transmission

210 Robert W. Snow et al.
Author's personal copy
(De Meillon, 1951). The Ministry of Health and Social Services has alwaysregarded the southern provinces of Karas and Hardap as malaria free(MoHSS, 1995, 1996) and supported De Meillon’s observations in the1950s (De Meillon, 1951). It was not until 1965 that a campaign of IRSwas launched using DDT and bendiocarb in urban residential houses inthe North. A malaria public health specialist was provided by SouthAfrica to establish a network of malaria health inspectors in the areas ofOvambo and Kavango along the Angolan border in the mid-1960s andthis led to the rapid expansion of DDT house spraying across these areaswith almost 1 million houses sprayed each year by 1970. This programmewas managed from Windhoek with regional officers at Oshakati andRuntu; however, due to accessibility, the Caprivi area was manageddirectly from Pretoria and IRS was less complete in this region (FrankHansford, personal communication; Hansford, 1990). Annual mass-bloodsurveys and treatment with Darachlor began in 1969; slides were read atTzaneen in South Africa and results returned to guide the mapping ofhigh-risk areas for the next annual spray rounds. Despite the war forindependence mounted by SWAPO in the northern territories, whichled to regular movement across Angola’s borders and periodic disruptionof basic services, IRS control continued although costs and supply beganto impact on coverage by the early 1990s. All Northern provinces havecontinued to support stable P. falciparum transmission since 1950, andfollowing wide-scale use of DDT for IRS almost exclusively maintainedbyAn. arabiensis. IRS was never mounted in the more southerly districts asparasite prevalence was intrinsically low.
Independence in 1990 unfortunately coincided with a large malariaepidemic. In 1991, the national malaria control programme was launchedas part of the National Vector Diseases Control Programme. In 2004,chloroquine was replaced with artemether–lumefantrine followingincreasing chloroquine treatment failures and deltamethrin replacedbendiocarb for spraying of modern structures. With support from theGlobal Fund, distribution of ITNs began in 2000; by 2009, 22% of thepopulation in the Northern provinces were sleeping under a treated netand 22% of households had been sprayed within the past year (MoHSS,2010). Reliable health information on malaria diagnoses is not availablefor the years during German occupation or during subsequent Union ofSouth Africa rule. A concerted effort to improve parasitologically diag-nosed cases was mounted in 2004 and recent data are hard to interpretagainst changing diagnostic practices.
4.4.3.3. BotswanaMalaria risk in the Republic of Botswana, formerly the British Protectorateof Bechuanaland until independence in 1966, is constrained by latitudeand the Kalahari Desert that makes up 70% of the country’s land mass. In

The Changing Limits and Incidence of Malaria in Africa: 1939–2009 211
Author's personal copy
1958, 98% of all malaria cases were reported from two districts, Ngami-land and Chobe in the North in areas surrounding the Okavango andChobe swamps fed by the Zambezi River (Bechuanaland Protectorate,1928-1963). Commenting on the combined parasitological data and clinicreturns for the year 1960, the medical department regarded the southern-most districts of Tsabong through to Gaborone as malaria free but subjectto introduced risks from neighbouring Transvaal (BechuanalandProtectorate, 1928-1963). During a national parasitological survey in1961–1962, no sampled infants were found to harbour infections inTsha, Loda, Gaborone, Kanye, Moduchi, Tuli and Ghanzi areas (Francode et al., 1984a).
Between 1958 and 1962, few cases were reported along the LimpopoRiver, and in 1959, discussions began with the Transvaal Medical Depart-ment of the Union of South Africa to start cross-border activities insupport of malaria elimination. Malaria control focussed on larval reduc-tion strategies and the use of DDT for house spraying in major townsbefore 1955 and was regarded as successful in reducing the case incidencein major towns such as Maun, Francistown, Mhalapye and Serowe by1956 (WHO-Bechuanaland, 1955). The medical department of the Bechua-naland Protectorate undertook extensive reconnaissance of malaria risksthrough school-based parasitological surveys from 1959 to 1962 (Bechua-naland Protectorate, 1959-62). These mapped data were used to prepare amalaria elimination strategy with the WHO in January 1961. The use ofDDT for IRS was irregular and incomplete between the 1950s and 1971,focussed largely in Ngamiland, Chobe and Francistown (Franco de et al.,1984a). In 1971/1972, fenitrothion was used briefly before being aban-doned the following year (Franco de et al., 1984a; Mabaso et al., 2004). TheBotswana National Malaria Control Programme was reorganized in 1980with headquarters at Maun. Improved biannual IRS using DDT use wasemployed in the most malarious districts of Ngamiland, Chobe andFrancistown (North-East) throughout the 1980s. There is reference madeto weekly chloroquine prophylaxis for pregnant women and childrenbelow the age of 5 years in the mid-1980s (Franco de et al., 1984a).Between 1982 and 1984, over 94% of all cases were reported from Maun,Chobe and Tutume regions (Franco de et al., 1984a). Shortages of DDT in1987 led to a failure to spray large parts of the endemic regions of Ngami-land and Tutume (Benthein, 1989).
In 1998, Botswana stopped using DDT and switched to the use ofdeltamethrin and lambda-cyhalothrin (MoH, 1999). ITN distributionbegan in 1997 but was only made free of charge through vaccine andantenatal clinics in the northern districts in 2008. Over 250,000 peoplewere protected by IRS in 2009 and approximately 69,000 LLIN had beendistributed since 2008. Following escalating treatment failures with chlo-roquine and sulphadoxine–pyrimethamine, Botswana switched to

Ann
ual m
alar
ia in
cide
nce
(per
10,
000
popu
latio
n)
60
120
40
No data
80
200
180
140
100
160
0
20
1928
1933
1938
No
data
No
data
No
data
No
data
1943
1948
1953
1958
1963
1968
1973
1978
1983
1988
1993
1998
2003
2008
FIGURE 4.13 Botswana annual slide-confirmed malaria case incidence 1928–2010 per
10,000 population. Data sources used include 1928–1938 (Bechuanaland Protectorate,
1928–1938); 1945–1953 (WHO-Bechuanaland, 1955); 1954–1960 (Bechuanaland Protector-
ate, 1954–1960); 1963–1973 (WHO, 2002); 1974–1984 (RBM, Southern Africa, 2002); 1985–
2009 (NMCP Botswana, unpublished data, 2009). No data available for review for the
years 1933, 1936, 1939–1944, 1948 and 1971. Reported cases converted to annual incidence
using annual population, to reflect overall changing population sizes with time rather
than population residing in risk areas. Population data from actual census years derived
from MoH reports and National Census Office (Bechuanaland Protectorate, 1934 and
1963; Botswana CSO, 2002–2004; Botswana CSO, 2005) and intercensal growth rates
used to compute non-census years. Annual malaria Incidence in 1928 and 1934 was 280
and 312 per 10,000, respectively, but attenuated on graph.
212 Robert W. Snow et al.
Author's personal copy
artemether–lumefantrine in 2007. Botswana experienced malaria epi-demics in 1988, 1993, 1996 and 1997, but these may have occurred againsta background of rising disease risk through the late 1980s to 2000 whereafter case incidence has declined (Fig. 4.13). In 2000, the National MalariaControl Programme assembled parasitological survey data from the 1990sand case-reporting data from the national health information system toconfirm that the districts of Kgalagadi, Kweneng, Kgatleng, Gaborone,Southern (including Good Hope) and South East were for practical pur-poses malaria free but could be subject to localized epidemics followingimported infections (MoH, 2001). Since 1990, case incidence, while proba-bly focal in its extent and magnitude, remains above 1 per 10,000 popula-tion at risk in areas where transmission has been reported between 1990and 2010 (Fig. 4.13). In September 2010, Botswana launched an elimina-tion strategy with a renewed emphasis on the use of scaled annualspraying between October and December with DDT.
4.4.3.4. ZimbabweMalaria risks in Zimbabwe are determined by altitude and proximity tothe river valleys of the Zambezi and Limpopo. During the 1920s, Thom-son remarked on the high risks associated with low-lying areas in the

The Changing Limits and Incidence of Malaria in Africa: 1939–2009 213
Author's personal copy
river valleys of Shamva, Bindura, Sinoia, Gatooma and Victoria butdescribes Salisbury (Harare) and Bulawayo as urban centres ostensiblyfree from malaria (Thomson, 1929). It is often stated that the central ridgeof mountains that bisects the country from Mutare to Bulawayo is largelyfree frommalaria above 1200 m (Taylor, 1985; Taylor andMutambu, 1986)although others have used 1500 m as the divide (Crees and Mhlanga,1985). The medical department records of malaria start in the late 1800sbut focus almost exclusively on the morbidity and mortality experiencesof European settlers. What is clear is that annual hospital returns suggestsome malaria risk across the entire country since the turn of the nine-teenth century when the country was first colonized.
Malaria control began in earnest in 1949 in Mazoe Valley using HCHfor IRS covering over 200,000 people (Alves, 1951; Alves and Blair, 1953;Blair, 1950) and increased across the lowveld areas through the early1950s (Alves and Blair, 1955). In 1953, the programme expanded furtherto include areas of higher altitude to serve as a ‘‘buffer’’ for Europeancommunities, and by 1955, both lowveld and middleveld areas were‘‘under control’’ (Alves and Blair, 1955). Between 1957 and 1991, DDTwas the preferred residual insecticide. A number of experimental projectswere also launched in reserve areas using enhanced surveillance (Wolfe,1964) and mass drug administration with chloroquine among children orwith amodiaquine and primaquine for immigrant labour (Alves, 1958;Reid, 1962). In 1942, malaria accounted for 10% of all hospitalizations, butby 1962, this had declined to only 0.3% of admissions (Taylor andMutambu, 1986). The city limits of Bulawayo and Harare (previouslySalisbury) were confirmed as malaria free from late 1970s by nationalmalaria control agencies (NMCP Zimbabwe, 2008) and internationaltravel advisories (IAMAT, 2004). The spatially restricted campaignssince the late 1940s were successful in reducing parasite prevalence andcase incidence to a state of unstable transmission by 1959 and through tothe late 1970s. It was hoped that malaria might be eliminated in thesouthern provinces during the 1960s although Rhodesia was never sup-ported by the WHO beyond pre-eradication. Spraying activitiescontinued throughout the civil war for independence during the 1970salthough disruptions were inevitable.
Since independence in 1980, malaria control was re-energized, and in1988, deltamethrin replaced DDT for IRS. The country witnessed a num-ber of severe epidemics of increasing frequency from the mid-1980s withthe most widespread and severe epidemics in 1988 and 1993 (Freeman,1995; Fig. 4.14). From the first reported evaluation and documentation ofchloroquine resistance in 1984, this spread across the country over thenext 10 years (Makono and Sibanda, 1999). Zimbabwe changed its first-line treatment policy from chloroquine to a combination of chloroquine–sulphadoxine/pyrimethamine in 2004; by 2006, artemether-lumefantrine

Ann
ual m
alar
ia in
cide
nce
(per
10,
000
popu
latio
n)
600
1200
400
800
1400
1000
1600
200
No data
1800
0
1980
1985
1990
1995
2000
2005
2009
FIGURE 4.14 Zimbabwe: Annual malaria case incidence per 10,000 population 1980–
2009. All case data combinations of slide confirmed and presumed cases. No data
available for review for the years 2001–2003. Data 1980–1989 from Freeman (1995);
1990–2009 (WHO, 2010); 2000 extracted from WHO (2002). Population data used to
compute incidence derived from the World Bank database (2011).
214 Robert W. Snow et al.
Author's personal copy
had become the recommended first-line treatment. Despite the continueddisruption within the health sector wrought by political unrest (Trenet al., 2007), progress had been made in increasing coverage of ITN with42% of children reported sleeping under a treated net the night before in anational sample survey of over 6000 households in 2008 (NMCPZimbabwe, 2010). Coverage with DDT IRS, reintroduced in 2004(NMCP Zimbabwe, 2008), was considerably lower in 2008 with only15.5% of households reporting spraying in the last 12 months (NMCPZimbabwe, 2010).
The various efforts to control and eradicate malaria over the yearsprobably led to constrained areas of unstable transmission in the 1950s,and by 1979, the central districts were regarded as malaria free (GlobalFund—Zimbabwe, 2010). Transmission today is largely supported onlyby An. arabiensis which has replaced the previously widespread presenceof An. funestus reported in the 1950s (Reid and Woods, 1957). Epidemicscontinue to be common, but by 2009, there were 14 districts that weremalaria free and part of elimination consolidation efforts (Fig. 4.20). Therise and fall of malaria between 1980 and 2009 is shown in Fig. 4.14, and itis important to recognize that Zimbabwe is yet to re-establish diseasecontrol to rates described in the early 1980s.

The Changing Limits and Incidence of Malaria in Africa: 1939–2009 215
Author's personal copy
4.4.3.5. SwazilandThe Kingdom of Swaziland is a landlocked country only 200 km by130 km sharing borders with South Africa and Mozambique. In commonwith Zimbabwe, the ecology of malaria is divided along altitudinal lineswith the lowveld (Bushveld) high-risk areas to the East, midveld and thehighveld lower-risk areas to the mountainous regions in the West(Mastbaum, 1957a). Malaria epidemics in 1937 and 1945 highlight theseverity of malaria in Swaziland; in 1937, hundreds of Swazis died ofmalaria (Packard, 1986); in 1945/1946, 6850 cases were reported (Fig. 4.15;Mastbaum, 1954). The only form of prevention prior to the end of theSecond World War included very limited larval control measures asrecommended by control agencies in the Union of South Africa. Thefirst malaria control unit was established in 1945 and limited HCHhouse spraying began in 1949 (Mastbaum, 1954) which expanded throughthe lowveld during the 1950s and a subsequent switch to DDT until 1951when BHC was used as a cheaper residual insecticide until 1961 (Mabasoet al., 2004). Dieldrin was also used experimentally in 1955–1956 in someareas and larviciding was maintained in Bremersdorp (Manzini) and
Ann
ual m
alar
ia in
cide
nce
(per
10,
000
popu
latio
n)
20
40
No data
60
80
100
120
140
160
180
0
200
1929
1934
1939
1944
1949
1954
1959
1964
1969
1974
1979
1984
1989
1994
1999
2004
2009
FIGURE 4.15 Kingdom of Swaziland. Annual malaria case incidence 1928/1929–2009/
2010 per 10,000 populations. Total population of Swaziland used throughout to highlight
changing national case incidence despite changing margins of risk. Case data derived
for period 1929–1938 (Ministry of Health, Swaziland, 1930–1938); 1946–1973 (Ministry of
Health, Swaziland, 1974); 1974–1982 (MoH Swaziland, 1983); other years and most recent
years provided by Simon Kunene and Joe Novotny. Annual malaria incidence in 1946 was
370 per 10,000 populations. No data available for review for the years 1939–1945.
Population has been sourced from several sites: 1929–1938 (Ministry of Health, Swaziland,
1930–1939); 1946, 1956 census years (Ministry of Health, Swaziland, 1948 and 1957); 1966,
1976, 1986, 1997 and 2007 (CSO, Kingdom of Swaziland, 2011). Non-census years
computed using annual intercensal growth rates. Annual case reporting is July–June;
therefore, graph starts July 1929 and ends June 2010.

216 Robert W. Snow et al.
Author's personal copy
Stegi (Siteki) (Mastbaum, 1957b). By 1955, all rural areas, sugar farms andirrigation schemes across the Kingdom were protected by IRS. Parasito-logical surveys were undertaken annually to monitor the impact of thecontrol programme; in 1945/1946, parasite rates among infants were 37%,declining to 6% by 1952/1953, 1.2% by 1954/1955 and 0% by 1956(Mastbaum, 1955, 1957a; WHO-Swaziland, 1955). In concert with Zim-babwe, Swaziland switched to a system of barrier control in 1958 with thehighveld areas and an intensified buffer of 15 km from the Mozambiqueborder in the Hhohho and Lubombo regions. An. funestus reduced signif-icantly in numbers following the scaled IRS campaigns (Mastbaum,1957b) and An. arabiensis predominates to this day. Spraying operationswere systematically withdrawn from areas that reported no cases within a2-year period and mass IRS was stopped in 1959. Between 1961 and 1967,focal IRS was maintained using both BHC and DDT. Between 1968 and2000, DDT was used for rural IRS and cyfluthrin in houses with paintedwalls (Hansford, personal communication; Mabaso et al., 2004). Oneimportant threat to the success of control during the 1950s and 1960s wasthe rapid introduction of irrigation and imported labour for the ColonialDevelopment Cooperation programme to stimulate sugar cane farming(Packard, 1986). This changed the landscape and risks of malaria includingepidemics in 1966 and 1971 (Fig. 4.15). Between 1956 and 1975, malaria caseincidence was less than 5 per 10,000 population per year with the excep-tions of the epidemics in 1966 and 1971. By 1970, it is stated that the onlycases were those imported from outside the country (MoHSW, 1999). Atthis point, malaria operations were drastically scaled down, funding with-drawn and the malaria department reduced from 36 staff to 7.
During the early 1980s, large-scale populationmovements occurred as aresult of refugees fleeing the civil war in Mozambique, for example, 24,000were settled in Malindza and Ndzevane in 1983 alone (Hansford, 1994). In1986/1987, spraying ceased due to lack of funding and declining govern-ment priority. This was followed by a resurgence of malaria risk untilfunding from South Africa restored control operations and led to a tempo-rary decline, but malaria case incidence followed a pattern seen elsewherein Southern Africa rising through to a peak in the late 1990s including aserious epidemic in 1996 that led to 125 malaria deaths (MoHSW, 1999).Between 1994 and 1999, 70% of cases came from Lubombo on the borderwith Mozambique (MoHSW, 1999). In 1999, Swaziland joined forces withKwaZulu-Natal Province in South Africa and Southern Mozambique toform the Lubombo Spatial Development Initiative (LSDI) to aggressivelyreduce transmission across borders (LSDI, 2007; Sharp et al., 2007). GlobalFund external support increased the national capacity to fund IRS, ITNdistribution, drugs and diagnostics and surveillance in 2003 and 2008. Upuntil 2009, the first-line treatment for malaria was chloroquine, and theSwazi Ministry of Health was the last to change to ACT in Africa in 2010.

The Changing Limits and Incidence of Malaria in Africa: 1939–2009 217
Author's personal copy
Case incidence began to decline from 2000, and for the three consecutiveyears 2006–2008, incidence was below 1 per 10,000 population (Fig. 4.15)and these areas of unstable risk are located in the Eastern regions ofLubombo and Hhohho. In 2008, the Kingdom of Swaziland launched amalaria elimination strategy (MoHSW, 2010).
Swaziland has probably witnessed several periods where itapproached the elimination of P. falciparum resulting in unstable caseincidence (late 1950s, early 1970s and late 2000s). These short-lived suc-cesses do not constitute sustained maintenance of unstable transmission.The recent declines in case incidence between 2006 and 2008 have resultedin less than 100 confirmed cases reported each year largely located in theEastern regions; therefore, we have treated the mapped extent of the casesin the East of the country as unstable and the remaining areas are malariafree. In 2010, the number of reported confirmed cases increased to 253(Simon Kunene, personal communication) highlighting the need forvigilance, cooperation with neighbouring Mozambique that providesseasonal labour and more aggressive containment of transmission ifSwaziland aims to eliminate all local transmission.
4.4.4. Malaria control in Middle Africa: From GMEP pilotsto RBM
4.4.4.1. Before the Second World WarBefore, and during, the Second World War, the control of malaria waslargely focused on protecting Europeans settling in central African terri-tories, military personnel or short-stay colonial administrators. Conse-quently, control was limited to urban administrative centres, ports andeconomic concessions such as mines and farming areas. Prior to theSecond World War, attempts to reduce vector breeding sites were under-taken in a number of urban and economically important areas in thehighly endemic countries of middle Africa under the colonial administra-tion of Britain, France, Portugal, Belgium and Germany. Reference ismade to environmental mapping of larval breeding sites and control,including in some cases penalties for infringement of ‘‘malaria legisla-tion’’, in Conakry, Guinea (Le Moal, 1906), Dakar, Senegal (Heckenroth,1922), the ‘‘Dutton Scheme’’ in Bathurst (Banjul), The Gambia (Colony ofThe Gambia, 1917), Leopoldville (Kinshasa), Democratic Republic ofCongo (Colonie du Congo Belge, 1931), Khartoum, Sudan (Balfour,1913), Dar es Salaam (Colonial Development Fund, 1935; Mackay, 1938),Nairobi, Kisumu and Mombasa, Kenya (De Boer, 1930) and the use ofoiling of breeding sites in large towns in Nigeria (Colony of Nigeria,1927). Few data exist on the overall impact of these approaches; however,several examples are worth highlighting.

218 Robert W. Snow et al.
Author's personal copy
Nairobi was established as the administrative capital of Kenya in 1905,and although it is located at 1795 m above sea level, malaria was asignificant problem for residents from 1911. Over 14,000 malaria caseswere recorded in Nairobi in 1913, and malaria cases fluctuated between2500 and 3600 per year between 1917 and 1919 (Symes, 1940). Three majorepidemics occurred in 1926 (De Mello, 1947; Symes, 1940), 1935 and 1940(De Mello, 1947; Haynes 1940). Following the 1926 epidemic, malaria wasmade a notifiable disease and renewed efforts were established, sup-ported by legislation, to improve drainage and environmental manage-ment to reduce the larval breeding sites across the expanding city (DeMello, 1947; Nairobi Municipality, 1930-1969; Symes, 1940). Notificationsshowed a significant decrease of autochthonous malaria cases from anannual average of 1182 cases in the 1930s, to 317 cases in the 1940s to 250in the 1950s and finally 49 cases in the 1960s during a period when thenumbers of Nairobi residents had increased 35 times since the 1930s(Fig. 4.16; Mudhune et al., 2011). Attribution of declining risk to specificintervention approaches is difficult, but the data shown in Fig. 4.16 sug-gest that urban malaria control was successful in reducing vector breed-ing and locally acquired disease incidence before the Second World War.
During the 1920s in Sierra Leone, extensive drainage of wells and‘‘canalization’’ were undertaken by the local colonial government’s
Ann
ual m
alar
ia in
cide
nce
per
10,0
00
Nai
robi
pop
ula
tion
200No data N
o da
ta400
600
800
10001200
1400
1600
1800
0
2000
1916
1921
1926
1931
1936
1941
1946
1951
1956
1961
1966
1969
FIGURE 4.16 Nairobi city malaria incidence per 10,000 population 1916–1969 (adapted
from Mudhune et al., 2011). Annual malaria incidence in 1926 was 3649 per 10,000
populations and attenuated in graph. No data were reported in 1921–1925 and 1945. Case
incidence between 1952–1964 was less than 5 per 10,000 and between 1965 and 1969 was
less than 1 per 10,000. Annual malaria incidence has been sourced from several pub-
lications: 1916–1920, 1926, 1928 and 1929 (Symes, 1940); 1930–1939, 1944–1949 (Nairobi
Municipality, 1930–1939 and 1946–1949); 1940–1943 (De Mello, 1947); 1950–1969 (Nairobi
Municipality, 1950–1969). No data available for review for years 1921–1925. Population
between 1916 and 1925 is estimated from historical prediction in 1926 (Symes, 1940) and
1928 (Mitullah, 2003); data on censused population 1929–1949 (Nairobi Municipality,
1930–1949) and 1950–1969 (Nairobi Municipality, 1950–1969). Note that malaria was a
notifiable disease after 1930 through to 1969.

The Changing Limits and Incidence of Malaria in Africa: 1939–2009 219
Author's personal copy
Medical and Public Works Department to improve the malaria situationin the towns of Freetown, Kissy and Aberdeen and led to significantreductions in house resting An. gambiae by the early 1940s (Tredre, 1943;Turner and Walton, 1946). Detailed reconnaissance of local vector breed-ing and control continued throughout the Second World War as the portof Freetown was extensively used by the army (Tredre, 1943). In NorthernZambia, between 1929 and 1949, a comprehensive programme of vegeta-tion clearance and drainage was mounted around the Roan Antelopecopper mines, accompanied by provision of quinine and promotion ofmosquito nets. Malaria mortality was reduced by 90% among Europeanemployees within 5 years of the programme starting (Utzinger et al.,2002). At Lagos in Nigeria, drainage of the swamps and provision oftide gates for the creeks during the Second World War were used toreduce malaria risks for the British Air Force who had built a base atApapa and was thought to have been directly responsible for a reductionof malaria attack rates from 100 per 1000 to approximately 30 per 1000stationed soldiers per year (Gilroy and Bruce-Chwatt, 1945). Throughoutthe twentieth century, urbanization has led to systematic declines inmalaria risk across many parts of middle Africa. The changing epidemi-ology of malaria in rapidly growing urban centres in Africa is complex(Hay et al., 2005; Keiser et al., 2004; Robert et al., 2003); however, theeffects of public heath engineering projects before the Second World Warcannot be underestimated (Keiser et al., 2005; Utzinger et al., 2001, 2002).
4.4.4.2. Vector control and pilot elimination projects post-SecondWorld War
The 1948 WHO malaria meeting (WHO, 1948) sought to maximize theadvances made in chemical discoveries for antimalarials and insecticidesduring the Second World War. Attempts to eliminate malaria in Africawere predominately located at the margins of stable transmission in thenorthern and southern latitudes or on islands. Far fewer national-levelelimination efforts were reported in the countries and territories governedby colonial powers in Middle Africa. The coverage of malaria preventionin countries located in this subregion is best summarized from a review ofreports presented to WHO regional meetings in 1955 and 1956 thatbrought together national malaria control programmes to review currentprogress toward elimination. The meetings were held in Lagos in August1955 (WHO, 1955) covering most of the Middle African countries and inAthens in June 1956 where Sudan reported (WHO, 1956). The nationalsummaries provided at these meetings allow some insight into the scope,scale, costs and impact of malaria control activities across the continentfor the approximate reporting year of 1953. Across the Middle Africancountries, the reported information varied between countries in detail,completeness and the sources of data provided; three countries did not

220 Robert W. Snow et al.
Author's personal copy
provide any information (Ethiopia, Italian Somalia and the British Camer-oons). Nevertheless, the data generated for the year 1953 provide someestimate of IRS and chemoprophylaxis coverage. Most countries reportedusing some form of IRS with the exception of Guinea-Bissau and Uganda.The most widely reported insecticide used was DDT; however, countriesalso reported using in addition gammexane, BHC, dieldrin, malariol orhexastan. Overall among the 32 reporting countries, representing approx-imately 122.5 million people at risk, only 4.9% of the population wasprotected by preventative measures and most of the areas protectedwere either special projects or urban settings. In 1955, Russell estimatedthat in the combined territories of West, Central and Eastern Africa only8.5% of people at risk of malaria were protected against infection (Russell,1956). While it is hard to distinguish what constitutes middle, southernand northern Africa, it was estimated that by 1968 of the 214 millionpeople living in the entire Africa region exposed to malaria, only 1.03million (0.5%) were living in areas that had mounted consolidation ormaintenance phases of elimination (Brown et al., 1976). By 1974, amongthe 240 million Africans living in potentially malarious areas, only 2.3%were protected under elimination campaigns, 5.9% were protected byvector control measures and 3.2% were protected by chemoprophylaxis;89% remained unprotected by any form of vector control or chemopro-phylaxis (Brown et al., 1976).
Pilot control and elimination projects across West, Central and EasternAfrica were in some cases highlighted in theWHO conferences in 1955 and1956 others began after 1955. These were significant trials coveringthousands of people. The trials provided important information on theimpact on transmission and mortality of house spraying and drug-basedregular prophylaxis or mass treatment. Between 1945 and 1979, IRS pilotprojects were undertaken in Senegal (Locan andMichel, 1962), Sierra Leone(Davidson, 1947; Walton, 1947, 1949), Liberia (Guttuso, 1967), Ghana(Eddey, 1944), Nigeria (Bruce-Chwatt et al., 1955, 1957; Foll and Pant,1966), Cameroon (Chastang, 1959), Togo (Bakri and Noguer, 1977), Demo-cratic Republic of Congo (Davidson, 1950; Vincke, 1950), Rwanda-Burundi( Jadin et al., 1953), Tanzania (Draper and Smith, 1960; Smith, 1962; Smithand Draper, 1959), Kenya (Fontaine et al., 1975; Payne et al., 1976), Ethiopia(Chand, 1965), Republic of Sudan (BNHP, 1981; El Gaddal et al., 1985;Mirghani et al., 2010) and Mozambique (Soeiro, 1952, 1956); trials of com-bined IRS with mass drug administration or chemoprophylaxis in Nigeria(Molineaux and Gramiccia, 1980; Najera et al., 1973), Cameroon (Cavalieand Mouchet, 1961), Burkina Faso (Escudie et al., 1961; Ricosse et al., 1959),Democratic Republic of Congo (Feuillat et al., 1954; Vincke, 1954), Kenya(Roberts, 1956, 1964a,b; Strangeways-Dixon, 1950) andUganda (De Zuluetaet al., 1964) and trials of drug-based control without IRS in Tanzania(Clyde, 1966, 1967), Ghana (Charles et al., 1962), Kenya (Avery-Jones,
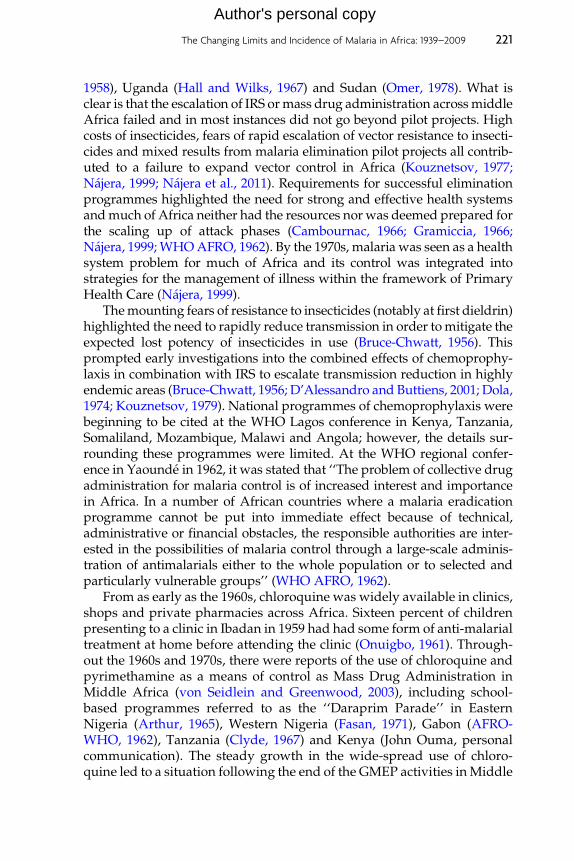
The Changing Limits and Incidence of Malaria in Africa: 1939–2009 221
Author's personal copy
1958), Uganda (Hall and Wilks, 1967) and Sudan (Omer, 1978). What isclear is that the escalation of IRS ormass drug administration acrossmiddleAfrica failed and in most instances did not go beyond pilot projects. Highcosts of insecticides, fears of rapid escalation of vector resistance to insecti-cides and mixed results from malaria elimination pilot projects all contrib-uted to a failure to expand vector control in Africa (Kouznetsov, 1977;Najera, 1999; Najera et al., 2011). Requirements for successful eliminationprogrammes highlighted the need for strong and effective health systemsandmuch of Africa neither had the resources nor was deemed prepared forthe scaling up of attack phases (Cambournac, 1966; Gramiccia, 1966;Najera, 1999;WHOAFRO, 1962). By the 1970s, malaria was seen as a healthsystem problem for much of Africa and its control was integrated intostrategies for the management of illness within the framework of PrimaryHealth Care (Najera, 1999).
Themounting fears of resistance to insecticides (notably at first dieldrin)highlighted the need to rapidly reduce transmission in order tomitigate theexpected lost potency of insecticides in use (Bruce-Chwatt, 1956). Thisprompted early investigations into the combined effects of chemoprophy-laxis in combination with IRS to escalate transmission reduction in highlyendemic areas (Bruce-Chwatt, 1956; D’Alessandro and Buttiens, 2001; Dola,1974; Kouznetsov, 1979). National programmes of chemoprophylaxis werebeginning to be cited at the WHO Lagos conference in Kenya, Tanzania,Somaliland, Mozambique, Malawi and Angola; however, the details sur-rounding these programmes were limited. At the WHO regional confer-ence in Yaounde in 1962, it was stated that ‘‘The problem of collective drugadministration for malaria control is of increased interest and importancein Africa. In a number of African countries where a malaria eradicationprogramme cannot be put into immediate effect because of technical,administrative or financial obstacles, the responsible authorities are inter-ested in the possibilities of malaria control through a large-scale adminis-tration of antimalarials either to the whole population or to selected andparticularly vulnerable groups’’ (WHO AFRO, 1962).
From as early as the 1960s, chloroquine was widely available in clinics,shops and private pharmacies across Africa. Sixteen percent of childrenpresenting to a clinic in Ibadan in 1959 had had some form of anti-malarialtreatment at home before attending the clinic (Onuigbo, 1961). Through-out the 1960s and 1970s, there were reports of the use of chloroquine andpyrimethamine as a means of control as Mass Drug Administration inMiddle Africa (von Seidlein and Greenwood, 2003), including school-based programmes referred to as the ‘‘Daraprim Parade’’ in EasternNigeria (Arthur, 1965), Western Nigeria (Fasan, 1971), Gabon (AFRO-WHO, 1962), Tanzania (Clyde, 1967) and Kenya (John Ouma, personalcommunication). The steady growth in the wide-spread use of chloro-quine led to a situation following the end of the GMEP activities inMiddle

222 Robert W. Snow et al.
Author's personal copy
Africa, whereby all fevers were routinely treated with branded forms ofchloroquine (AFRO WHO, 1962). At Saradidi in Western Kenya duringthe early 1980s, it was estimated that every person received on average1.24 chloroquine exposures per year, and 13.4% of the populationreceived five or more treatments per year (Spencer et al., 1987). With thescaled introduction of Primary Health Care and expanded availability ofretail drugs (Foster, 1995; McCombie, 1996) during the 1970s and 1980s,the presumptive treatment of all fevers as malaria with chloroquine waswidespread. The first confirmed case of chloroquine resistant malaria wasreported in Kenya and Tanzania in the late 1970s (Campbell et al., 1979;Fogh et al., 1979) and spread westwards reaching a presumed completeincursion across all of Africa by 1989 (Bloland et al., 1993; D’Alessandroand Buttiens, 2001; Talisuna et al., 2004).
There are very few long time-series data on malaria incidence fromMiddle Africa, and this limits our ability to fully understand the changingclinical epidemiology of malaria in this region between 1950 and the 1990s.What has been suggested from the examination of cause-specific demo-graphic surveillance studies across Middle Africa is that malaria-specificmortality in childhood reduced significantly following independence fromcolonial rule and remained at a lower incidence through to the 1990s whereafter it rose significantly as a cause of death against a continuing decline inall-cause mortality (Fig. 4.17; Snow et al., 2001). The rise in malaria
Mal
aria
mor
talit
y pe
r 10
00 c
hild
ren
p.a.
15
18
13
3
0
5
8
10
20
8Before 1960
20
1960–1989
11
After 1989
N =
FIGURE 4.17 Annualized malaria-specific mortality in children aged 0–4 years old
pre-1960; 1960–1989 and 1990–1999. Box plot showing median (central lines), 25%, 75%
quartile ranges around the median (box width) and upper and lower limits (T) mortality
estimates per 1000 children aged 0–4 years per annum (reproduced from Snow et al.,
2001).

Mal
aria
-spe
cific
mor
talit
y pe
r 10
00 c
hild
ren
age
d0–
4 ye
ars
p.a.
12
14
16
18
10
2
4
6
8
0
1984
1986
1988
1990
1992
1994
1996
1998
2000
2002
2004
2006
2008
2010
FIGURE 4.18 Niakhar, Senegal: Malaria-specific mortality per 1000 children 0–4 years
1984–2010 (adapted from Munier et al., 2009; Trape et al., 2012). Malaria defined in
demographic surveillance of Naikhar population using verbal autopsies. In 1992,
chloroquine resistance established; by 2000, sulphadoxine–pyrimethamine (SP) used for
second-line rescue therapy; 2003 amodiaquine (AQ)þSP became first-line treatment
until replaced by AQ-Artesunate in 2006; in 2008, ITN distribution went to scale.
The Changing Limits and Incidence of Malaria in Africa: 1939–2009 223
Author's personal copy
mortality witnessed at surveillance sites during the 1990s coincided withestablished high levels of chloroquine resistance (Snow et al., 2001) andmore temporally associated with documented drug resistance at Niakharin Senegal (Fig. 4.18; Munier et al., 2009; Trape et al., 2012). These observa-tions are further supported by longer-term data on malaria admissions at aTea Estate population in Kenya which showed low incidence during the1960s to early 1980s followed by a rise in malaria reaching peaks in the1990s, of note in this series is the subsequent decline through to 2009(Fig. 4.19; Shanks et al., 2002; Stern et al., 2011).
The peak of malaria incidence since the end of the GMEP in Africa wasprobably somewhere between the early 1990s and early 2000s in manysites of Africa where first-line drugs were failing and the prevention ofinfection with vector control was minimal. This period coincides withresurgent risks described earlier for the Malagasy highlands (Fig. 4.10),malaria mortality in Sao Tome and Prıncipe (Fig. 4.7), Kingdom of Swazi-land (Fig. 4.15), South Africa (Fig. 4.12) and Botswana (Fig. 4.13).
4.4.4.3. The RBM era in middle AfricaThe RBM initiative and the supporting financial structures provided bythe Global Fund emerged at a time when Africa was facing a rapidlyrising malaria disease burden. Both initiatives were slow to impact on the

Ann
ual m
alar
ia a
dmis
sion
s
200
400
600
800
1000
1200
0
1966
1971
1976
1981
1986
1991
1996
2001
2006
2009
FIGURE 4.19 Annual malaria admissions in Kericho Tea Estate population, Kenya 1966–
2009 (adapted from Shanks et al., 2002; Stern et al., 2011).
224 Robert W. Snow et al.
Author's personal copy
poor coverage of new efficacious tools such as ITN (Noor et al., 2009),removing failing monotherapies and supporting policy change in favourof ACTs (Attaran et al., 2006) and the funding necessary to implementaggressive control started reaching high-burden countries slowly(Narasimhan and Attaran, 2003; Teklehaimanot and Snow, 2002). TheScale-Up for Impact initiative was conceived to rapidly change the land-scape of poor coverage across Africa and achieve near universal accessand use of prevention and clinical care (Campbell and Steketee, 2011). By2005, new international funding was translating into effective coverage ofprevention (ITN, IRS and intermittent presumptive treatment of malariain pregnancy) across middle Africa. Between 2008 and 2010, a total ofabout 254 million nets were supplied and delivered to sub-SaharanAfrica, and approximately 34% of young children were sleeping underan ITN by 2010 (RBM, 2011). About 10% of Africans at risk of malariawere protected by IRS by 2010 (RBM, 2011) including more recent IRSpolicies and implementation in The Gambia, Senegal, Mali, Liberia,Ghana, Benin, Nigeria, Gabon, Angola, Democratic Republic of Congo,Zambia, Mozambique, Malawi, Uganda, Kenya, Tanzania, Rwanda, Bur-undi, Ethiopia and Eritrea. Although coverage was deliberately patchy,four countries achieved household coverage greater than 50% (RBM,2011). Overall, IRS coverage estimates are considerably higher in 2010than those reported during the 1950s and 1960s for Middle Africa. DDT isused for malaria control in 13 African countries.
Following growing concerns about chloroquine and sulphadoxine–pyrimethamine resistance and the lack of an international response(Attaran et al., 2006), remarkably rapid concerted action led to the policychanges to support novel ACTs as first-line therapies across Africa. In2003, only four countries in Africa had adopted ACTs as their first-line

The Changing Limits and Incidence of Malaria in Africa: 1939–2009 225
Author's personal copy
therapy (Bosman and Mendis, 2007); by 2010, they were first-line treat-ment in every malaria endemic country in Africa. Despite rapid policychange, making sure clinical cases are treated with an ACT has so farproven to be the most elusive milestone of RBM success nationally andregionally. These drugs still reach only a fraction of people who needthem. Most countries in Middle Africa, for which data are available,report that less than 20% of febrile children access an ACT (RBM, 2011).Not all fevers are malaria and the big-push is to now scale up parasitolog-ical diagnosis of malaria to improve case-management practices(D’Acremont et al., 2009).
RBM, the Global Fund and bilateral agencies supporting malaria con-trol in Africa have all improved how we assess the impact of financialinvestments to support disease control and elimination efforts. However,while there has been a significant improvement in how partners measurefinancial investment and coverage of malaria control activities, far lessattention has been given to the documented impact on disease incidenceand death frommalaria. Modelled expected impacts of reported interven-tion coverage form the main evidence base by which partners estimatedeaths averted in Africa since 2000 (Eisele et al., 2009; 2010; Komatsu et al.,2010; RBM, 2011). These models predict that approximately 0.8 to 1.1million deaths have been averted since the launch of RBM. Our onlyempirical evidence in Middle Africa comes from short-term temporalcoincidence between increased access to effective interventions and thechanging patterns of paediatric hospitalization with severe malaria since1999 in Eritrea (Nyarango et al., 2006), Ethiopia (Graves et al., 2008; Ottenet al., 2009), The Gambia (Ceesay et al., 2008; 2010); Gabon (Bouyou-Akotetet al., 2009), Rwanda (Otten et al., 2009; Sievers et al., 2008), Kenya(O’Meara et al., 2008; Okech et al., 2008; Okiro et al., 2007, 2009), Guinea-Bissau (Rodrigues et al., 2008), Senegal (Brasseur et al., 2011; Sarrassat et al.,2008), Tanzania (Mmbando et al., 2010) and Zambia (Chizema-Kaweshaet al., 2010). These reports suggest a wide-spread effect of scaled interven-tion across middle Africa since 1999 and are consistent with declines seenin southern Africa and those island states pursuing elimination.
There is little doubt that the epidemiology of malaria is in transitionacross Africa, yet there are several important aspects of this change thatneed highlighting. Firstly, all is not equal and there are reports from somehigh transmission settings in Africa including Western Kenya, (Okiroet al., 2009), Uganda (Okiro et al., 2011) and Malawi (Roca-Feltrer et al.,2012); the clinical burden presenting to hospitals has increased since 1999.Most reports of declining malaria burdens are from settings where theinitial transmission intensity was low to moderate (O’Meara et al., 2010).Secondly, progress in ensuring that the most vulnerable communities areprotected across Middle Africa has been varied with some countriesachieving more than others with similar levels of donor support
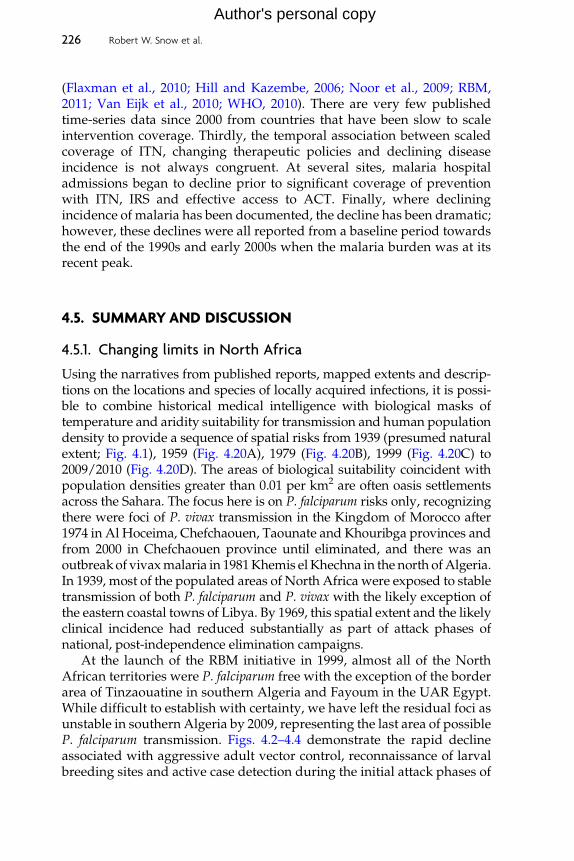
226 Robert W. Snow et al.
Author's personal copy
(Flaxman et al., 2010; Hill and Kazembe, 2006; Noor et al., 2009; RBM,2011; Van Eijk et al., 2010; WHO, 2010). There are very few publishedtime-series data since 2000 from countries that have been slow to scaleintervention coverage. Thirdly, the temporal association between scaledcoverage of ITN, changing therapeutic policies and declining diseaseincidence is not always congruent. At several sites, malaria hospitaladmissions began to decline prior to significant coverage of preventionwith ITN, IRS and effective access to ACT. Finally, where decliningincidence of malaria has been documented, the decline has been dramatic;however, these declines were all reported from a baseline period towardsthe end of the 1990s and early 2000s when the malaria burden was at itsrecent peak.
4.5. SUMMARY AND DISCUSSION
4.5.1. Changing limits in North Africa
Using the narratives from published reports, mapped extents and descrip-tions on the locations and species of locally acquired infections, it is possi-ble to combine historical medical intelligence with biological masks oftemperature and aridity suitability for transmission and human populationdensity to provide a sequence of spatial risks from 1939 (presumed naturalextent; Fig. 4.1), 1959 (Fig. 4.20A), 1979 (Fig. 4.20B), 1999 (Fig. 4.20C) to2009/2010 (Fig. 4.20D). The areas of biological suitability coincident withpopulation densities greater than 0.01 per km2 are often oasis settlementsacross the Sahara. The focus here is on P. falciparum risks only, recognizingthere were foci of P. vivax transmission in the Kingdom of Morocco after1974 in Al Hoceima, Chefchaouen, Taounate and Khouribga provinces andfrom 2000 in Chefchaouen province until eliminated, and there was anoutbreakof vivaxmalaria in 1981Khemis elKhechna in the north ofAlgeria.In 1939, most of the populated areas of North Africa were exposed to stabletransmission of both P. falciparum and P. vivax with the likely exception ofthe eastern coastal towns of Libya. By 1969, this spatial extent and the likelyclinical incidence had reduced substantially as part of attack phases ofnational, post-independence elimination campaigns.
At the launch of the RBM initiative in 1999, almost all of the NorthAfrican territories were P. falciparum free with the exception of the borderarea of Tinzaouatine in southern Algeria and Fayoum in the UAR Egypt.While difficult to establish with certainty, we have left the residual foci asunstable in southern Algeria by 2009, representing the last area of possibleP. falciparum transmission. Figs. 4.2–4.4 demonstrate the rapid declineassociated with aggressive adult vector control, reconnaissance of larvalbreeding sites and active case detection during the initial attack phases of

Author's personal copy

Author's personal copy

Author's personal copy

Author's personal copy

FIGURE 4.20 The changing margins and stability of P. falciparum transmission (A) 1959, (B) 1979, (C) 1999 and (D) 2009. Dark grey representing
no malaria risk; light grey biologically suitable transmission but population density less than 0.01 person per km2; light green unstable
transmission and dark pink stable transmission. (A) 1959: The remaining focal areas of P. falciparum risk in Kingdom of Morocco as reported and
mapped by Hoeul and Donadille (1953). The regions of Oran, Constantine and Algers in Algeriawere under aggressive control from the mid-1940s
that transitioned this area to unstable conditions by 1959 (Benzerrough and Janssens, 1985; Hammadi et al., 2009; Parrot et al., 1946). Elimination
campaigns systematically reduced the margins of malaria risk in Libya with a remaining area of unstable risk in Fezzan region by 1959 (Gebreel
et al., 1985). In Egypt, by 1953, no cases were recorded in the Canal Zone, Assiut, Girga, Kom Ombo, Asswan and Nubia regions (Halawani and
Shawarby, 1957). The Republic of Djibouti was malaria free. The islands of Reunion and Mauritius had substantially reduced malaria incidence to
render each island unstable by 1959. Use of IRS and chemoprophylaxis in Madagascar led to effective control in the highland plateau districts by
1959 (Bernard, 1954) and resulted in exceptionally low transmission and disease incidence. For South Africa, the map produced by Brink (1958)
and narrative provided by Hansford (1974) have been used to constrain the margins of risk in the Transvaal area by 1959 resulting from aggressive
use of DDT and providing evidence of unstable risk in the lower margins. It was felt that these control efforts were mirrored by a changing risk
along the lower margins of Botswana along the Limpopo River (Franco de et al., 1984a). In Zimbabwe, similar attack phases of elimination were
able to reduce case incidence in unstable transmission and provided as mapped extents by Alves and Blair (1955). Case incidence declined
rapidly in the Kingdom of Swaziland though the use of DDTand stable transmission was constrained to Lubombo and Hhohho regions until 1999
(MoHSW, 1999; Simon Kunene, personal communication); the highveld was regarded as malaria free (Fontaine, 1987), and this was digitized using
ARCGIS and regarded as malaria free through to 2009. (B) 1979: The Kingdom of Morocco was free from P. falciparum by 1974. By 1979, falciparum
transmission had been eliminated in the northern territories of Algeria and focal risks persisted in the southern provinces with increasing
stability with increasing latitude (Benzeroug and Wery, 1985). All of the Northern provinces of Tunisia were malaria free by 1968, and by 1979, all
districts were falciparum free (Ambroise-Thomas et al., 1976). Libya was declared malaria free in 1973. Stable transmission in Fayoum region.
Unstable transmission was likely in some parts of Egypt in 1979 at malaria suitable areas but national case incidence dropped to less than 1 in
10,000 (Hassan et al., 2003). 1979 was probably the last period when The Republic of Djibouti was regarded as malaria free. Reunion and
Mauritius were declared malaria free by 1979. Elimination efforts on the islands of Cape Verde had reduced case incidence to zero in all but
Santiago by the late 1960s. It is also likely that combined disease control on Mayotte resulted in a case incidence that would be regarded as
unstable by 1979. Drug-based and IRS control in the highlands of Madagascar sustained unstable control through to 1979. Continued efforts to
eliminate malaria in the Transvaal and KwaZulu-Natal provinces rendered increasing areas unstable and reduced the spatial extent of risk in
South Africa (Craig et al., 2004; Hansford, 1974; Kleinschmidt et al., 2001). In Namibia, combined medical intelligence based on case data
generated by the Ministry of Health and Social Services since the 1980s shows the regions of Khomas and Erango to have conditions that are
Author's personal copy

borderline malaria free and unstable transmission with consistently low case incidence (MoHSS, 1996). The southern-most risk districts in
Namibia had very few clinical cases during the early 1980s and regarded here as unstable by 1979 (MoHSS, 1996). These qualitative observations
were more systematically quantified using reporting from mapped facilities over the period 2008–2009 (Snow et al., 2010b). In Zimbabwe,
evidence suggests that the areas under control in 1959 remained under control rendering them unstable transmission; the cities of Harare and
Bulawayo were malaria free as were highland districts (NMCP Zimbabwe, 2008). In Swaziland, case incidence data were mapped in 1983 to show
that stable risks were constrained to only the areas located on the east of the country (Franco de et al., 1984b); these cases were digitized and
enveloped using ARCGIS. (C) 1999: A foci of risk in Algeria on the border with Mali at Tinzaouatine continued through to 2009 (Boubidi et al.,
2010). El Fayoum Governorate in Egypt remained a focal area of unstable transmission in 1999 (Hassan et al., 2003) with no autochthonous cases
elsewhere in Egypt. The Republic of Djibouti witnessed a sequence of epidemics from 1988 and in areas where transmission was biologically
suitable leading to the establishment of stable endemicity. Madagascar, Cape Verde (Santiago) and Mayotte witnessed resurgent risks of malaria
during the late 1980s and early 1990s that returned previously unstable areas to stable transmission and high disease burden. Risks in South
Africa were constrained by 1999 to areas located along the Kruger national park and borders with Zimbabwe in the Limpopo and Mpumalanga
Provinces (Philip Kruger and Aaron Mbuza, personal communication) and the two northerly districts of Ingwavuma and Ubombo in KwaZulu-
Natal Province (Craig et al., 2004; Kleinschmidt et al., 2001). The subregional rise in malaria risks affected Zimbabwe against a background of
political crisis and it is assumed that lowveld areas previously under control in Zimbabwe returned to stable transmission by 1999 with the
exceptions of malaria-free situations in Bulawayo, Harare and central highlands. (D) 2009: Since 1998, no locally acquired case has been reported
from Fayoum in Egypt and now the country is malaria free although not certified about. Following efforts to control malaria in the Republic of
Djibouti from 2008, case incidence was unstable (Hawa Guessod, personal communication). In Algeria, Tinzaouatine remains the only area of
unstable risk by 2010. Locally acquired cases have been reported on the Cape Verdean islands of Santiago (mainly Saint Caterina and Santa Cruz)
and Boa Vista in recent years but represent an unstable situation. Cases are concentrated in the northern districts of the main island of Mahore,
in Mayotte (Solet et al., 2007). Botswana reported no cases in most areas previously free of malaria by 2010; however, locally acquired cases
were detected in Kweneng West and East districts between 2006 and 2008 rendering this area unstable (Ministry of Health, 2009). By 2009,
malaria-free areas extended to include 14 districts in central highlands in Zimbabwe and under consolidation phase of elimination (Global Fund
Zimbabwe, 2010). By 2009, case incidence in South Africa and Swaziland had dropped dramatically and case incidence by district has been used
to delineate unstable and stable areas risks in Limpopo and Mpumalanga (Philip Kruger and Aaron Mbuza, personal communication; Ngomane
and de Jager, 2012), unstable risks in Ingwavuma, KwaZulu-Natal (Marlies Craig and Rajendra Maharaj, personal communication) and unstable
risks within the districts of Hhohho and Lubombo, with one stable endemic district of Mhlangatane, in the Kingdom of Swaziland (Kunene et al.,
2011).
Author's personal copy

The Changing Limits and Incidence of Malaria in Africa: 1939–2009 233
Author's personal copy
elimination programmes in North Africa. It is, however, important torecognize that malaria control had a long history in North Africa datingback over many years prior to the GMEP, and the effects of larval reduc-tion and mass drug administration on transmission in Morocco, Algeria,Tunisia and UAR Egypt are likely to have substantially reduced theendemicity prior to the launch of elimination campaigns. The naturalbarrier provided by the vast Saharan desert serves as a protection fromthe highly endemic regions of sub-Saharan Africa, thus reducing the risksof imported, cross-border malaria. Nevertheless, North Africa attractsmany economic migrants from the south. Since 2002, in the Kingdom ofMorocco, over 700 imported malaria cases have been detected (WHO-Morocco, 2010); between 1980 and 2009, 981 and 2466 imported cases havebeen detected in Tunisia (WHO-Tunisia, 2010) and Libya (WHO-Libya,2010), respectively. Demonstrations in Tunisia in 2010 set off a wave ofpolitical unrest across North Africa and Arabian Peninsula known as theArab Spring. It remains uncertain how the building and restructuring ofAlgeria, Tunisia, Libya and Egypt will affect the immediate vigilancerequired to maintain active detection of imported infections and theefforts required to contain onward transmission where vectors continueto provide areas of receptive risk.
4.5.2. The successes and failures of malaria elimination onAfrica’s islands
Small island states are thought to represent unique opportunities toeliminate malaria (Kaneko et al., 2000), having identifiable vector ecolo-gies and accessible populations isolated from neighbours harbouringcontinued transmission. All the self-governed African islands haveattempted malaria elimination at some stage over the past 70 years.These islands share several common properties that distinguish themfrom mainland Africa. Human settlement was more recent and involvedan ad-mixture of people from Asia and Africa resulting in significantproportions of the population having duffy-positive red cells and, com-binedwith a history of trade outside Africa, receptive to the establishmentof P. vivax transmission on all the islands in the Atlantic and IndianOceans. P. vivax is usually the ‘‘last parasite standing’’ during eliminationcampaigns (Baird, 2010) and harder to prevent from reintroduction aswitnessed in Mauritius. All the small islands have distinct agriculture-based ecologies and human settlement patterns allowing the relativelyeasy mapping of vector breeding sites, human risk and stratified spatialcontrol. With the exception of Zanzibar, migration between mainlandAfrica and the islands is quantitatively limited through a sea buffer ratherthan a desert buffer for North Africa, with the high transmission countriesof the continent. Increasing air travel has, however, transformed risks of

234 Robert W. Snow et al.
Author's personal copy
imported malaria, and special screening and containment programmes atairports during consolidation phases of elimination in Cape Verde,Reunion, Mauritius and Sao Tome and Prıncipe have at some stage beenimplemented. Interestingly, the islands of Madagascar and the Union ofComoros pose the largest threats to the re-establishment of malaria inReunion (Denys and Isautier, 1991). Although physically separated fromone another, the islands of the Indian Ocean, therefore, require a subre-gional effort to reduce the risks of re-establishing transmission in islandstates with high malariogenic potential.
Only Reunion (1979) and Mauritius (1973 and 1998) have achievedmalaria elimination since the launch of the GMEP. The Cape Verdeanislands reduced the spatial extent considerably and much earlier, but localtransmission continues on the islands of Santiago and Boavista. Zanzibar(three attempts), Mayotte (two attempts) and Madagascar (three attempts)have enjoyed varying degrees of success towards elimination over the past50 years, often reducing transmission and disease incidence to extremelylow levels but never interrupting transmission. On the islands of Sao Tomeand Prıncipe and the Union of Comoros, far less was achieved before thelaunch of the RBM initiative. An important component of previous elimina-tion efforts on the islands has been the combination of IRS with wide-scaleuse of anti-malarial drugs through mass drug administration, prophylaxisor screening and treatment. During periods when parasites were sensitiveto chloroquine, this approach would have had a dramatic effect on theparasite reservoir. Resurgent interest in this approach has been adopted inComoros; however, there remain concerns over the use of artemisininmonotherapy as resistance emerging to this important therapeutic agentwould be a disaster on far more than a local scale.
A consistent theme throughout the combined histories of malariaelimination attempts across Africa’s islands is the impact of waningpolitical support and financial commitments to maintaining preventionand surveillance when disease burdens are reduced to very low levels.Sustaining the malaria-fee status in Mauritius and the progressive effectsof early elimination attempts in Sao Tome and Prıncipe, Zanzibar andMadagascar were all jeopardised by weakened enthusiasm and commit-ment to programme efforts. Failures were also attributed to emergingdrug resistance (Cape Verde, Mayotte, Zanzibar andMadagascar), chang-ing patterns of land use (Madagascar) and imported infections accompa-nied by declining surveillance efforts (Mauritius and Cape Verde).Anticipating a long game, demanding constant vigilance rather than ashort-term win, is critical to sustaining success towards elimination.
All islands that have yet to interrupt transmission have witnesseddramatic reductions in the incidence and public health burden posed bymalaria since 2005. This is coincident with the scaling up of replacementACT first-line treatments, provision of free ITN and targeted IRS made

The Changing Limits and Incidence of Malaria in Africa: 1939–2009 235
Author's personal copy
possible following a massive increase in financial resources provided bythe Global Fund and other international agencies. In addition to theindependently governed islands, Bioko, one of the islands of EquatorialGuinea, saw a huge reduction in child mortality and malaria incidencefollowing scaled IRS and ITN coverage since 2005 (Kleinschmidt et al.,2009). The disease reduction successes across high-burden islands haveencouraged a renewed wave of enthusiasm for elimination: the Union ofComoros, Madagascar and Sao Tome and Prıncipe have all explicitlydeveloped elimination attack, maintenance and consolidation strategiesto achieve malaria-free status before 2020.
The RevolutionaryGovernment of Zanzibar and its 1.2 million residentsnow face a difficult decision to either maintain aggressive control to sustaina very lowprevalence and incidence of disease (low-stable endemic control)or embark on a pathway to elimination. An elimination feasibility studyreviewed the risks posed by imported infections from travellers each year(between 10,000 and 25,000 air travellers per month), its close connectivityby ferry and boats to mainland Tanzania and the economic costs (ZMCP,2009). The report concluded that the vulnerability posed by imported infec-tions, high receptivity on the islands and the costs (US $1.88 per capita forsustained control versus US $2.87 per capita for elimination over 25 years)argued in favour of sustaining low-stable endemic control (ZMCP, 2009).
4.5.3. Elimination and control efforts in Southern Africa
Malaria control activities began as national campaigns from 1948 in SouthAfrica, the Kingdom of Swaziland and Zimbabwe and the 1960s inBotswana and Namibia. Prior to 1948, malaria prevention was not wide-spread and tended to focus on the use of quinine prophylaxis amongEuropean settlers and limited vector control notably efforts to improveenvironmental sanitation, oiling and use of Paris Green. From the late1940s, the wide-scale use of IRS programmes with a variety of residualinsecticides, but mostly DDT, across many areas of Southern Africa wasable to achieve rapid and substantial reductions in transmission and inci-dent cases. None of the southern African countries have managed to sub-stantially reduce the margins of transmission that prevailed in 1939(Fig. 4.1), or completely interrupt transmission within the margins, buthave enjoyed periods of low case incidence that would qualify as unstabletransmission between the 1959 and 1979 (Fig. 4.20AandB) coincidentalwithperiods of aggressive IRS campaigns (Mabaso et al., 2004;Mastbaum, 1965).
Resurgent risks began to emerge in the 1980s (Figs. 4.11–4.15) and havebeen variously attributed to large-scale population movements during the1970s and 1980s due to regional conflicts, waning political commitmentand funding, periodic interruption of IRS, emerging drug resistance andthe HIV epidemic. The renewed political commitment to malaria control

236 Robert W. Snow et al.
Author's personal copy
and elimination in the 2000s served to galvanize efforts in Southern Africaand have led to recent successes in reducing the burden ofmalaria in everycountry from its second peak. However, it is important to recognize thatduring the period when the international development lens was focussedelsewhere and malaria in Africa was not a priority, much of SouthernAfrica experienced a lower malaria incidence than they do presentlyfollowing substantial investment and a renewed political interest.
There are a number of reasons why none of the Southern Africancountries have eliminated malaria. The dominant vectors, An. arabiensisand An. funestus, are considerably more efficient than their counterpartsin North Africa and breeding sites harder to map than on islands. Insecti-cide resistance, behavioural adaptation and changing species dominancehave posed challenges to IRS campaigns across the subregion (Enayatiand Hemingway, 2010). Compared to North Africa, southern Africancountries have been considerably poorer and have realized independentgovernance representing the majority of the population much later. Thecontinued presence of asymptomatic carriage among semi-immune resi-dents and the constant introduction of new migrant infection renderelimination particularly difficult even with the most aggressive combi-nations of active and passive surveillance. Towards the end of the attackphase of elimination, mass screening and active surveillance of popula-tions who are likely to harbour infections asymptomatically throughacquired anti-parasitic immunity is necessary. With the exception ofSouth Africa, all other southern African countries have not mountedactive surveillance since the 1960s, and the slide examination rates forpresumed clinical cases have been poor. During a pilot approach toactive screening in the southern part of Zimbabwe in the early 1960s, itwas recognized that this is an expensive element of the attack phase ofelimination, demanding skilled human resources and a carefully sensi-tized population (Wolfe, 1964). Prolific cross-border seasonal migrationfrom neighbouring highly endemic countries such as Angola andMozambique continues to pose a larger threat to interrupting transmis-sion in Namibia and Swaziland and South Africa. In recognition of thesubregional threats, initiatives have started across borders including theLSDI (Mozambique, Swaziland, South Africa) (LSDI, 2007; Sharp et al.,2007), Trans-Zambezi Malaria Initiative and the Trans-Kunene Initiative(SARN, 2011).
Recent progress in reducing case incidence has prompted the Ministersof Health in the subregion to launch the Africa Malaria Elimination Cam-paign supported by theAfricanUnion (AU) and the SouthernAfricaDevel-opment Community (SADC). The concept of theMalaria Elimination 8 (E8)was proposed and signed as the E8 Windhoek Agreement in 2009. Thecountries on mainland Africa that constitute the E8 include those regardedas having the greatest potential to eliminate malaria by 2015: Botswana,
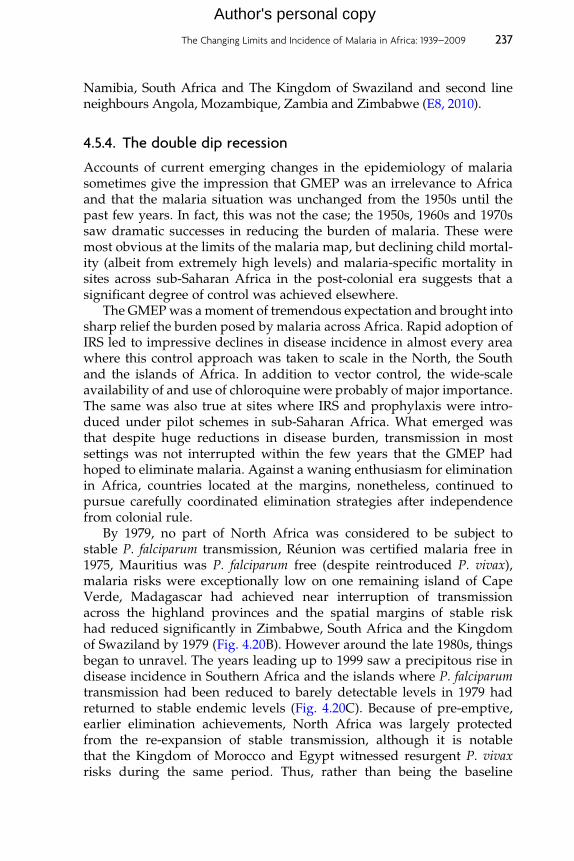
The Changing Limits and Incidence of Malaria in Africa: 1939–2009 237
Author's personal copy
Namibia, South Africa and The Kingdom of Swaziland and second lineneighbours Angola, Mozambique, Zambia and Zimbabwe (E8, 2010).
4.5.4. The double dip recession
Accounts of current emerging changes in the epidemiology of malariasometimes give the impression that GMEP was an irrelevance to Africaand that the malaria situation was unchanged from the 1950s until thepast few years. In fact, this was not the case; the 1950s, 1960s and 1970ssaw dramatic successes in reducing the burden of malaria. These weremost obvious at the limits of the malaria map, but declining child mortal-ity (albeit from extremely high levels) and malaria-specific mortality insites across sub-Saharan Africa in the post-colonial era suggests that asignificant degree of control was achieved elsewhere.
The GMEPwas amoment of tremendous expectation and brought intosharp relief the burden posed by malaria across Africa. Rapid adoption ofIRS led to impressive declines in disease incidence in almost every areawhere this control approach was taken to scale in the North, the Southand the islands of Africa. In addition to vector control, the wide-scaleavailability of and use of chloroquine were probably of major importance.The same was also true at sites where IRS and prophylaxis were intro-duced under pilot schemes in sub-Saharan Africa. What emerged wasthat despite huge reductions in disease burden, transmission in mostsettings was not interrupted within the few years that the GMEP hadhoped to eliminate malaria. Against a waning enthusiasm for eliminationin Africa, countries located at the margins, nonetheless, continued topursue carefully coordinated elimination strategies after independencefrom colonial rule.
By 1979, no part of North Africa was considered to be subject tostable P. falciparum transmission, Reunion was certified malaria free in1975, Mauritius was P. falciparum free (despite reintroduced P. vivax),malaria risks were exceptionally low on one remaining island of CapeVerde, Madagascar had achieved near interruption of transmissionacross the highland provinces and the spatial margins of stable riskhad reduced significantly in Zimbabwe, South Africa and the Kingdomof Swaziland by 1979 (Fig. 4.20B). However around the late 1980s, thingsbegan to unravel. The years leading up to 1999 saw a precipitous rise indisease incidence in Southern Africa and the islands where P. falciparumtransmission had been reduced to barely detectable levels in 1979 hadreturned to stable endemic levels (Fig. 4.20C). Because of pre-emptive,earlier elimination achievements, North Africa was largely protectedfrom the re-expansion of stable transmission, although it is notablethat the Kingdom of Morocco and Egypt witnessed resurgent P. vivaxrisks during the same period. Thus, rather than being the baseline

238 Robert W. Snow et al.
Author's personal copy
against which we should measure what is happening now, the 1990sshould probably be regarded as an exceptional period in which malariawas on the rise following a period of control, albeit limited, in manyparts of Africa.
The reasons for this are probably multifactorial: because interest inmalaria control had fallen off the international agenda since the late 1970s,effective new tools such as impregnated bed nets failed to be taken up. Inareas that had enjoyed protracted periods of effective control populationswere naive to the clinical consequences of infection having failed todevelop collective immunity. In many areas, especially those where vec-tor control had never been widely applied, the widespread use of chloro-quine had probably played the major role in controlling morbidity andmortality which began to be lost with increasing drug failure. The result,beginning in the late 1980s and early 1990s, was a wave of increasingmalaria incidence and deaths in many countries, including those locatedat the margins of stable transmission. A rise in incidence was seen acrosslarge parts of Southern Africa and the highland fringes of East Africa andMadagascar, and there was a stalling of progress towards elimination inNorth African countries yet to achieve a malaria-free status (Morocco,Egypt, Algeria). At the same time, malaria mortality was rising acrossmany parts of sub-Saharan Africa and in some areas may have doubled.By 1999, the international community had recognized the need for globalaction with a focus on Africa, new funding was made available and thesubsequent 10 years led to the re-establishment of effective control opera-tions in Southern Africa and the African islands leading to a renewedcontraction of stable endemicity by 2009 (Fig. 4.20D).
Thus, it seems plausible that the public health burden of malariaacross much of Africa south of the Sahara witnessed a substantive declinefollowing the Second World War. These achievements were probablysustained through the 1970s and early 1980s, and at some point towardsthe end of the 1980s into the 1990s, malaria incidence began to rise reach-ing, in some areas, pre-1940s levels by the late 1990s. Since 2000, evidenceexists of a declining incidence of malaria in many (though by no meansall) parts of Africa. It is reasonable to assume that the first ‘‘dip’’ inmalaria in Africa was largely related to deliberate attempts at control;certainly, this was the case at the limits of transmission. Similarly, themassively increased investment in malaria control must be playing animportant role in the second or ‘‘double dip’’ in malaria. However, it isalso important to recognize that there may be other factors at play; inseveral areas, it is clear that the beginnings of the current decline intransmission considerably preceded the widespread application of newinvestments in control and that these are insufficient to explain the timingand degree of the changes. Many factors, including climatic, socioeco-nomic, and biological factors, could potentially be lending a hand to the

The Changing Limits and Incidence of Malaria in Africa: 1939–2009 239
Author's personal copy
undoubted effects of vector control and availability of effective drugs.Understanding these factors is important because whilst they seem to bemoving in the right direction at the moment, there is no guarantee thatthis will always be the case.
4.5.5. The future
The past few years have seen renewed international commitment andinvestment in global malaria control. Its successes have led to a newoptimism and a refocussing of the world’s attention on the importanceof eradication as the long-term goal of our efforts. At the same time,there has been concern that Africa may once again be neglected andfinancial resources for a global programme diverted from high-burdencountries to support shrinking the malaria map at the low-risk marginsof the world outside Africa. Against this back ground, there are cer-tainly many lessons to be drawn from the long experience in Africa ofattempts at malaria control and elimination, and we have attempted tobring together for the first time in this review this accumulated experi-ence in some depth. Although it is clear that the final steps to elimina-tion, even in apparently favourable circumstances are difficult,prolonged and susceptible to setback from many causes, perhaps themost important point for the future is that reducing malaria to a minorproblem in terms of disease or deaths is an inescapable point on the wayto elimination. Here, the repeated lesson from control programmesaround Africa is that this can be achieved remarkably quickly, andthis should be the unremitting focus of African and international effortsuntil it is achieved.
ACKNOWLEDGEMENTS
This chapter is the result of funding provided by the Wellcome Trust, UK as part offellowship support to RWS (079080) and AMN (095127) and the Wellcome Trust CoreGrant to the Kenyan Major Overseas Programme (092654)This review has only been possible with the gracious help and assistance provided bylibrarians and archivists in Europe and Africa particularly the library staff at The WellcomeInstitute, London; the Institute Pasteur, Paris (Ages Raymond-Denise, Catherine Cecilio,Daniel Demellier and Dominique Dupenne); the Institute of Tropical Medicine, Antwerp(Dirk Schoonbaert); Sapienza—Universita di Roma, Rome (Gilberto Corbellini, MauroCapocci); Instituto Higiene Medicina Tropical, Project RIDES CPLP, Lisbon (Virgılio doRosario, Susana Nery); the World Health Organization library in Geneva (Marie SarahVillemin Partow), Sudan Civilization Institute, Khartoum (Jaffar Mirghani, Alaa Moawia);Wellcome Library, National Public Health Laboratory Service, Nairobi (Anne Mbeche);National Institutes for Health archives, Amani (William Kisinza, Jumanne Gwau, JaphetKimbesa). Of additional note for acknowledgement are the invaluable on-line libraryresources provided by Armed Forces Pest Management Board Defense Pest ManagementInformation Analysis Centre Literature Retrieval System—AFMIC Library: http://lrs.afpmb.

240 Robert W. Snow et al.
Author's personal copy
org; theWorld Health Organizations malaria and country report repositories: http://whqlib-doc.who.int/malaria/; Inter-university health library, Paris, France: http://www.biusante.parisdescartes.fr/debut.htm; South African Medical journal archives: http://archive.samj.org.za/index.php and the Institute of Tropical Medicine, Antwerp, Belgium http://lib.itg.be.The authors are also indebted to malariologists, surveillance officers and malaria controlprogramme managers from across Africa including; Joana Alves (Cape Verde), Rajae ElAouad (Morocco), Richard Kamwi and Benson Ntomwa (Namibia); Simon Kunene andJoseph Novotny (Swaziland); Philip Kruger, Aaron Mabuza, Marlies Craig, RajendraMaharaj and Karen Barnes (South Africa); Abdulla Ali and Justin Cohen (Zanzibar); Jean-Francois Trape (Senegal); Richard Cibulskis and Ryan O’Neil (Algeria and Botswana); HawaGuessod (Djibouti); Milijaona Randrianarivelojosia (Madagascar), Jean-Louis Solet (Mayotteand Reunion); Ghasem Zamani and Hoda Atta (Morocco and Egypt) and especially ourgratitude to Frank Hansford for his detailed descriptions of malaria and its control inNamibia, Botswana, Swaziland and South Africa. Finally, we are grateful for the assistanceprovided by Clara Mundia for help with proof reading.
REFERENCES
Afripop Project, 2011. Map of population density Africa. http://www.afripop.org.Albonico, M., Giorgi, F.D., Razanakolona, J., Raveloson, A., Sabatinelli, G., Pietra, V., et al.,
1999. Control of epidemic malaria on the highlands of Madagascar. Parassitologia 41,373–376.
Ali Halidi, M.E., 1995. Paludisme a Mayotte: passe, present, futur. Sante 5, 362–367.Alves, W., 1951. Preliminary notes on a southern Rhodesian experiment in malaria control. S.
Afr. J. Sci. 47, 289–292.Alves, W., 1958. Malaria parasite rates in Southern Rhodesia: May-September 1956. Bull.
World Health Organ. 19, 69–74.Alves, J., 1994. Programme National de Lutte contre le paludisme. Plan d’Action 1994-98.
Ministere de la Sante, Republique du Cap-Vert.Alves, W., Blair, D.M., 1953. An experiment in the control of malaria and bilharzias. Trans. R.
Soc. Trop. Med. Hyg. 47, 299–308.Alves, W., Blair, D.M., 1955. Malaria control in Southern Rhodesia. J. Trop. Med. Hyg. 58,
273–280.Alves, J., Roque, A.L., Cravo, P., Valdez, T., Jelinek, T., do Rosario, V.E., et al., 2006.
Epidemiological characterization of Plasmodium falciparum in the Republic of CaboVerde: implications for potential large scale re-emergence of malaria. Malar. J. 5, 32.
Alves, J., Machado, P., Silva, J., Goncalves, N., Ribeiro, L., Faustino, P., et al., 2009. Analysis ofmalaria associated genetic traits in Cabo Verde, a melting pot of European and sub-Saharan settlers. Blood Cells Mol. Dis. 44, 62–68.
Ambroise-Thomas, P., Wernsdorfer, W.H., Grab, B., Cullen, J., Bertagna, P., 1976. Longitudinalsero-epidemiologic study of malaria in Tunisia. Bull. World Health Organ. 54, 355–367.
Annecke, S., 1950. Report on malaria control in Transvaal. World Health Organization,WHO/MAL/48/;AFR/MAL/Conf/4.
Anon, 1944-1950. Bollettino delle malattie infettive verificatesi Nei Mesi de Gennaio adicembre 1944-1950. Bolletino Sanitario Della Tripolitania, Tripoli.
Anon, 1957. Malaria in Libya. Health Torch 2 (8-9 Special Issue), 1–9.Anon, 1981. The world malaria situation, 1979. Bull. Pan Am. Health Organ. 15, 278–284
(Egypt).Anon, 2007. Campagne de traitement de masse a l’artiquick. Rapport preliminaire, Ministre
de Sante, Fombini, Decembre 2007.

The Changing Limits and Incidence of Malaria in Africa: 1939–2009 241
Author's personal copy
Aregawi, M.W., Ali, A.S., Al-Mafazy, A.W., Molteni, F., Katikiti, S., Warsame, M., et al., 2011.Reductions inmalaria and anaemia case and death burden at hospitals following scale-upof malaria control in Zanzibar, 1999-2008. Malar. J. 10, 46.
Arthur, J.H., 1965. Antimalarial prophylaxis in primary schools in Eastern Nigeria: ReportFebruary-March 1965. Wellcome Foundation, June 1965.
Attaran, A., Barnes, K.I., Curtis, C., et al., 2004. WHO, the Global Fund and medicalmalpractice in malaria treatment. Lancet 363, 237–240.
Attaran, A., Barnes, K.I., Bate, R., Binka, F., D’Alessandro, U., Fanello, C., et al., 2006. TheWorld Bank: false financial and statistical accounts and medical malpractice in malariatreatment. Lancet 368, 247–252.
Avery-Jones, S., 1958. Mass treatment with pyrimethamine: a study of resistance and crossresistance resulting from a field trial in the hyperendemic malarious area of Makueni,Kenya September 1952-September 1953. Trans. R. Soc. Trop. Med. Hyg. 52, 547–561.
Ayala, D., Le Goff, G., Robert, V., Jong, P., Takken, W., 2006. Population structure of themalaria vector Anopheles funestus (Diptera: Culicidae) in Madagascar and Comoros. ActaTrop. 97, 292–300.
Bac, D.J., Cox, G.A., Isaacson, M., 1985. In vivo and in vitro chloroquine-resistant falciparummalaria in Venda. S. Afr. Med. J. 67, 937–938.
Bacar, A., 2010. The malaria control programme in the Union of Comoros. In: NovartisNMCP Best Practice Sharing Workshop, Beyond Abuja: Achieving Universal CoverageFeb 10th-11th 2010. Kigali, Rwanda.
Bagster-Wilson, D., 1939. Implications of malaria endemicity in East Africa. Trans. R. Soc.Trop. Med. Hyg. 32, 435–465.
Bagster-Wilson, D., Wilson, M., 1937. The manifestations and measurement of immunity tomalaria in different races. Trans. R. Soc. Trop. Med. Hyg. 30, 431–448.
Baird, J.K., 2010. Eliminating malaria—all of them. Lancet 376, 1883–1885.Bakri, G., Noguer, A., 1977. Impact of a single DDT spraying application on malaria vector
densities and entomological inoculation rates in Togo. World Health OrganizationWHO/Mal/77.891.
Balfour, A., 1913. A year’s anti-malarial work at Khartoum. J. Trop. Med. Hyg. 16, 225–232.Balfour-Kirk, J., 1934. Malaria in Mauritius. Trop. Dis. Bull. 31, 521–537.Balk, D.L., Deichmann, U., Yetman, G., Pozzi, F., Hay, S.I., Nelson, A., 2006. Determining
global population distribution: methods, applications and data. Adv. Parasitol. 62, 119–156.Barnes, K.I., Durrheim, D.N., Little, F., Jackson, A., Mehta, U., Allen, E., et al., 2005. Effect of
artemether-lumefantrine policy and improved vector control on malaria burden inKwaZulu-Natal, South Africa. PLoS Med. 2, e330.
Bechuanaland Protectorate, 1928-1963. Annual Medical and Sanitary Reports for the Protec-torate for the years 1928-1963. Government Printers, Gaborone.
Benthein, F.G., 1989. Malaria situation in Botswana. Report on a visit 21st August 1988–28thSeptember 1988. World Health Organization.
Benzeroug, E.H., Wery, M., 1985. Seroepidemiologie du paludisme au niveau d’un foyerresiduel en Algerie: commune de Khemis El Kechna. Rev. Epidemiol. Sante Publique 33,276–282.
Benzerrough, E.H., 1990. The malaria eradication programme in Algeria: present situation.Trans. R. Soc. Trop. Med. Hyg. 84, 347.
Benzerrough, E.H., Janssens, P.G., 1985. La surveillance du paludisme au Sahara Algerien.Bull. Soc. Pathol. Exot. 78, 859–867.
Bernard, M.P., 1950. La prophylaxie antipalustre au moyen des insecticides de contact aMadagascar. Bull. Soc. Pathol. Exot. 43, 505–512.
Bernard, M.P., 1954. Trois ans de lutte antipaludique a Madagascar 1950-1951-1952. Bulletinde Madagascar, Publication Mensuelle du Service General de l’information du HautCommissariat, no. 96.

242 Robert W. Snow et al.
Author's personal copy
Bey, A.H., Hussein, M.H., 1928. Malaria in Egypt. In: Comptes rendus: Congres Internationalde Medecine Tropical et d’Hygiene Le Caire, Egypte, Decembre 1928, 901–913.
Bhattarai, A., Ali, A.S., Kachur, P.S., Martensson, A., Abbas, A.K., Khatib, R., et al., 2007.Impact of artemisinin-based combination therapy and insecticide-treated nets on malariaburden in Zanzibar. PLoS Med. 4, e309.
Bill and Melinda Gates Foundation, 2007. Bill and Melinda Gates call for new globalcommitment to chart a course for malaria eradication. http://www.gatesfoundation.org/press-releases/Pages/course-for-malaria-eradication-071017-2.aspx.
Blair, D.M., 1950. Report on malaria control in Southern Rhodesia. World Health Organiza-tion, WHO/Mal/49/; Afr/Mal/Conf/5.
Blanchy, S., Benthein, F., Sabatinelli, G., 1987. Epidemiologie du paludisme en RepubliqueFederale Islamique des Comores. Cah. ORSTOM ser. Ent. med. Parasitol. 25, 45–52numero special.
Blanchy, S., Benthein, F., Houmadi, A., 1990. Morbidite palustre aux Comores. Med. Trop.(Mars) 50, 209–214.
Blanchy, S., Rakatonjanabelo, A., Ranaivoson, G., Rajaonarivelo, E., 1993. Epidemiologie dupaludisme sur les hautes terres malgaches depuis 1878. Sante 3, 155–161.
Bloland, P.B., Lackritz, E.M., Kazembe, P.N., Were, J.B.O., Steketee, R., Campbell, C.C., 1993.Beyond chloroquine: implications of drug resistance for evaluating malaria therapyefficacy and treatment policy in Africa. J. Infect. Dis. 167, 932–937.
Blue Nile Health Project, 1981. Annual Report. Ministry of Health, Wad Wedani Sudan.Bosman, A., Mendis, K.N., 2007. A major transition in malaria treatment: the adoption and
deployment of artemisinin-based combination therapies. Am. J. Trop. Med. Hyg. 77,193–197.
Botswana CSO, 2002-2004. 2001 Population and Housing Census, Gaborone, Botswana. http://www.cso.gov.bw/demographics/Table_1971-2001_Census_Demographic_Indicators.pdf.
Botswana CSO, 2005. Population Projections 2001-2031, Gaborone, Botswana.http://www.cso.gov.bw/demographics/Web-Population_Projection-2001-2031.pdf.
Boubidi, S.C., Gassen, I., Khechache, Y., Lamali, K., Tchicha, B., Brengues, C., et al., 2010.Plasmodium falciparum malaria, Southern Algeria, 2007. Emerg. Infect. Dis. 16, 301–303.
Bouffard, G., 1905. Geographie medicale: Djibouti. Ann. Hyg. Med. Col. 8, 333–375.Bouma, M.J., 2003. Methodological problems and amendments to demonstrate effects of
temperature on the epidemiology of malaria: a new perspective on the highland epi-demics in Madagascar, 1972-89. Trans. R. Soc. Trop. Med. Hyg. 97, 133–139.
Bouyou-Akotet, M.K., Mawili-Mboumba, D.P., Kendjo, E., Mabika-Mamfoumbi, M.,Ngoungou, E.B., Dzieng-Ella, A., et al., 2009. Evidence of decline of malaria in the generalhospital of Libreville, Gabon from 2000 to 2008. Malar. J. 8, 300.
Boyd, M.F., 1930. An Introduction to Malariology. Harvard University Press, Cambridge,MA, USA.
Brasseur, P., Badiane, M., Cisse, M., Agnamey, P., Vaillant, M.T., Olliaro, P.L., 2011. Chang-ing patterns of malaria during 1996–2010 in an area of moderate transmission in SouthernSenegal. Malar. J. 10, 203.
Brink, C.J.H., 1958. Malaria control in the northern Transvaal. S. Afr. Med. J. 32, 800–808.Brown, A.W.A., Haworth, J., Sahar, A.R., 1976. Malaria eradication and control from a global
standpoint. J. Med. Entomol. 13, 1–25.Bruce-Chwatt, L.J., 1956. Chemotherapy in relation to possibilities of malaria eradication in
tropical Africa. Bull. World Health Organ. 15, 852–862.Bruce-Chwatt, L.J., 1981. Alphonse Laveran’s discovery 100 years ago and today’s global
fight against malaria. J. R. Soc. Med. 74, 531–536.Bruce-Chwatt, L.J., Bruce-Chwatt, J.M., 1974. Malaria in Mauritius—as dead as the dodo.
Bull. N. Y. Acad. Med. 50, 1069–1080.Bruce-Chwatt, L.J., Archibald, H.M., Elliott, R., Fitz-John, R.A., Balogun, I.A., 1955. An
experimental malaria control scheme in Ilaro a semi rural holoendemic area of Southern

The Changing Limits and Incidence of Malaria in Africa: 1939–2009 243
Author's personal copy
Nigeria. Report on five years results. Malaria Service department of Medical ServicesFederation of Nigeria 3, 23–72.
Bruce-Chwatt, L.J., Archibald, H.M., Haworth, J., 1957. Second and Third Annual reports themalaria control pilot project in Western Sokoto (Mimeographed documents. FederalMalaria Service, Lagos, Nigeria, 1956-1957).
Bruce-Chwatt, L.J., Draper, C.C., Konfortion, P., 1973. Sero-epidemiological evidence oferadication of malaria from Mauritius. Lancet 302, 547–551.
Brunhes, J., 1977. Les moustiques de l’archipel des Comores I. Inventaire, repartition etdescription de quatre especes ou sous-especes nouvelles. Cah. ORSTOM ser. Ent. med.Parasitol. 15, 131–152.
Bryan, J.H., Gebert, F., 1976. Identifications of members of the Anopheles gambiae complexfrom Mauritius. Trans. R. Soc. Trop. Med. Hyg. 70, 339.
Cambournac, F.J.C., 1966. Le besoin des etudes epidemiologiques dans la campagne d’erad-ication du paludisme en Afrique. Bull. Soc. Pathol. Exot. 59, 501–513.
Cambournac, F.J.C., De Meira, M.T.V., 1952. Contribuicao para o estudo do sezonismo emCabo Verde. An. Inst. Med. Trop. (Lisb) 9, 409–460.
Cambournac, F.J.C., Vieira, H.S.R., Coutinho,M.A., Soares, F.A., Soares, A.B., Janz, G.J., 1984.Note sur l’eradication du paludisme dans l’ile de Santiago (Republique du Cap-Vert).Ann. Inst. Hyg. Med. Trop. 10, 23–34.
Campbell, C.C., Steketee, R.W., 2011. Malaria in Africa can be eliminated. Am. J. Trop. Med.Hyg. 85, 584–585.
Campbell, C.C., Collins, C.W., Teustsch, W.M., Moss, D.M., 1979. Chloroquine resistance inPlasmodium falciparum from East Africa. Lancet 314, 1151–1154.
CAPMAS Egypt, 2011. Central Agency for Public Mobilization and Statistics. Population inCensuses by Sex and Sex Ratio (1882-2006). http://www.capmas.gov.eg/pdf/egypt/pop/6.pdf.
Carter, R., Mendis, K.N., 2002. Evolutionary and historical aspects of the burden of malaria.Clin. Microbiol. Rev. 15, 564–594.
Carteron, B., Morvan, D., Rodhain, F., 1978. The question of endemic malaria in Republic ofDjibouti. Med. Trop. (Mars) 38, 299–304.
Cavalie, P., Mouchet, J., 1961. Les campagnes experimentales D’eradication du paludismedans le nord de la Republique du Cameroun. Med. Trop. (Mars) 21, 846–869.
Ceesay, S.J., Casals-Pascual, C., Erskine, J., Anya, S.E., Duah, N.O., Fulford, A.J., et al., 2008.Changes in malaria indices between 1999 and 2007 in The Gambia: a retrospectiveanalysis. Lancet 372, 1545–1554.
Ceesay, S.J., Casals-Pascual, C., Nwakanma, D.C., Walther, M., Gomez-Escobar, N.,Fulford, A.J., et al., 2010. Continued decline of malaria in The Gambia with implicationsfor elimination. PLoS One 5, e12242.
Ceita, J.G.V., 1981. O projecto de eradication do paludismo na republica democraticade STome e Prinicpe. Republic Democracy Sao Tome e Principe Missao Eradication Palu-dismo, October 1981.
Ceita, J.G.V., 1986. Malaria in Sao Tome and Prıncipe. In: Buck, A.A. (Ed.), Proceedings of theConference on Malaria in Africa. American Institute of Biological Sciences, Washington,DC, pp. 142–155.
Central Statistical Office, Kingdom of Swaziland, 2011. Ministry of Economic Planning andDevelopment, Mbabane, Kingdom of Swaziland: CSO. http://www.gov.sz/.
Central Statistics Office of Mauritius, 2011. Republic of Mauritius, Statistics Mauritius.http://www.gov.mu/portal/site/cso.
Centro National de Endemias, 2006. Avaliacao do Conhecimento, Atitude e Pratica daPopulacao em Relacao ao Mosquiteiro (Fundo Global). Ministerio da Saude, CentroNacional de Endemias, Sao Tome e Principe.
Chadli, A., Kennou, M.F., Kooli, J., 1985. Le paludisme en Tunisie historique et etat actuel.Bull. Soc. Pathol. Exot. 78, 844–851.

244 Robert W. Snow et al.
Author's personal copy
Chand, D., 1965. Malaria problem in Ethiopia. Ethiop. Med. J. 4, 27–34.Charles, L.J., Kaay, H.J.V.D., Vincke, I.H., Brady, J., 1962. The appearance of pyrimethamine
resistance in Plasmodium falciparum following self-medication by a rural community inGhana. Bull. World Health Organ. 26, 103–108.
Charmot, G., 1969. La chimioprophylaxie collective dans le controle du paludisme. Trans. R.Soc. Trop. Med. Hyg. 63, 31–35.
Chastang, R., 1959. Quatre annees de lutte antipaludique au Cameroun meridional. Med.Trop. (Mars) 19, 51–81.
Chizema-Kawesha, E., Miller, J.M., Steketee, R.W., Mukonka, V.M., Mukuka, C.,Mohamed, A.D., et al., 2010. Scaling up malaria control in Zambia: progress and impact2005-2008. Am. J. Trop. Med. Hyg. 83, 480–488.
Christophers, S.R., 1924. The mechanism of immunity against malaria in communities livingunder hyper-endemic conditions. Indian J. Med. Res. 12, 273–294.
Christophers, S.R., Stephens, J.W.W., 1900. The Natives as the Prime Agent in the MalarialInfection of Europeans. Further Reports to the Malaria Committee of the Royal Society-Harrison and Sons, London.
Ciavaldini, J., 1917. Six ans de campagne antipaludique a Robertville, (Dt. de Constantine),1910-1915. Estratto da la Malariologia Inst. Past. Alger, Tip. A. Tocco Napoli 10, 1–3.
CICRED Series, 1974. La population de l’Algerie. http://www.cicred.org/Eng/Publica-tions/pdf/c-c1.pdf.
Clyde, D.F., 1966. Suppression of malaria in Tanzania using medicated salt. World HealthOrganization, WHO/MAL/66.579.
Clyde, D.F., 1967. Malaria in Tanzania. Oxford University Press, London, UK.Cohen, J.M., Moonen, B., Snow, R.W., Smith, D.L., 2010. How absolute is zero? An evaluation
of the historical and current definitions of malaria elimination. Malar. J. 9, 213.Colbourne, M.J., 1966. Malaria in Africa. Oxford University Press, Ibadan, Nigeria.Colonial Development Fund, 1935. Report on the work done at Dar es Salaam during the period
January 1932 to January 1934. Garden City Press, Letchworth, UK.Colonie du Congo Belge, 1931. Rapport sur l’hygiene publique pendant l’annee 1929.
Libraire Albert Dewitt, Bruxelles, Belgium.Colony of Mauritius. (1928–1972). Annual report on the medical and health department annual
reports. Government Printers, Port Louis, Mauritius.Colony of Mauritius, 1950. An experiment in the eradication of malaria in Mauritius.
Government Printers, Port Louis, Mauritius.Colony of Nigeria, 1927. Annual medical and sanitary report for the year 1926. Government
Printers, Lagos, Nigeria.Colony of the Gambia, 1917. Annual medical and sanitary report for the year 1917. Waterlow
and Sons, London, UK.Communicable Disease Control Unit, Ministry of Health and Quality of Life (CDCU,
MoH&QL), 2008. Malaria.http://www.gov.mu/portal/goc/moh/file/mal-history.pdf.Courtois, D., Mouchet, J., 1970. Etude des populations de culicides en territoire Francais des
Afars et des Issas. Med. Trop. (Mars) 30, 837–846.Craig, M.H., Snow, R.W., le Sueur, D., 1999. A climate-based distribution model of malaria
transmission in sub-Saharan Africa. Parasitol. Today 15, 105–111.Craig, M.H., Kleinschmidt, I., Le Seuer, D., Sharp, B.L., 2004. Exploring 30 years of malaria
case data in KwaZulu-Natal, South Africa: Part II. The impact of non-climatic factors.Trop. Med. Int. Health 9, 1258–1266.
Crees, M.J., Mhlanga, T.H., 1985. Malaria prevalence in Zimbabwe and parasite survey of1983. Zimbabwe Science News 19, 114–117.
Curtis, C.F., 2002. Restoration of malaria control in the Madagascar highlands by DDTspraying. Am. J. Trop. Med. Hyg. 66, 1.

The Changing Limits and Incidence of Malaria in Africa: 1939–2009 245
Author's personal copy
D’Acremont, V., Lengeler, C., Mshinda, H., Mtasiwa, D., Tanner, M., Genton, B., 2009. Timeto move from presumptive malaria treatment to laboratory-confirmed diagnosis andtreatment in African children with fever. PLoS Med. 6, e252.
D’Alessandro, U., Buttiens, H., 2001. History and importance of antimalarial drug resistance.Trop. Med. Int. Health 6, 845–848.
D’Ortenzio, E., Sissoko, D., Dehecq, J.S., Renault, P., Filleul, L., 2009. Malaria imported intoReunion Island: is there a risk of re-emergence of the disease? Trans. R. Soc. Trop. Med.Hyg. 104, 251–254.
Davidson, G., 1947. Field trials with Gammexane as a means of malaria control by adultmosquito destruction in Sierra Leone, II: the effect of treatments of houses with ‘Gam-mexane’ on the malaria rate in the inhabitants. Ann. Trop. Med. Parasitol. 41, 210–214.
Davidson, G., 1950. A field study on the ‘Gammexane’ and malaria control in the BelgianCongo II. The Effect of the spraying of houses with ‘Gammexane’ on the mosquitopopulation and on the malaria incidence in children. Ann. Trop. Med. Parasitol. 44, 1–33.
De Boer, H.S., 1930. Anti Malarial measures in towns. Kenya and East Afr. Med. J. 7, 256–271.De Meillon, B., 1936. The control of malaria in South Africa by measures directed against the
adult mosquitoes in habitations. Q. Bull. Health Organ. League Nations 5, 134–137.De Meillon, B., 1951. Malaria survey of South-West Africa. Bull. World Health Organ. 4,
333–417.De Meira, M.T.V., 1954. Contrabuicao para o conhecimento sobre malaria na ilha de S.
Vicente (Cabo Verde). An. Inst. Med. Trop. (Lisb) 11, 287–338.De Meira, M.T.V., 1963. Relatorio anual da missao permanente de estudo e combate de
endemias de Cabo Verde (1961). An. Inst. Med. Trop. (Lisb) 20, 341–351.De Meira, M.T.V., 1964. Relatorio anual da missao permanente de estudo e combate de
endemias de Cabo Verde (1962). An. Inst. Med. Trop. (Lisb) 21, 187–210.De Mello, J.P., 1947. Some aspects of malaria in Kenya. East Afr. Med. J. 24, 112–123.De Zulueta, J., Kafuko, G.W., McCrae, A.W., Cullen, J.R., Pedersen, G.K., Wasswa, D.F.B.,
1964. A malaria eradication experiment in the highlands of Kigezi (Uganda). East Afr.Med. J. 41, 102–120.
De Zulueta, J., Ramsdale, C.D., Coluzzi, M., 1975. Receptivity to malaria in Europe. Bull.World Health Organ. 52, 109–111.
Decourt, P., Villain, G., Marini, C., Dupoux, R., 1936. Experiences de prophylaxies collectivesdu paludisme par les produits synthetiques effectuees en Tunisie au cours de l’annee1934. Arch. Inst. Past. Tunis 25, 154–199.
Dedet, J.P., 2008. The Sergent brothers and the antimalarial campaigns in Algeria (1902-1948).Parassitologia 50, 221–225.
Delfini, F.L., 1969. Malaria Eradication Programme, Zanzibar and Pemba. World HealthOrganization. AFR/MAL/104.
Deloron, P., Ramanamirija, J.A., Le Bras, J., Coulanges, P., 1984. 4-Aminoquinoline-sensitiv-ity of Plasmodium falciparum in Madagascar. III. Studies in three regions of the interior.Arch. Inst. Pasteur Madagascar 51, 57–68.
Denys, J.C., Isautier, H., 1991. Le maintien de l’eradication du paludisme dans l’ile de laReunion (1979-1990). Ann. Soc. Belg. Med. Trop. 71, 209–219.
Department of Health, South Africa, 2008. Prevalence and distribution of malaria in SouthAfrica 2007. Directorate of Epidemiology, HIER Cluster, Department of Health, Republicof South Africa.
Dobson, M.J., Malowany, M., Snow, R.W., 2000. Malaria control in East Africa: the KampalaConference and the Pare-Taveta Scheme: a meeting of common and high ground. Para-ssitologia 42, 149–166.
Dola, S., 1974. Mass drug administration as a supplementary attack measure in malariaeradication programme. East Afr. Med. J. 51, 529–531.

246 Robert W. Snow et al.
Author's personal copy
Dowling, M.A.C., 1951a. An experiment in eradication of malaria in Mauritius. Bull. WorldHealth Organ. 4, 443–461.
Dowling, M.A.C., 1951b. The malaria eradication scheme in Mauritius. Br. Med. Bull. 8,72–75.
Dowling, M.A.C., 1952. The malaria eradication scheme in Mauritius. Br. Med. J. 2, 309–312.Draper, C.C., Smith, A., 1960. Malaria in the Pare area of Tanganyika. Part II. Effects of three
years’ spraying of huts with dieldrin. Trans. R. Soc. Trop. Med. Hyg. 54, 342–357.Dutta, H.M., Dutt, A.K., 1978. Malarial ecology: a global perspective. Soc. Sci. Med. 12, 69–84.E8, 2010. The Elimination 8 Group. http://www.malariaeliminationgroup.org/sites/default/
files/Malaria-Elimination-8-Ministerial-Meeting-Resolution.pdf.Eastern Mediterranean Regional Office—World Health Organisation, 1987. Regional techni-
cal consultation on malaria control and primary health care. World Health OrganizationEM/MAL/216-E.
Eddey, L.G., 1944. Spray-killing of mosquitoes in houses a contribution to malaria control onthe gold coast. Trans. R. Soc. Trop. Med. Hyg. 38, 167–197.
Eisele, T.P., Keating, J., Littrell, M., Larsen, D., Macintyre, K., 2009. Assessment of insecticide-treated bednet use among children and pregnant women across 15 countries usingstandardized national surveys. Am. J. Trop. Med. Hyg. 80, 209–214.
Eisele, T.P., Larsen, D., Walker, N., Steketee, R.W., Cibulskis, R.E., 2010. Saving Lives withMalaria Control: Counting Down to the Millennium Development Goals. RBM Progressand Impact Series no 3. World Health Organization, Geneva.
El Aouad, R., 2009. Malaria in Morocco: from the endemicity to the elimination. In: WiltonPark meeting of Malaria Elimination Group: Getting to Zero. Wilton Park, Sussex, UK.
El Gaddal, A.A., Haridi, A.A.M., Hassan, F.T., Hussein, H., 1985. Malaria control in theGezira-Managil irrigated scheme of the Sudan. J. Trop. Med. Hyg. 88, 153–159.
El Mohamady, H., 2010. Epidemiological serosurvey studies in Egypt and Yemen (EMROCountries). In: Presentation given at inter-country meeting for members of HANMATand PIAM-Net, Marrakech, Morocco.
Elissa, N., Karch, S., 2005. Re-emergence of Anopheles funestus and its possible effect onmalariatransmission on Mayotte Island, Indian Ocean. J. Am. Mosq. Control Assoc. 21, 472–473.
Enayati, A., Hemingway, J., 2010. Malaria management: past, present, and future. Annu.Rev. Entomol. 55, 569–591.
Escudie, A., Hamon, J., Ricosse, J.H., Chartol, A., 1961. Resultats de deux annees de chimioprophylaxie antipaludique en milieu rural africain dans la zone pilote de Bobo Dioulasso(Haute Volta). Med. Trop. (Mars) 21, 689–727.
Faraj, C., Adlaoui, A., Rhajaoui, M., Lyagoubi, M., 2003. Estimation of malaria transmissionin high-risk provinces of Morocco. East. Mediterr. Health J. 9, 542–547.
Faraj, C., Ouahabi, S., Adlaoui, E., Boccolini, D., Romi, R., El Aouad, R., 2008. Risque dereemergence du paludisme auMaroc etude de la capacite vectorielle d’anopheles labran-chiae dans une zone rizicole au nord du pays. Parasite 15, 605–610.
Faraj, C., Adlaouia, E., Ouahabia, S., Rhajaouib, M., Fontenille, D., Lyagoubi, M., 2009.Entomological investigations in the region of the last malaria focus in Morocco. ActaTrop. 109, 70–73.
Fasan, P.O., 1971. Trimethoprim plus sulphamethoxazole compared with chloroquine in thetreatment and suppression of malaria in African school children. Ann. Trop. Med.Parasitol. 65, 117–121.
Feachem, R.G.A., Sabot, O.J., 2006. An examination of the Global Fund at 5 years. Lancet 368,537–540.
Feachem, R.G.A., Sabot, O.J., 2008. A new global malaria eradication strategy. Lancet 371,1633–1635.
Feachem, R.G.A., Phillips, A.A., Hwang, J., Cotter, C., Weilgosz, B., Greenwood, B.M., et al.,2010a. Shrinking the malaria map: progress and prospects. Lancet 376, 1566–1578.

The Changing Limits and Incidence of Malaria in Africa: 1939–2009 247
Author's personal copy
Feachem, R.G.A., Phillips, A.A., Targett, G.A., Snow, R.W., 2010b. Call to action: priorities formalaria elimination. Lancet 376, 1517–1521.
Ferriera, F.S.C., 1945. Anophelismo e sezonismo em S Vicente de Cabo Verde. Institute ofTropical Medicine, Lisboa.
Feuillat, F., Parent, M., Peeters, E.M.E., Vinckie, I.H., 1954. Progres recents dans la lute anti-malarienne au Katanga. Ann. Soc. Belg. Med. Trop. 33, 621–655.
Flaxman, A.D., Fullman, N., Otten, M.W., Jr., Menon, M., Cibulskis, R.E., Ng, M., et al., 2010.Rapid scaling up of insecticide-treated bed net coverage in Africa and its relationshipwith development assistance for health: a systematic synthesis of supply, distribution,and household survey data. PLoS Med. 7, e1000328.
Fogh, S., Jepsen, S., Effersoe, P., 1979. Chloroquine-resistant Plasmodium falciparummalaria inKenya. Trans. R. Soc. Trop. Med. Hyg. 73, 228–229.
Foley, H., 1923. Carte du paludisme en Algerie en 1922-1923. Arch. Inst. Past. Alger. 1,309–583.
Foll, C.V., Pant, C.P., 1966. The conditions ofmalaria transmission inKatsina province, northernNigeria and the effects of dichlorvos application. Bull. World Health Organ. 34, 395–404.
Fontaine, R.E., 1987. Review of the Swaziland malaria control program conducted betweenMarch 30 – April 25, 1987. Vector Biology and Control Project, Medical Service Consul-tants Inc., AR-052.
Fontaine, R.E., Joshi, G.P., Pradhan, G.D., 1975. Entomological evaluation of fenitrothion(OMS-43) as a residual spray for the control of An. gambiae and An. funestus, Kisumu,Kenya. World Health Organization, WHO/MAL/75.854.
Foster, S., 1995. Treatment of malaria outside the formal health services. J. Trop. Med. Hyg.98, 29–34.
Fox, E., Bouloumie, J., Olson, J.G., Tible, D., Lluberas, M., Shakib, S.O., et al., 1991. Plasmo-
dium falciparum voyage en train d’Ethiopie a Djibouti. Med. Trop. (Mars) 51, 185–189.Foy, H., Kondi, A., 1950. The correlation between black-water fever, malaria, quinine and
atebrin. Ann. Trop. Med. Parasitol. 44, 309–318.Franco de, A.L.T., Roche, S.M., Ariaratnam, V., Joia, H.S., Chinien, V., 1984a. Malaria situa-
tion in Botswana. Report on Evaluation Mission WHO Consultant Team, September-November 1984.
Franco de, A.L.T., Roche, S.M., Ariaratnam, V., Joia, H.S., Chinien, V., 1984b. Malaria situa-tion in Swaziland. Report on Evaluation Mission WHO Consultant Team, November-December 1984.
Freeman, T., 1995. Malaria Outbreaks: A Review of the Epidemiology of Malaria Transmis-sion and Distribution in Zimbabwe and the Relationship of Malaria Outbreaks to Preced-ing Meteorological Conditions. GTZ, Harare, Zimbabwe.
Gallup, J.L., Sachs, J.D., 2001. The economic burden of malaria. Am. J. Trop. Med. Hyg. 64,85–96.
Galtier, J., Blanchy, S., 1982. Le paludisme a Mayotte et son evolution de 1976 a 1981. Cah.ORSTOM ser. Ent. med. Parasitol. 20, 145–150.
Garnham, P.C.C., 1949. Modern concepts in malaria control. J. R. Soc. Promot. Health 69,617–625.
Gaud, J., 1947. La lutte antipaludique au Marco en 1947. Bull. Inst. Hyg. Maroc. 7, 119–124.Gaud, M., Sicault, G., 1938. La lutte antipaludique au Maroc les prophylaxies medicametu-
eses. Acta Conventus Terii de Tropicis Atque Malariae Morbis: Pars II Acta ConventusTertii deMalariaeMorbis. Societas NeerlandieaMedicinae Tropicae edidit Amserlodami,pp. 427–438.
Gebreel, A.O., 1982.Malaria in Libya: introduction and historical review. GaryounisMed. J 5,70–71 Benghazi.
Gebreel, A.O., Gilles, H.M., Prescot, J.E., 1985. Studies on the sero-epidemiology of endemicdiseases in Libya: IV. Malaria. Ann. Trop. Med. Parasitol. 79, 341–347.

248 Robert W. Snow et al.
Author's personal copy
Gerritsen, A.A., Kruger, P., van der Loeff, M.F., Grobusch, M.P., 2008. Malaria incidence inLimpopo Province, South Africa, 1998–2007. Malar. J. 7, 162.
Gething, P.W., van Boeckel, T.P., Smith, D.L., Guerra, C.A., Patil, A.P., Snow, R.W., et al.,2011. Modelling the global constraints of temperature on transmission of Plasmodium
falciparum and P. vivax. Parasite Vectors 4, 92.Gilroy, A.B., Bruce-Chwatt, L.J., 1945. Mosquito—control by swamp drainage in the coastal
belt of Nigeria. Ann. Trop. Med. Parasitol. 39, 20–40.Girod, R., Salvan, M., Denys, J.C., 1995. Struggle against the reintroduction of malaria on
Reunion. Sante 5, 397–400.Girod, R., Salvan, M., Simard, F., Andrianaivolambo, L., Fontenille, D., Laventure, S., 1999.
Evaluation de la capacite vectorielle d’Anopheles arabiensis (Diptera: Culicidae) a l’ıle deLa Reunion: une approche du risque sanitaire lie au paludisme d’importation en zoned’eradication. Bull. Soc. Pathol. Exot. 92, 203–209.
Global Fund—Zimbabwe, 2010. Zimbabwe Global Fund Round 10 Proposal Form.Availableat: www.theglobalfund.org/documents/rounds/10/ (Accessed February, 2012).
Goldewijk, K., Batthes, J.J., 1997. A hundred year (1890-1990) Data for Integrated Environ-mental Assessments (HYDE, version 1.1).Report Number 422514002 on behalf of RIVMand UNEP. http://www.rivm.nl/bibliotheek/rapporten/422514002.pdf.
Graham, W.M., 1912. Report on Blackwater fever in Southern Nigeria 1899-1911. MalariaResearch Institute, Lagos, Nigeria.
Gramiccia, G., 1966. Le probleme de l’eradication du paludisme. Bull. Soc. Pathol. Exot. 59,492–501.
Graves, P.M., Osgood, D.E., Thomson, M.C., Sereke, K., Araia, A., Zerom, M., et al., 2008.Effectiveness of malaria control during changing climate conditions in Eritrea, 1998-2003.Trop. Med. Int. Health 13, 218–228.
Gray, E.M., Bradley, T.J., 2005. Physiology of desiccation resistance in Anopheles gambiae andAnopheles arabiensis. Am. J. Trop. Med. Hyg. 73, 553–559.
Greenwood, B.M., Fidock, D.A., Kyle, D.E., Kappe, S.H.I., Alonso, P.L., Collins, F.H., et al.,2008. Malaria: progress, perils, and prospects for eradication. J. Clin. Invest. 118,1266–1276.
Guerra, C.A., Snow, R.W., Hay, S.I., 2006. Defining the global limits of malaria transmissionin 2005. Adv. Parasitol. 62, 157–179.
Guerra, C.A., Gikandi, P.W., Tatem, A.J., Noor, A.M., Smith, D.L., Hay, S.I., et al., 2008. Thelimits and intensity of Plasmodium falciparum: implications for malaria control and elimi-nation worldwide. PLoS Med. 5, e38.
Guihard, B., 2006. La prevention du paludisme a la Reunion: evaluation des pratiques desMedecins generalistes. These pour le Diplome d’etat de docteur en medicine, Universitede Nantes, Faculte de Medicine, 80pp.
Guttuso, C., 1967. A malaria eradication pilot project in Liberia (1958-1961). World HealthOrganization, WHO/Mal/67.589.
Guy, Y., 1963. Bilan epidemiologique du paludisme au Maroc. Ann. Parasitl. (Paris) 38,823–857.
Guy, Y., Gassabi, R., 1967. Les perspectives de l’eradication du paludisme en Algerie. Arch.Inst. Past. Alger. 45, 72–88.
Guy, Y., Holstein, M., 1968. Donnees recentes sur les anopheles du Magreb. Arch. Inst. Past.Alger. 46, 142–150.
Halawani, A., Shawarby, A.A., 1957. Malaria in Egypt; history, epidemiology, control andtreatment. J. Egypt. Med. Assoc. 40, 753–792.
Hall, S.A., Wilks, N.E., 1967. A trial of chloroquine-medicated salt for malaria suppression inUganda. Am. J. Trop. Med. Hyg. 16, 429–442.
Hammadi, D., Boubidi, S.C., Chaib, S.E., Saber, A., Khechache, Y., Gasmi, M., et al., 2009.Malaria in Algerian Sahara. Bull. Soc. Pathol. Exot. 102, 185–192.

The Changing Limits and Incidence of Malaria in Africa: 1939–2009 249
Author's personal copy
Hamon, J., Dufour, G., 1954. La lutte antipaludique a la Reunion. Bull. World Health Organ.11, 525–556.
Hamon, J., Mouchet, J., Chauvet, G., Lumaret, R., 1963. Bilan de quatorze annees de lutecontre le paludisme dans les pays francophones d’Afrique tropicale et a Madagascar.Considerations sur le persistence de la transmission et perspectives d’avenir. Bull. Soc.Pathol. Exot. 56, 933–971.
Hansford, C.F., 1972. Recent trends in the control and treatment of malaria. S. Afr. Med. J. 46,635–637.
Hansford, C.F., 1974.Malaria control in the Northern Transvaal. S. Afr. Med. J. 48, 1265–1269.Hansford, C.F., 1987. The Future of Malaria Control in South Africa. National Institute for
Tropical Diseases, Tzaneen, South Africa.Hansford, C.F., 1990. Malaria Control in Namibia. National Institute for Tropical Disease.
Department of National Health and Population Development, Tzaneen, South Africa.Hassan, A.N., Kenawy,M.A., Kamal, H., Abdel Sattar, A.A., Sowilem,M.M., 2003. GIS-based
prediction of malaria risk in Egypt. East. Mediterr. Health J. 9, 548–558.Haut-Commissariate au Plan Royaume duMaroc, 2011. Population of Morocco in a calendar
year (in thousands and middle of the year) by place of residence: 1960 to 2050. http://www.hcp.ma.
Hay, S.I., Guerra, C.A., Tatem, A.J., Atkinson, P.M., Snow, R.W., 2005. Urbanization, malariatransmission and disease burden in Africa. Nat. Red. Microbiol. 3, 81–90.
Hay, S.I., Smith, D.L., Snow, R.W., 2008. Measuring malaria endemicity from intense tointerrupted transmission. Lancet Infect. Dis. 8, 369–378.
Hay, S.I., Guerra, C.A., Gething, P.W., Patil, A.P., Tatem, A.J., Noor, A.M., et al., 2009.A world malaria map: Plasmodium falciparum endemicity in 2007. PLoS Med. 6, e1000048.
Haynes, W.S., 1940. The malaria epidemic. East Afr. Med. J. 17, 216–221.Heckenroth, F., 1922. Mesures capables d’enrayer le paludisme a Dakar. Bull. Soc. Pathol.
Exot. 15, 1024–1032.Henderson, L.H., 1934. Prophylaxis of malaria in the Sudan, with special reference to the use
of plasmoquine. Trans. R. Soc. Trop. Med. Hyg. 28, 157–164.Henrard, C., Van Hoof, L., 1933. Etude de facteurs epidemiologiques au cour d’un essai
limite de prophylaxie antipaludique par la quinine et plasmochine. Ann. Soc. Belg. Med.Trop. 12, 267–284.
Hijmans, R.J., Cameron, S.E., Parra, J.L., Jones, P.G., Jarvis, A., 2005. Very high resolutioninterpolated climate surfaces for global land areas. Int. J. Climatol. 25, 1965–1978.
Hill, E., Haydon, L.G., 1905. The epidemic of malaria fever in Natal 1905. J. Hyg. (Lond) 5,467–484.
Hill, J., Kazembe, P., 2006. Reaching the Abuja target for intermittent preventive treatment ofmalaria in pregnancy in African women: a review of progress and operational challenges.Trop. Med. Int. Health 11, 409–418.
Hoeul, G., Donadille, F., 1953. Vingt ans de lutte antipaludique au Maroc. Bull. Inst. Hyg.Maroc. 13, 3–51.
Houel, G., 1954. La lutte antipaludiques dans les zones rizicoles du Maroc. Bull. Inst. Hyg.Maroc. 14, 43–95.
Husson, A., Nicolle, C., 1907. Etudes epidemiologiques et prophylactiques sur le paludisme.Tunisie (Aout-Novembre 1906). Arch. Inst. Past. Tunis 2, 3–14.
IAMAT, 2004. WorldMalaria Risk Chart. International Association for Medical Assistance toTravellers Guelph, Canada. http://www.iamat.org.
INE Cape Verde, 2011. Evolucao da populacao residente em Cabo Verde por ilha e concelho(1940-2000). http://www.ine.cv/actualise/publicacao/files/PERFIL%20SOCIODEMO_%20cv.pdf.
INSEE, 2011a. Population-Famille: Le portrait demographique. http://www.insee.fr/fr/themes/document.asp?reg_id¼24&ref_id¼8710.

250 Robert W. Snow et al.
Author's personal copy
INSEE, 2011b. Recensements de la population, Evolution de la population deMayotte depuis1958-RP 07. http://www.insee.fr/fr/themes/tableau.asp?reg_id¼27&ref_id¼popop003.
Instituto Nacional de Estatistica, 2006. Sao Tome and Prıncipe em numeros, Sao Tome andPrıncipe en chifres. http://www.ine.st/files_pdf/STP_numeros_2006.pdf.
Jadin, J., Fain, A., Rupp, H., 1953. Lutte anti-malarienne etendue en zone rurale au moyen deD.D.T. a Astrida Ruanda-Urundi. Inst. R. colonial belge. Memoires. Sect. des SciencesNat. et Med. Coll. in-8 21, 3–46.
Jambou, R., Tombo, M.L., Raharimalala, L., Rakotonjanabelo, A., Rabe, T., Laventure, S.,et al., 1998. Le paludisme a Antananarivo: evaluation d’une situation post-epidemique.Sante 8, 257–264.
Jambou, R., Ranaivo, L., Raharimalala, L., Randrianaivo, J., Rakotomanana, F., Modiano, D.,et al., 2001. Malaria in the highlands of Madagascar after five years of indoor housespraying of DDT. Trans. R. Soc. Trop. Med. Hyg. 95, 14–18.
James, S.P., 1929. Report on a Visit to Kenya and Uganda to advise on anti-malarial Mea-sures. Prepared by adviser on tropical diseases to the Ministry of Health. Crown Agentsfor the Colonies, London.
Joaquim, A., de Mesquila, V.H.B., 1946. Contribuicao para o estudo do sezonismo em STome. An. Inst. Med. Trop. (Lisb) 22, 13–66.
Joncour, G., 1956. La lutte conte le paludisme a Madagascar. Bull. World Health Organ. 15,711–723.
Julvez, J., 1993. Anthropisation et paludisme. Eco-epidemiologie historique du paludisme dans les
archipels du sud-ouest de l’Ocean Indien. These pour le docteur d’Universite-Sciences,Universite Paul Sabatier–Toulouse III, Faculte Ecologie Humaine, p. 350.
Julvez, J., Isautier, H., Pichon, G., 1982. Aspects epidemiologiques du paludisme dans l’ile dela Reunion evaluation de certains parametres constituant Ie potentiel paludogene. Cah.ORSTOM ser. Ent. med. Parasitol. 20, 161–167.
Julvez, J., Michault, A., Isautier, H., Conan, H., Galtier, J., 1986. Etude seroepidemiologiquesdu paludisme a Mayotte de 1984-1986. Cah. ORSTOM ser. Ent. med. Parasitol. 24,279–286.
Julvez, J., Galtier, J., Ali Halidi, M., Henry, M., Mouchet, J., 1987. Epidemiologie du palu-disme et lutte antipaludique a Mayotte. Bull. Soc. Pathol. Exot. 80, 505–519.
Julvez, J., Mouchet, J., Ragavoodoo, C., 1990a. Epidemiologie historique du paludisme dansl’archipel des Mascareignes (Ocean Indien). Ann. Soc. Belg. Med. Trop. 70, 249–261.
Julvez, J., Michault, A., Galtier, J., Ali Halidi, E., Vidal, J.M., 1990b. Evaluation seroepide-mologique du paludisme a Mayotte. Bull. Soc. Pathol. Exot. 83, 658–668.
Kaneko, A., Taleo, G., Kalkoa, M., Yamar, S., Kobayakawa, T., Bjorkman, A., 2000. Malariaeradication on islands. Lancet 356, 1560–1564.
Keiser, J., Utzinger, J., Caldas de Castro, M., Smith, T.A., Tanner, M., Singer, B.H., 2004.Urbanization in sub-Saharan Africa and implication for malaria control. Am. J. Trop.Med. Hyg. 71, 118–127.
Keiser, J., Singer, B.H., Utzinger, J., 2005. Reducing the burden of malaria in different eco-epidemiological settings with environmental management: a systematic review. LancetInfect. Dis. 5, 695–708.
Kenawy, M.A., 1990. Fauna of anopheline mosquitoes (Diptera:Culicidae) in A.R. Egypt.Historical background and present situation. J. Egypt. Public Health Assoc. 65, 263–281.
Kenawy, M.A., Beier, J.C., Asiago, C.M., El Said, S., 1990. Factors affecting the human-feeding behavior of anopheline mosquitoes in Egyptian Oases. J. Am. Mosq. ControlAssoc. 6, 446–451.
Kidson, C., 1992. Global malaria challenge: the Amsterdam summit. Southeast Asian J. Trop.Med. Public Health 23, 635–640.
Kirkpatrick, T.W., 1925. The mosquitoes of Egypt. Government Press, Cairo.Kiszewski, A., Mellinger, A., Spielman, A., Malaney, P., Sachs, S.E., Sachs, J., 2004. A global
index representing the stability of malaria transmission. Am. J. Trop. Med. Hyg. 70, 486–498.

The Changing Limits and Incidence of Malaria in Africa: 1939–2009 251
Author's personal copy
Kleinschmidt, I., Sharp, B.L., Clarke, C.P.Y., Curtis, B., Fraser, C., 2001. Use of GeneralizedLinear Mixed Models in the spatial analysis of small-area malaria incidence rates inKwaZulu Natal, South Africa. Am. J. Epidemiol. 153, 1213–1222.
Kleinschmidt, I., Schwabe, C., Benavente, L., Torrez, M., Ridl, F.C., Segura, J.L., et al., 2009.Marked increase in child survival after four years of intensive malaria control. Am. J.Trop. Med. Hyg. 80, 882–888.
Komatsu, R., Korenromp, E., Low-Beer, D., Watt, C., Dye, C., Steketee, R.W., et al., 2010.Lives saved by Global Fund-supported HIV/AIDS, tuberculosis and malaria pro-grams: estimation approach and results between 2003 and end-2007. BMC Infect.Dis. 10, 109.
Kouznetsov, R.L., 1976. Malaria control by application of indoor spraying of residual insec-ticides in tropical Africa and its impact on population health.WorldHealth Organization,WHO/Mal/76.881.
Kouznetsov, R.L., 1977. Malaria control by application of indoor residual insecticides inTropical Africa and its impact on community health. Trop. Doc. 7, 81–91.
Kouznetsov, R.L., 1979. Review of past and present experience in the use of drugs for malariacontrol in Tropical Africa. World Health Organization, WHO/Mal/79.912.
Kunene, S., Phillips, A.A., Gosling, R.D., Kandula, D., Novotny, J.M., 2011. A national policyfor malaria elimination in Swaziland: a first of sub-Saharan Africa. Malar. J. 10, 313.
Laing, A.B.G., 1984. The impact of malaria chemoprophylaxis in Africa with special referenceto Madagascar, Cameroon and Senegal. Bull. World Health Organ. 62, 41–48.
Lassalle, C., Rachou, E., Hoareau, J.M., Verdier, R., Girod, R., 2000. Le paludisme a l’ile de laReunion (1992 a 1998). Bull. Epidemiol. Heb. 10, 41–44.
Le Bras, J., Dulat, C., Ralaubosom, D., Rakotonirima, P.J., Deloron, P., 1982. Etude prelimi-naire in vitro de la chimiosensibilite de Plasmodium falciparum Madagascar. Arch. Inst.Past. de Madagascar 50, 15–22.
Le Lannou, M., 1936. Le role geographique de la malaria. Annales de l’geographie 45,113–135.
Le Moal, M., 1906. Campagne antipaludique a Conakry en 1905. Ann. Hyg. Med. Colon. 9,550–562.
Le Sueur, D., Sharp, B.L., Appleton, C.C., 1993. Historical perspective of the malaria problemin Natal with Emphasis on the period 1928–1932. S. Afr. J. Sci. 89, 232–239.
League of Nations, 1933. The therapeutics of malaria: third general report of the malariacommission. Q. Bull. Health Organ. League Nations 2, 181–285.
Lee, P.Q., Liu, C.T., Rampao, H.S., Rosario, V.E., Shaio, M.E., 2010. Pre-elimination of malariaon the island of Principe. Malar. J. 9, 26.
Legendre, F.M.A., 1930. Note sur le fonctionnement du service antipaludique a Madagascar.Bull. Soc. Pathol. Exot. 23, 122–132.
Lehner, B., Doll, P., 2004. Development and validation of a global database of lakes, reser-voirs and wetlands. J. Hydrol. 296, 1–22.
Lengeler, C., 2004. Insecticide-treated bed nets and curtains for preventing malaria. TheCochrane Database of Systematic Reviews 2004, Issue 2. Art. No.: CD000363.
Lines, J.D., Curtis, C.F., Myamba, J., Njau, R., 1985. Tests of repellent or insecticide impreg-nated curtains, bed nets and anklets against malaria vectors in Tanzania. World HealthOrganization, WHO/ VBC/85.920.
Locan, A., Michel, R., 1962. The antimalarial sector of Thies in the Republique of Senegal.World Health Organization, AFR/MAL/61/40.
Loos, S., Quatresous, I., Sissoko, D., Jeannel, D., Achirafi, A., Sanquer, M.A., 2006. Situationepidemiologique du paludisme a Mayotte en 2003 et 2004. Bull. Epidemiol. Heb. 32,238–240.
Louis, J.P., Albert, J.P., 1988. Le paludisme en Republique de Djibouti strategie de controlepar la lutte antilarvaire biologique poissons larvivores autochtones (Aphanius dispar) ettoxines bacteriennes. Med. Trop. (Mars) 48, 127–131.

252 Robert W. Snow et al.
Author's personal copy
Lubombo Spatial Development Project, 2007. Annual report on malaria control on theLubombo Spatial Development Area. Regional Malaria Control Commission, MedicalResearch Centre, Durban and University of Cape Town.
Lysenko, A.J., Semashko, I.N., 1968. Geography of malaria. A medico-geographic profile ofan ancient disease. In: Lebedew, A.W. (Ed.), Itogi Nauki: Medicinskaja Geografija. Mos-cow, USSR, Academy of Sciences, pp. 25–146.
Mabaso, M., Sharp, B., Lengeler, C., 2004. Historical review of malarial control in southernAfrican with emphasis on the use of indoor residual house-spraying. Trop. Med. Int.Health 9, 846–856.
Macdonald, G., 1950. The economic importance of malaria in Africa. World Health Organi-zation, WHO/Mal/60;AFR/MAL/Conf./16.
Macdonald, G., 1952. The analysis of equilibrium in malaria. Trop. Dis. Bull. 49, 813–828.Macdonald, G., 1957. The epidemiology and control of malaria. Oxford University Press,
London, UK.Mackay, R., 1938. Second (final) Report of the Malaria Unit Dar es Salaam, for the Period
November to December 1936. Government Printers, Dar es Salaam, Tanganyika.Madwar, S., 1938. The transmission of malaria by different species of Egyptian Anophelines.
Acta Convent. Tertii de Trop. Atqu. Malar. Morbis 2, 222–224.Madwar, S., Shawarby, E., 1950. A short report on the eradication of Anopheles sergentii
from the oases in Egypt- 1946-1948. World Health Organization, WHO/Mal/39.Maharaj, B., Mthembu, D.J., Sharp, B.L., 2005. The impact of DDT reintroduction on malaria
transmission in KwaZulu-Natal, South Africa. S. Afr. Med. J. 95, 871–874.Makono, R., Sibanda, S., 1999. Review of the prevalence of malaria in Zimbabwe with specific
reference to parasite drug resistance (1984-96). Trans. R. Soc. Trop. Med. Hyg. 93, 449–452.Mali, S., Steele, S., Slutsker, L., Arguin, P.M., 2009. Malaria Surveillance-United States, 2007.
MMWR Surveill Summ 58 (SS-02), 1–16.Manguin, S., Carnevale, P., Mouchet, J., Coosemans, M., Julvez, J., Richard-Lenoble, D., et al.,
2008. Region afrotropicale. In: Biodiversity of Malaria in theWorld. John Libbey Eurotext,Paris, pp. 64–179.
Mansfield-Aders, W., 1920. Notes on the Identification of anophelinae and their larvae in theZanzibar Protectorate. Bull. Entomol. Res. 10, 329–332.
Mansfield-Aders, W., 1927. Notes on malaria and filariasis in the Zanzibar Protectorate.Trans. R. Soc. Trop. Med. Hyg. 21, 207–214.
Mastbaum, O., 1954. Observations of two Epidemic malaria seasons (1946 and 1953) beforeand after malaria control in Swaziland. Trans. R. Soc. Trop. Med. Hyg. 48, 325–331.
Mastbaum, O., 1955. Organization and administration of malaria control in Swaziland.World Health Organization, WHO/Mal/133; Lagos Conf./7.
Mastbaum, O., 1957a. Past and present of malaria position of malaria in Swaziland. J. Trop.Med. Hyg. 60, 119–127.
Mastbaum, O., 1957b. Malaria control in Swaziland. J. Trop. Med. Hyg. 60, 190–192.Mastbaum, O., 1965. Some problems of malaria eradication in Africa with special reference to
the south-east African region. Cent. Afr. J. Med. 11, 34–38.McCombie, S.C., 1996. Treatment seeking patterns for malaria: a review of recent research.
Soc. Sci. Med. 43, 933–945.Menard, D., Ratsimbasoa, A., Randrianarivelojosia, M., Rabarijaona, L.P., Raharimalala, L.,
Domarle, O., et al., 2008. Assessment of the efficacy of antimalarial drugs recommendedby the National Malaria Control Programme inMadagascar: up-dated baseline data fromrandomized and multi-site clinical trials. Malar. J. 7, 55.
Ministry of Health, 1999. Malaria: a manual for health workers in Botswana. Epidemiologyand Disease Control Unit, Community Health Services Division, Ministry of Health,Botswana.
Ministry of Health, 2001. Botswana Roll Back Malaria Strategic Plan 2002-2005. Ministry ofHealth, Botswana, November 2001.

The Changing Limits and Incidence of Malaria in Africa: 1939–2009 253
Author's personal copy
Ministry of Health, 2009. Botswana Malaria Programme performance review report. Depart-ment of Public Health, Ministry of Health.
Ministry of Health and Social Services, 1995. National Policy and Strategy for MalariaControl. Ministry of Health and Social Services, Namibia November 1995.
Ministry of Health and Social Welfare, 1999. Malaria control in Swaziland. National MalariaControl Programme, Mbabane, Kingdom of Swaziland.
Ministry of Health and SocialWelfare, 2010.Malaria elimination strategy 2008-2015. Ministryfor Health and Social Welfare, Mbabane, Kingdom of Swaziland.
Ministry of Health Swaziland, 1927-1955. Annual reports of the medical and sanitary divi-sion of the Protectorate and Kingdom of Swaziland.
Ministry of Health Swaziland, 1974. Annual reports of the medical and sanitary for theyear, 1973.
Ministry of Health Swaziland, 1983. Annual reports of the medical and sanitary for the year,1982 .
Ministry of Health and Social Services, 1996. Malaria in Namibia. An Information packprepared for the National Malaria Awareness Week. WHO and Ministry of Health andSocial Services Namibia 4th-8th November 1996.
Ministry of Health and Social Services, 2010. Namibia Malaria Indicator Survey 2009.National Vector Borne Diseases Control Programme. Ministry of Health and SocialServices, Namibia.
Mirghani, E.S., Nour, B.Y.M., Bushra, S.M., Hassan El, I., Snow, R.W., Noor, A.M., 2010. Thespatial-temporal clustering of Plasmodium falciparum infection over eleven years in GeziraState, The Sudan. Malar. J. 9, 172.
Mitullah, W., 2003. Understanding Slums: Case Studies for the Global Report on HumanSettlements 2003. Nairobi, Kenya.
Mmbando, B.P., Vestergaard, L.S., Kitua, A.Y., Lemnge, M.M., Theander, T.G., Lusingu, J.P.,2010. A progressive declining in the burden of malaria in north-eastern Tanzania. Malar.J. 9, 216.
Mnzava, A.E.P., Ntuli, V.M., Sharp, B., Ngxongo, S., Mthembu, J.D., Le Sueur, D., 1998.House spraying and replastering in KwaZulu-Natal. S. Afr. Med. J. 88, 1024–1028.
Mohamed, A.G., 1990. Le paludisme en Republique de Djibouti: Aspects historiques etepidemiologiques. These pour le doctorat d’etat en medicine, Universite Paul Sabatier–Toulouse III, Facultes de Medecine.
Molineaux, L., Gramiccia, G., 1980. The Garki Project. World Health Organization, Geneva.Mondher, B., 2010. Malaria eradication in Tunisia. In: Presentation given at WHO Inter-
country meeting, Marrakech, Kingdom of Morocco, September 2010.Monteiro, C., 1952. O Sezonismo em Cabo Verde. An. Inst. Med. Trop. (Lisb) 9, 461–483.Morlais, I., Girod, R., Hunt, R., Simard, F., Fontenille, D., 2005. Population structure of
Anopheles arabiensis on La Reunion island, Indian Ocean. Am. J. Trop. Med. Hyg. 73,1077–1082.
Morsy, T.A., El Kadry, A.A., Salama, M.M.I., Sabry, A.H.A., El Sharkawy, I.M.A., 1995.Studies on the bionomic and vector competence of adult Anopheline mosquitoes in ElFaiyum Governorate, Egypt. J. Egypt. Soc. Parasitol. 25, 213–244.
Mouchet, J., Baudon, D., 1988. Report on a field mission in Madagascar. Ministere de laCooperation, Paris, France October 1988, pp. 1–38.
Mouchet, J., Blanchy, S., 1995. Particularites et stratification du paludisme a Madagascar.Sante 5, 386–388.
Mouchet, J., Blanchy, S., Rakotonjanabelo, A., Ranaivoson, G., Rajaonarivelo, E.,Laventure, S., et al., 1993. Stratification epidemiologique du paludisme a Madagascar.Arch. Inst. Pasteur Madagascar 60, 50–59.
Mouchet, J., Manguin, S., Sircoulon, J., Laventure, S., Faye, O., Onapa, A.W., et al., 1998.Evolution of malaria in Africa for the past 40 years: impact of climatic and human factors.J. Am. Mosq. Control Assoc. 14, 121–130.

254 Robert W. Snow et al.
Author's personal copy
Mudhune, S.A., Okiro, E.A., Noor, A.M., Zurovac, D., Juma, E., Ochola, S.A., et al., 2011. Theclinical burden of malaria in Nairobi: a historical review and contemporary audit. Malar.J. 10, 138.
Munier, A., Diallo, A., Marra, A., Cot, M., Arduin, P., Ndiaye, O., et al., 2009. Evolution ofmalaria mortality and morbidity after the emergence of chloroquine resistance in Nia-khar, Senegal. Malar. J. 8, 270.
Nabarro, D.N., Taylor, E., 1998. The "Roll Back Malaria" Campaign. Science 280, 2067–2068.Nairobi Municipality, 1930-1969. Medical and Sanitation Department Annual Reports. Gov-
ernment of Kenya, Nairobi, Kenya.Najera, J.A., 1999. Malaria control achievements, problems and strategies. World Health
Organization, WHO/MAL/99.1087.Najera, J.A., Shidrawi, G.R., Storey, J., Leitaert, P.E.A., 1973. Mass drug administration and
DDT indoor spraying as antimalarial measures in the Northern Savannah of Nigeria.World Health Organization WHO/Mal/73.817.
Najera, J.A., Gonzalez-Silva, M., Alonso, P.L., 2011. Some lessons for the future from theGlobal Malaria Eradication Programme (1955–1969). PLoS Med. 8, e1000412.
Narasimhan, V., Attaran, A., 2003. Roll back malaria? The scarcity of international aid formalaria control. Malar. J. 2, 8.
National Institute of Statistics–Tunisia, 2011. Population census 2004: demographic charac-teristics of the population—distribution of the population by milieu (Period: 1966-2004).http://www.ins.nat.tn/indexen.php.
National Malaria Control Programme—Zimbabwe, 2008. Strategy for Zimbabwe 2008–2013.Ministry of Health and Child Welfare, Zimbabwe, October 2008.
National Malaria Control Programme—Zimbabwe, 2010. National malaria indicator survey2008. Ministry of Health and Child Welfare, Zimbabwe.
Ngomane, L., de Jager, C., 2012. Changes inmalaria morbidity andmortality inMpumalangaProvince, South Africa (2001-2009): a retrospective study. Malar. J. 11, 19.
Nikolaev, B.P., 1935. On the influence of temperature on the development of malariaplasmodia inside the mosquito. Leningrad Pasteur Inst. Epidem. Bacteriol. 2, 108–109.
Noor, A.M., Mutheu, J.J., Tatem, A.J., Hay, S.I., Snow, R.W., 2009. Insecticide-treated netcoverage in Africa: mapping progress in 2000-07. Lancet 373, 58–67.
Noor, A.M., Mohamed, M.B., Mugnenyi, C., Osman, M.A., Guessod, H.H., Kabaria, C.W.,et al., 2011. Establishing the extent of malaria transmission and challenges facing pre-elimination in the Republic of Djibouti. BMC Infect. Dis. 11, 121.
Nyarango, P.M., Gebremeskel, T., Mebrahtu, G., Mufunda, J., Abdulmumini, U.,Ogbamariam, A., et al., 2006. A steep decline of malaria morbidity and mortality trends inEritrea between 2000 and 2004: the effect of combination of control methods. Malar. J. 5, 33.
Nye, E.R., Gibson, M.E., 1997. Ronald Ross: Malariologist and Polymath. A biography.Macmillan Press Ltd, Basingstoke, UK, p. 100.
O’Meara, W.P., Bejon, P., Mwangi, T.W., Okiro, E.A., Snow, R.W., Newton, C.J.R.C., et al.,2008. Effect of a fall in malaria transmission on morbidity and mortality in Kilifi, Kenya.Lancet 372, 1555–1562.
O’Meara, W.P., Mangeni, J.N., Steketee, R., Greenwood, B., 2010. Changes in the burden ofmalaria in sub-Saharan Africa. Lancet Infect. Dis. 10, 545–555.
Office of National Statistics—Algeria, 2011. Population residente des menages ordinaires etcollectifs (MOC) selon la wilaya de residence et le sexe et le taux d’accroissement annuelmoyen (1998-2008). http://www.ons.dz/IMG/pdf/pop1_national.pdf.
Okech, B.A., Mwobobia, I.K., Kamau, A., Muiruri, S., Muhisa, N., Nyambura, J., et al., 2008.Use of integrated malaria management reduces malaria in Kenya. PLoS One 3, e4050.
Okiro, E.A., Hay, S.I., Gikandi, P.W., Sharif, S.K., Noor, A.M., Peshu, N., et al., 2007. Thedecline in paediatric malaria admissions on the coast of Kenya. Malar. J. 6, 151.
Okiro, E.A., Alegana, V.A., Noor, A.M., Mutheu, J.J., Juma, E., Snow, R.W., 2009. Malariapaediatric hospitalization between 1999 and 2008 across Kenya. BMC Med. 7, 75.

The Changing Limits and Incidence of Malaria in Africa: 1939–2009 255
Author's personal copy
Okiro, E.A., Bitira, D., Mbabazi, G., Mpimbaza, A., Alegana, V.A., Talisuna, A.O., et al.,2011. Increasing malaria hospital admissions in Uganda between 1999 and 2009. BMCMed. 9, 37.
Ollivier, L., Nevin, E.L., Darar, H.Y., Bougere, J., Saleh, M., Gidenne, S., et al., 2011.Malaria inthe Republic of Djibouti, 1998–2009. Am. J. Trop. Med. Hyg. 85, 554–559.
Omer, A.H., 1978. Species prevalence of malaria in northern and southern Sudan and controlby mass chemoprophylaxis. Am. J. Trop. Med. Hyg. 27, 858–863.
Onuigbo,W.I.B., 1961. Home treatment of malaria in children. Trans. R. Soc. Trop.Med. Hyg.55, 547–549.
Orenstein, A.J., 1914. Contribution to the study of the value of quininization in the eradica-tion of malaria. JAMA 28, 1931–1933.
Osman, M., 2008. Malaria control programme in Djibouti. In: Inter-country meeting ofNational Malaria Programme Managers from Horn of Africa Countries and Malariaendemic countries in Arabian Peninsula.
Otten, M., Aregawi, M., Were, W., Karema, C., Medin, A., Jima, D., et al., 2009. Initialevidence of reduction of malaria cases and deaths in Rwanda and Ethiopia due torapid scale-up of malaria prevention and treatment. Malar. J. 8, 14.
Packard, R.M., 1986. Agricultural development, migrant labor and the resurgence of malariain Swaziland. Soc. Sci. Med. 22, 861–867.
Pampana, E.J., 1969. A Textbook of Malaria Eradication, second ed. Oxford University Press,London, UK.
Pampana, E.J., Russell, P.F., 1955. Le paludisme: probleme mondial. World Health Organi-zation 69, 317–321.
Parrot, L., Catanei, A., Collignon, E., 1946. Nouveaux essais de prophylaxie collective dupaludisme par les medicaments synthetiques (Troisieme memoire). Arch. Inst. Past.Alger. 24, 205–209.
Paterson, A.R., 1928. Malaria and development. In: The Report of the Malaria Commission ofthe League of Nations on ‘‘Principles andMethods of Anti-Malarial Measures in Europe’’in Relation to Conditions in Kenya. Colony and Protectorate of Kenya, Medical Depart-ment, Health Pamphlet No. 5.
Payne, D., Grab, B., Fontaine, R.E., 1976. Impact of control measures on malaria transmissionand general mortality. Bull. World Health Organ. 54, 369–377.
Pettinelli, F., Pettinelli, M.-E., De Pecoulas, P.E., Millet, J., Michel, D., Brassuer, P., et al., 2004.High prevalence of multidrug-resistant Plasmodium falciparum malaria in the FrenchTerritory of Mayotte. Am. J. Trop. Med. Hyg. 70, 635–637.
Picot, H., 1976. Prevention contre la reintroduction du paludisme a la Reunion en 1972-1973.Bull. Soc. Pathol. Exot. 69, 134–140.
Pinto, J., Sousa, C.A., Gil, V., Ferreira, C., Goncalves, L., Lopes, D., et al., 2000a.Malaria in SaoTome and Prıncipe: parasite prevalences and vector densities. Acta Trop. 76, 185–193.
Pinto, J., Sousa, C.A., Gil, V., Goncalves, L., Lopes, D., Rosario, V.E., et al., 2000b. Mixed-species malaria infections in the human population of Sao Tome island, West Africa.Trans. R. Soc. Trop. Med. Hyg. 94, 256–257.
Presidents Malaria Initiative, 2009. PMI Country Profiles. Presidents Malaria Initiative,Washington, DC. http://www.fightingmalaria.gov.
Programa Nacional de Luta Contra o Paludismo—Cape Verde, 2009. Plano estrategico depre-elminacao do paludismo 2009-2013. Ministerio da Saude, Republica de Cabo Verde,March 2009.
Programme National de Lutte Contre le Paludisme – Comores, 2009. Plan strategique delutte contre le paludisme: 2007-2014. Programme National de Lutte contre de Paludisme,Direction de la lutte contre les endemies et epidemies, Ministre de Sante, Union deComores, March 2009.
Programme National de Lutte Contre le Paludisme – Djibouti. (2006). Plan strategique lalutte contre le paludisme 2006-2010. Ministere de la Sante, Republique de Djibouti.

256 Robert W. Snow et al.
Author's personal copy
Programme National de Lutte Contre le Paludisme – Djibouti. (2009). Djibouti NationalMalaria Indicator Survey 2008-2009. World Health Organization, Eastern MediterraneanRegional Office, Cairo, Egypt. March 2009.
Programme National de Lutte Contre le Paludisme – Djibouti. (2011) Evaluation duProgramme National de la lutte contre le Paludisme Djibouti, Juin 2011. PNLP, Repub-lique du Djibouti, July 2011.
Programme National de Lutte Contre le Paludisme–Madagascar, 2007. Plan strategique dulute contre le paludisme: Du controle vers l’elimination du paludisme a Madagascar,Extension et consolidation des zones indemnes du paludisme 2007-2012. ProgrammeNational de Lutte Contre le Paludisme–Madagascar and Republique de Madagascarministere de la sante, du planning familial et de la protection sociale, Antananarivo,Madagascar.
Pull, J.H., 1972. Malaria surveillance methods, their uses and limitations. Am. J. Trop. Med.Hyg. 21, 651–655.
Rabarijaona, L.P., Ariey, F., Matra, R., Cot, S., Raharimalala, A.L., Ranaivo, L.H., et al., 2006.Low autochthonous urban malaria in Antananarivo (Madagascar). Malar. J. 5, 27.
Ramsdale, C.D., 1990. Anopheles mosquitoes and imported malaria in Libya. MosquitoSystematics 22, 34–40.
Randrianarivelojosia, M., Raveloson, A., Randriamanantena, A., Juliano, J.J., Andrianjafy, T.,Raharimalala, L.A., et al., 2009. Lessons learnt from the six decades of chloroquine use(1945–2005) to control malaria in Madagascar. Trans. R. Soc. Trop. Med. Hyg. 103, 3–10.
Ranque, P., Toure, T.Y., Soula, G., Le Du Diallo, Y., Traore, O., Duflo, B., et al., 1984. Use ofmosquito nets impregnated with deltamethrin in mosquito control. In: InternationalCongress on Tropical Medicine and Malaria, Calgary.
Ray, A.P., Beljaev, A.E., 1984. Epidemiological surveillance: a tool for assessment of malariaand its control. J. Commun. Dis. 16, 197–207.
Raynal, J., 1928a. Enquete sanitaire a la Grande Comores 1925, observation de paludisme aforme epidemique. Bull. Soc. Pathol. Exot. 21, 132–141.
Raynal, J., 1928b. Le paludisme dans la province de Diego-Suarez: quelques index spleni-ques. Bull. Soc. Pathol. Exot. 21, 629–635.
Razafimanjato, J.Y., Randriamanjakasoa, J.H., Razanadrasawa, J., Rabeza-Rafaralahy, V.,1997. Recensement general de la population et de l’habitat, Etat de la Population.Institutnational de la Statistique Rapport d’analyse, Volume 2, Tome 1. Antanarivo 16. http://www.instat.mg/pdf/rgph_1.pdf.
Receveur, M.C., Roussin, C., Vatan, R., de Montera, A.M., Sissoko, D., Malvy, D., 2004. Bilandu paludisme a Mayotte. Epidemiologie, diagnostic, prevention et traitement. Bull. Soc.Pathol. Exot. 97, 265–267.
Reid, E.T., 1962. Chemotherapy as an adjunct to spraying in malaria control in SouthernRhodesia. Cent. Afr. J. Med. 8, 172–181.
Reid, E.T., Woods, R.W., 1957. Anopheline mosquitoes of Southern Rhodesia: a generalsurvey. Proc. Trans. Rhodesia Sci. Assoc. 45, 47–72.
Ribeiro, H., Ramos, H.C., Pires, C.A., 1988. Sobre os vectores da malaria em Sao Tomee Principe. Garcia de Orta Ser. Zool. Lisboa 15, 135–152.
Ribeiro, H., Ramos, H.C., Janz, J.G., 1992. The feeding and resting behaviour of Anophelesgambiae on the islands of Sao Tome and Principe, West Africa. Bull. Soc. Vector Ecol. 17,25–27.
Ricosse, J., Bailly-Choumara, H., Adam, J.P., Hamon, J., 1959. Resultats d’une experimenta-tion de chimioprophylaxie par la pyrimethamine dans la zone pilote de lutte antipaludi-que de Bobo-Dioulasso. Bull. Soc. Pathol. Exot. 52, 516–533.
Riff, H., Isautier, H., 1995. Situation actuelle du paludisme a la Reunion (Novembre 1994).Sante 5, 376–381.
Robert, V., Macintyre, K., Keating, J., Trape, J.F., Duchemin, J.B., Warren, M., et al., 2003.Malaria transmission in urban sub-Saharan Africa. Am. J. Trop. Med. Hyg. 68, 169–176.

The Changing Limits and Incidence of Malaria in Africa: 1939–2009 257
Author's personal copy
Roberts, J.M.D., 1956. Pyrimethamine (Daraprim) in the control of epidemic malaria. J. Trop.Med. Hyg. 59, 201–208.
Roberts, J.M.D., 1964a. The control of epidemic malaria in the Highlands of Western Kenya.Part II. The campaign. J. Trop. Med. Hyg. 67, 191–199.
Roberts, J.M.D., 1964b. The control of epidemic malaria in the Highlands of Western Kenya.Part III. After the campaign. J. Trop. Med. Hyg. 67, 230–237.
Roberts, L., Enserink, M., 2007. Malaria: did they really say. . . eradication? Science 318, 1544.Roca-Feltrer, A., Kwizombe, C.J., Sanjoaquin, M.A., Sesay, S.S.S., Faragher, B., Harrison, J.,
et al., 2012. Lack of decline in childhood malaria, Malawi, 2001–2010. Emerg. Inf. Dis. 18,272–278.
Rodier, G.R., Parra, J.P., Kamil, M., Chakib, S.O., Cope, S.E., 1995. Recurrence and emergenceof infectious diseases in Djibouti city. Bull. World Health Organ. 73, 755–759.
Rodrigues, A., Armstrong Schellenberg, J., Kofoed, P.E., Aaby, P., Greenwood, B.M., 2008.Changing pattern of malaria in Bissau, Guinea Bissau. Trop. Med. Int. Health 13, 1–8.
Rogier, C., Pradines, B., Bogreau, H., Koeck, J.L., Kamil, M.A., Mercereau-Puijalon, O., 2005.Malaria epidemic and drug resistance, Djibouti. Emerg. Infect. Dis. 11, 317–321.
Roll Back Malaria, 2008. The Global Malaria Action Plan for a Free Malaria World. Roll BackMalaria Partnership. August 2008World Health Organization, Geneva. http://www.roll-backmalaria.org/gmap/toc.html.
Roll Back Malaria, 2011. Progress and impact Series no. 7: a decade of partnership andresults. http://www.rbm.who.int/ProgressImpactSeries/docs/report8-en.pdf.
Roll Back Malaria, Southern Africa, 2002. Baseline 2001. World Health Organization, Harare,July 2002.
Romi, R., Razaiarimanga, M.C., Raharimanga, R., Rakotondraibe, E.M., Ranaivo, L.H.,Pietra, V., et al., 2002. Impact of the malaria control campaign (1993-1998) in the highlandsof Madagascar: parasitological and entomological data. Am. J. Trop. Med. Hyg. 66, 2–6.
Ross, R., 1902. Mosquito Brigades and How to Organize Them. George Philip and Son,London, p. 96.
Ross, R., 1908. Report on the Prevention ofMalaria inMauritius. Waterlow and Sons Limited,London.
Ross, R., 1916. An application of the theory of probabilities to the study of a priori pathome-try. Part I Proc. R. Soc. Lond. Ser-A 92, 204–230.
Roussin, J.M., Huart, V., Lepere, J.F., Le Bras, M.J., Roussin, C., Le Bras, J., 2002. Depistagerapide du paludisme et genotypes de chimioresistance de P. falciparum a Mayotte en 2001.Presse Med. 31, 1312.
Rowe, A.K., Rowe, S.Y., Snow, R.W., Korenromp, E.L., Armstrong Schellenberg, J.R.M.,Stein, C., et al., 2006. The burden of malaria mortality among African children in theyear 2000. Int. J. Epidemiol. 35, 691–704.
Russell, P.F., 1951. Some epidemiological aspects of malaria control with reference to DDT. J.Natl. Malar. Soc. 10, 257–265.
Russell, P.F., 1956. World-wide malaria distribution prevalence and control. Am. J. Trop.Med. Hyg. 6, 937–965.
Sachs, J., Malaney, P., 2002. The economic and social burden of malaria. Nature 415, 680–685.Sachs, J.D., McArthur, J.W., 2005. TheMillennium Project: a plan for meeting theMillennium
Development Goals. Lancet 365, 347–353.Sarrassat, S., Senghor, P., Le Hesran, J.Y., 2008. Trends in malaria morbidity following the
introduction of artesunate plus amodiaquine combination in M’lomp village dispensary,south-western Senegal. Malar. J. 7, 215.
Scharlemann, J.P.W., Benz, D., Hay, S.I., Purse, B.V., Tatem, A.J., Wint, G.R.W., et al., 2008.Global data for ecology and epidemiology: a novel algorithm for temporal Fourierprocessing MODIS data. PLoS One 3, e1408.
Schwartz, I.K., Payne, D., Campbell, C.C., Khatib, O.J., 1983. In-vivo and In-vitro assessment ofcholorquine-resistant Plasmodium falciparum malaria in Zanzibar. Lancet 321, 1003–1005.

258 Robert W. Snow et al.
Author's personal copy
Schwartz, E., Pener, H., Issa, M.S., Golenser, J., 1997. An overview of the malaria situation inZanzibar. J. Commun. Health 22, 33–44.
Sergent, E., Sergent, E., 1906. Campagnes antipaludiques en Tunisie. Arch. Inst. Past. Tunis 1,137–141.
Sergent, E., Sergent, E., 1928. Vingt-cinq annees d’etude et de prophylaxie du paludisme enAlgerie. Arch. Inst. Past. Alger. 6, 109–434.
Shah, S., 2010. The Fever: How Malaria Has Ruled Humankind for 500,000 Years. SarahCrichton Books/Farrar Straus and Giroux, New York, p. 305.
Shanks, G.D., Hay, S.I., Stern, D.I., Biomndo, K., Snow, R.W., 2002. Meteorologic influenceson Plasmodium falciparum malaria in the highland tea estates of Kericho, western Kenya.Emerg. Infect. Dis. 8, 1404–1408.
Sharp, B.L., Le Sueur, D., 1996. Malaria in South Africa—the past, the present and selectedimplications for the future. S. Afr. Med. J. 86, 83–89.
Sharp, B.L., Ngxonga, S., Botha, M.J., Ridl, F., Le Sueur, D., 1988. An analysis of 10 yearsof retrospective malaria data from the Kwazulu areas of Natal. S. Afr. J. Sci. 84,102–106.
Sharp, B.L., Kleinschmidt, I., Streat, E., Maharaj, R., Barnes, K.I., Durrheim, D.N., et al., 2007.Seven years of regional malaria control collaboration—Mozambique, South Africa andSwaziland. Am. J. Trop. Med. Hyg. 76, 42–47.
Shililu, J.I., Grueber, W.B., Mbogo, C.M., Githure, J.I., Riddiford, L.M., Beier, J.C., 2004.Development and survival of Anopheles gambiae eggs in drying soil: influence of the rateof drying, egg age, and soil type. J. Am. Mosq. Control Assoc. 20, 243–247.
Shousha, A.T., 1948. The eradication of A. gambiae from Upper Egypt, 1942-1945. Bull. WorldHealth Organ. 1, 309–348.
Sievers, A.C., Lewey, J., Musafiri, P., Franke, M.F., Bucyibaruta, B.J., Stulac, S.N., et al., 2008.Reduced paediatric hospitalizations for malaria and febrile illness patterns followingimplementation of community-based malaria control programme in rural Rwanda.Malar. J. 7, 167.
Sippe, G., Twining, M., 1946. Survey and field treatment of malaria in Mauritius. Colony ofMauritius Government.
Sissoko, D., Moendandze, A., Malvy, D., Giry, C., Ezzedine, K., Louis Solet, J., et al., 2006.Surveillance du paludisme a la Reunion en 2003–2004: tendances et perspectives d’action.Bull. Epidemiol. Heb. 32, 237–238.
Smith, G., 1911. Report of the advisory committee of the Tropical Diseases Research Fund, forthe year 1911. No. 3, Mauritius., p. 13.
Smith, A., 1962. Malaria in the Taveta area of Kenya and Tanganyika. Part III. Entomologicalfindings three years after the spraying period. East Afr. Med. J. 39, 553–564.
Smith, A., Draper, C.C., 1959. Malaria in the Taveta area of Kenya and Tanganyika. Part II.Results after three and a half years’ treatment of huts with dieldrin. East Afr. Med. J. 36,629–643.
Smith, A., Hansford, C.F., Thomson, J.F., 1977. Malaria control: epidemiological research insouthern Africa. WHO Chron. 31, 105–107.
Snow, R.W., Rowan, K.M., Greenwood, B.M., 1987. A trial of insecticide treated bed nets in theprevention of malaria in Gambian children. Trans. R. Soc. Trop. Med. Hyg. 81, 563–567.
Snow, R.W., Lindsay, S.W., Hayes, R.J., Greenwood, B.M., 1988. Permethrin-treated bed nets(mosquito nets) prevent malaria in Gambian children. Trans. R. Soc. Trop. Med. Hyg. 82,838–842.
Snow, R.W., Craig, M., Deichmann, U., Marsh, K., 1999. Estimating mortality, morbidity anddisability due to malaria among Africa’s non-pregnant population. Bull. World HealthOrgan. 77, 624–640.
Snow, R.W., Trape, J.F., Marsh, K., 2001. The past, present and future of childhood malariamortality in Africa. Trends Parasitol. 17, 593–597.

The Changing Limits and Incidence of Malaria in Africa: 1939–2009 259
Author's personal copy
Snow, R.W., Okiro, E.A., Gething, P.W., Atun, R., Hay, S.I., 2010a. Equity and adequacy ofinternational donor assistance for global malaria control: an analysis of populations atrisk and external funding commitments. Lancet 376, 1409–1416.
Snow, R.W., Alegana, V.A., Makomva, K., Reich, A., Uusiku, P., Katokele, S., et al., 2010b.Estimating the distribution of malaria in Namibia in 2009: assembling the evidence andmodelling risk. Ministry of Health and Social Services, Republic of Namibia and MalariaAtlas Project, May 2010.
Sobky, M.F., 1957. What a ‘malaria eradication’ programme would imply in Egypt. Bull.Endem. Dis. 2, 1–7.
Soeiro, A.N., 1952. O sezonismo em Mocambique contribuicao para o estudo epidemiolo-gico. Anais Instituto de Investigacao de Medicina Tropical (Lis) 9, 343–391.
Soeiro, A.N., 1956. A malaria em Mocambique, com especial referencia a campanha anti-malarica numa regiao predominantemente urbana (Lourenco Marques) e uma regiaopredominantemente rural (Vale do Limpopo). Anais Instituto de Investigacao de Medi-cina Tropical (Lis) 13, 615–634.
Solet, J.L., Balleydier, E., Quatresous, I., Sanquer, M.A., Gabrie, P., Elissa, N., et al., 2007.Situation epidemiologique du paludisme a Mayotte, France en 2005 et 2006. Bull. Epide-miol. Heb. 48, 407–409.
Southern African RBM Network, 2011. Cross-border malaria initiatives. http://www.sadc.int/shdsp/sarn/cross-border-initiatives.
Spencer, H.C., Kaseje, D.C.O., Roberts, J.M., Huong, A.Y., 1987. Consumption of chloroquinephosphate provided for treatment of malaria by volunteer village health workers inSaradidi, Kenya. Ann. Trop. Med. Parasitol. 81, 116–123.
STATSA, 2011. Statistics South Africa. http://www.statssa.gov.za.Stern, D.I., Gething, P.W., Kabaria, C.W., Temperley, W.H., Noor, A.M., Okiro, E.A., et al.,
2011. Temperature and malaria in highland East Africa. PLoS One 6, e24524.Strangeways-Dixon, D., 1950. Paludrine (Proguanil) as a malarial prophylactic amongst
African labour in Kenya. East Afr. Med. J. 28, 127–130.Strebel, P.M., Hansford, C.F., Kustner, H.G.V., 1988. The geographic distribution of malaria
in South Africa in 1986. South. Afr. J. Epidemiol. Infect. 3, 4–8.Sweeney, A.W., 2000. Wartime research on malaria chemotherapy. Parassitologia 42, 33–46.Swellengrebel, N.H., 1932. Report on investigation into malaria in the Union of South Africa
1930-1931. Annexure to Department of Public Health Report 1932, Government Printers,Pretoria.
Symes, C.B., 1940. Malaria in Nairobi. East Afr. Med. J. 17, 332–355.Talisuna, A.O., Bloland, P., D’Alessandro, U., 2004. History, dynamics and public health
importance of malaria parasite resistance. Clin. Microbiol. Rev. 17, 235–254.Tatarsky, A., Aboobakar, S., Cohen, J.M., Gopee, N., Bheecarry, A., Moonasar, D., et al., 2011.
Preventing the reintroduction of malaria in Mauritius: a programmatic and financialassessment. PLoS One 6, e23832.
Taylor, P., 1985. The malaria problem in Zimbabwe. Cent. Afr. J. Med. 31, 163–166.Taylor, P., Mutambu, S.L., 1986. A review of the malaria situation in Zimbabwe with special
reference to the period 1972-1981. Trans. R. Soc. Trop. Med. Hyg. 80, 12–19.Tchen, J., Ouledi, A., Lepere, J.F., Ferrandiz, D., Yvin, J.L., 2006. Epidemiologie et prevention
du paludisme dans les iles du sud-ouest de l’ocean indien.Med. Trop. (Mars) 66, 295–301.Teklehaimanot, A.T., Snow, R.W., 2002. Will the Global Fund help roll back malaria in
Africa? Lancet 360, 888–889.Teklehaimanot, H.D., Teklehaimanot, A., Kiszewski, A., Rampao, H.S., Sachs, J.D., 2009.
Malaria in Sao Tome and Principe: on the brink of elimination after three years ofeffective antimalarial measures. Am. J. Trop. Med. Hyg. 80, 133–140.
Thomson, J.G., 1929. Section of epidemiology and state medicine: endemic and epidemicmalaria in Southern Rhodesia. Proc. R. Soc. Med. 22, 1051–1058.

260 Robert W. Snow et al.
Author's personal copy
Trape, J.F., 2001. The public health impact of chloroquine resistance in Africa. Am. J. Trop.Med. Hyg. 64 (Suppl.), 12–17.
Trape, J.F., Sauvage, C., Ndiaye, O., Douillot, L., Marra, A., Diallo, A., et al., 2012. Newmalaria control policies and child mortality in Senegal: reaching Millennium Develop-ment Goal 4, Malaria control and child mortality. J. Infect. Dis. 205, 672–679.
Tredre, R.F., 1943. The role of Anopheles gambiae var. melas in the transmission of malaria inthe vicinity of Freetown Estuary, Sierra Leone, 1943. Ann. Trop. Med. Parasitol. 40,380–395.
Tren, R., Ncube, A.P., Urbach, J., Bate, R., 2007. Tyranny and disease: the destruction ofhealth care in Zimbabwe.Africa FightingMalaria, occasional paper. http://www.aei.org/papers/health/tyranny-and-disease.
Tseng, L.F., Chang, W.C., Ferreira, M.C., Wu, C.H., Rampao, H.S., Lien, J.C., 2008. Rapidcontrol of malaria by means of indoor residual spraying of alphacypermethrin in theDemocratic Republic of Sao Tome and Prıncipe. Am. J. Trop. Med. Hyg. 78, 248–250.
Turner, J.G.S., Walton, G.A., 1946. Report on malaria in Freetown and district. GovernmentPrinters, Freetown, Colony of Sierra Leone.
United States War Department, 1944. Geographical distribution of certain diseases. In: WarDepartment Pamphlet. US Government Printing Office, Washington No. 8-6.
Utzinger, J., Tozan, Y., Singer, B.H., 2001. Efficacy and cost-effectiveness of environmentalmanagement for malaria control. Trop. Med. Int. Health 6, 677–687.
Utzinger, J., Tozan, Y., Doumani, F., Singer, B.H., 2002. The economic payoffs of integratedmalaria control in the Zambian copper-belt between 1930 and 1950. Trop. Med. Int.Health 7, 657–677.
Van den Branden, F., van Hoof, L., 1923. Index de paludisme et essai de prophylaxiequinique de la malaria, a Leopoldville. Ann. Soc. Belg. Med. Trop. 3, 37–44.
Van Eijk, A.M., Hill, J., Alegana, V.A., Kirui, V., Gething, P.W., Ter Kuile, F.O., et al., 2010.Coverage of malaria protection in pregnant women in sub-Saharan Africa: a synthesisand analysis of national survey data. Lancet Infect. Dis. 11, 190–207.
Vialatte, C., 1923. Le Lutte antipaludique au Maroc, Etat de la question et resume de lachampagne de 1922. Arch. Inst. Pasteur Maroc 1, 563–593.
Vincke, I.H., 1950. Malaria control by means of DDT in Katanga (1947-1950). World HealthOrganization, WHO/Mal/47.
Vincke, I.H., 1954. Prophylaxie medicamenteuse du paludisme en zone rurale. Bull. WorldHealth Organ. 11, 785–792.
Von Seidlein, L., Greenwood, B.M., 2003. Mass administration of antimalarial drugs. TrendsParasitol. 19, 452–460.
Walton, G.A., 1947. On the control of malaria in Freetown, Sierra Leone. I. Plasmodium
falciparum and Anopheles gambiae in relation to malaria occurring in infants. Ann. Trop.Med. Parasitol. 41, 380–407.
Walton, G.A., 1949. On the control of malaria in Freetown, Sierra Leone. II: control methodsand the effects upon transmission of Plasmodium falciparum resulting from the reducedabundancy of Anopheles gambaie. Ann. Trop. Med. Parasitol. 43, 117–139.
Wassilieff, A., 1938. La lute antilarvaire, en Tunisie, doit-elle ester saisonniere ou continue?Arch. Inst. Past. Tunis 27, 31–41.
White, N.J., 1999. Delaying antimalarial drug resistance with combination chemotherapy.Parassitologia 41, 301–308.
White, N.J., Nosten, F., Looareesuwan, S., Watkins, W.M., Marsh, K., Snow, R.W., et al., 1999.Averting a malaria disaster. Lancet 353, 1965–1967.
Wolfe, H.L., 1964. Epidemiological data concerning one year of a malaria surveillance pilotproject in Southern Rhodesia. Bull. World Health Organ. 31, 707–720.
World Bank, 1993. World Development Report: Investing in Health. Oxford UniversityPress, Oxford, UK.

The Changing Limits and Incidence of Malaria in Africa: 1939–2009 261
Author's personal copy
World Bank, 2011. Population, total. http://data.worldbank.org/indicator/SP.POP.TOTL.WorldHealth Assembly, 2007.Malaria, including proposal for establishment ofWorldMalaria
Day. Sixtieth World Health Assembly Agenda item 12.5. May 2007; WHA60.18.World Health Organization, 1948. Fifth Session Malaria Programme of the World Health
Organization Interim commission on 26 January 1948. World Health Organization,WHO/IC/159.
World Health Organization, 1950. WHO Expert Committee on Malaria: report on the fourthsession—Kampala. World Health Organization, Geneva.
World Health Organization, 1954. WHO Expert Committee on Malaria: fifth report. WorldHealth Organization, Geneva.
World Health Organization, 1955. Summary of the status malaria in the Africa Region. In:World Health Organization, Lagos Conference, WHO/MAL/126-9.
World Health Organization, 1956. Malaria conference for the Eastern Mediterranean andEuropean regions. WHO Technical Report Series no. 132. World Health Organization,Athens.
World Health Organization, 1957. WHO Expert Committee on Malaria: Sixth Report. WorldHealth Organization, Geneva.
World Health Organization, 1961. Malaria eradication in 1960. WHO Chron. 15, 201–211.World Health Organization, 1967. Malaria eradication in Liberia and Mauritius. WHO
Chron. 21, 357.World Health Organization, 1971. Weekly Epidemiological Records. World Health Organi-
zation 46, 293–308 [Mauritius].World Health Organization, 1989. Weekly Epidemiological Records. World Health Organi-
zation 32, 244 [Libya, Egypt and South Africa].World Health Organization, 1992. Weekly Epidemiological Records. World Health Organi-
zation 35, 9 [Morocco].World Health Organization, 1999. Weekly Epidemiological Record. World Health Organiza-
tion 74, 265-272. [Sao Tome and Principe, Madagascar, Djibouti, Egypt].World Health Organization, 2000. The Abuja Declaration and the Plan of Action. An Extract
from the African Summit on Roll Back Malaria (WHO/CDS/RBM/2000.17), Abuja.http://www.rollbackmalaria.org/docs/abuja_declaration_final.htm.
World Health Organization, 2002. Roll Back Malaria in Southern Africa. Baseline 2001.Southern African Malaria Control Programme, World Health Organization, July 2002.
WorldHealth Organization, 2005. Global Strategic Plan: Roll BackMalaria. 2005–2015.WorldHealth Organization, Geneva.
World Health Organization, 2010. World Malaria Report. World Health Organization,Geneva.
World Health Organization Africa Regional Office, WHO-AFRO, 1962. Third Africanmalaria conference, Yaounde. Regional office for Africa, World Health Organization.
World Health Organization, Eastern Mediterranean Regional Office, 2011. Malaria controland elimination. http://www.emro.who.int/rbm/epidemiology-profiles.htm.
World Health Organization-Algeria, 1956. Information sur le programme de lutte antipalu-dique en Algeria (France). In: WHO EMRO inter-regional meeting, April 1956. Worldhealth organization, Athens Meeting, WHO/MAL/163-4.
World Health Organization-Bechuanaland, 1955. Information on the malaria controlprogramme in Bechuanaland. In: World Health Organization, Lagos Conference,WHO/MAL/126-8-2.
World Health Organization-Cape Verde, 1955. Information on the malaria controlprogramme in Cape Verde Islands. In: World Health Organization, Lagos Conference,WHO/MAL/126-4-2.

262 Robert W. Snow et al.
Author's personal copy
World Health Organization-Comoros, 1955. Informations sur le programme de lutte anti-paludique dans l’archipel des Comores. In: World Health Organization, Lagos Confer-ence, WHO/Mal/126-2-4.
World Health Organization-Djibouti, 1956. Informations sur le programme de lute antipa-ludique en Cote Francaise des Somalis. In: WHO EMRO inter-regional meeting, April1956. World Health Organization, Athens Meeting, WHO/MAL/163.16.
World Health Organization-Egypt, 1956. Information on the malaria control programme inEgypt. In: WHO EMRO inter-regional meeting, April 1956. World Health Organization,Athens Meeting, WHO/MAL/163.22.
World Health Organization-Egypt, 2010. Egypt. In: Presentation given atWHO Inter-countrymeeting, Marrakech, Kingdom of Morocco, September 2010.
World Health Organization-Libya, 2010. Libya. In: Presentation given at WHO Inter-countrymeeting, Marrakech, Kingdom of Morocco, September 2010.
World Health Organization-Madagascar, 1955. Information sur le programme de lutte anti-paludique a Madagascar. In: World Health Organization, Lagos Conference, WHO/MAL/126-2-5.
World Health Organization-Mauritius, 1955. Information on the malaria control programmein Mauritius. In: World Health Organization, Lagos Conference, WHO/MAL/126-8-6.
World Health Organization-Morocco, 2010. Malaria eradication in Morocco. In: Presentationgiven at WHO Inter-country meeting, Marrakech, Kingdom of Morocco, September 2010.
World Health Organization-Reunion, 1955. Information sur la programme de lutte antipa-ludique dans la Ile Reunion. In: World Health Organization, Lagos Conference, WHO/MAL/126-2-6.
World Health Organization-Sao Tome and Principe, 1955. Information on themalaria controlprogramme in Sao Tome and Principe. In:WorldHealth Organization, Lagos Conference,WHO/MAL/126-4-5.
World Health Organization-Spanish Morocco, 1955. Information on the malaria controlprogramme in Spanish Morocco. In: World Health Organization, Lagos Conference,WHO/MAL/126-6-1.
World Health Organization-Swaziland, 1955. Information on the malaria control programmein Swaziland. In: World Health Organization, Lagos Conference, WHO/MAL/126-8-12.
World Health Organization-Tunisia, 2010. Malaria in Tunisia. In: Presentation given atWHOInter-country meeting, Marrakech, Kingdom of Morocco, September 2010.
World Health Organization-Tunisie, 1956. Informations sur le programme de lutte antipa-ludique en Tunisie. In: WHO EMRO inter-regional meeting, April 1956. World HealthOrganization, Athens Meeting, WHO/Mal/163-6.
World Health Organization-Zanzibar, 1955. Information on the malaria control programmein Zanzibar. In: World Health Organization, Lagos Conference, WHO/MAL/126-6-15.
Yekutiel, P., 1960. Problems of epidemiology in malaria eradication. Bull. World HealthOrgan. 22, 669–683.
Zanzibar Malaria Control Program, 2009. Malaria elimination in Zanzibar: a feasibilityassessment. http://www.malariaeliminationgroup.org.
Zanzibar Protectorate, 1923-1966. Annual Report on the Medical, Sanitary and BiologicalDivisions for the years 1930-1966. Government Printers, Colony of Zanzibar.