The causal effect of peer aggression when “birds of a feather flock together”: Network Structure...
30
Running Head: Using social network data to identify peer effects 1 Estimating the causal effect of peer aggression when “birds of a feather flock together”: Network Structure as identification strategy of peer effects Andres Molano, Universidad de los Andes Stephanie M. Jones, Harvard University Authors’ Note Andres Molano, Universidad de los Andes, Bogotá. Colombia. Stephanie M. Jones Graduate School of Education, Harvard University. The original research and analyses presented in this article were supported by grants from IES (# R305LO30003) and W. T. Grant Foundation (#1656) to Lawrence Aber (PI) and from W. T. Grant Foundation (#7520) and NIMH (#1R01MH082085-01A2) to Joshua Brown and Stephanie Jones (PIs). The authors are very grateful to Tom Roderick and his entire staff at the Morningside Center for their talent at and commitment to developing and implementing the 4Rs (Reading, Writing, Respect, and Resolution) and to a rigorous external evaluation of the 4Rs. The authors are also enormously grateful to the many postdoctoral fellows, doctoral students, and research assistants at New York University, Fordham University, and Harvard University who have helped in every phase of the work reported here, from data collection through data analysis. Finally, we are grateful to the many thousands of students, hundreds of teachers, and dozens of schools who have made this work possible. Special thanks to Richard J. Murnane, John B. Willett and Felipe Barrera-Osorio who read and provide thoughtful comments to preliminary versions of this manuscript. Correspondence concerning this article should be addressed to Andres Molano, Centro de Investigación y Formación en Educación (CIFE), Universidad de los Andes. Carrera Primera # 18A-12, Bogotá, D.C., Colombia. E-mail: [email protected]
Transcript of The causal effect of peer aggression when “birds of a feather flock together”: Network Structure...
Running Head: Using social network data to identify peer effects 1
Estimating the causal effect of peer aggression when “birds of a feather
flock together”: Network Structure as identification strategy of peer effects
Andres Molano, Universidad de los Andes
Stephanie M. Jones, Harvard University
Authors’ Note
Andres Molano, Universidad de los Andes, Bogotá. Colombia. Stephanie M. Jones Graduate School of Education, Harvard University. The original research and analyses presented in this article were supported by grants from IES (# R305LO30003) and W. T. Grant Foundation (#1656) to Lawrence Aber (PI) and from W. T. Grant Foundation (#7520) and NIMH (#1R01MH082085-01A2) to Joshua Brown and Stephanie Jones (PIs). The authors are very grateful to Tom Roderick and his entire staff at the Morningside Center for their talent at and commitment to developing and implementing the 4Rs (Reading, Writing, Respect, and Resolution) and to a rigorous external evaluation of the 4Rs. The authors are also enormously grateful to the many postdoctoral fellows, doctoral students, and research assistants at New York University, Fordham University, and Harvard University who have helped in every phase of the work reported here, from data collection through data analysis. Finally, we are grateful to the many thousands of students, hundreds of teachers, and dozens of schools who have made this work possible. Special thanks to Richard J. Murnane, John B. Willett and Felipe Barrera-Osorio who read and provide thoughtful comments to preliminary versions of this manuscript. Correspondence concerning this article should be addressed to Andres Molano, Centro de Investigación y Formación en Educación (CIFE), Universidad de los Andes. Carrera Primera # 18A-12, Bogotá, D.C., Colombia. E-mail: [email protected]
Running Head: Using social network data to identify peer effects 2
Estimating the causal effect of peer aggression when “birds of a feather
flock together”: Network Structure as identification strategy of peer effects
Abstract
In an attempt to identify causal peer effects in contexts when children with similar levels of aggression cluster together – when birds of a feather flock together -, in this paper we capitalize on the existence of detailed network data to implement a method of instrumental variables estimation. Particularly, we attempt to identify the proportion of exogenous variation in peer aggression and to use it as a predictor of individual aggression. Results from our preferred specification, obtained through the implementation of a 2-stage Least Square Regression suggest that “hanging out” with aggressive peers represents a positive effect of almost 0.8 points (ES = 1.5) in the aggressive behavior for students in 4th grade of New York City Schools. We discuss our results at the light of the potential opportunities and limitations that detailed social network data provides for the empirical identification of this fundamental question in human development.
Resumen
Buscando identificar causalmente los efectos de pares en contextos en los que estudiantes con similares niveles de agresión se auto-seleccionan para armar grupos – cuando aves de la misma pluma vuelan juntas -, en este artículo utilizamos información detallada de las redes sociales de los estudiantes para implementar una estrategia de estimación de variables instrumentales. Específicamente, buscamos identificar la proporción de variación exógena en niveles de agresión de pares y usarla como el predictor principal de la agresión individual. Los resultados de nuestra especificación preferida, sugieren que “andar junto” a pares agresivos representa un efecto positivo de casi 0.8 puntos (ES=1.5) en los niveles de agresión individual de estudiantes de 4to grado en escuelas de la ciudad de New York. Discutimos nuestros resultados a la luz de las potenciales oportunidades y limitaciones que el uso de información de redes sociales provee para la identificación empírica de esta importante pregunta para el desarrollo humano.
JEL: A12, C36, C45, I20, I25.

Running Head: Using social network data to identify peer effects 1
Estimating the causal effect of peer aggression when “birds of a feather flock
together”: Network Structure as identification strategy of peer effects.
Children and adolescents exert powerful influences on the development of their
peers. Long-standing theoretical paradigms in sociology and psychology postulate that
patterns of affiliation and interaction between peers (Hansel, 1985), friendships (Boivin,
et al, 1995), and the individual identity constructed as a member of a group (Tajfel,
1978; 1979) influence social behavior. Moreover, theories that highlight the ecological
nature of human development (Bronfenbrenner, 1979; 1998) and developmental
systems (Magnusson & Stattin, 1998; Sameroff, 1995) describe the interactions among
individuals, social groups, and their environments as a primary driving force behind
human development (Jones & Molano, 2009).
Although these theories have highlighted the fundamental role of social
interactions on human development, it has been very difficult to find empirical evidence
to support the causal role of peers on an individual’s outcomes and growth. As
recognized by Manski (1993), obtaining unbiased estimates of these effects is
particularly challenging due to the difficulties in distinguishing the socialization effect of
peers on individual behavior from the selection process that motivate these individuals
to establish a relationship in the first place1. This assertion is supported by a long
tradition in sociological research, starting with Lazarsfeld and Merton (1954), who
coined the term homophily2 to describe the human tendency to establish relationships
with peers with similar personal characteristics. Because “birds of a feather flock
together”, and humans, in general, tend to establish social relationships with those who
resemble them, it is difficult to distinguish the causal role of peers on human behavior.
Attending to Manski’s (1993) observation, the last decade has seen the rigorous
development and application of analytical techniques to statistically control for
1 Manski (1993) names this challenge the “reflection problem” building form an analogy of the inherent difficulty of establishing causal effects of a person’s movement when observed in front of a mirror by someone who is not aware of the reflective properties of the mirror (pp. 532). 2 For a review of the sociological literature on Homophily see McPherson, Smith-Lovin & Cook (2001). According these authors, homophilic association has been observed along several individual characteristics including gender, ethnicity, socio-economic status and education levels among U.S populations, when controlling for other observed characteristics.
Running Head: Using social network data to identify peer effects 2
alternative mechanisms that could potentially explain true peer effects. Among
psychological and sociological traditions, a method receiving considerable attention is
the modeling of process of social network and behavioral evolution as the result of
stochastic actor-driven processes (Molano, Jones, Brown & Aber, 2013; Snijders,
Steglich & van de Bunt, 2010; Steglich, Snijders & Pearson, 2010; Veenstra & Steglich,
2012) that explicitly allows to estimate process of peer selection and influence.
According to Steglich et al., (2010) this family of models capitalizes on detailed
information about the network of relationships among members of a social group (e.g. a
classroom or a school) and accounts for alternative possible mechanisms of network
and behavioral change while respecting the network dependency of actors. While the
application of these analytical techniques to questions of child and adolescent behavior
has contributed enormously to elucidate process of selection and socialization in
different areas of human development (see Molano, Jones, Brown & Aber, 2013; for an
application on children’s aggressive and prosocial behavior and Veenstra & Steglich,
2012; and Veenstra & Dijkstra, 2011 for a broad review), the main identification strategy
frequently employed is statistical control.
Although it is widely recognized that only controlled experiments using random
assignment as a source of exogenous variation are able to provide unbiased causal
estimates (Murnane & Willett, 2012), parallel analytical developments in econometrics
and statistics have identified quasi-experimental conditions and sources of exogenous
variability that could be employed to causally identify peer effects from observational
data. In this paper we analyze detailed information on the patterns of interaction
between all the classroom-members of almost 900 students in 69 elementary school
classrooms in New York City as a mechanism to overcome some of the difficulties in
estimating peer effects. Using these detailed data we ask: What is the causal effect of
peer levels of aggression on individual levels of aggression in a population of low
income, urban elementary school students in New York City?
Specifically, we use data on the classroom-social networks of these students to
construct my identification strategy relying on the work of Bramulle, Djebbari & Fortin
(2009). We use parental reports of levels of community risk for students who are
connected to each participant’s friends – but not directly to him/her – as an empirical
Running Head: Using social network data to identify peer effects 3
instrument for the aggression of each participant’s peers. Relying on the structure of the
participant’s social networks – within each school and classroom – we argue that the
absence of a direct social relationship between each participant and his/her friends’
friends allow us to assume the absence of a direct effect of those friends’ friends’
exposure to community risk on the participant’s levels of aggression. The fundamental
assumption underlying our work is that the effect of peers is restricted to those actors
who are directly connected to each participant, and that the social transmission of
behavioral patterns occur only among those individual who share a direct social
connection.
We focus on individual levels of aggression, as an outcome, due to its potential
role as an important risk factor that hinders positive human development (Shinn &
Yoshikawa, 2008; Jones & Molano, 2009). Results from our preferred model
specification suggest that “hanging out” with aggressive peers causes a positive
increment of almost 1.5 standard deviation units in the teacher report of aggression for
elementary school students, in classrooms where more than 3 participants were
evaluated. This very large effect constitutes a reduction of almost 0.6 standard deviation
units from the estimate obtained employing a naïve OLS model.
In the following section we elaborate on the fundamental problems encountered
while estimating peer effects and provide support to the use of social network data as
an alternative to overcome some of these limitations. Then, we describe the structure of
our data, our sample and elaborate on the details of the empirical identification and
procedures in the research design section. We report the results of our estimation in the
findings section and discuss the potential limitations, or threats to the validity, of our
inferences and further directions in the final discussion section.
Background
A key challenge in the empirical literature on peer effects is to identify what
factors drive the association between outcomes of individuals who have close
relationships with one another. In the absence of the random assignment of individuals
to peers with varying levels of an outcome, any observed association between the
behaviors of individuals who interact together is subject to several threats that limit our
Running Head: Using social network data to identify peer effects 4
ability to attribute a causal effect of peers on individuals. More specifically, the
covariance between outcomes of individuals and their peers could be equally explained
by the causal effect of one on another, as by the process that drove individuals to
establish a relationship in the first place. Manski (1993) recognizes this problem and
presents an empirical formulation that details three potential, but empirically
confounded, mechanisms that could explain the effect of peers on human behavior.
First, he recognizes that the tendency of an individual to behave in a certain way
covaries with the behavior of the group as the result of a selection process – individuals
tend to establish social relationships with those who resemble them. Second, he
postulates that individuals in the same group behave similarly because they are part of
a similar environment – a correlated effect of exposure to similar environments –. Third
he postulates that some exogenous effect could exist such that the tendency of
individuals to behave in certain ways vary with exogenous characteristics of the group-
a true causal effect of peers on individuals’ behavior.
Working from the formulation of a linear in means model3, Manski (1993) shows
that two main identification problems arise when exploring the causal effects of peers on
individual behavior. First, he suggests that it is difficult to distinguish real social effects
from correlated effects stemming from exposure to shared environments by all
members of a group. Second, even in the absence of correlated effects, the reflection
problem –or the simultaneity in the observation of the behavior of interacting agents –
hinders the empirical identification of causal effects apart from the unobserved selection
process that generated a social relationship.
Recognizing the identification problems suggested by Manski (1993), an
increasing number of researchers have attempted to obtain unbiased estimates of the
effect of peers on human behavior. Among educational researchers special emphasis
has been placed on estimating the effect of peers on academic outcomes, as these
have been presented by previous research as important causal indicators of labor
market outcomes and economic prosperity (see for example Becker, 1993). However,
from a human development perspective, behavioral and socio-emotional outcomes
3 Where the individual outcome depends linearly on his/her own characteristics, the mean outcome of his group and their mean characteristics.
Running Head: Using social network data to identify peer effects 5
could be important indicators in understanding the fit of individuals within their social
environments. For example Petras et al. (2004), Nagin & Trembaly (1999) and
Maughan et al. (2000) present evidence that exposure and display of aggressive
behavior among elementary school students predicts latter criminal and antisocial
behavior in adolescents. Similarly, Jones et al., (2010; 2011) report the positive effects
of an intervention addressing social and emotional processes during middle childhood
on both the social (aggression and prosociality) and academic behavior of students
(literacy test scores) across elementary school.
Empirical identification with longitudinal data
When exploring the causal effect of peer’s outcomes and attributes on individual
academic achievement, one of the most frequent identification strategies4 implemented
in observational data is illustrated by Hoxby (2001). Capitalizing on the existence of rich
panel and administrative data from the state of Texas, Hoxby employs the idiosyncratic
variation in gender and ethnic composition of classrooms cohorts to explore the causal
effect of classroom composition on classroom average achievement. Hoxby’s
justification for the use of idiosyncratic change in classroom composition as a valid
identification strategy builds on the assumption that after controlling for temporal trends
in variations in classroom composition, the addition of a new student to a grade-cohort
classroom could be regarded as random and serves as a source of exogenous variation
in classroom composition. Using this strategy she finds that students achieve 0.40
standard deviations higher on standardized tests when in classrooms with peers who
score a standard deviation higher on the same tests5.
Building from Hoxby’s work, Neidell & Waldfogel (2008) and Lavy & Scholosser
(2010) developed further this empirical strategy through their work with longitudinal data
from populations in the United States and Israel respectively. They find similar effects to
the ones reported by Hoxby (2001) and extended her conclusions, accounting for the
effect of gender composition on academic achievement across elementary, middle and
4 Excluding empirical reports that capitalize in the existence of a natural experiment to achieve identification (see for example Sacerdote, 2001) 5 Hoxby (2001) also reports that the classroom percentage of females has a causal positive effect on classroom mean achievement in math (for both boys and girls).
Running Head: Using social network data to identify peer effects 6
high school populations. Of particular interest for our exploration of peer effects on
behavioral outcomes is the work of Lavy & Scholosser (2010). Although the authors
focus their report on peer effects on the academic achievement of Israeli students, they
also explore the causal effect of these idiosyncratic changes in students’ perceptions of
their classroom environment and on their individual expression of aggressive behavior.
Lavy & Scholosser (2001) find that having more girls in a class improves the
climate of safety in classrooms, as well as the social relationships among peers and the
quality of student-teacher relationships. However, they also find the proportion of girls in
a classroom does not have a statistically significant effect on individual self-reports of
aggressive behavior. The authors interpret these different results as an indication that
the effect of the proportion of girls in each classroom on the disruption of violence is
mainly driven by changes in the composition of the class and not by changes in the
individual behavior of students.
Empirical identification with data on social networks
Sijtsema et al., (2009) and Molano et al. (2013) report causal effects of peer’s
levels of aggression on individual aggressive behavior in a population of early
adolescents in the U.S. These authors obtain these results from their analysis of change
in the configuration of the particular patterns of association between students – their
social networks – across multiple waves of measurement. Detailed network data allow
Molano et al (2013) and Sijtseman et al. (2009) to use the observed formation of a new
tie with another peer as their predictor for changes in aggressive behavior, relying on
the assumption that controlling for the selection process observed within the network
allows them to isolate the causal effect of peer aggression on individual aggression6.
Although, the work of these authors does not address other potential sources of bias
that could influence their estimates, their use of longitudinal social network data is one
of the few existing examples of how these data could provide information to explicitly
6 The work of these authors employs a method of estimation developed by Snijders, Steglich &
Schweinberg, (2007) know as Simulation Investigation for Empirical Network Analysis (SIENA). This method allows the estimation of behavioral changes and network changes (changes in the absence or presence of a relation) by modeling them simultaneously. According to Veenstra & Dijkstra (2011) SIENA allows researchers to test both selection and influence effects while controlling for each other.

Running Head: Using social network data to identify peer effects 7
model the process of formation of social relationships among youth; a fundamental
alternative explanation to that of peer effects.
Similarly, Bramoulle, Djebbari & Fortin (2009) rely on the rich social network data
to propose and implement an identification strategy that directly addresses the points
raised by Manski (1993). The authors argue that social network data allows them to
relax the common notion that individuals interact in defined groups (classrooms or
schools) and to obtain detailed information about the unique reference group for each
individual: the peers who are directly connected to each student within a classroom.
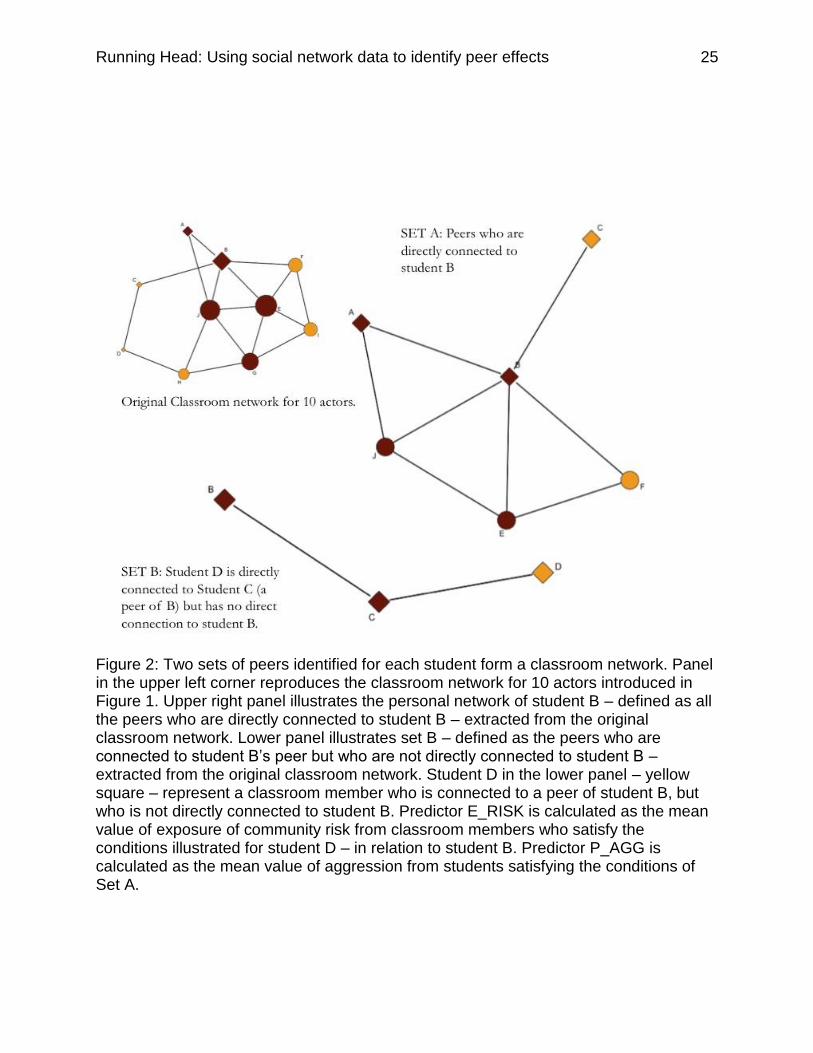
Furthermore, Bramoulle et al. (2009) demonstrate that using these detailed data about
the reference groups for each participant allows them to separate endogenous from
exogenous effects when considering the causal effects of peers. Particularly, the
authors demonstrate that social network data allow them to partition a classroom into
groups of peers (hereafter Set A) directly related to each participant (or the Target
child), as well as to identity students who are members of the classroom but that are not
directly connected to the Target child (hereafter Set B), but who are connected to the
Target child’s peers (Set A). In figures 1 and 2, we present a brief explanation of the key
elements of a social network and the two potential sets of peers that could be extracted
from these data. Figure 1 simply introduces the general structure of a social network
using simulated data from one participating classroom, while Figure 2 extends these
key notions to the identification of Set A and B for each member of the network.
Once these two groups of students are identified for each participant, the
structure of the data works as the mechanism on which identification relies. Bramoulle,
et al (2009) describe how the lack of existence of a social relationship between the
Target child’s friends’ friend allows them to use information from this group as an
instrument for the behavior of the Target child’s friends. Specifically, Bramoulle,
Djebbari & Fortin (2009) use the observed characteristics of the friend’s friends (Set B)
of a Target child as an empirical instrument for the action of the Target child’s friends
(Set A). The fundamental assumption underlying this model is that the effect of peers is
restricted to those actors who are directly connected to each participant, and that the
social transmission of behavioral patterns occur only among those individual who are
observed to share a direct social connection. While this assumption may seem limiting
Running Head: Using social network data to identify peer effects 8
from the perspective that acknowledges the potential effect of features of classroom
composition on the expression of individual’s behavior, it simply restricts the estimates
of the causal effect of peers on an individual’s behavior to those situation where there is
an actual observed social interaction between peers.
Based on this assumption, the authors propose an Instrumental Variables
Estimation model. The first stage of this model accounts for the effect of friend’s friends’
characteristics (Set B) as an instrument of the mean behavioral levels of the target
child’s friends (Set A). Relying on the observed social relationships within the classroom
– from social network data – the authors assume that in the absence of a social
relationship between peers in Set B and each participant, the effect of these peers
characteristics could only reach the participants through a path that runs through their
directly connected friends (Set A). In the second stage the authors show that the
predicted values of mean peer behavioral levels – from the first stage model - could be
used as an exogenous predictor of the individual behavioral levels of the target child.
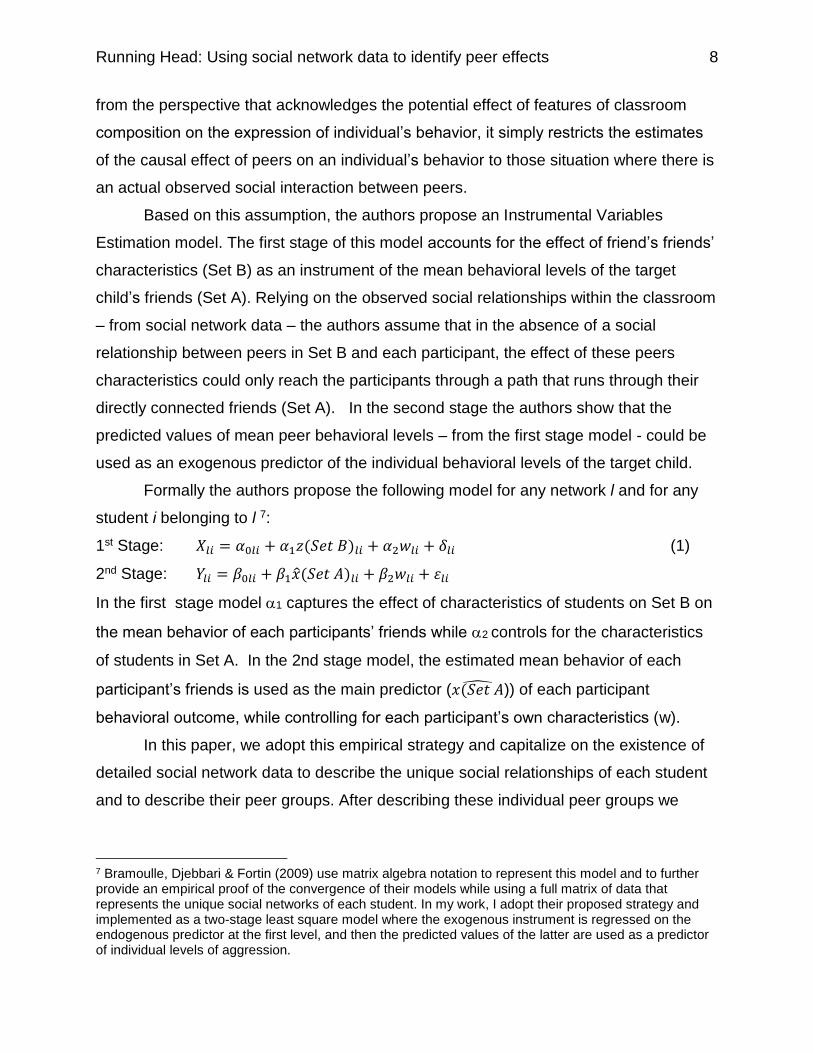
Formally the authors propose the following model for any network l and for any
student i belonging to l 7:
1st Stage: 𝑋𝑙𝑖 = 𝛼0𝑙𝑖 + 𝛼1𝑧(𝑆𝑒𝑡 𝐵)𝑙𝑖 + 𝛼2𝑤𝑙𝑖 + 𝛿𝑙𝑖 (1)
2nd Stage: 𝑌𝑙𝑖 = 𝛽0𝑙𝑖 + 𝛽1�̂�(𝑆𝑒𝑡 𝐴)𝑙𝑖 + 𝛽2𝑤𝑙𝑖 + 휀𝑙𝑖
In the first stage model 1 captures the effect of characteristics of students on Set B on
the mean behavior of each participants’ friends while 2 controls for the characteristics
of students in Set A. In the 2nd stage model, the estimated mean behavior of each
participant’s friends is used as the main predictor (𝑥(𝑆𝑒𝑡 𝐴̂ )) of each participant
behavioral outcome, while controlling for each participant’s own characteristics (w).
In this paper, we adopt this empirical strategy and capitalize on the existence of
detailed social network data to describe the unique social relationships of each student
and to describe their peer groups. After describing these individual peer groups we
7 Bramoulle, Djebbari & Fortin (2009) use matrix algebra notation to represent this model and to further provide an empirical proof of the convergence of their models while using a full matrix of data that represents the unique social networks of each student. In my work, I adopt their proposed strategy and implemented as a two-stage least square model where the exogenous instrument is regressed on the endogenous predictor at the first level, and then the predicted values of the latter are used as a predictor of individual levels of aggression.
Running Head: Using social network data to identify peer effects 9
employ a two-stage linear model to explore the effect of the exogenous proportion of
peer aggression on individual levels of aggression.
Although our identification strategy relies on the structure of the data, and
capitalizes on the rich information that is available about the social relationships of
students within classrooms, we also employ a third variable that introduces an
additional source of exogeneity into our first stage model. Specifically, we describe the
effect of students in Set B on the behavior of students in Set A, based on the exposure
to community violence of the former. Previous research has suggested that the levels of
exposure to community level risk (violence, disorganization and overpopulation) is in
fact a strong predictor of aggressive behavior exhibited by students at school (see
Gershoff & Aber, 2006); this relationship could function through an individual
mechanism (e.g. students exposed to higher levels of aggression at their
neighborhoods have better models to implement that aggression themselves).
Research Design:
Dataset
We use data collected by Aber, Brown & Jones (2004) in their experimental
evaluation of the 4Rs Program in the New York City public school system. We only
employ one wave of their data (Fall of 2005), where all the consented participants were
in the 4th grade of elementary school. This dataset contains records for 1122 students,
nested in 114 classrooms across 18 schools. The mean age of the participants in the
study at this point is 8.62 years (s.d. = 0.69), where 49.07% are male, 45.8% are
Hispanic and 41.3% are African-American. Additional demographic and compositional
variables that describe this sample are presented in the left panel of Table 1. From
these 1122 students we restrict our sample to account for the data completion
requirements of our proposed analyses. As such, we exclude 268 participants for which
the observations of the main dependent variable – teacher report levels of aggressive
behavior - are missing.
Furthermore, we exclude 19 participants who are in classrooms with less than 3
consented students since our main predictor (peer aggression) and our identification
Running Head: Using social network data to identify peer effects 10
strategy depend on the existence of at least one non-transitive triad8 in each classroom.
After these restrictions, our sample consists of 835 participants, nested in 69
classrooms and 18 schools. Demographic information about this final sample is
included in the right panel of Table 1.
Procedures
We employ two important sources of information in our analysis. First, we use as
dependent variable the average score of teacher report of aggression for each
participant. This score is obtained by averaging the teacher’s report of the frequency of
a child’s aggressive behavior (in the last 30 days) across 14 items. Calculated from the
available data, the internal consistency –reliability – of this scale is of 0.95.
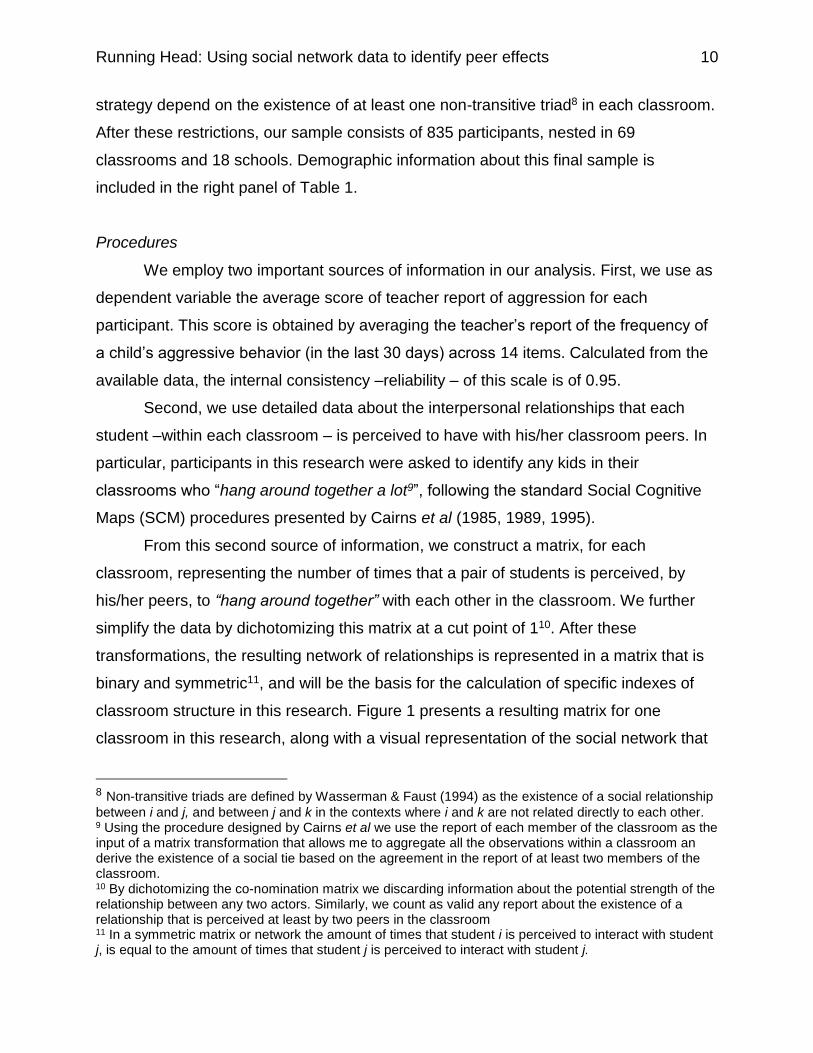
Second, we use detailed data about the interpersonal relationships that each
student –within each classroom – is perceived to have with his/her classroom peers. In
particular, participants in this research were asked to identify any kids in their
classrooms who “hang around together a lot9”, following the standard Social Cognitive
Maps (SCM) procedures presented by Cairns et al (1985, 1989, 1995).
From this second source of information, we construct a matrix, for each
classroom, representing the number of times that a pair of students is perceived, by
his/her peers, to “hang around together” with each other in the classroom. We further
simplify the data by dichotomizing this matrix at a cut point of 110. After these
transformations, the resulting network of relationships is represented in a matrix that is
binary and symmetric11, and will be the basis for the calculation of specific indexes of
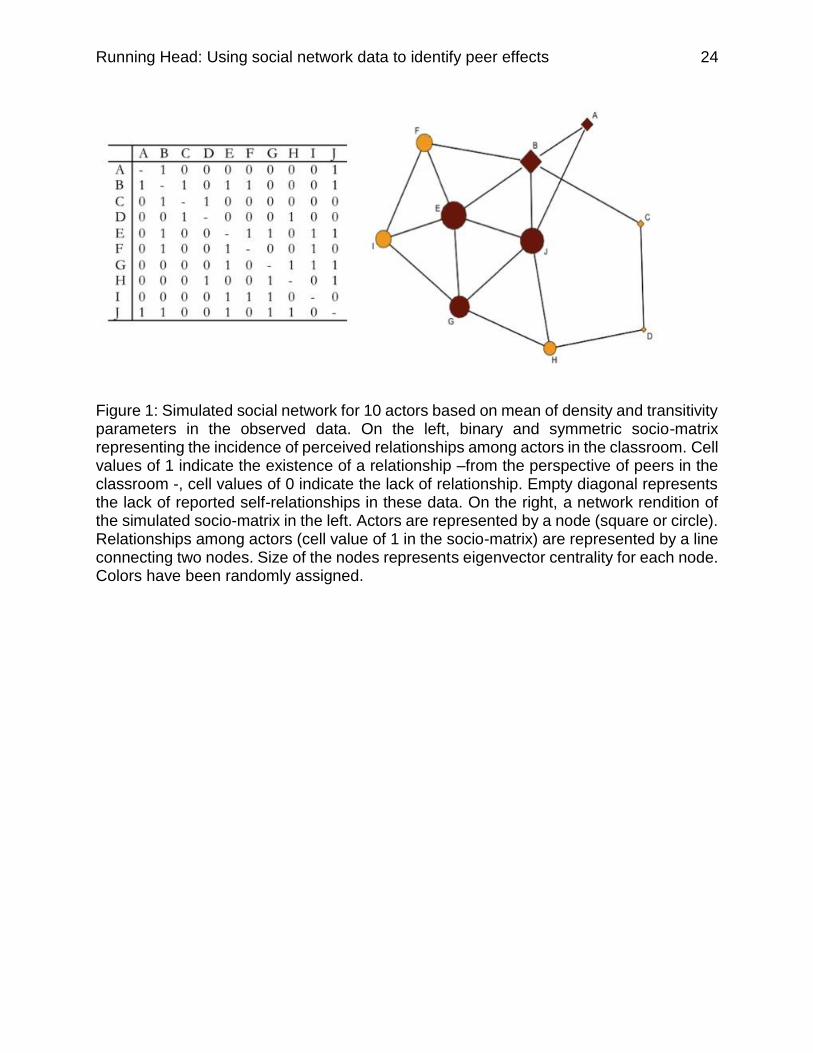
classroom structure in this research. Figure 1 presents a resulting matrix for one
classroom in this research, along with a visual representation of the social network that
8 Non-transitive triads are defined by Wasserman & Faust (1994) as the existence of a social relationship
between i and j, and between j and k in the contexts where i and k are not related directly to each other. 9 Using the procedure designed by Cairns et al we use the report of each member of the classroom as the input of a matrix transformation that allows me to aggregate all the observations within a classroom an derive the existence of a social tie based on the agreement in the report of at least two members of the classroom. 10 By dichotomizing the co-nomination matrix we discarding information about the potential strength of the relationship between any two actors. Similarly, we count as valid any report about the existence of a relationship that is perceived at least by two peers in the classroom 11 In a symmetric matrix or network the amount of times that student i is perceived to interact with student j, is equal to the amount of times that student j is perceived to interact with student j.

Running Head: Using social network data to identify peer effects 11
is implied by such data. From these two sources of information we construct the
following measures.
Measures
Outcome
AGGRESSION (AGG): Measured by the average response on 14 teacher-reported
items of aggressive behavior collected using the Behavioral Assessment System for
Children – BASC-II (Reynolds & Kamphaus, 1998). Scores range from 1.00 to 4.00,
with higher values representing higher levels of aggressive behavior.
Main Predictor and Instrument
1. PEER AGGRESSION (P_AGG): Based on the classroom social network obtained
through the application of the SCM procedure (Cairns et al. 1985), we identify all the
peers who are directly connected to each participating student in each classroom.
Using this information we can partition the classroom into two different sets for each
student. One set (Set A) represents all the students who are directly connected to
each child, her direct peer group. From Set A, we calculate the average level of
aggressive behavior to which each child is exposed by taking the average of all peer
scores and dividing it by the number of peers who are included in this set. We use
these averages, potentially different for each student in the classroom, as a measure
of peer levels of aggression, the main predictor in this work.
2. EXPOSURE TO COMMUNITY RISK (E_RISK): This covariate is measured using
parent responses to 7 items that sought to assess the extent to which children were
exposed to different sources of community risk factors and disorganization (e.g.
exposure to weapons, murders, overpopulated houses, gangs and litter, among
others). We employ the average scores across these items to obtain a measure of
average exposure to community risk for a particular set of students in the classroom.
This second set (Set B) represents all the classroom members who are directly
connected to the peers directly connected to each target student (Set A), but who
are not directly connected to each target student themselves. Simultaneously, set B
represents all the non-transitive relationships between each student’s peers who are
not directly his/her friends and it is the basis for my identification strategy. Figure 2
Running Head: Using social network data to identify peer effects 12
introduces a schematic of these relationships within a classroom network,
highlighting the classrooms members who belong to each one of the sets of peers
for a student. Based on the scores community risk of students belonging to Set B,
for each classroom member we calculate the average score for their exposure to
community risk. We use this variable as an instrument that is assumed to be related
to the expression of aggression of each student’s peers (Set A), but uncorrelated
with the residuals of a regression between mean levels of aggression (Set A) and
individual levels of aggression for each child.
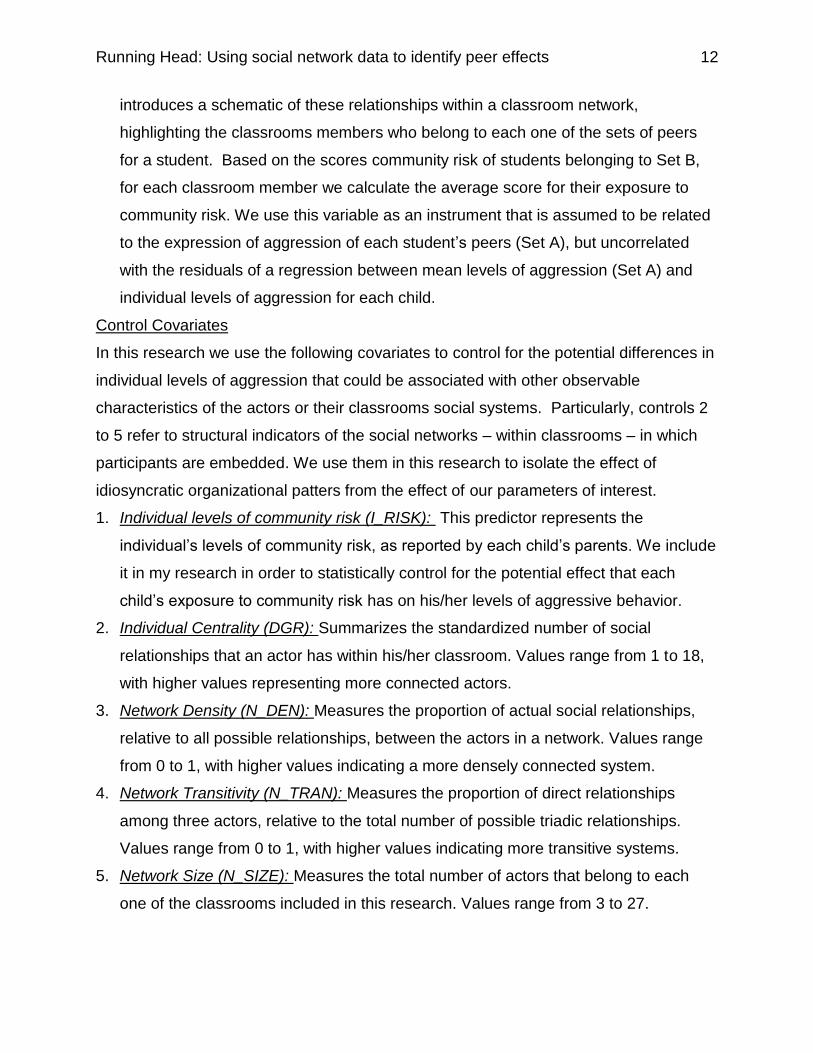
Control Covariates
In this research we use the following covariates to control for the potential differences in
individual levels of aggression that could be associated with other observable
characteristics of the actors or their classrooms social systems. Particularly, controls 2
to 5 refer to structural indicators of the social networks – within classrooms – in which
participants are embedded. We use them in this research to isolate the effect of
idiosyncratic organizational patters from the effect of our parameters of interest.
1. Individual levels of community risk (I_RISK): This predictor represents the
individual’s levels of community risk, as reported by each child’s parents. We include
it in my research in order to statistically control for the potential effect that each
child’s exposure to community risk has on his/her levels of aggressive behavior.
2. Individual Centrality (DGR): Summarizes the standardized number of social
relationships that an actor has within his/her classroom. Values range from 1 to 18,
with higher values representing more connected actors.
3. Network Density (N_DEN): Measures the proportion of actual social relationships,
relative to all possible relationships, between the actors in a network. Values range
from 0 to 1, with higher values indicating a more densely connected system.
4. Network Transitivity (N_TRAN): Measures the proportion of direct relationships
among three actors, relative to the total number of possible triadic relationships.
Values range from 0 to 1, with higher values indicating more transitive systems.
5. Network Size (N_SIZE): Measures the total number of actors that belong to each
one of the classrooms included in this research. Values range from 3 to 27.
Running Head: Using social network data to identify peer effects 13
6. Gender: We control for the effect of gender including a dichotomous predictor MALE
(coded as 1 for male and 0 for female).
7. School Fixed Effects: We control for the potential differences between schools by
including a set of dichotomous predictors coded as 1 for observations within each
school, otherwise 0.
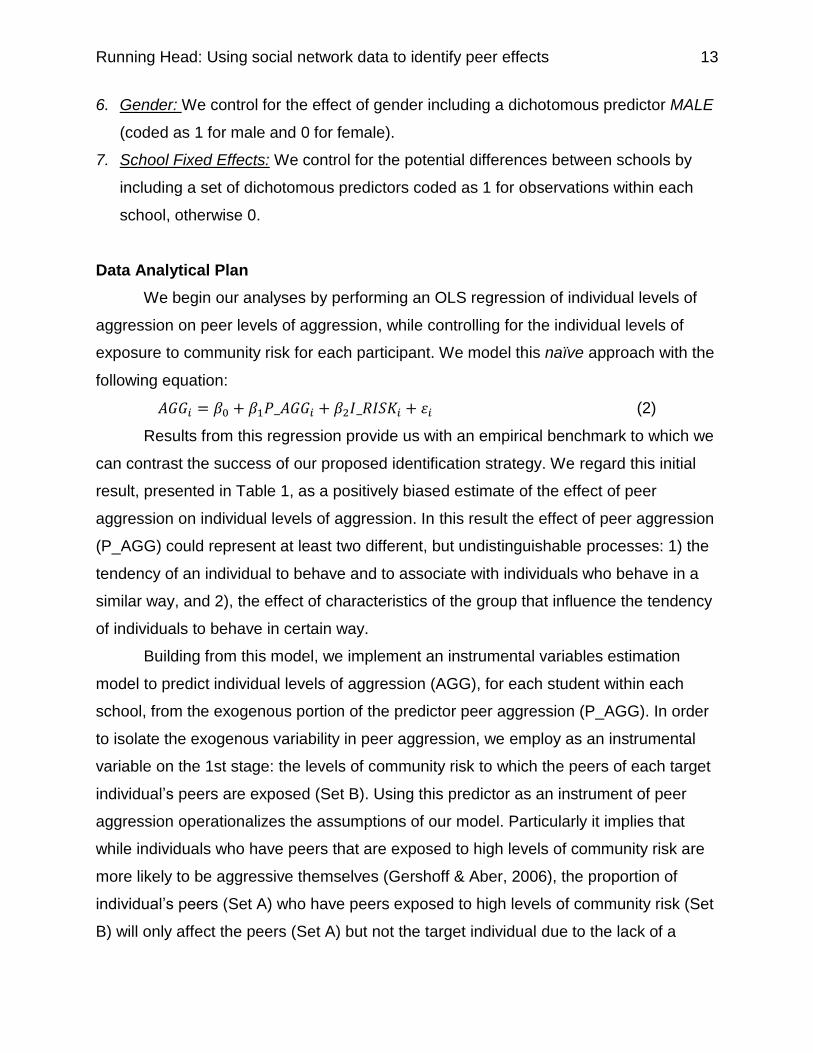
Data Analytical Plan
We begin our analyses by performing an OLS regression of individual levels of
aggression on peer levels of aggression, while controlling for the individual levels of
exposure to community risk for each participant. We model this naïve approach with the
following equation:
𝐴𝐺𝐺𝑖 = 𝛽0 + 𝛽1𝑃_𝐴𝐺𝐺𝑖 + 𝛽2𝐼_𝑅𝐼𝑆𝐾𝑖 + 휀𝑖 (2)
Results from this regression provide us with an empirical benchmark to which we
can contrast the success of our proposed identification strategy. We regard this initial
result, presented in Table 1, as a positively biased estimate of the effect of peer
aggression on individual levels of aggression. In this result the effect of peer aggression
(P_AGG) could represent at least two different, but undistinguishable processes: 1) the
tendency of an individual to behave and to associate with individuals who behave in a
similar way, and 2), the effect of characteristics of the group that influence the tendency
of individuals to behave in certain way.
Building from this model, we implement an instrumental variables estimation
model to predict individual levels of aggression (AGG), for each student within each
school, from the exogenous portion of the predictor peer aggression (P_AGG). In order
to isolate the exogenous variability in peer aggression, we employ as an instrumental
variable on the 1st stage: the levels of community risk to which the peers of each target
individual’s peers are exposed (Set B). Using this predictor as an instrument of peer
aggression operationalizes the assumptions of our model. Particularly it implies that
while individuals who have peers that are exposed to high levels of community risk are
more likely to be aggressive themselves (Gershoff & Aber, 2006), the proportion of
individual’s peers (Set A) who have peers exposed to high levels of community risk (Set
B) will only affect the peers (Set A) but not the target individual due to the lack of a
Running Head: Using social network data to identify peer effects 14
social relationship between students in Set B and each participant. We model these
relationships with the following equation using a two stage least square (2SLS)
estimation technique in Stata 12 (StataCorp, 2011).
1st Stage: 𝑃_𝐴𝐺𝐺𝑖 = 𝛼0 + 𝛼1𝐸_𝑅𝐼𝑆𝐾𝑖 + 𝛼2𝐼_𝑅𝐼𝑆𝐾𝑖 + 𝛿𝑙𝑖 (3)
2nd Stage: 𝐴𝐺𝐺𝑖 = 𝛽0 + 𝛽1𝑃_𝐴𝐺𝐺̂𝑖 + 𝛽2𝐼_𝑅𝐼𝑆𝐾𝑖 + 휀𝑙𝑖
Using this identification strategy we build a taxonomy of models. In our first
model, presented in table 2, we evaluate the empirical success of our modeling
strategy. In subsequent models we explore the change in the estimated effects of peer
aggression on individual levels of aggression as we introduce statistical controls to
isolate the effect of correlated features of the individuals and classrooms (Demographic
characteristics and structural features of the networks, presented in Model 2, Table 3).
In our final and preferred model specification (Model 3, Table 3) we introduce a set of
fixed effects for school as a way to control for observed variability in our outcome that is
associated to features of these environments. We interpret and discuss the results
obtained from Model 3 as the causal effects of the exogenous portion of peer
aggression – within schools – after controlling for individual and classroom level
covariates.
Results:
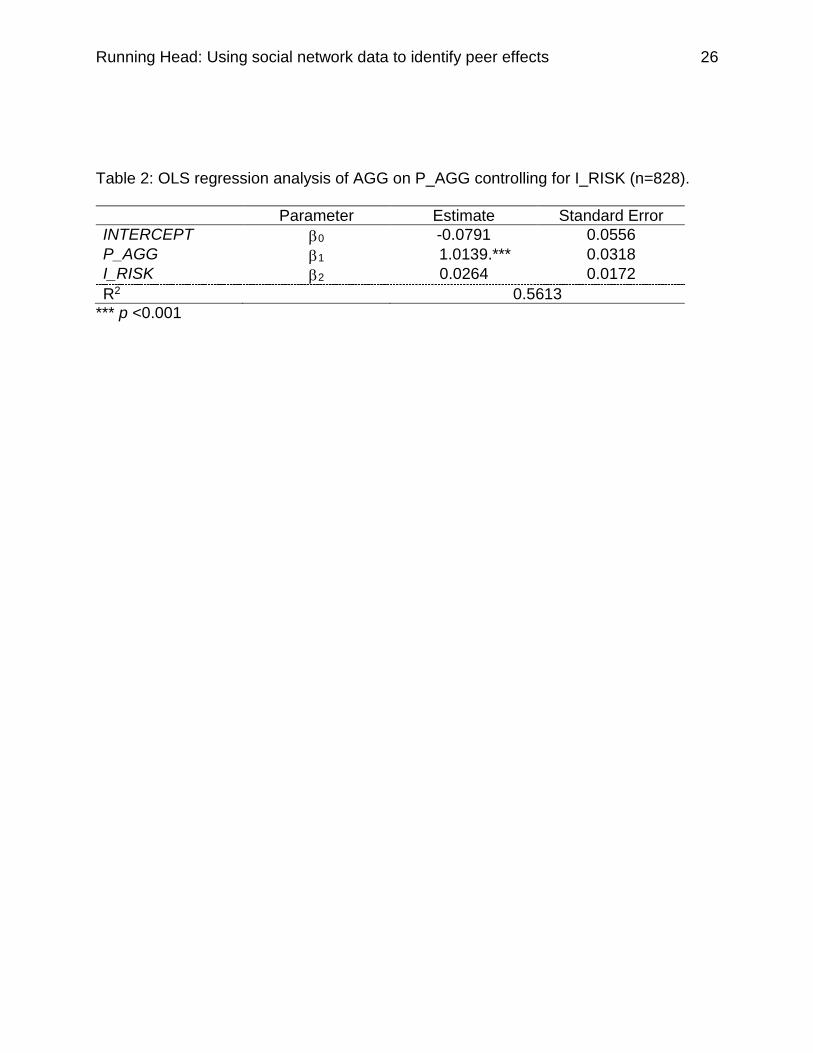
In table 2 we present the results of a naïve OLS regression that predicts
individual levels of aggression (AGGi) as a function of mean peer levels of aggression
(P_AGGi)12, after controlling for the individual levels of exposure to community risk
(I_RISKi). Of particular interest is the coefficient associated with the main predictor
P_AGGi that suggest that one unit difference in peer levels of aggression is associated
with 1.01 units in individual levels of aggression while controlling for the levels of
exposure to community risk of each participant. This result translates into a biased
12 Predictor P_AGG is constructed as the average aggression levels among all the peers who are directly
connected to each student. Set A. These scores are obtained from the following formula.
AGGi
iPi
ni
Running Head: Using social network data to identify peer effects 15
estimated effect size of 2.1 standard deviation units of individual levels aggression for
each standard deviation difference in peer levels of aggression.
Although the model and the estimated coefficients suggest a very precise
estimation of the variability in individual levels of aggression (S.E =0.03; RMSE =0.658),
several reasons discredit the internal validity of these results. Particularly, as discussed
before these estimates confound any potential source of systematic and endogenous
variation that could be attributed to 1) individual characteristics of the participants, 2)
features of the social structure of the classrooms, and 3) features of the schools.
In response to these threats to the internal validity of my inferences we employ
the instrumental variables estimation technique we described before. In table 3, we
present the results of the model that employs predictor E_RISK as an instrument of
P_AGGi.
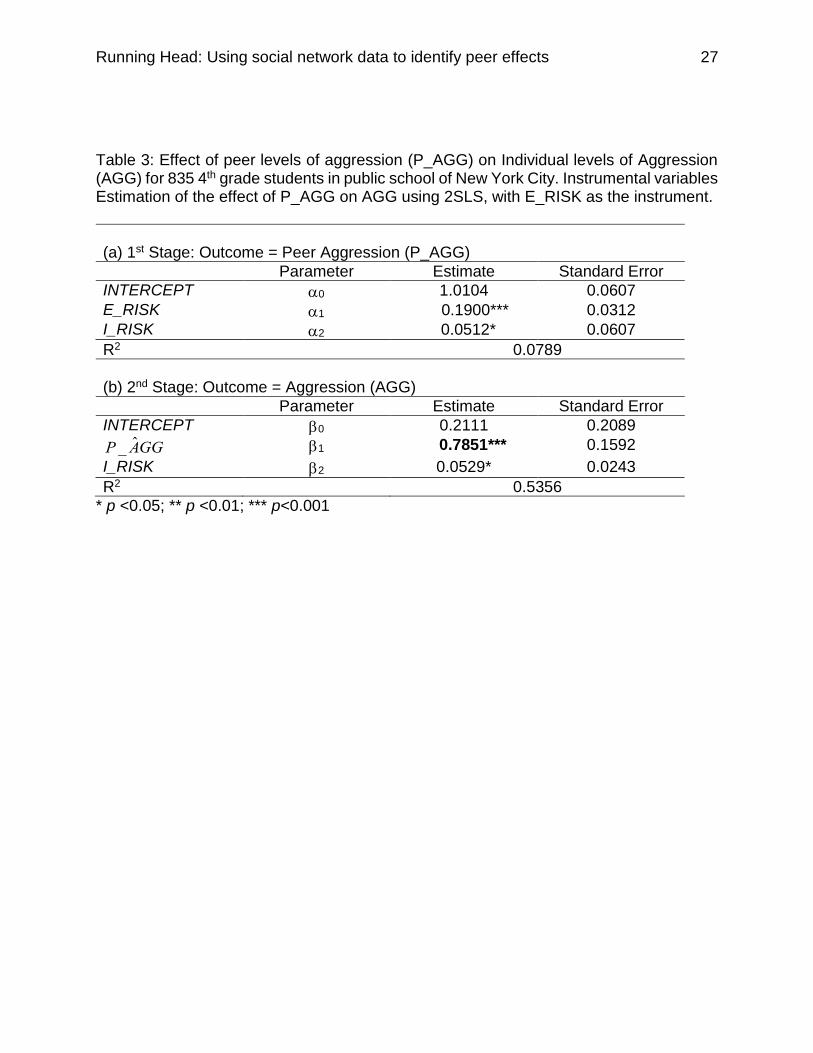
The upper portion of table 3 presents the results of the first stage model. These
results could be interpreted as the exogenous effect of average exposure to community
risk (for students in set B) on the average expression of aggression of students in Set A
(those who are directly connected to each Target individual in the second stage model).
Results from the first stage model suggest that E_RISKi is in fact a successful predictor
of peer levels of aggression, and that one unit difference in exposure to community risk
by the peers’ of each target student’s friends predicts a 0.19 unit difference in their
average level of aggression (Effect size =0.15). This regression slope is statistically
significantly different from zero (p<0.001) in the population. The associated F-statistic
(36.96, df=1) suggests that E_RISKi is a strong instrument of P_AGGi according to the
benchmarks suggested by Stock, Wright & Yogo (2002).
Similarly, the lower portion of table 3 presents the results of the second stage
model. In this model, the predicted levels of peer aggression – of students in Set A
(𝑃_𝐴𝐺𝐺)̂ – are used as the main predictor of individual levels of aggression for each
target student in the sample. The coefficient associated with this predictor suggests that
a one unit difference in peer levels of aggression has an estimated effect of 0.78 units
on individual levels of aggression. This result translates into an estimated effect size of
1.3 standard deviation units of individual levels of aggression for each standard
deviation difference in peer levels of aggression. Contrasting this new estimate against

Running Head: Using social network data to identify peer effects 16
the one obtained from a naïve OLS regression illustrates a reduction of almost 0.7
estimated standard deviation units in the magnitude of the association, at expense of an
increase on the standard errors of the coefficient by a factor of 5 (from 0.03 to 0.15).
Taken together, these results suggest that the instrumental variables method of
estimation successfully restricts the variability in predictor P_AGGi to only it’s
exogenous component, and that such exogenous portion of variability is in fact
systematically associated with individual levels of aggression, on average in the
population (p <0.001, CI 0.34 – 0.79).
Although the reduction in the estimated coefficient of 𝑃_𝐴𝐺𝐺𝑖 ̂ introduced by the
success of the instrumental variables estimation technique provides some support to
the internal validity of the inferences, there are still other potential threats to these
results. On one hand, one can argue that the magnitude of the coefficient (in the second
stage of the model) associated with 𝑃_𝐴𝐺𝐺̂ i is confounding the potential effect of
individual and classroom level characteristics that are likely to be associated with
individual levels of aggression due to potential correlated effects.
On the other hand, even after controlling for these observed characteristics
(results presented in column 1 of table 4) the estimated effect of peer levels of
aggression on individual levels of aggression is masking the effect of shared school-
wide environments that are associated with the individual display of aggression. To
address these concerns we present the results of two additional models that introduce
statistical controls for a set of individual and classroom covariates (model 2, table 4) and
for a set of fixed effects of school (model 3, table 4).
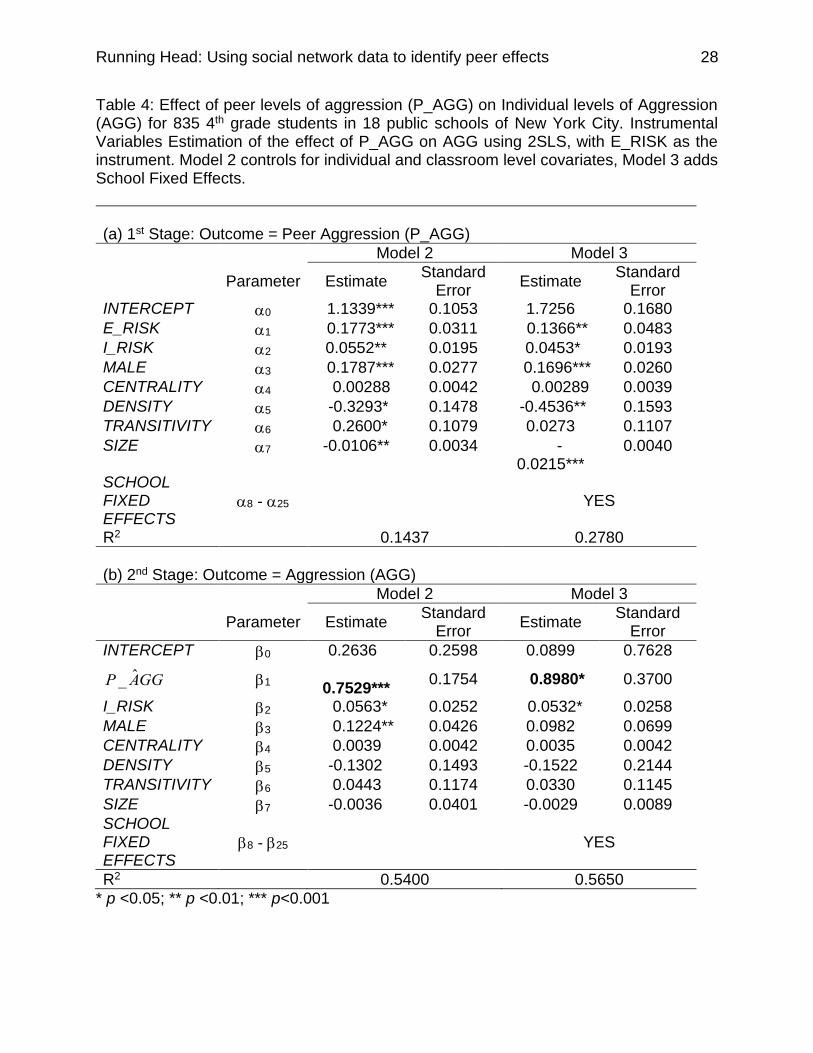
As suggested by the results of model 3 (table 4), after controlling for individual
and classroom level covariates and school fixed effects – at the two stages of the model
-, predictor E_RISKi is still a successful instrument for peer levels of aggression (p
=0.005, F1=8.00). Similarly, in the second stage of the model, the coefficient associated
with predictor 𝑃_𝐴𝐺𝐺𝑖̂ suggests a positive effect of peer aggression on individual levels
of aggression (coef. = 0.89, S.E.=0.37, p =0.01), after controlling for individual,
classroom and school covariates.
From Model 3, it is also worth noting that the coefficient of interest - 𝑃_𝐴𝐺𝐺̂𝑖𝑙 -
increases 0.10 estimated units from a model where no school fixed effects were
Running Head: Using social network data to identify peer effects 17
introduced (Model 2). This increment suggests that potential differences in individual
levels of aggression between schools where confounding the magnitude of the
estimates in Model 2. After controlling for differences, the effect of peer aggression on
individual levels of aggression is stronger.
From model 3, the effect of peer aggression on individual levels of aggression is
almost 1.5 standard deviations of individual levels of aggression. In other words, results
presented in model 3, suggest that “hanging out” with aggressive peers represents a
positive effect of almost 0.8 points in the aggressive behavior for students in 4th grade of
New York City Schools. From our current specification this effect is assumed to be
constant across individual levels of aggression.
Discussion
Although psychological and sociological theories have highlighted the role of
peers on the development of children and youth for several decades, only recently have
we been able to obtain the unbiased empirical estimates of these effects. This research
constitutes one such attempt to isolate the unique contribution of peers on the
expression of aggression among youth in an urban, high-risk context. Our results,
obtained from the implementation of an Instrumental Variables Estimation strategy,
suggest that “hanging out” with aggressive peers yields an increase of almost 1.5
standard deviation units in the teacher report of aggression for elementary school
students, in classrooms where more than 3 participants were evaluated, in the city of
New York.
While the estimates reported here provide some evidence for the causal effect of
peer aggression on individual expression of aggressive behavior, there are still some
limitations that challenge the internal and external validity of our results. First, the nature
of the social network data used in this research is non-directional13, and it is impossible
to distinguish different degrees of reciprocity in the relationships among peers. As
reported by Sijtsema et al. (2009) the stronger effect of peers on the expression of
aggression among adolescents is associated with those peers who have a reciprocal
relationship with each adolescent. Perhaps the large effect sizes we have reported in
13 Represented by a symmetric matrix.
Running Head: Using social network data to identify peer effects 18
this research are an artifact of the exclusive emphasis that we placed on unidirectional
relationships. Further research should address these differences in the report and
coding of the social relationships among students in the classroom. A direct alternative
to address these concerns is to replicate the estimated effects in a different sample.
Data collected as part of the National Longitudinal Study of Adolescent Health (Add
Health) could be central in attempts to replicate these results. According to Moody
(2001) these data includes both detailed and directed information on the structure of
social relationships of adolescents, as well as indicators of their aggressive behavior in
school.
A second limitation of this research is our reliance on a unique empirical
instrument for the identification of exogenous variation in peer aggression. While
previous literature has identified the exposure to community risk (see for example
Gershof & Aber, 2006) to be an important risk factor that leads to the expression of
aggression among elementary and middle school students, it might not be the only
exogenous source of variation that could influence the aggression levels of peers in this
study. Further research should consider how other exogenous sources of variation
could jointly explain the effect of peer aggression on the individual expression of
aggression. Similarly, it is important to extend the identification strategy employed in this
research to other behavioral and academic attributes of children that could influence
their subsequent development. As reported by Jones et al. (2011) the expression of
aggression is related to subsequent academic success and social adjustment among
youth. The work of Molano, Jones and Willett (under review) and Molano et al (2013)
presents these extensions while simultaneously estimating potential peer effects in
aggressive and prosocial behavior.
Finally, in terms of the external validity of my inferences, we have noted before
how empirical restrictions that we impose to our data limit the population to which my
results could be generalized. Particularly, the exclusion of participants with missing data
on the dependent variable introduces concerns about particular non-random patterns in
the process of missingness. In further research we will explore empirically these
potential mechanisms employing multiple imputation methods.
Running Head: Using social network data to identify peer effects 19
Despite these limitations, this paper constitutes an important addition to the
literature of peer effects in educational context; it provides evidence of how detailed
data on the structure of social relationships between classroom members could be
effectively used to address a set of identification problems. With the current prevalence
of theoretical conceptualizations of social relationships within schools and classrooms
as systems of multiple nested layers, and the increasing use of social network analysis
techniques, this paper represents one of the first attempts to establish a link between
the econometric literature that specializes in the estimation of causal effects, and the
applied developmental psychology literature specialized in discussing the role of social
relationships on positive youth development. Further research could use the methods
and estimates presented in this research to address additional questions about the
effect of peers on the expression of positive and risky behavior on important
developmental periods from early childhood to adolescence.
Running Head: Using social network data to identify peer effects 20
References
Aber, J.L., Brown, J.L., & Jones, S.M. (2004) Reading, writing, respect and resolution: The causal effects of a school-wide social-emotional learning and literacy intervention on teachers and children. William T. Grant Foundation.
Becker, G. (1993) Human Capital: A Theoretical and Empirical Analysis, with Special Reference to Education. 3rd Edition, Chicago, University of Chicago Press.
Boivin, M., Hymel, S., & Bukowski, W.M. (1995) The roles of social withdrawal, peer rejection, and victimization by peers in predicting loneliness and depressed mood in childhood. Development and Psychopathology, 7 . 765-785.
Bramulle, Y., Djebbari, H., & Fortin, B. (2009) Identification of peer effects through social networks. Journal of Econometrics. 150. 41-55.
Bronfenbrenner, U., The ecology of human development. 1979, Cambridge, MA: Harvard University Press.
Bronfenbrenner, U., & Morris, P.A. (1998). The ecology of developmental process. In W. Damon & R.M. Lerner (Eds.) Handbook of Child Psychology: Vol. 1. Theoretical models of human development. New York: Wiley.
Cairns, R. B., Perrin, J. E., & Cairns, B. D. (1985). Social structure and social cognition in early adolescence: Affiliative patterns. Journal of Early Adolescence. 5, 339–355.
Cairns, R.B., Cairns, B.D., Neckerman, H.J., Gest, S., & Gariepy, J.L. (1988) Social networks and aggressive behavior: Peer support or peer rejection? Developmental Psychology, 24, 813-823.
Cairns, R. B., Leung, M-C., Buchanan, L., & Cairns, B. D. (1995). Friendships and social networks in childhood and adolescence: Fluidity, reliability, and interrelations. Child Development. 66, 1330–1345.
Gershoff, E.T., & Aber, L. (2006) Neighborhoods and schools: Contexts and consequences for the mental health and risk behaviors of children and youth. In L. Balter and C. Tamis-LeMonda (Eds.), Child Psychology: A Handbook of Contemporary Issues (2nd ed.) (pp. 611-645). New York: Psychology Press/Taylor & Francis
Hansel, S. (1985) Adolescent friendship networks and distress in school. Social Forces, 63,3. 698-715
Hoxby, C. (2001) Peer effects in the classroom: Learning from gender and race variation. NBER working paper 7867. National Bureau of Economic Research.
Jones, S.M., Brown, J.L., & Aber, L. (2011) Two-year impacts of a universal school-based social-emotional and literacy intervention: An Experiment in transactional development research. Child Development, 82, 1. 533-554.
Jones, S.M., & Molano, A. (2009) The Influence of Schools on Adolescent Behavior and Risk-Taking. Paper presented at the Workshop on Understanding and Preventing Adolescent Risk Behavior: Integrating Findings across Domains of Influence. Board on Children, Youth and Families. Institute of Medicine/ National Research Council. Washington, D.C.
Kolaczyk, E., D. (2009) Statistical Analysis of Network Data. Methods and Models. New York. Springer Science+Business Media.
Lavy, V. & Scholosser, A. (2010) Mechanisms and impacts of gender peer effects at school. American Economic Journal: Applied Economics. 3. 1-33.
Running Head: Using social network data to identify peer effects 21
Lazarsfeld, P., and R.K. Merton. (1954). Friendship as a Social Process: A Substantive and Methodological Analysis. In Freedom and Control in Modern Society, Morroe Berger, Theodore Abel, and Charles H. Page, eds. New York: Van Nostrand, 18–66.
McPherson, M., Smith-Lovin, L., & Cook, J.M. (2001). Birds of a Feather: Homophily in Social Networks. Annual Review of Sociology. 27:415–44.
Manski, C. (1993) Identification of Endogenous Social Effects: The Reflection Problem. Review of Economic Studies. 60, 3. 531-542.
Magnusson, D., & Stattin, H. (1998). Person-context interaction theories. In W. Damon and R.M. Lerner (Eds.) Handbook of Child Psychology. Volume 1: Theoretical Models of Human Development. New York: Wiley.
Maughan, B., Pickles, A., Rowe, R., Costello, E. J., & Angold, A. (2000). Developmental trajectories of aggressive and nonaggressive conduct problems. Journal of Quantitative Criminology, 16, 199 –221.
Molano, A. Jones, S.M. & Willett, J.B. (2014) Peer Effects in the Elementary School Classroom: Socialization of Aggressive and Prosocial Behavior. Manuscript under review.
Molano, A., Jones, S. M., Brown, J., & Aber, J.L. (2013) Selection and socialization of aggressive and prosocial behavior: The Moderating Role of Social-Cognitive Processes. Journal of Research on Adolescence. 23, 3. 424-436.
Moody, J. (2001) Race, School Integration, and Friendship Segregation in America. American Journal of Sociology 107: 679-716
Murnane, R.J., & Willett, J.B. (2010) Methods Matter. Improving causal inference in educational and social science research. New York, Oxford University Press.
Nagin, D., & Tremblay, R. E. (1999). Trajectories of boys’ physical aggression, opposition, and hyperactivity on the path to physically violent and nonviolent juvenile delinquency. Child Development, 70, 1181–1196
Neidell, M. & Waldfogel, J. (2008) Cognitive and non-cognitive peer effects in early education. NBER working paper 14277, forthcoming, Review of Economics and Statistics.
Petras, H., Chilcoat, H., Leaf, P., Ialongo, N. & Kellam, S. (2004). The utility of teacher ratings of aggression during the elementary school years in identifying later violence in adolescent males. Journal of the American Academy of Child and Adolescent Psychiatry,1, 88-9
Tajfel, H. (1978). The social psychology of minorities. London: Minority Rights Group. Reynolds, C. R., & Kamphaus, R. W. (1998). Behavior Assessment System for Children
Manual. Circle Pines, MN: American Guidance Service, Inc. Sacerdote, B. (2001) Peer effects with random assignment: Results from Darthmouth
roommates. The Quarterly Journal of Economics. 116, 2. 681-704. Sameroff, A. J. (1995). General systems theories and developmental psychopathology.
In D. Cicchetti & D. J.Cohen (Eds.), Developmental psychopathology, Vol. 1: Theory and methods. New York: Wiley.
Shinn, M., & Yoshikawa, H. (2008). Toward positive youth development: Transforming schools and community programs. New York: Oxford University Press.
Sijtesma, J.J., Ojanen, T., Veenstra, R., Lindenberg, S., Hawley, P.H., & Little, T.D. (2010) Forms and functions of aggression in adolescent friendship selection and
Running Head: Using social network data to identify peer effects 22
influence: A longitudinal social network analysis. Social Development, 19,3. 515-534
Neal, J.W. (2008). Kracking the missing data problem: Applying Krackhardt’s cognitive social structures to school-based social network research. Sociology of Education, 81, 140-162.
Wasserman & Faust (1994) Social Network Analysis. Methods and Applications. New York: Cambridge University Press.
Running Head: Using social network data to identify peer effects 23
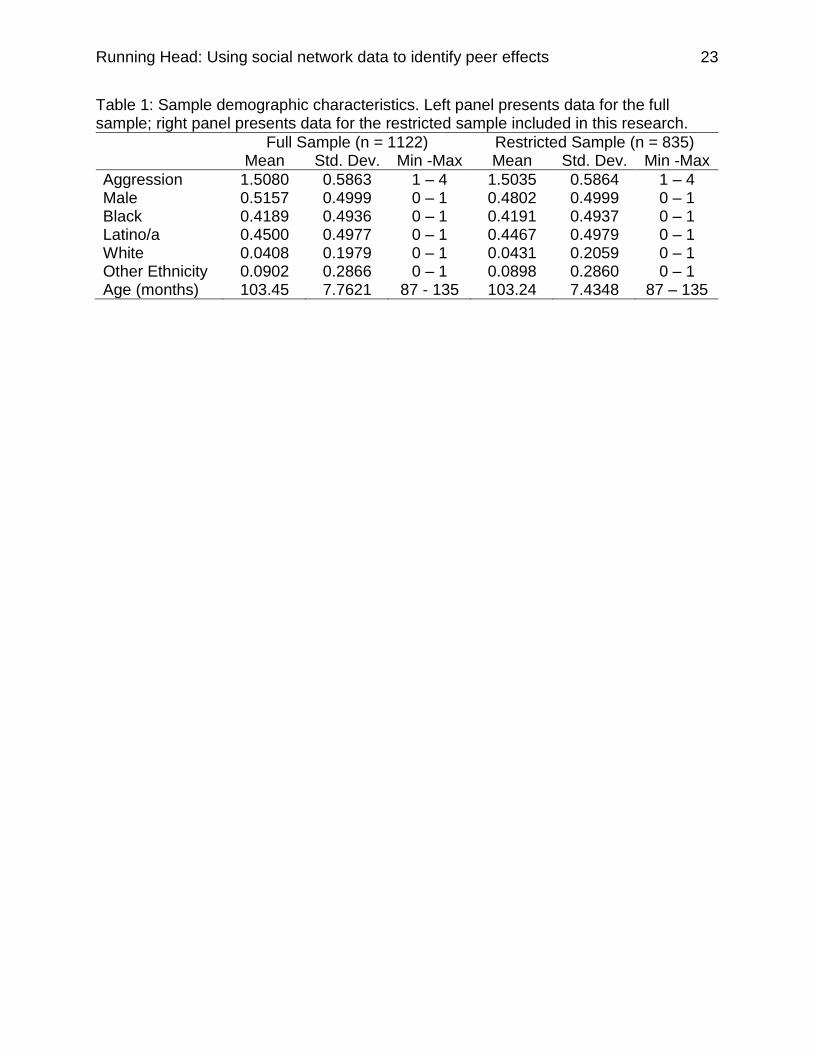
Table 1: Sample demographic characteristics. Left panel presents data for the full sample; right panel presents data for the restricted sample included in this research.
Full Sample (n = 1122) Restricted Sample (n = 835) Mean Std. Dev. Min -Max Mean Std. Dev. Min -Max
Aggression 1.5080 0.5863 1 – 4 1.5035 0.5864 1 – 4 Male 0.5157 0.4999 0 – 1 0.4802 0.4999 0 – 1 Black 0.4189 0.4936 0 – 1 0.4191 0.4937 0 – 1 Latino/a 0.4500 0.4977 0 – 1 0.4467 0.4979 0 – 1 White 0.0408 0.1979 0 – 1 0.0431 0.2059 0 – 1 Other Ethnicity 0.0902 0.2866 0 – 1 0.0898 0.2860 0 – 1 Age (months) 103.45 7.7621 87 - 135 103.24 7.4348 87 – 135
Running Head: Using social network data to identify peer effects 24
Figure 1: Simulated social network for 10 actors based on mean of density and transitivity parameters in the observed data. On the left, binary and symmetric socio-matrix representing the incidence of perceived relationships among actors in the classroom. Cell values of 1 indicate the existence of a relationship –from the perspective of peers in the classroom -, cell values of 0 indicate the lack of relationship. Empty diagonal represents the lack of reported self-relationships in these data. On the right, a network rendition of the simulated socio-matrix in the left. Actors are represented by a node (square or circle). Relationships among actors (cell value of 1 in the socio-matrix) are represented by a line connecting two nodes. Size of the nodes represents eigenvector centrality for each node. Colors have been randomly assigned.
Running Head: Using social network data to identify peer effects 25
Figure 2: Two sets of peers identified for each student form a classroom network. Panel in the upper left corner reproduces the classroom network for 10 actors introduced in Figure 1. Upper right panel illustrates the personal network of student B – defined as all the peers who are directly connected to student B – extracted from the original classroom network. Lower panel illustrates set B – defined as the peers who are connected to student B’s peer but who are not directly connected to student B – extracted from the original classroom network. Student D in the lower panel – yellow square – represent a classroom member who is connected to a peer of student B, but who is not directly connected to student B. Predictor E_RISK is calculated as the mean value of exposure of community risk from classroom members who satisfy the conditions illustrated for student D – in relation to student B. Predictor P_AGG is calculated as the mean value of aggression from students satisfying the conditions of Set A.
Running Head: Using social network data to identify peer effects 26
Table 2: OLS regression analysis of AGG on P_AGG controlling for I_RISK (n=828).
Parameter Estimate Standard Error
INTERCEPT 0 -0.0791 0.0556
P_AGG 1 1.0139.*** 0.0318
I_RISK 2 0.0264 0.0172
R2 0.5613
*** p <0.001
Running Head: Using social network data to identify peer effects 27
Table 3: Effect of peer levels of aggression (P_AGG) on Individual levels of Aggression (AGG) for 835 4th grade students in public school of New York City. Instrumental variables Estimation of the effect of P_AGG on AGG using 2SLS, with E_RISK as the instrument.
(a) 1st Stage: Outcome = Peer Aggression (P_AGG)
Parameter Estimate Standard Error
INTERCEPT 0 1.0104 0.0607
E_RISK 1 0.1900*** 0.0312
I_RISK 2 0.0512* 0.0607
R2 0.0789
(b) 2nd Stage: Outcome = Aggression (AGG)
Parameter Estimate Standard Error
INTERCEPT 0 0.2111 0.2089
1 0.7851*** 0.1592
I_RISK 2 0.0529* 0.0243
R2 0.5356
* p <0.05; ** p <0.01; *** p<0.001
P _ ˆ A GG
Running Head: Using social network data to identify peer effects 28
Table 4: Effect of peer levels of aggression (P_AGG) on Individual levels of Aggression (AGG) for 835 4th grade students in 18 public schools of New York City. Instrumental Variables Estimation of the effect of P_AGG on AGG using 2SLS, with E_RISK as the instrument. Model 2 controls for individual and classroom level covariates, Model 3 adds School Fixed Effects.
(a) 1st Stage: Outcome = Peer Aggression (P_AGG)
Model 2 Model 3
Parameter Estimate
Standard Error
Estimate Standard
Error INTERCEPT 0 1.1339*** 0.1053 1.7256 0.1680
E_RISK 1 0.1773*** 0.0311 0.1366** 0.0483
I_RISK 2 0.0552** 0.0195 0.0453* 0.0193
MALE 3 0.1787*** 0.0277 0.1696*** 0.0260
CENTRALITY 4 0.00288 0.0042 0.00289 0.0039
DENSITY 5 -0.3293* 0.1478 -0.4536** 0.1593
TRANSITIVITY 6 0.2600* 0.1079 0.0273 0.1107
SIZE 7 -0.0106** 0.0034 -0.0215***
0.0040
SCHOOL FIXED EFFECTS
8 - 25 YES
R2 0.1437 0.2780
(b) 2nd Stage: Outcome = Aggression (AGG)
Model 2 Model 3
Parameter Estimate
Standard Error
Estimate Standard
Error
INTERCEPT 0 0.2636 0.2598 0.0899 0.7628
1
0.7529*** 0.1754 0.8980* 0.3700
I_RISK 2 0.0563* 0.0252 0.0532* 0.0258
MALE 3 0.1224** 0.0426 0.0982 0.0699
CENTRALITY 4 0.0039 0.0042 0.0035 0.0042
DENSITY 5 -0.1302 0.1493 -0.1522 0.2144
TRANSITIVITY 6 0.0443 0.1174 0.0330 0.1145
SIZE 7 -0.0036 0.0401 -0.0029 0.0089
SCHOOL FIXED EFFECTS
8 - 25 YES
R2 0.5400 0.5650
* p <0.05; ** p <0.01; *** p<0.001
P _ ˆ A GG