The Case of Single European Sky and Emissions Trading
564
Challenges in Aviation Governance: Implementation of Single European Sky and EU Emissions Trading Scheme MARINA EFTHYMIOU A thesis submitted in partial fulfilment of the requirements of The University of West London for the degree of Doctor of Philosophy in Aviation Management October 2016
-
Upload
khangminh22 -
Category
Documents
-
view
4 -
download
0
Transcript of The Case of Single European Sky and Emissions Trading

Challenges in Aviation Governance:
Implementation of Single European Sky and EU Emissions Trading Scheme
MARINA EFTHYMIOU
A thesis submitted in partial fulfilment of the requirements of The University of West London for the degree of Doctor of Philosophy in Aviation Management
October 2016

This PhD thesis may be cited as follows:
Efthymiou, M. (2016). Challenges in Aviation Governance: Implementation of Single
European Sky and EU Emissions Trading Scheme. PhD thesis, University of West
London.

iii
Dedication:
Στον Ανδρέα και
σε όλους τους ανθρώπους
που με βοήθησαν να βρω αλλά και να χάσω τον δρόμο μου.

This page is intentionally left blank

v
ACKNOWLEDGEMENTS
Undertaking this PhD has been a life-changing experience and it would not have been
possible without my advisor and mentor Professor Dr Andreas Papatheodorou. I would like
to thank him for his support and patience.
I gratefully acknowledge the support I received from the highly esteemed experts of
EUROCONTROL and especially from the Support to States and Regional Activities Unit of
Directorate of Pan-European Sky. They have helped me understand the various topics and
I feel obliged for what I learned from them.
I would like to express my special appreciation and thanks to all the experts that
participated in my research. Without their help, it would not have been possible to
undertake research on this topic. I would like to thank the Business School of the
University of Aegean, Greece for providing me a place to work during my first year of the
PhD thesis. The support from different experts and individuals during the last three years
of my PhD studies was also very valuable. Among others, I would like to thank Paraskevas
Korfiatis, Juan Vázquez-Sanz, Dr Chris Markou, Hoang Vu Duc, Dr Cathal Guiomard, Dr
Frédéric Dobruszkes, Prof. Frank Fichert, Prof Alexandros Paraskevas, Dr John
Paravantis and the scholars of the German Aviation Research Society (GARS).
Finally, I would like to thank the members of my family and all the people that were or are
part of my life for their support in its various periods.
Marina Efthymiou,
October 2016
.

This page is intentionally left blank

vii
ABSTRACT
Traffic growth, capacity constraints, climate change and the necessity to develop a more
cost efficient system led to an ambitious initiative to reform the architecture of airspace
management. This initiative, launched by the European Commission (EC), is called Single
European Sky (SES). The four Key Performance Areas (KPAs) of SES are environment;
cost efficiency; capacity; and safety. In the environment KPA Performance Indicators for
Air Navigation Services Providers (ANSPs) are established to ensure that improvement in
sustainability is achieved. In addition, aviation is included in the European Union’s
Emission Trading Scheme (EU ETS): the EC sets limits on CO2 emissions and provides
economic incentives to airlines to reduce emissions by establishing a market-based
trading system. EU-ETS can be used to simultaneously promote economic efficiency and
achieve environmental goals on a sustainable basis.
The PhD research examines the existence of cancel-out effects between supply-led, i.e.
SES, and demand-led management, i.e. EU ETS, policies by following a holistic approach.
Environmental economics theory and industrial economics are applied to identify factors
that have a significant influence on the two policies. Interestingly, and in spite of common
objectives, the two schemes are governed by different bodies, which may fail to streamline
their communication process. Hence, the PhD thesis also addresses the issue of
governance and its possible failure regarding the full implementation and efficiency of the
schemes.
From a methodological perspective, Delphi is conducted in two rounds to encapsulate
policy complexity at an in-depth level. The target population comprises stakeholders
involved in SES and EU ETS. To select candidates purposive and snowball sampling was
used. Thus, the sample consists of 39 senior managers/experts from Civil Aviation
Authorities; ANSPs; aviation-related organisations and institutions; and airlines.

viii
Based on the results of the Delphi and building on its theoretical background, the PhD
thesis then develops a conceptual model to address governance failure, thus effectively
linking supply- to demand-oriented aviation policies in a holistic manner.
Key words: Single European Sky, Emissions Trading Scheme, Air Navigation Service
Provider, Performance Indicators in aviation, Aviation Policy and Governance

ix
TABLE OF CONTENTS
ABSTRACT ....................................................................................................................... vii
TABLE OF CONTENTS ..................................................................................................... ix
TABLE OF FIGURES ....................................................................................................... xiii
TABLE OF TABLES.......................................................................................................... xv
ACRONYMS AND ABBREVIATIONS .............................................................................. xix
1 Introduction ................................................................................................................. 1
1.1 Rationale of the research ........................................................................................ 2
1.2 Research Aim and Research Questions ................................................................. 9
1.3 Research Context ................................................................................................. 11
1.4 Research undertaken in aviation and the environment and research gap ............ 18
1.5 PhD Thesis Layout ............................................................................................... 23
2 Sustainable Aviation ................................................................................................. 27
2.1 Sustainable Growth of Civil Aviation ..................................................................... 27
2.2 Negative external economies ............................................................................... 29
2.3 Principal Environmental issues in aviation ............................................................ 38
2.3.1 Greenhouse Gases ....................................................................................................... 39
2.3.2 Noise Pollution and Local Air Quality ........................................................................... 42
2.4 Measuring environmental impact .......................................................................... 45
2.5 Fuel ....................................................................................................................... 49
2.5.1 Biofuels ......................................................................................................................... 52
2.6 Summary .............................................................................................................. 56
3 EU Emissions Trading Scheme in aviation ............................................................. 57
3.1 Kyoto Protocol and European Union ..................................................................... 57

x
3.2 EU Emissions Trading Scheme inclusion of Aviation ............................................ 62
3.3 Principles of carbon offsetting ............................................................................... 69
3.4 Trading Units and carbon prices ........................................................................... 71
3.5 Auction of Allowances and airlines’ decisions making .......................................... 75
3.6 Calculation of carbon dioxide emissions by ICAO ................................................ 85
3.7 Monitoring, Reporting and Verification .................................................................. 89
3.8 Carbon Leakage ................................................................................................... 93
3.9 Different Carbon offsetting programs .................................................................... 96
3.9.1 ICAO and the environment .......................................................................................... 98
3.9.2 Voluntary carbon offsetting ....................................................................................... 101
3.9.3 Examples of other ETS outside of Europe .................................................................. 102
3.10 Linking Emissions Trading Schemes .................................................................. 104
3.11 Summary ............................................................................................................ 106
4 Single European Sky ............................................................................................... 107
4.1 The Single European Sky concept ...................................................................... 108
4.2 Functional Airspace Blocks ................................................................................. 110
4.3 Charges for the ANS provision ........................................................................... 119
4.4 The economics of Air Transport Management .................................................... 124
4.5 Economic regulation of Air Navigation Services ................................................. 133
4.6 Performance ....................................................................................................... 153
4.6.1 KPA: Safety ................................................................................................................. 155
4.6.2 KPA: Capacity ............................................................................................................. 155

xi
4.6.3 KPA: Cost-Efficiency ................................................................................................... 156
4.6.4 KPA: Environment ...................................................................................................... 157
4.7 Summary ............................................................................................................ 173
5 Elaborations from Literature Review and Experts Consultation......................... 175
5.1 Multi-stakeholder Analysis and Management ..................................................... 176
5.2 Transaction Cost Economics theory and externalities ........................................ 180
5.2.1 Transaction Costs Categories in EU ETS and SES ....................................................... 187
5.3 Summary ............................................................................................................ 193
6 Research methodology ........................................................................................... 195
6.1 Research philosophy .......................................................................................... 195
6.2 Data collection techniques .................................................................................. 198
6.2.1 Participant Observation ............................................................................................. 200
6.2.2 Delphi Method ........................................................................................................... 202
6.3 Design of the instrument ..................................................................................... 207
6.3.1 Questionnaires design and Pilot Survey .................................................................... 209
6.3.2 Target participants and sample ................................................................................. 213
6.4 Ethical considerations ......................................................................................... 216
6.5 Limitations of the research .................................................................................. 219
6.6 Summary ............................................................................................................ 220
7 The findings of the Delphi Method ......................................................................... 223
7.1 First round of the Delphi Method ......................................................................... 223
7.1.1 The EU Emissions Trading Scheme Questionnaire descriptive analysis .................... 225
7.1.2 The Single European Sky (FABs) Questionnaire descriptive analysis......................... 231

xii
7.2 Second round of Delphi Method ......................................................................... 238
7.2.1 The EU Emissions Trading Scheme Questionnaire descriptive analysis (2nd round) . 241
7.2.2 The Single European Sky Questionnaire descriptive analysis (2nd round) ................. 247
7.2.3 Comparison of the common questions of SES and EU ETS Questionnaires ............ 254
7.2.4 Cross Tabulation of SES and EU ETS questionnaires (2nd round) ............................... 256
7.3 Summary ............................................................................................................ 296
8 Discussion ............................................................................................................... 299
8.1 Aviation Governance .......................................................................................... 299
8.1.1 Member States Readiness ......................................................................................... 300
8.1.2 Incentive Scheme ....................................................................................................... 311
8.1.3 Trade-offs between the KPAs .................................................................................... 312
8.2 Multi-Stakeholder Governance in Aviation .......................................................... 314
8.2.1 The Positions of the Stakeholders ............................................................................. 316
8.2.2 The level of influence and interest ............................................................................ 321
8.2.3 The group/coalition of stakeholders .......................................................................... 327
8.3 Summary ............................................................................................................ 329
9 Conclusion ............................................................................................................... 331
9.1 Conclusion for EU ETS and SES ........................................................................ 331
9.2 Contribution of the PhD thesis to the body of existing knowledge ...................... 333
9.2.1 Contribution to the policy makers and the aviation practitioners ............................ 335
9.2.2 Contribution to the methodology theory .................................................................. 360
9.3 Conclusions for the Research Questions ............................................................ 361
9.4 Limitations of the PhD Thesis ............................................................................. 370

xiii
9.5 Directions for further research ............................................................................ 371
Reference List ................................................................................................................ 373
Appendices ........................................................................................................................ 1
Appendix 1: Definitions of key terms and concepts .......................................................... 1
Appendix 2: Key features of the EU ETS for aviation (EC, 2013:16) ................................ 1
Appendix 3: DANUBE FAB Performance Plan (Draft version) ......................................... 1
Appendix 4: Pilot Survey questionnaire ............................................................................ 1
Appendix 5: 1st round Questionnaire: EU ETS and Aviation ............................................. 1
Appendix 6: 1st round Questionnaire: SES/FABs and the Environment .......................... 1
Appendix 7: 2nd round Questionnaire: EU ETS and Aviation ............................................ 1
Appendix 8: 2nd round Questionnaire: SES/FABs and the Environment ........................... 1
Appendix 9: Permission to use copyright material ............................................................ 1
TABLE OF FIGURES
Figure 1: Estimated regional share of CO2 from international aviation in 2020 without a regulatory
intervention (Based on ICAO Doc 10018, 2013) .................................................................................. 4
Figure 2: The performance tree (Source: Adapted from Lebas, l995 (Neely, 2004: 69) ..................... 7
Figure 3: Air Navigation Services categories ...................................................................................... 15
Figure 4: Implementing tax to correct the impact of negative externalities ..................................... 33
Figure 5: Market for pollution permits .............................................................................................. 35
Figure 6: Functions of the marginal cost of reducing pollution for two airlines ............................... 38
Figure 7: Sectoral GHG emissions by IPCC sector (EEA, 2016)........................................................... 41
Figure 8: World population exposed to noise exceeding 55DNL (ICAO, 2013a) ............................... 43
Figure 9: Changes in the proportion of CO2 emissions from EU and World international aviation
and total CO2 emissions from all the industries (Data based in IEA statistics, 2015) ....................... 48
Figure 10: The stages of a flight (Emission Inventory Guidebook, 2001) .......................................... 50

xiv
Figure 11: Emission calculation procedure of carbon dioxide from the ICAO (2014b) ..................... 86
Figure 12 The compliance cycle of EU ETS ......................................................................................... 91
Figure 13: The geographical scope of FABs (EUROCONTROL, 2016a) ............................................. 112
Figure 14: Traffic complexity scores (EUROCONTROL, 2016a: 13) .................................................. 115
Figure 15: Average annual flight growth 2014-2021 per state (EUROCONTROL, 2015a) ............... 117
Figure 16 Average Annual Growth per FAB, 2021 v 2014 (EUROCONTROL, 2015a) ....................... 118
Figure 17: Drivers for ANSP cooperation (Singh, 2011: 343) ........................................................... 128
Figure 18: Price and Quantity in monopoly market ......................................................................... 131
Figure 19: Economies of scale versus subadditivity ......................................................................... 132
Figure 20: PRU Framework for Cost Effectiveness Analysis (PRU, 2004: vii) ................................... 141
Figure 21: Example of regulated ANSP under uncertainty (Train, 1991: 102) ................................ 149
Figure 22: Evolution of horizontal flight efficiency (actual and flight plan) (2008-2015) (FAA and
EUROCONTROL, 2016) ..................................................................................................................... 161
Figure 23: The planning process of an optimized Flight Plan Routing (ICAO Doc 030, 2013) ......... 162
Figure 24 General CDO concept (EUROCONTROL, 2011a: 2) .......................................................... 165
Figure 25: Use of CDRs (EUROCONTROL, 2013: 22) ........................................................................ 168
Figure 26: Conditional Routes (CDR) during one peak day .............................................................. 168
Figure 27: Free Route Airspace Implementation 2014-2019 (NM, 2015) ....................................... 171
Figure 28: The research onion (Saunders et al., 2015) .................................................................... 196
Figure 29: The Research Journey ..................................................................................................... 208
Figure 30: Connection between SES (FABs) and EU ETS (1st round of EU ETS Q) ............................ 231
Figure 31: Connection between SES (FABs) and EU ETS (1st round of SES Q).................................. 238
Figure 32: The Global Competitiveness Index framework (WEF, 2015) .......................................... 301
Figure 33: Comparison of the Netherlands with the advanced economies in the 12 pillars of GCI (1:
low score and 7: high score) (WEF, 2015: 276)................................................................................ 303
Figure 34: The most problematic factors for doing business in the Netherlands (WEF, 2015) ...... 304
Figure 35: The main National Stakeholders involved in ATM in the Netherlands (LSSIP the
Netherlands, 2015) .......................................................................................................................... 305
Figure 36: The most problematic factors for doing business in Greece (WEF, 2015) ..................... 306
Figure 37: Comparison of Greece with the advanced economies in the 12 pillars of GCI (1: low
score and 7: high score) (WEF, 2015: 276) ...................................................................................... 306
Figure 38: The main National Stakeholders involved in ATM in Greece (LSSIP Greece, 2015) ....... 308

xv
Figure 39: Comparison of Greece and The Netherlands(1: low score and 7: high score) (created by
the author based on WEF, 2015) ..................................................................................................... 309
Figure 40: Two alternative routes between Milan and Brindisi ...................................................... 314
Figure 41: Aeronautical data chain stakeholders (Dutch Ministry of Infrastructure and the
Environment, 2013:7) ...................................................................................................................... 315
Figure 42: Multi-stakeholder theory of governance in aviation (based on Schwab and WEF, 2007)
.......................................................................................................................................................... 316
Figure 43: The biofuel journey from production to consumption (Source: own elaboration) ....... 337
Figure 44: EU ETS and other policies for carbon neutral growth (source: own elaboration) ......... 356
Figure 45: Problems and recent interventions in aviation (source: own elaboration) ................... 357
Figure 46: Aviation Policies for Environment (source: own elaboration) ........................................ 363
TABLE OF TABLES
Table 1: Research about Aviation and the environment ................................................................... 18
Table 2: CO2 emissions from EU and World international aviation and total CO2 emissions from all
the industries (IEA statistics, 2015) .................................................................................................... 48
Table 3: The four phases of the Kyoto Protocol ................................................................................ 60
Table 4: A comparison of CERs and VERs (IATA, 2008a) .................................................................... 72
Table 5 Cost of purchasing allowances in EU ETS (IATA, 2013b) ....................................................... 74
Table 6 German early auctions of the third trading period (Early Auctions) and the EUAA auction of
2012 (DEHSt, 2012) ............................................................................................................................ 78
Table 7: EUAA auction in 2012 (EEX, 2012) ....................................................................................... 78
Table 8: EUAAs Spot Primary Market Auction Report 2015 (EEX, 2016) ........................................... 79
Table 9: Some project types (IATA, 2008a) ........................................................................................ 97
Table 10: US/EUROPE Key ATM System Figures (EUROCONTROL and FAA, 2013) ......................... 107
Table 11: Functional Airspace Blocks ............................................................................................... 113
Table 12: Cost-bases and national unit rates for 2016 (EUROCONTROL, 2016c) ............................ 123
Table 13: Organisation and Corporate arrangements of the ECAA states (Efthymiou et al, 2016) 137
Table 14: Price cap versus rate of return regulation (Armstrong and Sappington, 2007:1608) ..... 150
Table 15: Estimated ANS-related impact on fuel burn and CO2 emissions savings
(EUROCONTROL/Performance Review Commission, 2015) ............................................................ 159

xvi
Table 16: Power-Interest Matrix (Johnson and Scholes, 2010; Olander, 2007) .............................. 179
Table 17: Transaction costs categories for policymakers/regulators emerging from the
Performance scheme regarding the KPA of environment (Source: own elaboration).................... 188
Table 18: Transaction costs categories for airlines deriving from the inclusion of aviation in EU ETS
(Source: own elaboration) ............................................................................................................... 190
Table 19: Transaction costs categories for policy makers/regulators deriving from the inclusion of
aviation in EU ETS (Source: own elaboration) ................................................................................. 191
Table 20: Use of Delphi method ...................................................................................................... 204
Table 21: The Research Validation Strategies followed by the researcher (based on Creswell, 2012)
.......................................................................................................................................................... 218
Table 22: Q1 Position of participants on EU ETS (1st round EU ETS Q) ............................................ 226
Table 23: Question about the impact of different allowance allocation methods (1st round EU ETS
Q) ...................................................................................................................................................... 228
Table 24: Ideal allocation method (1st round EU ETS Q) .................................................................. 228
Table 25: Factors to be considered for linking different ETSs (1st round EU ETS Q) ....................... 229
Table 26: Factors leading to carbon neutral growth (1st round EU ETS Q) ...................................... 230
Table 27: Areas benefitted from the establishment of FABs (1st round SES Q) .............................. 232
Table 28: Position of participants on SES and the environment (1st round SES Q) ......................... 233
Table 29: Factors affecting horizontal en route flight efficiency (1st round SES Q) ......................... 234
Table 30: Factors affecting the Civil Military cooperation (1st round SES Q) .................................. 235
Table 31: Factors contributing to emissions’ reduction (1st round SES Q) ...................................... 235
Table 32: Factors leading to carbon neutral growth (1st round SES Q) ........................................... 236
Table 33: Q1 Position of participants on EU ETS (2nd round EU ETS Q) ........................................... 242
Table 34: Ideal allocation method (2nd round EU ETS Q) ................................................................. 243
Table 35: Factors to be considered for linking different ETSs (2nd round EU ETS Q) ....................... 244
Table 36: Factors leading to carbon neutral growth (2nd round EU ETS Q) ..................................... 245
Table 37: Transaction costs categories (2nd round EU ETS Q) ......................................................... 246
Table 38: Areas benefitted from the establishment of FABs (2nd round SES Q) ............................. 247
Table 39: Position of participants on SES and the environment (2nd round SES Q) ........................ 248
Table 40: Factors affecting horizontal en route flight efficiency (2nd round SES Q) ........................ 250
Table 41: Factors affecting the Civil Military cooperation (2nd round SES Q) .................................. 251
Table 42: Factors contributing to emissions’ reduction (2nd round SES Q) ..................................... 252
Table 43: Factors leading to carbon neutral growth (2nd round SES Q) .......................................... 253

xvii
Table 44: Transaction costs categories (2nd round SES Q) ............................................................... 254
Table 45: Differences of EU ETS and SES questionnaire participants of opinions about the factors
leading to carbon neutral growth .................................................................................................... 255
Table 46: Crosstab Groups positions on EU ETS .............................................................................. 260
Table 47: Crosstab Groups points on allocation methods ............................................................... 265
Table 48: Crosstab Groups opinion on factors to be considered for linking different ETSs ............ 266
Table 49: Crosstab Groups and factors leading to carbon neutral growth ..................................... 268
Table 50: Crosstab Groups and Transaction Cost categories .......................................................... 271
Table 51: Crosstab Groups and importance of transaction costs .................................................... 274
Table 52: Crosstab Areas benefitted from the establishment of FABs and Groups ........................ 274
Table 53: Crosstab Position of participants on SES and the environment and Groups................... 279
Table 54: Crosstabs Factors affecting horizontal en route flight efficiency and Groups ................ 281
Table 55: Crosstabs Factors affecting the Civil Military cooperation and Groups .......................... 284
Table 56: Crosstab Factors contributing to emissions’ reduction and Groups ............................... 287
Table 57: Crosstab Factors leading to carbon neutral growth and Groups ..................................... 291
Table 58: Crosstab Transaction Costs in SES and Groups ................................................................ 294
Table 59: Sustainable Growth Sub-index in the 2014 Edition and Global Competitiveness Index
2015–2016 (based on WEF, 2014; WEF, 2015) ................................................................................ 301
Table 60: Environment KPI #1: Horizontal en-route flight efficiency [%] (NM, 2016)..................... 309
Table 61: Power-Interest Matrix of SES (blue bubbles) and EU ETS (red bubbles) (source: own
elaboration) ...................................................................................................................................... 322

This page is intentionally left blank

xix
ACRONYMS AND ABBREVIATIONS
A4A Airlines of America
AAIASB Air Accident Investigation and Aviation Safety Board
AAUs Assigned Amount Units
ACC Area Control Centre
ACCRI Aviation Climate Change Research Initiative
A-CDM Airport Collaborative Decision Making
ACE ATM Cost-Effectiveness Benchmarking Reports
ACR American Carbon Registry
ADS-B Automatic Dependent Surveillance – Broadcast
AEA Association of European Airlines
AER Annual Emissions Report
AGE Aviation-Grade Ethanol
AIC Aeronautical Information Circulars
AIM Aeronautical Information Management
AIP Aeronautical Information Publication
AIREG Aviation Initiative For Renewable Energy” In Germany
AIS Aeronautical Information Services
AMC Airspace Management Cell
ANSP Air Navigation Service Provider
AO Aircraft Operator
AOC Air Operator Certificate
AoR Area Of Responsibility
APP Approach Control Unit
APU Auxiliary Power Unit
ARN Airspace Route Network
ARTCC Air Route Traffic Control Centre

xx
ASA Air Services Agreement
ASKs Available Seat Kilometres
ASM Available Seats Miles
ASM Airspace Management
ASMA Arrival Sequencing And Metering Area
ATAG Air Transport Action Group
ATC Air Traffic Control
ATCEUC Air Traffic Controllers European Union’s Coordination
ATCO Air Traffic Controller
ATFCM Air Traffic Flow And Capacity Management
ATFM Air Traffic Flow Management
ATM Air Transport Management
ATM Air Traffic Management
ATS Air Traffic Service
ATSU Air Traffic Service Unit
BTL Biomass-To-Liquid
BULATSA Bulgarian Air Traffic Services Authority
CA Competent Authority
CAA Civil Aviation Authority
CAAFI Aviation Alternative Fuels Initiative
CAEP Committee On Aviation Environmental Protection
CAP Civil Aviation Publication
CARF Charges For Airports And Route Air Navigation Facilities
CBAs Cross-Border Areas
CCD Climb, Cruise And Descent
CCM Command And Control Measures
CCO Continuous Climb Operations

xxi
CCS Carbon Capture And Sequestration
CDA Continuous Descent Approach
CDM Clean Development Mechanism
CDM Collaborative Decision Making
CDO Continuous Descent Operations
CDR Conditional Route
CEC Carbon Emissions Calculator
CER Certified Emissions Reduction
CFIT Controlled Flight Into Terrain
CH 4 Methane
CJEU Court of Justice of the European Union
CLEEN Continuous Lower Energy, Emissions And Noise
CNS Communications, Navigation And Surveillance
CO Carbon Monoxide
CO2 Carbon Dioxide
COOPANS COOPeration between Air Navigation Services
CORSIA Carbon Offsetting and Reduction Scheme For International Aviation
COSIA Carbon Offsetting Scheme For International Aviation
CRCO Central Route Charges Office
CTL Coal-To-Liquids
CV Coefficient of Variation
DCs Deducted Costs
DCT Direct Routing
DEHSt German Emissions Trading Authority
DFS Germany - Deutsche Flugsicherung
DG CLIMA Directorate-General Climate Action
DG MOVE Directorate-General Mobility And Transport

xxii
DNL Day-Night Average Sound Level
DoT Department Of Transport
DSNA Direction Des Services De La Navigation Aérienne
DUR Determined Unit Rate
EANS Estonian Air Navigation Services
EASA European Aviation Safety Agency
EC European Commission
ECAA European Common Aviation Area
ECAC European Civil Aviation Conference
ECCP European Climate Change Programmes
EEA European Economic Area
EEA European Environmental Agency
EEX European Energy Exchange
EFT European Transport Workers Federation
EIG Emissions Inventory Guidebook
EIT Economies In Transition
ELFA European Low Fares Airline Association
ENAC Italian Civil Aviation Authority
ENAV Ente Nazionale Di Assistenza Al Volo
EP European Parliament
ERA European Regions Airlines Associations
ERNIP European Route Network Improvement Plan
ERU Emission Reduction Unit
EU European Union
EU ETS European Union Emissions Trading Scheme
EUAAs Eu Aviation Allowances
EUAs European Union Allowances

xxiii
FAA Federal Aviation Administration (Usa)
FAB Functional Airspace Block
FAF Final Approach Fix
FAIR
STREAM
FABEC ANSPs and AIRlines in SESAR TRials for Enhanced Arrival
Management
FDP Flight Data Processing
FEP Flight Efficiency Plan
FIAs FAB Improvement Areas
FIRs Flight Information Regions
FLOSYS Flight Optimisation System
FRAM Free Route Airspace Maastricht
FSNCs Full Service Network Carriers
FSTD Flight Simulation Training Device
FUA Flexible Use Of Airspace
GCAA General Civil Aviation Authority
GCD Great Circle Distance
GCI Global Competitiveness Index
GCM Global Climate Model
GCR Global Competitiveness Report
GDP Gross Domestic Product
GEF Global Environment Facility
GFAAF Global Framework For Aviation Alternative Fuels
GHG Green House Gas
GMBM Global Market Based Measures
GS Gold Standard
GTL Gas-To-Liquids
GWP Global Warming Potential
HAF Hellenic Air Force

xxiv
HAF/SAR Hellenic Air Force- Search and Rescue Service
HANSA Hellenic Air Navigation Supervisory Authority
HANSP Hellenic Air Navigation Service Provider
HCAA Hellenic Civil Aviation Authority
HCAA/REGS Hellenic Civil Aviation Authority – Regional Services
HEFA Hydroprocessed Esters And Fatty Acids
HFC Hydrofluorocarbons
HGCC High Level Group On International Aviation And Climate. Change
H-MANSOD Hellenic Military Air Navigation Services Oversight Division
HNMS Hellenic National Meteorological Service
HRJ Hydrogenated Renewable Jet Fuel
IAA Irish Aviation Authority
IATA International Air Transport Association
ICAO International Civil Aviation Organization
ICB Industry Consultation Body
ICCT International Council On Clean Transportation
IFR Instrument Flight Rules
ILS Instrument Landing System
IPCC Intergovernmental Panel On Climate Change
ISIS Implementation Of Single European Sky In South East Europe
ITAKA Initiative Towards Sustainable Kerosene For Aviation
ITC Institutional Transaction Costs
JI Joint Implementation
KEA Key Performance Environment Indicator Based on Actual Trajectory
KEP Key Performance Environment Indicator Based on Last Filed Flight Plan
KPA Key Performance Area
KPI Key Performance Indicator

xxv
KRIs Key Result Indicators
LAQ Local Air Quality
LCA Life-Cycle Assessment
LCC Low Cost Carrier
LGS Latvijas Gaisa Satiksme
LR Liability Rules
LSSIP Local Single Sky Implementation
LTO Landing-Take Off
LULUCF Land Use, Land Use Change And Forestry
LVC The Netherlands Air Traffic Committee
LVNL Air Traffic Control The Netherlands
MAA Military Aviation Authority
MATS Malta Air Traffic Services
MB Marginal Benefit
MBM Market Based Measures
MEC Marginal External Cost
MEP Member Of European Parliament
MET Meteorological Services For Air Navigation
MFUR Most Frequent Used Route
MITaN Ministry of Infrastructure, Transport & Networks
MND Ministry of National Defence
MoD Ministry of Defence
MoI&M Ministry of Infrastructure and the Environment
MoU Memorandum Of Understanding
MP Monitoring Program
MPC Marginal Private Cost
MRV Monitoring, Reporting And Verification

xxvi
MS Member State
MSC Marginal Social Cost
MSG Multi-Stakeholder Governance
MSR Market Stability Reserve
MUAC Maastricht Upper Area Control Centre
N2O Nitrous Oxyde
NADP Noise Abatement Department Procedure
NCP Nsa Coordination Platform
NGOs Non-Governmental Organisations
NM Network Manager
NMVOC Non-Methane Volatile Organic Compounds
NOTAM Notice To Airmen
NOx Nitrogen Oxides
NSA Navigation Service Authorities
O3 Ozone
OAG Official Airline Guide
OCC Operational Control Centres
OECD Organisation For Economic Co-Operation And Development
OLDI On-Line Data Interchange
Pax Passengers
PCA Prior Coordination Airspace
PCI Gross Domestic Product (GDP) Per Capita Income
PEL Planned Entry Level
PFC Perfluorinated Hydrocarbons
PI Performance Indicators
PKPs Passenger Kilometres Performed
PM Particulate Matter

xxvii
PPP Private Public Partnership
PR Property Rights
PRB Performance Review Body
PRC Performance Review Commission
P-RNAV Precision-Area Navigation
PRU Performance Review Unit
PSO Public Service Obligation
QAS Quality Assurance Standard For Carbon Offsetting
R&D Research And Development
RAD Route Availability Document
RCA Reduced Coordination Airspace
RED Renewable Energy Directive
REDD+ Reduced Emissions From Deforestation And Degradation
RF Radiative Forcing
RIMS Ranging And Integrity Monitoring Station (GNSS-1/EGNOS)
RIs Result Indicators
RNLAF Royal Netherlands Air Force
ROMATSA Romanian Air Traffic Services Administration
RP Reference Period
RPKs Revenue Passenger Kilometres
RSD Relative Standard Deviation
RSO Route Per State Overflown
RVSM Reduced Vertical Separation Minimum
RVT Remote and Virtual Tower
SA Stakeholder Analysis
SAAM System For Traffic Assignment And Analysis At A Macroscopic Level
SAFA Safety Assessment Of Foreign Aircraft

xxviii
SAFUG Sustainable Aviation Fuel Users Group
SAM Supply Adjustment Mechanism
SAR Search And Rescue
SARPs Standards And Recommended Practices
SD Standard Deviation
SEA Strategic Environmental Assessment
SES Single European Sky
SESAR Single European Sky ATM Research
SF6 Sulfur Hexafluoride
SFC Specific Fuel Consumption
SID Standard Instrumental Departure
SLA State Level Agreement
SO2 Sulphur Dioxide
SOX Oxides Of Sulphur
SRA Safety Risk Assessment
SSC Single Sky Committee
SSP State Safety Programme
STAR Standard Terminal Arrival Route
SUA Special Use Airspace
SWAFEA Sustainable Ways for Alternative Fuels and Energy for Aviation
TC Transaction Cost
TCE Transaction Costs Economic
TEC Total Economic Cost
TED Total Environmental Degradation
TMA Terminal Manoeuvring Area
TOD Top-Of-Descent
TRAs Temporary Reserved Areas

xxix
TSU Terminal Service Unit
TWR Terminal Control
UHC Unburned Hydrocarbons
UIR Upper Information Region
UNDP United Nations Development Programme
UNECE United Nations Economic Commission For Europe
UNFCCC United Nations Framework Convention On Climate Change
USA United States Of America
USOAP Universal Safety Oversight Audit Programme
VCS Verified Carbon Standard
VCS Voluntary Carbon Standard
VER Voluntary Emission Reductions
VOC Volatile Organic Compounds
WCI Western Climate Initiative
WEF World Economic Forum
ΔCV absolute difference of the Coefficient of Variation

xxx
This page is intentionally left blank

1
1 Introduction
The air traffic control is the mainstay of civil aviation. Aviation is a cross-border activity, yet
the air traffic management is organised in a fragmented way. This fragmentation impacts
safety, limits capacity, increases costs and slows down the decision-making process. The
airspace should therefore be organised according to the requirements of "Functional
Airspace Blocks" regardless of national borders. 'Functional Airspace Block' means an
airspace block based on operational requirements, reflecting the need for integrated
management of the airspace regardless the existing boundaries of Flight Information
Regions (FIR's) (EC 549/2004).
The fragmentation of European Union airspace into 27 national systems of air traffic gave
rise to a number of problems (EC, 2015). For this reason, the creation of a ‘Single
European Sky’ (SES) was promoted. The aim of this reform is to meet the needs for
improved capacity and safety. The main objectives are to restructure the European
airspace traffic, to create additional capacity and to increase the overall efficiency of the
Air Traffic Management (ATM) system. Its four pillars are: a) to achieve better performance
and more efficient response to environmental challenges, b) to increase the levels of flight
safety, c) to utilise new technology, and d) to increase airport capacity, efficiency and
safety.
Functional Airspace Blocks (FABs) are directly related to the Single European Sky and
environmental performance. The establishment of Functional Airspace Blocks was aimed
at the efficient use of airspace, improving system efficiency of air traffic management,
reducing costs, which would be achieved by saving fuel, reducing distances and improving
service quality for passengers. The process of creating and operating FAB's is extremely

2
difficult and time-consuming, as it requires the consent of the countries concerned, as well
as civil and military cooperation.
An equally important issue is the air pollutant emissions. In 2009, the European Union
decided to include aviation in the EU Emissions Trading Scheme (EU ETS). By 2012, the
airline industry set out a CO₂ emission ceiling, initially set at 97% of 2005 emission levels
by 2013 and then at 95%. All carriers flying to and from the European Economic Area
(EEA) must pay an amount for each excess tonne of CO₂ emitted on a flight to and from
(and within) the EEA. Airspace users are required to monitor the annual emissions for
each flight. These data should then be aggregated to an annual emissions report to be
audited by an independent accredited verifier. The operator should provide the
corresponding number of allowances. If actual emissions are lower than the operator’s
rights/allowances, they can sell their excess allowances on the market or "bank" them to
cover future emissions. If they predict that their emissions will exceed their rights, they can
take action to reduce their emissions and/or buy additional rights/allowances. Airlines can
also buy emission credits from clean energy projects carried out in third countries under
the mechanisms of the Kyoto Protocol. The existence of a market in which these rights can
be traded allows businesses to manage their emissions in a cost-effective way.
1.1 Rationale of the research
Air transportation traffic from 1945 to 1973, which is the first oil crisis, grew at double-digit
rates according to IATA.org (2016a). Due to technological improvements and technical
innovation, mainly the introduction of turbo-propeller aircraft in the early 1950s,
transatlantic jets in 1958, wide-bodied aircraft and high by-pass engines from 1970
onwards, the air traffic grew even further. A number of factors, including higher speeds,
greater size, and better unit cost control offered more affordable air tickets, in combination
with an increase in passengers’ purchase power, led to explosion in demand for air travel.

3
According to Oxford Economics (2011), air transport generates three distinct types of
economic benefit. Aviation creates jobs and tax revenues, contributes to Gross Domestic
Product (GDP). Air transportation is vital for remote regions. The increased connectivity
due to aviation represents an important infrastructure asset that enhances direct
investments, economic agglomeration and other spill over impacts on the production
capacity of an economy. For all those reasons, air transportation plays an extremely
important social role. It connects people. It connects core regions with periphery regions.
In 1948, there were 120 flights across the Atlantic per week, whereas nowadays there are
more than 1,200 flights per day in the North Atlantic airspace alone (ATAG, 2014).
Having said that, this traffic increase is not considered sustainable. The rapid air transport
growth has created a series of environmental problems from noise pollution to climate
change. The negative externalities caused by aviation are in parallel in proportion to the
traffic growth. Aviation produces around 2% of the world’s man-made emissions of carbon
dioxide (CO2), according to the United Nations Intergovernmental Panel on Climate
Change (IPCC). The IPCC (1999) forecasts that the aviation’s share of global man-made
CO2 emissions will increase to around 3% in 2050. According to the Aviation Environment
Federation (2016), aviation is one of the most energy- and carbon-intensive forms of
transport, whether measured per passenger, per km or per hour of travelling.

4
Figure 1: Estimated regional share of CO2 from international aviation in 2020 without a regulatory intervention (Based on ICAO Doc 10018, 2013)
Climate change is affecting aviation operations in many ways according to a European
Aviation Environmental Report of 2016 (EASA, EEA and EUROCONTROL, 2016). Due to
climate change, there will be more frequent heavy rain in Northern Europe, reducing the
number of landings and take-offs at airports. The increase in the air temperatures affects
the performance of the aircraft as well as the airports’ surface areas. Storms can become
larger, more frequent and powerful leading to more flight delays or cancellations. Changes
in snow cover can, on the one hand, reduce the snow-related delays, but on the other
hand, there might be more severe snow-incurred incidents in areas previously
unaccustomed to such weather phenomena. The long-term rise of the sea level will affect
coastal airports. Finally, climate change leads to constant changes in the wind direction.
This increases runways crosswinds reducing airport capacity and increasing delays in
flight movements.
The second pillar of the lack of sustainable development is that the growth in traffic is not
paired with the necessary infrastructure development. The traffic is putting pressure to the
Middle East , 6.70%
North America, 14.80%
South America, 6.70%
Asia/Pacific, 31%
Europe, 36.60%
Africa, 4.20%

5
airports and to the Air Navigation Service Providers (ANSPs). The number of flights has
increased by 80% between 1990 and 2014, and is forecasted to grow by a further 45%
between 2014 and 2035 (EASA, EEA and EUROCONTROL, 2016). The number of the
airports though is not increasing at the same pace. In addition, the airspace size cannot be
increased.
Passenger arrivals constitute evidence of the increase in traffic over the last decades. The
number of airports, the available aircraft and the number of airlines are not always
considered representative indicators of the traffic growth. The number of USA airports in
1980 was 15,161. There were 4,814 public use airports and 10,347 private use airports. In
2014, there were 19,299 airports, out of which 5,145 were for public use and 13,863 were
private use airports, according to the Bureau of Transport Statistics of the Department of
Transportation (2016). The available airplanes for service (domestic and international) in
1960 were 2,135 operated by 55 carriers and, in 2006, there were 6,758 available
airplanes operated by 66 carriers. In 1960, there were 2,566 thousands of passenger
arrivals and in 2006 the same figure reached 62,951 thousands of passenger arrivals in
USA airports (DoT, 2016).
The USA case proves that the rate of growth in passenger traffic is not the same with the
rate of growth in the number of airports and airlines. The number of runways has
increased and qualitative improvements have been made, but this does not eliminate the
congestion in some airports. Nowadays, airplanes offer more Available Seats Miles (ASM),
since there are more wide-bodied aircraft available or two-deck airplanes, such as Airbus
A380 that offers around 550 seats. Due to competition, airlines experienced consolidation
through mergers and acquisitions. On the other hand, expanding or developing an airport
is considered a highly expensive investment, thus emphasis seems to be given to optimal
utilisation of existing airports.

6
This is the problem that the aviation is facing nowadays: growth is not sustainable. The
question that arises is whether there is any solution to this. The solution is two-fold, supply
management policies and demand management policies. The supply chain management
focuses on time-efficient movement of resources and on the integration of the various
functions and pressures. Expansion in structural elements like buildings requires large
capital investments that are difficult to reverse (Bozarth, 2016). Building new airports might
be expensive but sometimes it is necessary. In the case of airspace though, expansion is
not an option. The only solution in this case is to optimise the use of the airspace.
From the demand management point of view, sustainable growth can be achieved by
revenue management or by taxation. In terms of revenue management, congestion pricing
or peak pricing can be a solution. Congestion pricing can be applied as charging more for
longer and complex routes. In terms of peak pricing, this can be applied as charging more
for routes operated during peak hours. Another alternative can be taxation on the fuel
consumption or economic incentives for better environmental performance, such as
Market Based Measures (MBM). All those demand management strategies aim to improve
the environmental performance of aviation.
Performance is a complex concept that describes the capability of generating results.
Figure 2 depicts a causal model that links the outcome (often reduced to output and
results), the processes and the foundations. This model is portrayed as a tree to illustrate
how an organization goes through the process of performancing. The analogy to a tree
helps to capture process complexity and characteristics of growth and change.

7
Figure 2: The performance tree (Source: Adapted from Lebas, l995 (Neely, 2004: 69)
Performance can be expressed as a set of variables or indicators that are complementary,
or occasionally contradictory. Performance measures can be classified as follows
(Parmenter, 2015):
1. Performance Indicators (PIs) express what needs to be achieved.
2. Key Performance Indicators (KPIs) express what needs to be achieved to
drastically improve performance.
3. Result Indicators (RIs) express what has already been achieved in general.
4. Key Result Indicators (KRIs) express what has been achieved according to a
certain perspective or critical success factor.

8
Another approach of describing performance indicators is given by Samsonowa (2012). In
general, Performance Indicator (PI) can be described as an auxiliary metric that partially
reflects the performance of an organizational unit. Regulation 390/2013 considers
performance indicators as indicators used for the purpose of performance monitoring,
benchmarking and reviewing of performance schemes for air navigation services and
network functions.
Both supply management policies and demand management policies intent to address
sustainable development. They seek to achieve the same target through different means.
An important element is the possible cancelling-out and/or overlapping effects, that one
scheme can cause to the other. The aim should be to develop synergies between the two
policies and have a systemic approach to environmental problems.
Single European Sky (SES) focuses on the provision of Air Navigation Services (ANS)
related to the supply management. ANS include the following services: air traffic
management (ATM), communications, navigation and surveillance (CNS), meteorological
services for air navigation (MET), search and rescue (SAR) and aeronautical information
services/aeronautical information management (AIS/AIM), as stated in ICAO Document
9161 (2013). Air Navigation Service Providers are offering ANS to airlines during all
phases of operations, i.e. approach, aerodrome and en route. The European Commission
implemented SES to regulate ANS and improve the efficiency of ANSPs towards a more
sustainable growth. One of the Key Performance Areas (KPAs) SES is focusing on is the
Environment. Through the creation of Functional Airspace Blocks (FABs), the SES aims to
improve the airspace architecture and optimise its use by airspace users.
On the other hand, the inclusion of aviation in the European Union Emissions Trading
Scheme (EU ETS) is related to the demand management. EU ETS is a Market Based
Measure for handling emissions. The EU ETS is based on the 'cap and trade' principle. A

9
'cap', or limit, is set on the total amount of certain greenhouse gases that can be emitted
by the airlines operating between aerodromes in the European Economic Area (EEA). The
cap is reduced over time so that total emissions decrease. Within the cap, airspace users
receive or buy emission allowances that they can trade with one another as needed. They
can also buy or sell limited amounts of international credits from emission-saving projects
around the world. The limit on the total number of allowances available ensures that they
have a value. As a result, airspace users in the European airspace are regulated through a
demand management policy. The regulator in EU ETS is the European Commission and
the Competent Authorities.
Both SES and EU ETS aim to tackle the negative externalities of aviation. The European
Commission (EC) in collaboration with the Member States regulates both regulatory
schemes. However, the problem that arises is that, although both schemes are centralised
to the EC, they are handled by different departments/directorates. The Commission is
divided into several departments and services. The departments are known as Directorate-
Generals (DGs). SES is regulated by Directorate-General Mobility and Transport (DG
MOVE) and EU ETS is regulated by Directorate-General Climate Action (DG CLIMA).
The research gap that can be detected in the schemes concerns the potential existence of
any cancelling-out and/or overlapping effects in the supply management, that is the SES,
and demand management, that is the EU ETS policies. Moreover, the rationale of the
present thesis is to research whether there is any governance failure in the full
implementation and efficiency of the schemes following a holistic view, by simultaneously
examining demand and supply management.
1.2 Research Aim and Research Questions
This study aims to analyse the aviation governance in terms of the environmental
regulation of aircraft operators and Air Transport Management (ATM) and determine the

10
effectiveness of the Single European Sky and European Union Emissions Trading Scheme
in the area of environment. Finally, this research seeks to uncover any implementation
issues for the Single European Sky and EU Emissions Trading Scheme reforms and
provide suitable recommendations for policy makers.
In order to achieve this aim the study will seek to provide answers to the following
research questions:
1. Are aviation operations sustainable and what are the factors leading to sustainable
growth?
2. How does the market environment and structure, in which the Single European Sky
(SES) and the European Union Emissions Trading Scheme (EU ETS) are
implemented, affect the efficiency of the schemes?
3. Can the inclusion of aviation in the European Union emissions Trading Scheme
and/or Single European Sky lead to carbon-neutral growth?
4. Can the effective implementation of SES render the EU ETS redundant and are the
environmental targets overlapping?
5. What do the research findings reveal about any issues the SES and the EU ETS
reforms are facing and how can these findings be used to improve the aviation
environmental performance and achieve a more sustainable growth?
To address the above research questions, it was necessary to examine the literature
review, to better understand the nature of the problem as well as the nature of the market.
Emphasis has been given to the theoretical overview and critical analysis of carbon trading
and airspace management and harmonisation (charges, operating benefits, conditions for
success, practical obstacles and addressing their legislative-regulatory framework,
economic and technical issues, etc.). In order to get a better insight into the management
of the scheme, the researcher held a post at EUROCONTROL in Brussels for 18 months.

11
EUROCONTROL is the Network Manager of SES and is responsible for Monitoring and
Reporting of EU ETS (aviation area). Additionally, experts from different countries were
interviewed and asked about their opinion on the efficiency of the schemes. This process
is described in detail in the Methodology Chapter.
1.3 Research Context
The first step for this study was to set the boundaries within which it would be carried out
by identifying the stakeholders involved in the reform of the European sky and the
regulation of the negative externalities. A stakeholder is defined as any entity with a
declared or conceivable interest or stake in a policy matter. Moreover, stakeholders are
those who are affected by the outcome or those who can affect the outcome of a proposed
development intervention (World Bank, n.d.). The range of stakeholders relevant to
consider for analysis varies according to the complexity of the area targeted. Stakeholders
can be of any form, size and capacity. They can be individuals, organisations or
unorganised groups. In most cases, stakeholders fall into one or more of the following
categories: international actors (e.g. EUROCONTROL), national or political actors (e.g.
legislators, governors), public sector agencies (e.g. EASA), interest groups (e.g. trade
unions, airline associations), commercial/private for-profit and non-profit organizations
(NGOs, foundations), civil society members, and users/consumers.
Moreover, aviation plays a crucial social role for a country or region. Aviation offers
connectivity to states with other states or periphery/semi-periphery regions to core regions.
After/Following the airlines’ liberalisation, the air transportation became widely available
due to lower ticket/fare prices. The passenger is one of the main stakeholders in aviation
and constitutes a central point of consideration in the regulations. The aviation is quite a
complex industry due to its multidimensional role. Aviation can act as a mechanism for a
country’s defence, but at the same time, airplanes are used for bombing attacks by the

12
state itself. The military dimension of aviation is different from one country to the other and
it depends by the geopolitical position of a state.
The current environment is highly deregulated and this has led to a very competitive
environment for the airlines. The role and value of airports is currently growing, as they
contribute to agglomeration and economic development of the destination and the
surrounding area. The Air Navigation Service Providers are the ones offering the
navigation services and one of the main players that will be discussed in this PhD thesis.
Furthermore, the regulators are one of the most important players in this ‘game’. The
regulators of aviation are the European Parliament and the European Council, the
European Commission and its supporting agencies. At national level, the regulators are
the Civil Aviation Authorities, the Ministries of Transport and the National Supervisory
Authorities. The employees in the aviation industry through the trade unions and the
passengers through their respective passenger associations also exercise influence over
the Parliament and the national authorities for passing regulations.
The International Civil Aviation Organisation (ICAO) is a specialised agency of the
United Nations (UN). It was created after the Convention on International Civil Aviation
(the Chicago Convention) of 1944 and it was ratified in 1947. ICAO together with its
Member States and a number of global aviation organisations develop international
Standards and Recommended Practices (SARPs).
The European Parliament is the EU's law-making body. EU voters directly elect the
parliament members every 5 years. The Parliament has three main roles: legislative,
supervisory and budgetary. The Parliament passes EU laws, together with the European
Council, based on European Commission proposals. The number of Members of the
European Parliament (MEPs) for each country is approximately proportionate to its
population, but no country can have fewer than 6 or more than 96 MEPs and the total

13
number cannot exceed 751 (750 plus the President). Moreover, MEPs are grouped based
on political affiliation, rather than nationality.
The European Commission (EC) was established in 1951. It is the executive body of the
European Union (EU), the only one that can propose legislation, and it is also responsible
for implementing decisions and upholding the EU treaties. The EC operates as a cabinet
government with 28 members (also called Commissioners). The EC is divided into 33
departments and services. The departments are known as Directorate-Generals (DGs).
The DG that deals directly with Aviation is Mobility and Transport (DG MOVE). The other
DGs are also related with the aviation sometimes, for instance, DG CLIMA is responsible
for the Emissions Trading Scheme.
The EC was set up from the beginning to act as an independent supranational authority
separate from governments; hence, it should act independently and remain neutral to
external influences. It should be noted though that the Commissioners are proposed by the
Member States’ governments. The EC proposes the legislation, the Council and
Parliament approve/pass the legislation and the EC is responsible to ensure, with the help
of Member States and EC Agencies (like EASA), that it is implemented.
The Civil Aviation Authorities (CAAs) is a generic term used in many countries, notably
the UK, and refers to national regulatory bodies responsible for aviation. The CAA
implements the ICAO SARPs in national legislation and are responsible for regulatory
oversight. On the other hand, the National Supervisory Authorities (NSAs) were
established by request of the EC. NSAs ensure the supervision of the regulatory
framework. Their main responsibilities include certifying and overseeing Air Navigation
Service Providers as well as preparing/drafting the national performance plans of the
Member States concerned (Reg. No 550/2004). In some states, the NSA is incorporated
within the CAA, whereas in some others it is a separate agency. The NSAs should be

14
independent from the ANSPs, in order to be allowed to have an effective oversight. Only in
4 out of 28 cases, a functional separation has been achieved, meaning that both NSA and
the ANSP are part of the same organisation, but are internally separated to ensure
independence of the NSA (SkyBrary, 2014). In order for NSAs to convene and discuss
issues pertinent to the SES, the NSA Coordination Platform (NCP) was established at
European level in 2009.
Airlines and airports rely on the Air Navigation Service Providers (ANSPs) for the
management of air traffic. Hence, Air Navigation Services (ANS) provision is considered
as a core element for air transportation. Air Navigation Services include five broad
categories of services provided to air traffic during all phases of operation (area control,
approach control and aerodrome control). These services are the following: Air Traffic
Management (ATM), Communication services, Navigation services and Surveillance
services (CNS), Meteorological services for air navigation (MET), Aeronautical Information
Services (AIS) and Search and Rescue (SAR) (ICAO Doc 9161, 2013).

15
Figure 3: Air Navigation Services categories
Aeronautical Information Services (AIS) provide information on the availability of air
navigation services and their associated procedures necessary for the safety, regularity
and efficiency of air navigation (i.e. AIP, AIC, NOTAM, etc.). Communications, Navigation
and Surveillance (CNS) includes communication facilities, navigation services and
surveillance systems. Communication facilities have two main categories: aeronautical
fixed service and aeronautical mobile service.
In Europe, there are 37 ANSPs. Most of them are government-owned. NATS is a Private
Public Partnership (PPP). Nevertheless, according to Article 28 of the Chicago
Convention, the State is ultimately responsible for the provision and operation of air
navigation facilities and services
The European Organisation for the Safety of Air Navigation, commonly known as
EUROCONTROL, is an international organisation working to achieve safe and seamless
air traffic management across Europe. EUROCONTROL is the Network Manager for

16
Single European Sky and is responsible for the Monitoring, Reporting and Verification
(MRV) of EU ETS.
The Performance Review Commission (PRC) was established in 1998 by the
Permanent Commission of EUROCONTROL. It advises EUROCONTROL’s Governing
Bodies and supports the effective management of European ANS through target-setting
and the establishment of a transparent and independent performance review system. This
system addresses all aspects of ANS, including policy and planning, safety management
at and around airports and in the airspace, as well as financial and economic aspects of
services rendered.
The PRC is responsible for enforcing implementation of the performance and target-setting
system throughout/in all EUROCONTROL’s Member States. The PRC reports directly to
the EUROCONTROL Permanent Commission through the Provisional Council on its
activities. These activities include providing advice on ANS performance issues, including
performance targets. The PRC deliverables include:
Annual performance review reports (PRR);
ATM Cost-effectiveness benchmarking reports (ACE);
Special reports on issues such as comparisons of ATM-related operational
performance in the United States and Europe.
The Performance Review Body (PRB) is composed of the 12 Members of the PRC, plus
the PRB Chairman, appointed by the European Commission. The PRB reports directly to
the European Commission. The purpose of the PRB is to assist the European Commission
in the implementation of the performance scheme and to assist the National Supervisory
Authorities (NSAs) on request. The PRB’s complete list of tasks is described in Article 3 of

17
Regulation No 691/2010 and Regulation No 390/2013. The PRB tasks include but are not
limited to the following:
collection, examination, validation and dissemination of performance-related data;
definition of new or adaptation of key performance areas and the related key
performance indicators;
setting up or revision of EU-wide performance targets;
consistency assessment of adopted performance plans, including performance
targets, with the EU-wide targets;
assessment of the revised performance targets or the corrective measures taken by
the EU Member States;
monitoring, benchmarking and reviewing of the performance of air navigation
services, at national or FAB and European Union level;
monitoring, benchmarking and reviewing of the performance of the network
functions;
assessment of the achievement of the performance targets;
assistance to NSAs with regards to national or functional airspace block
performance issues.
The Performance Review Unit (PRU) is the supporting Unit of the PRC and the PRB. In
terms of administration, it is part of the EUROCONTROL Agency’s Single Pan European
Sky Directorate. The PRU is responsible for monitoring and reviewing the performance of
the European ANS System. Based on its analysis, the PRU supports the PRC and the
PRB for performance improvements in the European ANS system (EUROCONTROL.int,
2016a).

18
1.4 Research undertaken in aviation and the environment and research
gap
The PhD thesis aims to highlight and fill the literature gap in the area of the implementation
process and the problems associated with the policy design of the inclusion of aviation in
the European Union Emission Trading Scheme (EU ETS). ETS is well researched in the
energy industry but not in aviation. The focus of this thesis is aviation and the published
research around aviation limits on the effects of ETS for airlines. No in-depth research has
been previously undertaken regarding the implementation issues and no related
suggestions for policy makers have been made in the past.
Moreover, in the area of Single European Sky, the published research is even more
limited. Very few papers are published and those focus on general aspects of SES and not
on the environmental aspect. Table 1 lists the published papers on the area of this
research, i.e. aviation and EU ETS and SES and the environment. No published work is
found on the relation of SES and EU ETS.
Table 1: Research about Aviation and the environment
Author(s) and paper Focus Methodology
Aviation and EU ETS
Xu, J., Qiu, R. & Lv, C., 2016.
Carbon emission allowance
allocation with cap and trade
mechanism in air passenger
transport. Journal of Cleaner
Production, 131, pp.308–320.
Government allocation
decisions and airlines aircraft
selection decisions1
Theoretical
economic model
1 The statement that the developed model has the ability to describe the interactions of multiple stakeholders and
balance their conflicts is not realistic since it addresses only the government authorities and the airlines with focus on
aircraft selection.

19
Author(s) and paper Focus Methodology
Zanin, M. et al., 2016. Towards a
secure trading of aviation CO 2
allowance. Journal of Air Transport
Management, 56, pp.3–11.
Secure Multi-party
Computation framework for
confidential information in
aviation emissions auction.
Conceptual model
for cloud-based
computational
service
Meleo, L., Nava, C.R., Pozzi, C.,
2016. Aviation and the costs of the
European Emission Trading
Scheme: The case of Italy, Energy
Policy, 88, pp. 138-147.
Calculation of the EU-ETS
direct costs for Italian airlines
and effects on airfares,
revenues, and social costs
Theoretical
economic model
Malavolti, E. and Podesta, M., 2015.
Strategic Reactions of Airlines to
the European Trading Scheme.
Transportation Research Procedia,
8, pp.103-113.
Economic analysis difference
between passengers carried
without regulation and when
the regulation is put in place.
Emphasis given on the
selection of aircraft
Theoretical
economic model
Miyoshi, C., 2014. Assessing the
equity impact of the European
Union Emission Trading Scheme on
an African airline. Transport Policy,
33(C), pp.56–64.
Equity issues by measuring
the impact of the EU ETS on
an African airline compared to
airlines in an Annex I country.
Case study and
BADA and logit
models
Sheu, J.-B., 2014. Airline
ambidextrous competition under an
emissions trading scheme – A
reference-dependent behavioral
perspective. Transportation
Research Part B: Methodological,
60(C), pp.115–145.
Airline fare adjustments due
to EU ETS and consumers
perceptions
Hotelling model
with reference
dependence theory
Barbot, C. et al., 2014. Trade-offs
between environmental regulation
and market competition: Airlines,
emission trading systems and entry
deterrence. Transport Policy, 33(C),
pp.65–72.
Effects on potential airline
competition and entry
deterrence
Theoretical
economic model

20
Author(s) and paper Focus Methodology
Girardet, D. & Spinler, S., 2013.
Does the aviation Emission Trading
System influence the financial
evaluation of new airplanes? An
assessment of present values and
purchase options. Transportation
Research Part D: Transport and
Environment, 20, pp.30–39.
Impact of the CO2 costs for
short- and long-haul aircraft
based on present values and
on purchase options
Econometric model
Kopsch, F., 2012. Aviation and the
EU Emissions Trading Scheme—
Lessons learned from previous
emissions trading schemes. Energy
Policy, 49(C), pp.770–773.
Brief discussion on design
issues (allocation, liability,
inter-temporal trade, trade
barriers, hot spots)
Case studies
Malina, R. et al., 2012. The impact
of the European Union Emissions
Trading Scheme on US aviation.
Journal of Air Transport
Management, 19(C), pp.36–41.
Economic impacts on US
airlines due to EU ETS.
Emissions
Prediction and
Policy Analysis
(EPPA) model
(General
Equilibrium Model)
Preston, H., Lee, D.S. & Hooper,
P.D., 2012. The inclusion of the
aviation sector within the European
Union’s Emissions Trading Scheme:
What are the prospects for a more
sustainable aviation industry?
Environmental Development, 2,
pp.48–56.
Whether the policy has the
potential to significantly
reduce aviation emissions
and contribute to a
sustainable future for the
industry in terms of climate
change
Calculations with
the Future Aviation
Scenario Tool
Vespermann, J. & Wald, A., 2011.
Much Ado about Nothing?-An
analysis of economic impacts and
ecologic effects of the EU-emission
trading scheme in the aviation
industry. Transportation Research
Ecologic and economic
impacts of EU ETS and
effects on competition
structures
Simulation model

21
Author(s) and paper Focus Methodology
Part A: Policy and Practice, 45(10),
pp.1066–1076.
Anger, A., 2010. Including aviation
in the European emissions trading
scheme: impacts on the industry,
CO 2 emissions and
macroeconomic activity in the EU.
Journal of Air Transport
Management, 16(2), pp.100–105.
Impacts on CO2 emissions
and the macroeconomic
activity in the EU
Energy–
Environment–
Economy Model
(dynamic simulation
model)
Scheelhaase, J., Grimme, W. &
Schaefer, M., 2010. The inclusion of
aviation into the EU emission
trading scheme-Impacts on
competition between European and
non-European network airlines.
Transportation Research Part D:
Transport and Environment, 15(1),
pp.14–25.
Impacts on competition,
operating costs, ticket prices
and cargo rates for European
and non-European aircraft
operators
Model-based
empirical
estimations
Scheelhaase, J.D. & Grimme, W.G.,
2007. Emissions trading for
international aviation: an estimation
of the economic impact on selected
European airlines. Journal of Air
Transport Management, 13(5),
pp.253–263.
The possibilities on how
aviation could be included in
existing emissions trading
schemes and overview on the
current political discussion2
and the impacts on operating
costs and transport demand
Simple
mathematical
module with 3
scenarios
Morrell, P., 2007. An evaluation of
possible EU air transport emissions
trading scheme allocation methods.
Energy Policy, 35(11), pp.5562–
5570.
Methods of allocation of
emissions permits
Case studies
2 This objective wasn’t addressed in the paper

22
Author(s) and paper Focus Methodology
Forster, P.M. de F., Shine, K.P. &
Stuber, N., 2006. It is premature to
include non-CO 2 effects of aviation
in emission trading schemes.
Atmospheric Environment, 40(6),
pp.1117–1121.
Non-CO2 effects, Radiative
Forcing and global warming
potential
Mathematical
calculations
Single European Sky
Nava-Gaxiola, C.A. & Barrado, C.,
2016. Performance measures of the
SESAR Southwest functional
airspace block. Journal of Air
Transport Management, 50, pp.21–
29.
Expected benefit in saving
flight distance after
introducing the Free Route
Airspace in Southwest FAB.
Traffic simulation
Baumgartner, M. & Finger, M.,
2014. European air transport
liberalization: Possible ways out of
the single European sky gridlock.
Utilities policy, 30, pp.29–40.
The process and the main
actors' interests, and explains
the current gridlock of the
SES as a result of conflicting
objectives among the main
players3
Overview
Baumgartner, M. & Finger, M.,
2014. The Single European Sky
gridlock: A difficult 10 year reform
process. Utilities Policy, 31, pp.289–
301.4
The process and the main
actors' interests, and explains
the current gridlock of the
SES as a result of conflicting
objectives among the main
Overview
3 The paper gives a rather confusing description of Single European Sky and references to three Key Performance
Areas whereas the Regulation 691/2010 refers to four areas. The identification of the stakeholders’ interests is
accurate.
4 This paper is the same as the Baumgartner, M. & Finger, M., 2014. European air transport liberalization: Possible
ways out of the single European sky gridlock. Utilities policy, 30, pp.29–40. In terms of content. It simply has a
different title and it is published twice.

23
Author(s) and paper Focus Methodology
players5
Button, K. & Neiva, R., 2013. Single
European Sky and the functional
airspace blocks: Will they improve
economic efficiency? Journal of Air
Transport Management, 33(C),
pp.73–80.
Potential economic efficiency
of functional airspace blocks
Data Envelopment
Analysis
Pellegrini, P. & Rodriguez, J., 2013.
Single European Sky and Single
European Railway Area: A system
level analysis of air and rail
transportation. Transportation
Research Part A: Policy and
Practice, 57(C), pp.64–86.
Similarities and difference in
operations and strategic
planning of air and rail
transportation
Comparison of rail
and air transport
based on some
characteristics
1.5 PhD Thesis Layout
The PhD thesis consists of nine chapters. In this chapter, the theoretical framework on
which the study is based was introduced. Moreover, the motivation of the research as well
as the aim and the research questions and objectives were stated and the stakeholders
were introduced. The remaining chapters are organised as follows. The main focus of
chapter two is sustainable aviation. The growth of aviation is not considered sustainable,
due to the negative externalities caused by aviation operations to the environment and the
social welfare. The three affected areas are the climate, the levels of noise and local air
quality.
5 The paper gives a rather confusing description of Single European Sky and references to three Key Performance
Areas whereas the regulation refers to four areas. The identification of the stakeholders’ interests is accurate.

24
Chapters 3 and 4 contextualise the study in the relevant literature. The concepts of
European Union Emissions Trading scheme and the Single European Sky are explained.
These chapters can be seen as two extensive case studies of environmental and
economic regulation of civil aviation. Chapter 5 further elaborates on the literature review
and experts’ consultation. This chapter states the theoretical basis underpinning some
parts of the research and discussion of the findings. The key areas examined in this
chapter are the Transaction Costs and the multi-stakeholder governance and management
theory.
Chapter 6 provides an account of the research methodology and method used in this PhD
thesis. The research philosophy, the design of the instrument, the ethical considerations
and limitations of the researcher are discussed in this chapter. Chapter 7 elaborates on the
findings of the Delphi method and juxtaposes the two rounds to identify whether a
consensus was achieved among the stakeholders.
Chapter 8 builds upon the theoretical and practical foundation laid down in the previous
chapters and focuses on the discussion of the EU ETS and SES reforms. In this chapter,
the critical issues for the success of the schemes are elaborated/examined in detail,
leading to Chapter 9, namely the conclusions drawn and the recommendations of this
research thesis. The recommendations are separately proposed for EU ETS and SES, but
a common approach is developed taking into consideration how the policies interact.
Lastly, the last part of Chapter 9 presents the limitations of the PhD thesis, as well as the
contribution that this thesis attempts to offer to the body of knowledge on the specific
academic field. Proposals for further research projects and are also out forward.
The Appendices provide additional information for a better comprehension of the research
thesis. The Appendices include the definitions of key terms, the first draft questionnaire,

25
the SES and EU ETS questionnaire of the first and the second round, the draft
performance plan of DANUBE FAB, and the permissions to use copyrighted material.

26
This page is intentionally left blank

27
2 Sustainable Aviation
In the introductory chapter, it was argued that the rationale for this research is the non-
sustainable growth of aviation. Therefore, the first step of this study is to examine in more
depth the sustainability of aviation. The chapter concludes that aviation is not sustainable
since it leads to climate change and the negative externalities are not taken into account.
A simplified way of considering aircraft operators is described by Banner (2008). He
argued that today the air is full of flying objects; commercial jumbo jets, helicopters, small
private planes, model rockets, etc. should share a sky, which once seemed unlimited
(Banner, 2008). This rapid spread is due to the reduction of the cost of air travel
(Piermartini & Rousova, 2008). With each new use of the air, the law must be adapted.
The airspace is divided both vertically and horizontally into different areas, with different
rules governing each area (Banner, 2008).
This chapter deals with sustainable development and environmental economics. Aviation
creates negative externalities, such as lowering the local air quality, creating noise
pollution and causing climate change due to the emissions of Green House Gases (GHG).
This chapter’s focus is the identification of the problem and its nature from an economic
point of view.
2.1 Sustainable Growth of Civil Aviation
The air transport industry services are considered essential. Occasional shocks like the oil
price shocks, pandemics, wars, security threats did not decrease traffic. The traffic
continued to grow on average at 5% annually. Europe’s GDP grew by 1.4% in 2014 and is
forecast to grow 1.8% annually through 2034 and aviation growth is expected to continue
(Boeing, 2016).

28
According to a study prepared for EC the growth in terms of Revenue Passenger
Kilometres (RPKs) was +5.2% on a worldwide basis in 2013 and 3.8 at Europe. On the
other hand, the airline capacity growth, measured in Available Seat Kilometres (ASKs) was
slightly slower (Mott MacDonald, 2015:7) As far as the Passenger Kilometres Performed
(PKPs) is concerned, Europe (inclusive of Turkey and Russia) is expected to grow at 5.4%
to 5.9% annually according to ICAO Medium Term Forecast 2014. The traffic growth
across the EU28 countries was +1.6% in 2013 (Mott MacDonald, 2015).
Moreover, there is a year-on-year decrease in aviation fatal accidents. In 2013, the
number of accidents decreased by 10% compared to 2012 according to ICAO Safety
report 2014. An audit protocol related to Universal Safety Oversight Audit Programme
(USOAP) was established acting as comprehensive checklist covering all areas of a
State’s safety oversight system, i.e. aerodromes, Air Navigation Service (ANS), Accident
investigation, Airworthiness, Operations, Licensing, Organisation and Legislation (ICAO,
2014a). In 2013, 26 fatal commercial accidents were reported worldwide causing 281
fatalities.
Another important aspect in aviation industry is cost. As far as the cost of infrastructure is
concerned according to IATA (2013a) “Airlines and passengers are estimated to have paid
at least USD92.3 billion for the use of airport and air navigation infrastructure globally in
2011, equivalent to 14.4% of the cost of transport”. Cost efficiency is quite critical for an
airline to compete and survive in such a competitive market.
Economies depend on natural resources, as an essential input. Environmental and natural
resource economics is the application of the principles of economics to the study of how
environmental and natural resources are developed and managed. According to EC
(2015) one way of using economics is to ensure that the costs and the benefits of
environmental measures are well balanced. Although it is difficult to estimate costs and

29
benefits, there is an increasing demand that this is done before environmental policy is
decided on a European level. With the use of market-based instruments, environmental
goals can sometimes be reached more efficiently than with traditional command and
control regulations.
Environmental policy is designed to tackle market failures, by controlling pollution,
regulating resource use and protecting and managing the natural environment. It aims to
achieve a more efficient use of resources in the economy, maintaining the environmental
assets, which people value and which support a healthy economy and society, while
reducing the costs to people and businesses of environmentally damaging activities.
The environmental economics and natural resources has sailed at a parallel course with
the general economic theory at least since the 18th century, and all the great classical
economists have expressed, directly or indirectly, aspects concerning the management of
goods and environmental services. Environmental Economics are the discipline that
studies the environmental problems, in light of the analytical techniques of the economy
(Field, 1994).
The environmental economics are based on the assumption that all the functions provided
by the natural environment, have an economic value, which would be evident if operations
were integrated into a real market (Turner, Pearce, & Bateman, 1994). Factors holding a
key role in the failure of market mechanisms are the problem of ownership of the
commons and the difference between value and price, ultimately leading to the existence
of externalities (Tietenberg, 2010; Harris and Roach, 2016).
2.2 Negative external economies
Air transportation is contributing to economic prosperity, facilitating growth particularly in
developing countries. Air transportation facilitates world trade by transporting goods of

30
high value. The main benefit that aviation offers is the connectivity that encourages
investments and improves productivity. Aviation has direct, indirect, induced and tourism
catalytic economic impacts. Aviation according to ATAG (2014) is a major employer
offering 58.1 million jobs globally (8.7 million direct jobs, 9.8 million indirect jobs and 35
million aviation-enabled tourism jobs).
Apart from the positive economic impact of aviation, aviation contributes to society.
Aviation facilitates the transportation of people and goods. It increased cross-border travel
which contributed to a closer relationship between states. The improved social and
economic networks, encourages social and economic integration. Furthermore, it improves
the living standards, alleviates poverty and increases revenues from taxes. Finally, air
transportation is necessary for places with poor road or rail connections and offers
connectivity in case of an emergency, like natural disasters, health epidemics or wars.
If markets could solve all their problems, there would not be the need for state regulation.
Environmental externalities are the proof that markets fail (Rao, 2003). External
economies occur when the behaviour of a person or a company causes profit or loss to a
third party (person or company), without having a mechanism that will internalize these
effects through prices. A typical example is the pollution of the environment.
There are two types of externalities, public e.g. air pollution, water which affects the
welfare of many people and private e.g. a person throwing garbage in the garden of the
neighbour (this move affects the welfare neighbour and nobody else). The cases where
the activity of an individual or business to impose other costs referred to as negative
externalities or external costs.
According to Rao (2003) there are different kinds of externalities. For instance, there is
Stock externality, i.e. the externality that arises from changes or accumulations of the
inventory or stock of a specific commodity or other physical entity; a similar concept holds

31
for a ‘flow’ externality. For example, atmospheric concentrations of greenhouse gases are
a stock pollutant with negative externalities. Urban smog is a stock externality as well as a
flow externality. Strategic externality is the impact of strategic behaviour on other
components of a system in relation to specific activities undertaken by direct participants;
this occurs especially in resource-to-resource consumption with limited liability or cost
sharing.
One of the possible ways to address externalities in aviation is by imposing restrictions on
travelling (Forsyth, 2008). The implementation is very difficult and the society loses the
surplus from the sale of this service. On the other hand, the airlines can continue the
volatile work, but to use more expensive inputs. For example, they use cleaner types of
fuel that will emit less GHG. The use of more expensive input is also a cost to society.
In the absence of corrective action, those who pollute will continue doing so up to the point
where the marginal private benefit from production equals marginal private cost (Morgan et
al, 2009). The company that pollutes incurs no additional cost as a result of its negative
production externalities if there is no external regulation. In this case, negative production
externalities are not due to the failure, but due to the absence of the market, since there is
no market for clean air or property rights (Morgan et al, 2009).
All production activities generate pollutants, and therefore the requirement should not be to
have zero pollution if that means a complete lack of production, but to have the "right
amount of pollution"(Morgan et al, 2009).To address these externalities some actions must
be taken. There must be private and/or state/government reaction. Private reactions
associate with mergers, social contracts, negotiations, etc. (Morgan et al, 2009).
State/government reactions involve control policies, redress taxes, market creation, etc.
(Morgan et al, 2009).

32
One way the government can intervene in a market with externalities is through a system
of "standards and charges". Whereby the government decides a fixed size of damage
caused by the externality and then charges to force the responsible ones to reduce the
externality to a desired level (Scotter, 2008). Some countries have imposed taxes such as
the Air Passenger Duty (APD) in the UK (IATA, 2006).
Maximization of social welfare does not imply the elimination of exogenous influence. That
would mean the end of air transport, which is not considered socially desirable. To address
the inefficiencies created by external influences various policy measures have been
invented, which fall into two categories, management (CCM, Command and Control
Measures) and measures work through the market mechanism (MBM, Market Based
Measures/Instruments).
Many countries follow a policy control to reduce external economies (e.g. Environmental
Problems) (Morgan et al, 2009). Under the Command and Control regulation area, the
polluter is obliged to reduce its emissions in order to avoid incurring legal penalties
(Morgan et al, 2009).
Taxes are one of the best-known MBM. Pigouvian tax is a tax levied on each unit of
production that pollutes and is exactly equal to the marginal damage that creates the
optimum level of production (Morgan et al, 2009). The theory assumes that the state is
able to know the marginal rate of substitution of emissions and tax level, i.e. how much the
negative externality costs, something that is not feasible in practice. The purpose of
Pigouvian taxation is to act using the tax system to impose a cost on economic externality
equal to the additional cost of a given effect.
Taxes levied on passengers depending on the flight length and the class travel could only
reduce emissions through their effect on air travel demand, and they would give rise to
some leakage effects (Forsyth, 2008). Adopting a Pigouvian tax on aviation, carriers would

33
be forced to take into account the cost of the external economies they create; hence,
carriers will be forced to produce in the optimum level of production.
Figure 4: Implementing tax to correct the impact of negative externalities
The equilibrium of the market if it runs smoothly is at point A, which is not optimal in
Pareto. It is assumed that marginal private benefit equals to marginal social benefit, i.e.
there is no demand side externalities and all externalities are related to production. Point B
is an optimal point and the difference between social and private costs is BΓ. When
imposing a tax t per unit in good/service that pollute and which is equal to BΓ, then the
private cost curve is shifted to the position of the curve (Marginal Social Cost) MPC +1,
which passes through the optimal point B.
However, there are several practical problems in the enforcement of this tax. First,
someone must define what activities produce pollution and how much. In addition, which
polluting units actually cause damage and what is the value of the damage being caused
(Morgan et al, 2009). The Pigouvian taxes aim at bringing marginal private costs, as these
influence choice, into line with social costs, as these are objectively measured. Only with
objective measurability can the proper corrective devices be introduced.

34
The existence of externalities like government intervention documentation was challenged
by Coase theorem according to which if there are no transaction costs (TC) and
negotiations, individuals affected by an externality will agree themselves in a distribution
that is Pareto-optimal and independent of property rights. The presence of deficiency
enables the parties involved to gain from working together to eliminate it (Morgan et al,
2009). The rationale is that if the benefits to someone from an activity that has externalities
exceed the costs incurred by the other, then the first can compensate (bribe) the second
and improve the position of both. However, there are some practical problems with the
theorem of Coase. Initially there is a cost of trading and the logic that each person has an
incentive to let others bear the cost, when he enjoys the benefits (Morgan et al, 2009).
Finally, there is difficulty in determining the source of loss and asymmetric information
(Morgan et al, 2009). The assumption that TCs are negligible or equal to zero leads to a
frictionless economic system according to Rao (2003). Coase aimed to examine the
implications of such a system on efficient functioning and to throw light on the sub-
optimality of certain stipulations in a non-zero TC world (Rao, 2003).
The problem of externalities is not that one part is harming another. The problem is how to
use a scarce resource. In the case of air pollution, producers wish to use the air to emit,
while residents wish to breathe clean air (North, 1992).
Finally, a very important way of state regulation of external economies is creating market.
The government increases economic efficiency by selling emission permit to producers
(Morgan et al, 2009). Thus, a market for clean air is created. The price paid for the license
to emit is called emission allowance (Morgan et al, 2009). According to Figure 5, the
government decides to sell emission permits Z * and firms compete to buy the right to hold
an allowance. The price charged is the one that equates the market supply and demand
and so is set by government (P1). The offer of permits is perfectly inelastic in Z *.

35
Businesses that are not willing to buy at this price must either reduce their production or
change their technology (Morgan et al, 2009).
Figure 5: Market for pollution permits
The creation of a market to be effective requires that someone knows who pollutes and in
what quantities. Auctioning reduces the uncertainty on the upper level of pollution and acts
as an economic incentive (Morgan et al, 2009). The problem of time inconsistency
concerns situations where someone creates an expectation with the intention of inducing
another in specific options, and then does not fulfil the expectation. Of particular interest is
the case that the time inconsistency improves the position of all. A typical example is the
EU ETS and «stop the clock».
The main difference between the Pigouvian and Coasian approaches to this issue arises
in their methods of dealing with economic externalities. The role of the state in assigning
property rights versus the levying of taxes and/or subsidies has been the underlying
difference between them. According to ATAG air travel is the only means with access to
remote and isolated areas and therefore performs social work (ATAG, 2005).

36
Welfare economics is the part of the economic, where the possible effects of different
kinds of economic policy on the welfare of society are studied (Nath, 1969). Welfare
economics allow the separation of situations under which markets can bring good results
from situations where they will produce undesirable results (Morgan et al, 2009). Pigou
could be considered the founder of welfare economics. Pigou argued that it is obvious that
any transfer of income from a relatively rich to a relatively poor man of similar
temperament, should increase overall satisfaction, since it enables the overall satisfaction
in being able to meet more pressing needs at the expense of less pressing needs, which
provoked strong reactions from Robbins (Nath, 1969).
A very important aspect of welfare economics is the social welfare function. Bergson in
1939 was the first to introduce the concept of social welfare function (Nath, 1969). A
general form of the function is:
W=W(A1,…..Am)
Where W is the social welfare and A is the variables which determine the social welfare
(Nath, 1969).
A Pareto-social welfare function can be expressed as follows:
Fn=f (U1,…Un)
Welfare economics is based on two fundamental theorems (Scotter, 2008). The first
argues that any competitive equilibrium is a Pareto optimal balance for the economy.
Thus, demand equals to the production when the economy reaches the competitive
allocation. The second fundamental theorem is in a sense the opposite of the first, which
tells us that each Pareto optimal allocation of an economy can be achieved as a
competitive equilibrium for an appropriately defined distribution of income.

37
A situation is Pareto efficient if someone cannot be brought in a better situation without
worsening someone else’s. An example can be the airlines that pollute the environment
and create a negative externality on society.
According to the Coase theorem ‘in the markets with externalities if property rights are
clearly defined and if the parties can negotiate inexpensively, then the parties will reach a
Pareto-optimal outcome regardless of who owns the property rights’ (Scotter, 2008: 579).
A method of government intervention to mitigate the effects of externalities caused by
pollution is creating tradable pollution permits (Scotter, 2008). Each permit allows a
company to pollute up to a certain degree. The advantage of this method is that because
firms can pollute only if authorized and because the government decides how many
licenses will be available, knows exactly the amount of pollution after the sale of licenses
(Scotter, 2008).
For example, there are two airlines, A and B. Figure 6 shows the functions of the marginal
cost of reducing pollution. The regulator decides that pollution should be reduced and
decides to give allowances to allow a certain amount of pollution. Any company can
choose whether to buy allowances to continue polluting or reduce its activities to comply
with the regulation or take other measures (like operational improvements) to comply with
the pollution limit.
If airline A does not purchase further allowances, it will have to pay $ 4 for an equalizer
with the first unit of pollution and $ 6 for the second, so $ 10 in total. Airline B has a higher
marginal cost of reducing emissions, and will have to pay $ 14 to equal the emissions.

38
Figure 6: Functions of the marginal cost of reducing pollution for two airlines
When these rights are auctioned for airlines A and B, Company A will reach up to $ 10,
after that amount the company will not "bid" anymore since that would be the cost to "clean
up" its emissions. Company B could bid up to $ 14, but since Company A will stop at $10,
company B can earn additional rights with a price slightly above $ 10. By this way, a
reduction of emissions for the society is achieved at the lowest possible cost.
Because of the existence of external economies, people and companies do not pay the
true social costs for specific resources, but fewer (Allen et al, 2012). The more a company
pollutes the environment, the greater the social cost. The government can control the
output by imposing an emission charge (effluent fee) or by issuing transferable emissions
permits (Allen et al, 2012).
2.3 Principal Environmental issues in aviation
This section presents the principal environmental issues in aviation. Those issues are the
production of greenhouse gases that contribute to climate change, which is a global
phenomenon. The other issues are the noise pollution and the lowering of local air quality.

39
2.3.1 Greenhouse Gases
The combustion of fuel in the engines of airplanes results in emissions of carbon dioxide
(CO2), nitrogen oxides (called NOx) and water vapour and particles. Carbon dioxide is a
greenhouse gas and alters the balance of incoming and outgoing radiation from the earth's
surface and contributes to the warming of the atmosphere. Emissions of carbon dioxide
from the air have the same effect on the climate, such as terrestrial broadcasting, from
power plants, industries etc. Carbon dioxide has an atmospheric lifetime of up to 200
years, so it reaches the lowest point of the atmosphere for all that time and it does not
matter where it is emitted from (Archer, 2011; Seinfeld and Pandis, 2006).
Emissions of nitrogen cause a series of chemical reactions in the atmosphere. Nitrogen
oxides form ozone (O3) in the presence of light, and as the light intensity is higher in
altitude, the more ozone is formed because of altitude than from terrestrial sources of
NOx. The nitrogen oxide emissions from subsonic aircraft accelerate local production of
ozone in the lower atmosphere, where the aircraft usually flies. The increase in ozone
concentration will generally be proportional to the amount of nitrogen oxides emitted by
airplanes.
Ozone is a powerful greenhouse gas, whose concentration is highly variable and
controlled by the atmospheric chemistry and dynamics. The increase in the retention of
radiation by ozone is greater than that of carbon dioxide emissions. However, ozone is
responsible for the destruction of atmospheric methane (CH4). Methane is also a powerful
greenhouse gas, with an atmospheric lifetime of 14 years. The destruction of methane as
a direct result of civil aviation leads to the reduction of global warming caused by aviation
emissions (Seinfeld and Pandis, 2006).
Water vapour is also an important greenhouse gas, but emissions of water vapour only by
air have little direct impact on the planet. Water vapour have short atmospheric lifetime

40
and is controlled by the hydrological cycle. The vapour emissions at high altitudes produce
contrails, a cloud-like trail behind the aircraft and are visible from the ground. These
contrails also trap heat in the atmosphere and their thermal effects are believed to be
equivalent to that of carbon dioxide. The contrails are not formed at lower altitudes, so they
could be avoided if the planes flew lower. This however could not be done because the
density at lower altitudes is greater and airplanes will burn more fuel (Archer, 2011;
Seinfeld and Pandis, 2006).
Emissions of sulphate and soot from burning also have little effect on the temperature of
the atmosphere. Traces of sulphate are present in the combustion and form aerosols of
sulphate compounds. Those reflect the incoming solar radiation back into space, and thus
have a small cooling effect. Conversely, small particles are produced from combustion
(soot) trap outgoing infrared radiation into the atmosphere and thus have little effect on
global warming. These are quantitatively insignificant and it is believed that they almost
cancel each other (Archer, 2011).
The key feature that is affected by "greenhouse gases" is radiation balance. This is the
balance between incoming solar radiation and microwave outgoing long-wave infrared
radiation. Any disturbance to the balance is called Radiative Forcing, RF and is expressed
as the change in energy flow in W / m2 (Committee on Radiative Forcing Effects on
Climate et al, 2005;Karakoc et al, 2016).
The RF does not account for the influence of a single flight a day, but the overall impact of
all known historical aviation emissions. IPCC has estimated that the change in RF
emissions from aviation in the pre-season is 0,049 W / m2 (Karakoc et al, 2016). The
effect of RF on aviation in terms of contribution to the general RF was estimated to be
3.5% in 1992 and 5% in 2050 (IPCC, 1999). The Aviation Climate Change Research
Initiative (ACCRI) researches the RF and claims that a 2% increase in fuel efficiency and a

41
decrease in NOx emissions thanks to advanced aircraft technologies and operational
procedures, combined with alternative fuels use, will decrease significantly the aviation’s
impact on climate change (Brasseuer et al, 2016).
To provide lift to an aircraft, thrust is produced by means of the combustion of an energy
source. This combustion produces noise due to the explosion processes of the energy
carrier, combined with that of moving parts of the engine, and chemical pollutants. The
exhaust composition is known to be 70% carbon dioxide (CO2), 29% water vapour (H2O)
and 1% of other pollutants such as the various oxides of nitrogen (NOX), carbon monoxide
(CO), oxides of sulphur (SOX), unburned hydrocarbons or volatile organic compounds
(VOCs), soot or particulate matter (PM) and other trace compounds (EEA, 2016). These
are considered to be local air quality (LAQ) pollutants or greenhouse gases (GHGs)
depending on whether the emissions occur near the ground or at altitude respectively;
though CO2 is always a GHG, not an LAQ pollutant.
Figure 7: Sectoral GHG emissions by IPCC sector (EEA, 2016)
Efforts to reduce NOX increase fuel consumption and other pollutants, while reducing
noise increases NOX and fuel consumption. The combustion of 1kg (1.25 litres) of

42
conventional jet fuel emits 3.15 kg of CO2. There are also indirect effects – warming and
cooling - due to contrails (though there are still major uncertainties regarding their precise
impact) (FAO, 2011).
2.3.2 Noise Pollution and Local Air Quality
Aviation noise negatively affects many people living around an airport or under a flight
path. Although noise performance has improved over the past fifty years, community
perception of noise pollution due to airlines’ operations is becoming more negative.
The traditional definition of noise is “unwanted or disturbing sound”. Sound becomes
unwanted when it either interferes with normal activities such as sleeping, conversation, or
disrupts or diminishes one’s quality of life. The perception of noise pollution differs from
person to person. The measurement of noise follows a standardised approach and noise
reference points for aircraft operations are established, but the effect person by person
differs. For instance, when a house is located far from a main road and it does not have
any traffic noise, the residents of this house might be more annoyed by aircraft noise than
others that are close to road traffic. For instance, when the noise is occurring when a
person is sleeping can be perceived as more annoying than when a person is eating.
Noise reference points from aircraft are (ICAO, 2010):
1. Fly over: 6,5 Km from the point that airplanes push the brake during the take-off
flight path
2. Sideline: the greater noise intensity recorded at any point of 450m from the runway
during take off
3. Approach: 2Km from the threshold of the runway during the approach.
According to Figure 8, in 2006 21.2 million people worldwide were exposed to noise due to
air transport at the level of 55DNL. While in 2036 the population exposed to that noise

43
level ranges from 26.6 to 34.1 million people (using a prediction based on the year 2006)
(ICAO, 2010: 23). Scenario 2 is considered quite possible and contains a number of
initiatives such as NextGen and SESAR.
Figure 8: World population exposed to noise exceeding 55DNL (ICAO, 2013a)
Noise-related charges are one of several types of airport charge. According to CAA CAP
1119 (2013) it is desirable that the airport authorities to consult the aircraft operators
regarding the proposed charges and to consider their views as well as the effect the
charges will have on them. Agreement between airports and operators is desirable, but
where it is not reached, the airport is free to impose the charges proposed, subject to a
right of appeal. According to ICAO Doc 9082 about the policies on Charges for Airports
and Air Navigation Services, noise-related charges should:
be levied only at airports experiencing noise problems;
designed to recover no more than the costs applied to the alleviation or prevention
of actual noise problems;

44
be associated with the landing fee, possibly by means of surcharges or rebates,
taking into account the noise certification provisions of ICAO Annex 16 in respect of
aircraft noise levels;
be non-discriminatory between users and
not be established at such levels as to be prohibitively high for the operation of
certain aircraft.
Apart from noise, aviation operations are influencing the local air quality (LAQ). Whilst CO2
is the greatest contributor towards climate change, at a local level several emissions are
known to be contributors to local air quality problems. The main contributors according to
CAA (2016) lowering the local air quality are a) nitrogen dioxide (NO2), b) nitric oxides
(NOx) and particulate matter (PM). Air pollution at airports arises from a combination of
aircraft and road traffic emissions (both passenger vehicles and vans and lorries collecting
air freight). The largest source of NOx at airports is usually not the aircraft but the surface
access routes. Unlike CO2, the production of NOx is not directly linked to fuel burn, and
therefore there has been a strong push from industry to regulate and minimise NOx
production (Independent Transport Commission, 2016).
The ICAO technical design standards limit emissions of NOx, carbon monoxide (CO) and
unburnt hydrocarbons (UHC). A specific EU legislation for aviation emissions contributing
to lowering the local air quality does not exist, but the general EU legislation establishing
limit values for the concerned pollutants (mainly NOx and particulates in the case of
aircraft emissions), being Directive 2008/50/EC on ambient air quality and cleaner air for
Europe and developing legislation, applies at and around airports just as they do
everywhere else in the EU according to EC (2016). Different airports have differing
obligations for monitoring and reporting air quality (CAA, 2016).

45
2.4 Measuring environmental impact
Negative externalities are an area that becomes more and more regulated. In order to
measure the efficiency of the regulations the externalities after they are identified they
need to be measured in order to monitor and evaluate the result of the implementation of
any solution. The environmental impacts of air transportation can be measured by certain
indicators. One of those according to IPCC (2007) is:
ΔΤs= λ ΔRF
The linear relationship between the change in global mean RF multiplied by the constant λ
and the global mean disordered surface temperature (ΔTs), where lambda is the
parameter of the climate sensitivity (Κ(W m-2)-1). The climate parameter sensitivity,
lambda, is found to be relatively stable in a Global climatic model (Global Climate Model,
GCM) but differ from GCM to GCM (CE, 2005: 29-30).
𝐆𝐖𝐏𝐱 =∫ 𝐚𝐱[𝐱(𝐭)]𝐝𝐭
𝐓𝐇
𝟎
∫ 𝐚𝐫𝐓𝐇
𝟎[𝐫(𝐭)]𝐝𝐭
Where TH is the Time Horizon, ax is the radiative efficiency arising from a unit increase in
atmospheric abundance of the substance (x) in question (in W m-2 kg-1), [x(t)] is the time-
dependent decay in the abundance of the instantaneous release of the substance, and r
refers to the reference substance in the denominator (CE, 2005: 30). The GWP is defined
as the ratio of the time-integrated RF resulting from the instantaneous release of 1kg of
trace element, relative to that of 1 kg of the reference gas (IPCC, 1999, CE, 2005: 30).
TED=P*PCI*ED
The above equation is used to measure the environmental degradation (Janic, 2007: 2).
Where:

46
TED is the total environmental degradation in monetary units
P is the population (number of people)
PCI is the Gross Domestic Product (GDP) per capita income (monetary units per
inhabitant)
ED is environmental degradation per unit gross domestic product
The above equation in case of examining carbon dioxide emissions can be modified as
follows (Janic, 2007: 13):
TE=P*D*FC*SE
Where:
TE is the total GHG emissions (tonnes)
P is the number of passengers
D is the average travel distance (kilometres or miles)
FC is the fuel consumption (tons per P / D)
SE are the specific emissions (tonnes of pollution per tonne of fuel consumed)
The Specific Fuel Consumption (SFC) is the quantity of fuel that produces a thrust unit in a
given moment of time. It is expressed in kilograms (Kg) of fuel per kiloNewton (kN) of
thrust per hour (Janic, 2007: 25). The SFC depends on the size of the aircraft (capacity)
and the number of engines. The largest aircraft have greater thrust produced by engines.
Furthermore, for large civil aircraft fuel consumption represents a large proportion of
operating costs, about 30%. Airlines therefore look to reduce costs by exploiting the

47
engine efficiency (ηₑ). Lower fuel consumption per machine means lower consumption of
non-renewable source of energy and therefore lower emissions of pollutants.
The Life-Cycle Assessment (LCA) method for quantifying the emissions, resources
consumed and environmental and health impacts associated with products (good and
services) has been internationally standardised since 1997. LCA takes into account a
product’s full life cycle from the extraction of resources, through production, use and
recycling, to the disposal of waste. Indicators help quantify the contributions to
environmental and health impacts such as climate change, smog, acidification, or cancer,
as well as the resources consumed and their scarcity.
The framework of an LCA is defined by a system boundary and a life-cycle inventory that
can vary according to the goals of a particular survey. The system boundary is defined by
the spatial, temporal and production chain limits (start and end points) of the process that
is being analysed. For example, the GHG balance of a crop grown for biofuel depends on
the size and location of the cultivation area (space boundary), the number of growing
seasons considered (time boundary), and whether fertilizer inputs and post-harvest
transport are considered (start and endpoint boundaries). Each step of the biofuel
production process involves energy and GHG uptake (inputs, e.g. uptake by plants and by
soil) as well as energy use and GHG emissions.

48
Figure 9: Changes in the proportion of CO2 emissions from EU and World international aviation and total CO2 emissions from all the industries (Data based in IEA statistics,
2015)
Table 2: CO2 emissions from EU and World international aviation and total CO2 emissions from all the industries (IEA statistics, 2015)
Year World CO2 emissions World Intl aviation
bunkers CO2 emissions
EU Intl Aviation bunkers
CO2 emissions
1971 13994.7 169.2 36.32
1975 15543.9 173.9 38.05
1980 17779.6 202.2 43.13
1985 18319.2 224.9 49.09
1990 20623 258.8 71.19
1995 21478 290.9 87.82
2000 23321.6 355 116.8
2005 27047.6 422.8 128.3
2010 29838.2 459.8 127.39
2012 31490.5 480.7 130.32
2013 32189.7 490.4 130.69
Table 2 shows the changes in CO2 emission indicator from international aviation in
relation to fossil fuel use, the EU and the world. In the EU, emissions from fossil fuels
reduce by about 5% in 1990-2009 (Leggett et al, 2012), while the emissions from aviation
fuel sold in the EU increased by approximately 89.5% for the period 1990-2013. This was
-10.00%
0.00%
10.00%
20.00%
30.00%
40.00%
50.00%
1965 1970 1975 1980 1985 1990 1995 2000 2005 2010 2015 2020
Change of CO2 emissions from fuel combustion
CO2 World CO2 World Int aviation CO2 EU Int Aviation

49
more than the increase in total emissions from Spain. Globally, also, aviation emissions
have increased faster than the total emissions of fossil fuels. ICAO estimates that CO2
emissions from all air transport (not only international) almost doubled in 1990 - 2006
(Leggett et al, 2012).
2.5 Fuel
The fuel cost is perhaps the biggest cost for the operation of a flight. The average price for
fuel for 2013 was just under $125 a barrel to IATA (2014a). After labour, fuel represents
the largest component of the cost for airlines. An effective and efficient way to reduce
costs is to consume less fuel. The fuel consumption differs considerably from route to
route compared to the weight of the aircraft, the wind conditions, altitude and more. In an
hourly flight, fuel costs are not accurate but estimated approximately. Fuel costs include all
relevant taxes for fuels established by each government and by some airport authorities
(Wensveen, 2007: 306).
Fuels account the global aviation industry is projected to reach $ 207 billion in 2012
(representing 33% of operating expenses at $ 110.0 / barrel of oil type Brent). This is an
increase of $ 31 billion for 2011. Operation of new, more direct routes, the realignment of
unprofitable routes and the improvement of traffic flow in the ground can reduce the cost of
the industry by 2.5 billion dollars annually. Individual efforts of airlines to improve their own
operational efficiency can yield significant savings. Each 1% improvement in fuel efficiency
across the industry can reduce the fuel bill by about $ 700 million per year according to
IATA (2014a).
The combustion of fuel depends on the stage / phase of the flight and the aircraft
consumes different amount of fuel. Emissions during a) the landing and take-off (landing
and take-off cycle, LTO), which includes all activities under 3,000 feet (1,000 meters) and
requires a lot of fuel consumption, and b) phase the ascend, the fixed altitude and descent
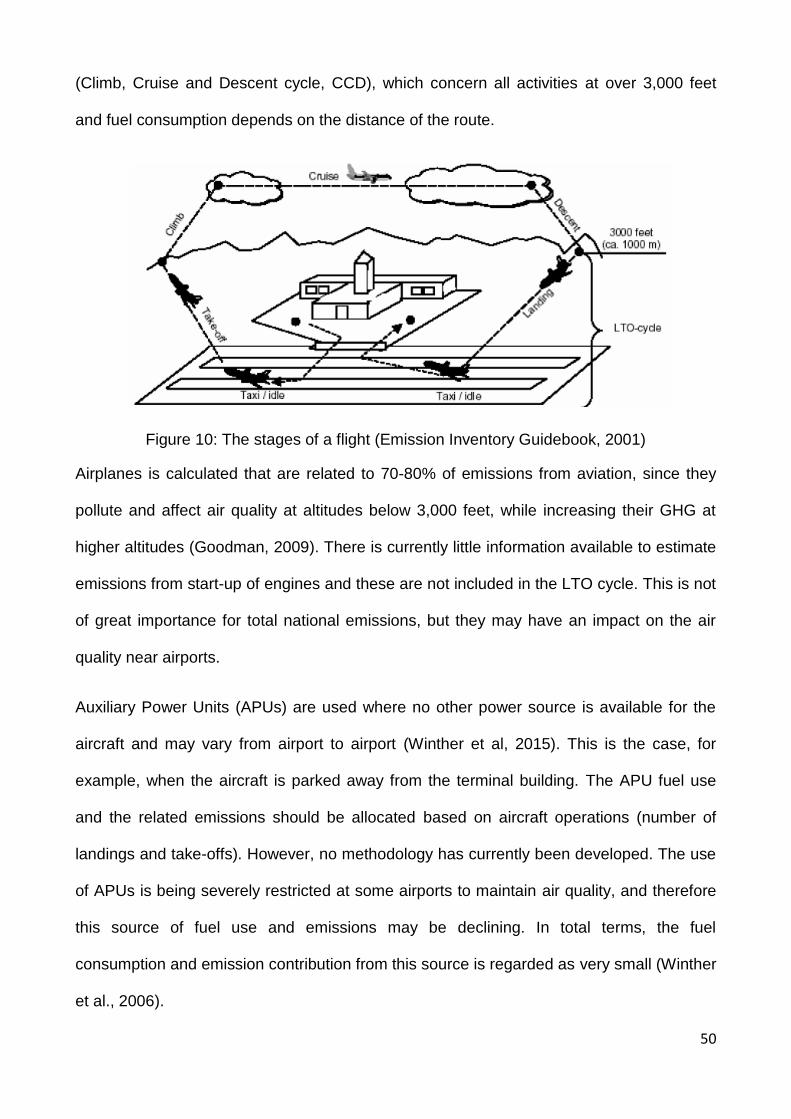
50
(Climb, Cruise and Descent cycle, CCD), which concern all activities at over 3,000 feet
and fuel consumption depends on the distance of the route.
Figure 10: The stages of a flight (Emission Inventory Guidebook, 2001)
Airplanes is calculated that are related to 70-80% of emissions from aviation, since they
pollute and affect air quality at altitudes below 3,000 feet, while increasing their GHG at
higher altitudes (Goodman, 2009). There is currently little information available to estimate
emissions from start-up of engines and these are not included in the LTO cycle. This is not
of great importance for total national emissions, but they may have an impact on the air
quality near airports.
Auxiliary Power Units (APUs) are used where no other power source is available for the
aircraft and may vary from airport to airport (Winther et al, 2015). This is the case, for
example, when the aircraft is parked away from the terminal building. The APU fuel use
and the related emissions should be allocated based on aircraft operations (number of
landings and take-offs). However, no methodology has currently been developed. The use
of APUs is being severely restricted at some airports to maintain air quality, and therefore
this source of fuel use and emissions may be declining. In total terms, the fuel
consumption and emission contribution from this source is regarded as very small (Winther
et al., 2006).

51
From time to time aircraft will have to dump fuel before landing so that they do not exceed
a certain maximum landing weight. This is done at a location and altitude where there will
be no local impact at ground level. Only large long-range aircraft will dump fuel. Non-
methane volatile organic compounds (NMVOC) emissions might become significant at
very large airports with frequent long distance flights (Winther et al., 2006). However, since
the most probable altitude of these emissions will be above 1 000 m, these are currently
not relevant for United Nations Economic Commission for Europe (UNECE) reporting
(Winther et al., 2006). The airport authorities and airline companies might give information
on the extent (frequency and amount) of dumping and the altitude at particular airports.
To calculate fuel consumption on a flight within the EU ETS an operator can follow any of
the following formulas that will give the same result (EC, 2012: 26):
FN,A=TN-TN+1+UN+1
Where:
FN,A: The fuel consumed for the flight test (N = flight)
TN: Amount of fuel contained in aircraft tanks after completion of fuel uplift for the flight
TN+1: Amount of fuel contained in aircraft tanks after completion of fuel uplift for
subsequent flight
UN+1: Fuel uplift for subsequent flight
FN,B=RN-1-RN+UN
Where:
FN,B: The fuel consumed for the flight test (N = flight)
RN-1: Amount of fuel remaining in aircraft tanks at the end of the previous flight

52
RN: Amount of fuel remaining in aircraft tanks at the end of the flight concerned
UN: Fuel uplift for the flight concerned
Airlines spend about $ 100 per minute / flight in the total operating costs (labour, fuel,
maintenance, etc.). If the paths were reduced by one minute that could reduce the total
industry operating cost over $ 1 billion per year and significantly reduce environmental
emissions. Improvements in traffic flows on the ground, departure and arrival and
rationalization of the existing Noise Abatement Departure Procedures (NADPs) can further
reduce fuel consumption and cost of the industry over 530 million dollars per year. Finally,
improving fuel efficiency by 1% across the industry can lower the fuel bill by around $2bn
per year at current fuel prices and reduce fuel costs by 700 million dollars per year (IATA,
2015). Improvements in air traffic management (ATM) and other operational procedures
could reduce the consumption of aviation fuel from 8 to 18%. The vast majority (6-12%) of
these reductions comes from expected improvements in ATM (IPCC, 1999: 11).
2.5.1 Biofuels
While fossil fuels come from ancient biomass, are not considered as biomass as they
contain carbon. As biomass is considered the biodegradable proportion of products, waste
and residues of biological origin from agriculture (both plant and animal substances),
forestry and related industries including fisheries and aquaculture, as well as the
biodegradable fraction of industrial and municipal waste as well as biofuels and bioliquids
(EC, 2012: 6). Biomass generally refers to any plant or material derived from a plant or
biodegradable material that can be used as fuel. The biomass can be converted directly
into liquid fuel or a biofuel for use as an alternative fuel. There are different types of
biofuels. The best-known are:

53
Ethanol, which is based on alcohol and is a high octane and clean burning
renewable fuel
Cellulosic ethanol, known as cellanol, is a complex carbohydrate, which is found in
plant cell walls.
Biodiesel is made through a chemical process called transesterification in which the
glycerol is separated from the fat or vegetable oil.
Synthetic fuel is any liquid fuel produced from coal, natural gas, or biomass.
Sometimes refers to fuels derived from other solids such as oil shale, tar, or waste
made of plastic.
The temperature, viscosity and opacity are a challenge for air quality biofuels. Such a fuel
that has proven successful is ethanol. Ethanol (Aviation-Grade Ethanol, AGE-85) is a high
performance, 85% ethanol content fuel mixture for use in any reciprocating aircraft engine.
AGE-85 has begun to replace the 100 octane low lead content in gasoline, which was the
standard leaded gasoline for aviation since World War II. The AGE-85 offers a substantial
improvement in performance of the aircraft and produces at least 12 percent more
horsepower and torque at typical cruising power. Lower operating temperatures are also
achieved with engines tend to operate at 50 to 100 ° C lower than with the current fuel.
Because the AGE-85 fuel causes significantly less accumulation of combustion products
into the engine, the time between engine repairs is greater and maintenance costs are
lower (Biedermann, 2015).
Fischer-Tropsch and Hydroprocessed Esters and Fatty Acids (HEFA) fuels were the first
alternative fuels approved for use in aviation (ICAO, 2013a). In 2006, the Commercial
Aviation Alternative Fuels Initiative (CAAFI), founded by U.S.-based aviation stakeholders,
was the first worldwide initiative promoting the development of alternative fuels for aviation
(ICAO, 2013a).

54
The CFM International has made a successful first test of the CFM56-7B engine using
biofuel from ester. CFM56-7B is the exclusive engine for Boeing Next-Generation with
airplanes 737-600 / -700 / -800 / -900. The thrust ranges from 18,500 to 27,300 Lb. The
biofuel used for this test was 30% vegetable oil methyl ester blended with 70%
conventional Jet A1-fuel. This test is designed to examine the operation of the jet engine
using a fuel made from biomass, without making technical changes to the engine. With this
type of biofuel, the target is a 20% reduction in CO2 emissions compared with current fuels
(NASA, 2009). In contrast to the oil price, the price of biomass is far from homogeneous
(De Laporte et al, 2016), i.e. shows large variations in European countries and depends on
the quality. The Commission expects a large increase in the use of biomass in the energy
sector until 2020 (Directive 2009/28/EC).
Los Angeles (LAX) is the world’s second airport that has incorporated biofuel into its
regular refuelling process. In 2016, KLM has signed a three-year contract for the supply of
sustainable biofuel for all its flights from there (KLM, 2016). South African Airways (SAA)
and Mango have operated a flight with a Boeing 737-800 from Johannesburg to Cape
Town powered with tobacco-based biofuels (SAA, 2016).
Environmental impact assessments show that the sustainability of alternative fuels
depends on the precise feedstock and supply chain used and that, depending on the
source, very low carbon fuels could be available as well as fuels that do not contribute to
decarbonisation.
The outcomes of different surveys have shown that Gas-to-Liquids (GTL) does not provide
a reduction in GHGs compared with conventional kerosene, even when carbon capture
and sequestration (CCS) is used during the manufacturing process (EC DG ENER, 2014;
Ecofys, 2014). There are studies in the literature that see the possibility of the equivalence
of GTL emissions with kerosene, but only with very high carbon capture efficiency and this

55
may also depend on the type of kerosene. From other studies, life-cycle Coal-to-liquids
(CTL) emissions are even higher than for GTL.
Until recently, aircraft operators have been reluctant to integrate the energy dimension into
their business models due to high costs of investment. Delta Airlines’ investment in the
energy sector by purchasing an oil refinery to produce its own conventional jet fuel was the
first of its kind, and represents a move towards a new business model (Coady et al, 2010).
This is not only a question of energy security, it could also be profitable when considering
the integration of bio-jet fuels, providing that airlines take the specificity of such end
products associated with the whole value chain into consideration, and that policy makers
address the price gap in order to provide a catalyst for the deployment of bio-jet fuels for
aviation. In another development, the Solena biofuels company had a long-term
agreement with British Airways to build a waste-to-biofuel plant (GreenAir, 2012).
Economics, including the market context, are as important as environmental constraints in
defining most promising alternative fuels for aviation. The cost of conventional jet fuel has
followed a very uneven path over the last ten years or so and if the cost of carbon is
factored in it could increase greatly over the next couple of decades.
Bio-jet fuels show a significant potential for emission reduction, depending on the process.
Biomass-to-Liquid (BTL) generally shows better performance than HRJ and while all the
BTLs considered meet the EU Renewable Energy Directive(RED) thresholds, this is not
always the case for HRJ. This is because hydro-processing uses hydrogen which induces
emissions in its production from natural gas. HRJ performance is also more dependent on
the type of feedstock and on the way this feedstock is produced or cultivated (Han et al.,
2013). Life-cycle emissions are very sensitive to the conditions considered for this
cultivation (World Economic Forum, 2010).

56
The European Union has launched the “Initiative Towards Sustainable Kerosene for
Aviation” (ITAKA) to produce sustainable bio-jet-fuel at a large enough scale to test its use
in normal flight operations. The “Aviation Initiative for Renewable Energy” in Germany
(AIREG) and “Bioqueroseno” in Spain, are also pursuing the development of a sustainable
bio-jet fuel industry (ICAO, 2013a).
Alternative fuels could make one of the highest contributions to reducing the carbon
footprint of aviation, and can reduce emissions of other pollutants such as particulate
matter responsible for air quality issues around airports. Biofuels should not be seen as
panacea though, since biofuels’ production can create a series of problems from land use
issues until high food prices. Nevertheless, biofuels are a considerable option for
mitigating CO2 and PM emissions (Kousoulidou and Lonza, 2016).
2.6 Summary
This chapter aimed at the several external costs (negative externalities) of air
transportation. The pollutants emitted noise and congestion costs both on the ground-
around airports and in the airspace adversely affect social welfare. The activities related to
aviation pollution on the air, produce GHG and contribute to climate change. Airplanes
pollute and affect air quality while increasing their GHG at higher altitudes.
The emissions are directly related to the fuel burn. Therefore, the reduction of the fuel burn
relates to the reduction of emissions. Airlines have an economic incentive to reduce the
fuel burn. Another solution for the airlines that want to be more environmentally friendly is
the use of alternative fuels. The alternative fuels and especially the biofuels can be a
promising solution for the aviation industry when are sustainably developed and used. A
number of schemes have been introduced in order to improve the sustainability of aviation
growth. The next chapter will explore the EU ETS regulation of climate change caused by
the aircraft operators in Europe.

57
3 EU Emissions Trading Scheme in aviation
Having discussed extensively about the negative externalities due to aviation in the
previous chapter, the next question that this study aims to address is the environmental
regulation through the Emissions Trading Scheme. Therefore, this chapter will examine its
implementation. European Commission has adopted several regulations to ‘save
environment’. In the aviation industry, the most important is the regulation about Noise
Pollution, i.e. Regulation (EU) No 598/2014 and Climate Change, i.e. EU ETS regulation.
3.1 Kyoto Protocol and European Union
According to Barrett (2009: 59), ‘Climate change may or may not be the most important
problem the world has ever faced, but it is certainly the greatest challenge for collective
action’. Over the past 50 years, the air transport industry has experienced rapid expansion
as technology has evolved and a steady decline in costs and prices was applied, which
encouraged further traffic growth (IPCC, 1999: 296). Transport is one of the major factors
for emissions in the planet. Emissions of carbon dioxide together with nitrogen oxide
contribute to the creation of the greenhouse effect, which adversely affects the climate.
Aviation has a severe contribution to global climate change. While total greenhouse gas
emissions in the EU increased by 5.5% from 1990 to 2003, emissions of carbon dioxide
caused only by international aviation in the 25 member states increased by 73% over the
same period (CE, 2005; ESA, 2006). Air transport to destinations outside the EU-25
accounted for 60% of these emissions. In 2005, CO2 emissions from all flights departing
from the EU-25 amounted to 142 Mt CO2 compared to the total weighted emission of
greenhouse gases of 4 980 Mt CO2 over the same period (EEA 2008, EC DG TREN,
2007).
The contribution of air transport in the EU-25 in the greenhouse emissions continue to rise,
reaching 12% of total greenhouse gas emissions from transport as a whole in 2005 (EEA,

58
2008: 26). Even though there have been significant improvements in aircraft technology
and operational efficiency, it was not enough to neutralize the effect of the growth in air
traffic. The environmental economics and natural resources have sailed at a parallel
course with the general economic theory at least since the 18th century, and all the great
classical economists have expressed, directly or indirectly, aspects concerning the
management of goods and environmental services. Environmental Economics is the
discipline that has as its object the study of environmental problems, in light of the
economics techniques (Field, 1994).
The International Air Transport Association (IATA) has requested the 10% of aircraft fuel to
be from alternative sources by 2017 (Chuck, 2016), a rate that is difficult to be reached by
2017. Hydrogen has been proposed as a long-term alternative to fossil fuels with low
emissions to power aircraft. Tests are done with unmanned airplanes using hydrogen-fuel
(Bradley et al., 2007).
On February 4, 1991, the Council authorized the Commission to participate on behalf of
the European Community in negotiations on the UN Framework Convention on Climate
Change, adopted in New York on 9 May 1992. The Framework Convention has been
ratified by the European Community by Council Decision 94/69 / EC of 15 December
1993. This Convention entered into force on March 21, 1994.The Framework Convention
has contributed significantly to the establishment of basic principles for combating climate
change globally. It defines the principle of "common but differentiated responsibilities." In
addition, it helped to improve further the public awareness, worldwide, as well as to the
problems associated with climate change. However, the contract does not include
quantified and detailed commitments by country to reduce greenhouse gas emissions.
The Contracting States to the Convention decided at the first meeting of the parties, held
in Berlin in March 1995, to negotiate a protocol regarding measure for the emissions

59
reduction for the period beyond 2000, to the industrialized countries. This protocol was
developed in Kyoto on December 11, 1997. The European Community signed the Protocol
on 29 April 1998. It represents a significant step in combating global warming as it includes
binding and quantified objectives for reducing greenhouse gases. The Kyoto Protocol
tackles emissions of six greenhouse gases:
1. carbon dioxide (CO2)
2. methane (CH4)
3. nitrous oxyde (N2O)
4. hydrofluorocarbons (HFC)
5. perfluorinated hydrocarbons (PFC)
6. sulfur hexafluoride (SF6).
To achieve these objectives, the Kyoto Protocol suggests various means:
stepping up or introducing national policies to reduce emissions (greater energy
efficiency, promotion of sustainable forms of agriculture, development of renewable
energy sources, etc.)
cooperation with other Contracting Parties (exchanges of experience or information,
coordination of national policies through emission permits, joint implementation, and
appropriate development mechanism).
On May 31, 2002, the European Union ratified the Kyoto Protocol. The Protocol entered
into force on February 16, 2005, following its ratification by Russia. Several industrialized
countries have refused to ratify the Protocol, including the United States and Australia. The
EU has reiterated its conditional offer to move to a 30% reduction by 2020 compared to
1990 level (UNFCCC, 2014b).

60
Table 3: The four phases of the Kyoto Protocol
The Kyoto Protocol has defined two mechanisms for carbon offset projects: The Clean
Development Mechanism (CDM) and the Joint Implementation (JI). The main difference
between the two mechanisms is that the first concerns investments in projects in
developing countries, whereas the second concerns investments in projects in developed
countries.
The Clean Development Mechanism (CDM) allows countries and companies to offset
their GHG emissions, in order to meet their Kyoto obligations and targets and at the same
time to assist developing countries in achieving sustainable development (UNFCCC,
2014a). The emissions reductions occurred by the CDM projects are reviewed and verified
by the UN (The Gold Standard, 2012: 16). The CDM is the main source of income for the
UNFCCC Adaptation Fund. This Fund was established to finance adaptation projects and
programmes in developing country parties to the Kyoto Protocol that are particularly
vulnerable to the adverse effects of climate change. In addition, since September 2007,
the CDM has self-financed its regulatory functions through fees charged to projects and no
longer relies on grants from the countries (Kollmuss, et al., 2010). The tradable unit under
the CDM is a Certified Emissions Reduction (CER). Each CER is equal to 1 metric ton of
CO2 emissions abated (Kollmuss et al., 2010).

61
The Joint Implementation (JI) mechanism is the instrument for offset projects happening
within countries with binding emission commitments under the Kyoto Protocol. The goal of
the program according to Kollmuss et al (2010: 59) is “to increase market efficiency by
allowing industrialized countries to meet a part of their obligation by investing in GHG
abatement projects in another industrialized or economies in transition (EIT) country if the
cost of abatement is lower in the other country” (Kollmuss, et al., 2010: 59). The tradable
unit under the JI program is an Emission Reduction Unit (ERU). Each ERU is equal to one
metric ton of carbon dioxide equivalent (mtCO2E) (Kollmuss et al., 2010).
Helm (2009:18) states that ‘Kyoto demonstrated how difficult it is to bring on board the
major players; and that a better and more comprehensive agreement could be achieved
without the Kyoto architecture getting in the way’. He also argues that the Kyoto and COP
did not have a sufficient impact on climate change mitigation because they did not include
aviation and shipping. The allocation of responsibility for the existing stock of carbon, the
fact that some countries may benefit from climate change, the free-rider incentives and the
difficult measuring of emissions make climate change intractable (Helm, 2009). According
to Barrett (2009) what makes Montreal protocol work in comparison to Kyoto protocol is
the permanent cuts in comparison to the five-year Kyoto target. Barrett (2009: 69) argues
that ‘An effective climate agreement must impose obligations that can be ratcheted up,
and that are immune to backsliding.
The largest and most important emissions trading scheme is developed by European
Union and is based on requirements of the Kyoto Protocol. The EU ETS concerns 25
countries. It is the largest emissions trading system and the first interstate system because
it contains more than one country (Anger & Kohler, 2010). The success of the system lies
in its ability to maintain a relatively stable carbon price, which gives an incentive for

62
companies to take environmental protection measures (Anger & Kohler, 2010). The first
phase, i.e. the period 2005-2007, was considered the trial period (Tietenberg, 2006).
The European emissions trading scheme differs from other Emissions Trading Schemes in
terms of (Grubb & Neuhoff, 2006):
The economic scale of the system, which exerts high pressure in the distribution
and raises concerns about competitiveness, which paradoxically is the source of
profit motivation unprecedented in the history of environmental policy
The small size of the cuts relative to the «business-as-usual» and resulting
instabilities in the system
The corresponding high percentage of free allocation, which underlies legal
pressures and the scope for distortions
The multi-periodic nature of the distributions
The responsibilities’ allocation to Member States and how it affects the sustainable
solutions.
3.2 EU Emissions Trading Scheme inclusion of Aviation
The EU ETS is one of the main instruments used by the EU to reach the statutory
reduction of greenhouse gas targets. The EU ETS is a «cap and trade» scheme. Under
the EU ETS, the European Union (EU), plus Iceland, Liechtenstein and Norway have set a
ceiling or a maximum amount for annual emissions of carbon dioxide (CO2) from large
industrial sources (Kantareva et al, 2016).
Global carbon markets can be divided into two categories: the regulator (or compliance)
and the voluntary market. The Emission Trading Scheme belongs to the first category, the
regulatory market. Trade of pollutants is used by governments to reduce greenhouse gas
emissions (GHG). The ETS uses various mechanisms of the economy to create a price on

63
emissions. The carbon trading involves trading of rights (permits, allowances, credits) to
emit a certain amount of emissions. Because of this commercial dimension, an economic
incentive is created (Preston et al, 2012). For example, airlines reduce their emissions or
acquire emission units from other projects under the auspices of the ETS and / or by
investing in reduction strategies.
A quantity of "allowances" or permits to emit one metric ton of CO2 is given or it needs to
be bought by each individual. At the end of each year, each emission source must return
the allowances at least equal to its emissions for the year. In case, that the source does
not return with sufficient allowances it will have to pay a fine. As time passes by, the
emission ceilings will be reduced and fewer allowances will be issued, causing CO2
emissions to be reduced because of the level established by the ceiling (Leggett et al,
2012; Meleo et al, 2016).
The original European application of the Kyoto Protocol did not include emissions from
aviation. In 2008, the European Parliament and the Council adopted a new law, Directive
2008/101 / EC, amending the EU ETS (Directive 2003/87 / EC) to include aviation
activities. The EU ETS in aviation is only about CO2 emissions from airplanes (Kantareva
et al, 2016).
For every MT CO2 emitted by a source, should be transformed to a right/allowance. For
2012, the 85% of emission allowances in aviation were offered free to aircraft users and
the 15% were auctioned (EC, 2016). For the period 2013-2020, the 83% are offered free,
the 15% are auctioned whereas the remaining 3% are banked for new entrants in the
market or for fast growing airlines (EC, 2016). This intertemporal flexibility reduces the
overall compliance costs (Kling and Rubin 1997; Tietenberg 2010; Ellerman et al. 2003;
Ellerman 2002; Ellerman and Montero, 2002, SchleichI, Ehrhart, Hoppe, Seifert, 2006).

64
The initial allocation to the units is done through a benchmark system regarding the tone-
kilometres that the aircraft flown from, to or within the EU during 2010. Every unit is
receiving the 0.6797 free allowances (baseline) for every 1,000 tonkilometers of flight. For
the period 2013-2020 the cap is reduced to 95% from the emissions from 2004-2006, the
target is also further reduced (Leggett et al, 2012:12). In phase three, an airline receives
0.6422 allowances per 1,000 tonne-kilometres flown (EC, 2016). The cap on total
allowances for phase three has been set at 210,349,264 per year. This is equivalent to
95% of 'historical' emissions (EC, 2016). As smaller the quantity of free allocated
allowances is, the bigger the associated cost for the aircraft operators (ΙΑΤΑ economics,
2013).
Airlines requiring more allowances can purchase them from EU auctions, other carriers
and other sources of emissions in the EU ETS or other international emissions trading
mechanisms. A small reserve of free allowances will be available for new or rapidly
expanding airlines (Anger & Kohler, 2010; EC, 2016).The entry into force of the EU
legislation covering emissions from international aviation is a significant move in the last
two decades regarding whether and how the aviation CO2 emissions can be mitigated.
According to the rules of the UNFCCC (2014a), almost all the emissions are calculated in
the country where they occur. Much of the emissions associated with international air
transport, however, take place in international airspace.
Aviation emissions could be counted and regulated by the country where the aviation fuel
is sold. However, small countries (such as Malta), for which the aviation and shipping fuel
sales are an unusually large part of the economy, have objections to this choice. Partly it
will have little influence on technologies used by carriers based somewhere else. They
also argue that, if not all countries, that sell aviation fuel, regulate emissions, fuel sales will

65
turn into uncontrollable point. This could result in financial transfers, losses and carbon
leakage (Leggett et al, 2012).
To minimize compliance costs and to provide flexibility to sources, the EU ETS permits
allowances to be negotiated. A source that has more allowances than necessary can sell
the extra to another source that needs more, or to other entities, such as "allowances
agent". The amount of the purchased allowances affects the price for the allowances. It is
the aim to establish price of allowances, which are higher compared to the costs of
reducing emissions by one ton. This aim gives economic incentives to reduce the amount
of emission and to sell unused allowances to other polluters. It also gives businesses (e.g.,
technology companies) incentive to develop new, lower-cost means of reducing emissions
(Kantareva et al, 2016).
Directive 2008/101/EC amended the EU ETS Directive 2003/87/EC and included aviation
activities within the scope of the ETS as follows:
All Member states from the European Economic Area (EEA) – including Iceland,
Norway, and Liechtenstein – participate in the EU ETS.
Total emissions are covered from flights that depart and arrive at EEA aerodromes
(hereafter "intra-EEA flights"), from flights that depart from EEA aerodromes to
destinations in third countries, and from flights that arrive at an EEA aerodrome
from third countries (the flights to and from third countries are hereafter referred to
as "extra-EEA flights").
The emission cap from 2013 onwards has been set at 95 % of the average historic
aviation emissions for the period from 2004 to 2006.
Aircraft operators have been obliged to start emissions reporting in 2010 and full
compliance – including surrendering of allowances – in 2012.

66
The EU ETS excludes certain types of flights from the cap-and-trade system, such as
flights from airports that do not belong to EU Member State, flights transferring governors,
military aircraft, search and rescue flights, circular flights, Public Service Obligation (PSO)
and flights for training purposes (EC, 2016). Furthermore, flights under the de minimis
criteria are excluded. These criteria include flights with airplanes with maximum certified
take-off weight of less than 5,700 kg, flights from airlines with less than 243 flights for 3
continues 4-month periods or flights with annual emissions under 10,000 Mt per year
(Kantareva et al, 2016)..
An airline that needs more allowances that the ones that allocated to it for free, can bit in
the auctions that are frequently organised by the national governments or the market that
holds allowances that wants to sell (EC, 2016). Because the high needs of airlines are part
of an open system of emissions trading, the allowances can be purchased from entities
from other sources (i.e. non-airlines) that are part of EU ETS or from credible/approved
sources that have excess allowances coming from projects of developing countries.
Moreover, airlines that have excess allowances can sell to other entities too (Anger &
Kohler, 2010).
If an airline does not comply with the EU ETS there is a fine for excessing the permitted
quantities. The fine is 100 € for every tome of CO2 that is above the allowances allocated,
a quantity many times higher than the expected prices in the carbon market. The air carrier
is also responsible for the submission of allowances for the next year’s emissions. The EC
regulation took under consideration also the situation when an air carrier does not comply
from for than a year to the regulation. The worst-case scenario is that the carrier will not be
allowed to operate to the EU (Leggett et al, 2012).
The Member State is required to inform and consult the EC on how they will use the profit
coming from EU ETS. There are concerns if the revenue will be used for the aviation

67
industry and/or for the decrease of the Green House Gases (GHG) (Leggett et al, 2012).
Within each Member State, a designated “competent authority” is responsible for
administering the EU ETS with respect to airlines. To reduce administrative costs, each
operator is administered by a single Member State, the one that issued its operating
licence or by the state with the greatest estimated attributed aviation emissions from that
operator in the base year (EC, 2016).
Airlines can be allocated to the Member State to and from which most of their flights
operate. Given the role of London’s Heathrow Airport as a significant hub for flights into
and out of Europe, a large number of airlines have been assigned to the UK. Germany,
France, Spain and the Netherlands also act as administering States for a large number of
carriers. Thus, there is high administration cost related to EU ETS for those countries.
Forsyth (2008) argues that an air transport specific ETS would be an inefficient means of
achieving a country’s targets. He also argues that the emissions reductions in aviation may
be quite small, because they do not have much scope to reduce. Nonetheless, if the ETS
operates sufficiently overall, there is no problem if aviation does not achieve a great
reduction in emissions. The regulation has different percentages for the different options
for allowances in the area of aviation.
The EC is following a multisectorial/multidimensional approach in handling the GHGs from
aviation taking measures in the Member States separately and all together. According to
EC (2016) EU ETS is one of the many measures the EC is using to handle environmental
problems in aviation (Cui et al, 2016). Other measures are for example research projects
for technology and biofuels, like Clean Sky Joint Undertaking or changes in the airspace
structure like SES.
New Zealand is using an emissions trading scheme for domestic flights. Under this
scheme, biofuels with or without sustainability requirement are not included, whereas in

68
the EU ETS the biofuel need to comply with sustainability criteria. This would make the
possible link between EU ETS and New Zealand ETS more complicated. Australia
introduced a single price for carbon as an additional charge for aviation in 2012. The
airlines can choose if this extra charge is through the airlines or the fuel provider. Australia
and EC agreed to connect their ETS from 2015 and both sides to acknowledge-accept the
emission allowances until the 2018 the latest (ΙΑΤΑ, 2012).
IATA (2013b) stated that ‘if the European Parliament and Council agree on the decision of
derogating from Directive 2003/87/EC is adopted by and made permanent; the cost of the
EU ETS is estimated at 30 million Euros in 2012 and 130 million Euros in 2020. That is
significantly lower than the cost incurred without derogation, which is estimated at 300
million Euros in 2012 and 1.5 billion Euros in 2020’.
EC suspended the application of the Emissions Trading Scheme to all the airlines
overflying Europe pending new impetus that might be given by the ICAO Council to find a
multilateral solution to combating climate change in the aviation sector. European
Commission decided to ‘stop the clock’ (Decision No. 377/2013/EU). According to this
Decision air carries that depart or land to an EEA airport are not obliged to surrender any
allowances back and are exempted from the EU ETS. Carriers that depart and land to an
EEA airport are obliged to submit the same amount of allowances they were given. For
example, a flight from JFK to FRA is not subject to EU ETS, but a flight from HRW is
subject to EU ETS. Emissions from flights between aerodromes in the European Economic
Area (EEA) remain fully covered under the EU ETS. Flights from and to outermost regions
are excluded, with the exception of Canary Islands, Melilla, Ceuta Aland Islands, French
Guiana, Guadeloupe, Martinique, Reunion, Saint Martin, Azores, Madeira, Jan Mayen,
Gibraltar (EC, 2013).

69
The emission factor from biofuels according to the EU ETS is zero. Therefore, there is no
need to return allowances and possible future costs are avoided. If the materials or fuels
containing both, and fossil and biomass percentage, the percentage of biomass is the
‘calculation factor’ (EC, 2012).
Sustainability criteria should be applied to biofuels and bio-liquids consumed in order to
assure that they have a zero emissions of greenhouse gases in the activities of the aircraft
operator covered by EU ETS. A biogenic material that does not comply with the
sustainability criteria of the Directive on Renewable Energy, as applicable, is considered
as a mineral, i.e. the emission factor is greater than zero (EC, 2012). Last year, nine
additional ETS programs started in North America, Central Asia and East Asia. Three
additional schemes are to follow in 2014 –2015, bringing the expected total up to 16 by
2015.
3.3 Principles of carbon offsetting
Carbon Offsetting projects are an attempt to internalise the externalities associated with
anthropogenic climate change. According to Golden Standards’ Carbon Offset Handbook,
Carbon Offsetting is “the financing of emission reductions outside of your flight’s
emissions.” (The Gold Standard, 2012: 8) There are several ways of offsetting carbon
emissions, ranging from purchasing carbon allowances from a cap-and-trade scheme, to
using carbon credits from unregulated or regulated carbon offset projects (The Gold
Standard, 2012). Each airpassenger can pay to offset the emissions caused by their share
of the flight’s emissions. Passengers can offset their emissions by investing in carbon
reduction projects that generate carbon credits. For example a passenger when booking
the ticket has the choise of donating money for instance to the Envira Amazonia Project.
Envira Amazonia is a payment for ecosystem services forest conservation project,

70
otherwise known as a Reduced Emissions from Deforestation and Degradation (REDD+)
project, protecting nearly 500,000 acres / 200,000 hectares of tropical rainforest.
In addition, IATA discribes market possibilities for Carbon Offsetting. There are two
markets for carbon offsets in aviation and in the overall industry: the voluntary and the
compliance market. Both of them are a way for individuals or organizations to “neutralize”
the proportion of aircraft’s carbon emissions on a particular journey by investing in carbon
reduction projects according to IATA (2016a). Furthermore, there is also the possibility
that indivudal customers participate directly in Carbon Ofsetting programs. Each
airpassenger can pay to offset the emissions caused by their share of the flight’s
emissions. Passengers can offset their emissions by investing in carbon reduction projects
that generate carbon credits.
The main goal of buying carbon offsets is that they should generate genuine emissions
reductions. In order to ensure the quality of the offset programmes, the following principles
should be respected (Ecosystem Marketplace, 2014) (IATA, 2008a):
Additionality. Additionality is the principle that carbon credits can only be awarded
to projects that would not have happened under a “business as usual” scenario.
Verification. Verification is the process, through which an external independent
party quantifies, verifies and confirms the accuracy of estimates. With respect to
these guidelines, it applies in particular to emissions of CO2 from airlines and also
to CO2 reductions achieved through offset programmes.
Traceability. Traceability is reached through a receipt given to the customer
indicating the type of the project or the quality standard that the offset meets. By
this way, it can be ensured that the carbon offset has not been used before and will
not be resold to other customers in the future.

71
Complementarity. Carbon offsets purchased should be part of wider efforts to
reduce emissions alongside technological and operational improvements in fuel
efficiency.
Registration. Registration is used to keep track of offsets and diminish the risk of
double counting. Moreover, registries also clarify the ownership of the offsets by a
serial number.
Guarantee. When purchasing emissions reduction, it should be guaranteed that in
case of failure, and alternative and equivalent offset will be made.
3.4 Trading Units and carbon prices
According to ICAO, (Doc 9885, 2008) one allowance is generally defined as a permit to
emit one tonne of CO2-equivalent. There are companies that have excess credits,
meaning they stay under the cap and have spare allowances that they can sell to other
companies that exceed their allowances. This practice is based on the financial incentive
of the buying/selling process. Consequently, trading emissions allowances is a way to
offset carbon (The Gold Standard, 2012: 16). The credits offered by the International
Emissions Trading are called Assigned Amount Units (AAUs). Additionally, to AAUs
tradable units and pricing information for offset credits under the EU ETS are based on
those used for the CDM and JI project-based mechanisms respectively (Kollmuss, et al.,
2010).
There are two principal types of carbon credits: certified emission reductions (CERs),
which are backed by the UN, and voluntary emission reductions (VERs). VERs are backed
by recognised quality standards such as the Voluntary Carbon Standard (VCS) and the
Gold Standard. VERs play an important role in emission projects with high sustainable
development benefits (IATA, 2008a).

72
Table 4: A comparison of CERs and VERs (IATA, 2008a)
The project type, its location, the market demand and the stringency of the offset program
requirements influence and set the offset prices. Offset prices in the compliance market
are driven primarily by the supply of and demand for offsets and allowances. Therefore,
the prices for mandatory market are higher than those of the voluntary offsets (Kollmuss et
al, 2010).
There is a close relationship between carbon prices and industrial production. When
increasing industrial production, rising and associated carbon emissions, need higher
allowances to cover their emissions. However, due to tighter restrictions on the demand
side under ceteris paribus, the carbon prices rise (Chevallier, 2012).
As stated earlier, the airlines have also the option to bank the excess allowances for future
use. Allowing carriers to bank allowances for future use reduces social costs by efficiently
distributing abatement choices among different time periods (Fell et al, 2008). The
literature focuses on price versus quantity regulation and little attention is paid to prices
versus bankable quantities. Wietzman (1974) researched extensively the topic price
versus quantity regulation. He argues that differences in the relative efficiency between
price and quantity controls are a result of the difference in marginal benefit and cost slopes
as well as the degree of the prevailing uncertainty in the markets. According to Laffont

73
(1977), uncertainty in the marginal costs function creates an information gap on the side of
the regulator. The regulator faces uncertainty about the demand that will arise for the
allowances. If the expected marginal benefit function from reducing emissions is flater
relative to the marginal cost of abatement, then a price control is preferred. If, however,
the marginal benefit function is steeper, then a quantity control is preferred (Weitzman,
1974).
According to Weitzman (2014), setting an internationally harmonized carbon price involves
only one layer of negotiations as opposed to two on quantity side. The EU ETS includes
many countries and a common decision needs to be reached. According to a quantity-
based system, the EU members need to agree on the single aggregate level of emissions
or allowances as well as the distribution of aggregate allowances/emissions among them.
On the other hand, under the price-based system they need to agree on a uniform price,
which is more complicated and difficult to reach agreement.
With cap-and-trade, the total carbon emissions are known but the price or (marginal) cost
is uncertain, whereas in the carbon tax the opposite happens. According to Weitzman
(2014) the political appeal of giving free allowance permits to carbon-intensive industry
groups makes the ETS more favourable to politicians. Grodecka and Kuralbayeva (2015)
argue that hybrid instruments, i.e. a combination of price and quantity mechanisms, are
superior to the sole use of either policies considered. They conclude that a cap-and-trade
mechanism with banking or borrowing possibilities when considered quantity based
regulation, can make quantity policies more flexible.
One key feature of EU ETS is its role in international efficiency and collaboration (Hepburn
and Stern, 2009). The Clean Development Mechanism (CDM) of the Kyoto Protocol offers
units falling in EU ETS able to reduce costs through the acquisition of emission rights from
developing countries (Chevallier, 2012). The CDM concerns Certified Emissions

74
Reductions (CERs). One CER is equal to one tonne of emission reduction CO2, while one
European Union Allowance (EUA) is equal to one tonne of CO2 emission allowances in the
atmosphere (Chevallier, 2012: 106). However, there is a limitation in the amount of CER s
purchased to comply with EU ETS. CDM received criticism due to the fact that it reduces
the incentives of developing-country governments to enact policies reducing emissions
(Hepburn and Stern, 2009).
There is uncertainty in estimating the costs for aircraft operators. This is associated with
the price of allowances. There are two types of allowances that can be used: The
European Union Aviation Allowances (EUAAs) and the European Union Allowances
(EUAs). Credits of carbon dioxide from the flexible mechanisms of the Kyoto Protocol can
also be used, but the limits imposed by EU ETS for 2013-2020 are significantly restricting
the use of these funds (IATA, 2013b).
Table 5 Cost of purchasing allowances in EU ETS (IATA, 2013b)
Over the past years, the prices for EUAs have changed greatly, with the maximum value
being 240% greater than the minimum by the examination of the same asset class. Policy
makers are considering various proposals to support the prices of EUA either through

75
delayed auction either by removing rights to create greater market tightness (IATA,
2013b).
According to ICAO (Doc 9951, 2011) most airlines provide a fair degree of transparency
about the price of offsetting a flight. There is a huge variation between the prices per tonne
of CO2 that customers can pay to offset their aviation emissions.
Countries, including developing and emerging economies, have taken action on emissions
from aviation through more efficient airspace design, consideration of appropriate market-
based measures (MBMs), as well as initiatives relating to alternative fuels and the
development of a comprehensive emissions inventory (WWF, 2012).
3.5 Auction of Allowances and airlines’ decisions making
The largest emissions trading market is the European Union Emissions Trading Scheme
(EU ETS), which uses a combination of free allowances from governments and auctions.
Initially the aircraft operators were given free allowances based on their historical
emissions. This method is known as grandfathering allocation. The initial allowances were
calculated with the benchmarking method that was only relying on the tone-kilometre and
the aircraft type. The allocation from with the two above methods cannot be altered. The
last allocation method that is used in the aviation sector is the allocation through auctions.
Auctions compared with the allocation of free allowances offer the advantage of better
distribution, as stakeholders who need more allowances can obtain those allowances
(Cong & Wei, 2012). The Kyoto protocol in order to help countries to achieve an effective
reduction of emissions, introduced three flexible mechanisms (Cong & Wei, 2012):
Emissions Trade (ET),
Joint Implementation (JI) and
Clean Development Mechanism (CDM).

76
In auctions there is a seller or buyer of a particular product / service (or products /
services) and a number of bidders or sellers competing by submitting bids. The auctioning
is one of the «purer» market forms according to Vettas & Katsoulakos (2004). A
Regulatory Authority may organize auctions where companies buy licenses (such as
licenses spectrum uses) or auctions where companies compete for a specific offered
service. The European Energy Exchange (EEX) is a secondary market and is the only
exchange in Europe with experience in EUA auctions on a regular basis. During Phase II
of the EU ETS, it has successfully carried out weekly EUA primary market auctions for
Germany, The Netherlands (2011/12) and Lithuania (in 2011/2012) (EEX, 2012).
Moreover, it has set a minimum amount of about 500 EUAAs (= 500 t CO2eq) (Minimum
lot size) per transaction (EEX, 2013).
A distinction of auctions is open type and sealed deals. The open type auctions may be
with increasing bids (English style) or with decreasing bids (Dutch) (Vettas & Katsoulakos,
2004). The English auction (Ascending price auction) is the oldest and most famous
auction type. The sale is conducted by the auctioneer starting from a low value, which is
increased by small increments. Here are at least two bidders. The auction ends when only
one biller remains at the end.
On the other hand, the Dutch auction (Descending price auction) is not widespread and
rarely used. In this case, the auction with a price so high that probably no one is interested
in buying and then the value decreases continuously until a bidder express an interest and
purchases the product at the price proposed.
There are two types of auctions, static / sealed and dynamic / clock auctions (Cong & Wei,
2012). Static auction can be further divided into single price auction, discriminatory price
auction and second price auction, according to the different settlement price of the market.
Alsemgeest et al. (from (Cong & Wei, 2012)) based on an economic experiment compared

77
the English clock auction with sealed uniform price auctions, and found that when
communication between candidates were prohibited and the market clearing price was
announced after each round of the auction the sealed unit price gathered more revenue for
the auctioneer from the English clock auction, which means that the bidders were easier to
conspire in the English clock auction.
According to Klemperer (2002) a well-designed auction is very important. The two issues
that really matter are a) to attract entry and b) preventing collusion (Klemperer, 2002). He
argued that a good auction mechanism should be able to prevent bidders from collusion
between them. According to Vetta and Katsoulakos (2004) it should be given close
attention to how precisely an auction is planned and executed. The auctions are more
flexible than selling in a fixed price and less time consuming to negotiate a price (Menezes
& Monteiro, 2008).
The German auctions on the EEX follow the process of a single price, which is the EU's
usual practice according to the German Emissions Trading Authority (DEHSt, 2012). It is a
bidding round with closed 'book of bids". This simple and robust procedure protects
against market manipulation and continued to be used for the auctions in the third trading
period (2013-2020) for aviation. The common procedure in prices means that all
contractors pay the same price. The auction clearing price is determined by ranking all
eligible bids, beginning with the highest bid, according to the bid price. In case of equal
tenders, bids are sorted by a random process. The number of tenders is counted starting
from the highest offer until the volume of offered allowances is reached. The bid price at
which the total volume of bids reaches or exceeds the offered volume of auctioned
allowances determines the auction clearing price.
Between October and December 2012, 23,531 million allowances of the third trading
period (EUA), were auctioned weekly in EEX. In addition, 2.5 million EUAAs were

78
auctioned in 2012 for air transport in the ETS yielding 17.525 million Euro (DEHSt, 2012).
Around 15% of EUAAs, i.e. around 30 million euro per year will be auctioned from 2012
until 2020 (EEX, 2012).
Table 6 German early auctions of the third trading period (Early Auctions) and the EUAA auction of 2012 (DEHSt, 2012)
Table 7: EUAA auction in 2012 (EEX, 2012)
The ‘Stop-the-clock’ Decision foresees auctioning of 15 % of 2012 aviation allowances in
circulation. Returned 2012 aviation allowances were cancelled and thus were not
considered as allowances in circulation. Allowances not auctioned before 1 May 2013, will
be auctioned as 2013-2020 aviation allowances instead. Table 8 depicts slightly increasing
prices on certain occasions. The increase is not considerable but it may be attributed to
the flights number increase during the summer season.

79
Table 8: EUAAs Spot Primary Market Auction Report 2015 (EEX, 2016)
Date Auction
Price €/tCO2
Min Bid €/tCO2
Maximum Bid €/tCO2
Number of Bidders
Number of Successful
Bidders
Auction Volume tCO2
Total Revenue €
14/01/15 6.99 5 7.16 12 10 1,494,000 10,443,060
28/01/15 6.56 2 6.80 11 8 1,494,000 9,800,640
11/02/15 6.87 6.42 7.10 9 8 1,494,000 10,263,780
25/02/15 7.35 6.47 8 9 6 1,447,500 10,639,125
11/03/15 6.48 6.32 6.77 11 8 1,494,000 9,681,120
25/03/15 6.88 6.5 7.01 11 2 433,500 2,982,480
22/04/15 6.75 6.38 7.10 11 11 1,493,500 10,081,125
06/05/15 7.25 6.51 7.50 11 6 935,000 6,778,750
01/07/15 7.16 6.94 7.50 12 6 935,000 6,694,600
07/10/15 7.97 7.60 8.15 14 5 781,500 6,228,555
04/11/15 8.25 8.01 8.38 11 3 933,000 7,697,250
05/11/15 8.25 8.01 8.38 11 3 933,000 7,697,250
20/01/16 6.57 5.95 6.65 12 5 683,500 4,490,595
The seller seeks to maximize its income, which is through the price paid by the purchaser
or, more precisely the expected utility of the price, as this is usually uncertain. The seller,
however, can have also other purposes than profit maximization and can make another
selection. For example, if a Greek carrier auctioning its extra allowances might be
interested in the identity of those who acquire them (perhaps because they are competing
carriers whose position is strengthened excessively with the sale of such allowances).
In the process of the auction, a bidder faces three types of uncertainty, a) uncertainty
regarding the value of the item being auctioned, b) strategic uncertainty related to the
strategies followed by the other players and c) uncertainty about the characteristics of his
02468
10121416
Sum of Auction Price €/tCO2
Sum of Minimum Bid €/tCO2
Sum of Maximum Bid €/tCO2
Sum of Median €/tCO2
Sum of Total Number of Bidders
Sum of Number of Successful Bidders
Sum of Mean €/tCO2

80
opponents (Laffont, 1997). It is like imperfect information games. Auctions according to
Laffont (1997) are interesting since the rules of the game are well defined and many
restrictions are available to define the structural models. In addition, the data are most
public and accessible compared with the data of monopolies. Friedman presented a
method to determine the best offer in a first-price of a sealed bid auction. Capen et al (in
(Laffont, 1997) generalizing the model of Friedman, suggested that the bidders have to
protect themselves from underbidding which should increase with the number of bidders.
Auctions of emissions trading have a special feature; the bidders can "save" their unused
allowances for future use. Saving of rights entails makes intertemporal bidders' abatement
costs verge to equal, fact that offers flexibility in reducing emissions and the corresponding
costs (Cong & Wei, 2012). The bidders’ attitude to risk (risk neutral, risk averse, risk
loving) affects significantly their behaviour in auctions (Vettas & Katsoulakos, 2004).
Finally, earnings from auctions can be invested in environmental protection programs and
to limit distortions of this tax (Cong & Wei, 2012).
According to Vickrey (from Tietenberg 2006) there are several types of auctions but for
emission trading the focus is concentrated in the following separation a) auctions
producing a profit for the government and b) those that do not. A common auction platform
facilitates the widest participation from across the European Union and, therefore,
mitigates at greatest risk of having participants undermining the auctions by using them as
a means for money laundering, the financing of terrorism, criminal activities or for market
abuse (EU No 1031/2010).
To ensure that the operation of EEX is done without manipulation and influences,
continuous surveillance is conducted by the independent Market Supervision Office
(Handelsüberwachungsstelle, HÜSt), as required by the German law. HÜSt DEHSt refers
to the results of monitoring activities through regular internal reporting. HÜST reported that

81
the auction of allowances was held in EEX on behalf of the German Federal Ministry for
the Environment, Nature Conservation and Nuclear Safety, in October, November and
December 2012 in accordance with the procedure laid down without disturbance. For this
period, the Market Supervision of EEX found no irregularities and especially no behaviour
of bidders that sought to manipulate the price of the auction (German Emissions Trading
Authority (DEHSt), 2012):
Two very important concepts in the theory of auctions are:
Individual Rationality: The expected profit from the transactions for each participant
of the mechanism should not be smaller than the gain for any other mechanism.
The mechanism should give incentives from the beginning for the participation of
agents at auction.
Auctioneer's Utility maximization: the utility function of auctioneer in relation to all
other mechanisms implementations must be maximized. Typical parameters of this
function are money gain and the estimation of what goods are not traded.
Airlines are asked to take a decision if they will participate in an auction either for buying or
selling allowances. Decision theory examines the processes of making rational decisions
under uncertainty. However, when uncertainty provides an opportunity for some others to
take advantage of this, then there is the theory of competitive sector decisions, i.e. game
theory (Amadae, 2016). The game theory studies the strategic situations that are like
games, i.e. how decisions are made by people who interact with each other (Nicholson &
Snyder, 2016). The sectorial economics and particularly the dimensions of oligopolistic
competition were areas where game theory has found fertile ground (Pacos, 1997).
This is a situation where (a) N (> 1) individuals, businesses, governments, trade unions,
etc. (so-called players) make some choices in order to satisfy everyone's interest and (b)
the result of each player does not depend only on its own choice, but by the choices of the

82
other N-1 players (Amadae, 2016; Varoufakis, 2001). A game involves players, actions,
information, strategies, benefits, results and balances (Waldman & Jensen, 2012). The
games can be cooperative or non-cooperative (Nicholson & Snyder, 2016). The concept of
Nash6 equilibrium is part of a broader set of tools used to analyse strategic behaviour,
known as non-cooperative game theory (Morgan et al, 2009). In cooperative games,
players can make agreements, while in non-cooperative such agreements are not possible
(Nicholson & Snyder, 2016).
In incomplete information games, players simply ignore the actions selected by other
players. However, they know who the other players are, the possible strategies / actions.
Therefore, the information on the other players in the incomplete information game is
complete. In partly completed information games, players may know or not some
information about other players, e.g. their type, their strategies.
Information serves as a very important role in game theory. When each player knows
every move that the other player will make before he makes it then this is called a game
with perfect information. In game theory, a non-player who makes random effects is called
nature. If a game includes nature, but it does not move first, or if the first movement of
nature is observed by all the players, then the game is characterized by comprehensive
information. If nature never moves after the opening of one of the players, then the game
is certain information.
However, if all players have the exact same information when each player is moving, the
game is symmetric information, and if players have different information then the game is
asymmetric information (Waldman & Jensen, 2012). A game called imperfect information
6 Nash equilibrium is defined as the dominant solution in which both players do their best, given the opponent
decision (Waldman & Jensen, 2006, p. 170)

83
game where a player must make a move but is unable to know the previous or
simultaneous movement of another player, and when one or more players are unsure
about any part of the tree then there is incomplete information game (Morgan et al, 2009).
The main models of the game theory are:
The first model is the so-called Nash equilibrium. According to this model, the
strategy of each agent is the best response to the strategies of the other agents,
regardless of their types, given that they select also an equilibrium strategy (best
response).
A second, more powerful model is that of dominant strategies. In this model, the
strategy of each agent is the best response to the strategies of the other agents,
regardless of what those are.
The third and weakest of the above models is that of Bayesian Nash equilibrium.
According to this, each agent chooses its strategy to maximize the expected utility
based on beliefs about the distribution of all types.
Harsanyri talked extensively about Bayesian Nash Equilibrium. His approach is to turn a
game with imperfect information in a game with no perfect information (Menezes &
Monteiro, 2008). Any buyer has imperfect information about the values of other buyers is
considered as not sure of their type. It is like recommending one extra player (nature)
which selects the type of each player. When there is nature it is referred to the
randomness of with whom someone plays a game. A pair of strategies (a *, b *) is defined
as a balance if the a * represents the optimal strategy of the player A when the player B
selects the b *, and b * represents the optimal strategy of Player B when A chooses a *.
A strategy that works at least as well as any other, no matter what the other player is
doing, is called dominant strategy. The set of dominant strategies and outcomes arising is

84
called dominant strategy equilibrium (Morgan et al, 2009). Absolute strategy is a strategy
that defines a particular action in each decision point, while the term mixed strategy is
referred to the one that allows random arrangement between actions in some or all
decision points (Morgan et al, 2009).
According to Stabler, Papatheodorou and Sinclair (2010) game theory is extremely useful
for explaining the behaviour and predicting the results of strategies for pricing, product
selection and differentiation, advertising, investment capital, mergers and acquisitions, and
the barriers to entry. Game theory has greatly improved the understanding of interactions
of firms in monopolistic market and its results in dynamic situations (Stabler et al, 2010).
An interesting phenomenon is the curse of the winner (winner's curse) suggesting that if
someone wins an auction with common values, understands that submitted more
"aggressive" offer from the others, who thus seem to have been less positive (for the value
of the object / service) information, as a result, every buyer should be more conservative in
the price tender (Vettas & Katsoulakos, 2004). Capen et al also studied extensively the
"winner's curse" whereby the winner tends to be the one who exaggerates what is worth to
him and one can win but has sacrificed too much evidence for this victory (Laffont, 1997).
For example, assume two competitive airlines, airline A and airline B. Both airlines are
FSNCs and serve the same market, have the same characteristics and they is intense
rivalry between them. Both airlines have the same availability of resources, the same
access to R&D and should comply with EU ETS. Airline A decides to make only
operational improvements on the engines by washing them more often. The cost of this
action is very small as well as the benefit for fuel consumption and emissions. Airline A will
need to buy allowances in order to comply with the EU ETS.
On the other hand, airline B decides to invest in fleet renewal. The total cost of its
operations will increase due to the purchase cost of the new aircraft; it will reduce the fuel

85
consumption and will have more allowances available to sell or bank. Airline B will have
increased its cost per available seat resulting to an increase in the ticket price. Hence,
many passengers will choose airline A instead of the more expensive airline B. Moreover,
Airline B will have excess allowances that it could either bank or sell. Banking all the
allowances is not a necessity for airline B since next year it will still have excess
allowances. Therefore, the airline B will need to sell allowances in the auction. Since there
will be a larger supply of allowances in the market thanks to airline B strategic decision to
renew all the airplanes, airline A can buy ‘cheap’ allowances. Should the airline A or the
airline B have known the strategic choices of each other the result could have been
different.
According to Forsyth (2008) in the short run, competition in markets is not expected to
decrease substantially: and prices will not rise to the level of the cost increase leading to
reduced airline profitability. Reality proved that the EU ETS targets were not strict enough
to create scarcity in the market. This would require an allowance price of € 20 to
substantially increase the cost of operations.
3.6 Calculation of carbon dioxide emissions by ICAO
Technological improvements contribute to the reduction of fuel burn and emissions.
According to International Council on Clean Transportation report (ICCT, 2016), the fuel
consumption of new aircraft designs could be cut by 25% in 2024 and 40% in 2034.
Although improvements in aircraft and engine technology and the efficiency of the ATM will
bring environmental benefits, this will not fully offset the effects of pollutant emissions
resulting from the projected growth in aviation (IPCC, 1999). The methodology followed by
the ICAO (ICAO, 2014b) to measure the carbon dioxide emissions from aviation is based
on distance travelled. The ICAO is using the best existing public display data on fuel
consumption. It also seeks to improve the model, updating and searching data constantly

86
to have a better estimate of emissions. As emissions of passenger aviation affected by
changing variables, specific to each flight, it is necessary to establish general parameters.
The calculation of carbon dioxide emissions (Carbon Emissions Calculator, CEC) from
ICAO requires the user to enter the departure and arrival airports for a direct flight, which
is then compared to a published flight schedule to find the type of aircraft serving these
airports and the number of departures for each aircraft. After fuel consumption is found for
the aircraft, the load factor and passenger load index are introduced for finding the total
fuel consumption. The system then calculates the average consumption for the trip
weighted by the frequency of departures for each aircraft type. This is then divided by the
total economy class passengers. The result is then multiplied by 3.157, which represents
the number of tons of CO2 produced by burning one ton of aviation fuel to calculate the
footprint of carbon dioxide from every passenger travelling between the two airports.
Figure 11: Emission calculation procedure of carbon dioxide from the ICAO (2014b)
Figure 11presents the process followed by the ICAO of calculating CO2 emissions. The
first step is the introduction of the airports of origin and destination. Code share flights are
treated as one, while those with a different flight number must be calculated separately
and then added by the user. The second step is the distance of travel, calculated from the
coordinates of airports and the optimal path (Great Circle Distance). Then a passenger

87
load factor is given in the defined by the user city pair, based on passenger load factor for
the respective groups of path. Information about the load rate taken from the database,
based on 17 groups of international routes and an additional 5 domestic areas. In the
fourth phase, the aircraft from the database of scheduled flights is recognized and
connected with the EMEP / CORINAIR base, which has a fuel consumption figure for
aircraft. The relation of fuel consumption with the distance covered is shown by the
Emissions Inventory Guidebook. The flight scheduling of passenger carriers is published
on Official Airline Guide (OAG) and the ABC World Airways Guide (Wensveen, 2007).
According to Figure 11, the parameters taken under consideration are (ICAO, 2014b):
1. User input – The user enters the origin and destination airports. The database is
searched for all flights, direct or non-direct, serving that city-pair. However, the tool does
not compute total emissions for journeys with different flight numbers (connecting flights).
To do this, the user can choose to build a total by calculating each of the journey legs
separately and adding them up.
Code share flights are treated as a single flight. This avoids a possible double counting of
flight departures that would otherwise affect the calculations.
The origin and destination database includes individual routings for single flight numbers
with multiple stops. Hence, the passenger does not need to know, nor input the full
itinerary of the flight.
2. Trip distance – The ICAO Location Indicators database contains the longitude and
latitude coordinates for the airports. From these coordinates the Great Circle Distance
(GCD) 1 is then calculated and corrected by a factor depending on the distance between
the two airports concerned.

88
3. Traffic data – A passenger load factor is assigned to the user-defined city-pair, based
on the passenger load factor for the corresponding route groups. Load factor information is
obtained from the database, based on 17 international route groups plus 5 domestic areas.
4. Aircraft mapping – From the scheduled flights database, the scheduled aircraft is
identified and linked to the aircraft fuel consumption database European Monitoring and
Evaluation Programme/ Core Inventory of Air Emissions (EMEP/CORINAIR). When the
scheduled aircraft is not in the database, the aircraft is mapped into one of the fifty
equivalent aircraft types existing in the aircraft fuel consumption database. Appendix B
provides details of how this mapping was done. This allows estimation of the total fuel use
on each route serving the user-defined city-pair.
5. Fuel burn data – The fuel burn to flight distance relationship is extrapolated from the
Emissions Inventory Guidebook (EIG) prepared by EMEP/CORINAIR. The factors
considered include passenger load factor, flight distance, the proportion of the overall
payload represented by passenger traffic, cabin class flown, and type of equivalent aircraft
flown. The amount of fuel used on a route is the weighted average of total fuel burnt based
on the frequencies of the scheduled aircraft types flown.
6. Economy Class (Y) seat capacity – From cabin floor plans obtained from the “Manual
on Airplane Characteristics for Airport Planning”, which is developed by manufacturers to
provide necessary data to airport operators and airlines for airport facilities planning, the
maximum number of Y-seats that can be fitted per equivalent aircraft is determined. This
“virtual” all economy configuration later allows the computation of cabin class factors
(steps 9 & 10).
7. / 8. CO2 per economy passenger – Using the trip distance, equivalent aircraft fuel
consumption, passenger to seat load factor and passenger to freight load factor for the

89
route group, and the number of Y-seats, the methodology calculates the CO2 associated to
each passenger, as follows:
𝐂𝐎𝟐 𝐩𝐞𝐫 𝐩𝐚𝐱 =𝟑, 𝟏𝟓𝟕 ∗ 𝐭𝐨𝐭𝐚𝐥 𝐟𝐮𝐞𝐥 ∗ 𝐩𝐚𝐱𝐭𝐨𝐟𝐫𝐞𝐢𝐠𝐡𝐭𝐟𝐚𝐜𝐭𝐨𝐫
𝐧𝐮𝐦𝐛𝐞𝐫 𝐨𝐟 𝐘𝐬𝐞𝐚𝐭𝐬 ∗ 𝐩𝐚𝐱 𝐥𝐨𝐚𝐝 𝐟𝐚𝐜𝐭𝐨𝐫
The estimated annual emissions can be calculated from the fuel consumed, using the
following formula for jet kerosene:
𝐄𝐬𝐭𝐢𝐦𝐚𝐭𝐞𝐝 𝐚𝐧𝐧𝐮𝐚𝐥 𝐞𝐦𝐢𝐬𝐬𝐢𝐨𝐧𝐬 [𝐢𝐧 𝐭𝐨𝐧𝐧𝐞𝐬 𝐂𝐎𝟐]= 𝐚𝐧𝐧𝐮𝐚𝐥 𝐟𝐮𝐞𝐥 𝐜𝐨𝐧𝐬𝐮𝐦𝐩𝐭𝐢𝐨𝐧 [𝐭𝐨𝐧𝐧𝐞𝐬]∗
𝟑,𝟏𝟓 [𝐭𝐨𝐧𝐧𝐞𝐬 𝐂𝐎𝟐
𝐭𝐨𝐧𝐧𝐞𝐬 𝐨𝐟 𝐟𝐮𝐞𝐥]
Note: For aviation gasoline and jet gasoline the emission factor (EF) of 3.15 should
replace with 3.10 (EC, 2016).
Aircraft operators determine the CO2 emissions using a simplified version of the standard
emission methodology using the following formula (EC, 2012):
𝐄𝐦 = 𝐀𝐃 ∗ 𝐄𝐅
Where:
Em: CO2 emissions
AD: Activity data (= amount of fuel consumed in tonnes)
EF: emission factor (tonnes CO2/tonnes fuel)
3.7 Monitoring, Reporting and Verification
Monitoring, reporting and verification (MRV) of emissions play an important role in the
reliability of any emissions trading scheme. Without MRV, there would not be transparency
in compliance and it would be much more difficult to enforce. Therefore, MRV applies to
the EU Emissions Trading Scheme (EU ETS). It is the complete, consistent, transparent

90
and accurate monitoring, reporting and controlling that creates trust in the emissions
trading system. This is the only way to ensure that air carriers and aircraft operators
comply with their obligation to surrender sufficient allowances (EC, 2012).
The EU ETS is an instrument based on the market. The market participants therefore want
to know the monetary value of the options granted to them, trade and must hand back. At
the same time, it is a means of ensuring and achieving environmental benefits in Europe
level. This requires a significant level of fairness among participants, ensuring a stable
MRV system to ensure that a ton CO2 emitted "meets" the corresponding tonne mentioned
(under the principle that: a tone must be a tone). The competent authorities monitor to
ensure that the objectives set by the "cap" are achieved (EC, 2012).
In order to ensure efficient implementation of the directive for EU ETS, every aircraft user
is assigned to only one member-state. In case the aircraft user holds a valid Air Operator
Certificate (AOC) that is given by a member state according to the EU regulation 2407/92,
the member state that gave the licence is the one that is responsible. In all the rest cases,
the member state where most of the emissions take place is the responsible one.
Every aircraft user should monitor its annual emissions from activities that are involved in
EU ETS (EC, 2012). The annual process of monitoring, submission of reports, compliance
checks and acceptance of the reports about the emissions from the competent authority is
usually referred as compliance cycle (EC, 2012).

91
Figure 12 The compliance cycle of EU ETS
The cycle in the right side of Figure 12 is the main cycle. The airline is monitoring its
emissions during all year. After the end of the calendar year (within 3 months), the airline
should prepare its annual report about its emissions (AER), ask for verification and submit
the verified report to the Competent Authority (CA) as indicated by Reg N0 100/2014. The
last report should be associated with the surrender of the allowances to the system.
Monitoring continues without any break until the end of the year. The process is very
important for the trust towards the system and the credibility of EU ETS. The process
should also be consistent during all the years thus the airline should ensure that the
monitoring process is documented and cannot change without any notice. Regarding the
EU ETS, the written process is called Monitoring Program (MP) (EC, 2012).
Figure 12 also depicts some very important responsibilities of the CA. CA should focus on
the compliance of the aircraft users. The first step is to approve every monitoring plan
before its implementation. Nevertheless, the compliance cycle has a wider perspective.
Finally, there is a second cycle. This is the tactical re-examination of the monitoring plan,
for which the verified form might offer important information. Moreover, the aircraft users
are requested to continuously try to improve the methodology of monitoring (EC, 2012).

92
The common information for the monitoring plan involve the following actions from the
aircraft user (the application depends from specific situations/cases):
Gathering of information
Description and explanation of calculations used
Control activities (e.g. 4-eyes for the data collection)
Archiving of data
Frequent identification of areas of improvement
The compliance cycle of EU ETS replies on the fact that the monitoring process is
following the year calendar. The MP should be approved by the CA before the start of the
first year for the emissions, i.e. the first year for the allowances trading like 2013. Whereas
for new aircraft operators, it is obligatory their MP to be submitted to the CA at least 4
months before they start operating flights that are controlled by the EU ETS (EC, 2012).
In practice, what is difficult to be achieved is that many times the aircraft operators do not
really know in advance that they will operate in EU destinations. In addition, some aircraft
operators do not know early enough with state is theirs CA. Thus, article 51 allows the
following deviations (EC, 2012):
An aircraft operator that flies a route that is under the EU ETS for the first time and
it could not predict that it will fly this route 4 months in advance, should submit a MP
to the CA without any delay but at least 6 weeks before is start flying this route.
When the CA is not known in advance, the airline without unjustified delay should
submit the MP when the information about the CA becomes available.
The EU ETS for MRV is a fundamental element for the success of the system. Every
required parameter for the emissions monitoring has different levels of quality of data.
Tier/Level means a set requirement used for determining activity data, calculation factors,

93
annual emission and annual average hourly emission, as well as for payload (EC Reg No
601/2012, art 3).
Most of the airline companies do not have information about how the used carbon credits
are tracked or registered (Interview with Airline representative, 2016). Without registration
and tracking, the credits (or the reductions/removals from which they were created) may
be sold more than once. In most cases, this information is only available at the website of
the offset provider. All CERs are tracked through national registries under the Kyoto
Protocol, and Gold Standard VERs are tracked using the Gold Standard Registry. Beyond
these two cases, it is not always easy, or even possible, to find information about how
credits are tracked.
3.8 Carbon Leakage
The EU ETS has been criticized as having failed to provide the necessary incentives to
reduce emissions, it produces undesirable distributional effects and that distorts
competition because of divergent rules between the different sections (Clo, 2010). Carbon
leakage is one of the main issues in environmental policies for climate change. The carbon
leakage is defined as the increase in CO2 emissions outside of the countries with domestic
policy mitigation7 divided by the reduction of emissions of these countries. The increase in
local prices of fossil fuels resulting, for instance, from mitigation policies can lead to a shift
of production to areas with less stringent mitigation rules (or no rules at all), resulting in
increase of emissions in these regions and therefore to carbon leakage. Moreover, the
decline in global demand for fossil fuels and the consequent reduction in the prices of
fossil fuels can lead to increased consumption of fossil fuels in countries that have not
7 Climate Change Mitigation refers to efforts to reduce or prevent emission of greenhouse gases. Mitigation can mean
using new technologies and renewable energies, making older equipment more energy efficient, or changing
management practices or consumer behaviour (UNEP, 2016).

94
taken steps to mitigate and, therefore, at risk of carbon leakage. However, the investment
attitude in many developing countries may be such that they are not ready yet to benefit
from such a leakage. The different emission limitations in different areas can also affect
the choice of technology and the emissions profile in areas with fewer or no restrictions
(Metz et al, 2007).
In short, carbon leakage is the prospect of rising GHG emissions when a company
transfers production out of a country, because it cannot pass the cost increases caused by
climate change policies to customers without significant loss of market share absence of a
legally binding international climate agreement (Department of energy and climate change,
2013).
The leakage rate or index leakage reduction is the ratio between the increase in
greenhouse gas emissions in countries that do not belong in Annex I because of climate
policy and the reduction of greenhouse gas emissions in other countries of Annex I
because of that policy. The estimated leakage reduction rates in applied models vary
significantly, from 2% to 130% (Monjon & Quirion, 2011). The mathematical formulation of
the rate of carbon leakage can be defined as the increase in CO2 emissions in non-abating
(NA) countries (who are not trying to reduce emissions) caused by domestic reduction
measures in abating (A) countries as a percentage the absolute value of the volume
reduction of CO2 emissions derived from compliant countries, according to the following
equation (Antimiani et al, 2013; Barker et al, 2007):
𝑪𝑳 𝒓𝒂𝒕𝒆 =𝜟𝐂𝑶𝟐
𝑵𝑨
|𝜟𝐂𝑶𝟐𝑨|
∗ 𝟏𝟎𝟎
The Carbon leakage is a very important factor in the design of the 3rd phase of the EU ETS
(De Bruyn, Nelissen, & Koopman, 2013). For the 3rd phase of the EU ETS auctioning is
referred to be the basic mechanism for allocating emission allowances. However, an

95
important exception is made for the areas "deemed to be exposed to a significant risk of
carbon leakage". These areas receive free allocation to the statutory limits at Community
level, at least until 2020 (De Bruyn et al, 2013: 11).
The two criteria presented in the revised Directive (2009/29/EC) to assess if an area is
exposed to carbon leakage were related to the additional cost of carbon and the volume of
trade. In short, areas with significantly high additional cost of carbon and / or highly
exposed to the global market through international trade will take continued free allocation
of emission allowances for 2013-2020 until the limits have been set at Community level
(De Bruyn et al., 2013).
Areas were classified as "at risk of carbon leakage" through the comitology procedure will
receive free allowances each year to a fixed reference point by 2020. Areas not classified
so received a free 80% of allowances in 2013 and will be reduced each year by small
increments until reaching 30% in 2020. The rest of the required allowances need to be
bought at the ETS market or one of the regular auctions for new allowances. Therefore,
the decision about whether an area could be classified as "exposed in carbon leakage"
has important economic consequences for businesses participating in EU ETS (De Bruyn
et al., 2013).
There are three distinct types of leakage. First, there is leakage through product markets,
where competitors from the EU may face a competitive disadvantage because of the cost
of carbon into the price of products. The products outside the EU will get a bigger share of
the market, so the production that is not under an emissions cap is increased. Secondly,
there is leakage through the capital markets, where investments are made in countries
without climate policies, because these investments may have higher yields due to the
absence of the cost of carbon. The third is the leakage through the energy market, where
reduced energy demand in the EU leads to a lower price of fossil fuels worldwide, which

96
stimulates consumption in other countries (De Bruyn et al., 2013:.14). One of the proposed
measures to limit carbon leakage is free allowances and easy access to international units
(De Bruyn et al., 2013).
3.9 Different Carbon offsetting programs
Carbon offsets play a role in both compliance and voluntary carbon markets. In
compliance markets, such those created by the Kyoto Protocol or the EU ETS,
governments and regulated facilities have mandatory, legal emission obligations, and can
use offsets, such as CERs, as an alternative to reducing their own emissions. The CDM is
currently the only program that can issue offsets from developing countries for use in
compliance markets. In contrast, voluntary market offset programs such as the Gold
Standard (GS), the American Carbon Registry (ACR), and the Verified Carbon Standard
(VCS) issue offsets that can be used by businesses, governments, NGOs, and individuals
electing to offset their emissions for other reasons, such as corporate or individual social
responsibility.

97
Table 9: Some project types (IATA, 2008a)
Offsets can be sourced from various types of project activities (IATA, 2008a: 14):
LULUCF (Land Use, Land Use Change and Forestry)
Avoided deforestation
Reforestation of former forest areas
Afforestation of new areas
Other types of land use projects
Industrial greenhouse gas offsets
Reduction of emissions and/or destruction of hydrofluorocarbon compounds (HFCS)
Reduction of emissions and/or destruction of nitrous oxide (N2O)
Methane (CH4) capture and use in energy generation
From landfills
From mines

98
From anaerobic digestion of, for example, livestock wastes
Energy efficiency
More efficient stoves
More efficient power generation
Light bulb replacement
Use of “waste” energy in co-generation
Renewable energy
Wind turbines
Hydroelectricity
Solar, thermal and photovoltaic systems
The main points to consider when selecting a project include: Standard, i.e. what
verification and auditing procedures are in place; Price, for instance, the VERs, from the
voluntary carbon market, are generally cheaper than CERs from the regulated Kyoto
market; Relevance to your business; Geographical location; and Resonance with
customers, for instance, those projects with social and economic benefits to local
communities may appeal more (IATA, 2008a).
3.9.1 ICAO and the environment
Under the 1992 UN Framework Convention on Climate Change (UNFCCC), the 1997
Kyoto Protocol (article 2(2)) tasks ICAO to secure the reduction of GHGs from aviation. In
2004, ICAO adopted three major environmental goals (ICAO Doc 9902, 2007), to:
1. limit or reduce the number of people affected by significant aircraft noise;
2. limit or reduce the impact of aviation emissions on local air quality and
3. limit or reduce the impact of aviation greenhouse gas emissions on the global
climate.

99
In July 2012, the ICAO Council’s Committee on Aviation Environmental Protection (CAEP)
developed a range of Standards to address aircraft noise and local air quality. They
adopted an Aircraft Carbon Dioxide (CO2) Emissions Calculation System as the first
building block towards a global CO2 standard for new aircraft (ICAO, 2014b).
The ICAO Council formed a special High-level Group on International Aviation and
Climate. Change (HGCC) to provide near-term recommendations on a series of policy
issues related to the feasibility of a global MBM scheme appropriate to international
aviation (ICAO, 2012). Its aim is to examine ICAO’s development of a policy framework to
guide the general application of any proposed MBM measures to international air transport
activity (ICAO, 2012). These steps on November 2012 led the EU to propose the
suspension (Stop the clock) of the application of its ETS to international flights (EC, 2014).
The International Civil Aviation Organization (ICAO) Assembly (191 members) meeting in
2013 agreed to develop a global scheme based on market-based measures (MBM) to limit
CO2 emissions from international aviation. The 39th ICAO Assembly in October 2016,
reached a global agreement for environmental protection. The member states agreed that
environment is of critical importance and 65 states including US, China and all EU
countries signed up for voluntarily participation between 2021 and 2026 in the Carbon
Offset and Reduction Scheme for International Aviation (CORSIA). CORSIA is a carbon-
offsetting scheme and is the first global measure covering an entire industrial sector.
CORSIA ‘is expected to offset around 80% of global airline carbon dioxide
(CO2) emissions above 2020 levels between 2021 and 2035’ according to De Juniac,
Director General of IATA (ATWonline.com, 2016).
MBMs provide financial incentives and disincentives to guide the behaviour of regulated
entities towards lowering emissions (ICAO, 2013b). Under the policy framework adopted
by the ICAO in 2010, MBMs are included in a “basket of measures” that Member States

100
can use to address CO2 emissions produced by international aviation and presented in
their Action Plan (ICAO, 2013b). MBMs offer flexibility to participants to select between the
implementation of emission reduction measures within their own sector, or offsetting those
CO2 emissions in other sectors. This is particularly important for the aviation industry,
where in-sector emissions reductions are expensive and limited (ICAO, 2013b). Moreover,
MBMs give financial incentives to guide behaviour towards environmentally responsible
activity.
In June 2012, the ICAO Council narrowed the MBM options to three (ICAO, 2013b):
1. Global Mandatory Offsetting
2. Global Mandatory Offsetting with Revenue
3. Global Emissions Trading
Moreover, ICAO Assembly resolved that when states were designing new schemes and
implementing existing schemes, they should:
engage in bilateral or multilateral negotiations with other states to reach an
agreement and
grant exemptions to developing states whose total revenue tonne kilometres of
international civil aviation is less than 1%.
ICAO and the European Commission (EC) signed in 2013 a Declaration of Intent, affirming
their collaboration on assistance and capacity building activities to support actions to
mitigate carbon emissions produced by international aviation (ICAO, 2013b). The Global
Environment Facility (GEF) has approved the project concept, and has earmarked USD 2
million toward a new joint assistance initiative between the United Nations Development
Programme (UNDP) and ICAO to reduce aviation emissions (ICAO, 2013b).

101
Furthermore, ICAO is requested to continue with the ICAO Global Framework for Aviation
Alternative Fuels (GFAAF) and to gather information on the progress of alternative fuels in
aviation, including through State action plans, in order to attain a global view of the future
use of alternative jet fuels, and to account for changes in life-cycle Green House Gas
emissions to evaluate the progress toward sustainability (ICAO, 2013).
In addition, the U.S. Federal Aviation Authority (FAA) is working on different programs to
reduce emissions. In 2010, the FAA initiated the Continuous Lower Energy, Emissions and
Noise (CLEEN) program to develop technologies to assist in reducing the environmental
impact of commercial aviation (FAA, 2016). This Continuous Lower Energy, Emissions and
Noise (CLEEN) program is a part of the FAA’s aviation and airspace improvement
program “NextGen” and focus on helping to accelerate the development and commercial
deployment of environmentally promising aircraft technologies (FAA, 2016).
3.9.2 Voluntary carbon offsetting
The voluntary carbon offsetting refers to all voluntary actions to reduce carbon emissions.
In this case, there is not a formal exchange, since this action is not part of a cap-and-trade
system. It can also be referred to as the voluntary Over-the-Counter market. Continental
Airlines, SAS AB, Delta Air Lines, Cathay Pacific Airways, Virgin Blue are only some of the
airlines that have launched a voluntary carbon-offsetting program for passengers who
want to offset their flights carbon dioxide emissions. Airlines offer individual carbon offset
programs for marketing reasons in order to appear environmentally conscious.
IATA’s program brings standardisation to the process and makes it possible for airlines,
either smaller or bigger, to easily introduce a credible and independently validated offset
program (IATA.org, 2016b). Around 32 IATA airlines have launched their own schemes
using different carbon calculators and investing in emission reductions with variable quality
(Schneider, 2012). Airlines are offering carbon credits stemming from renewable or other

102
high quality projects that follow the stringent quality requirements of the Quality Assurance
Standard for Carbon Offsetting (QAS) (IATA.org, 2016b). QAS-approved carbon offsets
are audited against at least 40 criteria (Quality Assurance Standard, 2014).
IATA approved offsets must carry one of the following high quality certificates:
CERs issued under the Clean Development Mechanism (CDM)
VERs -Gold Standard or VCS version 2007 onwards
Approved offsets based on land use employ sustainable REDD+ project8
methodologies.
IATA in addition offers a Carbon Calculator that follows the ICAO methodology enhanced
with real airline data.
3.9.3 Examples of other ETS outside of Europe
In 2008, Québec, a province in east-central Canada, joined the Western Climate Initiative
(WCI) and actively contributed to the design of its regional carbon market. The Québec
government launched its trading system in 2012. Its regulation was modelled on the
architecture set up by the WCI. In its first two years, the Québec ETS covers electricity and
industrial GHG emissions. However, from 2015, it also includes emissions from fossil fuels
distribution (ICAP, 2016).
8 Reducing Emissions from Deforestation and Forest Degradation (REDD) is an effort to create a financial
value for the carbon stored in forests, offering incentives for developing countries to reduce emissions from
forested lands and invest in low-carbon paths to sustainable development. "REDD+" goes beyond
deforestation and forest degradation, and includes the role of conservation, sustainable management of
forests and enhancement of forest carbon stocks. The implementation of REDD+ must co-exist with
significant emission reductions in both developed and developing countries to curb climate change (UN-
REDD Programme, 2014).

103
The Québec Cap-and-Trade Regulation sets a minimum price for allowances sold at
auction. At the first auction, which was held on Dec. 3, 2013, the minimum price, or “floor
price”, was 10.75 CAD (about 7.25 EUR). The price will rise annually by five percent plus
inflation until 2020. This guarantees a progressively stronger carbon price signal to the
Québec economy (ICAP, 2014).
Covered entities in the Québec ETS must report their GHG emissions using specific and
internationally recognized protocols. Furthermore, emissions data must be verified
independently by an accredited verifier in accordance with ISO standards. The WCI
stipulates that regulations and standards must be harmonized among its members. This
ensures that one ton of GHG emitted and calculated is the same across the partnership
(ICAP, 2016).
In October 2013, Québec and the California Air Resources Board signed an agreement to
link their respective schemes from January 2014. A first joint auction of emission
allowances is expected in 2014. As WCI members, Québec and California have
cooperated closely for the past five years and have strengthened their partnership over
this period. The signing of the agreement completed a year-long negotiation process,
marked by excellent cooperation, to harmonize and integrate their respective ETS
regulations. The link between the two systems creates the largest carbon market in North
America, and the first transnational cap-and-trade system run by subnational governments
in the world (ICAP, 2014).
The Emission Trading Scheme of Shenzhen city (SZ ETS) was launched on June 18,
2013, as the first carbon market in a developing country and in China (ICAP, 2014). The
allocation to the power sector and the water supply sector was based on benchmarking.
For manufacturing industries, given the large number of industry segments and the wide
variety of products, processes and device facilities, the allocation team decided on a

104
carbon intensity allocation method, based on carbon emissions per unit of industrial added
value (ICAP, 2014).
3.10 Linking Emissions Trading Schemes
The term “linking” describes that the one system’s allowances or another system’s
commercial units can be used directly or indirectly by one system joining another system
for compliance (Crubb, 2009). The linking of systems creates larger emission reduction
systems with better financial liquidity and harmonized prices without distortions due to
competition, and thus less vulnerable (Tuerk, et al., 2009). The existing emission trading
systems differ in size, cognitive characteristics, cost-containment and geographical scale,
but also the type and volume of trading units (Tuerk, et al., 2009). Nevertheless, all the
emissions trading systems wish to connect to the Clean Development Mechanism (CDM)
(Tuerk, et al., 2009).
The direct connection allows transactions between different systems and can be
distinguished by whether they allow trading in one or more directions. According to a
unilateral connection, entities belonging to the system A can buy and use rights coming
from the system B for compliance, but not vice versa (Tuerk, et al., 2009). If the system A
establish a one-way connection recognizing rights from system B, and the rights price of
system A is higher, trading between systems will occur until prices converge at an
intermediate level. If the price of the system A is lower, there will be no incentive for trade
between the two systems (Tuerk, et al., 2009). A critical factor in unilateral connections is
the effect it will have the A system that will be connected to B system (Tuerk, et al., 2009).
The connection of big cap and trade system with a smaller will increase the price of the
small equalling to the value of the largest (Tuerk, et al., 2009).
In a complete linking, emission rights are traded freely between two or more systems and
are equally valuable for compliance (Tuerk, et al., 2009). There is the option of using as

105
intermediate link the Clean Development Mechanism (Tuerk, et al., 2009). In addition,
areas with rising carbon prices due to linking systems will experience more leakages. The
opposite will occur in areas with declining prices (Tuerk, et al., 2009). There is also the
possibility the caps be relaxed to the countries in order to benefit from the additional sales
(Tuerk, et al., 2009). The economic impact of linking emissions trading systems can be of
three types (Flachsland et al., 2009): a) quasi-static, short-term gains efficiency; b)
dynamic efficiency gains; and c) the distribution results.
To link two or more emissions trading systems among themselves, the following
parameters should be considered (Tuerk, et al., 2009):
Monitoring, Reporting and Verification (MRV) rules for allowances
Banking provisions
Registries
Rules governing new entrants and closures
Compliance periods
Allocation methods
Relative stringency of targets
Stringency of enforcement
Eligibility of offset credits
Intensity targets
Cost-containment measures.
EU ETS involving aviation could be associated with a bilateral agreement with one or more
of the following programs (Haites, 2009):
A domestic trading scheme in a country with an emission reduction commitment
under the Kyoto Protocol or a future agreement, such as EU ETS or Swiss ETS

106
A trading system that is not linked to the UNFCCC, such as RGGI or the Chicago
Climate Exchange.
The CDM does not require returning units or rights and thus a bilateral agreement with the
CDM is not an option (Haites, 2009).
3.11 Summary
Carbon offsets should be part of a climate strategy by a company/organization. Aviation for
instance, cannot be carbon neutral, since it operates in an energy mix based in fossil fuels.
A climate strategy is not enough in order the company to eliminate internally the
emissions. According to Gössling and Upham (2009) two developments have substantially
affected aviation, EU ETS and the continuous rise in fuel prices. This trading scheme shall
provide economic incentives to reduce CO2 emissions based on market principles as well
as set fix limits of the mount of emitted emissions. The Kyoto Protocol and the EU ETS are
based on the principle that the emission of pollutants is a commodity and a measure is
required to calculate the degree of equivalence between the different gases.
Emissions trading is a market-based policy tool that can be used to promote economic
efficiency in achieving environmental goals. By harnessing market forces, emissions
trading regimes can create incentives for economic agents to discover and implement
cost-effective approaches to complying with environmental targets. The aircraft operators
are obliged to monitor and report their annual emissions to their Competent Authority (CA).
The CA should make compliance checks on the surrendering of allowances, inspect the
monitoring throughout the year and approve (or not) the GHG permit and monitoring plan
pf the aircraft operators. It is evident that the aircraft operators and the CA have many
responsibilities and a lot of documentation to fill in as well as well as management
procedure.

107
4 Single European Sky
As discussed in previous chapters the traffic in Europe is increasing and the Air Traffic
Management (ATM) system is deemed insufficient to accommodate the traffic in a
sustainable way. A proof of this insufficiency is the comparison between Europe and USA.
EUROCONTROL and US Air Traffic Organization (FAA-ATO) identified the differences of
ATM performance. As shown in Table 10, Europe is similar to USA in terms of total
surface of continental airspace, but USA controls approximately 59% more flights
operating under Instrument Flight Rules (IFR) with less Air Traffic Controllers (ATCOs) and
fewer facilities.
Table 10: US/EUROPE Key ATM System Figures (EUROCONTROL and FAA, 2013)
Moreover, Europe has 37 ANSPs, 63 Area Control Centres (ACCs), 260 Approach control
units (APPs). The European states have individual military needs and requirements thus
there is a difference in the number and locations of Special Use Airspace (SUA).

108
According to the study (EUROCONTROL and FAA, 2013), the number of restricted and
segregated areas in Europe is higher and they are more scattered which potentially affects
the level of flight inefficiency and capacity from the system point of view. Flight and cabin
crew, aircraft ownership, fuel, maintenance, handling and catering infrastructure,
passenger services and distribution and other costs are the main costs for all airlines and
an airline is managing the costs according to its business model. For instance, the Low
Cost Carriers (LCCs) have a different unit cost than the Full Service Network Carriers
(FSNCs) and follow different cost reduction strategies. ANS costs are the only costs that
are the same for every carrier and the way the carriers operate does not affect the ANS
cost significantly. All carriers are charged the same unit rate when they fly above a
European Civil Aviation Conference (ECAC) country.
The European sky is one of the busiest skies in the world with as many as 33,000 flights a
day (EC, 2015). The increased traffic, problems in capacity, climate change and the
necessity of developing a more cost efficient system led to an ambitious initiative to reform
the architecture of the Air Traffic Management (ATM). This initiative was first launched by
the European Commission in 1999 and is called Single European Sky (SES).
4.1 The Single European Sky concept
European sky according to EUROCONTROL is fragmented in small insufficient blocks that
use a wide variety of Air Traffic Control (ATC) technology. The fragmentation resulted in
safety risks, delays in flights and increased cost. Thus, better coordination for transferring
the responsibility of an airplane between two ATC sectors in Europe is needed.
The European ANS system covers 37 ANSPs, 60 control centres, is 10.8 million km² and
the estimated costs of fragmentation of airspace amounts to 4 billion EUR a year
according to EC (2015).
SES is based on the four following main regulations:

109
the Framework Regulation establishes the European Commission as the regulator
for the civil sector and the Single Sky Committee to assist it in its regulatory
activities;
the Airspace Regulation which will establish a single European Upper Information
Region and within it organize airspace into functional airspace blocks (FABs);
the Service Provision Regulation establishes a common licensing system for civil
ATM providers; and
the Interoperability Regulation which aims to ensure that systems, equipment and
procedures operate seamlessly.
The main target of the Scheme is to restructure the European ATC in accordance with the
traffic flows, to create additional capacity and to increase the efficiency of the system
preserving and increasing the safety standards. Finally, the delays due to inefficiency will
be reduced. Functional Airspace blocks (FABs) are one of the tools that where
implemented by SES to overcome these problems (EUROCONTROL, 2008:1).
The stakeholders of the SES are the following:
European Commission as regulator
The EU Member States in their capacity as Civil Aviation Authorities and National
Supervisory Authorities
Airline associations like the International Air Transport Association (IATA), the
Association of European Airlines (AEA), and the European Regions Airlines
Associations (ERA)
Trade Unions such as the European Transport Workers Federation (EFT) and Air
Traffic Controllers European Union’s Coordination (ATCEUC)
EUROCONTROL as Network Manager
SESAR JU, EASA, ICAO

110
The SES program aims at separating the regulatory role of the competent services and
service providers to provide an improved governmental control of the increasing number of
privatized service provider and to establish common rules and standards. Thus, the ANSP
was separated by the CAAs. Furthermore, the program intends to reorganize the
European airspace so as not to longer be limited by national borders. This allows the
complete unification of European airspace between 29,000 ft and 46,000 ft and to
establish more direct flight paths between origin and destination. With this unification of
European airspace, each airline would be free to determine the route to be followed by the
aircraft, saving time, fuel and money.
4.2 Functional Airspace Blocks
One of the core elements of the SES initiative are the FABs, which aim to reduce the
inefficiencies – in terms of safety, capacity, and cost – that result from the European
airspace fragmentation. A Functional Airspace Block (FAB) is an airspace block based on
operational requirements, reflecting the need for integrated management of the airspace
regardless the existing boundaries of Flight Information Regions (FIR's), where the
provision of air navigation services and related functions are oriented to performance and
are optimized looking forward to implementing of cooperative relationship between the
ANSPs in each FAB. Because FIRs are often limited by national boundaries, FABs also
provide the potential to overcome bilateral restrictions and to provide a more efficient
overflight from one territory to the next.
The functional airspace blocks follow the bottom up approach and are one of the tools
introduced by the "Single European Sky (SES)”, in order to enhance the security, the
overall system efficiency of air traffic management in Europe, to create additional capacity
to meet the needs of airspace users and reduce delays. The FAB's can improve the
planning and organization of airspace.

111
The Single European Sky (SES) is a flagship European initiative to overhaul the control of
European air traffic, to meet future capacity and safety needs. Based on the steps taken in
the late 90s, the Single Sky package I was adopted (SES I) in 2004 and the Single Sky II
package (SES II) in 2009 (EC, 2012).
According to the European Commission (2012), it is anticipated that with the
implementation of the SES:
the safety will improve by ten times;
the capacity of airspace will triple;
the cost of air traffic management will reduce by 50%;
the impact on the environment will reduce by 10%.
The weakness caused by the fragmented European airspace result in additional costs of
nearly 5 billion annually. In any average flight added to the mileage of 42 km, resulting in
the aircraft consumes more fuel, creating more emissions, increasing the burden on users
and there are longer delays. U.S.A. controls the same volume of airspace with more traffic
with almost half of the cost. With the consolidation of the European sky and the
consolidation of related services, FABs will reduce the impact of aviation on the
environment and reduce the cost of flights that today represent billion every year (EC,
2012).
The categorisation of FABs was done using geographical criteria according to European
Commission. Nine FAB initiatives have been taken (as seen in Figure 13); two of these
have already been implemented, namely the UK-Ireland and Denmark-Sweden FABs from
2014:
1. NEFAB (North European FAB): Estonia, Finland, Latvia, Norway.
2. Denmark-Sweden: Denmark, Sweden

112
3. BALTIC FAB Poland, Lithuania
4. FABEC (FAB Europe Central): France, Germany, Belgium, Netherlands,
Luxembourg, and Switzerland
5. FABCE (FAB Central Europe): Czech Republic, Slovak Republic, Austria, Hungary,
Croatia, Slovenia, Bosnia and Herzegovina
6. DANUBE Bulgaria, Romania
7. BLUE MED Italy, Malta, Greece, Cyprus, (and Egypt, Tunisia, Albania, Jordan as
observers)
8. UK- IRELAND FAB United Kingdom, Ireland
9. SW FAB (South West FAB) Portugal, Spain
Figure 13: The geographical scope of FABs (EUROCONTROL, 2016a)
These initiatives extend beyond the borders of the EU. This proves the openness of
approach for functional airspace blocks.

113
Table 11: Functional Airspace Blocks
NEFAB (North European FAB)
Member States -
ANSPs
1. Estonia -Estonian Air Navigation Services (EANS)
2. Finland -Finavia
3. Latvia -Latvijas Gaisa Satiksme (LGS)
4. Norway – Avinor
Area (million km2) 0.7
Denmark-Sweden
Member States-
ANSPs
1. Denmark - Naviair
2. Sweden - LFV (Luftfartsverket)
Area (million km2) 0.8
BALTIC FAB
Member States-
ANSPs
1. Poland - Polish Air Navigation Services Agency (PANSA)
2. Lithuania- Oro Navigacija
Area (million km2) 0.4
FABEC (FAB Europe Central)
Member States-
ANSPs
1. France - Direction des Services de la navigation aérienne (DSNA)
2. Germany - Deutsche Flugsicherung (DFS)
3. Belgium - Belgocontrol
4. Netherlands- Luchtverkeersleiding Nederland (LVNL)
5. Luxembourg
6. Switzerland- Skyguide
Area (million km2) 1.8
FABCE (FAB Central Europe)
Member States-
ANSPs
1. Czech Republic - Air Navigation Services of the Czech Republic (ANS
CR)
2. Slovak Republic - Letové prevádzkové služby (LPS)
3. Austria - Austro Control
4. Hungary - HungaroControl
5. Croatia - Croatia Control - Croatian Air Navigation Services
6. Slovenia- Slovenia Control
7. Bosnia and Herzegovina

114
Area (million km2) 0.5
DANUBE
Member States-
ANSPs
1. Bulgaria - Bulgarian Air Traffic Services Authority (BULATSA)
2. Romania- Romanian Air Traffic Services Administration (ROMATSA)
Area (million km2) 0.4
BLUE MED
Member States-
ANSPs
1. Italy - ENAV (Ente Nazionale di Assistenza al Volo)
2. Malta- Malta Air Traffic Services (MATS)
3. Greece
4. Cyprus
(plus Egypt, Tunisia, Albania, Jordan as observers)
Area (million km2) 1.7
UK- IRELAND
Member States-
ANSPs
1. United Kingdom
2. Ireland - Irish Aviation Authority (IAA)
Area (million km2) 1.3
SW FAB (South West FAB)
Member States-
ANSPs
1. Portugal - NAV Portugal (pt) (Navegação Aérea de Portugal)
2. Spain -ENAIRE (ENAIRE)
Area (million km2) 2.9
It is evident from the map that the criteria were not only geographical. For example,
NEFAB and Denmark-Sweden FAB prove that the criteria are also political and/or
operational. In addition, in terms of geographical coverage the FABs are not equally
categorised. For instance, Baltic FAB or Danube cover an area of 0.4 million Km2 whereas
South West FAB covers an area of 2.9 million Km2. Another important element is the
traffic. The annual total en-route service units in 2015 for SW FAB were 18.2 million
whereas Danube had 7.8 million terminal service units (TSUs) (EUROCONTROL, 2016a).
Another important element is the complexity of the airspace. Where there are special use
airspace (SUA) areas, the complexity of navigation can be an issue and the workload of

115
the pilots and ATCOs is increasing. Thus, the categories are not equally balanced in terms
of traffic, covered area, number of states, ANSPs and traffic complexity.
Figure 14: Traffic complexity scores (EUROCONTROL, 2016a: 13)
Maastricht Upper Area Control Centre (MUAC) is a successful example for the harmonised
European sky. MUAC is an international non-profit air navigation service provider,
operated by EUROCONTROL on behalf of four States – Belgium, Germany, Luxembourg
and the Netherlands. Someone could argue that MUAC should be extended to other
countries, but this depends on the political willingness of the states in question to transfer
control of their national airspace. MUAC airspace size is 260,000km2, has around 4,470
flights per day, 1.6 million flights per annum and the 98.9% of the flights are on time with
an average delay per flight of 0.17minutes.

116
To manage this busy and complex airspace, MUAC is organised on a multinational, cross-
border basis. The area of responsibility of MUAC in Belgium, Germany, Luxembourg and
the Netherlands consists of the Brussels UIR (Upper Information Region), the Amsterdam
FIR and the Hannover UIR from flight level 245 to flight level 660. It has to be noted that
over 17% of all European flights use MUAC’s airspace (EUROCONTROL, 2016b). It is
part of FABEC that covers the 55% of the European traffic (FABEC.eu, 2016).
For the 11th consecutive year, the ATM Cost-Effectiveness (ACE) 2012 Benchmarking
Report confirms MUAC as one of Europe’s best-performing Air Navigation Service
Providers with the highest controller productivity. The Free Route Airspace Maastricht and
Karlsruhe (FRAMaK) project delivers a total of 466 direct routes in the upper airspace
controlled by MUAC and the Karlsruhe UAC, creating a large-scale, cross-border direct
route network over Belgium, most of Germany, Luxembourg and the Netherlands.
Traffic is one of the main issues that affect the productivity and the profitability of the
ANSPs. Traffic flows are related to the number of passengers and the origin-destination
airport. The gentle flow of traffic can explain schedules, which seem excessive in relation
to traffic origin-destination (Wensveen, 2007). By nature, traffic flows differ from case to
case, depending on the geography, route structure and alternative services available.
Some cities because of favourable conditions to their geography derive more benefit from
the traffic flow, unlike some other cities. A company cannot change that, and a carrier may
not assume that a city A can support a specific type of service because a city B receives
such services. The traffic can therefore vary from city to city depending on the geography
and route structure, but even in the same city varies from year to year depending on the
type and intensity of nonstop services that can bypass this city (Wensveen, 2007). The
main aim of Air Traffic Flow Management is to balance air traffic demand with system
capacity to ensure a safe, efficient utilization of the Airspace System.

117
In 2021 according to EUROCONTROL (2015a) forecasts there will be 11.4 million IFR
movements (±1 million) in Europe figure that is 19% more than in 2014. In 2014, the
number of flights increased by 1.7% compared to 2013. As for the flights, this forecast is
partly driven by a weak economic growth in some parts of Europe. Sport events, like
EURO and Olympics, swifts to traffic flows due to airspace unavailability, like parts of
Eastern Ukraine, Syria, Iraq and Libya, or GDP changes are aspects that influence traffic
and are taken into consideration on the forecasts.
Figure 15: Average annual flight growth 2014-2021 per state (EUROCONTROL, 2015a)
France, Germany, Spain followed by UK, Italy and Belgium/Luxembourg are still the
busiest states in terms of number of extra flights per day, but Turkey has the fastest
growth rates (6.0% as average annual growth rate over the 7 years) and the highest
number of extra flights per day (2,330 additional flights per day in 2021) and is the biggest
contributor to the growth in Europe (EUROCONTROL, 2015a: 38).

118
Figure 16 Average Annual Growth per FAB, 2021 v 2014 (EUROCONTROL, 2015a)
Danube FAB is expected to have the highest average annual growth rate (4.1%, ±1.7 pp)
over the next seven years. Blue Med FAB and South West FAB are the busiest European
FABs with respectively 3.4% and 3% average annual growth rate. NEFAB and DK-SE FAB
will experience more limited average annual growth rates of respectively 1% and 1.6% by
2021 (EUROCONTROL, 2015a: 38).
The income of the ANSP is under the use pays principle and is coming from en-route
charges and from terminal charges. There are different sorts of air navigation charges;
route charges, terminal navigation charges, and communication charges
(EUROCONTROL, 2016a). The charging is defined according to the zone the airspace
user is flying at. The zones are of two kinds: en route charging zones and terminal
charging zone. The ‘en route charging zone means a volume of airspace for which a single

119
cost base and a single unit rate are established and the ‘‘terminal charging zone means an
airport or a group of airports for which a single cost base and a single unit rate are
established according to the Commission Regulation (EC) No 1794/2006 of 6 December
2006 laying down a common charging scheme for air navigation services. Charges are
directly cost-related. If the traffic is very low in one airspace, the charges could be
increased in order for the ANSP to recover the cost of the offered service. Thus, the traffic
forecasts affect the charges of the services by the ANSPs
4.3 Charges for the ANS provision
The Chicago Convention established the ICAO (International Civil Aviation Organization)
and introduced the charges for airports and air navigation services (Huet, 2011). In 1958, 5
types of charges were examined: a. a weight factor only, b) weight and distance factors, c)
a parameter depending on the kind of flight and nature of facilities required, d) a parameter
depending to the route flown, or e) general levies on fuel and oil provided at international
airports. After 9 years, at 1967, ICAO Conference on Charges for Airports and Route Air
Navigation Facilities (CARF) decided that it should be only one charging price per flight
that will cover all the air navigation services and be based on the achieved distance and
the weight of the aircraft (Huet, 2011).
At 1970, a multicriterial charging system was established that exists until today. From the
1st January 1986 there is a simple charging system according to which there is only one
charging price per flight that is paid in one currency, euro (since 1991) and is collected by
one body, EUROCONTROL, on behalf of its Member States (41 states)
(EUROCONTROL, 2010). The CRCO operates the EUROCONTROL Route Charges
System on behalf of the EUROCONTROL Member States under the provisions of the
Multilateral Agreement relating to Route Charges. In addition, the CRCO bills and collects

120
terminal charges and communication charges for Member States as well as air navigation
charges for non-Member States, on the basis of bilateral agreements.
At 2011, EUROCONTROL collected the charges for 38 Member States and the forecasts
were that it would collect 6.5 million euro with a recovery rate of more than 99%and has an
administrative cost of some 0.3% of the amount collected (Huet, 2011:150). At this
collecting system, there is not any difference between the upper and the lower airspace.
In 1998, the charging system of the Most Frequent Used Route (MFUR) to a Route per
State Overflown (RSO) charging system, allowing a more accurate billing, closer to where
the costs and services are generated. The first exemption to the full recovery mechanism
was UK. UK requested an alternative charging system that is based on independent
economic regulation as precondition to the partial privatization of its air navigation service
provider, NATS, to allow private investors to drive cost-efficiency, decrease charges and
generate profit (Huet, 2011:151). There are two different methods for the calculation of unit
rate, full cost recovery method and determined costs method.
SES aimed to implement a common single charging system for the provision of the Air
Navigation Services for the whole duration of the flight (EUROCONTROL.int, 2016b).
According to EC (2012) the so called ‘common charging scheme’ is of vital importance for
the implementation of a harmonised system of ATC in Europe. The common charging
scheme enhances a) the transparency of charging and collecting of the charges for the
airspace users, b) the efficient provision of ANS for the airspaces users that are funding
the system and c) the provision of harmonised services that is a fundamental step for the
implementation of Single European Sky.
The Route Charges System ensures the interoperability of SES rules and the fundamental
principles of EUROCONTROL regarding the application and collection of aeronautical
charges. The total charge (R) per flight that is collected by EUROCONTROL equals to the

121
sum of charges (ri) that are produced in the zone of charges that are established by the
states (EUROCONTROL.int, 2016c):
R=∑ 𝐫𝐢𝒏
The single charge (ri) is calculated by multiplying the distance factor (di) to weight factor
and to the unit rate (ti)
ri= di x p x ti
di x p) is defined as the number of service units in charging zone (i) for this flight.
The current charging system for ANS offered transparency among the European ANSPs
since the calculation is done with a common system and with the same formula (Huet,
2011). A very important step for the charging system is that it implemented the charging
zones without splitting it to upper and lower airspace.
Search and rescue flights authorised by the appropriate competent body, flights performed
by aircraft of which the maximum take-off weight authorised is less than two (2) metric
tonnes, flights performed exclusively for the transport, on official mission, humanitarian
flights authorised by the appropriate competent body, customs and police flights, circular
flights and flights performed exclusively under Visual Flight Rules (VFR) within this
charging zone are exempted from the payment of route charges (EUROCONTROL.int,
2016c).
Route charges are a type of reimbursement for the costs occurring for the States and the
ANSPs as well as the cost of EUROCONTROL. The costs of ANSPs are mainly costs for
the provision of ATC, COM, NAV, MET, AIS, overheads, training, research and
development. The costs for the States are mainly regulatory services and oversight
services (EUROCONTROL.int, 2016c).

122
The tariffs are calculated based on the forecast of the traffic. There is an adjustment
mechanism that balances the losses and gains on a year n+2 scale. Additionally, the
mechanism is calculated on a full costs recovery and it provides the application of
economic regulation (SES Performance Regulation). The states are taking under
consideration the depreciation cost, operating costs, costs of capital and EUROCONTROL
cost and establish a forecast cost-base for each charging zone. Thus, a unit rate is
established for each charging zone. The unit rate for Greece in 2013 was 33.89 euro and
34.53 in 2014 whereas for UK was 83.98 in 2013 and 83.73 in 2014 (EUROCONTROL,
2014; EUROCONTROL; 2015b). The unit rate is reducing year by year. The average
weighted unit rate for 2011 was 58.09 euro, whereas the average unit rate for 2016 was
56.72 euro (EUROCONTROL, 2012; EUROCONTROL, 2016c).

123
Table 12: Cost-bases and national unit rates for 2016 (EUROCONTROL, 2016c)

124
EUROCONTROL has bilateral agreements for aeronautical charges with 4 no-member
states, Belarus, Uzbekistan, Morocco and Egypt, but also with the Ukraine (until its full
technological incorporation to the multilateral route charging system). The terminal
charges for Ukraine, Belarus and Egypt for 2011 are around 35.3 million euros. The total
route charges for 2011 were 390.1 million euro and correspond to 1.25 million flights
(EUROCONTROL, 2012).
According to Crespo and Mendes De Leon (2011) it would be a utopia to say that in the
long-term FABs could establish one charging zone with strict common rules. The article 4
of the charging regulation says that FABs should have harmonisation and consequently
the implantation of this regulation to the maximum extent. European Commission admits
that it would be more beneficial for the European Network to have big charging zones
according to the business needs, but with slightly differentiated rules than to continue with
the same tradition charging zones following national borders.
The charging regulation utilised the economic sides of the performance system and
introduces economic incentives with a cost risk sharing system. FABs are tools for the
restructuring of the ANS service provision and enhancement of cost efficiency. FABs are
encouraged to define a charging zone or a common cooperation net by which it will be
easier to reach economies of scale (Huet, 2011). The full cost-recovery system offers
financial stability to ANSPs and allows users to get back any over-recoveries, but it does
not act as economic incentive for the ANSP to be cost-efficient since they face low
financial risk.
4.4 The economics of Air Transport Management
Single European Sky is a quite ambitious initiative. The implementation of SES is proven
hectic. In order to understand SES’s importance for the aviation sustainability as well as
the possible reasons why it is not fully implemented, it is of critical importance to explain

125
the business environment. Industrial economics theory will be applied to better understand
the aviation environment of SES.
Industrial economics deal with economic problems of the industries, as well as their
relationship with the society (Stigler, 1968). Industrial economics will be used to
understand the economic aspects of ATM seeking to analyse their behaviour and draw
normative implications for the aviation system. This part will concentrate on the constraints
which impede the achievement of the SES goals and will try to remove them emphasising
on empiricism.
One of the key issues in industrial economics is assessing whether a market is
competitive. The elements of market structure and market concentration are critical for
modelling firm behaviour. It deals with the information about the competitors, natural
resources and factors of production and government rules and regulations related to the
aviation industry. Furthermore, it deals with the business policy and decision-making.
Those two elements are interdependent, since without adequate information no one can
take proper decision about any aspect of business.
Industrial economics are closely related to the concept of efficiency or performance. ‘The
appropriate decision making and efficient implementation of the decisions are the vital
determinants for the efficiency conditions in business’ (Barthwal, 2004:31). The market
structure and market power in ATM is affecting the performance of SES and the
implementation of the regulations.
The main players in SES are the Air Navigation Service Providers, European Commission
and CAAs/NSAs. To determine the degree of competition in an industry, an initial
indication is the number of enterprises, which is not the most appropriate. Another way to
measure the degree of competition is the production concentration level. The simplest

126
indicator of the concentration of an industry is the sum of the market share for the industry
(index CRκ) (Pacos, 1997: 52).
CRk=∑ 𝒔𝒊𝒌𝒊=𝟏
Where:
CRk: concentration ratio
S: share of the firm i
K: number of the 3, 4, 8 ... larger firms in the industry
Another way of measuring is the index Herfindahl -Hirschman (index HHI). The H index
has the advantage over the CRk that it takes into account, in addition to 3.4... larger
companies in the industry, all other businesses (Pacos, 1997: 54)
H=∑ 𝒔𝒊𝟐𝒏
𝒊=𝟏 = 𝒍+𝒄𝒗𝟐
𝒏
Where:
Cv: represents the variation coefficient of the size of the companies in the industry
Cv2 / n: measures the contribution of inequality in the degree of concentration
1 / n: the inverse of the number of enterprises
The more firms there are in an industry, the lower the value of HHI, ceteris paribus
(Waldman & Jensen, 2012). This index takes account of all firms in the industry. Their
market shares are weighted by the market share itself. The larger the firm, the more will be
its weight in the index. The maximum value for the index is one where only one firm
occupies the whole market. This is the case of a monopoly. When the scope is national,
then the ANSPs are natural monopolies. When the scope is ECAC then the ANSPs are

127
considered Oligopolies. When considering though the services, the market structure
becomes more complicated.
According to the European Commission (2016) the five biggest ANSPs, i.e. DFS for
Germany, DSNA for France, ENAIRE for Spain, ENAV for Italy and NATS for the UK bear
60 % of total European gate-to-gate service provision costs and operate 54 % of European
traffic. Only 40 % of remaining gate-to-gate costs are borne by 32 other smaller ANSPs
that operate the 46% of European traffic. Consequently, the traffic is concentrated to the 5
big ANSPs.
When the scope of the services provided is not a country and the ANS are provided to
more than one country or a country has more than one ANSP then the market is
considered oligopolistic. An oligopolistic market is created when a small number of
producers dominate the industry (Stabler, et al., 2010). In the market, there are often a
number of competitors, but so that everyone has a negligible influence on the price
(Varian, 1992).
If firms of an oligopolistic industry manage to communicate with each other (in terms of
pricing, market shares, etc.) they achieve a restriction to competition and reduce
uncertainty, all of which reduce the total profits of the industry. A formal or informal
agreement / partnership between businesses for market exploitation is called cartel.
Conditions for the creation of a cartel are the production of homogeneous product, the
strong interdependence and knowledge of the demand conditions. Where a cartel
operates in accordance with the intentions of its members, it acts as individual practical
monopolist, which maximizes the total profit of the industry (Besanko & Braeutigam, 2011).
The cartel achieves maximization of profits when it is acting as a monopoly (Varian, 1992).
Air Navigation Service Providers after 2010 started forming alliances. The ATM reforms
were first mention in 1999 and they were implemented in 2012 through the Sky

128
harmonisation. ANSPs may cooperate for different reason, the most important are a) a
good cost benefit business case; b) synergies in technologies and expertise; c)
optimisation in the production and achievement of economies of scale or scope; and d)
forced by government regulation or legislation (Singh, 2011).
Figure 17: Drivers for ANSP cooperation (Singh, 2011: 343)
Air Navigation Service Providers are taking advantage of economies of scale. The main
point on the economies of scale lies in cost conditions, namely the way in which unit cost
varies as the amount of product produced by a production unit (Pacos, 1997). If production
increases and the long-term average cost decreases, then the cost exhibits economies of
scale (Vettas & Rector, 2004). In addition, economies of scale in cost function are
interrelated with the returns to scale production function and so ‘when the input product
exhibits constant returns to scale, the long-run average cost remains constant when
changing the level of production’ (Morgan et al, 2009). Economies of scale simply are
factors that cause the average cost of producing something to fall as the volume of its
output increases. When economies of scale are strong, which means that the market has

129
very few companies, the average cost curve falls abruptly to a large range of production
levels (Morgan et al, 2009).
Unlike the traditional microeconomic approach under real conditions, competition is not
perfect. Perfect competitive or monopolistic markets are simply the opposite ends within
which there are several gradations of organization of the market. Business’s attitude
affects their performance, i.e. prices, profits, etc. In many cases, it even affects the
performance of other companies in the sector. The behaviour of all firms in an industry
affects the performance of the entire sector. Thus, the performance of airlines or the
performance of airports, or the performance of ANSPs is affecting the performance of
aviation as a sector.
ANSPs within a country are considered natural monopolies. Monopoly is a situation in
which only a producer of a commodity exists for which there is no substitute (Stabler et al,
2010; Waldman & Jensen, 2012). The fact that a company does not face competition from
other operators does not mean that it can set the highest price of all feasible (Vettas &
Rector, 2004).
The cases of monopoly according to Katz & Rosen, (2007: 581) are a) the sellers are price
modulators, i.e. the demand curve for a price modulator now has a downward slope as the
price falls as the quantity of product sold increases; b) the sellers do not behave
strategically because the supplier does not encounter resistance from the other suppliers
in the selection of its own actions; c) entering the industry is impossible; and d) buyers are
price-receivers. The ANSPs are charging according to the cost of the service taking under
consideration the traffic volume. Thus, the airspace users are price receivers. The
airspace management belongs to the ANSP and the government either as Ministry of
Transport or as CAA has given the company the exclusive right to serve an airport and the

130
cost of service provision makes the provider more productive than many (natural
monopoly).
If for any level of production in the sector the overall cost of production of that level in a
company is less than the total cost to be borne by two or more companies if they share
this production together, then a market is characterised as natural monopoly (Besanko &
Braeutigam, 2011; Morgan et al, 2009; Scotter, 2008). This happens when there are
several strong economies of scale or economies of scope (Vettas & Katsoulakos, 2004). In
the long-run equilibrium, each firm in monopolistic competition has a normal economic
profit and produce on the downward part of the curve of average cost (Waldman & Jensen,
2012, p.366). According to Schumpeter, the ideal way for market structure is not perfect
competition, but large firms with monopoly power (Waldman & Jensen, 2012).
Moreover, Viscusi, Harrington and Vernon (2005), distinguish between permanent and
temporary natural monopoly. The Long-Run Average Cost (LRAC) of permanent natural
monopoly continuously decreases as output increases. In temporary natural monopoly, the
LRAC decreases but after a certain point it becomes constant.
Natural monopolies in most cases are regulated or operated by state (Varian, 1992). In
cases where the regulated monopoly does not take subsidy, it should operate on the
average cost curve or above in order not to have negative earnings. If a natural monopolist
operates in conditions of equal price and marginal cost, it will produce an effective amount
of product MC, but without covering its costs (Varian, 1992).
The existence of natural monopoly does not guarantee that a company will be able to
prevent competitors from entering the market. The natural monopoly can put other barriers
to entry in the market called monopoly viable (sustainable monopoly) (Scotter, 2008). So it
(Scotter, 2008: 330) has cost function C (q) and demand function D (p) if
131
1. The 1st condition is applied, under which the company meets the market demand at
any price [q = D (p)].
2. The 2nd condition is applied, under which the company covers the cost of [p * q = C
(q)].
3. The 3rd condition is applied, whereby the company sets a price p such that any
competitive company trying to enter the market by selling a smaller quantity at a
lower price, would suffer [p΄*q΄<C(q΄) for all p΄<p and all q΄≤D(p΄)].
Figure 18: Price and Quantity in monopoly market
In Figure 18, it can be seen that the profit-maximizing price is pm and qm quantity as at this
point the MC = MR. The supernormal profits of the company equal to the size of pmdcf.
The supernormal profits are probably attracting competitive companies. If a competitor
enters the market, then the company will lower the price to ps, which is sustainable and
market price, where ATC = D. The company assumes that consumers will stay inactive
and will not move the demand to the competitor immediately and the company will have
time to amend the price properly and thus preventing the competitor from taking the
market share (Scotter, 2008).

132
One key characteristic of natural monopoly is subadditivity. This means that it is cheaper
to produce the same production level when only one company produces, and that the
same production level becomes more expensive when a second company joins the
market. On the other hand, economies of scale exist when additional units of production
are associated with a lower average cost, but costs per unit begin to rise after a certain
level.
Figure 19: Economies of scale versus subadditivity
Figure 19 depicts the case of economics of scale versus subadditivity. The orange
demand curve, within the economies of scale region, is a viable natural monopoly. The
purple line indicates a non-sustainable natural monopoly. The red line indicates the border
case of a profit generating monopoly (which would attract competitors) and the blue line
indicates a viable duopoly. Subadditivity is considered a necessary but insufficient
condition for a natural monopoly to be considered optimal, whereas if economies of scale
exist, this is a sufficient but not necessary condition for a natural monopoly to be

133
sustainable. In multiple-output case where the interdependence among outputs becomes
important, economies of scale are neither necessary nor sufficient for costs to be
subadditive according to Viscusi et al (2005).
4.5 Economic regulation of Air Navigation Services
Air Navigation Service Providers (ANSPs) as explained above operate as natural
monopolists. There are different organisational forms. There are a) governmental agencies
(e.g. FAA-Federal Aviation Administration in USA), b) state owned or government
business enterprise (e.g. DFS Deutsche Flugsicherung GmbH in Germany), c) private-
public-partnership (PPP9) (e.g. NATS in UK) and d) private entity (e.g. Nav Canada). All
the different ownership and organisational forms exist and all have the potential according
to ICAO (Doc 9161, 2013) to deliver excellent service under the condition of an
appropriate government structure.
Most of the ANSPs are not private entities or PPPs. The idea behind privatization is to
increase the role of market forces, thus to improve industry performance. Apart from that
freeing of entry to an industry, encouraging competition and permitting joint ventures can
contribute to improvements on industry performance. Market forces can also be increased
by restructuring the nationalized industry, to create several successor companies that may
be publicly owned.
Privatisation can bring benefit to consumers, since private companies tend to produce the
quantities and varieties the customers want, thus by covering customers’ need, private
companies generate earnings. The companies though are becoming profit-orientated and
9 Public-private partnership (PPP) provides private financing for infrastructure investment without immediately adding
to government borrowing and debt, and can be a source of government revenue (ICAO-9980, 2012).

134
are unwilling to offer uneconomic services, are orientated towards eliminating inefficient
production and restrictive labour practices.
Nav Canada is the first fully private ANSP. It was created in 1996 and is the world’s
second largest ANSP by traffic volume. Nav Canada is following self-regulation, which
means that it has an unlimited ability to set fees to airlines at a level sufficient to cover all
of its costs, including reasonable reserves. Nav Canada is monitored by airline customers
through membership on the board of directors (ICAO Doc 9980, 2012). On the other hand,
AEROTHAI, Aeronautical Radio of Thailand Limited, is a State enterprise in which 89
airlines had minority equity stakes in 2008, but the government controls the charges (ICAO
Doc 9980, 2012). Charges for ANS is an important cost for airlines and thus for
passengers’ fairs.
Within Europe, UK is by far the most liberalised market. NATS was proposed as PPP in
1998 and was finally formed as PPP in 2001. In 2001, Airline Group acquired 46% of
NATS, the NATS staff took 5% and the remaining 49% was held by government. In 2009
joined the A6 alliance. In 2011, NATS crated a partnership with Ferrovial Servicios, called
FerroNATS. FerroNATS provides air traffic control services in the airports of Alicante,
Valencia, Ibiza, Sevilla, Jerez, Sabadell, Cuatro Vientos, Vigo, La Coruña and Melilla
(NATS 2015). Prices of NATS are regulated in accordance with the price-capping formula
(RPI-X) to create incentives for efficiency and are revised every 5 years taking into
account, inter alia, major investment projects.
Both airports and ANSPs are characterised by sunk costs. The central economic rationale
for airport regulation is the maximisation of conventional economic welfare or, equivalently,
the minimisation of deadweight loss according to Biggar (2012). Czerny, Guiomard and
Zhang (2016) identify airport market power per se; airport market power in combination
with potential airline market power (which relates to vertical governance and/or integration

135
in air transport markets); airport congestion; distributional issues; investment in airport
infrastructure; and the supply of airport concession services, as the main issues of concern
in price regulation of airport monopolies from an theoretical viewpoint. Large airports with
substantial market power are usually subject to detailed and strict regulation (Biggar, 2012;
Bel and Fageda, 2010).
According to Viscusi, Harrington and Vernon (2005) when an industry is regulated, market
forces and administrative processes codetermine industry performance in terms of
allocative and productive efficiency. It is very difficult for the government to perfectly
monitor firms and market forces play a predominant role regardless of the degree of
government intervention.
Moreover, Viscusi, Harrington and Vernon (2005) point three key decision variables for the
economic regulation of an industry, a) price, b) quantity and c) number of firms. The
regulator may control the entry and/or exit of firms. Control over entering the marker
usually applies in public utilities areas. The control of exit aims to have services provided
to a wider area. This regulatory principle is applied in the railway sector. Restrictions on
the quantity of production can be used with or without price regulation.
In price regulation, the regulator sets a particular price (or price structure) that firms must
charge or restricts firms to setting price within some range. One of the main issues the
regulator faces when regulating a monopolist is related to Ramsey pricing. This means
that the price margins should be inversely proportional to the demand elasticity for the
various products/services. Ramsey pricing is economically efficient in the sense that can
maximize welfare under certain circumstances. Ramsey pricing is effective only if all
markets are equally monopolistic or equally competitive. The services/products with more
elastic demands are charged less, likewise, the more inelastic the demand, the higher the
price ceteris paribus.

136
Under the rate of return regulation (also called cost of service or cost plus regulation)
ANSPs are required to obtain approval for the level of charges and investment. This
regulation aims to limit the provider’s rate of return on capital at the level prevailing in a
competitive market. According to ICAO Doc 9161 (2013) it allows cost pass-through for
both operating and capital expenditures, but it may provide the ANSP with a strong
incentive for over-investment in order to increase the volume of its profit. The solution to
this could be price cap regulation, under which the regulator sets a maximum chargeable
rate. Under performance regulation, ANSPs can charge up to a specific amount following a
traffic risk sharing mechanism.
ANSPS transition phase began in the 1980’s rather slower in comparison to the airports
and airlines, and traditionally have been operated directly by governments. Each structural
situation, strategy or legal regulation that limits the chances or entry speed is a factor of
protection for established business like air carriers or ANSPs, and it affects the potential
competition (Pacos, 1997). Thus, the entry barriers are considered very important. Equally
important are considered the exit barriers. The exit barriers raise the issue of non-
recoverability of an investment cost (Pacos, 1997)
Bain defined barriers to entry as market conditions that allow a dominant firm to raise
prices above the level of competition, without attracting new entry. A barrier to entry exists
when there is a new business entering the market is not able to achieve the same profit
levels with those of the dominant firm before the new entrant (Waldman & Jensen, 2012).
Bain found economies of scale, absolute cost advantages, the necessary capital
expenditure and product differentiation advantages as four elements of the market
structure that act as barriers to entry (Waldman & Jensen, 2012). Economies of scale act
as a barrier to entry, in the sense that the new entrant is unable to ensure that the size of
the sector demand, which would allow it to benefit from economies of scale without

137
simultaneously increasing the overall supply resulting in compression of the selling price in
below the minimum unit cost (Pacos, 1997).
Hence, the entry of a new ANSP is considered much more difficult than the entry of a new
airline due to the high sunk costs as well as the authorisation dependence from the
government authorities. All the European Common Aviation Area (ECAA) states and the
organisational and corporate arrangements for the ANS provider are gathered in the Table
13.
Table 13: Organisation and Corporate arrangements of the ECAA states (Efthymiou et al,
2016)
ANSP Country Organisational & Corporate Arrangements
Aena Spain State enterprise
ANS CR Czech Republic State enterprise
ARMATS Armenia Joint‐stock company (State‐owned)
Austro Control Austria Joint‐stock company (State‐owned)
Avinor Norway Joint‐stock company (State‐owned)
Belgocontrol Belgium State enterprise
BULATSA Bulgaria State enterprise
Croatia Control Croatia Joint‐stock company (State‐owned)
DCAC Cyprus Cyprus State body
DFS Germany Limited liability company (State‐owned)
DSNA France State body (autonomous budget)
EANS Estonia Joint‐stock company (State‐owned)

138
ANSP Country Organisational & Corporate Arrangements
ENAV Italy Joint‐stock company (State‐owned)
Finavia Finland State enterprise
HCAA Greece State body
HungaroControl Hungary State enterprise
IAA Ireland Joint‐stock company (State‐owned)
LFV Sweden State enterprise
LGS Latvia Joint‐stock company (State‐owned)
LPS Slovak Republic State enterprise
LVNL Netherlands Independent administrative body
MATS Malta Joint‐stock company (State‐owned)
M‐NAV F.Y.R.O.M. Joint‐stock company (State‐owned)
MUAC - International organisation
NATA Albania Albania Joint‐stock company (State‐owned)
NATS United Kingdom Joint‐stock company (part‐private)
NAV Portugal Portugal State enterprise
NAVIAIR Denmark State enterprise
Oro Navigacija Lithuania State enterprise
PANSA Poland State body (acting as a legal entity with an
autonomous budget)
ROMATSA Romania State enterprise

139
ANSP Country Organisational & Corporate Arrangements
Skyguide Switzerland Joint‐stock company (part‐private)
Slovenia
Control Slovenia State Enterprise
SMATSA
Serbia
Limited liability company
Montenegro
Cyprus ANSP before was Government department and in 2015 started to be reformed
again. DFS in Germany in 2002 was Limited Liability Company. LVNL (The Netherlands)
in 2002 was State enterprise and Slovenia Control was a government department. State
enterprise is a government-owned corporate entity operating under a special statute, not
normal commercial law (PRU, 2004). Commercialization in ANSPS is deemed as a
possible answer to financing and budgets constraints, as ANSPs were generally
dependent on government budget for their capital and operational expenses. One
important factor is reinvesting in the operational systems and enhancing performance and
efficiency.
According to ICAO Doc 9587 (2008) the objective of ongoing regulatory evolution is to
create an environment in which international air transport may develop and flourish in a
stable, efficient and economical manner without compromising safety and security and
while respecting social and labour standards. One also very important aspect in aviation
industry is cost. As far as the cost of infrastructure is concerned according to IATA (2013a)
airlines and passengers are estimated to have paid at least US$92.3 billion for the use of
airport and air navigation infrastructure globally in 2011, equivalent to 14.4% of the cost of
transport. Cost efficiency is quite critical for an airline to compete and survive in such a
competitive market. Cockpit and cabin crew, aircraft ownership, fuel, maintenance,

140
handling and catering infrastructure, passenger services and distribution and other costs
are the main costs for all airlines. ANS costs are the only costs that are the same for every
carrier and the way the carriers operate does not affect the ANS cost significantly. All
carriers are charged the same unit rate when they fly above a country.
The Cost Effectiveness of ANSPs is measured by the annual ATM Cost-Effectiveness
(ACE) Benchmarking Report conducted by Performance Review Unit of EUROCONTROL.
The main indicators that are taken under consideration are the ATCO-hour productivity,
i.e. the number of flight hours handled by each ATCO hour. This is can be influenced by
sector productivity (reflecting whether the number of sectors is optimal for the volume and
pattern of traffic), staffing per sector and ATCO productivity (reflecting, for example, the
efficiency and flexibility of ATCO rostering) (PRU, 2004). On the other hand, it is important
to recognise that a single flight hour can make different demands on ATCOs, depending
on the nature of the flight and the extent to which it interacts with other traffic. Thus, the
productivity is related to the complexity of the airspace.
The second main indicator is ATCO employment costs, which is closely related to the
wages and working practices (the trade unions power plays an important role in the
negotiations of the salaries) but will also reflect local economic conditions that are outside
of management’s control. The last main indicator for the cost effectiveness of ANS is the
support costs, and in particular, the ratio of total ATM/CNS provision costs to ATCO
employment costs.

141
Figure 20: PRU Framework for Cost Effectiveness Analysis (PRU, 2004: vii)
One of the main cost drivers for ANSPs costs is the complexity of the controlled airspace.
The complexity of the airspace is closely related with the ATCO’s workload. Complexity
covers anything that increases the possibility of airplanes interacting with each other and
therefore ATCOs may need to take action to ensure that safe distances are maintained
(NERA, 2006). Apart from the volume of airplanes handled, the complexity is affected by
whether certain routes cross each other and therefore give rise to potential conflict
situations, i.e. in the horizontal routes level. Moreover, whether there is a mix of traffic that
may be either climbing, descending or cruising within a particular area of airspace, i.e. the
vertical evolution of airplanes is affecting the complexity of the airspace. Finally yet
importantly, the mix of traffic speeds is influencing the complexity. Even if all planes are
following the same route and flying in the same direction, if some are faster than others
are, then ATCOs will need to ensure that faster planes do not catch up with preceding
slower planes. Thus when the airspace is more complex, more ATCOs will be needed to
ensure the safe separation between planes and in general safe operations.

142
The risks related to the revenues of ANSPs are the demand, the exchange rate and the
debt. The politic/economic climate, the changes in air traveller preferences and climate
events like volcanic eruptions can affect the revenues of ANSPs since the traffic is
affected. The traffic risk sharing arrangement from SES Charging Regulation can mitigate
the risk and will be explained in a later chapter. Unlike in other industries, demand is not
affected by competition, as ANSPs are monopoly service providers. One other risk for
those ANSPs that are not in Eurozone is the exchange rate. ANSP charges are initially
fixed in terms of the domestic currency and converted to Euros using estimates of monthly
average exchange rates thus there can be a positive or negative effect on revenues of the
ANSP. Finally, ANSPs face a small risk of non-payment from airlines with hectic economic
situation.
On the other hand, the risk associated with cost are related to the cost variations,
exchange rations and policy and regulation. There is a possibility that increases in charges
do not keep pace with increases in the cost base due to for instance inflation. The
difference in the exchange rate between euro and other currencies has an impact on the
costs of the ANSPs too. Finally risk in cost associated with possible changes to the
regulatory framework and relatively frequent changes to regulated charges can increase
the uncertainty of ANSP. Nevertheless, ICAO requires that states offer support to an
ANSP by providing distress finance or direct grants (Steer Davies Gleave, 2014).
The liberalization in the Air Navigation Service Provision was preceded by the liberalization
of airline activities. ANS in Europe started being liberalised through Single European Sky
and Functional Airspace Blocks. First proposed in 2004 and established in 2009, the FABs
were implemented 4 December 2012. Although on the air carrier side the private
participation, privatization and commercialization was faster than for airports and Air
Navigation Service Providers (ICAO, 2003), it is deemed necessary to liberalise the ANS

143
provision in order to improve the efficiency of aviation system and deliver a better value for
money and time for the passenger. Small ANSPs face difficulties in fully taking advantage
of economies of scale and dealing with the high cost of investments. ATC services like
meteorology and data communication services could be unbundled and outsourced, thus
leading to reduced costs and overall efficiency gains (Efthymiou et al, 2016).
The ANSPs and the airports have some similarities in terms of the sunk costs and the
natural monopoly forms. Niemeier (2002) researched the German airports regulatory
system in the first stages of liberalisation and concluded that the inefficient cost-plus
regulation does not increase the economic welfare and it is necessary to install an
independent regulator (to price cap airports) and to intensify competition by privatization,
cross-ownership restrictions, competition from near airport sites, slot auctioning and open
skies.
Since transport infrastructure is characterised by very high asset-specificity due to the
sunk costs on durable and immobile investments, it is important to prevent market abuse,
opportunistic behaviour and provide adequate levels and quality of service at reasonable
process according to ITF/OECD (2011). Moreover, an independent regulator ‘shields
market interventions from interference from ‘captured’ politicians and bureaucrats’ (OECD
2002). The regulator should be independent of government and operate in a transparent
fixed framework set by legislative act maintaining their independence.
Within the last years, the examples of changes in the ownership forms, pricing and
investment regulation and the liberation on service provision are quite impressive. The
Performance Regulation 550/2004 brought a relative liberalisation by stating that the issue
of certificates shall confer on ANSPs the possibility of offering their services to other
ANSPs, airspace users and airports within the Community. By this way, there is no
obligation on choice and the management of performance of the service provider is done

144
through an arm’s length commercial contract. For instance, NATS, the ANSP of UK, has
no monopoly on terminal ATM service provision and it provides such services at 15 of the
90 or so UK airports where terminal ATC services is required.
Furthermore, according to the EC Regulation 2015/340 laying down technical
requirements and administrative procedures relating to air traffic controllers' licences and
certificates pursuant, a mutual recognition of the certificates issued by ATCO training
organisations across the European Union and harmonises the medical requirements for
pilots and controllers facilitating the mobility of Air Traffic Controllers in Europe.
The system before SES was deemed insufficient and costly. For instance, the estimated
costs of fragmentation of airspace amounts to 4 billion EUR a year and the five biggest
ANSPs (AENA-Spain, DSNA-France, NATS-UK, DFS-Germany and ENAV-Italy) bear
60.3% of total European gate-to-gate ATM/CNS provision costs and they operate 54% of
European traffic according to EC (2015). SES separated the NSA/CAAs from the ANSPs
to ensure safety and efficient supervision on the targets achievement.
A random example of the situation is the traffic in April 2015. That month traffic increased
by 1.7% compared to April 2014 and despite crisis traffic is increasing. En-route ATFM
delays increased by 117% compared to April 2014 and airport ATFM delays increased by
74%. Based on airline data, the average departure delay per flight from “All-Causes” was
9.7 min per flight; this was an increase of 4% in comparison to the record low of 9.3 min
per flight in 2013 according to EUROCONTROL (2015c).
Bessley (1997) noted that the benefits of privatization derive partly from the ability to
diversify and redeploy assets, unconstrained by nationalization statutes. Bessley (1997)
also highlighted that privatisation is not just selling share, but it should be part of a whole
scheme tailored to the particular conditions of each industry. Privatization schemes should
be designed to maximize net consumer benefits, in terms of lower prices and improved

145
quality of service. It should be noted that competition in privatisation is the moving power
for effective means of maximizing consumer benefits and curbing monopoly power.
Moreover, Stricter competition policy is preferable to rate-of-return regulation, efficiency
audits and related forms of government ‘nannying’” (Bessley, 1997) as well as it is
essential to deal with social negative outcomes, such as transitional unemployment.
The adjustment results depend on a variety of factors, which are a) motivation for
regulation, b) the types of methods of regulation, c) the structure of the setup process, d)
the characteristics of the industry/sector and e) the economic and legal environment in
which the regulation takes place (Joskow & Rose, 1989, p. 1451).
In natural monopoly, the producer can minimize the cost, but an unregulated market may
lead to prices or costs to quite high level (Joskow & Rose, 1989, p. 1454). Price regulation
and absence of market entry may be a good practice in regulatory perspective if a) the
production of a single company of one or more goods minimizes costs, b) a company with
a statutory/legal monopoly chooses average prices and earnings, which are too high and
individual prices can be either too high or too low, c) the fear of entry of new competitors in
the market cannot teach a 'lesson' to the monopolist and e) the insufficient market entry
may result from the absence of a legal monopolist even if the prices are under regulation
(Joskow & Rose, 1989, p. 1454). The regulation aims to regulate the entry of potential
competitors in the market to achieve economies of a business, to set the price so that
there are insufficient or supernormal profits and to regulate the structure of values so as
the individual values to be profitable (Joskow & Rose, 1989, p. 1454).
Measuring the effects of economic regulation is achieved through some indicators
considering the behaviour and performance of the company and/or the market. The most
important indicators are (Joskow & Rose, 1989, p. 1457):

146
The average price level and structure of prices (e.g. non-unified and non-linear
tariff, pricing for natural monopolies of many products)
Static costs of production, including:
Distortion of input
Ineffectiveness under imperfect competition
Direct costs of regulation
Paid input prices
Dynamic efficiency, including the degree and direction of innovation and productivity
The quality and type of the product
The distribution of income and leases including
Profitability of regulated firms
Sharing leases with production factors
Income transfers between customer groups
Income transfers between producers group
According to Salvatore Sciacchitano, executive secretary of ECAC ‘liberalization of market
entry and fair competition go together and are keywords that have characterized the
development of aviation in the last decades in Europe’ (Sciacchitano, 2013). According to
O’Connell and Warnock-Smith (2013) yield decreased due to continued liberalization of air
services, high levels of competition, rising fuel bills and volatile operating environments.
According to Matthew Baldwin, Director for Aviation and International Transport Affairs,
European Commission (Baldwin, 2013) Europe is the most liberalized market for aviation
in the world. Airfares can be set freely, routes can be free in single aviation market
(including cabotage), there is no limit to the number of carriers and frequency, as well as
the ownership and control of European airlines. Moreover, the last ten (10) years have
been at the forefront agreements with Morocco, the Western Balkans, Jordan, Georgia,

147
Moldova, Ukraine, Lebanon, Azerbaijan and Tunisia. Agreements with Morocco and the
Western Balkans signed in 2006, reduced tariffs by 40% and benefits from 2006 to 2011 is
estimated at 6 billion euros (Baldwin, 2013).
The central issue of regulatory economics according to Train (1991) is the design of
mechanisms that regulators can apply to induce firms to achieve optimal outcomes. It
should be noticed that uncertainty has important implications for the behaviour of the firm
and consequently for the design of appropriate regulation. According to Armstrong and
Sappington (2007: 1607) ‘the policies are sorted on four dimensions: (1) the extent of
pricing flexibility granted to the regulated firm; (2) the manner in which regulatory policy is
implemented and revised over time; (3) the degree to which regulated prices are linked to
realized costs; and (4) the discretion that regulators themselves have when they formulate
policy’.
There are different forms of regulation. For instance, there is the rate of return regulation
and the RPI-X regulation. Apart from those, tree other alternative types of regulation are
market-based instruments, self-regulation and co-regulation approaches, and information
and education schemes.
Rate of Return (ROR) regulation follows the process described below (Bessley, 2005: 57):
“The regulated company files a tariff when it wishes to revise its prices. For an agreed test
period (‘frequently the latest 12-month period for which complete data are available’
(Phillips 1969)), the company calculates operating costs, capital employed and cost of
capital. The regulator audits these calculations and determines a fair rate of return on
capital employed. These data plus assumptions about demand are used to calculate the
total revenue requirement. This determines the level of the tariff. The structure of the tariff
has to avoid unfairness and unjust or unreasonable discrimination. The tariff therefore has
to be approved on a line-by-line or service-by-service basis, which typically requires the
allocation of common costs on the basis of, for example, output, direct costs, revenues,

148
etc. An approved tariff generally stands until the company files to change it, usually on the
grounds that the achieved rate of return has become inadequate.”
According to Adler et al (2015) the RoR regulation has few incentives for the regulated firm
to control costs and could lead to over-capitalization. The rate of return on capital is
defined (Train, 1991:33-34) as (PQ-wL)/K, where L is the only one noncapital input and K
the level of capital investment and wL the cost for noncapital inputs. Based on ROR
regulation an ANSP can choose any K, L, Q and P as long as the fair rate of return f is:
f≥ (PQ-wL) K
Thus, the maximum economic profit an ANSP is allowed to earn is (f-r) K since economic
profits are the difference between the ANSP’s revenue and its costs for all inputs, including
capital, meaning
π=PQ-wL-rK
Under the ROR regulation (Train, 1991) the hypothesis that an ANSP faces two scenarios,
bad and good luck, exists. Good luck means that the ANSP is able to earn greater profits
at each input combination than under bad luck. In addition, each ANSP does not know its
exact profits at each level of capital and it calculates the expected. It is assumed that there
are equal chances for the two scenarios to occur. The ANSP ‘s expected profit then is the
average of its sliced-off good luck and bad luck hills.

149
Figure 21: Example of regulated ANSP under uncertainty (Train, 1991: 102)
According to Figure 21, the ANSP in the good luck scenario would earn excessive profit
over a range of capital levels. The constraint plane slices off this part. In the case of the
bad luck scenario, the ANSP earns less than the cap. The maximum expected profits
occur at capital KR. If the ANSP knew that the good (bad) luck scenario would prevail, it
would choose KG (KB). Because of uncertainty, the ANSP chooses KR as a weighted
average solution. The constraint plane depends on the shapes of the good and bad luck
scenario hills and the maximum allowed rate of return (cap).
This regulatory system aims to control prices. For a period of 4-5 years, the ANSP should
not make any increase in the average price of a pre-specified basket of its goods and
services larger than RPI-X, where RPI is the retail price index (i.e. the rate of inflation) and
X is a performance related figure specified by the regulator. At the end of the specified
period, the level of X is reset by the regulator, and the process is repeated.
According to Bessley (2005) RPI—X is less vulnerable to ‘cost-plus’ inefficiency and
overcapitalization (the ‘Averch-Johnson effect’) than the rate of return (RoR) regulation.
Furthermore, RPI—X system offers more scope for bargaining, especially on productivity
and offers the company more flexibility in pricing.

150
The ‘cost of capital’ to a company and the required rate of return to the prospective
provider of finance are not identical. Divergences will occur under respective transactions
costs and tax positions. The regulators in order to control prices and assure competition
needs to be fully informed concerning the scope for cost reductions and the extent and
effects of new entry. Bessley (2005: 371) stated “the aim of an RPI/CPI—X regime is to set
up a total allowed revenue stream for a period of years ahead, with the intention to create
an incentive to beat the productivity gains built into that allowed revenue”.
Table 14: Price cap versus rate of return regulation (Armstrong and Sappington, 2007:1608)
Price Cap Rate of return
Firm’s flexibility over relative prices Yes No
Regulatory lag Long Short
Sensitivity of prices to realized costs Low High
Regulatory discretion Substantial Limited
Incentives for cost reduction Strong Limited
Incentives for durable sunk investment Limited Strong
According to Train (1991) the aspects of monopoly control that regulation is intended to
address such as high prices are not necessarily mitigated and could made worse, by the
regulation. Averch and Johnson created a model, known as A-J model that shows that the
regulatory procedure does not induce the firm to choose the socially optimal outcome, but
can be used to identify other types of regulation that do.
Under rate of return regulation, the firm can earn only up to the “fair rate” of return on its
capital investment. The firm is free to choose the price, output level and inputs under the

151
condition that its profits do not exceed the fair rate. This regulation can sometimes lead to
the opposite outcome, since firms face perverse incentives that operate against optimality.
ICAO Doc 9161 (2013) states that the rate of return regulation (also called cost of service
or cost plus regulation) may provide the ANSP with a strong incentive for over-investment
in order to increase the volume of its profit. Where there are no other incentives on
efficiency (for example, through governance) rate of return regulation may provide limited
incentive to cost-effectiveness and may also encourage overinvestment beyond the
requirement of users.
On the other hand, under the price cap regulation if the ANSP exceeds the target, it may
keep any over-recoveries according to ICAO Doc 9161 (2013). Where the target is not
met, the ANSP would not be allowed to increase charges to compensate for the under-
recovery and would have to find the means to balance its accounts during the regulated
period. Under this scenario, the ANSP has a strong incentive to improve its efficiency and
reduce its costs. On the other hand, an ANSP may have an incentive to overstate capital
expenditure prior to the price cap being set and, subsequently, not to undertake the full
programme (the price cap can give the ANSP a short-term return on the assets without
actually having to invest in them). It can be proven quite complex and hence expensive for
a regulator to monitor and evaluate the efficiency of such a regulation.
Output-based price caps may mitigate this problem. Prices set instead in relation to output
performance may provide better incentives to invest efficiently. The price can be varied up
or down based on meeting performance specifications. If price caps can be linked closely
to outputs over time, the ANSP will have fewer incentives to delay or not undertake
productive investments. The barriers to this form of regulation are the long lead times to
investment such that the benefits in terms of outputs are often achieved only many years

152
later and the challenge of defining outputs in such a way that they cover service quality as
well as capacity (ICAO Doc 9161, 2013).
Market based regulatory instruments according to OECD act to change or modify
behaviour through the economic incentives facing businesses. Trading schemes are a
common form of market-based instrument. MBI change relative prices and/or create
trading opportunities. Fiscal measures like taxes and subsidies, are also commonly used
MBI. Taxes are often imposed on harmful activities, such as tobacco products to make
them relatively more expensive and discourage their consumption. Subsides on the
contrary are used to encourage consumption or production of activities or products which
are considered desirable. OECD stated “the key advantage of market-based instruments is
that they reflect decisions made by citizens and businesses in response to the incentives
they face, therefore Market-based instruments are generally very flexible instruments”.
MBI are extensively used in environment and natural resource management issues.
Another type of regulation is Return on Output (ROO) regulation. The firm under this
regulation can earn a certain amount of profit up to the allowed amount per unit of output it
sells, being free to choose its output and input level as well as the price (Train, 1991).
Under the Return on Sales (ROS) regulation, the firm is allowed to earn a specific amount
of profit on each euro (Train, 1991). If marginal revenue is positive up to the second best
output then the firm behaves like under the ROO regulation, approaching arbitrarily
closely. On the other hand, Return on Cost (ROC) regulation allows to the firm a certain
amount of profit on each euro it expends. The firm increases its allowed profit by
increasing its costs. However, if marginal revenue is negative, then the firm obtains more
revenues by not increasing output. Self-regulation and co-regulation is another type of
alternative regulation. Industry self-regulation, broadly defined, can be seen as taking

153
place when a group of firms exerts control over its own membership and their behaviour
(Baldwin et al, 2013).
According to Coglianese, Nash and Olmstead (2002) the regulatory system is performance
based when performance is used as:
the basis for the legal commands found in regulatory standards,
a criterion for allocating enforcement and compliance resources,
a trigger for the application of differentiated (or tiered) regulatory standards, and
a basis for evaluating regulatory programs and agencies.
The performance based standards rely on the ability of the regulator to specify, measure
and monitor the performance. The information may be extremely difficult to be obtained.
When the implementation is hectic, the effect will be poor and the target of the regulation
will not be reached (Coglianese et al, 2002)
According to ICAO Doc 9980 (2012) the characteristics of ANS provision are much
different from those of the airports. ANS rely on facilities and services provided by other
states, since they extend over all the territory of the State concerned and sometimes
beyond. ANS provision has an international dimension based on necessary multistate
cooperation especially for route facilities and services.
4.6 Performance
The performance in Single European Sky is focusing on four Key Performance Areas
(KPAs) a) Safety, b) Capacity, c) Cost-Efficiency and d) Environment. The 4 KPAs are part
of the wider set of 11 ICAO KPAs, which also include efficiency, flexibility, predictability,
security, access & equity, interoperability and participation. The implementation as from 1
January 2012 of the performance scheme aims at setting and implementing binding
targets for EU Member States through the adoption of European-Union wide performance

154
targets and approval of consistent National or Functional Airspace Blocks (FAB)
performance plans.
Commercial aircraft operate at cruise altitudes of 8 to 13 km, where they release gases
and particulates that alter the atmospheric composition and contribute to climate change.
The effects of non-CO2 emissions (which have no Kyoto Protocol equivalent values) are
still scientifically less well understood although there are indications that certain non-CO2
emissions could have effects in some cases. In the case of contrails, the impact could be
significant, but scientific understanding of the direction and magnitude of the impact is not
currently well consolidated. To control the beyond CO2 emissions, environment is included
in the Key Performance Areas.
The Performance Scheme is developed in different periods, which are called Reference
Periods (RP). The first RP is covering the years 2012-2014. The second RP starts at 2015
and finishes at 2019. A critical point in Performance Regulation is the Monitoring, including
data collection and dissemination. If there is an evidence that the targets will not be
reached, then the introduction of corrective measures is necessary.
The estimated Total Economic Cost (TEC) for 2012 is around €10.5 bn for the SES area
(Grififths, 2014). The user charges are estimated to 7.5 bn euro. In another presentation in
2011 (Grififths, 2013), the ANS total economic cost was €14 bn p.a., where the user
charges were estimated to €9 Bn p.a. The cost of ATFM delays in 2011 was estimated at
€1.4B and the flight efficiency €3.8 B (en-route for €2B and TMA, taxi for €1.8B) whereas
the ATFM delays cost in 2012 was estimated to be €0.8B and the flight efficiency €2.2B
(en route for €1B and TMA, taxi for €1.2B). There are no available data after 2012.
Nevertheless, it is evident that the efficiency is improving. The ATFM delay and flight-
efficiency cost estimates are not included in the user charges. Airborne ANS cost, SESAR
and NEXTGEN cost is not included.

155
4.6.1 KPA: Safety
Safety is the first priority in air transportation. The role of ATM is vital in ensuring overall
aviation safety for example by providing separation between aircraft. Uniform safety
standards and risk and safety management practices should be applied systematically to
the Air Navigation System. To ensure safety to the maximum extent, criteria and
standardised safety management processes and practices should be implemented to the
global aviation system.
4.6.2 KPA: Capacity
The area of Capacity is another important area for the European Airspace. The system
should find a way to meet airspace user demand at peak times and locations and to keep
up with the demand of the traffic flows. To respond to future growth, capacity must
increase, along with corresponding increases in efficiency, flexibility, and predictability
while ensuring that there are no adverse impacts to safety giving due consideration to the
environment.
For the first Reference Period (RP1) a Union-Wide target has been set for en-route ATFM
delays per flight. Furthermore, the performance regulation stipulates that the three PIs
related to airport capacity (i.e. a. Arrival ATFM delay, b. additional Arrival sequencing and
metering area (ASMA) time and c. Additional Taxi Out time) be monitored on. No targets
have been set for ANS capacity at airports in RP1. Arrival ATFM delay and additional taxi-
out time is monitored for 77 airports that are subject to the Performance Regulation. As far
as the ASMA is concerned, only airports accommodating more than 100,000 movements
per annum, i.e. 39 airports, are subject to monitoring of additional ASMA time (PRB,
2013).
The Union-wide target for en-route ATFM delays in 2014 is 0.5 minutes per flight, with
intermediate targets of 0.7 min/flight in 2012 and 0.6 min/flight in 2013 (PRB, 2013). The

156
Union-wide capacity performance is the aggregation of both national and FAB capacity
performance. As far as the ASMA is concerned, additional taxi-out times are higher in
winter than in summer due to remote de-icing and snow removal operations. In addition, it
is recognised at several airports that Airport Collaborative Decision Making (A-CDM) can
significantly reduce taxi-out time (PRB, 2013).
4.6.3 KPA: Cost-Efficiency
The third area that the Single European Sky is regulating is the cost-efficiency. Any
proposals for changes in the ATM (e.g. investments in infrastructure) should always take
under consideration the cost of service to airspace users for improving ATM service quality
or performance. In addition, the ICAO guidelines regarding user charge policies and
principles should be followed.
Under the cost efficiency KPA, Union-wide targets have been set for the average
determined unit rate (DUR) for en-route ANS in 2012 (€57.88), 2013 (€55.87) and 2014
(€53.92). The aggregation of the individual national cost-efficiency targets for RP1
provides for a slightly lower figure for 2012 (€57.75) and higher figures for 2013 (€56.69)
and 2014 (€54.84) (EUROCONTROL, 2015b).
The results of the second year of RP1, under the Deducted Costs (DCs) method with
specific risk-sharing arrangements according to the PRB Annual Monitoring Report 2013
(PRB, 2013) were as expected. The ANSPs took action and complied with the new
calculation method. In a 2014 report one of the recommendations of PRB to EC is the
provision of more detailed information on the computation of the cost of capital (CAPEX) in
Annual Monitoring Reports and in the Performance Plans for RP2 (PRB, 2014b). This is
related to the lack of clarity for the calculation of the cost of the service and therefore the
determination of the charge. The en-route cost-efficiency performance is improving since
2012. The en-route unit costs decreased 5% compared to 2013 mainly due to the notable

157
traffic growth (5.9%) according to EUROCONTROL/Performance Review Commission
report for 2015 (2016).
4.6.4 KPA: Environment
The Air Navigation System should contribute to the protection of the environment by
considering noise, gaseous emissions, and other environmental issues in the
implementation and operation of the global Air Navigation System. According to
Regulation 691/2010 “the Performance Scheme” the main objective is to reduce ANS
related CO2 emissions and Local Air Quality (LAQ) through flight efficiency improvements,
both in the air and on the ground.
The first Reference Period (RP1) focused on improvements on average horizontal en
route flight efficiency of last filed flight plan (KEP) in European Network level (reduction of -
0.75% of the route extension in 2014 compared to the 2009 baseline equal to 5.42%) only
and not mandatory to national/FAB level and monitoring on Effective use of Civil/Military
airspace structures (PRB, 2013). The other objectives of RP1 are:
1. Develop and support the deployment of 500 airspace changes in 2012 – 2014.
2. Support the implementation of Free Route Airspace (FRA) in 25 ACCs by 2014.
3. Increase annually the number of Conditional Routes (CDR) by 5% annually
according to the Flexible Use of Airspace Concept (FUAC).
4. Increase annually the CDR1/2 availability and usage by an average of 5% annually
(FUA).
5. Reduce the route unavailability (in time and quantity) by 10% in 2013 and 2014
(FUA).
6. Reduction of vertical flight inefficiency by 5% in 2014.

158
The FUA indicators (bullet 3-5) are reported on quarterly. Flight efficiency (bullet 6) is
reported on only twice per year.
Whereas the main objective for the second Reference Period (RP2) is in EU wide level
and in national/FAB level (PRB, 2014a). The focus of RP2 is on:
1. Average horizontal en route flight efficiency of last filed flight plan (target is set in
European Network level (KEP=4.1%);
2. Horizontal flight efficiency of actual trajectory (KEA) (target is set in EU wide level
(KEA=2.6%) and in FAB level-different for every FAB);
3. Effectiveness of booking procedures for Free Use of Airspace (only monitoring in
EU wide level and in national/FAB level);
4. Rate of planning of CDRs (only monitoring in EU wide level and in national/FAB
level);
5. Effective use of CDRs (only monitoring in EU wide level and in national/FAB level);
6. Additional time in taxi-out phase (only monitoring in National/FAB level and in
airport level);
7. Additional time in terminal airspace (ASMA) (only monitoring in National / FAB level
and in airport level).
Monitoring of the ASMA and Additional taxi-out time indicators has started during RP1,
under the Capacity KPA. The rationale for monitoring is to gain experience with the
indicator, and to ensure an acceptable level of quality, both from a data and algorithmic
perspective.

159
Table 15: Estimated ANS-related impact on fuel burn and CO2 emissions savings (EUROCONTROL/Performance Review Commission, 2015)
Environmental impact assessment studies were conducted by EUROCONTROL in order
to evaluate the impact of the FABs creation the environmental performance of SES. For
instance, the DANUBE FAB Environmental Impact Assessment Study was carried out
using the System for traffic Assignment and Analysis at a Macroscopic level (SAAM) fast-
time simulation tool to calculate the changes in fuel use and CO2 emissions n the Danube
FAB airspace above FL09 (Kantareva et al, 2016). The study concluded that the annual
fuel saving due to the FAB implementation will be 45,000 tonnes by 2020 and 80,000
tonnes by 2030. The annual CO2 savings are expected to be 143,000 tonnes by 2020 and
255,000 by 2030 (Kantareva et al, 2016).
4.6.4.1 Flight efficiency improvements
During the last decade, a higher increase in capacity than the traffic growth was achieved,
while maintaining safety standards. At the same time, more efficient routes were
implemented. Currently, the European ATS route network distances are only 3.6% longer
than the Great Circle distances (for intra-European flights) (IATA, EUROCONTROL,
CANSO, 2008). An initial assessment of the European ATS route network design,
availability and utilisation indicates that flight efficiency could further improve by enhancing

160
both route availability and utilisation. The restrictions imposed on the utilisation of the
European ATS route network contribute with approximately 0.4% to the airspace utilisation
inefficiency.
EUROCONTROL developed a Flight Efficiency Plan (FEP) containing 5 Action Points that
required immediate attention (EUROCONTROL.int, 2016d):
1. Enhancing European en-route airspace design
2. Improving airspace utilization and route network availability
3. Efficient TMA design and utilization
4. Optimizing airport operations
5. Improving awareness of performance
These action points could save the airlines 470,000 tons of fuel each year – the equivalent
of 390 million euros and 1.5 million tons of CO2 emissions (EUROCONTROL.int, 2016d).
In Figure 22, the comparison of US and Europe in terms of en route flight efficiency is
shown. The data of Europe (i.e. the 41 member states of EUROCONTROL) appear from
2011 and afterwards. Data were not gathered prior to SES. An “inefficiency” of 5% means
for instance that the extra distance over 1 000NM was 50NM. One interesting element to
note is the difference between the actual and filed plan. Airlines fly more direct routes (i.e.
closer to the great distance cycle).

161
Figure 22: Evolution of horizontal flight efficiency (actual and flight plan) (2008-2015) (FAA and EUROCONTROL, 2016)
Airframe design, weight, weather conditions and the airspace they are flying in influences
the optimum cruise conditions. Flight Management Systems on board of aircraft can
determine the most efficient cruise altitude and speed to optimise fuel burn. ATM can
assist in this process by enabling capacity in the en-route phase of flight to offer aircraft
the cruise levels and speeds they request to burn less fuel. Furthermore, taking advantage
of the wind can offer efficiency gains.
Flight efficiency can be measured horizontally or vertically. The factors influencing
horizontal flight efficiency are illustrated in Figure 23 created by ICAO (Doc 030, 2013).
The figure also describes the planning process of an optimized Flight Plan Routing. States
that do not have a central archive of surveillance data use indicator option A based on the
last filed flight plan trajectory. If surveillance data are available (radar data, ADS-B data or
other), States use the actual trajectory (indicator option B).

162
Figure 23: The planning process of an optimized Flight Plan Routing (ICAO Doc 030, 2013)
Furthermore, according to ICAO (Doc 030, 2013) the desired outcome is not to achieve
zero extra distance, since that would create operational and economic problems. The
user-preferred trajectory rarely corresponds to the direct route. Computing the indicator for
wind-optimum trajectories (assuming such data are available), for example, can produce
an extra distance compared to the direct route. This is because more favourable wind
situations (e.g. high wind speed bands over the Northern Atlantic Ocean) can increase the
groundspeed of an airplane and so reduce flight time based costs (e.g. aircraft or fuel).
Hence, it is not advised to attempt a reduction of the horizontal en route flight efficiency
indicator towards its theoretical limit (zero).
4.6.4.1.1 The NATS’s 3Di inefficiency scoring model
NATS has developed a flight efficiency metric, called 3Di inefficiency score 3Di (NATS,
2014). The 3Di is an average efficiency rating for vertical and horizontal trajectories. It
applies to domestic airspace, for the airborne portion of flight only. It needs to be
highlighted that because aircraft performance and in particular fuel flow rates vary across

163
the different phases of flight the metric applies different weightings for level flight occurring
in climb, cruise, and descent phases of flight. The combination of those two factors (i.e.
deviation from the optimal trajectory and flight phase related rating) gives the inefficiency
score for each flight in the considered airspace. Scores run from 0, which represents zero
inefficiency to over 100, with most flights typically having a score in the range between 15
and 35. The score can be improved by better airspace design, controllers’ tools, flow
management techniques, changes to procedures, awareness training, flexible use of
airspace and optimised co-ordination across sectors. The score is also affected by the
number of flights, the traffic demand on sectors, the weather, any unusual events (e.g.
runway closure) and changes in the runway capacity.
In the horizontal plane, it compares the actual radar ground-track against the (most direct)
great circle track – between first and last radar point. Inefficiency in the horizontal plane is
defined by the difference between these two distances, which describes the ‘additional
miles flown’. In the vertical plane, it compares the actual vertical profile from radar data
against a modelled ideal flight, defined as a continuous climb to the aircraft’s Requested
Flight Level (for cruise), and followed by a continuous descent approach. Inefficiency is the
difference between the ‘actual’ and ‘ideal’ flight profile. The vertical inefficiency is defined
by the amount of flight time spent in level flight and the deviation from its requested cruise
level. Level portions of flight at low altitude are more fuel penalising than at higher levels.
By providing the most direct possible routes, smooth continuous climbs and descents and
optimum flight levels during cruise, air traffic controllers aim to help reduce aircraft fuel
burn and carbon emissions, earning a low 3Di score. The combination of 3Di airspace
efficiency metric with the Flight Optimisation System, or ‘FLOSYS’ enables the Air traffic
controllers to analyse the environmental efficiency of flights in near real-time.

164
By having access to this granularity of data for the first time, controllers and airspace
managers will be able to better identify the opportunities for operational improvements that
will save airlines fuel and cut carbon emissions.
4.6.4.2 Continuous Descent Operation and Continuous Climb Operations
During normal approaches, aircraft are often required by Air Traffic Control to descend
early and to level off at intermediate altitudes. The flight phases at these lower altitudes
are more fuel inefficient compared to flights in higher altitudes. Nowadays, it is the aim to
keep aircraft as long as possible in the cruising level and to perform the succeeding
descent with idle engine power to increase the fuel and noise efficiency. Therefore.
Continuous Descent Operations (CDO) describes a descent technique whereby engines
are as far as possible operated at idle thrust to reduce engine noise, fuel burn and exhaust
gas emission during descent (Shresta, Neskovic and Williams, 2009).
In ICAO Document 9931 (Doc 9931, 2010), the ‘Continuous Descent Operations Manual’,
CDO is defined as “an aircraft operating technique aided by appropriate airspace and
procedure design and appropriate ATC clearances enabling the execution of a flight profile
optimized to the operating capability of the aircraft, with low engine thrust settings and,
where possible, a low drag configuration, thereby reducing fuel burn and emissions during
descent. The optimum vertical profile takes the form of a continuously descending path,
with a minimum of level flight segments only as needed to decelerate and configure the
aircraft or to establish on a landing guidance system (e.g. ILS).”

165
Figure 24 General CDO concept (EUROCONTROL, 2011a: 2)
To achieve the maximum possible benefits of CDO in terms of fuel savings and noise
reduction, the descent should be flown from the Top-of-Descent (TOD) to the Final
Approach Fix (FAF) closed to the airport (ICAO Doc 9931, 2010). CDOs create
measurable benefits concerning fuel burn and emission reductions even though if they are
not introduced or flown to the full extend starting at the TOD. The establishment of some
parts of continuous descents and the removal of only some level offs during a descent can
also create measurable benefits (Shresta, Neskovic and Williams, 2009). Resulting of
such optimised descents according to the ICAO CDO manual can provide the following
advantages ( ICAO Doc 9931, 2010):
more efficient use of airspace and arrival route placement
more consistent flight paths and stabilised approach paths
reduction in both, pilot and controller workload
reduction in the number of required radio transmissions
cost savings and environmental benefits caused by reduced fuel burn
reduction in the incidence of controlled flight into terrain (CFIT)

166
authorisation of operations where noise limitations would otherwise result in
operations being curtailed or restricted.
Also if the actual focus is on the descent phase of a flight, the principle of avoiding level
offs at lower altitudes can be applied conversely to the climb phase of a flight. This method
is called Continuous Climb Operations (CCO). ICAO Document 9993 (Doc 9993, 2013)
defines CCO as “An operation, enabled by airspace design, procedure design and ATC, in
which a departing aircraft climbs without interruption, to the greatest possible extent, by
employing optimum climb engine thrust, at climb speeds until reaching the cruise flight
level”.
4.6.4.3 KPI: Average horizontal en-route flight efficiency:
As described in section 4.6.4.1, the average horizontal en-route flight efficiency (indicator)
is the difference between the distance of the en-route part of the trajectory and the
optimum trajectory which is, on average, the great circle distance. Thereby, “en-route” is
defined as the distance flown outside a circle of 40 NM around the airport. The flights
considered for the purpose of this indicator are:
all commercial IFR flights within European airspace;
where a flight departs or arrives outside the European airspace, only that part inside
the European airspace is considered;
circular flights and flights with a great circle distance shorter than 80NM between
terminal areas are excluded.
4.6.4.4 Conditional Routes
One other aspect that contributes to the improvement on the environment area are
Conditional Routes (CDRs). A Conditional Route (CDR) is an ATS route that is only
available for flight planning and is used under specified conditions. A Conditional Route

167
may have more than one category, and those categories may change at specified times
(EUROCONTROL.int 2016e):
Category One - Permanently Plannable CDR: CDR1 routes are in general available
for flight planning during times published in the relevant national Aeronautical
Information Publication (AIP). Updated information on the availability in accordance
with conditions published daily in EAUP/EUUPs. CDRs1 can either be established
on an H 24 basis or for fixed time periods or at fixed flight level bands.
Category Two - Non-Permanently Plannable CDR: CDR2 routes may be available
for flight planning. Flights may only be planned on a CDR2 in accordance with
conditions published daily in the EAUP/EUUPs, and
Category Three - Not Plannable CDR: CDR3 routes are not available for flight
planning; however, ATC Units may issue tactical clearances on such route
segments. CDR3 are not subject to allocation the day before by Airspace
Management Cell (AMCs).
Figure 25 depicts the percentage of filed plans that used CDRs. The left shide shows that
74% of airplanes that could have used CDR1s (that are permanently plannable) have
planned to use CDR1. The right side though shows the CDR2 (that are not permanently
plannable). The 64% of the airplanes planned on CDR2 (EUROCONTROL, 2013). The
use of CDRs should be increased since the occurring benefits both for the environment
and the economy are high.

168
Figure 25: Use of CDRs (EUROCONTROL, 2013: 22)
For instance, improving flight plan quality and utilisation of civil/military airspace structures
can lead to reduction on emissions. Figure 26 depicts Conditional Routes (CDR) that could
have been used during one peak day by the aircraft operators. The green routes are the
available, but not used routes and the red routes are the used ones. In case all the
available routes would be used at their full potential, annual savings of 30.000 tons of
fuel/year or reduced emissions of 100.000 tons of CO2/year could be achieved.
Figure 26: Conditional Routes (CDR) during one peak day

169
Apart from improving airspace utilisation and route network availability, enhancing
European airspace design and introducing a more efficient Terminal Airspace, by
improving Terminal Airspace design and implementing Continuous Descent Approaches
(CDAs), or optimising airport operations, by Implementing Airport Collaborative Decision
Making (A-CDM) can lead to carbon offsetting.
Through Collaborative Decision Making (CDM) procedures airport and aircraft operators,
ground handlers and air traffic control share information, creating a common situational
awareness for all actors. CDM is a concept to be implemented in an airport environment
through the introduction of a set of operational procedures and automated processes.
4.6.4.5 Free Route Airspace
Free Route Airspace (FRA) is a specific airspace within which users shall freely plan their
routes between an entry point and an exit point without reference to the ATS route
network. In this airspace, flights will remain subject to air traffic control (SkyBrary, 2016).
Despite FRA aims to its permanent implementation it is used during specific time periods.
In complicated airspaces like MUAC, FRA plays an important role in its capacity.
The main benefit from the implementation of FRA are straighter routes and the consequent
reductions in the total flown distance, carried and burned fuel and emissions. This will
reduce the weight of the aircraft during flight and hence will give a further benefit of
reduced fuel burn and CO2 emissions during the whole flight. Additionally, FRA will
significantly reduce complexity of the route structure and flight planning. Therefore, there
are also opportunities to rationalise some legacy inefficiencies in the network.
FRA is based on full trajectory operations. Thus, FRA concept brings increased flight
predictability, reduced uncertainty for the Network which in turn can lead to capacity
increases for ATM which will also benefit the user (SESAR, 2014).

170
Several ACCs and ANSPs already implemented fully or partially Free Route Airspace with
further phased implementations planned by all FABs/ANSPs over the period 2013-2019,
including cross border operations then full free route implementation. Free Route
operations are already operational in Portugal (24hrs), Maastricht (24hrs, night and week-
end in parts of the Area of Responsibility- AoR), Karlsruhe (24hrs in parts of the AoR),
Ireland (24 hrs), Austria - night, Finland - night and weekend, Zagreb, Belgrade, the
Former Yugoslav Republic of Macedonia and joint Free Route in Denmark and Sweden.
The implementation is coordinated through the NM European Route Network Improvement
Plan (ERNIP) and the Network Operations Plan following the Strategic Objectives and
Targets set in the Network Strategic Plan and in the Network Manager Performance Plan
(SESAR, 2014).
In Europe, there are many initiatives for the implementation of free route airspace. The first
states, in which the FRA was implemented, were Sweden, Portugal and Ireland. The
introduction of the FRA is easier to Portugal and Ireland due to the fact that their airspace
extends above the Atlantic Ocean, through which leads the transit flight paths Europe -
America thus to almost zero climbing / descent to / from the defined FRA area.
From March 2011 142 ‘new direct routes’ become available to the airspace controlled by
MUAC (EUROCONTROL, 2011b). Those routes contributed to the reduction of the flight
time and the engine use, reduction of the fuel use, CO2 emissions and to the costs
occurring from the high traffic density in the European airspace. For safety reasons those
routes were conducted during the night but also during the weekend. They are also the
first step to the «Free Route Airspace Maastricht (FRAM) programme» that aims to
implement those routes to a daily and 24hours scale. The expected benefit of this change
is 1.16 million Km less per year, meaning 3,700 tonnes of fuel less, 12,000 tonnes of CO2

171
and 37 tonnes less NOX in comparison to the previous routes (EUROCONTROL, 2011b).
In Figure 27, the estimated implementation progress of FRA is presented during the years.
Figure 27: Free Route Airspace Implementation 2014-2019 (NM, 2015)

172
The main problem is an insufficient ATC system, which cannot cope with the requirements
of the FRAs. For example, it can be expected that a free-selected trajectories of a given
number of aircraft will create a higher workload to Air Traffic Controller compared to an
adherence of predefined airways serving for the same amount of aircraft. Another example
is that a dynamic Flight Data Processing (FDP) makes a correct ordering of sectors for
flights more difficult. Therefore, today’s ATC systems only support FRAs to a limited
extent.
4.6.4.6 Flexible Use of Airspace Concept
The Flexible Use of Airspace Concept (FUAC) uses airspace structures and procedures
that are particularly suited for temporary allocation and/or utilisation, such as Conditional
Routes (CDRs), Temporary Reserved Areas (TRAs), Temporary Segregated areas
(TSAs), Cross-Border Areas (CBAs), Reduced Coordination Airspace (RCA) and Prior
Coordination Airspace (PCA). In order to improve the airspace utilisation in both a fixed
route network and a free route environment, these airspace structures will be implemented
according to the specific requirements (EUROCONTROL.int, 2016f).
According to Commission Regulation 2150/2005 Flexible Use of Airspace is “an airspace
management concept described by the International Civil Aviation Organisation (ICAO)
and developed by the European Organisation for the Safety of Aviation
(EUROCONTROL), according to which airspace should not be designated as either purely
civil or purely military airspace, but should rather be considered as one continuum in which
all users’ requirements have to be accommodated to the maximum extent possible.”
According to Commission Regulation 2150/2005 ‘airspace management cell (AMC)’
means a cell responsible for the day-to-day management of the airspace under the
responsibility of one or more Member States. According to Commission Regulation
2150/2005 ‘airspace restriction’ means a defined volume of airspace within which,

173
variously, activities dangerous to the flight of aircraft may be conducted at specified times
(a ‘Danger Area’); or such airspace situated above the land areas or territorial waters of a
State, within which the flight of aircraft is restricted in accordance with certain specified
conditions (a ‘Restricted Area’); or airspace situated above the land areas or territorial
waters of a State, within which the flight of aircraft is prohibited (a ‘Prohibited Area’)”.
According to the Commission Regulation 2150/2005 the following principles shall be
applied for the FUAC:
(a) coordination between civil and military authorities shall be organised at the strategic,
pre-tactical and tactical levels of airspace management through the establishment of
agreements and procedures in order to increase safety and airspace capacity, and to
improve the efficiency and flexibility of aircraft operations;
(b) consistency between airspace management, air traffic flow management and air traffic
services shall be established and maintained at the three levels of airspace management
enumerated in point (a) in order to ensure, for the benefit of all users, efficiency in airspace
planning, allocation and use;
(c) the airspace reservation for exclusive or specific use of categories of users shall be of a
temporary nature, applied only during limited periods of time based on actual use and
released as soon as the activity having caused its establishment ceases;
(d) Member States shall develop cooperation for the efficient and consistent application of
the concept of flexible use of airspace across national borders and/or the boundaries of
flight information regions, and shall in particular address cross-border activities; this
cooperation shall cover all relevant legal, operational and technical issues;
(e) air traffic services units and users shall make the best use of the available airspace.
4.7 Summary
The Single European Sky is an ambitious initiative of the European Commission. The SES
aims to improve safety and capacity of the airspace, to make the air traffic management
more cost efficient and to reduce the environmental impact of aviation operations. The
most important regulation for SES is the Performance Regulation. The performance
regulation sets targets, the so-called Performance Indicators, to the ANSPs in the four Key

174
Performance Areas, the Capacity, Safety, Cost Efficiency and Environment. In the
environment area, the most important KPI is the horizontal en-route flight efficiency.
After 2012, the horizontal en-route flight efficiency continued to improve. That trend
continues until today. In 2012, the actual horizontal en-route extension was 5.15% of the
GCD, quite close to the desired target (5.12%). Regional initiatives regarding FRA
continue to bring benefit to environment and the harmonised approach in relation to
Network Manager (NM) ensures the linkage of the different initiatives (EUROCONTROL,
2013). Finally, the KPAs are characterised by trade-offs and synergies. For instance,
improving safety reduces the cost efficiency due to the high investment in infrastructure.
Reducing delays improves the flight efficiency.

175
5 Elaborations from Literature Review and Experts Consultation
The environment is a dynamic and evolving system of natural and human factors. In the
environment, living organisms operate or human activities take place. Environment has a
direct or indirect, immediate or long-term effect or influence on the living beings or on
human actions at a given time, and in a circumscribed area (Raven et al, 2015).
The environmental awareness differs from airline to airline. There are some airlines that
they take measured to reduce their carbon footprint and mitigate their negative
externalities. The Lufthansa group for example, has taken many actions ranging from fleet
modernisation to green buildings. The Lufthansa Group is also a member of the
Sustainable Aviation Fuel Users Group (SAFUG) and of the Aviation Initiative for
Renewable Energy in Germany e.V. (aireg) (Lufthansa Group, 2016). Environmental
actions depend on the size of the airline. It should be noted that being environmentally
friendly is a costly practice. Small airlines for instance may not be in position to afford
green actions (e.g. use of biofuels)
Developing environmental projects increases the cost of the airline, but at the same time,
the economic objectives of firms may not conflict the environmental objectives. Following
an environmental strategy might be a plan for operational expansion of an airline. For
instance, it is very common airlines to sign MoU with biofuel providers. Some airlines (like
KLM, Iberia, Virgin Atlantic, Azul airlines, Air France, United, American Airlines and Alaska
airlines) have used biofuels and other airlines have not (e.g. Astra Airlines). It is evident
then that within the same category of stakeholders there are different objectives and
behaviours that need to be managed. Apart from that complying with environmental
regulations and improving the environmental performance, is an action that requires effort
and hides transaction costs.

176
It is unquestionable that the environment is priceless for the social welfare. Hence, there
are several government policies to regulate actions and operations related to the
environmental impact. In order for regulation to be implemented in the most efficient way
and be followed ethically and fully, the understanding of the stakeholders is critical in order
to manage them. This chapter will discuss the theory of multi-stakeholder analysis and
management as well as the importance of transaction costs for environmental regulations.
5.1 Multi-stakeholder Analysis and Management
Stakeholder Analysis (SA) is a methodology used to facilitate institutional and policy
reform processes by accounting for and often incorporating the needs of those who have a
‘stake’ or an interest in the reforms under consideration (Pigman, 2007). In order to
conduct an effective stakeholder analysis interviews were conducted directly with the
stakeholders involved in the specific policy area. The content and questions of the
interviews focused on background information on the policy making process, information
that identifies key stakeholders from a variety of groups in the reform process, and
questions about stakeholder power and interest in EU ETS and SES. The number of
interviews was determined by taking into consideration field conditions and logistical
constraints (e.g. sensitivity, access, time, budget, etc.).
It is of critical importance to evaluate each stakeholder’s power and likely impact on the
policy making process and this is done through several steps. The first step is to form a
consortium and then to identify their position to the reform. This leads to the creation of
groups/clusters that support, oppose or are indifferent to reform. The next step is to
categorise the stakeholder data according to the power/influence and salience of each
stakeholder. The regulator needs to understand their position in terms of the reform
therefore it is critical to categorise the stakeholders according to the following attributes
(worldbank.org, 2001):

177
Promoters: Stakeholders who prioritise high the policy reform and their actions can
impact the implementation of the policy.
Defenders: Stakeholders who prioritise high the policy reform but their actions do
not have an impact on the implementation of the policy.
Latents: Stakeholders whose actions can affect the implementation of the policy but
who prioritise low the reform policy •
Apathetics: Stakeholders whose actions cannot affect the implementation of the
reform policy and at the same time attach a low priority to this policy
The identification of the stakeholders and the application of the above categories, are
necessary so at to determine appropriate responsive strategies (e.g. which stakeholders to
target for negotiations and trade-offs, or which to buttress with resources and information,
etc.). The Stakeholder Analysis among others aims to reveal and hence supports the
stakeholder management approaches for balancing the power among weaker groups.
According to Stoney and Winstanley (2001) stakeholder management approaches can be
described following the five dimensions: political perspectives; purpose and objectives of
considering stakeholders; value of considering stakeholders; considering stakeholder
intervention levels; degree of stakeholder enforcement. There are different methodologies
developed by individuals, companies, universities and government bodies for stakeholder
identification and management.
The stakeholders face four major attributes (Stoney and Winstanley, 2001), the
stakeholders’ position on the reform issue, i.e. SES and EU ETS; the level of influence
(negotiation power) they hold; the level of interest they have in SES and/or EU ETS; and
the group/coalition to which they belong or can reasonably be associated with. These
attributes are identified through various data collection methods, including interviews with

178
experts and with the actual stakeholders directly, as well as from literature review and
public announcements.
Jones et al. (2007) claimed that there are five categories of stakeholder cultures that are
further subdivided into three typologies: amoral (i.e. agency culture or managerial egoism),
limited morality (i.e. corporate egoism and instrumentalism) and broad morality (i.e.
morality and altruism). Moreover, the position is related with the motives someone has.
The motives can be idealistic/altruistic, individual, corporate or strategic (Jones et al.
2007).
Moreover, the stakeholders have power over a regulation. The power is described as the
capacity to induce, persuade or coerce the actions of others and is displayed. Moreover, it
can be displayed in different ways. It can be displayed as force, i.e. coercive power,
material or financial resources, i.e. utilitarian power, or symbolic resources, i.e. normative
power (Johnson et al., 2010; Ihlen and Berntzen, 2007).
The level of influence depends on the stakeholder’s power for promoting its position on the
regulatory reform. The priority and importance the stakeholder attaches to SES and/or EU
ETS shows the level of interest or salience it has. The following matrix depicts the
relationship of power and interest in an organisation. The power differential between an
entity and its stakeholders will inform the strategies and tactics for dealing with each other
(Kolk and Pinkse, 2006). The list of stakeholders is long and they have different opinions
and interest that many times are a major source of conflict. Hence, SES and EU ETS
regulations are influenced on several dimensions and in different ways.

179
Table 16: Power-Interest Matrix (Johnson and Scholes, 2010; Olander, 2007)
Managing relationships in order to motivate stakeholders to behave in ways that support
the objectives of SES and EU ETS is of critical importance for the social welfare. Thus,
stakeholder management should be applied. According to Moloney (2006) stakeholder
management can be an effective way to influence the achievement of the goals. For
Vogwell (from Chinyio and Olomolaiye, 2010) stakeholder management is about creating
the most positive environment in which to develop a project. According to Goodpaster
(from Chinyio and Olomolaiye, 2010) there are 3 approaches for dealing with stakeholders:
the strategic approach; the Multi-fiduciary approach; and the Stakeholder synthesis
approach. Due to the nature of the stakeholders and the complexity of the relationships
and interest, a mixed approach is more appropriate for handling the situation. The
Stakeholder synthesis approach assumes a moral responsibility of the stakeholders which
in this case cannot be granted since most of the stakeholders are competing with each
other and/or don’t have a direct benefit from the achievements of the regulatory schemes,
Maintain these stakeholders in a
happy state
Manage these stakeholders closely (key
player)
Keep an eye on these
stakeholders and act when prompted
(minimal effort)
Keep these stakeholders happy and informed
High Power &
Low Interest
Low Power &
Low Interest
Low Power &
High Interest
High Power &
High Interest

180
i.e. SES and EU ETS. The Multi-fiduciary approach assumes a fiduciary responsibility to
stakeholders, allotting them equal stakes with shareholders, something that cannot be
achieved since by nature they cannot have the same stakes/benefits. The strategic
approach allots shareholders’ profit a greater priority above the interests of other
stakeholders. In this case, since the decision taker is the regulator the point of concern is
the passenger in the narrow sense of SES and EU ETS, but when considering the general
equilibrium of the system the industry and the research and development enables should
be taken under considerations.
5.2 Transaction Cost Economics theory and externalities
Transaction costs are extremely high for solving externalities (Rao, 2003). Externality is
the basis of environmental economics, whereas transaction is the basis of transaction cost
economics. Environmental problems are a kind of competition over conflicting uses for
scarce resources and the question that arises is who has the property rights of the
resource. Who owns the clean air? Obviously, everyone has the right for clean air, but at
the same time, the airspace users have the right to use the sky. Assigning property rights
faces tremendous legal, cultural and technological barriers.
Transaction cost theory deals with the coordination problem between more than two
parties in conflict over resource use and potentially involves a transfer of property rights
(McCann, 2013; Schniederjans and Hales, 2016). Environmental problems are
fundamentally problems of poorly defined property rights (Coase, 1960). Once property
rights have been assigned, the goods can be traded and the market place will reach a
Pareto-efficient outcome according to Nalebuff (Rao, 2003). According to Coase when one
assigns property rights, the market will be completed and efficient outcomes would be
produced, since traditional externalities are the reflection of a missing market.

181
Nalebuff (from Rao, 2003) noticed that TC show that a market-based property rights (PR)
approach is not a universal solution for environmental problems. Specifying PR aims to
identify the stakeholders, and their rights and duties, in the sustainable use of specific
resources. There are two big categories of environmental resources, a) res communis and
b) res nullius. Res communis are “assets of global common interest but not amenable to
state sovereign control; these are also referred to as common property resources”. Res
nullius is “an asset amenable to control/acquisition/ownership or use but not yet in the
possession of any entity of legal existence; these are also referred to as open-access
resources” (Rao, 2003: 153). PR as well as liability rules (LR) apply to the resources in the
res communis category (Rao, 2003).
Since legally valid methods of global environmental accounting and sharing of
responsibilities do not exist, global environmental externalities remain the norm (Rao,
2003). PR and LR are very important for sharing of responsibilities in the governance of
the global environment and coherent with the role of TC (Rao, 2003).
Frequency, asset specificity, and uncertainty of the transaction depend on the size and the
type of the stakeholder (McCann, 2013; Cacho et al, 2013). For example, a small airline
like Bluebird Airways has higher costs to develop a trading strategy than Lufthansa for
instance due to the necessary expertise already being developed in the big company. The
same concept can be applied to ANSPs. Moreover, the more complex the regulatory
scheme is, the higher the transaction costs. Companies need time to adapt to changes.
Another important concept is Institutional Transaction Costs (ITC). ITC consist of (Rao,
2003: 155):
Legislative or regulatory enactment costs;
Implementation costs;

182
Monitoring costs and
Enforcement costs
This part of TCE makes sense when it is applied to the Performance Regulation Scheme
of the Single European Sky (SES). The performance scheme has legislative or regulatory
enactment cost, cost related to setting the targets for the KPAs, implementation cost for
the targets, monitoring cost to check the progress of the states/FABs as well as
enforcement cost.
Trading pollution rights is a policy instrument for controlling environmental externalities that
first appeared during 1970s as cost-effective alternative to direct regulation by the
government (Rao, 2003). Dales proposed the concept of marketable permits to allocate
pollution reduction to private entities as a mechanism for cost-effective implementation,
which was also explored by Montgomery (Rao, 2003).
There is interdependence between the governmental institutions and the private market
institutions. The government of private market institutions depends on the quality of the
governance of the governmental institutions (Rao, 2003). This observation though
depends on the country, since there are some countries where the general quality of these
institutions is still lagging far behind those of some of the developed economies.
According to Rao (2003) what are considered to be costs in the short term may essentially
be viewed as investments for a return in the long run. This means that in case adaptation
costs involve or lead to higher efficiency, these costs become negative and thus net
benefits.
The Coase theorem states that the assignment of private property rights could lead to an
efficient outcome assuming zero transaction costs and common knowledge among
participants in the environmental damage resolution or compensation negotiation (Brunner

183
and Enting, 2014). The fact is that the ill-defined enforceable property rights create
externalities, but the application of property rights does not mean that efficient
environmental solutions are given.
Since expenditures for the obligations of the emissions trade cannot be used to realize
emission abatement measures, all transaction costs are “deadweight losses”. According to
Stavins (from Frasch, 2007:48) “Macroeconomic theory states that transaction costs
hinder the cost-effective allocation of tradable permits as the volume traded decreases,
which results in an increase of macroeconomic abatement costs”. In EU ETS the occurred
Transaction Costs derive from non-trade related activities, therefore the above aspect is
less important, since the effect on trade volume is not as significant as new institutional
economics would expect.
According to Stavins (1995) the following three sources for transaction costs exist in the
context of emissions trading (Owen & Hanley, 2004: 144):
1. search and information;
2. bargaining and decision;
3. monitoring and enforcement.
Montero (from Owen & Hanley, 2004) expanded the approach of Stavins (1995), explained
further the issue of transaction costs in a tradable permit system and confirmed the result
that in the presence of transaction costs and uncertainty, the resulting permit price will be
higher than that of a least cost solution. Montero (from Owen & Hanley, 2004) shows for
the case of NOX abatement in the US, that despite considerable transaction cost, the cost-
saving potential of a tradable permit system as compared with a command and control
approach is substantial. In emissions trading, the net buyers in the carbon market have to
pay for the transactions costs via increased permit prices, whereas for carbon tax the TC

184
are commonly borne by the regulator, or may partially be rolled over to the taxpayer (Owen
& Hanley, 2004).
According to Helndl (2012) if, for example, transaction costs from environmental regulation
are non-linear, alter the marginal condition for cost-minimization of firms and have a more
severe impact on smaller firms or emitters compared to larger ones, then those policies
induced ‘frictions’ could lead to larger optimal firm-size or larger optimal size of regulated
sources of emissions in equilibrium. This may also work as a market entry barrier; thus,
weakening competition.
According to Montero (from Owen & Hanley, 2004) provided that agents willing to trade
have to enter the market, find one another, communicate (negotiate price and quantity),
and sign the corresponding legal contract, some level of transaction costs is always likely
to exist – as in any market transaction. The regulatory requirements of trading permits are
low.
Stavins (from Heindl, 2012) states that if TC enters in a non-linear fashion into the cost
function, the optimal amount of emissions under regulation e*TC is no longer independent
of initial free allocation received by a carrier, which also implies that actual emissions
levels under transaction costs differ from first-best emissions levels e*TCi ≠e*i. This means
that the permit price in equilibrium differs no matter of transaction costs (Helndl, 2012).
Every carrier is having different TC, since the carriers differ in size and strength. Carriers
are free to choose how much effort they will put in ETS after they met minimal
requirements for compliance. The basis for creating equations on ETS and TC is the
following (Helndl, 2012):

185
Costs for a single firm depend on individual abatement costs c(e) ≥0, the exogenous
permit price p≥0 and emissions e≥ 0. The firm for a given level of production faces the
problem (Heindl, 2012:6):
𝐦𝐢𝐧𝒆[𝒄(𝒆) + 𝒑 ∗ 𝒆] (1)
Deriving by e yields the cost-minimizing level of emissions e* where the permit price
equals marginal abatement costs:
-c’(e)=p (2)
Overall emissions e are decomposed by e=a+u, where a is the free allocation received by
the firm with a≥ 0 and u is the amount of permits that must be purchased for compliance or
can be sold due to over-allocation.
Bargaining is itself a transaction cost (Usher, 1998). Thus, there are inherent fundamental
flaws in the assertions with Coasean proposals (Rao, 2003: 51). Bargaining/negotiations
costs can be reduced substantially by exchanges like European Climate Exchange,
because they provide standardized contracts and historical price information to facilitate
negotiation.
When a carrier chooses to trade then the p ∗ e, becomes p(a+u). Since carriers choose
the optimal amount of transactions and consequently aim to minimize transaction costs
given their specific needs then the corresponding condition for minimizing costs and the
marginal condition are:
𝐦𝐢𝐧𝒆[𝒄(𝒆) + 𝒑𝒆 + 𝒇(𝒆 − 𝒂)] (3)
-c’(e)=p+f’(e-a) (4)
For airlines, the highest transaction costs occur from Monitoring, Reporting and
Verification (MRV) of emissions and permit trading. Carriers are obligated to measure or

186
calculate emissions. This process is time demanding because data on emissions have to
be collected on the installation level and have to be analysed for emissions reporting each
year. Emissions data must be verified by a certified and independent third party, which
generates costs. Finally, the data have to be reported to the national authorities in a
standardized form, which again is time demanding.
These costs are likely to be dependent on emissions-levels with relatively high fixed costs
and resulting scale economies in MRV activities. So, if MRV related TC are g(e)≥0, the
cost function will be:
𝐦𝐢𝐧𝒆[𝒄(𝒆) + 𝒑𝒆 + 𝒈(𝒆)] (5)
and the corresponding marginal condition:
-c’(e)=p+g’(e) (6)
Many airlines in order not to have Transaction costs related to MRV chose to ask for help
from intermediaries to outsource this service to others, e.g. EUROCONTROL. Another
important cost is the one related to abatement strategies. Carriers face informational costs
when searching for appropriate technology for carbon offsetting or alternative solutions.
Reinvestment and replacement of existing fleet for instance is an extremely costly action.
Given the abatement and the related transaction costs term h(e)≥0, the cost function will
be:
𝐦𝐢𝐧𝒆[𝒄(𝒆) + 𝒑𝒆 + 𝒉(𝒆)] (7)
and the corresponding marginal condition:
-c’(e)=p+h’(e) (8)
Nevertheless, innovations and changes might occur outside of the environment of the
carriers and can prove beneficial for carbon offsetting and thus costs. For instance, the

187
harmonisation of European Sky through Functional Airspace Blocks, can lead to better
flight efficiency and thus less fuel consumption, costs and emissions.
As far as the search transaction costs are concerned, they are reduced substantially, since
greenhouse gas markets are facilitated by exchanges such as the European Climate
Exchange (ECX) and buyers and sellers find each other quite easily. Carriers can obtain
up to a specific percentage credits from the Kyoto Mechanisms. The Joint Implementation
(JI) provides for the creation of emissions reduction units (ERUs), whereas the Clean
Development Mechanism (CDM) provides for the creation of certified emissions reductions
(CERs). Therefore, CDM and JI are directly connected to EU ETS.
McKloskey et al. (from Chadwick, 2006:260) defined CDM transaction costs as “that part
of a CER’s price that cannot be attributed to the physical process of removing GHGs from
the atmosphere”. Chadwick (2006) argued that this definition does not take under
consideration the demand effects on CER market prices and thus adjustment is required to
separate the TC effects from the demand effects. According to Chadwick (2006) CDM
transaction costs are especially important because the financial sustainability of CDM
projects is so closely linked to the size of the CER revenue stream.
Under the existence of TC market outcomes rely on the structure and the rules of
surrounding institutions. Institutions have the effect of giving some actors more influence
or less costly influence (so that one party can shift the outcome to their favour with less
effort than the other can), over outcomes than others and shift market equilibria away from
the original “optimum” (Chadwick, 2006).
5.2.1 Transaction Costs Categories in EU ETS and SES
Transaction Costs Economic (TCE) theory may be used to highlight certain issues in the
Performance Regulation Scheme of the Single European Sky (SES) and European Union

188
Emissions Trading Scheme (EU ETS). This is because there are legislative and regulatory
enactment costs related to the KPAs, such as implementation costs to meet the targets;
monitoring costs to check the progress of the states/FABs; and enforcement costs to make
the scheme work. Search and information, bargaining and decision, monitoring and
enforcement of the Performance scheme create transaction costs (TC) for the SES
stakeholders.
The stakeholders experience the SES in a different way. For instance, the ANSPs are the
ones that are regulated and the CAAs or the EC are the regulators. The transaction costs
differ among the stakeholders because they focus on different elements. For instance, an
ANSP is not responsible for considering alternative policies, but a policymaker/regulator is.
Thus, the ANSP would have zero transaction costs for the category alternative policies.
The importance of every category is different for the different stakeholders. The focus on
the SES is on the policy makers, since for the ANSPs the main cost are the compliance
measures, i.e. the cost of considering and adopting new systems and infrastructure.
Transaction costs for policymakers/regulators emerging from the Performance scheme
regarding the KPA of environment may be categorised as follows:
Table 17: Transaction costs categories for policymakers/regulators emerging from the Performance scheme regarding the KPA of environment (Source: own elaboration)
Categories Description
Alternative
policies
Develop alternative solutions
Evaluate the alternative solutions
Decision for the implementing policy
Development and
Implementation of
the regulation
scheme
Quantification of historic emissions
Development of emission outlooks
Decision for an application rule
Measures to overcome “frictions” and negotiation with
stakeholders

189
Categories Description
Assessment of participants
Adaptation or purchase of software
Material costs Set up of organizational structures and
assignment of responsibilities
Fees for Information, training
Monitoring
Design of a monitoring concept
Implementation of an internal monitoring system
Ongoing monitoring
Reporting and
verification
Quantification of annual emissions
Compilation of an emissions report
Verification of an emissions report
Delivery of data for ex-post-control
Compliance
measures
Identification of compliance measures
Offering recommendations and support
Decision about imposing non-compliance penalties
Strategy
Design of the strategy for NSAs, ANSPs
Design of the regulation enforcement procedure
Design of the abatement strategy
As already mentioned, SES and consequently FABs aim to improve the performance of
airspace through ANSPs and NSAs for airspace users. FABs aim to achieve carbon
offsetting through setting environmental targets. Another scheme that can use the benefits
deriving from FABs is the EU ETS. The EU ETS is a Market Based Mechanism (MBM) and
introduced the 'cap and trade' principle, according to which a cap is set on the total amount
of greenhouse gases that can be emitted by all participating installations. 'Allowances' for
emissions are then auctioned off or allocated for free, and can subsequently be traded.
Installations must monitor and report their CO2 emissions, ensuring they hand in enough
allowances to the authorities to cover their emissions. Monitoring, reporting and verification
result in transaction costs whose largest part is passed to the airspace users. To lower

190
transaction costs, many airlines related to monitoring chose to outsource this service to
others, e.g. EUROCONTROL. Transaction costs for airlines deriving from the inclusion of
aviation in EU ETS can be categorised in the following categories:
Table 18: Transaction costs categories for airlines deriving from the inclusion of aviation in EU ETS (Source: own elaboration)
Categories Description
Application
(Scheme design)
Quantification of historic emissions
Development of emission outlooks
Decision for an application rule
Compilation of an application
Where necessary, compilation of a benchmark
Verification of the application
Fees for annual allocation
Fees for emissions register
Implementation of
emissions
Management
Information, training
Assessment of obligation to participate in the EU ETS
Set up of organizational structures and assignment of
responsibilities
Adaptation or purchase of software
Material costs
Monitoring
Design of a monitoring concept
Implementation of an internal monitoring system
Ongoing monitoring
Reporting and
verification
Quantification of annual emissions
Compilation of an emissions report
Verification of an emissions report
Delivery of data for ex-post-control
Abatement
measures
Identification of abatement measures
Decision about abatement measures
Trade
Transactions fees (exchange fees, broker fees,
clearing)
Trade and negotiation

191
Categories Description
Market observation
Strategy
Definition of the risk strategy
Definition of the trade strategy
Definition of the abatement strategy
As far as EU Emissions Trading Scheme in aviation is concerned, the focus is on the
airlines and the policy makers. The categories of transaction costs are different. The
transaction costs for the policy makers/regulators are similar to those of the SES. The
regulator spends a lot of effort on developing alternative policies, evaluating the options
and deciding on the policy to be implemented, i.e. the EU ETS. The second category is the
development and the implementation of the regulation scheme. The policy maker needs to
understand the aviation industry and its effect on the environment and set the parameters
for the regulation. This phase of the reform bears high transaction costs, since during this
period, experts from different areas are needed to set the regulatory framework. The
categories of Monitoring, Reporting and Verification related to the quantification of
emissions, the compilation of reports, the verification of report and the delivery of data for
ex-post-control. Another important category of TC for the regulator is the compliance
measures and the strategy. In this category the guidelines for the companies is included
as well as the strategy for enforcing the regulation and any abatement strategy.
Transaction costs for policy makers/regulators deriving from the inclusion of aviation in EU
ETS can be categorised in the following categories:
Table 19: Transaction costs categories for policy makers/regulators deriving from the inclusion of aviation in EU ETS (Source: own elaboration)
Categories Description
Alternative
policies
Develop alternative solutions
Evaluate the alternative solutions

192
Categories Description
Decision for the implementing policy
Development and
Implementation of
the regulation
scheme
Quantification of historic emissions
Development of emission outlooks
Decision for an application rule
Measures to overcome “frictions” and negotiation with
stakeholders
Compilation of an application
Where necessary, compilation of a benchmark
Verification of the application
Assessment of participants in the EU ETS
Adaptation or purchase of software
Material costs Set up of organizational structures and
assignment of responsibilities
Fees for Information, training
Monitoring
Design of a monitoring concept
Implementation of an internal monitoring system
Ongoing monitoring
Reporting and
verification
Quantification of annual emissions
Compilation of an emissions report
Verification of an emissions report
Delivery of data for ex-post-control
Compliance
measures
Identification of compliance measures
Decision about imposing non-compliance penalties
Strategy
Definition of the strategy for companies
Definition of the enforcing the regulation
Definition of the abatement strategy
All companies by nature look for lower costs thus are looking for lower TC. Through de-
minimis rule for airlines the smallest carries are protected from TC and at the same time
the regulators. The benefit of including them to EU ETS is smaller than the cost. TC are
also closely related to the spot price of permits. If the price is too low and Transaction

193
costs too high, then some airlines might prefer not to optimise their green policy as much
as possible. When policies like EU ETS are implemented there are usually complaints or
resistance towards the policy itself or the way the policy is implemented. These “frictions”
are basically costs, as Hicks (1935) supported.
Apparent rigidities and frictions towards a full scope EU ETS from the early beginning
might exert a positive role as a buffer against excessive fluctuations in traffic, prices and
fair competition. It needs to be highlighted that apart from economic agents, but also
organizations and companies react to “frictions”. Everyone from the stakeholders can be
the source of the “friction” or the reaction to the “friction”. For instance, in the case of stop
the clock, A4A was the “friction” and AEA was the reaction.
5.3 Summary
Both EU ATS and SES are quite complex reforms and their management can be quite
difficult. The management of the stakeholders in proved very demanding due to the fact
that the geographical scope is very extended, there are a lot of companies and entities to
manage, but most importantly there are quite diverse stakeholders. The regulators should
manage the airspace users, the other regulators, the institutions, the system suppliers, the
manufacturers, the ANSPs, the military entities, etc. The regulator should understand the
stakeholders, their level of influence as well as their power. As explained above the level
of influence depends on the stakeholder’s power for promoting its position on the
regulatory reform.
The most difficult part is not developing the concepts and the regulations around the
schemes, but implementing them. There are many hidden cost around the implementation
of the reforms. The theory of transaction costs was initially developed for the
environmental regulations and can be adopted in the SES and EU ETS reforms. The
researcher base on literature review, participant observation and consultation developed

194
some categories of transaction costs in EU ETS and SES. Those categories involve costs
associated with the alternative policies, the development and implementation of the
regulation scheme, the monitoring, reporting and verification, the compliance measures
and strategies.

195
6 Research methodology
Research is a process of steps used to collect and analyse information to increase our
understanding of a topic or issue”. It consists of three steps: Pose a question, collect data
to answer the question, and present an answer to the question according to Creswell
(2008).
According to Williams (2007: 65) the research process is ‘systematic in that defining the
objective, managing the data, and communicating the findings occur within established
frameworks and in accordance with existing guidelines’. Saunders et al. (2015) classified
research into six stages and named the model as ‘the research onion’. This model is
depicting the issues underlying the choice of data collection techniques and analysis
procedures (Saunders et al., 2015).
6.1 Research philosophy
Ontologies is ‘the term used to refer to the shared understanding of some domain of
interest which may be used as a unifying framework to solve the above problems in the
above described manner’ (Uschold & Gruninger, 1996:5). Ontology is the study of being,
that is, the nature of existence and what constitutes reality (Gray, 2014: 19). According to
Saunders et al. (2015) ontology relates to assumptions regarding the nature of reality.
While ontology embodies understanding what is, epistemology tries to understand what it
means to know. Epistemology provides a philosophical background for deciding what
kinds of knowledge are legitimate and adequate. Epistemology concerns what is
acceptable and legitimate. A similar concept is worldviews. Worldview means ‘a basic set
of beliefs that guide action’ according to Guba (1990, 17). Another type of research
assumptions is axiology, which refers to values and ethics.
After defining ontology and epistemology, the terms objectivism and subjectivism need to
be clarified too. Objectivism, ontologically defined embraces realism. This means that

196
reality exists independently of consciousness (Saunders et al., 2015). The target is to find
the objective truth without influenced from feelings and values. At the same time though,
objectivism does not entail the rejection of subjectivity: subjective views can be studied
(their values, attitudes and beliefs) but it should be done objectively (Bunge, 1993).
Figure 28: The research onion (Saunders et al., 2015)
There are four major philosophies of research, positivism, realism, interpretivism,
postmodernism and pragmatism (Figure 28). Positivism regards the attempt to obtain
predictive and descriptive information related to the social reality and the external world as
the main purpose of science. According to this philosophy, only phenomena that can be
observed will lead to the production of credible data. Moreover, the researcher is very
independent of and neither affects nor is affected by the subject of the research (Remenyi
et al., 1998).
Another epistemological position is this of realism. According to this position, the senses
show us the truth and not our mind as the idealism supports. Realism can be categorised

197
to critical realism and direct realism. Direct realism states that element itself and the
sensations it conveys is enough to explain the element. On the other hand, critical realism
makes an extra step by saying that it is also the mental processing that goes on sometime
after that sensation meets our senses. Pragmatism is a deconstructive paradigm that
advocates the use of mixed methods in research, “sidesteps the contentious issues of
truth and reality” (Feilzer, 2010: 8), and “focuses instead on ‘what works’ as the truth
regarding the research questions under investigation” (Tashakkori & Teddlie, 2010: 713).
Hence this approach focuses more on the ‘What’ and ‘How’.
Interpretivism claims that it is important for the researcher to find differences between
humans in their roles. The challenge of this research philosophy is that the researcher
should understand the research subjects and see the world from their point of view. The
philosophy that is followed in this PhD Thesis is Interpretivism. In this thesis, the methods
used capitalised on a dynamic setting resulting from different expert opinions expressed
with the help of Delphi method and unstructured interviews. The latter were based on a
free flow discussion and expressed subjective opinions. Based on those subjective
opinions the researcher tried to interpret the socially constructed reality.
When examining concepts like EU ETS and SES, interpretivism is more appropriate to
capture the complexity of those reforms, explain the governance issues and implement a
causal effect analysis. Many researchers in the area of business and management,
particularly in the fields of organisational behaviour, marketing and human resource
management have used interpretivism. It should be noted that generalizability of EU ETS
and SES is not of critical importance for this philosophy, since the aviation environment is
constantly changing, but generalizability for the aviation governance and policy is.
One step ahead of interpretivism is constructionism, also known as social constructionism.
This views reality as being socially constructed. The constructionism research

198
philosophy was also followed in the PhD thesis since it deemed vital to identify the
subjective meaning that motivate the actions of the aviation stakeholders involved in SES
and EU ETS. Aviation players in respect to their group, placed many different
interpretations of the situations in which they found themselves. These interpretations
affect their actions and the interaction they have with other players. The aviation players
may not share the same mentality. Therefore, the aim of the researcher is to understand
the subjective reality of each aviation player and explain their motives and actions
regarding EU ETS and SES in a meaningful way.
6.2 Data collection techniques
Data selection is of critical importance for all researches. Date can be qualitative and
quantitative, so the research can be categorised as qualitative or quantitative research.
What constitutes a quantitative research method involves a numeric or statistical approach
to research design. Leedy and Ormrod (2012) alleged that quantitative research is specific
in its surveying and experimentation, as it builds upon existing theories. The methodology
of a quantitative research maintains the assumption of an empiricist paradigm (Creswell,
2013). Qualitative research provides an important insight into interpersonal relationships
(Tracy, 2013). It can be used to understand groups and organisations or even a range of
societal issues that arise from particular cultural contexts (Yin, 2015; Hogan et al, 2011).
Qualitative research builds its premises on inductive, rather than deductive reasoning. It is
from the observational elements that pose questions that the researcher attempts to
explain. The strong correlation between the observer and the data is a marked difference
from quantitative research (Williams, 2007).
The mixed methods approach to research is an extension of rather than a replacement for
the quantitative and qualitative approaches to research, as the latter two research
approaches will continue to be useful and important (Johnson & Onwuegbuzie, 2004).

199
According to Creswell (2013) a mixed methods approach is one in which the researcher
tends to base knowledge claims on pragmatic grounds (e.g., consequence-oriented,
problem-cantered, and pluralistic). It employs strategies of inquiry that involve collecting
data either simultaneously or sequentially to best understand research problems. The data
collection also involves gathering both numeric information (e.g., on instruments) as well
as text information (e.g., on interviews) so that the final database represents both
quantitative and qualitative information.
Qualitative research is a holistic approach that involves discovery (Williams, 2007).
Qualitative research can also be described as an effective model that occurs in a natural
setting that enables the researcher to develop a level of detail from being highly involved in
the actual experiences (Creswell, 2013). According to Flick (2009) the qualitative research
features are the following:
Appropriateness of methods and theories
The perspectives of the participants and their diversity
Reflexivity of the researcher and the research
Variety or approaches and methods in qualitative research
For qualitative data collection, there are three broad categories, the indirect observation,
the direct observation and the elicitation or talking to people (Bernard et al, 2016).
Elicitation is interviewing, asking questions to people. The interviews can be structured,
semi-structured or unstructured. The main advantage of unstructured or semi-structured
interviews is that it offers flexibility and the interviewer can modify the order and details of
how topics are covered. This requires self-discipline and a trained memory to recall the
information. Unstructured interviews look and sound like casual conversations, but they
are not. Many times is the only way to get information from some experts. On the other

200
hand, if one wants to compare ideas and practices across people or groups then similarity
in the level and the kind of information is necessary.
The research methodologies that were selected for this research project are two: a)
participant observation combined with unstructured interviews based on a free flow
discussion and b) the Delphi Method. Each method has a different process and objective.
Having different and complementary methods offers a better insight to the aviation
governance issues and benefits the discussion and the arguments developed by the
researcher and complements the Multi- Stakeholder Analysis and Management that is
used to better analyse the results and contribute to the development of an ideal reform
mechanism.
6.2.1 Participant Observation
Participant observation is a process where the researcher can observe a setting to collect
data (Glesne & Peshkin, 1992). Participant observation is widely used in social sciences
and especially to ethnographic research. The participant observer comes to a social
situation with two purposes: a) to engage in activities appropriate to the situation and b) to
observe the activities, people, and physical aspects of the situation (Spradley, 2016;
Weissinger, 2005). This qualitative method aims at understanding the diverse perspectives
of any given community and at the interplay among them. The researcher accomplishes
this by either only observing or by both observing and participating to the activities held by
the community (Musante and DeWalt, 2010). The participants’ observation for
ethnographic research takes place in the location/environment of the community.
The participant observation was conducted at EUROCONTROL for the continuous period
between December 2013 and August 2015. During this period, the researcher participated
to projects related to SES and ETS as well as meetings like the NSA Coordination

201
Platform. After August 2015, the researcher participated to a meeting organised by
European Commission about the EU ETS.
During the period of participant observation research, unstructured interviews were
conducted that contributed also to the development of some of the Delphi research
questions. In total seven interviews were conducted. The seven interviewees had different
backgrounds. Two of them are senior experts at IATA (interviewee N.07 and interviewee
N.06), the other two are senior consultants/academics in aviation and environment
(interviewee N.05 and interviewee N.04), one expert is working in the NGO Transport and
the Environment (interviewee N.03), one senior expert at European Commission
(interviewee N.02) and one senior expert at EUROCONTROL (interviewee N.01). The
interviewees requested their profile to remain anonymous without stating their roles or
backgrounds. The airlines’ opinions are represented via IATA and the passengers’ opinion
is represented by the NGO. Their help was valuable and due to their anonymity they had a
more sincere and critical approach to SES and EU ETS.
The information and data obtained through participant observation enhance the
understanding of the social, cultural and economic contexts of the participants’
environment; the relationship among and between people, ideas, norms and events; and
peoples’ behaviours and activities. The researcher obtains a nuanced understanding of
communities’ complexities than can come only from personal experience. Through this
research method, the researcher can get information previously unknown that is crucial for
project design, data collection as well as interpretation of other data. On the other hand,
participant observation is very time consuming and extremely difficult to keep notes and
document the data while the researcher is in the act of participating and observing. Finally,
a third challenge is being objective. The researcher should diversify what is observed and
what is interpreted from what is seen. Hence, it is important to filter out personal biases.

202
It is of critical importance to establish categories of information that are worth observing.
For this specific research, the elements that were observed looking only at the people are
the following:
Verbal behaviour and interactions: Who speaks to whom and for how long; who
initiates interaction; languages or dialects spoken; tone of voice; their rank.
Physical behaviour and gestures: What experts do, who does what, who interacts
with whom, who is not interacting
Expert rotation: In which meetings experts participate, who they are (ethnicity, age,
educational profile); turnaround of the experts and directors.
Experts who stand out: The characteristics of these experts and their group; what
differentiates them from others; whether other experts consult them or they
approach other experts.
The participant observation was used in this PhD thesis in order to identify the different
players of the aviation game and to better understand the relationships among the
participants as well as the complexity of the positions. Moreover, participants’ observation
was selected as the first stage of this research project in order to facilitate and develop
relationships with key informants, stakeholders and gate keepers whose assistance was
needed for the research topic to become a reality. Often participant observation is used in
conjunction with interviewing to collect data in the participant’s words (Bogdan & Biklen,
2006).
6.2.2 Delphi Method
The Delphi method can be characterized as the one that forms the communication process
of a group so that this process is effective allowing a group of individuals, to enable as a
whole to deal with a complex issue (Linstone & Turoff, 2002). According to Linstone &
Turoff (2002) the traditional application of Delphi technique was forecasting, but it has

203
been used in gathering current and historical data not accurately known or available,
exploring urban and regional planning options, putting together the structure of a model,
delineating the pros and cons associated with potential policy options, developing causual
relationships in complex economic or social phenomena and distinguising and clarifying
real and perceived human motibations. Delphi method has been succesfully been used in
various fields. Delphi is the best tool to gather in-depth information from a panel of aviation
experts who are geographically dispersed.
To achieve this structured communication someone should (Linstone & Turoff, 2002):
Provide feedback of the individual contributions of information and knowledge
Provide an assessment of the crisis and the views of the group
Offer the opportunity to the individuals to revise their views
Provide some degree of anonymity for individual answers.
The Delphi method has several applications. It can be used for example as (Linstone &
Turoff, 2002): a) prediction method, b) for the collection of current and historical data not
accurately known or available, c) for identifying the significance of historical events, d) to
outline the pros and cons associated with potential policy options, e) to development of
causal relationships in complex economic or social phenomena, g) distinguish and clarify
the real and perceived human motivation.
Furthermore, the Delphi method is a method for structuring a group communication
process so that the process is effective in allowing a group of individuals as a whole to
deal with a complex problem (Van der Duin, 2016). The implementation of SES and EU
ETS is problematic and lacks of substantial knowledge regarding the governance issues
and the difficulties associated with their implementation and success.

204
This method is used in order to study in more details a specific or contemporary topic and
is conducted during multiple rounds. In the first round, a panel of experts, either as a group
in the same room or individually in different areas, are asked about their opinion regarding
the specific topic. The opinions of all the participants are summarised and sent back to the
participants in order to develop new ideas or to revise their already stated ideas. This can
be done many times in order to reform ideas and summarise opinions.
Table 20: Use of Delphi method
Researcher Topic Rounds Participants
Gustafson, Shukla,
Delbecq, & Walster
(1973).
Estimate almanac events to investigate Delphi
accuracy 2 4
Czinkota & Ronkainen
(1997)
Impact analysis of changes to the International
business environment. 3 1
Kuo & Yu (1999) Identify national park selection criteria. 1 28
Nambisan et al.
(1999)
Develop a taxonomy of organizational
mechanisms. 3 6
Lam, Petri, & Smith
(2000) Develop rules for a ceramic casting process. 3 3
Delbari et al (2016)
An investigation of key competitiveness
indicators and drivers of full-service airlines using
Delphi and AHP techniques
2 30
Varho et al (2016)
Futures od distributed small scale renewable
energy in Finland- a Delphi study of the
opportunities and obstacles up to 2025
2 18
There are two types of Delphi, the Delphi Exercise and the Delphi Conference (Linstone &
Turoff, 2002). The first one is like the ‘paper and pencil’ version, according to which a
questionnaire is sent to a group and after it is answered, it is returned to the researcher in
order to summarise the results. The researched based on the results, designs a new
questionnaire for the group. The group will have at least one opportunity to reconsider its
initial statements based on the collective position of the group towards the topic. This is
the most common form of Delphi.

205
Delphi Conference is the most modern form of Delphi research and it substitutes in a high
degree the research team with the computer that is programmed to conduct the drawing of
the results. This version of Delphi has the advantage that it eliminates the delay from
summarising/consolidating every round, making the process in more real time
communication system. Unfortunately, it does not offer any flexibility, since the terms of
communication should be clearly defined before the start of the research (Linstone &
Turoff, 2002).
Delphi method is conducted in four phases no matter which form it has (Linstone & Turoff,
2002). The first phase is related with the search of the topic, where every individual offers
additional information that believes is related to the topic. The second phase is about the
understanding of the opinions of the group regarding the topic. If there is a disagreement
among the participants for the topic, this disagreement is researched in the third phase of
the Delphi so as to understand the reasons of the disagreement. Finally, the last phase is
the analysis and evaluation of the findings.
The Delphi method is successful only when emphasis is given to specific aspects (Van der
Duin, 2016). The researcher should not pass his/her ideas and opinions to the participants,
or to oversimplify the structure of the Delphi method and not to allow other aspects of the
problem to be expressed.
In terms of communication with the groups, there are different ways of doing that. The
main techniques of communication with a group are conference telephone call, committee
meeting, formal conference or seminar, conventional Delphi and real time Delphi. The
effectiveness of the group communication technique is related mainly to the size of the
group, the length and the number of interactions and the occurrence of interaction by
individual. When Delphi is conducted with a small group size, psychological effects may be
minimised. Conducting a Delphi study can be time-consuming (Hsu & Sandford, 2007).

206
Linstone and Turoff (2002) stated that Delphi may be characterized as a method for
structuring a group communication process so that the process is effective in allowing a
group of individuals, as a whole, to deal with a complex problem. To accomplish this
‘‘structured communication’’ the following are provided: some feedback of individual
contributions of information and knowledge; some assessment of the group judgment or
view; some opportunity for individuals to revise views; and some degree of anonymity for
the individual responses.
Anonymity, iteration, controlled feedback and statistical aggregation of group response are
the four key features that define and characterise Delphi method (Skulmoski et al, 2007).
In the traditional Delphi method, participants are not usually aware of the identity of other
panellists. By protecting the identity of participants, the potential risk of self-censorship is
reduced (Ballantyne, Hughes & Bond, 2016). Moreover, it offers panellists the opportunity
to modify their views as they respond to those of others without the social pressure that
exists in face-to-face meetings. Using individual communication or online research the
potential of individual group members dominating the group-decision process as often
occurs in planning meetings and focus groups can be avoided.
Iteration, i.e. the repetition of the questionnaires over a number of rounds, gave to
individuals the opportunity to change their initially stated opinions and judgement without
any pressure from the group. The process is mainly as a series of rounds; in each round
every participant worked through a questionnaire which was returned to the researcher
who collected, edited, and returned to every participant a statement of the position of the
whole group and the participant’s own position. A summation of comments made each
participant aware of the range of opinions and the reasons underlying those opinions
Ludwig (1997).

207
The Delphi method is very different from the traditional survey in terms of the procedure.
Regarding sampling Delphi’s power does not rely on statistical power of the group size, but
rather on group dynamics and expertise. Finally, in Delphi method the participants are not
anonymous to the researcher; hence construct validation is permitted. It needs to be
highlighted that respondents are always anonymous to each other, but the researcher
knows them and has the opportunity to follow up for clarifications and further qualitative
data offering richness of data.
6.3 Design of the instrument
Research design according to Yin (2013) is the logical sequence that connects the
empirical data to a study’s initial research questions and ultimately to its conclusions. The
PhD thesis has two main pillars, the literature review and the primary research. The
literature review is the basis for understanding sustainable development in aviation. In the
literature review, two case studies, the SES and the EU ETS reforms, were examined by
looking at their aims and technical details. The research methods that were applied in the
order they were conducted are the participant observation, the Delphi method and the
unstructured interviews. The flow chart (Figure 29) shows the process that was followed to
conduct this research.

208
1. Determine area of investigation
2. Identify approach
3. Conduct Literature Review
Case study of SES
Research Problem Define Research QuestionsRefined in
light of literature
4. Determine data types
Mixture of qualitative and quantitative data
5. Choose data collection
instruments/methods
6. Obtain Ethics Approval
7. Data Collection
8. Analyse the findings
Observations
Interviews Document Analysis
Delphi Method
Type determined by the type of research
Where the data are coming from
and
9. Write up Finding, Recommendations
and Conclusions
Case study of EU ETS
Delphi R1
Delphi R2
Delphi Pilot
Stakeholders Analysis
Multi-Stakeholders Governance
Figure 29: The Research Journey

209
The participant observation was done at EUROCONTROL that is the Network Manager of
Single European Sky and the Reporting, Verification and Monitoring of emissions facilitator
for European Union Emissions Trading Scheme. The researcher stayed at
EUROCONTROL from December 2013 to August 2015, i.e. 20 months. During this period,
the researcher participated in a number of meetings with the EC, NSAs, CAAs, ANSPs,
Airlines and other Institutions. Those meetings offered an excellent opportunity to identify
the relevant stakeholders and define the groups. Moreover, many participants were
approached through those meetings and using the snowball effect the sample was
defined. This research method was invaluable in determining whom to recruit for the study
and how best to recruit them.
The researcher used data collected through participant observation in order to improve the
design of Delphi method. The first questionnaire was developed based on the literature
review and then it was circulated to EUROCONTROL members for their valuable opinion.
Then a second version of the questionnaire was developed, where the questionnaire was
split in two having different set of questions but having the same approach and objective.
Then the two new questionnaires were given to a panel of experts (consisting of CAAs,
EUROCONTROL, EC and ANSPs representatives) for their consideration and as a pilot
survey. The questionnaires were then reviewed again based on their feedback and a new
set of questionnaires were developed. Those questionnaires after three revisions were the
final questionnaires that were distributed for the first round of Delphi Method (please see
Appendix5 and 6).
6.3.1 Questionnaires design and Pilot Survey
The first questionnaire was developed by the researcher during April 2014 (see
Appendix4) and was test on two employees of EUROCONTROL, two employees of
ANSPs and two employee of airlines. The questionnaire was returned less than half filled

210
in. The respondents reported that they could not reply to most of the questions because it
was either too sensitive information and had political implications or it was out of their
expertise. Therefore, it was decided to have two set of questionnaires, one for the EU ETS
and one for the SES that would have a link with each other.
The researcher developed two set of questionnaires that were sent for consultation to two
academics and two EUROCONTROL members. After two weeks of revisions and
corrections and thanks to their valuable experience and kind guidance the final version of
questionnaires was developed. The two questionnaires had different cover page to help
the participants diversify them. The second page of the questionnaires was a thank
you/welcome note by the researcher and the principal supervisor. Finally, each
questionnaire had a project description to introduce the participants to all the elements of
the research areas. The questionnaires started with briefly explaining the Single European
Sky and the Functional Airspace Blocks (FABs). Then a brief description of EU ETS was
given. In a separate section, the focus of the questionnaires was stated. Moreover, the
nature of the questions and the time requirements as well as the next step were clearly
expressed. The final part of the introduction section was the brief presentation of the
research team, i.e. the PhD candidate and the principal supervisor. The questionnaires
that were developed after consultation can be found in the Appendix 5 and 6. The 1st
questionnaire was returned on the 11th June 2014 and the last one on the 11th May 2015.
The 1st questionnaire of the second round was received on the 1st July 2015 and the last
on the 29th April 2016. The process proved very time consuming, but the results were very
satisfying.
The participants were asked to rate some statements using a scale from 1-5, where 1
stands for strong disagreement and 5 for strong agreement giving also an opportunity to
make comments. Summated scales (or Likert-type scales) are developed by utilizing the

211
item analysis approach wherein a particular item is evaluated based on how well it
discriminates between those persons whose total score is high and those whose score is
low. In some other questions, the participants were asked to divide 100 points to different
parameters. This method is the method of rank order: Under this method of comparative
scaling, the respondents are asked to rank their choices. The participants in this case were
given the opportunity to add other factors they deemed appropriate.
The last two questions in both questionnaires are the connecting questions for the two
schemes, but there were also some other underlying questions that had similarities
between the two questionnaires. The question about the factors that lead to carbon neutral
growth is one of the most important questions for linking the EU ETS with the SES. In this
question different options to achieve carbon neutral growth are given. The participants
were asked to share 100 point to the options among the different options. The critical point
is whether the participants regard a single option as the only one possible to achieve for
carbon neutral growth: alternatively, in case of combined options what other ways to be
used. If the participants choose more than one option then this proves the need for policy
coordination. In particular, the options considered are the following:
1. The EU ETS leads to carbon neutral growth
2. Individual carbon offsetting programs from airlines lead to carbon neutral growth
3. Individual carbon offsetting programmes from states lead to carbon neutral growth
4. Horizontal en route flight efficiency
a. Direct routes lead to carbon neutral growth
b. Wind optimal routes lead to carbon neutral growth
c. Flexible Use of Airspace (FUA) leads to carbon neutral growth
d. Free Route Airspace (FRA) leads to carbon neutral growth
5. Other

212
The factors 1, 2 and 3 are related to Market Based Measures, whereas the factor 4, i.e.
Horizontal en route flight efficiency is related to operational improvements. The factor 5
was given for the participants to give points if they wish to other factors, for example
vertical flight efficiency, or biofuels, or technological improvements. The last question was
an open-ended question to give the respondents the opportunity to give their opinion on
the connection of EU ETS and SES.
For the second round of the Delphi method, one additional element was introduced. In was
evident from the individual/separate unstructured interviews that one element that was
leading to the slow implementation and deliverables of SES and secondly EU ETS was the
complexity of the mechanism and hence the additional time and effort the stakeholders
had to give. Hence, the element of transaction costs was implemented. Following the
interviews and advices from key experts the transaction costs were categorised in groups
and subgroups and the Delphi survey participants were asked to do a comparative scaling,
i.e. to rank them in terms of their importance for the success of the reform schemes and to
state their opinion for their importance in general (see Appendix 7 and 8).
The survey stopped in the second round because there were no major changes of the
experts’ opinions. There are three parametric statistical methods to check the consensus
and reliability in a Delphi study (Shah and Kalaian, 2009): a) the coefficient of variation
(CV); b) the Pearson correlation coefficient and c) the F-test. English and Kernan (from
Shah and Kalaian, 2009) used the coefficient of variation (CV) to determine the stopping
rule. According to Shah and Kalaian (2009) the CV is the best procedure to obtain
reliability in a Delphi study. If the magnitude of CV for an item was found to be too large,
the corresponding statement was needed to be modified and required an additional
round(s) of questionnaire administration. That was the case in this survey; hence, the
second round was the last round of the research.

213
The Coefficient of Variation can take values between 0 and √𝑁 − 1 , where N refers to the
sample size. The maximum value of CV is reached when all observations but one are
equal to zero (Abdi, 2010). Therefore, the CV in the EU ETS survey may take values
ranging from 0-5.48. In the case of SES survey, the CV can take values from 0-5.39.
When the CV is closer to 0 it is considered low and when it is closer to 5 it is considered
high.
6.3.2 Target participants and sample
All elements in a population must be examined in order to collect accurate data. When the
data is collected from the entire population, it is considered a census. When the population
of a study is big, a sample is considered as the most appropriate and realistic way of
research. Sampling is observing a part in order to glean information about the whole is an
almost instinctive human act (Creswell, 2013). Given the complexity of the problem, the
following groups were selected to participate in the survey:
Industry: Senior managers working in airlines and ANS provision companies
Government: Senior managers working in Civil Aviation Authorities (CAAs),
National (NSAs) and aviation organisations
Academia: Academic institutions and researchers working on aviation management
related programs
The Chain-referral sampling or snowball sampling is a non-random (nonprobability)
sampling technique in which a research participant is selected who then identifies further
participants whom he or she knows, often useful for finding hidden populations (Beins and
McCarthy, 2012). Because it was very difficult to identify the real expert and to make
contact with him or her, the researcher kindly asked the participants and other people that
were approached to participate to provide references to others that might be interested
and qualified to participate in the survey.

214
Quota sampling was an aim in order to achieve balance among the backgrounds of the
participants. Quota sampling is ‘a non-random (nonprobability) sampling technique in
which subgroups, usually convenience samples, are identified and a specified number of
individuals from each group are included in the research (Beins and McCarthy, 2012).
To select the candidates, two types of non-random sampling were used, a) purposive
sampling and b) snowball sampling. Purposive sampling is also known as judgmental,
selective or subjective sampling, is a type of non-probability sampling technique.
Purposive sampling is a non-random (nonprobability) sampling technique in which
participants are selected for a study because of some desirable characteristics, like
expertise in some area (Beins and McCarthy, 2012). In this specific area, the participants
were requested to have knowledge in both areas of ANSPs environmental regulations and
Airlines environmental regulations. Finding someone who is an expert in both regulating
the supply and the demand side of aviation was proven extremely difficult. Thus, the
approach of two different questionnaires with some common questions was decided. No
incentives were provided to the respondents for completing the questionnaires.
The stakeholders involved in SES and ETS are the following:
1. ANSPs
2. Airport Operators
3. Air Traffic Navigation staff
4. Airspace users
5. Regulators and Administrators
6. Academics and individuals
The target population are the stakeholders involved in both Single European Sky and
European Union Emission Trading Scheme in Aviation. According to EASA there are
almost 6,000 individual aircraft operators that provide commercial passenger and cargo

215
services in Europe. The fact that there are 6,000 aircraft operators does not mean that the
population for this survey is 6,000, because some of them are in the minimum criteria for
EU ETS and thus they are excluded from obligatory submission of allowances. According
to Sandbag (2013) 1169 airlines and operators participated in the EU ETS, 788 (67%) of
which were international, with the remaining 381 (33%) being EU airline. The USA has the
highest number of airlines participating in the scheme, 470 (40% of the total), but the
majority are smaller operators, such as company or private jets. Thus under the stop the
clock principle the airlines obliged to comply with EU ETS are only 381.
The European ANS system covers 37 Air Navigation Service Providers (ANSPs). The
provision of air traffic services is the responsibility of every State under the ICAO
Convention, and thus almost every State has its own Air Navigation Service Provider
(ANSP). There are 29 ANSPs that are part of SES (28 EU Member States plus Norway
and Switzerland). Luxembourg does not have its own ANSPs. Belgocontrol (Belgian
ANSP) controls the lower Luxembourg airspace (up to FL 245), and the upper airspace
(more than FL 245) is controlled by Maastricht UAC.
In terms of government authorities, regulators, administrators and institutions, the main
stakeholders are European Commission (Directorate General for Climate Action and
Directorate General for Mobility and Transport), Civil Aviation Authorities,
EUROCONTROL (Network Manager for SES and MRV facilitator for EU ETS),
International Air Transport Association (IATA), Ministries of Transport (when CAA is not
managing the ETS). Moreover, individuals may be also considered as stakeholders of
those changes. As Individuals we may consider the general aviation enthusiasts, the
passengers and researchers. The passengers are not familiar with the implemented
changes and thus their interest remains on the final product. The passengers are
concerned about their safety, the travelling time and scheduling issues, the price of their

216
tickets and some of them about their environmental footprint. This though does not qualify
them to participate in such a study. The ones that hold a Private Pilot License (PPL) are
not familiar with the en-route level and are under the minimum criteria of EU ETS, thus it is
doubtful if they are familiar with SES and EU ETS implementation.
Individual researchers and academics that conduct research in this topic are considered
as qualified participants. The population of those individuals is difficult to be estimated.
Both inclusion of aviation in EU ETS and Single European Sky are new topics and the
researchers working on those topics are limited. Furthermore, researchers are not that
interested in ANSPs from the management perspective because ANSP is considered very
technical and up to now the management of ANSPs was and it remains in a big part
government owned and non-profit orientated.
Identification and attraction of qualified participants is considered very difficult.
Nevertheless, the questionnaire was send to more than 260 qualified experts. The
participation rate was around 15%. On the SES questionnaire 30 experts took part to the
survey and on EU ETS 31 experts participated to the survey. The literature recommends
10-18 experts on a Delphi panel. Due to the complexity of the scheme as well as to the
number of stakeholders involved, the number of 30 experts is deemed necessary.
6.4 Ethical considerations
In order to conduct participant observation, the researcher went to EUROCONTROL and
the institution was informed about the presence of the researcher. The researcher did not
publish or reveal any confidential or sensitive information obtained during the staying at
the institution. The researcher when conducting participant observation, was discreet
enough about who she was and what she was doing so as not to disrupt the usual
activities, so people the researcher observed and interacted with did not feel that their
privacy was in danger. When participating in meetings the identity of the researcher was

217
revealed stating that she is member of the team and at the same is a researcher working
on SES and EU ETS.
The researcher was extremely careful not to mislead the members about her role and
purpose. When the researcher was participating only as observer and was informed that
the issues and topics discussed are sensitive and confidential, the researcher did not state
any of the points discussed. Some coded records were kept, but due to confidentiality
reasons, this information cannot be shared. Nevertheless, thanks to those meetings the
researcher obtained a more solid understanding and knowledge.
Anonymity is ensured to the participants of the Delphi survey. The implementation of FAB
and in general the slow implementation of SES is a quite sensitive topic. In addition, the
positions of Airlines and other stakeholders towards EU ETS due to the high competition
and the political sense of the scheme is also considered as ‘hot potato’ and demands
special treatment. Thus the participants wish to remain anonymous and their position as
well as their company/organisation to remain secret.
Furthermore, participants were informed that they do not have to participate in the
research and they can terminate their responses at any time. This constitutes voluntary
participation. The participation is voluntary and the researcher’s identity was made
available to respondents. The respondents’ anonymity is respected and it will remain
anonymous. Moreover, the security/privacy of the data is of high importance. Respondents
that requested not to be further contacted, were not sent any email and weren’t further
contacted by the researcher.
Response bias was avoided as much as possible. Response bias is ‘a tendency for a
respondent to answer in predictable ways, independent of the question content, such as
always agreeing with a statement or always providing high or low ratings on a Likert scale’
(Beins and McCarthy, 2012:100). Some of the questions are worded in such way to

218
identify when the participant is biased. It was not any case where the respondent thought
that he or she will be evaluated so as to tailor their responses to the survey. Shulruf,
Hattie, and Dixon (2008) created a five-stage model of how people comprehend and
respond to survey questions. In this model, respondents are seen as progressing through
the following steps: (a) understanding the question, (b) establishing the context, (c)
retrieving available information about related behaviours, (d) integrating information and
assessing impression management, and (e) evaluating all the information and aligning it
with the available range of responses. All the participants that fill in the questionnaire with
the presence of the researcher seemed to spend a considerable mental processing and
their answers were irrelevant to the researcher’s personal opinion that was not at all
communicated to them.
Accurate and credible findings are a function of validity and reliability (Creswell, 2013).
According to Creswell (2012), validity can be achieved by any two of the eight strategies:
prolonged engagement and persistent observation in the field; triangulation; peer review or
debriefing; refining hypotheses as the inquiry advances; clarifying researcher bias from the
outset of the study; the researcher solicits participants’ views of the credibility of the
findings and interpretations; ‘rich and thick description’ and external audits. Table 21
illustrates the validation strategies and how they were adopted.
Table 21: The Research Validation Strategies followed by the researcher (based on Creswell, 2012)
Validation strategies Adoption in the research
1. Prolonged engagement
and persistent
observation in the field
Working almost two years at EUROCONTROL
2. Peer review or debriefing
3. External audits’
This PhD thesis was supervised by one key professor and an
advisory committee. In total 4 professors and 1 industry

219
expert reviewed either the whole thesis or key parts of it.
4. The researcher solicits
participants’ views of the
credibility of the findings
and interpretations
Expert panel views were counted. This research was
presented in workshops (COST Action TU 1408 Air Transport
And Regional Development, German Aviation Research
Society, EUROCONTROL) to get more feedback from the
conference audience to adjust it and to increase its credibility.
One-paged feedback was received from academics and
industry experts.
5. Rich and thick description Qualitative data (e.g. interviews) were collected and
presented to give as much in depth information as possible
Finally, approval for reproducing the figures and table was granted from EUROCONTROL,
the European Commission, the Intergovernmental Panel of Climate Change (IPCC), the
European Energy Exchange (EEX) and the International Air Transport Association (IATA)
(see Appendix 9).
6.5 Limitations of the research
Although the research was carefully prepared and had reached the aims, there were some
unavoidable limitations. Because both SES and EU ETS in aviation are relevantly new
schemes, the research was conducted on a small size of the population. It was extremely
difficult to find qualified participants, but should more experts had participated in the
research the results could be covering more areas and capture better the complexity of the
systems and the need for interlinkages. The opinions of the fuel suppliers, the
manufacturers and the system suppliers are not captured in this research. In addition, the
literature review covers the contemporary expertise about environmental performance.
Should further research be conducted about the emissions contributing to climate change,
the focus of the regulations may be shifted to other areas.
Finally, the Delphi Method is a method that requires a lot of time to find and engage the
participants that are based in different countries. Some participants shared more

220
information than others did, leading to asymmetries of information regarding the
organisations. There were some countries that were not represented. There were no
participants from South West FAB and Performance Review Unit. The latest would have
given a very important added value to the results.
The participant observation was conducted at EUROCONTROL that gave an excellent
insight about the SES reform but a limited insight at the EU ETS reform. Should the
participant observation be conducted at European Commission the researcher could have
an insight of both the SES and the EU ETS. The interviewees did not allow the researcher
to keep any records or notes of the interviews neither to reproduce their exact words.
Therefore, the credibility and proper use of the findings of this method rely on the ability of
the researcher to capture the position of the interviewees.
6.6 Summary
The research was conducted by a mix of methods. Semi structured interviews based on
free flow discussions were used to research additional elements that a questionnaire could
not capture. The participant observation taking place at EUROCONTROL enabled the
researcher to obtain a wide knowledge of the topic, identify experts of SES and EU ETS
areas and build a professional network. Moreover, the researcher participated to a series
of meetings where due to confidentiality reasons, the information cannot be reproduced,
but gave a more in depth knowledge and understanding to the researcher that helped her
to build and better interpret the results collected by the Delphi method.
The elements that were taken under consideration for selecting Delphi method as the most
appropriate method for this PhD thesis were a) the scope and object of enquiry, b) the
precision required, c) the participants’ engagement and d) the impartiality of the
researcher. The Delphi method was deemed as the most appropriate to research the SES
and EU ETS topics. The Delphi method due to the complexity of the topic and the lack of

221
experts being familiar with both areas, was conducted using two sets of questionnaires,
the SES/FAB questionnaire and the EU ETS questionnaire. The Delphi method was
terminated in the second round since the Difference of Coefficient of Variation was very
low, proving consensus among the groups and the participants.

222
This page is intentionally left blank

223
7 The findings of the Delphi Method
This chapter presents the data collected by the questionnaires following the Delphi Method
and their discussion. The research methods followed are the Delphi method, semi
structured interviews and participant observation. The Delphi method is conducted in two
rounds. The Delphi method was applied for both cases, i.e. SES and EU ETS, having two
separate questionnaires with some common areas. For every set of questionnaire, there
were around 30 participants. The Likert scale was used in some of the questions ranging
from 1 to 5, where 1 stands for strong disagreement, 2 for disagreement, 3 for neutral
position, 4 for agreement and 5 for strong agreement. In other questions, the participants
were asked to share 100 points among the statements. In both questionnaires, an
additional question about the Transaction Costs was added in the second round. The
questions of the two questionnaires are listed in section 7.1.
For the second method, around seven experts were interviewed. The interviews replies
are presented in different parts of this PhD thesis as by this way more added value was
added in the arguments. The last method that was followed is the participant observation,
where the researcher attended a series of meetings with the EC, CAAs, NSAs, ANSPs,
EUROCONTROL, airlines and academics as well as by spending a big amount of time at
EUROCONTROL. The participant observation results are depicted as the critical analysis
of the theoretical framework and at the identification of the factors affecting the
implementation and the performance of SES and EU ETS.
7.1 First round of the Delphi Method
The Delphi method was conducted in two rounds. In this section, the first round is
presented. The questions for the first round of EU ETS questionnaire are the following:
Q1. Please assess the extent to which you agree with the following statements.

224
Q2. Please assess the impact of different allowances allocation methods to the
aviation sector (was removed in the 2nd round)
Q3. Please divide 100 points over the different allowance allocation methods that
you deem as appropriate for the allocation of allowances to the airlines, where the
most important factor gets the highest number of points. You are allowed to allocate
points to as many factors as you wish.
Q4. In order to link the different ETSs (like New Zealand or Shanghai ETS) with
entire scheme and not only in aviation, the following factors should be applied to the
same degree. Please assess the extent to which you agree with the following
statements.
Q5. Please divide 100 points over the different factors that lead to carbon neutral
growth, where the most important factor gets the highest number of points. You are
allowed to allocate points to as many factors as you wish.
Q6. Do you think that there is a connection between EU ETS and Functional
Airspace Blocks (FABs)? If yes, why? (was removed in the 2nd round)
The questions for the first round of SES questionnaire are:
Q1. Please evaluate the major FAB Improvement Areas (FIAs) that have been
identified as the most promising areas according to the degree of the potential
benefit coming from the establishment of FABs.
Q2. Please assess the extent to which you agree with the following statements
Q3. Please divide 100 points over the different factors that affect horizontal en route
flight efficiency, where the most important factor gets the highest number of points.
You are allowed to allocate points to as many factors as you wish.
Q4. Please divide 100 points over the different factors that affect the use of the
civil/military airspace structures (Free Route Airspace, Flexible use of Airspace),

225
where the most important factor gets the highest number of points. You are allowed
to allocate points to as many factors as you wish.
Q5. Please evaluate the following factors according to their contribution to
emissions’ reduction.
Q6. Please divide 100 points over the different factors that lead to carbon neutral
growth, where the most important factor gets the highest number of points. You are
allowed to allocate points to as many factors as you wish.
Q.7. Do you think that the present charging scheme is enough to avoid
fragmentation because of intra and inter FAB competition? What do you propose?
(was removed in the 2nd round)
Q8. Do you think that there is a connection between FABs and Emissions Trading
Scheme (EU ETS)? If yes, why? (was removed in the 2nd round)
7.1.1 The EU Emissions Trading Scheme Questionnaire descriptive analysis
This section is devoted to the descriptive presentation of the finding of the first round for
the EU ETS questionnaire and will proceed question by question. The tables provide
information about the participation rate (N), the range of the replies given (Min for
minimum value and Max for maximum value given), the mean, Standard Deviation (SD)
and Coefficient of Variation (CV) also known as Relative Standard Deviation (RSD). The
coefficient of variation (CV) is the ratio of the standard deviation of an item’s rating score to
its corresponding mean across panellists. This coefficient, unlike the standard deviation, is
not affected by the unit of measurement. The statements are ordered by higher to lower
mean.
As may be seen in Table 22, for some of the statements all the 31 participants expressed
their opinion for some others there were 27 replies. The standard deviation values show
that there is a small spread of the replies and indicates that despite the groups where they

226
belong they have consensus in their opinions. One interesting statement is that lobbying
around allocation of allowances affects the economic dimension of the EU ETS. The
majority of 27 participants agreed with these statements. The average value is 4 which
stands for agreement, the Standard Deviation (SD) was 0.83 and the coefficient of
variation (CV) was 0.21. The statements ‘It is possible to link the EU ETS and the other
Emissions Trading schemes and have a global ETS’; ‘The carbon market’s stability is
vulnerable because of the continuous changes in legislation’; ‘Additional fuel savings will
also be achieved owing to better fuel use predictability’; and ‘The EU ETS is causing
competition issues to airlines’ had a mean ranging from 3.5-3.9. The factors ‘The EU ETS
will lead the airlines to merge in order to obtain more emissions allowances’ and ‘Route
optimisation is sufficient enough for carbon neutral growth’ had the lowest means.
Table 22: Q1 Position of participants on EU ETS (1st round EU ETS Q)
Descriptive Statistics
N Min Max Mean SD CV
The economic dimension of the EU ETS drives
heavy lobbying around allocation of EU ETS
allowances.
27 2 5 4.00 0.83 0.21
It is possible to link the EU ETS and the other
Emissions Trading schemes and have a global
ETS.
31 1 5 3.87 1.06 0.27
The carbon market’s stability is vulnerable
because of the continuous changes in legislation. 30 2 5 3.73 0.98 0.26
Additional fuel savings will also be achieved
owing to better fuel use predictability. 28 1 5 3.64 0.95 0.26
The EU ETS is causing competition issues to
airlines 31 1 5 3.52 1.39 0.40
Using biofuels is a promising solution for carbon
offsetting. 30 1 5 3.33 1.24 0.37
The EU ETS can result in carbon leakage. 29 1 5 3.31 1.04 0.31
The multi-period nature of allocations (i.e.
banking and borrowing flexibility) drives
dependence both upon post-2012 decisions and
creates risk of perverse incentives
28 1 5 3.29 0.90 0.27

227
Descriptive Statistics
N Min Max Mean SD CV
The monitoring, reporting and verification of
emissions in the EU ETS is effective. 31 1 5 3.26 1.13 0.35
The EU ETS is vulnerable to frauds, for instance
VAT fraud and ‘phishing’ scams. 28 1 5 3.25 1.35 0.42
The carbon market stability is vulnerable
because of the low prices of the allowances. 29 1 5 3.21 1.15 0.36
Postponing the auctions can force the prices of
allowances to increase. 29 1 5 3.17 1.14 0.36
The EU ETS is source of profit-making incentives
unprecedented in the history of environmental
policy
27 1 5 3.04 1.40 0.46
The creation of carbon as a “financial
instrument” can lead to sufficient carbon
reduction.
28 1 5 3.00 1.09 0.36
The corresponding large proportion of free
allocation underlies legal stresses and a scope for
distortions.
28 1 4 2.89 0.96 0.33
There are small emissions reductions relative to
‘business-as-usual’ and this leads to instabilities
related to economics, policies and time frames)
in the EU ETS.
28 1 4 2.75 0.89 0.32
The free allocation of allowances to the airlines
must be stricter. 31 1 5 2.71 1.27 0.47
The cap of EU ETS is too generous. 30 1 5 2.67 1.32 0.50
The inclusion of aviation in the EU ETS will
influence negatively the development of non-
European airlines if they are included in EU ETS.
31 1 5 2.65 1.36 0.51
The EU ETS will lead the airlines to merge in
order to obtain more emissions allowances. 31 1 5 2.42 1.34 0.55
Route optimisation is sufficient enough for
carbon neutral growth. 30 1 5 2.03 1.22 0.60
The second question was about the impact of different allowances allocation methods to
the aviation sector (Table 23). This question was not taken under consideration because
many participants found it difficult to reply and the participation rate was too low to extract
results. Due to that it was not added to the second round.

228
Table 23: Question about the impact of different allowance allocation methods (1st round EU ETS Q)
Auctioning Grandfathering Repeated
benchmarking One off
benchmarking
The cost of EU ETS is passed to ticket or freight prices
Airlines have windfall profits
Airlines demands more allowances
Technical improvements and industry measures are implemented
The third question about the different allowance allocation methods received 24 replies
(Table 24). When the mean is taken under consideration, the allocation method with the
highest mark is benchmarking (mean=39%) followed by auctioning (mean=37%) and the
least ideal method taking under consideration the mean is the grandfathering rights
(mean=24%). The Standard deviation for all the allocation methods is very high, which
shows that the mean is not representative. The CV as explained in the methodology
chapter can take values from 0-5.48. In this case, the CV is higher compared to the other
question, but it is still considered as low.
Table 24: Ideal allocation method (1st round EU ETS Q)
Descriptive Statistics
N Min Max Mean SD CV
Benchmarking 24 0 100 39.25 26.12 0.67
Auctioning 24 0 90 36.58 26.08 0.71
Grandfathering 24 0 90 24.17 27.17 1.12
The next question is very important given the recent developments with ICAO Assembly
and the proposed Global Market Based Measure (Table 25). The participants were given a
set of factors that need to be the same for linking the different ETSs (like New Zealand or
Shanghai ETS) across the world to create a global scheme. The 27 participants agreed

229
with all the factors stated and did not add any additional factor. The average for all the
statements is 4.2.
Table 25: Factors to be considered for linking different ETSs (1st round EU ETS Q)
Descriptive Statistics
N Min Max Mean SD CV
There are the same Monitoring,
Reporting and Verification (MRV) rules
for allowances
27 1 5 4.56 1.81 0.40
There is the same eligibility of offset
credits 26 1 5 4.39 1.81 0.41
There are the same rules governing new
entrants and closures 27 1 5 4.33 1.82 0.40
There is the same stringency of
enforcement 27 1 5 4.33 1.80 0.42
There are the same registries’ rules 26 1 5 4.31 1.83 0.42
The same allocation methods are
applied 27 1 5 4.22 1.87 0.44
There is the same stringency of targets 27 1 5 4.15 1.88 0.45
There are the same compliance periods 27 1 5 3.89 2.03 0.52
There are the same banking provisions 27 1 5 3.67 1.04 0.28
Both the SES and the EU ETS questionnaires, as explained in the methodology chapter,
have a common question. The replies of the EU ETS participants are summarised in Table
26. The 26 participants who replied to this question gave the most points to the horizontal
en-route flight efficiency that is related with the 4 following factors: Direct routes lead to
carbon neutral growth; Wind optimal routes lead to carbon neutral growth; Flexible Use of
Airspace (FUA) leads to carbon neutral growth; and Free Route Airspace (FRA) leads to
carbon neutral growth. The second most important factor is the EU ETS according to 26
experts. The CV are very high in all factors. The comparison between the SES and the EU
ETS replies to this question is done in the second/final round of Delphi.

230
Table 26: Factors leading to carbon neutral growth (1st round EU ETS Q)
Descriptive Statistics
N Min Max Mean SD CV
The EU ETS leads to carbon neutral
growth. 26 0 94 21.46 25.31 1.18
Individual carbon offsetting programs
from airlines lead to carbon neutral
growth.
26 0 40 12.39 12.32 1.00
Other 26 0 60 11.35 17.75 1.57
Flexible Use of Airspace (FUA) leads to
carbon neutral growth 26 0 30 11.31 8.21 0.73
Wind optimal routes lead to carbon
neutral growth 25 0 45 10.76 10.29 0.96
Free Route Airspace (FRA) leads to
carbon neutral growth 26 0 40 10.35 9.17 0.89
Individual carbon offsetting
programmes from states lead to carbon
neutral growth.
26 0 30 10.15 10.19 1.00
Direct routes lead to carbon neutral
growth 26 0 40 10.15 8.67 0.85
Other 26 0 45 2.41 9.34 3.88
The final question of the EU ETS questionnaire asked the participants if they believe that
there is a connection between SES (FABs) and Emissions Trading Scheme (EU ETS).
The 45% of the participants believe that there is a connection between SES and EU ETS.
The 16% believe that there is no connection between the two schemes. The 39% of the
participants did not reply to the question (Figure 30).

231
Figure 30: Connection between SES (FABs) and EU ETS (1st round of EU ETS Q)
7.1.2 The Single European Sky (FABs) Questionnaire descriptive analysis
This section gives a descriptive presentation of the finding of the first round for the Single
European Sky questionnaire. Around 30 experts participated voluntarily and anonymously
to the first round of the SES questionnaire.
The participants were asked to evaluate the major FAB Improvement Areas (FIAs) that
have been identified as the most promising areas according to the degree of the potential
benefit coming from the establishment of FABs (Table 27). Most of the participants kept a
neutral position regarding the FAB Improvement Areas (FIAs) that have been identified as
the most promising areas according to the degree of the potential benefit coming from the
establishment of FABs. The areas that noted a positive position are the Common
Operational Procedures, Synergies in Air Traffic Flow and Capacity Management
(ATFCM), Communication Data Sharing, Harmonised ATM system and Reduction of
Emissions. Having an average CV at 30%, it is proven that there is consensus among the
experts in this question.
45%
16% 39%
Yes
No
N/A

232
Table 27: Areas benefitted from the establishment of FABs (1st round SES Q)
Descriptive Statistics
N Min Max Mean SD CV
Synergies in ATFCM 28 2 5 3.96 0.79 0.20
Harmonised ATM system 28 1 5 3.96 1.20 0.30
Reduction of emissions 28 2 5 3.96 0.96 0.24
Common Operational Procedures 28 2 5 3.93 0.77 0.20
Common Flight Inspection 28 1 5 2.93 0.81 0.28
Communication Data Sharing 28 2 5 3.89 0.83 0.21
Airspace consolidation 28 1 5 3.82 1.12 0.29
Common Routes Network design 28 1 5 3.79 1.03 0.27
Common Sector Design 28 1 5 3.64 1.03 0.28
Common Safety Management System 28 2 5 3.64 0.95 0.26
Surveillance Data sharing 27 1 5 3.63 1.12 0.31
Improved cooperation with Militaries 28 1 5 3.54 1.11 0.31
Common ATCO Training 28 2 5 3.50 0.84 0.24
Common R&D 27 1 5 3.15 0.99 0.31
Common Procurement 27 1 5 3.15 1.17 0.37
Sharing of navigation aids 27 1 5 3.15 1.03 0.33
Common AIS & MET 28 1 5 3.14 1.18 0.38
Other 4 3 5 4.00 1.16 0.29
The most important replies in the second question are for the importance and need of SES
and the contribution of SES to the environmental performance (Table 28). Almost all the
participants agreed that the European airspace was necessary to change (statement: ‘The
airspace before SES did not need to be changed’ mean= 1.93), but not all FABs are fully
operational (statement ‘All FABs are fully operational’: mean= 2.04). The CV in all the
statements with the exemption of the ‘All FABs are fully operational’ and the ‘the airspace
before SES did not need to be changed’ gather consensus among the participants.

233
Table 28: Position of participants on SES and the environment (1st round SES Q)
Descriptive Statistics
N Min Max Mean SD CV
The reorganisation of the European Sky
was necessary. 29 1 5 4.04 1.12 0.28
The European airspace network today
can benefit from a significant level of
dynamism through the application of the
Flexible Use of Airspace (FUA) concept.
28 1 5 3.79 0.96 0.25
Due to inherent safety (minimum
separation requirements between
aircraft) requirements, the level of
“inefficiencies” cannot be reduced to
zero at system level.
29 1 5 3.66 1.08 0.30
FABs bring routes closer to the optimum
“Great Circle” route and reduce
extended flight paths.
29 1 5 3.55 1.12 0.32
Due to capacity (organisation of traffic
flows) requirements, the level of
“inefficiencies” cannot be reduced to
zero at system level.
29 1 5 3.45 1.24 0.36
The main environmental KPI should be
the estimated economic value of CO2
emissions due to route extension.
29 1 5 2.83 1.34 0.47
The horizontal component is of higher
economic and environmental importance
than the vertical component of the Flight
efficiency.
29 1 4 2.59 0.95 0.37
All FABs are fully operational. 27 1 5 2.04 1.09 0.54
The airspace before SES did not need to
be changed. 29 1 5 1.93 1.19 0.62
The horizontal en route flight efficiency is a key factor for reducing the emissions in en
route level (Table 29). The participants characterised as the most important factors
affecting the horizontal en route flight efficiency: a) the airspace structure; b) the flight
planning capabilities; and c) the user preferences. The high CV suggests different opinions
among the participants and lack of consensus.

234
Table 29: Factors affecting horizontal en route flight efficiency (1st round SES Q)
Descriptive Statistics
N Min Max Mean SD CV
Route structure and availability
affect horizontal en route flight
efficiency.
24 5 50 27.71 12.25 0.44
Availability of airspace (utilisation of
civil military structures) affects
horizontal en route flight efficiency.
24 5 40 18.67 10.43 0.56
Flight planning capabilities (use of
software, repetitive flight planning)
affect horizontal en route flight
efficiency.
24 0 30 14.25 7.43 0.52
User preferences regarding fuel
affect horizontal en route flight
efficiency.
24 0 40 10.58 10.48 0.99
Tactical ATC routings affect
horizontal en route flight efficiency. 24 0 20 10.42 5.30 0.51
User preferences regarding time
affect horizontal en route flight
efficiency.
24 0 30 8.58 6.65 0.78
Special events such as ATC strikes
affect horizontal en route flight
efficiency.
24 0 30 8.33 6.54 0.79
Other 24 0 25 1.46 5.41 3.71
According to 27 participants, the most important factor affecting the use of the civil/military
airspace structures (Free Route Airspace, Flexible use of Airspace) are political issues
(Table 30). This factor gathered on average 43% with a standard deviation equal to 29.
The coefficient of variation is 0.67, which implies that there is limited consensus among the
participants.

235
Table 30: Factors affecting the Civil Military cooperation (1st round SES Q)
Descriptive Statistics
N Min Max Mean SD CV
Political issues 27 0 100 42.96 28.93 0.67
Flight planning capabilities (use of
software, repetitive flight planning) 27 0 60 13.41 13.08 0.98
Special events 27 0 60 13.41 16.53 1.23
Existing ICAO ATM procedures 27 0 30 9.70 9.53 0.98
Aspects related to position information
and radar vectoring 27 0 30 9.33 8.09 0.87
Other 27 0 100 10.82 27.14 2.51
The fifth question focused on the factors contributing to emissions’ reduction (Table 31).
The 30 participants agreed that the most important factors contributing to emissions’
reduction are the operational measures, like FUA, FRA and CDOs. Whereas they stated
that the emissions trading does not contribute to emissions’ reductions. For the SES in
general the average was 3.67 and the SD 1.09. The SD was on average below 30%
proving consensus among the participants. One participant added two factors that
contribute to the emissions reduction. One of those was the ‘ICAO Global Market Based
Measure (GMBM)’ and the other was the ‘new technologies’.
Table 31: Factors contributing to emissions’ reduction (1st round SES Q)
Descriptive Statistics
N Min Max Mean SD CV
Shortest feasible routes 29 1 5 4.14 0.88 0.21
Implementing continuous descent
approaches 30 2 5 4.10 0.71 0.17
Use of Eco-friendly engines 30 1 5 4.10 0.85 0.21
Flexible Use of Airspace 30 2 5 4.07 0.83 0.20
Free Route Airspace 29 2 5 4.03 0.82 0.20
Improving load factors 30 2 5 3.70 0.79 0.22
Use of Bio fuels 30 1 5 3.67 1.12 0.31
Single European Sky 30 1 5 3.67 1.09 0.30
Reduced traffic because of economic
crisis 30 1 5 3.27 1.11 0.34
Airlines develop offsetting programs 29 1 5 3.24 1.15 0.36

236
Descriptive Statistics
N Min Max Mean SD CV
EU Emissions Trading Scheme 30 1 5 2.90 1.19 0.41
Trading Certified Emissions Reductions
(CERs) 29 1 5 2.83 1.14 0.40
Trading Verified or Voluntary Emissions
Reductions (VERs) 29 1 5 2.62 1.12 0.43
Other 3 5 5 3.33 2.89 0.87
Other 1 5 5 5.00
The common question with the EU ETS questionnaire about the factors leading to carbon
neutral growth was answered by 25 participants (Table 32). The EU ETS and the carbon
offsetting schemes gathered around 43% and the en route flight efficiency scored 48%.
The replies to this question are quite diverse and there is very low consensus among the
participants. This is proven by the relatively high standard deviation and coefficient of
variation.
Table 32: Factors leading to carbon neutral growth (1st round SES Q)
Descriptive Statistics
N Min Max Mean SD CV
The EU ETS leads to carbon neutral
growth. 25 0 50 17.52 13.94 0.80
Individual carbon offsetting programs
from airlines lead to carbon neutral
growth.
25
0
40 15.12 12.02 0.80
Flexible Use of Airspace (FUA) leads to
carbon neutral growth 25 3 40 12.72 8.39 0.66
Free Route Airspace (FRA) leads to
carbon neutral growth 25
0 50 12.32 10.29 0.84
Wind optimal routes lead to carbon
neutral growth 25
0 40 11.72 8.84 0.75
Direct routes lead to carbon neutral
growth 25
0 40 11.68 9.75 0.83
Individual carbon offsetting
programmes from states lead to carbon
neutral growth.
25
0
30 10.72 9.74 0.91
Other 25 0 35 6.00 11.18 1.86
Other 25 0 45 2.60 9.70 3.73

237
The seventh question about the charging scheme received the following replies:
‘A common charging scheme based on the ideal route and not on the actual
trajectory can be the solution’ (IATA; CAA; EUROCONTROL; CAA)’.
An ANSP added ‘Common FAB unit-rate (or EU wide) with compensation scheme
could be the answer’.
A representative of a government body stated that ‘it depends on the political
strength of the EU to reduce charges’.
An airline’s representative said that ‘There is no such a thing as a “present charging
scheme” because the regulations change every year. The charging scheme which is
currently on the table (cost relative to route in European airspace) will move flights to
routes passing just outside of Europe, extending flight times and increasing CO2
emissions’.
No. For some ANSP's the targets were not very ambitious as their unit rates were
below target so they only raised the unit rates. For some others, the target was
unrealistic. It was very ambitious to set same targets for all but I don't think it works in
practice. Should we allow those FAB's that deliver to take over those FAB's who
don't? (Airline)
Another expert stated that ‘Present charging scheme goal is to return the additional
ANS revenues to the Users. In addition, the ultimate goal is to create single charging
zone within the FABs – with one unit rate per FAB. FAB single unit rate would
ensure equal distribution of flights that are based on operational requirements and
not on cost efficiency requirements as the flights are organized today within the FABs
(some states are more expensive than others within the FAB and thus Users would
rather fly cheaper route than more direct route – while this would have negative
impact on CO2 emission – but this would be more cost effective for the User, even
though they would have higher CO2 emission)’.
It is evident from the above replies that the participants are not happy with the charging
scheme. The current charging scheme is not set realistically, the implementation is lacking
political strength and there are consequences to the environmental performance, since
airlines select routes with cheaper unit rates and the charging scheme is not done based
on the Great Distance Cycle between the city pairs. Therefore, the airlines fly longer routes
to pay less for ANS, consuming more fuel and having higher emissions.
The last and eighth question was the same as the EU ETS questionnaire. As illustrated in
Figure 31 Figure 31: Connection between SES (FABs) and EU ETS (1st round of SES

238
Q)the 33% of the participants believe that there is a connection between SES (FABs) and
EU ETS and the 33% believes that there is not. The 1/3 of the participants did not reply to
the question.
Figure 31: Connection between SES (FABs) and EU ETS (1st round of SES Q)
7.2 Second round of Delphi Method
The second round is the final round of the Delphi Method. In this round two additional
questions were added to the SES and the EU ETS questionnaires based on the 5th
chapter of the literature review and as explained in the methodology chapter. In the EU
ETS two questions from the first round was removed. The one question that was removed
is “Please assess the impact of different allowances allocation methods to the aviation
sector”. The participation to this question was very low to extract any credible results.
Hence it was removed. Finally, the 5th question ‘Do you think that there is a connection
between EU ETS and Functional Airspace Blocks (FABs)? If yes, why?’ was also
removed. This question was already answered indirectly by other questions within the
questionnaire. Apart from this, its elimination will counterbalance the introduction of two
other questions. The following questions were added to the EU ETS questionnaire in the
2nd round of Delphi Method:
33%
33% 33% Yes
No
N/A

239
Q5: In the following table, please allocate 100 points over the various factors
associated with transaction costs for policymakers/regulators emerging from the
aviation EU ETS scheme. The most important factor gets the highest number of
points and the least important factor gets the lowest number of points. You are
allowed to allocate points to as many factors as you wish.
Q6: Overall, how important do you consider transactions costs to be for the effective
functioning of the aviation inclusion in the EU ETS scheme? Please mark the box.
As far the SES questionnaire is concerned, two questions were replaced by new. The
questions that were deleted are the ‘Do you think that the present charging scheme is
enough to avoid fragmentation because of intra and inter FAB competition? What do you
propose?’ and ‘Do you think that there is a connection between FABs and Emissions
Trading Scheme (EU ETS)? If yes, why?’. The participation to the first question was very
low and therefore, findings and conclusions could not be drowned from this. The second
question as in the case of EU ETS questionnaire was addressed indirectly by other
statements within the questionnaire. The following questions were added to the SES
questionnaire in the 2nd round of Delphi Method:
Q7. In the following table, please allocate 100 points over the various factors
associated with transaction costs for stakeholders emerging from the environment
KPA in the SES Performance scheme. The most important factor gets the highest
number of points and the least important factor gets the lowest number of points.
You are allowed to allocate points to as many factors as you wish.
Q8. Overall, how important do you consider transactions costs to be for the effective
functioning of the environment KPA in the SES Performance scheme? Please mark
the box.

240
In this section, the findings will be presented using descriptive statistics. Descriptive
statistics describe, show or summarize data in a meaningful way. The tables give
information about the participants’ number, the minimum and the maximum values, the
mean, the standard deviation and the coefficient of variation. Firstly, the finding of the EU
ETS questionnaire are given and the findings of the SES questionnaire.
Moreover, this section will also present the differences of the first and second round of the
Delphi method. The comparison will be made based on the difference of coefficient of
variation between the first round and the second round of the EU ETS and the SES
questionnaires. Moreover, the common questions of the EU ETS and the SES
questionnaires will be analysed in order to identify any commonalities or differences to the
options of the experts. It should be highlighted that the profiles of the experts participating
in the EU ETS questionnaires are more orientated to the airline business whereas the
experts participating to the SES questionnaire are more orientated to the ANSPs business.
As mentioned in the methodology chapter the CV will be used to compare the two rounds
of the Delphi method. A small CV value is an indication that the amount of variation was
small. A large value of the coefficient of variation (CV) for an item in the Delphi survey
(larger than 1) indicates that the responses of the experts are scattered compared to the
mean of the responses for the item. As stated in the methodology chapter the absolute
difference of the coefficient of variation will be used to identify any changed between the
rounds and prove the stability of responses. Should the absolute difference of the CV
(ΔCV) in round 1 (CV_R1) and the CV in round 2 (CV_R2) is small, there is no need to
add an additional round since the participants did not revise their opinions.

241
7.2.1 The EU Emissions Trading Scheme Questionnaire descriptive analysis (2nd
round)
Around 30 experts participated in the second round of the EU ETS questionnaire (Table
33). Most of the respondents do not believe that EU ETS causes competition issues, since
they disagreed with the first three statements. They also do not believe that the route
optimisation is sufficient for achieving carbon neutral growth. One important statement that
had a mean of 4.03 (SD=0.94), i.e. the participants agreed with the statement is that it is
possible to link the EU ETS and the other Emissions Trading schemes and have a global
ETS. Surprisingly, the average for the statement ‘the cap of EU ETS is too generous’ is
2.71 which is a disagreement. Finally, they have a neutral position towards agreement with
mean=3.93 and Standard Deviation=0.8 that the economic dimension of the EU ETS
drives heavy lobbying around allocation of EU ETS allowances. Consensus, as proved by
the low CV, is achieved in this question.
The absolute difference of CV (ΔCV) is calculated by deducting the CV of round 1
(CV_R1) from the CV of round two (CV_R2). The first question of the EU ETS
questionnaire had on average 0.056 ΔCV. The values ranged from 0.00 to 0.13. The
participants gave the exact same value to the additional fuel savings statement. The
statements that the participants slightly revised their opinions in this question were ‘The
cap of EU ETS is too generous’; ‘The EU ETS is source of profit-making incentives
unprecedented in the history of environmental policy’; ‘There are small emissions
reductions relative to ‘business-as-usual’ and this leads to instabilities related to
economics, policies and time frames) in the EU ETS’; ‘Route optimization is sufficient
enough for carbon neutral growth’ and ‘Postponing the auctions can force the prices of
allowances to increase’.

242
Table 33: Q1 Position of participants on EU ETS (2nd round EU ETS Q)
Descriptive Statistics
N Min Max Mean SD CV ΔCV
It is possible to link the EU ETS and the other
Emissions Trading schemes and have a global
ETS.
29 1 5 4.03 0.94 0.23 0.04
The economic dimension of the EU ETS
drives heavy lobbying around allocation of
EU ETS allowances.
29 2 5 3.93 0.80 0.20 0.01
The carbon market’s stability is vulnerable
because of the continuous changes in
legislation.
30 2 5 3.70 0.88 0.24 0.02
Additional fuel savings will also be achieved
owing to better fuel use predictability. 28 1 5 3.68 0.94 0.26 0.00
The EU ETS is causing competition issues to
airlines 30 1 5 3.47 1.20 0.34 0.06
Using biofuels is a promising solution for
carbon offsetting. 28 1 5 3.39 1.23 0.36 0.01
Postponing the auctions can force the prices
of allowances to increase. 28 2 5 3.36 0.78 0.23 0.13
The monitoring, reporting and verification of
emissions in the EU ETS is effective. 30 1 5 3.27 0.91 0.28 0.07
The multi-period nature of allocations (i.e.
banking and borrowing flexibility) drives
dependence both upon post-2012 decisions
and creates risk of perverse incentives
28 1 4 3.25 0.84 0.26 0.01
The EU ETS can result in carbon leakage. 29 2 5 3.24 0.91 0.28 0.03
The EU ETS is vulnerable to frauds, for
instance VAT fraud and ‘phishing’ scams. 29 1 5 3.17 1.10 0.35 0.07
The carbon market stability is vulnerable
because of the low prices of the allowances. 28 1 5 3.11 0.96 0.31 0.05
The creation of carbon as a “financial
instrument” can lead to sufficient carbon
reduction.
29 1 5 3.00 0.93 0.31 0.05
The corresponding large proportion of free
allocation underlies legal stresses and a
scope for distortions.
28 1 4 2.86 0.76 0.26 0.07
The EU ETS is source of profit-making
incentives unprecedented in the history of
environmental policy
30 1 5 2.83 0.99 0.35 0.11

243
Descriptive Statistics
N Min Max Mean SD CV ΔCV
There are small emissions reductions relative
to ‘business-as-usual’ and this leads to
instabilities related to economics, policies
and time frames) in the EU ETS.
29 1 4 2.76 0.58 0.21 0.11
The inclusion of aviation in the EU ETS will
influence negatively the development of
non-European airlines if they are included in
EU ETS.
30 1 5 2.73 1.17 0.43 0.08
The cap of EU ETS is too generous. 30 1 5 2.71 1.07 0.40 0.10
The free allocation of allowances to the
airlines must be stricter. 30 1 5 2.70 1.21 0.45 0.02
The EU ETS will lead the airlines to merge in
order to obtain more emissions allowances. 30 1 5 2.29 1.19 0.52 0.03
Route optimisation is sufficient enough for
carbon neutral growth. 30 1 4 1.77 0.86 0.49 0.11
Most of the 24 participants believe that benchmarking is the ideal method of allowances
allocation (Table 34). The auctioning method had a mean of around 36% and the
grandfathering method gathered 23 points. It should be noted that most of the participants
selected more than two methods of allocations had quite different opinions.
The participants in the second round gave almost the same points as in the first round in
the auctioning method. The ΔCV was 0.05. Moreover, the participants gave less points to
the grandfathering method and more points to the benchmarking method in the second
round. This is also supported by the ΔCV result.
Table 34: Ideal allocation method (2nd round EU ETS Q)
Descriptive Statistics
N Min Max Mean
Std.
Deviation
CV ΔCV
Benchmarking 24 0 80 41.04 24.27 0.59 0.08
Auctioning 24 0 90 36.25 24.10 0.66 0.05
Grandfathering 24 0 75 22.71 22.02 0.97 0.15

244
In the Q1 question of this questionnaire the average reply from the 29 participants to the
statement about the possibility of linking EU ETS with other schemes was 4.03 showing
that they agree that it can happen(Table 35). The Q3 question is related to this and is: ‘Q3.
In order to link the different ETSs (like New Zealand or Shanghai ETS), the following
factors should be applied to the same degree’. Please assess the extent to which you
agree with the following statements (1 stands for strong disagreement, 2 for disagreement,
3 for neutral position, 4 for agreement and 5 for strong agreement). The 26-27 participants
replied that the main factor that needs to be the same is the Monitoring, Reporting and
Verification (MRV) rules for allowances (mean=4.26). They expressed a rather neutral
opinion for the banking provisions, the compliance periods and the stringency of the
targets.
The question about the factor for linking different ETSs had a ΔCV ranging from 0.06 to
0.26. The lowest ΔCV value was noted in the banking provisions factor, whereas the
highest value was in the allocation methods and the compliance periods. The ΔCV
average in this question was equal to 0.20.
Table 35: Factors to be considered for linking different ETSs (2nd round EU ETS Q)
Descriptive Statistics
N Min Max Mean SD CV ΔCV
There are the same Monitoring, Reporting and
Verification (MRV) rules for allowances 27 1 5 4.26 0.90 0.21
0.1
9
There is the same stringency of enforcement 26 2 5 4.19 0.85 0.20
0.2
1
There is the same eligibility of offset credits 26 2 5 4.19 0.80 0.19
0.2
1
There are the same rules governing new
entrants and closures 26 3 5 4.15 0.73 0.18
0.2
2
The same allocation methods are applied 26 2 5 4.12 0.82 0.20
0.2
4
There are the same registries’ rules 27 2 5 4.04 0.81 0.20
0.2
0

245
Descriptive Statistics
N Min Max Mean SD CV ΔCV
There are the same banking provisions 26 2 5 3.65 0.80 0.22
0.0
6
There are the same compliance periods 26 2 5 3.65 0.94 0.26
0.2
6
There is the same stringency of targets 26 2 5 3.88 0.95 0.25
0.2
0
The question about the factors leading to carbon neutral growth was answered by 26-27
experts (Table 36). The operational factors contributing to carbon neutral growth had an
average score of 44% and the EU ETS and carbon offsetting schemes received 32%.
There was one participant that gave 94% to EU ETS and there was no consensus among
the participants. The CV in all the cases was high compared to the other questions.
The average ΔCV was 0.08. The prices of ΔCV ranged from 0 to 0.15. All prices were very
low, which indicates that the participants did not revise their opinions regarding the factors
leading to carbon neutral growth in the second round of the Delphi method.
Table 36: Factors leading to carbon neutral growth (2nd round EU ETS Q)
Descriptive Statistics
N Min Max Mean SD CV ΔCV
The EU ETS leads to carbon
neutral growth. 27 0 94 20.67 25.16 1.22
0.04
Flexible Use of Airspace (FUA)
leads to carbon neutral growth 27 0 50 12.74 10.97 0.86
0.13
Individual carbon offsetting
programs from airlines lead to
carbon neutral growth.
27 0 40 12.11 12.17 1.00
0.00
Free Route Airspace (FRA) leads
to neutral growth carbon 27 0 40 11.07 9.75 0.88
0.15
Wind optimal routes lead to
carbon neutral growth 27 0 45 10.33 10.10 0.98
0.02
Individual carbon offsetting
programmes from states lead to
carbon neutral growth.
27 0 30 9.89 10.09 1.02
0.13

246
Descriptive Statistics
N Min Max Mean SD CV ΔCV
Direct routes lead to carbon
neutral growth 27 0 40 9.85 8.65 0.88
0.12
Other 27 0 60 10.93 17.54 1.61 0.07
Other 27 0 45 2.50 9.51 3.81 0.07
The CV in the second round was smaller than the CV in the first round. Moreover, the
absolute difference of CV between the two rounds reached a small value. Therefore,
stability is reached and no additional round or action is needed.
In the second round of the questionnaires, the element of Transaction cost was
introduced. The participants were asked to share 100 points over the different categories
(identified by the researcher) where the most important factor gets the highest number of
points (Table 37). They were also given the option of adding a category themselves. The
highest score was noted to the Implementation of Emissions Management category,
followed by the Monitoring, Reporting and Verification as well as the application. The
Abatement measures category had the lowest score (mean=6.97%). There was
consensus for the category of ‘Application’ (CV=0.42) and ‘Implementation of Emissions
Management’ (CV=0.49), but there was no agreement on the other categories.
Table 37: Transaction costs categories (2nd round EU ETS Q)
Descriptive Statistics
N Min Max Mean SD CV
Application 26 0 30 14.78 6.24 0.42
Implementation of Emissions
Management 26 0 50 22.66 11.09 0.49
Monitoring 26 0 45 14.01 11.05 0.79
Reporting and verification 26 0 45 16.86 10.28 0.61
Abatement measures 25 0 15 6.97 5.16 0.74
Trade 26 0 25 10.01 7.54 0.75
Strategy 26 0 30 9.40 6.23 0.66
Other 25 0 10 1.40 3.07 2.19

247
Regarding the question about how important the transactions costs are for the effective
functioning of the aviation inclusion in the EU ETS scheme, the 26 participants gave on
average 3,65 which stands for neutral towards important. The important was the prevailing
opinion.
7.2.2 The Single European Sky Questionnaire descriptive analysis (2nd round)
This section is about the responses of the participants in the SES questionnaire in the
second round. Table 38 is about the areas that are benefited by the establishment of
Functional Airspace Blocks. On average 26 participants replied to this question. The
participants kept a neutral towards positive position regarding the FAB improvement areas
that have been identified as the most promising areas according to the degree of the
potential benefit coming from the establishment of FABs. The respondents identified the
Common Operational Procedures, Synergies in ATFCM, Harmonised ATM system and
Reduction of emissions as important FIAs. The Common Flight Inspection has been
identified as unimportant FIA.
The absolute difference of coefficient of variation is used to identify if there are any
changes in the opinions of the experts and groups in the second round of the SES
questionnaire of the Delphi method. The first question about the areas benefitted by FABs
had a very low ΔCV ranging from 0 to 0.07. Hence, stability was achieved.
Table 38: Areas benefitted from the establishment of FABs (2nd round SES Q)
Descriptive Statistics
N Min Max Mean SD CV ΔCV
Harmonised ATM system 26 1 5 4.12 0.95 0.23 0.07
Common Operational
Procedures 26 2 5 4.04 0.77 0.19
0.01
Reduction of emissions 25 2 5 4.04 0.89 0.22 0.02
Airspace consolidation 26 1 5 3.88 0.95 0.25 0.04
Common Routes Network
design 26 1 5 3.81 0.90 0.24
0.03

248
Descriptive Statistics
N Min Max Mean SD CV ΔCV
Communication Data Sharing 26 2 5 3.81 0.75 0.20 0.01
Common Sector Design 26 1 5 3.77 0.95 0.25 0.03
Common Safety Management
System 26 2 5 3.69 0.88 0.24
0.02
Improved cooperation with
Militaries 26 1 5 3.65 1.09 0.30
0.01
Surveillance Data sharing 26 1 5 3.54 0.99 0.28 0.03
Common ATCO Training 26 2 5 3.42 0.81 0.24 0.00
Common R&D 25 2 5 3.20 0.87 0.27 0.04
Common AIS & MET 26 1 5 3.15 1.19 0.38
Common Procurement 26 1 5 3.08 1.02 0.33 0.04
Sharing of navigation aids 26 1 4 3.00 0.85 0.28 0.05
Common Flight Inspection 25 1 5 2.80 0.76 0.27 0.01
Other, 5 3 5 3.60 0.89 0.25 0.04
On average, 27 participants replied the question about SES and the environment in the
second round (Table 39). Most of them agreed that the reorganisation of the European
Sky was necessary and that the airspace had to change. They also agreed that the FABs
are not fully operational. There were extremely small differences compared to the first
round. The ΔCV ranged from 0.01 to 0.11. The maximum ΔCV was for the statement The
airspace before SES did not need to be changed. More experts disagreed with this
statement in the second round.
Table 39: Position of participants on SES and the environment (2nd round SES Q)
Descriptive statistics
N Min Max Mean SD CV ΔCV
The reorganisation of the
European Sky was necessary. 28 1 5 4.21 0.96 0.23 0.05
The European airspace network
today can benefit from a
significant level of dynamism
through the application of the
Flexible Use of Airspace (FUA)
concept.
27 1 5 3.78 0.97 0.26 0.01

249
Descriptive statistics
N Min Max Mean SD CV ΔCV
Due to inherent safety
(minimum separation
requirements between aircraft)
requirements, the level of
“inefficiencies” cannot be
reduced to zero at system level.
28 1 5 3.75 1.00 0.27 0.03
FABs bring routes closer to the
optimum “Great Circle” route
and reduce extended flight
paths.
27 1 5 3.52 0.98 0.28 0.04
Due to capacity (organisation of
traffic flows) requirements, the
level of “inefficiencies” cannot
be reduced to zero at system
level.
28 1 5 3.46 1.17 0.34 0.02
The main environmental KPI
should be the estimated
economic value of CO2
emissions due to route
extension.
27 1 5 2.96 1.22 0.41 0.06
The horizontal component is of
higher economic and
environmental importance than
the vertical component of the
Flight efficiency.
28 1 4 2.54 0.88 0.35 0.02
All FABs are fully operational. 26 1 5 1.92 0.89 0.46 0.08
The airspace before SES did not
need to be changed. 28 1 5 1.79 0.92 0.51 0.11
The third question about the different factors that affect horizontal en route flight efficiency,
was answered by 24 experts (Table 40). The experts suggested that the most important
factors are the airspace structure, the flight planning capabilities and then the user
preferences. The question about the factors affecting horizontal en route flight efficiency
was the question that the experts revised their opinion the most compared to the rest of
the questions. Nevertheless, the ΔCV was quite low. The average ΔCV was 0.19. The

250
price is influenced by the high ΔCV of the factor ‘other’. This factor was an optional
additional factor and many of the experts did add one and it was marked with 0 points.
Therefore, when considering stability and consensus for the replies, it is not taken under
consideration. Stability was achieved in the question
Table 40: Factors affecting horizontal en route flight efficiency (2nd round SES Q)
Descriptive statistics
N Min Max Mean SD CV ΔCV
Route structure and availability
affect horizontal en route flight
efficiency.
24 5 50 27.92 10.52 0.38 0.06
Availability of airspace
(utilisation of civil military
structures) affects horizontal
en route flight efficiency.
24 5 40 17.83 8.51 0.48 0.08
Flight planning capabilities (use
of software, repetitive flight
planning) affect horizontal en
route flight efficiency.
24 5 25 14.67 5.83 0.40 0.11
Tactical ATC routings affect
horizontal en route flight
efficiency.
24 5 20 10.63 4.25 0.40 0.12
User preferences regarding
fuel affect horizontal en route
flight efficiency.
24 0 40 10.38 8.97 0.86 0.13
User preferences regarding
time affect horizontal en route
flight efficiency.
24 0 25 8.58 5.59 0.65 0.13
Special events such as ATC
strikes affect horizontal en
route flight efficiency.
24 0 20 7.96 5.07 0.64 0.15
Other 24 0 25 1.83 5.47 2.99 0.72
The Civil-Military cooperation is a very important element for the reorganisation of the
airspace. Therefore, the participants were asked to prioritise the factors that affect the use
of the civil/military airspace structures (Free Route Airspace, Flexible use of Airspace) as
seen in Table 41. The factor ‘political issues’ gathered on average 43% and the remaining

251
factors gathered 13-9%. The ΔCV of the Civil Military cooperation was very low, indicating
that stability was achieved. The values ranged from 0.03 to 0.39. As explained above
when the factor ‘other’ has a relative high ΔCV, it is not taken under consideration when
examining if stability is achieved.
Table 41: Factors affecting the Civil Military cooperation (2nd round SES Q)
Descriptive Statistics
N Min Max Mean SD
CV ΔCV
Political issues 26 0 100 43.12 27.13 0.63 0.04
Flight planning capabilities
(use of software, repetitive
flight planning)
26 0 35 13.04 9.49 0.73 0.25
Special events 26 0 50 12.85 15.37 1.20 0.03
Existing ICAO ATM procedures 26 0 30 9.12 7.92 0.87 0.11
Aspects related to position
information and radar
vectoring
26 0 30 9.12 7.66 0.84 0.03
Other 26 0 100 12.77 27.10 2.12 0.39
Around 27 participants evaluated the factors according to their contribution to emissions’
reduction and only 3 added a factor (Table 42). The factors that are considered the most
important by the participants are the FUA, the FRA, shortest routes, CDOs and use of eco-
friendly engines. The factors Trading Certified Emissions Reductions (CERs) (mean=2.78),
Trading Verified or Voluntary Emissions Reductions (VERs) (mean=2.54) and EU
Emissions Trading Scheme (mean=2.93) were evaluated as unimportant. As listed in
Table 42, the ΔCV of the opinions about factors contributing to emissions reduction is very
low, proving stability among the Delphi method rounds. The minimum value of ΔCV was 0
and the maximum value was 0.08.

252
Table 42: Factors contributing to emissions’ reduction (2nd round SES Q)
Descriptive Statistics
N Min Max Mean SD CV ΔCV
Shortest feasible routes 27 3 5 4.30 0.67 0.16 0.05
Flexible Use of Airspace 28 2 5 4.18 0.72 0.17 0.03
Implementing continuous
descent approaches 28 3 5 4.14 0.71 0.17 0.00
Use of Eco-friendly engines 28 1 5 4.14 0.89 0.22 0.01
Free Route Airspace 27 2 5 4.11 0.70 0.17 0.03
Single European Sky 28 1 5 3.82 0.94 0.25 0.05
Improving load factors 28 2 5 3.68 0.77 0.21 0.01
Use of Bio fuels 28 1 5 3.57 1.14 0.32 0.01
Reduced traffic because of
economic crisis 28 1 5 3.43 1.00 0.29 0.05
Airlines develop offsetting
programs 27 1 5 3.26 1.02 0.31 0.05
EU Emissions Trading Scheme 28 1 5 2.93 0.98 0.33 0.08
Trading Certified Emissions
Reductions (CERs) 27 1 5 2.78 1.01 0.36 0.04
Trading Verified or Voluntary
Emissions Reductions (VERs) 26 1 4 2.54 0.99 0.39 0.04
Other 3 5 5 5.00
Other 1 5 5 5.00
The 24 participants that replied to the question about the factors leading to carbon neutral
growth in the second round of the Delphi method gave points ranging from 0-50 (Table
43). The en-route flight efficiency factors gathered 47.21% and the EU ETS 17.5%,
airlines’ carbon offsetting schemes 15.67% and states’ carbon offsetting schemes
gathered 10.08%. The difference on replies from the first round of the Delphi method are
minor. The ΔCV took prices ranging from 0 to 0.13. The average ΔCV was 0.042.
Consensus and stability was achieved in this question too.

253
Table 43: Factors leading to carbon neutral growth (2nd round SES Q)
Descriptive Statistics
N Min Max Mean SD CV ΔCV
The EU ETS leads to carbon
neutral growth. 24 0 40 17.50 11.59 0.66 0.04
Individual carbon offsetting
programs from airlines lead to
carbon neutral growth.
24 0 40 15.67 10.48 0.67 0.00
Free Route Airspace (FRA)
leads to carbon neutral growth 24 0 50 12.58 9.94 0.79 0.01
Wind optimal routes lead to
carbon neutral growth 24 0 40 12.17 8.13 0.67 0.04
Flexible Use of Airspace (FUA)
leads to carbon neutral growth 24 0 20 11.54 4.90 0.42 0.13
Direct routes lead to carbon
neutral growth 24 0 30 10.92 6.80 0.62 0.03
Individual carbon offsetting
programmes from states lead
to carbon neutral growth.
24 0 25 10.08 7.47 0.74 0.02
Other 24 0 30 5.50 9.13
Other 24 0 37 2.38 8.43
In the second round of the questionnaires, the element of Transaction cost was introduced
(Table 44). The participants were asked to share 100 points over the different categories
(identified by the researcher) where the most important factor gets the highest number of
points. They were also given the option of adding a category themselves. On average 24
participants replied to this question. The category Development and Implementation of the
regulatory scheme received 27%, the Monitoring 18%, the strategy received around 17.5%
followed by the Reporting and verification (13%), the Alternative Policies (12%) and the
Compliance category (9.5%). Less than 5 participants gave 5-15% to an additional
category.

254
Table 44: Transaction costs categories (2nd round SES Q)
Descriptive Statistics
N Min Max Mean SD CV
Development and Implementation of
the regulatory scheme 24 10 45 27.15 9.46 0.35
Monitoring 24 10 45 18.07 10.02 0.55
Strategy 24 5 60 17.69 11.09 0.63
Reporting and verification 24 10 35 13.19 5.90 0.45
Alternative Policies 24 0 20 12.15 5.55 0.46
Compliance 23 0 17 9.20 4.29 0.47
Other 25 0 15 1.80 4.05 2.25
The mean for the question ‘Overall, how important do you consider transactions costs to
be for the effective functioning of the environment KPA in the SES Performance scheme’
is 3.83 (standard deviation=0.64 and Coefficient of Variation=0.17). The minimum score
was 3, i.e. neutral importance and the maximum was 5. The 24 participants either kept a
neutral position or marked transaction costs as important for the effectiveness of
environment KPA.
7.2.3 Comparison of the common questions of SES and EU ETS Questionnaires
The questionnaires of SES and EU ETS are connected. Apart from the two common
questions, i.e. the question about the about factors leading to carbon neutral growth and
the question if they believe that there is a connection between SES (FABs) and Emissions
Trading Scheme (EU ETS), there were some common elements that were researched.
The SES questionnaire participants were asked about the biofuels use, the carbon
offsetting schemes developed by airlines and the EU ETS. The EU ETS questionnaire
participants were asked also about the biofuels use, and operational measures like the
route optimisation and fuel predictability. 17 out of 29 experts in the EU ETS questionnaire
had a positive opinion about the contribution of biofuels to the improvement of
environmental performance and 7 had a negative opinion. The situation is the same at the

255
SES questionnaire where 16 out of the 28 experts expressed a positive opinion and only 4
expressed a negative opinion.
As far as the common question is concerned, Table 45 presents the average points the
participants of the EU ETS and SES 2nd round questionnaire gave to the factors
contributing to carbon neutral growth and the difference of mean. The difference in the
mean is very low. Consequently, it can be assumed that consensus was reached among
the experts in both questionnaires. As expected the EU ETS questionnaire shared more
points to the EU ETS reform and less points to flight efficiency. Moreover, the experts in
the first case shared more points to additional factors like the biofuel use and the fleet
renewal.
Table 45: Differences of EU ETS and SES questionnaire participants of opinions about the factors leading to carbon neutral growth
Factors EU ETS Q
All Experts’ position SES Q
All Experts’ position Difference of EU ETS – SES Mean
Mean(a) SD Mean(b) SD ΔMean (a-b)
The EU ETS leads to carbon
neutral growth. 20.26 25.16 17.50 11.59 2.76
Individual carbon offsetting
programs from airlines lead to
carbon neutral growth.
12.11 12.17 15.67 10.48 -3.56
Individual carbon offsetting
programmes from states lead to
carbon neutral growth.
9.89 10.09 10.08 7.47 0.19
Direct routes lead to carbon
neutral growth 9.85 8.65 10.92 6.80 -1.07
Wind optimal routes lead to
carbon neutral growth 10.33 10.10 12.17 8.13 -1.84
Flexible Use of Airspace (FUA)
leads to carbon neutral growth 12.74 10.97 11.54 4.90 1.2
Free Route Airspace (FRA) leads
to carbon neutral growth 11.07 9.75 12.58 9.94 -1.51
Other 10.93 17.54 5.50 9.13 5.43
Other 2.50 9.51 2.38 8.43 0.12

256
The common question if they believe that there is a connection between SES (FABs) and
Emissions Trading Scheme (EU ETS) the 45% of the EU ETS questionnaire participants in
the first round replied that there is a connection, while only the 33% of the SES
questionnaire participants replied yes. The 16% of the EU ETS questionnaire participants
kept a negative position as well as the 1/3 of the SES questionnaire experts. Despite those
replies, as proven in Table 45, the EU ETS and SES are connected through their
contribution to emissions reduction. The aim of EU ETS is to reduce the emissions where
as one of the targets of SES is also the environmental efficiency.
7.2.4 Cross Tabulation of SES and EU ETS questionnaires (2nd round)
Cross-tabulation analysis, also known as contingency table analysis, will be used to
analyse the categorical data. The importance of the Delphi method was to identify the
existence or lack of consensus among the groups and within the groups regarding the
reform occurring from the inclusion of aviation in EU ETS and the implementation of SES.
It was decided to illustrate the cross tabulation of the second round only since this round is
more important in terms of findings and conclusions. The findings should rely on a
stabilised environment where the participants are less possible to change their opinion.
Therefore, cross tabulation is applied only to the second round.
On the left side of the table are the statements/parameters, the second column are the
scales and then the different categories of the respondents are given. The categories are
Airlines, ANSPs, CAA/NSA, individual experts, governmental bodies (like PRB, Ministries
and EUROCONTROL) and IATA. The number of the respondents is given in brackets. It
should be noted that only European airlines participated in the survey.
7.2.4.1 Cross tabulation of EU ETS questionnaire (2nd round)
Table 46 lists all the 21 statements/positions that the different stakeholders were asked
about. The first element that was evaluated is the effects of EU ETS to competition. It is

257
interesting to see the differences in the replies of the different stakeholders. The 83% of
the EU airlines that participated in the Delphi method believe that if EU ETS decided to
extent the scope and include all the airlines, i.e. if the stop the clock decision is not
renewed, those airlines will not be influenced negatively. On the other hand, IATA (84%)
that represent the interests of many airlines across the world, believes that those non-EU
airlines will be negatively affected. Moreover, almost all the participants believe that
airlines will not be ‘forced’ to merge so as to get more allowances. Despite that, many of
the participants believe that EU ETS is causing competition issues to airlines.
The seventh statement in Table 46 refers to the supply of allowances. Airlines, ANSPs,
IATA and some experts believe that the amount of allowances that was given was fair. The
60% of the Government Bodies, the 40% of CAA/NSAs and the 29% of individual experts
believe that the cap of EU ETS is too generous. The gap between the regulator and the
airlines is quite evident in this statement. When the participants were asked about making
the free allocation of allowances stricter (statement 11), the airline representatives (83%)
and IATA (67%) commented that the allocation shouldn’t be stricter, whereas all the
ANSPs, the 40% of CAA/NSAs, the 29% of individual experts and surprisingly the 17% of
IATA experts suggested stricter allocations. The government bodies’ representatives kept
a neutral position.
Moreover, the 20th statement ‘The corresponding large proportion of free allocation
underlies legal stresses and a scope for distortions’ was not commented by the
government bodies, whereas almost all the remaining respondents disagreed with the
statement. This leads to the conclusion that the allocation method of the free allowances
was not a result of strong lobbying and is not associated with distortions (distortions are
associated with grandfathering of allowances). The replies of the participants regarding the
lobbying around the allocation of allowance had an average value of 4, i.e. agreed that the

258
economic dimension of EU ETS drives heavy lobbying. This finding is broadly consistent
with the general expectations. 80% of the government bodies, 83% of IATA experts, 50%
of ANSPs, 50% of CAAs, 83% of individual experts and 66% of airlines agreed with the
statement. Surprisingly, 17% of airlines disagreed with the statement.
The element of globalisation of the reform was accessed through statement number 4 in
Table 46. Only the 10% of the participants (i.e. 3 airline representatives) argued that
linking the EU ETS with other ETSs around the world and creating a global scheme is not
possible. The remaining 67% of airlines, 50% of the ANSPs, 100% of the CAAs, 72% of
experts, the 50% of the government bodies and all the IATA experts participating in the
survey believe that it is possible to link the ETS and create a global scheme10. The
parameters that need to be taken under consideration are accessed in Table 35.
There is overwhelming evidence corroborating the issues that EU ETS is facing.
Regarding the MRV effectiveness, the participants kept a quite neutral to positive position.
The majority of the participants indicated that the continuous changes in the legislation (for
instance the stop the clock in the first year of EU ETS and the CORSIA in less than 5
years from the enforcement of EU ETS) make the carbon market less stable. 40% of
government bodies disagreed with the above statement, but surprisingly 20% of them
agreed.
The individuals regardless of their group, had diverse opinions regarding the vulnerability
of EU ETS to frauds. The minimum value they gave was 2 and the maximum was 5. 1/5 of
the experts from governmental bodies disagreed with the statement and 2/5 agreed with
the statement. The same findings were noted for the 9th statement too. 50% of the
10 It should be noted that the EU ETS is incorporated in the ICAO Basket of Measures, but is not necessarily taken into
consideration by ICAO CORSIA (see 3.9.1 section).

259
governmental bodies, 50% of IATA experts, 33% of airlines representatives and 67% of
independent experts agreed that the carbon market stability is vulnerable due to low prices
of the allowances. The majority of the participants agreed that postponing the auctions can
force the prices of allowances to increase. 17% of airlines and 33% of IATA experts
disagreed with that statement.
In the literature, several concerns were expressed about the carbon leakage. 50% of
governmental bodies, 29% of individual experts and 17% of airlines believe that EU ETS
can result to carbon leakage. However, the opposite opinion is supported by 33% of
airlines, 50% of CAAs, 17% of IATA experts and 43% of experts. None of the
representatives of government bodies believes that EU ETS can result in carbon leakage.
There are quotas for receiving emissions from the flexible mechanism of Kyoto. The 21st
statement in Table 46 received diverse opinions. There are some participants, regardless
of their group that believe that the multi-period nature of allocations (i.e. banking and
borrowing flexibility) drives dependence both upon post-2012 decisions and creates risk of
perverse incentives, and others that do not.
In this question, various approaches to environmental problems were investigated. The
participants were given statements about operational changes that may lead to carbon
neutral growth. The use of biofuels is an issue that is more familiar to the airlines, IATA
experts, individual experts and government bodies. All of those stakeholders though share
a different opinion in this matter. The airlines are divided. 50% believes that the use of
biofuels is a promising solution for carbon offsetting and the other half do not. This is
related to the culture of the airline and the strategy of using biofuels or not is related with
the availability. The northern European airlines like SAS and central Europe airlines with
extended network like Lufthansa have invested in biofuels and have access to. Therefore,
it is hypothesized that those airlines are more familiar with its use and are strong

260
supporters of biofuels and others are not. 57% of the experts support the statement and
the remaining 43% keep a neutral position. The 75% of the government bodies agreed
with the statement.
Apart from biofuels use, the additional fuel savings will also be achieved owing to better
fuel use predictability according to the participants. 83% of airlines, 100% of ANSPs, 75%
of CAAs, 71% of individual experts and 50% of IATA experts agreed with the statement.
67% of government bodies disagreed. The airlines and the ANSPs are more familiar with
route structures and excess fuel’s contribution to fuel consumption. Therefore, their
opinion is much more important in this statement.
An important finding is the fact that the participants have diverse opinions whether the
carbon markets can lead to sufficient carbon reductions. In addition, the participants do not
believe that route optimisation is sufficient for carbon neutral growth. It is important that
50% of ANSPs, 100% of airlines and IATA experts as well as 80% of government bodies
supported this statement (Table 46). This means that neither SES nor EU ETS are
sufficient to lead to carbon neutral growth and needs complementary policies.
Table 46: Crosstab Groups positions on EU ETS
Statement Scale 1-5
Airlines (n=6)
ANSPs (n=2)
CAA/NSA (n=4)
Ind. Experts
(n=7)
Government Bodies (n=5)
IATA (n=6)
1. The inclusion of aviation in the EU ETS will influence negatively the development of non-European airlines if they are included in EU ETS.
1 50% 0% 0% 29% 0% 17%
2 33% 50% 0% 14% 40% 0%
3 17% 50% 100% 29% 20% 0%
4 0% 0% 0% 29% 40% 67%
5 0% 0% 0% 0% 0% 17%
Statement Scale 1-5
Airlines (n=6)
ANSPs (n=2)
CAA/NSA (n=5)
Ind. Experts
(n=7)
Government Bodies (n=5)
IATA (n=6)
2. The EU ETS will lead the airlines to merge in order to obtain more emissions allowances.
1 67% 50% 20% 29% 40% 0%
2 17% 0% 20% 14% 20% 83%
3 0% 0% 40% 43% 20% 0%
4 0% 50% 20% 14% 20% 17%
5 17% 0% 0% 0% 0% 0%

261
Statement Scale 1-5
Airlines (n=6)
ANSPs (n=2)
CAA/NSA (n=4)
Ind. Experts
(n=7)
Government Bodies (n=5)
IATA (n=6)
3. The EU ETS is causing competition issues to airlines
1 17% 0% 0% 14% 20% 0%
2 0% 0% 25% 0% 0% 33%
3 17% 0% 25% 29% 20% 17%
4 33% 100% 50% 43% 40% 33%
5 33% 0% 0% 14% 20% 17%
Statement Scale 1-5
Airlines (n=6)
ANSPs (n=2)
CAA/NSA (n=4)
Ind. Experts
(n=7)
Government Bodies (n=4)
IATA (n=6)
4. It is possible to link the EU ETS and the other Emissions Trading schemes and have a global ETS.
1 17% 0% 0% 0% 0% 0%
2 0% 0% 0% 0% 0% 0%
3 17% 50% 0% 29% 50% 0%
4 50% 0% 100% 43% 0% 33%
5 17% 50% 0% 29% 50% 67%
Statement Scale 1-5
Airlines (n=6)
ANSPs (n=2)
CAA/NSA (n=4)
Ind. Experts
(n=7)
Government Bodies (n=5)
IATA (n=6)
5. The monitoring, reporting and verification of emissions in the EU ETS is effective.
1 0% 0% 0% 0% 0% 17%
2 17% 0% 0% 14% 0% 33%
3 50% 100% 25% 29% 60% 33%
4 17% 0% 75% 57% 20% 17%
5 17% 0% 0% 0% 20% 0%
Statement Scale 1-5
Airlines (n=6)
ANSPs (n=2)
CAA/NSA (n=4)
Ind. Experts
(n=7)
Government Bodies (n=5)
IATA (n=6)
6. The EU ETS is vulnerable to frauds, for instance VAT fraud and ‘phishing’ scams.
1 0% 0% 50% 0% 0% 0%
2 33% 0% 0% 17% 20% 17%
3 50% 50% 25% 33% 40% 50%
4 0% 0% 25% 17% 40% 33%
5 17% 50% 0% 33% 0% 0%
Statement Scale 1-5
Airlines (n=6)
ANSPs (n=2)
CAA/NSA (n=4)
Ind. Experts
(n=7)
Government Bodies (n=5)
IATA (n=6)
7. The cap of EU ETS is too generous.
1 17% 0% 0% 14% 0% 17%
2 50% 100% 0% 43% 20% 59%
3 33% 0% 60% 14% 20% 33%
4 0% 0% 40% 0% 60% 0%
5 0% 0% 0% 29% 0% 0%
Statement Scale 1-5
Airlines (n=6)
ANSPs (n=2)
CAA/NSA (n=4)
Ind. Experts
(n=7)
Government Bodies (n=5)
IATA (n=6)
8. The carbon market’s stability is vulnerable because of the continuous changes in legislation.
1 0% 0% 0% 0% 0% 0%
2 17% 0% 0% 0% 40% 0%
3 17% 100% 0% 43% 40% 0%
4 50% 0% 100% 29% 20% 67%
5 17% 0% 0% 29% 0% 33%

262
Statement Scale 1-5
Airlines (n=6)
ANSPs (n=2)
CAA/NSA (n=3)
Ind. Experts
(n=7)
Government Bodies (n=4)
IATA (n=6)
9. The carbon market stability is vulnerable because of the low prices of the allowances.
1 0% 0% 0% 14% 25% 0%
2 17% 0% 33% 0% 0% 33%
3 50% 100% 0% 71% 25% 17%
4 33% 0% 67% 14% 25% 50%
5 0% 0% 0% 0% 25% 0%
Statement Scale 1-5
Airlines (n=6)
ANSPs (n=2)
CAA/NSA (n=3)
Ind. Experts
(n=7)
Government Bodies (n=4)
IATA (n=6)
10. Postponing the auctions can force the prices of allowances to increase.
1 0% 0% 0% 0% 0% 0%
2 17% 0% 0% 0% 0% 33%
3 33% 50% 33% 57% 75% 50%
4 33% 50% 67% 29% 25% 17%
5 17% 0% 0% 14% 0% 0%
Statement Scale 1-5
Airlines (n=6)
ANSPs (n=2)
CAA/NSA (n=5)
Ind. Experts
(n=7)
Government Bodies (n=4)
IATA (n=6)
11. The free allocation of allowances to the airlines must be stricter.
1 50% 0% 0% 14% 0% 50%
2 33% 0% 0% 14% 0% 17%
3 17% 0% 60% 43% 100% 17%
4 0% 100% 40% 0% 0% 17%
5 0% 0% 0% 29% 0% 0%
Statement Scale 1-5
Airlines (n=6)
ANSPs (n=2)
CAA/NSA (n=3)
Ind. Experts
(n=7)
Government Bodies (n=4)
IATA (n=6)
12. Using biofuels is a promising solution for carbon offsetting.
1 17% 0% 0% 0% 25% 17%
2 33% 50% 0% 0% 0% 17%
3 0% 0% 0% 43% 0% 17%
4 33% 50% 100% 57% 75% 0%
5 17% 0% 0% 0% 0% 50%
Statement Scale 1-5
Airlines (n=6)
ANSPs (n=2)
CAA/NSA (n=3)
Ind. Experts
(n=7)
Government Bodies (n=5)
IATA (n=6)
13. The creation of carbon as a “financial instrument” can lead to sufficient carbon reduction.
1 17% 0% 0% 0% 0% 17%
2 17% 0% 0% 43% 20% 0%
3 17% 50% 33% 43% 80% 67%
4 33% 50% 67% 14% 0% 17%
5 17% 0% 0% 0% 0% 0%
Statement Scale 1-5
Airlines (n=6)
ANSPs (n=2)
CAA/NSA (n=3)
Ind. Experts
(n=7)
Government Bodies (n=5)
IATA (n=6)
14. Additional fuel savings will also be achieved owing to better fuel use predictability.
1 17% 0% 0% 0% 0% 0%
2 0% 0% 0% 14% 67% 17%
3 0% 0% 25% 14% 33% 33%
4 50% 50% 75% 57% 0% 50%
5 33% 50% 0% 14% 0% 0%

263
Statement Scale 1-5
Airlines (n=6)
ANSPs (n=2)
CAA/NSA (n=3)
Ind. Experts
(n=7)
Government Bodies (n=5)
IATA (n=6)
15. Route optimisation is sufficient enough for carbon neutral growth.
1 67% 50% 0% 43% 60% 50%
2 33% 0% 25% 43% 20% 50%
3 0% 50% 50% 14% 20% 0%
4 0% 0% 25% 0% 0% 0%
5 0% 0% 0% 0% 0% 0%
Statement Scale 1-5
Airlines (n=6)
ANSPs (n=2)
CAA/NSA (n=4)
Ind. Experts
(n=7)
Government Bodies (n=4)
IATA (n=6)
16. The EU ETS can result in carbon leakage.
1 0% 0% 0% 0% 0% 0%
2 17% 0% 0% 29% 50% 0%
3 50% 100% 50% 29% 50% 83%
4 0% 0% 50% 29% 0% 0%
5 33% 0% 0% 14% 0% 17%
Statement Scale 1-5
Airlines (n=6)
ANSPs (n=2)
CAA/NSA (n=4)
Ind. Experts
(n=6)
Government Bodies (n=5)
IATA (n=6)
17. The economic dimension of the EU ETS drives heavy lobbying around allocation of EU ETS allowances.
1 0% 0% 0% 0% 0% 0%
2 17% 0% 0% 0% 0% 0%
3 17% 50% 50% 17% 20% 17%
4 33% 0% 50% 50% 80% 50%
5 33% 50% 0% 33% 0% 33%
Statement Scale 1-5
Airlines (n=6)
ANSPs (n=2)
CAA/NSA (n=5)
Ind. Experts
(n=6)
Government Bodies (n=5)
IATA (n=6)
18. The EU ETS is source of profit-making incentives unprecedented in the history of environmental policy
1 0% 0% 20% 17% 0% 17%
2 17% 0% 0% 33% 40% 17%
3 83% 50% 40% 33% 60% 50%
4 0% 50% 20% 17% 0% 0%
5 0% 0% 20% 0% 0% 17%
Statement Scale 1-5
Airlines (n=6)
ANSPs (n=2)
CAA/NSA (n=4)
Ind. Experts
(n=7)
Government Bodies (n=4)
IATA (n=6)
19. There are small emissions reductions relative to ‘business-as-usual’ and this leads to instabilities related to economics, policies and time frames) in the EU ETS.
1 0% 0% 25% 0% 0% 0%
2 17% 0% 0% 43% 0% 33%
3 83% 100% 75% 43% 100% 67%
4 0% 0% 0% 14% 0% 0%
5 0% 0% 0% 0% 0% 0%
Statement Scale 1-5
Airlines (n=6)
ANSPs (n=2)
CAA/NSA (n=4)
Ind. Experts
(n=6)
Government Bodies (n=4)
IATA (n=6)
20. The corresponding large proportion of free allocation underlies legal stresses and a scope for
1 17% 0% 0% 0% 0% 17%
2 17% 50% 25% 17% 0% 0%
3 67% 50% 75% 33% 100% 67%
4 0% 0% 0% 50% 0% 17%

264
distortions. 5 0% 0% 0% 0% 0% 0%
Statement Scale 1-5
Airlines (n=6)
ANSPs (n=2)
CAA/NSA (n=3)
Ind. Experts
(n=7)
Government Bodies (n=5)
IATA (n=6)
21. The multi-period nature of allocations (i.e. banking and borrowing flexibility) drives dependence both upon post-2012 decisions and creates risk of perverse incentives
1 17% 0% 0% 0% 0% 0%
2 17% 0% 0% 17% 25% 17%
3 17% 0% 100% 17% 50% 33%
4 50% 100% 0% 67% 25% 50%
5 0% 0% 0% 0% 0% 0%
The method of allocation for allowances is of critical importance. There are three methods,
benchmarking, grandfathering and auctioning. According to Table 47 the least preferred
method for the airlines is the auctioning (max points=25%) and the most favourite is the
benchmarking (max points=80%). The CAA/NSA showed almost equal preference for
auctioning and benchmarking. The individual experts shared the least point to the
grandfathering method and showed a preference for auctioning (max points=90%) and
benchmarking (max points=60%).
The government bodies representatives deemed auctioning as a better method for
allowances allocation. 60% of government representatives gave 0-10% to grandfathering
and 80% gave less than 30 points (out of 100 points) to benchmarking, whereas 40% of
government representatives gave 80-90 point to auctioning. The remaining 60% of
government representatives with respect to auctioning gave less than 30 points. Despite
that the policy makers believe that auctioning is a more appropriate method for allocation
of emissions, the EU ETS for aviation is based on grandfathering. Both under
grandfathering and benchmarking, allowances are allocated free of charge. The auctioning
of allowances in aviation is quite limited. One element that is extremely interesting is that
in the statement 17 of Table 46, 80% of government representatives supported that the
economic dimension of EU ETS drives heavy lobbying around allocation of EU ETS
allowances and in this section, they claim that auctioning is a better method for allocating
allowances. The regulators though supports the grandfathering and benchmarking. A

265
logical speculation would be that the heavy lobbying affected the regulation. For
consistency purposes, the reported results are groups in scale increments of 10 points (i.e.
0-9, 10-19, etc.).
Table 47: Crosstab Groups points on allocation methods
Method Scale 1-100
Airlines (n=4)
ANSPs (n=2)
CAA/NSA (n=3)
Experts (n=4)
Government (n=5)
IATA (n=6)
Grandfathering
0-9 0% 0% 67% 50% 40% 0%
10-19 25% 0% 0% 25% 20% 33%
20-29 50% 50% 0% 0% 0% 17%
30-39 25% 0% 33% 0% 0% 17%
40-49 0% 0% 0% 25% 20% 0%
50-59 0% 50% 0% 0% 0% 17%
60-69 0% 0% 0% 0% 0% 0%
70-79 0% 0% 0% 0% 20% 17%
80-89 0% 0% 0% 0% 0% 0%
90-100 0% 0% 0% 0% 0% 0%
Benchmarking
0-9 0% 0% 0% 0% 0% 17%
10-19 0% 0% 0% 25% 60% 17%
20-29 0% 0% 0% 0% 0% 0%
30-39 0% 100% 33% 0% 20% 17%
40-49 25% 0% 0% 25% 0% 0%
50-59 0% 0% 33% 25% 0% 33%
60-69 25% 0% 33% 25% 0% 0%
70-79 0% 0% 0% 0% 20% 0%
80-89 50% 0% 0% 0% 0% 17%
90-100 0% 0% 0% 0% 0% 0%
Auctioning
0-9 25% 0% 0% 0% 0% 0%
10-19 25% 50% 0% 0% 20% 33%
20-29 50% 0% 0% 25% 0% 0%
30-39 0% 0% 0% 25% 40% 17%
40-49 0% 0% 67% 0% 0% 33%
50-59 0% 50% 33% 25% 0% 17%
60-69 0% 0% 0% 0% 0% 0%
70-79 0% 0% 0% 0% 0% 0%
80-89 0% 0% 0% 0% 20% 0%
90-100 0% 0% 0% 25% 20% 0%
The element of global measures for the climate change was addressed with the question
about linking the different ETSs (Table 48). Overall, the participants agreed with all the
statements and have consensus for all the statements apart the statement for the

266
stringency of targets. 17% of airlines, 50% of ANSPs and 25% of CAAs disagreed with the
statement that in order to link the different ETS around the world with the EU ETS the
same stringency of targets should be granted. The ANSPs opinion is not that important in
this question and the airlines most probably had the benchmarking in mind and mainly the
differences among the airlines in terms of readiness. None of the participants added an
additional factor to the list created by the researcher.
Table 48: Crosstab Groups opinion on factors to be considered for linking different ETSs
Factors Scale 1-5
Airlines (n=6)
ANSPs (n=2)
CAA/NSA (n=4)
Experts (n=5)
Government (n=4)
IATA (n=6)
There are the same Monitoring, Reporting and Verification (MRV) rules for allowances
1 0% 0% 0% 0% 0% 0%
2 0% 50% 0% 0% 0% 0%
3 17% 0% 25% 0% 0% 0%
4 17% 50% 50% 80% 50% 33%
5 67% 0% 25% 20% 50% 67%
Factors Scale 1-5
Airlines (n=6)
ANSPs (n=2)
CAA/NSA (n=4)
Experts (n=5)
Government (n=3)
IATA (n=6)
There are the same banking provisions
1 0% 0% 0% 0% 0% 0%
2 0% 50% 0% 0% 0% 0%
3 83% 0% 50% 40% 33% 17%
4 0% 50% 50% 40% 67% 50%
5 17% 0% 0% 20% 0% 33%
Factors Scale 1-5
Airlines (n=6)
ANSPs (n=2)
CAA/NSA (n=4)
Experts (n=5)
Government (n=4)
IATA (n=6)
There are the same registries’ rules
1 0% 0% 0% 0% 0% 0%
2 17% 50% 0% 0% 0% 0%
3 17% 0% 25% 0% 0% 0%
4 33% 50% 75% 80% 75% 50%
5 33% 0% 0% 20% 25% 50%
Factors Scale 1-5
Airlines (n=6)
ANSPs (n=2)
CAA/NSA (n=4)
Experts (n=5)
Government (n=3)
IATA (n=6)
There are the same rules governing new entrants and closures
1 0% 0% 0% 0% 0% 0%
2 0% 0% 0% 0% 0% 0%
3 33% 0% 25% 40% 0% 0%
4 17% 100% 50% 40% 33% 67%
5 50% 0% 25% 20% 67% 33%
Factors Scale 1-5
Airlines (n=6)
ANSPs (n=2)
CAA/NSA (n=4)
Experts (n=5)
Government (n=3)
IATA (n=6)
The same allocation methods are applied
1 0% 0% 0% 0% 0% 0%
2 17% 50% 0% 0% 0% 0%
3 0% 0% 25% 0% 0% 0%
4 33% 50% 50% 80% 67% 67%

267
Factors Scale 1-5
Airlines (n=6)
ANSPs (n=2)
CAA/NSA (n=4)
Experts (n=5)
Government (n=4)
IATA (n=6)
5 50% 0% 25% 20% 33% 33%
Factors Scale 1-5
Airlines (n=6)
ANSPs (n=2)
CAA/NSA (n=4)
Experts (n=5)
Government (n=3)
IATA (n=6)
There is the same stringency of targets
1 0% 0% 0% 0% 0% 0%
2 17% 50% 25% 0% 0% 0%
3 17% 50% 0% 40% 0% 0%
4 33% 0% 75% 40% 33% 67%
5 33% 0% 0% 20% 67% 33%
Factors Scale 1-5
Airlines (n=6)
ANSPs (n=2)
CAA/NSA (n=4)
Experts (n=5)
Government (n=3)
IATA (n=6)
There is the same stringency of enforcement
1 0% 0% 0% 0% 0% 0%
2 17% 50% 0% 0% 0% 0%
3 0% 0% 0% 20% 0% 0%
4 33% 50% 75% 60% 33% 50%
5 50% 0% 25% 20% 67% 50%
Factors Scale 1-5
Airlines (n=6)
ANSPs (n=2)
CAA/NSA (n=4)
Experts (n=5)
Government (n=4)
IATA (n=6)
There is the same eligibility of offset credits
1 0% 0% 0% 0% 0% 0%
2 17% 0% 0% 0% 0% 0%
3 0% 50% 0% 20% 25% 0%
4 17% 50% 33% 60% 75% 50%
5 67% 0% 67% 20% 0% 50%
The 87% of the Delphi method participants replied to the question about the factors
leading to carbon neutral growth (Table 49). The factor that contributes the least to carbon
neutral growth is the individual carbon offsetting programmes from states. The maximum
point this factor gathered was 30 points. The second least effective factor is individual
carbon offsetting programmes implemented by airlines. Only 17% of airlines
representatives gave to this factor more than 20 points. Surprisingly, 50% of individual
experts gave more points than the airlines representatives. 25% of government bodies
shared 40 points out of 100 to the individual carbon offsetting programmes from airlines.
As depicted in Table 49, 83% of airlines, 100% of ANSPs, 33% of CAAs, 68% of individual
experts, 75% of government bodies and 83% of IATA experts shared less than 20 points
to EU ETS. This factor did not reach the level of consensus of the other factors. There
were 2 participants (individual expert and expert from government body) that gave more

268
than 90 points to this factor and 3 participants (one expert from an airline, one CAA and
one IATA expert) that gave 40-50/100 points. On average, the EU ETS gathered 21/100
points, the airlines’ carbon offsetting schemes 12/100 points and the states’ carbon
offsetting schemes 10/100 points. Despite those findings, the policy makers give more
emphasis to those solutions than the operational improvements. The operational
improvements focus on the horizontal en-route efficiency. The researcher based on
literature review and with the help of participants observation held at EUROCONTROL
identified some factors contributing to flight efficiency. Those factors are: a) the direct
routes; b) wind optimal routes; c) Flexible Use of Airspace (FUA); and d) Free Route
Airspace (FRA).
The horizontal en-route flight efficiency gathered 45 out of 100 points. The ANSPs gave
most of the points to FRA and FUA that contribute to direct routes and the least points to
wind optimal routes. It should be noted that the ANSPs are responsible for their areas,
where the wind optimal routes are not that important due to the short distance covered and
the geography. The jet stream is mostly used for transatlantic routes. The airlines that
have a network outside Europe and IATA gave more points to this factor. The airlines,
IATA some individual experts and Government bodies added as a factor the technological
changes to the airplanes and the use of alternative fuels. Those factors gathered on
average 14 out of 100 points.
Table 49: Crosstab Groups and factors leading to carbon neutral growth
Statement Scale 0-100
Airlines (n=6)
ANSPs (n=2)
CAA/NSA (n=3)
Ind. Experts
(n=6)
Government Bodies (n=4)
IATA (n=6)
The EU ETS leads to carbon neutral growth
0-9 33% 100% 0% 50% 0% 33% 10-19 17% 0% 33% 0% 25% 33% 20-29 33% 0% 0% 33% 50% 17% 30-39 0% 0% 33% 0% 0% 0% 40-49 0% 0% 0% 0% 0% 17% 50-59 17% 0% 33% 0% 0% 0% 60-69 0% 0% 0% 0% 0% 0%

269
Statement Scale 0-100
Airlines (n=6)
ANSPs (n=2)
CAA/NSA (n=3)
Ind. Experts
(n=6)
Government Bodies (n=4)
IATA (n=6)
70-79 0% 0% 0% 0% 0% 0% 80-89 0% 0% 0% 0% 0% 0%
90-100 0% 0% 0% 17% 25% 0%
Individual carbon offsetting programs from airlines lead to carbon neutral growth
0-9 50% 100% 33% 17% 50% 50% 10-19 0% 0% 67% 17% 0% 33% 20-29 33% 0% 0% 50% 0% 17% 30-39 0% 0% 0% 17% 0% 0% 40-49 17% 0% 0% 0% 25% 0% 50-59 0% 0% 0% 0% 0% 0% 60-69 0% 0% 0% 0% 0% 0% 70-79 0% 0% 0% 0% 0% 0% 80-89 0% 0% 0% 0% 0% 0%
90-100 0% 0% 0% 0% 0% 0%
Individual carbon offsetting programmes from states lead to carbon neutral growth
0-9 50% 100% 33% 33% 50% 83% 10-19 33 0% 67% 0% 25% 17% 20-29 0% 0% 0% 33% 0% 0% 30-39 17% 0% 0% 33% 0% 0% 40-49 0% 0% 0% 0% 0% 0% 50-59 0% 0% 0% 0% 0% 0% 60-69 0% 0% 0% 0% 0% 0% 70-79 0% 0% 0% 0% 0% 0% 80-89 0% 0% 0% 0% 0% 0%
90-100 0% 0% 0% 0% 0% 0%
Direct routes lead to carbon neutral growth
0-9 100% 50% 0% 33% 100% 50% 10-19 33% 0% 67% 50% 25% 17% 20-29 0% 0% 33% 17% 0% 33% 30-39 0% 0% 0% 0% 0% 0% 40-49 0% 50% 0% 0% 0% 0% 50-59 0% 0% 0% 0% 0% 0% 60-69 0% 0% 0% 0% 0% 0% 70-79 0% 0% 0% 0% 0% 0% 80-89 0% 0% 0% 0% 0% 0%
90-100 0% 0% 0% 0% 0% 0%
Wind optimal routes lead to carbon neutral growth
0-9 67% 50% 0% 50% 50% 33% 10-19 17% 50% 100% 33% 50% 17% 20-29 0% 0% 0% 17% 0% 33% 30-39 0% 0% 0% 0% 0% 17% 40-49 17% 0% 0% 0% 0% 0% 50-59 0% 0% 0% 0% 0% 0% 60-69 0% 0% 0% 0% 0% 0% 70-79 0% 0% 0% 0% 0% 0% 80-89 0% 0% 0% 0% 0% 0%
90-100 0% 0% 0% 0% 0% 0%
Flexible Use of Airspace (FUA) leads to carbon neutral growth
0-9 50% 0% 0% 67% 75% 17% 10-19 33% 0% 66% 17% 25% 50% 20-29 0% 50% 33% 17% 0% 17%

270
Statement Scale 0-100
Airlines (n=6)
ANSPs (n=2)
CAA/NSA (n=3)
Ind. Experts
(n=6)
Government Bodies (n=4)
IATA (n=6)
30-39 17% 0% 0% 0% 0% 17% 40-49 0% 0% 0% 0% 0% 0% 50-59 0% 50% 0% 0% 0% 0% 60-69 0% 0% 0% 0% 0% 0% 70-79 0% 0% 0% 0% 0% 0% 80-89 0% 0% 0% 0% 0% 0%
90-100 0% 0% 0% 0% 0% 0%
Free Route Airspace (FRA) leads to carbon neutral growth
0-9 67% 0% 0% 50% 75% 33% 10-19 33% 0% 66% 33% 25% 33% 20-29 0% 0% 33% 17% 0% 33% 30-39 0% 50% 0% 0% 0% 0% 40-49 0% 50% 0% 0% 0% 0% 50-59 0% 0% 0% 0% 0% 0% 60-69 0% 0% 0% 0% 0% 0% 70-79 0% 0% 0% 0% 0% 0% 80-89 0% 0% 0% 0% 0% 0%
90-100 0% 0% 0% 0% 0% 0%
Other
0-9 33% 100% 100% 83% 50% 67% 10-19 17% 0% 0% 0% 0% 0% 20-29 17% 0% 0% 17% 0% 17% 30-39 17% 0% 0% 0% 25% 17% 40-49 0% 0% 0% 0% 0% 0% 50-59 17% 0% 0% 0% 0% 0% 60-69 0% 0% 0% 0% 25% 0% 70-79 0% 0% 0% 0% 0% 0% 80-89 0% 0% 0% 0% 0% 0%
90-100 0% 0% 0% 0% 0% 0%
Other
0-9 83% 100% 100% 100% 100% 80% 10-19 0% 0% 0% 0% 0% 0% 20-29 17% 0% 0% 0% 0% 0% 30-39 0% 0% 0% 0% 0% 0% 40-49 0% 0% 0% 0% 0% 20% 50-59 0% 0% 0% 0% 0% 0% 60-69 0% 0% 0% 0% 0% 0% 70-79 0% 0% 0% 0% 0% 0% 80-89 0% 0% 0% 0% 0% 0%
90-100 0% 0% 0% 0% 0% 0%
The second round of the Delphi method included two questions about the transaction
costs as categorised by the researcher based on the literature review and participant
observation (Table 50). The 26 experts that replied to this question deemed the
implementation of emissions management as the costliest procedure. There is consensus

271
among the participants regarding the application of EU ETS in comparison to the
implementation. 100% of IATA experts and ANSPs, 17% of airlines and 60% of
government bodies gave 30-50 points to the implementation of emissions management.
66% of airlines, 50% of individual experts and 40% of government bodies gave less than
15 points. This proves the different opinions for this factor.
The factor of monitoring gathered on average 11% of the points. 50% of the individual
experts gave 25 points and 33% of airlines gave 45 points to this category. Consensus
wasn’t achieved by the participants. Surprisingly the government bodies and the CAAs,
that are responsible for the monitoring, marked this category low. The category of
reporting and verification that is mainly the responsibility of airlines gathered 17 points on
average. The airlines, the individual experts and the government bodies gave most of the
points to this category. Monitoring, Reporting and Verification (MRV) gathered 31 points
out of 100 making it the costliest procedure for EU ETS.
Consensus was achieved in the abatement measures (Table 50). The replies ranged from
0 to 15 points. The 100% of airlines gave 0-5 points. Moreover, all the participants gave 0-
25 points to the trade category. The category of strategy received points ranging from 0-
30. 100% of airlines, 25% of CAAs, 75% of individual experts, 80% of government bodies
and 83% of IATA experts gave 0-10 points to the strategy category. Only 20% of
government bodies and 17% of IATA experts gave 20-30 points.
Table 50: Crosstab Groups and Transaction Cost categories
Statement Scale 0-100
Airlines (n=6)
ANSPs (n=1)
CAA/NSA (n=4)
Ind. Experts
(n=4)
Government Bodies
(n=5)
IATA (n=6)
Application
0-9 17% 0% 0% 0% 0% 0%
10-19 33% 100% 100% 100% 40% 83%
20-29 33% 0% 0% 0% 60% 17%
30-39 17% 0% 0% 0% 0% 0%
40-49 0% 0% 0% 0% 0% 0%

272
Statement Scale 0-100
Airlines (n=6)
ANSPs (n=1)
CAA/NSA (n=4)
Ind. Experts
(n=4)
Government Bodies
(n=5)
IATA (n=6)
50-59 0% 0% 0% 0% 0% 0%
60-69 0% 0% 0% 0% 0% 0%
70-79 0% 0% 0% 0% 0% 0%
80-89 0% 0% 0% 0% 0% 0%
90-100 0% 0% 0% 0% 0% 0%
Implementation of Emissions Management
0-9 33% 0% 0% 0% 0% 0%
10-19 33% 0% 0% 50% 40% 0%
20-29 17% 0% 100% 50% 0% 0%
30-39 0% 100% 0% 0% 40% 100%
40-49 0% 0% 0% 0% 20% 0%
50-59 17% 0% 0% 0% 0% 0%
60-69 0% 0% 0% 0% 0% 0%
70-79 0% 0% 0% 0% 0% 0%
80-89 0% 0% 0% 0% 0% 0%
90-100 0% 0% 0% 0% 0% 0%
Monitoring
0-9 17% 0% 0% 0% 20% 67%
10-19 33% 0% 100% 50% 60% 33%
20-29 17% 100% 0% 50% 20% 0%
30-39 0% 0% 0% 0% 0% 0%
40-49 33% 0% 0% 0% 0% 0%
50-59 17% 0% 0% 0% 0% 0%
60-69 0% 0% 0% 0% 0% 0%
70-79 0% 0% 0% 0% 0% 0%
80-89 0% 0% 0% 0% 0% 0%
90-100 0% 0% 0% 0% 0% 0%
Reporting and verification
0-9 33% 0% 50% 0% 0% 0%
10-19 33% 100% 50% 50% 20% 33%
20-29 17% 0% 0% 0% 80% 67%
30-39 0% 0% 0% 50% 0% 0%
40-49 17% 0% 0% 0% 0% 0%
50-59 0% 0% 0% 0% 0% 0%
60-69 0% 0% 0% 0% 0% 0%
70-79 0% 0% 0% 0% 0% 0%
80-89 0% 0% 0% 0% 0% 0%
90-100 0% 0% 0% 0% 0% 0%
Abatement measures
0-9 100% 0% 0% 50% 75% 33%
10-19 0% 100% 100% 50% 25% 67%
20-29 0% 0% 0% 0% 0% 0%

273
Statement Scale 0-100
Airlines (n=6)
ANSPs (n=1)
CAA/NSA (n=4)
Ind. Experts
(n=4)
Government Bodies
(n=5)
IATA (n=6)
30-39 0% 0% 0% 0% 0% 0%
40-49 0% 0% 0% 0% 0% 0%
50-59 0% 0% 0% 0% 0% 0%
60-69 0% 0% 0% 0% 0% 0%
70-79 0% 0% 0% 0% 0% 0%
80-89 0% 0% 0% 0% 0% 0%
90-100 0% 0% 0% 0% 0% 0%
Trade
0-9 67% 100% 0% 25% 60% 83%
10-19 33% 0% 0% 50% 20% 17%
20-29 0% 0% 100% 25% 20% 0%
30-39 0% 0% 0% 0% 0% 0%
40-49 0% 0% 0% 0% 0% 0%
50-59 0% 0% 0% 0% 0% 0%
60-69 0% 0% 0% 0% 0% 0%
70-79 0% 0% 0% 0% 0% 0%
80-89 0% 0% 0% 0% 0% 0%
90-100 0% 0% 0% 0% 0% 0%
Strategy
0-9 50% 0% 25% 75% 20% 67%
10-19 50% 100% 25% 25% 60% 17%
20-29 0% 0% 0% 0% 20% 0%
30-39 0% 0% 0% 0% 0% 17%
40-49 0% 0% 0% 0% 0% 0%
50-59 0% 0% 0% 0% 0% 0%
60-69 0% 0% 0% 0% 0% 0%
70-79 0% 0% 0% 0% 0% 0%
80-89 0% 0% 0% 0% 0% 0%
90-100 0% 0% 0% 0% 0% 0%
Other
0-9 100% 100% 75% 75% 100% 100%
10-19 0% 0% 25% 25% 0% 0%
20-29 0% 0% 0% 0% 0% 0%
30-39 0% 0% 0% 0% 0% 0%
40-49 0% 0% 0% 0% 0% 0%
50-59 0% 0% 0% 0% 0% 0%
60-69 0% 0% 0% 0% 0% 0%
70-79 0% 0% 0% 0% 0% 0%
80-89 0% 0% 0% 0% 0% 0%
90-100 0% 0% 0% 0% 0% 0%

274
Regarding the question about how important the transactions costs are for the effective
functioning of the aviation inclusion in the EU ETS scheme (Table 51), 33.3% of the
airlines, 100% of ANSPs, 75% of individual experts, 80% of CAA/NSAs, 75% of the
government bodies and 100% of IATA experts responded that it is an important cost.
16.7% of the airlines stated that TC are very important for the effectiveness of EU ETS.
Table 51: Crosstab Groups and importance of transaction costs
Statement Scale 1-5
Airlines (n=6)
ANSPs (n=1)
CAA/NSA (n=5)
Ind. Experts
(n=4)
Government Bodies (n=4)
IATA (n=6)
Overall, how important do you consider transactions costs to be for the effective functioning of the aviation inclusion in the EU ETS scheme?
1 0% 0% 0% 0% 0% 0%
2 0% 0% 0% 0% 0% 0%
3 50% 0% 20% 25% 25% 0%
4 33% 100% 80% 75% 75% 100%
5 17% 0% 0% 0% 0% 0%
7.2.4.2 Cross tabulation SES (2nd round)
As seen in Table 52, the creation of Single European Sky (SES) and Functional Airspace
Blocks (FABs) aim to major reforms of the European airspace management and
architecture. The participants reached consensus regarding the areas of improvement.
IATA and the European airlines share very similar opinions. The government bodies have
some differences with the ANSPs regarding the common ATCO training and research and
development. EUROCONTROL and ANSPs have opposite opinions regarding the
common flight inspection and the sector design. Nevertheless, on average the participants
agreed on the factors.
Table 52: Crosstab Areas benefitted from the establishment of FABs and Groups
Statement Scale 1-5
Airlines (n=3)
ANSPs (n=4)
CAA/NSA (n=4)
ECTL (n=2)
Ind. Experts
(n=5)
Government Bodies (n=3)
IATA (n=5)
Common Routes Network design
1 33% 0% 0% 0% 0% 0% 0%
2 0% 0% 0% 0% 0% 0% 0%
3 67% 25% 25% 50% 0% 33% 20%
4 0% 50% 50% 50% 80% 67% 40%
5 0% 25% 25% 0% 20% 0% 40%

275
Statement Scale 1-5
Airlines (n=3)
ANSPs (n=4)
CAA/NSA (n=4)
ECTL (n=2)
Ind. Experts
(n=5)
Government Bodies (n=3)
IATA (n=5)
Common Sector Design
1 0% 0% 0% 50% 0% 0% 0%
2 0% 0% 0% 0% 0% 0% 0%
3 33% 50% 25% 50% 0% 67% 40%
4 0% 25% 75% 0% 80% 33% 20%
5 67% 25% 0% 0% 20% 0% 40%
Statement Scale 1-5
Airlines (n=3)
ANSPs (n=4)
CAA/NSA (n=4)
ECTL (n=2)
Ind. Experts
(n=5)
Government Bodies (n=3)
IATA (n=5)
Common Operational Procedures
1 0% 0% 0% 0% 0% 0% 0%
2 0% 0% 0% 0% 0% 0% 20%
3 0% 0% 25% 50% 20% 33% 0%
4 33% 75% 75% 0% 60% 67% 40%
5 67% 25% 0% 50% 20% 0% 40%
Statement Scale 1-5
Airlines (n=3)
ANSPs (n=4)
CAA/NSA (n=4)
ECTL (n=2)
Ind. Experts
(n=5)
Government Bodies (n=3)
IATA (n=5)
Airspace consolidation
1 33% 0% 0% 0% 0% 0% 0%
2 0% 0% 0% 0% 0% 0% 20%
3 0% 25% 0% 50% 20% 33% 0%
4 33% 75% 100% 0% 60% 67% 20%
5 33% 0% 0% 50% 20% 0% 60%
Statement Scale 1-5
Airlines (n=3)
ANSPs (n=4)
CAA/NSA (n=4)
ECTL (n=2)
Ind. Experts
(n=5)
Government Bodies (n=3)
IATA (n=5)
Synergies in ATFCM
1 0% 0% 0% 0% 0% 0% 0%
2 0% 0% 0% 50% 0% 0% 0%
3 0% 0% 25% 0% 20% 0% 0%
4 33% 75% 75% 0% 60% 67% 80%
5 67% 25% 0% 50% 20% 33% 20%
Statement Scale 1-5
Airlines (n=3)
ANSPs (n=4)
CAA/NSA (n=3)
ECTL (n=2)
Ind. Experts
(n=5)
Government Bodies (n=3)
IATA (n=5)
Common R&D
1 0% 0% 0% 0% 0% 0% 0%
2 0% 0% 0% 50% 0% 67% 20%
3 33% 100% 67% 0% 80% 33% 60%
4 33% 0% 33% 50% 0% 0% 0%
5 33% 0% 0% 0% 20% 0% 20%
Statement Scale 1-5
Airlines (n=3)
ANSPs (n=4)
CAA/NSA (n=4)
ECTL (n=2)
Ind. Experts
(n=5)
Government Bodies (n=3)
IATA (n=5)
Harmonised ATM system
1 0% 0% 0% 0% 0% 33% 0%
2 0% 0% 25% 0% 0% 0% 0%
3 0% 0% 0% 50% 0% 0% 0%
4 0% 100% 75% 0% 60% 67% 40%
5 100% 0% 0% 50% 40% 0% 60%
Statement Scale 1-5
Airlines (n=3)
ANSPs (n=4)
CAA/NSA (n=4)
ECTL (n=2)
Ind. Experts
(n=5)
Government Bodies (n=3)
IATA (n=5)

276
Statement Scale 1-5
Airlines (n=3)
ANSPs (n=4)
CAA/NSA (n=4)
ECTL (n=2)
Ind. Experts
(n=5)
Government Bodies (n=3)
IATA (n=5)
Common Procurement
1 0% 0% 0% 50% 0% 0% 0%
2 0% 25% 50% 0% 0% 67% 40%
3 67% 25% 0% 0% 80% 0% 40%
4 0% 50% 50% 50% 0% 33% 20%
5 33% 0% 0% 0% 20% 0% 0%
Statement Scale 1-5
Airlines (n=3)
ANSPs (n=4)
CAA/NSA (n=4)
ECTL (n=2)
Ind. Experts
(n=5)
Government Bodies (n=3)
IATA (n=5)
Common AIS & MET
1 33% 0% 0% 0% 0% 33% 0%
2 33% 25% 50% 50% 20% 33% 0%
3 0% 25% 0% 0% 40% 0% 40%
4 33% 50% 50% 0% 20% 33% 40%
5 0% 0% 0% 50% 20% 0% 20%
Statement Scale 1-5
Airlines (n=3)
ANSPs (n=4)
CAA/NSA (n=4)
ECTL (n=2)
Ind. Experts
(n=5)
Government Bodies (n=3)
IATA (n=5)
Surveillance Data sharing
1 0% 0% 0% 0% 20% 0% 20%
2 0% 0% 0% 0% 0% 0% 0%
3 0% 25% 0% 50% 80% 67% 20%
4 33% 50% 100% 50% 0% 33% 60%
5 67% 25% 0% 0% 0% 0% 0%
Statement Scale 1-5
Airlines (n=3)
ANSPs (n=4)
CAA/NSA (n=4)
ECTL (n=2)
Ind. Experts
(n=5)
Government Bodies (n=3)
IATA (n=5)
Communication Data Sharing
1 0% 0% 0% 0% 0% 0% 0%
2 0% 0% 0% 0% 0% 0% 20%
3 33% 0% 0% 50% 60% 67% 0%
4 0% 75% 100% 50% 40% 33% 60%
5 67% 25% 0% 0% 0% 0% 20%
Statement Scale 1-5
Airlines (n=3)
ANSPs (n=4)
CAA/NSA (n=4)
ECTL (n=2)
Ind. Experts
(n=5)
Government Bodies (n=3)
IATA (n=5)
Sharing of navigation aids
1 33% 0% 0% 0% 0% 0% 20%
2 67% 0% 25% 0% 0% 0% 0%
3 0% 50% 25% 100% 100% 67% 40%
4 0% 50% 50% 0% 0% 33% 40%
5 0% 0% 0% 0% 0% 0% 0%
Statement Scale 1-5
Airlines (n=3)
ANSPs (n=4)
CAA/NSA (n=4)
ECTL (n=2)
Ind. Experts
(n=5)
Government Bodies (n=3)
IATA (n=5)
Improved cooperation with Militaries
1 0% 0% 0% 0% 0% 0% 20%
2 0% 0% 0% 50% 20% 33% 0%
3 33% 25% 25% 0% 40% 0% 20%
4 33% 50% 75% 0% 40% 0% 40%
5 33% 25% 0% 50% 0% 67% 20%

277
Statement Scale 1-5
Airlines (n=3)
ANSPs (n=4)
CAA/NSA (n=4)
ECTL (n=1)
Ind. Experts
(n=5)
Government Bodies (n=3)
IATA (n=5)
Common Flight Inspection
1 0% 0% 0% 100% 0% 0% 0%
2 33% 50% 25% 0% 20% 0% 20%
3 67% 50% 50% 0% 60% 100% 80%
4 0% 0% 25% 0% 0% 0% 0%
5 0% 0% 0% 0% 20% 0% 0%
Statement Scale 1-5
Airlines (n=3)
ANSPs (n=4)
CAA/NSA (n=4)
ECTL (n=2)
Ind. Experts
(n=5)
Government Bodies (n=3)
IATA (n=5)
Common Safety Management System
1 0% 0% 0% 0% 0% 0% 0%
2 0% 0% 0% 100% 0% 0% 20%
3 67% 0% 25% 0% 40% 0% 20%
4 0% 75% 75% 0% 60% 67% 40%
5 33% 25% 0% 0% 0% 33% 20%
Statement Scale 1-5
Airlines (n=3)
ANSPs (n=4)
CAA/NSA (n=4)
ECTL (n=2)
Ind. Experts
(n=5)
Government Bodies (n=3)
IATA (n=5)
Common ATCO Training
1 0% 0% 0% 0% 0% 0% 0%
2 33% 25% 0% 0% 0% 0% 20%
3 33% 50% 50% 50% 80% 0% 20%
4 0% 25% 50% 50% 20% 67% 60%
5 33% 0% 0% 0% 0% 33% 0%
Statement Scale 1-5
Airlines (n=3)
ANSPs (n=4)
CAA/NSA (n=4)
ECTL (n=2)
Ind. Experts
(n=4)
Government Bodies (n=3)
IATA (n=5)
Reduction of emissions
1 0% 0% 0% 0% 0% 0% 0%
2 0% 25% 0% 50% 0% 0% 0%
3 33% 0% 25% 0% 0% 0% 20%
4 0% 50% 50% 0% 100% 100% 20%
5 67% 25% 25% 50% 0% 0% 60%
Statement Scale 1-5
Airlines (n=0)
ANSPs (n=0)
CAA/NSA (n=1)
ECTL (n=0)
Ind. Experts
(n=2)
Government Bodies (n=1)
IATA (n=1)
Other
1 0% 0% 0% 0% 0% 0% 0%
2 0% 0% 0% 0% 0% 0% 0%
3 0% 0% 100% 0% 100% 0% 0%
4 0% 0% 0% 0% 0% 0% 100%
5 0% 0% 0% 0% 0% 100% 0%
The environmental performance is correlated to Air Traffic Management. Table 53 lists the
replies of 28 experts to 9 statements regarding SES and the environment. Surprisingly,
25% of airlines totally agreed with the statement that the airspace before SES did not need
to be changed. The replies in this statement are in line with the replies to the ‘The
reorganisation of the European Sky was necessary’ statement. The flight efficiency can be

278
improved by optimal flight distances, i.e. horizontal component, and/or by optimal flight
level, i.e. vertical component. One airline representative mentioned that the technological
advances of airplanes are such that the airplanes can flight higher but are limited by ICAO
standards. An ATCO mentioned that for capacity reasons the flight levels are altered by
ATCOs. With respect to vertical and horizontal efficiency only 25% of CAAs and 20% of
IATA experts expressed a positive opinion to that statement.
Moreover, most of the participants also agreed that due to capacity and safety
requirements the inefficiencies cannot be reduced to zero at system level (Table 53). Only
25% of airlines, 33% of government bodies and 20% of IATA experts disagreed with the
safety statement. The capacity requirements gathered more negative replies. Apart from
the above mentioned participants, 50% of EUROCONTROL experts, 25% of ANSPs and
an additional 33% of government bodies suggest that despite capacity requirements the
level of inefficiencies can be reduced to zero at system level.
The 28 participants shared different opinions regarding the statement ‘The main
environmental KPI should be the estimated economic value of CO2 emissions due to route
extension’. Route extension may be caused by airspace congestion or restrictions.
Airlines, CAAs, individual experts, government bodies and IATA had diverse opinions
within their groups and among the groups. This is the case for the FABs and great cycle
routes. It should be noted that on many occasions the Great Distance Circle may not be
flown many times due to bad weather conditions that restrict the use of the airspace.
Nevertheless, regarding the statement ‘The European airspace network today can benefit
from a significant level of dynamism through the application of the Flexible Use of Airspace
(FUA) concept’ the groups reached consensus towards a positive opinion with the
exception of airlines representatives that kept a negative position.

279
Table 53: Crosstab Position of participants on SES and the environment and Groups
Statement Scale 1-5
Airlines (n=4)
ANSPs (n=4)
CAA/NSA (n=4)
ECTL (n=2)
Ind. Experts
(n=6)
Government Bodies (n=3)
IATA (n=5)
The airspace before SES did not need to be changed.
1 50% 25% 0% 50% 50% 33% 80%
2 25% 75% 50% 50% 50% 33% 20%
3 0% 0% 50% 0% 0% 33% 0%
4 0% 0% 0% 0% 0% 0% 0%
5 25% 0% 0% 0% 0% 0% 0%
Statement Scale 1-5
Airlines (n=4)
ANSPs (n=4)
CAA/NSA (n=4)
ECTL (n=2)
Ind. Experts
(n=6)
Government Bodies (n=3)
IATA (n=5)
FABs bring routes closer to the optimum “Great Circle” route and reduce extended flight paths.
1 25% 0% 0% 0% 0% 0% 0%
2 25% 0% 0% 50% 0% 0% 20%
3 25% 0% 25% 50% 40% 33% 20%
4 25% 75% 50% 0% 60% 33% 60%
5 0% 25% 25% 0% 0% 33% 0%
Statement Scale 1-5
Airlines (n=3)
ANSPs (n=4)
CAA/NSA (n=4)
ECTL (n=2)
Ind. Experts
(n=6)
Government Bodies (n=3)
IATA (n=5)
The European airspace network today can benefit from a significant level of dynamism through the application of the Flexible Use of Airspace (FUA) concept.
1 33% 0% 0% 0% 0% 0% 0%
2 67% 0% 0% 0% 0% 0% 0%
3 0% 0% 25% 0% 17% 33% 20%
4 0% 75% 75% 50% 67% 33% 60%
5 0% 25% 0% 50% 17% 33% 20%
Statement Scale 1-5
Airlines (n=4)
ANSPs (n=4)
CAA/NSA (n=4)
ECTL (n=2)
Ind. Experts
(n=6)
Government Bodies (n=3)
IATA (n=5)
The reorganisation of the European Sky was necessary.
1 25% 0% 0% 0% 0% 0% 0%
2 0% 0% 0% 0% 0% 0% 0%
3 25% 25% 25% 0% 0% 0% 20%
4 0% 25% 50% 100% 67% 33% 0%
5 50% 50% 25% 0% 33% 67% 80%
Statement Scale 1-5
Airlines (n=4)
ANSPs (n=4)
CAA/NSA (n=4)
ECTL (n=2)
Ind. Experts
(n=6)
Government Bodies (n=3)
IATA (n=5)
The horizontal component is of higher economic and environmental importance than the vertical component of the Flight efficiency.
1 50% 0% 0% 50% 0% 33% 20%
2 25% 50% 0% 0% 33% 0% 0%
3 25% 50% 75% 50% 67% 67% 60%
4 0% 0% 25% 0% 0% 0% 20%
5 0% 0% 0% 0% 0% 0% 0%
Statement Scale 1-5
Airlines (n=4)
ANSPs (n=4)
CAA/NSA (n=4)
ECTL (n=2)
Ind. Experts
(n=6)
Government Bodies (n=3)
IATA (n=5)

280
Statement Scale 1-5
Airlines (n=4)
ANSPs (n=4)
CAA/NSA (n=4)
ECTL (n=2)
Ind. Experts
(n=6)
Government Bodies (n=3)
IATA (n=5)
Due to inherent safety (minimum separation requirements between aircraft) requirements, the level of “inefficiencies” cannot be reduced to zero at system level.
1 25% 0% 0% 0% 0% 0% 0%
2 0% 0% 0% 0% 0% 33% 20%
3 25% 25% 25% 0% 50% 0% 0%
4 25% 75% 75% 0% 50% 33% 40%
5 25% 0% 0% 100% 0% 33% 40%
Statement Scale 1-5
Airlines (n=4)
ANSPs (n=4)
CAA/NSA (n=4)
ECTL (n=2)
Ind. Experts
(n=6)
Government Bodies (n=3)
IATA (n=5)
Due to capacity (organisation of traffic flows) requirements, the level of “inefficiencies” cannot be reduced to zero at system level.
1 25% 0% 0% 0% 0% 33% 0%
2 0% 25% 0% 50% 0% 33% 20%
3 25% 0% 25% 0% 33% 33% 20%
4 25% 75% 50% 0% 50% 0% 40%
5 25% 0% 25% 50% 17% 0% 20%
Statement Scale 1-5
Airlines (n=4)
ANSPs (n=4)
CAA/NSA (n=4)
ECTL (n=2)
Ind. Experts
(n=5)
Government Bodies (n=3)
IATA (n=5)
The main environmental KPI should be the estimated economic value of CO2 emissions due to route extension.
1 50% 0% 25% 50% 0% 0% 20%
2 0% 0% 25% 0% 40% 33% 0%
3 0% 50% 25% 50% 0% 33% 20%
4 50% 50% 25% 0% 40% 33% 60%
5 0% 0% 0% 0% 20% 0% 0%
Statement Scale 1-5
Airlines (n=4)
ANSPs (n=4)
CAA/NSA (n=4)
ECTL (n=2)
Ind. Experts
(n=4)
Government Bodies (n=3)
IATA (n=5)
All FABs are fully operational.
1 75% 25% 25% 50% 25% 0% 20%
2 0% 75% 75% 50% 50% 33% 80%
3 25% 0% 0% 0% 25% 33% 0%
4 0% 0% 0% 0% 0% 0% 0%
5 0% 0% 0% 0% 0% 33% 0%
The participants were provided with some factors affecting the horizontal en route flight
efficiency. The most important factor in terms of the mean (mean=27.52) is the route
structure and availability. The SES reform aims at improving this factor. The range of the
points given was 5-50 and received an average value of 27.52 points out of 100.
According to Table 54, 33% of airlines, 25% of ANSPs, 33% of CAAs, 50% of individual
experts, 66% of government bodies gave 0-20 points. EUROCONTROL experts and

281
ANSPs that are the ones responsible for the route structure and availability gave 30-50
points.
The second most important factor (mean=17.83) is the utilisation of civil military structures.
33% of airlines, 25% of ANSPs, 50% of EUROCONTROL experts, 33% of government
bodies and 20% of IATA experts gave 25-40 points. This element affects the route
structure and availability factor. The good flight planning factor was higher evaluated by
the non-airlines related experts. The Operational Control Centres (OCC) of airlines invest
a lot of time to design their flights in the most efficient way focusing on the fleet availability
and scheduling issues, therefore the environmental aspect is put aside in this part. The
remaining of the factors received less than 10 points on average and there was consensus
among the participants.
Table 54: Crosstabs Factors affecting horizontal en route flight efficiency and Groups
Statement Scale 0-100
Airlines (n=3)
ANSPs (n=4
CAA/NSA (n=3)
ECTL (n=2)
Ind.
Experts (n=4)
Government Bodies (n=3)
IATA (n=5)
Route structure and availability affect horizontal en route flight efficiency.
0-9 0% 0% 0% 0% 0% 33% 0% 10-19 33% 25% 33% 0% 50% 33% 0% 20-29 0% 25% 33% 0% 25% 33% 60% 30-39 33% 50% 0% 50% 50% 33% 20% 40-49 33% 25% 33% 0% 0% 0% 20% 50-59 0% 0% 0% 50% 0% 0% 0% 60-69 0% 0% 0% 0% 0% 0% 0%
70-79 0% 0% 0% 0% 0% 0% 0%
80-89 0% 0% 0% 0% 0% 0% 0%
90-100 0% 0% 0% 0% 0% 0% 0%
Availability of airspace (utilisation of civil military structures) affects horizontal en route flight efficiency.
0-9 33% 0% 33% 0% 0% 33% 0% 10-19 33% 0% 33% 50% 0% 0% 60%
20-29 33% 75% 33% 50% 50% 33% 20%
30-39 0% 25% 0% 0% 0% 33% 0%
40-49 0% 0% 0% 0% 0% 0% 20%
50-59 0% 0% 0% 0% 0% 0% 20% 60-69 0% 0% 0% 0% 0% 0% 0%
70-79 0% 0% 0% 0% 0% 0% 0%
80-89 0% 0% 0% 0% 0% 0% 0%
90-100 0% 0% 0% 0% 0% 0% 0%

282
Statement Scale 0-100
Airlines (n=3)
ANSPs (n=4
CAA/NSA (n=3)
ECTL (n=2)
Ind.
Experts (n=4)
Government Bodies (n=3)
IATA (n=5)
Flight planning capabilities (use of software, repetitive flight planning) affect horizontal en route flight efficiency.
0-9 33% 0% 33% 0% 0% 0% 0%
10-19 66% 50% 33% 50% 50% 33% 80%
20-29 0% 50% 33% 50% 50% 67% 20% 30-39 0% 0% 0% 0% 0% 0% 0%
40-49 0% 0% 0% 0% 0% 0% 0%
50-59 0% 0% 0% 0% 0% 0% 0%
60-69 0% 0% 0% 0% 0% 0% 0%
70-79 0% 0% 0% 0% 0% 0% 0%
80-89 0% 0% 0% 0% 0% 0% 0%
90-100 0% 0% 0% 0% 0% 0% 0%
User preferences regarding time affect horizontal en route flight efficiency.
0-9 67% 50% 66% 50% 0% 67% 40%
10-19 33% 50% 0% 50% 100% 33% 40%
20-29 0% 0% 33% 0% 0% 0% 20%
30-39 0% 0% 0% 0% 0% 0% 0%
40-49 0% 0% 0% 0% 0% 0% 0%
50-59 0% 0% 0% 0% 0% 0% 0%
60-69 0% 0% 0% 0% 0% 0% 0%
70-79 0% 0% 0% 0% 0% 0% 0%
80-89 0% 0% 0% 0% 0% 0% 0%
90-100 0% 0% 0% 0% 0% 0% 0%
User preferences regarding fuel affect horizontal en route flight efficiency.
0-9 67% 25% 33% 50% 0% 66% 40%
10-19 33% 75% 33% 5% 75% 0% 60% 20-29 0% 0% 33% 0% 25% 0% 0%
30-39 0% 0% 0% 0% 0% 0% 0%
40-49 0% 0% 0% 0% 0% 33% 0%
50-59 0% 0% 0% 0% 0% 0% 0%
60-69 0% 0% 0% 0% 0% 0% 0% 70-79 0% 0% 0% 0% 0% 0% 0%
80-89 0% 0% 0% 0% 0% 0% 0% 90-100 0% 0% 0% 0% 0% 0% 0%
Tactical ATC routings affect horizontal en route flight efficiency.
0-9 33% 25% 33% 50% 0% 33% 0%
10-19 66% 75% 66% 50% 100% 0% 100%
20-29 0% 0% 0% 0% 0% 67% 0%
30-39 0% 0% 0% 0% 0% 0% 0%
40-49 0% 0% 0% 0% 0% 0% 0%
50-59 0% 0% 0% 0% 0% 0% 0%
60-69 0% 0% 0% 0% 0% 0% 0%
70-79 0% 0% 0% 0% 0% 0% 0%
80-89 0% 0% 0% 0% 0% 0% 0%
90-100 0% 0% 0% 0% 0% 0% 0%
Special events such as 0-9 33% 50% 67% 50% 50% 67% 40%

283
Statement Scale 0-100
Airlines (n=3)
ANSPs (n=4
CAA/NSA (n=3)
ECTL (n=2)
Ind.
Experts (n=4)
Government Bodies (n=3)
IATA (n=5)
ATC strikes affect horizontal en route flight efficiency.
10-19 66% 50% 33% 50% 50% 0% 60%
20-29 0% 0% 0% 0% 0% 33% 0%
30-39 0% 0% 0% 0% 0% 0% 0%
40-49 0% 0% 0% 0% 0% 0% 0%
50-59 0% 0% 0% 0% 0% 0% 0%
60-69 0% 0% 0% 0% 0% 0% 0%
70-79 0% 0% 0% 0% 0% 0% 0%
80-89 0% 0% 0% 0% 0% 0% 0%
90-100 0% 0% 0% 0% 0% 0% 0%
Other
0-9 33% 100% 100% 100% 100% 100% 100%
10-19 33% 0% 0% 0% 0% 0% 0%
20-29 33% 0% 0% 0% 0% 0% 0%
30-39 0% 0% 0% 0% 0% 0% 0%
40-49 0% 0% 0% 0% 0% 0% 0%
50-59 0% 0% 0% 0% 0% 0% 0%
60-69 0% 0% 0% 0% 0% 0% 0%
70-79 0% 0% 0% 0% 0% 0% 0%
80-89 0% 0% 0% 0% 0% 0% 0%
90-100 0% 0% 0% 0% 0% 0% 0%
The reserved airspace for the military was foe many years a controversial topic of
discussions for capacity issues. Undoubtedly, the cooperation of Civil and Military
dimensions of aviation should be enhanced. The participants were asked to rank
hierarchically the factors given by the researcher and to add any factor they deem
important. The 26 experts shared 100 points and did not reach consensus within the group
or among the groups (Table 55).
The political issues factor received on average 43 points. The points ranged from 0-100.
33% of airlines, 25% of CAAs, 100% of EUROCONTROL experts, 20% of individual
experts and 33% of governmental bodies shared 0-10 points in this factor. 50% of ANSPs,
50% of CAAs, 20% of individual experts, 33% of airlines, 33% government bodies and
60% of IATA experts gave 30-45 points. 50% of ANSPs, 40% of individual experts and
40% of IATA experts gave to the political issues factor 50-70 points, whereas 33% of

284
airlines and government bodies gave 80 points. 25% of individual experts gave 90 points
and 20% of individual experts gave the maximum possible, i.e. 100 points to the political
issues factor. The most important opinions are those of the ANSPs, the CAAs,
EUROCONTROL and the government bodies (that include the Ministries of Transport).
Those participants had diverse opinions on this factor. The flight planning capabilities, the
special events, the ICAO ATM procedures, the position of information and radar vectoring
had on average 10 points out of the 100. Those factors received 0-50 points and did not
reach consensus within their group.
Five participants added a factor. One EUROCONTROL expert gave 40 points to Other
Airspace management and route structure. One expert representing government bodies
gave all the points, i.e. 100 points to the ‘Existing agreements and procedures at national
level on one side, and on FAB level at the other side’. An individual expert gave 10 points
to ‘Airline fleet modernization and equipment availability and rules and regulations of
aircraft registering State’. An airline representative gave 100 points to the ‘Overall flight
efficiency’. Lastly, one IATA expert representative gave 20 point to the communications of
military airspace availability. The expert mentioned that many times that the military
airspace is open e.g. on weekends, the flight planners and pilots are not aware of that
route options. This is supported by the literature review regarding the use of Conditional
Routes. Figure 25 in the Single European Sky chapter illustrated that many times despite
that the CDRs are available, the airspace users do not take advantage of it.
Table 55: Crosstabs Factors affecting the Civil Military cooperation and Groups
Statement Scale 0-100
Airlines (n=3)
ANSPs (n=4
CAA/NSA (n=4)
ECTL (n=2)
Ind. Experts
(n=5)
Government Bodies (n=3)
IATA (n=5)
Political issues
0-9 33% 0% 0% 0% 0% 33% 0% 10-19 0% 0% 25% 100% 20% 0% 0% 20-29 0% 0% 0% 0% 0% 0% 0%
30-39 0% 0% 25% 0% 20% 0% 20% 40-49 33% 50% 25% 0% 0% 33% 40%

285
Statement Scale 0-100
Airlines (n=3)
ANSPs (n=4
CAA/NSA (n=4)
ECTL (n=2)
Ind. Experts
(n=5)
Government Bodies (n=3)
IATA (n=5)
50-59 0% 0% 0% 0% 20% 0% 20% 60-69 0% 50% 0% 0% 20% 0% 0% 70-79 0% 0% 0% 0% 0% 0% 20% 80-89 33% 0% 0% 0% 0% 33% 0%
90-100 0% 0% 25% 0% 20% 0% 0%
Flight planning capabilities (use of software, repetitive flight planning)
0-9 66% 0% 25% 0% 20% 66% 20% 10-19 33% 50% 50% 0% 40% 0% 80% 20-29 0% 25% 25% 50% 40% 33% 0% 30-39 0% 25% 0% 50% 0% 0% 0% 40-49 0% 0% 0% 0% 0% 0% 0%
50-59 0% 0% 0% 0% 0% 0% 0%
60-69 0% 0% 0% 0% 0% 0% 0%
70-79 0% 0% 0% 0% 0% 0% 0%
80-89 0% 0% 0% 0% 0% 0% 0%
90-100 0% 0% 0% 0% 0% 0% 0%
Special events
0-9 67% 25% 25% 50% 20% 66% 20% 10-19 0% 75% 25% 0% 80% 33% 60% 20-29 0% 0% 0% 0% 0% 0% 0%
30-39 0% 0% 0% 0% 0% 0% 0%
40-49 33% 0% 25% 0% 0% 0% 0% 50-59 0% 0% 25% 50% 0% 0% 0% 60-69 0% 0% 0% 0% 0% 0% 0% 70-79 0% 0% 0% 0% 0% 0% 0%
80-89 0% 0% 0% 0% 0% 0% 0%
90-100 0% 0% 0% 0% 0% 0% 0%
Existing ICAO ATM procedures
0-9 67% 50% 50% 50% 20% 66% 20% 10-19 33% 50% 50% 50% 60% 33% 40% 20-29 0% 0% 0% 0% 20% 0% 20% 30-39 0% 0% 0% 0% 0% 0% 20% 40-49 0% 0% 0% 0% 0% 0% 0%
50-59 0% 0% 0% 0% 0% 0% 0%
60-69 0% 0% 0% 0% 0% 0% 0%
70-79 0% 0% 0% 0% 0% 0% 0%
80-89 0% 0% 0% 0% 0% 0% 0%
90-100 0% 0% 0% 0% 0% 0% 0%
Aspects related to position information and radar vectoring
0-9 100% 25% 50% 0% 20% 66% 0% 10-19 0% 75% 50% 50% 60% 33% 80% 20-29 0% 0% 0% 50% 20% 0% 00% 30-39 0% 0% 0% 0% 0% 0% 20% 40-49 0% 0% 0% 0% 0% 0% 0%
50-59 0% 0% 0% 0% 0% 0% 0%
60-69 0% 0% 0% 0% 0% 0% 0%
70-79 0% 0% 0% 0% 0% 0% 0%
80-89 0% 0% 0% 0% 0% 0% 0%

286
Statement Scale 0-100
Airlines (n=3)
ANSPs (n=4
CAA/NSA (n=4)
ECTL (n=2)
Ind. Experts
(n=5)
Government Bodies (n=3)
IATA (n=5)
90-100 0% 0% 0% 0% 0% 0% 0%
Other
0-9 67% 75% 75% 50% 60% 33% 60% 10-19 0% 25% 25% 0% 40% 33% 40% 20-29 0% 0% 0% 0% 0% 0% 0%
30-39 0% 0% 0% 0% 0% 0% 0%
40-49 0% 0% 0% 50% 0% 0% 0% 50-59 0% 0% 0% 0% 0% 0% 0%
60-69 0% 0% 0% 0% 0% 0% 0%
70-79 0% 0% 0% 0% 0% 0% 0%
80-89 0% 0% 0% 0% 0% 0% 0%
90-100 33% 0% 0% 0% 0% 33% 0%
The literature on environmental protection shows a variety of approached for emissions
reduction. The 28 participants were given a list of factor that according to the literature
contribute to the reduction of CO2 emissions (Table 56). The FUA and FRA reached
consensus among the participants with only one individual experts disagree with the
statement. The shortest feasible routes and the CDOs (that is mostly contributing to the
local air quality) reached consensus. The factor ‘use of biofuels’ had a low CV (0.32) which
means that consensus was reached across all the experts. Nevertheless, within the group
of airlines, CAAs, IATA and government bodies there were different opinions expressed by
the experts. Moreover, one EUROCONTROL expert questioned the use of eco-friendly
engines contribution emissions reduction. In addition, one expert of IATA suggested that
the load factors are improved to the maximum and there is no area of improvement in this
factor. Someone, could argue that the replacement of small airplanes with bigger airplanes
could improve the emissions per Revenue Passenger Kilometre (RPK).
The factor ‘reduced traffic due to economic crisis’ gathered different replies (Table 56).
Despite the economic crisis the Air Transport Movements (ATM) have not decreased in
reality. Nevertheless, should the ATM decrease the emissions will be decreased too. The
trading of emissions, both Certified Emissions Reductions (CERs) and Verified Emissions
Reductions (VERs), gathered many negative opinions. Only 33% of individual experts,

287
50% of EUROCONTROL experts and 33% of government bodies expressed a positive
opinion to CERs. As far as VERs is concerned only 60% of individual experts suggested
that could contribute to emissions reductions.
It is quite interesting that some airline (33%) and IATA (20%) experts that do not believe
that offsetting schemes developed by airlines can reduce emissions. The government
bodies kept a neutral position regarding this. Likewise, some experts do not believe that
ETS can lead to emissions reduction. But there are also others that agree to the
statements. There was no consensus among the experts regarding the offsetting and
emission trading schemes. In addition, 50% of airlines did not believe that SES can
contribute to emissions reduction. The airlines had a totally different opinion than IATA in
this factor. A participant added the factor Airlines Fuel Saving Policy / System which can
indeed reduce the fuel consumption. The fleet renewal can improve the fuel consumption
hence the emissions. Finally, one expert commented that the complementarity of the
measures could have a more positive effect to environmental performance.
The findings were quite unexpected regarding some of the statements. The most likely
explanation of the negative opinions regarding some of the statements is that the
participants wanted to make a point on the limitations of the measure or the unmatched
expectations about their implementation.
Table 56: Crosstab Factors contributing to emissions’ reduction and Groups
Statement Scale 1-5
Airlines (n=4)
ANSPs (n=4)
CAA/NSA (n=4)
ECTL (n=2)
Ind. Experts
(n=6)
Government Bodies (n=3)
IATA (n=5)
Flexible Use of Airspace
1 0% 0% 0% 0% 0% 0% 0%
2 0% 0% 0% 0% 17% 0% 0%
3 25% 0% 0% 0% 17% 0% 0%
4 50% 50% 100% 50% 50% 33% 60%
5 25% 50% 0% 50% 17% 67% 40%
Statement Scale 1-5
Airlines (n=4)
ANSPs (n=4)
CAA/NSA (n=4)
ECTL (n=2)
Ind. Experts
(n=5)
Government Bodies (n=3)
IATA (n=5)
Free Route Airspace 1 0% 0% 0% 0% 0% 0% 0%

288
2 0% 0% 0% 0% 20% 0% 0%
3 25% 0% 0% 0% 20% 0% 0%
4 75% 50% 100% 50% 40% 33% 80%
5 0% 50% 0% 50% 20% 67% 20%
Statement Scale 1-5
Airlines (n=4)
ANSPs (n=4)
CAA/NSA (n=4)
ECTL (n=1)
Ind. Experts
(n=6)
Government Bodies (n=3)
IATA (n=5)
Shortest feasible routes
1 0% 0% 0% 0% 0% 0% 0%
2 0% 0% 0% 0% 0% 0% 0%
3 25% 0% 0% 0% 0% 0% 40%
4 50% 75% 50% 100% 50% 33% 20%
5 25% 25% 50% 0% 50% 67% 40%
Statement Scale 1-5
Airlines (n=4)
ANSPs (n=4)
CAA/NSA (n=4)
ECTL (n=2)
Ind. Experts
(n=6)
Government Bodies (n=3)
IATA (n=5)
Implementing continuous descent approaches
1 0% 0% 0% 0% 0% 0% 0%
2 0% 0% 0% 0% 0% 0% 0%
3 25% 0% 50% 0% 17% 33% 0%
4 25% 75% 50% 100% 50% 0% 60%
5 50% 25% 0% 0% 33% 67% 40%
Statement Scale 1-5
Airlines (n=4)
ANSPs (n=4)
CAA/NSA (n=4)
ECTL (n=2)
Ind. Experts
(n=6)
Government Bodies (n=3)
IATA (n=5)
Use of Bio fuels
1 25% 0% 25% 0% 0% 0% 0%
2 0% 0% 0% 0% 0% 33% 20%
3 25% 75% 50% 0% 0% 33% 20%
4 25% 25% 25% 50% 67% 33% 20%
5 25% 0% 0% 50% 33% 0% 40%
Statement Scale 1-5
Airlines (n=4)
ANSPs (n=4)
CAA/NSA (n=4)
ECTL (n=2)
Ind. Experts
(n=6)
Government Bodies (n=3)
IATA (n=5)
Use of Eco-friendly engines
1 0% 0% 0% 50% 0% 0% 0%
3 25% 25% 25% 0% 0% 0% 0%
4 0% 50% 50% 50% 67% 67% 60%
5 75% 25% 25% 0% 33% 33% 40%
Statement Scale 1-5
Airlines (n=4)
ANSPs (n=4)
CAA/NSA (n=4)
ECTL (n=2)
Ind. Experts
(n=6)
Government Bodies (n=3)
IATA (n=5)
Improving load factors
1 0% 0% 0% 0% 0% 0% 0%
2 0% 0% 0% 0% 0% 0% 20%
3 0% 75% 75% 0% 33% 33% 40%
4 50% 25% 25% 100% 33% 67% 40%
5 50% 0% 0% 0% 33% 0% 0%
Statement Scale 1-5
Airlines (n=4)
ANSPs (n=4)
CAA/NSA (n=4)
ECTL (n=2)
Ind. Experts
(n=6)
Government Bodies (n=3)
IATA (n=5)
Reduced traffic because of economic crisis
1 25% 0% 0% 0% 0% 0% 0%
2 25% 25% 0% 0% 33% 0% 0%
3 0% 0% 25% 50% 17% 33% 80%
4 25% 75% 75% 50% 33% 33% 20%
5 25% 0% 0% 0% 17% 33% 0%

289
Statement Scale 1-5
Airlines (n=3)
ANSPs (n=4)
CAA/NSA (n=4)
ECTL (n=2)
Ind. Experts
(n=6)
Government Bodies (n=3)
IATA (n=5)
Trading Certified Emissions Reductions (CERs)
1 67% 0% 25% 0% 0% 0% 0%
2 33% 0% 0% 0% 50% 0% 40%
3 0% 100% 75% 50% 17% 67% 60%
4 0% 0% 0% 0% 33% 0% 0%
5 0% 0% 0% 50% 0% 33% 0%
Statement Scale 1-5
Airlines (n=3)
ANSPs (n=4)
CAA/NSA (n=4)
ECTL (n=2)
Ind. Experts
(n=5)
Government Bodies (n=3)
IATA (n=5)
Trading Verified or Voluntary Emissions Reductions (VERs)
1 67% 0% 25% 0% 0% 0% 0%
2 33% 0% 0% 0% 20% 33% 60%
3 0% 100% 75% 100% 20% 67% 40%
4 0% 0% 0% 0% 60% 0% 0%
5 0% 0% 0% 0% 0% 0% 0%
Statement Scale 1-5
Airlines (n=3)
ANSPs (n=4)
CAA/NSA (n=4)
ECTL (n=2)
Ind. Experts
(n=6)
Government Bodies (n=3)
IATA (n=5)
Airlines develop offsetting programs
1 0% 0% 0% 0% 17% 0% 20%
2 33% 25% 0% 0% 17% 0% 0%
3 33% 50% 50% 50% 0% 100% 20%
4 0% 25% 50% 50% 50% 0% 60%
5 33% 0% 0% 0% 17% 0% 0%
Statement Scale 1-5
Airlines (n=4)
ANSPs (n=4)
CAA/NSA (n=4)
ECTL (n=2)
Ind. Experts
(n=6)
Government Bodies (n=3)
IATA (n=5)
EU Emissions Trading Scheme
1 50% 0% 25% 0% 0% 0% 0%
2 25% 25% 0% 0% 0% 0% 40%
3 25% 75% 25% 50% 67% 67% 40%
4 0% 0% 50% 0% 33% 33% 20%
5 0% 0% 0% 50% 0% 0% 0%
Statement Scale 1-5
Airlines (n=4)
ANSPs (n=4)
CAA/NSA (n=4)
ECTL (n=2)
Ind. Experts
(n=6)
Government Bodies (n=3)
IATA (n=5)
Single European Sky
1 25% 0% 0% 0% 0% 0% 0%
2 25% 0% 0% 0% 0% 0% 0%
3 0% 25% 50% 50% 17% 33% 0%
4 50% 75% 50% 0% 67% 67% 20%
5 0% 0% 0% 50% 17% 0% 80%
Statement Scale 1-5
Airlines (n=1)
ANSPs (n=0)
CAA/NSA (n=0)
ECTL (n=0)
Ind. Experts
(n=0)
Government Bodies (n=0)
IATA (n=2)
Other
1 0% 0% 0% 0% 0% 0% 0%
2 0% 0% 0% 0% 0% 0% 0%
3 0% 0% 0% 0% 0% 0% 0%
4 0% 0% 0% 0% 0% 0% 0%
5 100% 0% 0% 0% 0% 0% 100%
Statement Scale 1-5
Airlines (n=0)
ANSPs (n=0)
CAA/NSA (n=0)
ECTL (n=0)
Ind. Experts
(n=0)
Government Bodies (n=0)
IATA (n=1)
Other 1 0% 0% 0% 0% 0% 0% 0%

290
2 0% 0% 0% 0% 0% 0% 0%
3 0% 0% 0% 0% 0% 0% 0%
4 0% 0% 0% 0% 0% 0% 0%
5 0% 0% 0% 0% 0% 0% 100%
The question that its replies are illustrated in Table 57 is the same question as the one in
the SES questionnaire and refers to the different ways the carbon neutral growth can be
achieved. 66% of airlines, 25% of individual the experts and ANSPs, 50% of
EUROCONTROL experts, 60% of IATA experts and 33% of CAAs gave 0-10 points to the
EU ETS. 50% of ANSPs, 33% of airlines, 67% of CAA/NSAs, 75% of individual experts
and the 100% of government bodies gave 15-25 points to EU ETS. 25% of ANSPs, 50% of
EUROCONTROL experts and 40% of IATA experts believe that the EU ETS contributes to
carbon neutral growth by 30-40 points. The EU ETS received 18 points on average.
Regarding the individual carbon offsetting programs from airlines the 24 experts gave 16
points on average. 66% of airlines, 75% of ANSPs, 100% of CAAs, 100% of
EUROCONTROL experts, 50% of individual experts, the 335 of government bodies and
100% of IATA experts gave 0-20 points. The remaining 33% of airlines, 25% of ANSPs,
50% of individual experts and 66% of government bodies gave 25-40 points (Table 57).
The individual carbon offsetting programs from states received less points, with minimum 0
and maximum only 25 points. The airlines and IATA reached consensus in this question.
Some induvial experts and ANSPs trust the states more than the governmental bodies and
the CAAs that would be the ones responsible should state carbon offsetting schemes be
implemented by states. The carbon offsetting schemes gathered on average 26 points out
of 100.
The horizontal flight efficiency factor gathered on average 48 points out of 100. Some
experts of the CAAs (33%) proved to be the biggest supporters of operational changes
giving to the direct routes factor 30 points, whereas the FRA factor received 50 points. The

291
airlines gave more factors to wind optimal routes, FUA and FRA than to direct routes. Yet
IATA gave less points to FRA.
The participants added two more factors to the list. The additional factors that were
proposed by more than one experts are the alternative fuels and the fleet renewal. Apart
from those, the vertical flight efficiency and the Global market-based mechanism as
collective programme by States were added. The additional factors gathered on average 8
points.
Table 57: Crosstab Factors leading to carbon neutral growth and Groups
Statement Scale 0-100
Airlines (n=3)
ANSPs (n=4
CAA/NSA (n=3)
ECTL (n=2)
Ind. Experts
(n=4)
Government Bodies (n=3)
IATA (n=5)
The EU ETS leads to carbon neutral growth.
0-9 66% 0% 33% 0% 25% 0% 20% 10-19 0% 50% 0% 50% 0% 0% 40% 20-29 33% 25% 67% 0% 75% 100% 0% 30-39 0% 25% 0% 0% 0% 0% 20% 40-49 0% 0% 0% 50% 0% 0% 20% 50-59 0% 0% 0% 0% 0% 0% 0%
60-69 0% 0% 0% 0% 0% 0% 0%
70-79 0% 0% 0% 0% 0% 0% 0%
80-89 0% 0% 0% 0% 0% 0% 0%
90-100 0% 0% 0% 0% 0% 0% 0%
Individual carbon offsetting programs from airlines lead to carbon neutral growth.
0-9 33% 0% 33% 0% 0% 0% 40% 10-19 0% 75% 67% 100% 50% 33% 60% 20-29 33% 25% 0% 0% 50% 33% 0% 30-39 0% 0% 0% 0% 0% 0% 0%
40-49 33% 0% 0% 0% 0% 33% 0% 50-59 0% 0% 0% 0% 0% 0% 0%
60-69 0% 0% 0% 0% 0% 0% 0%
70-79 0% 0% 0% 0% 0% 0% 0%
80-89 0% 0% 0% 0% 0% 0% 0%
90-100 0% 0% 0% 0% 0% 0% 0%
Individual carbon offsetting programmes from states lead to carbon neutral growth.
0-9 100% 0% 33% 0% 25% 33% 60% 10-19 0% 75% 67% 100% 50% 33% 40% 20-29 0% 25% 0% 0% 25% 33% 0% 30-39 0% 0% 0% 0% 0% 0% 0%
40-49 0% 0% 0% 0% 0% 0% 0%
50-59 0% 0% 0% 0% 0% 0% 0%
60-69 0% 0% 0% 0% 0% 0% 0%
70-79 0% 0% 0% 0% 0% 0% 0%

292
Statement Scale 0-100
Airlines (n=3)
ANSPs (n=4
CAA/NSA (n=3)
ECTL (n=2)
Ind. Experts
(n=4)
Government Bodies (n=3)
IATA (n=5)
80-89 0% 0% 0% 0% 0% 0% 0%
90-100 0% 0% 0% 0% 0% 0% 0%
Direct routes lead to carbon neutral growth
0-9 66% 25% 0% 0% 50% 33% 20% 10-19 33% 50% 66% 100% 50% 67% 40% 20-29 0% 25% 0% 0% 0% 0% 40% 30-39 0% 0% 33% 0% 0% 0% 0% 40-49 0% 0% 0% 0% 0% 0% 0%
50-59 0% 0% 0% 0% 0% 0% 0%
60-69 0% 0% 0% 0% 0% 0% 0%
70-79 0% 0% 0% 0% 0% 0% 0%
80-89 0% 0% 0% 0% 0% 0% 0%
90-100 0% 0% 0% 0% 0% 0% 0%
Wind optimal routes lead to carbon neutral growth
0-9 0% 25% 33% 0% 50% 67% 20% 10-19 33% 75% 67% 50% 50% 33% 40% 20-29 33% 0% 0% 50% 0% 0% 40% 30-39 0% 0% 0% 0% 0% 0% 0%
40-49 33% 0% 0% 0% 0% 0% 0% 50-59 0% 0% 0% 0% 0% 0% 0%
60-69 0% 0% 0% 0% 0% 0% 0%
70-79 0% 0% 0% 0% 0% 0% 0%
80-89 0% 0% 0% 0% 0% 0% 0%
90-100 0% 0% 0% 0% 0% 0% 0%
Flexible Use of Airspace (FUA) leads to carbon neutral growth
0-9 0% 25% 0% 0% 50% 33% 20% 10-19 100% 50% 100% 100% 50% 66% 60% 20-29 0% 25% 0% 0% 0% 0% 20% 30-39 0% 0% 0% 0% 0% 0% 0%
40-49 0% 0% 0% 0% 0% 0% 0%
50-59 0% 0% 0% 0% 0% 0% 0%
60-69 0% 0% 0% 0% 0% 0% 0%
70-79 0% 0% 0% 0% 0% 0% 0%
80-89 0% 0% 0% 0% 0% 0% 0%
90-100 0% 0% 0% 0% 0% 0% 0%
Free Route Airspace (FRA) leads to carbon neutral growth
0-9 0% 25% 0% 0% 50% 33% 60% 10-19 100% 50% 66% 50% 50% 33% 20% 20-29 0% 25% 0% 50% 0% 33% 20% 30-39 0% 0% 0% 0% 0% 0% 0%
40-49 0% 0% 0% 0% 0% 0% 0%
50-59 0% 0% 33% 0% 0% 0% 0% 60-69 0% 0% 0% 0% 0% 0% 20% 70-79 0% 0% 0% 0% 0% 0% 0%
80-89 0% 0% 0% 0% 0% 0% 0%
90-100 0% 0% 0% 0% 0% 0% 0%
Other 0-9 67% 100% 100% 100% 50% 67% 60%
10-19 0% 0% 0% 0% 25% 0% 20%

293
Statement Scale 0-100
Airlines (n=3)
ANSPs (n=4
CAA/NSA (n=3)
ECTL (n=2)
Ind. Experts
(n=4)
Government Bodies (n=3)
IATA (n=5)
20-29 33% 0% 0% 0% 25% 33% 0% 30-39 0% 0% 0% 0% 0% 0% 20% 40-49 0% 0% 0% 0% 0% 0% 0%
50-59 0% 0% 0% 0% 0% 0% 0%
60-69 0% 0% 0% 0% 0% 0% 0%
70-79 0% 0% 0% 0% 0% 0% 0%
80-89 0% 0% 0% 0% 0% 0% 0%
90-100 0% 0% 0% 0% 0% 0% 0%
Other
0-9 67% 100% 100% 100% 100% 100% 80% 10-19 0% 0% 0% 0% 0% 0% 0%
20-29 33% 0% 0% 0% 0% 0% 0% 30-39 0% 0% 0% 0% 0% 0% 20% 40-49 0% 0% 0% 0% 0% 0% 0%
50-59 0% 0% 0% 0% 0% 0% 0%
60-69 0% 0% 0% 0% 0% 0% 0%
70-79 0% 0% 0% 0% 0% 0% 0%
80-89 0% 0% 0% 0% 0% 0% 0%
90-100 0% 0% 0% 0% 0% 0% 0%
The new question about TCE was answered by 24 participants (Table 58). The most
important category of transaction costs was the ‘Development and Implementation of the
regulatory scheme’ with 27 points on average. This category did not reach consensus
among the participants. 100% of airlines, 25% of CAAs, 75% of individual experts and
20% of IATA experts gave 10-20 points to this category, whereas 100% of government
bodies gave 25-30 points, 80% of IATA experts gave 25-35 points, 75% of CAA gave 30-
40 points and 100% of ANSPs gave 30-45 out of 100 points.
The monitoring category gathered on average 18 points. Most of the participants gave less
than 20 points with the exception of 67% of airlines that gave 45 points, 33% of ANSPS
giving 30 points and 25% of individual experts that gave more than 50 points to this
category. The reporting and verification category gathered less points (mean=13). Almost
all the participants gave 10 point to this category. The most points (35) were given by 25%
of individual experts. This category reached consensus by the experts. The compliance
category with mean equal to 9 reached also consensus among the experts.

294
The ‘alternative policies’ category received 0 to 20 points and there was consensus among
the respected experts. On the other hand, the category ‘strategy’ gathered on average 18
points out of 100 but the expert did not agree on its value. This category received 5-60
points. All the participants gave less than 30 points to this category, apart from 33% of
airlines that gave 60 points. Nevertheless, there was consensus within the groups but not
across the groups. Out of the 24, 5 participants added an additional category. This
category received 5-15 points. The participants did not add any further details.
Table 58: Crosstab Transaction Costs in SES and Groups
Statement Scale 0-100
Airlines (n=3)
ANSPs (n=4
CAA/NSA (n=3)
ECTL (n=2)
Individual Experts
(n=4)
Government Bodies (n=3)
IATA (n=5)
Alternative Policies
0-9 33% 100% 0% 0% 25% 0% 0%
10-19 67% 0% 100% 50% 50% 67% 80% 20-29 0% 0% 0% 50% 25% 33% 20% 30-39 0% 0% 0% 0% 0% 0% 0%
40-49 0% 0% 0% 0% 0% 0% 0%
50-59 0% 0% 0% 0% 0% 0% 0%
60-69 0% 0% 0% 0% 0% 0% 0%
70-79 0% 0% 0% 0% 0% 0% 0%
80-89 0% 0% 0% 0% 0% 0% 0%
90-100 0% 0% 0% 0% 0% 0% 0%
Development and Implementation of the regulatory scheme
0-9 0% 0% 0% 0% 0% 0% 0%
10-19 100% 0% 0% 0% 50% 0% 0%
20-29 0% 0% 25% 50% 50% 33% 40%
30-39 0% 33% 50% 0% 0% 67% 60%
40-49 0% 66% 25% 50% 0% 0% 0%
50-59 0% 0% 0% 0% 0% 0% 0%
60-69 0% 0% 0% 0% 0% 0% 0%
70-79 0% 0% 0% 0% 0% 0% 0%
80-89 0% 0% 0% 0% 0% 0% 0%
90-100 0% 0% 0% 0% 0% 0% 0%
Monitoring
0-9 0% 0% 0% 0% 0% 0% 0%
10-19 33% 0% 75% 100% 25% 33% 100% 20-29 0% 67% 25% 0% 75% 67% 0% 30-39 0% 33% 0% 0% 0% 0% 0% 40-49 67% 0% 0% 0% 0% 0% 0%
50-59 0% 0% 25% 0% 25% 0% 20%
60-69 0% 0% 0% 0% 0% 0% 0%
70-79 0% 0% 0% 0% 0% 0% 0%
80-89 0% 0% 0% 0% 0% 0% 0%

295
Statement Scale 0-100
Airlines (n=3)
ANSPs (n=4
CAA/NSA (n=3)
ECTL (n=2)
Individual Experts
(n=4)
Government Bodies (n=3)
IATA (n=5)
90-100 0% 0% 0% 0% 0% 0% 0%
Reporting and verification
0-9 0% 0% 0% 0% 0% 0% 0%
10-19 100% 100% 100% 100% 75% 66% 60% 20-29 0% 0% 0% 0% 0% 33% 40% 30-39 0% 0% 0% 0% 25% 0% 0% 40-49 0% 0% 0% 0% 0% 0% 0%
50-59 0% 0% 0% 0% 0% 0% 0%
60-69 0% 0% 0% 0% 0% 0% 0%
70-79 0% 0% 0% 0% 0% 0% 0%
80-89 0% 0% 0% 0% 0% 0% 0%
90-100 0% 0% 0% 0% 0% 0% 0%
Compliance
0-9 0% 100% 0% 0% 0% 0% 40%
10-19 33% 0% 100% 100% 100% 100% 60% 20-29 0% 0% 0% 0% 0% 0% 0%
30-39 0% 0% 0% 0% 0% 0% 0%
40-49 0% 0% 0% 0% 0% 0% 0%
50-59 0% 0% 0% 0% 0% 0% 0%
60-69 0% 0% 0% 0% 0% 0% 0%
70-79 0% 0% 0% 0% 0% 0% 0%
80-89 0% 0% 0% 0% 0% 0% 0%
90-100 0% 0% 0% 0% 0% 0% 0%
Strategy
0-9 0% 33% 25% 0% 0% 0% 0%
10-19 67% 0% 50% 0% 50% 67% 60% 20-29 0% 33% 25% 100% 50% 33% 40%
30-39 0% 33% 0% 0% 0% 0% 0%
40-49 0% 0% 0% 0% 0% 0% 0%
50-59 0% 0% 0% 0% 0% 0% 0%
60-69 33% 0% 0% 0% 0% 0% 0%
70-79 0% 0% 0% 0% 0% 0% 0%
80-89 0% 0% 0% 0% 0% 0% 0%
90-100 0% 0% 0% 0% 0% 0% 0%
Other
0-9 100% 100% 75% 100% 100% 100% 60%
10-19 0% 0% 25% 0% 0% 0% 40% 20-29 0% 0% 0% 0% 0% 0% 0%
30-39 0% 0% 0% 0% 0% 0% 0%
40-49 0% 0% 0% 0% 0% 0% 0%
50-59 0% 0% 0% 0% 0% 0% 0%
60-69 0% 0% 0% 0% 0% 0% 0%
70-79 0% 0% 0% 0% 0% 0% 0%
80-89 0% 0% 0% 0% 0% 0% 0%
90-100 0% 0% 0% 0% 0% 0% 0%

296
Regarding the transaction costs in SES the participants in the question ‘Overall, how
important do you consider transactions costs to be for the effective functioning of the
environment KPA in the SES Performance scheme?’ reported that this cost is important.
67% of airlines, 67% of ANSPs, 75% of CAA/NSAs, 50% of EUROCONTROL experts,
50% of individual experts, 67% of government bodies and 40% of IATA experts stated that
is an important cost for the effectiveness of SES performance scheme. 20% of IATA
experts, 33% of government bodies and 50% of EUROCONTROL experts marked it as a
very important parameter.
7.3 Summary
The questionnaires developed after consultation with key aviation professionals proved
effective for the purpose of the present research. With few exceptions, the participants
seem to have comprehended the questions and did not add other factors or. From the
Delphi research that has been carried out in two rounds from May 2014 until May 2016, it
may be deduced that the experts identified some key issues affecting the efficiency of the
EU ETS and SES reforms. The majority of the participants agreed that reorganization of
the airspace and the implementation of the SES were necessary. Moreover, the
participants agreed that the implementation of the SES is quite slow. The different
components of SES were evaluated and the added value of SES and FABs was verified.
As far as the inclusion of aviation to the EU ETS is concerned, the participants agreed that
the EU ETS contributes towards the reduction of aviation emissions. Concerns were
expressed regarding the technical terms and conditions of EU ETS. Nevertheless, all the
participants agreed that the carbon neutral growth cannot be achieved only via EU ETS.
Factors such as flight efficiency were highly prioritized. This was also the result that
emerged from the SES questionnaires.

297
Stability and consensus were achieved in most of the factors both within the group but also
among the groups for both questionnaires. Summing up the results from the Delphi
method, it may be concluded that there is no single factor leading to carbon neutral
growth, albeit a combination. The factors that contribute to carbon neutral growth in the
aviation sector are the EU ETS and carbon-offsetting scheme, flight efficiency,
technological fleet improvements and the use of alternative fuels.
The addition of the question regarding the transaction cost categories of the EU ETS and
SES reforms in to the Delphi second round proved very wise because the participants’
replies offered valuable information. All the participants in both questionnaires agreed that
transactions costs occur due to the implemented reforms. Different importance factors
were given to the different categories. As far the EU ETS is concerned, the most important
categories were the implementation of emissions management and the monitoring,
reporting and verification of allowances. As far as the SES is concerned, the most
important transaction cost categories were the development and implementation of the
regulatory scheme, the monitoring of the scheme and the strategy of the scheme.

298
This page is intentionally left blank

299
8 Discussion
This section analyses the aviation environment stakeholders and the dynamics in relation
to Single European Sky and European Union Emissions Trading Scheme as captured from
the participant observation, the unstructured interviews and the Delphi Method. In this
chapter, the results from the primary research, i.e. the participant observation, the
unstructured interviews and the Delphi Method, enriched with any other necessary
information are combined, analysed and discussed.
It is evident that most schemes are not delivering to the degree to which they should. For
instance, the horizontal en-route flight efficiency (shorter routes) of the last filed flight plan
trajectory improved slightly in 2013, but this was not enough to meet the target profile. The
results from 2014 (4.9%), measured in deviations of the flight plan trajectory from the great
circle distance and summed over all IFR (instrument flights rules) in the European Union,
indicate that the RP1 target of 4.67% was not achieved.
8.1 Aviation Governance
Governance is the process by which decisions are implemented or not implemented.
Governance in Europe is multi-level where ‘supranational, national, regional, and local
governments are enmeshed in territorially overarching policy networks’ (Marks, 1993:
402). There is a growing interdependence between governments operating at different
territorial levels. This makes the arrangements complex for taking decisions in increasingly
dense networks of public and private, individual and collective actors. In the aviation
industry mainly due to its international nature, governance is a very important element. In
addition to the multi-level aviation governance, there is also multi-stakeholder governance
which is the approach followed in this PhD thesis. The multi-stakeholder governance
approach considers the different states as stakeholders. The main issues that are
important with respect to EU ETS and SES reforms are the readiness of the states, the

300
incentive mechanism (associated with the willingness to take action) and the trade-offs
between the different areas. Governance has emerged as an approach to understanding
the dynamic inter-relationship within and between different levels and groups of
stakeholders.
8.1.1 Member States Readiness
The interviewees N.02, N.05 and N.04 discussed at length the differences in the countries.
They mentioned that not all countries are ready for the reforms or at least progress at the
same rate as others. This was also noted by the researcher in the participant observation
and in the meeting held with the different member states. Not all the states are in the same
position neither do they have the capability to deliver results at the same level. To prove
that not all the states are the same the Global Competitiveness Report prepared by the
World Economic Forum (2015) is used to assess the readiness of each state involved in
EU ETS and SES. To undertake structural changes. The examples of Greece and The
Netherlands will be used to shed further light in this context.
The Global Competitiveness Report is used because it gives a Growth Competitiveness
Index, which is based on three broad components: macroeconomic environment; quality of
public institutions; and technology. Within each component are major subcomponents, for
example, the macroeconomic environment consists of macroeconomic stability,
government waste, and country credit rating. Furthermore, this report gives an insight on
the willingness/openness of a country to the reforms by taking into consideration the
openness of the economy to trade and finance; the role of the government budget and
regulation; the development of financial markets; the quality of infrastructure; the quality of
technology; the quality of business management; the labour market flexibility; and the
quality of judicial and political institutions.

301
Figure 32: The Global Competitiveness Index framework (WEF, 2015)
Table 59 focuses on the sustainable growth and the Global Competitiveness Index (GCI).
The sustainable growth sub-index is measuring the extent to which the natural
environment is contributing to overall national competitiveness and the preservation of a
pollution-free environment (WEF, 2014).
Table 59: Sustainable Growth Sub-index in the 2014 Edition and Global Competitiveness Index 2015–2016 (based on WEF, 2014; WEF, 2015)
Country GCI 2015-2016
Score (1–7)
Environmental
sustainability 2014
Score (1–7)
Austria 5.12 5.43
Belgium 5.20 4.62
Bulgaria 4.32 3.94
Croatia 4.07 4.67

302
Country GCI 2015-2016
Score (1–7)
Environmental
sustainability 2014
Score (1–7)
Cyprus 4.23 3.96
Czech Republic 4.69 4.18
Denmark 5.33 5.27
Estonia 4.74 4.67
Finland 5.45 5.75
France 5.13 5.03
Germany 5.53 5.18
Greece 4.02 4.27
Hungary 4.25 3.59
Ireland 5.11 4.42
Italy 4.46 4.36
Latvia 4.45 5.48
Lithuania 4.55 4.93
Luxembourg 5.20 4.68
Malta 4.39 3.89
Netherlands 5.50 4.77
Poland 4.49 4.07
Portugal 4.52 5.06
Romania 4.32 3.94
Slovak Republic 4.22 4.34
Slovenia 4.28 5.17
Spain 4.59 4.86
Sweden 5.43 5.83
United Kingdom 5.43 4.77
8.1.1.1 Readiness issue: The case of Greece vs The Netherlands
The Dutch economy remains one of the most sophisticated and innovative in the world. Its
GDP per capita is 51,373 US$. The Netherlands’ Global Competitiveness Index is 5.5/7.
The 1st Pillar of Global Competitiveness Report (GCR) is institutions. With regard to the
institutions, the country received a score of 6/7. The infrastructure was ranked 3rd out of
the 140 participating countries with a score of 6.3. In particular, the Quality of air transport
infrastructure received 6.4/7 and was ranked 4/140. The macroeconomic environment

303
received 5.7/7, the financial market development got 4.4 and the technological readiness
got 6.1/7 position the Netherlands in the 10th position out of 140.
Figure 33: Comparison of the Netherlands with the advanced economies in the 12 pillars of GCI (1: low score and 7: high score) (WEF, 2015: 276)
The figure above shows the comparison of the Netherlands with other advanced
economies. The Dutch economy is quite strong. It has risen from 8th to 5th place in the
Global Competitiveness Report due to its excellent school system, efficient infrastructure,
reliable public administration and permanent focus on innovation.

304
Figure 34: The most problematic factors for doing business in the Netherlands (WEF, 2015)
In the Netherlands, 52% of the flights are overflights, 46% are international departures and
arrivals and 2% are domestic flights. Based on NM archived data, traffic in the Netherlands
increased by 2.9% during summer 2015 (May to October), when compared to summer
2014. The average en-route delay per flight slightly decreased from 0.17 minutes per flight
during summer 2014 to 0.13 minutes per flight in summer 2015. 46% of the delays were
due to ATC Capacity, and 28% because of Weather (LSSIP the Netherlands, 2015). The
main National Stakeholders involved in ATM in the Netherlands are the following:
The Ministry of Infrastructure and the Environment (MoI&M, “Ministerie van
Infrastructuur en Milieu”); - The Human Environment and Transport Inspectorate
(ILT (CAA-NL), “Inspectie Leefomgeving en Transport”);
The Ministry of Defence (MoD, “Ministerie van Defensie”) / Military Aviation
Authority (MAA, “Militaire Luchtvaart Autoriteit”);
Air Traffic Control The Netherlands (LVNL, “Luchtverkeersleiding Nederland”);
Royal Netherlands Air Force (RNLAF, “Koninklijke Nederlandse Luchtmacht”);

305
The Netherlands Air Traffic Committee (LVC, “Luchtverkeerscommissie);
The EUROCONTROL Maastricht Upper Area Centre (Maastricht UAC).
Their activities are detailed in the following subchapters and their relationships are shown
in the diagram below (Figure 35).
Figure 35: The main National Stakeholders involved in ATM in the Netherlands (LSSIP the Netherlands, 2015)
On the other hand, Greece has GDP per capita 21,653 US$. The GCI score for 2015-2016
is 4/7 which puts Greece in 81st position out of 140. The first pillar of GCR, i.e. Institutions
received 3.7/7 points. In terms of infrastructure Greece was ranked 34th out of 140 with a
score of 4.8/7. The quality of air transport infrastructure received 5.1/7 points putting
Greece in the 37th position. The macroeconomic environment is quite hectic with a score
3.3/7 positioning Greece in the 132nd position out the 140 participating countries. The
technological readiness received 4.9/7 points. According to the WEF report the most
problematic factors for doing business in Greece is the access to financing, the inefficient
government bureaucracy, the political instability and the corruption.

306
Figure 36: The most problematic factors for doing business in Greece (WEF, 2015)
Figure 37: Comparison of Greece with the advanced economies in the 12 pillars of GCI (1: low score and 7: high score) (WEF, 2015: 276)
Greece has one ANSP. In 2014 48% of the flights were overflights, 37% were international
departures/arrivals and the remaining 14% was domestic flights (LSSIP Greece, 2015). In
Athinai ACC the average en-route delay per flight increased from 0.67 minutes per flight in
summer 2014 to 1.46 minutes per flight in summer 2015. 60% of delays were due to ATC

307
capacity and 39% because of ATC staffing. In Macedonia ACC the average en-route delay
increased from 0.24 minutes per flight in summer 2014 to 0.75 minutes per flight in
summer 2015. 62% of delays were due to ATC staffing, and 37% because of ATC
capacity.
In the Local Single Sky ImPlementation (LSSIP) GREECE report of 2015 (2015:23) it is
stated that:
‘The main reasons for shortfalls in the Greek ANS system are the economic and
social problems prevailing in Greece in the recent years. That has resulted in lack
of investments in ANS infrastructure and lack of personnel. New approaches to
allow timely developments and implementation of operational plans including staff
availability/recruitment are expected to be put in place.’
The main National Stakeholders involved in ATM in Greece (LSSIP Greece, 2015) are the
following:
Ministry of Infrastructure, Transport & Networks (MITaN)
Ministry of National Defence (MND)
Hellenic Air Force (HAF)
Hellenic Air Navigation Service Provider (HANSP) – Air Navigation Services
Provider
Hellenic Military Air Navigation Services Oversight Division (H-MANSOD)
Hellenic Air Force- Search and Rescue Service (HAF/SAR)
Air Accident Investigation and Aviation Safety Board (AAIASB)
Hellenic National Meteorological Service (HNMS) – Meteorological Service Provider
Hellenic Air Navigation Supervisory Authority (HANSA) – National Supervisory
Authority
Hellenic Civil Aviation Authority (HCAA) – Civil Aviation Regulator
o Regional Services (HCAA/REGS) – Airports Operator

308
o Civil Aviation Training Centre
Their relationships are shown in Figure 38.
Figure 38: The main National Stakeholders involved in ATM in Greece (LSSIP Greece, 2015)
If we had to compare Greece and the Netherlands, based on the competitiveness of the
countries, the Netherlands is far more advanced than Greece. Figure 39 shows the
differences of the two countries in the 12 pillars that demonstrate their competitiveness.
Therefore, the two countries cannot progress at the same rate.

309
Figure 39: Comparison of Greece and The Netherlands(1: low score and 7: high score) (created by the author based on WEF, 2015)
In terms of what is expected from the Countries/FABs for the Performance Scheme every
FAB and every country has a different target. In the example below (Table 60), Blue Med
for the period 01 January 2015 till 31 December 2015 the KEP was 5.17% whereas
FABEC was 6.14%. Regarding the KEA, the target for 2015 was 3.3% for FABEC and
2.78% for Blue Med. The EU Wide KEP target was 4.78% (Actual KEP=4.84%) and KEA
target was 2.96% (actual KEA=2.83%).
Table 60: Environment KPI #1: Horizontal en-route flight efficiency [%] (NM, 2016)
Entity (based on FIR) KEP [2015] KEA [PP tgt. 2015] KEA [2015] Dif.
Baltic FAB 3.17% 1.50% 1.62% 0.12%
BLUE MED FAB 5.17% 2.78% 2.83% 0.05%
DANUBE FAB 3.16% 1.55% 1.29% -0.26%
0
1
2
3
4
5
6
7Institutions
Infrastructure
Macroeconomicenvironment
Health and primaryeducation
Higher education andtraining
Goods marketefficiency
Labor market efficiency
Financial marketdevelopment
Technologicalreadiness
Market size
Business sophistication
Innovation
Netherlands Greece

310
Entity (based on FIR) KEP [2015] KEA [PP tgt. 2015] KEA [2015] Dif.
DK-SE FAB 2.55% 1.20% 1.22% 0.02%
FAB CE 3.42% 1.99% 1.93% -0.06%
FABEC 6.14% 3.30% 3.36% 0.06%
NEFAB 2.07% 1.35% 1.44% 0.09%
SW FAB 4.13% 3.85% 3.41% -0.44%
UK-Ireland FAB 5.94% 3.36% 3.50% 0.14%
SES Area (RP2) 4.84% 2.96% 2.83% -0.13%
Hence, there are different targets for the countries based on their historic performance. It
should also be highlighted that the Netherlands have both LVNL and Maastricht UAC
offering ATC to the country. MUAC is a very sophisticated and efficient provider hence the
Netherlands have a strong advantage. Greece on the other hand is lacking economic
resources, faces serious staffing shortages and it should be noted that in terms of
education there are no aeronautical or airspace engineering schools in the country. Some
should also evaluate the supporting industry behind the aviation industry. Greece is
located quite far from the strong economic centres of Europe and its relations with the
supporting mechanism (e.g. CANSO, EC) are not as strong as those of the Netherlands.
Hence, different targets might have been established based on the up that time
performance, but the current and future situation of the countries has not been evaluated
as well as their readiness for the reform. This statement has also been supported by the
interviewees N.04 and N.01.

311
8.1.2 Incentive Scheme
Air Navigation Service Providers are given incentives by the EC to enhance their
compliance and efficiency to the Performance Regulation. The risk-sharing mechanism of
the charging scheme, i.e. the sharing of the financial risk between Member States/ANSPs
and airspace users, is seen as a meaningful economic incentive for ANSPs to be more
cost–efficient taking advantage of good management, economies of scale and productivity
gains. According to Crespo and Mendes De Leon (2011: 161) ‘this creates a regime close
to a cost capping in a multi-annual framework’. According to article 12 of Reg. 390/2013
with a link to Commission Implementing Regulation (EU) No. 391/2013, the incentives
shall be part of the regulatory environment known ex ante by all stakeholders and be
applicable during the entire reference period. Moreover, the incentives on environment and
capacity shall be financial and the NSA should enforce corrective actions if necessary.
Safety is a KPA that does not have any incentives mechanisms due to it uncompromising
nature. The maximum number of aggregate bonuses and the maximum amount of
aggregate penalties shall not exceed 1% of the revenue from air navigation services in
year n.
The Performance Plan of DANUBE in the Appendix 3 section 4.1 has a general description
for the KPA environment and it is not an effective incentive. For the Capacity KPA the
incentive is financial for both ANSPs, i.e. ROMATSA and BULATSA and it was decided to
have bonuses or penalties equal to 0.1% of revenue from en route air navigation services
(see Appendix 3 section 4.1).
According to IATA, the Association of European Airlines, and the European Regions
Airline Association (2013) ‘the targets and financial incentives set must cascade through
the entire ATM supply chain with binding mechanisms between the states and their
various air navigation services providers issued on a limited and regularly reviewed term

312
with binding performance obligations’. All the interviewees highlighted the importance of
incentive mechanisms for the implementation and success of both SES and EU ETS.
8.1.3 Trade-offs between the KPAs
Flight efficiency always involves trade-offs between the different areas (interviewees N.01,
N.02, N.03, N.04, N.05, N.06, N.07), for instance safety versus capacity, fuel cost versus
time cost, ground versus airborne delay, noise versus emissions, etc. Excess fuel burn in
the Air Traffic Management system is primarily characterized by flight delay costs and
flight efficiency costs. Flight delays occur when an airport or airspace resource (runway,
gate, taxiway, or airspace sector) has greater demand than the available capacity. Flight
delays tend to grow exponentially with increased levels of traffic. Flight efficiency is
measured as the increased flight time, distance, and fuel compared to an “ideal” flight
trajectory.
As per the DANUBE FAB Performance Plan section 3.3 - Description of KPAs
interdependencies and trade-offs:
"Safety
Safety KPA establishes mandatory requirements in ATM operations and
represents the key element of ANS. No safety compromises should be made in
order to improve other KPAs especially the cost-efficiency. The Performance
Scheme Regulation and corresponding targets for RP2 are more oriented on cost-
effectiveness while focusing less on the safety key performance area. Thus, for
the second reference period and the next to come the biggest challenge for States
and FABs will be to keep focusing on safety while trying to achieve the targets in
different KPAs.
Capacity
The very good performance of ATFM delays recorded by the DANUBE FAB in the
last five years and for RP2 implies extra cost through investments, staff and
corresponding procedures. DANUBE FAB RP2 capacity targets followed the PRB
expectations and indicative figures while contributing to the very challenging cost-
efficiency objectives. We appreciate that having one of the most reduced FAB

313
determined unit cost and ATFM delays represent a very challenging objective and
should be carefully assessed.
Environment
Similarly, to the capacity targets the flight efficiency requires extras cost through
investments, staff and corresponding procedures that are requested for reaching
the targets. "
8.1.3.1 Example of Environment Vs Unit Rate Cost
The flight Milano- Brindisi can follow different routes. In Figure 40 two different routes are
given. The green flight path is sorely within Italy, whereas the red path is passing through
Croatia. The Great Distance Cycle (GDC) are the dashed lines in the map. For the red
flight path, i.e. the one passing from Croatia the GDC is calculated firstly from Milano to
the border of the FIR and then within Croatia for the other intersections of the flight plan
with the charging zone and then to Brindisi. Compared to the flight plan contained entirely
within Italy, the route through Croatia implies a reduction of 430 km in Italy and an
increase of 477 km in Croatia.
For an aircraft weighing 80 metric tonnes, the price (for the unit rate) per kilometre (July
2013) is €1.00 in Italy and €0.53 in Croatia. The longer route (through Croatia) is therefore
€177.19 cheaper (430km x €1.00 – 477km x €0.53). The reason for this significant
difference in cost is the different Unit Rate in the two charging zones. The airplane might
burn additional fuel by a longer distance but the total savings are higher if the plane flies
through Croatian airspace. In this specific example, the additional distance is 47km for the
plan through Croatia. It is cheaper for the airspace user to file (and fly) the longer flight
plan as long as its operating costs per kilometre are less than €3.77 (€177.19 / 47km).
According to PRB Annual Monitoring Report 2012 (2013: 21) ‘such a situation exposes the
risk of possible unintended consequences of the current rules. They might constitute an
incentive for airspace users to file longer routes with a detrimental effect on the horizontal

314
flight efficiency indicator (KEP). They might create cost competition based on Unit Rates,
in order to attract traffic’.
Figure 40: Two alternative routes between Milan and Brindisi
Avoiding expensive unit rates and asking for direct routing may have negative impacts on
safety due to sector overloads and on capacity due to ACC under and overload. This is the
argument that is used for the implementation of single unit rate per FAB, an action that is
quite complex given the diverse local financial arrangements.
8.2 Multi-Stakeholder Governance in Aviation
In SES, there are three main levels of governance. There is the political level (EC), the
management level (Deploy manager) and the Implementation level (Project managers).
Hence, the multi-stakeholder governance theory will be applied to better understand the
underlying issues in SES and EU ETS implementation as well as the possible solutions for
the different stakeholders’ points of view. Schwab developed a stakeholder theory of
management of industrial manufacturing firms in the 1960s. Schwab argued that in order
to be effective in maximizing a firm’s potential, managers should consider the interests of

315
all the stakeholders in the firm, i.e. shareholders, customers and clients, employees, but
also the broader interests of the communities within which the firm is situated, including
neighbours in the immediate proximity of the firm, governments, and fellow users of the
environment in which the firm operates. Governments can be counted as stakeholders
since they certainly affect organisations and groups through their regulatory policies
(Moloney, 2006). In the aviation industry and especially when considering the SES and EU
ETS governments are one of the most ‘strong’ stakeholders. Moreover, within
governments as a group there are specific governments with even stronger power of
influence (Interviewee N.02).
The stakeholders can be primary players, for instance the airlines, or secondary players,
for instance education and training providers. The different stakeholders are different
types of groups or entities that do not represent themselves and communicate to other
bodies in the same way hence the Multi-Stakeholder Governance (MSG) approach and
problem solving become more complex as it was realised during the participant
observation.
Figure 41: Aeronautical data chain stakeholders (Dutch Ministry of Infrastructure and the Environment, 2013:7)

316
The graph above shows the overview of the aeronautical data chain elements and the
relationships with the different stakeholders in The Netherlands. It is evident that for
Aeronautical Information Services there are a lot of stakeholders to manage and their
communication can be complex.
Figure 42: Multi-stakeholder theory of governance in aviation (based on Schwab and WEF, 2007)
The stakeholders as stated in a previous chapter face four major attributes, 1) the
stakeholders’ position on the reform issue, i.e. SES and EU ETS; 2) the level of influence
(negotiation power) they hold; 3) the level of interest they have in SES and/or EU ETS;
and 4) the group/coalition to which they belong or can reasonably be associated with.
These attributes are identified through various data collection methods, including
interviews with experts and with the actual stakeholders directly, as well as from literature
review and public announcements.
8.2.1 The Positions of the Stakeholders
Based on a creative amalgamation of the participant observation and the unstructured
interviews, the positions of the SES and EU ETS stakeholders are stated in the following

317
subsections. According to interviewees N.01, N.06 and N.07 it is of critical importance to
understand who are the stakeholders and their positions in order to manage them. The
main stakeholders in the EU ETS and SES reforms are the European Commission,
European Parliament and National Governments, the airspace users, the organizations
and institutions and the Air Navigation Service Providers. In this section their positions, as
interpreted from the participant observation and the semi-structure interviews, will be
presented.
8.2.1.1 European Commission, European Parliament, and National Governments
The European Parliament (EP) is the final decisions maker of the reforms. The European
Parliament may approve or reject a legislative proposal, or propose amendments to it. The
EP recognises that it has a duty to make a positive contribution to welfare and sustainable
development as a long-term goal, both through its political and legislative role. The
Parliament mentions in the website that it has always been keen on removing the
obstacles of the SES implementation following a pragmatic approach. The EP is working
closely with the European Commission in this matter. The European Commission’s
position is the same with the European Parliament’s position (interviewee N.02). As per EP
website (europarl.europa.eu, 2016):
‘Given that the major objectives of the Single European Sky are still to be
achieved, Parliament is now calling on the Commission to switch from a ‘bottom-
up’ to a ‘top-down’ approach, in order to overcome remaining reticence and to
speed up the implementation of the initiative, notably with respect to the SESAR
programme and the functional airspace blocks.’
Moreover, the Industry Consultation Body was established under Article 6 of Regulation
549/2004 which was formed after the Parliament proposed it. It should be noted that the
Members of the European Parliament are directly elected by voters in all Member States to
represent people’s interests with regard to EU law-making and to make sure other EU
institutions are working democratically. It is implied that the EP is affected many times from

318
the industry bodies in terms of policy making. As the British politician Shirley Williams
(from Van der Brug and De Vreese, 2016:79) remarked:
The “democratic deficit” is the gap between the powers transferred to the
Community level and the control of the elected [European] Parliament over them,
a gap filled by national civil servants operating as European experts…and to some
extent by organized lobbies, mainly representing businesses.
The PRB white paper on RP3 Performance Objectives (2016) states that the regulation
and oversight is quite weak. It also argued that the Member States and their ANSPs have
a ‘vested interest’ in maintaining monopolies and lack of competition as they benefit from
this. PRB (2016: 8) also mentioned that ‘Unhelpful behaviours and gaming are observed.
Not only in the regulated community but also in the operational elements of the legislation’.
Since most of the ANSPs are government owned and the charging scheme is such that
the ANSP cannot make a loss, the national governments have a strong incentive to
preserve the situation as it is in terms of ownership and competition. Thus, Ministries retain
control of the infrastructure and manage the interaction within its regulating bodies leaving
clear conflicts of interests (PRB, 2016). Hence, the independence and credibility of the
regulator is a function of the political economy that creates the regulator, sets its goals and
instruments, and is always in a position to subsequently change the rules.
8.2.1.2 Airspace Users
The term airspace users refer to aircraft operators and especially airlines. Most of the
airlines are private owned. Their main objective to increase their revenues and to decrease
their costs. The costs of airlines are: fuel; cost of operations; pax services; airport and ANS
charges; distribution; aircraft ownership; and maintenance. SES is affecting the cost of fuel
and the navigation charges. Due to SES, the routes will be shorter, thus more fuel efficient
and the navigation cost is decreasing through the performance scheme KPA Cost
Efficiency. Hence airlines are in favour of the SES reform of ATM. Depending on the

319
business model (LCC or FSNC), the direct cost for ANS represents between 6 and 20% of
the total operating costs (TOC), excluding fuel. In addition, there are additional costs for
delays and flight inefficiencies (due to longer routes and more fuel consumption) (EC,
2015).
Regarding the EU ETS it needs to be highlighted that this a regulation for the airlines.
Since most of the airlines are private, they try to be as cost efficient as possible. Fuel is
considered the second or the third highest cost (depending on the fuel price). Airlines try to
consume as much as possible. The fuel consumption is directly related to carbon
emissions, thus by minimising its consumption airlines are minimising their carbon
footprint. However, in order for the minimum consumption of fuel to be achieved, airlines
need to invest in airplanes, new technologies, trainings of pilots and other measures.
Thus, the EU ETS regulation causes stress to many airlines. The majority of airlines
oppose the inclusion of aviation in EU ETS. On the other hand, there are some airlines
that are already following a more environmentally friendly approach and are investing a lot
of capital to the environmental improvement of their operations. Thus, those airlines
embrace the EU ETS principles and concepts. Another condition that influences the
position of the airline towards EU ETS is the size of the airline and the ownership. Airlines
that have a small fleet and few operations, the time and effort that they invest in EU ETS
exceeds the benefits they will get back. Moreover, airlines that are government owned
need to have the approval of the ministry in order to do radical changes in the fleet or the
management of the operations. Finally, it is also a matter of available expertise and
mentality. Small airlines lack the necessary expertise in order to follow fuel-efficient
strategies and operate sophisticated software for fuel planning operations.
8.2.1.3 Organisations and Institutions
The Institutions/Organisations related to SES are EUROCONTROL; the International Air
Transport Association (IATA); the Association of European Airlines (AEA); and the

320
European Low Fares Airline Association (ELFAA); the Trade Unions, in particular the
European Transport Workers' Federation (EFT) and 'Air Traffic Controllers European
Union Coordination' (ATCEUC); and CANSO. In terms of EU ETS, the trade unions and
CANSO are not an important stakeholder.
EUROCONTROL is an independent organisation and does not have a position on the
reforms. It supports and follows the regulations promoting the efficiency and effectiveness
of the aviation systems for all its 41 Members States equally. IATA on the other hand has
the mission to represent, lead, and serve the airline industry. As per IATA’s website
(IATA.org, 2016c) ‘Advocating for the interests of airlines across the globe, we challenge
unreasonable rules and charges, hold regulators and governments to account, and strive
for sensible regulation’.
The airlines are following the developments on SES and they want the aviation system
both in terms of charges and in terms of operations to be more efficient. AEA promotes the
reduction of emissions and environmental impact, but claims that due to the stop the clock
the EU ETS has a negative impact on airlines operating on European routes and is looking
forward to the reassessment of ETS following the outcome of the 2016 ICAO assembly.
ELFAA’s mission statement is ‘to ensure that European policy and legislation promote free
and equal competition to enable the continued growth and development of low fares into
the future, allowing a greater number of people to travel by air. John Hanlon (2013),
Secretary General of ELFAA said:
‘ELFAA has consistently supported the inclusion of aviation in EU ETS. ELFAA
renews its call for the reinstatement of full scope EU ETS, to restore environmental
effectiveness and remove the unfair discriminatory burden of a limited scope’.
The Trade Unions of ATCOs are opposing the way the SES is designed and is
implemented due to the insecurity they feel for their jobs and salaries. One of the main
targets of SES is to reduce the charges for airlines and the charges is related to the

321
ATCOs salaries. In addition, programs like the Remote and Virtual Tower (RVT), is a risk
for the demand of ATCOs. Hence, they are opposing to some elements of SES. In terms
of EU ETS, they have a neutral position.
8.2.1.4 Air Navigation Service Providers
ANSPs have two diverse positions for the SES and neutral position for EU ETS. Those
ANSPs that are state enterprises/bodies, i.e. owned by the state follow the position of the
state, i.e. preservation of the natural monopoly. Other ANSPs, that are more profit
orientated like NATS, might be in favour of the reforms in order to be given the opportunity
to overtake services provided by other ANSPs. Those services are mostly Terminal
Control (TWR) or Approach Control (APP). With the current national regulations, there is
the requirement/limitation that the ATCOs speak the country’s language especially in APP
and TWR control. Moreover, to comply with the Performance Scheme rapid and drastic
changes in the operations need to be done and many times the ANSPs personnel are not
willing to adapt. Finally, the SES requires investments in the infrastructures that the
ANSPs budget may not be sufficient.
8.2.2 The level of influence and interest
The effective power of the industry, i.e. the degree of power the stakeholder holds over
other groups in relation to a reform of the aviation environment, is very strong. In Table 61,
a general overview of the power and interest is depicted as it was identified by the
participant observation and the unstructured interviews. The blue and red coloured
bubbles represent the SES reform and the EU ETS respectively. Bubble number 1
represents the airlines that have high power and high interest. Bubble number 2
represents the academic community that has low power, but high interest. Bubble number
three is the ANSPs that have high interest in the SES reform and quite high power too
(due to strong Trade Unions and natural monopolistic power). The bubble number 4 in

322
Table 61, is the regulator either in the form of CAA/NSA or in the form of EC or EP. The 4th
bubble has the highest power and the highest interest in the reform. Bubble number 5 is
the airports. The airports, concerning the SES, benefit in terms of on ground ATC
improvements, but their role is more as an observer than as an active participant. The
sixth bubble represents the organisations/associations and institutions like IATA and
EUROCONTROL. Bubble number 7 in Table 61is the fuel suppliers. The fuel suppliers
have high power but low interest in SES. The 8th bubble represents the manufacturers.
The manufacturers have higher power than fuel suppliers do, but lower interest compared
to airports or airlines. The ninth bullet is the system providers. They have high power and
high interest in SES.
Table 61: Power-Interest Matrix of SES (blue bubbles) and EU ETS (red bubbles) (source: own elaboration)
Regarding the EU ETS, the red bubbles depict the power and interest of the different
players. The airlines, which consider EU ETS, i.e. bubble number 1, have high interest and
2
5
7
8
5
3
1
3 7
8
1
6
4
9
9
High Power & Low Interest
Low Power & Low Interest
Low Power & High Interest
High Power & High Interest
1: Airlines
2: Academia
3: ANSPs
4: CAAs/NSAs
5: Airports
6: Organisations
7: Fuel suppliers
8: Manufacturers
9: System providers

323
relatively high power over the reforms (see example about ‘stop the clock’). Bubble 2
represents the academic society, which has high interest on EU ETS, but low power. The
ANSPs (bubble 3) have no interest and little power over the EU ETS. The regulators, i.e.
bubble number 4, have the same interest and power as in the SES. Bubble number 5, i.e.
the airports, have low power and low interest in EU ETS reforms. The 6th bubble is in the
exact position as the SES. Institutions and Associations as an entity have the same
interest and power over the 2 reforms. The fuel suppliers, i.e. bubble number 7, have quite
high power due to their oligopolistic power, and high interest regarding the environmental
targets set to airlines. The manufacturers (bubble 8) have high power and high interest on
EU ETS performance due to the possible change in the demands of the airlines. Finally,
the system providers, i.e. red bubble 9 have low interest and low power over EU ETS.
Based on Chinyio and Olomolaiye’s (2010:8) seven (7) principles of stakeholder
management, the regulators should:
1. ‘Acknowledge and actively monitor the concerns of all legitimate stakeholders, and
take their interests appropriately into account in decision-making and operations.
2. Listen and openly communicate with stakeholders about the latter’s respective
concerns and contributions, and about the risks that the regulators assume because
of their involvement with the corporation.
3. Adopt processes and modes of behaviour that are sensitive to the concerns and
capabilities of each stakeholder’s constituency.
4. Recognise the interdependence of efforts and rewards among stakeholders, and
attempt to achieve a fair distribution of the benefits and burdens of corporate activity
among them, taking into account the stakeholders’ respective risks and
vulnerabilities.

324
5. Work cooperatively with other entities, both public and private, to ensure that risks
and harms arising from corporate activities are minimised and, where they cannot
be avoided, appropriately compensated.
6. Avoid altogether activities that might jeopardise inalienable human rights (e.g. the
right to life) or give rise to risks that, if clearly understood, would be patently
unacceptable to relevant stakeholders.
7. Acknowledge the potential conflicts between (a) their known roles as corporate
stakeholders and (b) their legal and moral responsibilities for the interests of
stakeholders, and address such conflicts through open communication, appropriate
reporting, incentive systems and, where necessary, third-party review.’
The players that have high power and high interest need to be managed closely, because
they are key players for the success of the schemes. The players that have high power
and low interest need to kept satisfied. The stakeholders with low power and high interest
need to be kept satisfied but also informed. Finally, for those stakeholders with low power
and low interest, minimal effort can be provided; however, action must be taken by the
policymakers when necessary. It needs to be highlighted that the Network Manager has
strong power over the airspace users and minimum power over the ANSPs. The industry
is also represented by the SESAR JU. There are numerous examples proving this power.
The stakeholders can lead to amendments or changes in the reforms under consideration
due to their interests and due to their power. The most important example with major
effects on the aviation reform related to the reactions of many airlines against the scope of
the EU ETS.

325
8.2.2.1 Reactions to the Implementation of European Union Emissions Trading Scheme in
Aviation
The United States of America (USA) disagreed with the implementation of EU ETS in
international civil aviation. Representatives of the USA and other government bodies of
other states claimed that the onside implementation of EU ETS to non-European carriers
violates the Chicago Convection of 1947 for the international civil aviation and its bilateral
agreements and that the issue should be resolved by ICAO (Havel and Sanchez, 2012).
ICAO supports the cooperation of its Member States (MS) for the non-binding standards
and recommended practices for safety, environmental protection and other issues
affecting civil aviation. The United States is a signatory MS to the Chicago Convention and
is one of the current 190 Member States of ICAO. While the European Union (EU) is not a
signatory to the Chicago Convention, it is represented by its 28 Member States in the
ICAO. But the EU has observer status in ICAO (Leggett et al, 2012:3).
Since 1997 (Kyoto Protocol) ICAO has published technical information and a range of
different volunteering options and recommendations relating to the limitation of
greenhouse gas emissions from aviation. In 2004, ICAO ruled out the option of a global
emissions trading system for aviation. Instead, it has established guidelines for the
Member States which should include international aviation into their own emissions trading
schemes. ICAO requested the introduction to be a "mutual agreement" and non-
discriminatory. Member states are requested to produce Action Plans presenting how they
handle environment issues related to aviation (Leggett et al, 2012: 3).
The US response is particularly strong. Some American airlines and Airlines of America
(A4A) appealed to the European Court. But the Court of Justice of the European Union
(CJEU) concluded that the EU ETS did not contravene the Chicago Convention, the Kyoto
Protocol or the US EU Open Skies Agreement. The Court ruled that application of the EU

326
ETS to aircraft operators infringes neither the principle of territoriality nor the sovereignty of
third party State (Court of Justice of the European Union, 2011).
The US government, China and some other countries have requested exemptions for the
airlines from the emissions trading system (Malina et al, 2012). Europe's representatives
responded by saying that the regulation is not contradictory to the Chicago Convention
and that the consent of the other countries is not required (American Society of
International Law, 2008). This policy of the European Union has raised many controversies
among the stakeholders. On the one hand, there are countries such as the USA and China
that actively react to this policy, because they believe it could have a negative impact on
their carriers’ profitability. On the other hand, there are some countries, that are positive to
EU ETS full scheme, because they have developed the biofuels industry. Brazil is one of
them since Boeing and Embraer opened in 2015 a Joint Aviation Biofuel Research Centre
in Brazil (Embraer, 2015).
This example illustrates that within the category of the stakeholder, there are subgroups
that are either supportive or against the regulation according to their interests. Hence
countries that are biofuels producers supported the full scope of the EU ETS whereas fast
developing countries like China were opposed. Nevertheless, some international airlines
complied with the full, original, scope of the scheme including: Korean Air; Fed Ex; Nippon
Air and Lufthansa Cargo (Sandbag, 2013). The reason for such a decision was that they
considered it financially advantageous to receive the generous number of free allowances.
According to Sandbag (2013) Ryanair publicly announced an ETS charge of €0.25 per
passenger per flight, and had €8 million windfall profits since their actual ETS cost was
€0.13 in 2012.

327
8.2.3 The group/coalition of stakeholders
The stakeholders come closer and start forming groups with common goals and aims, i.e.
coalitions. The ANSPs have developed coalitions due to SES, but the airlines haven’t
developed coalitions due to EU ETS. The airlines are using the established groups, for
instance IATA, ELFAA or AEA. The ANSPs formed COOPANS that included a system
supplier. COOPeration between Air Navigation Services providers-COOPANS is an
international partnership between the IAA and the air navigations service providers
(ANSPs) of Austria, Croatia, Denmark and Sweden and system supplier, Thales.
COOPANS has structured the development and deployment process around joint activities
such as common specification, operational documentation, validation, training materials
and generic safety cases.
The overarching aim of COOPANS is to achieve financial savings and reduced investment
risks by harmonising and standardising technical solutions and operational procedures.
COOPANS also meets the EU requirements concerning future harmonisation of ATM
systems in Europe. The business partners share the development costs. In total, the
cooperation is expected to cut system development costs by approximately 30 per cent
compared with the costs each partner would incur if it had to develop the technology
independently. Using COOPANS capability, the Irish Aviation Authority (IAA) has enabled
Free Route Airspace within the Rathlin West sector (RATHE), which allows airlines to
reduce fuel uplift and gives them greater flexibility in how they route.
Furthermore, the five biggest ANSPs plus PANSA (Poland) formed an alliance called A6
alliance. Apart from A6 there is COOPANS Alliance consisting of the ANSPs of Austria,
Croatia, Denmark, Ireland and Sweden that works with A6. Moreover, B4 Consortium
consists of the ANSPs of the Czech Republic, Lithuania, Poland and Slovakia and is
member of A6 on work associated with the Deployment Manager and SESAR 2020.

328
Noracon - representing the ANSPs of Austria (Austro Control), Denmark (Naviair), Estonia
(EANS), Finland (Finavia), Ireland (IAA) Norway (AVINOR) and Sweden (LFV) at the end
of 2016 - will no longer be a member of the A6 Alliance. The A6 aims to modernise of the
European ATM network within the SESAR programme creating synergies between the
ANSP members of the SESAR JU to maximise customer and network benefits as well as
promoting leadership at a European level in critical technical and strategic areas. The
practice of forming alliances that was followed by the airlines is now applied to the ANSPs
as a result of SES regulatory framework.
There are also some attempts from FABS. Functional and efficient cooperation
arrangement with neighbouring states and FAB´s are of strategic importance for FABs.
The FAIR STREAM (FABEC ANSPs and AIRlines in SESAR TRials for Enhanced Arrival
Management) consortium involving major European airlines, ANPSPs and suppliers has
started the concrete work on flight trials to improve predictability and flight efficiency
towards major European airports. The project is launched by the SESAR. DK-SE FAB is
cooperating with the ANSPs in NEFAB to increase the opportunities for establishing Free
Route Airspace, so the airlines can determine their own routes throughout the entire
Nordic airspace.
In 2011, Irish IAA, Swedish LFV, UK NATS and Naviair established the so-called FAB 4
project (IAA, 2013). The project is exploring the possibilities of closer cooperation on ATM
in the airspace over Denmark, Sweden, the UK and Ireland. The aim is to enhance ATM
efficiency in this area. The possibility of combining the only two European FABs to date –
the Danish-Swedish and the UK-Irish FABs – forms part of the project analysis. A
preliminary study already completed has shown that genuine cost reductions and
enhanced efficiency would be possible in cooperation.

329
Significant improvements have been done in terms of the Inter- FAB Coordination,
explicitly by creating `Borealis Alliance`, where ANSPs of Norway, Finland, Estonia, Latvia
(NEFAB States), Sweden and Denmark (DK-SE FAB States), and UK and Ireland (UK-IR
FAB States) cooperates to enable better performance for stakeholders through business
collaboration. Borealis Alliance focuses on strategic business cooperation between the
member ANSPs, seeking economies of scale and projects that can be achieved on a
commercial basis, complementing the work of the northern European Functional Airspace
Blocks (FABs) but without the need for regulatory or State involvement.
8.3 Summary
The four major attributes, 1) the stakeholders’ position on the reform issue, i.e. SES and
EU ETS; 2) the level of influence (negotiation power) they hold; 3) the level of interest they
have in SES and/or EU ETS; and 4) the group/coalition to which they belong or can
reasonably be associated with, determine the capability the stakeholder has to block,
amend or promote regulations either alone or in collaboration with other stakeholders.
Hence, Stakeholder Analysis offers a detailed understanding of the aviation game taking
into consideration political, economic, and social elements that affect the groups’ positions,
the hierarchy of authority, but also the power among different groups.
There are big differences among the stakeholders, but also within the stakeholders. For
instance, the ANSPs in Europe operate in very diverse environments, both in terms of
operational conditions (e.g. traffic complexity and traffic variability) and socio-economic
conditions (e.g. cost of living, labour laws). There are also significant differences in terms
of size across the ANSPs since the five largest bear 57% of the total Pan-European
ATM/CNS provision costs while the five smallest represent less than 1% of the costs.

330
This page is intentionally left blank

331
9 Conclusion
This chapter is dedicated to the summarised conclusions of the research, but most
importantly to the contribution of the thesis to the body of existing knowledge. Moreover,
recommendations for the Single European Sky and the European Union Emissions
Trading Scheme will be given. Finally, a holistic/systemic approach for handling
environmental regulations in the aviation sector will be presented.
9.1 Conclusion for EU ETS and SES
The aviation sector has been included in the EU ETS since 2012. The provisional cap of
aviation emissions has been set at a constant level of 210,349,264 aviation allowances per
year which represents 95% of the historical aviation emissions. The allocation of
allowances was done by free allocation (based on benchmarks and expressed at CO2 per
tonne-kilometre) or via auctioning (15%).
The EU Emissions Trading Scheme is the biggest ETS in scale and size in the world. The
impact of Emissions Trading (ET) in aviation affects companies of all size and from various
industrial sectors. For instance, the EU ETS in aviation affects the system suppliers in
terms of implementing the element of the EU ETS in the Operation Control Centres
software for choosing flight paths. The biomass producers are directly affected by the EU
ETS. The carbon offsetting schemes in countries outside the EU are also linked to the
ETS. Even consumers are affected by the way the trading scheme is set. If the biofuels do
not comply with sustainability criteria and if they are produced in land used for food
production, food prices are affected. Moreover, if the land is important for biodiversity, the
ecosystem is affected. Therefore, the EU ETS not only affects the industries or the
countries that it regulates, but it also affects every one of us directly or indirectly.
Aircraft operators are requested to surrender a number of allowances to the Competent
Authority. When it comes to compliance with the EU ETS, there are different options.

332
These options might be short-term (e.g. optimised use of the given technologies) or long-
term (e.g. investment in technical progress and new technologies).
In order to achieve successful implementation of stakeholder management within an
organisation, the following factors should be considered: a) the effort of the implementation
must be aligned with the organisations’ readiness, i.e. the maturity of the organisations to
comply with the reform, and b) the implementation must be treated as a change
programme (Bourne, 2009).
The concept of ‘organisational maturity’ for measuring the organisation’s performance in
specific areas and benchmark their existing practices aiming at improvements is essential.
The level of readiness of an organisation is closely related to the organisational willingness
to engage proactively in developing and improving the processes. Therefore, the
readiness of the stakeholders is of critical importance for the implementation and success
of both the EU ETS and the SES. If and when the regulator understands the level of
readiness an organisation is closer to, the management can define the starting point for
improvements in stakeholder relationship management. We should note that the EU ETS
and the SES are reform projects for many countries and they involve different stakeholders
both in terms of nationality and in terms of nature. On that account, the regulatory
authorities (EC, European Parliament, CAAs etc.) should first evaluate the readiness of the
involved stakeholders and then proceed to stakeholders’ management in order to better
support aviation reforms. The challenge is to keep Transaction Costs low enough to
ensure that cost-effective reductions of GHGs can be achieved. In addition, the role of the
institutions is very important as they are needed in order to make the results believable,
enforce contracts, disseminate information and resolve disputes.

333
9.2 Contribution of the PhD thesis to the body of existing knowledge
The current state of knowledge in the field of Air Transport Management is limited and the
most abundant mass of studies concerns airspace engineering and environmental
sciences. Most studies focus on the specific and limited topic of research, without linking
areas or topics. Moreover, most of the comparative studies in policies refer to individual
companies or entities in a single- or cross-country context rather than groups/stakeholders
as part of two or more systems at the same time. However, an important contribution of
this study is its synthetic nature. The study examined the interaction of the individuals in
both reform programmes taking into consideration at the same time more than just the
environmental sector.
This PhD thesis contributes to the limited academic literature that is available on the topic
of the Single European sky and the environmental regulation of climate change due to
aviation operations. At the same time, it contributes by generating empirical evidence on
the relationship of reforms to ANSPs and Airlines in terms of environmental performance
and operations. To the knowledge of the researcher, no such research had been carried
out previously. The contribution is in line with the literature review and the comments of the
interviewees and therefore some citations and interviews statements are used to reinforce
and support the recommendations.
Different models have been built to measure the carbon footprint of aviation operations
and its environmental consequences in general. Other studies have evaluated the welfare
effect of environmental problems. There are plenty of studies regarding noise pollution and
local air quality in the proximity of airports and their consequences to the health and well-
being of the communities living there. Other studies concern the models that evaluate the
impacts of the implemented operational solution to civil aviation with regards to
environmental performance. This research follows a different approach, focusing on the

334
management perspective and the governance issues related to the implementation of SES
and EU ETS. Ultimately, it will be the task of aviation managers to implement policies for
the environment.
Furthermore, studies have been carried out about the implementation of the EU ETS in
other industries, and research has been conducted concerning the inclusion of aviation in
the area of environmental studies focusing on the emission reduction measurements due
to EU ETS. As far as SES is concerned, research has been conducted in the engineering
part, i.e. approached design, minimum separation criteria and avionics, as well as some
studies by EUROCONTROL or the European Commission. However, all these studies
were controlled or were conducted on behalf of the European Commission.
Finally, transaction cost economic theory is applied widely in the environmental economics
and especially in Emissions Trading Scheme, but it was never applied in the air transport
management reforms and so to Single European Sky. It proved very topical to implement
transaction costs to Single European Sky. Many participants in the Delphi method
commented that they spend a lot of effort on ‘figuring out what is happening and how to
handle the reform’. Moreover, all the interviewees reported that all the stakeholders apart
from the direct economic cost of handling the reform, they spent and are spending a lot of
time and consequently time to develop policies, evaluate the policies, think of strategies,
monitor progress, i.e. a cost that is not taken under consideration and is not always
obvious. When dealing with reforms implemented within one company or even within one
country, the transaction costs are quite low, compared to the cost of the technical
changes. However, when the reforms are for the entire aviation system, then the
transaction costs and the complexity of implementation and monitoring can be extremely
high.

335
9.2.1 Contribution to the policy makers and the aviation practitioners
From an aviation policy point of view, the findings of the research could assist the relevant
decision-and-policy makers with assessing the impact of regulatory reforms to the
environmental performance of the sector as well as with evaluating possible corrective
measures. The researcher focused on governance issues that obstruct the implementation
and effectiveness of the policy reforms. The multi-stakeholders approach in implementing
reforms can be a realistic solution to empower the reforms.
9.2.1.1 Recommendations for EU ETS
This section presents the recommendations for the European Union Emissions Trading
Scheme. These recommendations focus on the Monitoring, Reporting and Verification
processes, the revenue from auctions and penalties, the balance of allowances demand
and supply, as well as the interaction with the Global Market Based Measure developed by
ICAO.
9.2.1.1.1 More simple MRV process and further environmental training
A major difficulty in the Monitoring, Reporting and Verification of emissions is the
verification of biofuels. This issue was brought up by the researcher during a workshop
about the MRV and biofuels that was held in June 2016 in Brussels. Many airlines,
verifiers and fuel suppliers expressed concerns about the process of MRV and discussed
extensively the role of alternative fuels on the emissions reduction.
The central EU regulation for alternative fuels is the RED Directive 2009/28/EC. The EU
agreed on a Directive (2009/28/EC) on the promotion of the use of energy from renewable
sources (RED). Some Member States have a large share of aviation in their gross final
consumption of energy due to specific characteristics. For instance, Cyprus and Malta, due
to their insular and peripheral character, have a gross final consumption of energy in
national air transport that is more than three times the Community average in 2005. Since

336
these places rely largely on aviation, the exemption should cover the amount by which
they exceed the Community average gross final consumption of energy in aviation in 2005,
as assessed by Eurostat (Directive 2009/28/EC).
The EU has set sustainability criteria (Directive 2009/28/EC, article 17) to ensure that the
carbon savings from biofuels are real and that biodiversity is protected. Biofuels that are
not produced according to these criteria do not count towards the environmental targets.
According to DG Energy, biofuels cannot be produced either in areas converted from land
with previously high carbon stock (such as wetlands or forests) or from raw materials
obtained from land with high biodiversity (such as primary forests or highly biodiverse
grasslands).
In the renewable energy directive (2009/28/EC: “RED”) the European Union, in order to
encourage the diversification of feedstocks used to produce biofuels, i.e. biofuels produced
from wastes, residues and lignocellulosic, counts for double their real energy value in
terms of their contribution to the national EU mandates. The double counting gives an
economic value to some biofuel pathways (advanced biofuels) and it can increase their
chances of being selected by airlines.
One key issue that airspace users are facing is the complexity in monitoring, reporting and
verifying allowances. For instance, reporting the use of biofuels is an especially
complicated process. Biofuels are difficult to track when they are blended with the
standard aviation fuel. In some airports some airlines have dedicated fuel tank farms. In
case the airlines do not have one, the purchased blend of biofuel ends up in the common
tank that supplies all the airlines. For instance, if Airline A buys 50% blend of bio-kerosene
and this ends up in the common tank farm, it blends with the Fossil Jet A1 fuel that is paid
by other airlines. As a result, everyone ends up with a blend of the blend and Airline A is
not using what they paid for. In this case, the physical tracing of bio-kerosene is almost

337
impossible. A mathematical fuel balance is used to estimate the use of bio-kerosene.
However, the verifier of biofuel has no knowledge about whether or not other airlines
purchased bio-kerosene, which imposes the risk of double counting of biofuel and credits.
Furthermore, we cannot verify whether the bio-kerosene is used for flights within the EU or
for international flights.
Common Tank Farm
Verifier
Airline
Designated Tank Farm
Bio-Refinery
Transport of Blended Biofuel
Airport
If the airline does not have a Tank Farm
If the airline has a Tank Farm
Blend of the blend
Figure 43: The biofuel journey from production to consumption (Source: own elaboration)
The above described practical problem could be resolved in different ways. For instance,
we could claim that every airline should have its designated tank farm in every airport
where it buys fuel. This might solve the problem with the use of the biofuel blend but, on
the other hand, it would increase the cost of infrastructure and it would create land use
problems. Building biofuel tank farms could be a solution, which could become a reality as
soon as more airlines purchase biofuels.

338
A solution would be to virtually assign the credits of biofuels to airlines and to take for
granted that the biofuel is used for EU flights. We could then count the total use of biofuels
vs fossil fuel and this would make the process much easier and faster, which would
encourage airlines to start reporting their use of biofuels. The airlines avoid reporting the
use of biofuels blend because the process is too complex and the use of biofuels is limited
to a small amount of flights. The interviewees N.05 and N.06 also mentioned this.
Moreover, the physical tracing of biofuels is not possible. The airlines use an intermediate
company that purchases the biofuels for them. This company, the verifier, is responsible
for the logistics and documentation of the biofuels. The airline and the verifier use national
databases to document the biofuel blend use. In these databases, such as the German
Nabisy, there is the rule of ‘no information’ on the supply chain of the biofuel supplier. This
ensures that the airline will not bypass the intermediate company and, instead, it will buy
directly from the biofuel supplier. This process might protect the intermediate company but,
on the other hand, it makes the physical tracing of the biofuel more difficult and it
increases the risk of double counting.
Aircraft operators, the MRV authorities as well as everyone involved in the documentation
and administration of the EU ETS should first undergo training by the same organisation or
training agency in order to have the same level of information as well as reference point for
questions and answers. This training will, first of all, help to raise the environmental
awareness of the involved members and, secondly, it can ensure a better administration
and handling of the EU ETS. The implementation of simpler MRV processes and
environmental training is an easy and inexpensive procedure.
9.2.1.1.2 Revenue from auctions and penalties
The Emissions Trading Scheme involves transactions from which Member States can
create revenues. The Member States (MS) make revenues by selling allowances in the

339
stock market and from the penalties that are imposed to aircraft operators. The MS
according to article 10 (3) of the EU ETS Directive are obliged to use at least 50% of
auction revenues in order to combat climate change in the EU and third countries.
However, since the MS do not have any obligation to publish relevant information, it is
often unknown where exactly the revenues go. Of course, this raises ethical issues for the
scheme and it became a main discussion topic in some workshops that the researcher
attended.
Regarding the penalties, the MS and the CA in particular are responsible for imposing
them. According to Carbon Market Report 2015, the application of the 'excess emissions
penalty' in 2014 was reported for a low number of cases (ca. 0.1% of installations) in 6
Member States (DE, ES, PL, PT, RO, UK). As provided for by the Directive, Member
States should increase the penalty in accordance with the European index of consumer
prices. The range of different penalties varies substantially across MS; in certain cases the
minimum can be a few hundred euros and the maximum €75,000, whereas in other cases
the imposed penalties might range from €5,000 to €15 million. Seven Member States
reported potential penalties in the form of imprisonment.
Another important element is the transaction cost of the EU ETS. The issue here is the
existing inconsistency in this respect, as some Member States charge the airlines
administrative fees, whereas others do not. According to Carbon Market Report 2015 (EC,
COM (2015) 576) there are 16 countries that do not charge any fees to operators.
However, six EU countries collect an annual subsistence fee from operators or aircraft
operators. These fees range from 671€ to 5250€ per year per operator. In two reported
cases, they are expressed as an amount (0.02€ to 0.07€) per allowance. Seventeen
Member States reported that they collect fees for various services, such as the approval or
update of monitoring plans or permits. Those fees vary significantly, starting from below

340
100€ up to above 3,000€ for a new monitoring plan approval. That being said, it seems
that some member states recover their transaction cost, whereas others do not. The
inconsistency that is created, however, is unfair both to the member states administration
offices and the aircraft operators.
The situation calls for a standardisation of the processes; penalties should be given by a
central agency following the same criteria and methods for all the operators in all
countries. The CA should be responsible for MRV and not for imposing penalties in
questionable ways. It is also proposed that the MS publish information about the revenue
investments. Moreover, the MS should monitor the progress of the carbon offsetting
schemes or the environmental improvements projects. Since climate change is a global
phenomenon, all the money, i.e. 100% of the gathered revenues, should be assigned to
environmental improvements. In order for this recommendation to be implemented,
consensus needs to be reached among member states and this is not always an easy
thing to achieve. .
9.2.1.1.3 Balance of the allowances market
The EU ETS is a virtual market based on shadow prices and requires that wisely set
factors are applied to all aircraft operators in all EU countries. As a virtual market, it allows
the ideal setting of the factors, which contributes to the achievement of the EU ETS target,
i.e. the decrease of the negative environmental externalities. Since it is a market, all the
rules of demand and supply apply to the scheme. As discussed in the literature review, it is
evident that there is no balance between the supply and the demand of the allowances.
The interviewees N.04 and N.05 expressed their concerns on this lack of balance. A
mechanism is thus required in order to accommodate this need for balance in the market.
There are numerous trials to project CO2 emissions. Different scenarios are applied in
order to capture the interaction of the different policies, reforms, changes. However, the

341
problem arises when the different scenarios do not develop according to plan and, in that
case, amendment or corrective measures should be taken by the regulator to adapt to the
new standards and situations.
According to the EC, there is a surplus of allowances leading to lower carbon prices and
weaker incentives to reduce emissions. The surplus amounted to around 2 billion
allowances at the start of phase 3 and it increased further to more than 2.1 billion in 2013.
In 2015, it was reduced to around 1.78 billion as a consequence of back-loading. Without
this, the surplus would have been almost 40% higher at the end of 2015 (EC, 2016). This
massive oversupply of allowances has hugely devalued the carbon price.
The surplus is a big issue for the position of aviation in the EU ETS and the existence of a
surplus is proven by the allowances price in EEX. The surplus can be either due to a
generous cap or an excess supply. According to the result of the Delphi analysis, the
CAAs/NSAs (40%), some individual experts (29%) and other governmental bodies (60%)
believe that the cap of the EU ETS is too generous. On the other hand, IATA (66%), the
airlines (57%) and the ANSPs (100%) believe that the cap was not generous. The
fundamental issue faced by the ETS is the absolutely fixed nature of the cap (SSE, n.d.).
Companies that have been given enough free allowances to cover their emissions have an
economic incentive to sell any offsets they do not actually need, since they are significantly
cheaper than EU carbon allowances, giving them the option to make a profit. According to
SSE (nd), the linear reduction factor does not align with expected targets. This
phenomenon is mostly for energy industries, but it affects the supply of allowances for the
aviation industry, too. This difference in the supply and demand of allowances makes the
EU ETS vulnerable and increases the risks for stakeholders and especially investors.
The supply of allowances needs to be controlled for the market to start working. A Supply
Adjustment Mechanism (SAM) would allow the supply of allowances to respond to the

342
demand. To control the market, allowances that are considered surplus could be placed
into a strategic reserve which can be used only when the demand is much higher than the
supply. In the area of aviation, the EC, in an effort to control supply and demand,
postponed the auctions and created some kind of scarcity in the market. This was an ad
hoc measure with limited but not sufficient results for market stability. A more organised
strategy like the SAM would be more beneficial for the virtual market of the EU ETS. The
SAM can be used when additional schemes affect the availability of the allowances. For
instance, the SES reform through the optimisation of the airspace provided aircraft users
with shorter routes and, consequently, fewer emissions, saving in allowance usage.
Technological improvements in the aircraft and the engines have the same effect. As a
consequence, the supply of allowances becomes higher than the demand and the
emissions market becomes vulnerable.
The surplus of allowances can be identified in the auction markets or the banking reserves
of the airlines. Airlines are allowed to bank the allowances that they have not used.
SchleichI et al (2006:36) claimed that ‘banning the transfer of allowances increases the
overall compliance costs because cost savings cannot be traded over time’. After their
simulations, they also concluded that a generous allocation of allowances in the first phase
results in the collapse of market prices towards the end of the first commitment period and
a sharp increase afterwards when targets become stricter. However, reality proved that
either the targets did not become strict enough after 10 years or what the simulation was
suggesting was wrong. In both cases, the EU ETS needs to change. If the supply of
allowances needs to be controlled, the banking of allowances rule should change or the
free allowances given for next year need to be reduced. The simplest market rule says
that, if the supply is much higher than the demand, the prices fall. Consequently, the
aircraft operators will no longer have an incentive to cut emissions or even auction excess
allowances.

343
The Market Stability Reserve (MSR) is a rule-based mechanism that allows the supply of
allowances to respond to the changes in demand, maintaining the balance in the EU ETS
carbon market. To put it simply, the MSR adjusts the auction volumes. By using the total
number of allowances in the market as an indicator, market imbalances due to unexpected
shocks that impact demand, such as the economic crisis, can be addressed. This allows
the EU ETS to maintain its objective for emission reduction in a cost-effective and
economically efficient manner, even under unexpected circumstances.
Another way of offering stability and credibility to the market could be a price minimum
cap, a price floor, for the auctioned allowances. This might improve the stability of the
allowances markets but it will not serve the target as effectively as the control of the
allowances supply. The minimum price for purchase of allowances will increase, ensuring
minimum revenues from the auctions, but this does not mean that the oversupply is under
control or that the market is functioning. Undoubtedly, it is a measure that can be
implemented easier than the ban of banking or further reduction of free allocated
allowances and its implementation is recommended, but only as a complement to SAM.
9.2.1.1.4 EU ETS vs Global Measures
The emissions trading scheme in the EU is the largest ETS in the world in scale as well as
in scope. Aviation was recently included in it and so far only CO2 emissions are regulated.
At the same time, there are discussions on how global measures will be adopted to
address climate change as far as aviation emissions are concerned.
The states were asked to voluntarily prepare the report ‘ICAO Action Plan on Emissions
Reduction’ where they state the measures/actions they take to handle emissions from
aviation operations. The states reported on their ATM reforms, i.e. the SES/FABs, the
research and development actions like the Clean Sky Joint Undertaking (JU) which is a
Joint Technology Initiative (JTI) involving the industry. Moreover, they reported on biofuels

344
with reference to the Renewable Energy Directive (RED) and SWAFEA (Sustainable Ways
for Alternative Fuels and Energy for Aviation). This research actively contributed to the
development of the “ICAO Action Plan on Emissions Reduction - Republic of Bulgaria” as
part of a team from the Directorate General of Civil Aviation Administration - Republic of
Bulgaria. These reports are the basis to understanding the similarities and differences
among the different policies and actions. To clarify, the EU ETS regulates the airlines. The
Clean Sky JU conducts research on the possible technological improvements in the
engines and airframes of airplanes and helicopters contributing to environmental
performance. The SES regulates ANSPs and the RED regulates the fuel provision.
Carbon offsetting schemes, voluntary or not, do not provide an effective solution to climate
change. The funded emission reduction projects enhance the clean technology and
support developing countries. Carbon offsetting projects contribute to opening a path to a
low carbon economy. However, these projects do not provide a solution to climate change
as the problem is not actually resolved, but rather transferred to another industry or region
causing carbon leakage. A multi-layered approach with different schemes working in
conjunction is needed.
The strong points of the EU ETS is the safeguarding systems to address environmental
and social risks as well as the sustainable development criteria. Emitters can buy carbon
offsetting only up to a certain extent, avoiding thus leakage phenomena. There are three
main MBM: voluntary offsetting, mandatory offsetting with revenue and the emissions
trading scheme. The administration of a carbon offsetting scheme is much easier since it
can be handled by a centralised database/accounting system. According to ICAO Doc
10018 (2013), the main difference between ETS and carbon offsetting schemes is the use
of tradable emissions allowances in the ETS, which would create additional responsibilities

345
and opportunities for the participants as emissions allowances are similar to financial
assets.
Climate change is a global phenomenon and, for this reason, it should be addressed at a
global level. The EC does not have the regulatory power to impose rules to non-EU
countries and carriers. The International Civil Aviation Organization (ICAO) is a UN
specialized agency to manage the administration and governance of the Convention on
International Civil Aviation (Chicago Convention). ICAO has 191 Member States and it is
the most appropriate organization to deal with a global issue. ICAO proposed the
implementation of a Global Market Based Measures (GMBM) handling CO2 emissions
worldwide. The decision regarding this was taken during the 39th Session of the Assembly
(October 2016). The ICAO GMBMs is the Carbon Offsetting Scheme for International
Aviation (COSIA) aiming at addressing any annual increase in total CO2 emissions above
the 2020 levels, taking into account special circumstances and respective capabilities.
Offsetting in COSIA is accomplished through the purchase of emissions units that certify
emission reductions in other locations or sectors. The global MBM scheme uses emissions
units that are available through carbon markets. This global scheme does not generate
any emission reduction credits. According to ICAO, the aircraft operator will be required to
offset n tonnes of CO2. The operator acquires a number of emissions units equivalent to
this obligation in the carbon market; each emissions unit corresponds to one tonne of CO2
that was reduced by another project/program. The aircraft operator surrenders these
emissions units to the regulatory authority. The regulatory authority records that the
operator surrendered these emissions units, thereby fulfilling its obligation (ICAO, 2016).
The decision on the implementation of GMBM was taken during the 39th ICAO Assembly
(27/09/2016-07/10/2016) and until the 40th ICAO Assembly in 2019 there will be actions for
the implementation of GMBM, which is expected to be implemented by 2020. The first

346
Compliance cycle will be in 2021-2023, the second compliance cycle concerns the period
2024-2026 and finally the third period will be in 2027-2029. The quantity to be offset by
each operator is calculated using a formula that takes into account the average
percentage increase in the sector’s emissions, the operator’s individual percentage
increase in emissions, as well as adjustments for fast growers and early movers.
One important element of CORSIA is that it takes into consideration the fast growers, new
entrants, de minimis thresholds and the early movers. The new entrant is exempted from
the application of the CORSIA for three years or until the year in which its annual
emissions exceed 0.1 per cent of total emissions in 2020, whichever occurs earlier (ICAO,
2016). Due to high transaction costs such as administrative costs, the smaller entities of
both airlines and aircraft are exempted. Fast growers, i.e. individual airlines predominantly
serving increasingly growing routes, will have fewer offset obligations than airlines serving
more mature routes, in order to support those routes. There is a number of airlines that
have invested in more fuel-efficient airplanes and/or have improved their operations
resulting in fewer emissions. For those airlines the allocation of offset obligations will be
made based on a historic performance benchmark (European Parliament, 2016).
It is evident from both the ICAO Action Plans and the Delphi research undertaken in this
thesis that one measure cannot on its own lead to carbon neutral growth. The COSIA
initiative is a carbon-offsetting scheme that does not reduce emissions and climate
change. It gives the opportunity to aircraft operators to transfer their emissions somewhere
else without actually cutting them and without leading to carbon leakage. The initial name
of the GMBM was COSIA, which stands for Carbon Offsetting Scheme in Aviation, and
ICAO renamed it to CORSIA, i.e. Carbon Offsetting and Reduction Scheme in Aviation.
This is indicative of the change of the scheme’s aim making it maybe more vulnerable to
carbon leakage. A fuller set of measures can achieve a better outcome. The ICAO Basket

347
of measures reducing aviation emissions is definitely a better solution to handle climate
change. Individual efforts cannot lead to carbon neutral growth. The schemes should act
complementarily to achieve the maximum outcome.
9.2.1.2 Recommendations for SES
This section presents the recommendation to improve the performance of the SES. The
recommendations focus on raising the environmental awareness of ANSPs and CAAs, the
use of navigation charges as incentives for better environmental performance, the
consolidation of ANSPs and the ideal regulatory system for the better implementation of
Performance Scheme. These are considered in turn.
9.2.1.2.1 Environmental awareness of ANSPs and CAAs
The KPA of Environment in the Performance Regulation is not exactly a separate target,
but someone could argue that it benefits from improvements in the other areas. The
creation of FAB and the implementation of FUA and FRA, the improvements in the
communication and data sharing or the decrease of the en-route delays have positive
consequences to the environmental performance. The targets set in the Performance
regulation assist in measuring the benefits, but also in promoting the mentality of
protecting the environment.
Environmentally-friendly attitude and behaviour is not common across all the ANSPs and
countries and this was noted during the participant’s observation. As discussed in the
literature review, some of the ANSPs have implemented additional measures to protect the
environment, hence they prove a more environmentally friendly behaviour. On the other
hand, some ANSPs prioritise the other KPAs and the environment is not among their
priorities (supported also by Interviewee N.01). In order to promote consistency among
ANSPs and handle the global problem of climate change, a change of mentality is deemed
necessary.

348
The most effective action to increase environmental awareness is to change the mentality
of ATCOs, ANSPs employees and CAAs employees. Public Environmental Awareness
and Education could be applied either by each state or centrally by the EC or NM. Should
the training be developed and delivered from the CAAs/NSAs or Ministries of Transport,
the implementation is expected to be self-defeating. The reason is that the educators most
probably share the same mentality and do not have the mentality of environmental
protection and sustainable development. They also need to be trained and educated. If the
training was organised by a central authority like the EC or EUROCONTROL, there would
be fewer transaction costs due to economies of scale. The researcher attended ‘the
Aviation and the Environment’ training course offered by IANS/EUROCONTROL and
believes that, if it was more adapted to SES and if some practical elements were
introduced, it could become an effective solution.
In addition, airspace users are not making the best from SES. There are conditional routes
available that the airlines do not use either due to the short notice or due to the difficulty
from the AOC to change the flight plans as a system. The airlines should also be informed
about the implemented solutions regarding the CDRs and a better communication channel
should be developed to make the change of routes a reality. The implementation of this
recommendation is considered very important and necessary. The main advantage of its
implementation is the low cost, the acceptance by the stakeholders and the radical effects
it will bring to the environmental protection mentality.
9.2.1.2.2 Charges Scheme as Incentive mechanism
In terms of mitigating Climate change in the en-route level from an operational perspective,
the main stakeholders are the Airlines and the ANSPs. The Airlines have an incentive to
reduce their emissions based on the principle that excess fuel consumption costs them

349
money. The ANSPs have no incentive to be more environmentally friendly (Interviewee
N.03).
The airlines behaviour depends a lot on fuel prices. Fossil fuels are much cheaper than
biofuels. Therefore, the price is the main parameter for its use. Secondly, the availability of
biofuel is another important element as the airlines often have difficulties in finding
biofuels. Finally, the certification and verification of biofuel use as explained above in the
EU ETS process can be quite complicated. The question that arises is whether airlines
need another incentive for using biofuel.
One way to enhance the use of biofuels by airlines would be a discount in the en-route or
terminal charges. All countries would benefit from the use of biofuel, regardless of whether
the flight is taking place in their airspace. Should the discount be in the en-route phase, it
would mean that all ANSPs should offer a discount to that airline proportionally to the
airway use. If the discount was in terminal charges, that would bring extra benefits for the
airports. Some airports, Heathrow for instance, face problems with the Local Air Quality
(LAQ) and, if the airlines had a financial incentive to use biofuels, those airports would
improve their LAQ and bring benefits to the local society. Biofuels though would be used
during the whole phase of the flight contribution to climate change mitigation.
The discount in the en-route charges for biofuel users might be a solution that needs to be
accepted by all ANSPs, but some might bring objections to that. Discount to terminal
charges in some selective airports that have a problem with LAQ because it might be a
constraint for their expansion, is something that could be implemented more easily.
Airports and local communities have adopted, or tried to adopt, measures to regulate
airlines operations with regard to LAQ by implementing Pigouvian taxes, like the
Catalonian NOx tax as discussed earlier. The taxes are not well received by airlines and
the airlines often threaten airport authorities that they would move their operations to other

350
airports (Interviewee N.02). A discount could be a solution and it would be well received by
the airlines, it would improve the LAQ and it would help an airport expand, as it would
comply with the environmental regulations.
The practical difficulty in this solution is the administration of biofuel use. When the airline
does not possess a dedicated fuel tank, it is unknown whether the specific airline is using
the biofuel. This solution can work for big airlines when they operate for flight connecting
their base/hub with another big airport, but not in the connections among regional airports.
Heathrow airport is capped to 480,000 ATMs per annum and hosts on average 670 flights
per day. The fuel demand in 2008 was forecast to be 8 mil litres, but BAA and BA demand
forecasts show fuel doubling by 2030 (IATA, 2008b). In 2008 there were two fuel tank
farms and fuel was delivered to aircraft via hydrant systems. The analysis conducted by
British Airways stated that LHR needs four additional tanks to accommodate fuel demand.
Should the expansion of LHR be a reality and given the need for fuel storage, BA -as the
dominant airline at Heathrow- should have a dedicated farm tank that could facilitate
biofuel use and tracking.
As far as route availability is concerned, the organisation of auctions regarding the routes
that are closer to GDC could be a possible scenario. The ANSP could modify the charging
scheme and charge by route. Routes identical or almost identical to GDC could be
auctioned to airlines that are willing to contribute more for the use of these routes. The
principles of slot trading could be implemented to this mechanism. For the time being this
scenario looks unrealistic, but it could be an effective solution in case the nature of ANSPs
changes and consolidation is achieved or in case ANSP alliances are reinforced and
promoted.
The ANSPs could be reshaped to have a centralised en-route level, or at least one
handled by a single company or authority, as well as a terminal level handled by the

351
national authority/company. This would promote consistency among the different sectors,
reduce the number of sectors and improve data sharing leading to improved, more direct
routes. Other than that, the existing performance regulation includes economic incentives
when the ANSP performance is above the expected targets. The implementation of this
recommendation can be time-consuming and bears many bureaucratic procedures, but it
is a very effective way to encourage an environmentally friendly behaviour.
9.2.1.2.3 Consolidation and financing
As discussed in previous chapters, the economic situation and the readiness of the
countries are not at the same level. The performance targets are set at national/FAB level
and at EU-wide level. Nevertheless, it is not very clear how these targets are set. They can
be set at individual rate, at sectoral rate or a combination of both. The hybrid option could
balance the pros and cons of the individual rate and sectoral rate options. It could be one
level ahead of the existing regulation, offering flexibility and accommodating the needs of
fast growers, new entrants and early movers so as to make the implementation of the
regulation fairer for all the players. In case some ANSPs face problems that might make
the achievement of the targets extremely difficult, the possibility to freeze the targets
should be available.
Some ANSPs have already taken action before the implementation of the Performance
Scheme to improve and make their operations more efficient. From a fairness perspective,
those early birds should be rewarded but they would be ignored if the targets were
allocated based on the sectoral rate. Moreover, with regard to capacity and environment,
the efficiency of ANSPs in ECAC is affected by the efficiency of other ANSPs that are not
based in ECAC, but that handle traffic entering the ECAC airspace. Therefore, the scope
of SES and the performance scheme could be extended to capture the actions of the
neighbouring ANSPs.

352
The current aviation system in terms of ANS provision is based on the natural monopolies
or, in the best case, on the oligopolies of ANSPs. The cost of infrastructure as well as the
cost of service provision is very high which results in high charges for both the airlines and
the passengers. Furthermore, some ANSPs cannot increase their CAPEX due to financial
problems. The Greek ANSPs’ revenues from the charges are not necessarily reinvested to
the ANSP thus contributing to infrastructure improvements, but they may be allocated to
other sectors, such as healthcare or education. Consequently, there might be inefficiencies
in the aviation systems affecting all the other ECAC members. If a special financing
system from the EU is implemented to economically support those ANSPs for
technological improvements, this might be unfair for other countries.
Most of the ANSPs handle a small share of movements, but they still need all the
infrastructure. Traffic movements are concentrated in 4-5 countries, i.e. 4-5 ANSPs.
Nevertheless, this does not necessarily mean that only those 4-5 ANSPs are needed to
provide ANS. Services could be provided from the most efficient and effective ones (one or
two) with regard to safety, capacity, environment and cost efficiency factors. The system
could be more efficient if the number of ANSPs was reduced or if some of the ANS were
centrally provided by a separate entity. This recommendation is quite controversial and it
can create a series of reactions from the trade unions. However, due to increased
competition among the ANSPs, it will be a reality in the coming future and it is better to
organise and control this transition.
9.2.1.2.4 Independent regulator
The Single European Sky (SES) reform is a necessity in order to respond to the
contemporary needs of civil aviation. The European Parliament and the Council vote on
the regulations, whereas the European Commission drafts the regulations with the help of
some agencies. In order to monitor the performance plans of the Functional Airspace

353
Blocks (FABs), the Civil Aviation Authority (CAA) was separated from the Air Navigation
Service Provider (ANSP). The National Supervisory Authority (NSA), which is usually part
of the CAA, is responsible for monitoring the performance of the ANSP that is offering the
services to the state. This separation was made in order to gain credibility and
transparency in the monitoring process as well as in the proposal of corrective actions.
The CAA/NSA is responsible for proposing penalties or financial awards to the ANSP. The
question that arises is the independence of the CAA/NSA from the ANSP.
A more independent regulator for the ANSP is proposed. The regulator can be the CAA of
X country regulating and monitoring the ANSP of Y country. This might lead to mutual
forbearance, as the CAAs of X country are less likely to act aggressively if needed when
they perceive that the CAA of Y country can counterattack the ANSP of X country. This is
related to the ownership of the ANSPs. Should the ANSPs be private entities, the mutual
forbearance would be an unlikely hypothesis. In order to avoid this case, it should be
ensured that the X country’s ANSP is not monitored by the Y country. This would enable
the existence of a more binding mechanism for the FAB/State and the ANSP allowing the
targets set to be cascaded.
The Monitoring, Reporting and Verification practice of the EU ETS could be applied to the
SES, too. This would either enhance the efficiency of the ANSP or create frictions between
the ANSPs and the CAAs/NSAs. ANSPs could claim that, due to safety issues and the
confidentiality of the operations of Military aviation, they do not wish to share specific
information with foreign countries.
Currently, there are many agencies and bodies involved with a rather unclear role, leading
most probably to duplications of the tasks and efforts without contributing to the overall
efficiency of the system. The role of EASA regarding the SES is not clarified enough
(Interviewee N.07 and N.04) and, according to IATA, AEA and ERA (2013), the NM should

354
be empowered with new responsibilities and functions concerning airspace architecture.
The position of the Performance Review Body and the Performance Review Commission
should be further clarified since the PRB and PRC almost consist of the same members
holding different positions.
Another way of regulating the ANSPs more effectively could be the establishment of a
body with the power to impose fines and actually enforce the regulation. PRC or PRB
should be re-established and enrich the body with industry members, such as
representatives of IATA, EUROCONTROL, CANSO and NCP. If the PRB/PRC consisted
of all the main stakeholders, the regulation could be more effective as the consultation
would be realistic and the views of the different stakeholders would actually be taken into
consideration. The role of the new, reshaped PRB would not only be to monitor, but also to
establish the performance scheme, to monitor and enforce the targets to the member
states.
9.2.1.3 Policies interaction and systemic approach
Engine manufacturers are obliged to meet the noise certification standards adopted by the
Council of ICAO that are included in Annex 16 — Environmental Protection, Volume I. The
engine emissions principles and standards for the airplanes are also included in Annex 16.
The EC implemented the Directive 2002/49/EC and the Regulation (EU) No 598/2014 on
the procedures concerning the introduction of noise-related operating restrictions. The
Framework Directive 96/62/EC and the Directive 2008/50/EC refers to the ambient air
quality and cleaner air for Europe. Apart from global policies and EC regulations, there are
also national regulations regarding noise levels and the LAQ. Pigouvian taxes can be
imposed at national or local level. Those taxes are directly imposed to the airlines in
combination with ICAO standards to manufacturers and EC regulations to airports.

355
With regards to climate change, engine manufacturers are regulated by Annex 16 of ICAO.
Airports refer to local level only, and, thus, there is no regulation for climate change
regarding aircraft operations. Airlines are regulated by the EU ETS and ANSPs are
regulated by the performance regulation of SES. The passenger is the key point for air
transportation, but since the passenger is the consumer and not the producer, there are no
binding regulations for the passenger.
Apart from the regulations, the players can take additional actions to mitigate or
compensate their emissions. Once example is the Clean Sky Joint Undertaking focusing
on technological improvements in the engines and airframes of the airplanes. The
European Advanced Biofuels Flightpath aims at putting sustainably produced biofuels to
the market faster through the construction of advanced biofuel production plants and at
convincing the aviation industry to use 2 million tonnes of biofuels by 2020. Oslo airport is
the first airport in Europe offering biofuels to all airlines. AirBP, the Norwegian airport
operator Avinor and biofuel specialist SkyNRG work together to provide airlines at
Gardermoen Airport with biofuel for jets. Finally, ICAO also introduced a balanced
approach according to which airplanes should be quieter, the land around airports should
be managed in a sustainable way, operational procedures to reduce the ground noise
should be implemented and operating restrictions should be adopted.
Figure 44 depicts the interaction of the EU ETS with operations and technology policies
according to four scenarios. The first scenario is business as scheduled. In order to
achieve carbon neutral growth, operational and technology policies (grey bars) are needed
in combination with the EU ETS (blue bar). The EU ETS is represented by the blue bar,
whereas the operational and technology policies are the grey bars. The blue line
represents traffic growth. In the first three scenarios, the traffic growth is positive and as
expected. The second scenario is capturing the case of failing operations and technology

356
policies. If those two policies underachieve their targets, more emphasis should be given
to the EU ETS. By imposing stricter EU ETS requirements, the carbon prices will increase.
According to the third scenario, if the supplementary policies achieve more than expected,
the EU ETS requirements will become less strict leading to lower carbon prices. Finally,
the last scenario suggests that traffic is reduced and, subsequently, the emissions as well.
Should this be the case, the EU ETS will not be necessary for carbon neutral growth. It
should be highlighted that the aim of the policies is environmental improvements and not
overregulating the market without bringing benefit to the social welfare.
EU ETS
Technology policies
Operations Policies
Business as Scheduled
Supplementary policies underachieve
Supplementary policies overachieve
Reduction of flights
Higher carbon price
Lower carbon price
No need for EU ETS
Carbon Neutral Growth
Figure 44: EU ETS and other policies for carbon neutral growth (source: own elaboration)
The environmental issues should be addressed holistically according to the unstructured
interviews and as identified by the Delphi method and the participant observation.

357
Regarding the operational aspect of aviation, the problems of the air transport industry
(orange boxes in Figure 45) are the high cost of ATM service provision, the delays and
related costs, safety issues and the climate change caused by excess fuel burn and
emissions. Those problems are caused by the fragmentation of the ATM sector, labour
and social issues, economic difficulties faced by the States, outdated technology and lack
of airspace capacity (blue boxes in Figure 45). The reforms (red boxes in Figure 45)
currently implemented are the EU ETS for the aircraft operators, the SES for the ANSPs
and the Clean Sky JU for the manufacturers. The supply chain, mainly the manufacturers,
are not forced to implement the technological solutions developed by Clean Sky JU, but
they contribute to the Research & Development (R&D) cost of Clean Sky.
Root Causes
Fragmentation of ATM Sector
Labour and Social Issues
Economic Problems of States
Old Technology
Lacking Airspace Capacity
So
luti
on
s
Clean Sky JU
SES
EU ETS Airlines
ANSPs
Manufacturers
Regulating: Policies/Reforms Problems
High Cost of ATM service Provision
Delays
Climate Change due to excess fuel burn &
emissions
Safety issues
=>
Figure 45: Problems and recent interventions in aviation (source: own elaboration)

358
In conclusion, there are two aviation stakeholders that are regulated (Airlines and ANSPs)
and one that is self-regulated (manufacturers). The airlines operate under competition and
in a global environment, the ANSPs are natural monopolies or oligopolies and operate in a
national/local or ECAC environment, whereas the manufacturers are under oligopoly
selling their products worldwide. The EC cannot impose a regulation to the manufacturers
due to the fact that not all manufacturers are obliged to comply with EC rules and
regulations. The only solution in ECAC level would be to intensify the existing
environmental regulations and ensure their effective implementation.
On the other hand, should ICAO implement the GMBM in all airlines, there will be no need
for the EU ETS to continue in aviation; it can focus on other industries. The policy makers
should approach this option taking into consideration all the industries and addressing
climate change holistically. The lack of collaboration and coordination in R&D at regional
and multi-national levels, within one industry and cross-industries should be eliminated.
The environmental aspects of aviation should be looked into in parallel with the economic
situation of the airlines, ANSPs and states, and societal needs. Moreover, Research and
Development is a very costly sector and, when developing environmental policies in
aviation (like the use of biofuels), the needs and policies for the other means of
transportation should be interlinked. The links should be formed within Europe but also
with the rest of the world.
Finally, managing the stakeholders is one of the most critical points in order to achieve an
effective reform. The interests of the different airlines, airports, ANSPs, States, CAAs, fuel
suppliers, manufacturers and policy consultants should be taken into consideration when
designing environmental policies. The next step is to develop more platforms, apart from
the NSA Coordination Platform, and move beyond the consultation documents. The NSA
have reported that they find the NSA Coordination Platform (NCP) very useful as it is the

359
only established official platform where they can gather and discuss related matters in
person promoting the exchange of information and lesson learning. Similar platforms could
be developed encouraging each group to meet separately or with other groups and
contribute their ideas or express their concerns to the regulators.
The processes should be adapted to the needs and capabilities of the stakeholders in all
states or send experts as secondments to help the groups perform their obligations. Apart
from that recognition of efforts, the communication of benefits and burdens as well as the
fair distribution of benefits should be a priority for policy makers. When policy makers work
together with the stakeholders, the can be more easily identified and solutions can be
found with less difficulty. Improved communication, monitoring and reporting, incentive
systems and third party review are key elements for the sustainable development of
aviation through SES and EU ETS. In this way, potential conflicts between airlines,
airports, ANSPs, CAAs, suppliers, policy advisers and makers will be identified and
addressed. The connection and linking among the different schemes, rather than their
individual function, can bring operational cost savings. However, the linking should be
done only if there is consistency among the schemes in question.
9.2.1.4 Concluding remarks of recommendations
Since Climate change is a reality with tremendous impacts to human well-being, it needs
to be regulated. Both EU ETS and SES can contribute to the mitigation of emissions. Both
reforms face many problems in terms of their effective implementation because, even
though they have been implemented, they do not deliver to the expected extent.
A common solution would be to change the mind-set and mentality towards the
environmental performance of civil aviation. The transparency and credibility of the
SES and EU ETS can be enhanced by putting in place an independent regulator

360
that is able to balance the influences by the industry, airlines, ANSPs, governments
and all the stakeholders.
In addition, the financial aspect can be a useful tool towards achieving the targets.
The ETS bonus to the use of biofuels can enhance their use and economic
incentives to ANSPs can enhance the offer of flight efficiency measures taken by
the ANSPs. Climate change is a global issue which requires a global solution. ICAO
is an organisation with power all over the world. The Market-Based Measure that
will be implemented by ICAO should focus on the reduction of the actual emissions
and it should not lead to carbon leakage.
Finally, the central point of the recommendations is the holistic approach of the
environmental regulations. The regulator should consider all the policies and their
interrelation in order not to have underachieving or overachieving schemes that are
under-regulating or over-regulating the aviation system.
9.2.2 Contribution to the methodology theory
The originality of the proposed thesis is also based on its methodology. The Delphi method
that was applied is usually conducted with one questionnaire (in which questions can be
added) in 1, 2, 3, n rounds. In this research, two sets of questionnaires were used. One
questionnaire (EU ETS Questionnaire) was addressed to airline orientated experts, and a
second questionnaire (SES questionnaire) was addressed to air navigation experts. Both
sets of questionnaires were focusing on the same issue, i.e. environmental performance
and governance issues, but from different perspectives. The questionnaires had some
common questions and few experts participated in both surveys since they had expertise
in both areas. This can prove very helpful for future research that combines complex and
multidisciplinary topics.

361
Finally, the study contributes to the body of knowledge of secondary research and the
industry by creating a conceptual framework for the systemic environmental performance
of the air transportation sector. The comprehensive overview of the Single European Sky
with emphasis on the environment under the perspective of the management stream is
one of the few such overviews. On the other hand, the EU Emissions Trading Scheme in
aviation and the connection of operational improvements, i.e. SES, is a very different
undertaking.
9.3 Conclusions for the Research Questions
The main reason for endeavouring on this research path was the unanswered question
why aviation is not as regulated as the other industries in terms of the negative
environmental externalities. The reason was the airlines were traditionally owned by the
state and regulating them via a tax or via MBMs would not make any sense in the context
of vertical governance. There has been little academic discourse on the management
aspect of aviation regulation and especially in the area of ANSPs. In the current PhD
thesis, the research focused on the area of governance issues in civil aviation related to
the implementation of the SES and EU ETS reforms. The SES reform focuses on
restructuring the airspace system and reshaping the ANSP sector. The EU ETS aims at
regulating civil aviation operations and at internalising external negative economies that
are related to climate change.
In order to understand the interactions of the policies, the general picture of the
environmental problem and the reforms should first be explained. The environmental
issues constitute a real problem. The environmental issues originate from natural causes
and human causes. Natural causes, such as changes in volcanic activity, solar output or
the Earth's orbit around the sun, cannot be controlled or mitigated. Human causes, such
as the burning of fossil fuels and the conversion of land for forestry and agriculture, were

362
intensified after the industrial revolution. The human-induced enhancement of the
greenhouse effect should be regulated to handle the negative externalities and achieve
sustainable development.
The main environmental issues in Europe are Local Air Quality, Noise Pollution and
Climate change. Those issues are addressed at a local level, at EU level and at global
level. Since climate change is a global problem, any solutions implemented locally are less
effective than solutions implemented globally. Global warming is primarily attributed to the
increase of the natural greenhouse gas effect. Without appropriate action, climate change
endangers both the environment and the people. Temperatures are rising, upsetting the
balance of the ecosystems, plants and animals. Landscapes are changing, rising seas
threaten airports, and intensified storms affect aircraft operations. All the above put
communities at risks and have a high economic impact.
Carbon dioxide is the main cause of human-induced climate change and it is a very long-
lived gas contributing to the greenhouse effect. Increases in CO2 are due primarily to fossil
fuel use, with additional contribution from the change in the use of land. Risks from climate
change depend on cumulative CO2 emissions and, according to IPCC, there is fair
scientific understanding regarding the behaviour of CO2 concerning climate change.
Consequently, CO2 is the element that is regulated. The main sectors that contribute to
climate change and CO2 emissions according to CAIT (2015) are: energy-electricity/heat
(33%); Energy/transport (16%); Energy-manufacturing/construction (14%); agriculture
(12%); energy-other fuel combustion (9%); industrial processes (6%); energy-fugitive
emissions (6%); and waste (3%).
According to IPCC (1999), airplanes emit gases and particles which alter the atmospheric
concentration of greenhouse gases, trigger the formation of condensation trails and may
increase cirrus cloudiness, all of which contribute to climate change; airplanes are

363
estimated to contribute about 3.5% of the total radiative forcing (a measure of change in
climate) by all human activities and that this percentage, which excludes the effects of
possible changes in cirrus clouds, was projected to grow. The main players involved in air
transportation are manufacturers, airports, airlines, the ANSPs and passengers. Figure 46
depicts the different policies that each player is obliged to comply with.
Figure 46: Aviation Policies for Environment (source: own elaboration)
The aim of the PhD thesis was to analyse the aviation governance concerning
environmental regulation of aircraft emissions. The thesis used Single European Sky and
EU Emissions Trading Scheme as its major schemes of study and looked into their

364
interaction and implementation having as main target to identify any areas in need of
improvement and make suitable recommendations for policy makers.
In order to achieve this aim, the PhD thesis addressed the following research questions
(as identified in chapter 1):
Research Question 1: Are airline operations environmentally sustainable and what
are the factors leading to sustainable growth?
The three pillars of sustainable development as discussed in chapter 2 are a) the
economic pillar, b) the social pillar and c) the environmental pillar. Aviation offers
connectivity to remoted or isolated regions, supports 63 million jobs and $2.4 trillion in
economic activity. A third of all global trade by value is shipped by air. Despite the fact that
aviation is a valuable driver for the economic development and the society in general, it
damages the environment.
Airport operations, aircraft manufacturing, construction of infrastructure, etc., produce
harmful emissions and damage the natural environment and the social welfare. Emissions
of nitrogen oxides (NOx), carbon monoxide (CO), unburned hydrocarbons (UHC) and
particulate matter (PM) contribute to local air quality deterioration, resulting in negative
human health and welfare impacts. Air pollution has been linked to diseases like cancer,
asthma, stroke and heart disease, diabetes, obesity, and dementia. Those negative
externalities do not have a direct cost for the one that creates them.
In the context of airlines, burned fuel produces the aircraft’s emissions. The airline
industry’s fuel bill is estimated to $181 billion in 2015 and accounts for the 27% of
operating expenses at $55/barrel (IATA, 2016b). In 2003 when the oil price was at $28.8
per barrel (13.6% of operational cost), the airlines focused on reduction strategies of other
costs (IATA, 2016b). When the price per barrel of crude oil is high, the airlines focus on

365
ways to reduce their fuel costs. Strategies for fuel reduction, apart from hedging, are the
use of environmentally friendly aircraft/engines or operational improvements. By reducing
the fuel consumption, airlines also reduce their emissions. Hence, airlines for example in
comparison to airport operators or ANSPSs, have a direct economic incentive to emit less.
Based on the literature review discussed in this thesis, in order to have sustainable
development in aviation, all three dimensions, i.e. environmental, social and economic
dimension, should be balanced. As discussed in chapter 2, this is not the case for
contemporary aviation where the environmental pillar was not taken seriously under
consideration until the introduction of EU ETS, SES and other environmental schemes. On
these grounds, aviation growth is not regarded as sustainable for the time being. Should
the environmental aspect be incorporated better in the aviation operation, then aviation will
have a more sustainable growth.
Research Question 2: How does the market environment and structure, in which the
Single European Sky (SES) and the European Union Emissions Trading Scheme (EU
ETS) are implemented, affect the efficiency of the schemes?
The market environment of airlines is very different from the ANSPs market environment.
Therefore, the implementation process and associated issues of SES and EU ETS are
very different too. The airline environment in Europe is quite competitive with many private
companies with different business models. The EU ETS as discussed in chapter 3 is a
reform scheme for different sectors and it included aviation in 2012. The airlines according
to the regulatory framework may take actions to reduce their emissions, leading to excess
allowances that they can bank or sell. Moreover, the carriers can purchase allowances
from auctions (either from other airlines or other industries) or from carbon offsetting
schemes. Therefore, the EU ETS market environment is primarily affected by the
competitive environment of airlines (game theory can explain the airlines’ behaviour) and

366
the other industries to a lesser degree. European airlines could not obstruct the
implementation of EU ETS, but the non-EU airlines managed to ‘stop the clock’ and
amend the regulatory framework.
On the other hand, the ANSPs environment as analysed in chapter 4, is characterised as
natural monopoly, where almost every country has its own national ANSP. This practice is
slowly changing where few ANSPs in spite of being state-owned developed a profit
orientation. For instance, Belgocontrol offers training modules to individuals about safety,
capacity, economic and environmental efficiency.
Few ANSPs (e.g. NATs) offer services to other states and established cooperation or even
alliances, leading to an oligopolistic market. For instance, DFS (a state-owned Limited
Liability Company) offers ATC services at Gatwick airport. A6 alliance, Noracon and
COOPANS are the first alliances of ANSPs. Those alliances are concentrated around the
biggest ANSPs, i.e. NATS, DFS, ENAIRE, ENAV, DSNA, PANSA and the northern
countries. ANSPs like Croatia Control and MATS find it difficult to follow the ‘giants’.
The fact that ANSPs are still the leading players within their national borders (for both
terminal and en-route control) means that there is still a monopolistic market that moves
towards oligopoly. Due to this monopolistic/oligopolistic market, the full implementation of
the SES is obstructed by the ANSPs unwillingness to liberalise the market.
Research Question 3: Can the inclusion of aviation in the European Union
Emissions Trading Scheme and/or Single European Sky lead to carbon-neutral
growth?
In chapter 3 and 4, it was made evident that both the EU ETS and the SES contribute to
environmental improvements. The main aim of EU ETS is CO2 reduction. European
Commission set the cap at 210,465,788 allowances per year. 82% is granted for free and

367
15% are auction (3% are held in a special reserve). There is only a 5% decrease to the
allowances. It should be noted that the 15% of the 5% might be coming from the flexible
mechanisms of Kyoto that does not necessary mean carbon emissions reduction. As
analysed in chapter 7, the Delphi participants were asked to share 100 points to the
factors that lead to carbon neutral growth and none of them gave 100 points to one factor.
All of them split the points to two or even nine factors, the most important of which were
flight efficiency and ETS. As a conclusion, the EU ETS alone (when 82% of the allowances
based on the initial base year are for free) is not sufficient to achieve carbon neutral
growth.
On the other hand, the Single European Sky never aimed to carbon neutral growth. SES
has the following high - level goals: a) to enable a 3-fold increase in capacity which will
also reduce delays both on the ground and in the air, b) to improve safety by a factor of 10,
c) to enable a 10% reduction in the effects flights have on the environment and d) to
provide ATM services to the airspace users at a cost of at least 50% or less. As discussed
in Chapter 7, the Delphi participants were asked if the route optimisation is sufficient
enough to lead to carbon neutral growth; the majority of the participants stated that it is not
enough (mean=1.77 where 1 is strongly disagree). The KPA of environment as understood
in the participatory observation and the unstructured interviews is more like a ‘fortunate’,
positive side-effect of the operational changes in the ATM system that aimed to improve
capacity and safety and has positive externalities to the environment area. Therefore, and
although the Delphi participants agreed that FABs lead to reduction of emissions, the SES
alone cannot lead to carbon neutral growth.
Research Question 4: Can the effective implementation of SES render the EU ETS
redundant and are the environmental targets overlapping?

368
The SES general target is to reduce the effects flights have on the environment by 10%.
According to the performance scheme (RP2) the EU - wide targets are to reduce the
average horizontal en route flight inefficiency for the last filed flight plan trajectory to 4.1%
and for the actual trajectory to 2.6 %. The targets of SES are related only to ATM structure
and in some parts to the airline’s decision to use the possibilities offered by the ANSPs
(e.g. CDRs) as identified by the participatory observation at EUROCONTROL. Therefore,
there is no overlapping between the targets of SES in relation to EU ETS. SES was
implemented after the baseline calculations for EU ETS had been set. Therefore, the
environmental benefits of SES are not taken under consideration to the allocated
allowances for EU ETS.
The EU ETS is an environmental regulatory framework and it included aviation in 2012 in
the third phase. In 2012 the cap was 97% and from 2013-2020 the cap is 95% of the
baseline (average annual emissions of 2004-2006). The EU ETS target is easier to
achieve because the business environment of aviation operations was very different in
2004-2006. Therefore, the environmental target is made redundant and the scheme in
spite of not underperforming according to the target, it is not delivering the emissions
reduction that it could. This was concluded after the long discussions and interviews with
the 7 experts that belong to different groups. Nowadays, the technological state-of-the-art
as well as the ATM structure and procedures are of higher standards compared to 2004-
2006. It would be much better if the cap were applied based on the previous year
operations.
Research Question 5: What do the research findings reveal about any issues that
the SES and the EU ETS reforms are facing and how can these findings be used to
improve the aviation environmental performance and achieve a more sustainable
growth?

369
The SES and EU ETS do not deliver to the extend they could. The main reasons, as
identified in the primary research and discussed in chapter 8, are the following:
Different readiness/capabilities of the air carriers (for the EU ETS) and the
states/ANSPs (for SES);
Insufficient incentive mechanism;
Different positions and the (political) willingness to take actions; and
Trade-offs and interactions among the different areas.
The most significant contribution of this PhD thesis is the synthetic discussion of the SES
and EU ETS issues and the recommendations made to address currently underperforming
areas. The identification of the problem and its root is part of the solution. Therefore, the
recommendations for EU ETS as discussed earlier in this final chapter of the Thesis are:
Simpler Monitoring, Reporting and Verification Process and further environmental
training;
Standardised process in the revenue use form auctions and processes;
Balance of the allowances market; and
Development of an ambitious and realistic global environmental scheme for aviation
operations.
The recommendations for Single European Sky as explained above are:
Increase the Environmental awareness of ANSPs and CAAs
Use the charging scheme as incentive mechanism to improve the environmental
performance
Restructure the ANSP market and make them more efficient in their operations and
services
Use an independent regulator that has the political willingness to take actions
The EU ETS, the SES and any other environmental reform/regulatory framework should
not be treated separately, but it should be designed as part of a system of regulations.

370
Only then can the reform prove sufficiently effective to improve the environmental
performance of aviation to the maximum possible extent.
9.4 Limitations of the PhD Thesis
The central point of this research is the policies about environmental performance in
aviation. The SES and EU ETS reforms were used as case studies to evaluate the
governance issues around the regulation of the European aviation system. The use of
more cases would bring more added value to the findings. Moreover, comparisons
between national and EU attempts to tackle environmental problems were not carried out.
The Delphi study focused on the participants’ opinions on the SES and EU ETS reforms,
but also on other options for the reduction of carbon emissions and the adoption of carbon
neutral growth. A major limitation of this research was the fact that the focus is on carbon
emissions, not on other harmful gases. The regulation focuses on carbon emissions due to
the lack of scientific knowledge about other gases that contribute to Climate Change. The
management approach would be more guiding and beneficial for the actual mitigation of
negative externalities to the environment if further research is conducted in both physics
and chemistry, in combination with the evaluation of the technological improvements in the
aircraft. Due to the lack of consistent and reliable statistical data on aircraft emissions and
their contribution to climate change, this topic is highlighted as an important one, requiring
further research. The contribution of aviation reforms to carbon neutral growth can be
accurately assessed provided that the emissions are researched and fully understood.
Finally, the Delphi research gathered opinions from different stakeholders. The European
Commission, EUROCONTROL, IATA, CAAs and NSAs, European airlines, ANSPs,
individual aviation experts and experts from Ministries of Transports expressed their views
about the SES and EU ETS reforms in relation to the main issues they face and their
contribution to environmental performance. A major limitation is the omission of system

371
and fuel suppliers, the absence of manufacturers and non-European airlines. The reason
for this absence is the difficulty to find experts that are familiar with the reforms and that
are willing to participate in the research. If those groups were represented, the research
would be more holistic and representative of the situation.
9.5 Directions for further research
The aim of this research was achieved. The PhD Thesis gives insight into the
environmental problems caused by aviation operations and the key factors that can lead to
carbon neutral growth. The areas of the Single European Sky and the European Union
Emissions Trading Scheme reforms and their associated issues were extensively
researched; it has been found that they face implementation problems and
recommendations have been given. Finally, the interaction of the aviation reforms, i.e.
SES and EU ETS, were identified and a common approach was proposed.
An area that is very interesting for further study is the route choice based on the trade-off
between the environment and the economic cost of a flight. A conceptual model that arose
from the PhD research takes into consideration the fact that the cost factor needs to be
minimised and flight efficiency needs to be maximised. The model may prove extremely
helpful for the Operational Control Centres of airlines and for the Capacity Flow
Management.
The airlines want to reduce fuel costs, spill costs, the time based cost and overflight costs.
Those costs are subject to aircraft performance, weather conditions, the allowed route,
altitude structure and any schedule and operational constraints. It should be noted that the
route (the ground track), the profile (altitudes along route), the speed (possibly varying
along the route) and the departure fuel vary. The Aircraft Price Index and Aircraft utilisation
parameter are important elements for the model.

372
As far as environmental aspects are concerned, the en-route flight efficiency is affected by
a number of factors. The most important are the following: the route network design
(existing route network), route availability (utilisation of civil military structures), flight
planning capabilities (use of software, repetitive flight planning), user preferences (time,
cost, fuel), the tactical ATC routings and special events such as severe weather or ATC
strikes.
The reduction of emissions depends on the aircraft, the flight operations, technical
optimisation and the network-ground relation. For the aircraft factor, the aircraft weight and
size, the speed, the tanking and the balance-optimal centre for gravity in cargo should be
considered. Flight operations are related to the SES scheme and especially to the
Conditional routes and the airspace re-design. As for the technical optimisation factor,
aerodynamics, the engines, alternative fuels, the 4D trajectory management algorithms (G,
A), the advanced Communication: Datalink (G-A), the advanced Navigation: P-RNAV (A)
and the advanced Surveillance: ADS-B (G ,A), these can actually affect carbon emissions.
The Network/Ground factor concerns local air quality and, to a lesser extent, the climate
change.
The main parameters of the model are identified, but the weighing factors need to be set.
The model will improve airline decision-making for routes selection and will incorporate the
negative externalities towards the environment as well as the trade-offs with other areas of
aviation. The model could be initially a theoretical model and it may afterwards be tested to
historical data and different scenarios.

373
Reference List
1. Abdi, H. (2010) Coefficient of Variation. In Salkind, N. Encyclopaedia of Research
Design, Thousand Oaks, CA: Sage.
2. Adler, N., Forsyth, P., Mueller, J. and Niemeier, H.M. (2015) An economic
assessment of airport incentive regulation, Transport Policy, 41, 5-15.
3. Allen, W.B., Weigelt, K., Doherty, N.A and Mansfield, E. (2012). Managerial
Economics, Theory, Applications and Cases (8th ed.). New York: Norton &
Company Inc.
4. Amadae, S.M (2016) Prisoners of Reason: Game Theory and Neoliberal Political
Economy. UK: Cambridge University Press.
5. American Society of International Law (2008) Possible Looming Conflict with EU
Regulation of Greenhouse Gas Emissions from Civil Aviation; United States Prefers
ICAO Action, The American Journal of International Law, 102 (1), 171-173.
6. Anger, A. and Kohler, J. (2010) Including aviation emissions in the EU ETS: much
ado about nothing? A review. Transport Policy, 17, 38-46.
7. Anger, A., 2010. Including aviation in the European emissions trading scheme:
impacts on the industry, CO 2 emissions and macroeconomic activity in the EU.
Journal of Air Transport Management, 16(2), pp.100–105.
8. Antimiani, A., Costantini, V., Martini, C., Salvatici , L., & Tommasino, M. (2013)
Assessing alternative solutions to carbon leakage. Energy Economics,13, 299-311.
9. Archer, D. (2011) Global Warming: Understanding the Forecast (2nd Edition). USA:
Wiley.
10. Armstrong, M. and Sappington, E.E.M. (2007) Recent Developments in the Theory
of Regulation. In Armstrong, M. and Porter, R. Handbook of Industrial Organization,
Volume 3. North Holland.
11. ATAG (2014). Aviation Benefits beyond Borders. Geneva: ATAG.
12. ATAG, (2005). The economic & social benefits of air transport, Geneva: ATAG.
13. ATWonline. Com (2016) ICAO seals aviation emissions deal. Available from:
http://atwonline.com/eco-aviation/icao-seals-aviation-emissions-deal?NL=ATW-
04&Issue=ATW-04_20161006_ATW-
04_859&sfvc4enews=42&cl=article_1&utm_rid=CPEN1000000425477&utm_camp
aign=7267&utm_medium=email&elq2=6ac59fa75c624f3e8241aa9f909b8cbe
[Accessed 10 October 2016].

374
14. Baldwin, M. (2013). Air Transport Liberalisation - the EU Perspective. ECAC News,
The European Civil Aviation Conference Magazine: 7.
15. Baldwin, R., Cave, M. and Lodge, M. (2013) Understanding Regulation (2nd ed.).
Oxford: Oxford University Press.
16. Ballantyne, R., Hughes, K. & Bond, N. (2016). Using a Delphi approach to identify
managers' preferences for visitor interpretation at Canterbury Cathedral World
Heritage Site. Tourism Management 54, 72-80.
17. Banner, S. (2008). Who Owns the Sky? The struggle to control airspace from the
Wright brothers on. Harvard University Press.
18. Barbot, C. et al., 2014. Trade-offs between environmental regulation and market
competition: Airlines, emission trading systems and entry deterrence. Transport
Policy, 33(C), pp.65–72.
19. Barker, T., Junankar, S., Pollitt, H. & Summerton, P. (2007) Carbon leakage from
unilateral Environmental Tax Reforms in Europe, 1995-2005. Energy Policy, 35,
6281-6292.
20. Barrett, S. (2009) Climate Treaties and the Imperative of Enforcement. In Helm, D.
and Hepburn, C. (2009) The economics and politics of climate change. NY: Oxford
University Press.
21. Barthwal, R. R. (2004). Industrial Economics, an introductory textbook. 2nd edition.
New Delhi: New Age International.
22. Baumgartner, M. & Finger, M., 2014. European air transport liberalization: Possible
ways out of the single European sky gridlock. Utilities policy, 30, pp.29–40.
23. Baumgartner, M. & Finger, M., 2014. The Single European Sky gridlock: A difficult
10 year reform process. Utilities Policy, 31, pp.289–301.
24. Beesley, M. (1997) Privatization, Regulation and Deregulation (2nd Ed). Routledge.
25. Beins, C. B., and McCarthy A. M. (2012). Research methods and statistics. USA:
Pearson.
26. Bel, G. and Fageda, X., (2010) Privatization, regulation and airport pricing: An
empirical analysis for Europe, Journal of Regulatory Economics, 37(2), 142–61.
27. Bernard, H.R., Wutich, A.Y. and Ryan, G.W. (2016) Analyzing qualitative data:
Systemic approaches. California: SAGE.
28. Besanko, D. & Braeutigam, R. R. (2011). Microeconomics 4th edition. USA: John
Wiley & Sons.
29. Biedermann, M. (2015) Aviation Biofuels. Curse or Cure for Green Aviation?
Germany: Grin Verlag Gmbh.

375
30. Biggar, D., 2012. Why Regulate Airports?<BR> A Re-examination of the Rationale
for Airport Regulation. Journal of Transport Economics and Policy (JTEP), 46(3),
pp.367–380.
31. Boeing, 2016. Current Market Outlook 2016-2035. Seattle: Boeing.
32. Bogdan, R.C. & Biklen, S. K. (2006). Qualitative research for education: An
introductory to theory and methods. (5th ed.). Needham Heights, MA: Allyn and
Bacon.
33. Bourne, L., (2009). Stakeholder Relationship Management, a Maturity Model for
Organisational Implementation. Surrey: Gower Publishing Limited.
34. Bozarth, C. (2016). Introduction to Operations and Supply Chain Management
(Global Edition). UK: Pearson.
35. Bradley, T. H., Moffitt, B. A., Parekh, D. E. and Mavris, D. N. (2007) Flight Test
Results for a Fuel Cell Unmanned Aerial Vehicle," in45th AIAA Aerospace Sciences
Meeting and Exhibit, 8 - 11 January 2007, Reno, Nevada.
36. Brasseur, G.P., Gupta, M., Anderson, B.E., Balasubramanian, S., Barrett, S., Duda,
D., Fleming, G., Forster, P.M., Fuglestvedt, J., Gettelman, A., et al. (2016) Impact of
Aviation on Climate: FAA’s Aviation Climate Change Research Initiative (ACCRI)
Phase II. DOI: http://dx.doi.org/10.1175/BAMS-D-13-00089.1 .
37. Brunner, s. and Enting, K. (2013) Climate finance: A transaction cost perspective on
the structure of state-to-state transfers. Global Environmental Change, 27, 138-143.
38. Bunge, M. (1993) Realism and Antirealism in Social Science. Theory and Decision,
35(3), 207-235.
39. Button, K. & Neiva, R., 2013. Single European Sky and the functional airspace
blocks: Will they improve economic efficiency? Journal of Air Transport
Management, 33(C), pp.73–80.
40. CAA (2016) Aviation's impact on air quality. Available from:
https://www.caa.co.uk/Environment/Environmental-information/Information-by-
environmental-impact/Aviation-s-impact-on-air-quality/ [Accessed on 01 July 2016].
41. CAA CAP 1119 (2013) Environmental charging – Review of impact of noise and
NOx landing charges. London: CAA.
42. Cacho, O.J., Lipper, L. and Moss J. (2013) Transaction costs of carbon offset
projects: A comparative study. Ecological Economics, 88, 232-243.
43. CAIT Climate Data Explorer (2015) World Resources Institute. Available from:
http://cait.wri.org. [Accessed on 28 July 2016].

376
44. Calleja Crespo D. & Mendes de Leon P.M.J. (2011), Achieving the Single European
Sky: Goals and Challenges. Alphen aan de Rijn: Kluwer law International.
45. CE (2005) Giving wings to emission trading: Inclusion of aviation under the
European emission trading system (ETS): design and impacts. The Netherlands:
CE.
46. Chadwick, B. P. (2006) Transaction costs and the clean development mechanism.
Natural Resources Forum, 30, 256-271.
47. Chevallier, J. (2012). Econometric Analysis of Carbon Markets. 1st Edition ed.
S.l.:Springer.
48. Chinyio, E. and Olomolaiye, P. (2010) Construction Stakeholder Management.
Wiley-Blackwell
49. Chuck, C. (2016) Biofuels for Aviation Feedstocks, Technology and Implementation.
Elsevier
50. Clo, S. (2010) Grandfathering, auctioning and Carbon Leakage: Assessing the
inconsistencies of the new ETS Directive. Energy Policy, 38, 2420-2430.
51. Coady, D.Gillingham, R., Ossowski, R., Piotrowski, J., Tareq, S. and Tyson, J.
(2010) Petroleum product subsidies: Costly, inequitable and rising; International
Monetary Fund Staff Position Note. Available from:
http://www.imf.org/external/pubs/ft/spn/2010/spn1005.pdf [Accessed on 28 July
2016].
52. Coase, R.H. (1960) The Problem of Social Cost, Journal of Law and Economics, 3,
1-43.
53. Coglianese, C., Nash, J. and Olmstead, T. (2002) Performance-Based Regulation:
Prospects and Limitations in Health, Safety, and Environmental Protection,
Regulatory Policy Program Report No. RPP-03. Available from:
http://www.ksg.harvard.edu/m-rcbg/Events/Papers/RPPREPORT3.pdf [Accessed
19 September 2014].
54. Committee on Radiative Forcing Effects on Climate, Climate Research Committee,
Board on Atmospheric Sciences and Climate, Division on Earth and Life Studies
and National Research Council (2005) Radiative Forcing of Climate Change:
Expanding the Concept and Addressing Uncertainties. USA: National Academies
Press
55. Cong, R.-G. & Wei, Y.-M. (2012) Experimental comparison of impact of auction
format on carbon allowance market. Renewable and Sustainable Energy Reviews,
16(6), 4148-4156.

377
56. Court of Justice of the European Union (2011) The directive including aviation
activities in the EU’s emissions trading scheme is valid. Luxembourg: CJEU.
57. Creswell, J. W. (2008). Educational Research: Planning, conducting, and evaluating
quantitative and qualitative research (3rd ed.). Upper Saddle River: Pearson.
58. Creswell, J. W. (2013). Research design: Qualitative, quantitative, and mixed
methods approaches, 4th Ed. Sage Publications.
59. Creswell, J.W. (2012). Qualitative inquiry & research design: Choosing among five
approaches, 3rd Ed. Sage Publications.
60. Crubb, M. (2009). Linking Emissions Trading Schemes. Climate Policy, 9, 339-340.
61. Cui, Q., Wei, Y.M. and Li, Y. (2016) Exploring the impacts of the EU ETS emission
limits on airline performance via the Dynamic Environmental DEA approach.
Applied Energy, 183, 984-994.
62. Czerny, AI., Guiomard, C. and Zhang, A. (2016) Single-Till versus Dual-Till
Regulation of Airports: Where Do Academics and Regulators (Dis)Agree? Available
at SSRN: https://ssrn.com/abstract=2734643 or
http://dx.doi.org/10.2139/ssrn.2734643 [Accessed 08 February 2017].
63. De Bruyn, S., Nelissen, D. & Koopman, M. (2013). Carbon leakage and the future of
the EU ETS market Impact of recent developments in the EU ETS on the list of
sectors deemed to be exposed to carbon leakage. [Online] Available from:
http://www.cedelft.eu/art/uploads/CE_Delft_7917_Carbon_leakage_future_EU_ETS
_market_Final.pdf [Accessed 19 September 2013].
64. De Laporte, A.V., Weersink, A.J. and McKenney, D.W. (2016) Effects of supply
chain structure and biomass prices on bioenergy feedstock supply, Applied Energy,
183, 1053-1064.
65. DECISION No 377/2013/EU on derogating temporarily from Directive 2003/87/EC
establishing a scheme for greenhouse gas emission allowance trading within the
Community.
66. DEHSt (2012) Auctioning of Emission Allowances in Germany Periodical Report:
Early Auctions and Auctioning in Aviation 2012. Available from:
http://www.dehst.de/SharedDocs/Downloads/EN/Auctioning/2012_report_early-
auctions.pdf?__blob=publicationFile [Accessed 19 April 2013].
67. Department of energy and climate change (2013). Call for evidence EU ETS:
Carbon leakage review data request. [Online] Available from:
https://www.gov.uk/government/uploads/system/uploads/attachment_data/file/1442

378
32/call_for_evidence_euets_carbon_leakage_review_data_request.pdf [Accessed
19 September 2013].
68. Department of Transportation (DoT) / Bureau of Transport Statistics of the (2016).
National Transportation Statistics. Available from:
http://www.rita.dot.gov/bts/sites/rita.dot.gov.bts/files/publications/national_transporta
tion_statistics/index.html#chapter_1 [Accessed 10 October 2016].
69. DIRECTIVE 2008/101/EC on amending Directive 2003/87/EC so as to include
aviation activities in the scheme for greenhouse gas emission allowance trading
within the Community
70. DIRECTIVE 2009/28/EC OF THE EUROPEAN PARLIAMENT AND OF THE
COUNCIL of 23 April 2009 on the promotion of the use of energy from renewable
sources and amending and subsequently repealing Directives 2001/77/EC
and 2003/30/EC.
71. Directive 2009/28/EC on the promotion of the use of energy from renewable
sources and amending and subsequently repealing Directives 2001/77/EC and
2003/30/EC.
72. Directive 2009/29/EC of the European Parliament and of the Council amending
Directive 2003/87/EC so as to improve and extend the greenhouse gas emission
allowance trading scheme of the Community.
73. EASA, EEA and EUROCONTROL (2016) European Aviation Environmental Report
2016. Available from:
http://ec.europa.eu/transport/sites/transport/files/modes/air/aviation-
strategy/documents/european-aviation-environmental-report-2016-72dpi.pdf
[Accessed 3 October 2016].
74. EC (2012) Guidance Document: The Accreditation and Verification Regulation
Verification Guidance for EU ETS Aviation. Brussels, EC. Available from:
http://ec.europa.eu/clima/policies/ets/monitoring/docs/gd_iii_aviation_verification_gu
idance_en.pdf [Accessed 03 February 2015].
75. EC (2013). Impact Assessment Available from:
http://ec.europa.eu/clima/policies/transport/aviation/docs/swd_2013_430_en.pdf
[Accessed 23 February 2015].
76. EC (2014) Opinion of the European Economic and Social Committee on the
Proposal for a Directive of the European Parliament and of the Council amending
Directive 2003/87/EC establishing a scheme for greenhouse gas emission
allowance trading within the Community, in view of the implementation by 2020 of

379
an international agreement applying a single global market-based measure to
international aviation emissions. Available from: http://eur-lex.europa.eu/legal-
content/EN/TXT/?uri=celex%3A52013AE7943 [Accessed 03 February 2015].
77. EC (2015). Evaluation of the Single European Sky (SES) performance and charging
schemes. Available from: http://ec.europa.eu/smart-
regulation/roadmaps/docs/2016_move_015_evaluation_single_european_sky_perf
ormance_en.pdf [Accessed 03 June 2016].
78. EC (2016) Structural reform of the EU ETS. Available from:
http://ec.europa.eu/clima/policies/ets/reform/index_en.htm [Accessed 01 July 2016]
79. EC (n.d.) EU ETS Handbook. Available at
http://ec.europa.eu/clima/publications/docs/ets_handbook_en.pdf [Accessed 01 July
2016].
80. EC 2015/340 on laying down technical requirements and administrative procedures
relating to air traffic controllers' licences and certificates pursuant to Regulation (EC)
No 216/2008 of the European Parliament and of the Council, amending
Commission Implementing Regulation (EU) No 923/2012 and repealing
Commission Regulation (EU) No 805/2011.
81. EC COM (2015) 576 final CARBON MARKET REPORT 2015. Available from:
http://ec.europa.eu/clima/policies/strategies/progress/docs/com_2015_576_annex_
1_en.pdf
82. EC DG ENER (2014). Study on actual GHG data for diesel, petrol, kerosene and
natural gas (Interim Report). Brussels, EC.
83. EC No 100/2014 amending Regulation (EC) No 748/2009 on the list of aircraft
operators that performed an aviation activity listed in Annex I to directive
2003/87/EC of the European Parliament and of the Council on or after 1
January 2006 specifying the administering Member State for each aircraft
operator.
84. EC No 1031/2010 on the timing, administration and other aspects of auctioning of
greenhouse gas emission allowances pursuant to Directive 2003/87/EC of the
European Parliament and of the Council establishing a scheme for greenhouse gas
emission allowances trading within the Community.
85. EC No 1794/2006 laying down a common charging scheme for air navigation
services.
86. EC No 2150/2005 on laying down common rules for the flexible use of airspace.

380
87. EC No 390/2013 on laying down a performance scheme for air navigation services
and network functions.
88. EC No 549/2004 on laying down the framework for the creation of the Single
European Sky.
89. EC No 550/2004 on the provision of air navigation services in the Single European
Sky.
90. EC No 601/2012 on the monitoring and reporting of greenhouse gas emissions
pursuant to Directive 2003/87/EC of the European Parliament and of the Council.
91. EC No 691/2010 on laying down a performance scheme for air navigation
services and network functions and amending Regulation (EC) No 2096/2005
laying down common requirements for the provision of air navigation services.
92. EC No 94/69: Council Decision of 15 December 1993 concerning the conclusion of
the United Nations Framework Convention on Climate Change.
93. Ecofys (2014). Greenhouse gas impact of marginal fossil fuel use. Netherlands,
Ecofys.
94. Ecosystem Marketplace (2014) Ecosystem Marketplace. Available from:
http://www.ecosystemmarketplace.com/pages/dynamic/web.page.php?section=carb
on_market&page_name=otc_market [Accessed 20 February 2014].
95. EEX (2012) Auctioning of Emission Allowances in EU ETS Phase III, Guidance for
Bidders. Available from:
http://cdn.eex.com/document/129131/EEX_PIIIAuctions_Guidance.pdf [Accessed
19 April 2013].
96. EEX (2013) EEX. Available from: http://www.eex.com/en/Auction [Accessed 19 April
2013].
97. EEX (2016) Emission Spot Primary Market Auction Report 2016. Available from:
https://www.eex.com/en/products/environmental-markets/emissions-auctions
[Accessed 19 August 2016].
98. Efthymiou, M., Arvanitis, P. & Papatheodorou, A. (2016) Institutional Changes and
Dynamics in the European Aviation Sector: Implications for Tourism. In Pappas N.
& Bregoli, I. (eds) Global Dynamics in Travel, Tourism and Hospitality. Hershey
Pennsylvania: IGI Global.
99. Embraer (2015) Boeing and Embraer Open Joint Aviation Biofuel Research Center
in Brazil. Available from: http://www.embraer.com/en-us/imprensaeventos/press-
releases/noticias/pages/boeing-e-embraer-inauguram-centro-de-pesquisa-em-
biocombustiveis-no-brasil.aspx [Accessed 28 June 2016].

381
100. EUROCONTROL (2008) Evaluation of Functional Airspace Block (FAB) initiatives
and their contribution to Performance improvement. Brussels: EUROCONTROL.
Available from: http://www.eurocontrol.int/sites/default/files/publication/files/prc-
evaluation-of-fabs-high-quality-graphics.pdf [Accessed 3 October 2016].
101. EUROCONTROL (2010) EUROCONTROL History Book. Brussels:
EUROCONTROL. Available from
https://www.eurocontrol.int/sites/default/files/publication/files/2011-history-book.pdf
[Accessed 21 April 2016].
102. EUROCONTROL (2011a) Continuous Descent: A guide to implementing
Continuous Descent. Brussels: EUROCONTROL. Available from:
https://www.eurocontrol.int/sites/default/files/publication/files/2011-cd-brochure-
web.pdf [Accessed 3 October 2016].
103. EUROCONTROL (2011b) Free Route Airspace in high-density airspace enters new
phase – direct routes available to aircraft operators for longer time period. Available
from: http://www.eurocontrol.int/sites/default/files/pressrelease/june2011-
fram2pressrelease.pdf [Accessed 3 October 2016].
104. EUROCONTROL (2012) Report on the Operation of the Route Charges System in
2011. Brussels: EUROCONTROL. Available from:
https://www.eurocontrol.int/sites/default/files/article/content/documents/route-
charges/operation-reports/system_report_2011.pdf [Accessed 21 April 2016].
105. EUROCONTROL (2014) Report on the Operation of the Route Charges System in
2013. Brussels: EUROCONTROL. Available from:
https://www.eurocontrol.int/sites/default/files/content/documents/route-
charges/operation-reports/2013-report-on-the-operation-of-the-route-charges-
system.pdf [Accessed 21 April 2016].
106. EUROCONTROL (2015a) EUROCONTROL Seven-Year Forecast February 2015:
Flight Movements and Service Units 2015 – 2021. Available from:
https://www.eurocontrol.int/sites/default/files/content/documents/route-
charges/forecast-of-service-units/seven-year-flights-service-units-forecast-2015-
2021-feb2015.pdf [Accessed 21 April 2016].
107. EUROCONTROL (2015b) Report on the Operation of the Route Charges System in
2014. Brussels: EUROCONTROL. Available from:
https://www.eurocontrol.int/sites/default/files/content/documents/route-
charges/operation-reports/2014-report-on-the-operation-of-the-route-charges-
system.pdf [Accessed 21 April 2016].

382
108. EUROCONTROL (2015c) Annual Network Operations Report 2014, June 2015.
Available from:
https://www.eurocontrol.int/sites/default/files/publication/performance/2014_annual/f
inal/annual_network_operations_report_2014_main_report_final_edition.pdf
[Accessed 21 April 2016].
109. EUROCONTROL (2016a) EUROCONTROL Seven-Year Forecast February 2016:
Flight Movements and Service Units 2016-2022. Available online from:
https://www.eurocontrol.int/sites/default/files/content/documents/official-
documents/forecasts/seven-year-flights-service-units-forecast-2016-2022-
Feb2016.pdf [Accessed 21 April 2016].
110. EUROCONTROL (2016b). Maastricht Upper Area Control Centre Annual Report
2015. Maastricht: EUROCONTROL.
111. EUROCONTROL (2016c) Initial Estimates of the Route Charges Cost-Bases and
Unit Rates CRCO Overview –Estimated figures –June 2016 (Information Paper).
Brussels: EUROCONTROL. Available from:
https://www.eurocontrol.int/sites/default/files/content/documents/route-
charges/operation-reports/preliminary-estimate-route-charges-2017.pdf [Accessed
3 October 2016].
112. EUROCONTROL and FAA, 2013. Comparison of ATM-related performance: U.S. –
Europe.
113. EUROCONTROL and University of Westminster (2004) Evaluating the true cost to
airlines of one minute of airborne or ground delay. Brussels: EUROCONTROL.
Available from:
https://www.eurocontrol.int/sites/default/files/content/documents/sesar/business-
case/evaluating_true_cost_of_delay_2004.pdf [Accessed 02 June 2015]
114. EUROCONTROL.int (2016a) Performance Review Unit. Available from:
http://www.eurocontrol.int/articles/performance-review-unit [Accessed 3 October
2016].
115. EUROCONTROL.int (2016b) Full integration with the Single European Sky.
Available from: http://www.eurocontrol.int/articles/full-integration-single-european-
sky [Accessed 3 October 2016].
116. EUROCONTROL.int (2016c) Establishing route charges. Available from:
http://www.eurocontrol.int/articles/establishing-route-charges [Accessed 3 October
2016].

383
117. EUROCONTROL.int (2016d) Airspace developments and the Flight Efficiency Plan
(FEP). Available from: http://www.eurocontrol.int/articles/airspace-developments-
and-flight-efficiency-plan-fep [Accessed 3 October 2016].
118. EUROCONTROL.int (2016e) Conditional Route. Available from:
https://ext.eurocontrol.int/lexicon/index.php/Conditional_Route [Accessed 3
October 2016].
119. EUROCONTROL.int (2016f) Flexible use of airspace. Available from:
http://www.eurocontrol.int/articles/flexible-use-airspace [Accessed 3 October 2016].
120. EUROCONTROL/Performance Review Commission (2015) Performance Review
Report: An Assessment of Air Traffic Management in Europe during the Calendar
Year 2014. Brussels: EUROCONTROL. Available from:
https://www.eurocontrol.int/sites/default/files/publication/files/prr-2014.PDF
[Accessed 3 October 2016].
121. EUROCONTROL/Performance Review Commission (2016) Performance Review
Report: An Assessment of Air Traffic Management in Europe during the Calendar
Year 2015. Brussels: EUROCONTROL. Available from:
http://www.eurocontrol.int/sites/default/files/content/documents/single-
sky/pru/publications/other/PRR-2015.pdf [Accessed 3 October 2016].
122. europarl.europa.eu (2016) Air transport: Single European Sky. Available from:
http://www.europarl.europa.eu/atyourservice/en/displayFtu.html?ftuId=FTU_5.6.9.ht
ml [Accessed 10 October 2016].
123. European Parliament (2016) Main options for a GMBM at ICAO during its High-level
Meeting in May 2016. Available from:
http://www.europarl.europa.eu/RegData/etudes/BRIE/2016/578983/IPOL_BRI(2016
)578983_EN.pdf [Accessed 28 July 2016].
124. FAA (2016) Continuous Lower Energy, Emissions, and Noise (CLEEN) Program.
Available from:
http://www.faa.gov/about/office_org/headquarters_offices/apl/research/aircraft_tech
nology/cleen/ [Accessed 01 October 2016].
125. FAA and EUROCONTROL (2016). 2015 Comparison of ATM-related performance:
U.S. –Europe. Available from:
https://www.eurocontrol.int/sites/default/files/content/documents/single-
sky/pru/publications/other/us-eu-comparison-2015.pdf [Accessed 10 October 2016].

384
126. FABEC.eu (2016) FABEC Facts & Figures. Available from:
http://www.fabec.eu/fabec_homepage/en/About%20FABEC/Facts%20&%20Figures
/ [Accessed 21 April 2016].
127. FAO (2011) New tool for weighing pros and cons of bioenergy; FAO Press release,
17th May 2011. Available from:
http://www.fao.org/asiapacific/rap/home/news/detail/en/?no_cache=1&news_uid=74
658 [Accessed on 10 July 2013].
128. Feilzer, M. Y. (2010). Doing mixed methods research pragmatically: Implications for
the rediscovery of pragmatism as a research paradigm. Journal of Mixed Methods
Research. 4, 6 – 16.
129. Field, B. (1994) Environmental Economics: An introduction. Sinapore: McGraw-Hill
International Editions.
130. Flachsland, C., Marschinski, R. & Edenhofer, O. (2009) To link or not to link:
benefits and disadvantages of linking cap-and-trade systems. Climate Policy, 9,
358-372.
131. Flick, U. (2009) An Introduction to Qualitative Research 4th Ed. Sage.
132. Forster, P.M. de F., Shine, K.P. & Stuber, N., 2006. It is premature to include non-
CO 2 effects of aviation in emission trading schemes. Atmospheric Environment,
40(6), pp.1117–1121.
133. Forsyth, P. (2008) The Impact of Climate Change Policy on Competition in the Air
Transport Industry. Paris: OECD.
134. Frasch, F. (2007) Transaction Costs of the EU Emissions Trading Scheme in
German Companies, Sustainable Development Law & Policy, 48-51.
135. Girardet, D. & Spinler, S., 2013. Does the aviation Emission Trading System
influence the financial evaluation of new airplanes? An assessment of present
values and purchase options. Transportation Research Part D: Transport and
Environment, 20, pp.30–39.
136. Glesne, C. & Peshkin, A. (1992) Becoming qualitative researchers: An introduction.
White Plains, NY: Longman.
137. Goodman, J. C. (2009) Aviation and the Environment. 1st ed. New York: Nova
Science Publishers.
138. Gössling, S. & Upham, P. (2009) Climate Change and Aviation, Issues, Challenges
and Solutions. London: Earthscan.
139. Gray, E.D. (2014). Doing Research in the Real World. UK: SAGE.

385
140. GreenAir (2012) British Airways pledges 10-year offtake agreement as GreenSky
project with Solena gathers momentum; GreenAir Online. Available from:
http://www.solenafuels.com/pdfs/BritishAirways_10yrAgreement.pd [Accessed 30
December 2012].
141. Grififths, P. (2013) SES Performance targets and achievements. Available from:
http://www.caa.lv/upload/userfiles/files/SES%20Performance%20targets%20_%20a
chievements.pdf [Accessed 10 October 2016].
142. Grififths, P. (2014) SES Performance Scheme: Driving Performance Improvement in
European ATM /ANS. Presented at CIPFA Meeting. Available from:
www.cipfa.org/~/media/files/.../ses%20performance%20scheme%20cipfa.pptx?la=e
n [Accessed 10 October 2016].
143. Grodecka, A. and Kuralbayeva, K. (2015) The price vs quantity debate: climate
policy and the role of business cycles. Working paper, Centre for Climate Change
Economics and Policy and Grantham Research Institute on Climate Change and
the Environment.
144. Grubb, M. & Neuhoff, K. (2006) Allocation and competitiveness in the EU emissions
trading scheme: policy overview. Climate Policy, 6, 7-30.
145. Guba, E. G. (1990) The Alternative Paradigm Dialog. In Guba, E. (Ed) The
Paradigm dialog. Newbury Park, CA: Sage Publications.
146. Haites, E. (2009) Linking emission trading schemes for international aviation and
shipping emissions. Climate Policy, 9, 415-430.
147. Han, J., Elgowainy, A., Cai, H. and Wang Q.Q., (2013) Life-cycle analysis of bio-
based aviation fuels, Bioresource Technology, 15, 447-456.
148. Hanlon, J., (2013) ELFAA Press Release ELFAA urges Parliament to reject
Commission proposal to weaken effectiveness of EU ETS Available from:
http://www.elfaa.com/131202_ELFAA_PressRelease_ETS.pdf [Accessed 28 June
2016].
149. Harris, J.M and Roach, B. (2016) Environmental and Natural Resource Economics:
A Contemporary Approach (3rd ed.). London, Routledge
150. Havel, B.F. and Sanchez, G.S. (2012) Toward an international aviation emissions
agreement, Harvard Environmental Law Review, 36, 350-385.
151. Heindl, P. (2012), Transaction Costs and Tradable Permits: Empirical Evidence
from the EU Emissions Trading Scheme, ZEW Discussion Paper No. 12-021,
Mannheim.

386
152. Helm, D. (2009) Climate-change Policy: Why has so little been achieved? In Helm,
D. and Hepburn, C. (2009) The economics and politics of climate change. NY:
Oxford University Press.
153. Hepburn, C. and Stern, S. (2009) The Global Deal on Climate Change. In Helm, D.
and Hepburn, C. (2009) The economics and politics of climate change. NY: Oxford
University Press.
154. Hicks, J. R. (1935) A Suggestion for Simplifying the Theory of Money. Economica
(New Series), 2(5), 1-19.
155. Hogan, J., Dolan, P., Donnelly, P. (2011) Approaches to Qualitative Research:
Theory and Its Practical Application. Cork: Oak Tree Press.
156. Hsu, C.C and Sandford, B.A. (2007) The Delphi Technique: Making Sense Of
Consensus, Practical Assessment, Research & Evaluation, 12(10), 1-8.
157. Huet, F. (2011) The Regulation of Air Navigation Charges. In Crespo, D.C. and
Mendes de Leon, P. Achieving the Single European Sky: Goals and Challenges,
The Netherlands: Kluwer Law International.
158. IAA and NATS (2012) UK-Ireland FAB Cost-Benefit Analysis. Available from:
http://ec.europa.eu/transport/modes/air/single_european_sky/doc/2012_04_17_app
endix_i_fab_cba_final_9_jan_2012.pdf [Accessed 13 August 2013].
159. IAA, 2013. FAB 4 Project, IAA. Available from: https://www.iaa.ie/FAB [Accessed 16
August 2013].
160. IATA (2006) Economics Briefing Impact of the Rise in UK Air Passenger Duty,
Geneva: IATA .
161. IATA (2008a) Aviation carbon offset programmes IATA guidelines and toolkit.
Montreal: IATA.
162. IATA (2008b) IATA Guidance on Airport Fuel Storage Capacity. Available at
https://www.iata.org/policy/Documents/guidance-fuel-storage-may08.pdf [Accessed
on 28 July 2016].
163. IATA (2013a) IATA Economic Briefing Infrastructure Costs. Montreal: IATA.
Available from:
https://www.iata.org/whatwedo/Documents/economics/Infrastructure-Cost-March-
2013.pdf [Accessed on 28 July 2016].
164. IATA (2013b) The Cost of the EU Emissions Trading Scheme. Montreal: IATA.
Available from: https://www.iata.org/publications/economics/Documents/EUETS-
cost-briefing-march-2013.pdf [Accessed on 28 July 2015].

387
165. IATA (2014a) Annual Review 2014. Montreal: IATA. Available from:
https://www.iata.org/about/Documents/iata-annual-review-2014.pdf [Accessed on
28 July 2016].
166. IATA (2015) Progress Report 2015 and Supporting Airline Industry Achievement of
Sustained Financial Health. Montreal: IATA. Available from:
http://www.iata.org/services/finance/Documents/iata-financial-committee-white-
paper.pdf [Accessed on 28 July 2016].
167. IATA (2016a). Fact Sheet: Carbon Offsetting. Montreal: IATA. Available from:
https://www.iata.org/pressroom/facts_figures/fact_sheets/Documents/fact-sheet-
carbon-offsetting.pdf [Accessed on 06 October 2016].
168. IATA (2016b) Fact Sheet –Fuel. Montreal: IATA. Available from:
https://www.iata.org/pressroom/facts_figures/fact_sheets/Documents/fact-sheet-
fuel.pdf [Accessed on 06 October 2016].
169. IATA, AEA and ERA (2013) A Blueprint for the Single European Sky report.
Available from: https://www.iata.org/pressroom/pr/Documents/blueprint-single-
european-sky.pdf [Accessed on 28 July 2016].
170. IATA, AEA and ERA, (2013) A Blueprint for the Single European Sky Delivering on
safety, environment, capacity and cost-effectiveness. Available from:
https://www.iata.org/pressroom/pr/Documents/blueprint-single-european-sky.pdf
[Accessed 29 June 2016].
171. IATA, EUROCONTROL, CANSO (2008) Flight Efficiency Plan: Fuel and emissions
savings. Available from:
http://www.EUROCONTROL.int/sites/default/files/article/content/documents/nm/rep
orts/flight-efficiency-plan.pdf [Accessed 6 Oct. 2016].
172. IATA.org (2016b) IATA Carbon Offset Program. Available from
https://www.iata.org/whatwedo/environment/Pages/carbon-offset.aspx [Accessed 6
Oct. 2016].
173. IATA.org (2016c) Vision and Mission. Available from:
http://www.iata.org/about/Pages/mission.aspx [Accessed 6 Oct. 2016].
174. IATA.org. (2016a) IATA - History - Growth and Development. Available from:
http://www.iata.org/about/Pages/history_3.aspx [Accessed 6 Oct. 2016].
175. ICAO (2003) Worldwide Air Transport Conference: Challenges and Opportunities of
Liberalization ATConf/5-WP/20. Available from:
http://www.icao.int/Meetings/ATConf5/Documents/ATConf5_wp020_en.pdf
[Accessed 09 September 2015].

388
176. ICAO (2010). ICAO Environmental Report 2010, Aviation and Climate Change.
Montreal: ICAO.
177. ICAO (2012) New ICAO Council High-level Group to Focus on Environmental Policy
Challenges. Available from: http://www.icao.int/Newsroom/Pages/new-ICAO-
council-high-level-group-to-focus-on-environmental-policy-challenges.aspx
[Accessed 09 September 2015].
178. ICAO (2013a) Present and Future Trends in Aircraft Noise and Emissions. Agenda
Item 17: Environmental Protection Assembly — 38th Session Working Paper 26.
Available online at http://www.icao.int/Meetings/a38/Documents/WP/wp026_en.pdf
[Accessed 09 April 2016].
179. ICAO (2013b) ICAO Environmental Report 2013. Montreal: ICAO.
180. ICAO (2014a) Safety report 2014 edition. Montreal, ICAO. Available from:
http://www.icao.int/safety/Documents/ICAO_2014%20Safety%20Report_final_0204
2014_web.pdf [Accessed 12 July 2016].
181. ICAO (2014b) CAO Carbon Emissions Calculator Version 7. Montreal: ICAO.
Available from http://www.icao.int/environmental-
protection/CarbonOffset/Documents/Methodology%20ICAO%20Carbon%20Calcula
tor_v7-2014.pdf [Accessed 09 April 2016].
182. ICAO (2016) High Level Meeting on a Global Market Based Measure Scheme.
Working paper available from http://www.icao.int/Meetings/HLM-
MBM/Documents/HLM-GMBM.WP2-Developments_Final.pdf [Accessed 28 July
2016].
183. ICAO Annex 16 (2008) Environmental Protection Volume II Aircraft engine
emissions (3rd ed). Montreal: ICAO.
184. ICAO Annex 16 (2011) Environmental Protection Volume I Aircraft Noise (6th ed).
Montreal: ICAO.
185. ICAO Doc 030 (2013) EUR Region Performance Framework Document. Montreal:
ICAO.
186. ICAO Doc 10018 (2013). Report of the Assessment of Market-based Measures.
Available from: http://www.icao.int/Meetings/GLADs-
2015/Documents/10018_cons_en.pdf [Accessed 12 July 2016].
187. ICAO Doc 9082 (2012) ICAO’s Policies on Charges for Airports and Air Navigation
Services. Montreal: ICAO.

389
188. ICAO Doc 9161 (2013) Manual on Air Navigation Services Economics. Available
from: http://www.icao.int/publications/Documents/9161_en.pdf [Accessed 12 July
2016].
189. ICAO Doc 9587 (2008) Policy and Guidance Material on the Economic Regulation
of International Air Transport. Montreal: ICAO.
190. ICAO Doc 9885 (2008) Guidance on the Use of Emissions Trading for Aviation.
Montreal: ICAO.
191. ICAO Doc 9902 (2007) Assembly Resolutions in Force (as of 28 September 2007).
Available from: http://www.icao.int/environmental-
protection/Documents/A36_Res22_Prov.pdf [Accessed 09 April 2015].
192. ICAO Doc 9931 (2010) Continuous Descent Operations (CDO) Manual. Montreal:
ICAO.
193. ICAO Doc 9951 (2011) Offsetting Emissions from the Aviation Sector. Montreal:
ICAO.
194. ICAO Doc 9980 (2012) Manual on Privatization in the Provision of Airports and Air
Navigation Services. Montreal: ICAO
195. ICAO Doc 9993 (2013) Continuous Climb Operations (CCO) Manual. Montreal:
ICAO.
196. ICAP (2014) Emissions Trading Worldwide International Carbon Action Partnership
(ICAP) Status Report 2014. Available from:
https://icapcarbonaction.com/en/?option=com_attach&task=download&id=349
[Accessed 09 April 2015].
197. ICAP (2016) Canada - Québec Cap-and-Trade System. Available from:
https://icapcarbonaction.com/en/?option=com_etsmap&task=export&format=pdf&la
yout=list&syste [Accessed 09 October 2016].
198. ICCT (2016) Cost assessment of near and mid-term echnologies to improve new
aircraft fuel efficiency. USA: ICCT. Available from:
http://www.theicct.org/sites/default/files/publications/ICCT%20aircraft%20fuel%20ef
ficiency%20cost%20assessment_final_09272016.pdf [Accessed 10 October 2016].
199. Ihlen, O and Berntzen, O. (2007) When lobbying backfires: Balancing lobby efforts
with insights from stakeholder theory. Journal of Communication Management,
11(3):235–246.
200. Independent Transport Commission (2016) The sustainability of UK Aviation:
Trends in the mitigation of noise and emissions. London: Independent Transport
Commission. Available from: http://www.theitc.org.uk/wp-

390
content/uploads/2016/03/ITC-Aviation-Sustainability-March-2016-complete.pdf
[Accessed 12 September 2016].
201. International Energy Agency (IEA) (2015) CO2 Emissions From Fuel Combustion
Highlights. Available from
https://www.iea.org/publications/freepublications/publication/CO2EmissionsFromFu
elCombustionHighlights2015.pdf [Accessed 09 March 2016].
202. IPCC (1999) Aviation and the Global Atmosphere. Geneva:IPCC. Available from:
http://www.ipcc.ch/ipccreports/sres/aviation/ [Accessed on 28 July 2016].
203. IPCC (2007) Climate Change 2007 – The Physical Science Basis. Contribution of
Working Group I to the Fourth Assessment Report. Available from
http://www.ipcc.ch/publications_and_data/ar4/wg1/en/contents.html Accessed
09/04/2016 [Accessed on 28 July 2015].
204. ITF/OECD (2011) Better Economic Regulation: The role of the regulator. Paris:
OECD
205. Janes, T.M., Felps, W. and Bigley, G.A. (2007) Ethical theory and stakeholder
related decisions: the role of stakeholder culture, Academy of Management Review,
22(1), 137-155.
206. Janic, M. (2007) The Sustainability of Air Transportation: A Quantitative Analysis
and Assessment. UK: Routledge
207. Johnson, G., Scholes, K. and Whittington, R. (2010) Exploring Corporate Strategy:
Texts and Cases (9th ed). Harlow: Financial Times Prentice-Hall.
208. Johnson, R. B. & Onwuegbuzie, A. J. (2004). Mixed methods research: A research
paradigm whose time has come. Educational Researcher, 33(7), 14-26.
209. Joskow: L. & Rose, N. L. (1989). The Effects of Economic Regulation. In: Handbook
of Industrial Organization. S.l.:Elsevier Science Publishers B.V.
210. Karakoc, T.H., Ozerdem, M.B., Sogut, M.Z., Colpan, C.O., Altuntas, O. and
Acikkalp, E. (2016). Sustainable Aviation: Energy and Environmental Issues 1st ed.
Germany: Springer.
211. Kantareva, M., Angelova, A., Iliev, L. and Efthymiou, M. (2016). Action Plan of
Bulgaria for CO2 Emissions Reduction from Civil Aviation. Bulgaria: Civil Aviation
Administration the Republic of Bulgaria.
212. Klemperer, P. (2002) How (not) to run auctions: The European 3G telecom
auctions. European Economic Review, 46(4-5), 829–845.

391
213. KLM (2016) KLM to operate biofuel flights out of Los Angeles. Available from:
http://news.klm.com/klm-to-operate-biofuel-flights-out-of-los-angeles [Accessed 10
October 2016].
214. Kolk, A. and Pinkse, J. (2006) Stakeholder mismanagement and corporate social
responsibility crises. European Management Journal, 24(1):59–72.
215. Kollmuss, A., Lazarus, M., Lee, C., LeFranc, M. and Polycarp, C. (2010). Handbook
of Carbon Offset Programs: Trading Systems, Funds, Protocols and Standards
(Environmental Market Insights). UK Routledge.
216. Kopsch, F., 2012. Aviation and the EU Emissions Trading Scheme—Lessons
learned from previous emissions trading schemes. Energy Policy, 49(C), pp.770–
773.
217. Kousoulidou, M. and Lonza, L. (2016) Biofuels in aviation: Fuel demand and CO2
emissions evolution in Europe toward 2030. Transportation Research Part D:
Transport and Environment, 46, 166-181.
218. Laffont, J.J. (1977) More on Prices vs. Quantities, Review of Economic Studies
44(1): 177–182.
219. Laffont, J.J. (1997) Game theory and empirical economics: The case of auction
data. European Economic Review, 41, 1-35.
220. Leedy, P. & Ormrod, J. (2012). Practical research: Planning and design (10th ed.).
UK, Pearson.
221. Linstone, H. A. & Turoff, M. (2002) The Delphi Method: Techniques and
Applications. S.l.:Addison-Wesley Publishing.
222. LSSIP Greece (2015) Local Single Sky ImPlementation (LSSIP) GREECE Year
2015-Level 1. Available from
https://www.eurocontrol.int/sites/default/files/content/documents/official-
documents/reports/lssip2015-greece.pdf [Accessed 26 June 2016].
223. LSSIP the Netherlands Local Single Sky ImPlementation (LSSIP) the Netherlands
Year 2015-Level 1. Available from
https://www.eurocontrol.int/sites/default/files/content/documents/official-
documents/reports/2016-lssip2015-netherlands.pdf [Accessed 26 June 2016].
224. Ludwig, B. (1997). Predicting the future: Have you considered using the Delphi
methodology? Journal of Extension, 35 (5), 1-4.
225. Lufthansa Group (2016). Environmental Strategy 2020. Available from:
https://www.lufthansagroup.com/en/responsibility/climate-and-environmental-

392
responsibility/environmental-strategy-and-measures.html [Accessed 3 October
2016].
226. Malavolti, E. and Podesta, M., 2015. Strategic Reactions of Airlines to the European
Trading Scheme. Transportation Research Procedia, 8, pp.103-113.
227. Malina, R. et al., 2012. The impact of the European Union Emissions Trading
Scheme on US aviation. Journal of Air Transport Management, 19(C), pp.36–41.
228. Malina, R. McConnachie, D., Winchester, N., Wollersheim, C., Paltsev, S. and
Waitz, I.A. (2012) The impact of the European Union Emissions Trading Scheme on
US aviation, Journal of Air Transport Management, 19, 36-41.
229. MARKS, G. (1993) ‘Structural Policy and Multilevel Governance in the EC’, in A.
Cafruny and G. Rosenthal (eds), The State of the European Community Vol. 2: The
Maastricht Debates and Beyond (Boulder, CO: Lynne Riener, and Harlow:
Longman).
230. McCann, L. (2013) Transaction costs and environmental policy design. Ecological
Economics, 88, 253-262.
231. Meleo, L., Nava, C.R. and Pozzi, C. (2016). Aviation and the costs of the European
Emission Trading Scheme: The case of Italy. Energy Policy, 88, 138-147.
232. Meleo, L., Nava, C.R., Pozzi, C., 2016. Aviation and the costs of the European
Emission Trading Scheme: The case of Italy, Energy Policy, 88, pp. 138-147.
233. Menezes, F. M. & Monteiro: K. (2008). An introduction to auction theory. s.l.:Oxford
University Press.
234. Metz, B., Davidson, O.R., Bosch, P.R., Dave, R. and Meyer, L.A. (2007)
Contribution of Working Group III to the Fourth Assessment Report of the
Intergovernmental Panel on Climate Change. UK: Cambridge University Press.
235. Miyoshi, C., 2014. Assessing the equity impact of the European Union Emission
Trading Scheme on an African airline. Transport Policy, 33(C), pp.56–64.
236. Moloney, K. (2006) Rethinking Public Relations: PR Propaganda and Democracy
(2nd edn). London: Routledge.
237. Monjon, S. & Quirion, P. (2011). Addressing leakage in the EU ETS: Border
adjustment or output-based allocation? Ecological Economics, 70: 1957–1971.
238. Morgan, C.W., Katz, M. L. & Rosen, H. S. (2009) Microeconomics. UK: McGraw-Hill
Higher Education.
239. Morrell, P., 2007. An evaluation of possible EU air transport emissions trading
scheme allocation methods. Energy Policy, 35(11), pp.5562–5570.

393
240. Mott MacDonald (2015) Annual Analyses of the EU Air Transport Market 2013.
Available from:
http://ec.europa.eu/transport/modes/air/internal_market/observatory_market/doc/an
nual-2013.pdf [Accessed 07 July 2015].
241. Musante, K. and DeWalt, B.R. (2010) Participant Observation: A Guide for
Fieldworkers (2nd Ed.). USA: AltaMira Press.
242. NASA (2009) Biofuels as an Alternative Energy Source for Aviation—A Survey.
USA: NASA. Available from:
http://ntrs.nasa.gov/archive/nasa/casi.ntrs.nasa.gov/20100002886.pdf [Accessed 03
February 2015].
243. Nath, S. K. (1969) Reappraisal of Welfare Economics. NY: Routledge & Kegan Paul
PLC.
244. NATS (2014). 3Di inefficiency score. [Online] Available at:
http://www.nats.aero/news/projects/greensky/ [Accessed 05 December 2014].
245. NATS (2015). FerroNATS. Available from http://www.nats.aero/static/ferronats/
[Accessed 05 July 2016].
246. Nava-Gaxiola, C.A. & Barrado, C., 2016. Performance measures of the SESAR
Southwest functional airspace block. Journal of Air Transport Management, 50,
pp.21–29.
247. Neely, A. (2004). Business performance measurement, Theory and practice. UK:
Cambridge University Press.
248. NERA (2006) Cost Benchmarking of Air Navigation Service Providers: A Stochastic
Frontier Analysis. London, NERA. Available from:
http://www.eurocontrol.int/publications/cost-benchmarking-ansps-stochastic-frontier-
analysis [Accessed 05 December 2015].
249. Nicholson, W. and Snyder C.M. (2016) Microeconomic Theory: Basic Principles and
Extensions 12th Edition. USA: Cengage Learning.
250. Niemeier, HM. (2002) Regulation of airports: the case of Hamburg airport—a view
from the perspective of regional policy, Journal of Air Transport Management, 8(1),
37-48.
251. NM (2015) European Route Network Improvement Plan: PART 2 European ATS
Route Network - Version 2015-2019. Brussels, EUROCONTROL.
252. North, G. (1992) The Coase Theorem, a study in economic epistemology.
s.l.:Institute for Christian Economics.

394
253. O’Connell, J.F. and Warnock-Smith, D. (2013) An investigation into traveler
preferences and acceptance levels of airline ancillary revenues, Journal of Air
Transport Management, 33, 12-21.
254. OECD (2002) Regulatory Policies in OECD Countries: From Interventionism to
Regulatory Governance, Paris: OECD
255. Okoli, C. and Pawlowski, S.D. (2004). The Delphi method as a research tool: an
example, design considerations and applications. Information and Management, 15-
29.
256. Olander, S. (2007) Stakeholder impact analysis in construction project
management. Construction Management and Economics, 25(3):277–287.
257. Owen, A. D. & Hanley, N. (2004). The Economics of Climate Change. London:
Routledge.
258. Oxford Economics (2011) Economic Benefits from Air Transport in the UK. Oxford
Economics
259. Pacos, T. (1997). Industrial Organization, Business Policies and Performance (in
greek). Athens: Papazisi.
260. Parmenter, D. (2015). Key Performance Indicators, Developing, Implementing and
Using Winning KPIs. 3rd ed. Canada: John Wiley & Sons, Inc.
261. Pellegrini, P. & Rodriguez, J., 2013. Single European Sky and Single European
Railway Area: A system level analysis of air and rail transportation. Transportation
Research Part A: Policy and Practice, 57(C), pp.64–86.
262. Piermartini, R. & Rousova, L. (2008) Liberalization of Air Transport Services and
Passenger Traffic. Available from:
http://www.wto.org/english/res_e/reser_e/ersd200806_e.pdf [Accessed 18
September 2013].
263. Pigman, A., G. (2007). The World Economic Forum, a multi stakeholder approach to
global governance. NY: Routledge.
264. PRB (2013) PRB Annual monitoring Report 2012, Volume 1, European overview
and PRB recommendations. Brussels: EUROCONTROL. Available from:
http://www.EUROCONTROL.int/sites/default/files/content/documents/single-
sky/pru/news-related/2013-19-13_prb_monitoring_report_2012_volume_1-
_european_overview_and_prb_recommendations.pdf [Accessed 04 October 2013].
265. PRB (2014a) PRB Assessment Report of RP2 FAB Performance Plans
Volume 1 - Union-wide view assessment report. Brussels: EC. Available from:
http://www.eurocontrol.int/sites/default/files/content/documents/single-

395
sky/pru/publications/other/RP2-Assessment-Report-Vol-1-Union-wide-view.pdf
[Accessed 21 April 2016].
266. PRB (2014b) PRB Annual Monitoring Report 2013 Volume 1 -European overview
and PRB recommendations. Brussels: EC. Available from:
http://www.eurocontrol.int/sites/default/files/content/documents/single-
sky/pru/publications/other/RP1-Annual-Monitoring-Report-2013-Vol1-European-
view-Fact-validated-edition.pdf [Accessed 21 April 2016].
267. PRB (2016) PRB White Paper: RP3 Performance Objectives, version 3.6. available
from:
http://www.eusinglesky.eu/Documents/PRB%20Reports/Reference%20Period%20T
hree/RP3%20White%20Paper.pdf [Accessed 04 October 2016].
268. Preston, H., Lee, D.S. & Hooper, P.D., 2012. The inclusion of the aviation sector
within the European Union’s Emissions Trading Scheme: What are the prospects
for a more sustainable aviation industry? Environmental Development, 2, pp.48–56.
269. Preston, H., Lee, D.S. and Hooper, P.D. (2012). The inclusion of the aviation sector
within the European Union's Emissions Trading Scheme: What are the prospects
for a more sustainable aviation industry? Environmental Development, 2, 48-56.
270. PRU (2004). ATM Cost-Effectiveness (ACE) 2002 Benchmarking Report. Brussels:
EUROCONTROL.
271. PRU (2016) ATM Cost-Effectiveness (ACE) 2014 Benchmarking Report with 2015-
2019 Outlook. Available from:
http://www.eurocontrol.int/sites/default/files/content/documents/single-
sky/pru/publications/ace/ACE-2014-Benchmarking-Report.pdf [Accessed 28 June
2016].
272. Quality Assurance Standard (2014). Quality Assurance Standard. Available from:
http://qascarbonoffsetting.com/airline-carbon-offset-programs/ [Accessed 21
February 2014].
273. Rao, R. K. (2003). The Economics of Transaction Costs: Theory, Methods, and
Applications. UK: Palgrave Macmillan.
274. Raven, H.P., Hassenzahl, D.M., Hager, M.C., Gift, N.Y. and Berg, L.R. (2015)
Environment, 9th Edition. USA: Wiley.
275. Regulation (EU) No 598/2014 on the establishment of rules and procedures with
regard to the introduction of noise-related operating restrictions at Union airports
within a Balanced Approach and repealing Directive 2002/30/EC.
http://www.eusinglesky.eu/Documents/PRB%20Reports/Reference%20Period%20Three/RP3%20White%20Paper.pdf

396
276. Remenyi, D., Williams, B., Money, A. and Swartz, E. (1998) Doing Research in
Business and Management: An Introduction to Process and Method. London, Sage.
277. SAA (2016) Africa's Greenest Flight. Available from:
https://www.flysaa.com/us/en/flyingSAA/News/Africas_Greenest_Flight_First_flight_
to_operate_with_biofuel_made_from_locally_grown_tobacco_plants.html
[Accessed 10 October 2016].
278. Samsonowa, T. (2012). Industrial Research Performance Management Key
Performance Indicators in the ICT Industry. Berlin: Springer.
279. Sandbag (2013) Aviation and the EU ETS What happened in 2012 during ‘Stop the
Clock? UK: Sandbag. Available from:
https://sandbag.org.uk/site_media/pdfs/reports/Sandbag_Aviation_and_the_EU_ET
S_2012_171213_1.pdf [Accessed 14 October 2016].
280. Saunders, M.N.K., Lewis, P. and Thornhill, A. (2015) Research Methods for
Business Students, 7th ed, Trans-Atlantic Publications, Inc.
281. Scheelhaase, J., Grimme, W. & Schaefer, M., 2010. The inclusion of aviation into
the EU emission trading scheme-Impacts on competition between European and
non-European network airlines. Transportation Research Part D: Transport and
Environment, 15(1), pp.14–25.
282. Scheelhaase, J.D. & Grimme, W.G., 2007. Emissions trading for international
aviation: an estimation of the economic impact on selected European airlines.
Journal of Air Transport Management, 13(5), pp.253–263.
283. Schleich, J., Ehrhart, K.M., Hoppe, C. and Seifert, S. (2006) Generous allocation
and ban on banking. In Antes, R. Hansjurgens, B. and Letmathe, P. (2006)
Emissions Trading and Business. Springer.
284. Schniederjans, D.G and Hales, D.N. (2016) Cloud computing and its impact on
economic and environmental performance: A transaction cost economics
perspective. Decision Support Systems, 86, 73-82.
285. Sciacchitano, S. (2013). ECAC-Editorial. ECAC News, the European Civil Aviation
Conference Magazine, 49: 1.
286. Scotter, A. (2008). Microeconomics, a modern approach. USA: Addison-Wisley.
287. Seinfeld, J.H. and Pandis S.N. (2006). Atmospheric Chemistry and Physics: From
Air Pollution to Climate Change (2nd Edition). USA: Wiley-Interscience.
288. SESAR (2014). eATM Portal, European ATM Master Plan. Available from:
https://www.atmmasterplan.eu/essip/AOM21 [Accessed 09 December 2014].

397
289. Shah, H., A., and Kalaian, S. A. (2009) Which Is the Best Parametric Statistical
Method for Analyzing Delphi Data? Journal of Modern Applied Statistical Methods
8(1): 226-232.
290. Sheu, J.-B., 2014. Airline ambidextrous competition under an emissions trading
scheme – A reference-dependent behavioral perspective. Transportation Research
Part B: Methodological, 60(C), pp.115–145.
291. Shresta, S., Neskovic, D., and Williams, S. (2009) Analysis of Continuous
Descent Benefits and Impacts during Daytime Operations, Eighth USA/Europe
Air Traffic Management Research and Development Seminar (ATM2009),
Napa, CA.
292. Shulruf, B., Hattie, J., & Dixon, R. (2008). Factors affecting responses to Likert type
questionnaires: Introduction of the ImpExp, a new comprehensive model. Social
Psychology of Education, 11, 59–78.
293. Singh, M. (2011) Cooperation in Air navigation services: is Globalization Arriving in
the world of ANS? In O’Connell, J. F. & Williams, G. (2011) Air Transport in the 21st
Century Key strategic Developments. UK: Ashgate.
294. Skulmoski, G.J, Hartman, F.T. and Krahn, J. (2007) The Delphi Method for
Graduate Research, Journal of Information Technology Education, 6, 1-21.
295. SkyBrary (2014) National Supervisory Authority. Available from:
http://www.skybrary.aero/index.php/National_Supervisory_Authority [Accessed 3
October 2016].
296. SkyBrary (2016) Free Route Airspace (FRA). Available from:
http://www.skybrary.aero/index.php/Free_Route_Airspace_(FRA) [Accessed 3
October 2016].
297. Spradley, J. (2016) Participant Observation (Reissue Edition). USA: Waveland
Press, Inc.
298. SSE (n.d.) EU ETS reform– SSE’s view. UK: SSE. Available from:
http://sse.com/media/206701/ets-reform-sse-view.pdf [Accessed 18 September
2016].
299. Stabler, M. J., Papatheodorou, A. & Sinclair, T. M. (2010). The Economics of
Tourism. 2nd ed. ed. s.l.:Routledge.
300. Stavins, R.N. (1995). Transaction Costs and Tradable Permits. Environmental
Economics and management, 13-48.
301. Steer Davies Gleave (2014) Study on Cost of Capital, Return on Equity and
Pension Costs of Air Navigation Service Providers (Prepared for the European

398
Commission). Available from:
http://ec.europa.eu/transport/modes/air/single_european_sky/doc/2014_03_25_final
-report-cost-of_capital-and-pensions-v2-25march2014.pdf [Accessed 07 May 2016].
302. Stoney, C. and Winstanley D. (2001). ‘Stakeholding: Confusion or Utopia? Mapping
the Conceptual Terrain’, Journal of Management Studies, 38(5): 603–626.
303. Tashakkori, A., & Teddlie, C. (2010) Handbook of Mixed Methods in Social and
Behavioral Research (2nd ed). Thousand Oaks, CA: Sage Publications.
304. The Gold Standard (2012). The Gold Standard. Available from:
http://www.cdmgoldstandard.org/wp-content/uploads/2012/09/Offset-Handbook-lo-
res.pdf [Accessed 20 February 2014].
305. Tietenberg, T. H. (2006). Emissions Trading, Principles and Practice. 2nd ed. ed.
Washington DC: Resources for the Future.
306. Tietenberg, T.H. (2010). Environmental and Natural Resource Economics (10th ed.)
New York: HarperCollins Publishers Inc.
307. Tracy, S.J. (2013) Qualitative Research Methods: Collecting Evidence, Crafting
Analysis, Communicating Impact. Wiley-Blackwell.
308. Train, K. E. (1991). Optimal Regulation. The economic Theory of Natural Monopoly.
USA: MIT.
309. Tuerk, A., Mehling, M., Flachsland, C. & Sterk, W., 2009. Linking Carbon Markets:
Concepts, case studies and pathways. Climate Policy, 9, 341-357.
310. Turner, R.K, Pearce, D & Bateman I. (1994). Environmental economics: An
elementary introduction. U.K.: Harvester Wheatsheaf.
311. UNEP (2016). Climate Change mitigation. Available from:
http://www.unep.org/climatechange/mitigation/ [Accessed 06 May 2016].
312. UNFCCC (2014a). UNFCCC. Available from:
http://cdm.unfccc.int/about/dev_ben/index.html [Accessed 20 February 2014].
313. UNFCCC (2014b). Appendix I - Quantified economy-wide emissions targets for
2020. Available from:
http://unfccc.int/meetings/copenhagen_dec_2009/items/5264.php [Accessed 01
February 2015].
314. UN-REDD Programme, 2014. UN-REDD Programme. Available from:
http://www.un-redd.org/AboutREDD/tabid/102614/Default.aspx [Accessed 21
February 2014].
315. Uschold, M. and Gruniger, M. (1996) Ontologies: Principles, methods and
applications. Knowledge Engineering Review, 11(2):93–155.

399
316. Van der Brug, W. and De Vreese, C.H. (2016) (Un)intended Consequences of EU
Parliamentary Elections. UK: Oxford University Press.
317. Van der Duin, P. (2016) Foresight in Organizations: Methods and Tools, Routledge.
318. Varian, H. R. (1992). Microeconomic Analysis (3rd Ed.). USA: W. W. Norton &
Company.
319. Varoufakis J. (2001) Game Theory: Critical Concepts in the Social Sciences.
London: Routledge.
320. Vespermann, J. & Wald, A., 2011. Much Ado about Nothing?-An analysis of
economic impacts and ecologic effects of the EU-emission trading scheme in the
aviation industry. Transportation Research Part A: Policy and Practice, 45(10),
pp.1066–1076.
321. Vettas, Ν. & Katsoulakos, G. (2004). Competition Policy and Regulatory Policy.
Athens: Typothito.
322. Viscusi, W.K., Harrington, J.E. and Vernon, J.M. (2005) Economics of Regulation
and Antitrust. The MIT Press, Cambridge.
323. Waldman, D. E. & Jensen, E. J. (2012) Industrial Organization: Theory and
Practice, New International Edition (The Pearson Series in Economics) 4th Ed.
USA: Routledge.
324. Weissinger, G.J. (2005). Law Enforcement and the INS: A Participant Observation
Study of Control Agents (2nd ed.). USA: UPA.
325. Weitzman, M. L. (1974) Prices vs. Quantities, Review of Economic Studies, 41 (4),
477– 491.
326. Weitzman, M.L., (2014) Can Negotiating a Uniform Carbon Price Help to Internalize
the Global Warming Externality? Journal of the Association of Environmental and
Resource Economists, 1(1), 29 - 49.
327. Wensveen, J.G (2007) Air Transport: A Management Perspective (6th ed.). Ashgate.
328. Williams, C. (2007) Research Methods. Journal of Business & Economic Research,
5 (3), 65-72.
329. Williams, S., (1991) Sovereignty and accountability in the European community.
R.O. Keohane, S. Hoffmann (Eds.), The New European Community: Decision
making and Institutional Change, Westview Press, Boulder, CO.
330. Winther, M., Kousgaard, U. and Oxbol, A. (2006) Calculation of odour emissions
from aircraft engines at Copenhagen Airport, Science of the total environment, 366,
218-232.

400
331. Winther, M., Kousgaard, U., Ellermann, T., Massling, A., Nojgaard, J.K. and Ketzel,
M. (2015) Emissions of NOx, particle mass and particle numbers from aircraft main
engines, APU's and handling equipment at Copenhagen Airport, Atmospheric
Environment, 100, 218-229.
332. World Bank, n.d. Stakeholder Analysis. [ONLINE] Available at:
http://www1.worldbank.org/publicsector/anticorrupt/PoliticalEconomy/stakeholderan
alysis.htm. [Accessed 3 October 2016].
333. World Economic Forum (2010). The future of industrial biorefineries. Geneva, WEF.
334. World Economic Forum (2014) The Global Competitiveness Report 2014–2015.
Geneva: WEF.
335. World Economic Forum (2015) The Global Competitiveness Report 2015–2016.
Geneva: WEF.
336. Worldbank.org (2001) Stakeholder Analysis. Available from:
http://www1.worldbank.org/publicsector/anticorrupt/PoliticalEconomy/stakeholderan
alysis.htm [Accessed 18 September 2016].
337. WWF (2012) Aviation Report: Market Based Mechanisms to Curb Greenhouse Gas
Emissions from International Aviation. Available from:
http://awsassets.panda.org/downloads/aviation_main_report_web_simple.pdf
[Accessed on 28 July 2016].
338. Xu, J., Qiu, R. & Lv, C., 2016. Carbon emission allowance allocation with cap and
trade mechanism in air passenger transport. Journal of Cleaner Production, 131,
pp.308–320.
339. Yin, R.K (2013) Case Study Research: Design and Methods (Applied Social
Research Methods) 5th Ed. Sage publications.
340. Yin, R.K. (2015) Qualitative Research from Start to Finish, 2nd Ed. The Guilford
Press.
341. Zanin, M. et al., 2016. Towards a secure trading of aviation CO 2 allowance.
Journal of Air Transport Management, 56, pp.3–11.

A1 - 1
Appendices
Appendix 1: Definitions of key terms and concepts
Accountable
entity
The entity in a cap-and-trade emissions trading system that is
responsible for measuring and reporting actual emissions and for
submitting sufficient allowances to cover those emissions
Additionality To avoid giving credits for greenhouse gas (GHG) emissions
reductions that would have happened anyway, eligibility criteria have
been developed to determine whether the reductions are “additional”
— that is, are more than would have occurred in the absence of the
project (environmental additionality) or in the absence of the incentive
from the clean development mechanism (CDM) (project additionality).
The concept of additionality is important as only carbon credits from
projects that are “additional to” the business-as-usual scenario
represent a net environmental benefit. Without the “additionality”
requirement, there is no guarantee that the emissions reduction
activities will lead to a reduction of greenhouse gases into the
atmosphere.
Aeronautical
Information
Service (AIS)
A service established within the defined area of coverage responsible
for the provision of aeronautical information/data necessary for the
safety, regularity and efficiency of air navigation. Such information
includes the availability of air navigation facilities and services and the
procedures associated with them, and must be provided to flight
operations personnel and services responsible for flight information
service.
Air navigation
services
This term includes air traffic management (ATM), communications,
navigation and surveillance systems (CNS), meteorological services
for air navigation (MET), search and rescue (SAR) and aeronautical
information services/aeronautical information management (AIS/AIM).
These services are provided to air traffic during all phases of
operations (approach, aerodrome and en route).

A1 - 2
Air Operator
Certificate
(AOC)
An Air Operator Certificate (AOC) is a certificate authorising an
operator to carry out specified commercial air transport operations.
(ICAO Annex 6)
Air Traffic
Management
(ATM)
is the dynamic, integrated management of air traffic and airspace
including air traffic services, airspace management and air traffic flow
management - safely, economically and efficiently - through the
provision of facilities and seamless services in collaboration with all
parties and involving airborne and ground-based functions. The
general objective of ATM is to enable aircraft operators to meet their
planned departure and arrival times and to adhere to their preferred
flight profiles with the minimum constraints, without compromising
agreed levels of safety.
Aircraft
operator
Aircraft operator means a holder of an air carrier operating certificate
Allocation The initial distribution of allowances to accountable entities for a
compliance period. This allocation could, for example, be based on
historical emissions or a performance standard and level of
production; it could be made for free or through an auctioning process
or both.
Allowance An allowance is a tradable emission permit that can be used for
compliance purposes in a cap-and-trade system. Each allowance
allows the holder to emit a specific quantity of a pollutant (e.g. one
tonne of CO2) one time.
Annex B
countries
Annex B countries are the 39 emissions-capped industrialized
countries and economies in transition listed in Annex B of the Kyoto
Protocol.
Annex I
countries
Annex I countries are the 36 industrialized countries and economies
in transition listed in Annex I of the United Nations Framework
Convention on Climate Change (UNFCCC).
Annex I Parties A group of industrialized countries and economies in transition
included in Annex I to the United Nations Framework Convention on

A1 - 3
or Countries Climate Change (UNFCCC) that committed individually or jointly to
returning to their 1990 levels of GHG emissions by the year 2000.
Approach
phase
The operating phase defined by the time during which the engine is
operated in the approach operating mode.
Area Control
Centre (ACC)
is a unit established to provide air traffic control service to controlled
flights in control areas under its jurisdiction.
Assigned
amount units
(AAUs)
Emissions targets for industrialized country Parties to the Kyoto
Protocol are expressed as levels of allowed emissions or “assigned
amounts” for the 2008-2012 commitment period. Such assigned
amounts are denominated in tonnes of CO2 equivalent emissions
(CO2e).
International
aviation
bunkers
International aviation bunkers includes deliveries of aviation fuels to
aircraft for international aviation. Fuels used by airlines for their road
vehicles are excluded. The domestic/international split should be
determined on the basis of departure and landing locations and not by
the nationality of the airline. For many countries this incorrectly
excludes fuel used by domestically owned carriers for their
international departures.
Air traffic
complexity
Air traffic complexity is a measure of the control activity required to
accept an aircraft entering into the sector. In this paper we measure
control activity by the total change in heading summed over all aircraft
in the sector.
Auctioning The distribution of allowance - either the initial distribution or from a
set-aside, this is achieved through an auction in which system
participants bid for the right to purchase allowances. Different auction
models could be used. Auctions often complement other forms of
allowance allocation. ICAO Documents 9949/50/51
Banking A banking provision permits allowances issued for one compliance
period to be saved for use during a subsequent compliance period.
ICAO Documents 9949/50/51

A1 - 4
Baseline A reference level of emissions. For example, a baseline can be used
to calculate the total quantity of allowances to be distributed under a
cap-and-trade system or the quantity of credits generated under a
baseline-and-credit (emissions intensity) system. A baseline also sets
the level of emissions that would occur without policy intervention in
an offset programme.
Benchmarking A reference level, such as emissions per unit of output that can be
part of the formula for the free allocation of allowances under a cap-
and-trade system or that can define the target in an emissions
intensity system. It is a method for distribution of obligations under an
MBM scheme. It establishes a reference level based on efficiency
such as emissions per unit of output, e.g. CO2/RTK
Biofuels Products refer to non-fossil energy sources which are made from
living organisms or from biogenic feedstocks (plant oils or animal
fats). In order to be considered as biofuel, the fuel must contain over
80 percent renewable materials.
Borrowing A borrowing provision permits an accountable entity to use
allowances for a future period to achieve compliance in the current
period. ICAO Documents 9949/50/51
Cap and Trade The Cap and Trade system involves trading of emission allowances,
where the total amount of allowances is strictly limited or ‘capped’ by
a regulatory authority. Allowances are created to account for the total
allowed emissions. At the end of each compliance period each entity
must surrender sufficient allowances to cover its emissions during
that period. Trading occurs when an entity can reduce units of
emission at a lower cost than another entity and then sells the
allowance. A Cap and Trade system is generally based on those
entities included in the cap.
Carbon Dioxide
Equivalent
(CO2e)
CO2e is a measurement unit to indicate the global warming potential
(GWP) of greenhouse gases. Carbon dioxide is the reference gas
against which other greenhouse gases are measured. Other
greenhouse gases that are reported as Carbon Dioxide Equivalent

A1 - 5
are: Carbon dioxide (CO2); Methane (CH4); Nitrous oxide (N2O);
Sulphur hexafluoride (SF6); Perfluorocarbons (PFCs);
Hydrofluorocarbons (HFCs). For the EU ETS CO2 is the main
greenhouse gas that is covered, with N2O and PFCs also covered for
selected industry sectors.
Carbon
Leakage
Emission reductions in one location could be offset by an increase in
emissions in another location. Leakage occurs when laws or activities
designed to cut greenhouse gas emissions implemented in one
jurisdiction or project area lead to the movement rather than the
reduction of the targeted emitting activities, such as a carbon-
intensive industry moving in response to regulation.
Certified
emission
reductions
(CERs)
A compliance unit under the Kyoto Protocol issued for emissions
reductions achieved from project activities in non-Annex I Parties that
meet the requirements of the clean development mechanism (CDM).
One CER is equal to one metric tonne of CO2 equivalent.
Clean
development
mechanism
(CDM)
A mechanism established by the Kyoto Protocol that enables
emissions reduction projects in non-Annex I Parties to earn CERs that
can be sold to entities in Annex I Parties for compliance with their
emissions limitation or reduction commitments under the Kyoto
Protocol.
Climb phase The operating phase defined by the time during which the engine is
operated in the climb operating mode.
Code sharing The use of the flight designator code of one air carrier on a service
performed by a second air carrier, which service is usually also
identified (and may be required to be identified) as a service of, and
being performed by, the second air carrier.
Compliance System for checking adherence to reduction obligations, including
measures and sanctions to be implemented if a country (in case of
the Kyoto Protocol) or operator (in case of an ETS) does not fulfil its
obligations to reduce emissions as laid down in legislation of the
system

A1 - 6
Distances Aerodrome-to-aerodrome great circle distances should be used in all
items involving distance computations (Items 1, 6, 7, 9, 10, 12, 17, 18,
19 and 20). Distances can be calculated using the Great Circle
Distance which is defined as the shortest distance between any two
points on the surface of the Earth which should be approximated
using the Vincenty distance formula associated with the World
Geodesic System – 1984 (WGS 84) adopted by ICAO and referred to
in Annex 15 to the Chicago Convention. The latitude and longitude of
aerodromes can be taken either form aerodrome data published in
Aeronautical Information Publication (AIP).
Domestic A flight stage not classifiable as international. Domestic flight stages
include all flight stages flown between points within the domestic
boundaries of a State by an air carrier whose principal place of
business is in that State. Flight stages between a State and territories
belonging to it, as well as any flight stages between two such
territories, should be classified as domestic. This applies even though
a stage may cross international waters or over the territory of another
State.
NOTES:
1. In the case of multinational air carriers owned by partner States,
traffic within each partner State should be reported separately as
domestic and all other traffic as international.
2. “Foreign” cabotage traffic (i.e. traffic carried between city-pairs in a
State other than the one where the reporting carrier has its principal
place of business) should be reported as international traffic.
3. A technical stop should not result in any flight stage being classified
differently than would have been the case had the technical stop not
been made.
Economies of
density
are defined in relation to the impact on unit costs when output
increases holding network size constant. There are economies of
density when unit costs fall as output increases on a fixed network

A1 - 7
and there are diseconomies of density when unit costs rise as output
increases on a fixed network
Economies of
scale
are defined in relation to the impact on unit costs when both output
and size of network increase in the same proportion and other
characteristics of the operating environment are held constant. There
are economies of scale when unit costs fall as output and network
size increase, and there are diseconomies of scale when unit costs
rise as output and network size increase.
Filed Flight
Plan (FPL)
is the flight plan as filed with an ATS unit by the pilot or a designated
representative, without any subsequent changes.
Final Approach
Fix (FAF) or
Final Approach
Point (FAP)
The final approach starts at the Final Approach Fix (FAF), sometimes
also called Final Approach Point (FAP). At the FAF the aircraft has
reached its landing configuration with the landing gear and the flaps in
the correct landing position.
Flexible
mechanisms
The Kyoto Protocol makes provision for three instruments that provide
flexibility to its signatories in implementing their reduction goals:
emissions trading, Joint Implementation (projects carried out jointly by
industrial countries) and the Clean Development Mechanism (projects
which reduce emissions in developing countries). The underlying
philosophy of all three flexible mechanisms is that the Annex B
countries can make some of the reductions to which they have
committed themselves outside their own country.
Flexible Use of
Airspace (FUA)
Concept
is based on the fundamental principle that airspace should not be
designated as either pure civil or military airspace, but rather be
considered as one continuum in which all user requirements have to
be accommodated to the extent possible.
Flight
Information
Region (FIR)
is an airspace of defined dimensions within which flight information
service and alerting service are provided
Flight stage A flight stage is the operation of an aircraft from take-off to its next
landing. A flight stage is classified as either international or domestic

A1 - 8
based on the following definitions:
Free Route
Operations
Airspace (FRA)
A specified airspace within which users may freely plan a route
between a defined entry point and a defined exit point, with the
possibility to route via intermediate (published or unpublished) way
points, without reference to the ATS route network, subject to
airspace availability. Within this airspace, flights remain subject to air
traffic control.
Grandfathering Allocation methodology under an ETS under which the distribution of
allowances to entities is based on historical emissions.
International A flight stage with one or both terminals in the territory of a State,
other than the State in which the air carrier has its principal place of
business.
Joint
implementation
(JI)
Joint implementation is a flexible mechanism established by Article 6
of the Kyoto Protocol for project-based emissions reduction activities
in Annex B countries. Emissions reductions from JI projects earn
ERUs.
Key
performance
areas (KPAs)
Key areas of performance corresponding to the expectations of
providers, regulators, users and other interested parties.
Key
performance
indicators
(KPIs)
Current/past performance, expected future performance (estimated
as part of forecasting and performance modelling), as well as actual
progress in achieving performance objectives are quantitatively
expressed by means of indicators. Since indicators support
objectives, they should be defined having a specific performance
objective in mind.
Kyoto Protocol
(KP)
The 1997 Kyoto Protocol commits 39 industrial nations as a whole to
a five-percent reduction from 1990 levels in their emissions of gases
damaging to the climate between 2008 and 2012 in the first
commitment period. It came into force on February 16, 2005. The
European Union is committed to reduce emissions between the years
2008 and 2012 by eight percent compared to the level in 1990.

A1 - 9
138/138 The second commitment period is between 2013 and 2020
and the EU has committed to reduce its GHG emissions by 20% by
2020 compared to 1990 levels.
LTO cycle The reference emissions LTO cycle defines the thrust settings to be
used when making emissions and smoke measurements and the time
to be used for each mode in the subsequent calculations of Dp.
These thrust settings and times are listed in Annex 16, Volume II, Part
III, Chapter 2 (engines for subsonic propulsion).
Market-based
measures
Sometimes referred to as market instruments, MBMs provide financial
incentives and disincentives to regulated entities towards desired
behaviour, e.g. lowering emissions. These measures can be
implemented to reduce damage to the environment
Network
Manager
means the entity established under Article 6 of regulation (EC) No
551/2004 (the Airspace regulation) to perform the duties provided for
in that article and in regulation (EU) 677/2011 (the ATM Network
Functions regulation).
Offset Credit or
Offset
In this report the term “credit”, “offset credit” or “offset” is used to
denote the compensating emissions reductions (product) that have
been achieved and can be applied in the activity of offsetting. An
offset credit could equate to a one-tonne reduction of carbon dioxide
(CO2) emissions or a one kilogram reduction of nitrogen oxide (NOx)
emissions, for example. These credits can be tradable units.
Offsetting Offsetting is the activity of “cancelling out” or “neutralizing” emissions
from a sector like aviation using offset credits — compensating
emissions reductions created in a different activity or location that
have been rigorously quantified and verified. It is only when credits
are acquired from outside the emissions trading scheme or linked
schemes and used to meet commitments/obligations under the
scheme that the activity is referred to as offsetting. On the other hand,
if a regulated emitter acquires compliance units (allowances or
credits) from another regulated emitter within the same emissions
trading scheme, or from a linked scheme, this is referred to simply as

A1 - 10
emissions trading. ICAO Documents 9949/50/51
Open
emissions
trading
An emissions trading system where allowances can be traded in and
outside the given scheme or sector. For example, within an emissions
trading scheme for aviation, participants would be allowed to buy
allowances from sectors outside the aviation emissions trading
scheme.
Performance Performance can be expressed as a set of parameters or indicators
that are complementary, and sometimes contradictory. Performance
measures are categorised in the four following measures
Pooling
arrangements
An air carrier commercial agreement which may involve some degree
of capacity control and may cover matters such as routes operated,
conditions of operation, and the sharing between the parties of traffic,
frequencies, equipment, revenues and costs.
Public-private
partnership
(PPP)
An ownership and management structure in which the private and the
public sectors both participate. PPPs refer to arrangements where the
private sector supplies infrastructure assets and services that
traditionally have been provided by the government. This technique
provides private financing for infrastructure investment without
immediately adding to government borrowing and debt, and can be a
source of government revenue. PPPs also present business
opportunities for the private sector in areas from which it was in many
cases previously excluded.
Registry Registries usually use electronic databases to record the unit holdings
and transactions for each account, as well as verified emissions.
Registry systems facilitate accounting and compliance for market
based mechanisms.
Revenue
passengers
A passenger for whose transportation an air carrier receives
commercial remuneration.
NOTES:
1. This definition includes, for example, a) passengers travelling

A1 - 11
under publicly available promotional offers (for example, “two-for-
one”) or loyalty programmes (for example, redemption of frequent-
flyer points); b) passengers travelling as compensation for denied
boarding; c) passengers travelling on corporate discounts; d)
passengers travelling on preferential fares (government, seamen,
military, youth, student, etc.).
2. This definition excludes, for example, a) persons travelling free; b)
persons travelling at a fare or discount available only to employees of
air carriers or their agents or only for travel on business for the
carriers; c) infants who do not occupy a seat.
Surrendering Submitting allowances for emissions by the accountable entity in
order to fulfil the obligations under the emissions trading scheme.
Surrender’ typically refers to the process by which public/private
entities submit units for compliance under their applicable regulatory
system, whereas ‘retire’ typically refers to the process by which
countries submit units under an international agreement.
Unit (Includes
permit)
The compliance instruments, otherwise referred to as “credit”, “offset
credit”, “offset” or “allowance” are called emissions units. One
emissions unit equals one tonne of CO2.
United Nations
Framework
Convention on
Climate
Change
(UNFCCC)
The UN Convention on Climate Change has been ratified by 192
countries, and it sets an overall framework for intergovernmental
efforts to tackle the challenge of climate change. Under the
Convention, governments share information on GHG emissions,
national policies and best practices, commit to GHG
limitation/reduction activities/targets, and provide financial and
technical support for the adaptation and mitigation activities of other
countries.
Verification Verification provides independent assurance that the emissions
quantification and reporting have been accurately completed. The
“level of assurance” provided depends on the system requirements. In
most systems the verifiers must be accredited by a standard-setting

A1 - 12
organization.
Voluntary
Market
Voluntary markets for emissions reductions cover those buyers and
sellers of Verified Emission Reductions, which seek to manage their
emission exposure for non-regulatory purposes. Such credits are not
eligible in the EU ETS due to a potential lack of transparency and
control exercised compared to government controlled compliance
systems.

A2 - 1
Appendix 2: Key features of the EU ETS for aviation (EC, 2013:16)
EU ETS feature Description
Geographical
coverage
European Economic Area (EEA) which includes the 28 EU Member
States, Iceland, Norway and Liechtenstein).
Territories of Member States are treated as follows:
- The 13 territories that are part of the EU are included in the EU
ETS for aviation: Guadeloupe, French Guiana, Martinique,
Reunion, the Azores, Madeira, the Canary Islands, Aland Islands,
Akrotiri, Dhekelia, Ceuta, Melilla and Gibraltar
- All other territories of Member States that are not part of the EU
are outside of the scope of EU ETS for aviation (e.g. Greenland or
Channel Islands)
Flights covered All flights landing at or departing from EEA airports.
Emissions
coverage All CO2 emissions released during the whole flight.
Open or closed
system
Aviation is regulated under the same rules as the general EU ETS
i.e. as an open system, but allowances are specific to the aviation
sector (i.e. they cannot be used by other EU ETS operators).
Quantity of
allowances
Total number of allowances (cap): 210,349,264 per annum from
2013
Free allowances: 172,486,396 per annum from 2013
Allowances to be auctioned: 31,552,390 per annum from 2013
Special reserve: 50,483,824
Allocation of
allowances
82% of allowances are allocated for free to operator based on a
benchmark in line with their activity levels in 2010. In addition, 15%
of allowances can be purchased through auctions. The special

A2 - 2
reserve shall ensure access to the market for new aircraft operators
and to assist aircraft operators which increase sharply the number
of tonne-kilometres that they perform.
International
credits
Aircraft operators may use Certified Emission Reductions and
Emission Reduction Units for up to 1.5 % of the number of
allowances they are required to surrender.
Exclusions
Commercial airlines that operate fewer than 243 flights per period
for three consecutive four-month periods or flights with total annual
emissions lower than 10,000 tonnes per year. Other types of
special purpose airplanes are also excluded (e.g. military flights,
medical / rescue / scientific research flights or flights performed in
the framework of public service obligations on routes within
outermost regions or on routes where the capacity offered does not
exceed 30,000 seats per year). A full list is in Annex I to the
Directive.
MRV approach
CO2 emissions are based on applying an agreed emission factor
(tCO2/km) to fuel consumption measured by considering tank
levels at specific points in time as well as fuel uplift at the airport. A
simplified approach is available for small emitters with emissions
estimated using a standardised distance flown based on Great
Circle Distance.

A3 - 1
Appendix 3: DANUBE FAB Performance Plan (Draft version)

A3 - 2

A3 - 3

A3 - 4

A3 - 5

A3 - 6

A3 - 7

A3 - 8

A3 - 9

A3 - 10

A3 - 11

A3 - 12

A3 - 13

A3 - 14

A3 - 15

A3 - 16

A3 - 17

A3 - 18

A3 - 19

A3 - 20

A3 - 21

A3 - 22

A3 - 23

A3 - 24

A3 - 25

A3 - 26

A3 - 27

A3 - 28

A3 - 29

A3 - 30

A3 - 31

A3 - 32

A3 - 33

A3 - 34

A3 - 35

A3 - 36

A3 - 37

A3 - 38

A3 - 39

A3 - 40

A3 - 41

A3 - 42

A3 - 43

A3 - 44

A3 - 45

A3 - 46

A3 - 47

A3 - 48

A3 - 49

A3 - 50

A3 - 51

A3 - 52

A3 - 53

A3 - 54

A3 - 55

A3 - 56

A3 - 57

A3 - 58

A3 - 59

A3 - 60

A3 - 61

A3 - 62

A3 - 63

A3 - 64

A3 - 65

This page is intentionally left blank

A4 - 1
Appendix 4: Pilot Survey questionnaire
Marina Efthymiou
Andreas Papatheodorou
FABs and EU ETS: Delphi survey

A4 - 2
Delphi survey
Thank you for agreeing to participate in this Delphi survey on the interrelations and dynamics
between Functional Airspace Blocks and European Union Emissions Trading Scheme in aviation.
Delphi may be characterized as a method for structuring a group communication process so that the
process is effective in allowing a group of individuals, as a whole, to deal with a complex problem.
This questionnaire round is the first of up to three rounds of the survey. Please try to answer all
questions, even though we do not expect you to have in depth knowledge of all of them. You will
have the opportunity to revise your answers with subsequent rounds of the survey.
In these surveys, you will be asked to contribute by developing ideas and statements for the two
notions, FABs and EU ETS. Some of the questions can be answered with only a single selection.
Where appropriate, a space is also provided for you to comment on the underlying reasons for your
responses.
Specifically, the research study investigates the four following domains:
RD1. The contribution of FABs and EU ETS on emissions’ reduction
RD2. The interrelation and dynamics of the two parallel regulating and deregulating
schemes, ETS and FABs
RD3. Recommendations and suggestions for issues relating to FABs and EU ETS
RD4. The states and views of the involved stakeholders and the dynamics that are developed
among them
Once we have received responses from all panellists, we will collate and summarise the findings
and formulate the second questionnaire.
We assure you that your participation in the survey and your individual responses will be strictly
confidential to the research team and will not be divulged to any outside party, including other
panellists.
Kind regards,

A4 - 3
Project Description
Introduction to the two notions, Functional Airspace Blocks and European Union
Emissions Trading Scheme
A. Functional Airspace Blocks (FABs)
The Single European Sky is a European Commission initiative. Its aim is to de-fragmentize
the European airspace, reduce delays, increase safety standards and flight efficiency to reduce
the aviation environmental footprint and reduce costs related to service provision. In the
context of the Single European Sky (SES), Functional Airspace Blocks (FABs) will
reorganize the European airspace in a more sufficient and operational way.
A FAB means an airspace block based on operational requirements and established regardless
of State boundaries, where the provision of air navigation services and related functions are
performance-driven and optimized with a view to introducing, in each functional airspace
block, enhanced cooperation among air navigation service providers or, where appropriate, an
integrated provider.
Nine FAB initiatives are established:
1) NEFAB (North European FAB): Estonia, Finland, Latvia, Norway.
2) Denmark-Sweden: Denmark, Sweden
3) BALTIC FAB Poland, Lithuania
4) FABEC (FAB Europe Central): France, Germany, Belgium, Netherlands,
Luxembourg, and Switzerland
5) FABCE (FAB Central Europe): Czech Republic, Slovak Republic, Austria, Hungary,
Croatia, Slovenia, Bosnia and Herzegovina
6) DANUBE Bulgaria, Romania
7) BLUE MED Italy, Malta, Greece, Cyprus, (and Egypt, Tunisia, Albania, Jordan as
observers)
8) UK- IRELAND FAB United Kingdom, Ireland
9) SW FAB (South West FAB) Portugal, Spain
B. European Union Emissions Trading System (EU ETS)
The European Union Emissions Trading System (EU ETS), also known as the European
Union Emissions Trading Scheme, was the first large emissions trading scheme in the world,
and remains the biggest. In 2008 the EU passed legislation to include aviation in the EU-ETS.
This means that from 2012, overall CO 2 emissions of the aviation industry are capped:
initially at 97% of 2005 emissions levels, and from 2013 onwards at 95%. All operators
flying to and from the EU will have to surrender one allowance for every tonne of CO 2
emitted on a flight to and from (and within) European Economic Area.
Under the 'cap and trade' principle, a cap is set on the total amount of greenhouse gases that

A4 - 4
can be emitted by all participating installations. 'Allowances' for emissions are then auctioned
off or allocated for free, and can subsequently be traded. Installations must monitor and
report their CO2 emissions, ensuring they hand in enough allowances to the authorities to
cover their emissions. Non-complying aircraft operators face a penalty of € 100 per missing
allowance on top of the obligation to procure and surrender missing allowances. If emission
exceeds what is permitted by its allowances, an installation must purchase allowances from
others. Conversely, if an installation has performed well at reducing its emissions, it can sell
its leftover credits. This allows the system to find the most cost-effective ways of reducing
emissions without significant government intervention.
Focus
A particular emphasis is to investigate the states and views of the involved stakeholders and
the dynamics that are developed among them. The In-depth and confidential interviews with
the participants will provide the data for the qualitative part of the study and contribute to the
development of a model about the convergence of the emissions diminution resulted from
FABs and EU ETS.
The Questions
In the questionnaire below, you will find the question categorised in the 4 domains mentioned
above. There are xx questions and it will take you xx minutes approximately to answer them.
Please respond to those questions you feel comfortable with, for each addressing their
probability and consequences. You may leave any of the questions unanswered, if you wish.
When you return to the study at a later time, you will be able to change or edit your prior
answers, as well as add others.
You can also submit additional text on a separate page. Explain further issues with the online
tool.
Time requirements
It is expected to take you xx minutes approximately to answer all the questions. You are
kindly asked to send fill the questionnaire until xxxx.
The next phase
Once we have received responses from all experts, we will collate and summarise the
findings and formulate the second questionnaire. In the second round, each Delphi participant

A4 - 5
receives a second questionnaire and is asked to review the items summarized by the
investigators based on the information provided in the first round. As a result of round two,
areas of disagreement and agreement will be identified
The research team
Ms Marina Efthymiou works as trainee at EUROCONTROL at the Directorate Pan-European
Sky/Support to States and Regional Initiatives (DPS/SSR). She is a PhD candidate at the
Department of Business Administration, University of the Aegean, Greece. She holds a
Master in Planning, Management and Policy of Tourism with specialization in Strategic
Development and a bachelor in Business Administration, University of Patras, Greece.
Dr. Andreas Papatheodorou is Associate Professor in Industrial and Spatial Economics with
Emphasis on Tourism at the Department of Business Administration, University of the
Aegean, Greece. He is also a Fellow of the UK Tourism Society and a member of the
German Aviation Research Society (GARS) and the international Air Transport Research
Society (ATRS).

A4 - 6
Questionnaire
RD1. The contribution of FABs and EU ETS on carbon offsetting
RQ1.1 Can you please compare the NextGen with the SES?
…………………………………………………………………………………………………………………
…………………………………………………………………………………………………………………
………………………………………………………………………………………………..
RQ1.2 What is your opinion about the observers and the associate partners in FABs?
…………………………………………………………………………………………………………………
…………………………………………………………………………………………………………………
………………………………………………………………………………………………..
RQ1.3 Evaluate, please, the following factors according to their contribution to emissions’ reduction
Factors Evaluation* Comment
Flexible Use of Airspace Choose an item.
Free Route Airspace Choose an item.
Shortest feasible routes Choose an item.
Implementing continuous descent approaches Choose an item.
Use of Bio fuels Choose an item.
Use of Eco-friendly engines Choose an item.
Improving load factors Choose an item.
Reduced traffic because of economic crisis Choose an item.
Trading Certified Emissions Reductions (CERs) Choose an item.
Trading Verified or Voluntary Emissions Reductions (VERs) Choose an item.
Airlines develop offsetting programs Choose an item.
EU Emissions Trading Scheme Choose an item.
Single European Sky Choose an item.
Other … Choose an item.
*Higher numbers indicate higher contribution to emissions reduction

A4 - 7
RQ1.4 Can you please give your opinion about the effectiveness of the current charging scheme? Do
you think that the present charging scheme is enough to avoid fragmentation because of intra and
inter FAB competition? What do you propose?
…………………………………………………………………………………………………………………
…………………………………………………………………………………………………………………
………………………………………………………………………………………………..
RQ1.5 Please write the problems the FABs face, their importance and their possible solutions
FABS Problems and solutions Importance*
Uk-IR
P: Choose an
item.
S:
Blue Med
P: Choose an
item.
S:
Baltic FAB
P: Choose an
item.
S:
NEFAB
P: Choose an
item.
S:
FABEC
P: Choose an
item.
S:
FABCE
P: Choose an
item.
S:
SW FAB
P: Choose an
item.
S:
Danube P: Choose an

A4 - 8
item.
S:
Denmark-
Sweden
P: Choose an
item.
S:
*Higher numbers indicate higher importance
RQ1.6 Do you believe that the inclusion of aviation in the EU ETS will influence the development of
non-European airlines? If yes please explain how.
…………………………………………………………………………………………………………………
…………………………………………………………………………………………………………………
………………………………………………………………………………………………..
RQ1.7 Do you think that the EU ETS will lead to airline mergers in order to obtain more emissions
allowances? What do you think about the market scenery considering competition issues?
…………………………………………………………………………………………………………………
…………………………………………………………………………………………………………………
………………………………………………………………………………………………..
RQ1.8 Do you think that in the future it would be possible to link the different Emissions Trading
schemes and have a global ETS? Please explain why.
…………………………………………………………………………………………………………………
…………………………………………………………………………………………………………………
………………………………………………………………………………………………..
RQ1.9 Do you think that the monitoring, reporting and verification of emissions in EU ETS is
sufficient? If no, please explain.
…………………………………………………………………………………………………………………
…………………………………………………………………………………………………………………
………………………………………………………………………………………………..
RD2. The interrelation and dynamics of the two parallel regulating and deregulating schemes, ETS
and FABs
RQ2.1 Can you please describe the landscape of stakeholders’ dynamics in FABs and EU ETS?

A4 - 9
…………………………………………………………………………………………………………………
…………………………………………………………………………………………………………………
………………………………………………………………………………………………..
RQ2.2 In your opinion can the optimization of air routes through FABs substitute the effects of the EU
ETS in carbon offsetting?
…………………………………………………………………………………………………………………
…………………………………………………………………………………………………………………
………………………………………………………………………………………………..
RQ2.3 Do you think that there is a connection between the ETS and FABs
…………………………………………………………………………………………………………………
…………………………………………………………………………………………………………………
………………………………………………………………………………………………..
RD3. Recommendations and suggestions for issues relating to FABs and EU ETS
Do you have any recommendations or suggestions on FABs and EU ETS related issues?
…………………………………………………………………………………………………………………
…………………………………………………………………………………………………………………
………………………………………………………………………………………………..
RD4. The states and views of the involved stakeholders and the dynamics that are developed among
them?

This page is intentionally left blank

A5 - 1
Appendix 5: 1st round Questionnaire: EU ETS and Aviation
Marina Efthymiou
Dr. Andreas Papatheodorou
EU ETS and Aviation: Delphi survey

A5 - 2
Delphi survey
Thank you for participating in this Delphi survey that is part of my PhD entitled “Functional
Airspace Blocks and European Union Emissions Trading Scheme in aviation”.
Delphi is a method for structuring a group communication process effective in allowing a group of
individuals, to deal with a complex problem, as a whole.
This questionnaire round is the first of up to three rounds of the survey. Thanks for answering to all
the questions, even when you do not have in depth knowledge of some of them. You will have the
opportunity to revise your answers during the next rounds of the survey.
In these surveys, you will be asked to contribute by developing ideas and statements. Some of the
questions need to be answered with a single selection. Where appropriate, a space is provided to
argument on the reasons for your responses.
Once the responses from all panellists are received, the main findings will be collated and
summarised to feed the formulation of the second questionnaire.
Your participation in the survey and your individual responses will be strictly confidential to the
research team and will not be divulged to any outside party, including other panellists.
This research is for academic purposes only, the outcome of which is the attainment of a doctoral
degree and the publishing of articles in accredited scientific journals.
Please send your feedback to the following address [email protected]
Many thanks for your kind co-operation.
Marina Efthymiou
Dr. Andreas Papatheodorou

A5 - 3
Project Description
Introduction to the notion of
European Union Emissions Trading Scheme
European Union Emissions Trading System (EU ETS)
The European Union Emissions Trading System (EU ETS), also known as the European Union
Emissions Trading Scheme, was the first large emissions trading scheme in the world, and remains the
biggest. In 2008 the EU passed legislation to include aviation in the EU-ETS. This means that from
2012, overall CO2 emissions of the aviation industry are capped: initially at 97% of 2005 emissions
levels, and from 2013 onwards at 95%. All operators flying to and from the EU will have to surrender
one allowance for every tonne of CO2 emitted on a flight to and from (and within) European
Economic Area.
Under the 'cap and trade' principle, a cap is set on the total amount of greenhouse gases that can be
emitted by all participating installations. 'Allowances' for emissions are then auctioned off or allocated
for free, and can subsequently be traded. Installations must monitor and report their CO2 emissions,
ensuring they hand in enough allowances to the authorities to cover their emissions. Non-complying
aircraft operators face a penalty of € 100 per missing allowance on top of the obligation to procure
and surrender missing allowances. If emission exceeds what is permitted by its allowances, an
installation must purchase allowances from others. Conversely, if an installation has performed well at
reducing its emissions, it can sell its leftover credits. This allows the system to find the most cost-
effective ways of reducing emissions without significant government intervention.
Focus
A particular emphasis is to investigate the opinions of the involved individual stakeholders, ANSPs,
NSAs, Organisations, Academia and Airlines and the dynamics that are developed among them.
The focus of the questionnaire is to collect the opinions of the individuals involved stakeholders,
ANSPs, NSAs, Organisations, Academia and Airlines on the inclusion of aviation in EU ETS.
The Questions
The in-depth and confidential interviews with the participants aim to provide the data for the
qualitative part of the study and contribute to the development of a model explaining the convergence
of the diminution of emissions resulted from FABs and EU ETS initiatives.
Time requirements

A5 - 4
To address the 6 questions of the present questionnaire will take approximately 15 minutes You may
leave any of the questions unanswered, if you wish. When you return to the study at a later time, you
will be able to change or edit your prior answers, as well as add others.
You can also submit additional text on a separate page.
You are kindly asked to send fill the questionnaire until 27/07/2014.
The next phase
As said earlier as soon as the responses from all experts are received the main findings will be used to
in formulating the second questionnaire. As a result of round two, areas of disagreement and
agreement will be identified.
The research team
Ms Marina Efthymiou works as trainee at EUROCONTROL at the Directorate Pan-European
Sky/Support to States and Regional Initiatives (DPS/SSR). She is a PhD candidate at the Department
of Business Administration, University of the Aegean, Greece. She holds a Master in Planning,
Management and Policy of Tourism with specialization in Strategic Development and a bachelor in
Business Administration, University of Patras, Greece.
Dr. Andreas Papatheodorou is Associate Professor in Industrial and Spatial Economics with Emphasis
on Tourism at the Department of Business Administration, University of the Aegean, Greece. He is
also a Fellow of the UK Tourism Society and a member of the German Aviation Research Society
(GARS) and the international Air Transport Research Society (ATRS).

A5 - 5
Q1. Please assess the extent to which you agree with the following statements
1 stands for strong disagreement, 2 for disagreement, 3 for neutral position, 4 for agreement and 5 for
strong agreement.
Statements Scale Comments The inclusion of aviation in the EU ETS will influence negatively the development of non-European airlines if they are included in EU ETS.
The EU ETS will lead the airlines to merge in order to obtain more emissions allowances.
The EU ETS is causing competition issues to airlines It is possible to link the EU ETS and the other Emissions Trading schemes and have a global ETS.
The monitoring, reporting and verification of emissions in the EU ETS is effective.
The EU ETS is vulnerable to frauds, for instance VAT fraud and ‘phishing’ scams.
The cap of EU ETS is too generous. The carbon market’s stability is vulnerable because of the continuous changes in legislation.
The carbon market stability is vulnerable because of the low prices of the allowances.
Postponing the auctions can force the prices of allowances to increase.
The free allocation of allowances to the airlines must be stricter.
Using biofuels is a promising solution for carbon offsetting.
The creation of carbon as a “financial instrument” can lead to sufficient carbon offsetting.
Additional fuel savings will also be achieved owing to better fuel predictability.
Route optimisation is sufficient enough for carbon neutral growth.
The EU ETS can cause carbon leakage. The economic scale of the EU ETS drives heavy lobbying around allocation.
The EU ETS is source of profit-making incentives unprecedented in the history of environmental policy
There are small cutbacks relative to ‘business-as-usual’ and this leads to instabilities in the EU ETS.
The corresponding large proportion of free allocation underlies legal stresses and the scope for distortions.
The multi-period nature of allocations drives dependence both upon post-2012 decisions and

A5 - 6
creates risk of perverse incentives
Q2. Please assess the impact of different allowances allocation methods to the aviation sector
1 stands for strong disagreement, 2 for disagreement, 3 for neutral position, 4 for agreement and 5 for
strong agreement.
Auctioning Grandfathering Repeated benchmarking
One off benchmarking
The cost of EU ETS is passed to ticket or freight prices
Airlines have windfall profits
Airlines demands more allowances
Technical improvements and industry measures are implemented
Q3. Please divide 100 points over the different allowance allocation methods that you deem as
appropriate for the allocation of allowances to the airlines, where the most important factor gets the
highest number of points. You are allowed to allocate points to as many factors as you wish.
Allocation methods Points Comments
Grandfathering
Benchmarking
Auctioning
Total points 100
Q4. In order to link the difference ETSs (like New Zealand or Shanghai ETS), the following factors should
be applied to the same degree. Please assess the extent to which you agree with the following
statements.
1 stands for strong disagreement, 2 for disagreement, 3 for neutral position, 4 for agreement and 5 for
strong agreement.
Parameters Scale Comments There are the same Monitoring, Reporting and Verification (MRV) rules for allowances
There are the same banking provisions There are the same registries’ rules There are the same rules governing new entrants and closures
There are the same compliance periods The same allocation methods are applied There is the same stringency of targets There is the same stringency of enforcement There is the same eligibility of offset credits
There are the same intensity targets There are the same cost-containment measures

A5 - 7
Q5. Please divide 100 points over the different factors that lead to carbon neutral growth, where the
most important factor gets the highest number of points. You are allowed to allocate points to as many
factors as you wish.
Factors Points Comments The EU ETS leads to carbon neutral growth. Individual carbon offsetting programs from airlines lead to carbon neutral growth.
Individual carbon offsetting programmes from states lead to carbon neutral growth.
Horizontal en route flight efficiency
Direct routes lead to carbon neutral growth
Wind optimal routes lead to carbon neutral growth
Flexible Use of Airspace (FUA) leads to carbon neutral growth
Free Route Airspace (FRA) leads to carbon neutral growth
Other, Total points 100
Q6. Do you think that there is a connection between EU ETS and Functional Airspace Blocks (FABs)11? If
yes why?
………………………………………………………………………………………………………………………………………………………………………
………………………………………………………………………………………………………………………………………………………………………
Thank you very much for your contribution
11 A FAB means an airspace block based on operational requirements and established regardless of State boundaries,
where the provision of air navigation services and related functions are performance-driven and optimized with a view
to introducing, in each functional airspace block, enhanced cooperation among air navigation service providers or,
where appropriate, an integrated provider. In the context of the Single European Sky (SES), the nine Functional
Airspace Blocks (FABs) that were established will reorganize the European airspace in a more sufficient and
operational way. The goal is to de-fragment the European airspace, reduce delays, increase safety standards and flight
efficiency to reduce the aviation environmental footprint and reduce costs related to service provision. For more info
please visit http://ec.europa.eu/transport/modes/air/single_european_sky/fab/.

This page is intentionally left blank

A6 - 1
Appendix 6: 1st round Questionnaire: SES/FABs and the Environment
Marina Efthymiou
Dr. Andreas Papatheodorou
FABs and Environment: Delphi survey

A6 - 2
Delphi survey
Thank you for participating in this Delphi survey that is part of my PhD entitled “Functional
Airspace Blocks and European Union Emissions Trading Scheme in aviation”.
Delphi is a method for structuring a group communication process effective in allowing a group of
individuals, to deal with a complex problem, as a whole.
This questionnaire round is the first of up to three rounds of the survey. Thanks for answering to all
the questions, even when you do not have in depth knowledge of some of them. You will have the
opportunity to revise your answers during the next rounds of the survey.
In these surveys, you will be asked to contribute by developing ideas and statements. Some of the
questions need to be answered with a single selection. Where appropriate, a space is provided to
argument on the reasons for your responses.
Once the responses from all panellists are received, the main findings will be collated and
summarised to feed the formulation of the second questionnaire.
Your participation in the survey and your individual responses will be strictly confidential to the
research team and will not be divulged to any outside party, including other panellists.
This research is for academic purposes only, the outcome of which is the attainment of a doctoral
degree and the publishing of articles in accredited scientific journals.
Please send your feedback to the following address [email protected]
Many thanks for your kind co-operation.
,
Marina Efthymiou
Dr. Andreas Papatheodorou

A6 - 3
Project Description
Introduction to the notions of
Functional Airspace Blocks and European Union Emissions
Trading Scheme
Functional Airspace Blocks (FABs)
The Single European Sky is a European Commission initiative. Its aim is to de-fragment the
European airspace, reduce delays, increase safety standards and flight efficiency to reduce the
aviation environmental footprint and reduce costs related to service provision. In the context
of the Single European Sky (SES), Functional Airspace Blocks (FABs) will reorganize the
European airspace in a more sufficient and operational way.
A FAB is an airspace block based on operational requirements and established regardless of
State boundaries, where the provision of air navigation services and related functions are
performance-driven and optimized with a view to introducing, in each functional airspace
block, enhanced cooperation among air navigation service providers or, where appropriate, an
integrated provider.
Nine FAB initiatives are established:
1) NEFAB (North European FAB): Estonia, Finland, Latvia, Norway.
2) Denmark-Sweden: Denmark, Sweden
3) BALTIC FAB Poland, Lithuania
4) FABEC (FAB Europe Central): France, Germany, Belgium, Netherlands,
Luxembourg, and Switzerland
5) FABCE (FAB Central Europe): Czech Republic, Slovak Republic, Austria, Hungary,
Croatia, Slovenia, Bosnia and Herzegovina
6) DANUBE Bulgaria, Romania
7) BLUE MED Italy, Malta, Greece, Cyprus, (and Egypt, Tunisia, Albania, Jordan as
observers)
8) UK- IRELAND FAB United Kingdom, Ireland
9) SW FAB (South West FAB) Portugal, Spain
European Union Emissions Trading System (EU ETS)
The European Union Emissions Trading System (EU ETS), also known as the European

A6 - 4
Union Emissions Trading Scheme, was the first large emissions trading scheme in the world,
and remains the biggest. In 2008 the EU passed legislation to include aviation in the EU-ETS.
This means that from 2012, overall CO2 emissions of the aviation industry are capped:
initially at 97% of 2005 emissions levels, and from 2013 onwards at 95%. All operators
flying to and from the EU will have to surrender one allowance for every tonne of CO2
emitted on a flight to and from (and within) European Economic Area.
Under the 'cap and trade' principle, a cap is set on the total amount of greenhouse gases that
can be emitted by all participating installations. 'Allowances' for emissions are then auctioned
off or allocated for free, and can subsequently be traded. Installations must monitor and
report their CO2 emissions, ensuring they hand in enough allowances to the authorities to
cover their emissions. Non-complying aircraft operators face a penalty of € 100 per missing
allowance on top of the obligation to procure and surrender missing allowances. If emission
exceeds what is permitted by its allowances, an installation must purchase allowances from
others. Conversely, if an installation has performed well at reducing its emissions, it can sell
its leftover credits. This allows the system to find the most cost-effective ways of reducing
emissions without significant government intervention.
Focus
A particular emphasis is to investigate the opinions of the involved individual stakeholders,
ANSPs, NSAs, Organisations, Academia and Airlines and the dynamics that are developed
among them.
The focus of the questionnaire is to collect the opinions of the individuals involved
stakeholders, ANSPs, NSAs, Organisations, Academia and Airlines on the inclusion of
aviation in EU ETS.
The Questions
The in-depth and confidential interviews with the participants aim to provide the data for the
qualitative part of the study and contribute to the development of a model explaining the
convergence of the diminution of emissions resulted from FABs and EU ETS initiatives.
Time requirements
To address the xx questions of the present questionnaire will take approximately xx minutes
You may leave any of the questions unanswered, if you wish. When you return to the study at

A6 - 5
a later time, you will be able to change or edit your prior answers, as well as add others.
You can also submit additional text on a separate page.
You are kindly asked to send fill the questionnaire until 10/07/2014.
The next phase
As said earlier as soon as the responses from all experts are received the main findings will
be used to in formulating the second questionnaire. As a result of round two, areas of
disagreement and agreement will be identified
The research team
Ms Marina Efthymiou works as trainee at EUROCONTROL at the Directorate Pan-European
Sky/Support to States and Regional Initiatives (DPS/SSR). She is a PhD candidate at the
Department of Business Administration, University of the Aegean, Greece. She holds a
Master in Planning, Management and Policy of Tourism with specialization in Strategic
Development and a bachelor in Business Administration, University of Patras, Greece.
Dr. Andreas Papatheodorou is Associate Professor in Industrial and Spatial Economics with
Emphasis on Tourism at the Department of Business Administration, University of the
Aegean, Greece. He is also a Fellow of the UK Tourism Society and a member of the
German Aviation Research Society (GARS) and the international Air Transport Research
Society (ATRS).

A6 - 6
Q1.Please evaluate the major FAB Improvement Areas (FIAs) that have been
identified as the most promising areas according το the degree of the potential
benefit coming from the establishment of FABs12.
1 stands for strong disagreement, 2 for disagreement, 3 for neutral position, 4 for
agreement and 5 for strong agreement.
FIAs Scale Comments
Common Routes Network design
Common Sector Design
Common Operational Procedures
Airspace consolidation
Synergies in ATFCM
Common R&D
Harmonised ATM system
Common Procurement
Common AIS & MET
Surveillance Data sharing
Communication Data Sharing
Sharing of navigation aids
Improved cooperation with
Militaries
Common Flight Inspection
Common Safety Management
System
Common ATCO Training
Reduction of emissions
Other,
Q2. Please assess the extent to which you agree with the following statements
1 stands for strong disagreement, 2 for disagreement, 3 for neutral position, 4 for
agreement and 5 for strong agreement.
Statements Scale Comments
12 http://ec.europa.eu/transport/modes/air/studies/doc/traffic_management/evaluation_of_fabs_final_report.pdf

A6 - 7
The airspace before SES didn’t
need to be changed.
FABs bring routes closer to the
optimum “Great Circle” route and
reduce extended flight paths.
The European airspace network
today can benefit from a
significant level of dynamism
through the application of the
Flexible Use of Airspace (FUA)
concept.
The reorganisation of the
European Sky was necessary.
The horizontal component is of
higher economic and
environmental importance than the
vertical component of the Flight
efficiency.
Due to inherent safety (minimum
separation requirements between
aircraft) requirements, the level of
“inefficiencies” cannot be reduced
to zero at system level.
Due to capacity (organisation of
traffic flows) requirements, the
level of “inefficiencies” cannot be
reduced to zero at system level.
The main environmental KPI
should be the estimated economic
value of CO2 emissions due to
route extension.
All FABs are fully operational.

A6 - 8
Q3. Please divide 100 points over the different factors that affect horizontal en route
flight efficiency13, where the most important factor gets the highest number of
points. You are allowed to allocate points to as many factors as you wish.
Factors Points Comments
Route structure and availability affect horizontal en route flight efficiency.
Availability of airspace (utilisation of civil military structures) affects horizontal en route flight efficiency.
Flight planning capabilities (use of software, repetitive flight planning) affect horizontal en route flight efficiency.
User preferences regarding time affect horizontal en route flight efficiency.
User preferences regarding fuel affect horizontal en route flight efficiency.
Tactical ATC routings affect horizontal en route flight efficiency.
Special events such as ATC strikes affect horizontal en route flight efficiency.
Other,
Total points 100
Q4. Please divide 100 points over the different factors that affect the use of the
civil/military airspace structures (Free Route Airspace, Flexible use of Airspace),
where the most important factor gets the highest number of points. You are allowed
to allocate points to as many factors as you wish.
Factors Points Comments
Political issues
Flight planning capabilities (use of
software, repetitive flight planning)
Special events
Existing ICAO ATM procedures
Aspects related to position information
13 Horizontal en route flight efficiency compares the length of flight trajectories (L) to the “achieved” reference
distance (H). The achieved distance apportions the Great Circle Distance between two airports within European
airspace. If the origin/ destination airport is located outside of European airspace, the entry/exit point into the
airspace is used for the calculation.

A6 - 9
and radar vectoring
Other,
Total points 100
Q5. Please evaluate the following factors according to their contribution to
emissions’ reduction.
1 stands for strong disagreement, 2 for disagreement, 3 for neutral position, 4 for
agreement and 5 for strong agreement.
Factors Scale Comment
Flexible Use of Airspace
Free Route Airspace
Shortest feasible routes
Implementing continuous descent approaches
Use of Bio fuels
Use of Eco-friendly engines
Improving load factors
Reduced traffic because of economic crisis
Trading Certified Emissions Reductions (CERs)
Trading Verified or Voluntary Emissions Reductions (VERs)
Airlines develop offsetting programs
EU Emissions Trading Scheme
Single European Sky
Other,
Q6. Please divide 100 points over the different factors that lead to carbon neutral
growth, where the most important factor gets the highest number of points. You are
allowed to allocate points to as many factors as you wish.
Factors Points
Comments
The EU ETS leads to carbon neutral growth.
Individual carbon offsetting programs from airlines lead to carbon neutral growth.
Individual carbon offsetting programmes from states lead to carbon neutral growth.
Horizontal en route flight efficiency
Direct routes lead to carbon neutral growth
Wind optimal routes lead to carbon neutral growth
Flexible Use of Airspace (FUA) leads to carbon neutral growth

A6 - 10
Free Route Airspace (FRA) leads to carbon neutral growth
Other,
Total points 100
Q.7 Do you think that the present charging scheme is enough to avoid
fragmentation because of intra and inter FAB competition? What do you propose?
…………………………………………………………………………………………………………
…………………………………………………………………………………………………………
……………………………………………………………………………………………….
Q8. Do you think that there is a connection between FABs and Emissions Trading
Scheme (EU ETS)14? If yes, why?
.………………………………………………………………………………………………………
…………………………………………………………………………………………………………
…………………………………………………………………………………………………………
…………………………………………………………………………………………………………
…………………………………….
14 The European Union Emissions Trading System (EU ETS), also known as the European Union Emissions Trading
Scheme, was the first large emissions trading scheme in the world, and remains the biggest. In 2008 the EU passed
legislation to include aviation in the EU-ETS. This means that from 2012, overall CO2 emissions of the aviation industry
are capped: initially at 97% of 2005 emissions levels, and from 2013 onwards at 95%. All operators flying to and from
the EU will have to surrender one allowance for every tonne of CO2 emitted on a flight to and from (and within)
European Economic Area. Under the 'cap and trade' principle, a cap is set on the total amount of greenhouse gases
that can be emitted by all participating installations. 'Allowances' for emissions are then auctioned off or allocated for
free, and can subsequently be traded. Installations must monitor and report their CO2 emissions, ensuring they hand
in enough allowances to the authorities to cover their emissions. For more info please visit
http://ec.europa.eu/clima/policies/transport/aviation/index_en.htm

A7 - 1
Appendix 7: 2nd round Questionnaire: EU ETS and Aviation
Thank you for participating in the 1st round of the Delphi survey that is part of my PhD entitled
“Functional Airspace Blocks and European Union Emissions Trading Scheme in aviation”. Delphi is
a method for structuring a group communication process effective in allowing a group of
individuals, to deal with a complex problem, as a whole.
Thank for continuing to the 2nd round!
This questionnaire round is the second and last round of the survey. Thanks for answering as many
questions as possible. In this round you will have the opportunity to revise your answers and take
under consideration what the rest of the participants have answered (You will find their answer in
a separate column next to yours)
Your participation in the survey and your individual responses will be strictly confidential to the
research team and will not be divulged to any outside party, including other panellists.
This research is for academic purposes only, the outcome of which is the attainment of a doctoral
degree and the publishing of articles in accredited scientific journals.
Please send your feedback to the following address [email protected] or
Many thanks for your kind co-operation.

A7 - 2
Introduction to the notion of the 2nd and last round of Delphi
Focus
A particular emphasis is to investigate the opinions of the involved individual stakeholders, ANSPs,
NSAs, Organisations, Academia and Airlines and the dynamics that are developed among them.
The focus of the questionnaire is to collect the opinions of the individuals involved stakeholders,
ANSPs, NSAs, Organisations, Academia and Airlines on the EU ETS Scheme.
Questions and Time requirements
To revise the questions of the present questionnaire will take less than 10 minutes You may leave
any of the questions as you scored them in the first round, if you wish. One of the questions that
you answered in the first round is replaced with another question and an additional one is added.
You are kindly requested to answer them.
You can submit additional text on a separate page if you wish.
You are kindly asked to send your answers until 01/09/2015.
The research team
Ms Marina Efthymiou works as at EUROCONTROL at the Directorate Pan-European Sky/Support to
States and Regional Initiatives (DPS/SSR) and she is looking for her next career step in aviation
industry. She is a PhD candidate at the Department of Business Administration, University of the
Aegean, Greece. She holds a Master in Planning, Management and Policy of Tourism with
specialization in Strategic Development and a bachelor in Business Administration, University of
Patras, Greece.
Dr Andreas Papatheodorou is Associate Professor in Industrial and Spatial Economics with
Emphasis on Tourism at the Department of Business Administration, University of the Aegean,
Greece. He is also a Fellow of the UK Tourism Society and a member of the German Aviation
Research Society (GARS) and the international Air Transport Research Society (ATRS).

A7 - 3
Q1/Q6. Please assess the extent to which you agree with the following statements. 1 stands for
strong disagreement, 2 for disagreement, 3 for neutral position, 4 for agreement and 5 for strong
agreement.
Statements
Your
opinion in
the 1st
round
Others
(n=31)
Your
opinion in
the 2nd
round
Comments
The inclusion of aviation in the EU ETS will
influence negatively the development of
non-European airlines if they are included in
EU ETS.
The EU ETS will lead the airlines to merge in
order to obtain more emissions allowances.
The EU ETS is causing competition issues to
airlines
It is possible to link the EU ETS and the other
Emissions Trading schemes and have a global
ETS.
The monitoring, reporting and verification of
emissions in the EU ETS is effective.
The EU ETS is vulnerable to frauds, for
instance VAT fraud and ‘phishing’ scams.
The cap of EU ETS is too generous.
The carbon market’s stability is vulnerable
because of the continuous changes in
legislation.
The carbon market stability is vulnerable
because of the low prices of the allowances.
Postponing the auctions can force the prices
of allowances to increase.
The free allocation of allowances to the

A7 - 4
Statements
Your
opinion in
the 1st
round
Others
(n=31)
Your
opinion in
the 2nd
round
Comments
airlines must be stricter.
Using biofuels is a promising solution for
carbon offsetting.
The creation of a carbon market as a
“financial instrument” can lead to sufficient
carbon reduction.
Additional fuel savings will also be achieved
owing to better fuel use predictability.
Route optimisation is sufficient enough for
carbon neutral growth.
The EU ETS can result in carbon leakage.
The economic dimension of the EU ETS
drives heavy lobbying around allocation of
EU ETS allowances.
The EU ETS is source of profit-making
incentives unprecedented in the history of
environmental policy
There are small emissions reductions relative
to ‘business-as-usual’ and this leads to
instabilities (related to economics, policies
and time frames) in the EU ETS.
The corresponding large proportion of free
allocation underlies legal stresses and gives a
scope for distortions.
The multi-period nature of allocations( i.e.
banking and borrowing flexibility) drives
dependence both upon post-2012 decisions
and creates risk of perverse incentives

A7 - 5
Q2/Q6: Please divide 100 points over the different allowance allocation methods that you deem
as appropriate for the allocation of allowances to the airlines, where the most important factor
gets the highest number of points. You are allowed to allocate points to as many factors as you
wish.
Allocation methods Your opinion in the 1st
round
Others
(n=24)
Your opinion in the
2nd round Comments
Grandfathering (free
allocation)
Benchmarking
Auctioning
Total points 100 100 100
Q3/Q6: In order to link the different ETSs (like New Zealand or Shanghai ETS) with entire scheme
and not only in aviation, the following factors should be applied to the same degree. Please
assess the extent to which you agree with the following statements. 1 stands for strong
disagreement, 2 for disagreement, 3 for neutral position, 4 for agreement and 5 for strong
agreement.
Parameters
Your opinion
in the 1st
round
Others
(n=27)
Your opinion
in the 2nd
round
Comments
There are the same Monitoring,
Reporting and Verification (MRV)
rules for allowances
There are the same banking
provisions
There are the same registries’ rules
There are the same rules governing
new entrants and closures
There are the same compliance
periods
The same allocation methods are

A7 - 6
Parameters
Your opinion
in the 1st
round
Others
(n=27)
Your opinion
in the 2nd
round
Comments
applied
There is the same stringency of
targets
There is the same stringency of
enforcement
There is the same eligibility of offset
credits
Q4/Q6 Please divide 100 points over the different factors that lead to carbon neutral growth in
aviation, where the most important factor gets the highest number of points. You are allowed to
allocate points to as many factors as you wish.
Factors
Your opinion
in the 1st
round
Others
(n=26)
Your opinion
in the 2nd
round
Comments
The EU ETS leads to carbon neutral
growth.
Individual carbon offsetting programs
from airlines lead to carbon neutral
growth.
Individual carbon offsetting programmes
from states lead to carbon neutral
growth.
Horizontal en
route flight
efficiency
Direct routes lead to
carbon neutral growth
Wind optimal routes
lead to carbon neutral
growth
Flexible Use of
Airspace (FUA) leads

A7 - 7
to carbon neutral
growth
Free Route Airspace
(FRA) leads to carbon
neutral growth
Other
Other
Total points 100 100 100
Into for the last section of the questionnaire: Search and information, bargaining and
decision, monitoring and enforcement of the EU ETS scheme create transaction costs (TC) for the
stakeholders. This is because there are legislative and regulatory enactment costs related to the
ETS such as implementation costs to meet the targets; monitoring costs to check the progress of
the states/Aircraft operators; and enforcement costs to make the scheme work.
Q5/Q6: In the following table, please allocate 100 points over the various factors associated
with transaction costs for policymakers/regulators emerging from the aviation EU ETS scheme.
The most important factor gets the highest number of points and the least important factor gets
the lowest number of points. You are allowed to allocate points to as many factors as you wish.
TC Factors Areas within Factors Points Comments
Application
Quantification of historic emissions
Development of emission outlooks
Decision for an application rule
Compilation of an application
Where necessary, compilation of a benchmark
Verification of the application
Fees for annual allocation
Fees for emissions register
Implementation of Emissions Management
Information, training
Assessment of obligation to participate in the EU ETS
Set up of organizational structures and assignment of responsibilities
Adaptation or purchase of software
Material costs
Monitoring Design of a monitoring concept

A7 - 8
TC Factors Areas within Factors Points Comments
Implementation of an internal monitoring system
Ongoing monitoring
Reporting and verification
Quantification of annual emissions
Compilation of an emissions report
Verification of an emissions report
Delivery of data for ex-post-control
Abatement measures
Identification of abatement measures
Decision about abatement measures
Trade
Transactions fees (exchange fees, broker fees, clearing)
Trade and negotiation
Market observation
Strategy Design of a risk strategy
Design of a trade strategy
Design of an abatement strategy
Other (please explain)
Please explain
Total Points: 100
Q6/Q6: Overall, how important do you consider transactions costs to be for the effective
functioning of the aviation inclusion in the EU ETS scheme? Please mark the box.
Very unimportant
Unimportant Neither Important or Unimportant
Important Very Important
Email for contacting for the final results dissemination:
Thank you very much for your contribution!
Marina Efthymiou ([email protected])

A8 - 1
Appendix 8: 2nd round Questionnaire: SES/FABs and the Environment
Thank you for participating in the 1st round of the Delphi survey that is part of my PhD entitled
“Functional Airspace Blocks and European Union Emissions Trading Scheme in aviation”. Delphi is
a method for structuring a group communication process effective in allowing a group of
individuals, to deal with a complex problem, as a whole.
Thank for continuing to the 2nd round!
This questionnaire round is the second and last round of the survey. Thanks for answering as many
questions as possible. In this round you will have the opportunity to revise your answers and take
under consideration what the rest of the participants have answered (You will find their answer in
a separate column next to yours)
Your participation in the survey and your individual responses will be strictly confidential to the
research team and will not be divulged to any outside party, including other panellists.
This research is for academic purposes only, the outcome of which is the attainment of a doctoral
degree and the publishing of articles in accredited scientific journals.
Please send your feedback to the following address [email protected] or
Many thanks for your kind co-operation.

A8 - 2
Introduction to the notion of the 2nd and last round of Delphi
Focus
A particular emphasis is to investigate the opinions of the involved individual stakeholders, ANSPs,
NSAs, Organisations, Academia and Airlines and the dynamics that are developed among them.
The focus of the questionnaire is to collect the opinions of the individuals involved stakeholders,
ANSPs, NSAs, Organisations, Academia and Airlines on the SES Scheme.
Questions and Time requirements
To revise the questions of the present questionnaire will take less than 10 minutes You may leave
any of the questions as you scored them in the first round, if you wish. Two of the questions that
you answered in the first round are replaced with another 2 short questions, that you are kindly
invited to answer.
You can submit additional text on a separate page if you wish.
You are kindly asked to send your answers until 01/09/2015.
The research team
Ms Marina Efthymiou works as at EUROCONTROL at the Directorate Pan-European Sky/Support to
States and Regional Initiatives (DPS/SSR) and she is looking for her next career step in aviation
industry. She is a PhD candidate at the Department of Business Administration, University of the
Aegean, Greece. She holds a Master in Planning, Management and Policy of Tourism with
specialization in Strategic Development and a bachelor in Business Administration, University of
Patras, Greece.
Dr Andreas Papatheodorou is Associate Professor in Industrial and Spatial Economics with
Emphasis on Tourism at the Department of Business Administration, University of the Aegean,
Greece. He is also a Fellow of the UK Tourism Society and a member of the German Aviation
Research Society (GARS) and the international Air Transport Research Society (ATRS).

A8 - 3
Q1/Q8.Please evaluate the major FAB Improvement Areas (FIAs) that have been identified as
the most promising areas according to the degree of the potential benefit coming from the
establishment of FABs. 1 stands for totally unimportant, 2 for unimportant, 3 for neutral position,
4 for important and 5 for very important.
FIAs Your opinion in
the 1st round
Others
(n=28)
Your opinion in the
2nd round Comments
Common Routes Network
design
Common Sector Design
Common Operational
Procedures
Airspace consolidation
Synergies in ATFCM
Common R&D
Harmonised ATM system
Common Procurement
Common AIS & MET
Surveillance Data sharing
Communication Data
Sharing
Sharing of navigation aids
Improved cooperation with
Militaries
Common Flight Inspection
Common Safety
Management System
Common ATCO Training
Reduction of emissions
Other,

A8 - 4
Q2/Q8. Please assess the extent to which you agree with the following statements. 1 stands for
strong disagreement, 2 for disagreement, 3 for neutral position, 4 for agreement and 5 for strong
agreement.
Statements
Your
opinion in
the 1st
round
Others
(n=29)
Your
opinion in
the 2nd
round
Comments
The airspace before SES didn’t need to be
changed.
FABs bring routes closer to the optimum
“Great Circle” route and reduce extended
flight paths.
The European airspace network today can
benefit from a significant level of dynamism
through the application of the Flexible Use
of Airspace (FUA) concept.
The reorganisation of the European Sky was
necessary.
The horizontal component is of higher
economic and environmental importance
than the vertical component of the Flight
efficiency.
Due to inherent safety (minimum separation
requirements between aircraft)
requirements, the level of “inefficiencies”
cannot be reduced to zero at system level.
Due to capacity (organisation of traffic
flows) requirements, the level of
“inefficiencies” cannot be reduced to zero at
system level.
The main environmental KPI should be the
estimated economic value of CO2 emissions

A8 - 5
Statements
Your
opinion in
the 1st
round
Others
(n=29)
Your
opinion in
the 2nd
round
Comments
due to route extension.
All FABs are fully operational.
Q3/Q8. Please divide 100 points over the different factors that affect horizontal en route flight
efficiency, where the most important factor gets the highest number of points. You are allowed
to allocate points to as many factors as you wish.
Factors
Your opinion
in the 1st
round
Others
(n=24)
Your opinion
in the 2nd
round
Comments
Route structure and availability affect
horizontal en route flight efficiency.
Availability of airspace (utilisation of
civil military structures) affects
horizontal en route flight efficiency.
Flight planning capabilities (use of
software, repetitive flight planning)
affect horizontal en route flight
efficiency.
User preferences regarding time affect
horizontal en route flight efficiency.
User preferences regarding fuel affect
horizontal en route flight efficiency.
Tactical ATC routings affect horizontal
en route flight efficiency.
Special events such as ATC strikes affect
horizontal en route flight efficiency.
Other,
Total points 100 100
Q4/Q8. Please divide 100 points over the different factors that affect the use of the civil/military
airspace structures (Free Route Airspace, Flexible use of Airspace), where the most important
factor gets the highest number of points. You are allowed to allocate points to as many factors
as you wish.

A8 - 6
Factors Your opinion in
the 1st round
Others
(n=27)
Your opinion in
the 2nd round Comments
Political issues
Flight planning capabilities (use of
software, repetitive flight
planning)
Special events
Existing ICAO ATM procedures
Aspects related to position
information and radar vectoring
Other
Total points 100 100 100
Q5/Q8. Please evaluate the following factors according to their contribution to emissions’
reduction. 1 stands for totally unimportant, 2 for unimportant, 3 for neutral position, 4 for
important and 5 for very important.
Factors
Your opinion in
the 1st round
Others (n=30)
Your opinion in the
2nd round
Comments
Flexible Use of Airspace
Free Route Airspace
Shortest feasible routes
Implementing continuous descent approaches
Use of Bio fuels
Use of Eco-friendly engines
Improving load factors
Reduced traffic because of economic crisis
Trading Certified Emissions Reductions (CERs)
Trading Verified or Voluntary Emissions Reductions (VERs)
Airlines develop offsetting programs
EU Emissions Trading Scheme

A8 - 7
Factors
Your opinion in
the 1st round
Others (n=30)
Your opinion in the
2nd round
Comments
Single European Sky
Other,
Other,
Q6/Q8. Please divide 100 points over the different factors that lead to carbon neutral growth,
where the most important factor gets the highest number of points. You are allowed to allocate
points to as many factors as you wish.
Factors Points Others
(n=25)
Your opinion
in the 2nd
round
Comments
The EU ETS leads to carbon neutral growth.
Individual carbon offsetting programs from
airlines lead to carbon neutral growth.
Individual carbon offsetting programmes from
states lead to carbon neutral growth.
Horizontal en
route flight
efficiency
Direct routes lead to
carbon neutral growth
Wind optimal routes lead
to carbon neutral growth
Flexible Use of Airspace
(FUA) leads to carbon
neutral growth
Free Route Airspace (FRA)
leads to carbon neutral
growth
Other
Other

A8 - 8
Total points 100 100 100
Into for the last section of the questionnaire: Search and information, bargaining and
decision, monitoring and enforcement of the Performance scheme create transaction costs (TC)
for the SES stakeholders. This is because there are legislative and regulatory enactment costs
related to the KPAs, such as implementation costs to meet the targets; monitoring costs to check
the progress of the states/FABs; and enforcement costs to make the scheme work.
Q7/Q8: In the following table, please allocate 100 points over the various factors associated with transaction costs for stakeholders emerging from the environment KPA in the SES Performance scheme. The most important factor gets the highest number of points and the least important factor gets the lowest number of points. You are allowed to allocate points to as many factors as you wish.
TC Factors Areas within Factors Points Comments
Alternative policies Develop alternative solutions
Evaluate the alternative solutions
Decision for the implementing policy
Development and Implementation of the regulatory scheme
Quantification of historic emissions
Development of emission outlooks
Decision for an application rule
Measures to overcome “frictions” and negotiation with stakeholders
Assessment of participants
Adaptation or purchase of software
Material costs Set up of organizational structures and assignment of responsibilities
Fees for Information, training
Monitoring
Design of a monitoring concept
Implementation of an internal monitoring system
Ongoing monitoring
Reporting and verification
Quantification of annual emissions
Compilation of an emissions report
Verification of an emissions report
Delivery of data for ex-post-control
Compliance measures
Identification of compliance measures
Offering recommendations and support
Decision about imposing non-compliance penalties
Strategy Design of a strategy for NSAs, ANSPs
Design of a regulation enforcement

A8 - 9
TC Factors Areas within Factors Points Comments
procedure
Design of an abatement strategy
Other (please explain) Please explain
Total Points: 100
Q8/Q8: Overall, how important do you consider transactions costs to be for the effective
functioning of the environment KPA in the SES Performance scheme? Please mark the box.
Very unimportant
Unimportant Neither Important or Unimportant
Important Very Important
Email for contacting for the final results dissemination:
Thank you very much!
Marina Efthymiou ([email protected])

This page is intentionally left blank

A9 - 1
Appendix 9: Permission to use copyright material

A9 - 2

A9 - 3

A9 - 4

A9 - 5

A9 - 6

A9 - 7

A9 - 8