The Bharat Microfinance Report 2013.pdf - Margdarshak
160
-
Upload
khangminh22 -
Category
Documents
-
view
1 -
download
0
Transcript of The Bharat Microfinance Report 2013.pdf - Margdarshak
FosteringClient-Centric Practices
through Compliance
The Bharat Microfinance Report 2013
12 & 13, Special Institutional Area2nd Floor, MPTCD Building, Shaheed Jeet Singh Marg
New Delhi - 110 067, IndiaTel. : +91-11-47174400 Fax : +91-11-47174405Email : [email protected], [email protected]
© Copyright reserved Sa-Dhan2013
Developed & Published by:Sa-Dhan
12 & 13, Special Institutional Area,2nd Floor, MPTCD Building, Shaheed Jeet Singh Marg,
New Delhi – 110 067, IndiaTel: +91-11-47174400 Fax: +91-11-47174405
E-mail: [email protected], [email protected]
Cover Design & Printed by:Anil
9810803375, 8860127811
Disclaimer:The views expressed in this publication do not necessarily reflect the opinions/views of any
supporters nor they be held responsible for the opinions/views in this report.

Preface
iii
Microfinance sector in India, after the Andhra Pradesh crisis, is inching back to normalcy, thanks to the regulatory comfort provided by RBI. The microfinance Bill, which is
before Parliament is expected to bring in further legitimacy to all forms of MFIs. The industry Code of Conduct implementation coupled with regulatory compliance by the sector would go a long way in infusing confidence among all the stakeholders.
In this context, I think there are three areas of our domain deserving our special attention. One is the need for articulating the fact that microfinance is a strategic part of financial inclusion agenda of the government and the central bank. The second is the criticality of re-demonstrating our collective intention to help the poor and the unbanked populace by way of right mission, social performance and client protection. The third area is projecting the fact that microfinance institutions are sustainable financial institutions and they continue to be the investable destination for the bankers and the investors.
In order to articulate these positions, we need empirical data. This report has been designed to provide new perspectives on the above three areas. Primary data received from 155 Sa-Dhan members and other MFIs, who represent around 95 percent of the client / the credit portfolio of MFIs in India, and analysis thereon are the basis for this report.
Sa-Dhan has been publishing The Bharat Microfinance Report for the past nine years. This year, in spite of MFIs preoccupation with their operational issues, 155 MFIs reported data, including 51 non-member of Sa-Dhan. We thank them for reposing confidence in us and valuing transparency through data reporting.
For the first time, we have included an elaborate account of SHGs and Cooperatives as microfinance intermediaries. The data and case studies provided by Self Help Group Promotion Institutions (SHPIs) and Cooperatives have been helpful in developing the chapter. NABARD Data sets have been analysed and lucidly presented to understand the SBLP trend.
A dedicated team at Sa-Dhan secretariat consisting of Dr. K.Natarajan and Mr. Ardhendu Nandi spearheaded the report work with active support of their colleagues Mr. P.M Kamalesh, Ms. Isha Gambhir and Ms. Neetu Lodhey. We appreciate them for their meticulous collection of data through repeated follow up with members, validation of the data analysis and compilation of the report. We appreciate the data collection support rendered by members of Sa-Dhan team, Mr. Krishna Reddy, Mr. Susanta K.Behera, Mr. Habib Shaik and Mr. T.Kumar from their respective regions of operation.
We are grateful to Mr. C.S.Ghosh, Mr. Suresh Krishna, Mr. Ravi Narasimham, Mr. V. S. Radha Krishnan, Mr. Royston Braganza, Mr.Parashuram Nayak, Mr.Vinod Jain,

The Bharat Microfinance Report 2013iv
Mr. V. Salimath, Mr. Rajesh Singhi, Ms. Kalpana Pant and Mr. Subrat Singh for their guid-ance and feedback on the framework and draft report.
Special thanks to Mr. Somesh Dayal, Mr. Alok Kumar Dubey and Mr. Chandan Kumar for providing technical inputs for the report work.
We are grateful to overall patronage from SIDBI, Ford Foundation, Citi Foundation, IFC, Hivos, NABARD, RBI and Government agencies for the work of Sa-Dhan.
We have attempted to provide some new insights in this report. We hope this would be useful to you. We look forward to receiving your comments and suggestions for improvement.
Mathew TitusExecutive Director
v
Contents
Preface i
List of Boxes viii
List of Figures ix
List of Tables xi
List of Abbreviations xii
Glossary xiv
Executive Summary xviii
Part 1: Microfinance And Financial Inclusion 1 1.1 Microfinance Complementing Banks 2 1.2 GOI and RBI stand on MicrofinanceRole and Financial Inclusion 3 1.3 Microfinance Outreach 4 1.4 Microcredit for Financial Inclusion 7 1.5 MFIs Reach to Special Segments of People 7 1.6 Non-Credit Financial services of MFIs 9 1.7 MFIs as Banking Correspondents (BCs) 10 1.8 Deepening Financial Inclusion through Finance + Development Services 12 1.9 Fruits of MFIs Inclusive Efforts -Impact on the Lives of Borrowers 15
Part 2: MFIs: Outreach and Loan Portfolio 19 2.1 Geographical Spread 19 2.2 Client Outreach 20 2.2.1 The Regional Spread of MFI Clients 22 2.2.2 State-wise Client Outreach 22 2.2.3 Leading MFIs in Client Outreach 23 2.2.4 Types of Clients Reached 24 2.2.5 New Clients Acquired 24 2.3 Loan Portfolio of MFIs 25 2.3.1 Region-wise Loan Portfolio 27 2.3.2 Loan Portfolio across States 27 2.3.3 Managed Portfolio 28 2.3.4 Loan Amount Outstanding per Borrower 29 2.4 Growth Trend in MFI Borrowers and Loan Portfolio 30 2.5 Loan Disbursement 30 2.5.1 Loan Disbursement –Regional Variation 31 2.5.2 Leading MFIs in Loan Disbursement during 2012-13 34 2.6 Purpose of Loan 34 2.6.1 Income Generation Loan 34 2.6.2 Non-Income Generation Loans 35
The Bharat Microfinance Report 2013vi
Part 3: MFIs – Institutional and Financial Performance 37 3.1 Branch Network 37 3.2 Workforce in MFIs 38 3.2.1 Active Borrowers per Credit Officer (ABCO) 40 3.3 Portfolio Quality 40 3.4 Assets and Liabilities of MFIs 42 3.4.1 MFI Assets 42 3.4.2 MFI Equity Outstanding 44 3.4.3 Fresh Equity Acquired 45 3.4.4 Leverage / Debt –Equity Ratio 47 3.4.5 Capital (Net owned Fund) to Total Assets Ratio 48 3.4.6 Gross Loan Portfolio to Total Assets 49 3.5 Income Analysis 50 3.5.1 Break-up of Income 50 3.6 Expenditure Analysis 51 3.7 Net surplus 52 3.8 Cost and Profitability Ratios 53 3.8.1 Cost Per Borrower 53 3.8.2 Operating Cost Ratio 54 3.8.3 Borrowing Cost 54 3.8.4 Yield on Loan Portfolio (Financial Revenue Ratio) 55 3.8.5 Operating Self Sufficiency 56 3.8.6 Margin Level 56 3.8.7 Profitability Ratios 57
Part 4: Funding MFIs 59 4.1 Funding Instrument wise Analysis 59 4.1.1 MFIs Borrowing Instruments 59 4.2 Lender wise Analysis 61 4.2.1 Funds Received by MFIs 61 4.2.2 Target MFIs (Beneficiaries) for Funds lent during 2012-13 62 4.2.3 MFIs’ Outstanding Bank Loan Portfolio 63 4.2.4 Top Lenders to MFIs During 2012-13 65 4.3 Results of Bankers Survey on MFI lending 68 4.3.1 On MFIs being partners of Banks 68 4.3.2 On Performance of MFIs 68 4.3.3 On lending criteria to MFIs under priority sector lending 69 4.3.4 On Change of Risk Assessment under MFI lending 70 4.3.5 Banks views on Post-crisis Era being normal or ‘new normal’ 71
Part 5: Self Regulation 72 5.1 RBI Regulation 72 5.2 Microfinance Bill 72 5.3 RBI’s Say in Self Regulation 73 5.4 Sa-Dhan and Self Regulation 73 5.5 Lenders’ Forum – Reinforcing Self Regulation 75 5.6 Responsible Finance Forum – A Think Tank in Self Regulation 76 5.7 Sa-Dhan Members’ Self Regulation in response to the RBI Regulation 76
vii
5.8 Self Regulation – State Level Efforts 78 5.9 Credit Bureau Checking as Self Regulation 79 Appendix - Perpective of a Credit Bureau-High Mark 81
Part 6: Community Based Microfinance Organizations 6.1 Self Help Group Bank Linkage Programme (SBLP) 83 6.1.1 SBLP Activity since Inception 84 6.1.2 Savings Performance of SBLP 85 6.1.3 SHGs with Bank Loan 86 6.1.4 SHG Bank Loan –Portfolio Quality 91 6.2 SHGs and Their Federations-Some Observation 93 6.2.1 SHGs Quality 93 6.2.2 SHGs Federations 94 6.2.3 Good Practices in SHG Federation –A Typical Case 95 6.2.4 Strengthening SHGs and Federations – Some Suggestions for Future 97 6.3 Self Help Promoting Institutions (SHPIs) 98 6.3.1 The Key Findings from Eight SHPI Data-Source –Primary Data 98 6.3.2 SHPI survey -Salient Observation 100 6.3.3 Engagement of SHPIs by Ministry of Finance under Women Self Help 100 Groups (WSHGs) Scheme 6.4 Livelihoods Promotion through Self Help Groups 104 6.4.1 Summary of NGO Interventions 104 6.4.2 Value Chain Financing through SHGs (Care India)-A Typical Case of Livelihood 106 6.4.3 Aajeevika National Rural Livelihoods Mission – A Brief Intro 109 6.5 Microfinance through Cooperatives 110 6.5.1 Saving Facilitation by Cooperative MFIs 110 6.5.2 An Evoled Cooperative Microfinance Institution : SEWA Bank - A Case 111 6.5.2.1 Savings 112 6.5.2.2 Loan 113 6.5.2.3 Pension 114 6.5.2.4 Banksathis - SEWA’s Unique Banking Facilitator 114Appendix Appendix 1 : State wise No. of Saving SHG Over years 116 Appendix 2 : State wise Amount of Saving 117 Appendix 3 : State wise Amount of SHG Loan Disbursed 118 Appendix 4 : State wise No. of SHG with Loan Oustanding 119 Appendix 5 : State wise Amount of SHG Bank Loan Oustanding 120 Appendix 6 : Bank SHG Loan (% of NPA) 121 Appendix 7 : SHG Loan Disbursement by Public Sector Banks 122 Appendix 8 : SHG Loan Disbursement by Private Sector Banks 123 Appendix 9 : Summary of Cooperative MFI - Case Studies 124
AnnexruesDistribution of MFIs contributing data to Bharat Microfinance Report 2013 127Profile of MFIs Contributed Data for Bharat Microfinance Report 2013 129
List of Boxes
Part 1: Microfinance and Financial Inclusion
Box 1: Key Statistics in Banking Infrastructure in Village and Coverage 1
Box 2: Poorest States Inclusive Growth (PSIG) Programme 8
Box 3 MFIs Vis-a Vis Chit Funds 17
Part 3: MFIs – Institutional and Financial Performance
Box 1: Capital Inflow into the Indian Microfinance sector in 2012-13: Emergence of the ‘New Normal 46
Part 6: Community Based Microfinance Organizations
The Bharat Microfinance Report 2013viii
List of Figures
SHPI Facilitating Business Correspondent model 103
Part 1: Microfinance and Financial InclusionFigure 1 : Map Showing MFI Client Outreach ( CO) and Loan Portfolio ( LP) across States as on 31 March 2013 5Figure 2 : Map* Showing SHG Client Outreach (SCO) and SHG Loan Outstanding (SLO)Across Indian States as on 31 March 2013 6Figure 3 : Microcredit Outstanding through SHG Bank Linkage and MFI Programmes over the years 7Figure 4 : MFIs Outreach to the Unreached - SC/ST & Minority Clients over the years 9
Part 2: MFIs: Outreach and Loan PortfolioFigure 1 : No.of MFIs in Indian States / UTs and No.of Districts with MFI Operation 19Figure 2 : List of MFIs Operating in Highest Number of Indian States / Union Territories 20Figure 3 : No. of MFI Borrowers Yearly Trend and MFI Category-wise Break-up of 2013 Figure 21Figure 4 : Rural-Urban Share of MFI Borrowers - 31 March 3013 21Figure 5 : MFI Borrowers - Region wise Trend over the years 22Figure 6 : MFI Borrowers - Numbers across State - 2012 & 2013 23Figure 7 : List of Top MFIs with Highest Client Outreach as of March 2013 24Figure 8 : MFI Borrowers Acquired - Yearly Trend and MFI- Category - wise Break-up of 2013 Figure 25Figure 9 : MFIs Gross Loan Portfolio Yearly Trend and MFI Category wise Break-up of 2013 Figure 26Figure 10 : MFIs Loan Portfolio – Region wise Trend over the years 27Figure 11 : MFIs Loan Portfolio Outstanding Amount across States - 2012 & 2013 28Figure 12: MFIs Managed Loan Portfolio - Yearly Trend and MFI Category wise Break-up of 2013 Figure 29Figure 13 : Growth Fluctuations in MFI Borrowers and Loan Outstanding over the Years 30Figure 14 : MFIs Loan Disbursement -Yearly Trend and MFI-Category-wise Break-up of 2013 Figure 31Figure 15 : MFIs Loan Disbursement during 2012-13 - Regional Variation 31Figure 16 : MFIs Loan Disbursement Amount across States during 2012-13 33Figure 17 : Top MFIs disbursing Loan during 2012-13 34Figure 18 : Share of MFIs Loan Portfolio Held under Different Sub -sector as of March 2013 35Figure 19 : Share of MFI Non Income Generation Loan under Different Sub-sectors as of March 2013 36
Part 3: MFIs – Institutional and Financial Performance Figure 1: MFI Branch Network - Yearly Trend and MFI- Category- wise Break-up of 2013 Figure 37Figure 2: No.of MFI Staff - Yearly Trend and MFI Category wise Break-up of 2013 Figure 38Figure 3 : MFI Field Vs Other Staff Distribution - 2013 39Figure 4 : New Staff Recruited by MFIs over the years 49Figure 5 : Active No. of Borrowers per Credit Officer -2012 & 2013 40Figure 6 : MFI Loan Portfolio at Risk (PAR) Ratio -Trend and MFI Category wise Break-up of 2013 Figure 41Figure 7 : Percentage Share of Overdue Installments (Over 180 days) among MFI Categories - 2013 41Figure 8 : Loan Write Off - Yearly Trend and MFI- Category- wise Break-up of 2013 Figure 42Figure 9 : MFI Total Asset - Yearly Trend and MFI- Category- wise Break -up of 2013 Figure 43Figure 10 : Major Components of MFI Total Asset 43Figure 11 : MFI Equity Outstanding - Yearly Trend and MFI- Category- wise Break-up of 2013 Figure 44Figure 12 : Percentage Distribution of Equity across Size of MFIs - 2012 and 2013 44Figure 13 : Fresh Equity Raised by MFIs - Yearly Trend and MFI- Category- wise Break-up of 2013 Figure 45
ix
Figure 14 : Debt - Equity Ratio for 2012 and 2013 and for MFI Categories 2013 48Figure 15 : Capital to Total Asset Ratio - Yearly Trend and MFI-Category-wise Break-up of 2013 Figure 49Figure 16 : Gross Loan Portfolio to Total Asset Ratio - Yearly Trend and Ratio across MFI Category 49Figure 17 : Total income of Reporting MFIs - Yearly Trend and MFI- Category- wise Break-up of 2013 50Figure 18 : Composition of Total Income of MFIs-2012-13 50Figure 19 : Total Expenditure of Reporting MFIs - Yearly Trend and MFI-Category-wise Break-up of 2012-13 51Figure 20 : Financial and Operational Expenditure of MFIs for 2011-12 & 2012-13 51Figure 21 : Break-up of Operational Expenditure of MFIs 52Figure 22 : Net Surplus Income Realized by MFIs after All Expenditure and Tax-MFI-Category wise Break-up 52Figure 23 : Operating Cost Ratio - Across MFI Categories 54Figure 24 : Borrowing Cost of MFIs 55Figure 25 : Yield on MFI Portfolio across MFI Categories 55Figure 26 : Operational Self Sufficiency (OSS) of MFIs during 2012-13 56Figure 27 : MFIs Financial Margin (Financial Revenue minus Borrowing Cost) across MFI Category 57 during 2012-13Figure 28 : Return on Asset ( RoA) across MFI categories during 2012-13 57Figure 29 : Return on Equity (RoE) across MFI Categories during 2012-13 58
Part 4: Funding MFIsFigure 1 : Outstanding Funds with MFIs under Different Borrowing Instruments as of March 2012 & 2013 60Figure 2 : Percentage Share of Outstanding Amount under Different Funding Instruments as of 31 60 March 2013Figure 3 : Source wise Loan Amount Received by MFIs during 2011-12 and 2012-13 61Figure 4 : MFI Fund Amount Received: Yearly Trend and MFI-Category-wise Break - up of 2012-13 Figure 62Figure 5 : Source wise Share of Loans lent among Different Legal Forms of MFIs during 2012-13 62Figure 6 : Source wise Share of Loans lent among Different sizes of MFIs during 2012-13 63Figure 7 : Lender wise Outstanding Loan Held by MFIs -2012 and 2013 64Figure 8 : Lender wise Outstanding Loan Held by MFIs - Yearly Trend and MFI Category wise Share 64 of 2013 Figure
Part 6: Community Based Microfinance OrganizationsFigure 1 : SBLP - Historical Trend in Credit Linkage and Bank Loan Disbursed 84Figure 2 : All India and Regional Trend in No.of SHGs Savings Linked with Banks 85Figure 3 : SBLP - All India and Regional Trend in SHG Savings Amount Held at the Indian Banking System 86Figure 4 : SBLP - All India and Regional Trend in Average per SHG Savings Held in the Banking System 86Figure 5 : SBLP - All India and Regional Trend in No.of SHGs Availing Bank Loan 87Figure 6 : SBLP - All India and Regional Trend in Bank Loan Amount Disbursed to SHGs 87Figure 7 : SBLP - All India and Regional Trend in Number of SHGs Getting Fresh Loan Disbursement from the Banking System 88Figure 8 : SBLP - All India and Regional Trend in Average Bank Loan Amount Disbursed per SHG 89Figure 9 : SBLP - Amount of Bank Loan Disbursed to SHGs in Top 10 States in Terms of Amount Disbursed 89Figure 10 : SBLP - All India and Regional Trend in SHG Loan Outstanding in the Books of Banking System 90Figure 11 : SBLP -All India and Regional Trend in Average per SHG Loan Outstanding in the Banking System 91Figure 12 : SBLP - Non Performing Asset Percentage of SHG Loans with Banks 91Figure 13: SBLP – Non- Performing Asset of Bank SHG Loans With and Without SGSY Loans -
The Bharat Microfinance Report 2013x
List of Tables
a Comparison (March 2012) 92
Part 1: Microfinance and Financial InclusionTable 1 : Non - Credit Financial Services by Reporting MFIs 9Table 2 : MFIs as Banking Correspondents 10Table 3 : Key Learning from MFIs as Banking Correspondents 11Table 4 : Finance + Development Services of Reporting MFIs - Outreach Figures 12Table 5 : MFIs and Livelihoods Interventions 13Table 6 : MFIs and Women Empowerment Intervention 13Table 7 : MFIs and Education Intervention 14Table 8 : MFIs and Health Intervention 15
Part 2: MFIs: Outreach and Loan PortfolioTable 1 : MFIs and the No.of States of their Operation 20Table 2 : Loan Portfolio Outstanding - MFIs Reporting Change between 2012 & 2013 26Table 3 : MFIs Loan Outstanding per Borrower over the years 29Table 4 : Loan Disbursement – MFIs Reporting Change between 2013 and 2012 32Table 5 : Legal Form wise MFIs holding Loan Portfolio under Different Sub- sectors as of March 2013 35
Part 3: MFIs – Institutional and Financial PerformanceTable 1 : Branch Network - MFIs Reporting Change between 2012 & 2013 38Table 2 : Staff Turn- over among MFIs during 2012-13 40Table 3: List of MFIs which Received Equity over Rs. 0.5 crore during 2012-13 46Table 4 : Cost per Borrower - across MFI Categories for 2012 and 2013 53
Part 4: Funding MFIsTable 1 : List of Banks (Lenders) Reported as TOP 10 Lenders of Reporting MFIs in terms of Outstanding as of March 2013 65Table 2 : List of Bulk Lenders among the TOP 10 Lenders of Reporting MFIs in terms of Outstanding as of March 2013 67
Part 5: Self Regulation Table 1 : Indicative Statistics on MFIs Credit Bureau Reporting Frequency 80
Part 6: Community Based Microfinance OrganizationsTable 1: Region wise spread of SHG-Federations in India in year 2012 95Table 2 : Range of Entries under Different Parameters in the SHPI Data Set Received by Sa-Dhan 99Table 3: Women SHG Scheme of MoF in 150 Poorest Districts in India -List of Sa-Dhan members 102 selected for implementation Table 4: NGO–Facilitated SHG–Livelihood Practices 105Table 5: Cooperative MFIs - Savings Performance 110
xi
List of Abbreviation
1 ABCO Active Borrower per Credit Officer
2 ALCO Assets & Liabilities Committee
3 AP Andhra Pradesh
4 APC Agriculture Production Cluster
5 BC Business Correspondent
6 BPL Below Poverty Line
7 BRGF Backward Regions Grant Fund
8 CA Chartered Accountant
9 CAR Capital Adequacy Ratio
10 CBMO Community Based Microfinance Organization
11 CBEO Community Based Economic Organization
12 CDR Corporate Debt Restructuring
13 CIB Credit Information Bureau
14 CoC Code of Conduct
15 COCA Code of Conduct Compliance Assessment
16 CSPs Community Service Providers
17 DBOD Department of Banking Operations and Development
18 DBT Direct Benefit Transfer
19 DDM District Development Manager
20 D-E Ratio Debt-Equity Ratio
21 DLCC District Level Coordination Committee
22 DNBS Department of Non-Banking Supervision
23 DVC Dairy Value Chain
24 ECB External Commercial Borrowing
25 FE Financial Education
26 FER Finance Expense Ratio
27 FLDG First Loss Default Guarantee
28 FPC Fair Practice Code
29 GDP Gross Domestic Product
30 GLP Gross Loan Portfolio
31 KYC Know your Customer
32 LAB Local Area Bank
33 LEAD Livelihood Enhancement Action Plan
34 LPG Liquefied Petroleum Gas
35 LWE Left Wing Extremism
The Bharat Microfinance Report 2013xii
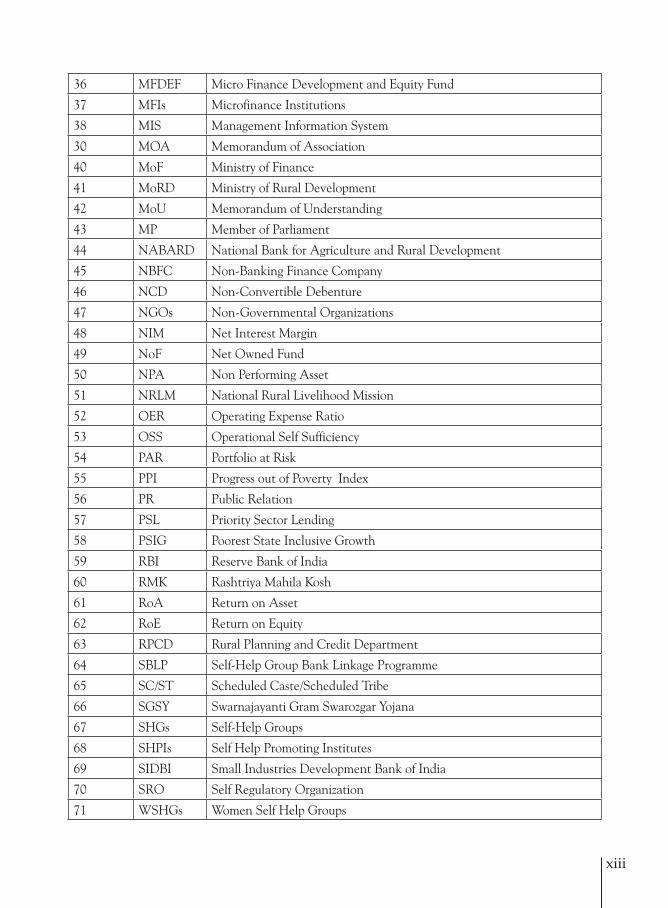
36 MFDEF Micro Finance Development and Equity Fund
37 MFIs Microfinance Institutions
38 MIS Management Information System
30 MOA Memorandum of Association
40 MoF Ministry of Finance
41 MoRD Ministry of Rural Development
42 MoU Memorandum of Understanding
43 MP Member of Parliament
44 NABARD National Bank for Agriculture and Rural Development
45 NBFC Non-Banking Finance Company
46 NCD Non-Convertible Debenture
47 NGOs Non-Governmental Organizations
48 NIM Net Interest Margin
49 NoF Net Owned Fund
50 NPA Non Performing Asset
51 NRLM National Rural Livelihood Mission
52 OER Operating Expense Ratio
53 OSS Operational Self Sufficiency
54 PAR Portfolio at Risk
55 PPI Progress out of Poverty Index
56 PR Public Relation
57 PSL Priority Sector Lending
58 PSIG Poorest State Inclusive Growth
59 RBI Reserve Bank of India
60 RMK Rashtriya Mahila Kosh
61 RoA Return on Asset
62 RoE Return on Equity
63 RPCD Rural Planning and Credit Department
64 SBLP Self-Help Group Bank Linkage Programme
65 SC/ST Scheduled Caste/Scheduled Tribe
66 SGSY Swarnajayanti Gram Swarozgar Yojana
67 SHGs Self-Help Groups
68 SHPIs Self Help Promoting Institutes
69 SIDBI Small Industries Development Bank of India
70 SRO Self Regulatory Organization
71 WSHGs Women Self Help Groups
xiii
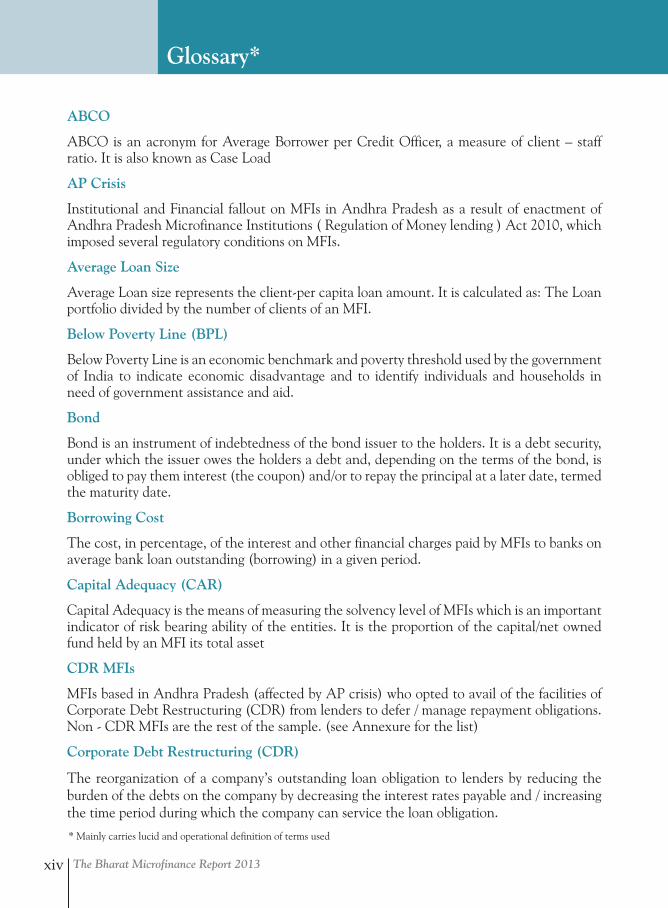
Glossary*
ABCO
ABCO is an acronym for Average Borrower per Credit Officer, a measure of client – staff ratio. It is also known as Case Load
AP Crisis
Institutional and Financial fallout on MFIs in Andhra Pradesh as a result of enactment of Andhra Pradesh Microfinance Institutions ( Regulation of Money lending ) Act 2010, which imposed several regulatory conditions on MFIs.
Average Loan Size
Average Loan size represents the client-per capita loan amount. It is calculated as: The Loan portfolio divided by the number of clients of an MFI.
Below Poverty Line (BPL)
Below Poverty Line is an economic benchmark and poverty threshold used by the government of India to indicate economic disadvantage and to identify individuals and households in need of government assistance and aid.
Bond
Bond is an instrument of indebtedness of the bond issuer to the holders. It is a debt security, under which the issuer owes the holders a debt and, depending on the terms of the bond, is obliged to pay them interest (the coupon) and/or to repay the principal at a later date, termed the maturity date.
Borrowing Cost
The cost, in percentage, of the interest and other financial charges paid by MFIs to banks on average bank loan outstanding (borrowing) in a given period.
Capital Adequacy (CAR)
Capital Adequacy is the means of measuring the solvency level of MFIs which is an important indicator of risk bearing ability of the entities. It is the proportion of the capital/net owned fund held by an MFI its total asset
CDR MFIs
MFIs based in Andhra Pradesh (affected by AP crisis) who opted to avail of the facilities of Corporate Debt Restructuring (CDR) from lenders to defer / manage repayment obligations. Non - CDR MFIs are the rest of the sample. (see Annexure for the list)
Corporate Debt Restructuring (CDR)
The reorganization of a company’s outstanding loan obligation to lenders by reducing the burden of the debts on the company by decreasing the interest rates payable and / increasing the time period during which the company can service the loan obligation.
The Bharat Microfinance Report 2013xiv
* Mainly carries lucid and operational definition of terms used
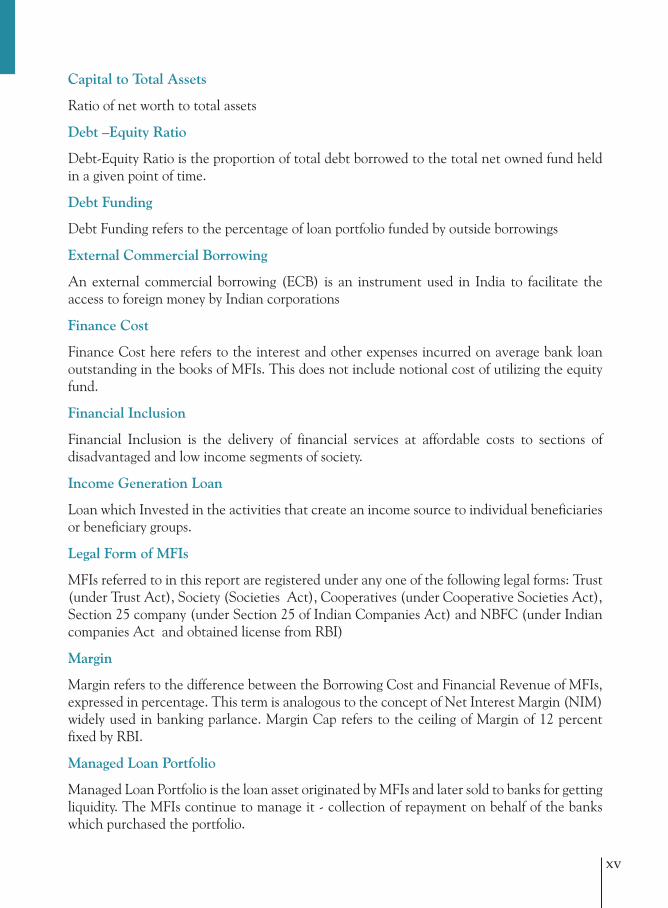
Capital to Total Assets
Ratio of net worth to total assets
Debt –Equity Ratio
Debt-Equity Ratio is the proportion of total debt borrowed to the total net owned fund held in a given point of time.
Debt Funding
Debt Funding refers to the percentage of loan portfolio funded by outside borrowings
External Commercial Borrowing
An external commercial borrowing (ECB) is an instrument used in India to facilitate the access to foreign money by Indian corporations
Finance Cost
Finance Cost here refers to the interest and other expenses incurred on average bank loan outstanding in the books of MFIs. This does not include notional cost of utilizing the equity fund.
Financial Inclusion
Financial Inclusion is the delivery of financial services at affordable costs to sections of disadvantaged and low income segments of society.
Income Generation Loan
Loan which Invested in the activities that create an income source to individual beneficiaries or beneficiary groups.
Legal Form of MFIs
MFIs referred to in this report are registered under any one of the following legal forms: Trust (under Trust Act), Society (Societies Act), Cooperatives (under Cooperative Societies Act), Section 25 company (under Section 25 of Indian Companies Act) and NBFC (under Indian companies Act and obtained license from RBI)
Margin
Margin refers to the difference between the Borrowing Cost and Financial Revenue of MFIs, expressed in percentage. This term is analogous to the concept of Net Interest Margin (NIM) widely used in banking parlance. Margin Cap refers to the ceiling of Margin of 12 percent fixed by RBI.
Managed Loan Portfolio
Managed Loan Portfolio is the loan asset originated by MFIs and later sold to banks for getting liquidity. The MFIs continue to manage it - collection of repayment on behalf of the banks which purchased the portfolio.
xv
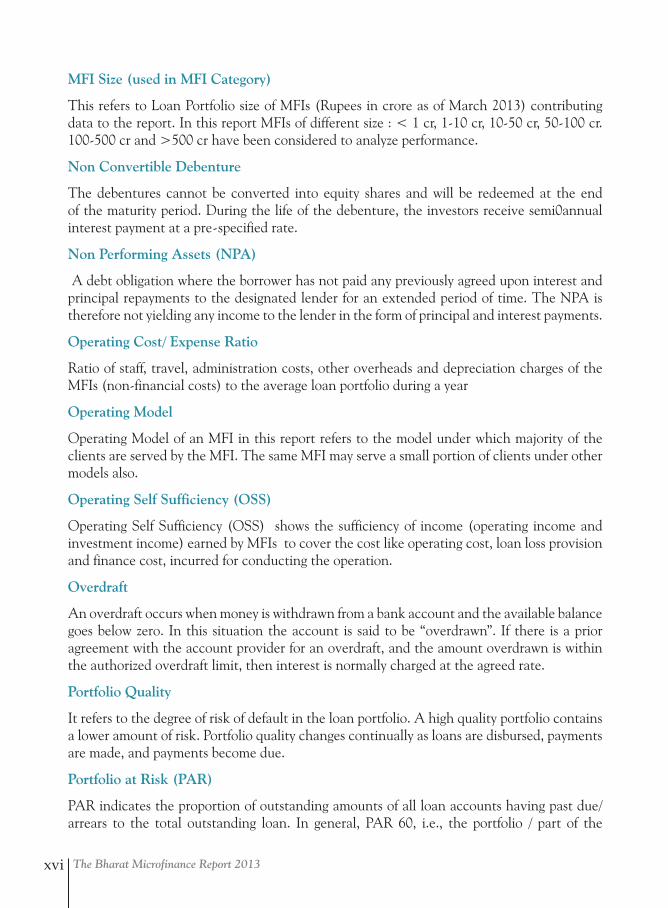
MFI Size (used in MFI Category)
This refers to Loan Portfolio size of MFIs (Rupees in crore as of March 2013) contributing data to the report. In this report MFIs of different size : < 1 cr, 1-10 cr, 10-50 cr, 50-100 cr. 100-500 cr and >500 cr have been considered to analyze performance.
Non Convertible Debenture
The debentures cannot be converted into equity shares and will be redeemed at the end of the maturity period. During the life of the debenture, the investors receive semi0annual interest payment at a pre-specified rate.
Non Performing Assets (NPA)
A debt obligation where the borrower has not paid any previously agreed upon interest and principal repayments to the designated lender for an extended period of time. The NPA is therefore not yielding any income to the lender in the form of principal and interest payments.
Operating Cost/ Expense Ratio
Ratio of staff, travel, administration costs, other overheads and depreciation charges of the MFIs (non-financial costs) to the average loan portfolio during a year
Operating Model
Operating Model of an MFI in this report refers to the model under which majority of the clients are served by the MFI. The same MFI may serve a small portion of clients under other models also.
Operating Self Sufficiency (OSS)
Operating Self Sufficiency (OSS) shows the sufficiency of income (operating income and investment income) earned by MFIs to cover the cost like operating cost, loan loss provision and finance cost, incurred for conducting the operation.
Overdraft
An overdraft occurs when money is withdrawn from a bank account and the available balance goes below zero. In this situation the account is said to be “overdrawn”. If there is a prior agreement with the account provider for an overdraft, and the amount overdrawn is within the authorized overdraft limit, then interest is normally charged at the agreed rate.
Portfolio Quality
It refers to the degree of risk of default in the loan portfolio. A high quality portfolio contains a lower amount of risk. Portfolio quality changes continually as loans are disbursed, payments are made, and payments become due.
Portfolio at Risk (PAR)
PAR indicates the proportion of outstanding amounts of all loan accounts having past due/arrears to the total outstanding loan. In general, PAR 60, i.e., the portfolio / part of the
The Bharat Microfinance Report 2013xvi
portfolio remaining unpaid 60 days and beyond crossing the due date, would be used as a measure to assess the portfolio quality.
Qualifying Assets
Qualifying Assets are loan portfolios created by MFIs adhering to certain conditions to make the MFIs eligible to be called as MFIs and to raise loans from banks under Priority Sector Advances Scheme ( as per recent RBI norms).
Return on Asset (RoA)
Return on Asset (RoA) is the universally accepted profitability measure which, in essence, is the percentage net income earned out of total average asset deployed by MFIs during a given period, say a year.
Return on Equity (RoE)
Return on Equity (RoE) is the net income earned out of average equity of MFIs held by MFIs during the given period.
Self Help Groups (SHGs)
SHGs refer to groups of 10-12 women coming together to form a semi formal community based institution to meet their common financial and social needs.
Securitization
Securitization allows lenders to realize liquidity from future receivables. The ‘originator’ of such transaction transfer sits assets to special purpose vehicle that bundles these assets and repackages them as securities.
SHG Bank Linkage Programme (SBLP)
SHGs are linked to mainstream banks for depositing surplus savings of the SHGs and to obtain loans. It is considered to be an effective strategy to ensure financial inclusion.
Subordinated Debt
Subordinated debt is debt which ranks after other debts should a company fall into liquidation or bankruptcy. Such debt is referred to as ‘subordinate’, because the debt providers (the lenders) have subordinate status in relationship to the normal debt.
Surplus
Net income carried to Balance sheet of MFIs after meeting all cost (including meeting tax obligation)
Yield on Portfolio
Yield represents total income from microcredit operation-Interest income, processing fee/ service charge – earned out of average loan portfolio outstanding. It does not, include investment income. It is a good proxy / surrogate for loan interest rate.
xvii
Executive Summary
The Background and the Context
Microfinance has been recognized as one of the potent tools to address the issue of poverty. The positive outcomes of experiments in SEWA Bank in Gujarat and initiatives of
leading NGOs like MYRADA and PRADAN encouraged the Reserve Bank of India (RBI) and the National Bank for Agriculture and Rural Development (NABARAD) to nurture Self Help Groups ( SHGs) movement. This further led to Self Help Group Bank Linkage Programme (SBLP) commencing in the year 1992. Also, considering the fact that around 50 per cent of working population does not have access to banking services, the RBI recognized Microfinance Institutions (MFIs) as extended arms of banks to reach out to unbanked populace.
As per NABARAD data (2012-13), there are around 73 lakhs Self Help Groups operating in India. An estimated 500 MFIs, most of them operating in southern and eastern regions of the country, borrow funds from banks to on-lend to over 275 lakhs clients across the country.
The microfinance sector is undergoing a phase of transition now. In 2010 , MFIs in Andhra Pradesh state have been affected by Andhra Pradesh Microfinance Institutions (Regulation of Money lending) Act.2010. Consequently, the banks, whose funds constitute about 85 per cent of MFIs lending resources, have slowed down release of loans during the past two years. The growth in client outreach and loan outstanding has retarded during the past two years. This contagion has spread to Self Help Bank Linkage programme also affecting its loan repayment performance. This development is popularly known as Andhra Pradesh Crisis (AP Crisis) in the sector.
In response to the crisis, RBI studied the issues surrounding MFIs in the country through a special committee – Y.H. Malegam Committee and introduced regulatory framework through its circulars, 3 May, 2 December 2011 and 3 August 2012. Through these notifications, RBI has also created a separate category of NBFC-MFIs. Now all NBFC-MFIs are required to register themselves with RBI to continue their operation. Market report says over 30 NBFC-MFIs have received licenses from RBI so far.
The NBFC-MFIs directly and non-NBFC MFIs indirectly are required to comply with the RBI regulation and its Fair Practices code on the one hand and Code of Conduct prescribed by the sector associations on the other. Thus MFIs compliance to these norms is set to safeguard the interest of the poor clients being served by MFIs.
In the meantime Govt. of India introduced the draft Bill, Microfinance Institutions (Regulation and Development) Bill 2012 in Parliament with an intent to bring all the microfinance institutions, including Trust and Society forms under regulatory regime. The Bill is before the Standing Committee of Finance which has completed the public hearing on the provisions of the Bill. The committee is about to submit its report to Parliament/ Ministry.
The Bharat Microfinance Report 2013xviii
These two measures have instilled a sense of confidence among the stakeholders and banks particularly resumed their fund support to MFIs. Banks collectively have over Rs. 16000 crore exposure to the MFIs in the country.
The practitioners in the sector are looking forward to continued bank support for the funds and Microfinance Bill for the regulatory comfort. In the meantime, RBI has sought associations to apply for positions of Self Regulatory Organization (SRO) to facilitate the MFIs to better comply with regulation.
Target Audience for the Bharat Microfinance Report 2013
The report purports to provide a primary-data based analytical information to the government, policy makers, the RBI, banks, and MFIs enabling them to make informed intervention in the sector.
The Data behind the Report
Sa-Dhan as an association collects data from their member organizations, mainly Microfinance institutions, Self Help Promoting Institutions (SHPIs) and Cooperatives. For this report, the data so received from 155 MFIs of all legal forms (Trust, Society, Cooperatives, Section -25 Company and NBFCs) have been collated, validated, analyzed and the results presented in Part 2, 3 and 4 of this report. The distribution of sample of MFIs which reported data is given in Annexure 1. The MFI category used were: Legal form, MFI Loan size ( as of March 2013) and CDR status.
Besides, NABARD data, data and case studies from SHPIs have benn used to carry out qualitative analysis and generate Part 1, 5 and 6 of the report. Secondary data, internal reports and insights have also been used to generate certain sections of the report.
The project team scrupulously scrutinized the self-reported data of the MFIs to improve the data quality through three rounds of validation- scrutiny of financial statements, calling the MFIs, wherever prima facie discrepancies are found, to confirm and sending the preliminary findings / ratios to contributing MFIs to validate / confirm the data. The team also reconciled NBFC data with that of MFIN data sets. The validity of the findings, however, is subject to the accuracy of the self –reported data, though the reconciliation techniques mentioned above would have minimized the data errors to the bare minimum.
The relevance of the findings has been improved to the extent possible through several rounds of consultation with the Advisory Group members who are industry leaders and practitioners.
The Report Coverage
Part 1 highlights the role of microfinance in financial inclusion. Part 2 covers MFI-outreach and loan portfolio. Part 3 discusses the Institutional and financial aspects of MFI operation. Part 4 deals with funding of MFIs and Part 5 introduces the Self Regulatory initiatives in the sector. For the first time in the report series, an elaborate account on Community based Microfinance organizations – like SHGs, Federations, Cooperatives and Self Help Promoting Institutions – is given in Part 6.
xix
Summary of the Report
On Microfinance and Financial inclusion
Microfinance has been the key intervention in the financial inclusion space, though its role is yet to be fully appreciated. Self Help Bank Linkage programme purveys bank credit to the mass that do not have any access to banking service. Similarly, the MFIs use bank funds to offer credit to the same kind of unreached people in the villages. They offer services to SC/ST and minority clients. They also offer variety of products- savings, insurance, pension, and livelihood, health and education services.
On MFI Outreach and Loan Portfolio
The MFIs reach out to poor clients residing in 573 districts across 33 states of the country. The spread of operation in excluded north and east is a positive development. The MFI loan portfolio has reached an all-time high in 2013 (Rs.22300 crore), after a slump in the previous two years. Loans are increasingly being made available to income generation purposes, fully complying with RBI stipulation.
On MFI Institutional and Financial aspects
The MFIs have embraced consolidation approach to overcome the crisis situation. They reduced their infrastructure in terms of staff and branches. The staff turnover is high that has to be tackled to reduce staff training cost. Loan Portfolio quality is good, except in case of seen Corporate Debt Restructuring (CDR) MFIs who has the base in microfinance-beleaguered Andhra Pradesh. Total operation cost of MFIs shot up because of high loan loss provision made by MFIs especially among CDR MFIs. The operating cost ratio, however, is under control. MFIs earnings and expenditure are compliant with RBI norm, though their profitability is under stress.
On Funding MFIs
Bank borrowing is the sole resource for MFIs to fund their portfolio. Dwindling share of public sector bank lending to MFIs is an area of concern. Banks, in general, have positive notion on supporting MFIs and MFIs contribution to the priority sector lending. Their credit appraisal norms to fund MFIs have undergone significant change. The role of Bulk Lenders is very crucial for funding MFIs.
On Self Regulation
Sa-Dhan had been taking proactive steps in the self regulation starting from introduction of voluntary code of conduct in 2007. Amendment to Sa-Dhan Memorandum of Association (MoA) infusing additional powers to the association to deal with erring members, constitution of Ethics and Grievance Redressal Committee ( EGRC), etc are the other steps taken in this respect. The regulation from RBI has further strengthened the self-regulation efforts. The RBI regulation workshops, release of Handbook on RBI regulation for the benefit of MFIs, Code of Conduct validation exercise, etc. are the other Sa-Dhan efforts during the recent
The Bharat Microfinance Report 2013xx
past. Sa-Dhan is seeking RBI approval to act as SRO. This is expected to bring in further impetus to self regulation.
On Community Based Microfinance Organizations
The slackness in Self Help Group Bank Linkage Programme (SBLP) as evident from decline in number of SHGs, increase in Non Performing Assets (NPA) is a source of concern. NABARD and banks will have to involve Self Help Promoting Institutions (SHPIs) in a big way for reversing the trend.
SHPIs have played a very key role in conceiving and giving momentum to SHG movement. Yet, there are multiple challenges facing SHGs, their federations and SHPIs. There is widespread issue on group quality, funding SHPIs, Bank Linkage, getting loans for SHGs, etc. which warrant urgent attention.
Cooperatives are the only form of MFIs which offer savings service to the low income members. Through addressing issues like governance and managerial efficiency that often affect such institutions, cooperatives could be evolved as robust community based economic organizations.
xxi

Microfinance and Financial Inclusion 1
Microfinance and Financial InclusionPart 1
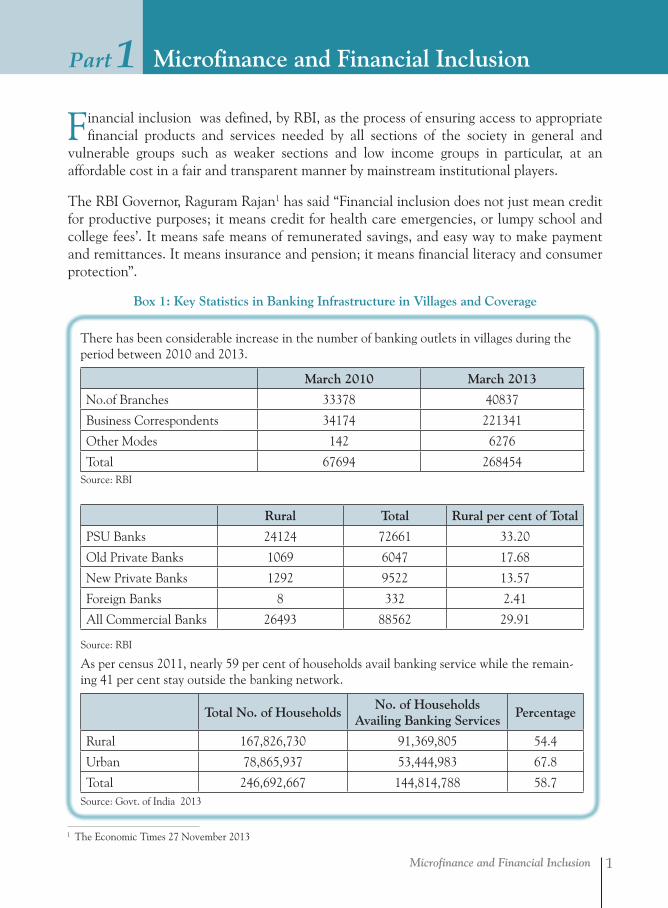
Financial inclusion was defined, by RBI, as the process of ensuring access to appropriate financial products and services needed by all sections of the society in general and
vulnerable groups such as weaker sections and low income groups in particular, at an affordable cost in a fair and transparent manner by mainstream institutional players.
The RBI Governor, Raguram Rajan1 has said “Financial inclusion does not just mean credit for productive purposes; it means credit for health care emergencies, or lumpy school and college fees’. It means safe means of remunerated savings, and easy way to make payment and remittances. It means insurance and pension; it means financial literacy and consumer protection”.
Box 1: Key Statistics in Banking Infrastructure in Villages and Coverage
There has been considerable increase in the number of banking outlets in villages during the period between 2010 and 2013.
March 2010 March 2013
No.of Branches 33378 40837
Business Correspondents 34174 221341
Other Modes 142 6276
Total 67694 268454Source: RBI
Rural Total Rural per cent of Total
PSU Banks 24124 72661 33.20
Old Private Banks 1069 6047 17.68
New Private Banks 1292 9522 13.57
Foreign Banks 8 332 2.41
All Commercial Banks 26493 88562 29.91
Source: RBI
As per census 2011, nearly 59 per cent of households avail banking service while the remain-ing 41 per cent stay outside the banking network.
Total No. of HouseholdsNo. of Households
Availing Banking Services Percentage
Rural 167,826,730 91,369,805 54.4
Urban 78,865,937 53,444,983 67.8
Total 246,692,667 144,814,788 58.7
1 The Economic Times 27 November 2013
Source: Govt. of India 2013
The Bharat Microfinance Report 20132
1.1 Microfinance Complementing Banks
The problem of banking access empirically shown in Box 1 is exacerbated when it comes to the poor people. The poor are always in a dilemma as far as financial services is concerned. Their problems for accessing formal banking services relate to collateral, distance from the bank branch, transportation expenses, potential wage loss during visiting / waiting period, cumbersome paper work, bankers approach, etc. Services from informal sources, on the other hand, are costly and exploitative.
Problem persists for the poor with respect to other financial products as well. According to the nation-wide survey carried out by IISS (India Incomes and Savings Survey, 2007), 97 per cent of all household do not have any health insurance and 61 per cent do not have any life insurance. According to NSSO surveys, roughly 25 per cent of households get into chronic indebtedness because of health related emergencies.
Since financial services are provided by market, both supply (financial inclusion) and demand (financial literacy) side consideration are important. There is need for institutions closer and approachable to the people and are reliable and non-exploitative.
Microfinance is an innovation in providing financial services to the excluded segment of the society. The microfinance practice, per se, addresses the lacunae associated with both formal and purely informal sources of financial services. The essential features of microcredit, for example, are:
i. The borrowers are low-income households.
ii. The loan size is small enough to suit the unbanked and poor borrowers.
iii. The loans are without collateral.
iv. The loans are generally taken for income-generating activities, although loans are also provided for consumption, housing and other purposes.
v. The tenure of the loans is short.
vi. The frequency of repayments is higher than, say weekly/fortnightly.
Microfinance and Financial Inclusion 3
1.2 GOI and RBI stand on Microfinance Role and Financial Inclusion
The then Finance Minister Sri. Pranab Mukherjee said the following in his budget speech 2011:
Microfinance Institutions (MFIs) have emerged as an important means of financial inclusion. Creation of dedicated fund for providing equity to smaller MFIs would help them maintain growth and achieve scale and efficiency in operations. I propose to create in the course of the year, ‘India Microfinance Equity Fund’ of Rs.100 crore with SIDBI . To empower women and promote their Self Help Group (SHGs), I propose to create a ‘women’s SHG’s Development Fund’ with corpus of Rs.500 crore. The committee set up by RBI to look into issues relating to microfinance sector in India has submitted its report. The Government is considering putting in place appropriate framework to protect the interest of small borrowers.
The Finance Minister recognized the crucial role played MFIs and SHGs as quoted above.Besides, the finance ministry has proposed The Microfinance Institutions (Development and Regulation) Microfinance Bill 2012 to regulate the MFI-sector. The Bill 2012 is a significant move in achieving the agenda of financial inclusion as it provides detailed regulatory framework for microfinance sector. The bill is before Parliament Standing Committee which has sought opinion of stakeholders including Sa-Dhan and the committee is about to submit its report.
Reserve Bank of India looks at core indicators which place a given population on the continuum of financial access, depending on its usage of formal, semi-formal, and informal financial services and those excluded from the use of financial services2. In particular the indicators are:
o the proportion of the population that uses a bank or bank like institution;
o the population which uses service from non-bank ‘other formal’ financial institutions, but does not use bank services;
o the population which only uses services from informal financial service providers
o the population which uses no financial services.
MFIs belong to non-bank ‘other formal’ financial institutions, providing services to people at the distal end of the access continuum.
Reserve Bank of India further clarifies that the degree of financial inclusion can be measured by looking into services offered. The services may be:
o Transactions or payment services
o savings (deposit) and investment services
o loan or credit services
o Risk transformation services such as insurance.
2 RBI (2009) Report on currency and Finance 2008
The Bharat Microfinance Report 20134
MFIs offer loan or credit services through small value, high volume transactions with unbanked population, facilitate savings among them by acting as Business Correspondents of banks, among Self Help Groups by linking them with banks, extend insurance services as agents of insurance service providers and offer money transfer services to migrant workers.
Reserve Bank of India patronizes MFIs, keeping the financial inclusion agenda of MFIs in view. RBI included bank lending to MFIs as priority sector credit which helped MFIs to source resources to on-lend to low end clients. Introduction of NBFC MFI category amplify further RBI commitment to the sector.
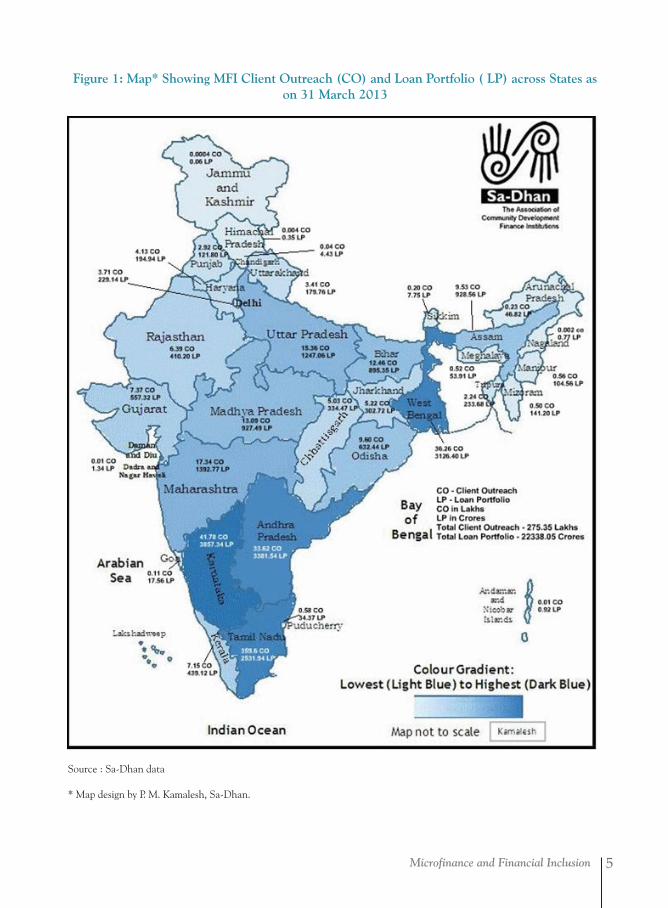
1.3 Microfinance Outreach
MFIs render their services in 28 States and five Union Territories of India. MFIs have a presence in 573 districts of the country and providing financial services. The MFI Map of India depicted in Figure-1 shows the numbers of MFI clients present (Client Outreach–CO) and loan portfolio (Loan Portfolio-LP) held in different states, with color gradients indicating the comparative concentration of state figures under the client outreach indicator.
The map shows the MFIs have services in priority states viz., West Bengal, Odisha, Chhattisgarh, Madhya Pradesh, Assam, Uttar Pradesh, Bihar and Rajasthan, apart from pioneering southern states.
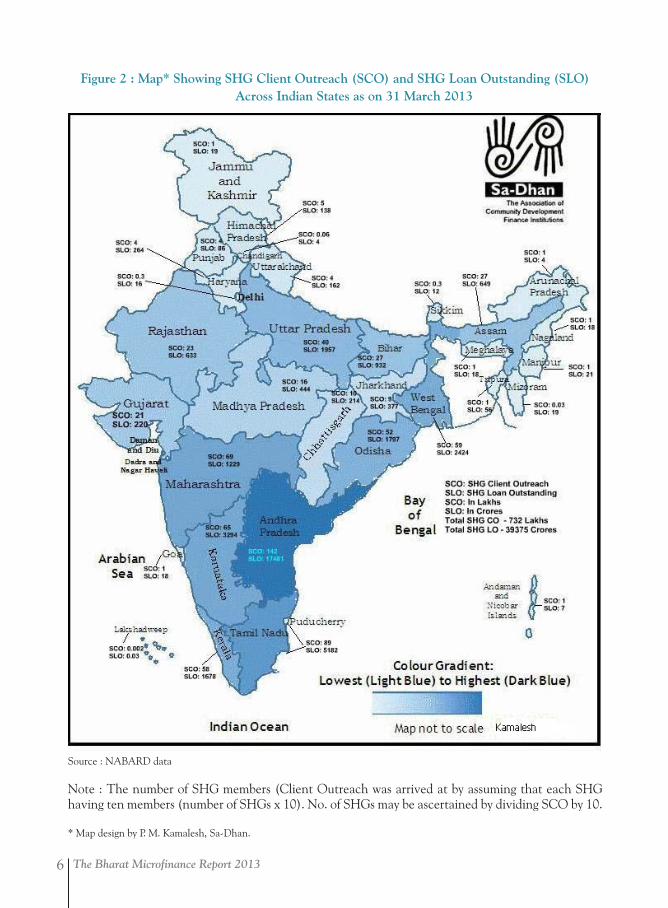
Figure-2, similarly, carries the image of Indian states with data on savings-linked SHG members and loan outstanding. The number of SHG members was arrived at by assuming that each SHG having ten members (number of SHG x 10). SHG concentration is high in southern states while it is relatively less in northern regions. The state wise statistics on SHG transactions is furnished in Part 6.
Microfinance and Financial Inclusion 5
Figure 1: Map* Showing MFI Client Outreach (CO) and Loan Portfolio ( LP) across States as on 31 March 2013
Source : Sa-Dhan data
* Map design by P. M. Kamalesh, Sa-Dhan.
The Bharat Microfinance Report 20136
Figure 2 : Map* Showing SHG Client Outreach (SCO) and SHG Loan Outstanding (SLO)Across Indian States as on 31 March 2013
Source : NABARD data
Note : The number of SHG members (Client Outreach was arrived at by assuming that each SHG having ten members (number of SHGs x 10). No. of SHGs may be ascertained by dividing SCO by 10.
* Map design by P. M. Kamalesh, Sa-Dhan.
Microfinance and Financial Inclusion 7
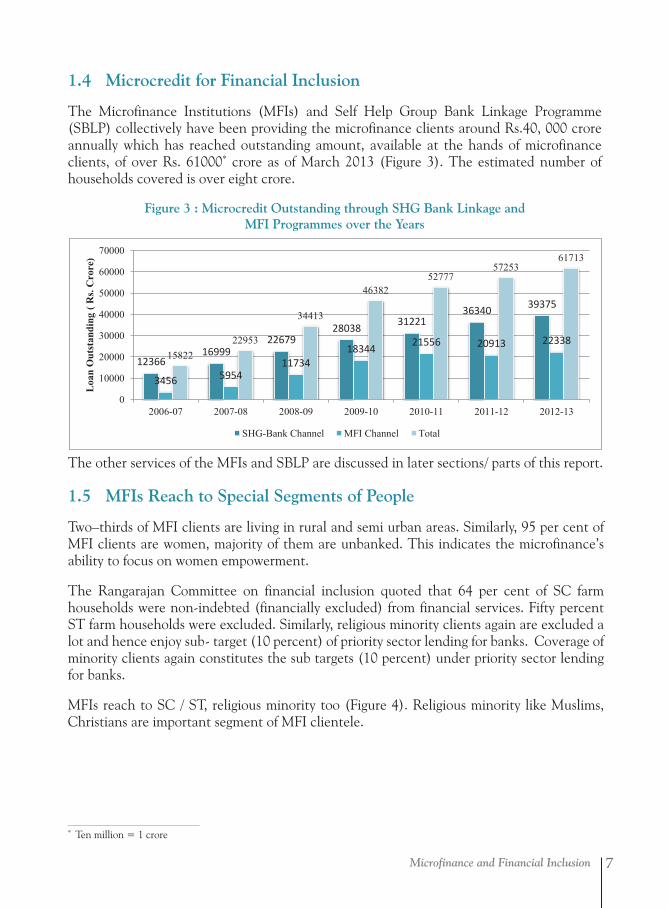
1.4 Microcredit for Financial Inclusion
The Microfinance Institutions (MFIs) and Self Help Group Bank Linkage Programme (SBLP) collectively have been providing the microfinance clients around Rs.40, 000 crore annually which has reached outstanding amount, available at the hands of microfinance clients, of over Rs. 61000* crore as of March 2013 (Figure 3). The estimated number of households covered is over eight crore.
Figure 3 : Microcredit Outstanding through SHG Bank Linkage andMFI Programmes over the Years
12366 16999
22679 28038 31221
36340 39375
3456 5954 11734
18344 21556 20913 22338 15822
22953
34413
46382 52777
57253 61713
0
10000
20000
30000
40000
50000
60000
70000
2006-07 2007-08 2008-09 2009-10 2010-11 2011-12 2012-13
Loa
n O
utst
andi
ng (
Rs.
Cro
re)
SHG-Bank Channel MFI Channel Total
The other services of the MFIs and SBLP are discussed in later sections/ parts of this report.
1.5 MFIs Reach to Special Segments of People
Two–thirds of MFI clients are living in rural and semi urban areas. Similarly, 95 per cent of MFI clients are women, majority of them are unbanked. This indicates the microfinance’s ability to focus on women empowerment.
The Rangarajan Committee on financial inclusion quoted that 64 per cent of SC farm households were non-indebted (financially excluded) from financial services. Fifty percent ST farm households were excluded. Similarly, religious minority clients again are excluded a lot and hence enjoy sub- target (10 percent) of priority sector lending for banks. Coverage of minority clients again constitutes the sub targets (10 percent) under priority sector lending for banks.
MFIs reach to SC / ST, religious minority too (Figure 4). Religious minority like Muslims, Christians are important segment of MFI clientele.
* Ten million = 1 crore
The Bharat Microfinance Report 20138
Box 2 Poorest States Inclusive Growth (PSIG) Programme
There have been special efforts to give impetus to northern states, given the less concentration of microfinance activities there. Incidentally poverty in these states is relatively higher. SIDBI, with support of DFID, UK, has been implementing Poorest States Inclusive Growth (PSIG) programme in priority states. A brief note on this PSIG is given below:
SIDBI has been awarded the contract for Design and Implementation of PSIG programme by DFID, UK. The programme aims to enhance the income and employment opportunities of poor women and men in 8 low income States by enabling them to participate and benefit from wider economic growth in India. The purpose of the programme is to improve income, and reduce vulnerability, of poor people and small producers, by expanding their access to finance and markets.
PSIG has two separate, interlinked components:
Component 1 - Financial Inclusion and women’s empowerment: The programme (duration of 6 years) shall improve access for poor men and women to a variety of financial services in the 4 low income states (Bihar, Orissa, Madhya Pradesh and Uttar Pradesh ) and will: a) facilitate financial services institutions, including banks and MFIs, to provide services for poor people in geographical areas to which they would not otherwise go by providing patient capital, guarantees or technical assistance, as appropriate; b) supplement microfinance programmes with training for women to improve their knowledge and confidence in financial services c) facilitate studies, set up high level think tanks and feed into improving the policy environment for microfinance and improving overall business environment in the Low Income states; and d) fund commercially sustainable approaches that demonstrate responsible client practices and complement Government of India programmes.
Component I would have three outputs as under:
Policy and institutional environment that encourages provision of financial services to poor people in a responsible manner facilitated Institutions providing diverse financial services promoted
Women’s capacities to tackle financial and gender issues enhanced
Component 2: Impact Investments: The programme funds will be spent on promoting businesses that increase the income of, or services to, the poor in 8 low income Indian states (Bihar, Orissa, Madhya Pradesh, Uttar Pradesh, Chhattisgarh, Jharkhand, Rajasthan and West Bengal). The programme funds will provide capital or guarantees to businesses which have the potential to benefit poor people, but which do not attract private capital even though they are judged to be financially viable. The investments will be judged on social and environmental performance in addition to financial risk and return, and will be in the form of debt, equity, venture capital and guarantees.
PSIG is expected to leverage private sector financial and technical resources to reach up to 12 million direct and indirect beneficiaries. The programme’s investments in enterprises in the 8 poorest states will result in better opportunities for the poor to benefit as producers, consumers or skill providers.
Source: SIDBI
Microfinance and Financial Inclusion 9
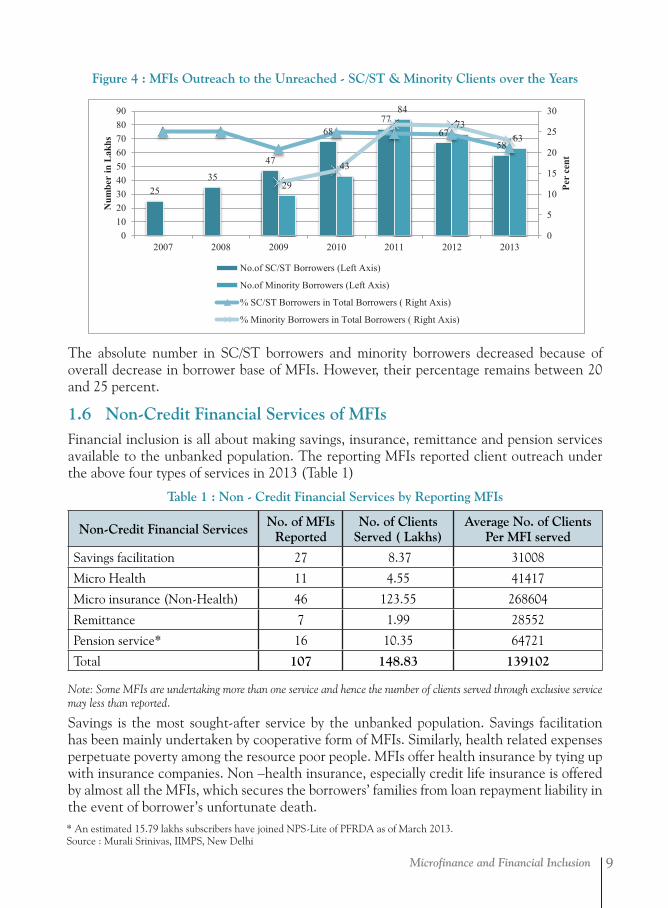
Figure 4 : MFIs Outreach to the Unreached - SC/ST & Minority Clients over the Years
The absolute number in SC/ST borrowers and minority borrowers decreased because of overall decrease in borrower base of MFIs. However, their percentage remains between 20 and 25 percent.
1.6 Non-Credit Financial Services of MFIs Financial inclusion is all about making savings, insurance, remittance and pension services available to the unbanked population. The reporting MFIs reported client outreach under the above four types of services in 2013 (Table 1)
Table 1 : Non - Credit Financial Services by Reporting MFIs
Non-Credit Financial Services No. of MFIs Reported
No. of Clients Served ( Lakhs)
Average No. of Clients Per MFI served
Savings facilitation 27 8.37 31008
Micro Health 11 4.55 41417
Micro insurance (Non-Health) 46 123.55 268604
Remittance 7 1.99 28552
Pension service* 16 10.35 64721
Total 107 148.83 139102
Note: Some MFIs are undertaking more than one service and hence the number of clients served through exclusive service may less than reported.
Savings is the most sought-after service by the unbanked population. Savings facilitation has been mainly undertaken by cooperative form of MFIs. Similarly, health related expenses perpetuate poverty among the resource poor people. MFIs offer health insurance by tying up with insurance companies. Non –health insurance, especially credit life insurance is offered by almost all the MFIs, which secures the borrowers’ families from loan repayment liability in the event of borrower’s unfortunate death.
25 35
47
68 77
67 58
29
43
84 73
63
0
5
10
15
20
25
30
0102030405060708090
2007 2008 2009 2010 2011 2012 2013
Per
cent
Num
ber
in L
akhs
No.of SC/ST Borrowers (Left Axis)
No.of Minority Borrowers (Left Axis)
% SC/ST Borrowers in Total Borrowers ( Right Axis)
% Minority Borrowers in Total Borrowers ( Right Axis)
* An estimated 15.79 lakhs subscribers have joined NPS-Lite of PFRDA as of March 2013. Source : Murali Srinivas, IIMPS, New Delhi
The Bharat Microfinance Report 201310
Money transfer/remittance service is critical for migrant workers to send money back home to their families. Access to banking services in urban areas is generally good; and yet most migrant workers do not have a bank account at the urban destination points where they are working. Many migrant workers do not have adequate information about formal financial services, and many of those who have accounts with banks do not use them effectively. MFIs provide remittance service through making suitable arrangements with banks.
All the workers of unorganized sector are deprived of pension as an old age security. MFIs have become aggregators of pension remittance to the Pension Schemes regulated by Pension and Regulatory and Development Authority (PFRDA).
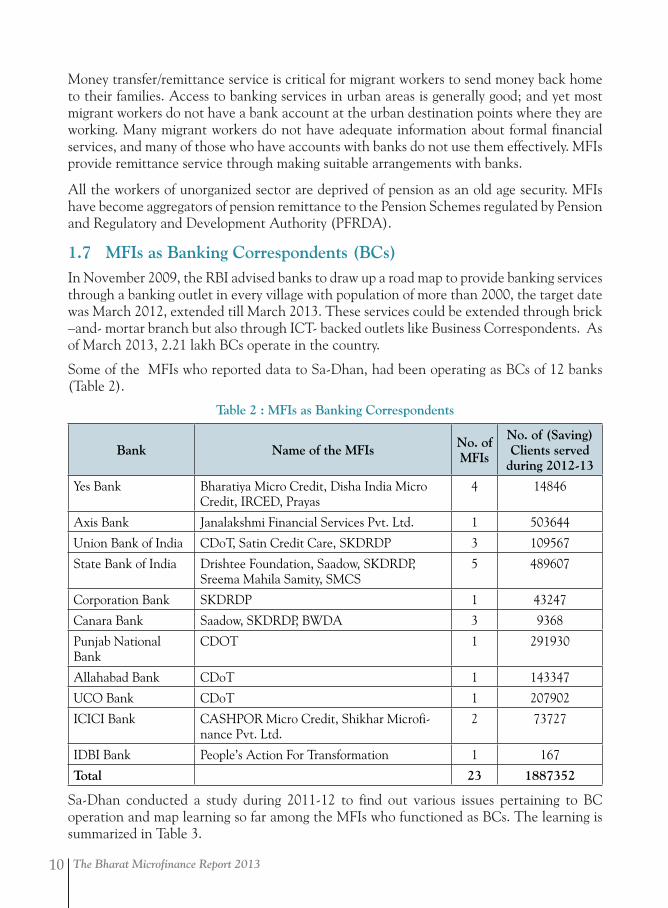
1.7 MFIs as Banking Correspondents (BCs)In November 2009, the RBI advised banks to draw up a road map to provide banking services through a banking outlet in every village with population of more than 2000, the target date was March 2012, extended till March 2013. These services could be extended through brick –and- mortar branch but also through ICT- backed outlets like Business Correspondents. As of March 2013, 2.21 lakh BCs operate in the country.
Some of the MFIs who reported data to Sa-Dhan, had been operating as BCs of 12 banks (Table 2).
Table 2 : MFIs as Banking Correspondents
Bank Name of the MFIs No. of MFIs
No. of (Saving) Clients served
during 2012-13
Yes Bank Bharatiya Micro Credit, Disha India Micro Credit, IRCED, Prayas
4 14846
Axis Bank Janalakshmi Financial Services Pvt. Ltd. 1 503644
Union Bank of India CDoT, Satin Credit Care, SKDRDP 3 109567
State Bank of India Drishtee Foundation, Saadow, SKDRDP, Sreema Mahila Samity, SMCS
5 489607
Corporation Bank SKDRDP 1 43247
Canara Bank Saadow, SKDRDP, BWDA 3 9368
Punjab National Bank
CDOT 1 291930
Allahabad Bank CDoT 1 143347
UCO Bank CDoT 1 207902
ICICI Bank CASHPOR Micro Credit, Shikhar Microfi-nance Pvt. Ltd.
2 73727
IDBI Bank People’s Action For Transformation 1 167
Total 23 1887352
Sa-Dhan conducted a study during 2011-12 to find out various issues pertaining to BC operation and map learning so far among the MFIs who functioned as BCs. The learning is summarized in Table 3.
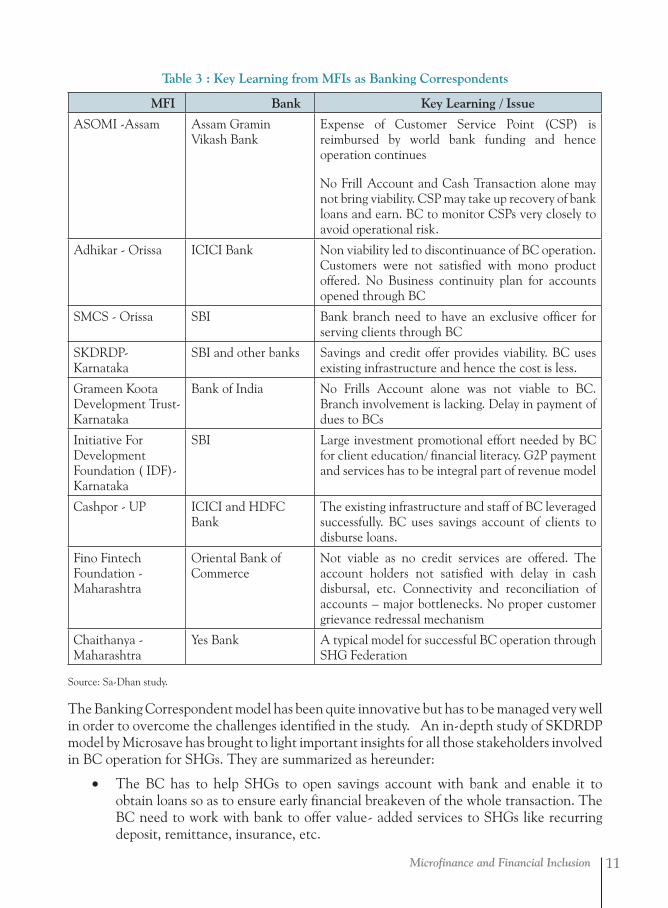
Microfinance and Financial Inclusion 11
Table 3 : Key Learning from MFIs as Banking Correspondents
MFI Bank Key Learning / Issue
ASOMI -Assam Assam Gramin Vikash Bank
Expense of Customer Service Point (CSP) is reimbursed by world bank funding and hence operation continues
No Frill Account and Cash Transaction alone may not bring viability. CSP may take up recovery of bank loans and earn. BC to monitor CSPs very closely to avoid operational risk.
Adhikar - Orissa ICICI Bank Non viability led to discontinuance of BC operation. Customers were not satisfied with mono product offered. No Business continuity plan for accounts opened through BC
SMCS - Orissa SBI Bank branch need to have an exclusive officer for serving clients through BC
SKDRDP-Karnataka
SBI and other banks Savings and credit offer provides viability. BC uses existing infrastructure and hence the cost is less.
Grameen Koota Development Trust- Karnataka
Bank of India No Frills Account alone was not viable to BC. Branch involvement is lacking. Delay in payment of dues to BCs
Initiative For Development Foundation ( IDF)-Karnataka
SBI Large investment promotional effort needed by BC for client education/ financial literacy. G2P payment and services has to be integral part of revenue model
Cashpor - UP ICICI and HDFC Bank
The existing infrastructure and staff of BC leveraged successfully. BC uses savings account of clients to disburse loans.
Fino Fintech Foundation - Maharashtra
Oriental Bank of Commerce
Not viable as no credit services are offered. The account holders not satisfied with delay in cash disbursal, etc. Connectivity and reconciliation of accounts – major bottlenecks. No proper customer grievance redressal mechanism
Chaithanya - Maharashtra
Yes Bank A typical model for successful BC operation through SHG Federation
Source: Sa-Dhan study.
The Banking Correspondent model has been quite innovative but has to be managed very well in order to overcome the challenges identified in the study. An in-depth study of SKDRDP model by Microsave has brought to light important insights for all those stakeholders involved in BC operation for SHGs. They are summarized as hereunder:
• The BC has to help SHGs to open savings account with bank and enable it to obtain loans so as to ensure early financial breakeven of the whole transaction. The BC need to work with bank to offer value- added services to SHGs like recurring deposit, remittance, insurance, etc.
The Bharat Microfinance Report 201312
• SHPI- leadership is very critical to engage multiple stakeholders to take forward the BC operation.
• The BC need to prepare the bank in terms of understanding the grass root level challenges and transactions. The bank will have to devote committed branch team for taking care of the BC business.
• The BC need to obtain the due commission from the bank for various transactions and monitoring service rendered by it on time to make the BC operation sustainable.
• The field-focus is very vital for the successful BC operation. The feedback from clients and their satisfaction should drive continuous improvement of the product / process.
• Staff choice, training and motivation are equally important areas deserving the attention of BC. The BC staff quality and their relationship with bank staff may make or break BC system.
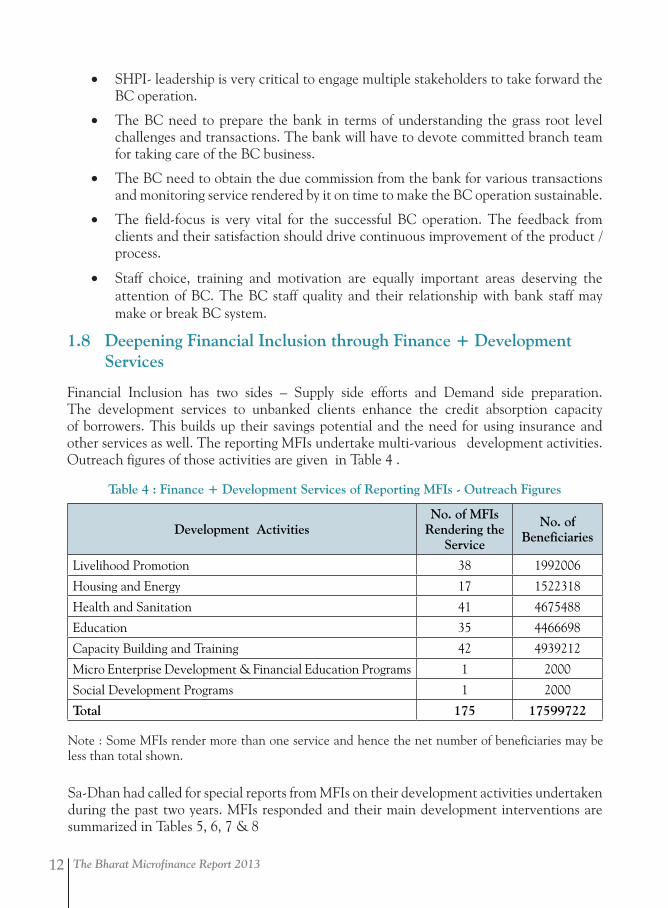
1.8 Deepening Financial Inclusion through Finance + Development Services
Financial Inclusion has two sides – Supply side efforts and Demand side preparation. The development services to unbanked clients enhance the credit absorption capacity of borrowers. This builds up their savings potential and the need for using insurance and other services as well. The reporting MFIs undertake multi-various development activities. Outreach figures of those activities are given in Table 4 .
Table 4 : Finance + Development Services of Reporting MFIs - Outreach Figures
Development ActivitiesNo. of MFIs
Rendering the Service
No. of Beneficiaries
Livelihood Promotion 38 1992006
Housing and Energy 17 1522318
Health and Sanitation 41 4675488
Education 35 4466698
Capacity Building and Training 42 4939212
Micro Enterprise Development & Financial Education Programs 1 2000
Social Development Programs 1 2000
Total 175 17599722
Note : Some MFIs render more than one service and hence the net number of beneficiaries may be less than total shown.
Sa-Dhan had called for special reports from MFIs on their development activities undertaken during the past two years. MFIs responded and their main development interventions are summarized in Tables 5, 6, 7 & 8
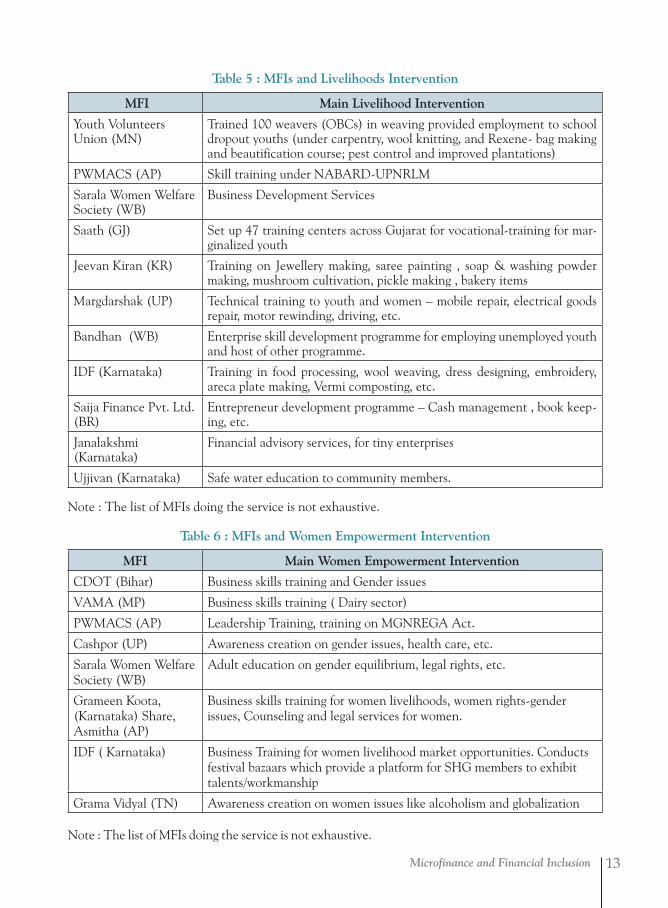
Microfinance and Financial Inclusion 13
Table 5 : MFIs and Livelihoods Intervention
MFI Main Livelihood Intervention
Youth Volunteers Union (MN)
Trained 100 weavers (OBCs) in weaving provided employment to school dropout youths (under carpentry, wool knitting, and Rexene- bag making and beautification course; pest control and improved plantations)
PWMACS (AP) Skill training under NABARD-UPNRLM
Sarala Women Welfare Society (WB)
Business Development Services
Saath (GJ) Set up 47 training centers across Gujarat for vocational-training for mar-ginalized youth
Jeevan Kiran (KR) Training on Jewellery making, saree painting , soap & washing powder making, mushroom cultivation, pickle making , bakery items
Margdarshak (UP) Technical training to youth and women – mobile repair, electrical goods repair, motor rewinding, driving, etc.
Bandhan (WB) Enterprise skill development programme for employing unemployed youth and host of other programme.
IDF (Karnataka) Training in food processing, wool weaving, dress designing, embroidery, areca plate making, Vermi composting, etc.
Saija Finance Pvt. Ltd. (BR)
Entrepreneur development programme – Cash management , book keep-ing, etc.
Janalakshmi (Karnataka)
Financial advisory services, for tiny enterprises
Ujjivan (Karnataka) Safe water education to community members.
Note : The list of MFIs doing the service is not exhaustive.
Table 6 : MFIs and Women Empowerment Intervention
MFI Main Women Empowerment Intervention
CDOT (Bihar) Business skills training and Gender issues
VAMA (MP) Business skills training ( Dairy sector)
PWMACS (AP) Leadership Training, training on MGNREGA Act.
Cashpor (UP) Awareness creation on gender issues, health care, etc.
Sarala Women Welfare Society (WB)
Adult education on gender equilibrium, legal rights, etc.
Grameen Koota, (Karnataka) Share, Asmitha (AP)
Business skills training for women livelihoods, women rights-gender issues, Counseling and legal services for women.
IDF ( Karnataka) Business Training for women livelihood market opportunities. Conducts festival bazaars which provide a platform for SHG members to exhibit talents/workmanship
Grama Vidyal (TN) Awareness creation on women issues like alcoholism and globalization
Note : The list of MFIs doing the service is not exhaustive.
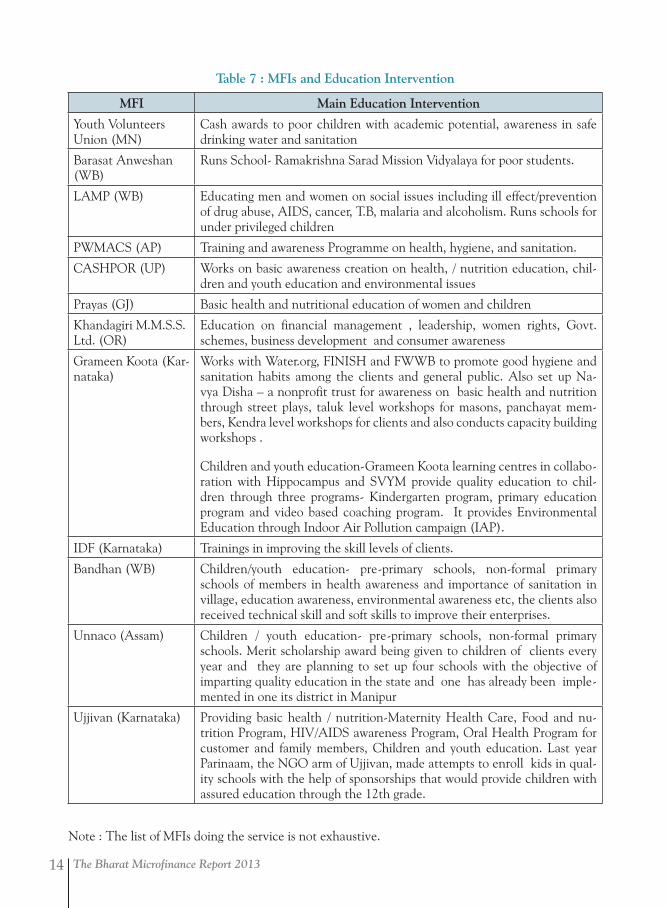
The Bharat Microfinance Report 201314
Table 7 : MFIs and Education Intervention
MFI Main Education Intervention
Youth Volunteers Union (MN)
Cash awards to poor children with academic potential, awareness in safe drinking water and sanitation
Barasat Anweshan (WB)
Runs School- Ramakrishna Sarad Mission Vidyalaya for poor students.
LAMP (WB) Educating men and women on social issues including ill effect/prevention of drug abuse, AIDS, cancer, T.B, malaria and alcoholism. Runs schools for under privileged children
PWMACS (AP) Training and awareness Programme on health, hygiene, and sanitation.
CASHPOR (UP) Works on basic awareness creation on health, / nutrition education, chil-dren and youth education and environmental issues
Prayas (GJ) Basic health and nutritional education of women and children
Khandagiri M.M.S.S. Ltd. (OR)
Education on financial management , leadership, women rights, Govt. schemes, business development and consumer awareness
Grameen Koota (Kar-nataka)
Works with Water.org, FINISH and FWWB to promote good hygiene and sanitation habits among the clients and general public. Also set up Na-vya Disha – a nonprofit trust for awareness on basic health and nutrition through street plays, taluk level workshops for masons, panchayat mem-bers, Kendra level workshops for clients and also conducts capacity building workshops .
Children and youth education-Grameen Koota learning centres in collabo-ration with Hippocampus and SVYM provide quality education to chil-dren through three programs- Kindergarten program, primary education program and video based coaching program. It provides Environmental Education through Indoor Air Pollution campaign (IAP).
IDF (Karnataka) Trainings in improving the skill levels of clients.
Bandhan (WB) Children/youth education- pre-primary schools, non-formal primary schools of members in health awareness and importance of sanitation in village, education awareness, environmental awareness etc, the clients also received technical skill and soft skills to improve their enterprises.
Unnaco (Assam) Children / youth education- pre-primary schools, non-formal primary schools. Merit scholarship award being given to children of clients every year and they are planning to set up four schools with the objective of imparting quality education in the state and one has already been imple-mented in one its district in Manipur
Ujjivan (Karnataka) Providing basic health / nutrition-Maternity Health Care, Food and nu-trition Program, HIV/AIDS awareness Program, Oral Health Program for customer and family members, Children and youth education. Last year Parinaam, the NGO arm of Ujjivan, made attempts to enroll kids in qual-ity schools with the help of sponsorships that would provide children with assured education through the 12th grade.
Note : The list of MFIs doing the service is not exhaustive.
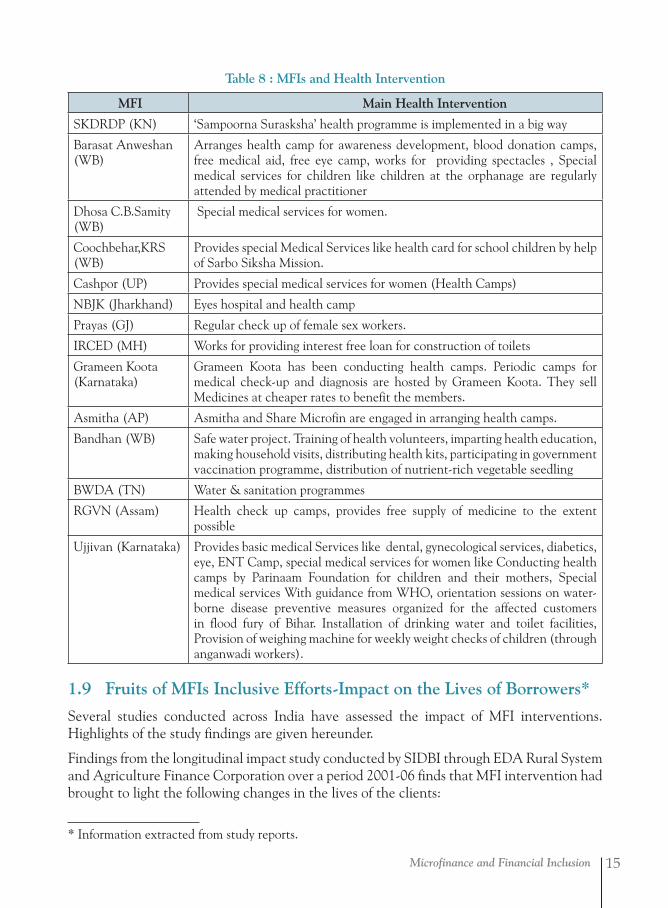
Microfinance and Financial Inclusion 15
Table 8 : MFIs and Health Intervention
MFI Main Health Intervention
SKDRDP (KN) ‘Sampoorna Surasksha’ health programme is implemented in a big way
Barasat Anweshan (WB)
Arranges health camp for awareness development, blood donation camps, free medical aid, free eye camp, works for providing spectacles , Special medical services for children like children at the orphanage are regularly attended by medical practitioner
Dhosa C.B.Samity (WB)
Special medical services for women.
Coochbehar,KRS (WB)
Provides special Medical Services like health card for school children by help of Sarbo Siksha Mission.
Cashpor (UP) Provides special medical services for women (Health Camps)
NBJK (Jharkhand) Eyes hospital and health camp
Prayas (GJ) Regular check up of female sex workers.
IRCED (MH) Works for providing interest free loan for construction of toilets
Grameen Koota (Karnataka)
Grameen Koota has been conducting health camps. Periodic camps for medical check-up and diagnosis are hosted by Grameen Koota. They sell Medicines at cheaper rates to benefit the members.
Asmitha (AP) Asmitha and Share Microfin are engaged in arranging health camps.
Bandhan (WB) Safe water project. Training of health volunteers, imparting health education, making household visits, distributing health kits, participating in government vaccination programme, distribution of nutrient-rich vegetable seedling
BWDA (TN) Water & sanitation programmes
RGVN (Assam) Health check up camps, provides free supply of medicine to the extent possible
Ujjivan (Karnataka) Provides basic medical Services like dental, gynecological services, diabetics, eye, ENT Camp, special medical services for women like Conducting health camps by Parinaam Foundation for children and their mothers, Special medical services With guidance from WHO, orientation sessions on water-borne disease preventive measures organized for the affected customers in flood fury of Bihar. Installation of drinking water and toilet facilities, Provision of weighing machine for weekly weight checks of children (through anganwadi workers).
1.9 Fruits of MFIs Inclusive Efforts-Impact on the Lives of Borrowers*
Several studies conducted across India have assessed the impact of MFI interventions. Highlights of the study findings are given hereunder.
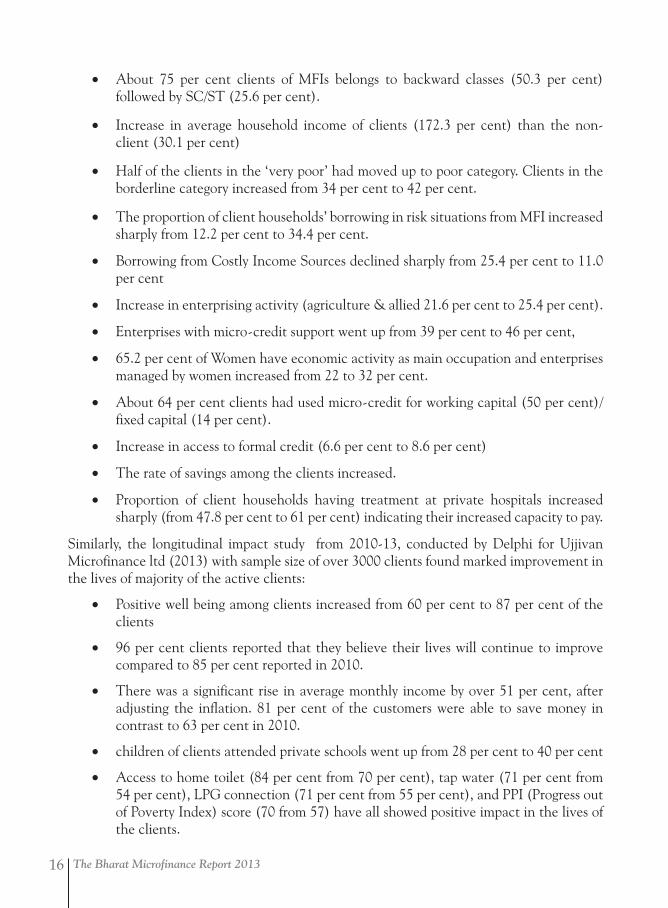
Findings from the longitudinal impact study conducted by SIDBI through EDA Rural System and Agriculture Finance Corporation over a period 2001-06 finds that MFI intervention had brought to light the following changes in the lives of the clients:
* Information extracted from study reports.
The Bharat Microfinance Report 201316
• About 75 per cent clients of MFIs belongs to backward classes (50.3 per cent) followed by SC/ST (25.6 per cent).
• Increase in average household income of clients (172.3 per cent) than the non-client (30.1 per cent)
• Half of the clients in the ‘very poor’ had moved up to poor category. Clients in the borderline category increased from 34 per cent to 42 per cent.
• The proportion of client households’ borrowing in risk situations from MFI increased sharply from 12.2 per cent to 34.4 per cent.
• Borrowing from Costly Income Sources declined sharply from 25.4 per cent to 11.0 per cent
• Increase in enterprising activity (agriculture & allied 21.6 per cent to 25.4 per cent).
• Enterprises with micro-credit support went up from 39 per cent to 46 per cent,
• 65.2 per cent of Women have economic activity as main occupation and enterprises managed by women increased from 22 to 32 per cent.
• About 64 per cent clients had used micro-credit for working capital (50 per cent)/fixed capital (14 per cent).
• Increase in access to formal credit (6.6 per cent to 8.6 per cent)
• The rate of savings among the clients increased.
• Proportion of client households having treatment at private hospitals increased sharply (from 47.8 per cent to 61 per cent) indicating their increased capacity to pay.
Similarly, the longitudinal impact study from 2010-13, conducted by Delphi for Ujjivan Microfinance ltd (2013) with sample size of over 3000 clients found marked improvement in the lives of majority of the active clients:
• Positive well being among clients increased from 60 per cent to 87 per cent of the clients
• 96 per cent clients reported that they believe their lives will continue to improve compared to 85 per cent reported in 2010.
• There was a significant rise in average monthly income by over 51 per cent, after adjusting the inflation. 81 per cent of the customers were able to save money in contrast to 63 per cent in 2010.
• children of clients attended private schools went up from 28 per cent to 40 per cent
• Access to home toilet (84 per cent from 70 per cent), tap water (71 per cent from 54 per cent), LPG connection (71 per cent from 55 per cent), and PPI (Progress out of Poverty Index) score (70 from 57) have all showed positive impact in the lives of the clients.
Microfinance and Financial Inclusion 17
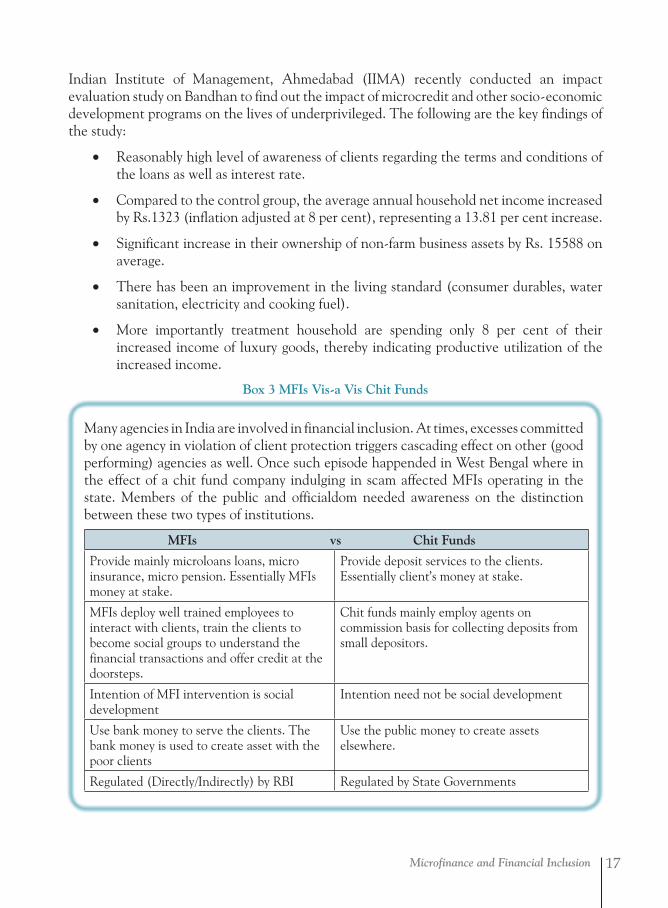
Indian Institute of Management, Ahmedabad (IIMA) recently conducted an impact evaluation study on Bandhan to find out the impact of microcredit and other socio-economic development programs on the lives of underprivileged. The following are the key findings of the study:
• Reasonably high level of awareness of clients regarding the terms and conditions of the loans as well as interest rate.
• Compared to the control group, the average annual household net income increased by Rs.1323 (inflation adjusted at 8 per cent), representing a 13.81 per cent increase.
• Significant increase in their ownership of non-farm business assets by Rs. 15588 on average.
• There has been an improvement in the living standard (consumer durables, water sanitation, electricity and cooking fuel).
• More importantly treatment household are spending only 8 per cent of their increased income of luxury goods, thereby indicating productive utilization of the increased income.
Box 3 MFIs Vis-a Vis Chit Funds
MFIs vs Chit Funds
Provide mainly microloans loans, micro insurance, micro pension. Essentially MFIs money at stake.
Provide deposit services to the clients. Essentially client’s money at stake.
MFIs deploy well trained employees to interact with clients, train the clients to become social groups to understand the financial transactions and offer credit at the doorsteps.
Chit funds mainly employ agents on commission basis for collecting deposits from small depositors.
Intention of MFI intervention is social development
Intention need not be social development
Use bank money to serve the clients. The bank money is used to create asset with the poor clients
Use the public money to create assets elsewhere.
Regulated (Directly/Indirectly) by RBI Regulated by State Governments
Many agencies in India are involved in financial inclusion. At times, excesses committed by one agency in violation of client protection triggers cascading effect on other (good performing) agencies as well. Once such episode happended in West Bengal where in the effect of a chit fund company indulging in scam affected MFIs operating in the state. Members of the public and officialdom needed awareness on the distinction between these two types of institutions.
The Bharat Microfinance Report 201318
Key Takeaways
Q Microfinance has been the key intervention in the financial inclusion space, though its role is yet to be fully appreciated. Self Help Bank Linkage programme purveys bank credit to the mass that do not have any access to banking service. Similarly, the MFIs use bank funds to offer credit to the same kind of unreached people in remote villages.
Q Ultimate objective of financial inclusion would be to make the bank funds/ services accessible to the mass. Addressing both supply side and demand side issues will pave for financial inclusion. SBLP and MFIs intervene in both the sides of financial inclusion continuum appropriately.
Q SBLP and MFIs will continue to perform this critical role till a sound alternative is evolved for financial inclusion unexplored thus far.
MFIs: Outreach and Loan Portfolio 19
MFIs: Outreach and Loan PortfolioPart 2
The MFIs outreach and their loan portfolio are important indicators of MFI- financial inclusion architecture. This part highlights these components based on data received
from 155 MFIs.
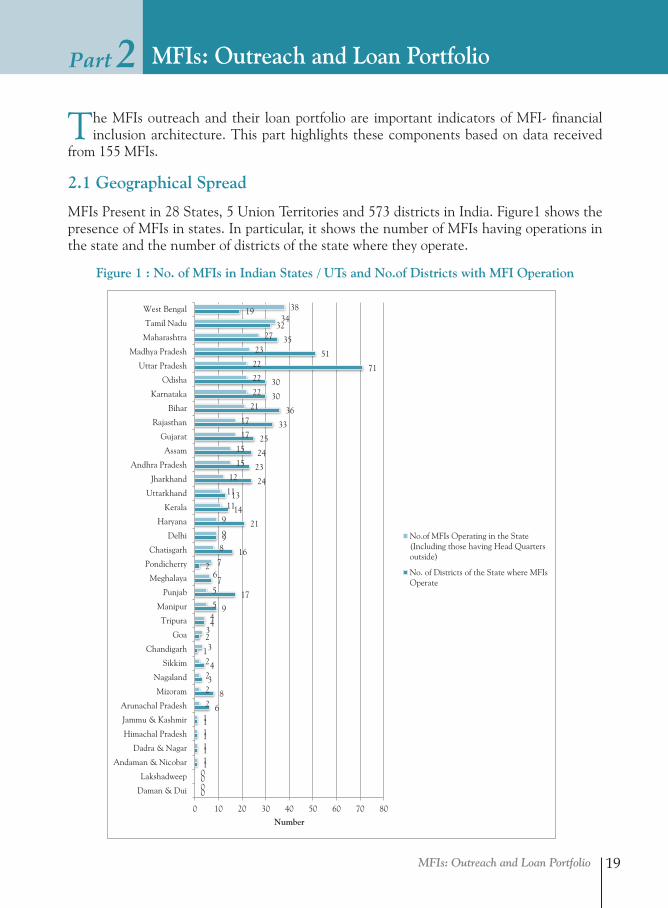
2.1 Geographical Spread
MFIs Present in 28 States, 5 Union Territories and 573 districts in India. Figure1 shows the presence of MFIs in states. In particular, it shows the number of MFIs having operations in the state and the number of districts of the state where they operate.
Figure 1 : No. of MFIs in Indian States / UTs and No.of Districts with MFI Operation
0
0
1
1
1
1
6
8
3
4
1
2
4
9
17
7
2
16
9
21
14
13
24
23
24
25
33
36
30
30
71
51
35
32
19
0
0 1
1
1
1
2
2
2
2
3
3
4 5
5
6 7
8
9
9
11
11
12
15
15
17
17
21
22
22
22
23
27
34 38
0 10 20 30 40 50 60 70 80
Daman & Dui
Lakshadweep
Andaman & Nicobar
Dadra & Nagar
Himachal Pradesh
Jammu & Kashmir
Arunachal Pradesh
Mizoram
Nagaland
Sikkim
Chandigarh
Goa
Tripura
Manipur
Punjab
Meghalaya
Pondicherry
Chatisgarh
Delhi
Haryana
Kerala
Uttarkhand
Jharkhand
Andhra Pradesh
Assam
Gujarat
Rajasthan
Bihar
Karnataka
Odisha
Uttar Pradesh
Madhya Pradesh
Maharashtra
Tamil Nadu
West Bengal
Number
No.of MFIs Operating in the StateIncluding those having Head Quarters(
outside)
No. of Districts of the State where MFIs Operate
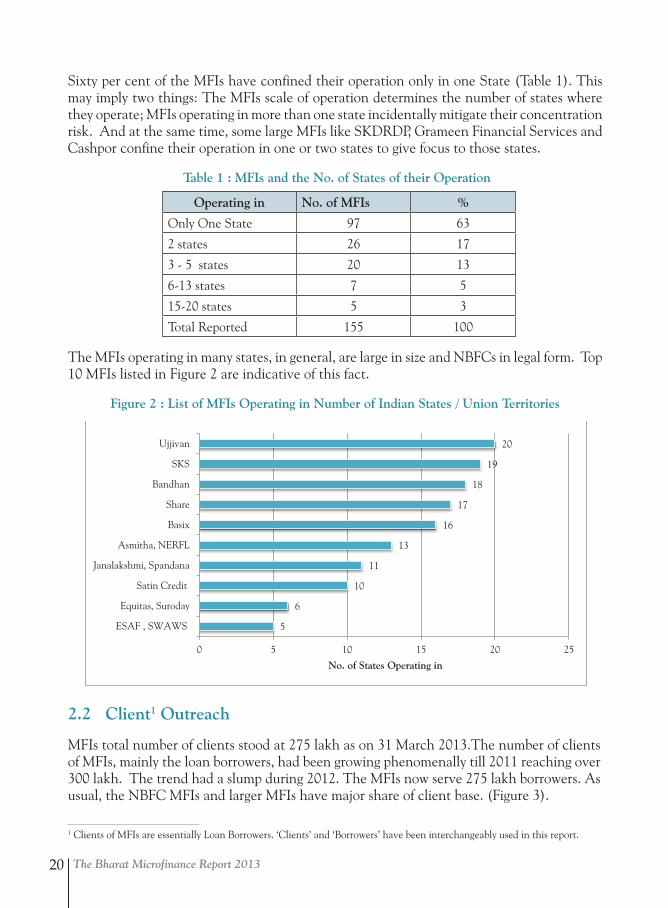
The Bharat Microfinance Report 201320
1 Clients of MFIs are essentially Loan Borrowers. ‘Clients’ and ‘Borrowers’ have been interchangeably used in this report.
Sixty per cent of the MFIs have confined their operation only in one State (Table 1). This may imply two things: The MFIs scale of operation determines the number of states where they operate; MFIs operating in more than one state incidentally mitigate their concentration risk. And at the same time, some large MFIs like SKDRDP, Grameen Financial Services and Cashpor confine their operation in one or two states to give focus to those states.
Table 1 : MFIs and the No. of States of their Operation
Operating in No. of MFIs %
Only One State 97 63
2 states 26 17
3 - 5 states 20 13
6-13 states 7 5
15-20 states 5 3
Total Reported 155 100
The MFIs operating in many states, in general, are large in size and NBFCs in legal form. Top 10 MFIs listed in Figure 2 are indicative of this fact.
Figure 2 : List of MFIs Operating in Number of Indian States / Union Territories
5
6
10
11
13
16
17
18
19
20
0 5 10 15 20 25
ESAF , SWAWS
Equitas, Suroday
Satin Credit
Janalakshmi, Spandana
Asmitha, NERFL
Basix
Share
Bandhan
SKS
Ujjivan
No. of States Operating in
2.2 Client1 Outreach
MFIs total number of clients stood at 275 lakh as on 31 March 2013.The number of clients of MFIs, mainly the loan borrowers, had been growing phenomenally till 2011 reaching over 300 lakh. The trend had a slump during 2012. The MFIs now serve 275 lakh borrowers. As usual, the NBFC MFIs and larger MFIs have major share of client base. (Figure 3).
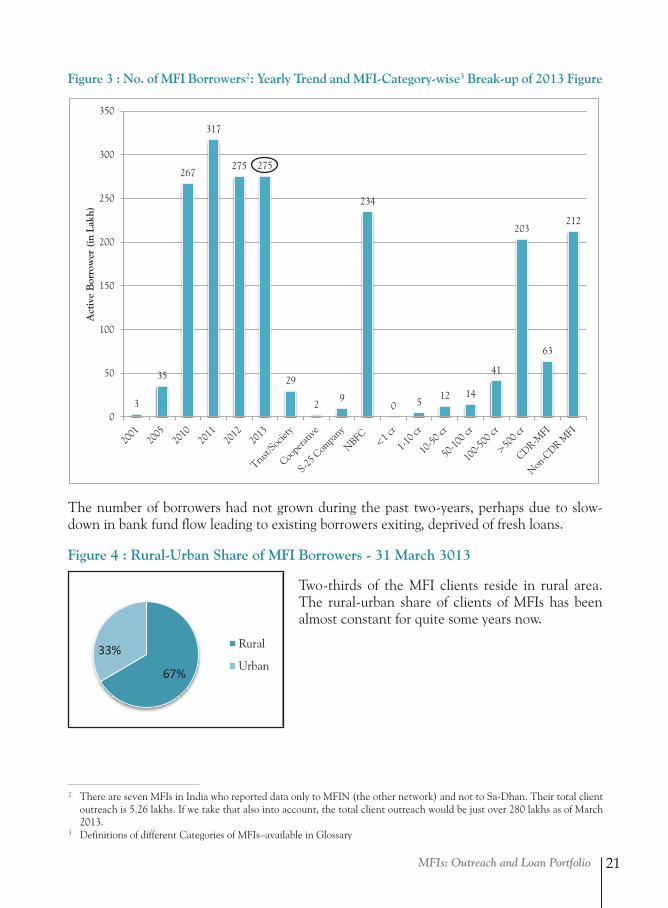
MFIs: Outreach and Loan Portfolio 21
Figure 3 : No. of MFI Borrowers2: Yearly Trend and MFI-Category-wise3 Break-up of 2013 Figure
3
35
267
317
275 275
29
2 9
234
0 5 12 14
41
203
63
212
0
50
100
150
200
250
300
350
Act
ive
Bor
row
er (
in L
akh)
The number of borrowers had not grown during the past two-years, perhaps due to slow-down in bank fund flow leading to existing borrowers exiting, deprived of fresh loans.
Figure 4 : Rural-Urban Share of MFI Borrowers - 31 March 3013
Two-thirds of the MFI clients reside in rural area. The rural-urban share of clients of MFIs has been almost constant for quite some years now.
62 63 69 64
149 142 135
119
267
314*
275 275
0
50
100
150
200
250
300
350
2010 2011 2012 2013
No.
of B
orro
wer
s (
Lakh
s)
North
East
West
South
North East
Central
Total
67%
33% Rural
Urban
2 There are seven MFIs in India who reported data only to MFIN (the other network) and not to Sa-Dhan. Their total client outreach is 5.26 lakhs. If we take that also into account, the total client outreach would be just over 280 lakhs as of March 2013.
3 Definitions of different Categories of MFIs–available in Glossary
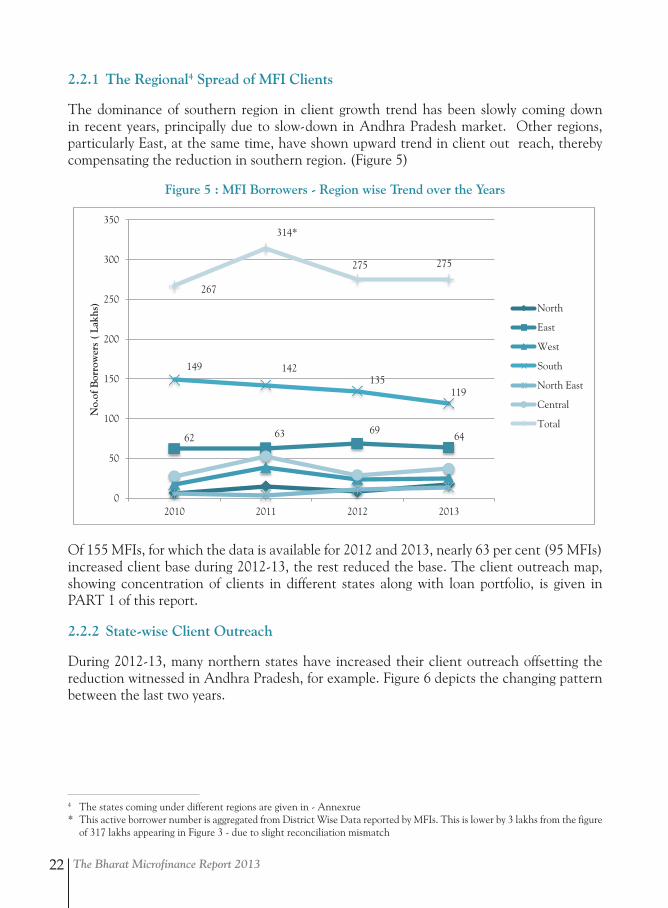
The Bharat Microfinance Report 201322
2.2.1 The Regional4 Spread of MFI Clients
The dominance of southern region in client growth trend has been slowly coming down in recent years, principally due to slow-down in Andhra Pradesh market. Other regions, particularly East, at the same time, have shown upward trend in client out reach, thereby compensating the reduction in southern region. (Figure 5)
Figure 5 : MFI Borrowers - Region wise Trend over the Years
62 63 69 64
149 142 135
119
267
314*
275 275
0
50
100
150
200
250
300
350
2010 2011 2012 2013
No.
of B
orro
wer
s (
Lakh
s)
North
East
West
South
North East
Central
Total
67%
33% Rural
Urban
Of 155 MFIs, for which the data is available for 2012 and 2013, nearly 63 per cent (95 MFIs) increased client base during 2012-13, the rest reduced the base. The client outreach map, showing concentration of clients in different states along with loan portfolio, is given in PART 1 of this report.
2.2.2 State-wise Client Outreach
During 2012-13, many northern states have increased their client outreach offsetting the reduction witnessed in Andhra Pradesh, for example. Figure 6 depicts the changing pattern between the last two years.
4 The states coming under different regions are given in - Annexrue* This active borrower number is aggregated from District Wise Data reported by MFIs. This is lower by 3 lakhs from the figure
of 317 lakhs appearing in Figure 3 - due to slight reconciliation mismatch
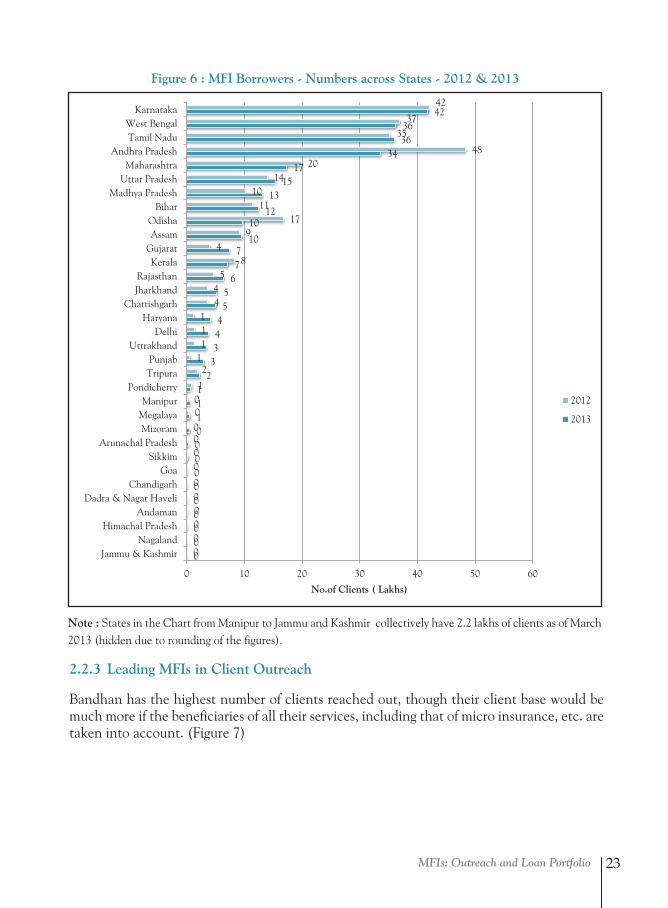
MFIs: Outreach and Loan Portfolio 23
Figure 6 : MFI Borrowers - Numbers across States - 2012 & 2013
0 0 0 0 0 0 0 0 0 0 1 1 1
2 3 3 4 4
5 5
6 7 7
10
10 12
13 15
17 34
36 36
42
0 0 0 0 0 0
0 0 0 0 0 0 1
2 1 1 1 1
4 4
5 8
4 9
17 11
10 14
20 48
35 37
42
0 10 20 30 40 50 60
Jammu & KashmirNagaland
Himachal PradeshAndaman
Dadra & Nagar HaveliChandigarh
GoaSikkim
Arunachal PradeshMizoram
MegalayaManipur
PondicherryTripuraPunjab
UttrakhandDelhi
HaryanaChattishgarh
JharkhandRajasthan
KeralaGujaratAssamOdisha
BiharMadhya Pradesh
Uttar PradeshMaharashtra
Andhra PradeshTamil NaduWest Bengal
Karnataka
No.of Clients ( Lakhs)
2012
2013
Note : States in the Chart from Manipur to Jammu and Kashmir collectively have 2.2 lakhs of clients as of March 2013
Note : States in the Chart from Manipur to Jammu and Kashmir collectively have 2.2 lakhs of clients as of March 2013 (hidden due to rounding of the figures).
2.2.3 Leading MFIs in Client Outreach
Bandhan has the highest number of clients reached out, though their client base would be much more if the beneficiaries of all their services, including that of micro insurance, etc. are taken into account. (Figure 7)
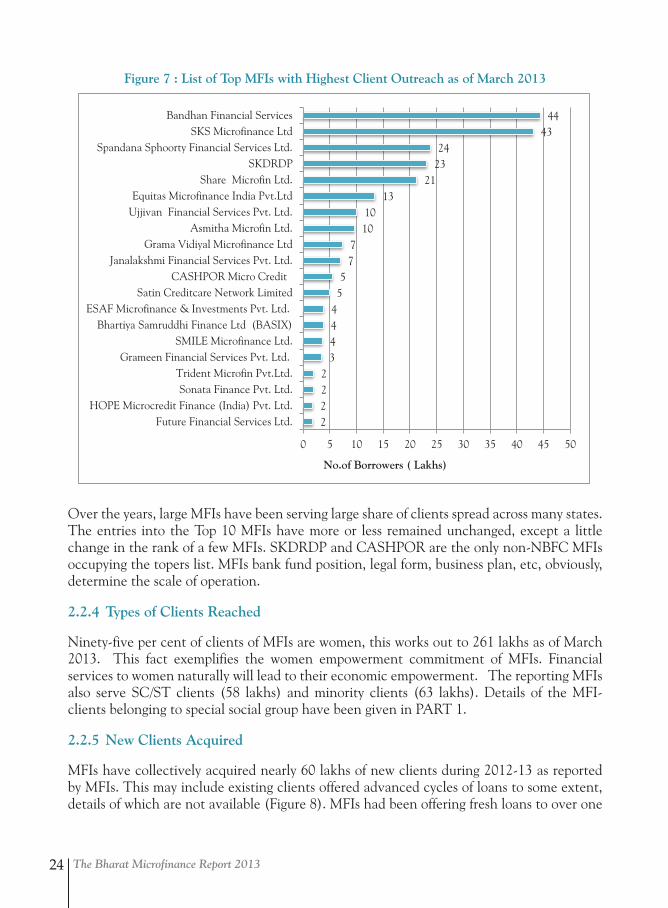
The Bharat Microfinance Report 201324
Figure 7 : List of Top MFIs with Highest Client Outreach as of March 2013
Over the years, large MFIs have been serving large share of clients spread across many states. The entries into the Top 10 MFIs have more or less remained unchanged, except a little change in the rank of a few MFIs. SKDRDP and CASHPOR are the only non-NBFC MFIs occupying the topers list. MFIs bank fund position, legal form, business plan, etc, obviously, determine the scale of operation.
2.2.4 Types of Clients Reached
Ninety-five per cent of clients of MFIs are women, this works out to 261 lakhs as of March 2013. This fact exemplifies the women empowerment commitment of MFIs. Financial services to women naturally will lead to their economic empowerment. The reporting MFIs also serve SC/ST clients (58 lakhs) and minority clients (63 lakhs). Details of the MFI-clients belonging to special social group have been given in PART 1.
2.2.5 New Clients Acquired
MFIs have collectively acquired nearly 60 lakhs of new clients during 2012-13 as reported by MFIs. This may include existing clients offered advanced cycles of loans to some extent, details of which are not available (Figure 8). MFIs had been offering fresh loans to over one
2 2 2 2
3 4 4 4 5 5
7 7
10 10
13 21
23 24
43 44
0 5 10 15 20 25 30 35 40 45 50
Future Financial Services Ltd.HOPE Microcredit Finance (India) Pvt. Ltd.
Sonata Finance Pvt. Ltd.Trident Microfin Pvt.Ltd.
Grameen Financial Services Pvt. Ltd.SMILE Microfinance Ltd.
Bhartiya Samruddhi Finance Ltd (BASIX)ESAF Microfinance & Investments Pvt. Ltd.
Satin Creditcare Network LimitedCASHPOR Micro Credit
Janalakshmi Financial Services Pvt. Ltd.Grama Vidiyal Microfinance Ltd
Asmitha Microfin Ltd.Ujjivan Financial Services Pvt. Ltd.Equitas Microfinance India Pvt.Ltd
Share Microfin Ltd.SKDRDP
Spandana Sphoorty Financial Services Ltd.SKS Microfinance Ltd
Bandhan Financial Services
No.of Borrowers ( Lakhs)
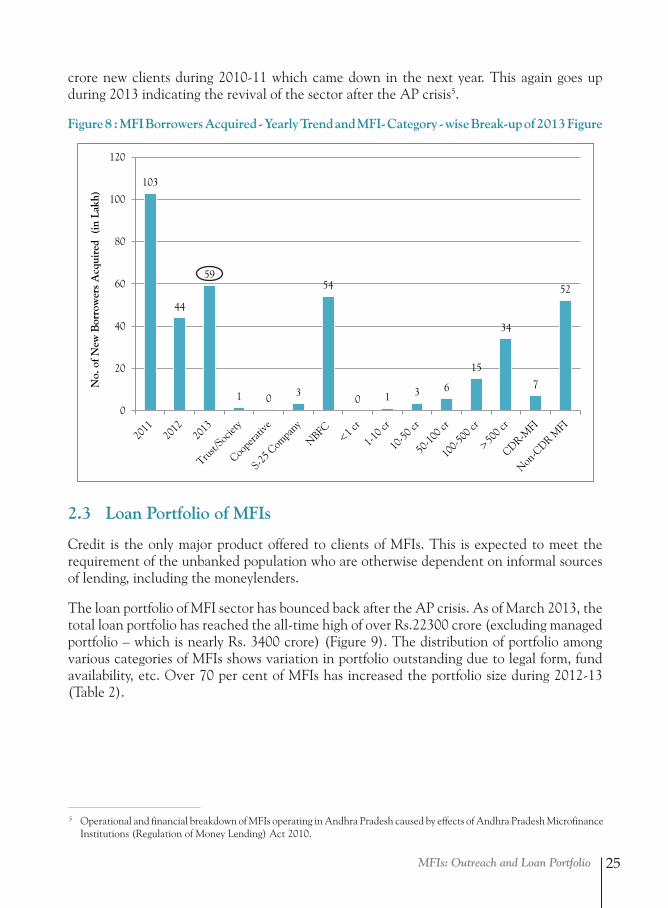
MFIs: Outreach and Loan Portfolio 25
crore new clients during 2010-11 which came down in the next year. This again goes up during 2013 indicating the revival of the sector after the AP crisis5.
Figure 8 : MFI Borrowers Acquired - Yearly Trend and MFI- Category - wise Break-up of 2013 Figure
103
44
59
1 0 3
54
0 1 3 6
15
34
7
52
0
20
40
60
80
100
120
No.
of N
ew B
orro
wer
s A
cqui
red
(in
Lak
h)
2.3 Loan Portfolio of MFIs
Credit is the only major product offered to clients of MFIs. This is expected to meet the requirement of the unbanked population who are otherwise dependent on informal sources of lending, including the moneylenders.
The loan portfolio of MFI sector has bounced back after the AP crisis. As of March 2013, the total loan portfolio has reached the all-time high of over Rs.22300 crore (excluding managed portfolio – which is nearly Rs. 3400 crore) (Figure 9). The distribution of portfolio among various categories of MFIs shows variation in portfolio outstanding due to legal form, fund availability, etc. Over 70 per cent of MFIs has increased the portfolio size during 2012-13 (Table 2).
5 Operational and financial breakdown of MFIs operating in Andhra Pradesh caused by effects of Andhra Pradesh Microfinance Institutions (Regulation of Money Lending) Act 2010.
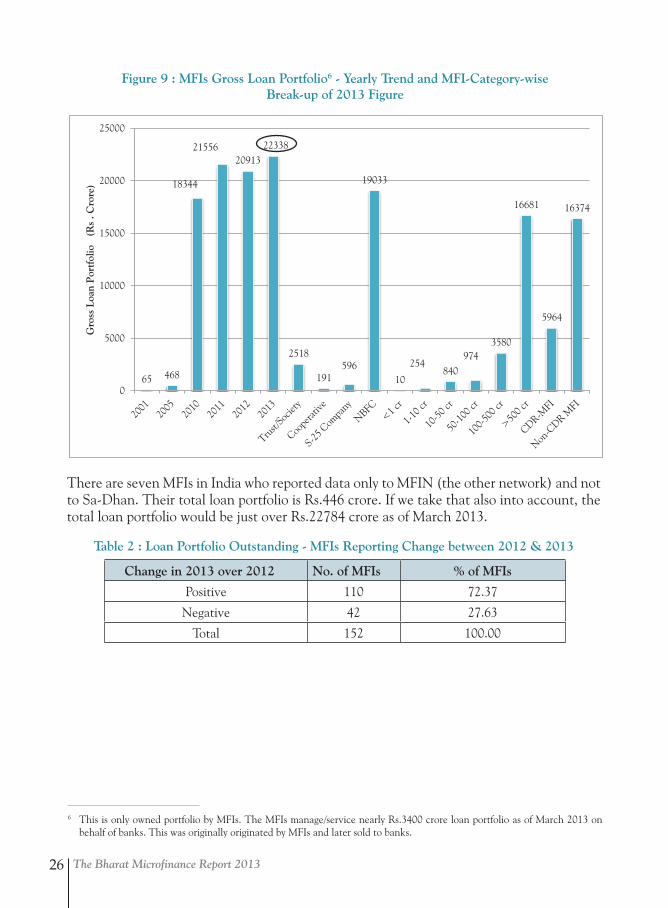
The Bharat Microfinance Report 201326
Figure 9 : MFIs Gross Loan Portfolio6 - Yearly Trend and MFI-Category-wise Break-up of 2013 Figure
65 468
18344
21556 20913
22338
2518
191 596
19033
10
254 840
974 3580
16681
5964
16374
0
5000
10000
15000
20000
25000
Gro
ss L
oan
Por
tfol
io
(Rs
. Cro
re)
There are seven MFIs in India who reported data only to MFIN (the other network) and not to Sa-Dhan. Their total loan portfolio is Rs.446 crore. If we take that also into account, the total loan portfolio would be just over Rs.22784 crore as of March 2013.
Table 2 : Loan Portfolio Outstanding - MFIs Reporting Change between 2012 & 2013
Change in 2013 over 2012 No. of MFIs % of MFIs
Positive 110 72.37
Negative 42 27.63
Total 152 100.00
6 This is only owned portfolio by MFIs. The MFIs manage/service nearly Rs.3400 crore loan portfolio as of March 2013 on behalf of banks. This was originally originated by MFIs and later sold to banks.
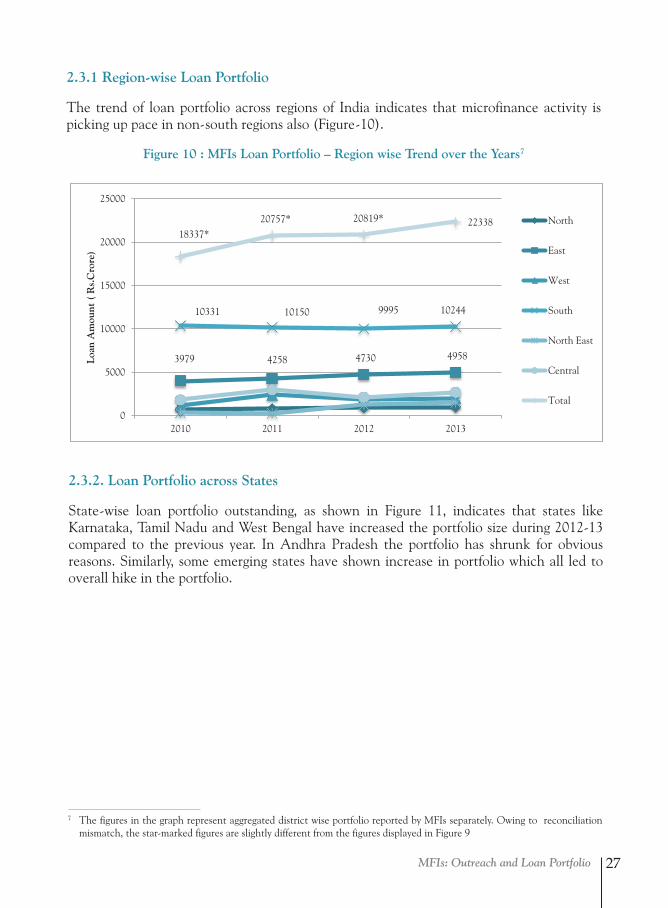
MFIs: Outreach and Loan Portfolio 27
2.3.1 Region-wise Loan Portfolio
The trend of loan portfolio across regions of India indicates that microfinance activity is picking up pace in non-south regions also (Figure-10).
Figure 10 : MFIs Loan Portfolio – Region wise Trend over the Years7
3979 4258 4730 4958
10331 10150 9995 10244
18337* 20757* 20819* 22338
0
5000
10000
15000
20000
25000
2010 2011 2012 2013
Loan
Am
ount
( R
s.C
rore
)
North
East
West
South
North East
Central
Total
7 The figures in the graph represent aggregated district wise portfolio reported by MFIs separately. Owing to reconciliation mismatch, the star-marked figures are slightly different from the figures displayed in Figure 9
2.3.2. Loan Portfolio across States
State-wise loan portfolio outstanding, as shown in Figure 11, indicates that states like Karnataka, Tamil Nadu and West Bengal have increased the portfolio size during 2012-13 compared to the previous year. In Andhra Pradesh the portfolio has shrunk for obvious reasons. Similarly, some emerging states have shown increase in portfolio which all led to overall hike in the portfolio.
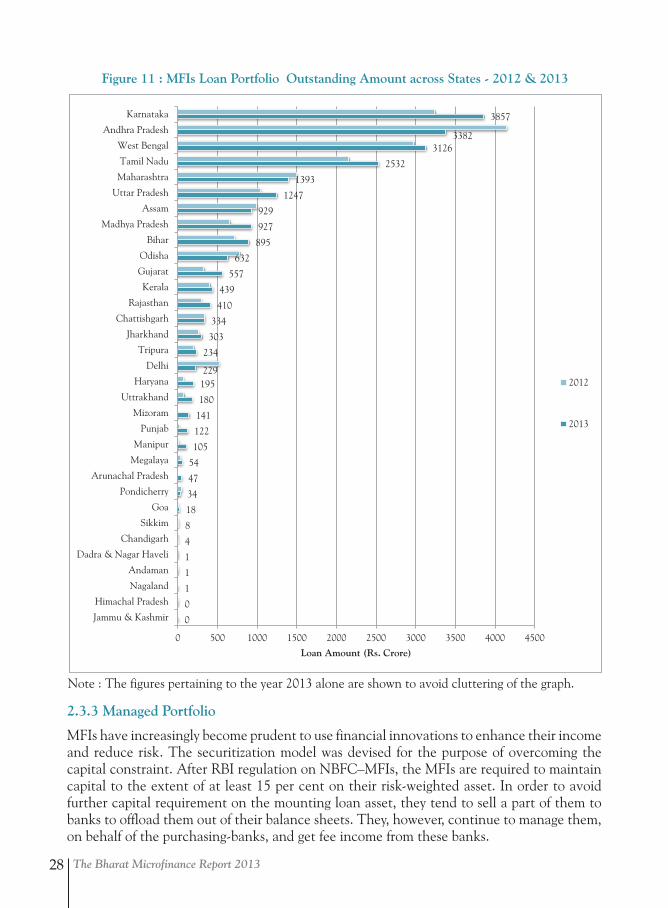
The Bharat Microfinance Report 201328
2.3.3 Managed Portfolio
MFIs have increasingly become prudent to use financial innovations to enhance their income and reduce risk. The securitization model was devised for the purpose of overcoming the capital constraint. After RBI regulation on NBFC–MFIs, the MFIs are required to maintain capital to the extent of at least 15 per cent on their risk-weighted asset. In order to avoid further capital requirement on the mounting loan asset, they tend to sell a part of them to banks to offload them out of their balance sheets. They, however, continue to manage them, on behalf of the purchasing-banks, and get fee income from these banks.
0
0
1
1
1
4
8
18
34
47
54
105
122
141
180
195 229
234
303
334
410
439
557
632
895
927
929
1247
1393
2532
3126 3382
3857
0 500 1000 1500 2000 2500 3000 3500 4000 4500
Jammu & Kashmir
Himachal Pradesh
Nagaland
Andaman
Dadra & Nagar Haveli
Chandigarh
Sikkim
Goa
Pondicherry
Arunachal Pradesh
Megalaya
Manipur
Punjab
Mizoram
Uttrakhand
Haryana
Delhi
Tripura
Jharkhand
Chattishgarh
Rajasthan
Kerala
Gujarat
Odisha
Bihar
Madhya Pradesh
Assam
Uttar Pradesh
Maharashtra
Tamil Nadu
West Bengal
Andhra Pradesh
Karnataka
Loan Amount (Rs. Crore)
2012
2013
Figure 11 : MFIs Loan Portfolio Outstanding Amount across States - 2012 & 2013
Note : The figures pertaining to the year 2013 alone are shown to avoid cluttering of the graph.
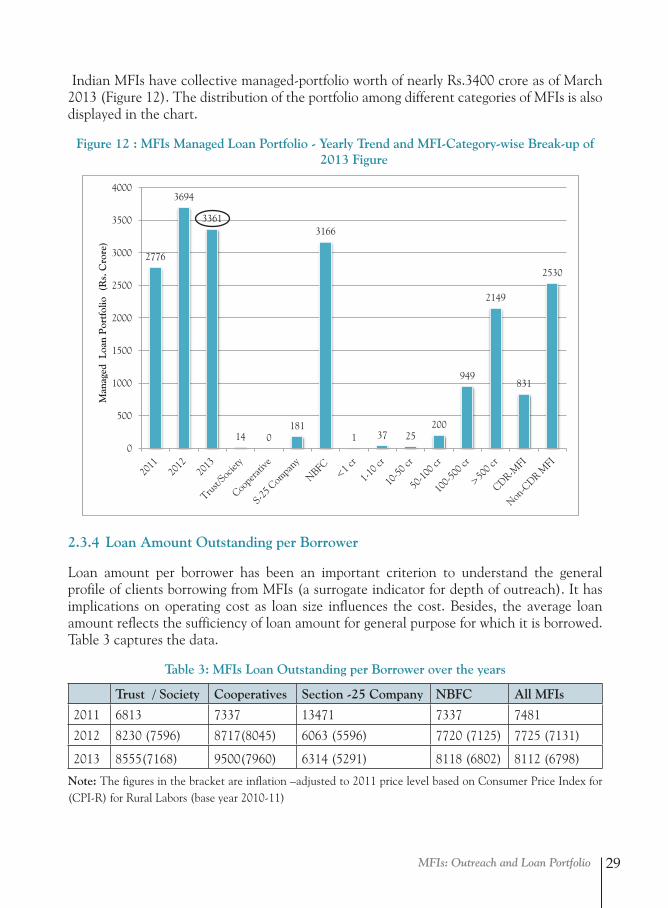
MFIs: Outreach and Loan Portfolio 29
Indian MFIs have collective managed-portfolio worth of nearly Rs.3400 crore as of March 2013 (Figure 12). The distribution of the portfolio among different categories of MFIs is also displayed in the chart.
Figure 12 : MFIs Managed Loan Portfolio - Yearly Trend and MFI-Category-wise Break-up of 2013 Figure
2.3.4 Loan Amount Outstanding per Borrower
Loan amount per borrower has been an important criterion to understand the general profile of clients borrowing from MFIs (a surrogate indicator for depth of outreach). It has implications on operating cost as loan size influences the cost. Besides, the average loan amount reflects the sufficiency of loan amount for general purpose for which it is borrowed. Table 3 captures the data.
Table 3: MFIs Loan Outstanding per Borrower over the years
Trust / Society Cooperatives Section -25 Company NBFC All MFIs
2011 6813 7337 13471 7337 7481
2012 8230 (7596) 8717(8045) 6063 (5596) 7720 (7125) 7725 (7131)
2013 8555(7168) 9500(7960) 6314 (5291) 8118 (6802) 8112 (6798)
Note: The figures in the bracket are inflation –adjusted to 2011 price level based on Consumer Price Index for (CPI-R) for Rural Labors (base year 2010-11)
Figure 12 : MFIs Managed Loan Portfolio - Yearly Trend and MFI Category wise Break-up of 2013 Figure
2776
3694
3361
14 0 181
3166
1 37 25 200
949
2149
831
2530
0
500
1000
1500
2000
2500
3000
3500
4000
Man
aged
Loa
n P
ortf
olio
(R
s. C
rore
)
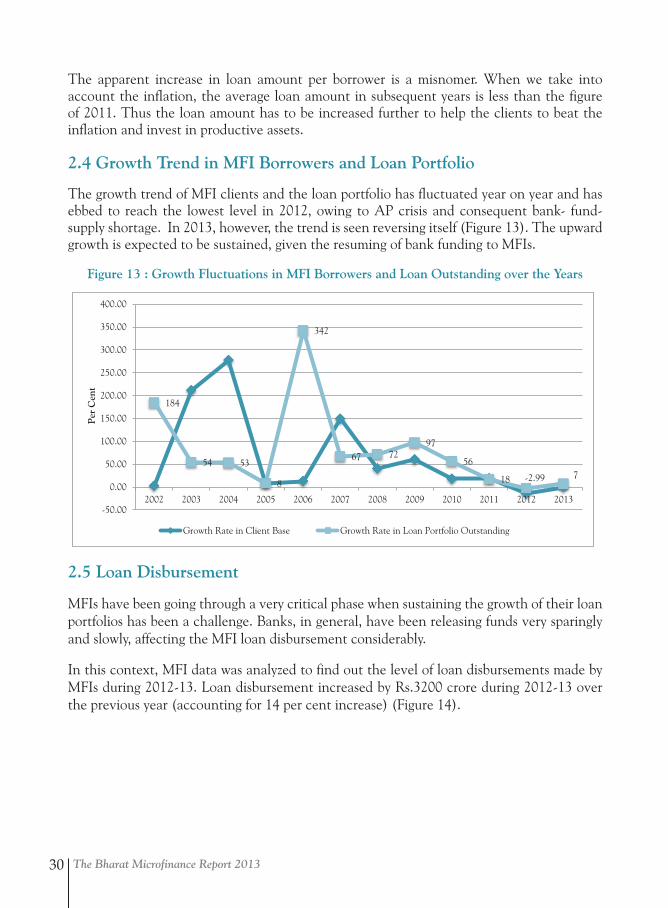
The Bharat Microfinance Report 201330
The apparent increase in loan amount per borrower is a misnomer. When we take into account the inflation, the average loan amount in subsequent years is less than the figure of 2011. Thus the loan amount has to be increased further to help the clients to beat the inflation and invest in productive assets.
2.4 Growth Trend in MFI Borrowers and Loan Portfolio
The growth trend of MFI clients and the loan portfolio has fluctuated year on year and has ebbed to reach the lowest level in 2012, owing to AP crisis and consequent bank- fund- supply shortage. In 2013, however, the trend is seen reversing itself (Figure 13). The upward growth is expected to be sustained, given the resuming of bank funding to MFIs.
Figure 13 : Growth Fluctuations in MFI Borrowers and Loan Outstanding over the YearsFigure 13 : Growth Fluctuations in MFI Borrowers and Loan Outstanding over the Years
184
54 53
8
342
67 72 97
56
18 -2.99 7
-50.00
0.00
50.00
100.00
150.00
200.00
250.00
300.00
350.00
400.00
2002 2003 2004 2005 2006 2007 2008 2009 2010 2011 2012 2013
Per
Cen
t
Growth Rate in Client Base Growth Rate in Loan Portfolio Outstanding
2.5 Loan Disbursement
MFIs have been going through a very critical phase when sustaining the growth of their loan portfolios has been a challenge. Banks, in general, have been releasing funds very sparingly and slowly, affecting the MFI loan disbursement considerably.
In this context, MFI data was analyzed to find out the level of loan disbursements made by MFIs during 2012-13. Loan disbursement increased by Rs.3200 crore during 2012-13 over the previous year (accounting for 14 per cent increase) (Figure 14).
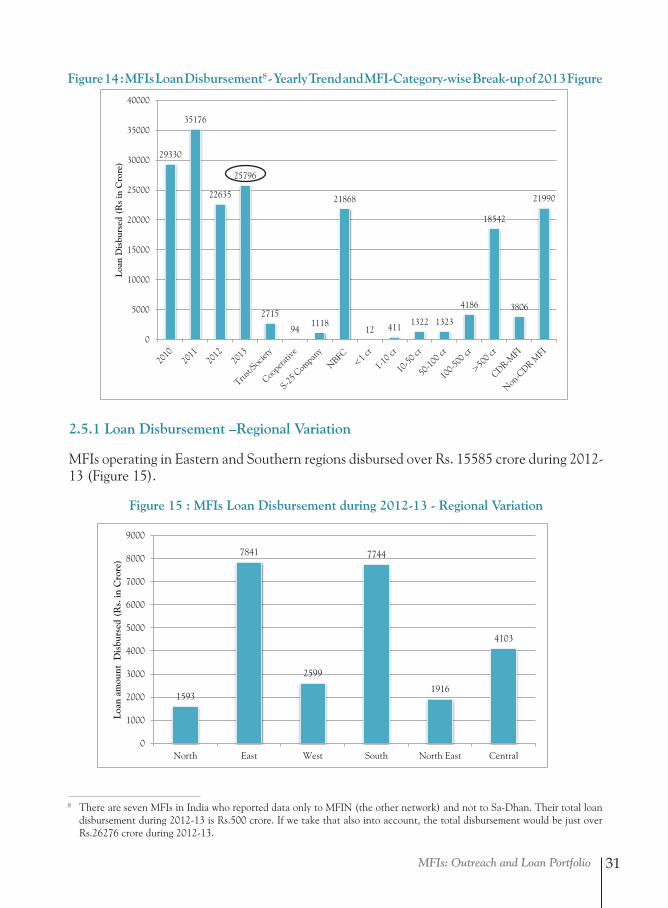
MFIs: Outreach and Loan Portfolio 31
Figure 14 : MFIs Loan Disbursement8 - Yearly Trend and MFI-Category-wise Break-up of 2013 Figure
8 There are seven MFIs in India who reported data only to MFIN (the other network) and not to Sa-Dhan. Their total loan disbursement during 2012-13 is Rs.500 crore. If we take that also into account, the total disbursement would be just over Rs.26276 crore during 2012-13.
Figure 14 : MFIs Loan Disbursement8 - Yearly Trend and MFI-Category-wise Break-up of 2013 Figure
29330
35176
22635
25796
2715
94 1118
21868
12 411 1322 1323
4186
18542
3806
21990
0
5000
10000
15000
20000
25000
30000
35000
40000
Loan
Dis
burs
ed (
Rs
in C
rore
)
2.5.1 Loan Disbursement –Regional Variation
MFIs operating in Eastern and Southern regions disbursed over Rs. 15585 crore during 2012-13 (Figure 15).
Figure 15 : MFIs Loan Disbursement during 2012-13 - Regional VariationFigure 15 : MFIs Loan Disbursement during 2012-13 - Regional Variation
1593
7841
2599
7744
1916
4103
0
1000
2000
3000
4000
5000
6000
7000
8000
9000
North East West South North East Central
Loan
am
ount
Dis
burs
ed (
Rs.
in C
rore
)
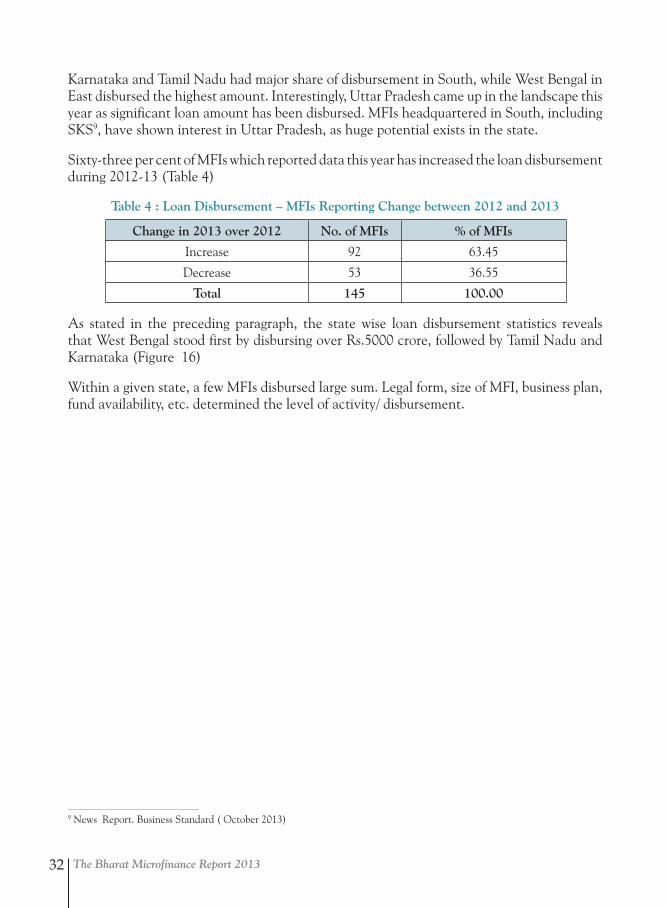
The Bharat Microfinance Report 201332
Karnataka and Tamil Nadu had major share of disbursement in South, while West Bengal in East disbursed the highest amount. Interestingly, Uttar Pradesh came up in the landscape this year as significant loan amount has been disbursed. MFIs headquartered in South, including SKS9, have shown interest in Uttar Pradesh, as huge potential exists in the state.
Sixty-three per cent of MFIs which reported data this year has increased the loan disbursement during 2012-13 (Table 4)
Table 4 : Loan Disbursement – MFIs Reporting Change between 2012 and 2013
Change in 2013 over 2012 No. of MFIs % of MFIs
Increase 92 63.45
Decrease 53 36.55
Total 145 100.00
As stated in the preceding paragraph, the state wise loan disbursement statistics reveals that West Bengal stood first by disbursing over Rs.5000 crore, followed by Tamil Nadu and Karnataka (Figure 16)
Within a given state, a few MFIs disbursed large sum. Legal form, size of MFI, business plan, fund availability, etc. determined the level of activity/ disbursement.
9 News Report. Business Standard ( October 2013)
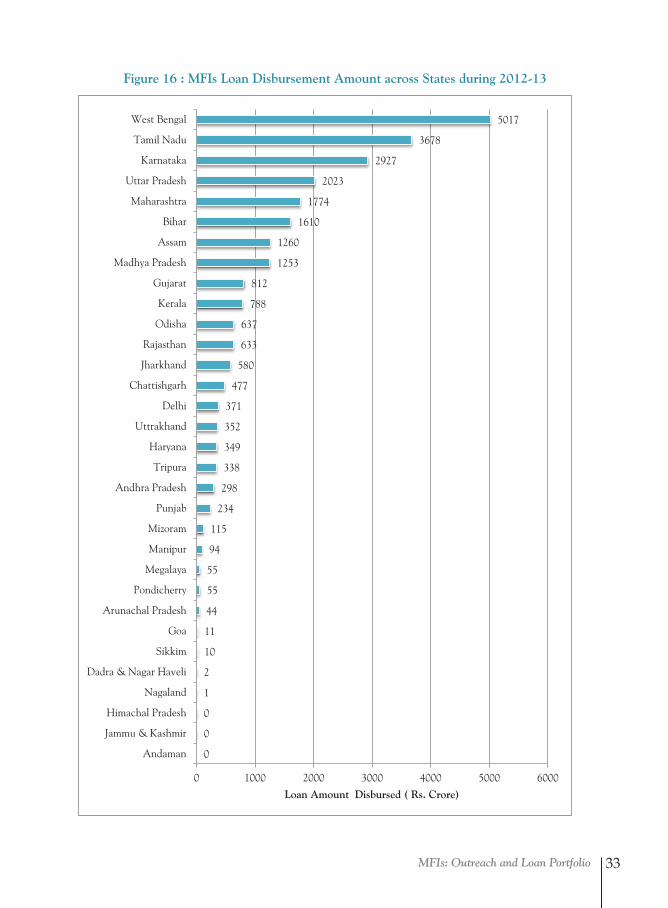
MFIs: Outreach and Loan Portfolio 33
Figure 16 : MFIs Loan Disbursement Amount across States during 2012-13
0
0
0
1
2
10
11
44
55
55
94
115
234
298
338
349
352
371
477
580
633
637
788
812
1253
1260
1610
1774
2023
2927
3678
5017
0 1000 2000 3000 4000 5000 6000
Andaman
Jammu & Kashmir
Himachal Pradesh
Nagaland
Dadra & Nagar Haveli
Sikkim
Goa
Arunachal Pradesh
Pondicherry
Megalaya
Manipur
Mizoram
Punjab
Andhra Pradesh
Tripura
Haryana
Uttrakhand
Delhi
Chattishgarh
Jharkhand
Rajasthan
Odisha
Kerala
Gujarat
Madhya Pradesh
Assam
Bihar
Maharashtra
Uttar Pradesh
Karnataka
Tamil Nadu
West Bengal
Loan Amount Disbursed ( Rs. Crore)
Figure 16 : MFIs Loan Disbursement Amount across States during 2012-13
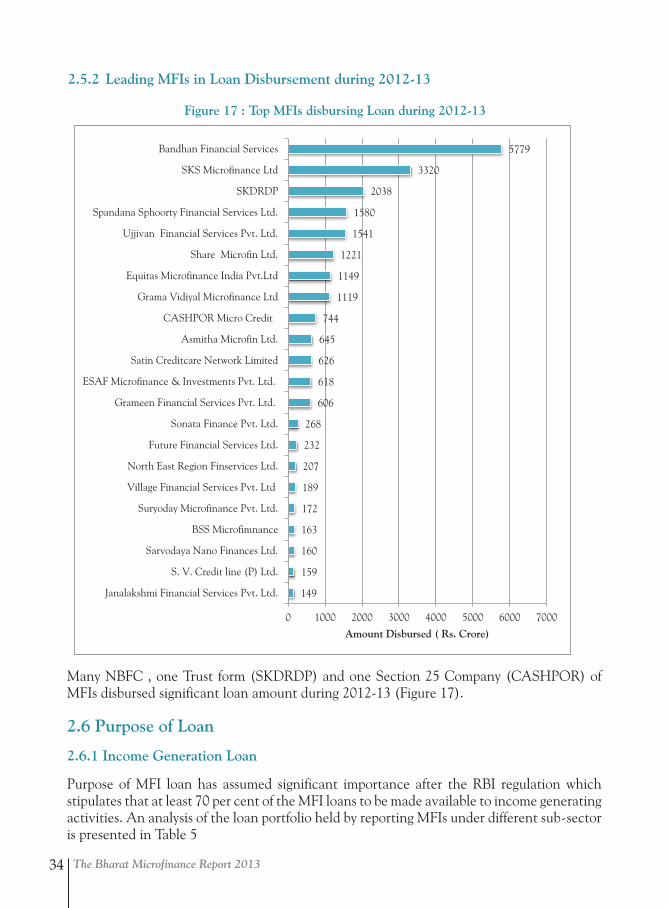
The Bharat Microfinance Report 201334
2.5.2 Leading MFIs in Loan Disbursement during 2012-13
Figure 17 : Top MFIs disbursing Loan during 2012-13
Figure 17 : Top MFIs disbursing Loan during 2012-13
149
159
160
163
172
189
207
232
268
606
618
626
645
744
1119
1149
1221
1541
1580
2038
3320
5779
0 1000 2000 3000 4000 5000 6000 7000
Janalakshmi Financial Services Pvt. Ltd.
S. V. Credit line (P) Ltd.
Sarvodaya Nano Finances Ltd.
BSS Microfimnance
Suryoday Microfinance Pvt. Ltd.
Village Financial Services Pvt. Ltd
North East Region Finservices Ltd.
Future Financial Services Ltd.
Sonata Finance Pvt. Ltd.
Grameen Financial Services Pvt. Ltd.
ESAF Microfinance & Investments Pvt. Ltd.
Satin Creditcare Network Limited
Asmitha Microfin Ltd.
CASHPOR Micro Credit
Grama Vidiyal Microfinance Ltd
Equitas Microfinance India Pvt.Ltd
Share Microfin Ltd.
Ujjivan Financial Services Pvt. Ltd.
Spandana Sphoorty Financial Services Ltd.
SKDRDP
SKS Microfinance Ltd
Bandhan Financial Services
Amount Disbursed ( Rs. Crore)
Many NBFC , one Trust form (SKDRDP) and one Section 25 Company (CASHPOR) of MFIs disbursed significant loan amount during 2012-13 (Figure 17).
2.6 Purpose of Loan
2.6.1 Income Generation Loan
Purpose of MFI loan has assumed significant importance after the RBI regulation which stipulates that at least 70 per cent of the MFI loans to be made available to income generating activities. An analysis of the loan portfolio held by reporting MFIs under different sub-sector is presented in Table 5
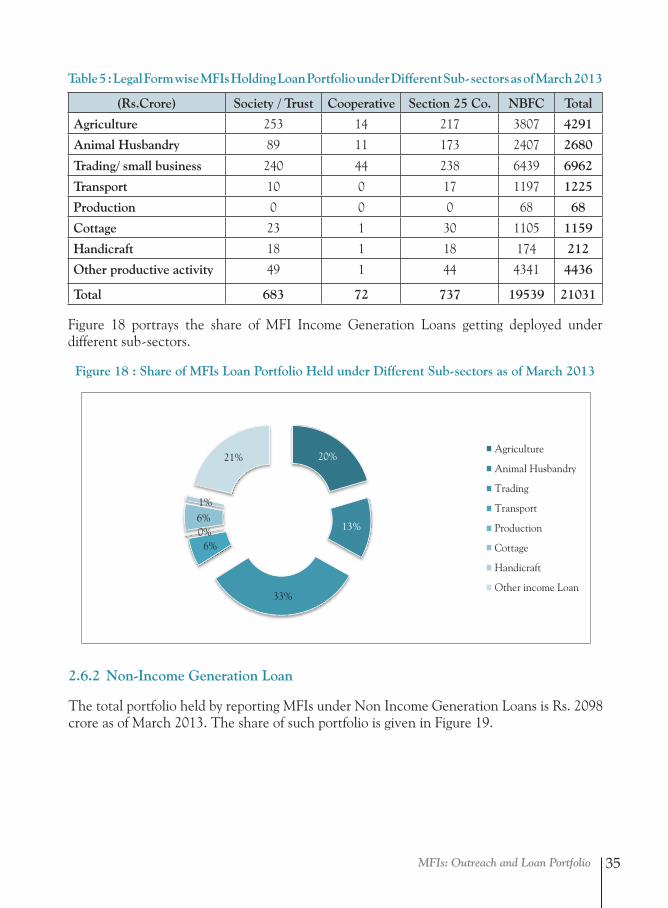
MFIs: Outreach and Loan Portfolio 35
Table 5 : Legal Form wise MFIs Holding Loan Portfolio under Different Sub- sectors as of March 2013
(Rs.Crore) Society / Trust Cooperative Section 25 Co. NBFC Total
Agriculture 253 14 217 3807 4291
Animal Husbandry 89 11 173 2407 2680
Trading/ small business 240 44 238 6439 6962
Transport 10 0 17 1197 1225
Production 0 0 0 68 68
Cottage 23 1 30 1105 1159
Handicraft 18 1 18 174 212
Other productive activity 49 1 44 4341 4436
Total 683 72 737 19539 21031
Figure 18 portrays the share of MFI Income Generation Loans getting deployed under different sub-sectors.
Figure 18 : Share of MFIs Loan Portfolio Held under Different Sub-sectors as of March 2013
Figure 18 : Share of MFIs Loan Portfolio Held under Different Sub -sector as of March 2013
20%
13%
33%
6% 0% 6% 1%
21% Agriculture
Animal Husbandry
Trading
Transport
Production
Cottage
Handicraft
Other income Loan
2.6.2 Non-Income Generation Loan
The total portfolio held by reporting MFIs under Non Income Generation Loans is Rs. 2098 crore as of March 2013. The share of such portfolio is given in Figure 19.
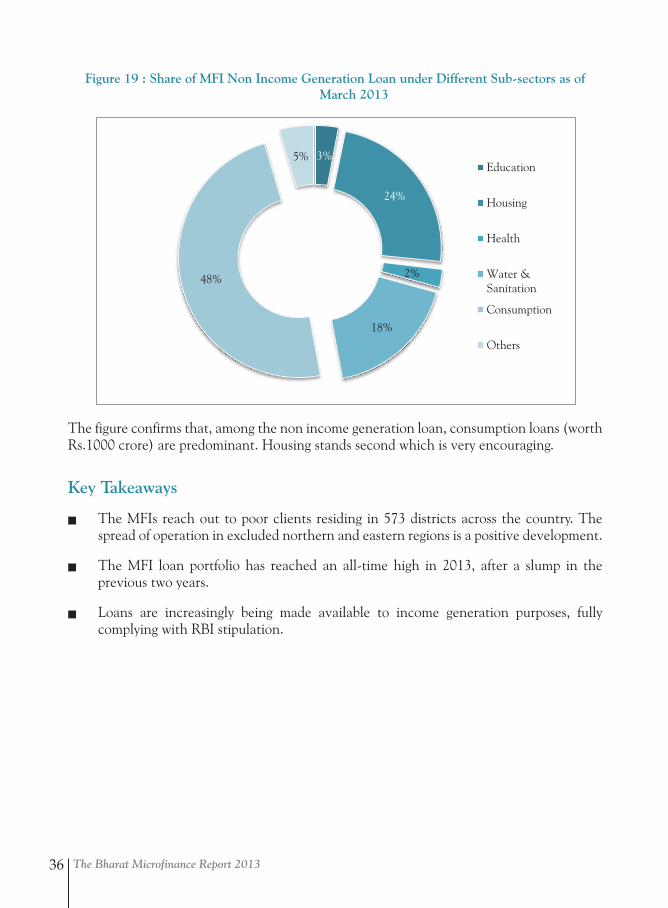
The Bharat Microfinance Report 201336
Figure 19 : Share of MFI Non Income Generation Loan under Different Sub-sectors as of March 2013
Figure 19 : Share of MFI Non Income Generation Loan under Different Sub Sectors as of March 2013
3%
24%
2%
18%
48%
5% Education
Housing
Health
Water &Sanitation
Consumption
Others
The figure confirms that, among the non income generation loan, consumption loans (worth Rs.1000 crore) are predominant. Housing stands second which is very encouraging.
Key Takeaways
Q The MFIs reach out to poor clients residing in 573 districts across the country. The spread of operation in excluded northern and eastern regions is a positive development.
Q The MFI loan portfolio has reached an all-time high in 2013, after a slump in the previous two years.
Q Loans are increasingly being made available to income generation purposes, fully complying with RBI stipulation.
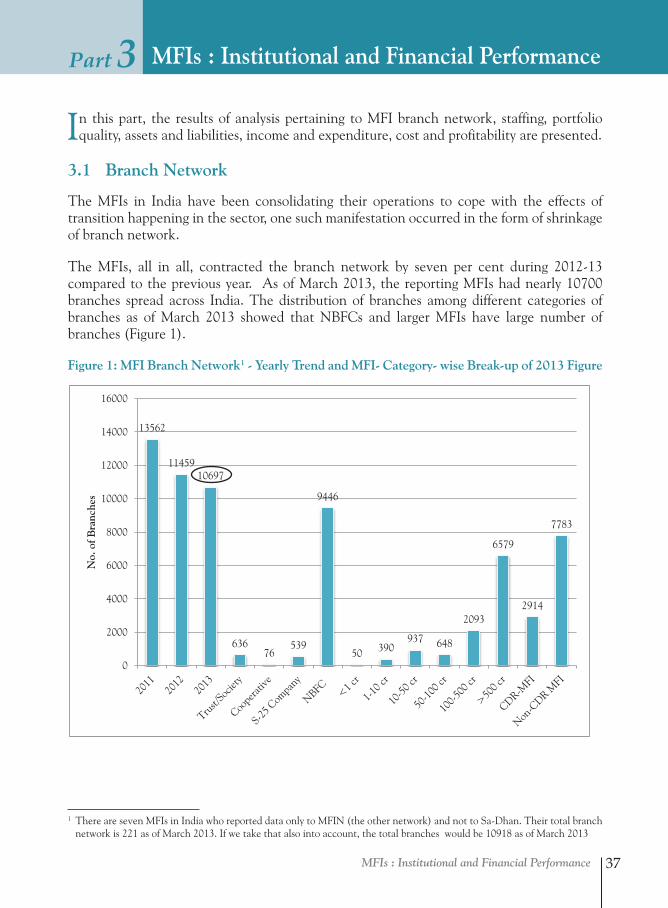
MFIs : Institutional and Financial Performance 37
MFIs : Institutional and Financial PerformancePart 3
In this part, the results of analysis pertaining to MFI branch network, staffing, portfolio quality, assets and liabilities, income and expenditure, cost and profitability are presented.
3.1 Branch Network
The MFIs in India have been consolidating their operations to cope with the effects of transition happening in the sector, one such manifestation occurred in the form of shrinkage of branch network.
The MFIs, all in all, contracted the branch network by seven per cent during 2012-13 compared to the previous year. As of March 2013, the reporting MFIs had nearly 10700 branches spread across India. The distribution of branches among different categories of branches as of March 2013 showed that NBFCs and larger MFIs have large number of branches (Figure 1).
Figure 1: MFI Branch Network1 - Yearly Trend and MFI- Category- wise Break-up of 2013 Figure
1 There are seven MFIs in India who reported data only to MFIN (the other network) and not to Sa-Dhan. Their total branch network is 221 as of March 2013. If we take that also into account, the total branches would be 10918 as of March 2013
Figure 1: MFI Branch Network1 - Yearly Trend and MFI- Category- wise Break-up of 2013 Figure
13562
11459 10697
636 76
539
9446
50 390 937 648
2093
6579
2914
7783
0
2000
4000
6000
8000
10000
12000
14000
16000
No.
of B
ranc
hes
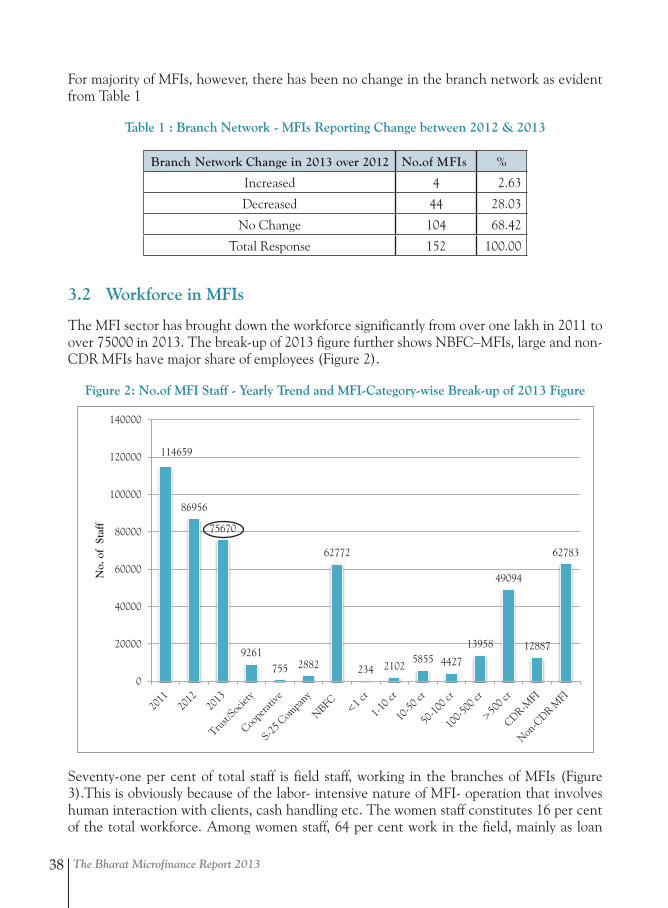
The Bharat Microfinance Report 201338
For majority of MFIs, however, there has been no change in the branch network as evident from Table 1
Table 1 : Branch Network - MFIs Reporting Change between 2012 & 2013
Branch Network Change in 2013 over 2012 No.of MFIs %
Increased 4 2.63
Decreased 44 28.03
No Change 104 68.42
Total Response 152 100.00
3.2 Workforce in MFIs
The MFI sector has brought down the workforce significantly from over one lakh in 2011 to over 75000 in 2013. The break-up of 2013 figure further shows NBFC–MFIs, large and non-CDR MFIs have major share of employees (Figure 2).
Figure 2: No.of MFI Staff - Yearly Trend and MFI-Category-wise Break-up of 2013 Figure
Figure 2: No.of MFI Staff - Yearly Trend and MFI Category wise Break-up of 2013 Figure
114659
86956
75670
9261 755 2882
62772
234 2102 5855 4427
13958
49094
12887
62783
0
20000
40000
60000
80000
100000
120000
140000
No.
of
Staf
f
Seventy-one per cent of total staff is field staff, working in the branches of MFIs (Figure 3).This is obviously because of the labor- intensive nature of MFI- operation that involves human interaction with clients, cash handling etc. The women staff constitutes 16 per cent of the total workforce. Among women staff, 64 per cent work in the field, mainly as loan
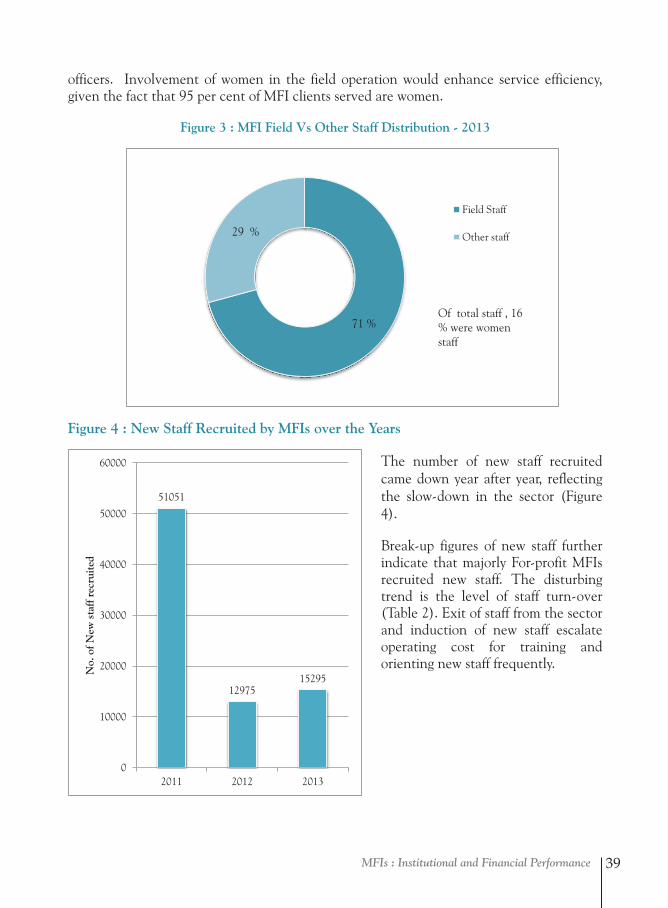
MFIs : Institutional and Financial Performance 39
officers. Involvement of women in the field operation would enhance service efficiency, given the fact that 95 per cent of MFI clients served are women.
Figure 3 : MFI Field Vs Other Staff Distribution - 2013
3
Figure 3 : MFI Field Vs Other Staff Distribution - 2013
71 %
29 %
Field Staff
Other staff
Of total staff , 16 % were women staff
51051
12975 15295
0
10000
20000
30000
40000
50000
60000
2011 2012 2013
No.
of N
ew s
taff
rec
ruite
d
Figure 4 : New Staff Recruited by MFIs over Years
3
Figure 3 : MFI Field Vs Other Staff Distribution - 2013
71 %
29 %
Field Staff
Other staff
Of total staff , 16 % were women staff
51051
12975 15295
0
10000
20000
30000
40000
50000
60000
2011 2012 2013
No.
of N
ew s
taff
rec
ruite
d
Figure 4 : New Staff Recruited by MFIs over Years Figure 4 : New Staff Recruited by MFIs over the Years
The number of new staff recruited came down year after year, reflecting the slow-down in the sector (Figure 4).
Break-up figures of new staff further indicate that majorly For-profit MFIs recruited new staff. The disturbing trend is the level of staff turn-over (Table 2). Exit of staff from the sector and induction of new staff escalate operating cost for training and orienting new staff frequently.
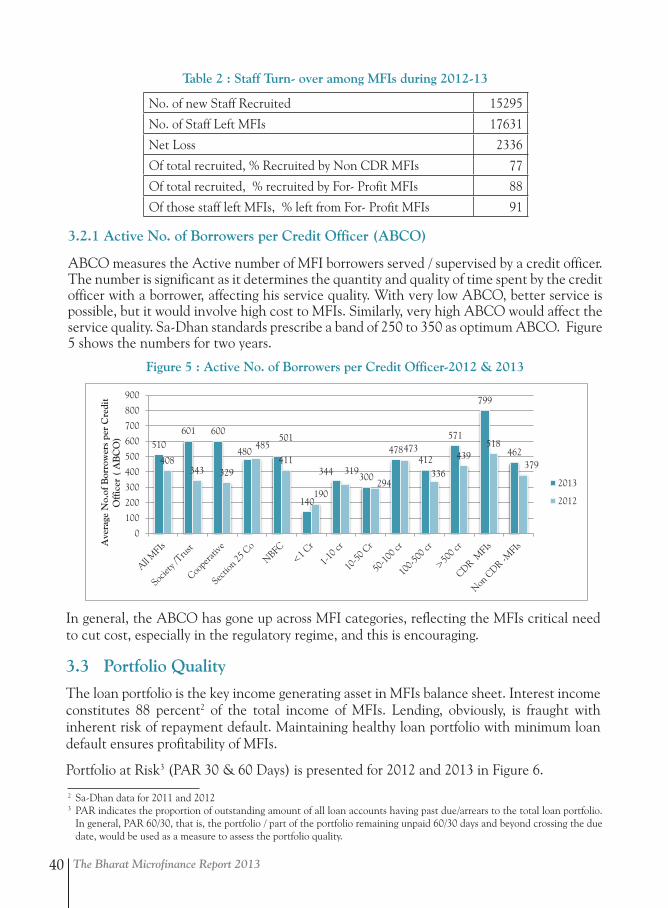
The Bharat Microfinance Report 201340
Table 2 : Staff Turn- over among MFIs during 2012-13
No. of new Staff Recruited 15295
No. of Staff Left MFIs 17631
Net Loss 2336
Of total recruited, % Recruited by Non CDR MFIs 77
Of total recruited, % recruited by For- Profit MFIs 88
Of those staff left MFIs, % left from For- Profit MFIs 91
3.2.1 Active No. of Borrowers per Credit Officer (ABCO)
ABCO measures the Active number of MFI borrowers served / supervised by a credit officer. The number is significant as it determines the quantity and quality of time spent by the credit officer with a borrower, affecting his service quality. With very low ABCO, better service is possible, but it would involve high cost to MFIs. Similarly, very high ABCO would affect the service quality. Sa-Dhan standards prescribe a band of 250 to 350 as optimum ABCO. Figure 5 shows the numbers for two years.
Figure 5 : Active No. of Borrowers per Credit Officer-2012 & 2013Figure 5 : Average No. of Borrowers per Credit officer (Case Load) -2012 & 2013
510 601 600
480 501
140
344 300
478 412
571
799
462 408
343 329
485
411
190
319 294
473
336
439 518
379
0
100
200
300
400
500
600
700
800
900
Ave
rage
No.
of B
orro
wer
s pe
r C
redi
t O
ffic
er (
AB
CO
)
2013
2012
In general, the ABCO has gone up across MFI categories, reflecting the MFIs critical need to cut cost, especially in the regulatory regime, and this is encouraging.
3.3 Portfolio Quality
The loan portfolio is the key income generating asset in MFIs balance sheet. Interest income constitutes 88 percent2 of the total income of MFIs. Lending, obviously, is fraught with inherent risk of repayment default. Maintaining healthy loan portfolio with minimum loan default ensures profitability of MFIs.
Portfolio at Risk3 (PAR 30 & 60 Days) is presented for 2012 and 2013 in Figure 6.
2 Sa-Dhan data for 2011 and 20123 PAR indicates the proportion of outstanding amount of all loan accounts having past due/arrears to the total loan portfolio.
In general, PAR 60/30, that is, the portfolio / part of the portfolio remaining unpaid 60/30 days and beyond crossing the due date, would be used as a measure to assess the portfolio quality.
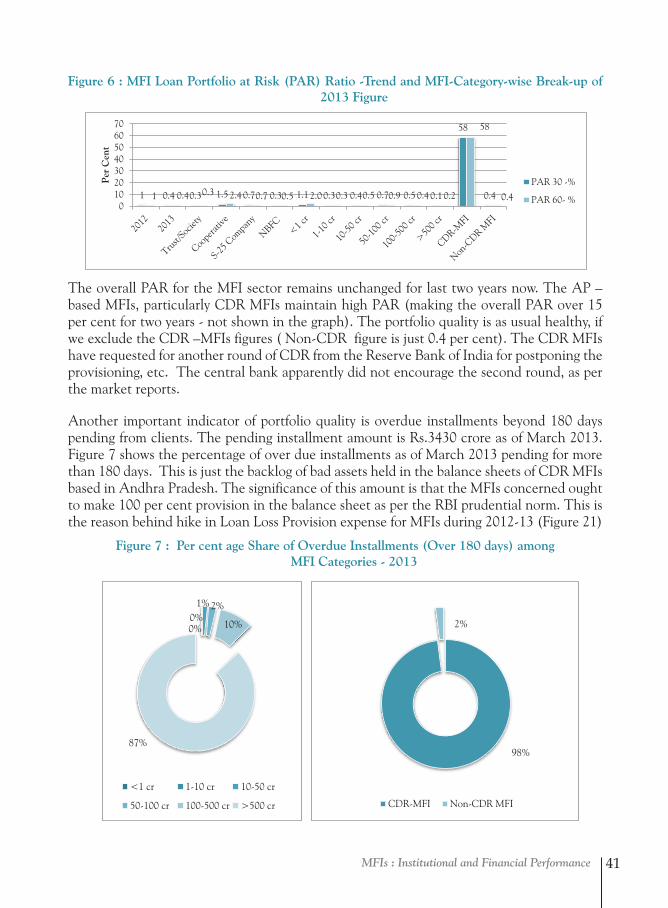
MFIs : Institutional and Financial Performance 41
Figure 6 : MFI Loan Portfolio at Risk (PAR) Ratio -Trend and MFI-Category-wise Break-up of 2013 Figure
The overall PAR for the MFI sector remains unchanged for last two years now. The AP –based MFIs, particularly CDR MFIs maintain high PAR (making the overall PAR over 15 per cent for two years - not shown in the graph). The portfolio quality is as usual healthy, if we exclude the CDR –MFIs figures ( Non-CDR figure is just 0.4 per cent). The CDR MFIs have requested for another round of CDR from the Reserve Bank of India for postponing the provisioning, etc. The central bank apparently did not encourage the second round, as per the market reports.
Another important indicator of portfolio quality is overdue installments beyond 180 days pending from clients. The pending installment amount is Rs.3430 crore as of March 2013. Figure 7 shows the percentage of over due installments as of March 2013 pending for more than 180 days. This is just the backlog of bad assets held in the balance sheets of CDR MFIs based in Andhra Pradesh. The significance of this amount is that the MFIs concerned ought to make 100 per cent provision in the balance sheet as per the RBI prudential norm. This is the reason behind hike in Loan Loss Provision expense for MFIs during 2012-13 (Figure 21)
Figure 7 : Per cent age Share of Overdue Installments (Over 180 days) among MFI Categories - 2013
Figure 6 : MFI Loan Portfolio at Risk (PAR) Ratio -Trend and MFI Category wise Break-up of 2013 Figure
1 0.4 0.3 1.5 0.7 0.3 1.1 0.3 0.4 0.7 0.5 0.1
58
0.4 1 0.4 0.3 2.4 0.7 0.5 2.0 0.3 0.5 0.9 0.4 0.2
58
0.4 0
10203040506070
Per
Cen
t
PAR 30 -%
PAR 60- %
Figure 7 : Per cent age Share of Overdue Installments (Over 180 days) among MFI Categories - 2013
98%
2%
CDR-MFI Non-CDR MFI
0% 0%
1% 2%
10%
87%
<1 cr 1-10 cr 10-50 cr
50-100 cr 100-500 cr >500 cr
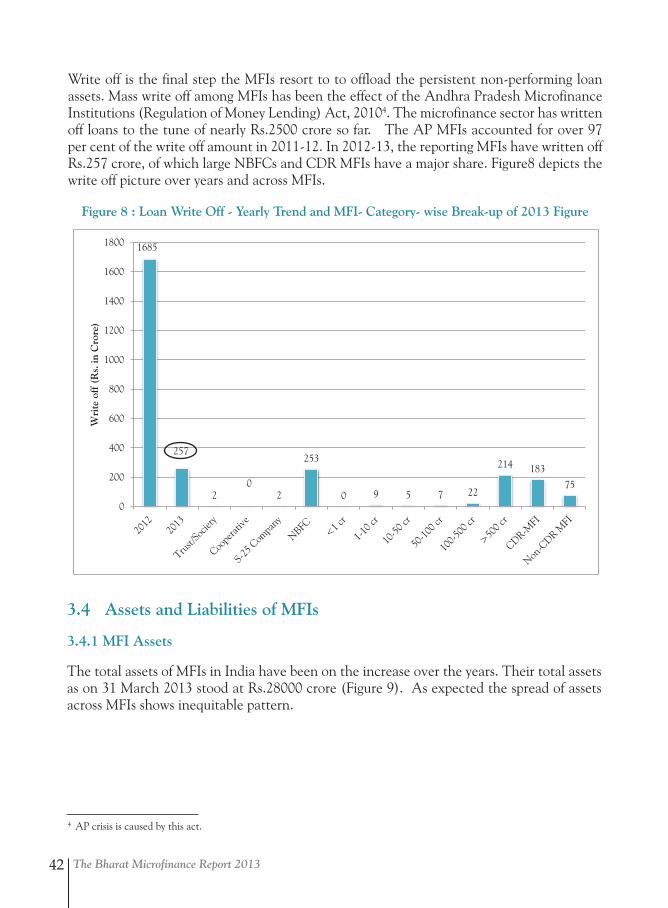
The Bharat Microfinance Report 201342
Write off is the final step the MFIs resort to to offload the persistent non-performing loan assets. Mass write off among MFIs has been the effect of the Andhra Pradesh Microfinance Institutions (Regulation of Money Lending) Act, 20104. The microfinance sector has written off loans to the tune of nearly Rs.2500 crore so far. The AP MFIs accounted for over 97 per cent of the write off amount in 2011-12. In 2012-13, the reporting MFIs have written off Rs.257 crore, of which large NBFCs and CDR MFIs have a major share. Figure8 depicts the write off picture over years and across MFIs.
Figure 8 : Loan Write Off - Yearly Trend and MFI- Category- wise Break-up of 2013 Figure
4 AP crisis is caused by this act.
Figure 8 : Loan Write Off - Yearly Trend and MFI- Category- wise Break-up of 2013 Figure
1685
257
2 0
2
253
0 9 5 7 22
214 183
75
0
200
400
600
800
1000
1200
1400
1600
1800
Wri
te o
ff (
Rs.
in C
rore
)
3.4 Assets and Liabilities of MFIs
3.4.1 MFI Assets
The total assets of MFIs in India have been on the increase over the years. Their total assets as on 31 March 2013 stood at Rs.28000 crore (Figure 9). As expected the spread of assets across MFIs shows inequitable pattern.
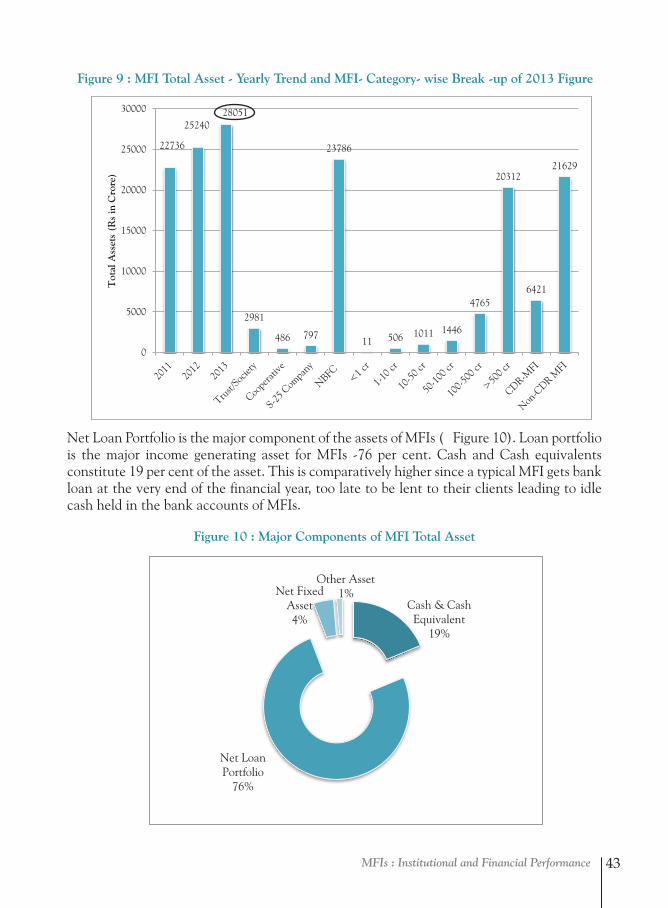
MFIs : Institutional and Financial Performance 43
Figure 9 : MFI Total Asset - Yearly Trend and MFI- Category- wise Break -up of 2013 Figure
Figure 10 : Major Components of MFI Total Asset
22736
25240 28051
2981
486 797
23786
11 506 1011 1446
4765
20312
6421
21629
0
5000
10000
15000
20000
25000
30000T
otal
Ass
ets
(Rs
in C
rore
)
Cash & Cash Equivalent
19%
Net Loan Portfolio
76%
Net Fixed Asset 4%
Other Asset 1%
Figure 10 : Major Components of MFI Total Asset
22736
25240 28051
2981
486 797
23786
11 506 1011 1446
4765
20312
6421
21629
0
5000
10000
15000
20000
25000
30000
Tot
al A
sset
s (R
s in
Cro
re)
Cash & Cash Equivalent
19%
Net Loan Portfolio
76%
Net Fixed Asset 4%
Other Asset 1%
Net Loan Portfolio is the major component of the assets of MFIs ( Figure 10). Loan portfolio is the major income generating asset for MFIs -76 per cent. Cash and Cash equivalents constitute 19 per cent of the asset. This is comparatively higher since a typical MFI gets bank loan at the very end of the financial year, too late to be lent to their clients leading to idle cash held in the bank accounts of MFIs.
Figure 10 : Major Components of MFI Total Asset
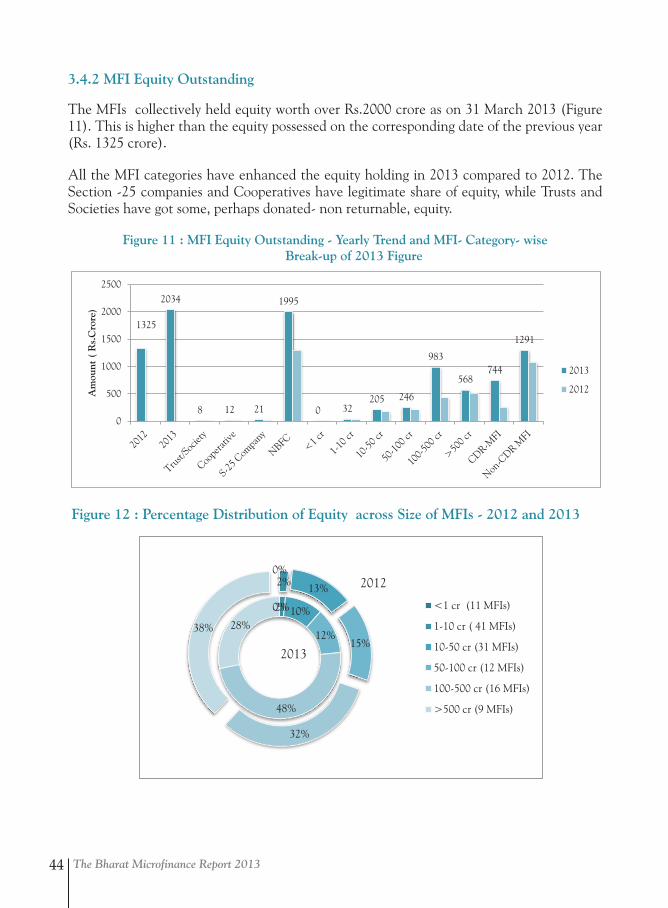
The Bharat Microfinance Report 201344
3.4.2 MFI Equity Outstanding
The MFIs collectively held equity worth over Rs.2000 crore as on 31 March 2013 (Figure 11). This is higher than the equity possessed on the corresponding date of the previous year (Rs. 1325 crore).
All the MFI categories have enhanced the equity holding in 2013 compared to 2012. The Section -25 companies and Cooperatives have legitimate share of equity, while Trusts and Societies have got some, perhaps donated- non returnable, equity.
Figure 11 : MFI Equity Outstanding - Yearly Trend and MFI- Category- wise Break-up of 2013 Figure
Figure 11 : MFI Equity Outstanding - Yearly Trend and MFI- Category- wise Break-up of 2013 Figure
Figure 12 : Percentage Distribution of Equity across Size of MFIs - 2012 and 2013
1325
2034
8 12 21
1995
0 32 205 246
983
568 744
1291
0
500
1000
1500
2000
2500
Am
ount
( R
s.C
rore
)
2013
2012
0% 2% 10%
12%
48%
28%
0% 2% 13%
15%
32%
38%
<1 cr (11 MFIs)
1-10 cr ( 41 MFIs)
10-50 cr (31 MFIs)
50-100 cr (12 MFIs)
100-500 cr (16 MFIs)
>500 cr (9 MFIs)
2013
2012
Figure 12 : Percentage Distribution of Equity across Size of MFIs - 2012 and 2013
Figure 11 : MFI Equity Outstanding - Yearly Trend and MFI- Category- wise Break-up of 2013 Figure
Figure 12 : Percentage Distribution of Equity across Size of MFIs - 2012 and 2013
1325
2034
8 12 21
1995
0 32 205 246
983
568 744
1291
0
500
1000
1500
2000
2500
Am
ount
( R
s.C
rore
)
2013
2012
0% 2% 10%
12%
48%
28%
0% 2% 13%
15%
32%
38%
<1 cr (11 MFIs)
1-10 cr ( 41 MFIs)
10-50 cr (31 MFIs)
50-100 cr (12 MFIs)
100-500 cr (16 MFIs)
>500 cr (9 MFIs)
2013
2012
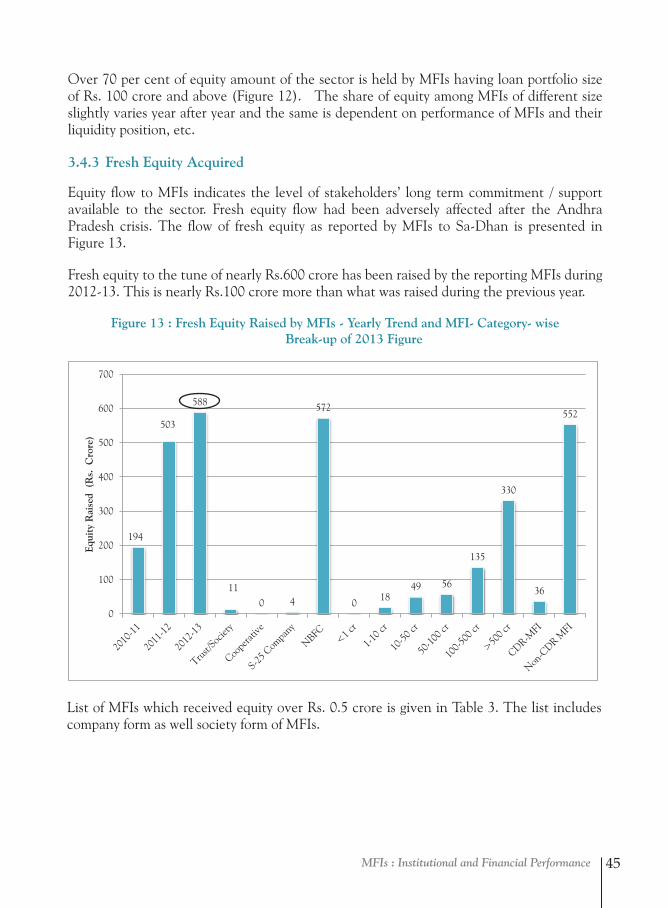
MFIs : Institutional and Financial Performance 45
Over 70 per cent of equity amount of the sector is held by MFIs having loan portfolio size of Rs. 100 crore and above (Figure 12). The share of equity among MFIs of different size slightly varies year after year and the same is dependent on performance of MFIs and their liquidity position, etc.
3.4.3 Fresh Equity Acquired
Equity flow to MFIs indicates the level of stakeholders’ long term commitment / support available to the sector. Fresh equity flow had been adversely affected after the Andhra Pradesh crisis. The flow of fresh equity as reported by MFIs to Sa-Dhan is presented in Figure 13.
Fresh equity to the tune of nearly Rs.600 crore has been raised by the reporting MFIs during 2012-13. This is nearly Rs.100 crore more than what was raised during the previous year.
Figure 13 : Fresh Equity Raised by MFIs - Yearly Trend and MFI- Category- wise Break-up of 2013 Figure
Figure 13 : Fresh Equity Raised by MFIs - Yearly Trend and MFI- Category- wise Break-up of 2013 Figure
194
503
588
11 0 4
572
0 18 49 56
135
330
36
552
0
100
200
300
400
500
600
700
Equi
ty R
aise
d (
Rs.
Cro
re)
List of MFIs which received equity over Rs. 0.5 crore is given in Table 3. The list includes company form as well society form of MFIs.
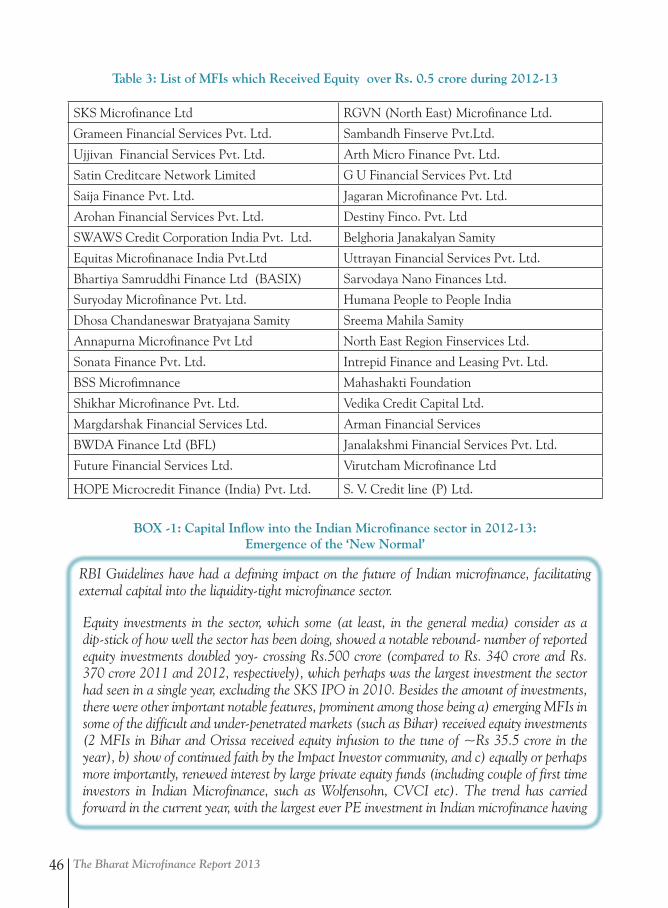
The Bharat Microfinance Report 201346
Table 3: List of MFIs which Received Equity over Rs. 0.5 crore during 2012-13
SKS Microfinance Ltd RGVN (North East) Microfinance Ltd.
Grameen Financial Services Pvt. Ltd. Sambandh Finserve Pvt.Ltd.
Ujjivan Financial Services Pvt. Ltd. Arth Micro Finance Pvt. Ltd.
Satin Creditcare Network Limited G U Financial Services Pvt. Ltd
Saija Finance Pvt. Ltd. Jagaran Microfinance Pvt. Ltd.
Arohan Financial Services Pvt. Ltd. Destiny Finco. Pvt. Ltd
SWAWS Credit Corporation India Pvt. Ltd. Belghoria Janakalyan Samity
Equitas Microfinanace India Pvt.Ltd Uttrayan Financial Services Pvt. Ltd.
Bhartiya Samruddhi Finance Ltd (BASIX) Sarvodaya Nano Finances Ltd.
Suryoday Microfinance Pvt. Ltd. Humana People to People India
Dhosa Chandaneswar Bratyajana Samity Sreema Mahila Samity
Annapurna Microfinance Pvt Ltd North East Region Finservices Ltd.
Sonata Finance Pvt. Ltd. Intrepid Finance and Leasing Pvt. Ltd.
BSS Microfimnance Mahashakti Foundation
Shikhar Microfinance Pvt. Ltd. Vedika Credit Capital Ltd.
Margdarshak Financial Services Ltd. Arman Financial Services
BWDA Finance Ltd (BFL) Janalakshmi Financial Services Pvt. Ltd.
Future Financial Services Ltd. Virutcham Microfinance Ltd
HOPE Microcredit Finance (India) Pvt. Ltd. S. V. Credit line (P) Ltd.
BOX -1: Capital Inflow into the Indian Microfinance sector in 2012-13:Emergence of the ‘New Normal’
RBI Guidelines have had a defining impact on the future of Indian microfinance, facilitating external capital into the liquidity-tight microfinance sector.
Equity investments in the sector, which some (at least, in the general media) consider as a dip-stick of how well the sector has been doing, showed a notable rebound- number of reported equity investments doubled yoy- crossing Rs.500 crore (compared to Rs. 340 crore and Rs. 370 crore 2011 and 2012, respectively), which perhaps was the largest investment the sector had seen in a single year, excluding the SKS IPO in 2010. Besides the amount of investments, there were other important notable features, prominent among those being a) emerging MFIs in some of the difficult and under-penetrated markets (such as Bihar) received equity investments (2 MFIs in Bihar and Orissa received equity infusion to the tune of ~Rs 35.5 crore in the year), b) show of continued faith by the Impact Investor community, and c) equally or perhaps more importantly, renewed interest by large private equity funds (including couple of first time investors in Indian Microfinance, such as Wolfensohn, CVCI etc). The trend has carried forward in the current year, with the largest ever PE investment in Indian microfinance having
MFIs : Institutional and Financial Performance 47
been announced in a large urban MFI. This helps the argument that the underlying business model continues to be strong, despite the stringent regulations that the sector now faces.
On an aggregate level, MFIs ability to raise debt also showed marked increase over the previous fiscal, though banks remain the largest source (>80%) of debt followed by non-banks/FIs. Though the debt capital markets activity seems to be picking up, a few Non-convertible debenture (NCD) issuances were made by NBFC MFIs in the year and several are in the pipeline. Though given the NCDs don’t qualify as PSL, Banks have largely stayed away from investing in these, and most investors have been Foreign Institutional investors (besides small, opportunistic investments by domestic wealth managers), which otherwise have limited ability to do debt for Indian MFIs. This was also largely focused on top tier / large players and smaller MFIs continue to face challenges on this front. In view of clarity in the guidelines and continued benefit on the priority sector lending classification (versus gold loan companies PSL benefit being taken away), Bank funding to MFI showed signs of improving. Investors also showed strong interest in microfinance paper with close to Rs. 2900 billion in microfinance assets securitized, primarily to Banks. This again was concentrated with larger (top 5) MFIs, though many smaller MFIs also participated for the first time, through multi-originator pool securitizations.
The regulations around external commercial borrowings (ECB) were relaxed for NBFC MFIs5 and could potentially emerge as a strong source of capital for NBFC MFIs in the near future. NGOs engaged in microfinance are allowed to raise ECBs, though aggregate external commercial borrowings by NGOs for microfinance, isn’t very si gnificant (less than 24 crore in 2012-13) compared to the total debt. While no for-profit MFIs were able to take advantage of this route, since NBFC MFI licenses were pending, now that the RBI has started issuing the licenses, we are likely to see some traction, despite the concern on pricing (‘all-in-cost ceiling’ on ECB) and the volatile rupee, primarily with Development Financial Institutions as likely sources.
- Shashi Shrivastava, Grameen Capital India, Mumbai
3.4.4. Leverage / Debt –Equity6 Ratio
MFIs, like any other business institutions, use own fund as a base for borrowing from banks. Their borrowing capacity depends on their capital. The leverage is generally understood as the multiples of own capital amount; these borrowings are from outside sources including banks. Debt-Equity Ratio is the parameter considered for measuring the extent of leveraging of equity to raise outside debt. The leverage needs to be optimum to balance between profitability and stability of MFIs.
The Debt–Equity Ratio has remained the same in both years 2012 and 2013. Trust and Society has the highest Debt- Equity Ratio. Over leveraging is not a healthy sign, in general.
5 December 20116 Here Equity refers to Net Owned Fund (Equity + Free Reserves and Surplus)
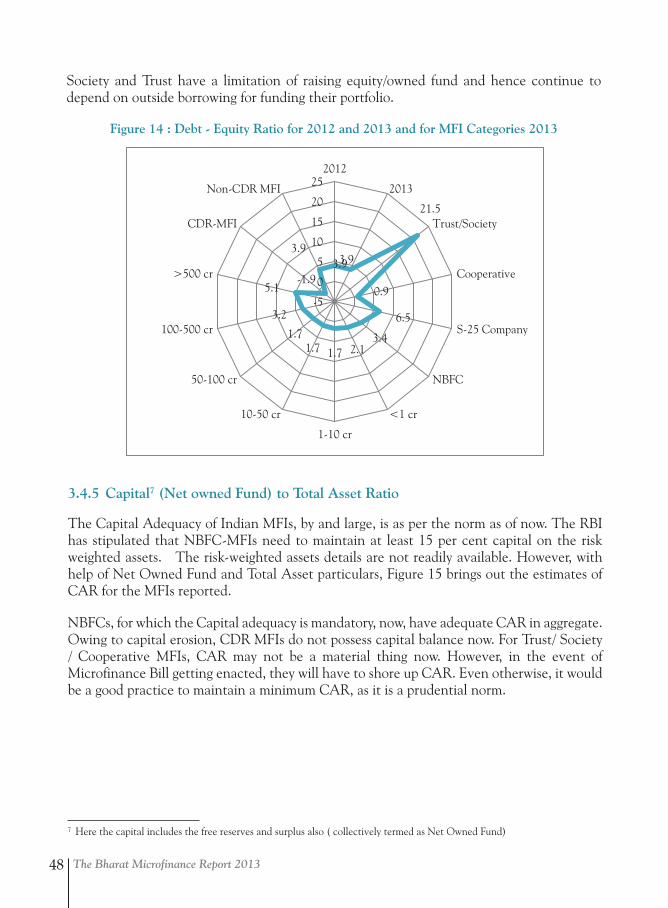
The Bharat Microfinance Report 201348
Society and Trust have a limitation of raising equity/owned fund and hence continue to depend on outside borrowing for funding their portfolio.
Figure 14 : Debt - Equity Ratio for 2012 and 2013 and for MFI Categories 2013
3.4.5 Capital7 (Net owned Fund) to Total Asset Ratio
The Capital Adequacy of Indian MFIs, by and large, is as per the norm as of now. The RBI has stipulated that NBFC-MFIs need to maintain at least 15 per cent capital on the risk weighted assets. The risk-weighted assets details are not readily available. However, with help of Net Owned Fund and Total Asset particulars, Figure 15 brings out the estimates of CAR for the MFIs reported.
NBFCs, for which the Capital adequacy is mandatory, now, have adequate CAR in aggregate. Owing to capital erosion, CDR MFIs do not possess capital balance now. For Trust/ Society / Cooperative MFIs, CAR may not be a material thing now. However, in the event of Microfinance Bill getting enacted, they will have to shore up CAR. Even otherwise, it would be a good practice to maintain a minimum CAR, as it is a prudential norm.
Figure 14 : Debt - Equity Ratio for 2012 and 2013 and for MFI Categories 2013
3.9 3.9
21.5
0.9
6.5
3.4 2.1 1.7 1.7
1.7
3.2
5.1 -1.9
3.9
-5
0
5
10
15
20
252012
2013
Trust/Society
Cooperative
S-25 Company
NBFC
<1 cr
1-10 cr
10-50 cr
50-100 cr
100-500 cr
>500 cr
CDR-MFI
Non-CDR MFI
7 Here the capital includes the free reserves and surplus also ( collectively termed as Net Owned Fund)
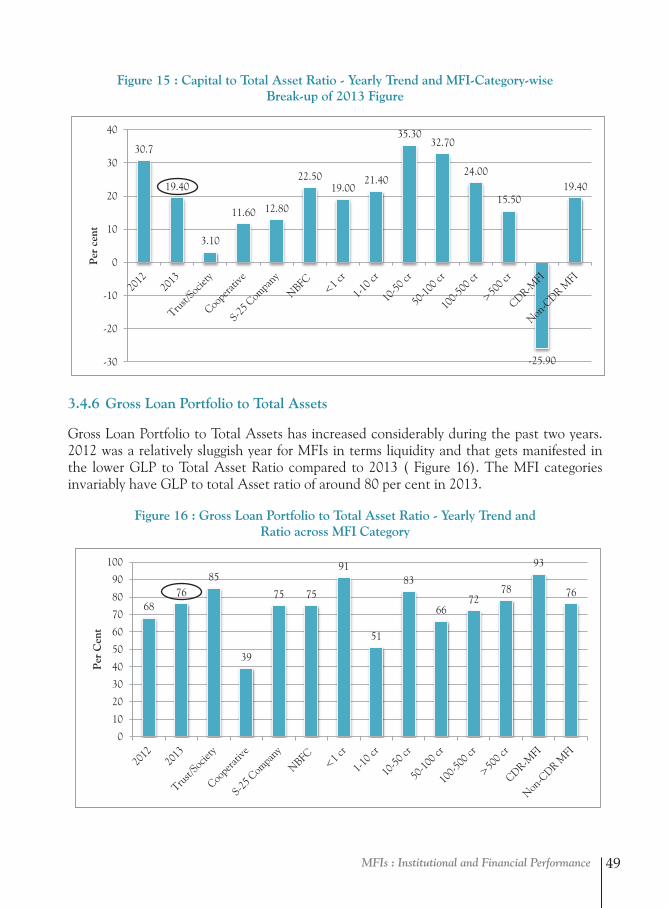
MFIs : Institutional and Financial Performance 49
Figure 15 : Capital to Total Asset Ratio - Yearly Trend and MFI-Category-wiseBreak-up of 2013 Figure Figure 15 : Capital to Total Asset Ratio - Yearly Trend and MFI-Category-wise Break-up of 2013 Figure
30.7
19.40
3.10
11.60 12.80
22.50 19.00
21.40
35.30 32.70
24.00
15.50
-25.90
19.40
-30
-20
-10
0
10
20
30
40
Per
cen
t
3.4.6 Gross Loan Portfolio to Total Assets
Gross Loan Portfolio to Total Assets has increased considerably during the past two years. 2012 was a relatively sluggish year for MFIs in terms liquidity and that gets manifested in the lower GLP to Total Asset Ratio compared to 2013 ( Figure 16). The MFI categories invariably have GLP to total Asset ratio of around 80 per cent in 2013.
Figure 16 : Gross Loan Portfolio to Total Asset Ratio - Yearly Trend andRatio across MFI Category
Figure 16 : Gross Loan Portfolio to Total Asset Ratio - Yearly Trend and Ratio across MFI Category
68 76
85
39
75 75
91
51
83
66 72
78
93
76
0
10
20
30
40
50
60
70
80
90
100
Per
Cen
t
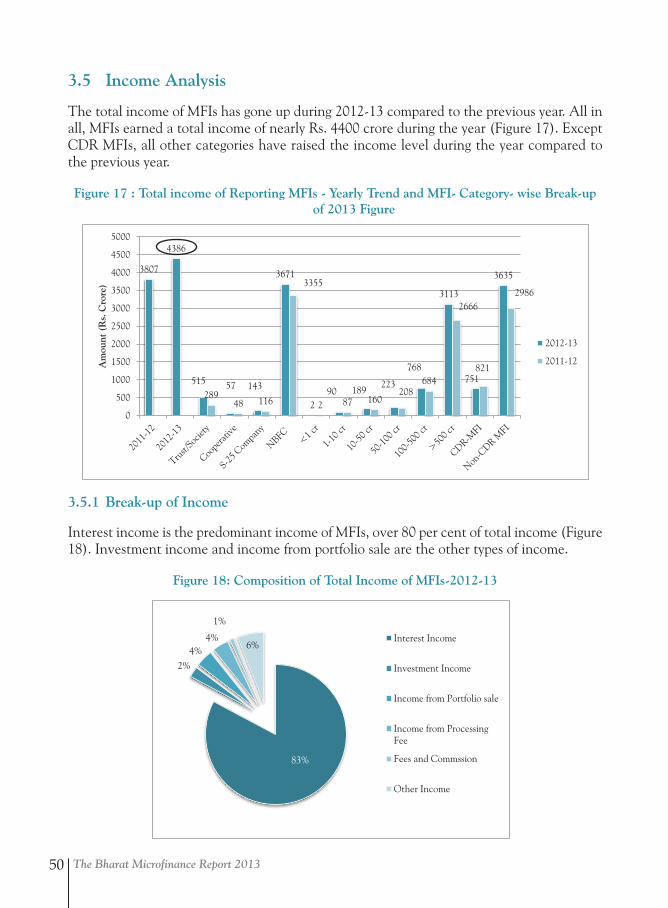
The Bharat Microfinance Report 201350
3.5 Income Analysis
The total income of MFIs has gone up during 2012-13 compared to the previous year. All in all, MFIs earned a total income of nearly Rs. 4400 crore during the year (Figure 17). Except CDR MFIs, all other categories have raised the income level during the year compared to the previous year.
Figure 17 : Total income of Reporting MFIs - Yearly Trend and MFI- Category- wise Break-up of 2013 FigureFigure 17 : Total income of Reporting MFIs - Yearly Trend and MFI- Category- wise Break-up of 2013 Figure
Figure 18: Composition of Total Income of MFIs-2012-13
3807
4386
515 57 143
3671
2 90 189
223
768
3113
751
3635
289 48 116
3355
2 87 160 208
684
2666
821
2986
0
500
1000
1500
2000
2500
3000
3500
4000
4500
5000
Am
ount
(R
s. C
rore
)
2012-13
2011-12
83%
2% 4%
4%
1%
6% Interest Income
Investment Income
Income from Portfolio sale
Income from ProcessingFee
Fees and Commssion
Other Income
Figure 17 : Total income of Reporting MFIs - Yearly Trend and MFI- Category- wise Break-up of 2013 Figure
Figure 18: Composition of Total Income of MFIs-2012-13
3807
4386
515 57 143
3671
2 90 189
223
768
3113
751
3635
289 48 116
3355
2 87 160 208
684
2666
821
2986
0
500
1000
1500
2000
2500
3000
3500
4000
4500
5000
Am
ount
(R
s. C
rore
)
2012-13
2011-12
83%
2% 4%
4%
1%
6% Interest Income
Investment Income
Income from Portfolio sale
Income from ProcessingFee
Fees and Commssion
Other Income
3.5.1 Break-up of Income
Interest income is the predominant income of MFIs, over 80 per cent of total income (Figure 18). Investment income and income from portfolio sale are the other types of income.
Figure 18: Composition of Total Income of MFIs-2012-13
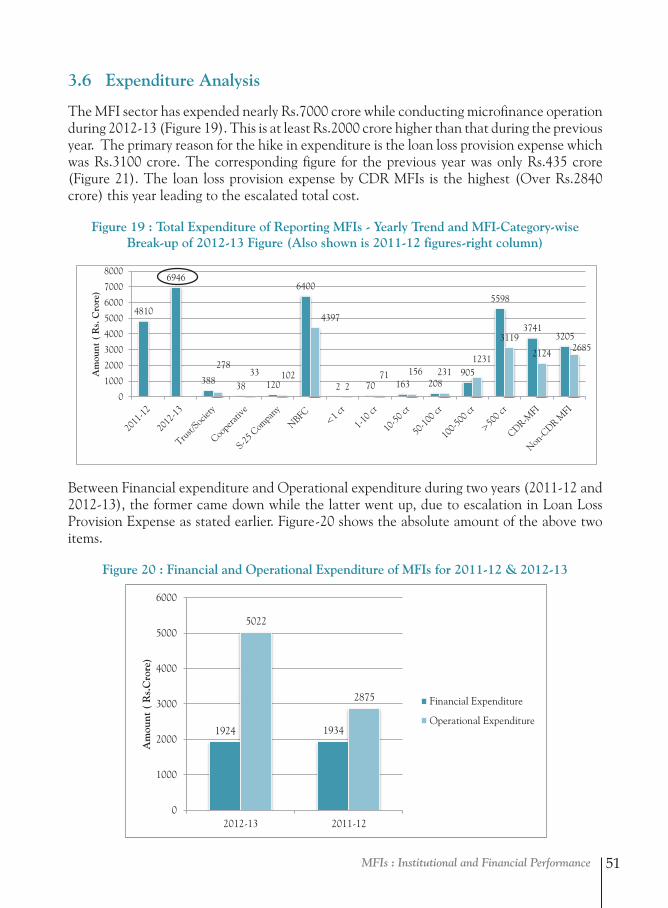
MFIs : Institutional and Financial Performance 51
3.6 Expenditure Analysis
The MFI sector has expended nearly Rs.7000 crore while conducting microfinance operation during 2012-13 (Figure 19). This is at least Rs.2000 crore higher than that during the previous year. The primary reason for the hike in expenditure is the loan loss provision expense which was Rs.3100 crore. The corresponding figure for the previous year was only Rs.435 crore (Figure 21). The loan loss provision expense by CDR MFIs is the highest (Over Rs.2840 crore) this year leading to the escalated total cost.
Figure 19 : Total Expenditure of Reporting MFIs - Yearly Trend and MFI-Category-wiseBreak-up of 2012-13 Figure (Also shown is 2011-12 figures-right column)
Between Financial expenditure and Operational expenditure during two years (2011-12 and 2012-13), the former came down while the latter went up, due to escalation in Loan Loss Provision Expense as stated earlier. Figure-20 shows the absolute amount of the above two items.
Figure 20 : Financial and Operational Expenditure of MFIs for 2011-12 & 2012-13
Figure 19 : Total Expenditure of Reporting MFIs - Yearly Trend and MFI-Category-wise Break-up of 2012-13 Figure
4810
6946
388 38 120
6400
2 70 163 208 905
5598
3741 3205
278 33 102
4397
2 71 156 231
1231
3119
2124 2685
0
1000
2000
3000
4000
5000
6000
7000
8000
Am
ount
( R
s. C
rore
)
Figure 20 : Financial and Operational Expenditure of MFIs for 2011-12 & 2012-13
Figure 21 : Break-up of Operational Expenditure of MFIs
1924 1934
5022
2875
0
1000
2000
3000
4000
5000
6000
2012-13 2011-12
Am
ount
( R
s.C
rore
)
Financial Expenditure
Operational Expenditure
1070 1208
3122
435
816
1236
0
500
1000
1500
2000
2500
3000
3500
2012-13 2011-12
Am
ount
( R
s.C
rore
)
Salary Expenditure
Loan Loss Provision
Admn.Expenditure
Other Expenditure
12 2
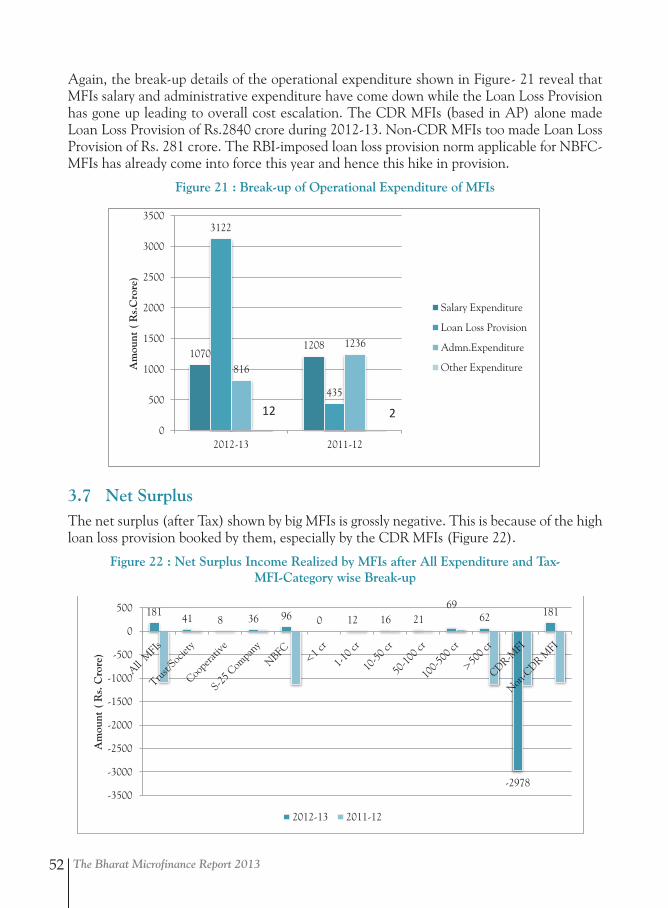
The Bharat Microfinance Report 201352
Again, the break-up details of the operational expenditure shown in Figure- 21 reveal that MFIs salary and administrative expenditure have come down while the Loan Loss Provision has gone up leading to overall cost escalation. The CDR MFIs (based in AP) alone made Loan Loss Provision of Rs.2840 crore during 2012-13. Non-CDR MFIs too made Loan Loss Provision of Rs. 281 crore. The RBI-imposed loan loss provision norm applicable for NBFC-MFIs has already come into force this year and hence this hike in provision.
Figure 21 : Break-up of Operational Expenditure of MFIs
Figure 20 : Financial and Operational Expenditure of MFIs for 2011-12 & 2012-13
Figure 21 : Break-up of Operational Expenditure of MFIs
1924 1934
5022
2875
0
1000
2000
3000
4000
5000
6000
2012-13 2011-12
Am
ount
( R
s.C
rore
)
Financial Expenditure
Operational Expenditure
1070 1208
3122
435
816
1236
0
500
1000
1500
2000
2500
3000
3500
2012-13 2011-12
Am
ount
( R
s.C
rore
)
Salary Expenditure
Loan Loss Provision
Admn.Expenditure
Other Expenditure
12 2
3.7 Net SurplusThe net surplus (after Tax) shown by big MFIs is grossly negative. This is because of the high loan loss provision booked by them, especially by the CDR MFIs (Figure 22).
Figure 22 : Net Surplus Income Realized by MFIs after All Expenditure and Tax-MFI-Category wise Break-up
181 41 8 36 96 0 12 16 21
69 62
-2978
181
-3500
-3000
-2500
-2000
-1500
-1000
-500
0
500
Am
ount
( R
s. C
rore
)
2012-13 2011-12
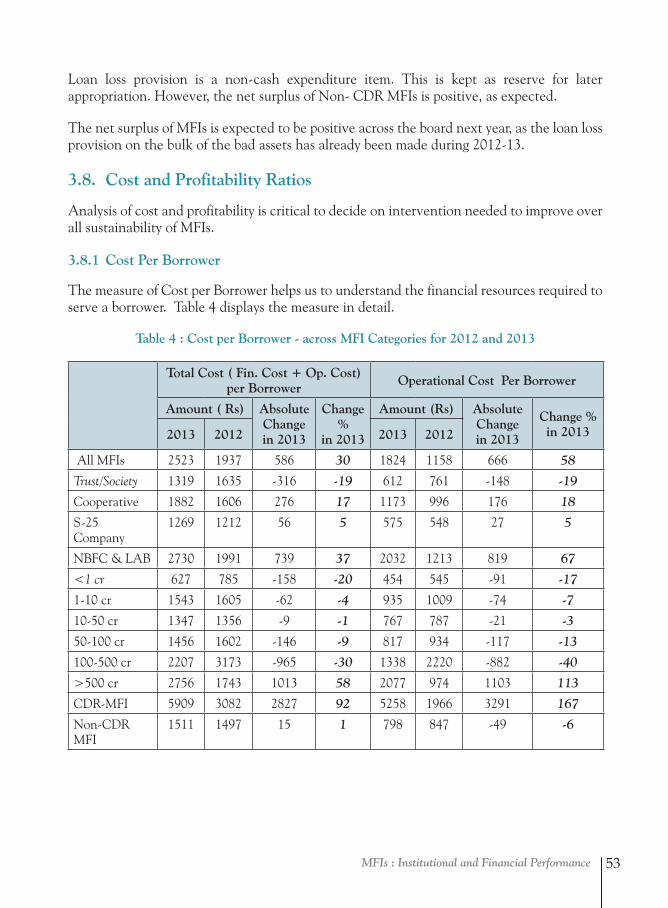
MFIs : Institutional and Financial Performance 53
Loan loss provision is a non-cash expenditure item. This is kept as reserve for later appropriation. However, the net surplus of Non- CDR MFIs is positive, as expected.
The net surplus of MFIs is expected to be positive across the board next year, as the loan loss provision on the bulk of the bad assets has already been made during 2012-13.
3.8. Cost and Profitability Ratios
Analysis of cost and profitability is critical to decide on intervention needed to improve over all sustainability of MFIs.
3.8.1 Cost Per Borrower
The measure of Cost per Borrower helps us to understand the financial resources required to serve a borrower. Table 4 displays the measure in detail.
Table 4 : Cost per Borrower - across MFI Categories for 2012 and 2013
Total Cost ( Fin. Cost + Op. Cost) per Borrower Operational Cost Per Borrower
Amount ( Rs) Absolute Changein 2013
Change %
in 2013
Amount (Rs) Absolute Changein 2013
Change %in 20132013 2012 2013 2012
All MFIs 2523 1937 586 30 1824 1158 666 58
Trust/Society 1319 1635 -316 -19 612 761 -148 -19
Cooperative 1882 1606 276 17 1173 996 176 18
S-25 Company
1269 1212 56 5 575 548 27 5
NBFC & LAB 2730 1991 739 37 2032 1213 819 67
<1 cr 627 785 -158 -20 454 545 -91 -17
1-10 cr 1543 1605 -62 -4 935 1009 -74 -7
10-50 cr 1347 1356 -9 -1 767 787 -21 -3
50-100 cr 1456 1602 -146 -9 817 934 -117 -13
100-500 cr 2207 3173 -965 -30 1338 2220 -882 -40
>500 cr 2756 1743 1013 58 2077 974 1103 113
CDR-MFI 5909 3082 2827 92 5258 1966 3291 167
Non-CDR MFI
1511 1497 15 1 798 847 -49 -6
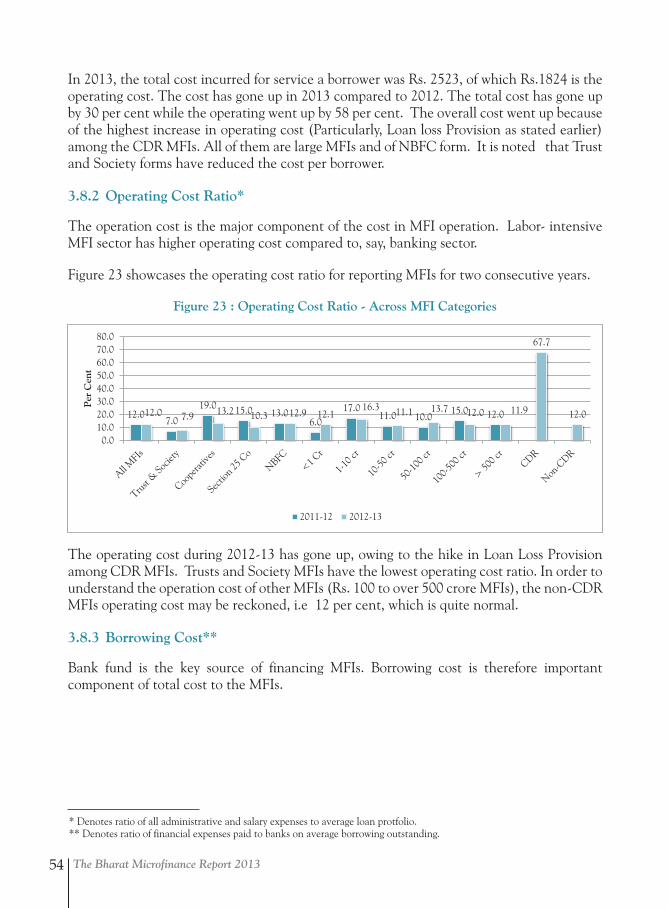
The Bharat Microfinance Report 201354
In 2013, the total cost incurred for service a borrower was Rs. 2523, of which Rs.1824 is the operating cost. The cost has gone up in 2013 compared to 2012. The total cost has gone up by 30 per cent while the operating went up by 58 per cent. The overall cost went up because of the highest increase in operating cost (Particularly, Loan loss Provision as stated earlier) among the CDR MFIs. All of them are large MFIs and of NBFC form. It is noted that Trust and Society forms have reduced the cost per borrower.
3.8.2 Operating Cost Ratio*
The operation cost is the major component of the cost in MFI operation. Labor- intensive MFI sector has higher operating cost compared to, say, banking sector.
Figure 23 showcases the operating cost ratio for reporting MFIs for two consecutive years.
Figure 23 : Operating Cost Ratio - Across MFI CategoriesFigure 23 : Operating Cost Ratio - Across MFI Categories
12.0 7.0
19.0 15.0 13.0 6.0
17.0 11.0 10.0
15.0 12.0 12.0 7.9 13.2 10.3 12.9 12.1 16.3 11.1 13.7 12.0 11.9
67.7
12.0
0.010.020.030.040.050.060.070.080.0
Per
Cen
t
2011-12 2012-13
The operating cost during 2012-13 has gone up, owing to the hike in Loan Loss Provision among CDR MFIs. Trusts and Society MFIs have the lowest operating cost ratio. In order to understand the operation cost of other MFIs (Rs. 100 to over 500 crore MFIs), the non-CDR MFIs operating cost may be reckoned, i.e 12 per cent, which is quite normal.
3.8.3 Borrowing Cost**
Bank fund is the key source of financing MFIs. Borrowing cost is therefore important component of total cost to the MFIs.
* Denotes ratio of all administrative and salary expenses to average loan protfolio.** Denotes ratio of financial expenses paid to banks on average borrowing outstanding.
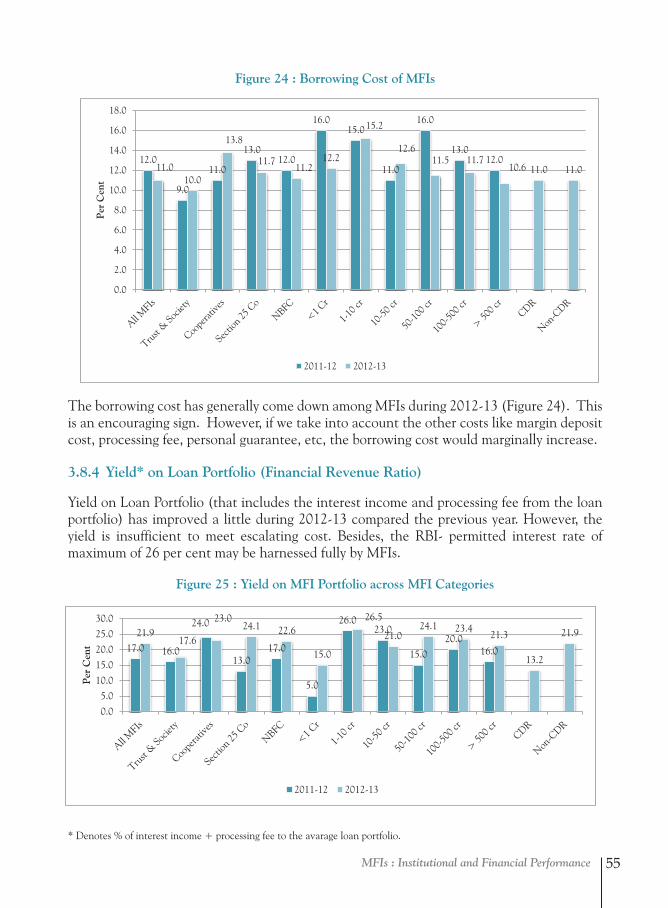
MFIs : Institutional and Financial Performance 55
Figure 24 : Borrowing Cost of MFIs
12.0
9.0
11.0
13.0 12.0
16.0 15.0
11.0
16.0
13.0 12.0
11.0 10.0
13.8
11.7 11.2
12.2
15.2
12.6 11.5 11.7
10.6 11.0 11.0
0.0
2.0
4.0
6.0
8.0
10.0
12.0
14.0
16.0
18.0P
er C
ent
2011-12 2012-13
Figure 24 : Borrowing Cost of MFIs
The borrowing cost has generally come down among MFIs during 2012-13 (Figure 24). This is an encouraging sign. However, if we take into account the other costs like margin deposit cost, processing fee, personal guarantee, etc, the borrowing cost would marginally increase.
3.8.4 Yield* on Loan Portfolio (Financial Revenue Ratio)
Yield on Loan Portfolio (that includes the interest income and processing fee from the loan portfolio) has improved a little during 2012-13 compared the previous year. However, the yield is insufficient to meet escalating cost. Besides, the RBI- permitted interest rate of maximum of 26 per cent may be harnessed fully by MFIs.
Figure 25 : Yield on MFI Portfolio across MFI CategoriesFigure 25 : Yield on MFI Portfolio across MFI Categories
Figure 26 : Operational Self Sufficiency (OSS) of MFIs during 2012-13
17.0 16.0
24.0
13.0 17.0
5.0
26.0 23.0
15.0
20.0 16.0
21.9 17.6
23.0 24.1 22.6
15.0
26.5
21.0 24.1 23.4
21.3
13.2
21.9
0.0
5.0
10.0
15.0
20.0
25.0
30.0
Per
Cen
t
2011-12 2012-13
111 113
151
119 109
102
131 116 115 111 109
19
111
0
20
40
60
80
100
120
140
160
Per
Cen
t
* Denotes % of interest income + processing fee to the avarage loan portfolio.
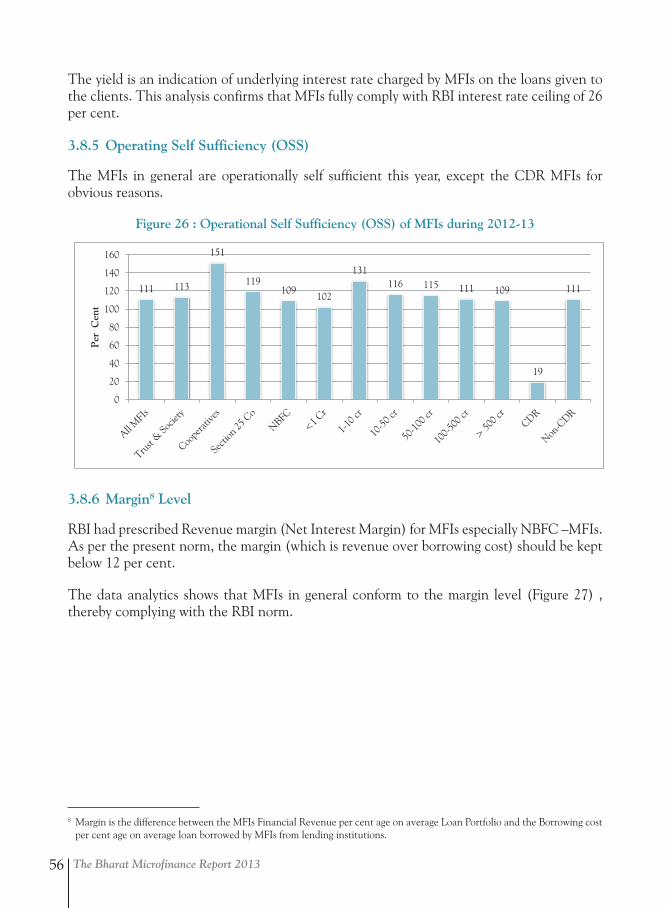
The Bharat Microfinance Report 201356
Figure 25 : Yield on MFI Portfolio across MFI Categories
Figure 26 : Operational Self Sufficiency (OSS) of MFIs during 2012-13
17.0 16.0
24.0
13.0 17.0
5.0
26.0 23.0
15.0
20.0 16.0
21.9 17.6
23.0 24.1 22.6
15.0
26.5
21.0 24.1 23.4
21.3
13.2
21.9
0.0
5.0
10.0
15.0
20.0
25.0
30.0
Per
Cen
t
2011-12 2012-13
111 113
151
119 109
102
131 116 115 111 109
19
111
0
20
40
60
80
100
120
140
160
Per
Cen
t The yield is an indication of underlying interest rate charged by MFIs on the loans given to the clients. This analysis confirms that MFIs fully comply with RBI interest rate ceiling of 26 per cent.
3.8.5 Operating Self Sufficiency (OSS)
The MFIs in general are operationally self sufficient this year, except the CDR MFIs for obvious reasons.
Figure 26 : Operational Self Sufficiency (OSS) of MFIs during 2012-13
3.8.6 Margin8 Level
RBI had prescribed Revenue margin (Net Interest Margin) for MFIs especially NBFC –MFIs. As per the present norm, the margin (which is revenue over borrowing cost) should be kept below 12 per cent.
The data analytics shows that MFIs in general conform to the margin level (Figure 27) , thereby complying with the RBI norm.
8 Margin is the difference between the MFIs Financial Revenue per cent age on average Loan Portfolio and the Borrowing cost per cent age on average loan borrowed by MFIs from lending institutions.
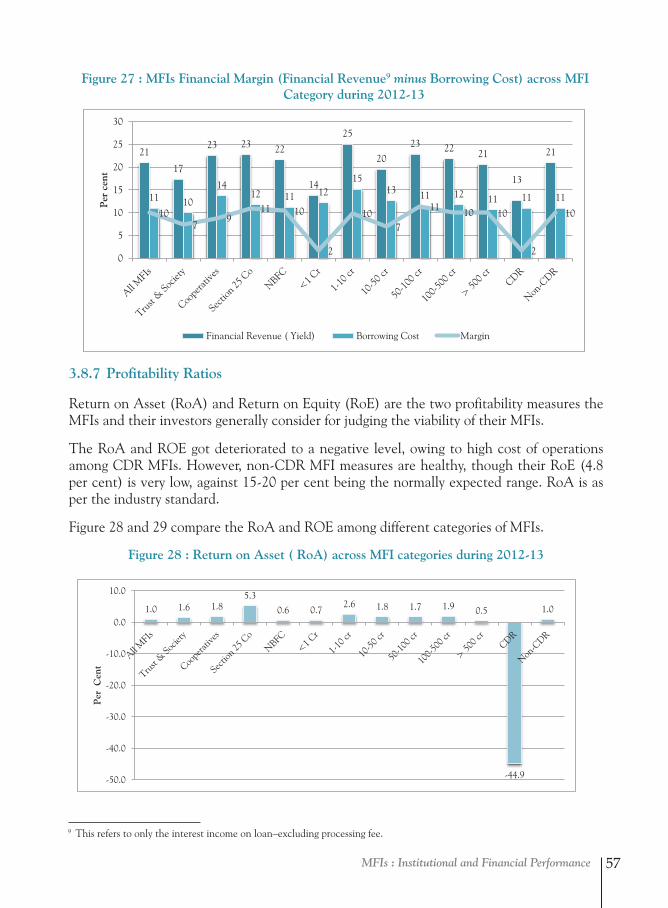
MFIs : Institutional and Financial Performance 57
Figure 27 : MFIs Financial Margin (Financial Revenue9 minus Borrowing Cost) across MFI Category during 2012-13
9 This refers to only the interest income on loan–excluding processing fee.
3.8.7 Profitability Ratios
Return on Asset (RoA) and Return on Equity (RoE) are the two profitability measures the MFIs and their investors generally consider for judging the viability of their MFIs.
The RoA and ROE got deteriorated to a negative level, owing to high cost of operations among CDR MFIs. However, non-CDR MFI measures are healthy, though their RoE (4.8 per cent) is very low, against 15-20 per cent being the normally expected range. RoA is as per the industry standard.
Figure 28 and 29 compare the RoA and ROE among different categories of MFIs.
Figure 28 : Return on Asset ( RoA) across MFI categories during 2012-13
Figure 27 : MFIs Financial Margin (Financial Revenue9 minus Borrowing Cost) across MFI Category during 2012-13
21
17
23 23 22
14
25
20 23 22 21
13
21
11 10
14 12 11 12
15 13 11 12 11 11 11
10 7
9 11 10
2
10 7
11 10 10
2
10
0
5
10
15
20
25
30
Per
cen
t
Financial Revenue ( Yield) Borrowing Cost Margin
Figure 28 : Return on Asset ( RoA) across MFI categories during 2012-13
Figure 29 : Return on Equity (RoE) across MFI Categories during 2012-13
1.0 1.6 1.8 5.3
0.6 0.7 2.6 1.8 1.7 1.9 0.5
-44.9
1.0
-50.0
-40.0
-30.0
-20.0
-10.0
0.0
10.0
Per
Cen
t
4.8 43.6
16.3 53.3
2.7 5.1 12.0 5.3 5.1 7.9 3.0
-472.8
4.8
-500.0
-400.0
-300.0
-200.0
-100.0
0.0
100.0
Per
Cen
t
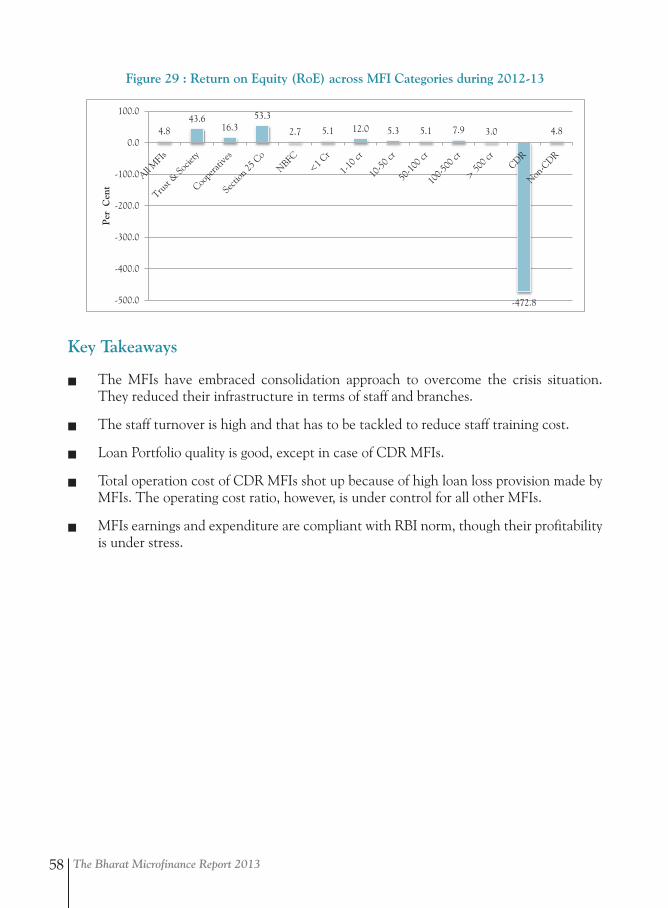
The Bharat Microfinance Report 201358
Figure 29 : Return on Equity (RoE) across MFI Categories during 2012-13
Figure 28 : Return on Asset ( RoA) across MFI categories during 2012-13
Figure 29 : Return on Equity (RoE) across MFI Categories during 2012-13
1.0 1.6 1.8 5.3
0.6 0.7 2.6 1.8 1.7 1.9 0.5
-44.9
1.0
-50.0
-40.0
-30.0
-20.0
-10.0
0.0
10.0
Per
Cen
t
4.8 43.6
16.3 53.3
2.7 5.1 12.0 5.3 5.1 7.9 3.0
-472.8
4.8
-500.0
-400.0
-300.0
-200.0
-100.0
0.0
100.0P
er C
ent
Key Takeaways
Q The MFIs have embraced consolidation approach to overcome the crisis situation. They reduced their infrastructure in terms of staff and branches.
Q The staff turnover is high and that has to be tackled to reduce staff training cost.
Q Loan Portfolio quality is good, except in case of CDR MFIs.
Q Total operation cost of CDR MFIs shot up because of high loan loss provision made by MFIs. The operating cost ratio, however, is under control for all other MFIs.
Q MFIs earnings and expenditure are compliant with RBI norm, though their profitability is under stress.
Funding MFIs 59
Funding MFIsPart 4
1 A slight variation exists in total fund outstanding reported by MFIs between these ways. The difference between outstanding amount reported under Lender wise Reporting (Rs.19979) and instrument wise Reporting (Rs.20724) as of 31 March 2013 is Rs.745 crore (Figure-1 Vs 8). This indicates that over Rs.745 crore would have been raised through non-conventional means other than from Banks, SIDBI/NABARD, Bulk Lenders and Financial Institutions.
2 Definition of funding Instruments-see Glossary.3 Mainly in the form of Term Loans from domestic banks and financial institutions.
MFIs, in effect, are micro banking intermediaries intermediating between mainstream banks and the low income households. Typically 85 per cent of MFIs lendable resources
come from banks. Andhra Pradesh crisis has led to near drying-up of bank funds to MFIs initially which became eased out a bit now. This part presents two-way analysis of funding MFIs. One is funding instrument-wise analysis and another is Lender-wise analysis1.
Also, the results of bankers’ survey held exclusively for this report, is presented to give an idea of bankers’ notion on MFI lending.
4.1 Funding Instrument-wise Analysis
4.1.1 MFIs Borrowing Instruments2
Funding for MFIs has largely been through two sources, Borrowing3 (84 per cent of total amount) and securitization /Portfolio sale (11 per cent of total amount), though other forms do exist to some extent. The other forms include: Subordinated Debt, Over Draft, Bond, Non Convertible Debenture, External Commercial Borrowing, Savings and Deposits from borrowers/members.
As seen in Figure 1, all reporting MFIs had outstanding borrowing of over Rs.20, 700 crore as on 31 March 2013, while they had Rs.16, 959 in the previous year. Borrowing alone was over Rs.17, 300 crore which was marginally higher than the previous year. The Securitization / Portfolio sale is the next important source of fund. The outstanding securitized amount with MFIs remained the same (Rs.2229 crore) both the years -2012 and 2013. This indicates that the banks had not gone for fresh securitization deal during 2012-13.
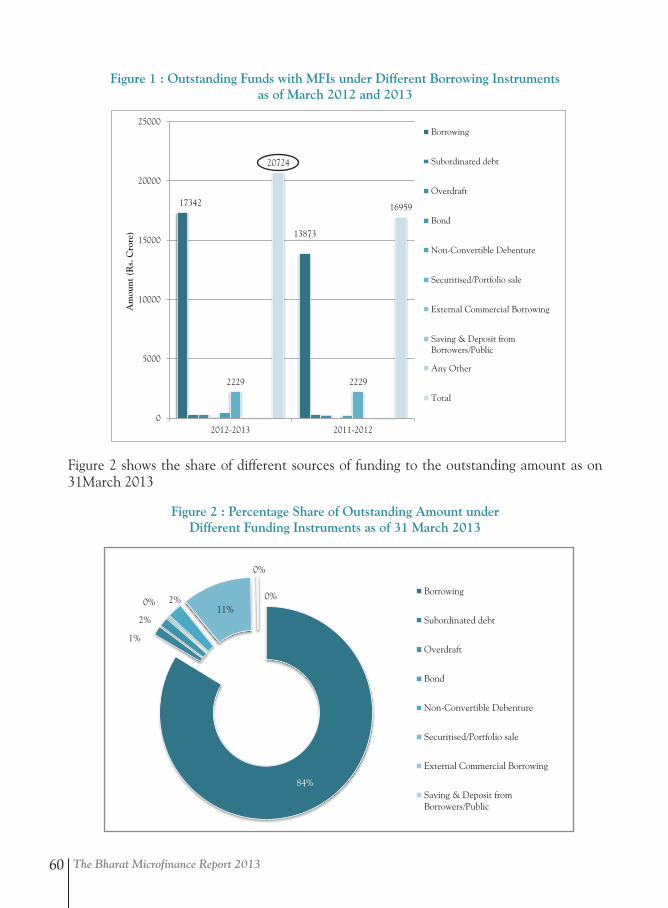
The Bharat Microfinance Report 201360
Figure 1 : Outstanding Funds with MFIs under Different Borrowing Instrumentsas of March 2012 and 2013Figure 1 : Outstanding Funds with MFIs under Different Borrowing Instruments as of March 2012 and 2013
17342
13873
2229 2229
20724
16959
0
5000
10000
15000
20000
25000
2012-2013 2011-2012
Am
ount
(R
s. C
rore
) Borrowing
Subordinated debt
Overdraft
Bond
Non-Convertible Debenture
Securitised/Portfolio sale
External Commercial Borrowing
Saving & Deposit fromBorrowers/Public
Any Other
Total
Figure 2 shows the share of different sources of funding to the outstanding amount as on 31March 2013
Figure 2 : Percentage Share of Outstanding Amount underDifferent Funding Instruments as of 31 March 2013
Figure 2 : Percentage Share of Outstanding Amount under Different Funding Instruments as of 31 March 2013
84%
1%
2%
0% 2% 11%
0%
0%
Borrowing
Subordinated debt
Overdraft
Bond
Non-Convertible Debenture
Securitised/Portfolio sale
External Commercial Borrowing
Saving & Deposit fromBorrowers/Public
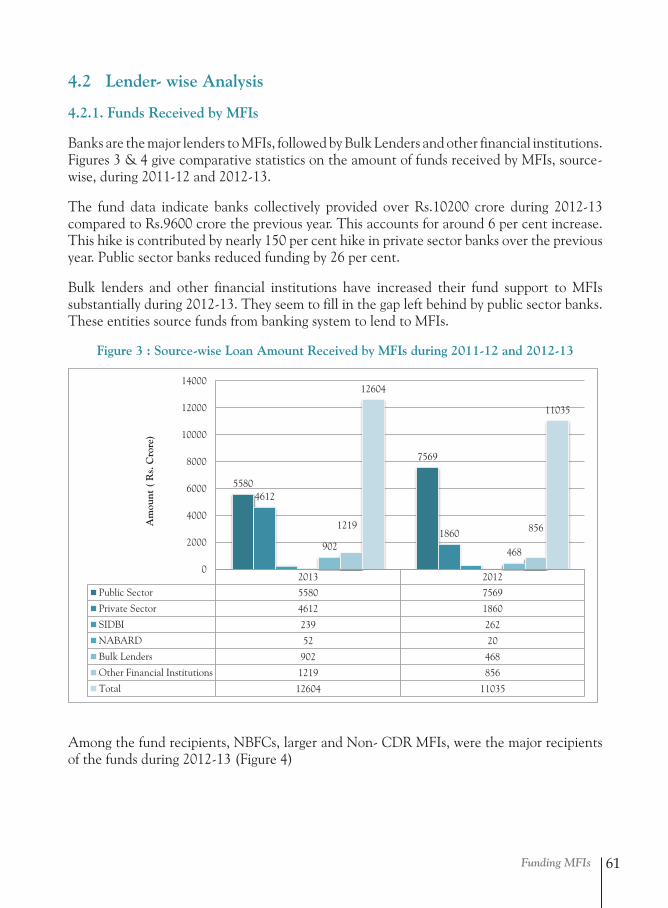
Funding MFIs 61
4.2 Lender- wise Analysis
4.2.1. Funds Received by MFIs
Banks are the major lenders to MFIs, followed by Bulk Lenders and other financial institutions. Figures 3 & 4 give comparative statistics on the amount of funds received by MFIs, source-wise, during 2011-12 and 2012-13.
The fund data indicate banks collectively provided over Rs.10200 crore during 2012-13 compared to Rs.9600 crore the previous year. This accounts for around 6 per cent increase. This hike is contributed by nearly 150 per cent hike in private sector banks over the previous year. Public sector banks reduced funding by 26 per cent.
Bulk lenders and other financial institutions have increased their fund support to MFIs substantially during 2012-13. They seem to fill in the gap left behind by public sector banks. These entities source funds from banking system to lend to MFIs.
Figure 3 : Source-wise Loan Amount Received by MFIs during 2011-12 and 2012-13Figure 1 : Source wise Loan Amount Received by MFIs during 2011-12 and 2012-13
2013 2012
Public Sector 5580 7569
Private Sector 4612 1860
SIDBI 239 262
NABARD 52 20
Bulk Lenders 902 468
Other Financial Institutions 1219 856
Total 12604 11035
5580
7569
4612
1860 902 468
1219 856
12604
11035
0
2000
4000
6000
8000
10000
12000
14000
Am
ount
( R
s. C
rore
)
Among the fund recipients, NBFCs, larger and Non- CDR MFIs, were the major recipients of the funds during 2012-13 (Figure 4)
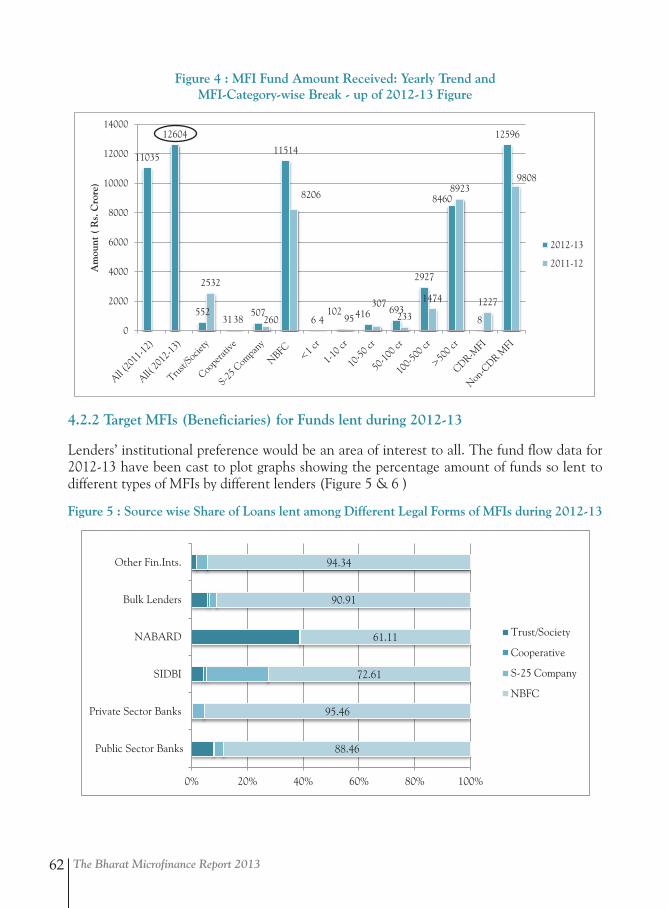
The Bharat Microfinance Report 201362
Figure 4 : MFI Fund Amount Received: Yearly Trend andMFI-Category-wise Break - up of 2012-13 FigureFigure 2 : MFI Fund Amount Received: Yearly Trend and MFI-Category-wise Break - up of 2012-13 Figure
11035
12604
552 31
507
11514
6 102 416 693
2927
8460
8
12596
2532
38 260
8206
4 95
307 233
1474
8923
1227
9808
0
2000
4000
6000
8000
10000
12000
14000
Am
ount
( R
s. C
rore
)
2012-13
2011-12
4.2.2 Target MFIs (Beneficiaries) for Funds lent during 2012-13
Lenders’ institutional preference would be an area of interest to all. The fund flow data for 2012-13 have been cast to plot graphs showing the percentage amount of funds so lent to different types of MFIs by different lenders (Figure 5 & 6 )
Figure 5 : Source wise Share of Loans lent among Different Legal Forms of MFIs during 2012-13Figure 3 : Source wise Share of Loans lent among Different Legal Forms of MFIs during 2012-13
Figure 4 : Source wise Share of Loans lent among Different sizes of MFIs during 2012-13
88.46
95.46
72.61
61.11
90.91
94.34
0% 20% 40% 60% 80% 100%
Public ector BanksS
Private Sector Banks
SIDBI
NABARD
Bulk Lenders
Other Fin.Ints.
Trust/Society
Cooperative
S-25 Company
NBFC
16.47
25.44
30.34
61.11
49.31
23.39
75.93
70.39
53.36
30.41
14.95
57.32
0% 10% 20% 30% 40% 50% 60% 70% 80% 90% 100%
Public ector BanksS
Private Sector Banks
SIDBI
NABARD
Bulk Lenders
Other Fin.Ints.
<1 cr
1-10 cr
10-50 cr
50-100 cr
100-500 cr
>500 cr
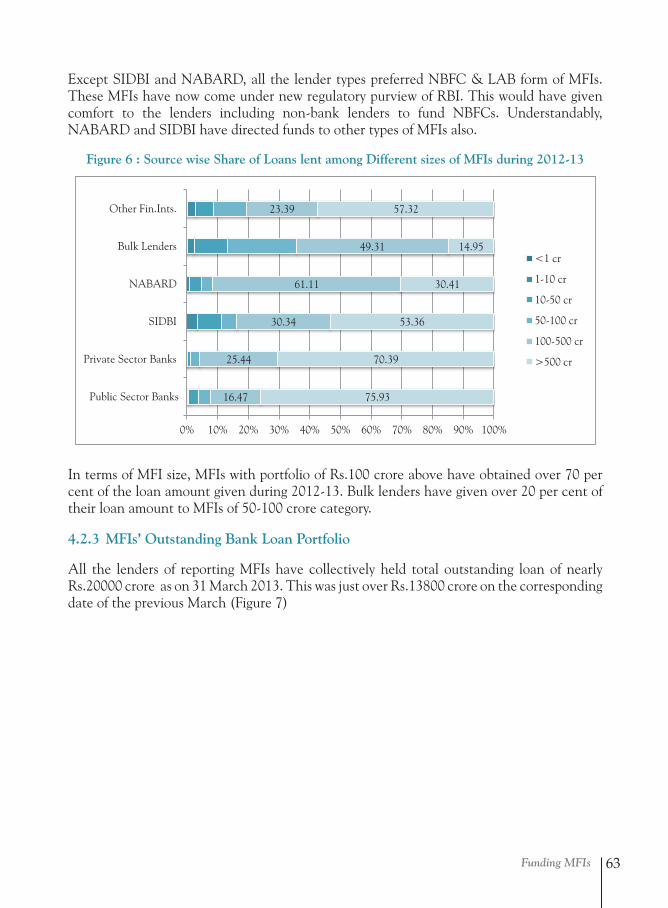
Funding MFIs 63
Figure 3 : Source wise Share of Loans lent among Different Legal Forms of MFIs during 2012-13
Figure 4 : Source wise Share of Loans lent among Different sizes of MFIs during 2012-13
88.46
95.46
72.61
61.11
90.91
94.34
0% 20% 40% 60% 80% 100%
Public ector BanksS
Private Sector Banks
SIDBI
NABARD
Bulk Lenders
Other Fin.Ints.
Trust/Society
Cooperative
S-25 Company
NBFC
16.47
25.44
30.34
61.11
49.31
23.39
75.93
70.39
53.36
30.41
14.95
57.32
0% 10% 20% 30% 40% 50% 60% 70% 80% 90% 100%
Public ector BanksS
Private Sector Banks
SIDBI
NABARD
Bulk Lenders
Other Fin.Ints.
<1 cr
1-10 cr
10-50 cr
50-100 cr
100-500 cr
>500 cr
Except SIDBI and NABARD, all the lender types preferred NBFC & LAB form of MFIs. These MFIs have now come under new regulatory purview of RBI. This would have given comfort to the lenders including non-bank lenders to fund NBFCs. Understandably, NABARD and SIDBI have directed funds to other types of MFIs also.
Figure 6 : Source wise Share of Loans lent among Different sizes of MFIs during 2012-13
In terms of MFI size, MFIs with portfolio of Rs.100 crore above have obtained over 70 per cent of the loan amount given during 2012-13. Bulk lenders have given over 20 per cent of their loan amount to MFIs of 50-100 crore category.
4.2.3 MFIs’ Outstanding Bank Loan Portfolio
All the lenders of reporting MFIs have collectively held total outstanding loan of nearly Rs.20000 crore as on 31 March 2013. This was just over Rs.13800 crore on the corresponding date of the previous March (Figure 7)
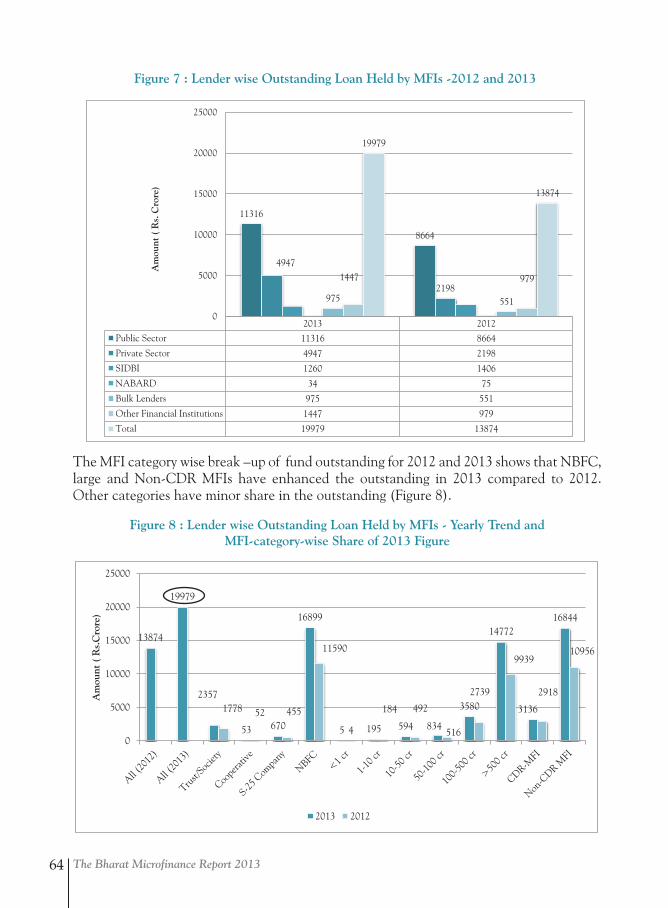
The Bharat Microfinance Report 201364
Figure 7 : Lender wise Outstanding Loan Held by MFIs -2012 and 2013Figure 5 : Lender wise Outstanding Loan Held by MFIs -2012 and 2013
2013 2012
Public Sector 11316 8664
Private Sector 4947 2198
SIDBI 1260 1406
NABARD 34 75
Bulk Lenders 975 551
Other Financial Institutions 1447 979
Total 19979 13874
11316
8664
4947
2198 975 551
1447 979
19979
13874
0
5000
10000
15000
20000
25000
Am
ount
( R
s. C
rore
)
The MFI category wise break –up of fund outstanding for 2012 and 2013 shows that NBFC, large and Non-CDR MFIs have enhanced the outstanding in 2013 compared to 2012. Other categories have minor share in the outstanding (Figure 8).
Figure 8 : Lender wise Outstanding Loan Held by MFIs - Yearly Trend andMFI-category-wise Share of 2013 FigureFigure 6 : Lender wise Outstanding Loan Held by MFIs - Yearly Trend and MFI Category wise Share of 2013 Figure
13874
19979
2357
53 670
16899
5 195 594 834
3580
14772
3136
16844
1778 52 455
11590
4
184 492
516
2739
9939
2918
10956
0
5000
10000
15000
20000
25000
Am
ount
( R
s.C
rore
)
2013 2012
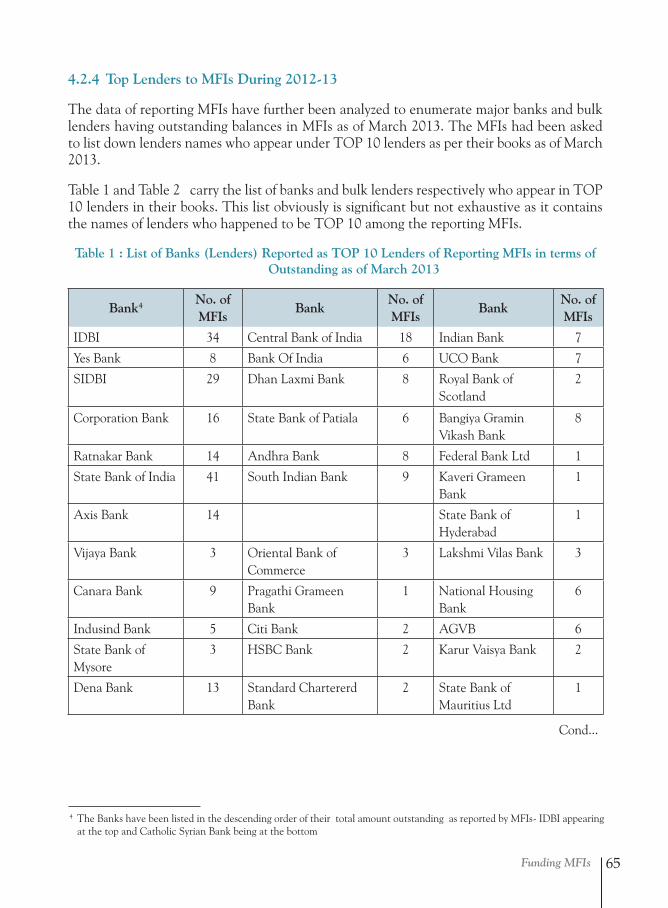
Funding MFIs 65
4.2.4 Top Lenders to MFIs During 2012-13
The data of reporting MFIs have further been analyzed to enumerate major banks and bulk lenders having outstanding balances in MFIs as of March 2013. The MFIs had been asked to list down lenders names who appear under TOP 10 lenders as per their books as of March 2013.
Table 1 and Table 2 carry the list of banks and bulk lenders respectively who appear in TOP 10 lenders in their books. This list obviously is significant but not exhaustive as it contains the names of lenders who happened to be TOP 10 among the reporting MFIs.
Table 1 : List of Banks (Lenders) Reported as TOP 10 Lenders of Reporting MFIs in terms of Outstanding as of March 2013
Bank4 No. of MFIs
Bank No. of MFIs
BankNo. of MFIs
IDBI 34 Central Bank of India 18 Indian Bank 7
Yes Bank 8 Bank Of India 6 UCO Bank 7
SIDBI 29 Dhan Laxmi Bank 8 Royal Bank of Scotland
2
Corporation Bank 16 State Bank of Patiala 6 Bangiya Gramin Vikash Bank
8
Ratnakar Bank 14 Andhra Bank 8 Federal Bank Ltd 1
State Bank of India 41 South Indian Bank 9 Kaveri Grameen Bank
1
Axis Bank 14 State Bank of Hyderabad
1
Vijaya Bank 3 Oriental Bank of Commerce
3 Lakshmi Vilas Bank 3
Canara Bank 9 Pragathi Grameen Bank
1 National Housing Bank
6
Indusind Bank 5 Citi Bank 2 AGVB 6
State Bank of Mysore
3 HSBC Bank 2 Karur Vaisya Bank 2
Dena Bank 13 Standard Chartererd Bank
2 State Bank of Mauritius Ltd
1
4 The Banks have been listed in the descending order of their total amount outstanding as reported by MFIs- IDBI appearing at the top and Catholic Syrian Bank being at the bottom
Cond...
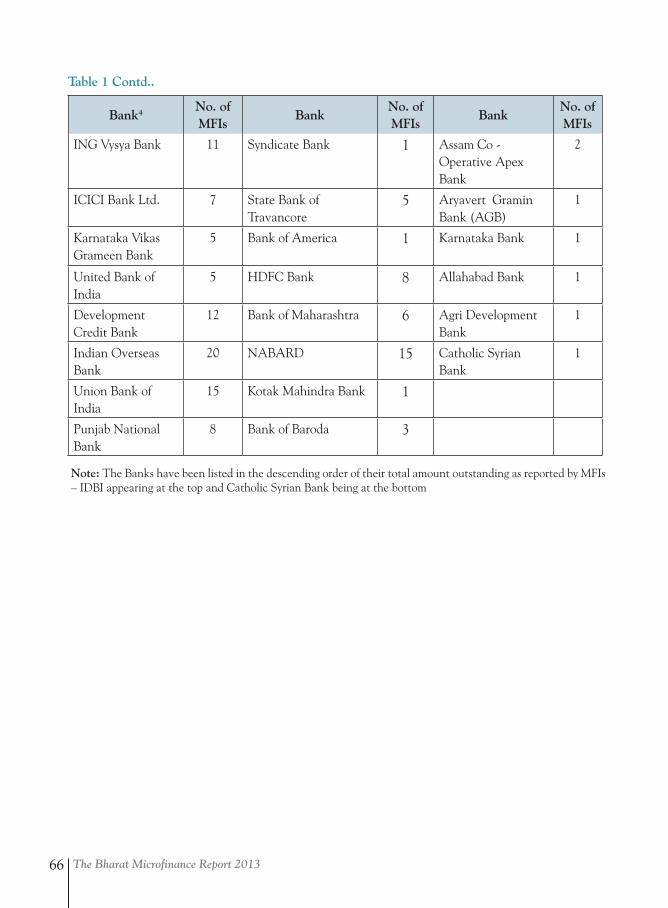
The Bharat Microfinance Report 201366
Note: The Banks have been listed in the descending order of their total amount outstanding as reported by MFIs – IDBI appearing at the top and Catholic Syrian Bank being at the bottom
Bank4 No. of MFIs
Bank No. of MFIs
BankNo. of MFIs
ING Vysya Bank 11 Syndicate Bank 1 Assam Co - Operative Apex Bank
2
ICICI Bank Ltd. 7 State Bank of Travancore
5 Aryavert Gramin Bank (AGB)
1
Karnataka Vikas Grameen Bank
5 Bank of America 1 Karnataka Bank 1
United Bank of India
5 HDFC Bank 8 Allahabad Bank 1
Development Credit Bank
12 Bank of Maharashtra 6 Agri Development Bank
1
Indian Overseas Bank
20 NABARD 15 Catholic Syrian Bank
1
Union Bank of India
15 Kotak Mahindra Bank 1
Punjab National Bank
8 Bank of Baroda 3
Table 1 Contd..
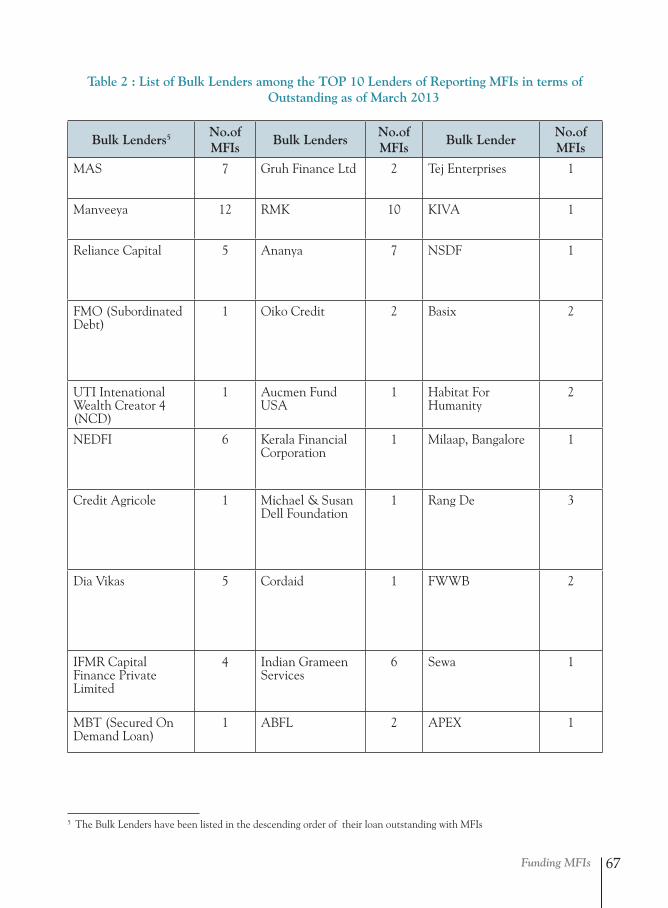
Funding MFIs 67
Table 2 : List of Bulk Lenders among the TOP 10 Lenders of Reporting MFIs in terms of Outstanding as of March 2013
Bulk Lenders5 No.of MFIs
Bulk Lenders No.of MFIs
Bulk LenderNo.of MFIs
MAS 7 Gruh Finance Ltd 2 Tej Enterprises 1
Manveeya 12 RMK 10 KIVA 1
Reliance Capital 5 Ananya 7 NSDF 1
FMO (Subordinated Debt)
1 Oiko Credit 2 Basix 2
UTI Intenational Wealth Creator 4 (NCD)
1 Aucmen Fund USA
1 Habitat For Humanity
2
NEDFI 6 Kerala Financial Corporation
1 Milaap, Bangalore 1
Credit Agricole 1 Michael & Susan Dell Foundation
1 Rang De 3
Dia Vikas 5 Cordaid 1 FWWB 2
IFMR Capital Finance Private Limited
4 Indian Grameen Services
6 Sewa 1
MBT (Secured On Demand Loan)
1 ABFL 2 APEX 1
5 The Bulk Lenders have been listed in the descending order of their loan outstanding with MFIs
The Bharat Microfinance Report 201368
4.3 Results of Bankers Survey on MFI lending5
The bankers’ view on different aspects of lending to MFIs is given hereunder.
4.3.1 On MFIs being partners of Banks
• Strong distribution network and delivering services at the door step.
• Enablers in providing financial services in remote rural location and unbanked area under priority sector lending.
• Helps to fulfill banks priority sector lending.
• MFIs are cost efficient to lend at rates prescribed by RBI.
• It is necessary for banks to have a partnership with MFIs to perform under Financial Inclusion.
• MFIs outreach and portfolio qualities are good, reflecting the efficiency of MFIs in serving the unbanked population in cost effective manner.
To improve on:
• They need to improve on the systems and processes to give comfort to Banks to partner with them for financial inclusion, as the present MFI system has evolved only for doing microloans. For delivering various financial products to the customers, the model has to adapt itself suitably. MFIs operation needs to go beyond prosperous areas.
4.3.2 On Performance of MFIs
• After 2010, MFIs have well drafted policies on loan appraisal, recovery management, HR management, customer service, monitoring of loan accounts, delinquency management etc.
• Risk Assessment capacity in MFIs has increased credit checks. MFIs are able to assess risks associated with the provision of financial services.
• The sector has seen large scale fallout and then consolidation which now gives a sense of comfort to the bankers. The exit of profit seeking Equity funds and a new crop of socially inclined venture capitalists have enhanced the credibility.
• AP crisis has resulted in better systems and processes at the MFI level resulting in higher outreach and greater transparency.
6 Results of questionnaire survey from five banks ( ICICI Bank, Kotak Mahindra, Axis Bank, Union bank, Indus Ind Bank )
Funding MFIs 69
• As the industry has grown, professionalism has evolved in the sector. Performance of MFIs in general is satisfactory in the FY 2012.
• Responsible lending by strict adherence to Fair Practices Code and regulatory norms are indispensable to mitigate risks.
• MFI sustainability is to be reckoned beyond financial sustainability. MFIs mission, its ownership, governance structure, etc. are equally important considerations.
4.3.3 On lending-criteria to MFIs under priority sector lending
• MFI should have good operational and financial background.
• Technology, operational area, governance, relationship with other Banks/FIs, center meeting transaction, branches, regional and head office are important considerations.
• MFI has to submit an end-use certificate with Book debt statement to bank within 60 days of availing the facility. MFI shall ensure adherence to the following regulatory stipulations circular issued by RBI dated July 01, 2013 (DNBS.(PD) CC. No. 347/03.10.38/2013-14) and any subsequent amendments thereof.
• Focus on established MFIs with responsible managements for credit delivery.
• Spreading the risks across multiple states and limit single state / territory concentration. We prefer MFIs having exposure in very many states.
• MFIs to have granulated equity holding. Plus substantive promoter stake and multiple bank line.
• MFIs should meet the priority sector lending criteria and Fair Practices Code prescribed by RBI.
• MFI should have proper credentials, track record, system of maintaining accounts & records with regular audits in place and manpower for close supervision and follow-up.
• Standing of promoters, reputation, business plan/projections, financial parameters, operational parameters, asset quality, regulatory compliance, corporate governance, experience in the sector, MIS system, external grading/rating, credit discipline etc.
• Banks benchmark performance of MFIs under several pre-defined financial standards before taking any credit decision.
The Bharat Microfinance Report 201370
• Other Criteria :
a. Governance: Composition of the Board of Directors, presence of independent directors, involvement of Board members in decision making process and relevant experience with the top management
b. Transparency: Sharing of reports with various agencies as well as proper disclosure of information
c. Financial viability: Profitability and sustainability
d. Regulatory compliance: Compliances to the various guidelines on RBI.
Once banks get adequate comfort on the MFI after assessment on various parameters, they take a further view on the priority sector lending and broader Financial Inclusion mileage available out of the business proposition from lending to the MFI.
4.3.4 On Change of Risk Assessment under MFI lending
• After the AP crisis, some banks stopped lending to MFIs and MFIs became their non priority. In FY2012, MFI sector gain some confidence after RBI guidelines and a few investors returned to microfinance sector. In FY2013, a category in NBFC introduced by RBI as NBFC-MFI with more prudent guidelines that has regained the confidence of Banks. However, Banks were not willing to take any additional exposure in Andhra Pradesh. Banks have funded the MFIs based upon previous relationship, experience and performance of MFI.
• Increased attention to factors like capital adequacy, geographical concentration and governance issues.
• Banks have started taking a view of the following aspects as part of our risk assessment:
a. Regulatory compliance – Compliances to various pricing, margin cap regulations, customer targeting, products and repayment tenor
b. Code of conduct – Compliance of the MFIs towards the Fair practices Code of RBI as well as SROs
c. Geographical concentration – Post the AP crisis, it is important for banks to assess that the MFI is having reasonable spread of its portfolio across geographies so that it can avoid the risks pertaining to one particular region/state. Banks use data from credit bureaus in order to understand the microfinance history in specific geographies.
d. Cost efficiency of the MFI– Given the price control, it is important for banks to assess whether the MFI is having adequate ability to keep adopting cost saving operational measures to further bring down the costs in future if regulations stipulate so.
Funding MFIs 71
e. Credit checks – After the advent of guidelines on multiple lending by RBI, banks verify whether the MFI is regularly submitting the data of its existing loans to credit bureaus on a regular basis. It would also be important to assess the degree to which the MFI is using credit bureau data to assess the credit history and current indebtedness of a borrower.
f. Loan utilization checks – It is important for banks to ascertain that the funds that are being given by the Bank are going to the target borrowers. In this regard, it is important that the MFI is having strong mechanisms and policies for conducting fool-proof loan utilization checks to ensure that loans are not used for any purpose which may not qualify under Priority Sector Loan.
g. Other risks – Certain risks under the operations policy of the MFIs such as ever-greening of Loans, prompting clients to prepay the loans in order to give them higher loans, using different KYC IDs of the clients by MFIs during different loan cycles thereby enabling them to bypass the credit bureau checks.
4.3.5 Banks view on Post-Crisis Era being normal or ‘new normal’
Post-crisis era is “new normal”. Pre-crisis era witnessed unjustified and non-transparent pricing, over-indebtedness and coercive recovery methods leading to crisis. Post crisis, suitable and structured regulations have given a new framework to the industry reducing the potential risk. Code of conduct and Fair Practices code, etc. have brought necessary checks and balances resulting in client protection and productivity enhancement.
It is new normal and microfinance sector is in self-correction mode. With the revised guidelines and categorization, RBI has more control over the MFIs and restricting the exponential growth in portfolio. Implementation of credit check has established a new benchmark in microfinance sector and brought sector in new shape.
Now MFIs are more transparent in their business. Overall, it has brought a radical change in microfinance sector and the new normal is good for MFIs.
Key Takeaways
Q Bank borrowing is the sole resource for MFIs to fund their portfolio. Dwindling share of public sector bank lending to MFIs is an area of concern.
Q Banks, in general, have positive notion on supporting MFIs and MFIs contribution to the priority sector lending. Their credit appraisal norms to fund MFIs have undergone significant change, knowledge of which would help MFIs to readjust their system to ensure banks’ continued support.
Q The role of Bulk Lenders is very crucial for funding MFIs. Banks need to patronize Bulk Lenders so that they can on-lend to and nurture small MFIs Lending to Bulk lenders also needs to be classified as priority sector advances.

The Bharat Microfinance Report 201372
Self Regulation Part 5
Regulatory response in India was triggered by series of developments in Andhra Pradesh during 2010. The State Government enacted Andhra Pradesh Microfinance (Regulation
of Money lending) Act 2010 to curtail anti- poor activities of MFIs. The Act prescribed several restrictions including: the MFIs to obtain prior approval of district authorities before sanctioning loans; the MFIs need to register themselves in each district of their operation; renew the registration annually, etc. This proved to be a huge hindrance for MFIs and MFIs there could not disburse loans as before, faced loan default leading to financial loss. The contagion effect of the crisis affected the Self Help Group Bank Linkage Programme and its loan repayment affecting the expansion and asset quality of SBLP in the state.
5.1 RBI Regulation
RBI, after detailed study of the situation in Andhra Pradesh, with help of Y.H.Malegam Committee, has put in place a detailed regulation regulating the priority sector lending for MFIs and host of norms for NBFC-MFIs during May and December 2011. The details of the regulation are available in RBI Master Circular NBFC-MFIs – Directions, RBI/2013-14/49 DNBS. (PD) CC.No.347/03.10.38/2013-14, 1 July 2013.The regulatory structure proposed by the RBI puts in place restrictions and safeguards with regard to minimum standards of governance, management and customer protection as well as the financial health of MFIs.
5.2 Microfinance Bill
The RBI regulation largely covers NBFC-MFIs recognized separately by RBI. The other form of MFIs- not for profit MFIs remain under the regulatory vacuum. The Microfinance Institutions (Regulation and Development) Bill 2012, which is before the parliament, would cover all types of MFIs comprehensively.
The Bill states its purpose as “.. to provide for development and regulation of microfinance institutions for the purpose of facilitating access to credit , thrift and other microfinance services to the rural and urban poor and other disadvantaged sections of the people and promoting financial inclusion through such institutions..”
The Parliament Standing Committee on Finance has been deliberating the provisions of the bill, seeking suggestions and views from various stakeholders. Sa-Dhan and MFIN have represented MFIs before the standing committee and put forth their views on the importance of the Bill. The Standing Committee sought written responses from Sa-Dhan and MFIN to a set of questions to understand the importance of the Bill from the associations’ point of view.
Similarly, Sa-Dhan, with support of SIDBI, has organized regional workshops and poor-women melas in around the constituencies of Members of Parliament (MPs) who constitute the Standing Committee to deliberate upon the importance of the Bill as perceived by the microcredit borrowers. This enabled the MPs to get firsthand information on the importance of the Bill.
Self Regulation 73
5.3 RBI’s Say in Self Regulation
Andhra Pradesh Crisis –II in 2010 compelled RBI to set rules of regulation and self regulation. The sub-committee of the Central Board of the Reserve Bank (Chaired by Shri Y.H. Malegam), set up to study issues and concerns in the MFI sector articulated the need for Self Regulatory Organization ( SRO) and the role of sector association in it. RBI too confirmed this through its circular dated 3rd August 2012 and indicated the need for SRO for monitoring regulatory compliance.
All NBFC-MFI will have to become member of at least one recognized Self- Regulatory Organization (SRO) by the Reserve Bank and will have to comply with the Code of Conduct prescribed by the SRO. The Industry associations / SROs will also play a key role in ensuring compliance with the regulatory framework. In addition, banks lending to NBFC-MFIs will also ensure that lending policies are aligned to the regulatory framework.
Self Regulation is an integral part of the regulatory arrangements that RBI has put forth. RBI has maintained a stand that principle- based regulation, including self-regulation, is better than rule- based regulation as the former is less prescriptive with lesser compliance costs involved. The governance system of MFIs would encompass self-regulation at the individual entity level through the mechanism of SRO. In fact, these two would form the first line of defense of regulatory framework providing the backdrop. In the absence of effective self regulation, the regulatory framework becomes more prescriptive which raises cost to regulators and supervisors in administering the regulatory framework and also increases compliance costs to the regulated entities. This is clearly a sub –optimal solution1.
RBI has now sought applications from potential SROs in the market to recognize them to act as SROs.
5.4 Sa-Dhan and Self Regulation
The industry association which represents the sector has a key role in regulation. Sa-Dhan as the mother association put in place several self regulatory mechanism in the formative years. Sa-Dhan had been requesting RBI to regulate the MFIs and microfinance sector since the year 2000. The request has come into fruition in 2011 through RBI regulation to NBFCs. It is already pursuing the microfinance bill which is before the parliament. On its part, RBI as the regulator brought in rules of regulation and self regulation subsequently.
The year 2006 was the watershed year prompting self regulation. Andhra Pradesh crisis (AP Crisis-I) erupted, albeit in a localized way, during the year when the government-district authorities, perceiving certain aberrations, forcefully shut the branches of leading MFIs. This warranted attention of all those concerned including Sa-Dhan. Sa-Dhan intervened and held several rounds of dialogues with state and district authorities to persuade them
1 Anand Sinha, Deputy Governor, RBI ( source- SOS-2013)
The Bharat Microfinance Report 201374
that the perceived aberrations on the part of MFIs had been some isolated excesses caused by untrained grass roots workers. The intervention paved for an agreement between the government agencies and MFIs on common minimum discipline and cooperation on the field. The crisis was brought to an end and the MFIs resumed their field operations.
Sa-Dhan, subsequently, convened series of meetings with MFI members and deliberated ways to avoid recurrence of such crisis. In the course of deliberation members agreed to codify self-restraint and business conduct. They coined voluntary Code of Conduct and brought into effect from 2007 onwards. Sa-Dhan had been advocating the Code of Conduct since then and insisting upon members to display the code across the offices / branches to sensitize the employees the code. RBI acknowledged the introduction of Code of Conduct by Sa-Dhan in their Annual publication ‘Trends and Progress’ in 2008.
During the same year Sa-Dhan introduced ‘Advisory Set’ for transparent disclosure by MFIs through their financial statements.
First Ever Financial Standards for MFIs
Sa-Dhan set benchmarks for financial performance of MFIs. Earlier, NGO-MFIs were not under any financial regulation. Microfinance business was unique and there were no performance indicators available for MFIs to benchmark upon and for outsiders to judge the MFI operational efficiency. The MFI Financial Performance Standards had to balance between cost efficiency and financial sustainability on the one hand and development initiatives on the other. Sa-Dhan led consultative standards-development process involving members, financial experts, bankers and others and came out with financial performance standards. The standards carried six financial ratios on sustainability, asset quality and efficiency. Banks and investors appreciated the standards. These standards became part of the systems and reporting by MFIs.
Recent SRO Initiatives at Sa-Dhan
Sa-Dhan had been working with MFIs for proper adherence of the RBI code. To begin with Sa-Dhan collected data from MFIs on the level of adherence to RBI norms as soon the norms had been recommended by the Malegam committee. The Bharat Microfinance Report 2011 carried the analysis of MFI data indicating the operational and financial characteristics vis- a-vis the recommended norms. In addition, Sa-Dhan provided feedback on the changes required in the norms as soon as they were notified. Similarly, as soon as the norms came into force, Sa-Dhan conducted workshops across regions on RBI regulation to create awareness and build knowledge and understanding of MFIs and their auditors on the compliance strategy. It also developed a comprehensive Handbook for MFIs on ways of complying with RBI regulation. It would continue building capacities of different players on the regulatory provisions.
In response to the AP Crisis-II, Sa-Dhan put up host of measures to restrain members from straying in business conduct. It amended its Memorandum of Association (MoA) to secure
Self Regulation 75
more rights to pull up members who consistently violate the agreed Code of Conduct. The amended MoA carries sanctions or penalty or restrictions the Association can impose upon members for gross negligence or persistent non compliance.
Similarly, Sa-Dhan set up Ethics and Grievance Redressal Committee (EGRC) with members drawn from independent professionals to hear complaints emanating from members / others on CoC violation under new CoC enforcement regime. Advice and directions are given by the EGRC. The committee serves as a ‘self regulator’ and has the power to suggest measures against erring members. The primary objective of the committee is to facilitate the compliance to the Code of Conduct and ensure a fair, ethical and timely grievance redressal by the Association upon complaints of non-compliance by the member/s. The committee met and sent advisory to members found to be inadvertently indulging in some excesses.
Unified Code of Conduct
Sa-Dhan and MFIN came together, facilitated by SIDBI and IFC under the banner of Responsible Finance Forum, to harmonize the Sa-Dhan code and MFIN code and came out with Unified Code of Conduct. Sa-Dhan has developed technical tools to review the Unified-CoC implementation by members and compliance level of RBI regulation. Sa-Dhan has been strengthening the capacities of secretariat team in conducting review. The membership renewal is now subject to adherence to CoC by members.
Code of Conduct Assessment
Since 2010, SIDBI led Lenders Forum joined by most of the banks participating in MFI-funding. It stipulated that the borrowing–MFIs to undergo COCA (Code of Conduct Assessment) and the assessment report to become part of credit appraisal documents. Similarly, at the instance and support of SIDBI, Sa-Dhan undertook CoC Validation on MFI compliance to recent directions of RBI and Fair Practices Code prescribed for NBFCs. Though SIDBI funding is based on ‘third party assessment’ (COCA), Sa-Dhan exercise served as a ‘forerunner’ for small MFIs to build better system to pass through COCA later.
Over the last two years, a total of 90 COC Assessments have been conducted by SIDBI (51), Sa-Dhan (26) and Smart Campaign (13).
5.5 Lenders’ Forum – Reinforcing Self Regulation
Lenders’ Forum was established under SIDBI with 12 leading banks as members to coordinate the activities and banks lending to MFIs. The periodical meeting of the forum discusses the issues in microfinance sector and precautions to be observed while lending to the sector. The forum prescribed Common Loan Covenants which the banks and the borrowing MFIs need to follow.
The Bharat Microfinance Report 201376
The gist of the covenants is :
To furnish financial and operational data.
To undergo third-party Code of Conduct Assessment ( COCA)
To undergo systems and portfolio audit covering areas of operational systems, procedure, funds utilization, assessment of portfolio in terms of risk parameters, finance, planning and control.
To ensure transparency and uniformity in calculating and reporting the effective cost ( to clients and in public domain)
To prepare board approved recovery practice each branch to undertake responsible and non-coercive recovery practice at the field level.
Broad –policy to check multiple lending / over indebtedness annual affirmation of strategy by board.
To put in place grievance redress mechanism and display the same both in website and offices.
Electronic and printed acknowledgement to customers
To report data to Credit Information Bureau.
5.6 Responsible Finance Forum – A Think Tank in Self Regulation
Lenders, Associations and other stakeholders have come together to form a “Responsible Finance Forum” to ensure fair and sustainable financial services through MFIs. The forum is hosted by International Finance Corporation (IFC) and actively participated by SIDBI and associations and independent experts. This forum monitors activities in the microfinance sector, conducts various studies to understand client responses and the delivery of microfinance services. It primarily focuses on building a robust client protection framework for microfinance borrowers.
5.7 Sa-Dhan Members’ Self Regulation in Response to the RBI Regulation
Sa-Dhan members have reported the following governance, operation and financial level changes effected during 2012-13.
On Governance
Fine Tuning of Corporate Governance Professionals inducted onto the board. More independent Directors on the Board.
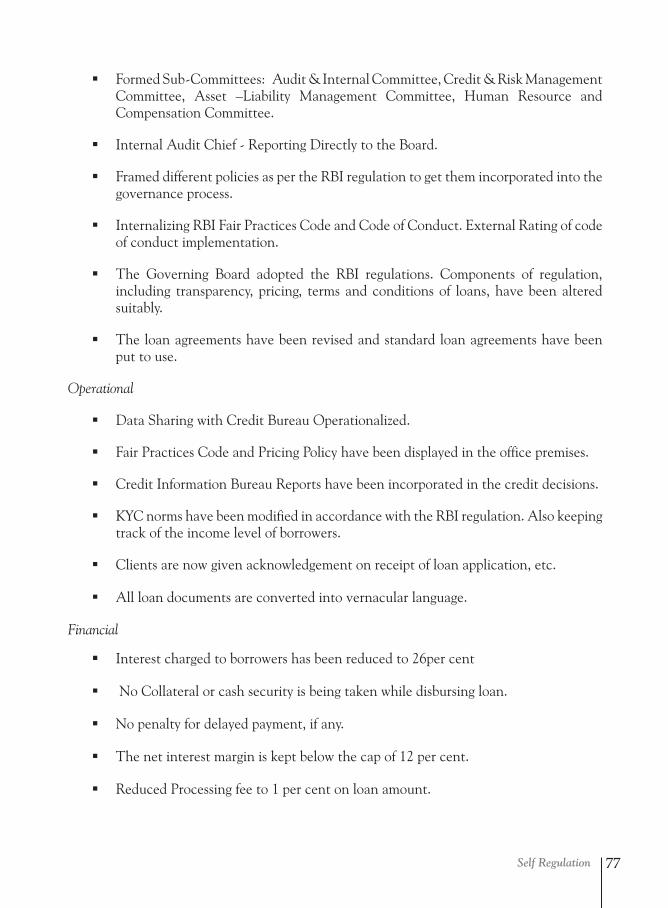
Self Regulation 77
Formed Sub-Committees: Audit & Internal Committee, Credit & Risk Management Committee, Asset –Liability Management Committee, Human Resource and Compensation Committee.
Internal Audit Chief - Reporting Directly to the Board.
Framed different policies as per the RBI regulation to get them incorporated into the governance process.
Internalizing RBI Fair Practices Code and Code of Conduct. External Rating of code of conduct implementation.
The Governing Board adopted the RBI regulations. Components of regulation, including transparency, pricing, terms and conditions of loans, have been altered suitably.
The loan agreements have been revised and standard loan agreements have been put to use.
Operational
Data Sharing with Credit Bureau Operationalized.
Fair Practices Code and Pricing Policy have been displayed in the office premises.
Credit Information Bureau Reports have been incorporated in the credit decisions.
KYC norms have been modified in accordance with the RBI regulation. Also keeping track of the income level of borrowers.
Clients are now given acknowledgement on receipt of loan application, etc.
All loan documents are converted into vernacular language.
Financial
Interest charged to borrowers has been reduced to 26per cent
No Collateral or cash security is being taken while disbursing loan.
No penalty for delayed payment, if any.
The net interest margin is kept below the cap of 12 per cent.
Reduced Processing fee to 1 per cent on loan amount.
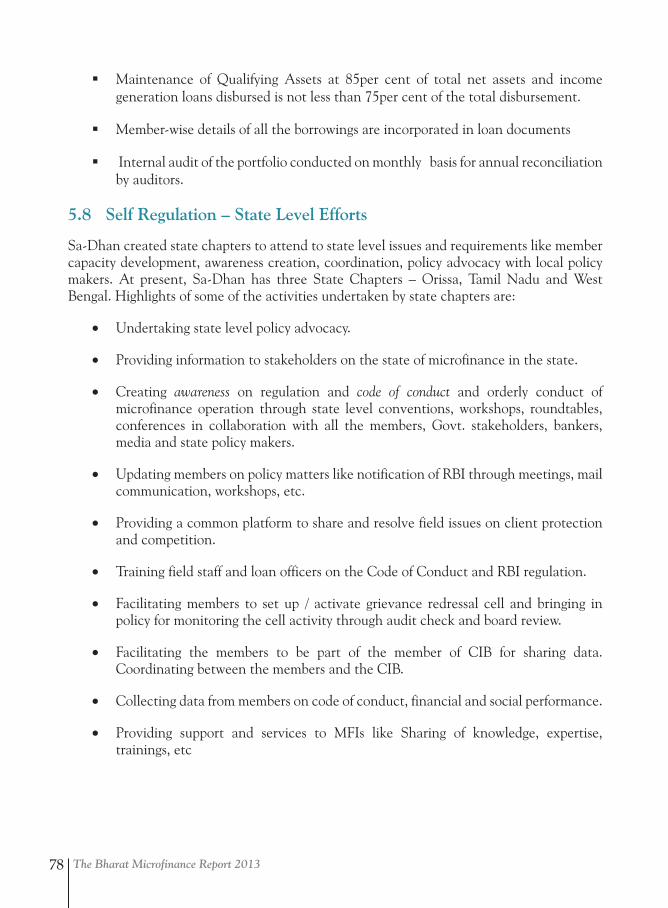
The Bharat Microfinance Report 201378
Maintenance of Qualifying Assets at 85per cent of total net assets and income generation loans disbursed is not less than 75per cent of the total disbursement.
Member-wise details of all the borrowings are incorporated in loan documents
Internal audit of the portfolio conducted on monthly basis for annual reconciliation by auditors.
5.8 Self Regulation – State Level Efforts
Sa-Dhan created state chapters to attend to state level issues and requirements like member capacity development, awareness creation, coordination, policy advocacy with local policy makers. At present, Sa-Dhan has three State Chapters – Orissa, Tamil Nadu and West Bengal. Highlights of some of the activities undertaken by state chapters are:
• Undertaking state level policy advocacy.
• Providing information to stakeholders on the state of microfinance in the state.
• Creating awareness on regulation and code of conduct and orderly conduct of microfinance operation through state level conventions, workshops, roundtables, conferences in collaboration with all the members, Govt. stakeholders, bankers, media and state policy makers.
• Updating members on policy matters like notification of RBI through meetings, mail communication, workshops, etc.
• Providing a common platform to share and resolve field issues on client protection and competition.
• Training field staff and loan officers on the Code of Conduct and RBI regulation.
• Facilitating members to set up / activate grievance redressal cell and bringing in policy for monitoring the cell activity through audit check and board review.
• Facilitating the members to be part of the member of CIB for sharing data. Coordinating between the members and the CIB.
• Collecting data from members on code of conduct, financial and social performance.
• Providing support and services to MFIs like Sharing of knowledge, expertise, trainings, etc
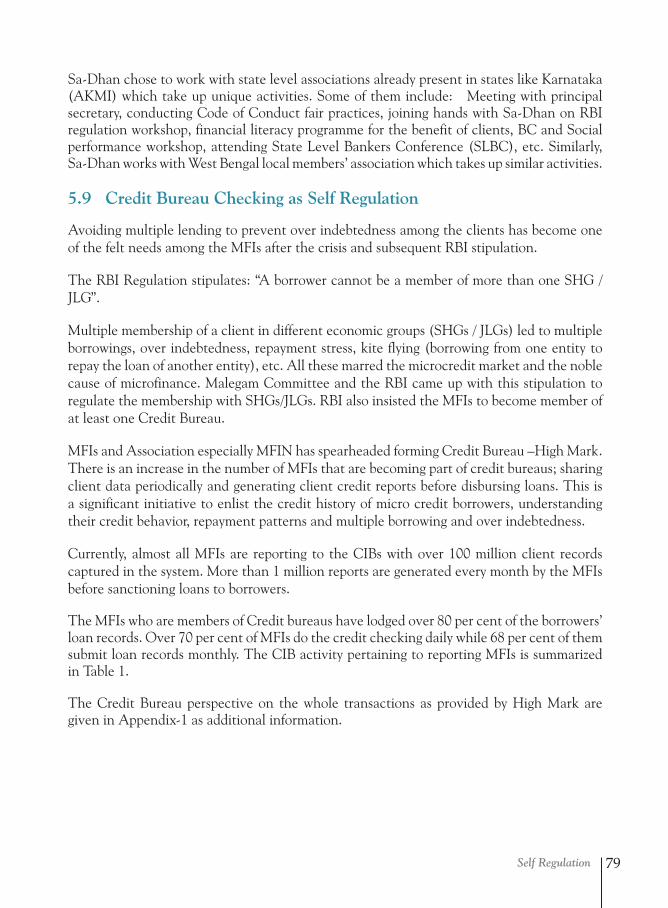
Self Regulation 79
Sa-Dhan chose to work with state level associations already present in states like Karnataka (AKMI) which take up unique activities. Some of them include: Meeting with principal secretary, conducting Code of Conduct fair practices, joining hands with Sa-Dhan on RBI regulation workshop, financial literacy programme for the benefit of clients, BC and Social performance workshop, attending State Level Bankers Conference (SLBC), etc. Similarly, Sa-Dhan works with West Bengal local members’ association which takes up similar activities.
5.9 Credit Bureau Checking as Self Regulation
Avoiding multiple lending to prevent over indebtedness among the clients has become one of the felt needs among the MFIs after the crisis and subsequent RBI stipulation.
The RBI Regulation stipulates: “A borrower cannot be a member of more than one SHG / JLG”.
Multiple membership of a client in different economic groups (SHGs / JLGs) led to multiple borrowings, over indebtedness, repayment stress, kite flying (borrowing from one entity to repay the loan of another entity), etc. All these marred the microcredit market and the noble cause of microfinance. Malegam Committee and the RBI came up with this stipulation to regulate the membership with SHGs/JLGs. RBI also insisted the MFIs to become member of at least one Credit Bureau.
MFIs and Association especially MFIN has spearheaded forming Credit Bureau –High Mark. There is an increase in the number of MFIs that are becoming part of credit bureaus; sharing client data periodically and generating client credit reports before disbursing loans. This is a significant initiative to enlist the credit history of micro credit borrowers, understanding their credit behavior, repayment patterns and multiple borrowing and over indebtedness.
Currently, almost all MFIs are reporting to the CIBs with over 100 million client records captured in the system. More than 1 million reports are generated every month by the MFIs before sanctioning loans to borrowers.
The MFIs who are members of Credit bureaus have lodged over 80 per cent of the borrowers’ loan records. Over 70 per cent of MFIs do the credit checking daily while 68 per cent of them submit loan records monthly. The CIB activity pertaining to reporting MFIs is summarized in Table 1.
The Credit Bureau perspective on the whole transactions as provided by High Mark are given in Appendix-1 as additional information.
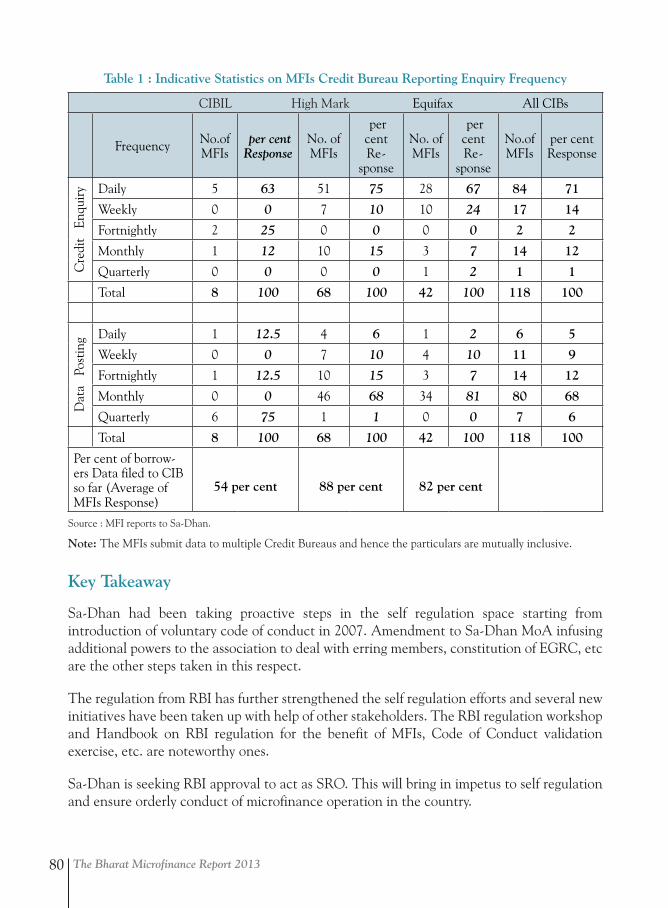
The Bharat Microfinance Report 201380
Table 1 : Indicative Statistics on MFIs Credit Bureau Reporting Enquiry Frequency
CIBIL High Mark Equifax All CIBs
Frequency No.of MFIs
per cent Response
No. of MFIs
per cent Re-
sponse
No. of MFIs
per cent Re-
sponse
No.of MFIs
per cent Response
Cre
dit
Enq
uiry Daily 5 63 51 75 28 67 84 71
Weekly 0 0 7 10 10 24 17 14
Fortnightly 2 25 0 0 0 0 2 2
Monthly 1 12 10 15 3 7 14 12
Quarterly 0 0 0 0 1 2 1 1
Total 8 100 68 100 42 100 118 100
Dat
a P
ostin
g Daily 1 12.5 4 6 1 2 6 5
Weekly 0 0 7 10 4 10 11 9
Fortnightly 1 12.5 10 15 3 7 14 12
Monthly 0 0 46 68 34 81 80 68
Quarterly 6 75 1 1 0 0 7 6
Total 8 100 68 100 42 100 118 100
Per cent of borrow-ers Data filed to CIB so far (Average of MFIs Response)
54 per cent 88 per cent 82 per cent
Source : MFI reports to Sa-Dhan.
Note: The MFIs submit data to multiple Credit Bureaus and hence the particulars are mutually inclusive.
Key Takeaway
Sa-Dhan had been taking proactive steps in the self regulation space starting from introduction of voluntary code of conduct in 2007. Amendment to Sa-Dhan MoA infusing additional powers to the association to deal with erring members, constitution of EGRC, etc are the other steps taken in this respect.
The regulation from RBI has further strengthened the self regulation efforts and several new initiatives have been taken up with help of other stakeholders. The RBI regulation workshop and Handbook on RBI regulation for the benefit of MFIs, Code of Conduct validation exercise, etc. are noteworthy ones.
Sa-Dhan is seeking RBI approval to act as SRO. This will bring in impetus to self regulation and ensure orderly conduct of microfinance operation in the country.
Self Regulation 81
APPENDIX - 1
Perspective of a Credit Bureau-High Mark
High Mark today runs India’s first and the world’s largest Microfinance Credit Bureau operations, with over 177 Member Microfinance institutions (NBFCs, Societies, Trusts, and Section 25 & NGO MFIs) as on date.
With this, the HM MFI database has over 98% of industry coverage.
As on date, 105 MFIs share data with High Mark. The Company is working closely with the remaining Member MFIs to enable them to share data with the bureau. High Mark has a total of 105 Million microfinance loan records (current and historical) from MFIs belonging to over 35 million borrowers. 90% of the data uploads from MFIs to the HM MFI bureau happens on a weekly frequency, and 10% of the data is uploaded on a monthly frequency.
MFIs pulled 21.3 million reports from High Mark in FY 12 – 13, as an input into their credit due diligence process, with 98% of the MFIs making daily inquiries. Only 2% of these inquiries were made on a weekly basis, in line with internal processes at some of the MFIs.
Some of the large MFIs are system integrated with the bureau and receive their responses on individual inquiries instantaneously.
However, there are several MFIs which adopt a Batch mode of inquiries, in line with their internal processes. Thus credit officers come back to the office after their group meetings and update their systems with the details of the individuals within various JLGs that are being considered for a loan. The data thus consolidated is extracted and fired as a “batch inquiry” to High Mark, which processes the batch and sends the results to the MFI within committed turnaround times.. MFIs have also installed easy to use “Credit Assist” tools from High Mark to view the result summaries as well as the detailed reports, to understand the Credit history of their potential borrowers.
Typical challenges:
During the initial on-boarding for a new MFI, a high number of inquiries get rejected on account of poor inquiry quality. With constant feedback and handholding, the inquiries stabilize over a period of a month to the extent that there are comparatively fewer rejections thereon.
Inquiries peak during a few hours in the day and a few days each month, which tend to put the system under pressure, slowing responses slightly during this time. This said, over 97% of these inquiries are still processed within the committed turnaround time.
It must be remembered that the Credit Bureau is an enabler for credit decisions and is not a decision in itself. Banks and NBFCs that use Bureaus rely on additional due diligence based on information in the borrower application – income, loan purpose and viability of purpose
The Bharat Microfinance Report 201382
etc. Typically, the Credit officer must weigh the merits of each case before making a loan decision.
Managing multiple lending & over indebtedness
Microfinance institutions largely realize that it is of utmost importance to detect and prevent overleveraging / over indebtedness of their borrowers. There are times when field staff, for various reasons including their own targets, feel that an effective bureau is a hindrance, considering that an adverse report on some potential borrowers may require the formation of a new group or a smaller group. Every staff member must be responsible for managing Risk, with some MFIs making this a key performance indicator.
MFIs could also refer Geographic Presence & Performance reports while entering new regions in order to understand current penetration levels and avoid overcrowding if possible.
MFIs need to realize that managing multiple-lending and overindebtedness of a borrower ultimately helps the MFI itself and the entire ecosystem (borrowers and other MFIs).
MFI associations (MFIN & Sadhan) must drive for improved data quality at their member MFIs. High Mark works closely with various MFIs providing them with regular feedback to help improve their data quality, which will result in robust Credit reporting.To this extent, KYC compliance with mandatory fields during client onboarding must be followed.
Both associations have stressed to their members the need for maintaining compliance with the Code of conduct, drawn from the Malegam committee’s recommendations for MFI lending. While this is practiced at all NBFC MFIs, the same must be extended to other MFIs and financial institutions lending to JLGs, in order to preserve the sanctity of the norms laid out in the code of conduct.
High Mark set up the MFI Credit Bureau line of business as a joint initiative with several MFIs and the MFI association. MFIs must make full use of the bureau reports to take better credit decisions and lower future credit risk. The use of the bureau has resulted in marked improvements in repayment behavior and collections (borrower accountability in general). This, along with the RBI, MFIN and Sa-dhan code of conduct has played a significant role in shaping borrower awareness around prudent borrowing and debt management.
The above measures will help preserve the MFI ecosystem while facilitating sustainable growth, since the market is still under penetrated in most parts of the country.
- Courtesy : K.Sridhar, High Mark
Note: Apart from High Mark and Equifax, Experian Credit Information Company of India Private Ltd is another emerging Credit Bureau showing interest in handling MFI loan records. It is a joint venture with Axis Bank, Punjab National Bank, Union Bank of India, Indian Bank, Federal Bank, Sundaram Finance and Magma Fincorp to form Experian Credit Information Company of India Private Limited providing Credit Information Services.
Community Based Microfinance Organizations 83
Community Based Microfinance OrganizationsPart 6
1 C.S.Reddy et al, 2007, SHG Federations In India, APMAS, Hyderabad
The Community Based Microfinance Organizations (CBMOs), a term coined by Sa-Dhan SHG Task Force, encompass SHGs, Federations, Cooperatives and Self Help Promoting
Institutions. In this part, brief facts and observations about CBMOs are presented in order to provide a panoramic view of issues affecting and interventions required with respect to different types of CBMOs.
The part has five sections as follows :
6.1 Self Help Group Bank Linkage Programme (SBLP)
6.2 Issues under SHGs and Their Federations
6.3 Self Help Promoting Institutions (SHPIs)
6.4 Livelihoods Promotion through Self Help Groups
6.5 Microfinance through Cooperatives
6.1 Self Help Group Bank Linkage Programme (SBLP)
1The evolution of SHG movement could be summarized as below:
• NGO’s, especially MYRADA and PRADAN explored the possibility of promoting SHGs on a small scale for their overall development.
• NABARD successfully partnering with MYRADA and PRADAN in evolution of SHG movement.
• The state governments particularly in the South taking on an active role in the promoting of SHGs by way of revolving loan fund.
• SHG-Bank linkage reaching up to a scale of more than a million banks – linked SHGs.
• The emergence of SHG-Federations to sustain the SHG movement and providing value addition.
• The widespread recognition of SHGs and SHG-Federations to act in implementation of various government schemes.
• Enhanced roles of Self Help Promoting NGOs in supporting growth of SBLP to next stage.
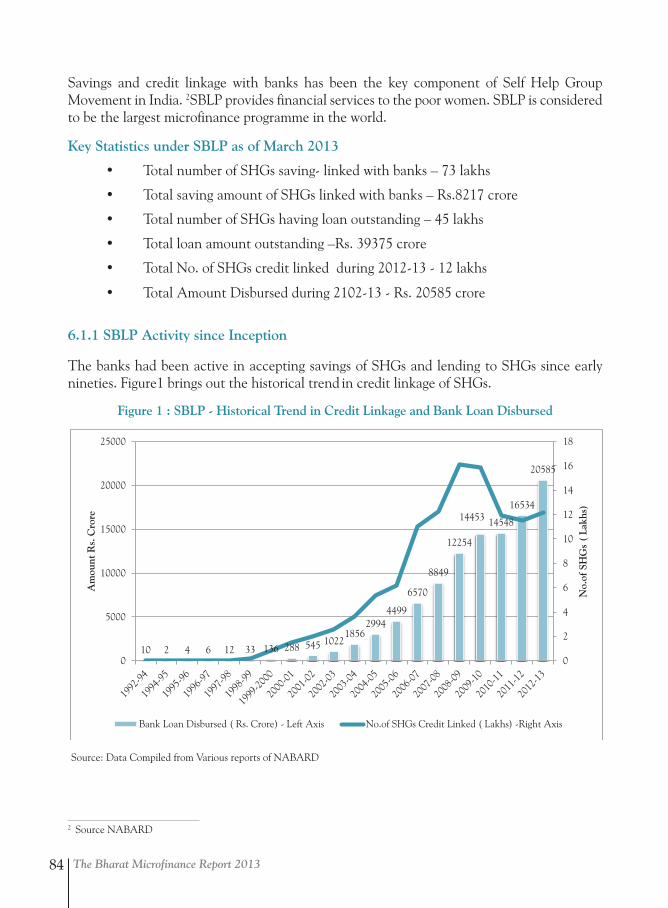
The Bharat Microfinance Report 201384
2 Source NABARD
Savings and credit linkage with banks has been the key component of Self Help Group Movement in India. 2SBLP provides financial services to the poor women. SBLP is considered to be the largest microfinance programme in the world.
Key Statistics under SBLP as of March 2013
• Total number of SHGs saving- linked with banks – 73 lakhs
• Total saving amount of SHGs linked with banks – Rs.8217 crore
• Total number of SHGs having loan outstanding – 45 lakhs
• Total loan amount outstanding –Rs. 39375 crore
• Total No. of SHGs credit linked during 2012-13 - 12 lakhs
• Total Amount Disbursed during 2102-13 - Rs. 20585 crore
6.1.1 SBLP Activity since Inception
The banks had been active in accepting savings of SHGs and lending to SHGs since early nineties. Figure1 brings out the historical trend in credit linkage of SHGs.
Figure 1 : SBLP - Historical Trend in Credit Linkage and Bank Loan Disbursed
Source: Data Compiled from Various reports of NABARD
10 2 4 6 12 33 136 288 545 1022 1856
2994 4499
6570
8849
12254
14453 14548
16534
20585
0
2
4
6
8
10
12
14
16
18
0
5000
10000
15000
20000
25000
No.
of S
HG
s (
Lakh
s)
Am
ount
Rs.
Cro
re
Bank Loan Disbursed ( Rs. Crore) - Left Axis No.of SHGs Credit Linked ( Lakhs) -Right Axis
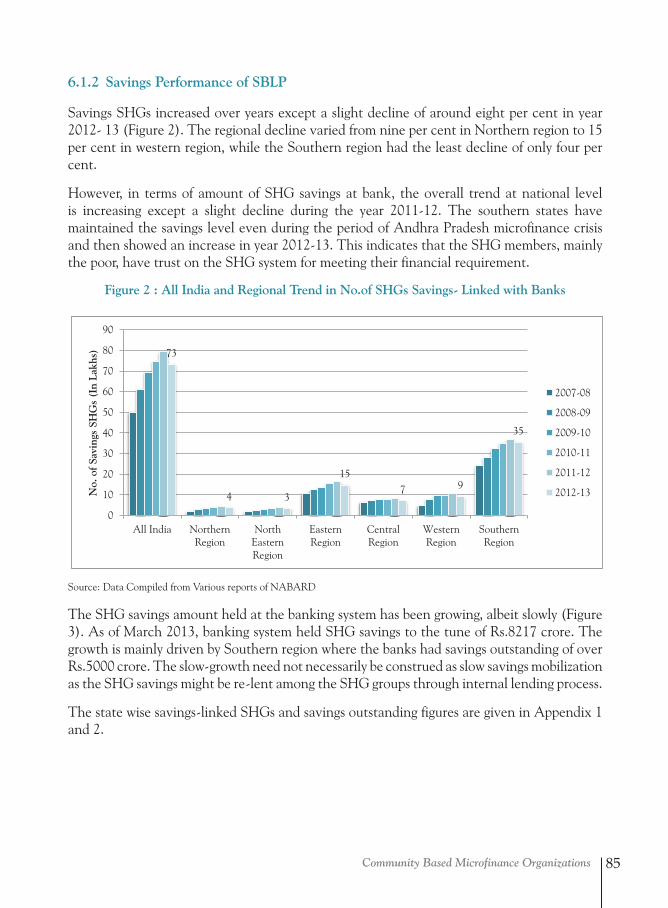
Community Based Microfinance Organizations 85
6.1.2 Savings Performance of SBLP
Savings SHGs increased over years except a slight decline of around eight per cent in year 2012- 13 (Figure 2). The regional decline varied from nine per cent in Northern region to 15 per cent in western region, while the Southern region had the least decline of only four per cent.
However, in terms of amount of SHG savings at bank, the overall trend at national level is increasing except a slight decline during the year 2011-12. The southern states have maintained the savings level even during the period of Andhra Pradesh microfinance crisis and then showed an increase in year 2012-13. This indicates that the SHG members, mainly the poor, have trust on the SHG system for meeting their financial requirement.
Figure 2 : All India and Regional Trend in No.of SHGs Savings- Linked with Banks
73
4 3
15 7 9
35
0
10
20
30
40
50
60
70
80
90
All India NorthernRegion
NorthEasternRegion
EasternRegion
CentralRegion
WesternRegion
SouthernRegion
No.
of S
avin
gs S
HG
s (I
n La
khs)
2007-08
2008-09
2009-10
2010-11
2011-12
2012-13
8217
5083
696 6241393
130 2910
100020003000400050006000700080009000
All India southern Western Region
Central Region
Eastern Region
North -Eastern Region
Northern Region
Savi
ngs
Amou
nt(R
s. C
rore
)
2007-08
2008-09
2009-10
2010-11
2011-12
2012-13
Source: Data Compiled from Various reports of NABARD
The SHG savings amount held at the banking system has been growing, albeit slowly (Figure 3). As of March 2013, banking system held SHG savings to the tune of Rs.8217 crore. The growth is mainly driven by Southern region where the banks had savings outstanding of over Rs.5000 crore. The slow-growth need not necessarily be construed as slow savings mobilization as the SHG savings might be re-lent among the SHG groups through internal lending process.
The state wise savings-linked SHGs and savings outstanding figures are given in Appendix 1 and 2.
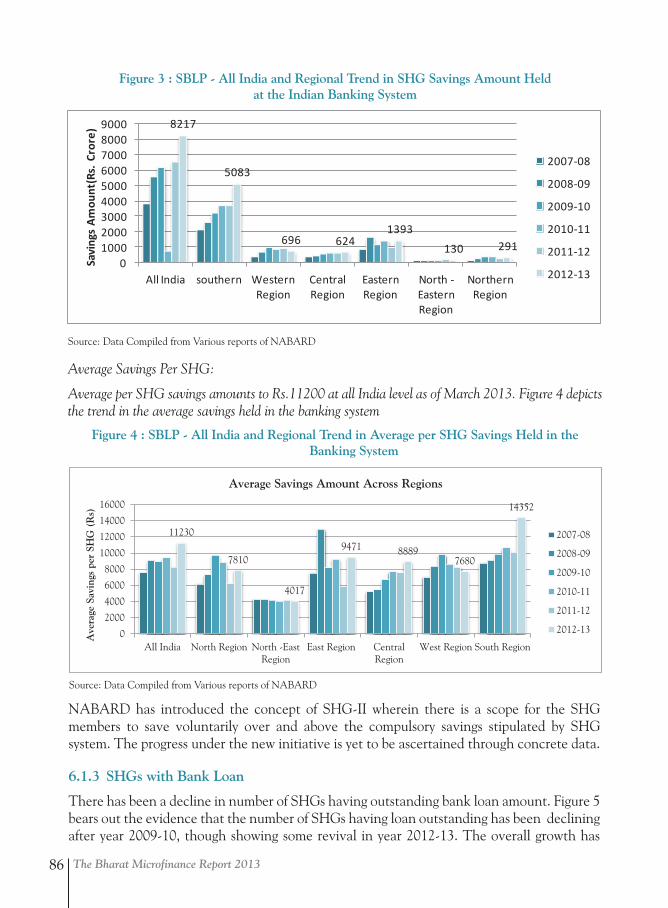
The Bharat Microfinance Report 201386
Figure 3 : SBLP - All India and Regional Trend in SHG Savings Amount Heldat the Indian Banking System
Source: Data Compiled from Various reports of NABARD
Average Savings Per SHG:
Average per SHG savings amounts to Rs.11200 at all India level as of March 2013. Figure 4 depicts the trend in the average savings held in the banking system
Figure 4 : SBLP - All India and Regional Trend in Average per SHG Savings Held in the Banking System
73
4 3
15 7 9
35
0
10
20
30
40
50
60
70
80
90
All India NorthernRegion
NorthEasternRegion
EasternRegion
CentralRegion
WesternRegion
SouthernRegion
No.
of S
avin
gs S
HG
s (I
n La
khs)
2007-08
2008-09
2009-10
2010-11
2011-12
2012-13
8217
5083
696 6241393
130 2910
100020003000400050006000700080009000
All India southern Western Region
Central Region
Eastern Region
North -Eastern Region
Northern Region
Savi
ngs
Amou
nt(R
s. C
rore
)
2007-08
2008-09
2009-10
2010-11
2011-12
2012-13
NABARD has introduced the concept of SHG-II wherein there is a scope for the SHG members to save voluntarily over and above the compulsory savings stipulated by SHG system. The progress under the new initiative is yet to be ascertained through concrete data.
6.1.3 SHGs with Bank Loan
There has been a decline in number of SHGs having outstanding bank loan amount. Figure 5 bears out the evidence that the number of SHGs having loan outstanding has been declining after year 2009-10, though showing some revival in year 2012-13. The overall growth has
11230
7810
4017
9471 8889 7680
14352
0
2000
4000
6000
8000
10000
12000
14000
16000
All India North Region North -EastRegion
East Region CentralRegion
West Region South Region
Ave
rage
Sav
ings
per
SH
G (
Rs)
Average Savings Amount Across Regions
2007-08
2008-09
2009-10
2010-11
2011-12
2012-13
Source: Data Compiled from Various reports of NABARD
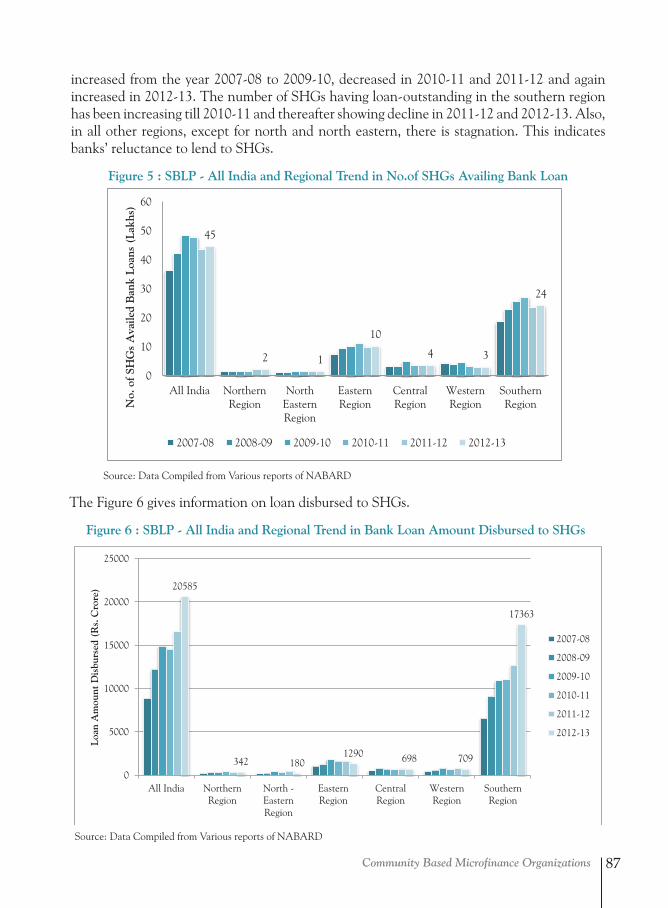
Community Based Microfinance Organizations 87
increased from the year 2007-08 to 2009-10, decreased in 2010-11 and 2011-12 and again increased in 2012-13. The number of SHGs having loan-outstanding in the southern region has been increasing till 2010-11 and thereafter showing decline in 2011-12 and 2012-13. Also, in all other regions, except for north and north eastern, there is stagnation. This indicates banks’ reluctance to lend to SHGs.
Figure 5 : SBLP - All India and Regional Trend in No.of SHGs Availing Bank Loan
45
2 1
10
4 3
24
0
10
20
30
40
50
60
All India NorthernRegion
NorthEasternRegion
EasternRegion
CentralRegion
WesternRegion
SouthernRegionNo.
of S
HG
s A
vaile
d B
ank
Loan
s (L
akhs
)
2007-08 2008-09 2009-10 2010-11 2011-12 2012-13
20585
342 180 1290 698 709
17363
0
5000
10000
15000
20000
25000
All India NorthernRegion
North -EasternRegion
EasternRegion
CentralRegion
WesternRegion
SouthernRegion
Loan
Am
ount
Dis
burs
ed (
Rs.
Cro
re)
2007-08
2008-09
2009-10
2010-11
2011-12
2012-13
The Figure 6 gives information on loan disbursed to SHGs.
Figure 6 : SBLP - All India and Regional Trend in Bank Loan Amount Disbursed to SHGs
45
2 1
10
4 3
24
0
10
20
30
40
50
60
All India NorthernRegion
NorthEasternRegion
EasternRegion
CentralRegion
WesternRegion
SouthernRegionN
o. o
f SH
Gs
Ava
iled
Ban
k Lo
ans
(Lak
hs)
2007-08 2008-09 2009-10 2010-11 2011-12 2012-13
20585
342 180 1290 698 709
17363
0
5000
10000
15000
20000
25000
All India NorthernRegion
North -EasternRegion
EasternRegion
CentralRegion
WesternRegion
SouthernRegion
Loan
Am
ount
Dis
burs
ed (
Rs.
Cro
re)
2007-08
2008-09
2009-10
2010-11
2011-12
2012-13
Source: Data Compiled from Various reports of NABARD
Source: Data Compiled from Various reports of NABARD
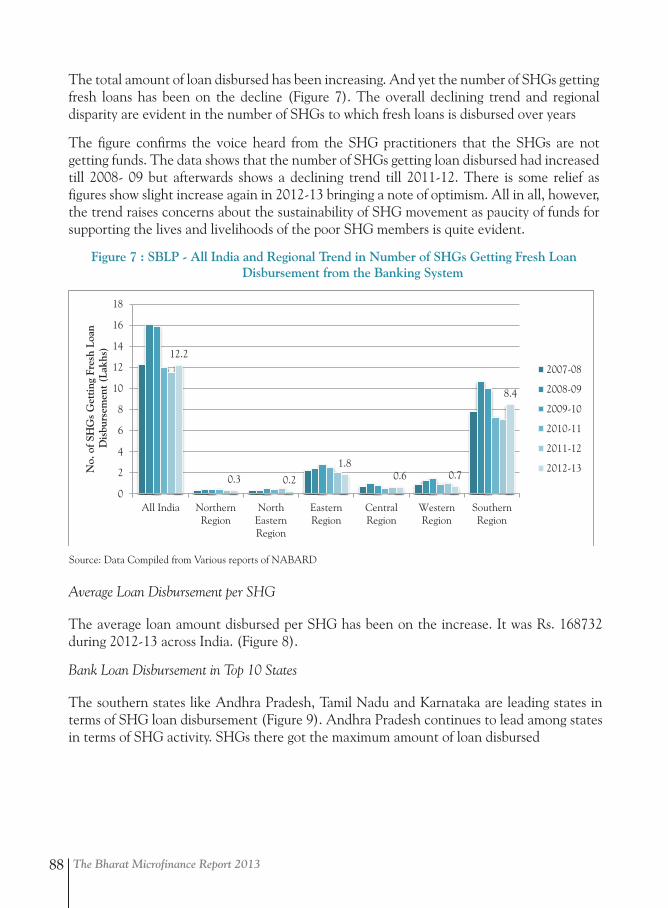
The Bharat Microfinance Report 201388
The total amount of loan disbursed has been increasing. And yet the number of SHGs getting fresh loans has been on the decline (Figure 7). The overall declining trend and regional disparity are evident in the number of SHGs to which fresh loans is disbursed over years
The figure confirms the voice heard from the SHG practitioners that the SHGs are not getting funds. The data shows that the number of SHGs getting loan disbursed had increased till 2008- 09 but afterwards shows a declining trend till 2011-12. There is some relief as figures show slight increase again in 2012-13 bringing a note of optimism. All in all, however, the trend raises concerns about the sustainability of SHG movement as paucity of funds for supporting the lives and livelihoods of the poor SHG members is quite evident.
Figure 7 : SBLP - All India and Regional Trend in Number of SHGs Getting Fresh Loan Disbursement from the Banking System
12.2
0.3 0.2
1.8 0.6 0.7
8.4
0
2
4
6
8
10
12
14
16
18
All India NorthernRegion
NorthEasternRegion
EasternRegion
CentralRegion
WesternRegion
SouthernRegion
No.
of S
HG
s G
ettin
g Fr
esh
Loan
D
isbu
rsem
ent (
Lakh
s)
2007-08
2008-09
2009-10
2010-11
2011-12
2012-13
Average Loan Disbursement per SHG
The average loan amount disbursed per SHG has been on the increase. It was Rs. 168732 during 2012-13 across India. (Figure 8).
Bank Loan Disbursement in Top 10 States
The southern states like Andhra Pradesh, Tamil Nadu and Karnataka are leading states in terms of SHG loan disbursement (Figure 9). Andhra Pradesh continues to lead among states in terms of SHG activity. SHGs there got the maximum amount of loan disbursed
Source: Data Compiled from Various reports of NABARD
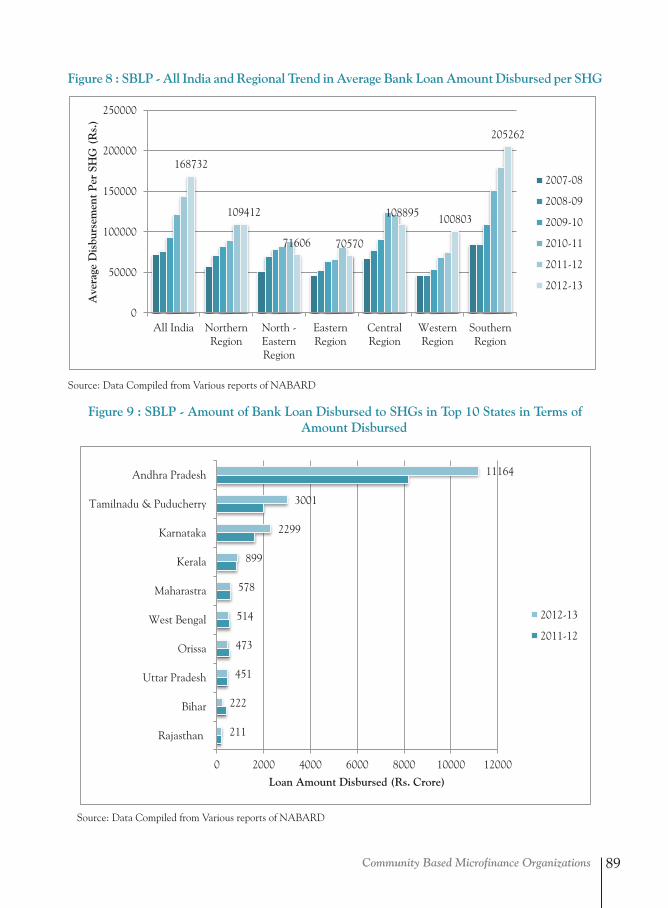
Community Based Microfinance Organizations 89
Figure 8 : SBLP - All India and Regional Trend in Average Bank Loan Amount Disbursed per SHG
Source: Data Compiled from Various reports of NABARD
Figure 9 : SBLP - Amount of Bank Loan Disbursed to SHGs in Top 10 States in Terms of Amount Disbursed
168732
109412
71606 70570
108895 100803
205262
0
50000
100000
150000
200000
250000
All India NorthernRegion
North -EasternRegion
EasternRegion
CentralRegion
WesternRegion
SouthernRegion
Ave
rage
Dis
burs
emen
t P
er S
HG
(R
s.)
2007-08
2008-09
2009-10
2010-11
2011-12
2012-13
211
222
451
473
514
578
899
2299
3001
11164
0 2000 4000 6000 8000 10000 12000
Rajasthan
Bihar
Uttar Pradesh
Orissa
West Bengal
Maharastra
Kerala
Karnataka
Tamilnadu & Puducherry
Andhra Pradesh
Loan Amount Disbursed (Rs. Crore)
2012-13
2011-12
Source: Data Compiled from Various reports of NABARD
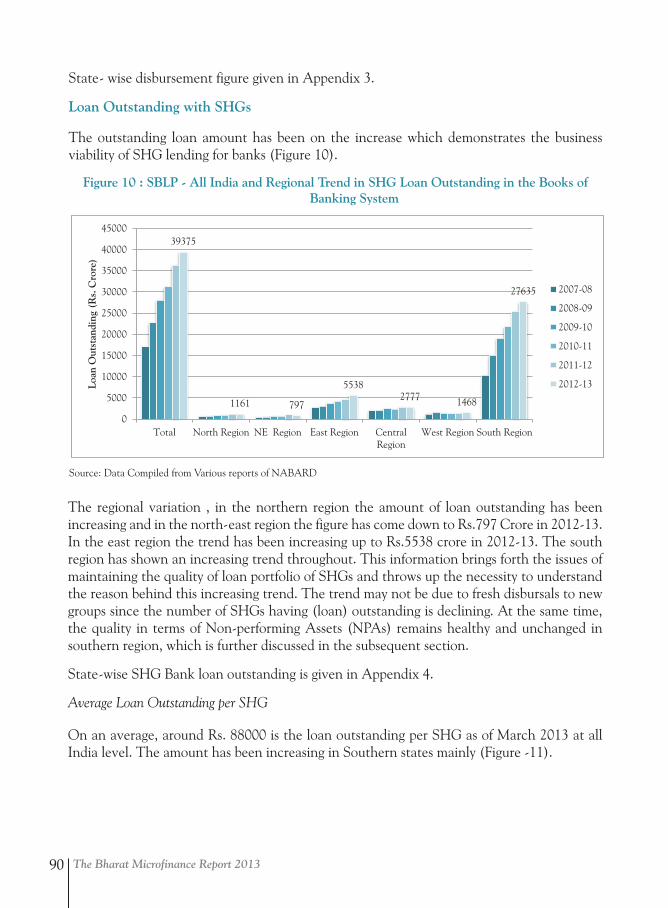
The Bharat Microfinance Report 201390
State- wise disbursement figure given in Appendix 3.
Loan Outstanding with SHGs
The outstanding loan amount has been on the increase which demonstrates the business viability of SHG lending for banks (Figure 10).
Figure 10 : SBLP - All India and Regional Trend in SHG Loan Outstanding in the Books of Banking System
The regional variation , in the northern region the amount of loan outstanding has been increasing and in the north-east region the figure has come down to Rs.797 Crore in 2012-13. In the east region the trend has been increasing up to Rs.5538 crore in 2012-13. The south region has shown an increasing trend throughout. This information brings forth the issues of maintaining the quality of loan portfolio of SHGs and throws up the necessity to understand the reason behind this increasing trend. The trend may not be due to fresh disbursals to new groups since the number of SHGs having (loan) outstanding is declining. At the same time, the quality in terms of Non-performing Assets (NPAs) remains healthy and unchanged in southern region, which is further discussed in the subsequent section.
State-wise SHG Bank loan outstanding is given in Appendix 4.
Average Loan Outstanding per SHG
On an average, around Rs. 88000 is the loan outstanding per SHG as of March 2013 at all India level. The amount has been increasing in Southern states mainly (Figure -11).
39375
1161 797
5538 2777 1468
27635
0
5000
10000
15000
20000
25000
30000
35000
40000
45000
Total North Region NE Region East Region CentralRegion
West Region South Region
Loan
Out
stan
ding
(R
s. C
rore
)
2007-08
2008-09
2009-10
2010-11
2011-12
2012-13
Source: Data Compiled from Various reports of NABARD
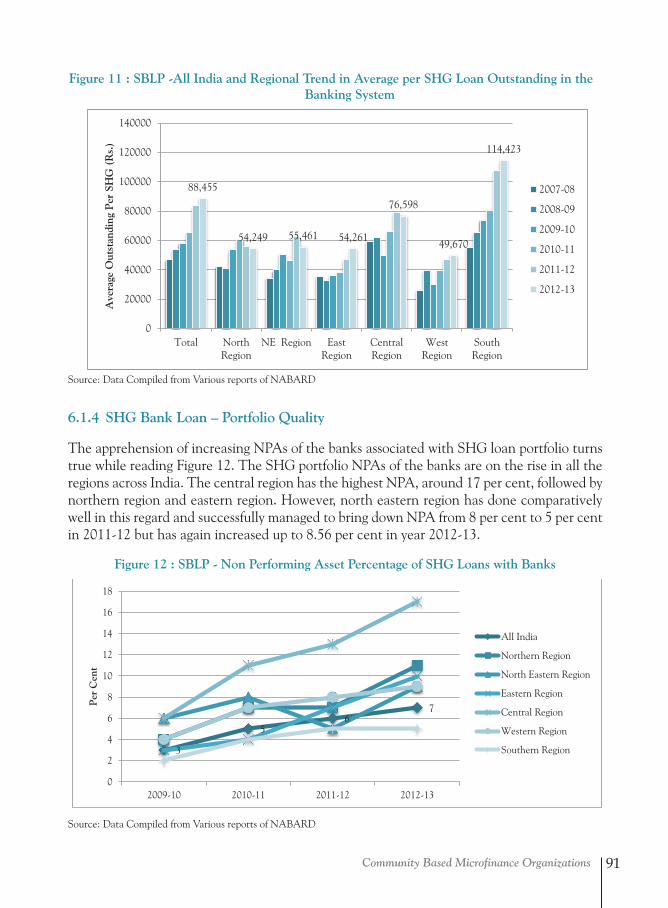
Community Based Microfinance Organizations 91
6.1.4 SHG Bank Loan – Portfolio Quality
The apprehension of increasing NPAs of the banks associated with SHG loan portfolio turns true while reading Figure 12. The SHG portfolio NPAs of the banks are on the rise in all the regions across India. The central region has the highest NPA, around 17 per cent, followed by northern region and eastern region. However, north eastern region has done comparatively well in this regard and successfully managed to bring down NPA from 8 per cent to 5 per cent in 2011-12 but has again increased up to 8.56 per cent in year 2012-13.
Figure 12 : SBLP - Non Performing Asset Percentage of SHG Loans with Banks
Figure 11 : SBLP -All India and Regional Trend in Average per SHG Loan Outstanding in the Banking System
88,455
54,249 55,461 54,261
76,598
49,670
114,423
0
20000
40000
60000
80000
100000
120000
140000
Total NorthRegion
NE Region EastRegion
CentralRegion
WestRegion
SouthRegion
Ave
rage
Out
stan
ding
Per
SH
G (
Rs.
)
2007-08
2008-09
2009-10
2010-11
2011-12
2012-13
Source: Data Compiled from Various reports of NABARD
3
5 6
7
0
2
4
6
8
10
12
14
16
18
2009-10 2010-11 2011-12 2012-13
Per
Cen
t
All India
Northern Region
North Eastern Region
Eastern Region
Central Region
Western Region
Southern Region
Source: Data Compiled from Various reports of NABARD
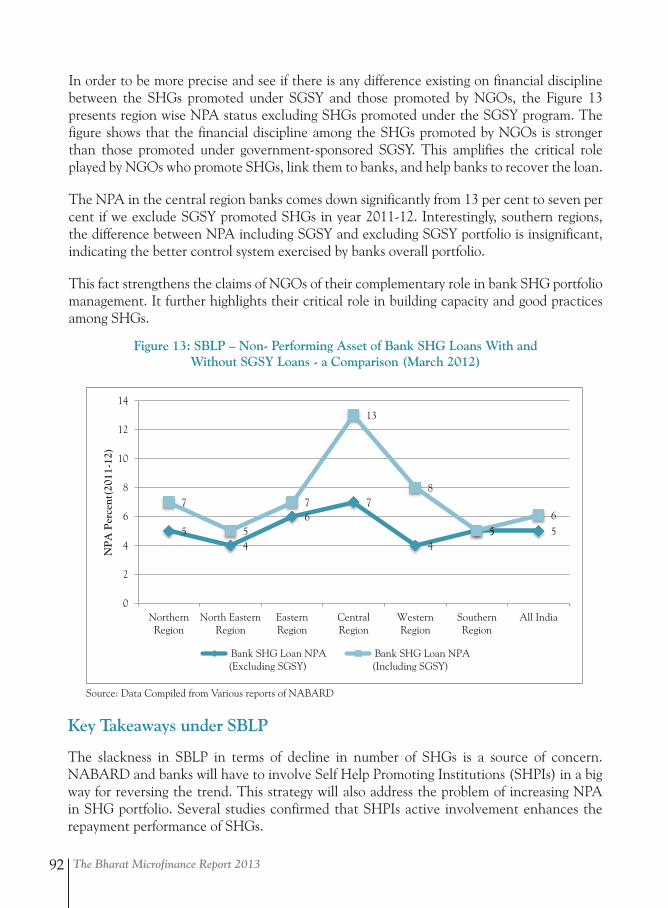
The Bharat Microfinance Report 201392
In order to be more precise and see if there is any difference existing on financial discipline between the SHGs promoted under SGSY and those promoted by NGOs, the Figure 13 presents region wise NPA status excluding SHGs promoted under the SGSY program. The figure shows that the financial discipline among the SHGs promoted by NGOs is stronger than those promoted under government-sponsored SGSY. This amplifies the critical role played by NGOs who promote SHGs, link them to banks, and help banks to recover the loan.
The NPA in the central region banks comes down significantly from 13 per cent to seven per cent if we exclude SGSY promoted SHGs in year 2011-12. Interestingly, southern regions, the difference between NPA including SGSY and excluding SGSY portfolio is insignificant, indicating the better control system exercised by banks overall portfolio.
This fact strengthens the claims of NGOs of their complementary role in bank SHG portfolio management. It further highlights their critical role in building capacity and good practices among SHGs.
Figure 13: SBLP – Non- Performing Asset of Bank SHG Loans With andWithout SGSY Loans - a Comparison (March 2012)
5 4
6 7
4 5 5
7
5
7
13
8
5 6
0
2
4
6
8
10
12
14
NorthernRegion
North EasternRegion
EasternRegion
CentralRegion
WesternRegion
SouthernRegion
All India
NP
A P
erce
nt(2
011-
12)
Bank SHG Loan NPA(Excluding SGSY)
Bank SHG Loan NPA(Including SGSY)
Key Takeaways under SBLP
The slackness in SBLP in terms of decline in number of SHGs is a source of concern. NABARD and banks will have to involve Self Help Promoting Institutions (SHPIs) in a big way for reversing the trend. This strategy will also address the problem of increasing NPA in SHG portfolio. Several studies confirmed that SHPIs active involvement enhances the repayment performance of SHGs.
Source: Data Compiled from Various reports of NABARD
Community Based Microfinance Organizations 93
Banks’ adequate compensation for the NGO-SHPIs will pave way for best practices on the ground. GoI has fixed a compensation pattern for NGOs–Rs.10000 grant assistance per group formed and 5 per cent per annum on net outstanding credit – engaged in women SHG programme in 150 Left- wing- Extremist affected districts of the country. This norm may be followed for all NGO-SHPI work across the country.
6.2 SHGs and Their Federations-Some Observations
The Self Help Group (SHG) movement in India is one of the largest movements working towards poverty alleviation, social transformation, women empowerment and financial inclusion. It has led to a paradigm shift in the poverty alleviation programs and introduced the use of social capital and group strategy towards addressing poverty.
The SHGs and Federations are basic level institutions of the poor to which banks lend, government provide subsidized facilities, etc. The benefit realizable on the investment made on these institutions very much depends on the quality and capacity of these institutions. Some facts and observations on SHGs and their federations are given in this section.
6.2.1 SHG Quality
Sa-Dhan conducted a study3 on SHGs promoted by self help promoting member NGOs viz. Nidan, Nav Jagriti, SBMA, Sewa Mandir, Urmul Semant, Urmul Setu, CYSD. The findings show that the constitution of self help groups abides by the principles of social cohesion and social capital building. Some Specific facts on the group quality:
Homogeneity:
• Around 80 per cent of the members of the SHGs are having geographical proximity 67 per cent of the members of SHGs come from the same type of occupation
Organizational Discipline:
• 60 per cent of the SHGs are having regular meetings (at least once in a month).
• 67 per cent SHGs are having participation of more than 90 per cent of their members.
• More than 73 per cent of the SHGs are having regularity in savings.
System maintenance at SHGs level:
• Only 27 per cent of the SHGs have written rules and regulations in four major areas of operations: Savings, Meetings, Credit, and Group Management.
• Further, the findings raise concerns on book keeping and documentations as
3 Sa-Dhan, 2013, A Study To assess the CMMF Program of Plan India in Four States, New Delhi.
The Bharat Microfinance Report 201394
SHGs give more importance to the ledger maintenance than minute’s book, but maintenance of minute’s book has its own importance for the group management and decision making. It is found that 60 per cent of the SHGs give focus on minute’s book writing whereas 73 per cent give primary focus on ledger maintenance. Moreover, the grey area prevails in the operations of the SHGs as loans have been disbursed to less than 30 per cent members of the 47 per cent of the SHGs under study.
• 65 per cent of SHGs had bank linkage, while 12 -20 per cent got credit support.
• Loan Repayment is 87 per cent.
• Interest rate from banks to SHGs: 12-14 per cent
• Time gap for bank loan disbursement from application date -1-6 months Dormant groups –around 10 per cent.
• Savings so mobilized is not fully used for internal lending (only 47 per cent used for internal lending and the rest lying in bank account. This fact is in contrast with NABARD estimate of 70 per cent being used for internal lending
6.2.2 SHG Federations
In order to provide financial and operational sustainability to the SHGs and draw the benefits of the economies of scale, the SHG-Federation model have been evolved in India. Even though SHGs are now recognized as an institution per se through RBI guideline and can operate their own bank account, still there are inherent limitations of a small unregistered group. The benefits of federations include:
i. Reduction in transaction cost
ii. Reduction in default rates at all levels
iii. Provision of value adding services
iv. Reduction in the cost of promoting new SHGs (that is, in the cost of reaching out to every poor woman) and
v. Increasing levels of financial discipline and accountability among SHGs.
The whole range of services provided by federations could be grouped into four categories, viz, institutional development, financial intermediation, livelihoods and business development service, and social intermediation. Also, it has been experienced that each SHG has its own growth path dependent on the socio-economic scenario of the members and it needs support for several years. The SHG-Federations which are primarily an association of all SHGs operating in nearby geography can extend support to these SHGs and also work as a platform for strengthening demands from external agencies. Table 1 displays statistics on network of Federations in India.
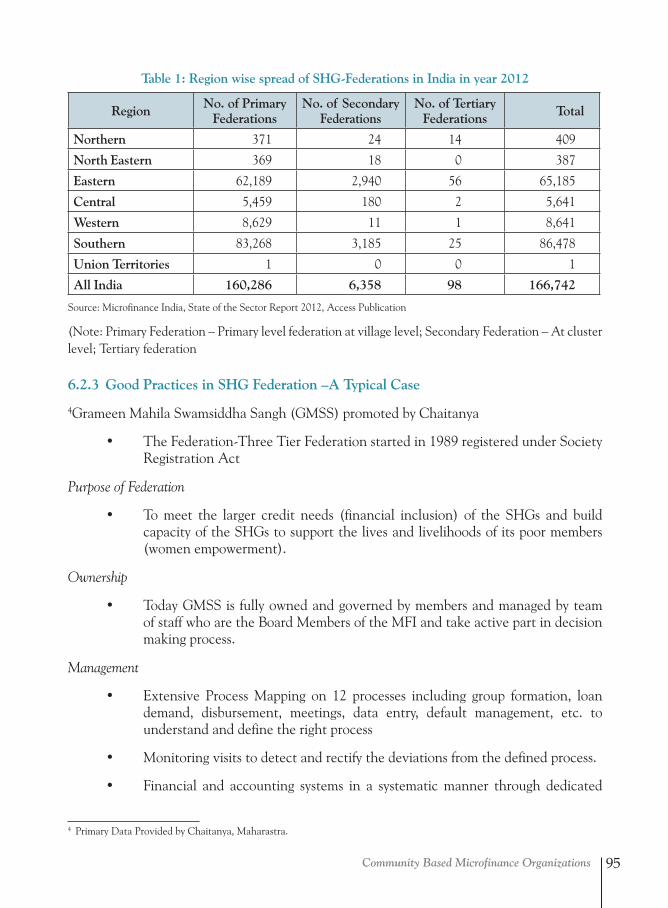
Community Based Microfinance Organizations 95
Table 1: Region wise spread of SHG-Federations in India in year 2012
Region No. of Primary Federations
No. of Secondary Federations
No. of Tertiary Federations Total
Northern 371 24 14 409
North Eastern 369 18 0 387
Eastern 62,189 2,940 56 65,185
Central 5,459 180 2 5,641
Western 8,629 11 1 8,641
Southern 83,268 3,185 25 86,478
Union Territories 1 0 0 1
All India 160,286 6,358 98 166,742
Source: Microfinance India, State of the Sector Report 2012, Access Publication
(Note: Primary Federation – Primary level federation at village level; Secondary Federation – At cluster level; Tertiary federation
6.2.3 Good Practices in SHG Federation –A Typical Case
4Grameen Mahila Swamsiddha Sangh (GMSS) promoted by Chaitanya
• The Federation-Three Tier Federation started in 1989 registered under Society Registration Act
Purpose of Federation
• To meet the larger credit needs (financial inclusion) of the SHGs and build capacity of the SHGs to support the lives and livelihoods of its poor members (women empowerment).
Ownership
• Today GMSS is fully owned and governed by members and managed by team of staff who are the Board Members of the MFI and take active part in decision making process.
Management
• Extensive Process Mapping on 12 processes including group formation, loan demand, disbursement, meetings, data entry, default management, etc. to understand and define the right process
• Monitoring visits to detect and rectify the deviations from the defined process.
• Financial and accounting systems in a systematic manner through dedicated
4 Primary Data Provided by Chaitanya, Maharastra.
The Bharat Microfinance Report 201396
accounting team at Head Office with delegated teams with responsibilities viz., maintaining loan/savings ledger, cashbook, general ledger, vouchers, general ledger, etc.
Value added services
• The registered status of the federation enabled to access outside credit from banks and institutions like Sate Bank of Hyderabad, SIDBI, NABARD, etc and re-lend to member SHGs. The SHGs have been able to get cash credit limit also.
• Livelihood promotion through micro-credit, technical support, training and guidance to their members towards promotion of on- farm and off- farm activities.
• Capacity building programs, trainings, exposure visits and technical support helped farmers adopt organic farming, horticulture, kitchen gardening and diversified their cropping pattern. This resulted in enhanced income and reduced cost of production.
• Members without irrigation facility or land were encouraged to go in for micro- enterprises viz, tailoring shops, stationery shops, flour and spice mill, tea shops etc.
• Kalamb village which is located in Ambegaon block has water but due to lack of knowledge, skill and financial resources the marginal farmers were left outside from main stream development process. GMSS introduced vegetable cultivation and marketing of vegetables. The average loan size microcredit loan given to the SHG in 2007 was Rs.25, 000 which increased to Rs. 40,000 by December 2009, evidencing the higher credit absorption capacity of the farmers.
Sustainability
• Savings from the SHG members – compulsory savings when an SHG becomes member of GMSS. This helped GMSS to raise corpus and revolving savings.
• GMSS would provide credit to SHGs charging an interest rate of 21 per cent and the SHGs can in turn lend to their members at a rate of 24 per cent.
• The membership increase and the higher credit disbursals enabled the GMSS to increase turn over and ensure sustainability. The cost cutting exercise, narrated below, also contributed to the sustainability
Reduction in the cost of promoting new SHGs & enhanced MIS
• Cost Cutting - GMSS got restructuring in 2008 the field staff were recruited from the community as a result they have minimized transport cost of the field force as they have advantage of having people from local community.
Community Based Microfinance Organizations 97
• The overhead cost on salaries has reduced drastically as cluster supervisors were recruited from the field level to manage clusters and at office level.
• The technical support has helped the MFI to prepare their business plans, manage their finances and deliver their products and services to larger section of the population effectively and efficiently.
6.2.4 Strengthening SHGs and Federations – Some Suggestions for the Future
• Federations5 should be prepared to change into a company, cooperative society or other form that ensures continued support from external stakeholders such as banks, governments and donors. During the course of this transformation, retaining community participation in ownership and governance is critical.
• Federations would do well to embed financial intermediation in livelihood development programmes over time. Federations cannot rely on financial intermediation to generate resources for their non-financial interventions. Appropriate sources of long term funds must be accessed. The federations need much stronger policy support.
• Banks should see federations as financial intermediary to purvey credit to SHGs members which would reduce credit delivery cost. The government could also rely on federations to reach a large number of beneficiaries at low effective costs. The members of the federations benefit from having an institution of their own that has the size and competence to negotiate on their behalf and function in their interest.
• To mobilize and pool the managerial capabilities from all sections of primary members, a system of compensation for the time dedicated for functions in SHG institutions may be introduced to the leaders, with the condition of compulsory rotation of leadership at specified periodicity.
Federations have brought in visibility to the SHGs as independent institutions. The SHG institution are going to play very crucial role in the years to come in the light of nationwide NRLM programme which focuses on livelihood promotion of SHG members through multiples interventions.
Federations require additional capacity to take up the development role and evolve as a community based organization. The federations require robust MIS to handle data and use the information for decision making. Culture of Federation Rating needs to evolve. This will help financial institutions to assess the risk and fund federations. NABARD, on its part may actively facilitate Federation-Bank linkages by obtaining necessary guidelines from RBI, orientating banks through capacity building, refinancing, credit guaranty etc.
5 Girija Srinivasan, Ajay Tankha,2010, SHG Federations-Development Costs and Sustainability, Access Development Services, New Delhi
The Bharat Microfinance Report 201398
6.3 Self Help Promoting Institutions (SHPIs)
SHG movement took birth from initial spade work done by prominent NGOs viz, MYRADA and PRADAN in 1980’s. The recognition of such work by NABARD and Reserve Bank of India in early 1990’s has taken the SHG operation into a new scale. The expansion of SHG activities was facilitated by the NGOs (now termed as Self Help Promoting Institutions (SHPIs). The SHPIs got involved in mobilizing women into SHGs, train them to have thrift habits, conduct the transactions, inter loaning, book keeping, opening accounts in banks, etc.
6.3.1 The Key Findings from Eight SHPI Data6
SHPIs have been facing innumerous challenges in their role in terms of funding, human resource etc. Sa-Dhan had been making efforts to map SHPI activities to understand their issues better. For the first time, eight members of Sa-Dhan reported data under different parameters. The size and experience of SHPIs vary vey widely. Also, given the small sample size, drawing broad conclusions and generalization to make them universally applicable to entire nation may not be relevant. Therefore, the primary data so received has been analyzed and three figures representing the range of data viz., the smallest, the highest and the median (middle) have been for each parameter of the data. The segregated figures are given in Table-2.
A cursory look at the table above shows that SHPIs are highly heterogeneous. There are a few key indicators which tell about the areas of intervention required by the stakeholders supporting SHPIs and SHG movement.
Average savings is around Rs.5000 (Rs.50000 per SHG approx, if it is a 10-member SHG) which is quite high compared to the average savings reported by NABARD (Around Rs.11000 per SHG in 2013). Thus, the savings potential of members is far more than what the SHG movement is currently tapping.
Similarly, the average loan outstanding per SHG (as reported by SHPIs – Rs.49000, (4927 x 10) is lower than the average reported by NABARD in all India level (Rs. 88000). Thus, credit availability of SHPI – supported SHG is very low and this has to be addressed.
6 Source : Primary Data Received by Sa-Dhan
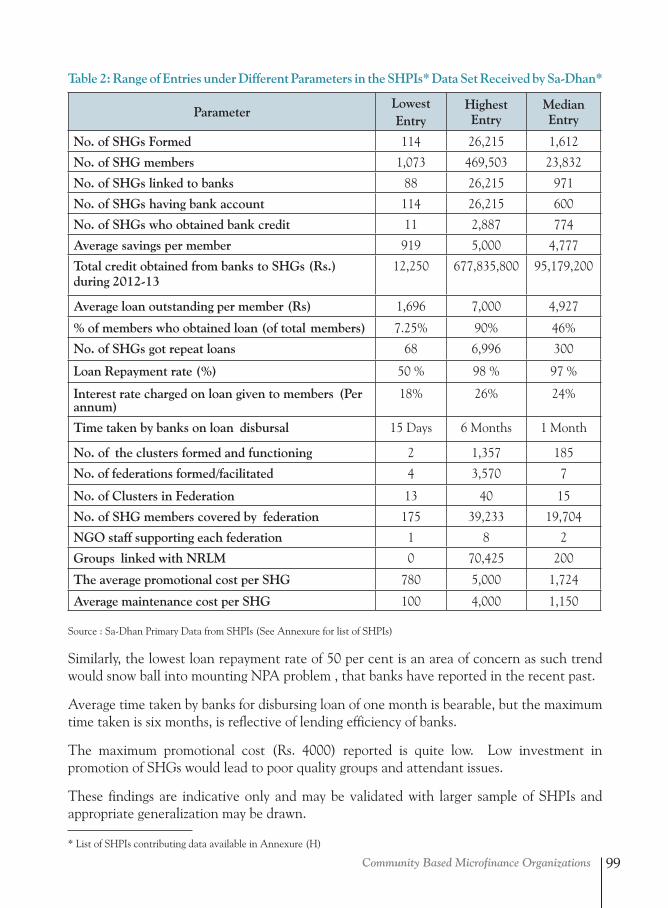
Community Based Microfinance Organizations 99
Table 2: Range of Entries under Different Parameters in the SHPIs* Data Set Received by Sa-Dhan*
ParameterLowest Entry
Highest Entry
Median Entry
No. of SHGs Formed 114 26,215 1,612
No. of SHG members 1,073 469,503 23,832
No. of SHGs linked to banks 88 26,215 971
No. of SHGs having bank account 114 26,215 600
No. of SHGs who obtained bank credit 11 2,887 774
Average savings per member 919 5,000 4,777
Total credit obtained from banks to SHGs (Rs.) during 2012-13
12,250 677,835,800 95,179,200
Average loan outstanding per member (Rs) 1,696 7,000 4,927
% of members who obtained loan (of total members) 7.25% 90% 46%
No. of SHGs got repeat loans 68 6,996 300
Loan Repayment rate (%) 50 % 98 % 97 %
Interest rate charged on loan given to members (Per annum)
18% 26% 24%
Time taken by banks on loan disbursal 15 Days 6 Months 1 Month
No. of the clusters formed and functioning 2 1,357 185
No. of federations formed/facilitated 4 3,570 7
No. of Clusters in Federation 13 40 15
No. of SHG members covered by federation 175 39,233 19,704
NGO staff supporting each federation 1 8 2
Groups linked with NRLM 0 70,425 200
The average promotional cost per SHG 780 5,000 1,724
Average maintenance cost per SHG 100 4,000 1,150
Source : Sa-Dhan Primary Data from SHPIs (See Annexure for list of SHPIs)
Similarly, the lowest loan repayment rate of 50 per cent is an area of concern as such trend would snow ball into mounting NPA problem , that banks have reported in the recent past.
Average time taken by banks for disbursing loan of one month is bearable, but the maximum time taken is six months, is reflective of lending efficiency of banks.
The maximum promotional cost (Rs. 4000) reported is quite low. Low investment in promotion of SHGs would lead to poor quality groups and attendant issues.
These findings are indicative only and may be validated with larger sample of SHPIs and appropriate generalization may be drawn.
* List of SHPIs contributing data available in Annexure (H)
The Bharat Microfinance Report 2013100
6.3.2 SHPI survey -Salient Observation
Sa-Dhan conducted survey7 of SHPIs to understand the issues faced by SHPIs spread across four states of Orissa, Bihar, Uttarakhand and Rajasthan. The important observations are:
• The SHPIs are registered as Society, Trust, Section -25 Companies, etc.
• 57 per cent SHPIs are having problem in opening of bank accounts for SHGs.
• 71 per cent SHPIs are having problem in bank credit linkage.
• 57 per cent SHPIs are having problems in getting repeated credit from banks.
• 85 per cent SHPIs are challenged to get SHG promotion cost reimbursed.
• 71 per cent SHPIs are having problem to get cost of promoting clusters/federation reimbursed.
• 71 per cent SHPIs are having problem of sustainability of SHGs over long term.
• 71 per cent SHPIs are having problem on sustainability of federations.
• Defunct SHGs is the problem with 43 per cent SHPIs.
• SHG accounts maintenance is an issue for 43 per cent SHPIs.
The survey results have pointed to the radical measures that need to be taken for engaging the banks to take ownership of SHGs and extend support to SHPIs to nurture groups for bank linkage.
6.3.3 SHPIs under Women Self Help Groups (WSHGs) Scheme
A new framework for intensifying development of women self help groups in rural areas of various backward districts of India is envisaged under LWE-WSHG (Left Wing Extremism Women SHG) scheme by Department of Financial Services Govt. of India, Ministry of Finance to be implemented across 150 backward districts of the country.
Operating Feature8
Lead Bank of selected districts and District Development Managers of NABARD are responsible for implementation, monitoring and coordination of the scheme in the districts. The scheme is implemented through two bank branches, having CBS facility, in each block of the identified districts. Each branch has one nodal person for handling all matters related to SHGs, openings of account, processing for credit etc. The Lead Bank will identify one NGO for each district in consultation with District level Coordination Committee (DLCC). The bank branch will enter a MoU with the main NGO.
7 Sponsored by Plan India. The SHPIs are: Nidan and Navjagriti ( Bihar), SBMA ( Uttarkhand), Sewa Mandir Urmul Semant, Urmul Setu (Rajasthan), CYSD ( Odisha)
8 Source- F. NO.3/6/2011-AC (VOL.II), Govt. of India, Ministry of Finance
Community Based Microfinance Organizations 101
Financial Assistance
NGOs/other support organizations shall be given a grant assistance of Rs.10, 000 per group in four installments, incentives for NGOs/other support organizations i.e. 5 per cent per annum on net outstanding credit shall be paid by the bank to the respective NGOs.
Sa-Dhan Efforts in WSHGs Scheme
In continuation of our efforts to monitor and track the progress of the SHG formation scheme in weakest districts of India, Sa-Dhan team visited the districts and discussing the implementation issues with all stakeholders, the anchor NGOs, local banks and regional NABARAD offices during May –June 2013-13.
The feedback from Sa-Dhan members -SKDRDP, Janhit Foundation, Support, Chaitanya, We The People and Holy Cross helped to highlight to the Ministry of Finance the suggestions under the project. They include:
• Flexibility to allow anchor NGOs to act as Banking Correspondents (BCs) transacting with SHGs and the banks, because bank branches do not have the capacity to deal with so many SHGs on a weekly basis. If so, some reimbursement of the costs of running the BC operations should be made by the banks.
• There have been problems in most districts with inordinate delays in opening and linking bank accounts and not giving importance to SHG members.
• Instituting an exposure and training programme to local bank managers on the role of SHGs as important channel of the Financial Inclusion agenda
• Creating incentive mechanism for the banks to be part of the programme.
• Sa-Dhan suggested modifying guidelines to have credit linkages within three months based on merits of the SHGs, as under SHG-II model.
• The implementing agency is also responsible for repayment and recovery. Hence, MoF /NABARD in consultation with NRLM/ MoRD may issue guidelines to state RD dept. for not floating tenders for LWE district covered under WSHG project.
• There could be regular consultations between the MoF officials, NABARD and some of the implementing NGOs on the above policy advocacy issues in order to strengthen the WSHG movement.
The list of Anchor NGOs/SHPIs who are members of Sa-Dhan and are taking part in the project is given in Table-3
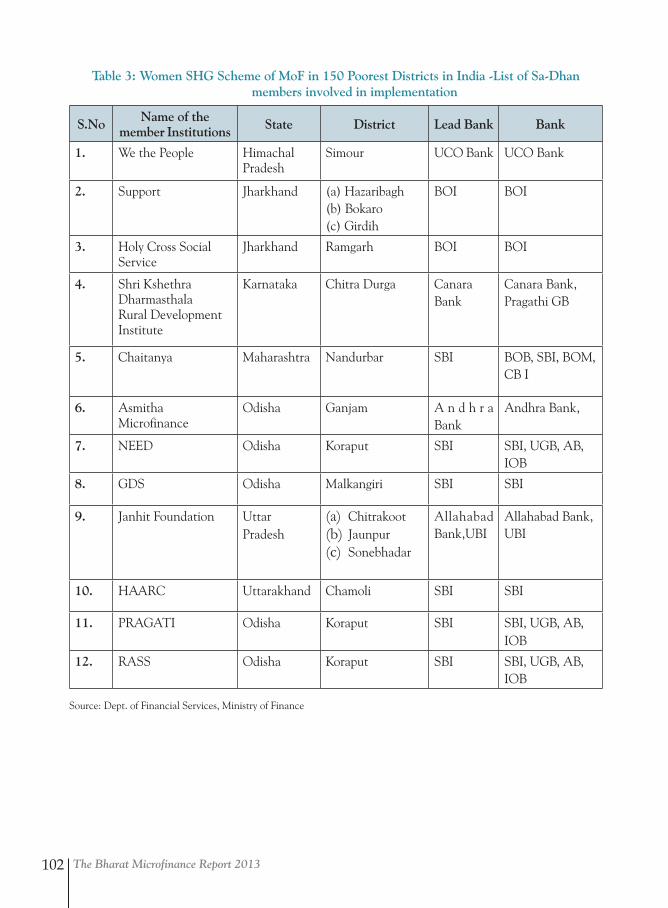
The Bharat Microfinance Report 2013102
Table 3: Women SHG Scheme of MoF in 150 Poorest Districts in India -List of Sa-Dhan members involved in implementation
S.No Name of the member Institutions State District Lead Bank Bank
1. We the People Himachal Pradesh
Simour UCO Bank UCO Bank
2. Support Jharkhand (a) Hazaribagh(b) Bokaro(c) Girdih
BOI BOI
3. Holy Cross Social Service
Jharkhand Ramgarh BOI BOI
4. Shri Kshethra Dharmasthala Rural Development Institute
Karnataka Chitra Durga Canara Bank
Canara Bank, Pragathi GB
5. Chaitanya Maharashtra Nandurbar SBI BOB, SBI, BOM, CB I
6. Asmitha Microfinance
Odisha Ganjam A n d h r a Bank
Andhra Bank,
7. NEED Odisha Koraput SBI SBI, UGB, AB, IOB
8. GDS Odisha Malkangiri SBI SBI
9. Janhit Foundation Uttar Pradesh
(a) Chitrakoot(b) Jaunpur(c) Sonebhadar
Allahabad Bank,UBI
Allahabad Bank, UBI
10. HAARC Uttarakhand Chamoli SBI SBI
11. PRAGATI Odisha Koraput SBI SBI, UGB, AB, IOB
12. RASS Odisha Koraput SBI SBI, UGB, AB, IOB
Source: Dept. of Financial Services, Ministry of Finance
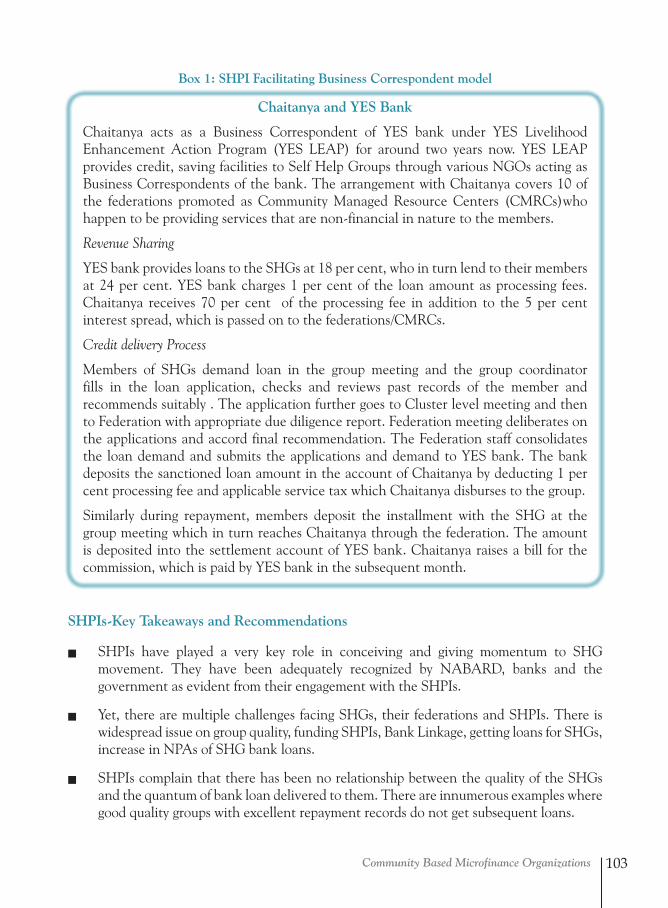
Community Based Microfinance Organizations 103
Box 1: SHPI Facilitating Business Correspondent model
Chaitanya and YES Bank
Chaitanya acts as a Business Correspondent of YES bank under YES Livelihood Enhancement Action Program (YES LEAP) for around two years now. YES LEAP provides credit, saving facilities to Self Help Groups through various NGOs acting as Business Correspondents of the bank. The arrangement with Chaitanya covers 10 of the federations promoted as Community Managed Resource Centers (CMRCs)who happen to be providing services that are non-financial in nature to the members.
Revenue Sharing
YES bank provides loans to the SHGs at 18 per cent, who in turn lend to their members at 24 per cent. YES bank charges 1 per cent of the loan amount as processing fees. Chaitanya receives 70 per cent of the processing fee in addition to the 5 per cent interest spread, which is passed on to the federations/CMRCs.
Credit delivery Process
Members of SHGs demand loan in the group meeting and the group coordinator fills in the loan application, checks and reviews past records of the member and recommends suitably . The application further goes to Cluster level meeting and then to Federation with appropriate due diligence report. Federation meeting deliberates on the applications and accord final recommendation. The Federation staff consolidates the loan demand and submits the applications and demand to YES bank. The bank deposits the sanctioned loan amount in the account of Chaitanya by deducting 1 per cent processing fee and applicable service tax which Chaitanya disburses to the group.
Similarly during repayment, members deposit the installment with the SHG at the group meeting which in turn reaches Chaitanya through the federation. The amount is deposited into the settlement account of YES bank. Chaitanya raises a bill for the commission, which is paid by YES bank in the subsequent month.
SHPIs-Key Takeaways and Recommendations
Q SHPIs have played a very key role in conceiving and giving momentum to SHG movement. They have been adequately recognized by NABARD, banks and the government as evident from their engagement with the SHPIs.
Q Yet, there are multiple challenges facing SHGs, their federations and SHPIs. There is widespread issue on group quality, funding SHPIs, Bank Linkage, getting loans for SHGs, increase in NPAs of SHG bank loans.
Q SHPIs complain that there has been no relationship between the quality of the SHGs and the quantum of bank loan delivered to them. There are innumerous examples where good quality groups with excellent repayment records do not get subsequent loans.
The Bharat Microfinance Report 2013104
Recommendations:
i. The Banks need to put extra efforts and investment in entertaining SHG business generated by SHPIs. There shall be dedicated staff, simplified procedure, standardized forms, etc. to reduce the drudgery, time lag and waiting period for SHGs getting loan. Indian Bank’s Micro State branch is a typical example of focused SHG lending. The model may be emulated by other banks as well.
ii. NABARD’s initiative under SHG-II is yet to yield any concrete results on the ground in terms of bank credit flow to the SHGs. The Credit-Deposit ratio of groups formed by the eight SHPIs who reported data is barely 1: 1. This is in contrast to 1: 7 ratio ascertained through per- SHG savings and Loan outstanding reported by NABARD. There appears to be low credit offering to SHGs formed by SHPIs and this needs to be addressed.
iii. Banks’ adequate compensation for the NGO-SHPIs will pave way for best practices on the ground. GoI has fixed a compensation pattern for NGOs–Rs.10000 grant assistance per group formed and 5 per cent per annum on net outstanding credit – engaged in women SHG programme in 150 Left- wing- Extremist affected districts of the country. This norm may be followed for all NGO-SHPI work across the country.
iv. Banks need to compensate the SHPIs SHG work timely, in terms of releasing the commission.
v. The SHPIs as well as Federations need to explore Banking Correspondent model for sustainable service to the SHGs. They can draw lessons from Chaitanya –Yes Bank Banking Correspondent Model.
6.4 Livelihoods Promotion through Self Help Groups
Livelihood Promotion is the primary objective of the microfinance interventions. SHG work in India largely has been towards women empowerment, financial inclusion and improving standards of living through livelihood promotion.
NABARD has supported many NGOs and Self Help Promoting institutions to undertake livelihood interventions among their clientele. This section touches upon some typical SHG work at a scale of livelihood promotion undertaken by Sa-Dhan member NGOs who contributed case studies to this report. In addition a brief summary of NRLM also has been given.
6.4.1 Summary of NGO Interventions
The livelihood interventions have got some common strategy that led to successful livelihood work. Some of the practices called out from field stories of Sa-Dhan members have been tabulated below (Table-4).
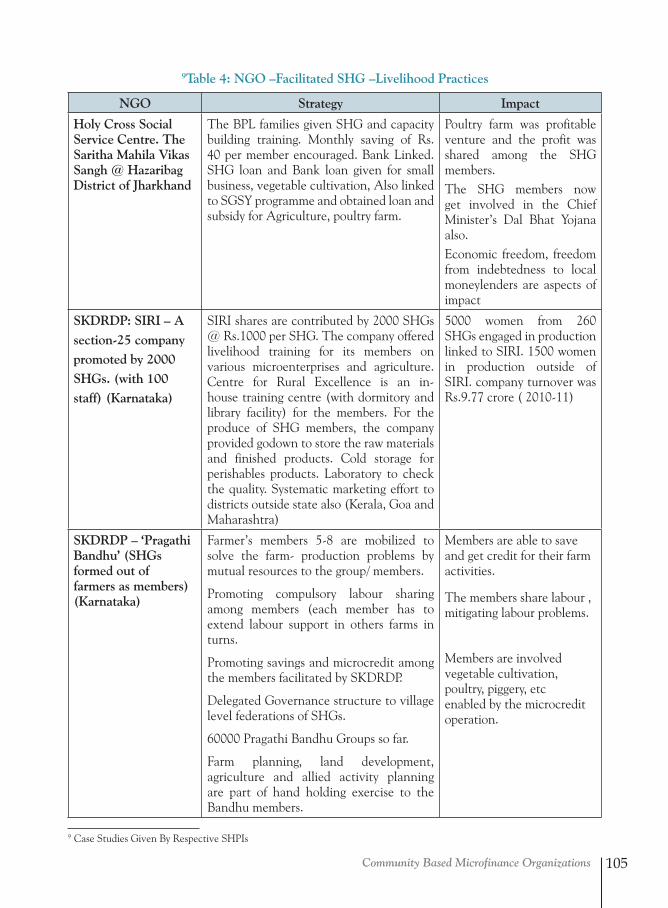
Community Based Microfinance Organizations 105
9Table 4: NGO –Facilitated SHG –Livelihood Practices
NGO Strategy Impact
Holy Cross Social Service Centre. The Saritha Mahila Vikas Sangh @ Hazaribag District of Jharkhand
The BPL families given SHG and capacity building training. Monthly saving of Rs. 40 per member encouraged. Bank Linked. SHG loan and Bank loan given for small business, vegetable cultivation, Also linked to SGSY programme and obtained loan and subsidy for Agriculture, poultry farm.
Poultry farm was profitable venture and the profit was shared among the SHG members.The SHG members now get involved in the Chief Minister’s Dal Bhat Yojana also.Economic freedom, freedom from indebtedness to local moneylenders are aspects of impact
SKDRDP: SIRI – A section-25 company promoted by 2000 SHGs. (with 100 staff) (Karnataka)
SIRI shares are contributed by 2000 SHGs @ Rs.1000 per SHG. The company offered livelihood training for its members on various microenterprises and agriculture. Centre for Rural Excellence is an in-house training centre (with dormitory and library facility) for the members. For the produce of SHG members, the company provided godown to store the raw materials and finished products. Cold storage for perishables products. Laboratory to check the quality. Systematic marketing effort to districts outside state also (Kerala, Goa and Maharashtra)
5000 women from 260 SHGs engaged in production linked to SIRI. 1500 women in production outside of SIRI. company turnover was Rs.9.77 crore ( 2010-11)
SKDRDP – ‘Pragathi Bandhu’ (SHGs formed out of farmers as members) (Karnataka)
Farmer’s members 5-8 are mobilized to solve the farm- production problems by mutual resources to the group/ members.
Promoting compulsory labour sharing among members (each member has to extend labour support in others farms in turns.
Promoting savings and microcredit among the members facilitated by SKDRDP.
Delegated Governance structure to village level federations of SHGs.
60000 Pragathi Bandhu Groups so far.
Farm planning, land development, agriculture and allied activity planning are part of hand holding exercise to the Bandhu members.
Members are able to save and get credit for their farm activities.
The members share labour , mitigating labour problems.
Members are involved vegetable cultivation, poultry, piggery, etc enabled by the microcredit operation.
9 Case Studies Given By Respective SHPIs
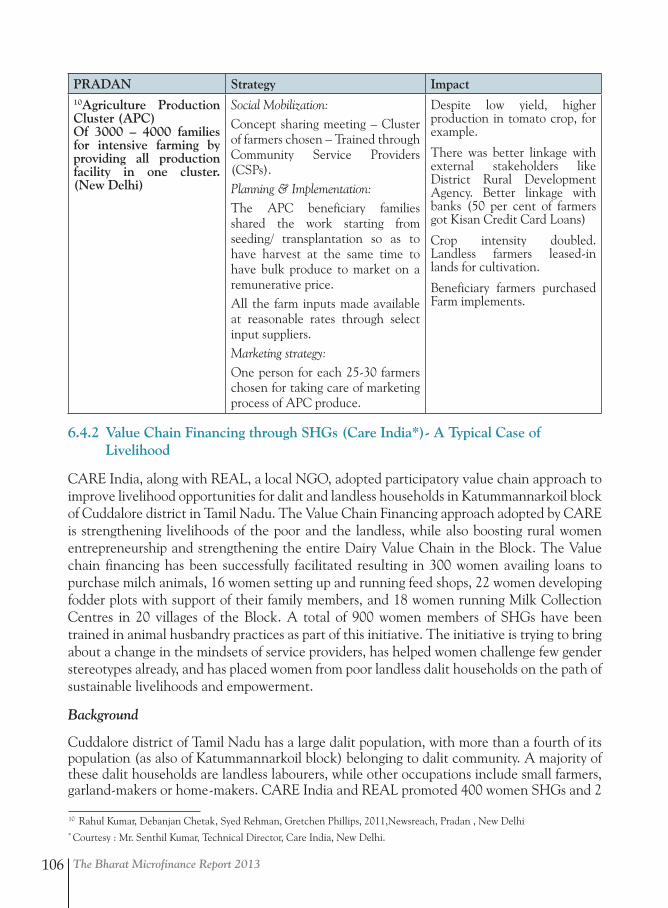
The Bharat Microfinance Report 2013106
PRADAN Strategy Impact10Agriculture Production Cluster (APC)Of 3000 – 4000 families for intensive farming by providing all production facility in one cluster. (New Delhi)
Social Mobilization:Concept sharing meeting – Cluster of farmers chosen – Trained through Community Service Providers (CSPs).Planning & Implementation:The APC beneficiary families shared the work starting from seeding/ transplantation so as to have harvest at the same time to have bulk produce to market on a remunerative price.All the farm inputs made available at reasonable rates through select input suppliers.Marketing strategy:One person for each 25-30 farmers chosen for taking care of marketing process of APC produce.
Despite low yield, higher production in tomato crop, for example.
There was better linkage with external stakeholders like District Rural Development Agency. Better linkage with banks (50 per cent of farmers got Kisan Credit Card Loans)
Crop intensity doubled. Landless farmers leased-in lands for cultivation.
Beneficiary farmers purchased Farm implements.
6.4.2 Value Chain Financing through SHGs (Care India*)- A Typical Case of Livelihood
CARE India, along with REAL, a local NGO, adopted participatory value chain approach to improve livelihood opportunities for dalit and landless households in Katummannarkoil block of Cuddalore district in Tamil Nadu. The Value Chain Financing approach adopted by CARE is strengthening livelihoods of the poor and the landless, while also boosting rural women entrepreneurship and strengthening the entire Dairy Value Chain in the Block. The Value chain financing has been successfully facilitated resulting in 300 women availing loans to purchase milch animals, 16 women setting up and running feed shops, 22 women developing fodder plots with support of their family members, and 18 women running Milk Collection Centres in 20 villages of the Block. A total of 900 women members of SHGs have been trained in animal husbandry practices as part of this initiative. The initiative is trying to bring about a change in the mindsets of service providers, has helped women challenge few gender stereotypes already, and has placed women from poor landless dalit households on the path of sustainable livelihoods and empowerment.
Background
Cuddalore district of Tamil Nadu has a large dalit population, with more than a fourth of its population (as also of Katummannarkoil block) belonging to dalit community. A majority of these dalit households are landless labourers, while other occupations include small farmers, garland-makers or home-makers. CARE India and REAL promoted 400 women SHGs and 2
10 Rahul Kumar, Debanjan Chetak, Syed Rehman, Gretchen Phillips, 2011,Newsreach, Pradan , New Delhi * Courtesy : Mr. Senthil Kumar, Technical Director, Care India, New Delhi.
Community Based Microfinance Organizations 107
block level SHG Federations11, with an overall savings of INR 1.78 crore. SHG members used the savings to lend among groups members and some also availed loans from banks. CARE India promoted and strengthened participation of women in the dairy value chain (DVC). To enhance participation of women in the DVC, the initiative prioritized the need to improve ownership and quality of milch animals among women, access to affordable and quality inputs like feed and fodder, especially as many of them were landless, access to basic health care services, and appropriate market linkages to sell milk.
A baseline study conducted by CARE India revealed that though 85% families of the block had prior experience of rearing milch animals, only 12% were actually doing so. Milk productivity was poor 4 litres/day/animal, against a potential of 7-10 litres /day/animal. The community had little knowledge about appropriate feed and fodder practices, and relied largely on traditional feeds. Their access to feed and fodder markets was also restricted. Further, awareness about and coverage of existing milch animals under any kind of insurance was negligible. The key constraints for women to participate in the dairy value chain was lack of access to affordable finance for purchasing animal and cattle fodder/feed, poor access to cattle feed and green fodder, poor price realization of milk, and lack of support services (including risk coverage). In families rearing milch animals, the female member did most of the work related to feeding, care and upkeep of the animal, while the male played a dominant role in the milk market, handling money and deciding utilisation of household earnings from milk sales.
Strategy
To increase the ownership of milch animals, CARE India identified the need to finance SHG members and supported REAL in becoming a Business Correspondent of NABFINS (an NBFC), and through this facilitated 125 SHGs in 20 villages to mobilise Rs. 4.3 crore in loans from NABFINS12. Of the total loan amount, ~Rs.40 lakh was loaned to the SHG members for purchasing milch animals. The loanees were chosen on the basis of their past experience and interest in animal rearing as an income generation activity. These loans were used to purchase mostly Jersey or Holstein Friesian (HF) cross-bred cows, though availability of high quality animals was a challenge. For ensuring the quality of animals, a small team consisting of Federation leaders, SHG members, local veterinarians, and Project Co-ordinators was formed to guide every purchase. The veterinarians also checked and authenticated every animal prior to purchase.
The loan beneficiaries were capacitated as animal rearers through intensive training and handholding, done in collaboration with local private and government veterinary institutions.13 On-field handholding included regular guidance to animal rearers and animal spot-checks by para-Vets, visioning exercises, and initiating basic business planning with the rearers. For addressing feed and fodder requirement of the newly acquired and existing milch animals, women were trained and financed to set up feed shops and fodder plots14. The feed
11 The Federations are registered as Mutual Benefit Trusts. The Federation leaders manage them with support from REAL and CARE India. Federations meet their expenses from the income from the share capital mobilized from SHG members, while the staff costs are supported by another initiative of CARE India.
12 These loans came at a diminishing balance-interest rate of 14.00 to 16.75% per annum, depending on the size of loan.13 The training was based on five modules, viz. (i) Feed and Fodder Rationing; (ii) Calf Management; (iii) Prominent, Prevalent
Diseases and their Management; (iv) Pure Milk Production; and (v) Increasing Fertility and Insemination Methods.14 Entrepreneurs were carefully chosen depending on their ability to develop such a facility or allocate land for fodder
cultivation.
The Bharat Microfinance Report 2013108
shops were stocked to sell wheat flour, tapioca powder, mixed and balanced ration available as concentrates in the form of pellets and powder, groundnut cake, maize powder, cotton-seed and hammer-milled pulses.
Veterinary services were ensured to cattle rearers by developing para-vets locally. To develop para-vets, youth in the locality were identified and provided an intensive 50-hour-credit training15. The course included both classroom sessions and practical demonstration exercises, and covered the skill and knowledge aspects required for functioning as para-vet. Once the para-vets started practice, they were provided ongoing communication and mentoring support by an animal science professor from the local University. Further, an arrangement has been made for a local veterinarian to follow up with the para- vets regularly and provide guidance. The Federation members and entrepreneurs discuss the quality of para-vet services during their periodic meetings as well as in the meetings of SHGs. In this manner, the quality of para-vet services are monitored and ensured.
Given the socioeconomic situation and vulnerability of beneficiary households, the initiative included a component on spreading awareness about cattle insurance among the beneficiaries and also ensuring their linkage to a low-cost, subsidised animal insurance product from the New India Assurance.16 The annual premium of selected Cattle Insurance Policy is 2.5% of the cost of animal (4% without subsidy). In most cases, the animals were insured with subsidy.
To develop local market for milk and milk products, the initiative supported the SHG Federation to set up Milk Collection Centers and individual members to set up Milk Sale Points for retail sales. SHG meetings, participatory exercises and village-level meetings were used to spread awareness among milch animal rearers regarding the Milk Collection Centers and retail milk procurement by individual entrepreneurs. During these meetings, rearers were motivated to supply milk to the SHG member-entrepreneurs or to the Federation’s Milk Collection Centers.
Impact
The Dairy Value Chain in Katummannarkoil Block now has been strengthened with >300 poor women as milk producers, selling through 18 Milk Collection Centers and 13 Milk Sale Points, accessing feed and fodder from 16 Feed Shops, 22 Fodder Plots, and 32 Azolla plots, all located at an accessible distance and run by fellow women entrepreneurs. Animal rearers are also accessing fee-based veterinary services from three freelancing para-vets. Based on the business plans developed, Aavin, i.e., the Tamil Nadu Milk Producers’ Federation Ltd. was successfully convinced to support development of some Milk Collection Centers and link with them. Looking at the response of Aavin, Arokya (a private sector milk brand owned by Hatsun Agro Product Ltd.) also approached the project team exploring linkages and some other Milk Collection Centers were initiated and linked to it after supply and route exploration. Aavin and Arokya have trained the personnel in the Milk Collection Centers to measure milk quality and maintain records. Arokya has even started supplying quality feed for sale to milk producers, through a Milk Collection Center.
15 The training was supported by CARE India and delivered by a Veterinary Professor from a Regional Agriculture University.16 Indemnity is limited to 75% of sum insured, covers death of the animal due to (a) Accident (Inclusive of fire, lightning, flood,
inundation, storm, hurricane, earthquake, cyclone, tornado, tempest and famine); (b) Diseases contracted or occurring during the period of the policy; (c) Surgical Operations; and (d) Riot and Strike. The Policy can also be extended to cover Permanent Total Disability on payment of extra premium.
Community Based Microfinance Organizations 109
As a result of these institutional linkages of Milk Collection Centers, local milk vendors operating in the villages of Katummannarkoil have been forced to compete for the available milk supply and raise the price offered by them to milk producers from Rs. 15 to Rs. 19 a litre, in a matter of just 6 months.
6.4.3 Aajeevika National Rural Livelihoods Mission
The Ministry of Rural Development, Government of India has launched National Rural Livelihood Mission (NRLM) by restructuring Swarnajayanti Gram Swarozgar Yojana (SGSY), effective from April 2013. The world bank- sponsored mission will provide a continuous hand-holding support to the institutions of the poor for a period of 5-7 years till they come out of abject poverty. NRLM enables the state rural livelihoods missions to professionalize their human resources at state, district and block level. So far, the ministry has approved Annual Action Plan of 14 States who met the NRLM criteria and funds have been sanctioned to them. These states are Andhra Pradesh, Assam, Bihar, Chhattisgarh, Gujarat, Jharkhand, Kerala, Madhya Pradesh, Maharashtra, Mizoram, Odisha, Punjab, Rajasthan and Tamil Nadu.
The Mission will spearhead the financial inclusion through SHGs, replicating the combined desirable features of IKP, Mahalir Thittam, Kudumbashree, etc., across the country. The bank linkage is the main component under NRLM.
NRLM is a Centrally Sponsored Scheme and the financing of the programme would be shared between the Centre and the States in the ratio of 75:25.
Building up social capital takes some time in the initial years. Social capital of the poor consists of the institutions of the poor, their leaders, community professionals and more importantly community resource persons.
The blocks that are taken up for implementation of NRLM, ‘intensive blocks’ would have access to a full complement of trained professional staff and cover a whole range of activities of universal and intense social and financial inclusion, livelihoods, partnerships etc.
Key Statistics under NRLM as of March 2013
No. of Districts Covered 443
No. of Blocks Covered 4333
Intensive Districts 118
Intensive Blocks 444
No. of States Covered 19
Source: www. Aajevika.in
Key Takeaways in Livelihood promotion
Mobilizing the women/ poor, identifying their needs , skills sets, local socio economic condition, training them for taking up livelihood activities , facilitating linkages are part of strategies of livelihood promotion.
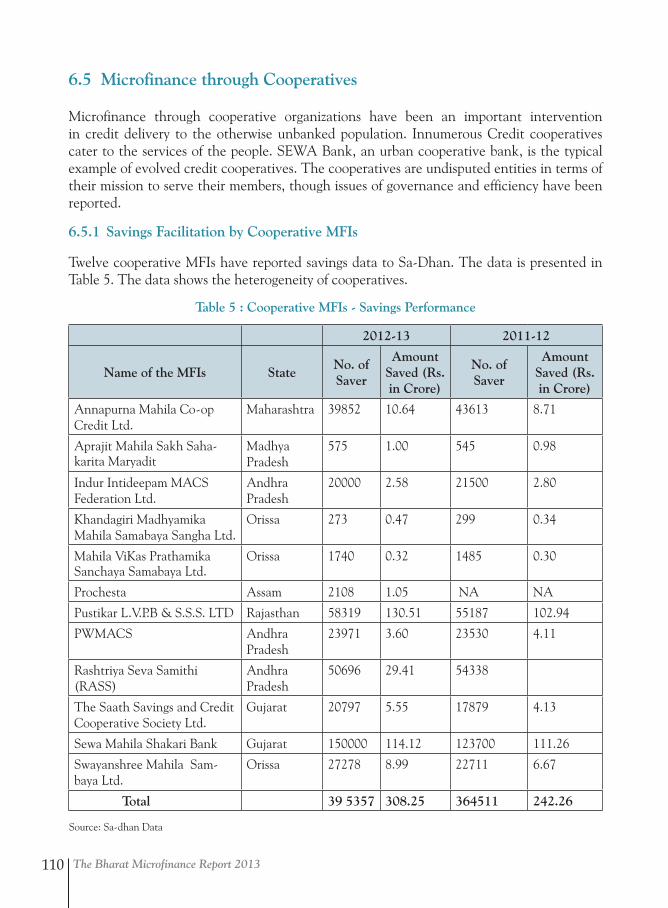
The Bharat Microfinance Report 2013110
6.5 Microfinance through Cooperatives
Microfinance through cooperative organizations have been an important intervention in credit delivery to the otherwise unbanked population. Innumerous Credit cooperatives cater to the services of the people. SEWA Bank, an urban cooperative bank, is the typical example of evolved credit cooperatives. The cooperatives are undisputed entities in terms of their mission to serve their members, though issues of governance and efficiency have been reported.
6.5.1 Savings Facilitation by Cooperative MFIs
Twelve cooperative MFIs have reported savings data to Sa-Dhan. The data is presented in Table 5. The data shows the heterogeneity of cooperatives.
Table 5 : Cooperative MFIs - Savings Performance
2012-13 2011-12
Name of the MFIs StateNo. of Saver
Amount Saved (Rs. in Crore)
No. of Saver
Amount Saved (Rs. in Crore)
Annapurna Mahila Co-op Credit Ltd.
Maharashtra 39852 10.64 43613 8.71
Aprajit Mahila Sakh Saha-karita Maryadit
Madhya Pradesh
575 1.00 545 0.98
Indur Intideepam MACS Federation Ltd.
Andhra Pradesh
20000 2.58 21500 2.80
Khandagiri Madhyamika Mahila Samabaya Sangha Ltd.
Orissa 273 0.47 299 0.34
Mahila ViKas Prathamika Sanchaya Samabaya Ltd.
Orissa 1740 0.32 1485 0.30
Prochesta Assam 2108 1.05 NA NA
Pustikar L.V.P.B & S.S.S. LTD Rajasthan 58319 130.51 55187 102.94
PWMACS Andhra Pradesh
23971 3.60 23530 4.11
Rashtriya Seva Samithi (RASS)
Andhra Pradesh
50696 29.41 54338
The Saath Savings and Credit Cooperative Society Ltd.
Gujarat 20797 5.55 17879 4.13
Sewa Mahila Shakari Bank Gujarat 150000 114.12 123700 111.26
Swayanshree Mahila Sam-baya Ltd.
Orissa 27278 8.99 22711 6.67
Total 39 5357 308.25 364511 242.26
Source: Sa-dhan Data
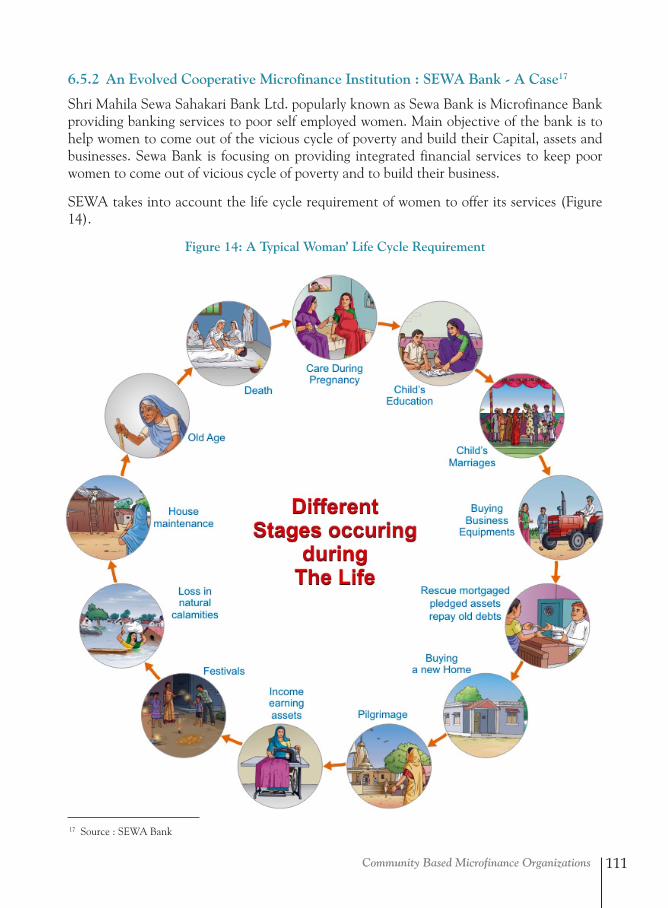
Community Based Microfinance Organizations 111
6.5.2 An Evolved Cooperative Microfinance Institution : SEWA Bank - A Case17
Shri Mahila Sewa Sahakari Bank Ltd. popularly known as Sewa Bank is Microfinance Bank providing banking services to poor self employed women. Main objective of the bank is to help women to come out of the vicious cycle of poverty and build their Capital, assets and businesses. Sewa Bank is focusing on providing integrated financial services to keep poor women to come out of vicious cycle of poverty and to build their business.
SEWA takes into account the life cycle requirement of women to offer its services (Figure 14).
Figure 14: A Typical Woman’ Life Cycle Requirement
17 Source : SEWA Bank
The Bharat Microfinance Report 2013112
6.5.2.1 Savings
Through constant training, Sewa Bank inculcates the habit of saving to its member. Sewa Bank lays great emphasis on savings, more so when its clients are all self employed women with low income. Also, from an institutional view point, building a credit loan fund from members very own savings is cost effective. A wide range of different saving schemes are available for members:
Ghar Fund Yojana (Housing Fund Scheme)
To enable the member to have a house of their own and in particular in their own name was started Ghar Fund Yojana (House Fund Scheme) in 1999 with contributions of Rs. 250, Rs. 500 and Rs. 750. Deposits are made on monthly basis for a period of 5 years or more. With the amount returned after 5 years with interest, woman can build their own houses. If the bank finds it appropriate, members will get the same amount as a loan under bank’s terms and conditions. This scheme motivate woman to build their own houses or renovate their houses from the amount.
Chinta Nivaran Yojana (Worry Riddance Scheme)
To meet small difficulties and overcome worries Chinta Nivaran Yojana (Worry Riddance Scheme) was started in 1999, that year Sewa Bank celebrated its silver jubilee with contributions ranging from Rs.40, Rs. 80 and Rs. 120. Under this scheme, deposits are made every month up to Five Years.
In any emergency like Natural Calamities Cyclone, Earthquake, Flood, Famine, Accidental death of family member, illness or any kind of emergency, after one year of joining in the scheme they can get an overdraft loan.
Mangal Prasang Yojana (Special Occasion Scheme)
This scheme was launched in 1999. This too was for 5 years with contributions being for Rs. 200, Rs. 400 and Rs. 600. This was primarily aimed to help members during wedding of their sons and daughters. The main object is that members start to think for their tomorrow. Also they avoid unnecessary loans and understand Importance of Saving.
Kishori Gold Yojana
This scheme was started in 2004 which encourage member to save money for special occasion is Kishori Gold Yojana (Buying Gold Scheme). This was aimed at meeting expenses towards buying gold and gold ornaments during the wedding of their progeny. Gold ornaments are assets and a saving. Gold can help in both occasion daughters’ wedding or son’s wedding. At the time of marriage one does not have to borrow for the purpose of buying gold. Small savings made gradually or accumulated gold can be used for future occasions. This scheme is where gold can be of help for both the daughter as also the son’s wedding.
Community Based Microfinance Organizations 113
6.5.2.2 Loan
Members need loans for a wide variety of purpose: to buy assets, raw materials, finished goods for resale, old debts, renovation of their homes, buy transportation means such as Pedal cart, handcart or put in infrastructure in their homes such as water or electric connections.
Sewa Bank has been providing a wide range of loan products to meet the productive credit needs of its clients. The bank requires that woman save regularly for at least one year before she is eligible to apply for a loan. In the absence of traditional collateral, a regular savings record has been a necessary from of security in Sewa Bank’s experience of banking with the poor for well over 38 years.
More than 30000 members got the facility of loan in the f.y. 2012-13.
Housing Loans
Financial Institutions have been reluctant to give women housing loans for women are still perceived as mere housewives who are high credit risks. Housing loans are not seen as productive loans which will lead to an increase in income.
Housing however is a productive asset for millions of women who are poor and work out of their homes and this access to housing finance at long term, affordable rates is a prime necessity. Moreover, among the poor those with assets are less vulnerable to the vagaries of life than those with out assets.
More than 3000 members privileged the services of Housing Loan.
House Repairing Loans (Paki Bhit Loan)
Sewa Bank has found that as the economic security of SEWA member’s increases, the demand for housing loans and housing related services also increases. Most importantly, and as a rule, loans for a new house require that the house be bought in the name of the women borrower, thereby creating an asset for the women.
Sewa Bank has given loans for housing purposed to thousands of women. These include loans to repair or replace a roof, wall, floor or door, for monsoon proofing, adding a room or kitchen, upgrading as well as loans that could be used as deposits for rent and to buy or build a new house. Loans were also taken for infrastructural facilities such as water or electricity connections, building toilets and paved approach roads to the house.
Secured (Gold) Loans
In india, majority of women own some jewellery and gold is seen as an investment- a form of insurance against bad times. Even the poorest of women own some jewellery, usually given to her at the time of her marriage. Sewa Bank has designed a secured loan product based on jewellery as collateral. This prevents them from going to money lenders who give bad rates and often reclaim the jewellery (selling it to a third party) before the loan due date. Up to 80 per cent of the value of the jewellery is retained with Sewa Bank until loan is fully paid.
The Bharat Microfinance Report 2013114
6.5.2.3 Pension
The bank came up with a Pension Scheme to meet the needs of the women of unorganized sector and provide them with old age security.
• Designed own Pension Saving Product in the year 1995.
• Linked with Pension Product of UTI in the year 2006.
• Linked with National Pension Scheme (NPS) from February, 2012.
80000 members already joined the Micro Pension Scheme.
6.5.2.4 Banksathis – SEWA’s Unique Banking Facilitator
Banksathis are the Bank’s front line worker. They come from the same communities as the customers and live alongside them in the same neighborhoods. They typically also pursue the same trades as the women while working in conjunction with the Bank. A banksathi is usually someone who has experience at maintaining a bank account; is a local leader with good credibility; is strong, energetic, and alert; is active within SEWA; and can preferably read and write. Banksathis have fixed deposits of 15,000 rupees in SEWA Bank – the amount that is taken as a “security deposit,” a safeguard against any misappropriation. (Recently, the Reserve Bank of India has suggested raising the amount.) She may borrow from the bank and deposit the amount in her fixed – deposit account. A capable banksathi can serve around 400 borrowers of the bank. A bank staff in-charge monitors the banksathi.
The loan procedure is relatively simple. The banksathi first assesses the applicant. Before coming to a decision, she takes notes on several points: irregularity of income, unpaid debt installments, number of dependents in the family, number of children working at home, regularity in savings, absence of a steel these factors does not disqualify a candidate – such mitigating circumstances are, after all, a part of the women’s lives. The banksathi’s role is to note potential areas of trouble, but also to note areas where supplementary help can be provided to the women – access to crèche, to legal services, or to medical attention. Assessing the creditworthiness of a woman whose husband drinks or who is a window without family support, for example, requires taking into consideration a lot of other factors and making certain allowances.
A bank facilitator then follows up on the banksathi’s recommendation and probes deeper into an applicant’s business activities. She notes the level of competition in the business, the family’s finances and their productive assets, the woman’s entrepreneurial skills, and her overall participation in the Bank’s savings programs.
The facilitator then asks the banksathi to explain the loan application process, the repayment rules, and the implications of overdue payments to the potential member. Only after there is no doubt that the woman has thoroughly understood the process wills the banksathi sign the form recommending the woman. The application is then presented to the Loan Committee, which meets every third day and makes its sanctions. If approved, the loan is disbursed through the main office of the Bank within a week to ten days. The banksathi then
Community Based Microfinance Organizations 115
informs the woman whether her loan has been accepted or rejected. The banksathi earns approximately 1 percent on savings and 3 percent of loans over the total business she has transacted.
6.5.3. Cooperative MFIs – Salient Features
Some select cooperative MFIs have reported case studies for this report. The case studies have been analyzed and their salient features are furnished in Appendix 9 as additional information for the readers.
Key Takeaways in Cooperative MFIs
Co-operatives MFIs have objectives of providing microfinance at affordable rates. Their boards have fair representation from members. Most of them are following strategy of utilizing internal savings. Some cooperatives use external borrowing to meet the credit needs. Most of them are offering savings, loans, micro-insurance, capacity building services. Cooperative bank form offers multiple other services as well. Most of them have been able to inculcate savings habits and offer credit support to their members.
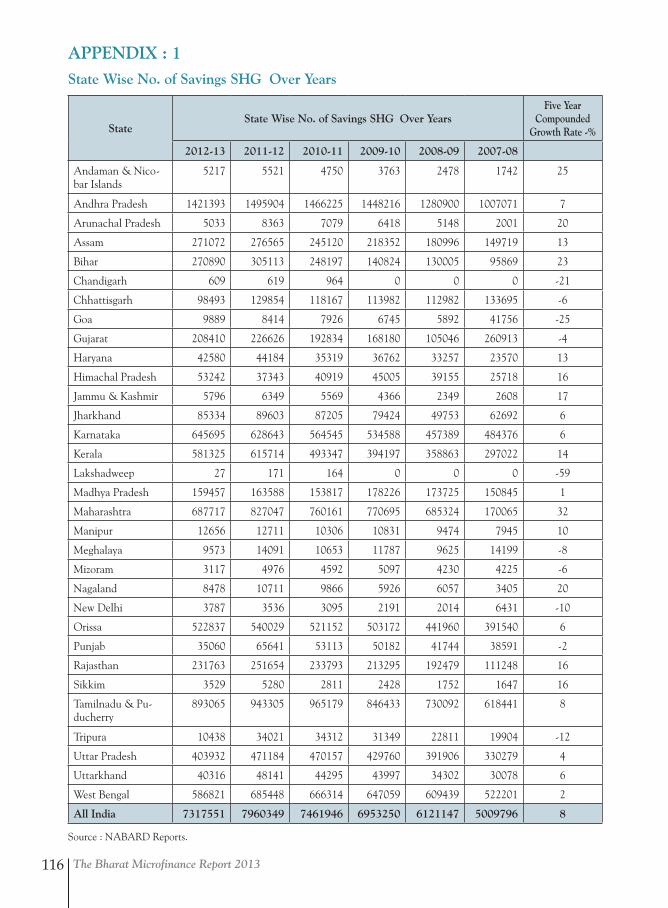
The Bharat Microfinance Report 2013116
StateState Wise No. of Savings SHG Over Years
Five Year Compounded
Growth Rate -%
2012-13 2011-12 2010-11 2009-10 2008-09 2007-08
Andaman & Nico-bar Islands
5217 5521 4750 3763 2478 1742 25
Andhra Pradesh 1421393 1495904 1466225 1448216 1280900 1007071 7
Arunachal Pradesh 5033 8363 7079 6418 5148 2001 20
Assam 271072 276565 245120 218352 180996 149719 13
Bihar 270890 305113 248197 140824 130005 95869 23
Chandigarh 609 619 964 0 0 0 -21
Chhattisgarh 98493 129854 118167 113982 112982 133695 -6
Goa 9889 8414 7926 6745 5892 41756 -25
Gujarat 208410 226626 192834 168180 105046 260913 -4
Haryana 42580 44184 35319 36762 33257 23570 13
Himachal Pradesh 53242 37343 40919 45005 39155 25718 16
Jammu & Kashmir 5796 6349 5569 4366 2349 2608 17
Jharkhand 85334 89603 87205 79424 49753 62692 6
Karnataka 645695 628643 564545 534588 457389 484376 6
Kerala 581325 615714 493347 394197 358863 297022 14
Lakshadweep 27 171 164 0 0 0 -59
Madhya Pradesh 159457 163588 153817 178226 173725 150845 1
Maharashtra 687717 827047 760161 770695 685324 170065 32
Manipur 12656 12711 10306 10831 9474 7945 10
Meghalaya 9573 14091 10653 11787 9625 14199 -8
Mizoram 3117 4976 4592 5097 4230 4225 -6
Nagaland 8478 10711 9866 5926 6057 3405 20
New Delhi 3787 3536 3095 2191 2014 6431 -10
Orissa 522837 540029 521152 503172 441960 391540 6
Punjab 35060 65641 53113 50182 41744 38591 -2
Rajasthan 231763 251654 233793 213295 192479 111248 16
Sikkim 3529 5280 2811 2428 1752 1647 16
Tamilnadu & Pu-ducherry
893065 943305 965179 846433 730092 618441 8
Tripura 10438 34021 34312 31349 22811 19904 -12
Uttar Pradesh 403932 471184 470157 429760 391906 330279 4
Uttarkhand 40316 48141 44295 43997 34302 30078 6
West Bengal 586821 685448 666314 647059 609439 522201 2
All India 7317551 7960349 7461946 6953250 6121147 5009796 8
APPENDIX : 1State Wise No. of Savings SHG Over Years
Source : NABARD Reports.
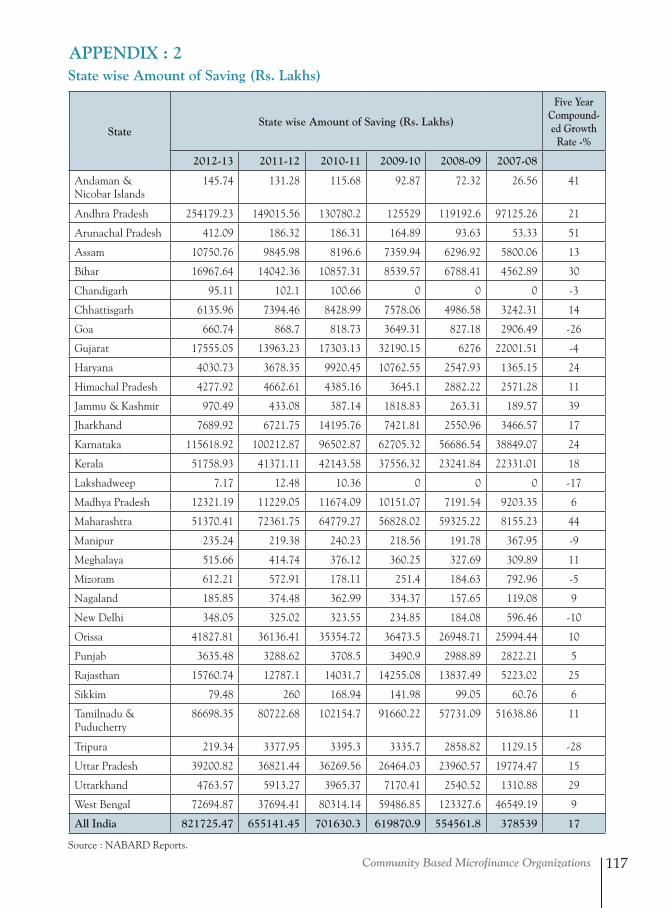
Community Based Microfinance Organizations 117
StateState wise Amount of Saving (Rs. Lakhs)
Five Year Compound-ed Growth
Rate -%
2012-13 2011-12 2010-11 2009-10 2008-09 2007-08
Andaman & Nicobar Islands
145.74 131.28 115.68 92.87 72.32 26.56 41
Andhra Pradesh 254179.23 149015.56 130780.2 125529 119192.6 97125.26 21
Arunachal Pradesh 412.09 186.32 186.31 164.89 93.63 53.33 51
Assam 10750.76 9845.98 8196.6 7359.94 6296.92 5800.06 13
Bihar 16967.64 14042.36 10857.31 8539.57 6788.41 4562.89 30
Chandigarh 95.11 102.1 100.66 0 0 0 -3
Chhattisgarh 6135.96 7394.46 8428.99 7578.06 4986.58 3242.31 14
Goa 660.74 868.7 818.73 3649.31 827.18 2906.49 -26
Gujarat 17555.05 13963.23 17303.13 32190.15 6276 22001.51 -4
Haryana 4030.73 3678.35 9920.45 10762.55 2547.93 1365.15 24
Himachal Pradesh 4277.92 4662.61 4385.16 3645.1 2882.22 2571.28 11
Jammu & Kashmir 970.49 433.08 387.14 1818.83 263.31 189.57 39
Jharkhand 7689.92 6721.75 14195.76 7421.81 2550.96 3466.57 17
Karnataka 115618.92 100212.87 96502.87 62705.32 56686.54 38849.07 24
Kerala 51758.93 41371.11 42143.58 37556.32 23241.84 22331.01 18
Lakshadweep 7.17 12.48 10.36 0 0 0 -17
Madhya Pradesh 12321.19 11229.05 11674.09 10151.07 7191.54 9203.35 6
Maharashtra 51370.41 72361.75 64779.27 56828.02 59325.22 8155.23 44
Manipur 235.24 219.38 240.23 218.56 191.78 367.95 -9
Meghalaya 515.66 414.74 376.12 360.25 327.69 309.89 11
Mizoram 612.21 572.91 178.11 251.4 184.63 792.96 -5
Nagaland 185.85 374.48 362.99 334.37 157.65 119.08 9
New Delhi 348.05 325.02 323.55 234.85 184.08 596.46 -10
Orissa 41827.81 36136.41 35354.72 36473.5 26948.71 25994.44 10
Punjab 3635.48 3288.62 3708.5 3490.9 2988.89 2822.21 5
Rajasthan 15760.74 12787.1 14031.7 14255.08 13837.49 5223.02 25
Sikkim 79.48 260 168.94 141.98 99.05 60.76 6
Tamilnadu & Puducherry
86698.35 80722.68 102154.7 91660.22 57731.09 51638.86 11
Tripura 219.34 3377.95 3395.3 3335.7 2858.82 1129.15 -28
Uttar Pradesh 39200.82 36821.44 36269.56 26464.03 23960.57 19774.47 15
Uttarkhand 4763.57 5913.27 3965.37 7170.41 2540.52 1310.88 29
West Bengal 72694.87 37694.41 80314.14 59486.85 123327.6 46549.19 9
All India 821725.47 655141.45 701630.3 619870.9 554561.8 378539 17
APPENDIX : 2
Source : NABARD Reports.
State wise Amount of Saving (Rs. Lakhs)
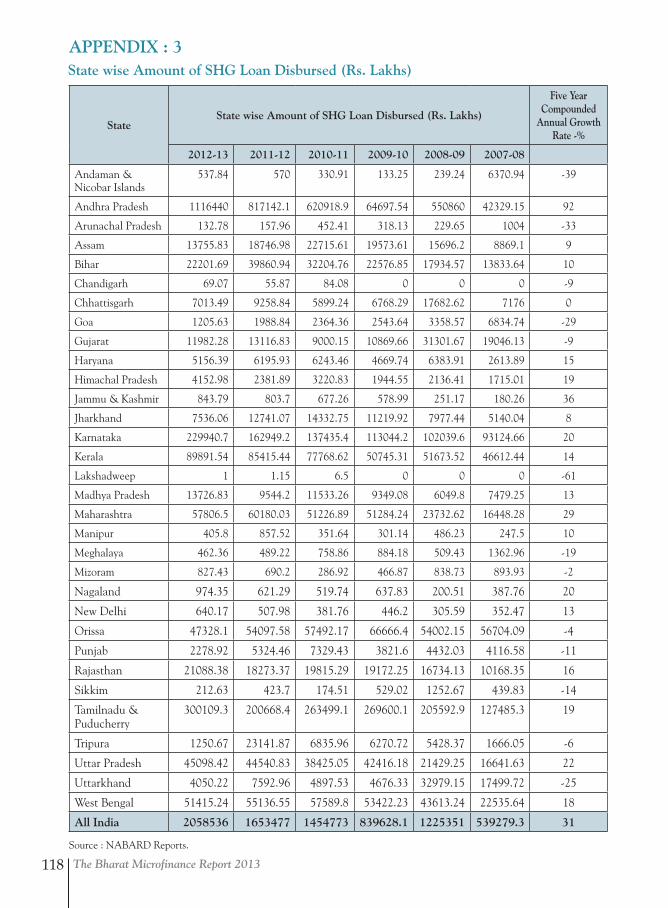
The Bharat Microfinance Report 2013118
StateState wise Amount of SHG Loan Disbursed (Rs. Lakhs)
Five Year Compounded
Annual Growth Rate -%
2012-13 2011-12 2010-11 2009-10 2008-09 2007-08
Andaman & Nicobar Islands
537.84 570 330.91 133.25 239.24 6370.94 -39
Andhra Pradesh 1116440 817142.1 620918.9 64697.54 550860 42329.15 92
Arunachal Pradesh 132.78 157.96 452.41 318.13 229.65 1004 -33
Assam 13755.83 18746.98 22715.61 19573.61 15696.2 8869.1 9
Bihar 22201.69 39860.94 32204.76 22576.85 17934.57 13833.64 10
Chandigarh 69.07 55.87 84.08 0 0 0 -9
Chhattisgarh 7013.49 9258.84 5899.24 6768.29 17682.62 7176 0
Goa 1205.63 1988.84 2364.36 2543.64 3358.57 6834.74 -29
Gujarat 11982.28 13116.83 9000.15 10869.66 31301.67 19046.13 -9
Haryana 5156.39 6195.93 6243.46 4669.74 6383.91 2613.89 15
Himachal Pradesh 4152.98 2381.89 3220.83 1944.55 2136.41 1715.01 19
Jammu & Kashmir 843.79 803.7 677.26 578.99 251.17 180.26 36
Jharkhand 7536.06 12741.07 14332.75 11219.92 7977.44 5140.04 8
Karnataka 229940.7 162949.2 137435.4 113044.2 102039.6 93124.66 20
Kerala 89891.54 85415.44 77768.62 50745.31 51673.52 46612.44 14
Lakshadweep 1 1.15 6.5 0 0 0 -61
Madhya Pradesh 13726.83 9544.2 11533.26 9349.08 6049.8 7479.25 13
Maharashtra 57806.5 60180.03 51226.89 51284.24 23732.62 16448.28 29
Manipur 405.8 857.52 351.64 301.14 486.23 247.5 10
Meghalaya 462.36 489.22 758.86 884.18 509.43 1362.96 -19
Mizoram 827.43 690.2 286.92 466.87 838.73 893.93 -2
Nagaland 974.35 621.29 519.74 637.83 200.51 387.76 20
New Delhi 640.17 507.98 381.76 446.2 305.59 352.47 13
Orissa 47328.1 54097.58 57492.17 66666.4 54002.15 56704.09 -4
Punjab 2278.92 5324.46 7329.43 3821.6 4432.03 4116.58 -11
Rajasthan 21088.38 18273.37 19815.29 19172.25 16734.13 10168.35 16
Sikkim 212.63 423.7 174.51 529.02 1252.67 439.83 -14
Tamilnadu & Puducherry
300109.3 200668.4 263499.1 269600.1 205592.9 127485.3 19
Tripura 1250.67 23141.87 6835.96 6270.72 5428.37 1666.05 -6
Uttar Pradesh 45098.42 44540.83 38425.05 42416.18 21429.25 16641.63 22
Uttarkhand 4050.22 7592.96 4897.53 4676.33 32979.15 17499.72 -25
West Bengal 51415.24 55136.55 57589.8 53422.23 43613.24 22535.64 18
All India 2058536 1653477 1454773 839628.1 1225351 539279.3 31
APPENDIX : 3
Source : NABARD Reports.
State wise Amount of SHG Loan Disbursed (Rs. Lakhs)
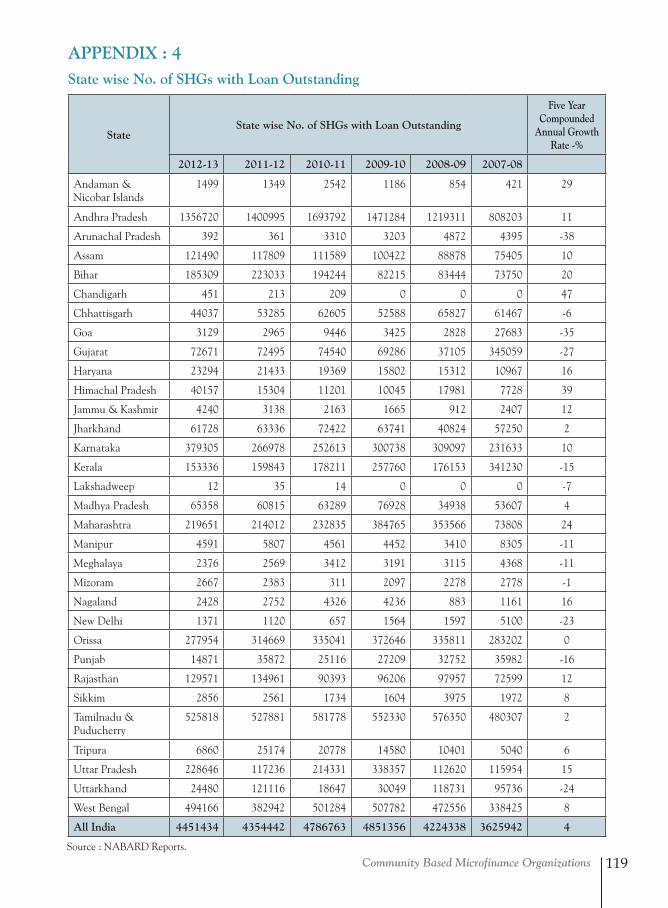
Community Based Microfinance Organizations 119
StateState wise No. of SHGs with Loan Outstanding
Five Year Compounded
Annual Growth Rate -%
2012-13 2011-12 2010-11 2009-10 2008-09 2007-08
Andaman & Nicobar Islands
1499 1349 2542 1186 854 421 29
Andhra Pradesh 1356720 1400995 1693792 1471284 1219311 808203 11
Arunachal Pradesh 392 361 3310 3203 4872 4395 -38
Assam 121490 117809 111589 100422 88878 75405 10
Bihar 185309 223033 194244 82215 83444 73750 20
Chandigarh 451 213 209 0 0 0 47
Chhattisgarh 44037 53285 62605 52588 65827 61467 -6
Goa 3129 2965 9446 3425 2828 27683 -35
Gujarat 72671 72495 74540 69286 37105 345059 -27
Haryana 23294 21433 19369 15802 15312 10967 16
Himachal Pradesh 40157 15304 11201 10045 17981 7728 39
Jammu & Kashmir 4240 3138 2163 1665 912 2407 12
Jharkhand 61728 63336 72422 63741 40824 57250 2
Karnataka 379305 266978 252613 300738 309097 231633 10
Kerala 153336 159843 178211 257760 176153 341230 -15
Lakshadweep 12 35 14 0 0 0 -7
Madhya Pradesh 65358 60815 63289 76928 34938 53607 4
Maharashtra 219651 214012 232835 384765 353566 73808 24
Manipur 4591 5807 4561 4452 3410 8305 -11
Meghalaya 2376 2569 3412 3191 3115 4368 -11
Mizoram 2667 2383 311 2097 2278 2778 -1
Nagaland 2428 2752 4326 4236 883 1161 16
New Delhi 1371 1120 657 1564 1597 5100 -23
Orissa 277954 314669 335041 372646 335811 283202 0
Punjab 14871 35872 25116 27209 32752 35982 -16
Rajasthan 129571 134961 90393 96206 97957 72599 12
Sikkim 2856 2561 1734 1604 3975 1972 8
Tamilnadu & Puducherry
525818 527881 581778 552330 576350 480307 2
Tripura 6860 25174 20778 14580 10401 5040 6
Uttar Pradesh 228646 117236 214331 338357 112620 115954 15
Uttarkhand 24480 121116 18647 30049 118731 95736 -24
West Bengal 494166 382942 501284 507782 472556 338425 8
All India 4451434 4354442 4786763 4851356 4224338 3625942 4
APPENDIX : 4
Source : NABARD Reports.
State wise No. of SHGs with Loan Outstanding
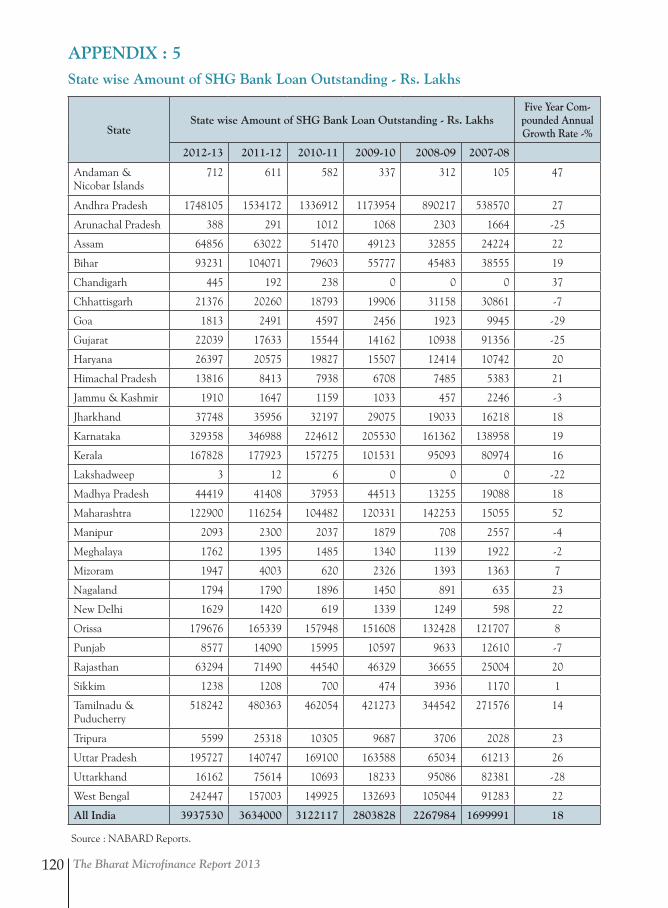
The Bharat Microfinance Report 2013120
StateState wise Amount of SHG Bank Loan Outstanding - Rs. Lakhs
Five Year Com-pounded Annual Growth Rate -%
2012-13 2011-12 2010-11 2009-10 2008-09 2007-08
Andaman & Nicobar Islands
712 611 582 337 312 105 47
Andhra Pradesh 1748105 1534172 1336912 1173954 890217 538570 27
Arunachal Pradesh 388 291 1012 1068 2303 1664 -25
Assam 64856 63022 51470 49123 32855 24224 22
Bihar 93231 104071 79603 55777 45483 38555 19
Chandigarh 445 192 238 0 0 0 37
Chhattisgarh 21376 20260 18793 19906 31158 30861 -7
Goa 1813 2491 4597 2456 1923 9945 -29
Gujarat 22039 17633 15544 14162 10938 91356 -25
Haryana 26397 20575 19827 15507 12414 10742 20
Himachal Pradesh 13816 8413 7938 6708 7485 5383 21
Jammu & Kashmir 1910 1647 1159 1033 457 2246 -3
Jharkhand 37748 35956 32197 29075 19033 16218 18
Karnataka 329358 346988 224612 205530 161362 138958 19
Kerala 167828 177923 157275 101531 95093 80974 16
Lakshadweep 3 12 6 0 0 0 -22
Madhya Pradesh 44419 41408 37953 44513 13255 19088 18
Maharashtra 122900 116254 104482 120331 142253 15055 52
Manipur 2093 2300 2037 1879 708 2557 -4
Meghalaya 1762 1395 1485 1340 1139 1922 -2
Mizoram 1947 4003 620 2326 1393 1363 7
Nagaland 1794 1790 1896 1450 891 635 23
New Delhi 1629 1420 619 1339 1249 598 22
Orissa 179676 165339 157948 151608 132428 121707 8
Punjab 8577 14090 15995 10597 9633 12610 -7
Rajasthan 63294 71490 44540 46329 36655 25004 20
Sikkim 1238 1208 700 474 3936 1170 1
Tamilnadu & Puducherry
518242 480363 462054 421273 344542 271576 14
Tripura 5599 25318 10305 9687 3706 2028 23
Uttar Pradesh 195727 140747 169100 163588 65034 61213 26
Uttarkhand 16162 75614 10693 18233 95086 82381 -28
West Bengal 242447 157003 149925 132693 105044 91283 22
All India 3937530 3634000 3122117 2803828 2267984 1699991 18
APPENDIX : 5
Source : NABARD Reports.
State wise Amount of SHG Bank Loan Outstanding - Rs. Lakhs
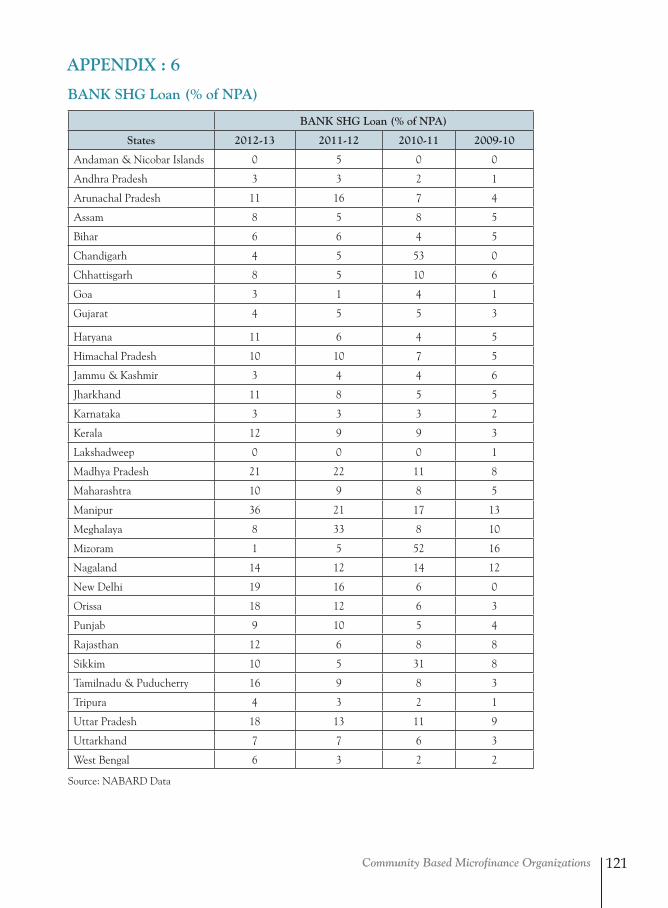
Community Based Microfinance Organizations 121
BANK SHG Loan (% of NPA)
States 2012-13 2011-12 2010-11 2009-10
Andaman & Nicobar Islands 0 5 0 0
Andhra Pradesh 3 3 2 1
Arunachal Pradesh 11 16 7 4
Assam 8 5 8 5
Bihar 6 6 4 5
Chandigarh 4 5 53 0
Chhattisgarh 8 5 10 6
Goa 3 1 4 1
Gujarat 4 5 5 3
Haryana 11 6 4 5
Himachal Pradesh 10 10 7 5
Jammu & Kashmir 3 4 4 6
Jharkhand 11 8 5 5
Karnataka 3 3 3 2
Kerala 12 9 9 3
Lakshadweep 0 0 0 1
Madhya Pradesh 21 22 11 8
Maharashtra 10 9 8 5
Manipur 36 21 17 13
Meghalaya 8 33 8 10
Mizoram 1 5 52 16
Nagaland 14 12 14 12
New Delhi 19 16 6 0
Orissa 18 12 6 3
Punjab 9 10 5 4
Rajasthan 12 6 8 8
Sikkim 10 5 31 8
Tamilnadu & Puducherry 16 9 8 3
Tripura 4 3 2 1
Uttar Pradesh 18 13 11 9
Uttarkhand 7 7 6 3
West Bengal 6 3 2 2
APPENDIX : 6
BANK SHG Loan (% of NPA)
Source: NABARD Data
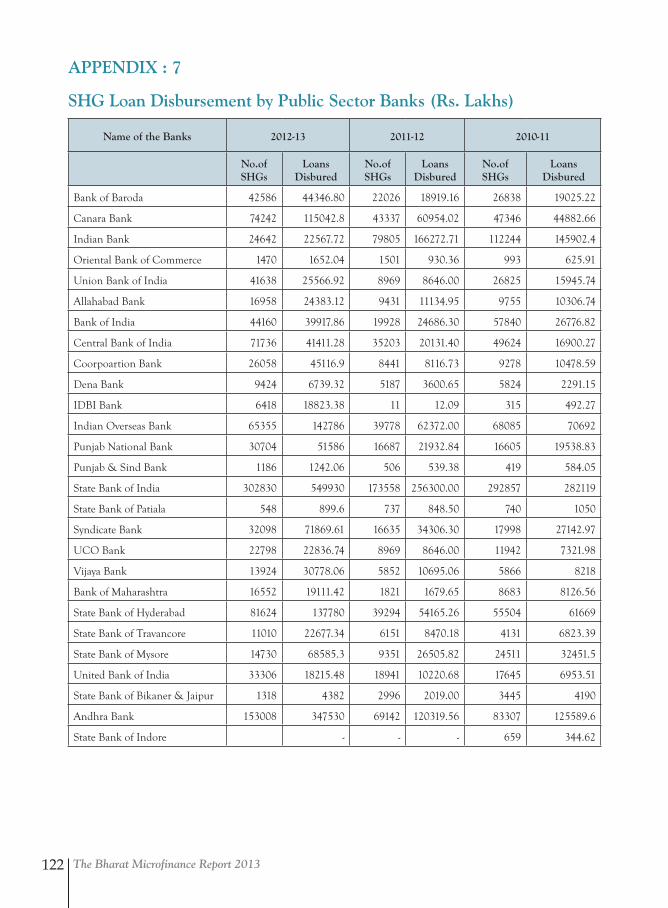
The Bharat Microfinance Report 2013122
Name of the Banks 2012-13 2011-12 2010-11
No.of SHGs
Loans Disbured
No.of SHGs
Loans Disbured
No.of SHGs
Loans Disbured
Bank of Baroda 42586 44346.80 22026 18919.16 26838 19025.22
Canara Bank 74242 115042.8 43337 60954.02 47346 44882.66
Indian Bank 24642 22567.72 79805 166272.71 112244 145902.4
Oriental Bank of Commerce 1470 1652.04 1501 930.36 993 625.91
Union Bank of India 41638 25566.92 8969 8646.00 26825 15945.74
Allahabad Bank 16958 24383.12 9431 11134.95 9755 10306.74
Bank of India 44160 39917.86 19928 24686.30 57840 26776.82
Central Bank of India 71736 41411.28 35203 20131.40 49624 16900.27
Coorpoartion Bank 26058 45116.9 8441 8116.73 9278 10478.59
Dena Bank 9424 6739.32 5187 3600.65 5824 2291.15
IDBI Bank 6418 18823.38 11 12.09 315 492.27
Indian Overseas Bank 65355 142786 39778 62372.00 68085 70692
Punjab National Bank 30704 51586 16687 21932.84 16605 19538.83
Punjab & Sind Bank 1186 1242.06 506 539.38 419 584.05
State Bank of India 302830 549930 173558 256300.00 292857 282119
State Bank of Patiala 548 899.6 737 848.50 740 1050
Syndicate Bank 32098 71869.61 16635 34306.30 17998 27142.97
UCO Bank 22798 22836.74 8969 8646.00 11942 7321.98
Vijaya Bank 13924 30778.06 5852 10695.06 5866 8218
Bank of Maharashtra 16552 19111.42 1821 1679.65 8683 8126.56
State Bank of Hyderabad 81624 137780 39294 54165.26 55504 61669
State Bank of Travancore 11010 22677.34 6151 8470.18 4131 6823.39
State Bank of Mysore 14730 68585.3 9351 26505.82 24511 32451.5
United Bank of India 33306 18215.48 18941 10220.68 17645 6953.51
State Bank of Bikaner & Jaipur 1318 4382 2996 2019.00 3445 4190
Andhra Bank 153008 347530 69142 120319.56 83307 125589.6
State Bank of Indore - - - 659 344.62
SHG Loan Disbursement by Public Sector Banks (Rs. Lakhs)
APPENDIX : 7
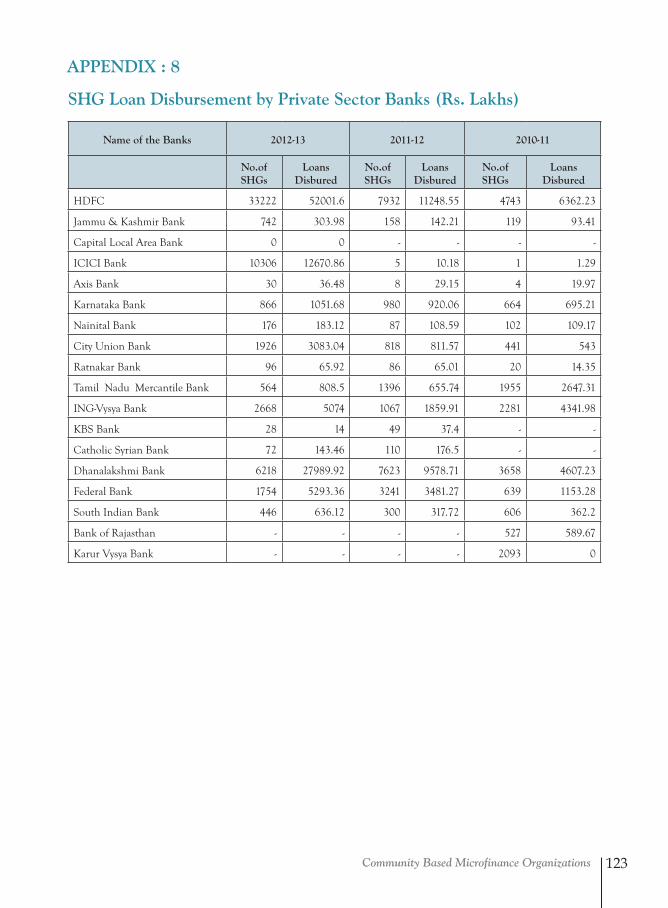
Community Based Microfinance Organizations 123
Name of the Banks 2012-13 2011-12 2010-11
No.of SHGs
Loans Disbured
No.of SHGs
Loans Disbured
No.of SHGs
Loans Disbured
HDFC 33222 52001.6 7932 11248.55 4743 6362.23
Jammu & Kashmir Bank 742 303.98 158 142.21 119 93.41
Capital Local Area Bank 0 0 - - - -
ICICI Bank 10306 12670.86 5 10.18 1 1.29
Axis Bank 30 36.48 8 29.15 4 19.97
Karnataka Bank 866 1051.68 980 920.06 664 695.21
Nainital Bank 176 183.12 87 108.59 102 109.17
City Union Bank 1926 3083.04 818 811.57 441 543
Ratnakar Bank 96 65.92 86 65.01 20 14.35
Tamil Nadu Mercantile Bank 564 808.5 1396 655.74 1955 2647.31
ING-Vysya Bank 2668 5074 1067 1859.91 2281 4341.98
KBS Bank 28 14 49 37.4 - -
Catholic Syrian Bank 72 143.46 110 176.5 - -
Dhanalakshmi Bank 6218 27989.92 7623 9578.71 3658 4607.23
Federal Bank 1754 5293.36 3241 3481.27 639 1153.28
South Indian Bank 446 636.12 300 317.72 606 362.2
Bank of Rajasthan - - - - 527 589.67
Karur Vysya Bank - - - - 2093 0
SHG Loan Disbursement by Private Sector Banks (Rs. Lakhs)
APPENDIX : 8
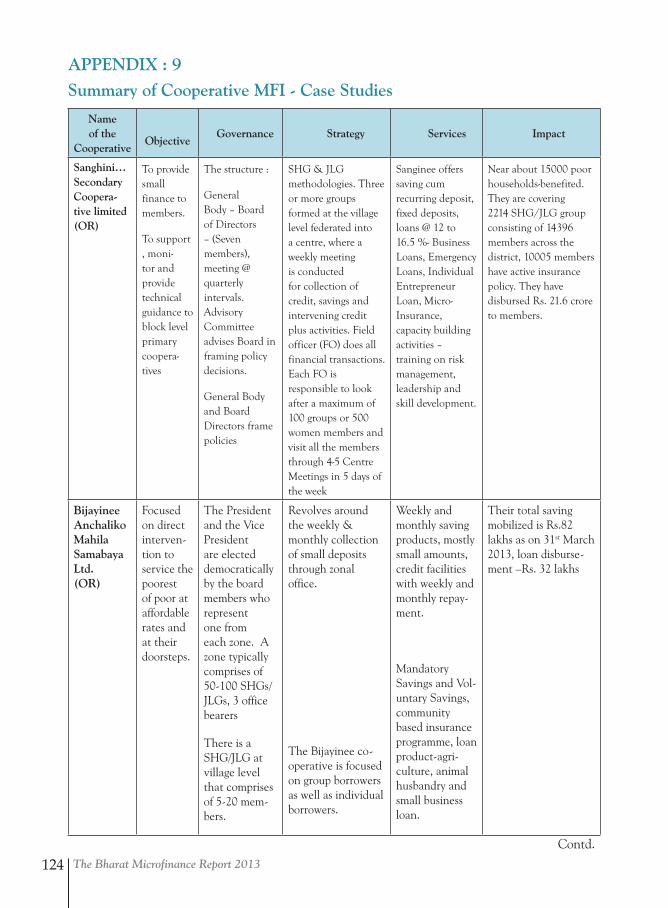
The Bharat Microfinance Report 2013124
APPENDIX : 9
Name of the
Cooperative
Objective
Governance Strategy Services Impact
Sanghini…Secondary Coopera-tive limited (OR)
To provide small finance to members.
To support , moni-tor and provide technical guidance to block level primary coopera-tives
The structure :
General Body – Board of Directors – (Seven members), meeting @ quarterly intervals. Advisory Committee advises Board in framing policy decisions.
General Body and Board Directors frame policies
SHG & JLG methodologies. Three or more groups formed at the village level federated into a centre, where a weekly meeting is conducted for collection of credit, savings and intervening credit plus activities. Field officer (FO) does all financial transactions. Each FO is responsible to look after a maximum of 100 groups or 500 women members and visit all the members through 4-5 Centre Meetings in 5 days of the week
Sanginee offers saving cum recurring deposit, fixed deposits, loans @ 12 to 16.5 %- Business Loans, Emergency Loans, Individual Entrepreneur Loan, Micro-Insurance, capacity building activities – training on risk management, leadership and skill development.
Near about 15000 poor households-benefited. They are covering 2214 SHG/JLG group consisting of 14396 members across the district, 10005 members have active insurance policy. They have disbursed Rs. 21.6 crore to members.
Bijayinee Anchaliko Mahila Samabaya Ltd. (OR)
Focused on direct interven-tion to service the poorest of poor at affordable rates and at their doorsteps.
The President and the Vice President are elected democratically by the board members who represent one from each zone. A zone typically comprises of 50-100 SHGs/JLGs, 3 office bearers
There is a SHG/JLG at village level that comprises of 5-20 mem-bers.
Revolves around the weekly & monthly collection of small deposits through zonal office.
The Bijayinee co-operative is focused on group borrowers as well as individual borrowers.
Weekly and monthly saving products, mostly small amounts, credit facilities with weekly and monthly repay-ment.
Mandatory Savings and Vol-untary Savings, community based insurance programme, loan product-agri-culture, animal husbandry and small business loan.
Their total saving mobilized is Rs.82 lakhs as on 31st March 2013, loan disburse-ment –Rs. 32 lakhs
Summary of Cooperative MFI - Case Studies
Contd.
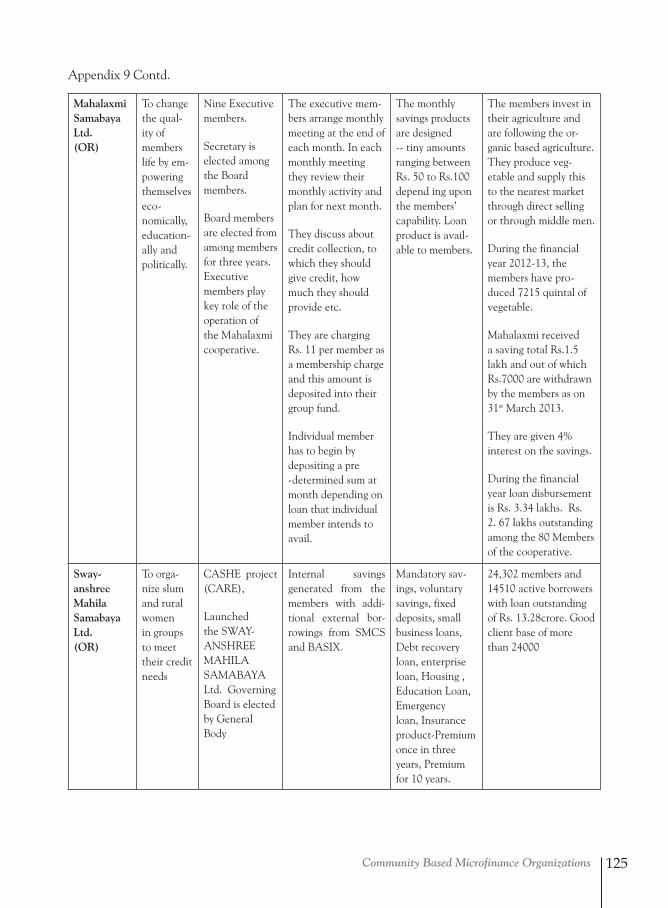
Community Based Microfinance Organizations 125Contd.
Mahalaxmi Samabaya Ltd. (OR)
To change the qual-ity of members life by em-powering themselves eco-nomically, education-ally and politically.
Nine Executive members.
Secretary is elected among the Board members.
Board members are elected from among members for three years. Executive members play key role of the operation of the Mahalaxmi cooperative.
The executive mem-bers arrange monthly meeting at the end of each month. In each monthly meeting they review their monthly activity and plan for next month.
They discuss about credit collection, to which they should give credit, how much they should provide etc.
They are charging Rs. 11 per member as a membership charge and this amount is deposited into their group fund.
Individual member has to begin by depositing a pre -determined sum at month depending on loan that individual member intends to avail.
The monthly savings products are designed -- tiny amounts ranging between Rs. 50 to Rs.100 depend ing upon the members’ capability. Loan product is avail-able to members.
The members invest in their agriculture and are following the or-ganic based agriculture. They produce veg-etable and supply this to the nearest market through direct selling or through middle men.
During the financial year 2012-13, the members have pro-duced 7215 quintal of vegetable.
Mahalaxmi received a saving total Rs.1.5 lakh and out of which Rs.7000 are withdrawn by the members as on 31st March 2013.
They are given 4% interest on the savings.
During the financial year loan disbursement is Rs. 3.34 lakhs. Rs. 2. 67 lakhs outstanding among the 80 Members of the cooperative.
Sway-anshree Mahila Samabaya Ltd. (OR)
To orga-nize slum and rural women in groups to meet their credit needs
CASHE project (CARE),
Launched the SWAY-ANSHREE MAHILA SAMABAYA Ltd. Governing Board is elected by General Body
Internal savings generated from the members with addi-tional external bor-rowings from SMCS and BASIX.
Mandatory sav-ings, voluntary savings, fixed deposits, small business loans, Debt recovery loan, enterprise loan, Housing , Education Loan, Emergency loan, Insurance product-Premium once in three years, Premium for 10 years.
24,302 members and 14510 active borrowers with loan outstanding of Rs. 13.28crore. Good client base of more than 24000
Appendix 9 Contd.
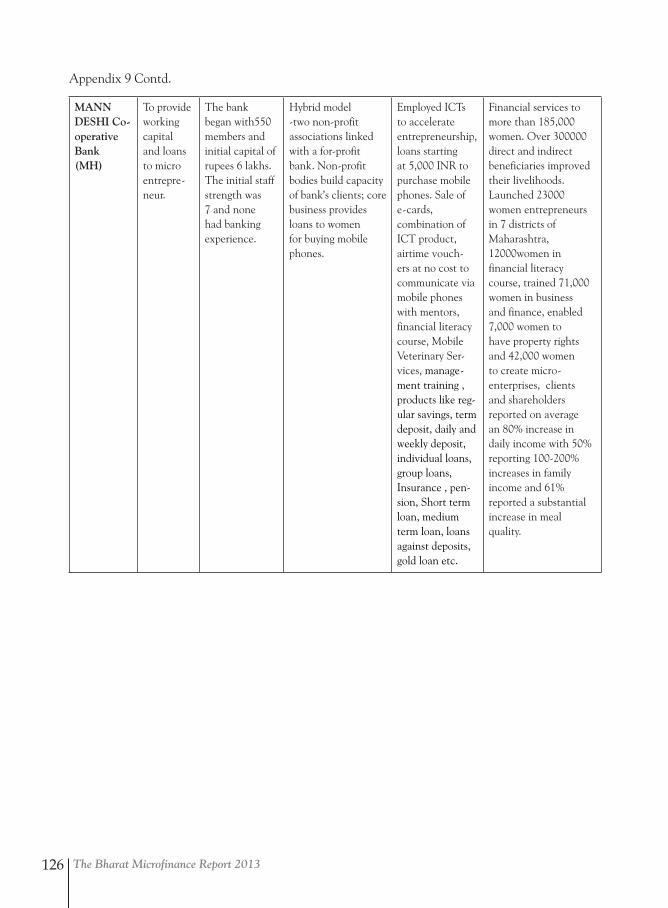
The Bharat Microfinance Report 2013126
MANN DESHI Co-operative Bank (MH)
To provide working capital and loans to micro entrepre-neur.
The bank began with550 members and initial capital of rupees 6 lakhs. The initial staff strength was 7 and none had banking experience.
Hybrid model -two non-profit associations linked with a for-profit bank. Non-profit bodies build capacity of bank’s clients; core business provides loans to women for buying mobile phones.
Employed ICTs to accelerate entrepreneurship, loans starting at 5,000 INR to purchase mobile phones. Sale of e-cards,combination of ICT product, airtime vouch-ers at no cost to communicate via mobile phones with mentors, financial literacy course, Mobile Veterinary Ser-vices, manage-ment training , products like reg-ular savings, term deposit, daily and weekly deposit, individual loans, group loans, Insurance , pen-sion, Short term loan, medium term loan, loans against deposits, gold loan etc.
Financial services to more than 185,000 women. Over 300000 direct and indirect beneficiaries improved their livelihoods. Launched 23000 women entrepreneurs in 7 districts of Maharashtra, 12000women in financial literacy course, trained 71,000 women in business and finance, enabled 7,000 women to have property rights and 42,000 women to create micro-enterprises, clients and shareholders reported on average an 80% increase in daily income with 50% reporting 100-200% increases in family income and 61% reported a substantial increase in meal quality.
Appendix 9 Contd.
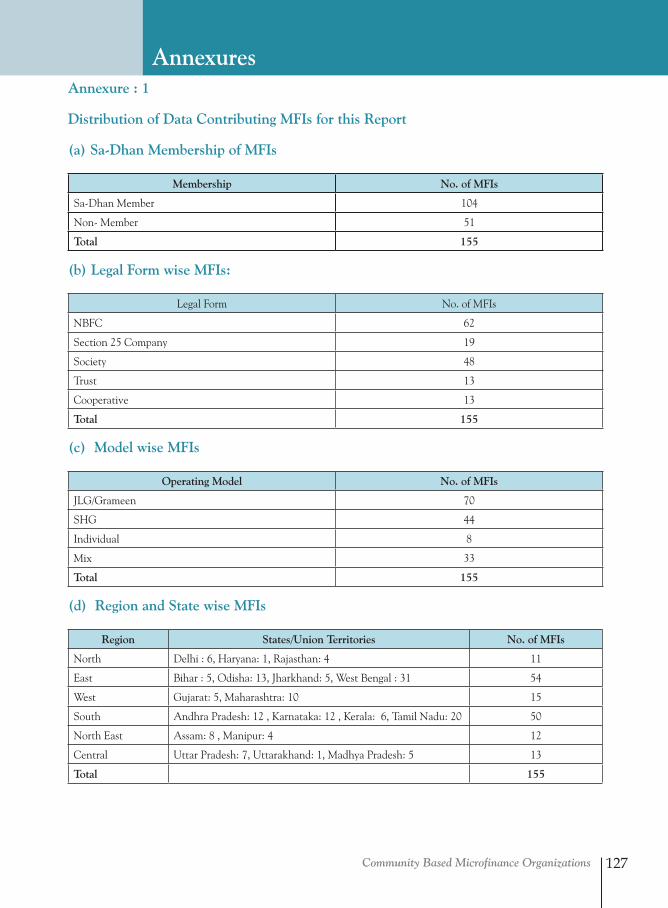
Community Based Microfinance Organizations 127
Annexure : 1
Distribution of Data Contributing MFIs for this Report
(a) Sa-Dhan Membership of MFIs
Membership No. of MFIs
Sa-Dhan Member 104
Non- Member 51
Total 155
(b) Legal Form wise MFIs:
Legal Form No. of MFIs
NBFC 62
Section 25 Company 19
Society 48
Trust 13
Cooperative 13
Total 155
(c) Model wise MFIs
Operating Model No. of MFIs
JLG/Grameen 70
SHG 44
Individual 8
Mix 33
Total 155
(d) Region and State wise MFIs
Region States/Union Territories No. of MFIs
North Delhi : 6, Haryana: 1, Rajasthan: 4 11
East Bihar : 5, Odisha: 13, Jharkhand: 5, West Bengal : 31 54
West Gujarat: 5, Maharashtra: 10 15
South Andhra Pradesh: 12 , Karnataka: 12 , Kerala: 6, Tamil Nadu: 20 50
North East Assam: 8 , Manipur: 4 12
Central Uttar Pradesh: 7, Uttarakhand: 1, Madhya Pradesh: 5 13
Total 155
Annexures
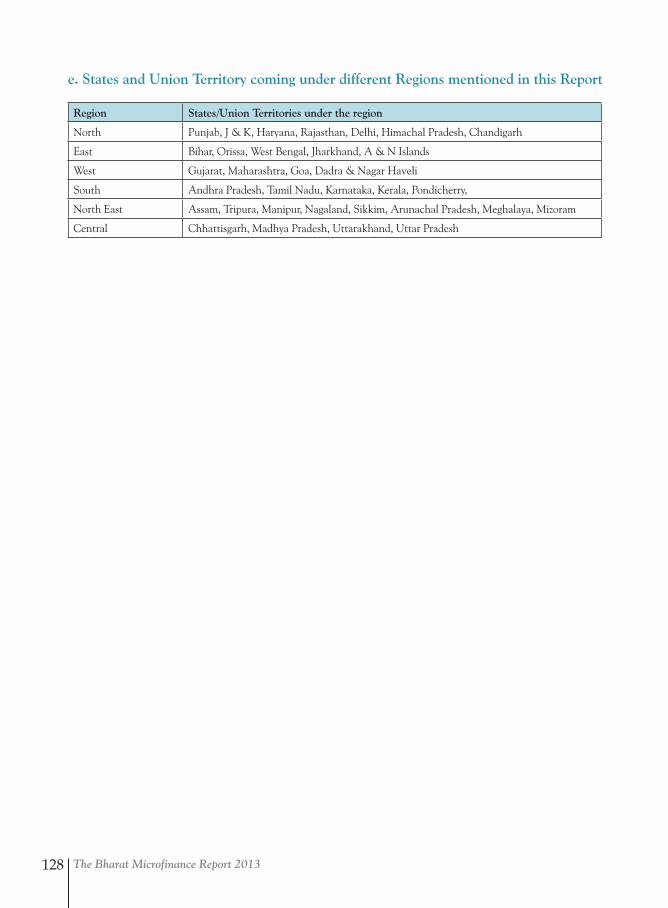
The Bharat Microfinance Report 2013128
e. States and Union Territory coming under different Regions mentioned in this Report
Region States/Union Territories under the region
North Punjab, J & K, Haryana, Rajasthan, Delhi, Himachal Pradesh, Chandigarh
East Bihar, Orissa, West Bengal, Jharkhand, A & N Islands
West Gujarat, Maharashtra, Goa, Dadra & Nagar Haveli
South Andhra Pradesh, Tamil Nadu, Karnataka, Kerala, Pondicherry,
North East Assam, Tripura, Manipur, Nagaland, Sikkim, Arunachal Pradesh, Meghalaya, Mizoram
Central Chhattisgarh, Madhya Pradesh, Uttarakhand, Uttar Pradesh
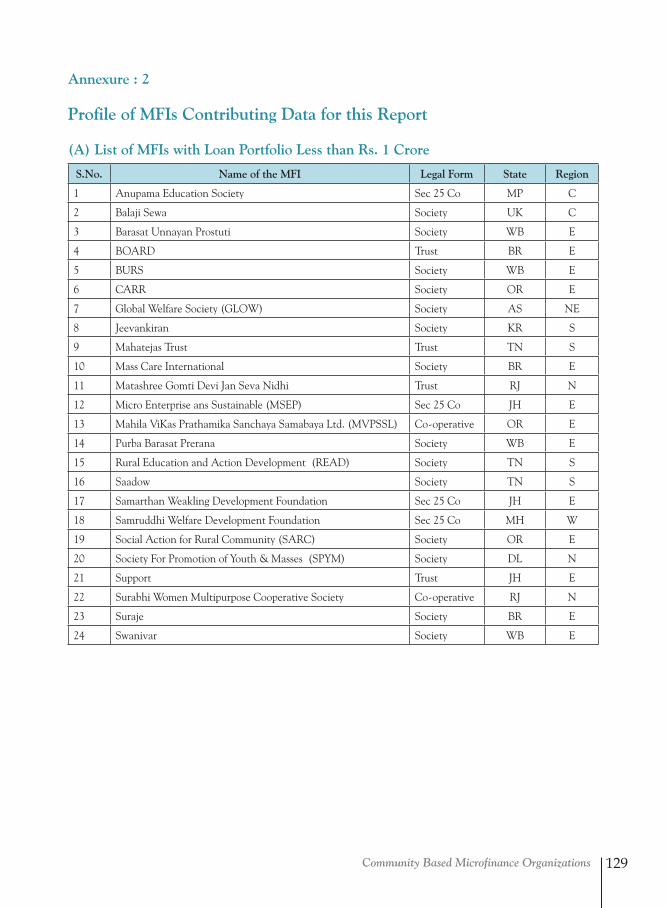
Community Based Microfinance Organizations 129
Profile of MFIs Contributing Data for this Report
(A) List of MFIs with Loan Portfolio Less than Rs. 1 Crore
S.No. Name of the MFI Legal Form State Region
1 Anupama Education Society Sec 25 Co MP C
2 Balaji Sewa Society UK C
3 Barasat Unnayan Prostuti Society WB E
4 BOARD Trust BR E
5 BURS Society WB E
6 CARR Society OR E
7 Global Welfare Society (GLOW) Society AS NE
8 Jeevankiran Society KR S
9 Mahatejas Trust Trust TN S
10 Mass Care International Society BR E
11 Matashree Gomti Devi Jan Seva Nidhi Trust RJ N
12 Micro Enterprise ans Sustainable (MSEP) Sec 25 Co JH E
13 Mahila ViKas Prathamika Sanchaya Samabaya Ltd. (MVPSSL) Co-operative OR E
14 Purba Barasat Prerana Society WB E
15 Rural Education and Action Development (READ) Society TN S
16 Saadow Society TN S
17 Samarthan Weakling Development Foundation Sec 25 Co JH E
18 Samruddhi Welfare Development Foundation Sec 25 Co MH W
19 Social Action for Rural Community (SARC) Society OR E
20 Society For Promotion of Youth & Masses (SPYM) Society DL N
21 Support Trust JH E
22 Surabhi Women Multipurpose Cooperative Society Co-operative RJ N
23 Suraje Society BR E
24 Swanivar Society WB E
Annexure : 2
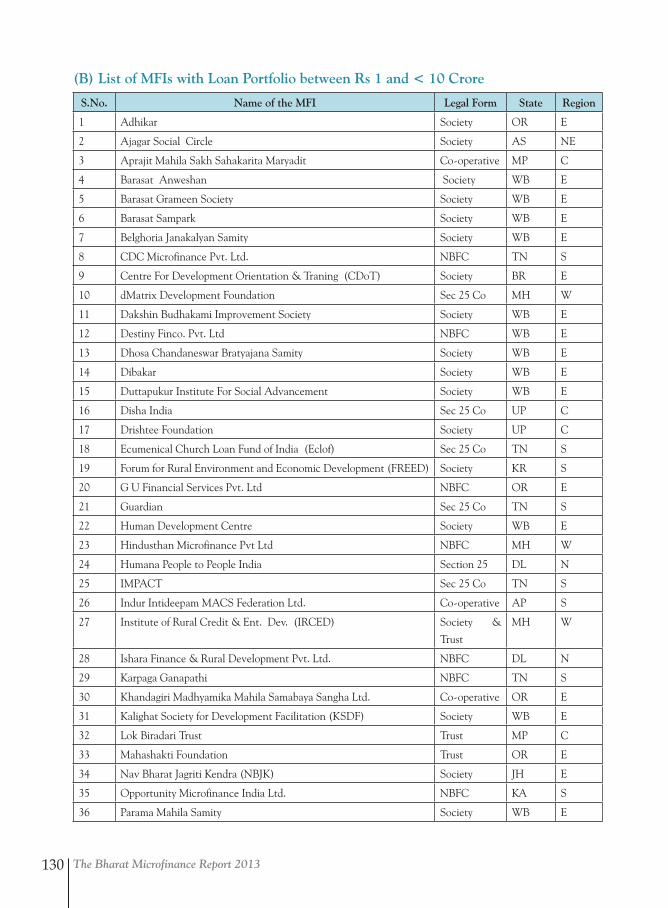
The Bharat Microfinance Report 2013130
(B) List of MFIs with Loan Portfolio between Rs 1 and < 10 Crore
S.No. Name of the MFI Legal Form State Region
1 Adhikar Society OR E
2 Ajagar Social Circle Society AS NE
3 Aprajit Mahila Sakh Sahakarita Maryadit Co-operative MP C
4 Barasat Anweshan Society WB E
5 Barasat Grameen Society Society WB E
6 Barasat Sampark Society WB E
7 Belghoria Janakalyan Samity Society WB E
8 CDC Microfinance Pvt. Ltd. NBFC TN S
9 Centre For Development Orientation & Traning (CDoT) Society BR E
10 dMatrix Development Foundation Sec 25 Co MH W
11 Dakshin Budhakami Improvement Society Society WB E
12 Destiny Finco. Pvt. Ltd NBFC WB E
13 Dhosa Chandaneswar Bratyajana Samity Society WB E
14 Dibakar Society WB E
15 Duttapukur Institute For Social Advancement Society WB E
16 Disha India Sec 25 Co UP C
17 Drishtee Foundation Society UP C
18 Ecumenical Church Loan Fund of India (Eclof) Sec 25 Co TN S
19 Forum for Rural Environment and Economic Development (FREED) Society KR S
20 G U Financial Services Pvt. Ltd NBFC OR E
21 Guardian Sec 25 Co TN S
22 Human Development Centre Society WB E
23 Hindusthan Microfinance Pvt Ltd NBFC MH W
24 Humana People to People India Section 25 DL N
25 IMPACT Sec 25 Co TN S
26 Indur Intideepam MACS Federation Ltd. Co-operative AP S
27 Institute of Rural Credit & Ent. Dev. (IRCED) Society &
Trust
MH W
28 Ishara Finance & Rural Development Pvt. Ltd. NBFC DL N
29 Karpaga Ganapathi NBFC TN S
30 Khandagiri Madhyamika Mahila Samabaya Sangha Ltd. Co-operative OR E
31 Kalighat Society for Development Facilitation (KSDF) Society WB E
32 Lok Biradari Trust Trust MP C
33 Mahashakti Foundation Trust OR E
34 Nav Bharat Jagriti Kendra (NBJK) Society JH E
35 Opportunity Microfinance India Ltd. NBFC KA S
36 Parama Mahila Samity Society WB E
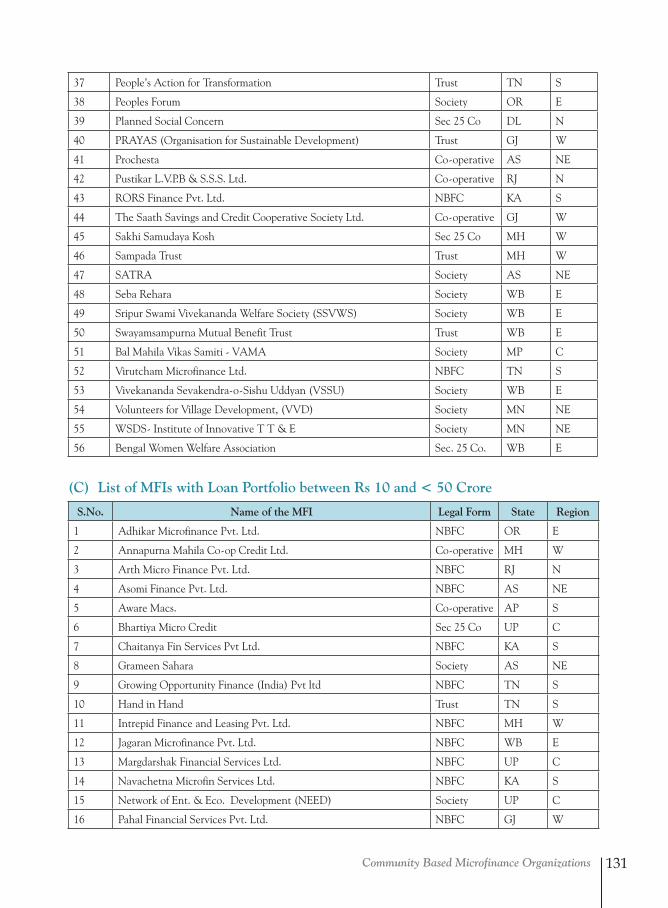
Community Based Microfinance Organizations 131
37 People’s Action for Transformation Trust TN S
38 Peoples Forum Society OR E
39 Planned Social Concern Sec 25 Co DL N
40 PRAYAS (Organisation for Sustainable Development) Trust GJ W
41 Prochesta Co-operative AS NE
42 Pustikar L.V.P.B & S.S.S. Ltd. Co-operative RJ N
43 RORS Finance Pvt. Ltd. NBFC KA S
44 The Saath Savings and Credit Cooperative Society Ltd. Co-operative GJ W
45 Sakhi Samudaya Kosh Sec 25 Co MH W
46 Sampada Trust Trust MH W
47 SATRA Society AS NE
48 Seba Rehara Society WB E
49 Sripur Swami Vivekananda Welfare Society (SSVWS) Society WB E
50 Swayamsampurna Mutual Benefit Trust Trust WB E
51 Bal Mahila Vikas Samiti - VAMA Society MP C
52 Virutcham Microfinance Ltd. NBFC TN S
53 Vivekananda Sevakendra-o-Sishu Uddyan (VSSU) Society WB E
54 Volunteers for Village Development, (VVD) Society MN NE
55 WSDS- Institute of Innovative T T & E Society MN NE
56 Bengal Women Welfare Association Sec. 25 Co. WB E
(C) List of MFIs with Loan Portfolio between Rs 10 and < 50 Crore
S.No. Name of the MFI Legal Form State Region
1 Adhikar Microfinance Pvt. Ltd. NBFC OR E
2 Annapurna Mahila Co-op Credit Ltd. Co-operative MH W
3 Arth Micro Finance Pvt. Ltd. NBFC RJ N
4 Asomi Finance Pvt. Ltd. NBFC AS NE
5 Aware Macs. Co-operative AP S
6 Bhartiya Micro Credit Sec 25 Co UP C
7 Chaitanya Fin Services Pvt Ltd. NBFC KA S
8 Grameen Sahara Society AS NE
9 Growing Opportunity Finance (India) Pvt ltd NBFC TN S
10 Hand in Hand Trust TN S
11 Intrepid Finance and Leasing Pvt. Ltd. NBFC MH W
12 Jagaran Microfinance Pvt. Ltd. NBFC WB E
13 Margdarshak Financial Services Ltd. NBFC UP C
14 Navachetna Microfin Services Ltd. NBFC KA S
15 Network of Ent. & Eco. Development (NEED) Society UP C
16 Pahal Financial Services Pvt. Ltd. NBFC GJ W
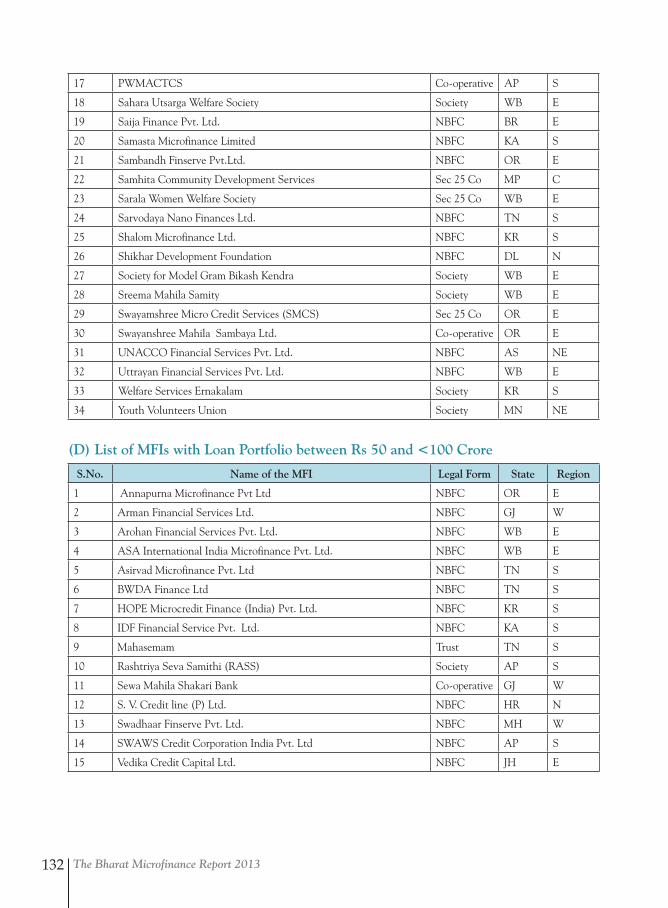
The Bharat Microfinance Report 2013132
17 PWMACTCS Co-operative AP S
18 Sahara Utsarga Welfare Society Society WB E
19 Saija Finance Pvt. Ltd. NBFC BR E
20 Samasta Microfinance Limited NBFC KA S
21 Sambandh Finserve Pvt.Ltd. NBFC OR E
22 Samhita Community Development Services Sec 25 Co MP C
23 Sarala Women Welfare Society Sec 25 Co WB E
24 Sarvodaya Nano Finances Ltd. NBFC TN S
25 Shalom Microfinance Ltd. NBFC KR S
26 Shikhar Development Foundation NBFC DL N
27 Society for Model Gram Bikash Kendra Society WB E
28 Sreema Mahila Samity Society WB E
29 Swayamshree Micro Credit Services (SMCS) Sec 25 Co OR E
30 Swayanshree Mahila Sambaya Ltd. Co-operative OR E
31 UNACCO Financial Services Pvt. Ltd. NBFC AS NE
32 Uttrayan Financial Services Pvt. Ltd. NBFC WB E
33 Welfare Services Ernakalam Society KR S
34 Youth Volunteers Union Society MN NE
(D) List of MFIs with Loan Portfolio between Rs 50 and <100 Crore
S.No. Name of the MFI Legal Form State Region
1 Annapurna Microfinance Pvt Ltd NBFC OR E
2 Arman Financial Services Ltd. NBFC GJ W
3 Arohan Financial Services Pvt. Ltd. NBFC WB E
4 ASA International India Microfinance Pvt. Ltd. NBFC WB E
5 Asirvad Microfinance Pvt. Ltd NBFC TN S
6 BWDA Finance Ltd NBFC TN S
7 HOPE Microcredit Finance (India) Pvt. Ltd. NBFC KR S
8 IDF Financial Service Pvt. Ltd. NBFC KA S
9 Mahasemam Trust TN S
10 Rashtriya Seva Samithi (RASS) Society AP S
11 Sewa Mahila Shakari Bank Co-operative GJ W
12 S. V. Credit line (P) Ltd. NBFC HR N
13 Swadhaar Finserve Pvt. Ltd. NBFC MH W
14 SWAWS Credit Corporation India Pvt. Ltd NBFC AP S
15 Vedika Credit Capital Ltd. NBFC JH E
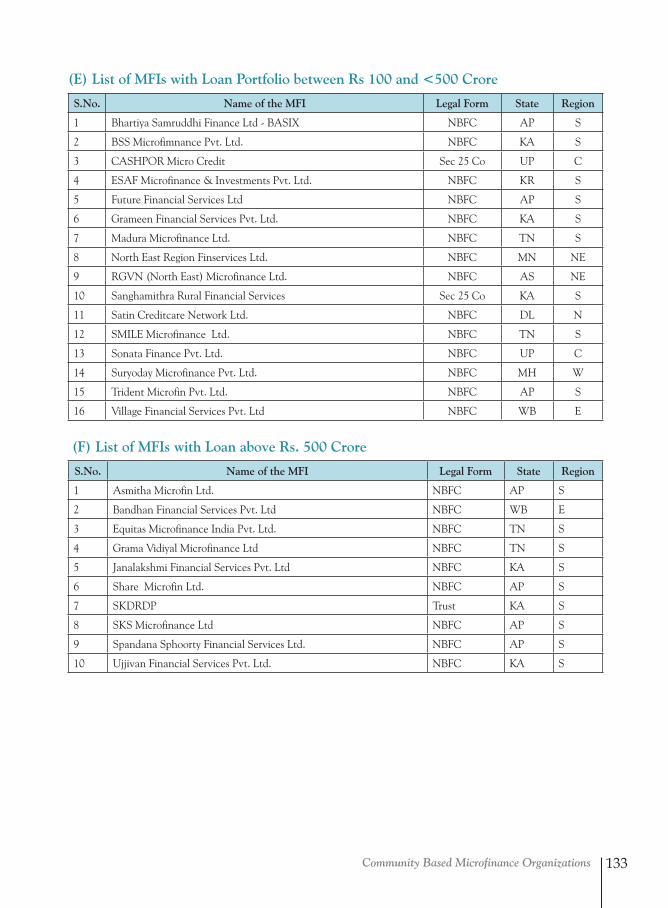
Community Based Microfinance Organizations 133
(E) List of MFIs with Loan Portfolio between Rs 100 and <500 Crore
S.No. Name of the MFI Legal Form State Region
1 Bhartiya Samruddhi Finance Ltd - BASIX NBFC AP S
2 BSS Microfimnance Pvt. Ltd. NBFC KA S
3 CASHPOR Micro Credit Sec 25 Co UP C
4 ESAF Microfinance & Investments Pvt. Ltd. NBFC KR S
5 Future Financial Services Ltd NBFC AP S
6 Grameen Financial Services Pvt. Ltd. NBFC KA S
7 Madura Microfinance Ltd. NBFC TN S
8 North East Region Finservices Ltd. NBFC MN NE
9 RGVN (North East) Microfinance Ltd. NBFC AS NE
10 Sanghamithra Rural Financial Services Sec 25 Co KA S
11 Satin Creditcare Network Ltd. NBFC DL N
12 SMILE Microfinance Ltd. NBFC TN S
13 Sonata Finance Pvt. Ltd. NBFC UP C
14 Suryoday Microfinance Pvt. Ltd. NBFC MH W
15 Trident Microfin Pvt. Ltd. NBFC AP S
16 Village Financial Services Pvt. Ltd NBFC WB E
(F) List of MFIs with Loan above Rs. 500 Crore
S.No. Name of the MFI Legal Form State Region
1 Asmitha Microfin Ltd. NBFC AP S
2 Bandhan Financial Services Pvt. Ltd NBFC WB E
3 Equitas Microfinance India Pvt. Ltd. NBFC TN S
4 Grama Vidiyal Microfinance Ltd NBFC TN S
5 Janalakshmi Financial Services Pvt. Ltd NBFC KA S
6 Share Microfin Ltd. NBFC AP S
7 SKDRDP Trust KA S
8 SKS Microfinance Ltd NBFC AP S
9 Spandana Sphoorty Financial Services Ltd. NBFC AP S
10 Ujjivan Financial Services Pvt. Ltd. NBFC KA S
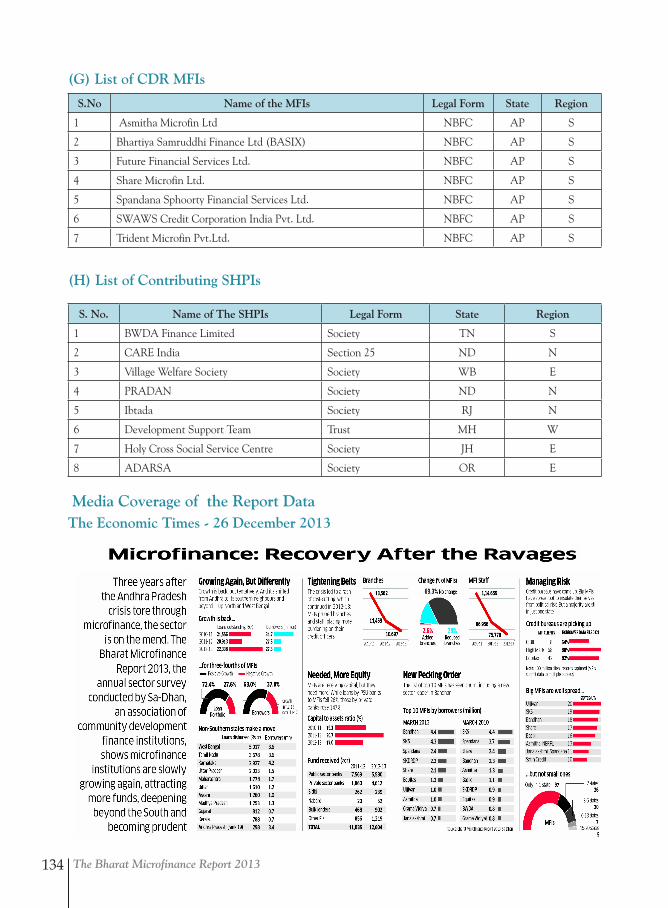
The Bharat Microfinance Report 2013134
(G) List of CDR MFIs
S.No Name of the MFIs Legal Form State Region
1 Asmitha Microfin Ltd NBFC AP S
2 Bhartiya Samruddhi Finance Ltd (BASIX) NBFC AP S
3 Future Financial Services Ltd. NBFC AP S
4 Share Microfin Ltd. NBFC AP S
5 Spandana Sphoorty Financial Services Ltd. NBFC AP S
6 SWAWS Credit Corporation India Pvt. Ltd. NBFC AP S
7 Trident Microfin Pvt.Ltd. NBFC AP S
(H) List of Contributing SHPIs
S. No. Name of The SHPIs Legal Form State Region
1 BWDA Finance Limited Society TN S
2 CARE India Section 25 ND N
3 Village Welfare Society Society WB E
4 PRADAN Society ND N
5 Ibtada Society RJ N
6 Development Support Team Trust MH W
7 Holy Cross Social Service Centre Society JH E
8 ADARSA Society OR E
Media Coverage of the Report DataThe Economic Times - 26 December 2013