
The Baltic connection: industrial structure in and intergration between Southern Sweden and Nothern...
173
econstor www.econstor.eu Der Open-Access-Publikationsserver der ZBW – Leibniz-Informationszentrum Wirtschaft The Open Access Publication Server of the ZBW – Leibniz Information Centre for Economics Nutzungsbedingungen: Die ZBW räumt Ihnen als Nutzerin/Nutzer das unentgeltliche, räumlich unbeschränkte und zeitlich auf die Dauer des Schutzrechts beschränkte einfache Recht ein, das ausgewählte Werk im Rahmen der unter → http://www.econstor.eu/dspace/Nutzungsbedingungen nachzulesenden vollständigen Nutzungsbedingungen zu vervielfältigen, mit denen die Nutzerin/der Nutzer sich durch die erste Nutzung einverstanden erklärt. Terms of use: The ZBW grants you, the user, the non-exclusive right to use the selected work free of charge, territorially unrestricted and within the time limit of the term of the property rights according to the terms specified at → http://www.econstor.eu/dspace/Nutzungsbedingungen By the first use of the selected work the user agrees and declares to comply with these terms of use. zbw Leibniz-Informationszentrum Wirtschaft Leibniz Information Centre for Economics Lagnevik, Magnus et al. Working Paper The Baltic connection : industrial structure in and intergration between Southern Sweden and Nothern Germany Kiel Working Papers, No. 520 Provided in Cooperation with: Kiel Institute for the World Economy (IfW) Suggested Citation: Lagnevik, Magnus et al. (1992) : The Baltic connection : industrial structure in and intergration between Southern Sweden and Nothern Germany, Kiel Working Papers, No. 520 This Version is available at: http://hdl.handle.net/10419/608
-
Upload
independent -
Category
Documents
-
view
2 -
download
0
Transcript of The Baltic connection: industrial structure in and intergration between Southern Sweden and Nothern...
econstor www.econstor.eu
Der Open-Access-Publikationsserver der ZBW – Leibniz-Informationszentrum WirtschaftThe Open Access Publication Server of the ZBW – Leibniz Information Centre for Economics
Nutzungsbedingungen:Die ZBW räumt Ihnen als Nutzerin/Nutzer das unentgeltliche,räumlich unbeschränkte und zeitlich auf die Dauer des Schutzrechtsbeschränkte einfache Recht ein, das ausgewählte Werk im Rahmender unter→ http://www.econstor.eu/dspace/Nutzungsbedingungennachzulesenden vollständigen Nutzungsbedingungen zuvervielfältigen, mit denen die Nutzerin/der Nutzer sich durch dieerste Nutzung einverstanden erklärt.
Terms of use:The ZBW grants you, the user, the non-exclusive right to usethe selected work free of charge, territorially unrestricted andwithin the time limit of the term of the property rights accordingto the terms specified at→ http://www.econstor.eu/dspace/NutzungsbedingungenBy the first use of the selected work the user agrees anddeclares to comply with these terms of use.
zbw Leibniz-Informationszentrum WirtschaftLeibniz Information Centre for Economics
Lagnevik, Magnus et al.
Working Paper
The Baltic connection : industrial structure in andintergration between Southern Sweden and NothernGermany
Kiel Working Papers, No. 520
Provided in Cooperation with:Kiel Institute for the World Economy (IfW)
Suggested Citation: Lagnevik, Magnus et al. (1992) : The Baltic connection : industrial structurein and intergration between Southern Sweden and Nothern Germany, Kiel Working Papers, No.520
This Version is available at:http://hdl.handle.net/10419/608
Kieler ArbeitspapiereKiel Working Papers
Working Paper No. 520
The/Baltic ConnectionIndustrial Structure in and Integration
between Southern Sweden and Northern Germany
by
Magnus Lagnevik, Konrad Lammers et al.
July 1992
Institutfur Weltwirtschaft an der Universitat Kiel
The Kiel Institute of World Economics
ISSN 0342-0787
Kiel Institute of World EconomicsDiistembrooker Weg 120, D-2300 Kiel
Working Paper No. 520
The/Baltic ConnectionIndustrial Structure in and Integration
between Southern Sweden and Northern Germany
by
Magnus Lagnevik, Konrad Lammers et al.
July 1992
Authors:
Kristina Genell, Claus-Friedrich Laaser,Magnus Lagnevik, Konrad Lammers, Goran Lundin,
Karl-Johan Lundqvist, Lars-Olof Olander
The authors themselves, not the Kiel Institute of World Economics,are responsible for the contents and distribution of Kiel WorkingPapers.Since the series involves manuscripts in a preliminary form, interestedreaders are requested to direct criticisms and suggestions directly tothe authors and to clear any quotations with them.

Prefatory Note
This study is the outcome of a common research project between the Institutefor Economic Research at the school of Economics and Management in Lundand the Kiel Institute of World Economics. The authors would like to thankHans Medin for his initiatives and enthusiasm in the creation of cooperationbetween the two Institutes through the German-Swedish Research Association.
Contents
Part 1. Background, Purpose and Problem (1)
Part 2. Structure and Networks - Southern Sweden (5)
The Southern Swedish Region (6)
Manufacturing Industry in Southern Sweden: Structural Changes 1970-1987 (10)Statistical Basis (11)Analytical Method: Sectors and Sub Sectors (11)Structure and Change on a National Level (14)Southern Sweden (16)
Notes on the Empirical Material (22)Survey I: "Export and International Specialization" (22)Survey II: "Supplier Patterns and International Relations" (23)
Export Intensities and Geographical Distribution (24)R&D Share, Concentration of Production and Ownership of Industrial Firms in aRegional Perspective (25)Export Intensities (29)The "Home Base" and Its Importance (31)Geographical Distribution (35)
Foreign Production (38)Geographical Distribution (39)
The Purchasing Patterns and Purchasing Networks (41)Long Term Buyer Relations (42)Local and Regional Supplier Networks (43)Purchasing Networks with Germany, Europe and the Rest of the World (43)Expected Changes in Volume Purchased Abroad (44)
Company Actions and Plans as an Answer to Environmental Changes (45)The European Community and the Single Market Actions and Plans (46)Actions and Plans concerning the Economic and Political Developments inEastern Europe (47)
Expectations and Preparations for the Future (54)The Regional Mobilization (54)The Corporate Behaviour (55)No Expected Changes in Import and Export (58)
The Development of Competitiveness - an Emerging Pattern (59)
Part 3. Structure and Networks - Schleswig-Holstein (65)
Position and Performance of Schleswig-Holstein's Economy 1970-1990 (66)Conditions for Economic Activities in Schleswig-Holstein (75)Locational Factors (76)Institutional Conditions (82)Main Lines of Industrial Structure and Structural Change in Schleswig-Holsteinin the Seventies and Eighties (84)Structural Change in Schleswig-Holstein (89)
Networks: Export Structures and Direct-Investment Relations (99)Export Structures by Categories of Products (99)Export Structures by Regions (101)Exports to Sweden (102)Direct Investment Relations (104)
Effects of the Completion of the European Single Market of the Economy ofSchleswig-Holstein (110)Methodical Considerations (110)"Sectoral Affectedness of Schleswig-Holstein's Manufacturing Sector (111)"Regional Competitiveness" of Schleswig-Holstein (113)
Potential Effects of the ESM-Program in the Judgement of Enterprises fromSchleswig-Holstein (114)
Part 4. Comparative Analysis - Southern Sweden andSchleswig-Holstein (123)
Economic Performance and Structural Change (124)Problem Sectors and Prosperous Sectors (129)
Interaction and Internationalization (134)Effects of the Completion of the European Single Market (138)Baltic Cooperation - Based on what? (142)
References (149)
Appendix 1: Ohlsson and Vinell Classification of Manufacturing Industry (155)Appendix 2: "ESM Affectedness Classification" of Swedish ManufacturingIndustries (159)Appendix 3: Classification Schemes Provided by Ohlsson and Vinell, and Klodtand Sectoral Affectedness of Branches by the ESM-Program According toBuigues, Ilzkowitz and Lebrun (163)Appendix 4: Results of the 1992 Questionnaire of the Schleswig-HolsteinChambers of Industry and Commerce Among Enterprises in Schleswig-HolsteinConcerning the Potential Results of the European Single Market, Results forManufacturing Enterprises (167)

Parti
Many people and politicians see the Baltic rim as a region with promising eco-nomic prospects. Even the picture of a new "Hanse" region is drawn. It is truethat the political upheaval in Eastern Europe has changed the situation in theBaltic rim substantially: Poland, Russia and the Baltic states are on the way tobecoming market economies which will presumably bring more scope for tradewith - not only, but especially - the other countries around the Baltic Sea.Changes in the economic environment are not limited to the former centralplanned economies. At the end "of 1992 the common internal market between ECmember countries should be completed. The EC and the EFTA countries haveagreed that the same internal market conditions will mainly be valid for EFTAcountries. Furthermore the EFTA countries Sweden and Finland have applied formembership of the EC. All this means that the countries in the Baltic region willpresumably face far reaching changes in their established trade and othereconomic relations.
Undoubtedly the changing economic environment will lead to new patterns oftrade, cooperation and competition around the Baltic. All regions will not beaffected in same manner and the reactions in the regions may be different. In thisstudy we consider two regions of the Baltic rim - Southern Sweden andSchleswig-Holstein which is the most northern German Bundesland.
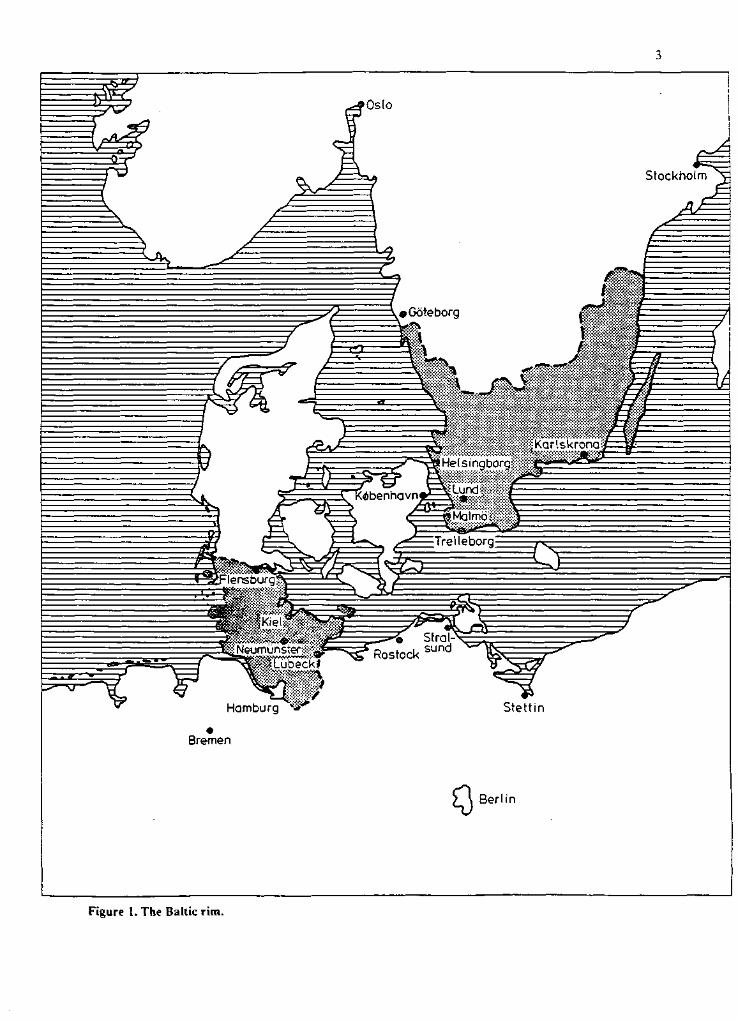
Our attention is centered on these regions because Sweden and Germany are theleading export countries in the Baltic rim belonging to different economic areas,the EFTA and the EC. Southern Sweden and Schleswig-Holstein are border-regions between these economic areas and more or less peripheral regions totheir respective national centres (figure 1). Therefore one can expect that theeffects of integration of the EFTA and EC should be more distinctly noticeablein Southern Sweden and Schleswig-Holstein.1 Besides the effects resulting fromintegration in Europe the regions are of course confronted - as any region whichis involved in the international division of labour - by the challenge of increasingglobal competition.
In our study we consider the economic performance and structure of the regionsand we ask how the regions have managed structural change in the seventies andeighties. Furthermore we investigate the economic networks between the regions
1 From a point of view which gives priority to geographic distance Mecklenburg-Vorpommern is the Germanregion nearest to Sweden. But investigating economic structure and performance in the past and existing traderelations assessing integration effects for Mecklenburg-Vorpommem does not seem very promising. In theformer GDR all determinants of economic development were the result of planning decisions influenced by theidea of intra-Comecon socialistic division of labour. The situation has substantially changed by the Germanunification indeed, but the period since 1990 is too short to draw any conclusions. Besides this any reliabledata on Mecklenburg-Vorpommern suitable for the investigation are still lacking.
^
=5^
V
Oslo
Stockholm
Figure 1. The Baltic rim.
and the "rest of the world", especially the trade patterns and the investmentrelations. As far as possible we focus on the links between Southern Sweden andSchleswig-Holstein. Based on these issues we draw conclusions on the prospectsof the two regions in a changing economic environment that is characterized bythe various integrative efforts in Europe.
The study consist of four parts. In the second part Southern Sweden is investi-gated as described above. In the third part the same is done for Schleswig-Holstein. A comparative analysis of the two regions based on the main findingsforms the fourth part.
We have tried to consider the two regions by the same method. However, theavailability of comparable data restricted our efforts. Furthermore the interests ofthe involved researchers may have led to slightly different focal points in thesecond and the third part of our study. The study may leave more questions openthan it gives answers. In spite of that we hope that we can stimulate thediscussion and further research efforts on what can be called "the BalticConnection".
Part 2
The Southern Swedish Region
There are at least two main principles for defining a region, both satisfying theo-retically but also less satisfactory from a practical point of view. One method isof course to rely on existing administrative boundaries, the other to use one or anumber of social and economic criteria, thereby arriving at a "functional region"independent of administrative boundaries. While the "administrative region"seldom is quite suitable for any but a few specific purposes, it has one distinctadvantage over functional regions: and that is the availability of statistics.
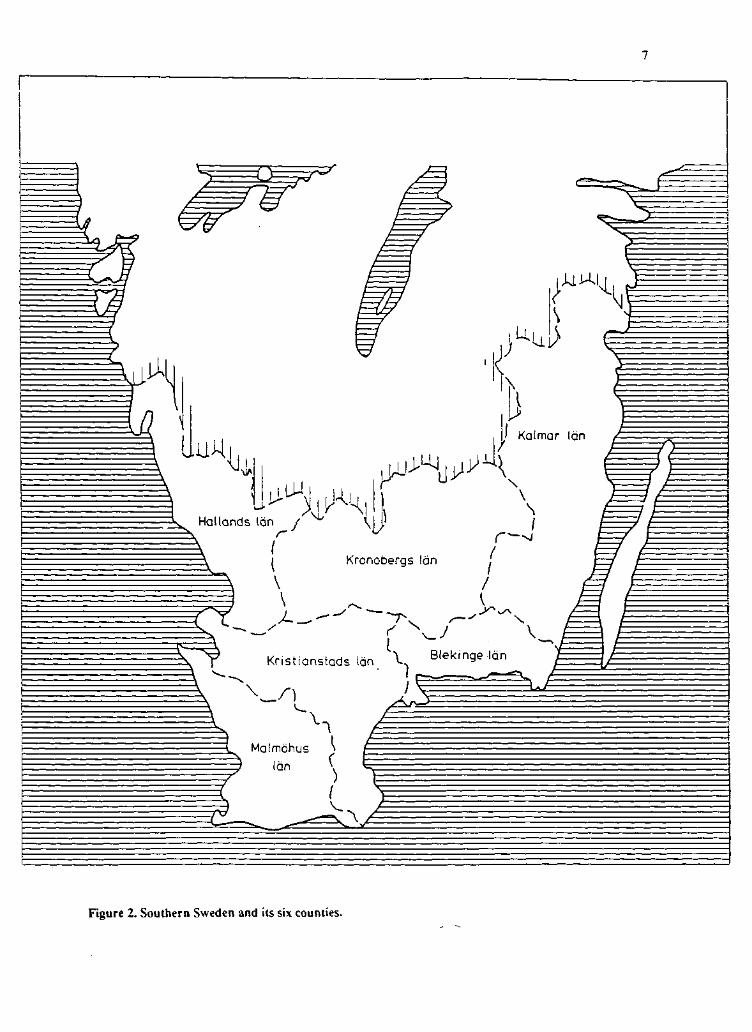
Therefore, in the present study, Southern Sweden has been defined as the sixsouthernmost counties (Malmohus, Kristianstads, Hallands, Blekinge, Krono-bergs and Kalmar counties). The reason for picking out just these six, is thatthey are the southernmost counties "bordering" more or less to present ECcountries (figure 2). There is an increasing amount of cooperation between thesecounties in matters such as regional development projects public transport, etc.Recent discussion have been held on the issue of creating some kind of"Regional Parliament" including at least two and possibly more of the sixcounties.
It could, of course, be argued that the northern parts of Hallands and Kalmarcounties should not belong to "Southern" but rather to "Mid" Sweden. Again,such a delimitation would be possible by using municipalities or labour-marketregions instead of counties, but due to Swedish data security regulations, a suf-ficiently detailed classification of industries would then in some cases be-comeimpossible.
For the purpose of this study, however, the exact definition of the region is notcrucial. It should, therefore, not cause any analytical or other problems.
Thus defined, Southern Sweden had in 1988 a population of 1,857,336, or al-most exactly 22% of Sweden's total population. More than half of this popula-tion (slightly over one million) lives in Skane (Malmohus and Kristianstadscounties).
Tables 2 to 4 will give a rough picture of the structure of employment in theregion.
Kristianstads Idn V Biekingeldn1
Figure 2. Southern Sweden and its six counties.
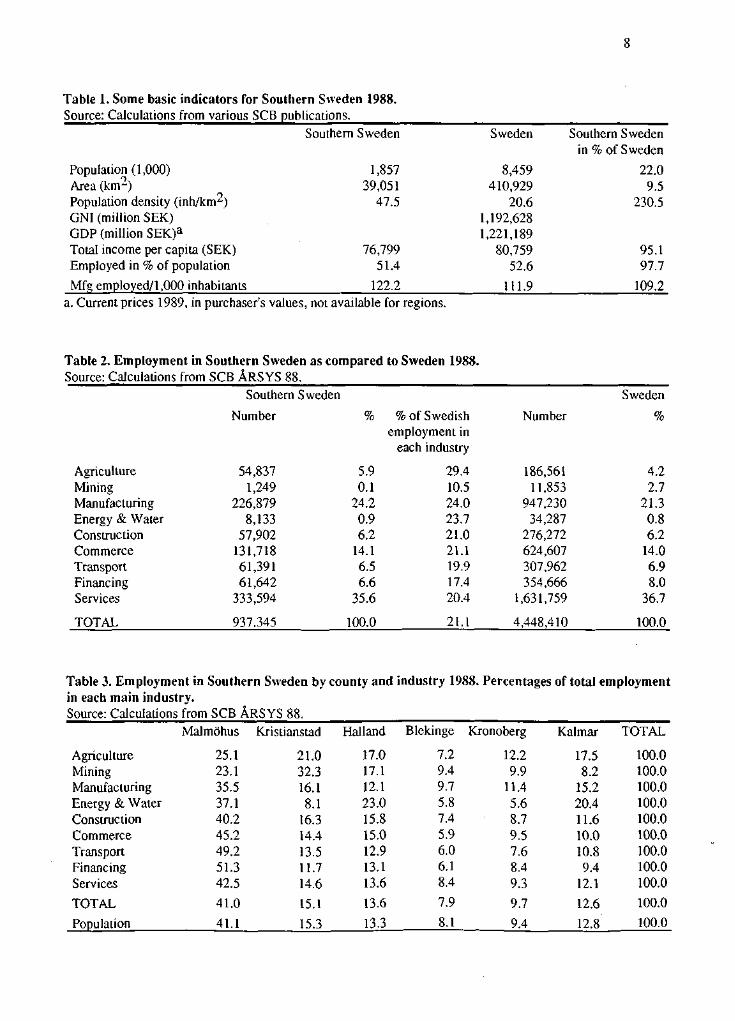
Table 1. Some basic indicators for Southern Sweden 1988.Source: Calculations from various SCB publications.
Population (1,000)Area (km2)Population density (inh/km2)GNI (million SEK)GDP (million SEK)a
Total income per capita (SEK)Employed in % of population
Mfg employed/1,000 inhabitants
Southern Sweden
1,85739,051
47.5
76,79951.4
122.2
Sweden
8,459410,929
20.61,192,6281,221,189
80,75952.6
111.9
Southern Swedenin % of Sweden
22.09.5
230.5
95.197.7
109.2a. Current prices 1989, in purchaser's values, not available for regions.
Table 2. Employment in Southern Sweden as compared to Sweden 1988.Source: Calculations from SCB ARSYS 88.
AgricultureMiningManufacturingEnergy & WaterConstructionCommerceTransportFinancingServices
TOTAL
Southern Sweden
Number
54,8371,249
226,8798,133
57,902131,71861,39161,642
333,594
937.345
%
5.90.1
24.20.96.2
14.16.56.6
35.6
100.0
% of Swedishemployment in
each industry
29.410.524.023.721.021.119.917.420.4
21.1
Number
186,56111,853
947,23034,287
276,272624,607307,962354,666
1,631,759
4,448,410
Sweden
%
4.22.7
21.30.86.2
14.06.98.0
36.7
100.0
Table 3. Employment in Southern Sweden by county and industry 1988. Percentages of total employmentin each main industry.Source: Calculations from SCB ARSYS 88.
AgricultureMiningManufacturingEnergy & WaterConstructionCommerceTransportFinancingServices
TOTAL
Population
Malmohus
25.123.135.537.140.245.249.251.342.5
41.0
41.1
Kristianstad
21.032.316.18.1
16.314.413.511.714.6
15.1
15.3
Halland
17.017.112.123.015.815.012.913.113.6
13.6
13.3
Blekinge
7.29.49.75.87.45.96.06.18.4
7.9
8.1
Kronoberg
12.29.9
11.45.68.79.57.68.49.3
9.7
9.4
Kalmar
17.58.2
15.220.411.610.010.89.4
12.1
12.6
12.8
TOTAL
100.0100.0100.0100.0100.0100.0100.0100.0100.0
100.0
100.0
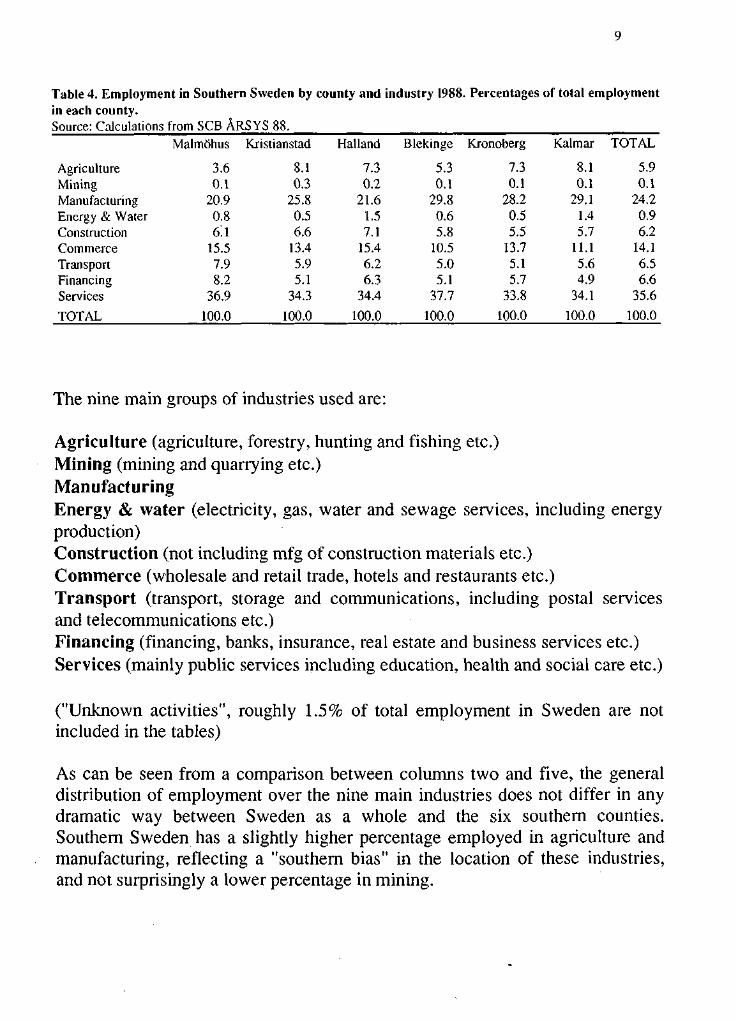
Table 4. Employment in Southern Sweden by county and industry 1988. Percentages of total employmentin each county.Source: Calculations from SCB ARSYS 88.
AgricultureMiningManufacturingEnergy & WaterConstructionCommerceTransportFinancingServices
TOTAL
Malmohus
3.60.1
20.90.86.1
15.57.98.2
36.9
100.0
Kristianstad
8.10.3
25.80.56.6
13.45.95.1
34.3
100.0
Halland
7.30.2
21.61.57.1
15.46.26.3
34.4
100.0
Blekinge
5.30.1
29.80.65.8
10.55.05.1
37.7
100.0
Kronoberg
7.30.1
28.20.55.5
13.75.15.7
33.8
100.0
Kalmar
8.10.1
29.11.45.7
11.15.64.9
34.1
100.0
TOTAL
5.90.1
24.20.96.2
14.16.56.6
35.6
100.0
The nine main groups of industries used are:
Agriculture (agriculture, forestry, hunting and fishing etc.)Mining (mining and quarrying etc.)ManufacturingEnergy & water (electricity, gas, water and sewage services, including energyproduction)Construction (not including mfg of construction materials etc.)Commerce (wholesale and retail trade, hotels and restaurants etc.)Transport (transport, storage and communications, including postal servicesand telecommunications etc.)Financing (financing, banks, insurance, real estate and business services etc.)Services (mainly public services including education, health and social care etc.)
("Unknown activities", roughly 1.5% of total employment in Sweden are notincluded in the tables)
As can be seen from a comparison between columns two and five, the generaldistribution of employment over the nine main industries does not differ in anydramatic way between Sweden as a whole and the six southern counties.Southern Sweden has a slightly higher percentage employed in agriculture andmanufacturing, reflecting a "southern bias" in the location of these industries,and not surprisingly a lower percentage in mining.
10
Table 3 shows the percentage shares of Southern Sweden's employment for eachcounty and main industry. As can be seen, total employment roughly follows thedistribution of population, and consequently, for most industries, a major shareof employment is found in Malmohus and Kristianstad counties. This southernbias within the region is especially pronounced for construction, transport,commerce and financing.
The structural differences between the counties are more evident from table 4,showing the distribution of employment in each of the six counties. Whilemanufacturing industry has the highest percentage of employment in Blekinge,Kalmar and Kronoberg, these three together do not have more than approxi-mately 35% of the manufacturing industry employment of the entire region, oralmost exactly the same share as Malmohus county alone.
Similarity, Malmohus county has a low percentage of its employed in agriculturebut still a quarter of the total agricultural employment of Southern Sweden orabout the same share as Kronobergs and Kalmar counties taken together.
Manufacturing Industry in Southern Sweden:Structural Changes 1970-1987
The aim of this section is to present a brief and comprehensive analysis of SouthSwedish manufacturing industry, its structure and development during the lasttwo decades.
In "traditional" analyses, industry is usually classified and grouped after thetypes of goods produced, but here another principle is used, where classificationis based on factor intensities and competition. Thus it is possible to carry out amore dynamic analysis of both growth potentials and competitiveness. The mainprinciples of this classification are outlined below.
The analysis is based upon a large and detailed statistical material. In its presentcontext it will only be given a limited presentation and comment. The mainambition here is to focus and clarify certain general and important characteristicsof the industrial structure and its changes.
Another aim is to relate industrial structure in this region to a wider regional andnational context. The analysis therefore starts off at the national level.
11
Comparisons are also made with the Stockholm and Gothenburg regions. WithinSouthern Sweden the Malmo region is treated separately. The main reason forthis is that these three "metropolitan" areas differ considerably from the rest ofthe country.
Employment figures are used throughout as a measure of industrial change. Thisis by no means undisputable. A firm or an industry may show a positive deve-lopment without increasing its employment and, conversely, increasing employ-ment is not always a sign of positive development. The main, but not the only,reason for using employment as a measure is that other economic data are notalways available at a regional level.
STATISTICAL BASIS
The study is based on employment figures from official Industrial Statisticsproduced by the Central Bureau of Statistics for the years 1970, 1980, 1985 and1987. Work places with less than five employees are excluded.
Swedish Industrial Statistics are based on the so-called SNI system, by which allwork places are given a code after its main type of production. The degree ofdetail varies. In most cases it is sufficiently precise for the purpose of thisanalysis, but in others clearly less than satisfactory. This in turn affects thepossible analytical precision.
As an example of the latter situation, it may be mentioned that the SNI systemdoes not make a distinction between such diverse products as cars, buses, andarmoured fighting vehicles!
Another problem arises when a plant manufactures products belonging to morethan one SNI code. In such cases, the entire work place is coded after the mainproduct, i.e. the product which has the largest employment. In effect, this means,that the rest of the employment is given the "wrong" SNI code. It should also bementioned, that the SNI system is not always fully compatible with the classifi-cation used later in the German part of this study.
ANALYTICAL METHOD: SECTORS AND SUB SECTORS
Industry is divided into five main sectors and a number of sub sectors, accordingto their main factors of production and their international competition char-acteristics. In addition to classical factors (Labour and Capital) two "new" ones
12
are defined: technological Knowledge/skill and Research and Development(R&D)2
It is not possible here to give a full description of the delimitation and content ofthe sectors, so the following presentation is limited to main principles andexamples of the types of industry belonging to each sector. The general develop-ment tendencies for the five main sectors are also discussed briefly. A moredetailed description of the classification system is given in appendix 1, includingthe different sub sectors. In the following presentation of the data emphasis willbe put on development at the sectoral level.
"Sheltered" industry (S-sector) includes parts of food, wood, and buildingmaterials industries. It is delimited by its actual exposure to international compe-tition (export should be less than 10% of total production and import less than10%. of total domestic consumption), not primarily by formal limits to compe-tition. Thus the S-sector also includes industries, which are "protected" by theirreliance on a national or even regional market. Examples from this category maybe found in building materials industry and in the food industry. It is not selfevident how, or even if, these industries will be affected by a Swedish ECmembership, especially in a short perspective. Parts of the building industrymay, for instance, "enjoy" continued protection not only from nationaldifferences in technical standards, but also from national building traditions. Onthe other hand, those S-sector industries that are now protected by formal re-strictions and subsidies, will undoubtedly experience much harder competitionas a result of Swedish EC membership. This will especially affect the food in-dustry as a consequence of changes in agricultural policy.
A general prediction is that Sheltered industry employment as a whole will con-tinue to decrease, probably at an even higher pace than before. It is important toemphasize, that tougher competition will affect different sub sectors in differentways. In a longer perspective, the consequences may not be singularly negative.
Labour intensive industry (L-sector) as opposed to Capital intensive industry,employs a large number of (blue-collar or unskilled) workers. It is composedmainly of parts of food and wood industries, and two other mixed groups ofindustry which face competition mainly from other industrial countries or fromdeveloping countries. A similar prediction can be made for the L-sector as forthe S-sector, although it is already exposed to international competition. Thecontractive impulses stem partly from remaining low-wage countries and regions
^ English terminology for the classification scheme used here is based on Ohlsson, L: Industry and EC.Federation of Swedish Industries 1988.
fur Weltwirtschaft Kiel13
within the EC, although differences in wage levels can be expected to graduallywither away, and partly from Eastern Europe. The latter impulses may not beimportant in the nearest future, and will probably be most noticeable in certainlow and medium technology industries.
Capital intensive industry (C-sector) is, as the name implies, characterised byits comparatively high capital input. It comprises the "traditional", heavy pri-mary industry. Its future development is difficult to foresee. A strong raw ma-terials orientation, dependence on international raw material prices and highexport orientation make it highly dependant on business cycles in other indu-strial countries. The C-sector can hardly be expected to expand its employment,because its competitiveness is based on a high and probably increasing capitalintensity.
The Knowledge intensive industry (K-sector) includes industries with a highpercentage of engineers and other qualified technicians. Examples of these in-clude consumer durable goods and investment goods industries.
The R&D intensive R-sector industries have a high percentage of employeeswith a formal scientific education and comparatively high R&D costs. The R-sector is subdivided into two groups, one mainly electronics-based and the othercomprising pharmaceuticals, electric equipment and aircraft production.
In the K- and R-sectors, Sweden has certain comparative advantages due to awage structure with relatively small differences between highly educated andless qualified categories. This is one reason why continued growth should beexpected at least in parts of these two sectors. Another reason is that both sec-tors, almost by definition, have inherent growth potential stemming from the factthat high investments in technical competence and R&D usually result in a highoutput of new products and new production technology. In other words, theseindustries have the necessary prerequisites to remain at the expansive end of theproduct life cycle for a longer period than others.
It would be false to say that there are no problems facing the K- and R-sectorindustries. For one thing, the comparative advantages created by Swedish wagerelations may very well be of a temporary nature. It is also a well-documentedfact that Swedish industry, in spite of its high investments in R&D, has provedless capable of implementing the results into domestic production. Instead, therehas been an increasing export of technology in the form of patents, productionlicenses etc. Several explanations have been put forward; one is a lack ofventure capital mainly during the 1980s, another is an almost permanent lack ofhighly educated personnel.
8.026.914.227.920.12.9 ~
100.0
10.129.015.723.219.32.7
100.0
11.630.314.222.618.72.5
100.0
11.330.713.922.319.02.8
100.0
)80
1.80.10.32.21.00.6
1980-1987
0.1-0.7-2.9-1.9-1.6-1.5
14
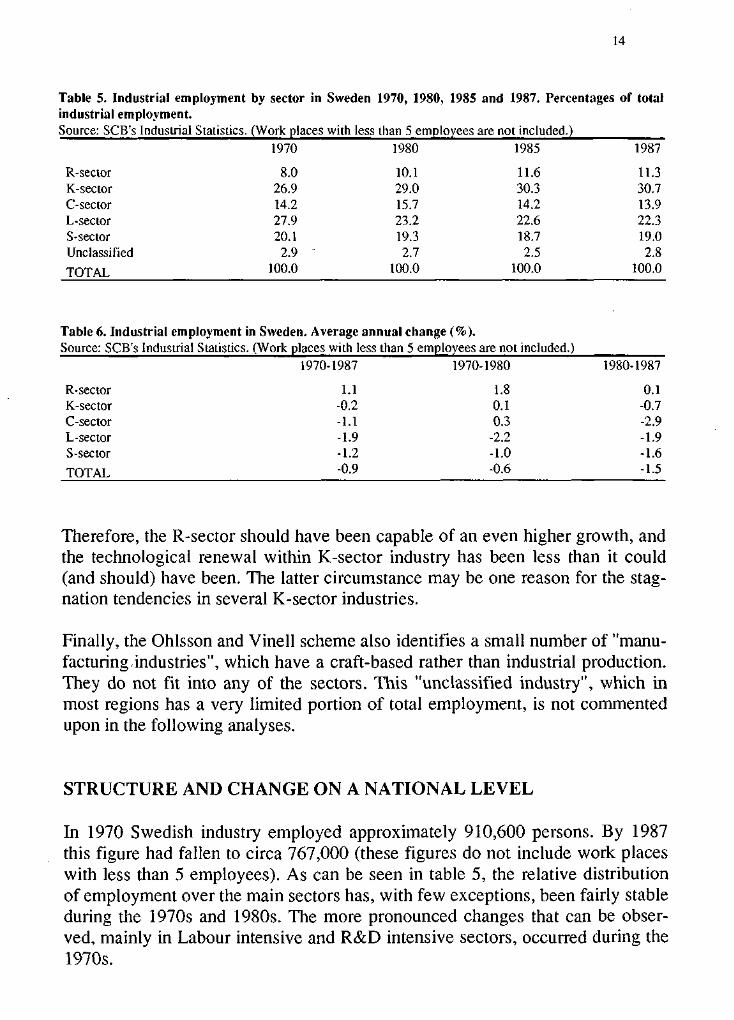
Table 5. Industrial employment by sector in Sweden 1970, 1980, 1985 and 1987. Percentages of totalindustrial employment.Source: SCB's Industrial Statistics. (Work places with less than 5 employees are not included.)
1970 1980 1985 1987
R-sectorK-sectorC-sectorL-sectorS-sectorUnclassified
TOTAL
Table 6. Industrial employment in Sweden. Average annual change (%).Source: SCB's Industrial Statistics. (Work places with less than 5 employees are not included.)
1970-1987 19"/
R-sector 1.1K-sector -0.2C-sector -1.1L-sector -1.9S-sector -1.2
TOTAL "°-9
Therefore, the R-sector should have been capable of an even higher growth, andthe technological renewal within K-sector industry has been less than it could(and should) have been. The latter circumstance may be one reason for the stag-nation tendencies in several K-sector industries.
Finally, the Ohlsson and Vinell scheme also identifies a small number of "manu-facturing-industries", which have a craft-based rather than industrial production.They do not fit into any of the sectors. This "unclassified industry", which inmost regions has a very limited portion of total employment, is not commentedupon in the following analyses.
STRUCTURE AND CHANGE ON A NATIONAL LEVEL
In 1970 Swedish industry employed approximately 910,600 persons. By 1987this figure had fallen to circa 767,000 (these figures do not include work placeswith less than 5 employees). As can be seen in table 5, the relative distributionof employment over the main sectors has, with few exceptions, been fairly stableduring the 1970s and 1980s. The more pronounced changes that can be obser-ved, mainly in Labour intensive and R&D intensive sectors, occurred during the1970s.
15
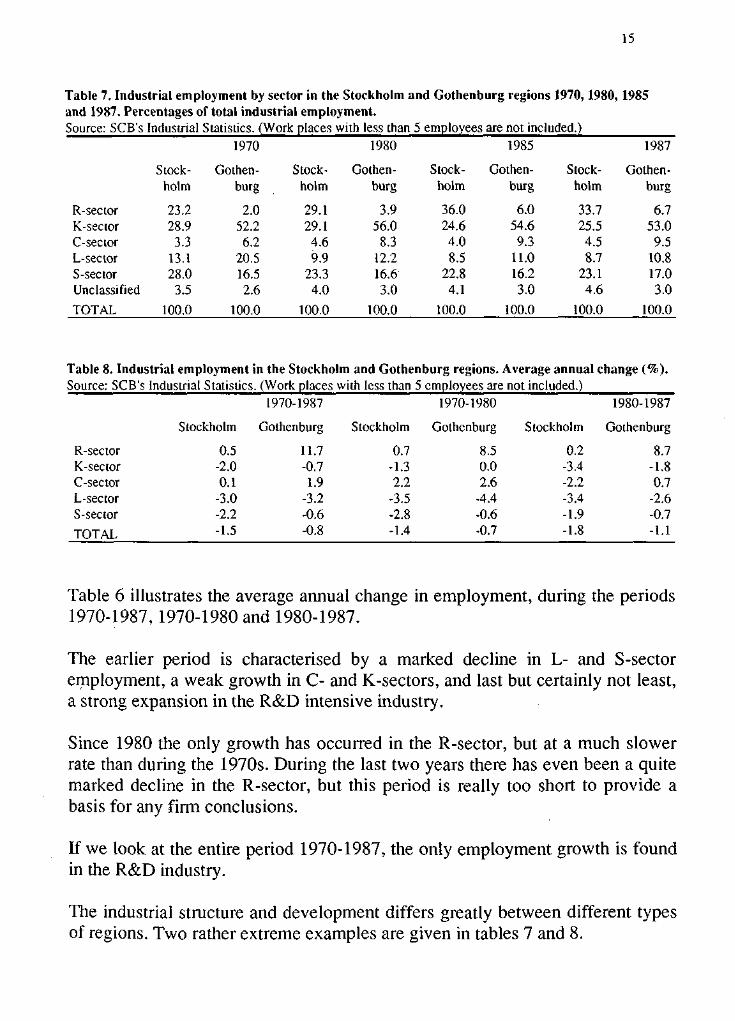
Table 7. Industrial employment by sector in the Stockholm and Gothenburg regions 1970,1980, 1985and 1987. Percentages of total industrial employment.Source: SCB's Industrial Statistics. (Work places with less than 5 employees are not included.)
R-sectorK-sectorC-sectorL-sectorS-sectorUnclassified
TOTAL
Stock-holm
23.228.9
3.313.128.0
3.5
100.0
1970
Gothen-burg
2.052.2
6.220.516.52.6
100.0
Stock-holm
29.129.1
4.69.9
23.34.0
100.0
1980
Gothen-burg
3.956.0
8.312.216.63.0
100.0
Stock-holm
36.024.64.08.5
22.84.1
100.0
1985
Gothen-burg
6.054.6
9.311.016.23.0
100.0
Stock-holm
33.725.54.58.7
23.14.6
100.0
1987
Gothen-burg
6.753.0
9.510.817.03.0
100.0
Table 8. Industrial employment in the Stockholm and Gothenburg regions. Average annual change (%).Source: SCB's Industrial Statistics. (Work places with less than 5 employees are not included.)
R-sectorK-sectorC-sectorL-sectorS-sector
TOTAL
Stockholm
0.5-2.00.1
-3.0-2.2-1.5
1970-1987
Gothenburg
11.7-0.71.9
-3.2-0.6-0.8
Stockholm
0.7-1.32.2
-3.5-2.8-1.4
1970-1980
Gothenburg
8.50.02.6
-4.4-0.6-0.7
Stockholm
0.2-3.4-2.2-3.4-1.9-1.8
1980-1987
Gothenburg
8.7-1.80.7
-2.6-0.7-1.1
Table 6 illustrates the average annual change in employment, during the periods1970-1987, 1970-1980 and 1980-1987.
The earlier period is characterised by a marked decline in L- and S-sectoremployment, a weak growth in C- and K-sectors, and last but certainly not least,a strong expansion in the R&D intensive industry.
Since 1980 the only growth has occurred in the R-sector, but at a much slowerrate than during the 1970s. During the last two years there has even been a quitemarked decline in the R-sector, but this period is really too short to provide abasis for any firm conclusions.
If we look at the entire period 1970-1987, the only employment growth is foundin the R&D industry.
The industrial structure and development differs greatly between different typesof regions. Two rather extreme examples are given in tables 7 and 8.
16
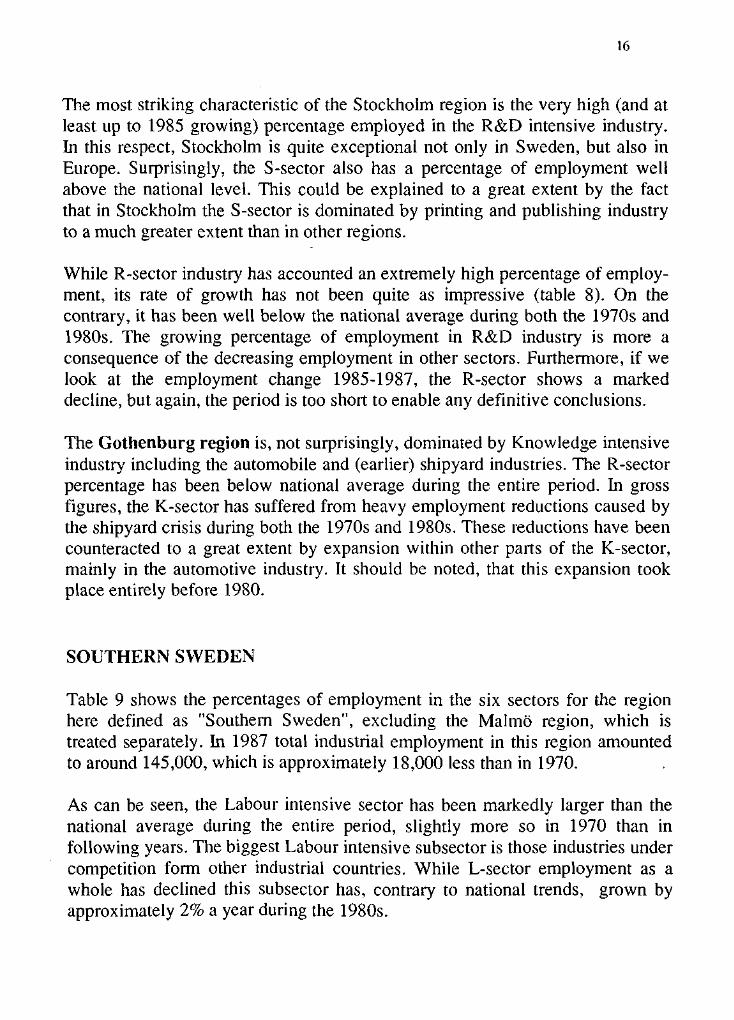
The most striking characteristic of the Stockholm region is the very high (and atleast up to 1985 growing) percentage employed in the R&D intensive industry.In this respect, Stockholm is quite exceptional not only in Sweden, but also inEurope. Surprisingly, the S-sector also has a percentage of employment wellabove the national level. This could be explained to a great extent by the factthat in Stockholm the S-sector is dominated by printing and publishing industryto a much greater extent than in other regions.
While R-sector industry has accounted an extremely high percentage of employ-ment, its rate of growth has not been quite as impressive (table 8). On thecontrary, it has been well below the national average during both the 1970s and1980s. The growing percentage of employment in R&D industry is more aconsequence of the decreasing employment in other sectors. Furthermore, if welook at the employment change 1985-1987, the R-sector shows a markeddecline, but again, the period is too short to enable any definitive conclusions.
The Gothenburg region is, not surprisingly, dominated by Knowledge intensiveindustry including the automobile and (earlier) shipyard industries. The R-sectorpercentage has been below national average during the entire period. In grossfigures, the K-sector has suffered from heavy employment reductions caused bythe shipyard crisis during both the 1970s and 1980s. These reductions have beencounteracted to a great extent by expansion within other parts of the K-sector,mainly in the automotive industry. It should be noted, that this expansion tookplace entirely before 1980.
SOUTHERN SWEDEN
Table 9 shows the percentages of employment in the six sectors for the regionhere defined as "Southern Sweden", excluding the Malmo region, which istreated separately. In 1987 total industrial employment in this region amountedto around 145,000, which is approximately 18,000 less than in 1970.
As can be seen, the Labour intensive sector has been markedly larger than thenational average during the entire period, slightly more so in 1970 than infollowing years. The biggest Labour intensive subsector is those industries undercompetition form other industrial countries. While L-sector employment as awhole has declined this subsector has, contrary to national trends, grown byapproximately 2% a year during the 1980s.
3.125.0
8.939.821.4
1.8
4.627.310.134.622.1
1.5
4.528.1
9.934.622.0
0.9
4.928.0
9.934.122.4
0.8
)80
4.30.61.01.50.0
1980-1987
-0.2-0.8-1.3-1.3-0.9
17
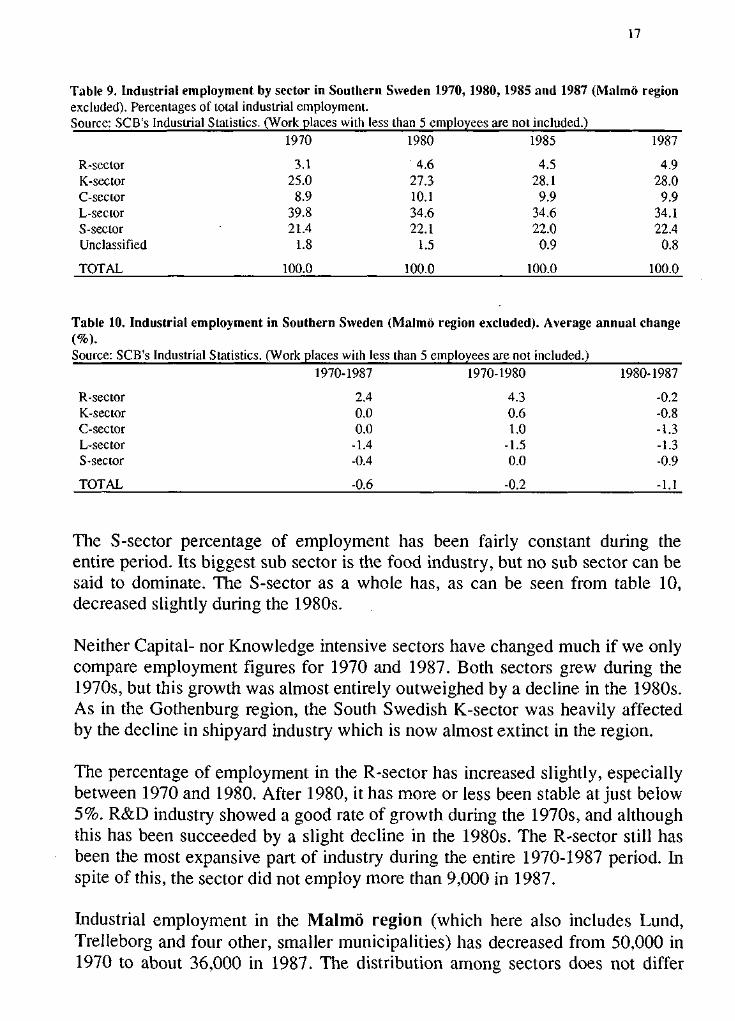
Table 9. Industrial employment by sector in Southern Sweden 1970, 1980, 1985 and 1987 (Malmo regionexcluded). Percentages of total industrial employment.Source: SCB's Industrial Statistics. (Work places with less than 5 employees are not included.)
1970 1980 1985 1987
R-sectorK-sectorC-sectorL-sectorS-sectorUnclassified
TOTAL 100.0 100.0 100.0 100.0
Table 10. Industrial employment in Southern Sweden (Malmo region excluded). Average annual change(%)•Source: SCB's Industrial Statistics. (Work places with less than 5 employees are not included.)
1970-1987 197
R-sector 2.4K-sector 0.0C-sector 0.0L-sector -1.4S-sector -0.4
TOTAL -0.6 -0.2 -1.1
The S-sector percentage of employment has been fairly constant during theentire period. Its biggest sub sector is the food industry, but no sub sector can besaid to dominate. The S-sector as a whole has, as can be seen from table 10,decreased slightly during the 1980s.
Neither Capital- nor Knowledge intensive sectors have changed much if we onlycompare employment figures for 1970 and 1987. Both sectors grew during the1970s, but this growth was almost entirely outweighed by a decline in the 1980s.As in the Gothenburg region, the South Swedish K-sector was heavily affectedby the decline in shipyard industry which is now almost extinct in the region.
The percentage of employment in the R-sector has increased slightly, especiallybetween 1970 and 1980. After 1980, it has more or less been stable at just below5%. R&D industry showed a good rate of growth during the 1970s, and althoughthis has been succeeded by a slight decline in the 1980s. The R-sector still hasbeen the most expansive part of industry during the entire 1970-1987 period. Inspite of this, the sector did not employ more than 9,000 in 1987.
Industrial employment in the Malmo region (which here also includes Lund,Trelleborg and four other, smaller municipalities) has decreased from 50,000 in1970 to about 36,000 in 1987. The distribution among sectors does not differ
2.029.9
5.829.729.2
3.4
4.831.5
6.223.930.9
2.6
7.128.64.9
25.331.82.3
6.928.3
5.625.031.52.7
980
10.0-1.2-1.1-3.3-1.2
1980-1987
3.4-3.2-3.3-1.4-1.7
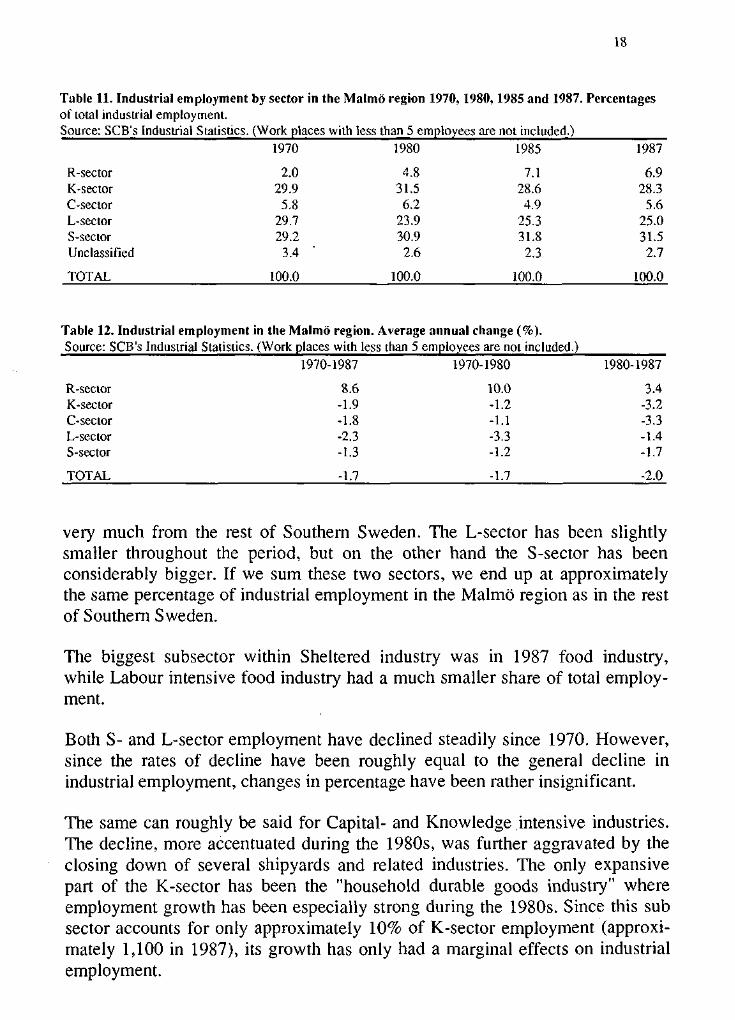
18
Table 11. Industrial employment by sector in the Malmo region 1970, 1980,1985 and 1987. Percentagesof total industrial employment.Source: SCB's Industrial Statistics. (Work places with less than 5 employees are not included.)
1970 1980 1985 1987
R-sectorK-sectorC-sectorL-sectorS-sectorUnclassified
TOTAL 100.0 100.0 100.0 100.0
Table 12. Industrial employment in the Malmo region. Average annual change (%).Source: SCB's Industrial Statistics. (Work places with less than 5 employees are not included.)
1970-1987 19
R-sector 8.6K-sector -1.9C-sector -1.8L-sector -2.3S-sector -1.3
TOTAL -1.7 -1.7 -2.0
very much from the rest of Southern Sweden. The L-sector has been slightlysmaller throughout the period, but on the other hand the S-sector has beenconsiderably bigger. If we sum these two sectors, we end up at approximatelythe same percentage of industrial employment in the Malmo region as in the restof Southern Sweden.
The biggest subsector within Sheltered industry was in 1987 food industry,while Labour intensive food industry had a much smaller share of total employ-ment.
Both S- and L-sector employment have declined steadily since 1970. However,since the rates of decline have been roughly equal to the general decline inindustrial employment, changes in percentage have been rather insignificant.
The same can roughly be said for Capital- and Knowledge intensive industries.The decline, more accentuated during the 1980s, was further aggravated by theclosing down of several shipyards and related industries. The only expansivepart of the K-sector has been the "household durable goods industry" whereemployment growth has been especially strong during the 1980s. Since this subsector accounts for only approximately 10% of K-sector employment (approxi-mately 1,100 in 1987), its growth has only had a marginal effects on industrialemployment.
19
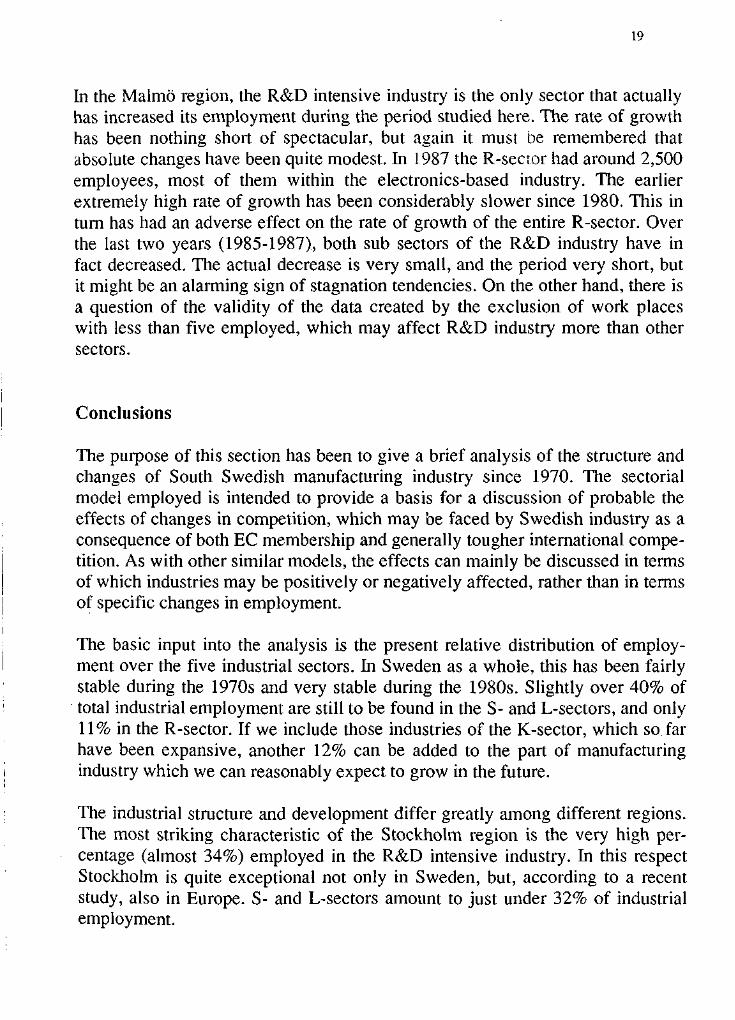
In the Malmo region, the R&D intensive industry is the only sector that actuallyhas increased its employment during the period studied here. The rate of growthhas been nothing short of spectacular, but again it must be remembered thatabsolute changes have been quite modest. In 1987 the R-secror had around 2,500employees, most of them within the electronics-based industry. The earlierextremely high rate of growth has been considerably slower since 1980. This inturn has had an adverse effect on the rate of growth of the entire R-sector. Overthe last two years (1985-1987), both sub sectors of the R&D industry have infact decreased. The actual decrease is very small, and the period very short, butit might be an alarming sign of stagnation tendencies. On the other hand, there isa question of the validity of the data created by the exclusion of work placeswith less than five employed, which may affect R&D industry more than othersectors.
Conclusions
The purpose of this section has been to give a brief analysis of the structure andchanges of South Swedish manufacturing industry since 1970. The sectorialmodel employed is intended to provide a basis for a discussion of probable theeffects of changes in competition, which may be faced by Swedish industry as aconsequence of both EC membership and generally tougher international compe-tition. As with other similar models, the effects can mainly be discussed in termsof which industries may be positively or negatively affected, rather than in termsof specific changes in employment.
The basic input into the analysis is the present relative distribution of employ-ment over the five industrial sectors. In Sweden as a whole, this has been fairlystable during the 1970s and very stable during the 1980s. Slightly over 40% oftotal industrial employment are still to be found in the S- and L-sectors, and only11 % in the R-sector. If we include those industries of the K-sector, which so farhave been expansive, another 12% can be added to the part of manufacturingindustry which we can reasonably expect to grow in the future.
The industrial structure and development differ greatly among different regions.The most striking characteristic of the Stockholm region is the very high per-centage (almost 34%) employed in the R&D intensive industry. In this respectStockholm is quite exceptional not only in Sweden, but, according to a recentstudy, also in Europe. S- and L-sectors amount to just under 32% of industrialemployment.
20
The Gothenburg region is dominated by Knowledge intensive industry, with53% of the industrial employment. This, in turn is dominated by the automobileindustry. The R-sector percentage has been below national average during theentire period. The S- and L-sectors at approximately 28% are even smaller thanin the Stockholm region.
In Southern Sweden, excluding the Malmo region, the Labour intensiveindustry has been markedly above national average during the entire period. In1987 it comprised 34% of total industrial employment. Its dominant subsectorcontains industries under competition from other industrial countries. While L-sector employment as a whole has declined, this subsector has grown byapproximately 2% a year during the 1980s. This may indicate, that at least thispart of the South Swedish L-sector will also have better prospects for the future.
The S-sector percentage of employment has been fairly constant during the last20 years. S- and L-sectors today constitute just over 56% of the region's indust-rial employment.
Although South Swedish K-industry was negatively affected by the decline inshipbuilding, it still had 28% of employment in 1987. R&D industry showed agood rate of growth during the 1970s, although this has been followed by aslight decline in the 1980s. Seen over the entire twenty years period the R-sectorstill remains the most expansive part of industry. In spite of this, the sector onlyemployed 5% in 1987.
Industrial employment in the Malmo region does not differ very much struc-turally from the rest of Southern Sweden. The L- and S-sectors together add upto approximately the same percentage of employment as in the rest of SouthernSweden.
The changes in Capital- and Knowledge intensive industries have also beenmoderate. The only expansive part of the K-sector has been the "householddurable goods industry", especially during the 1980s. Since this subsector onlyaccounts for approximately 10% of K-sector employment, its growth has had amarginal effect on total employment.
In the Malmo region, as in the rest of Southern Sweden, R&D intensive industryis the only sector that actually has increased its employment during the periodstudied. The rate of growth has been spectacular, but absolute changes havebeen quite modest. Furthermore, over the last two years (1985-1987), both sub-sectors of the R&D industry have, in fact, decreased. This might be interpreted
21
as a sign of stagnation. The same tendencies can be seen in Swedish R&D inten-sive industry as a whole.
A general assumption is, that the "Sheltered" and Labour intensive industrieswill face greater difficulties than the rest of the manufacturing industry inadjusting to tougher international competition. To some extent the S-industrieswill loose their "protection" and have to face a competitive situation to whichthey are not accustomed, and perhaps not prepared. Those S-sector industriesthat are now protected by formal restrictions and subsidies, will undoubtedlyexperience a much harder competition as a result of a Swedish EC membership.Since the S-sector also includes industries which have been and in all proba-bility will continue to be sheltered by their reliance on a domestic market, it isnot clear how these industries will be affected by a Swedish EC membership.
A general prediction therefore is, that Sheltered industry employment as awhole will continue to decrease, probably at a higher rate than before. A point tobe made is that this decline is only partly caused by an EC membership.
Similar predictions can be made for the Labour intensive industry. The contrac-tive impulses stem partly from competition from low-wage countries and regionswithin the EC, partly from Eastern Europe and other low-wage countries in theworld. With more than 55% of its industrial employment in the S- and L-sectors,there is of course a clear risk that Southern Sweden will face greater strain thanthe rest of Sweden, certainly greater than the Gothenburg and Stockholm
regions.
The future of the Capital intensive sector is difficult to foresee. The C-sectorcan, however, hardly be expected to expand its employment.
In the K- and R-sectors, Sweden has, at least until now, had certain compa-rative advantages due to a wage structure with relatively small differencesbetween highly educated and less qualified categories. This is one reason why acontinued growth should be expected in at least parts of these two sectors.Another reason is the fact that high investments in technical competence andR&D usually result in a high output of new products and new production tech-nology, thus creating competitive advantages.
In discussing the Swedish K- and R-sectors it should be remembered that theadvantages are of a potential nature. They probably have not been exploited infull during the last decade. The K-sector has only been partly expansive, and R-sector growth has been insufficient in all but a few metropolitan and/oruniversity regions.
Even though we have good reasons to "believe" in the future competitivenessand growth of K- and R-industries, there is nothing automatic in such positivedevelopment. Furthermore, potentially expansive parts of South Swedish R- andK-industry are so small that even if growth should continue and increase, it ishard to imagine that it will be sufficient to counteract the negative tendencies ofthe much larger S- and L-sectors.
Notes on the Empirical Material
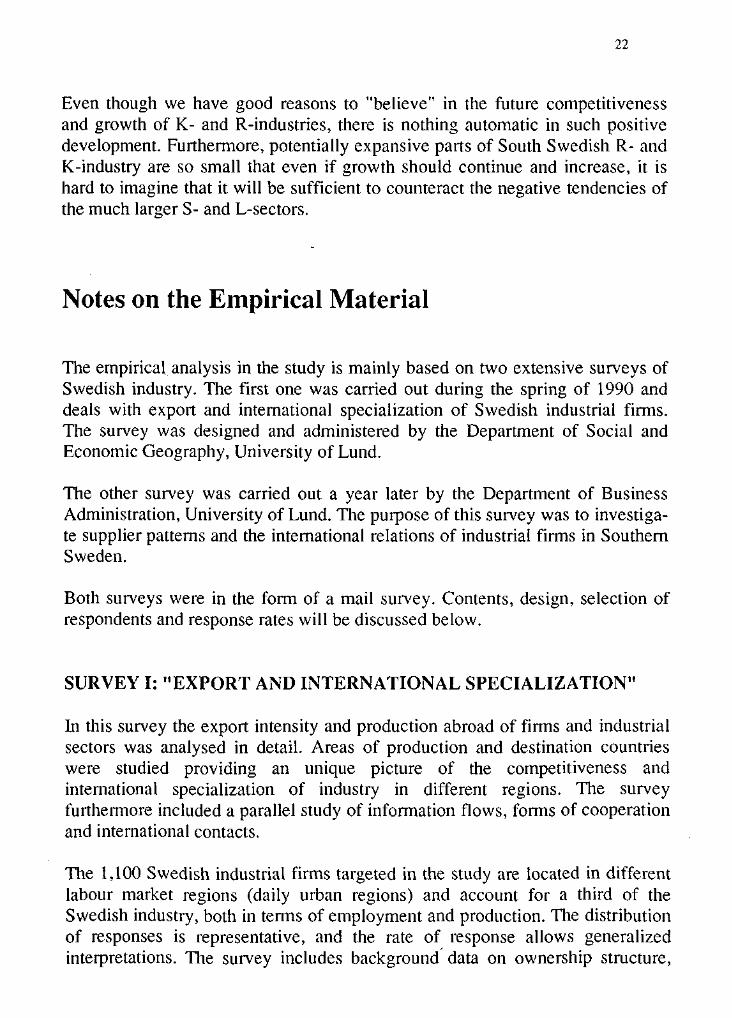
The empirical analysis in the study is mainly based on two extensive surveys ofSwedish industry. The first one was carried out during the spring of 1990 anddeals with export and international specialization of Swedish industrial firms.The survey was designed and administered by the Department of Social andEconomic Geography, University of Lund.
The other survey was carried out a year later by the Department of BusinessAdministration, University of Lund. The purpose of this survey was to investiga-te supplier patterns and the international relations of industrial firms in SouthernSweden.
Both surveys were in the form of a mail survey. Contents, design, selection ofrespondents and response rates will be discussed below.
SURVEY I: "EXPORT AND INTERNATIONAL SPECIALIZATION"
In this survey the export intensity and production abroad of firms and industrialsectors was analysed in detail. Areas of production and destination countrieswere studied providing an unique picture of the competitiveness andinternational specialization of industry in different regions. The surveyfurthermore included a parallel study of information flows, forms of cooperationand international contacts.
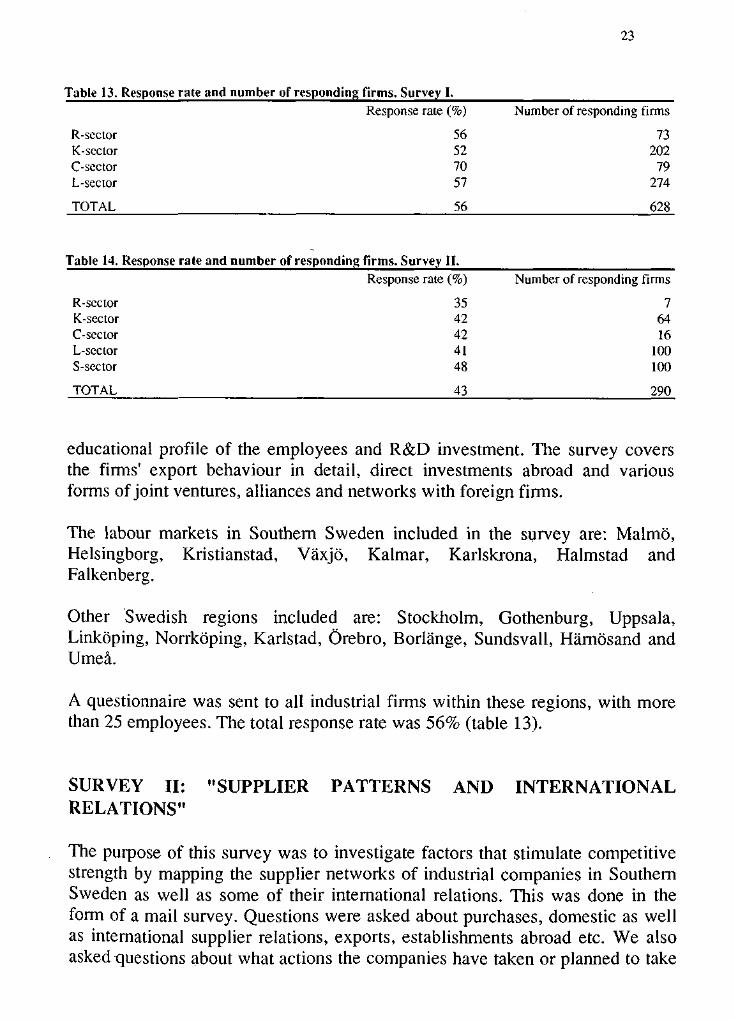
The 1,100 Swedish industrial firms targeted in the study are located in differentlabour market regions (daily urban regions) and account for a third of theSwedish industry, both in terms of employment and production. The distributionof responses is representative, and the rate of response allows generalizedinterpretations. The survey includes background data on ownership structure,
23
Table 13. Response rate and number of responding firms. Survey I.Response rate (%) Number of responding firms
R-sector 56 73K-sector 52 202C-sector 70 79L-sector 57 274
TOTAL 56 628
Table 14. Response rate and number of responding firms. Survey II.Response rate (%) Number of responding firms
R-scctor 35 7K-sector 42 64C-sector 42 16L-sector 41 100S-sector 48 100
TOTAL 43 290
educational profile of the employees and R&D investment. The survey coversthe firms' export behaviour in detail, direct investments abroad and variousforms of joint ventures, alliances and networks with foreign firms.
The labour markets in Southern Sweden included in the survey are: Malmo,Helsingborg, Kristianstad, Vaxjo, Kalmar, Karlskrona, Halmstad andFalkenberg.
Other Swedish regions included are: Stockholm, Gothenburg, Uppsala,Linkoping, Norrkoping, Karlstad, Orebro, Borlange, Sundsvall, Harnosand andUmea.
A questionnaire was sent to all industrial firms within these regions, with morethan 25 employees. The total response rate was 56% (table 13).
SURVEY II: "SUPPLIER PATTERNS AND INTERNATIONALRELATIONS"
The purpose of this survey was to investigate factors that stimulate competitivestrength by mapping the supplier networks of industrial companies in SouthernSweden as well as some of their international relations. This was done in theform of a mail survey. Questions were asked about purchases, domestic as wellas international supplier relations, exports, establishments abroad etc. We alsoasked questions about what actions the companies have taken or planned to take
24
because of the economic and political events within the EC and in EasternEurope. The questionnaire was designed in close cooperation with researchersfrom the Department of Social and Economic Geography in order to comple-ment and allow comparison with their survey.
Questionnaires were sent to all industrial companies with more than 20employees in six counties in Southern Sweden: Malmohus, Kristianstad,Blekinge, Kronoberg, Kalmar and Halland. This amounted to a total of 673companies. The questionnaires were sent out in February, 1991. The finalresponse rate was 43% (290 companies). There were some differences inresponse rate among the industrial sectors. For companies belonging to the fourcompeting sectors the response rate was 40%, while the companies in theSheltered sector had a response rate of 48% (table 14).
The analysis of these survey results was based on the same categorization of thecompanies into different industrial sectors, as the first survey.
Export Intensities and Geographical Distribution
This chapter deals only with the competition exposed sectors of Swedishindustry exposed to competition. The Sheltered manufacturing sector, thatexports a very small fraction of its production, is not included in the followinganalysis.3
Export intensity is defined as the percentage of the different sectors' domesticproduction that is exported to foreign countries.
The competitiveness of a manufacturing sector in a specific region is defined asits export intensity compared to the corresponding national performance of thatsector. Thus a sector in a specific region with an export intensity that is higherthan the national sector's is said to have comparative advantage for that pro-duction. This revealed comparative advantage is assumed to depend partly onfactor advantages in the region.
Stockholm, Gothenburg and Malmo are represented by all firms investigated ineach specific region. Southern Sweden (Malmo excluded), Middle Sweden(Stockholm and Gothenburg excluded) and Northern Sweden are represented byfirms from a sample of labour market regions within each part of the country.
This sector is based on "Survey I".

25
The first section of this chapter provides a background for the analytic sectionon the export patterns of manufacturing sectors in various regions that follows. Itdeals with R&D intensities and the concentration of the sectors' R&D emloy-ment and production in various regions. A brief analysis of firm ownership indifferent regions is included. The purpose is to give an idea of the linkagesbetween manufacturing sectors and their "home bases", i.e. their home regions.As mentioned, it is assumed that regional factor qualities of the home-bases areimportant to competitiveness and export intensities.
R&D SHARE, CONCENTRATION OF PRODUCTION AND OWNER-SHIP OF INDUSTRIAL FIRMS IN A REGIONAL PERSPECTIVE
The firms studied vary considerably in regional concentration of different kindsof firm functions. This depends on ownership, regional composition and organi-zation of corporation networks. It also depends on differences in regional qualityand accessibility of factor conditions as well as the firm's sector possession.
Focus is set on the regional concentration of firm functions such as management,R&D and production. Management is always assumed to be located in the firms'home region as it is defined by the SCB (Swedish Bureau of Statistics). Produc-tion of goods and R&D efforts can be managed inside or outside the homeregion to varying degrees.
The R&D level in Swedish industry is one of the highest in the world. Industrialcountries like Japan, West Germany and Great Britain have a lower level. Onthe other hand, Swedish firms have not been successful in their ability to ex-change this high level of R&D into high technology products produced insidethe country.
Even though the national R&D level is high, it varies widely among differentkinds of regions in Sweden. The variation depends on the fact that in general themost R&D intensive industrial sector (R-sector) is concentrated in certain kindsof regions. It is also due to the fact that identical industrial sectors in differentregions show quite a different levels of R&D.
Not surprisingly, the region with the highest level of industrial R&D is found inStockholm. This condition is explained by the high concentration of the R-sectorin the Stockholm region. Other industrial sectors in Stockholm have a lowerR&D levels compared with the national average for these sectors.
26
Table 15. R&D level (share of R&D employees of total employees) of industrial lead sectors in differentSwedish regions.
R-sectorK-sectorC-sectorL-sector
TOTAL
Stockholm
9.67.21.21.1
8.0
Gothenburg
4.010.07.82.3
7.9
Malmo
7.46.92.10.5
2.4
SouthernSweden
3.12.50.80.8
1.2
MiddleSweden
22.14.31.30.7
6.7
NorthernSweden
0.03.00.60.5
1.2
TOTAL
10.37.62.01.1
5.7
Table 16. Share of R&D performed inside the home region of the firm in different industrial lead sectorsand Swedish regions.
R-sectorK-sectorC-sectorL-sector
TOTAL
Stockholm
8884
10067
86
Gothenburg
87978920
92
Malmo
80806272
78
SouthernSweden
40786884
75
MiddleSweden
70915890
73
NorthernSweden
_
916387
83
TOTAL
82948259
85
Table 17. Share of production inside the home region of the firm in different industrial lead sectors andin Swedish regions.
R-sectorK-sectorC-sectorL-sector
TOTAL
Stockholm
37.857.452.136.3
42.8
Gothenburg
33.784.793.424.1
75.3
Malmo
60.790.559.981.8
80.5
SouthernSweden
80.791.536.677.9
69.0
MiddleSweden
45.788.755.183.5
67.2
NorthernSweden
100.096.293.591.7
92.6
TOTAL
40.283.663.865.1
65.8
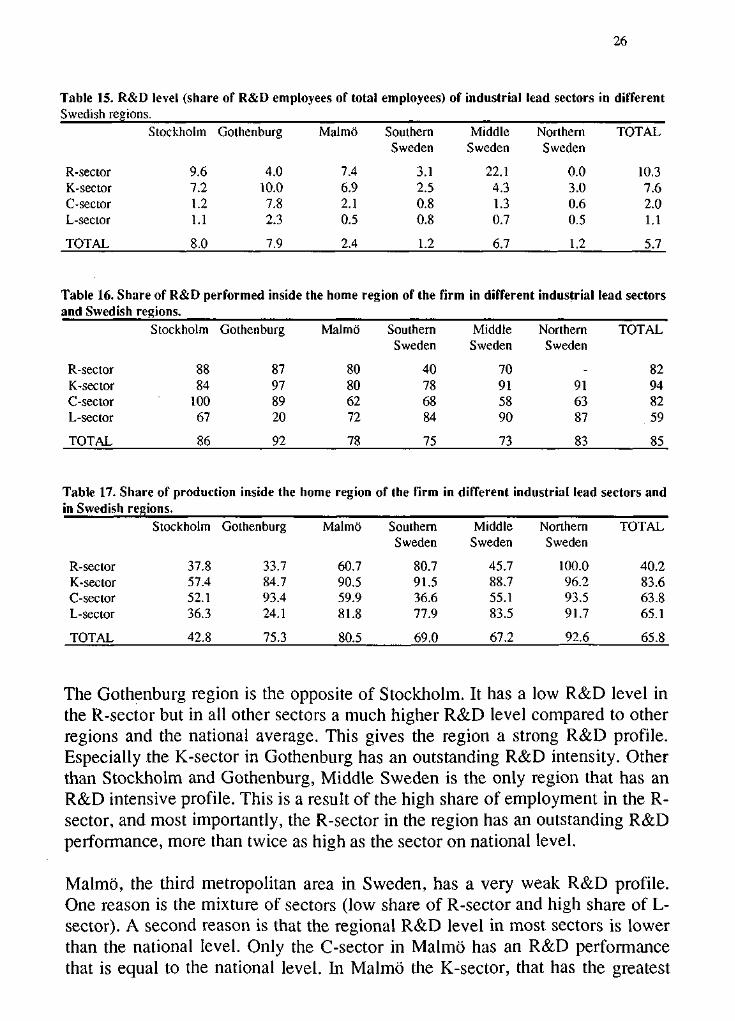
The Gothenburg region is the opposite of Stockholm. It has a low R&D level inthe R-sector but in all other sectors a much higher R&D level compared to otherregions and the national average. This gives the region a strong R&D profile.Especially the K-sector in Gothenburg has an outstanding R&D intensity. Otherthan Stockholm and Gothenburg, Middle Sweden is the only region that has anR&D intensive profile. This is a result of the high share of employment in the R-sector, and most importantly, the R-sector in the region has an outstanding R&Dperformance, more than twice as high as the sector on national level.
Malmo, the third metropolitan area in Sweden, has a very weak R&D profile.One reason is the mixture of sectors (low share of R-sector and high share of L-sector). A second reason is that the regional R&D level in most sectors is lowerthan the national level. Only the C-sector in Malmo has an R&D performancethat is equal to the national level, hi Malmo the K-sector, that has the greatest
27
share of employment in the region, is not far from the national R&D level for thesector.
In Southern Sweden (excluding Malmo) the R&D level is a dilemma, comparedwith other regions in Sweden and with the national average. Not one of thesectors in this region is even close to the national R&D levels.
The R&D level of the sectors in different regions is not necessarily generatedinside the home region. Parts of the R&D may be carried out in plants outsidethe home region of the firm. The highest concentration of R&D in the homeregion are found among firms in Stockholm and Gothenburg. This reinforces thepicture of these regions as the industrial R&D centers of Sweden. MiddleSweden, as was pointed out earlier, has a high total level of R&D as a result ofits very competitive R-sector. However, the firms show a considerably lowerconcentration of R&D efforts inside their home region. About 30% of the R&Dof Middle Swedish firms is performed by firm units in other regions.
However, in general firms in different sectors and regions have their R&Dactivities highly concentrated to their home region. One exception is the L-sectorwith a considerably higher degree of R&D units outside the home regions. Thisperformance of the L-sector is especially notieable in Gothenburg.
Firms in Malmo and Southern Sweden in general have a lower concentration ofR&D inside the home region, with some exception for the L-sector. Theseconditions reinforce the picture of Southern Sweden as a very poor R&D regioncompared with other regions and the national average.
The variation among the industrial lead sectors concerning concentration of thefirms' production to the home region is much larger than was the case for R&Dvariation. Firms included in the K-sector have a high concentration of produc-tion inside the home region. The concentration to their home region is more thantwice as high in the K-sector compared with the R-sector. The shares ofproduction inside the home region among firms included in the L- and C-sectorsis around 65% of the national average.
Evidently, firms belonging to the K-sector are especially dependent on the closeproximity of production plants and the headquarter activities. This is probablyexplained by the fact that the technology of the sector is very much based ontight linkages between technical skilled workers on the shop floor and R&Dunits. The possibility for a firm to direct, coordinate and evaluate the differentparts of its activities is facilitated by an agglomeration of management, R&Dand production units.
28
In Stockholm all sectors have a distinctly lower concentration of production tothe home region compared with the national average. Earlier it was pointed outthat nearly all the R&D units of the Stockholm firms were kept inside the homeregion. These circumstances show that industrial firms in Stockholm put the vastmajority of the routine production and assembling outside the home region andkeep all advanced functions such as R&D, strategic planning, and managementinside the home region.
The L-sector in Gothenburg and the C-sector in Southern Sweden have very lowconcentrations of production compared with the national averages of thesesectors.
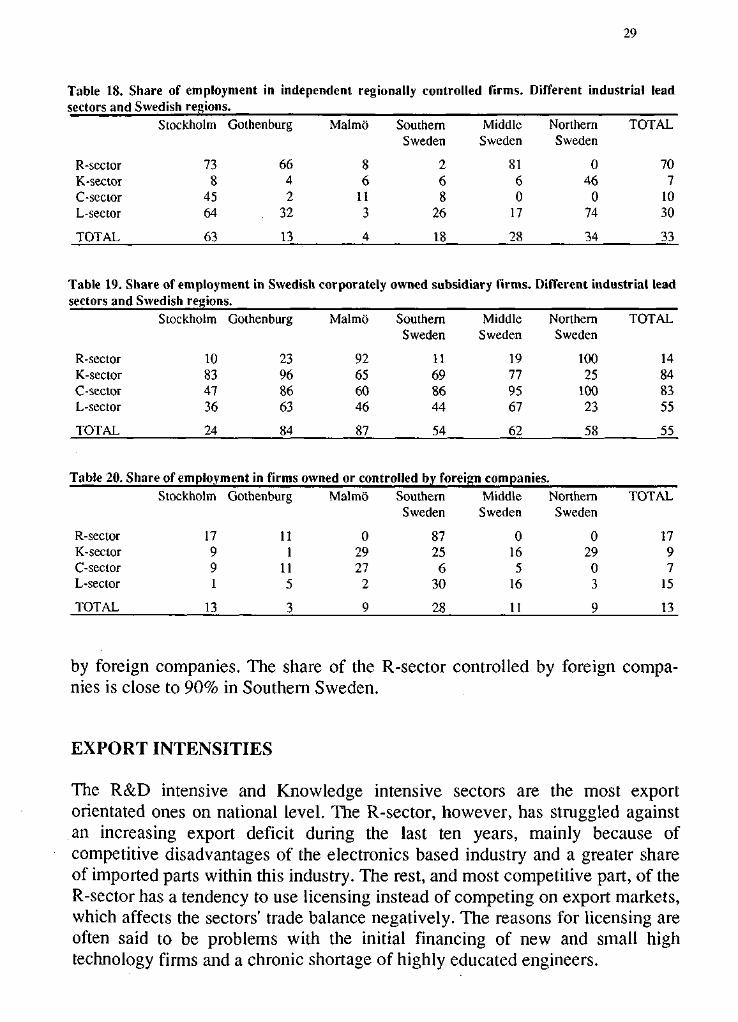
Tables 18-20 give a regional perspective of different ownership patterns distri-buted over the lead sectors.
On a national level the R-sector is dearly different from the other sectors with itsvery high degree of independent regionally controlled companies. On regionallevel, however, the pattern of the R-sector is quite varied. In regions, where theR-sectors is dominant (Stockholm, Gothenburg and Middle Sweden), the sectorhas a much higher share of employment in independent regionally controlledcompanies compared with regions with a weak R-sector (Malmo, SouthernSweden and Northern Sweden).
The K- and C-sectors consist in general of Swedish corporately owned subsi-diary firms, with the corporate head office outside the home region. In allregions the K-sector has a very small share of employment among independentregionally controlled companies.
Ownership among firms in the L-sector shows a strong regional variation.Stockholm and Northern Sweden have large shares of employment in indepen-dent regionally controlled firms, while this share is extremely low in Malmo. Itis obvious that the industry in Stockholm consists mainly of independentregional firms. This is not the case in the other regions where the industry isdominated by subsidiary firms connected to national network of corporations,controlled outside the home region.
About 13% of the employees work in firms that are controlled or owned byforeign companies. Foreign companies have their strongest positions in the R-and L-sectors. Southern Sweden as a region is quite different from the nationalaverage. More than twice as high share of industrial employment is controlled
29
Table 18. Share of employment in independent regionally controlled firms. Different industrial leadsectors and Swedish regions.
R-sectorK-sectorC-sectorL-sector
TOTAL
Stockholm
738
4564
63
Gothenburg
6642
. 32
13
Malmo
86
113
4
SouthernSweden
268
26
18
MiddleSweden
8160
17
28
NorthernSweden
046
074
34
TOTAL
707
1030
33
Table 19. Share of employment in Swedish corporately owned subsidiary firms. Different industrial leadsectors and Swedish regions.
R-sectorK-sectorC-sectorL-sector
TOTAL
Table 20.
R-sectorK-sectorC-sectorL-sector
TOTAL
Stockholm
10834736
24
Gothenburg
23968663
84
Share of employment in firmsStockholm
17991
13
Gothenburg
111
115
3
Malmo
92656046
87
SouthernSweden
11698644
54
MiddleSweden
19779567
62
owned or controlled by foreign companiesMalmo
02927
2
9
SouthernSweden
8725
630
28
MiddleSweden
0165
16
11
NorthernSweden
10025
10023
58
NorthernSweden
029
03
9
TOTAL
14848355
55
TOTAL
1797
15
13
by foreign companies. The share of the R-sector controlled by foreign compa-nies is close to 90% in Southern Sweden.
EXPORT INTENSITIES
The R&D intensive and Knowledge intensive sectors are the most exportorientated ones on national level. The R-sector, however, has struggled againstan increasing export deficit during the last ten years, mainly because ofcompetitive disadvantages of the electronics based industry and a greater shareof imported parts within this industry. The rest, and most competitive part, of theR-sector has a tendency to use licensing instead of competing on export markets,which affects the sectors' trade balance negatively. The reasons for licensing areoften said to be problems with the initial financing of new and small hightechnology firms and a chronic shortage of highly educated engineers.
30
The K-sector has produced a substantial export surplus on national level formany years. It has levelled out in the 1980s because of growing problems of theautomobile industry and the diminishing export surplus in the investment goodsindustry. The K-sector's smallest fraction is the industry producing parts andconsumers' goods, an industry with a continuously increasing export deficitsince the 1970s.
The C-sector (Capital intensive)4s exporting half of its production and has had alarge export surplus for many years, although fluctuating from time to time. Thetrade surplus comes from the wood industry (pulp and paper) and the metalindustry. The chemical, petroleum and food industries are all suffering fromtrade deficits.
The L-sector is the least export intensive sector of the manufacturing industry.Its competitiveness on export markets is very weak and its trade deficit has beensteadily increasing since the middle of the 1970s. The most competitive indu-stries are the wood industry and the industry that produces Labour intensiveproducts in competition with other developed economies. The food industry andthe Labour intensive industry competing with less developed economies both arefacing permanent and growing trade deficits.
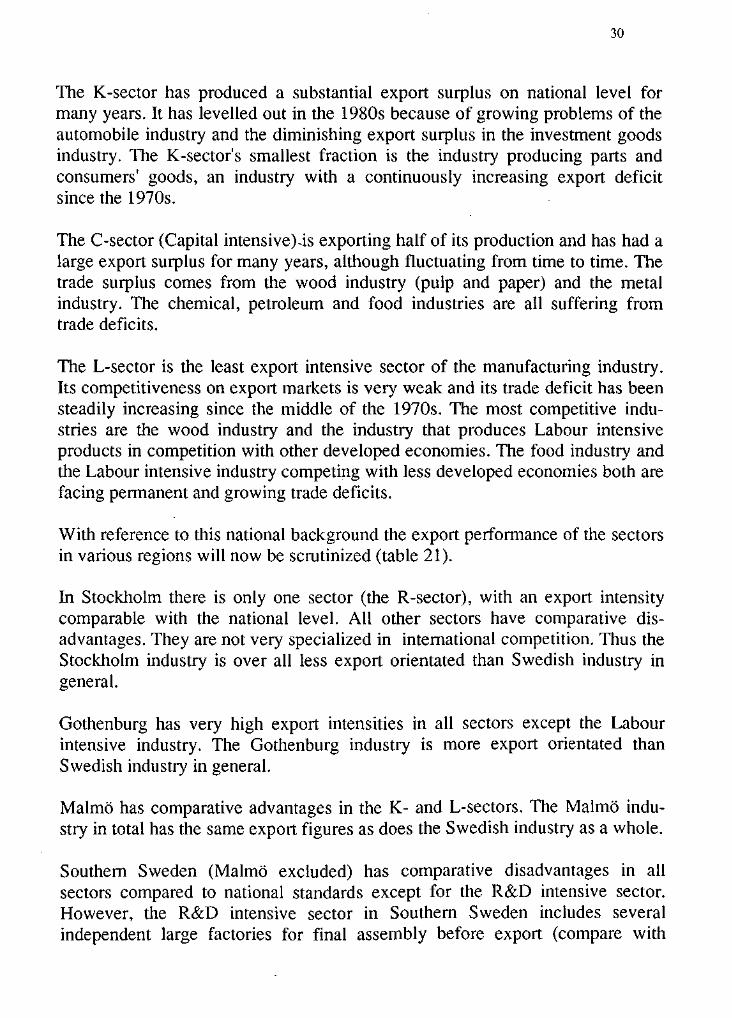
With reference to this national background the export performance of the sectorsin various regions will now be scrutinized (table 21).
In Stockholm there is only one sector (the R-sector), with an export intensitycomparable with the national level. All other sectors have comparative dis-advantages. They are not very specialized in international competition. Thus theStockholm industry is over all less export orientated than Swedish industry ingeneral.
Gothenburg has very high export intensities in all sectors except the Labourintensive industry. The Gothenburg industry is more export orientated thanSwedish industry in general.
Malmo has comparative advantages in the K- and L-sectors. The Malmo indu-stry in total has the same export figures as does the Swedish industry as a whole.
Southern Sweden (Malmo excluded) has comparative disadvantages in allsectors compared to national standards except for the R&D intensive sector.However, the R&D intensive sector in Southern Sweden includes severalindependent large factories for final assembly before export (compare with
31
Table 21. Export intensities of lead sectors, defined as percentage of domestic production exported in1990.
R-scctorK-sectorC-sectorL-sector
TOTAL
Stockholm
62362511
48
Gothenburg
69795821
68
Malmo
36703555
55
SouthernSweden
75544426
39
MiddleSweden
64536730
53
NorthernSweden
1596642
61
TOTAL
63684929
54
foreign production below), so there is doubt whether Southern Sweden really hasa comparative advantage in any sector.
The competitiveness of Middle Sweden (Stockholm and Gothenburg excluded)is much stronger than that of Southern Sweden. The R- and C-sectors are perfor-ming very well on export markets. Gothenburg and the rest of Middle Swedenmake complete a very strong manufacturing belt with high export intensities inthe R-, K- and C-sector. These are the most important Swedish exportingsectors.
Northern Sweden has, not surprisingly, specialized in the Capital and Labourintensive sectors. Both sectors have comparative advantage, especially the woodindustry and the metal industry. The export intensity from the total of all sectorsoutranks the corresponding national figures.
THE "HOME BASE" AND ITS IMPORTANCE
Competitiveness on export markets and the productivity of the firm, even themultinational firm, is to some extent founded on the factor endowments of thehome base, i.e. the nation and the region. In this study the region is in focus. Theknowledge base in a broad sense of its term such as business services andnetworks for communication, development work and production could in somesectors be a regional factor of importance, as could the regional labour marketand transport possibilities to choose just a few examples. The factor demand offirms in different sectors varies and so do the factor endowments of regions in acountry.
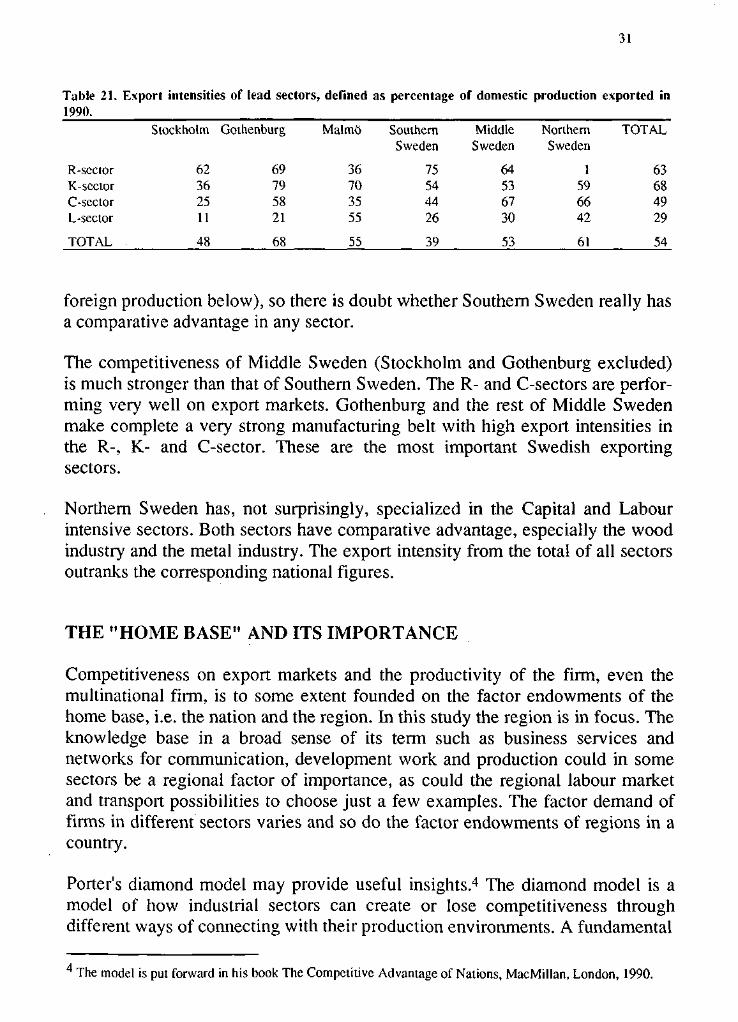
Porter's diamond model may provide useful insights.4 The diamond model is amodel of how industrial sectors can create or lose competitiveness throughdifferent ways of connecting with their production environments. A fundamental
4 The model is put forward in his book The Competitive Advantage of Nations, MacMillan, London, 1990.
32
The Porter Diamond
Rivals vscompany strategy
Local marketcustomer demand
Productionfactors
Governmentinfrastructure
Related andsupportingindustries
Figure 4: The Porter Diamond - Sources of competitive advantage.Source: Porter (1990) p 127.
concept is that conditions of the home base (nation or region) are of decisiveimportance for the capacity of firms to create and maintain competitive advan-tage in international markets.
In short, Porter says that the competitiveness of firms and sectors is determinedby four main aspects which together constitute the conditions of production in anation or region. These are:
Firm strategies, structure and rivalry: distinctive national features concerninghow firms are created, organized and led; domestic rivalry between firms in thesame sector.
Demand conditions: the demand structure of the domestic market for products ofthe sector.
Factor conditions: the work force profile, infrastructure, necessity to compete ina certain sector.
Related and supporting industries: presence or absence of inter-nationallycompetitive agents.
33
These four aspects or factors are complemented by Government and Chance.Government could have an important influence on competitive advantage insome industries through its ability to upgrade or downgrade the factorsmentioned. Chance events outside any control could also influence competitiveadvantage. Examples are unplanned political developments or technologicalbreakthroughs in products or processes.
The four factors are mutually connected and influence, strengthen or weakeneach other. For instance, advantageous demand conditions do not necessarilylead to competitive advantage if the domestic rivalry is not strong enough tobring about investments in the sector. Competitive advantage based on only oneor two of these factors is feasible only in an industry based on raw materials andcharacterized by a low level of technological development. Such advantages aregenerally of short duration. Sustained competitive advantage in a Knowledgeintensive sector requires a combination of several advantageous conditions ofproduction. Interaction between advantages in different factors have a reinfor-cing effect on competitiveness which is very difficult for foreign competitors toequalize.
The firm strategies, structure and rivalry as well as government and the demandconditions are important factors in explaining competitive advantage of sectorson a national level. Then the home base is equal to the national economy.However, firm strategies and demand conditions can be considered as constantfactors when the analysis deals with differences in the competitive advantage ofregions within an economy, which is the issue in this paper. Here factorconditions and supporting industries come more naturally into focus as impor-tant factors in explaining regional economic performance. Thus, factor condi-tions and supporting industries are highlighted in the following brief analysis ofthe importance of regional home bases.
When comparing factor demands and factor endowments it is not surprising thatStockholm, Gothenburg and Middle Sweden (with university regions likeUppsala and Linkoping as outstanding examples) have a great share of competi-tive R&D intensive industry. The factor quality for this kind of industry is veryhigh in these regions. The firms can easily build up the main part of their Know-ledge intensive networks within the regions and make them complete throughinternational networks. Moreover the firms are given access to advancedbusiness service and high technology components in these regions. The homebase is often the site of the sector's qualified production, while assembly androutine production is carried out in peripheral regions with a less qualified andcheaper labour force (compare the share of R&D and production performedinside the home regions in table 16 and 17).
34
In Stockholm and Gothenburg less competitive manufacturing sectors aresqueezed on factor markets between the expanding R&D intensive industry withits ability to pay and the protected sector with its rather low sensitivity for costs.These circumstances may explain to some extent why the Capital intensive andLabour intensive sectors are so small and comparatively non-competitive inStockholm and Gothenburg.
The Knowledge intensive sectoris not dependent on home bases with excellencein all factor markets. Firms within this sector are often one of many organi-sations linked together by ownership. R&D results, business services and newtechnology filter down from top to bottom and from centre to periphery. Thiscan make firms competitive in less dynamic and smaller regions as well, pro-vided that these smaller regions have technically skilled blue-collar labourforces. Competitive firms within the sector very often have a substantial part oftheir production in their home bases, i.e. their headquarter regions. Malmo,Gothenburg and the most prominent manufacturing regions in Northern Swedenoffer such labour markets, resulting in Knowledge intensive sectors with highexport intensities.
What has been said about the Knowledge intensive sector and its organizationalnetworks also applies for the Capital intensive sector. However, the competitivewood industry and metal industry are restricted to special areas of Northern andMiddle Sweden by tradition and their dependance on raw material and transportlinks. In contrast to these industries the competitive chemical industry and thefood industry are located closer to the well equipped regions in Southern andMiddle Sweden.
Some parts of the Labour intensive sector like the Knowledge intensive sectordepend on a technically skilled labour force. The two sectors very often competeon the same labour markets. Malmo has a long tradition in both sectors and asustained advantage in its technically skilled labour force. Therefore, it is notsur-prising that Malmo has high export intensities in both these sectors. Otherparts of the Labour intensive sector are much more dependent on a cheap andless qualified labour force. The competitive Labour intensive industry inNorthern Sweden is mainly based on such advantages.
A special analysis of local and regional supplier networks, which is an importantpart of related and supporting industries, follows in a later section.5
' The Purchasing Patterns and Purchasing Networks.
35
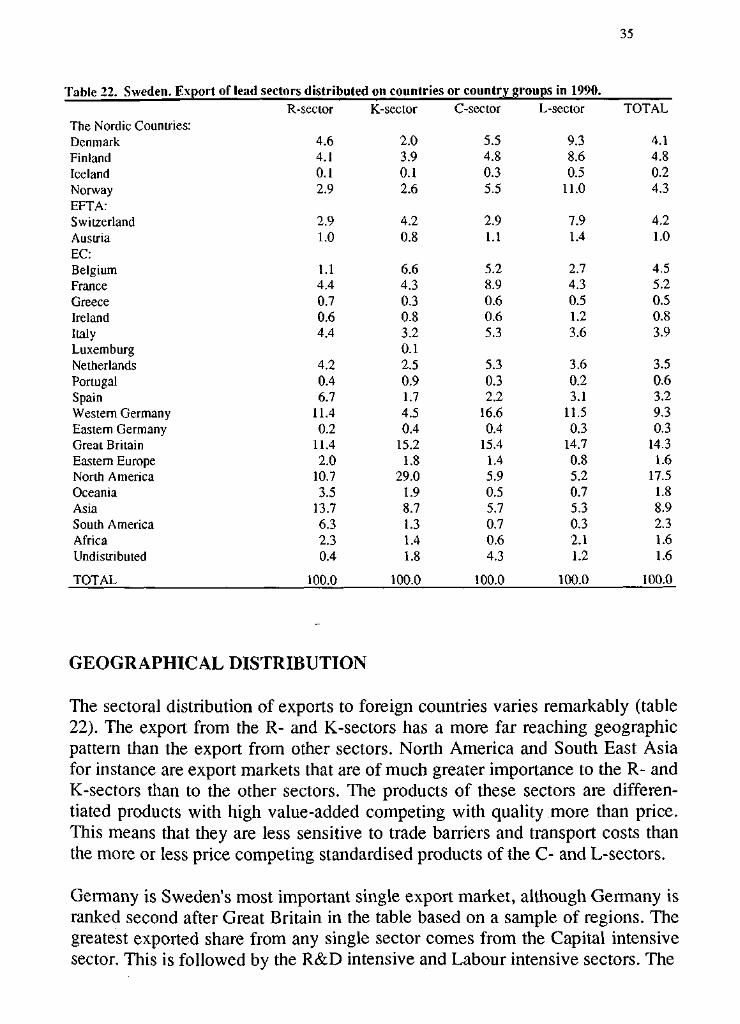
Table 22. Sweden. Export of lead sectors distributed on countries or country groups in 1990.R-sector K-sector C-sector L-sector TOTAL
The Nordic Countries:DenmarkFinlandIcelandNorwayEFTA:SwitzerlandAustriaEC:BelgiumFranceGreeceIrelandItalyLuxemburgNetherlandsPortugalSpainWestern GermanyEastern GermanyGreat BritainEastern EuropeNorth AmericaOceaniaAsiaSouth AmericaAfricaUndistributed
TOTAL 100.0 100.0 100.0 100.0 100.0
4.64.10.12.9
2.91.0
1.14.40.70.64.4
4.20.46.7
11.40.2
11.42.0
10.73.5
13.76.32.30.4
2.03.90.12.6
4.20.8
6.64.30.30.83.20.12.50.91.74.50.4
15.21.8
29.01.98.71.31.41.8
5.54.80.35.5
2.91.1
5.28.90.60.65.3
5.30.32.2
16.60.4
15.41.45.90.55.70.70.64.3
9.38.60.5
11.0
7.91.4
2.74.30.51.23.6
3.60.23.1
11.50.3
14.70.85.20.75.30.32.11.2
4.14.80.24.3
4.21.0
4.55.20.50.83.9
3.50.63.29.30.3
14.31.6
17.51.88.92.31.61.6
GEOGRAPHICAL DISTRIBUTION
The sectoral distribution of exports to foreign countries varies remarkably (table22). The export from the R- and K-sectors has a more far reaching geographicpattern than the export from other sectors. North America and South East Asiafor instance are export markets that are of much greater importance to the R- andK-sectors than to the other sectors. The products of these sectors are differen-tiated products with high value-added competing with quality more than price.This means that they are less sensitive to trade barriers and transport costs thanthe more or less price competing standardised products of the C- and L-sectors.
Germany is Sweden's most important single export market, although Germany isranked second after Great Britain in the table based on a sample of regions. Thegreatest exported share from any single sector comes from the Capital intensivesector. This is followed by the R&D intensive and Labour intensive sectors. The

36
Table 23. Malmo. Export of lead sectors distributed on countries or country groups in 1990.R-sector K-sector C-sector L-scctor TOTAL
The Nordic CountriesDenmarkFinlandIcelandNorwayEFTASwitzerlandAustriaECBelgiumFranceGreeceIrelandItalyLuxemburgNetherlandsPortugalSpainWestern GermanyEastern GermanyGreat BritainEastern EuropeNorth AmericaOceaniaAsiaSouth AmericaAfricaUndistributed
TOTAL 100.0 100.0 100.0 100.0 100.0
K-sector only exports a minor share to Germany. The former DDR had a verysmall share of Swedish export.
Comments on exports from different regions will be restricted to Malmo andSouthern Sweden. The export from Malmo's less competitive R&D intensiveand Capital intensive sectors is not as far reaching as from the same sectors onnational level (table 23). North and continental Europe have greater shares thanNorth America and South East Asia, for instance. However, the Knowledgeintensive and Labour intensive sectors, both competitive, export to a wide rangeof countries and longer distances compared to the national geographic pattern.
Malmo's industry is exporting a surprisingly small share to Germany comparedto Sweden's total export. While the exported share to Germany of R&Dintensive and capital intensive products is relatively great, the export ofKnowledge intensive and Labour intensive products to Germany amounts to avery small percentage of exported value. Thus to a great extent the exports from
4.72.1
L5.8
4.63.5
4.08.4
4.4
3.66.20.9
14.6
7.95.05.11.25.0
3.10.0
1.61.90.13.8
41.92.3
0.81.20.80.42.6
0.91.50.82.61.22.28.92.00.4
10.32.39.30.2
7.911.4
6.3
3.9
15.8
3.59.2
10.211.59.90.1
7.72.6
0.0
10.56.91.5
10.2
40.1
0.7
0.10.7
2.10.25.40.11.20.19.71.18.60.8
5.54.40.67.0
36.21.3
0.61.20.40.22.1
1.81.00.73.61.44.45.61.80.49.51.88.00.5
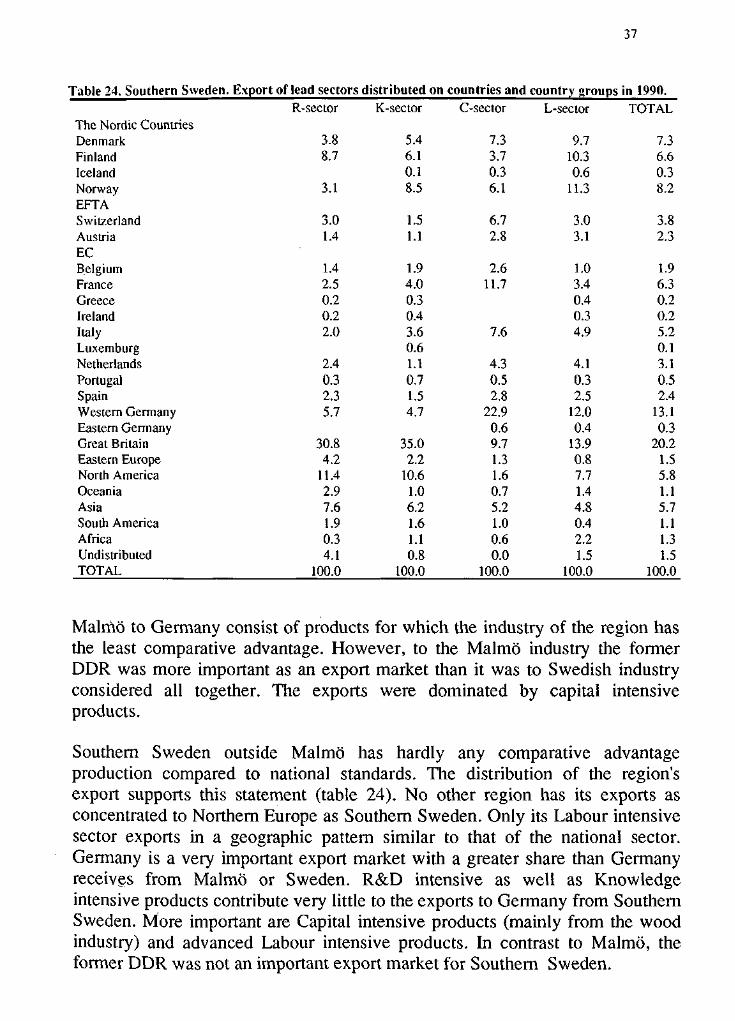
37
Table 24. Southern Sweden. Export of lead sectors distributed on countries and country groups in 1990.R-sector K-sector C-sector L-sector TOTAL
The Nordic CountriesDenmarkFinlandIcelandNorwayEFTASwitzerlandAustriaECBelgiumFranceGreeceIrelandItalyLuxemburgNetherlandsPortugalSpainWestern GermanyEastern GermanyGreat BritainEastern EuropeNorth AmericaOceaniaAsiaSouth AmericaAfricaUndistributed 4.1 0.8 0.0 1.5 1.5TOTAL 100.0 100.0 100.0 100.0 100.0
Malmo to Germany consist of products for which the industry of the region hasthe least comparative advantage. However, to the Malmo industry the formerDDR was more important as an export market than it was to Swedish industryconsidered all together. The exports were dominated by capital intensiveproducts.
Southern Sweden outside Malmo has hardly any comparative advantageproduction compared to national standards. The distribution of the region'sexport supports this statement (table 24). No other region has its exports asconcentrated to Northern Europe as Southern Sweden. Only its Labour intensivesector exports in a geographic pattern similar to that of the national sector.Germany is a very important export market with a greater share than Germanyreceives from Malmo or Sweden. R&D intensive as well as Knowledgeintensive products contribute very little to the exports to Germany from SouthernSweden. More important are Capital intensive products (mainly from the woodindustry) and advanced Labour intensive products. In contrast to Malmo, theformer DDR was not an important export market for Southern Sweden.
3.88.7
3.1
3.01.4
1.42.50.20.22.0
2.40.32.35.7
30.84.2
11.42.97.61.90.3
5.46.10.18.5
1.51.1
1.94.00.30.43.60.61.10.71.54.7
35.02.2
10.61.06.21.61.1
7.33.70.36.1
6.72.8
2.611.7
7.6
4.30.52.8
22.90.69.71.31.60.75.21.00.6
9.710.30.6
11.3
3.03.1
1.03.40.40.34.9
4.10.32.5
12.00.4
13.90.87.71.44.80.42.2
7.36.60.38.2
3.82.3
1.96.30.20.25.20.13.10.52.4
13.10.3
20.21.55.81.15.71.11.3
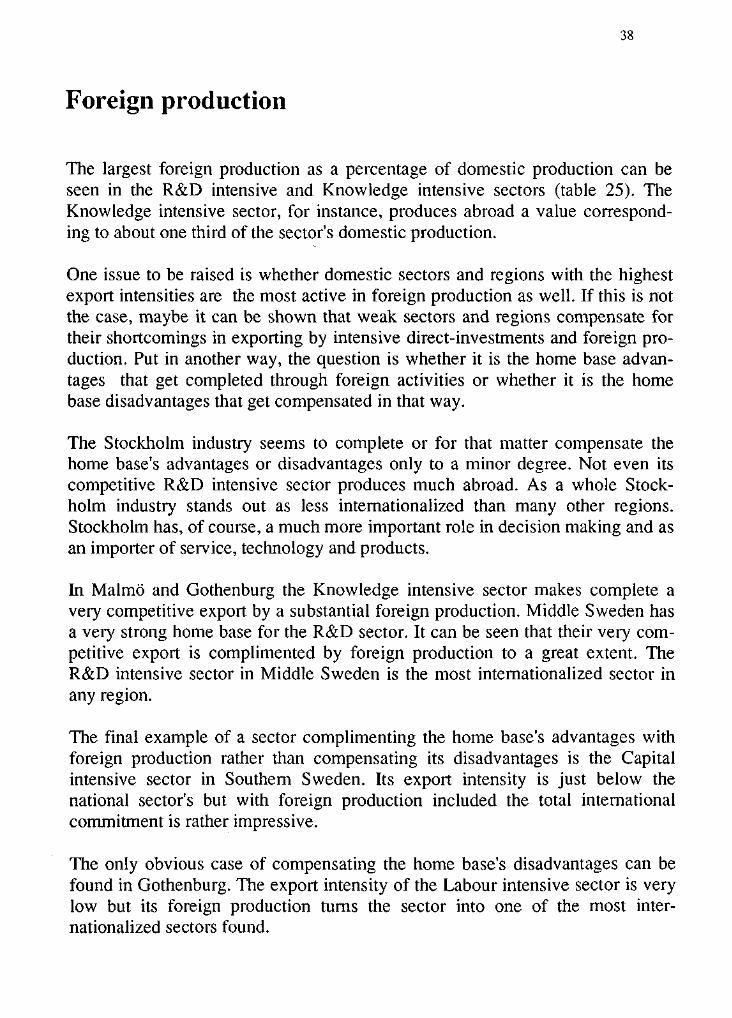
38
Foreign production
The largest foreign production as a percentage of domestic production can beseen in the R&D intensive and Knowledge intensive sectors (table 25). TheKnowledge intensive sector, for instance, produces abroad a value correspond-ing to about one third of the sector's domestic production.
One issue to be raised is whether domestic sectors and regions with the highestexport intensities are the most active in foreign production as well. If this is notthe case, maybe it can be shown that weak sectors and regions compensate fortheir shortcomings in exporting by intensive direct-investments and foreign pro-duction. Put in another way, the question is whether it is the home base advan-tages that get completed through foreign activities or whether it is the homebase disadvantages that get compensated in that way.
The Stockholm industry seems to complete or for that matter compensate thehome base's advantages or disadvantages only to a minor degree. Not even itscompetitive R&D intensive sector produces much abroad. As a whole Stock-holm industry stands out as less internationalized than many other regions.Stockholm has, of course, a much more important role in decision making and asan importer of service, technology and products.
In Malmo and Gothenburg the Knowledge intensive sector makes complete avery competitive export by a substantial foreign production. Middle Sweden hasa very strong home base for the R&D sector. It can be seen that their very com-petitive export is complimented by foreign production to a great extent. TheR&D intensive sector in Middle Sweden is the most internationalized sector inany region.
The final example of a sector complimenting the home base's advantages withforeign production rather than compensating its disadvantages is the Capitalintensive sector in Southern Sweden. Its export intensity is just below thenational sector's but with foreign production included the total internationalcommitment is rather impressive.
The only obvious case of compensating the home base's disadvantages can befound in Gothenburg. The export intensity of the Labour intensive sector is verylow but its foreign production turns the sector into one of the most inter-nationalized sectors found.
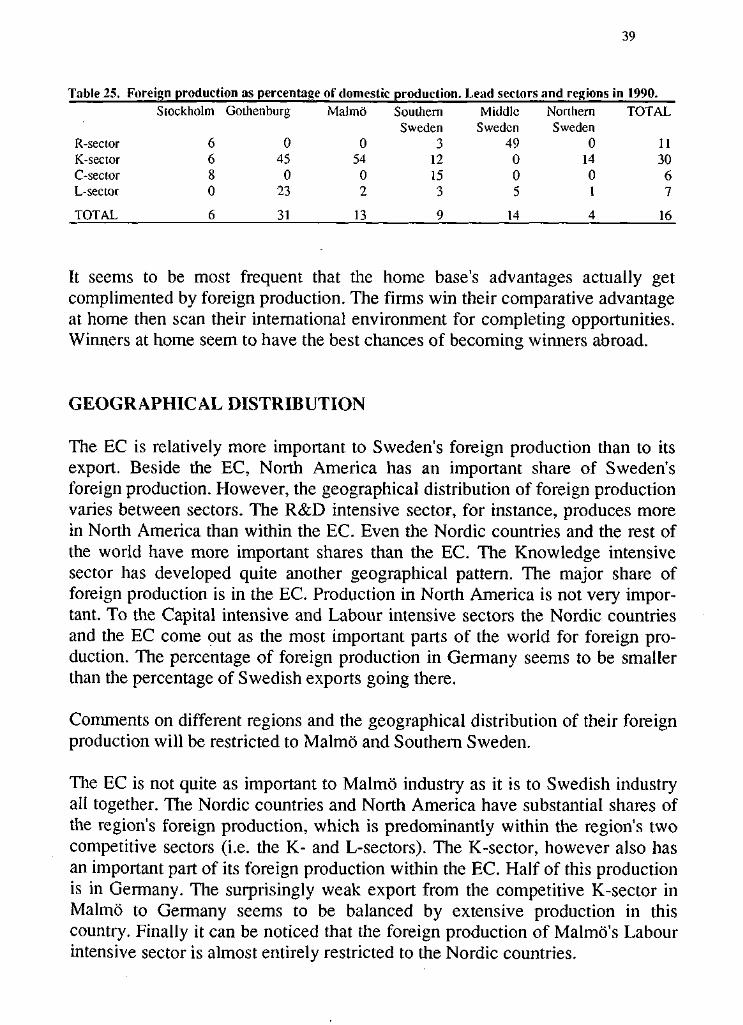
39
Table 25. Foreign production as percentage of domestic production. Lead sectors and regions in 1990.
R-sectorK-sectorC-sectorL-sector
TOTAL
Stockholm
6680
6
Gothenburg
0450
23
31
Malmo
054
02
13
SouthernSweden
312153
9
MiddleSweden
49005
14
NorthernSweden
01401
4
TOTAL
113067
16
It seems to be most frequent that the home base's advantages actually getcomplimented by foreign production. The firms win their comparative advantageat home then scan their international environment for completing opportunities.Winners at home seem to have the best chances of becoming winners abroad.
GEOGRAPHICAL DISTRIBUTION
The EC is relatively more important to Sweden's foreign production than to itsexport. Beside the EC, North America has an important share of Sweden'sforeign production. However, the geographical distribution of foreign productionvaries between sectors. The R&D intensive sector, for instance, produces morein North America than within the EC. Even the Nordic countries and the rest ofthe world have more important shares than the EC. The Knowledge intensivesector has developed quite another geographical pattern. The major share offoreign production is in the EC. Production in North America is not very impor-tant. To the Capital intensive and Labour intensive sectors the Nordic countriesand the EC come out as the most important parts of the world for foreign pro-duction. The percentage of foreign production in Germany seems to be smallerthan the percentage of Swedish exports going there.
Comments on different regions and the geographical distribution of their foreignproduction will be restricted to Malmo and Southern Sweden.
The EC is not quite as important to Malmo industry as it is to Swedish industryall together. The Nordic countries and North America have substantial shares ofthe region's foreign production, which is predominantly within the region's twocompetitive sectors (i.e. the K- and L-sectors). The K-sector, however also hasan important part of its foreign production within the EC. Half of this productionis in Germany. The surprisingly weak export from the competitive K-sector inMalmo to Germany seems to be balanced by extensive production in thiscountry. Finally it can be noticed that the foreign production of Malmo's Labourintensive sector is almost entirely restricted to the Nordic countries.
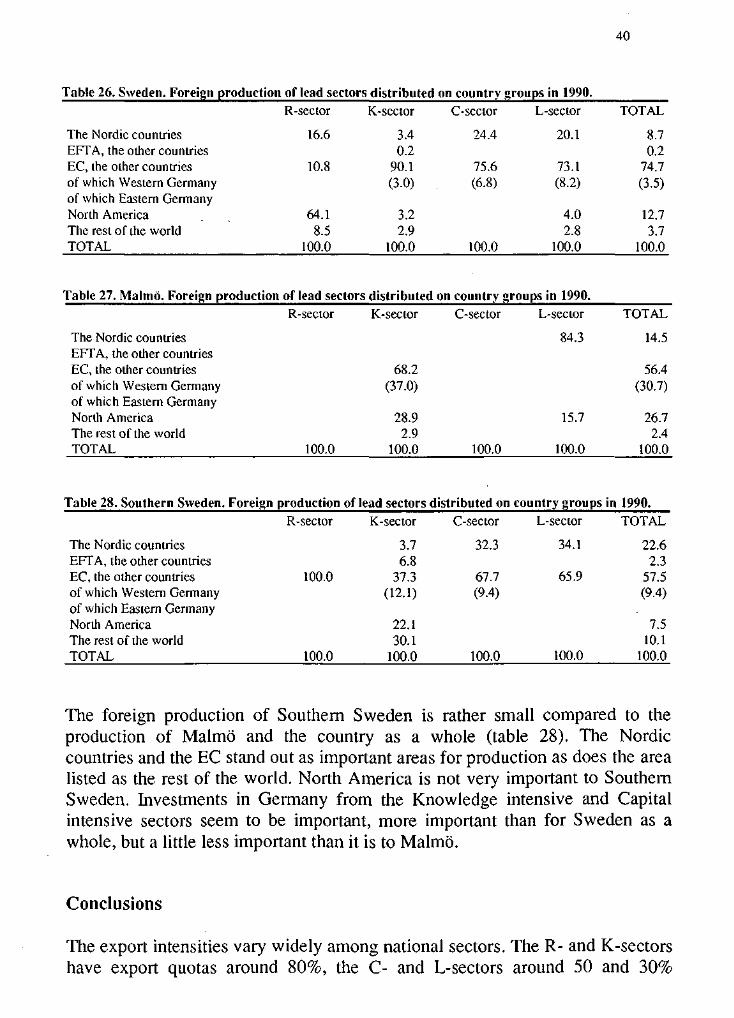
40
Table 26. Sweden. Foreign production of lead sectors distributed on country groups in 1990.R-sector K-scctor C-scctor L-sector TOTAL
The Nordic countriesEFTA, the other countriesEC, the other countriesof which Western Germanyof which Eastern GermanyNorth AmericaThe rest of the worldTOTAL
16.6
10.8
64.18.5
100.0
3.40.2
90.1(3.0)
3.22.9
100.0
24.4
75.6(6.8)
100.0
20.1
73.1(8.2)
4.02.8
100.0
8.70.2
74.7(3.5)
12.73.7
100.0
Table 27. Malmo. Foreign production of lead sectors distributed on country groups in 1990,R-sector K-sector C-sector
The Nordic countriesEFTA, the other countriesEC, the other countriesof which Western Germanyof which Eastern GermanyNorth AmericaThe rest of the worldTOTAL 100.0
68.2(37.0)
28.92.9
100.0 100.0
ector
84.3
15.7
100.0
TOTAL
14.5
56.4(30.7)
26.72.4
100.0
Table 28. Southern Sweden. Foreign production of lead sectors distributed on country groups in 1990.R-sector K-sector C-sector L-sector TOTAL
The Nordic countriesEFTA, the other countriesEC, the other countriesof which Western Germanyof which Eastern GermanyNorth AmericaThe rest of the worldTOTAL
100.0
100.0
3.76.8
37.3(12.1)
22.130.1
100.0
32.3
67.7(9.4)
100.0
34.1
65.9
100.0
22.62.3
57.5(9.4)
7.510.1
100.0
The foreign production of Southern Sweden is rather small compared to theproduction of Malmo and the country as a whole (table 28). The Nordiccountries and the EC stand out as important areas for production as does the arealisted as the rest of the world. North America is not very important to SouthernSweden. Investments in Germany from the Knowledge intensive and Capitalintensive sectors seem to be important, more important than for Sweden as awhole, but a little less important than it is to Malmo.
Conclusions
The export intensities vary widely among national sectors. The R- and K-sectorshave export quotas around 80%, the C- and L-sectors around 50 and 30%
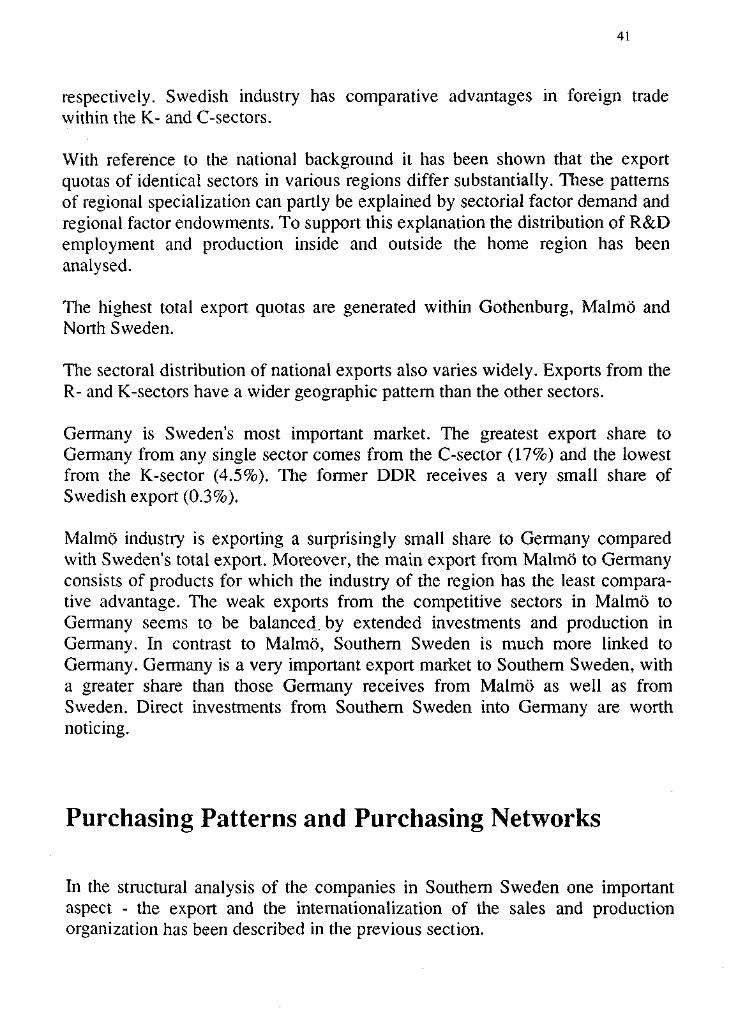
41
respectively. Swedish industry has comparative advantages in foreign tradewithin the K- and C-sectors.
With reference to the national background it has been shown that the exportquotas of identical sectors in various regions differ substantially. These patternsof regional specialization can partly be explained by sectorial factor demand andregional factor endowments. To support this explanation the distribution of R&Demployment and production inside and outside the home region has beenanalysed.
The highest total export quotas are generated within Gothenburg, Malmo andNorth Sweden.
The sectoral distribution of national exports also varies widely. Exports from theR- and K-sectors have a wider geographic pattern than the other sectors.
Germany is Sweden's most important market. The greatest export share toGermany from any single sector comes from the C-sector (17%) and the lowestfrom the K-sector (4.5%). The former DDR receives a very small share ofSwedish export (0.3%).
Malmo industry is exporting a surprisingly small share to Germany comparedwith Sweden's total export. Moreover, the main export from Malmo to Germanyconsists of products for which the industry of the region has the least compara-tive advantage. The weak exports from the competitive sectors in Malmo toGermany seems to be balanced, by extended investments and production inGermany. In contrast to Malmo, Southern Sweden is much more linked toGermany. Germany is a very important export market to Southern Sweden, witha greater share than those Germany receives from Malmo as well as fromSweden. Direct investments from Southern Sweden into Germany are worthnoticing.
Purchasing Patterns and Purchasing Networks
In the structural analysis of the companies in Southern Sweden one importantaspect - the export and the internationalization of the sales and productionorganization has been described in the previous section.
42
In this section of the paper we focus on another important aspect of the industrystructure and internationalization - purchasing patterns. The reason for studyingpurchasing patterns is that we want to get a picture of the networks of industriesin Southern Sweden. Our framework for analysis in this section is Porter (1990)who describes the network as consisting of production factors, local markets andcustomer demand, supporting and related industries, and rivals. All these factorsinteract in a framework regulated by the infrastructure created by govern-mentand the irregularities created by chance.
The purchasing patterns and purchasing networks of the producing industry inSouthern Sweden were investigated in Survey II. Questions were asked concer-ning the amount and origin of the purchased goods used in the production. Wealso investigated the nature and direction of supplier relations, regionally,nationally and internationally.
If we start with the number of suppliers used, we find that companies on thewhole have many suppliers. There is a difference between the competitionexposed sectors where the average company has more than 100 suppliers, whilethe corresponding figure in the Sheltered sector is around 50. This reflects thefact that a fair part of the companies in the Sheltered sector are cooperatives withan express goal to cater for to needs of the local farm industry and to find outletsfor its products.
LONG TERM BUYER RELATIONS
We can also learn that the buyer relations are clearly long term. In the compe-tition exposed sectors 58% of the purchasing relationships last between 6 and 15years. As many as 34% of the purchasing relationships are more than 16 yearsold. Only 8% of the suppliers have delivered for a shorter time than 6 years.
Perhaps one could guess that the supplier relations in the Sheltered sector wouldbe even more long term. This is not the case, however. In this sector the supplierrelations older than 16 years are 34%. However, "only" 51% of the relations arebetween 6 and 15 years old, while "new" relations have the almost doublefrequency compared to the other sectors - a bit over 14%.
Even though the supplier relations in the Sheltered sector are somewhat shorter,it is still very relevant to regard the relations as very stable, long term commit-ments.
43
LOCAL AND REGIONAL SUPPLIER NETWORKS
Looking at the spatial aspects, we find that the supplier networks are verylocal/regional by nature. In the Sheltered sector 36% of the companies buy 5%or less of their volume outside Sweden. 21% buy 6-10% and 14% of the compa-nies buy 11-15% of their purchasing volume outside Sweden. It is interesting tonote, however, a group of companies with quite another profile in this sector20%. In the competitions exposed sectors the imported volume varies more bet-ween the companies. 13% of the companies import less than 10%. 21% of thecompanies import between 11 and 20% of the volume and 17% import between21 and 30%. Also in these sectors we have a cluster of companies that import alarge portion of the supplies. 23% of the companies import more than 50% of thevolume. The high import share companies are more often from the R-, K- and C-sectors than from the Labour intensive sector.
PURCHASING NETWORKS WITH GERMANY, EUROPE AND THEREST OF THE WORLD
In the competition exposed sectors the average company buys 15-20% of its pur-chased volume from Europe and around 10% from the rest of the area listed asthe world. In the Sheltered sector, it was quite uncommon to have suppliers out-side Sweden. Those who bought from other geographical areas bought a smallpart of their volume there - below 10%.
The most common trading partner countries outside the Nordic countries wereGermany, Great Britain and the Netherlands in the competition exposed sectors.
Germany takes a clear lead as the clearly most frequent trade partner country. Inthe Sheltered sector, Germany also takes a clear leading position with the USAas the second most important country. In all the sectors, however, the suppliernetworks in Germany more often than not end in central or Southern Germany.The links with Northern Germany are not very frequent - only nine of therelations were with Northern Germany. This can be compared with 64 supplierrelations with the other parts of Germany.
In the regional mobilization programme in Southern Sweden, special attentionhas been given to the opportunities that cooperation with Schelswig-Holstein'sindustry could offer. In our sample only one company named a supplier inScheswig-Holstein as one of its five most important suppliers.

44
It is obvious that the advertised advantages of cooperation with Schleswig-Holstein have not yet been discovered and exploited by the producing compa-nies in Southern Sweden.
EXPECTED CHANGES IN VOLUME PURCHASED ABROAD
In the Sheltered sector the expectation for the future was to continue to buylocally/regionally. 50% of the companies that answered about their futureexpectations believed that less than 10% would be bought abroad in the future.This does not mean that 50% had plans to increase their internationalization,because 1/3 of the companies did not respond. This failure to respond can beinterpreted as a lack of vision and plans for the future.
The companies in the competition exposed sectors were not more optimisticregarding the possible internationalization of purchasing networks. If anything, itwas believed that a smaller part of the total volume would be purchased abroadin the future.
The companies that planned for increased internationalization of purchases werefound in the Research intensive and Knowledge intensive sectors of industry. Inthese sectors quite a few companies also believed in buying a smaller amountabroad in the future.
An interpretation of the research data on purchasing in general terms is thefollowing:
The purchasing pattern and the purchasing relations are at present long termsupplier-customer relations. The networks are frequently local, rather oftennational. In addition to supply relations inside Sweden, purchases from theNordic countries are rather frequent.
On the whole there are few suppliers abroad. The most frequent supplier countryoutside the Nordic countries is Germany with a concentration of the suppliers incentral and Southern Germany.
A large portion of the companies envisage a stable or reduced purchasingvolume abroad. However, one small segment of the companies takes a reversestand and plan for a substantially increased internationalization of their pur-chasing networks
45
Company Actions and Plans as an Answer toEnvironmental Changes
During the past few years Europe has changed considerably in a number ofrespects, both politically and economically. The changes we are referring to arethe European Community and the European Single Market, which will become areality within two years, as well as the political and economic upheavals in theSoviet Union and the countries in what used to be called Eastern Europe. Whathas happened in the eastern countries within a few years was probably expectedby few analysts. These changes in different parts of Europe imply alteredconditions for Swedish companies on the whole in several ways, but especially,which is evident from earlier parts of this report, for companies in the southernpart of Sweden. It is geographically very close to those regions where the greatchanges are going on and will continue to appear in the future.
At present it seems obvious that Sweden will become a member of the EuropeanCommunity within a few years. Whether this will be the case or not, theSwedish companies will be influenced by the single market, particularly in termsof the competitive situation. Then, what are the companies in Southern Swedendoing and what are they planning to do considering developments within theEuropean community?
Sweden's neighbouring countries in Eastern Europe have changed considerablyin terms of the possibilities for Swedish and other foreign companies to investand establish businesses. Furthermore, only a couple of months ago three newneighbouring countries gained their independence from the Soviet Union. All ofthem appear very interested in obtaining economic relations with countries inWestern Europe, hi what ways have the companies in Southern Swedenexploited these possibilities?
In the daily press in Sweden as well as in the business press and other types ofmedia, a lot of space is devoted to the above mentioned environmental changesand how they affect Swedish companies. It is easy to get the impression thatmost Swedish companies are very active in adapting themselves to the require-ments of the European community and also as actors on the immense, newlyopened Eastern European market.
The second survey questionnaire posed questions concerning these environ-mental changes and what actions are being taken or planned in response to thesingle market and the political and economic changes in Eastern Europe. The
46
overall result was that the majority of the companies taking part in the surveyhad neither taken any actions nor planned to do so. This result applies to bothactions regarding the single market and to those aimed at Eastern Europe.Nevertheless, it was possible to distinguish differences between the regions andbetween the different industrial sectors. In this part of the report we will describethe differences and also speculate on why the interest to the above mentionedchanges seems to be so small, considering the extent of the changes and theirpotential significance for Swedish companies. This part of the report is based onthe results from the second survey questionnaire.
THE EUROPEAN COMMUNITY AND THE SINGLE MARKETACTIONS AND PLANS
In the questionnaire we posed two questions about company actions regardingthe European community and the single market. The first one asked what actionsthe companies had taken owing to the changed market situation, which can beexpected as a result of the completion of the single market. The other questionconcerned whether any such actions were planned within the companies.Surprisingly, the result was that the majority of the companies had not taken anyactions whatsoever and did not plan any either.
When looking at the companies that had reacted to the environmental changes,the most frequent action taken or planned seemed to be cooperation withcompanies within EC countries. A rather large share of the companies had alsochanged their marketing strategy or planned to do so. Changes in companyorganization and structure were quite common and so were changes in productsand production technology. It is remarkable that very few of the companies men-tioned alterations in the raising of capital or capital management as issues sincethe EC single market also will exert a great influence on the capital markets allover Europe. Changes in research and development were not reported to anygreat extent, neither concerning business in Sweden nor in EC countries. Thisfact could also be considered surprising since it is often declared by researchersas well as by journalists, that one of the main problems of the industry inSouthern Sweden is that the research and development intensive sector is toosmall a part of the industry. Moreover, the single market will imply a differentcompetitive situation for Swedish companies, and, therefore, increasedinvestments in research and development will have to be considered in manycompanies.
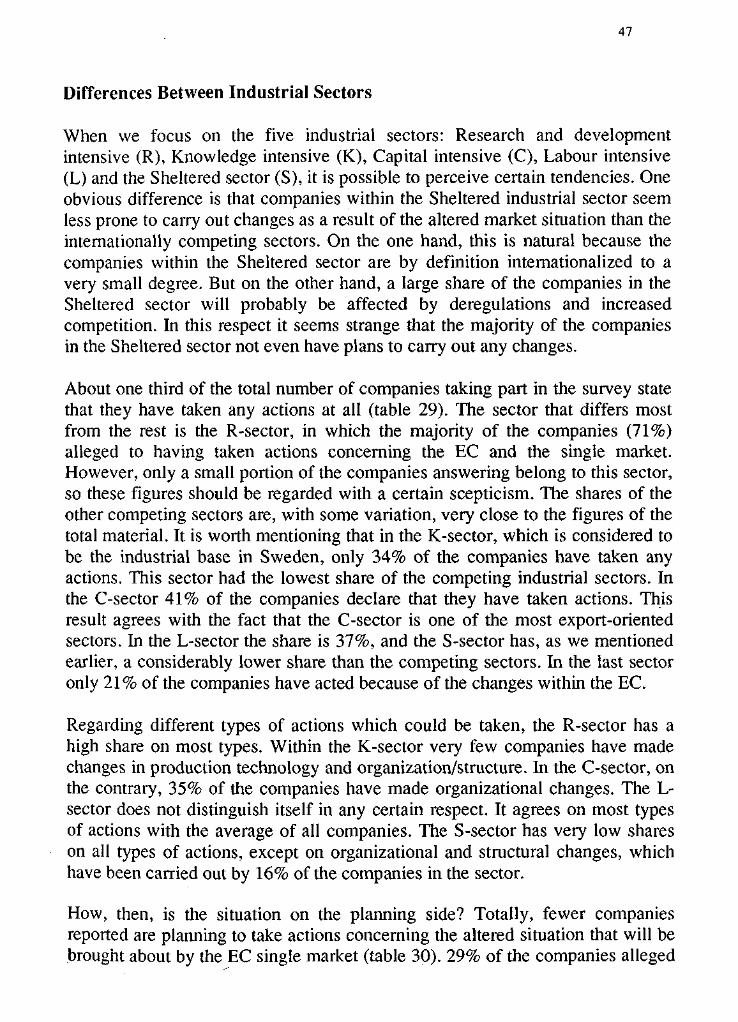
47
Differences Between Industrial Sectors
When we focus on the five industrial sectors: Research and developmentintensive (R), Knowledge intensive (K), Capital intensive (C), Labour intensive(L) and the Sheltered sector (S), it is possible to perceive certain tendencies. Oneobvious difference is that companies within the Sheltered industrial sector seemless prone to carry out changes as a result of the altered market situation than theinternationally competing sectors. On the one hand, this is natural because thecompanies within the Sheltered sector are by definition internationalized to avery small degree. But on the other hand, a large share of the companies in theSheltered sector will probably be affected by deregulations and increasedcompetition. In this respect it seems strange that the majority of the companiesin the Sheltered sector not even have plans to carry out any changes.
About one third of the total number of companies taking part in the survey statethat they have taken any actions at all (table 29). The sector that differs mostfrom the rest is the R-sector, in which the majority of the companies (71%)alleged to having taken actions concerning the EC and the single market.However, only a small portion of the companies answering belong to this sector,so these figures should be regarded with a certain scepticism. The shares of theother competing sectors are, with some variation, very close to the figures of thetotal material. It is worth mentioning that in the K-sector, which is considered tobe the industrial base in Sweden, only 34% of the companies have taken anyactions. This sector had the lowest share of the competing industrial sectors. Inthe C-sector 41% of the companies declare that they have taken actions. Thisresult agrees with the fact that the C-sector is one of the most export-orientedsectors. In the L-sector the share is 37%, and the S-sector has, as we mentionedearlier, a considerably lower share than the competing sectors. In the last sectoronly 21% of the companies have acted because of the changes within the EC.
Regarding different types of actions which could be taken, the R-sector has ahigh share on most types. Within the K-sector very few companies have madechanges in production technology and organization/structure. In the C-sector, onthe contrary, 35% of the companies have made organizational changes. The L-sector does not distinguish itself in any certain respect. It agrees on most typesof actions with the average of all companies. The S-sector has very low shareson all types of actions, except on organizational and structural changes, whichhave been carried out by 16% of the companies in the sector.
How, then, is the situation on the planning side? Totally, fewer companiesreported are planning to take actions concerning the altered situation that will bebrought about by the EC single market (table 30). 29% of the companies alleged
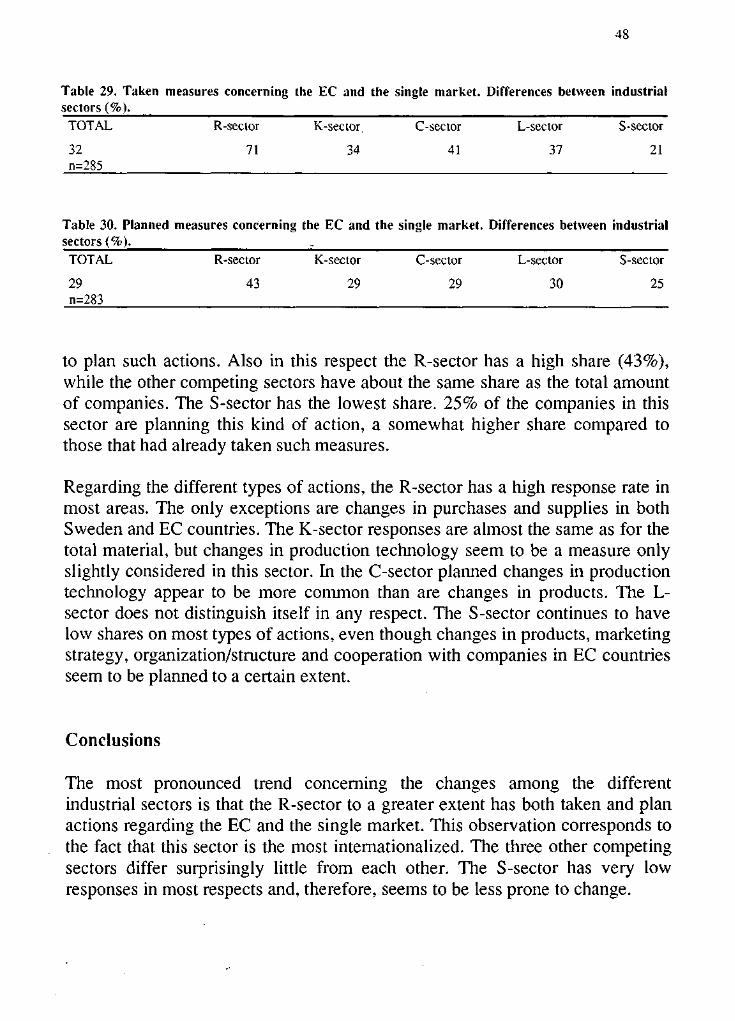
48
Table 29. Taken measures concerning the EC and the single market. Differences between industrialsectors (%).
TOTAL
32n=285
Table 30. Plannedsectors (%).
TOTAL
29n=283
R-sector
71
measures concerning
R-sector
43
K-sector
34
the EC and
K-sector
29
C-sector
41
the single market.
C-sector
29
L-sector
37
Differences between
L-sector
30
S-sector
21
industrial
S-sector
25
to plan such actions. Also in this respect the R-sector has a high share (43%),while the other competing sectors have about the same share as the total amountof companies. The S-sector has the lowest share. 25% of the companies in thissector are planning this kind of action, a somewhat higher share compared tothose that had already taken such measures.
Regarding the different types of actions, the R-sector has a high response rate inmost areas. The only exceptions are changes in purchases and supplies in bothSweden and EC countries. The K-sector responses are almost the same as for thetotal material, but changes in production technology seem to be a measure onlyslightly considered in this sector. In the C-sector planned changes in productiontechnology appear to be more common than are changes in products. The L-sector does not distinguish itself in any respect. The S-sector continues to havelow shares on most types of actions, even though changes in products, marketingstrategy, organization/structure and cooperation with companies in EC countriesseem to be planned to a certain extent.
Conclusions
The most pronounced trend concerning the changes among the differentindustrial sectors is that the R-sector to a greater extent has both taken and planactions regarding the EC and the single market. This observation corresponds tothe fact that this sector is the most internationalized. The three other competingsectors differ surprisingly little from each other. The S-sector has very lowresponses in most respects and, therefore, seems to be less prone to change.
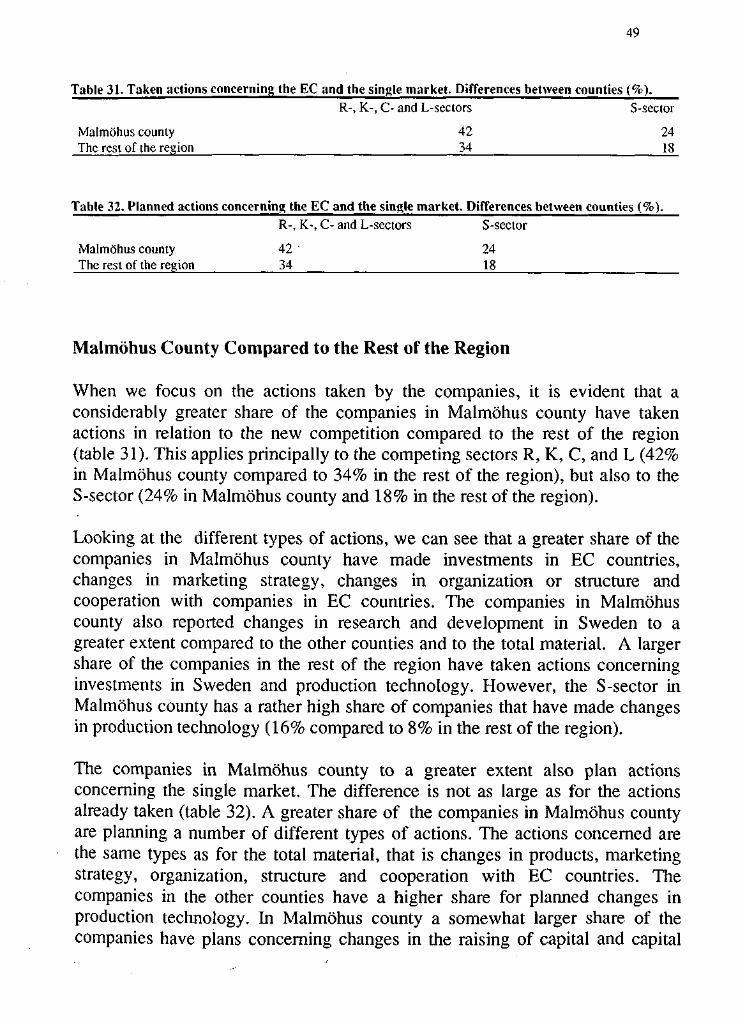
49
Table 31. Taken actions concerning the EC and the single market. Differences between counties (%).R-, K-, C- and L-sectors S-sector
Malmohus county 42 24The rest of the region 34 18_
Table 32. Planned actions concerning the EC and the single market. Differences between counties (%).R-, K-, C- and L-sectors S-sector
Malmohus county 42 " 24The rest of the region 34 18
Malmohus County Compared to the Rest of the Region
When we focus on the actions taken by the companies, it is evident that aconsiderably greater share of the companies in Malmohus county have takenactions in relation to the new competition compared to the rest of the region(table 31). This applies principally to the competing sectors R, K, C, and L (42%in Malmohus county compared to 34% in the rest of the region), but also to theS-sector (24% in Malmohus county and 18% in the rest of the region).
Looking at the different types of actions, we can see that a greater share of thecompanies in Malmohus county have made investments in EC countries,changes in marketing strategy, changes in organization or structure andcooperation with companies in EC countries. The companies in Malmohuscounty also reported changes in research and development in Sweden to agreater extent compared to the other counties and to the total material. A largershare of the companies in the rest of the region have taken actions concerninginvestments in Sweden and production technology. However, the S-sector inMalmohus county has a rather high share of companies that have made changesin production technology (16% compared to 8% in the rest of the region).
The companies in Malmohus county to a greater extent also plan actionsconcerning the single market. The difference is not as large as for the actionsalready taken (table 32). A greater share of the companies in Malmohus countyare planning a number of different types of actions. The actions concerned arethe same types as for the total material, that is changes in products, marketingstrategy, organization, structure and cooperation with EC countries. Thecompanies in the other counties have a higher share for planned changes inproduction technology. In Malmohus county a somewhat larger share of thecompanies have plans concerning changes in the raising of capital and capital
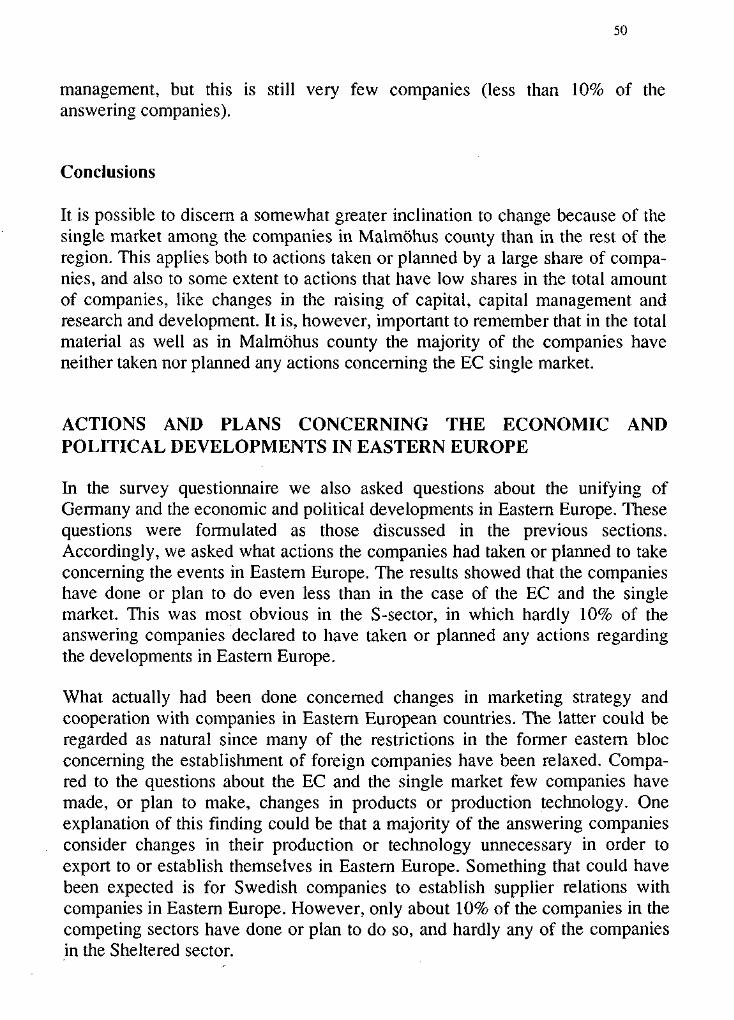
50
management, but this is still very few companies (less than 10% of theanswering companies).
Conclusions
It is possible to discern a somewhat greater inclination to change because of thesingle market among the companies in Malmohus county than in the rest of theregion. This applies both to actions taken or planned by a large share of compa-nies, and also to some extent to actions that have low shares in the total amountof companies, like changes in the raising of capital, capital management andresearch and development. It is, however, important to remember that in the totalmaterial as well as in Malmohus county the majority of the companies haveneither taken nor planned any actions concerning the EC single market.
ACTIONS AND PLANS CONCERNING THE ECONOMIC ANDPOLITICAL DEVELOPMENTS IN EASTERN EUROPE
In the survey questionnaire we also asked questions about the unifying ofGermany and the economic and political developments in Eastern Europe. Thesequestions were formulated as those discussed in the previous sections.Accordingly, we asked what actions the companies had taken or planned to takeconcerning the events in Eastern Europe. The results showed that the companieshave done or plan to do even less than in the case of the EC and the singlemarket. This was most obvious in the S-sector, in which hardly 10% of theanswering companies declared to have taken or planned any actions regardingthe developments in Eastern Europe.
What actually had been done concerned changes in marketing strategy andcooperation with companies in Eastern European countries. The latter could beregarded as natural since many of the restrictions in the former eastern blocconcerning the establishment of foreign companies have been relaxed. Compa-red to the questions about the EC and the single market few companies havemade, or plan to make, changes in products or production technology. Oneexplanation of this finding could be that a majority of the answering companiesconsider changes in their production or technology unnecessary in order toexport to or establish themselves in Eastern Europe. Something that could havebeen expected is for Swedish companies to establish supplier relations withcompanies in Eastern Europe. However, only about 10% of the companies in thecompeting sectors have done or plan to do so, and hardly any of the companiesin the Sheltered sector.
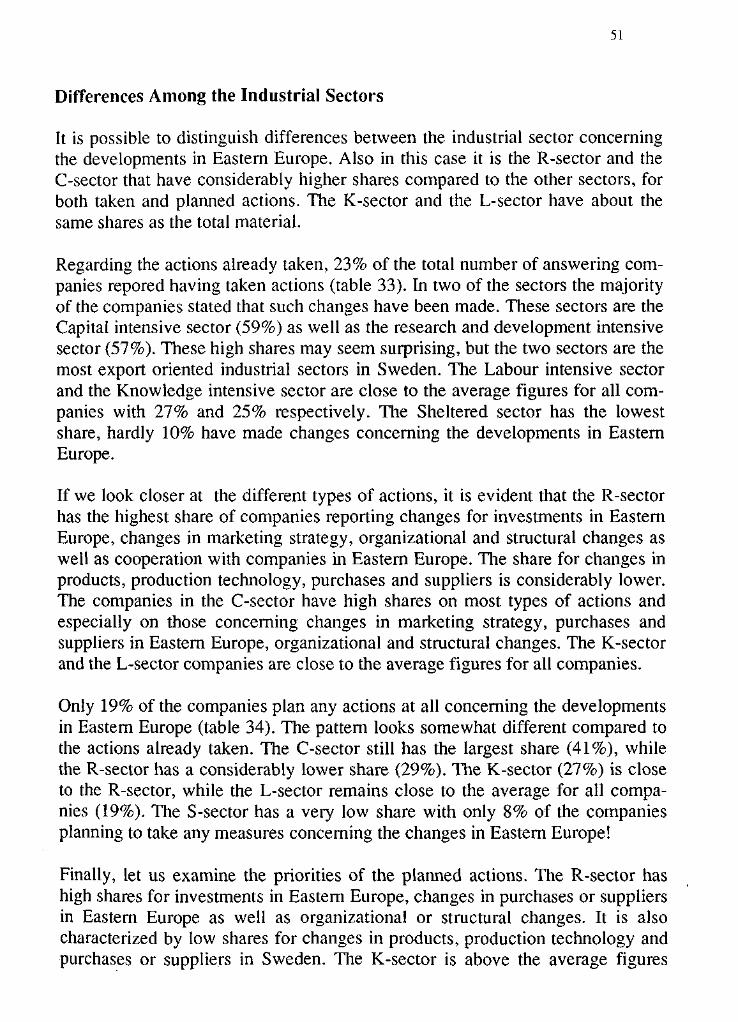
51
Differences Among the Industrial Sectors
It is possible to distinguish differences between the industrial sector concerningthe developments in Eastern Europe. Also in this case it is the R-seetor and theC-sector that have considerably higher shares compared to the other sectors, forboth taken and planned actions. The K-sector and the L-sector have about thesame shares as the total material.
Regarding the actions already taken, 23% of the total number of answering com-panies repored having taken actions (table 33). In two of the sectors the majorityof the companies stated that such changes have been made. These sectors are theCapital intensive sector (59%) as well as the research and development intensivesector (57%). These high shares may seem surprising, but the two sectors are themost export oriented industrial sectors in Sweden. The Labour intensive sectorand the Knowledge intensive sector are close to the average figures for all com-panies with 27% and 25% respectively. The Sheltered sector has the lowestshare, hardly 10% have made changes concerning the developments in EasternEurope.
If we look closer at the different types of actions, it is evident that the R-sectorhas the highest share of companies reporting changes for investments in EasternEurope, changes in marketing strategy, organizational and structural changes aswell as cooperation with companies in Eastern Europe. The share for changes inproducts, production technology, purchases and suppliers is considerably lower.The companies in the C-sector have high shares on most types of actions andespecially on those concerning changes in marketing strategy, purchases andsuppliers in Eastern Europe, organizational and structural changes. The K-sectorand the L-sector companies are close to the average figures for all companies.
Only 19% of the companies plan any actions at all concerning the developmentsin Eastern Europe (table 34). The pattern looks somewhat different compared tothe actions already taken. The C-sector still has the largest share (41%), whilethe R-sector has a considerably lower share (29%). The K-sector (27%) is closeto the R-sector, while the L-sector remains close to the average for all compa-nies (19%). The S-sector has a very low share with only 8% of the companiesplanning to take any measures concerning the changes in Eastern Europe!
Finally, let us examine the priorities of the planned actions. The R-sector hashigh shares for investments in Eastern Europe, changes in purchases or suppliersin Eastern Europe as well as organizational or structural changes. It is alsocharacterized by low shares for changes in products, production technology andpurchases or suppliers in Sweden. The K-sector is above the average figures
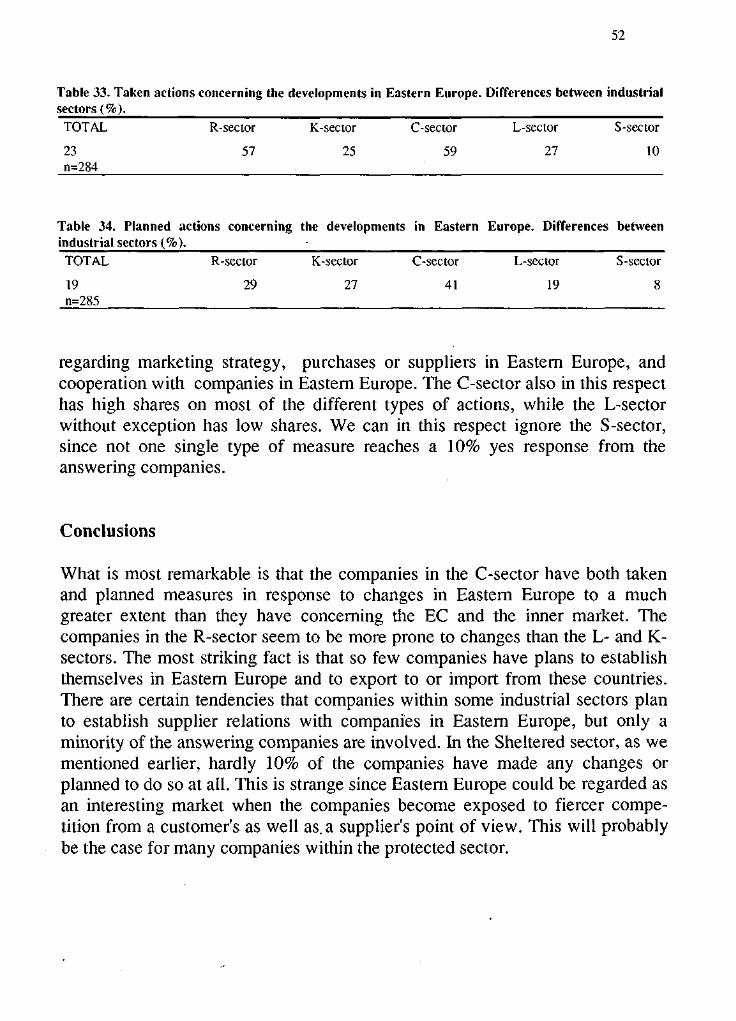
52
Table 33. Taken actions concerning the developments in Eastern Europe. Differences between industrialsectors (%).
TOTAL
23n=284
R-sector
57
K-sector
25
C-sector
59
L-sector
27
S-sector
10
R-sector
29
K-sector
27
C-sector
41
L-sector
19
S-sector
8
Table 34. Planned actions concerning the developments in Eastern Europe. Differences betweenindustrial sectors (%).
TOTAL
19n=285
regarding marketing strategy, purchases or suppliers in Eastern Europe, andcooperation with companies in Eastern Europe. The C-sector also in this respecthas high shares on most of the different types of actions, while the L-sectorwithout exception has low shares. We can in this respect ignore the S-sector,since not one single type of measure reaches a 10% yes response from theanswering companies.
Conclusions
What is most remarkable is that the companies in the C-sector have both takenand planned measures in response to changes in Eastern Europe to a muchgreater extent than they have concerning the EC and the inner market. Thecompanies in the R-sector seem to be more prone to changes than the L- and K-sectors. The most striking fact is that so few companies have plans to establishthemselves in Eastern Europe and to export to or import from these countries.There are certain tendencies that companies within some industrial sectors planto establish supplier relations with companies in Eastern Europe, but only aminority of the answering companies are involved. In the Sheltered sector, as wementioned earlier, hardly 10% of the companies have made any changes orplanned to do so at all. This is strange since Eastern Europe could be regarded asan interesting market when the companies become exposed to fiercer compe-tition from a customer's as well as. a supplier's point of view. This will probablybe the case for many companies within the protected sector.
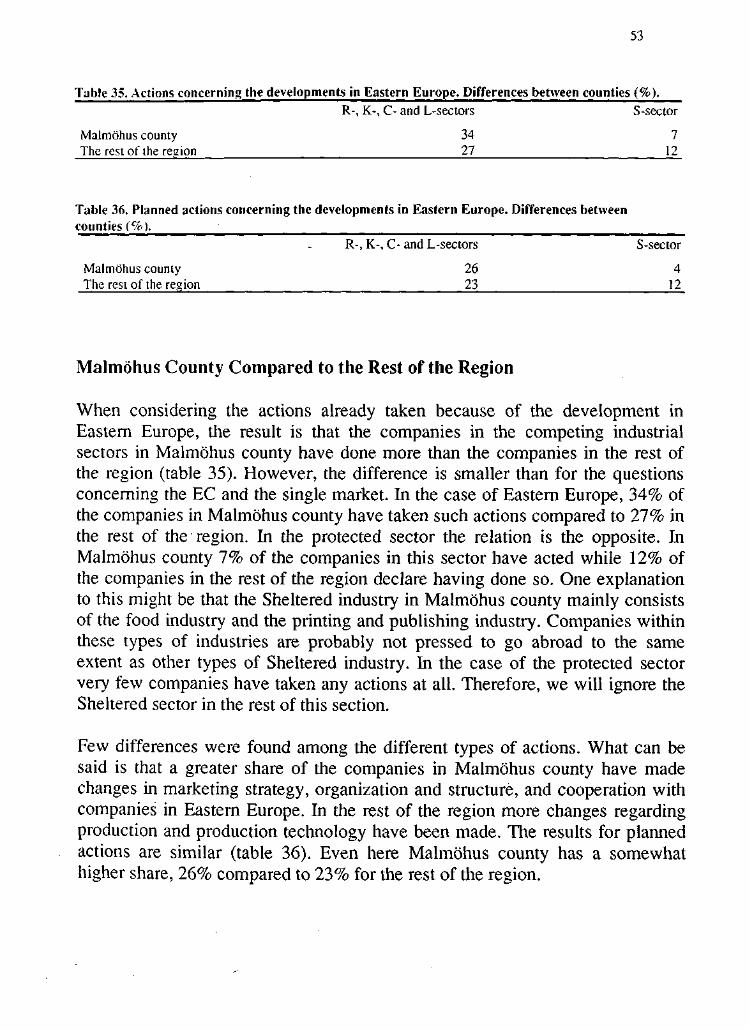
53
Table 35. Actions concerning the developments in Eastern Europe. Differences between counties (%).R-, K-, C- and L-sectors S-sector
Malmohus county 34 7The rest of the reaion 27 12
Table 36. Planned actions concerning the developments in Eastern Europe. Differences betweencounties (%).
R-, K-, C- and L-sectors S-sector
Malmohus county 26 4The rest of the reaion 23 12
Malmohus County Compared to the Rest of the Region
When considering the actions already taken because of the development inEastern Europe, the result is that the companies in the competing industrialsectors in Malmohus county have done more than the companies in the rest ofthe region (table 35). However, the difference is smaller than for the questionsconcerning the EC and the single market. In the case of Eastern Europe, 34% ofthe companies in Malmohus county have taken such actions compared to 27% inthe rest of the region. In the protected sector the relation is the opposite. InMalmohus county 7% of the companies in this sector have acted while 12% ofthe companies in the rest of the region declare having done so. One explanationto this might be that the Sheltered industry in Malmohus county mainly consistsof the food industry and the printing and publishing industry. Companies withinthese types of industries are probably not pressed to go abroad to the sameextent as other types of Sheltered industry. In the case of the protected sectorvery few companies have taken any actions at all. Therefore, we will ignore theSheltered sector in the rest of this section.
Few differences were found among the different types of actions. What can besaid is that a greater share of the companies in Malmohus county have madechanges in marketing strategy, organization and structure, and cooperation withcompanies in Eastern Europe. In the rest of the region more changes regardingproduction and production technology have been made. The results for plannedactions are similar (table 36). Even here Malmohus county has a somewhathigher share, 26% compared to 23% for the rest of the region.
54
Conclusions
The main result when comparing the different counties is that Malmohus countyseems to be somewhat more prone to changes in the competing industrialsectors. The opposite seems to apply to the Sheltered sector.
Expectations and Preparations for the Future
One very relevant aspect of the competitiveness of the industry of SouthernSweden is its readiness for change and its attitudes towards the changing busi-ness environment.
In the previous section we have seen that the most common approach to the on-going turmoil in the European Community is to ignore it. Very little is beingdone and very little is planned as a response to the development or as a pre-action to the development. Even less is being done or planned as a result of thedevelopments in Eastern Europe.
This evaluation of actions, plans and attitudes in the Southern Swedish industryis relevant for an attempt to analyse the effects in the production industry ofregional mobilization efforts. Several initiatives for restructuring and inter-nationalization have been taken in the region and on the national level.
THE REGIONAL MOBILIZATION
In the debate concerning the construction of a bridge or a tunnel across Oresund,several local governments, chambers of commerce and individual businessmenhave expressed great concern and awareness of the importance of developing thecompetitiveness of the industry of Southern Sweden. Several local communitieshave launched projects aiming at improving the infrastructure for internationalbusiness.
In planning for the deregulation of the food and agriculture industries severalprojects have been launched to promote change and development in the industry.The government has released funds directed to this purpose. The farmers'association (LRF) has invested in change programmes both for forestry and farmindustries, as has the regional employment agency.
55
The regional governments in all the five counties in Southern Sweden havespecial programmes and efforts directed towards industrial development, inter-nationalization and improvement of industrial competitiveness.
The development of the industry in Southern Sweden has also been supported bypoliticians and officials in Northern Germany - especially Schleswig-Holstein. Aspecial campaign for the Oresund area was launched in the Financial Times inJune 1991. At Lund University a special research group has studied the indu-strial future of the biggest town, Malmo. Positive results from this research havebeen communicated in the local press. The general feeling among politicians andcivil servants is one of awareness, mobilization and ability to act on severallevels.
THE CORPORATE BEHAVIOUR
What are the actual plans, actions and attitudes to change as reported in thequestionnaire from the producing companies in Southern Sweden? In theprevious section were presented figures showing that the overwhelming majorityof companies had not taken any actions in the face of the new situation withincreasing market dynamics and the sudden appearance of several closelylocated low cost labour markets.
Most of the companies have not made plans to do anything either. The gapbetween the mobilization efforts among politicians and civil servants and theplans and actions in the companies is clearly visible.
What about the expectations of companies for the future? One question askedabout the expected sales volume in 1995. This question is an operationalizationof one perspective of the "hope for the future" in the companies.
It was observed that the companies had rather high hopes concerning their futuresales volumes. Very few companies expected in a decline in business volume. Inthe competition exposed sector this figure was 6%. It was only 1% in the Shelte-red sector. As a comparison we also asked the companies about their profitexpectations for the future. In all sectors 70-75% of the companies expectedincreased profits during the same period, while 25% expected declining profits.
A conclusion from these figures is that there is a general belief in increased salesvolume in the future. In one part of the industry there seems to be an awarenessthat cost control can become a problem in a situation with increased compe-titiveness.
56
At the same time it is obvious that a large portion of those who responded hadfaith in the future. It should be noted that more than 50% of the companieschoose not to answer to this question. Here we can trace a genuine uncertaintyabout the future profits of the companies.
Differences Between Industrial Sectors and Counties
The hopes for growth in the future differed among the industrial sectors. Themost positive view of the future occurred in the research intensive R-sector,where an increase in turnover of more than 50% was expected by a majority ofthe companies. In the Knowledge intensive sector and the Capital intensivesector 33% of the companies expected growth greater than 50%. The lowestexpectations were found in the Labour intensive sector, 28%. The Shelteredsector had as high hopes for the future as the K-sector and the C-sector.
Malmohus county is more urban and more densely populated than the othercounties in the region. In a comparison between Malmohus county and the othercounties in the region there is a difference in expectations between the sectorswithin the competition exposed sector and the protected sector. In Malmohuscounty the competition exposed sectors have higher hopes for the future than theprotected sector. 34% expected growth greater than 50% in the competitionexposed sectors in Malmohus county, while 28% of the Sheltered sector expec-ted such a large growth in volume. In the other counties the relation was the re-verse. 33% of the Sheltered sector expected large growth, while only 28% of thecompanies in the competition exposed sectors expected large growth (table 37).
The differences between different counties within the Southern Swedish regionthat we have found in our analysis will create a special problem in the regionaldevelopment. These findings are supported by results in a study by ourcolleagues6 who describe the following situation:
Malmohus county has an industrial- and service sector which shows gooddevelopmental characteristics, even if the sector starts from a rather weakposition.
Skane, seen as a whole, is a much weaker region. The structure of industryand services in Kristianstad county will demand substan-tial efforts tosustain its competitiveness in an international context.
6 Alsen et al. (1991) pp. 140 ff.
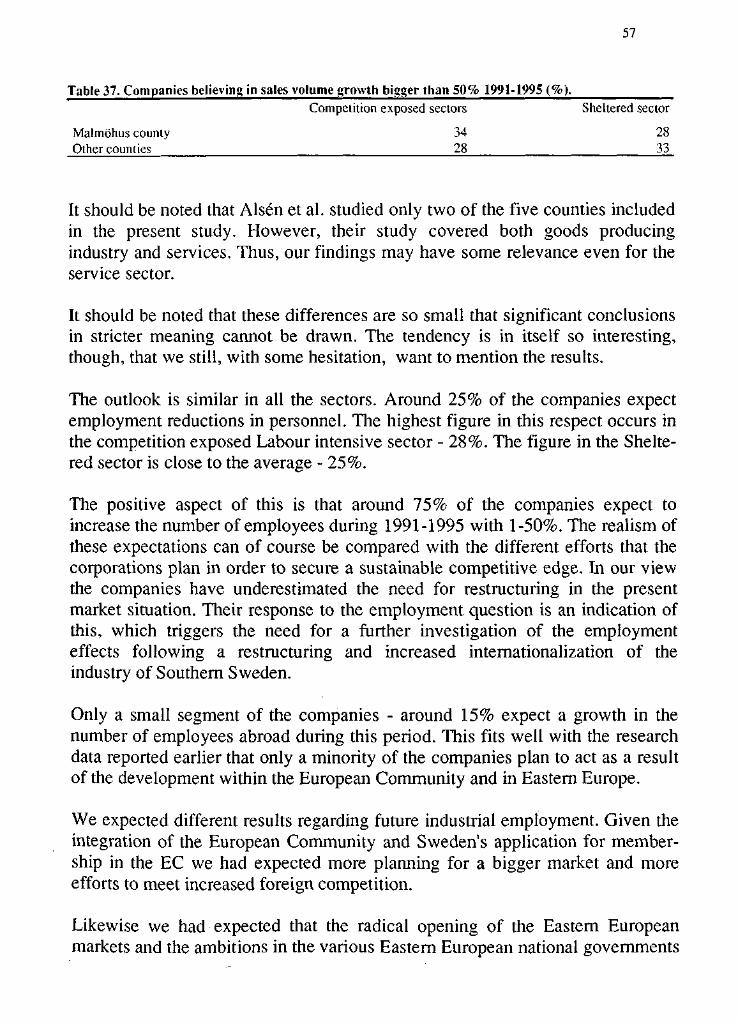
57
Table 37. Companies believing in sales volume growth bigger than 50% 1991-1995 (%).Competition exposed sectors Sheltered sector
Malmohus county 34 28Other counties 28 33
It should be noted that Alsen et al. studied only two of the five counties includedin the present study. However, their study covered both goods producingindustry and services. Thus, our findings may have some relevance even for theservice sector.
It should be noted that these differences are so small that significant conclusionsin stricter meaning cannot be drawn. The tendency is in itself so interesting,though, that we still, with some hesitation, want to mention the results.
The outlook is similar in all the sectors. Around 25% of the companies expectemployment reductions in personnel. The highest figure in this respect occurs inthe competition exposed Labour intensive sector - 28%. The figure in the Shelte-red sector is close to the average - 25%.
The positive aspect of this is that around 75% of the companies expect toincrease the number of employees during 1991-1995 with 1-50%. The realism ofthese expectations can of course be compared with the different efforts that thecorporations plan in order to secure a sustainable competitive edge. In our viewthe companies have underestimated the need for restructuring in the presentmarket situation. Their response to the employment question is an indication ofthis, which triggers the need for a further investigation of the employmenteffects following a restructuring and increased internationalization of theindustry of Southern Sweden.
Only a small segment of the companies - around 15% expect a growth in thenumber of employees abroad during this period. This fits well with the researchdata reported earlier that only a minority of the companies plan to act as a resultof the development within the European Community and in Eastern Europe.
We expected different results regarding future industrial employment. Given theintegration of the European Community and Sweden's application for member-ship in the EC we had expected more planning for a bigger market and moreefforts to meet increased foreign competition.
Likewise we had expected that the radical opening of the Eastern Europeanmarkets and the ambitions in the various Eastern European national governments
58
to improve business conditions in their countries, would lead to action bySwedish companies.
Especially in the Labour intensive sector we can see some distinct advantageswith low cost labour markets in our neighbouring countries. This advantagecould be exploited if production is moved to these countries. On the other hand,the low cost labour market can be a threat to the industry of Southern Sweden ifcompanies from other countries exploit this advantage or if local companies inthe East European countries increase their exports. In our research concerningthe industrial future of Southern Sweden it seems relevant to supplement theaggregated data for the whole region with a number of in-depth studies ofcompanies and communities that use approaches to competitiveness whichdeviate from the average.
NO EXPECTED CHANGES IN IMPORT AND EXPORT
There are no notable ambitions among the companies in the survey to increasetheir exports in the period between 1991 and 1995. More than 90% of thecompanies have no plans to change their purchasing patterns. These purchasingpatterns are very stable long term relations. Around 50% of supplier relations arebetween 6-15 years old and more than 30% are more than 16 years old.
To this it can be added that the main supplier networks are located withinSouthern Sweden, both in the competition exposed and the protected sectors ofthe industry. The second layer in the network cobweb is located within Swedenand the other Nordic countries.
International supplier networks are spread over several countries. We cannotfind any specific network structure developed around the Baltic. Germany is animportant supplier market, but the main connections are with the central andsouthern parts of Germany. It could be noted that among foreign supplier rela-tions there are only 9 connections with Northern Germany in the total material.Only one of these relations is with the Schleswig-Holstein region.
59
The Development of Competitiveness - an EmergingPattern
One emerging pattern is that most business in Southern Sweden is local. Mostcompanies believe in future growth and increased employment. Most companiesare not concerned about the emerging market developments in our neighbouringcountries.
Few companies have reacted to the changing market dynamics. There is slightlymore awareness in Malmohus county than in the other counties. On the whole,the regional mobilization programme have passed by the majority of the compa-nies. The ambitious efforts to create networks and business relations across theBaltic have not yet led to many results - judged by the whole population ofcompanies.
In the interpretation of this material we can supplement the general averageswith comparisons between the sectors and between companies of different sizes.We find that the willingness to act and plan to meet the market changes is biggerin the competition exposed sectors than in the Sheltered sector. In the Shelteredsector only 20% of the companies have taken measures regarding the EuropeanCommunity and 25% planned to do something in the future. In the competitionexposed sectors 37% had acted and 30% planned to do so. We interpret thelower figure to mean that those who had already acted interpreted the "plan-question" as "other plans not already in progress".
Concerning Eastern Europe, only 10% of the companies in the S-sector hadacted in any way, such as changing the company's products, sales or organiza-tion. In the other sectors the corresponding figure was 29%.
If we make a comparison between small and large companies we also find cleardifferences. In the Sheltered sector 12% of the small companies had taken mea-sures in response to the challenge of the EC 1992 scenario. 25% of the largecompanies in this sector had done so.
In the competition exposed sectors 33% of the small companies had acted withregard to EC, while the corresponding figure for the large companies was 50%.
For Eastern Europe 8% of the small companies and 25% of the large companiesin the Sheltered sector had taken action. In the competition exposed sectors thecorresponding figures were 23% and 42%.
60
Table 38. Actions and plans - Sheltered sector and competition exposed sectors (%).Sheltered sector Other sectors
Actions vs EC 20 36Plans vs EC 25 30Actions vs E. Europe 10 30Plans vs E. Europe 8 23
Table 39. Actions and plans - differences between small and large companies (%).
Actions EC, S-sectorPlans EC, S-sector
Actions EC, Other sectorsPlans EC, Other sectors
Actions E. Europe, S-sectorPlans E. Europe, S-sector
Actions E. Europe, Other sectorsPlans E. Europe, Other sectors
Small companies1215
3332
99
2320
Large companies2550
5033
2513
4217
In these figures we can see greater awareness and more action in the larger com-panies compared to the smaller ones. We can also see more activity in thecompetition exposed sectors than in the Sheltered sector.
The problem of stimulating activity in the companies remains. In the region, theSheltered sector has a strong position in number of companies, in volumes ofbusiness and in employees. Likewise the small and medium sized companies aremany, have large proportion of the business volume and employ about half thetotal volume of employees.
Even among the large, competition exposed companies the amount of activity issurprisingly low. One half of the large competition exposed companies have nottaken any measure to face the new market situation.
Conclusions
Even after controlling for these differences between different types of compa-nies, the overall picture still remains - a picture of little proaction and a limitedamount of awareness in the everyday life of the companies in spite of the inte-rest level among policy makers and regional planners is high.
It might be interesting to compare our results with results from a survey with1,800 Danish companies and 160 trade and peak associations, except associa-
61
tions of agriculture and fishing. This study by Niels Chr. Sidenius found thatDanish industry also has high hopes concerning the completion of the innermarket. 40% of the industry estimates that the inner market will have a positiveeffect on the export performance of the Danish companies. 32% of the compa-nies also assess that the effects on profitability will be positive.
However, 62% of the companies in that survey also declared that they have notdeveloped any EC strategy. Only 28% of the companies have given higherpriority to the EC as a result of the inner market. 55% have no intention tochange their market priorities. Only 1% of the producing companies have inter-nationalized themselves in other EC countries by setting up production compa-nies or trade companies.
In short, the level of internationalization of Danish manufacturing firms islow when measured on these three dimensions.7
A conclusion from comparison with the Danish study is that the companies inSouthern Sweden are not at all unique in having a hopeful view of the future anddoing relatively little to prepare for it. If this tendency is more general it couldmean that those companies and those countries which have a proactive or inter-active approach will create the future for the others.
But what explanations can be found for the rather passive way that the industryin Southern Sweden tackles the future?
One explanation could be that the international situation has so many differentand sudden developments that the managers in the companies in SouthernSweden find the market situation difficult to interpret. Therefore, the commonreaction is to wait and see what happens next. Perhaps the situation will be a bitmore stable and create a solid ground for competitive analysis in the near future?
A complementary explanation could be the recession. Companies have problemsenough in their daily activity. Perhaps the times should be a little better andmore money should be earned before it is invested in foreign ventures or exportor restructuring? Two circumstances, however, contradict this explanation. Oneis that the survey was made before the recession was clearly noticed. One othercircumstance is that the companies have rather high hopes for the future.
A third explanation could be that there are segments of the companies inSouthern Sweden which have a very domestic orientation. If the vast majority of
7 Sidenius (1991) pp. 6-7.
62
the customers are local, and the international context creates obstacles forinternational business for the companie's products, it is sometimesunderstandable that the working hypothesis of the coiporate top managements ofsuch companies is one that views the market as local. If that is the case, thesecompanies of Southern Sweden are not interested in changes in surroundingmarkets. Perhaps the general feeling is that deregulation will not be a realityafter all. Perhaps companies in the Sheltered sector devote their time and energyto lobbying in the political system. The approach would then be to invest insustainable regulation rather that to develop sustainable competitiveness.
A fourth explanation would be that the market developments around us areexaggerated by mass media and the politicians and that the implications in realindustrial life will be negligible.
The way we understand the developments abroad, it must be clearly stated that itis real effort to change the global competitive situation. Several governments,including the Swedish government, have invested a lot of time and money in thedevelopment of a Europe with industrial strength. This is done against the back-ground that the United States and several Pacific states have developed a lead inthis area.
We also know that there are several international companies - including someSwedish companies - which do not wait and see. They take an active part in thecreation of the new market conditions. At the same time they move their ownbusiness frontiers ahead. The purpose of the European integration is to increasethe competition between European companies. Many companies have receivedthat signal.
This leads us to two general conclusions:
The first conclusion is that market development in the coming years willcreate great surprises to many companies in Southern Sweden. For thosewho have not chosen pre-action, the demand for adaptation can be suddenand difficult. It is our belief that quite a number of companies will sufferin this process.
The second conclusion is that in the search for models and patterns fordevelopment of global competitiveness in a regional context, it isnecessary to supplement studies of the whole population of companies andthe average figures. This is the next phase of our research.
63
We will search for unique combinations of productions factors, customers,supporting and competing industries and unique strategies. These factors will berelated to the regional infrastructure and governmental actions. Thus we willanalyse patterns of corporate development and success for the minority group ofcompanies - those who analyze and act early. Findings from these companiescan create insights that may support the regional development in a broadersense.
Our second conclusion has theoretical as well as methodological consequences.In the introduction to this paper we described our theoretical platform. In theanalysis of the industry structure and the description of the present actions andplans in the industry of Southern Sweden we use the product cycle theory andMichael Porters work in a neoclassical context. This static approach is very clearand concise in that it works very well for structural analysis and for present statesnapshots of the industry activities and plans.
In addition to this structural analysis, we search for explanations to successfuldevelopment processes and well working competitive behaviour. Therefore, wewill realize the need to use the theories and concepts in a more dynamicapproach. This increased focus on dynamism and change processes also meansthat we include methods that can capture important aspects of these processes.Examples of such methods are historical analysis, in-depth case descriptions,analysis of critical choices in development processes, analysis of dominatingactors, scenario-writing, Delphi techniques, interactive seminars and fieldexperiments.
65
Part3
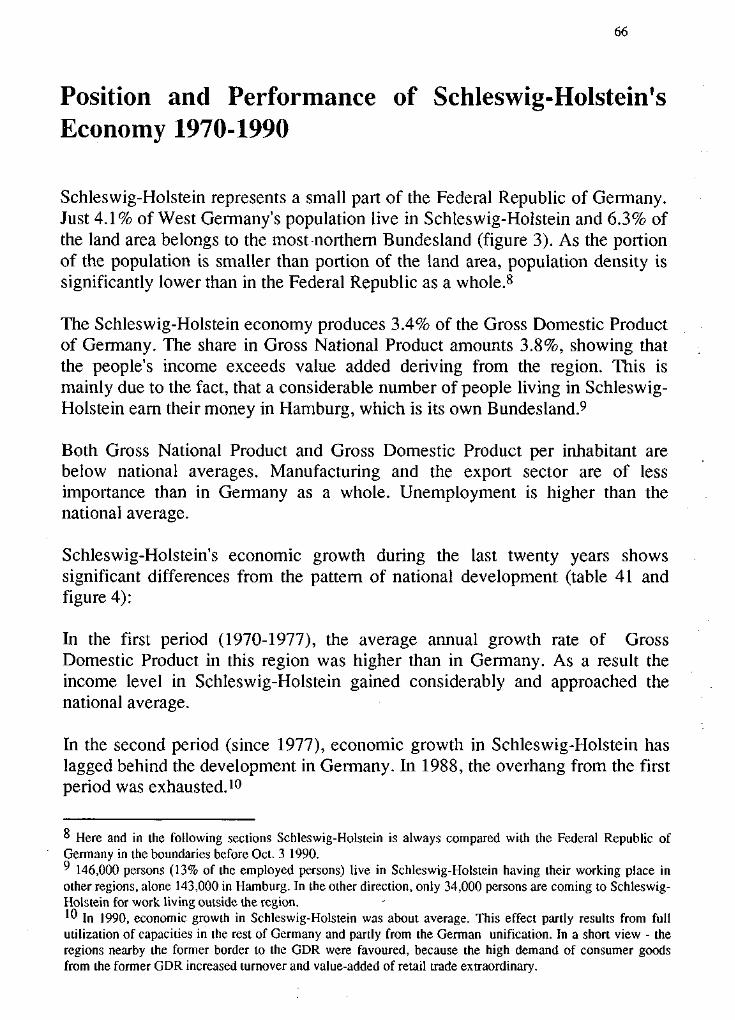
66
Position and Performance of Schleswig-Holstein'sEconomy 1970-1990
Schleswig-Holstein represents a small part of the Federal Republic of Germany.Just 4.1% of West Germany's population live in Schleswig-Holstein and 6.3% ofthe land area belongs to the most northern Bundesland (figure 3). As the portionof the population is smaller than portion of the land area, population density issignificantly lower than in the Federal Republic as a whole.8
The Schleswig-Holstein economy produces 3.4% of the Gross Domestic Productof Germany. The share in Gross National Product amounts 3.8%, showing thatthe people's income exceeds value added deriving from the region. This ismainly due to the fact, that a considerable number of people living in Schleswig-Holstein earn their money in Hamburg, which is its own Bundesland.9
Both Gross National Product and Gross Domestic Product per inhabitant arebelow national averages. Manufacturing and the export sector are of lessimportance than in Germany as a whole. Unemployment is higher than thenational average.
Schleswig-Holstein's economic growth during the last twenty years showssignificant differences from the pattern of national development (table 41 andfigure 4):
In the first period (1970-1977), the average annual growth rate of GrossDomestic Product in this region was higher than in Germany. As a result theincome level in Schleswig-Holstein gained considerably and approached thenational average.
In the second period (since 1977), economic growth in Schleswig-Holstein haslagged behind the development in Germany. In 1988, the overhang from the firstperiod was exhausted.10
° Here and in the following sections Schleswig-Holstein is always compared with the Federal Republic ofGermany in the boundaries before Oct. 3 1990." 146,000 persons (13% of the employed persons) live in Schleswig-Holstein having their working place inother regions, alone 143,000 in Hamburg. In the other direction, only 34,000 persons are coming to Schleswig-Holstein for work living outside the region.1 0 In 1990, economic growth in Schleswig-Holstein was about average. This effect partly results from fullutilization of capacities in the rest of Germany and partly from the German unification. In a short view - theregions nearby the former border to the GDR were favoured, because the high demand of consumer goodsfrom the former GDR increased turnover and value-added of retail trade extraordinary.

67
Rendsburg-Eckernforde
borders of the Landkreiseand kreisfreie Stddte
e 3. Schleswig-Holstein and its counties.
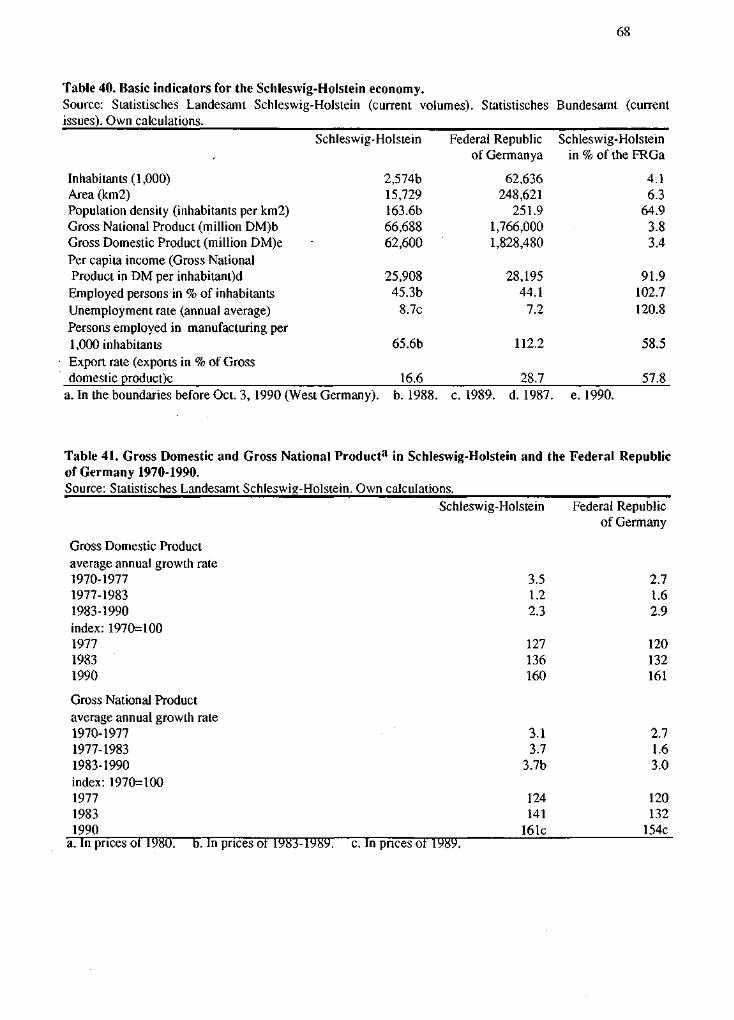
68
Table 40. Basic indicators for the Schleswig-Holstein economy.Source: Statistisches Landesamt Schleswig-Holstein (current volumes). Statistisches Bundesamt (currentissues). Own calculations.
Inhabitants (1,000)Area (km2)Population density (inhabitants per km2)Gross National Product (million DM)bGross Domestic Product (million DM)ePer capita income (Gross NationalProduct in DM per inhabitant^Employed persons in % of inhabitantsUnemployment rate (annual average)Persons employed in manufacturing per1,000 inhabitantsExport rate (exports in % of Grossdomestic producpc
a. In the boundaries before Oct. 3, 1990 (West Germany), b. 1988. c. 1989. d. 1987. e. 1990.
Schleswig-Holstein
2,574b15,729163.6b66,68862,600
25,90845.3b
8.7c
65.6b
16.6
Federal Republicof Germanya
62,636248,621
251.91,766,0001,828,480
28,19544.1
7.2
112.2
28.7
Schleswig-Holsteinin % of the FRGa
4.16.3
64.93.83.4
91.9102.7120.8
58.5
57.8
Table 41. Gross Domestic and Gross National Producta in Schleswig-Holstein and the Federal Republicof Germany 1970-1990.Source: Statistisches Landesamt Schleswig-Holstein. Own calculations.
Gross Domestic Productaverage annual growth rate1970-19771977-19831983-1990index: 1970=100197719831990
Gross National Productaverage annual growth rate1970-19771977-19831983-1990index: 1970=100197719831990
a. In prices of 1980. b. In prices of 1983-1989. c. In pnces of 1989.
Schleswig-Holstein
3.51.22.3
127136160
3.13.7
3.7b
124141
161c
Federal Republicof Germany
2.71.62.9
120132161
2.71.63.0
120132
154c
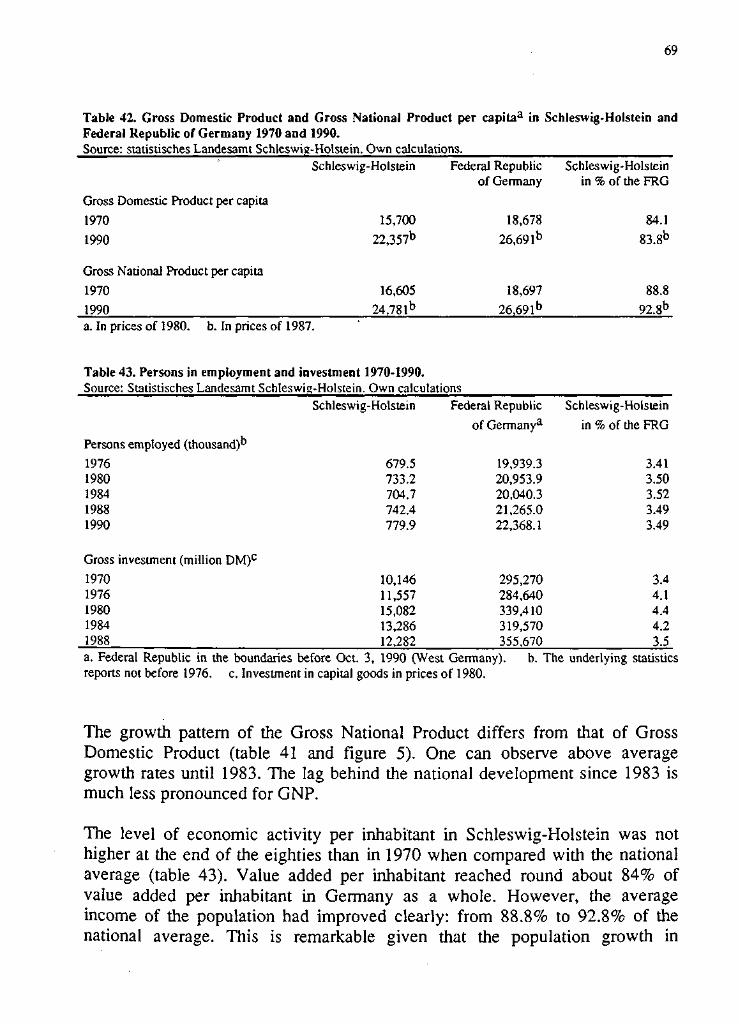
69
Table 42. Gross Domestic Product and Gross National Product per capitaa in Schleswig-Holstein andFederal Republic of Germany 1970 and 1990.Source: statistisches Landesamt Schleswig-Holstein. Own calculations.
Gross Domestic Product per capita
1970
1990
Gross National Product per capita
1970
1990a. In prices of 1980. b. In prices of
Schleswig-Holstein
15,700
22,357°
16,605
24,781b
1987.
Federal Republicof Germany
18,678
26,691°
18,697
26,691°
Schleswig-Holsteinin % of the FRG
84.1
83.8b
88.8
92.8°
Table 43. Persons in employment and investment 1970-1990.Source: Statistisches Landesamt Schleswig-Holstein. Own calculations
Persons employed (thousand)0
19761980198419881990
Gross investment (million DM)C
19701976198019841988
Schleswig-Holstein
679.5733.2704.7742.4779.9
10,14611,55715,08213,28612,282
Federal Republic
of Germanya
19,939.320,953.920,040.321,265.022,368.1
295,270284,640339,410319,570355,670
Schleswig-Holstein
in % of the FRG
3.413.503.523.493.49
3.44.14.44.23.5
a. Federal Republic in the boundaries before Oct. 3, 1990 (West Germany),reports not before 1976. c. Investment in capital goods in prices of 1980.
b. The underlying statistics
The growth pattern of the Gross National Product differs from that of GrossDomestic Product (table 41 and figure 5). One can observe above averagegrowth rates until 1983. The lag behind the national development since 1983 ismuch less pronounced for GNP.
The level of economic activity per inhabitant in Schleswig-Holstein was nothigher at the end of the eighties than in 1970 when compared with the nationalaverage (table 43). Value added per inhabitant reached round about 84% ofvalue added per inhabitant in Germany as a whole. However, the averageincome of the population had improved clearly: from 88.8% to 92.8% of thenational average. This is remarkable given that the population growth in
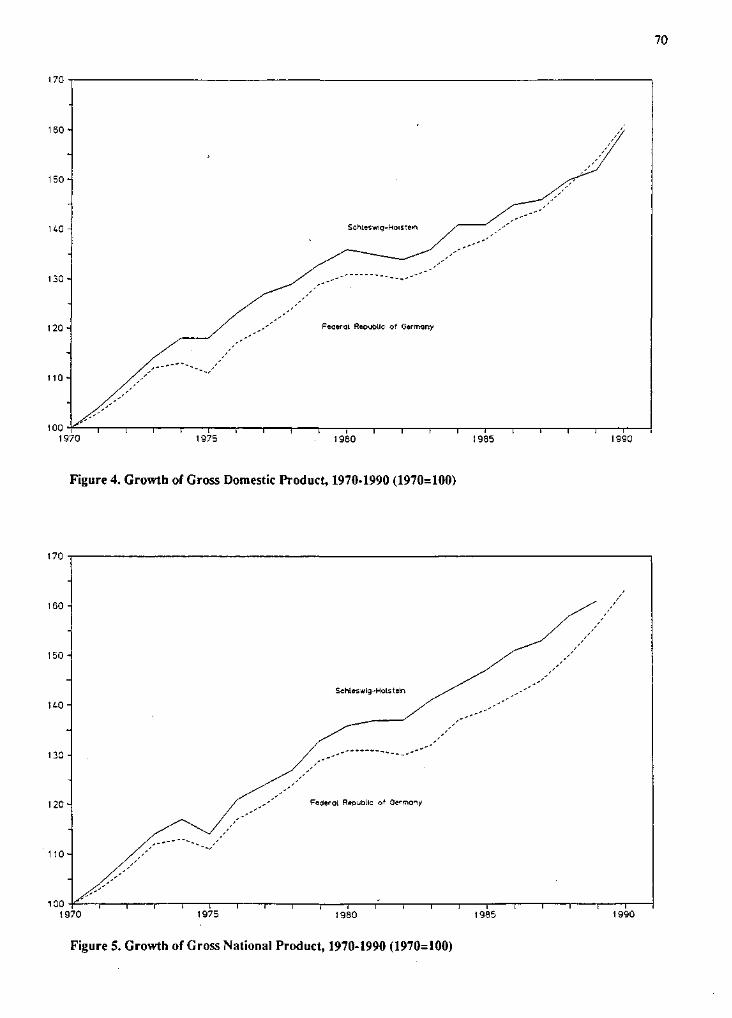
170
160 -
150 -
K0 -
130-
120 -
110-
100
Schleswig-Hoistein
Feaerat Republic of Germany
70
1970 1975 1980 1985
Figure 4. Growth of Gross Domestic Product, 1970-1990 (1970=100)
1990
1 /U ~
160 -
150 -
-
140-
130 -
120-
110-
100 - r i T~
Schleswlg-Holsteln ^ ^
/ ,'' Federal Reoubtlc o' Germany
I I I I I I \ 1 1 1 I I I
/ /
yS
I I I I I1970 1975 1980 1985
Figure 5. Growth of Gross National Product, 1970-1990 (1970=100)
1990
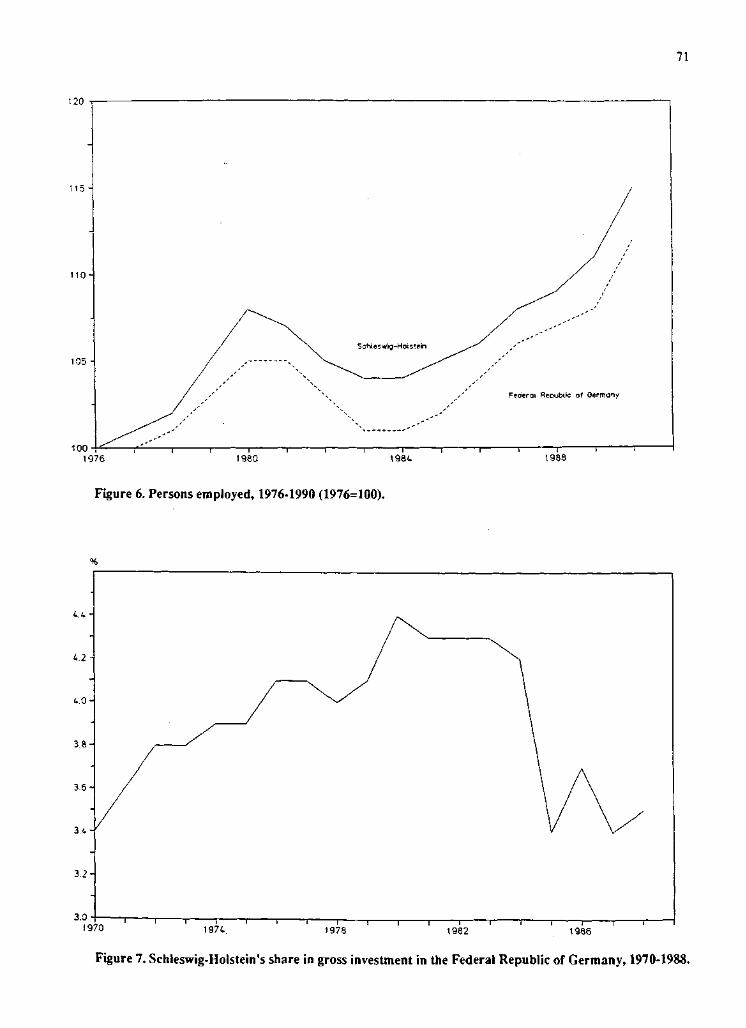
71
120
115-
110-
105 -
100-*1976
Federal ReoubUc of Germany
1984 1988
Figure 6. Persons employed, 1976-1990 (1976=100).
4.4-
4.2 -
4.0-
3.8-
3.6-
3.4-
3.2-
3.01970
1 1 1 1 1—1974. 1978
1 1 r1982
"1 11986
Figure 7. Schleswig-Holstein's share in gross investment in the Federal Republic of Germany, 1970-1988.
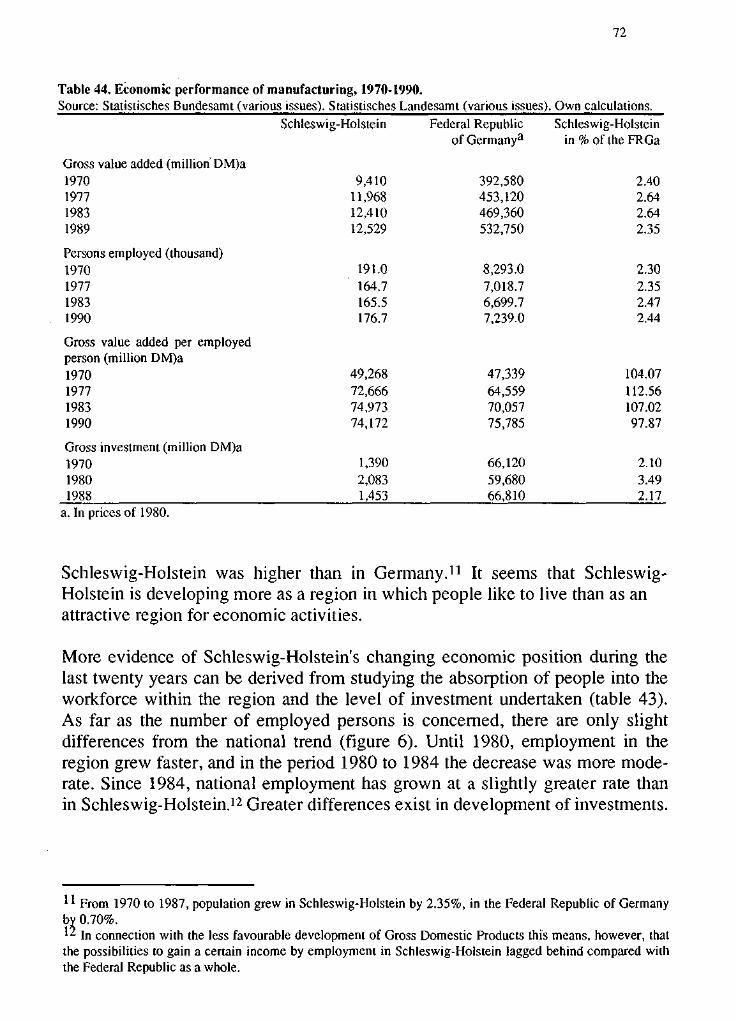
72
Table 44. Economic performance of manufacturing, 1970-1990.Source: Statistisches Bundesamt (various issues). Statistisches Landesamt (various issues). Own calculations.
Gross value added (million DM)a1970197719831989
Persons employed (thousand)1970197719831990
Gross value added per employedperson (million DM)a1970197719831990
Gross investment (million DM)a197019801988
Schleswig-Holstein
9,41011,96812,41012,529
191.0164.7165.5176.7
49,26872,66674,97374,172
1,3902,0831,453
Federal Republicof Germanya
392,580453,120469,360532,750
8,293.07,018.76,699.77,239.0
47,33964,55970,05775,785
66,12059,68066,810
Schleswig-Holsteinin % of the FRGa
2.402.642.642.35
2.302.352.472.44
104.07112.56107.0297.87
2.103.492.17
a. In prices of 1980.
Schleswig-Holstein was higher than in Germany.11 It seems that Schleswig-Holstein is developing more as a region in which people like to live than as anattractive region for economic activities.
More evidence of Schleswig-Holstein's changing economic position during thelast twenty years can be derived from studying the absorption of people into theworkforce within the region and the level of investment undertaken (table 43).As far as the number of employed persons is concerned, there are only slightdifferences from the national trend (figure 6). Until 1980, employment in theregion grew faster, and in the period 1980 to 1984 the decrease was more mode-rate. Since 1984, national employment has grown at a slightly greater rate thanin Schleswig-Holstein.12 Greater differences exist in development of investments.
1 1 From 1970 to 1987, population grew in Schleswig-Holstein by 2.35%, in the Federal Republic of Germanyby 0.70%.12 in connection with the less favourable development of Gross Domestic Products this means, however, thatthe possibilities to gain a certain income by employment in Schleswig-Holstein lagged behind compared withthe Federal Republic as a whole.
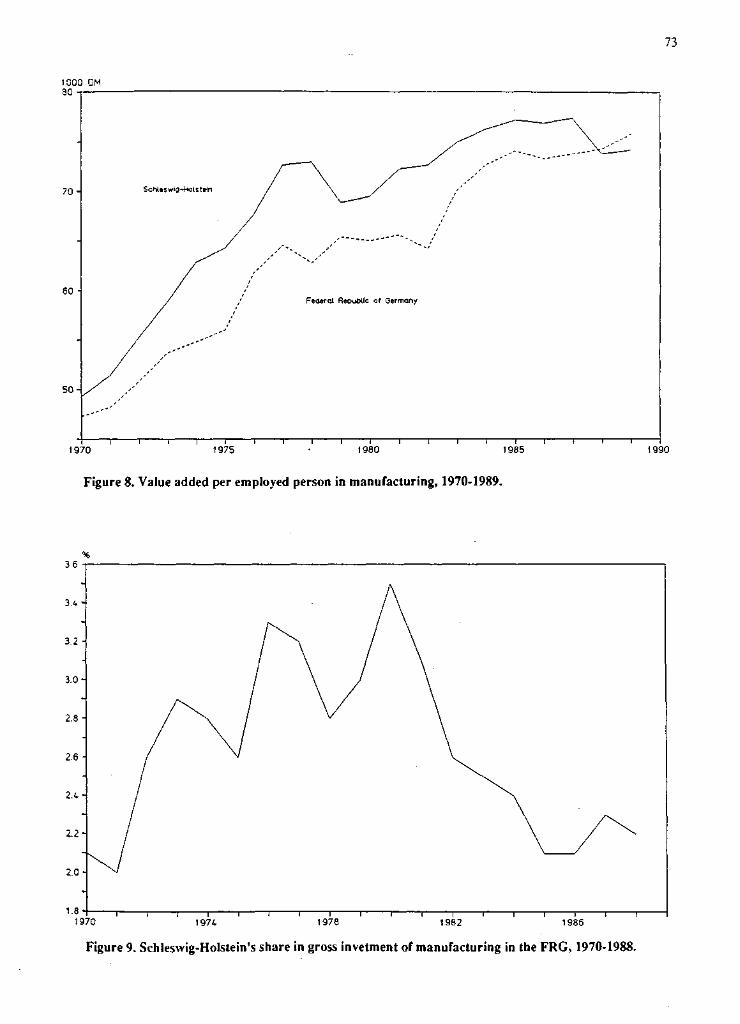
1000 DM30
73
70 -
60 -
5 0 -
Schleswtg-Hoistofn
Federal Republic of Germany
1970 1975 1980 1985 1990
Figure 8. Value added per employed person in manufacturing, 1970-1989.
1970 1974. 1978 1982 1986
Figure 9. Schleswig-Holstein's share in gross invetment of manufacturing in the FRG, 1970-1988.
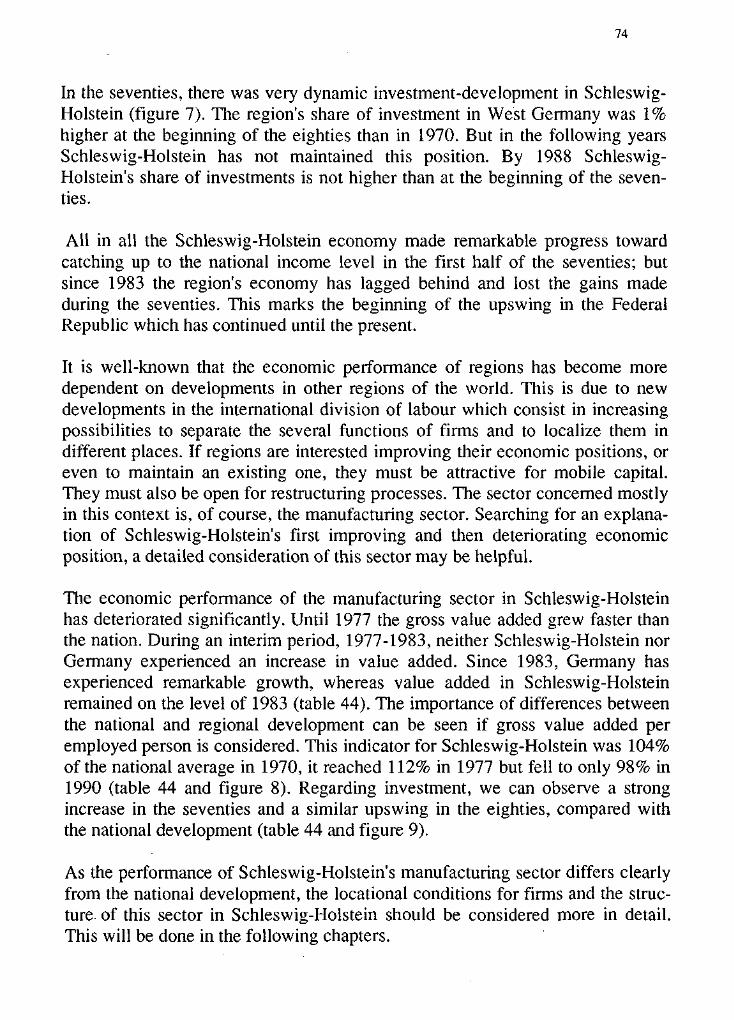
74
In the seventies, there was very dynamic investment-development in Schleswig-Holstein (figure 7). The region's share of investment in West Germany was 1%higher at the beginning of the eighties than in 1970. But in the following yearsSchleswig-Holstein has not maintained this position. By 1988 Schleswig-Holstein's share of investments is not higher than at the beginning of the seven-ties.
All in all the Schleswig-Holstein economy made remarkable progress towardcatching up to the national income level in the first half of the seventies; butsince 1983 the region's economy has lagged behind and lost the gains madeduring the seventies. This marks the beginning of the upswing in the FederalRepublic which has continued until the present.
It is well-known that the economic performance of regions has become moredependent on developments in other regions of the world. This is due to newdevelopments in the international division of labour which consist in increasingpossibilities to separate the several functions of firms and to localize them indifferent places. If regions are interested improving their economic positions, oreven to maintain an existing one, they must be attractive for mobile capital.They must also be open for restructuring processes. The sector concerned mostlyin this context is, of course, the manufacturing sector. Searching for an explana-tion of Schleswig-Holstein's first improving and then deteriorating economicposition, a detailed consideration of this sector may be helpful.
The economic performance of the manufacturing sector in Schleswig-Holsteinhas deteriorated significantly. Until 1977 the gross value added grew faster thanthe nation. During an interim period, 1977-1983, neither Schleswig-Holstein norGermany experienced an increase in value added. Since 1983, Germany hasexperienced remarkable growth, whereas value added in Schleswig-Holsteinremained on the level of 1983 (table 44). The importance of differences betweenthe national and regional development can be seen if gross value added peremployed person is considered. This indicator for Schleswig-Holstein was 104%of the national average in 1970, it reached 112% in 1977 but fell to only 98% in1990 (table 44 and figure 8). Regarding investment, we can observe a strongincrease in the seventies and a similar upswing in the eighties, compared withthe national development (table 44 and figure 9).
As the performance of Schleswig-Holstein's manufacturing sector differs clearlyfrom the national development, the locational conditions for firms and the struc-ture of this sector in Schleswig-Holstein should be considered more in detail.This will be done in the following chapters.
75
CONDITIONS FOR ECONOMIC ACTIVITIES IN SCHLESWIG-HOLSTEIN
The lagging behind of Schleswig-Holstein's economy and especially its manu-facturing sector since the second half of the seventies can probably be tracedback to two underlying factors. One explanation may be an unfavourable indust-rial structure with a local concentration on less dynamic and low-income indust-ries. This will be discussed in detail later. The second explanation could be arelatively unfavourable set of what is called "locational factors". They form thebase for the whole economy of a region. This may be of importance for aregion's position in the interregional locational competition for attracting mobilefactors of production.
Theoretically this set of locational factors might also include the institutional(legal and fiscal) framework in which enterprises operate, at least to the extentthat regulations and tax rates differ between locations. Regulations and most taxrates, however, are the same for Schleswig-Holstein and the Federal Republic asa whole - with a few exceptions concerning local taxes. Enterprises inSchleswig-Holstein, therefore, share the competitive position of others locatedelsewhere in the Federal Republic. Clear differences within the Federal Republiccan be observed with other locational factors. What is still more important, thesedifferences have changed over time. They may well account for the differenteconomic performance in Schleswig-Holstein in the seventies and eighties.
Locational factors can be divided into "hard" factors (as the stock of publicinfrastructure or factor costs) and "soft" factors (as the endowment with culturaland leisure accommodations). The exact ranking of the importance of individuallocational factors is unknown. However, the results from the questionnairesindicate that there exists a number of core factors underlying investment deci-sions with respect to the question of where to invest. The most prominent amongthese core factors are an efficient transport infrastructure (esp. uncongestedmotorways and easy access to airport facilities), the proximity to universities andresearch institutions, a well-educated labour force, and the availability of landfor industrial purposes.13 In the following paragraph, we shall mainly concentrate
1 J When factor (in particular labour) costs are lacking among most of the answers to these questionnaires thismay be due to the fact that the labour market in Germany is heavily regulated (with nearly completely levelledand downward-sticky wage rates as bargained in collective agreements de facto valid nearly all over thecountry). Thus, the wage-rate for most enterprises is a data rather than a price governing supply and demand.The latter argument shows that for fostering economic growth in a country or region the institutionalframework may be as important as the hard factors.
76
on hard factors.14 After that the main lines of institutional framework (includingthe tax- and subsidy-system) will be analysed.
LOCATIONAL FACTORS
Geographical Situation and Transport Infrastructure Facilities
With respect to central Europe Schleswig-Holstein belongs to the more periphe-rical regions. Producers and consumers residing within its borders have to over-come greater distances when engaging in international and interregional tradewith relevant selling and purchasing markets. Investigations by Adlung et al.(1979), Keeble et al. (1981), and by Hoffmeyer et al. (1990) have provided evi-dence that Schleswig-Holstein's location relative to relevant markets is inferiorcompared with that of other German regions. Its proximity to Hamburg and itssituation near the Baltic Sea are favourable.
A peripheral location by itself, however, is not necessarily an impediment toeconomic development. Otherwise countries like Hongkong would never hadhave any chance to participate successfully in the international division oflabour. The location should be taken into account in its interaction with otherfactors. Locational disadvantages can be overcome, if economic integration pro-cesses take place. In this respect, Schleswig-Holstein's economy has gained a lotfrom the enlargement of the European Community in 1973, when Denmark, theUnited Kingdom, and Ireland joining the Community. One can indeed infer fromforeign trade data that Schleswig-Holstein gained more from this trade libera-lisation towards the northern and northwestern neighbouring countries than theFederal Republic did as a whole.
In the eighties, the EC was enlarged at its southern border. This southwardtendency was enhanced by the location of the economic centres themselvesmoving southward during the last twenty years, e.g. in West Germany theRhein-Main-Neckar-Isar area is more and more outperforming the Ruhr area.Thus, Schleswig-Holstein's relative economic location in space somewhatimproved in the seventies but deteriorated in the eighties.
Closely connected to the question of location is the endowment of a region withtransport and communication infrastructure facilities. In this respect, one candetect a similar development showing differences between the seventies and
1 4 For a detailed analysis of Schleswig-Holstein's locational factors see Hoffmeyer et al. (1990, chapter C.)
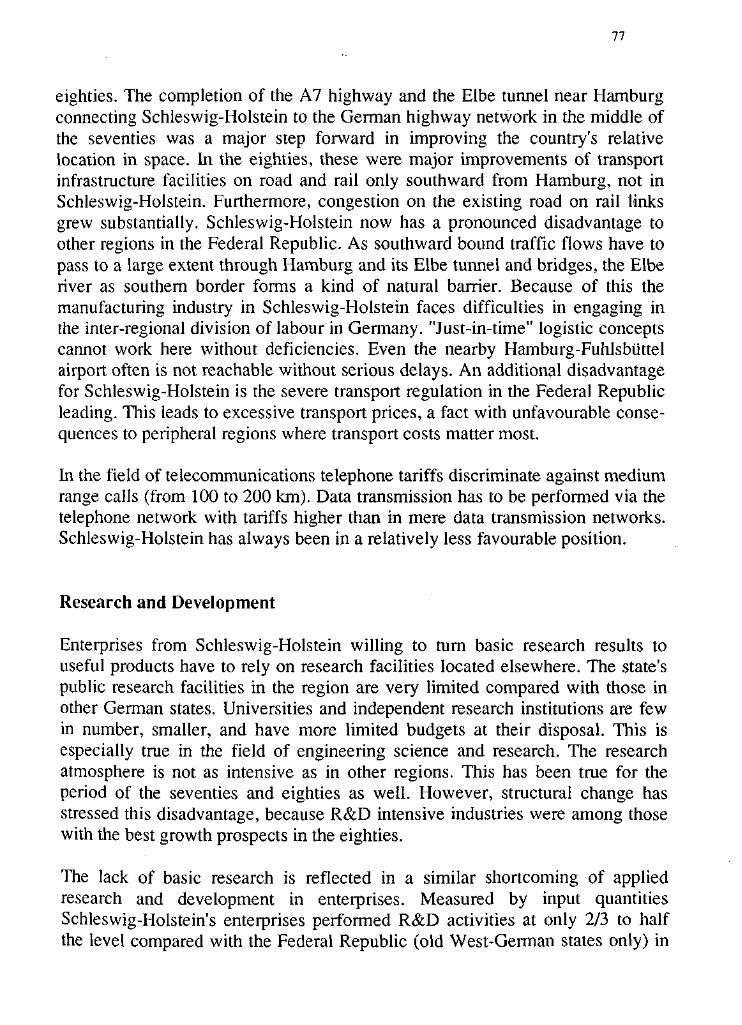
77
eighties. The completion of the A7 highway and the Elbe tunnel near Hamburgconnecting Schleswig-Holstein to the German highway network in the middle ofthe seventies was a major step forward in improving the country's relativelocation in space. In the eighties, these were major improvements of transportinfrastructure facilities on road and rail only southward from Hamburg, not inSchleswig-Holstein. Furthermore, congestion on the existing road on rail linksgrew substantially. Schleswig-Holstein now has a pronounced disadvantage toother regions in the Federal Republic. As southward bound traffic flows have topass to a large extent through Hamburg and its Elbe tunnel and bridges, the Elberiver as southern border forms a kind of natural barrier. Because of this themanufacturing industry in Schleswig-Holstein faces difficulties in engaging inthe inter-regional division of labour in Germany. "Just-in-time" logistic conceptscannot work here without deficiencies. Even the nearby Hamburg-Fuhlsbiittelairport often is not reachable without serious delays. An additional disadvantagefor Schleswig-Holstein is the severe transport regulation in the Federal Republicleading. This leads to excessive transport prices, a fact with unfavourable conse-quences to peripheral regions where transport costs matter most.
In the field of telecommunications telephone tariffs discriminate against mediumrange calls (from 100 to 200 km). Data transmission has to be performed via thetelephone network with tariffs higher than in mere data transmission networks.Schleswig-Holstein has always been in a relatively less favourable position.
Research and Development
Enterprises from Schleswig-Holstein willing to turn basic research results touseful products have to rely on research facilities located elsewhere. The state'spublic research facilities in the region are very limited compared with those inother German states. Universities and independent research institutions are fewin number, smaller, and have more limited budgets at their disposal. This isespecially true in the field of engineering science and research. The researchatmosphere is not as intensive as in other regions. This has been true for theperiod of the seventies and eighties as well. However, structural change hasstressed this disadvantage, because R&D intensive industries were among thosewith the best growth prospects in the eighties.
The lack of basic research is reflected in a similar shortcoming of appliedresearch and development in enterprises. Measured by input quantitiesSchleswig-Holstein's enterprises performed R&D activities at only 2/3 to halfthe level compared with the Federal Republic (old West-German states only) in
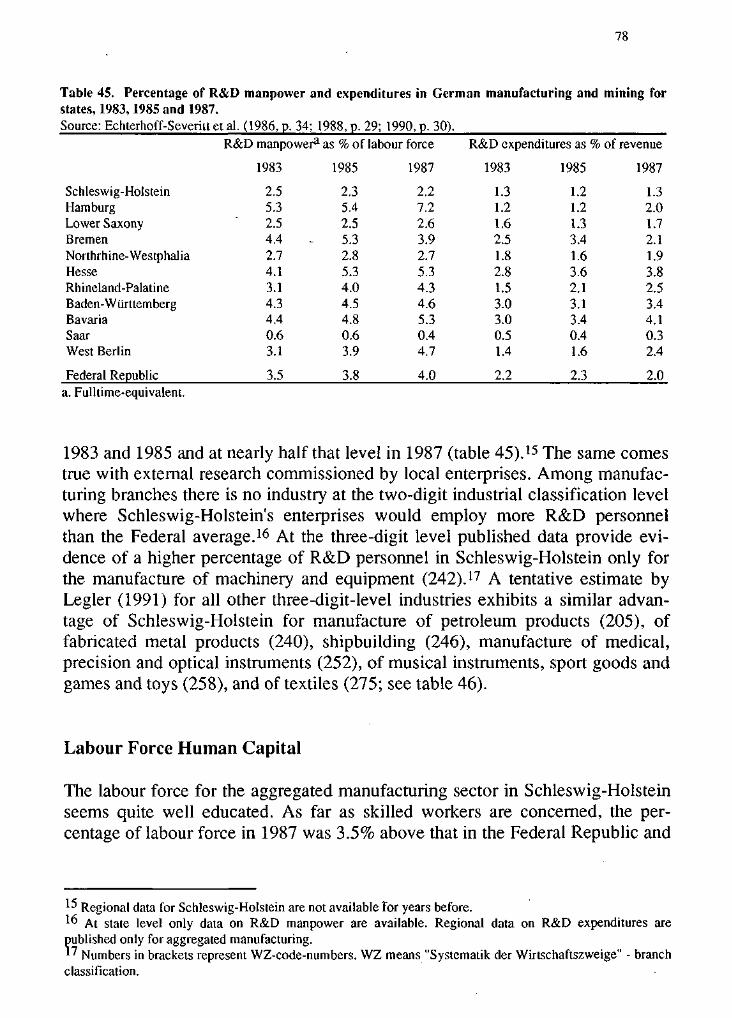
78
Table 45. Percentage of R&D manpower and expenditures in German manufacturing and mining forstates, 1983,1985 and 1987.Source: Echterhoff-Severitt et al. (1986, p. 34; 1988, p. 29; 1990, p. 30).
Schleswig-HolsteinHamburgLower SaxonyBremenNorthrhine-WestphaliaHesseRhineland-PalatineBaden-WiirttembergBavariaSaarWest Berlin
Federal Republic
R&D manpower3 as % of labour
1983
2.55.32.54.42.74.13.14.34.40.63.1
3.5
1985
2.35.42.55.32.85.34.04.54.80.63.9
3.8
force
1987
2.27.22.63.92.75.34.34.65.30.44.7
4.0
R&D expenditures as °i
1983
1.31.21.62.51.82.81.53.03.00.51.4
2.2
1985
1.21.21.33.41.63.62.13.13.40.41.6
2.3
b of revenue
1987
1.32.01.72.11.93.82.53.44.10.32.4
2.0a. Fulltime-equivalent.
1983 and 1985 and at nearly half that level in 1987 (table 45).15 The same comestrue with external research commissioned by local enterprises. Among manufac-turing branches there is no industry at the two-digit industrial classification levelwhere Schleswig-Holstein's enterprises would employ more R&D personnelthan the Federal average.16 At the three-digit level published data provide evi-dence of a higher percentage of R&D personnel in Schleswig-Holstein only forthe manufacture of machinery and equipment (242).17 A tentative estimate byLegler (1991) for all other three-digit-level industries exhibits a similar advan-tage of Schleswig-Holstein for manufacture of petroleum products (205), offabricated metal products (240), shipbuilding (246), manufacture of medical,precision and optical instruments (252), of musical instruments, sport goods andgames and toys (258), and of textiles (275; see table 46).
Labour Force Human Capital
The labour force for the aggregated manufacturing sector in Schleswig-Holsteinseems quite well educated. As far as skilled workers are concerned, the per-centage of labour force in 1987 was 3.5% above that in the Federal Republic and
15 Regional data for Schleswig-Holstein are not available for years before.1 6 At state level only data on R&D manpower are available. Regional data on R&D expenditures arepublished only for aggregated manufacturing.*7 Numbers in brackets represent WZ-code-numbers. WZ means "Systematik der Wirtschaftszweige" - branchclassification.
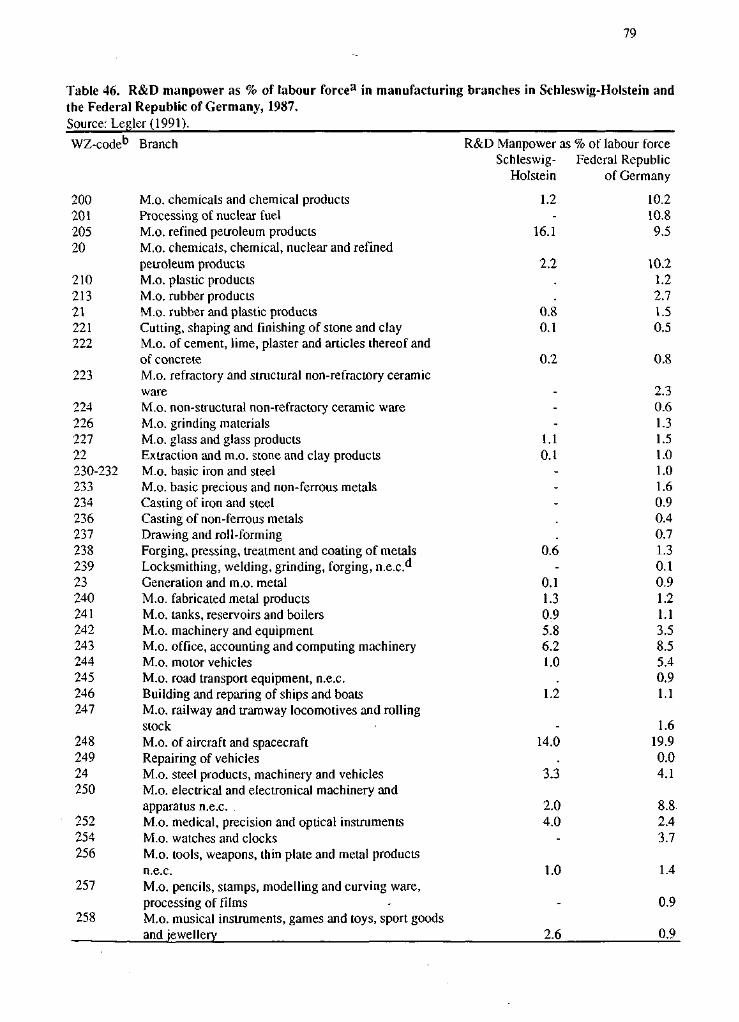
79
Table 46. R&D manpower as % of labour forcea in manufacturing branches in Schleswig-Holstein andthe Federal Republic of Germany, 1987.Source: Legler (1991).
WZ-codeb Branch R&D Manpower as % of labour forceSchleswig- Federal Republic
Holstein of Germany
200 M.o. chemicals and chemical products201 Processing of nuclear fuel205 M.o. refined petroleum products20 M.o. chemicals, chemical, nuclear and refined
petroleum products210 M.o. plastic products213 M.o. rubber products21 M.o. rubber and plastic products221 Cutting, shaping and finishing of stone and clay222 M.o. of cement, lime, plaster and articles thereof and
of concrete223 M.o. refractory and structural non-refractory ceramic
ware224 M.o. non-structural non-refractory ceramic ware226 M.o. grinding materials227 M.o. glass and glass products22 Extraction and m.o. stone and clay products230-232 M.o. basic iron and steel233 M.o. basic precious and non-ferrous metals234 Casting of iron and steel236 Casting of non-ferrous metals237 Drawing and roll-forming238 Forging, pressing, treatment and coating of metals239 Locksmithing, welding, grinding, forging, n.e.c.23 Generation and m.o. metal240 M.o. fabricated metal products241 M.o. tanks, reservoirs and boilers242 M.o. machinery and equipment243 M.o. office, accounting and computing machinery244 M.o. motor vehicles245 M.o. road transport equipment, n.e.c.246 Building and reparing of ships and boats247 M.o. railway and tramway locomotives and rolling
stock248 M.o. of aircraft and spacecraft249 Repairing of vehicles24 M.o. steel products, machinery and vehicles250 M.o. electrical and electronical machinery and
apparatus n.e.c.252 M.o. medical, precision and optical instruments254 M.o. watches and clocks256 M.o. tools, weapons, thin plate and metal products
n.e.c.257 M.o. pencils, stamps, modelling and curving ware,
processing of films258 M.o. musical instruments, games and toys, sport goods
and jewellery
1.2-
16.1
2.2
0.80.1
0.2
-1.10.1
-
0.6
0.11.30.95.86.21.0
1.2
14.0
3.3
2.04.0
-
1.0
-
2.6
10.210.89.5
10.21.22.71.50.5
0.8
2.30.61.31.51.01.01.60.90.40.71.30.10.91.21.13.58.55.40.91.1
1.619.90.04.1
8.82.43.7
1.4
0.9
0.9
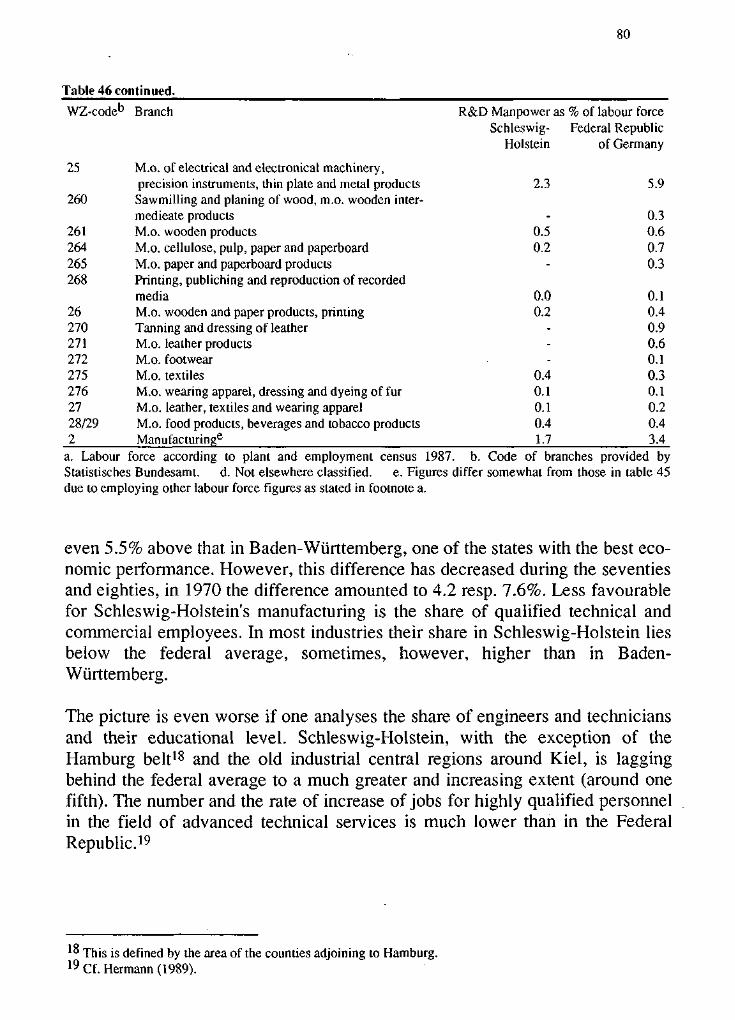
80
Table 46 continued.
WZ-codeb Branch
25 M.o. of electrical and electronical machinery,precision instruments, thin plate and metal products
260 Sawmilling and planing of wood, m.o. wooden inter-medieate products
261 M.o. wooden products264 M.o. cellulose, pulp, paper and paperboard265 M.o. paper and paperboard products268 Printing, publiching and reproduction of recorded
media26 M.o. wooden and paper products, printing270 Tanning and dressing of leather271 M.o. leather products272 M.o. footwear275 M.o. textiles276 M.o. wearing apparel, dressing and dyeing of fur27 M.o. leather, textiles and wearing apparel28/29 M.o. food products, beverages and tobacco products2 Manufacturing6
R&D Manpower asSchleswig-
Holstein
2.3
_
0.50.2
-
0.00.2
-
0.40.10.10.41.7
% of labour forceFederal Republic
of Germany
5.9
0.30.60.70.3
0.10.40.90.60.10.30.10.20.43.4
a. Labour force according to plant and employment census 1987. b. Code of branches provided byStatistisches Bundesamt. d. Not elsewhere classified. e. Figures differ somewhat from those in table 45due to employing other labour force figures as stated in footnote a.
even 5.5% above that in Baden-Wiirttemberg, one of the states with the best eco-nomic performance. However, this difference has decreased during the seventiesand eighties, in 1970 the difference amounted to 4.2 resp. 7.6%. Less favourablefor Schleswig-Holstein's manufacturing is the share of qualified technical andcommercial employees. In most industries their share in Schleswig-Holstein liesbelow the federal average, sometimes, however, higher than in Baden-Wurttemberg.
The picture is even worse if one analyses the share of engineers and techniciansand their educational level. Schleswig-Holstein, with the exception of theHamburg belt18 and the old industrial central regions around Kiel, is laggingbehind the federal average to a much greater and increasing extent (around onefifth). The number and the rate of increase of jobs for highly qualified personnelin the field of advanced technical services is much lower than in the FederalRepublic.19
1 8 This is defined by the area of the counties adjoining to Hamburg.1 9 Cf. Hermann (1989).
81
Labour Costs
As already mentioned in the introductory remarks of this chapter, labour costdifferentials in the Federal Republic do not reflect regional productivity diffe-rentials. A high level of regional unemployment in peripheral regions indicatesserious disturbances in the labour costs/productivity ratio. Wage rates, beingcollectively bargained by employers' organizations and labour unions, are nearlythe same all over the Federal Republic.20 Up to the middle of the seventies, westill could observe a certain amount of wage differentiation, but since thenbargained wage rates have converged. Effectively paid wage rates still differ tosome extent, but - with the exception of the municipal states - this margin doesnot exceed 5% in most cases.21 Schleswig-Holstein in all has not offered veryfavourable labour costs, especially in the eighties.22 This may not be true for thebooming Hamburg belt, where higher effective wages are justified by a higherproductivity and the bargained wage rates which are below the effective rates donot act as minimum wages. This latter is the case, however, in more periphe-ralregions of Schleswig-Holstein as in the German-Danish border regions, whereunemployment is highest on average in the region.
Other Local Costs
A somewhat favourable picture can be drawn in the field of land prices andavailability of industrial and commercial sites. Land prices are lower in inter-regional comparison, and available industrial sites seem to be sufficient.Shortages can be observed, however, in the booming Hamburg belt and in Kiel,Liibeck and Flensburg.
Energy costs were relatively high in the seventies and at the beginning of theeighties. Since that time rates for electrical energy have much more increasedelsewhere, so that Schleswig-Holstein has now energy costs near the federalaverage.
iy) Only Bavarian bargained wage rates are still lagging behind those in the rest of the Federal Republic.2 1 Cf. Paque(1989,p. 33).2 2 This should not be mixed with the evidence that the income per head is lower in Schleswig-Holstein than inthe Federal Republic. This can be explained by structural reasons: In Schleswig-Holstein low-income branchesare dominating. See next section of the paper.
82
"Soft" Factors
Soft locational factors can be difficult, because their assessment and classifica-tion often depends on personal tastes and preferences. What can be said is thatSchleswig-Holstein's natural environment has advantages with its lower level ofpollution. Similarly the region's role as holiday resort is unquestioned, and in thefield of cultural activities there have been major steps forward in the last years.With respect to soft factors Schleswig-Holstein's position seems favourable, but- though soft factors are to gain more and more importance - one should notforget the decline in the hard factors in the eighties.
INSTITUTIONAL CONDITIONS
General institutional conditions as the legal framework, regulations and taxes arenearly the same all over the Federal Republic. What counts in internationalcomparisons between Schleswig-Holstein and regions in other countries are thedifferences between the Federal Republic and locations abroad.
Legal framework and Regulations
Measured by its basic legal framework the Federal Republic is constituted on theprinciple of the social market economy. It can best be characterized as a kind ofmixed economy with a large public sector involvement in many areas. From aliberal economic perspective some of these would be called market domains.Similarly, public regulation of industries is widespread and most prominent inbranches that have been categorized as "exempted from competitive pressures".Examples of these are agriculture, coal mining, steel production, public utilities,transportation, communication and banking.23 Another relevant issue in thisrespect is the high level of subsidization that some industries (agriculture, coalmining, steel production, shipbuilding, manufacture of air- and spacecraft, trans-portation and other service sectors) enjoy. All these things taken togetheraccount for more than 50% of aggregated value added and employment that arenot subject to internal or external competition.24 As far as Schleswig-Holstein isconcerned, the public sector together with regulated and subsidized industries'share is even higher than the federal average due to the structural composition of
23For details see Moschel (1982, p. 605 ff.); Soltwedel et al. (1986; 1987).2 4 Cf. Donges, Schatz (1986, p. 58).
83
the economy.25 Agriculture, shipbuilding and transportation are prominentbranches in Schleswig-Holstein's structural mix.
Thus, Schleswig-Holstein is in a relatively unfavourable position concerningincentives to structural change and dynamic economic performance. Empiricalresults as well as theoretical considerations lead to the conclusion that the morean economy is governed by competition the more intensive incentives are tosearch for new income opportunities and to act as dynamic Schumpeterianentrepreneurs. If, on the other hand, more and more jobs can be found inbranches which are not subject to competition, the incentives for structuralchange will decline over time with the consequence that resources, especiallyskilled workers, remain in suboptimal uses and are not at the disposal of dyna-mic future-oriented branches.
Tax System
The national and local aspects of the tax system have to be separated. In general,the German tax system is constituted in such a way that tax rates do not differover regions. So Schleswig-Holstein's competitive position is defined by that ofthe Federal Republic in international comparisons. There exist regional differen-tiations for only a few taxes. These are the real estate tax and the commercialtax, the latter's basis of valuation includes invested capital and plant profits aswell. As far as the Federal Republic's relative position in business taxation isconcerned, profits from joint stock corporations are taxed higher than in mostother industrial countries.26 This is due to the double taxation by business andcommercial tax. Foreign companies engaging in subsidiary corporations inGermany are taxed for these domestic activities higher than elsewhere. TheFederal Republic - and Schleswig-Holstein as a part of it - does not belong to themost favourable tax locations. Its relative position in the international locationalcompetition for mobile capital funds is less favourable than that of other indu-strial countries like the United Kingdom.
In a regional domestic comparison Schleswig-Holstein's position is not un-favourable. Those tax rates being locally differentiated were near or above the
Z J One should further keep in mind that the federal average itself is distorted by a few states with seriousstructural problems (e.g. Northrhine-Westfalia and Saar with coal-mining and steel production). So thedifference between Schleswig-Holstein and most other West German states is even larger. Only in one respectSchleswig-Holstein is in a favourable position. External (tariff and non-tariff) protection is less for the state'saverage, because heavily protected branches as textiles or steel production are lacking in the structural mix.Cf. Hpffmeyer et al. (1990, pp. 42 ff.).2 6 For details cf. Boss (1988).
84
federal average at the beginning of the seventies, but were lower at the end ofthe eighties.27
Summarising the balance of locational factors and institutional framework, itseems that Schleswig-Holstein's position in interregional and internationallocational competition improved during the seventies. Since then has worsenedcompared with that of other regions in the Federal Republic.
MAIN LINES OF INDUSTRIAL STRUCTURE AND STRUCTURALCHANGE IN SCHLESWIG-HOLSTEIN IN THE SEVENTIES ANDEIGHTIES
Data Problems
The end of analysing industrial structure and structural change would best beserved by a data set which is highly disaggregated and which provides data foras many years as possible in order to identify sub-periods of structural change.Unfortunately we do not have a data set which fits in with both criteria. A highlydisaggregated data set with respect to employment in industries is provided bythe plant and employment censuses, which took place in 1970 and 1987. Thereare no data for years inbetween or after 1987. Data on a yearly basis for employ-ment and revenues as well are provided by the normal industrial census. Thesedata, however, are only available at such an aggregated level that any categori-zation with respect to factor intensities, as will be done later in this chapter, doesnot make analytical sense.28 In order to get useful results we decided to rely onthe highly disaggregated plant and employment censuses. This means that wecannot discriminate between sub-periods and possibly different phases of struc-tural change therein. We can only identify the structural change between 1970and 1987.
The Overall Structural Pattern
The overall structural pattern of the economy of Schleswig-Holstein exhibitsclear differences from that of the Federal Republic as a whole. The share of
2 7 Cf. Hoffmeyer et al. (1990).2 8 Extremely speaking, one would have to split the aggregated groups of industries according to one's ownprejudices just to arrive at the results one would expect.
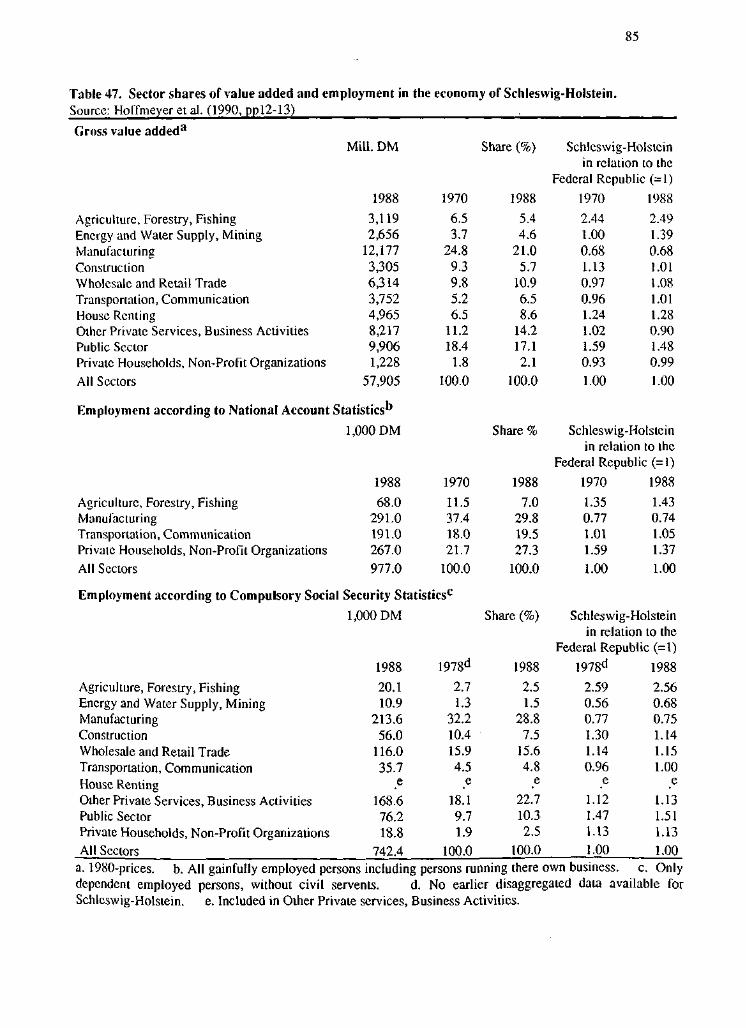
85
Table 47. Sector shares of value added and employment in the economy of Schleswig-Holstein.Source: Hoffmeyer et al. (1990, pp!2-13)
Gross value addeda
Agriculture, Forestry, FishingEnergy and Water Supply, MiningManufacturingConstructionWholesale and Retail TradeTransportation, CommunicationHouse RentingOther Private Services, Business ActivitiesPublic SectorPrivate Households, Non-Profit Organizations
All Sectors
Mill. DM
1988
3,1192,656
12,1773,3056,3143,7524,9658,2179,9061,228
57,905
1970
6.53.7
24.89.39.85.26.5
11.218.4
1.8
100.0
Share (%)
1988
5.44.6
21.05.7
10.96.58.6
14.217.12.1
100.0
Schleswig-Holsteinin relation to the
Federal Republic (=1)
1970
2.441.000.681.130.970.961.241.021.590.93
1.00
1988
2.491.390.681.011.081.011.280.901.480.99
1.00
Employment according to National Account Statistics''
Agriculture, Forestry, FishingManufacturingTransportation, CommunicationPrivate Households, Non-Profit OrganizationsAll Sectors
Employment according to Compulsory Social
Agriculture, Forestry, FishingEnergy and Water Supply, MiningManufacturingConstructionWholesale and Retail TradeTransportation, CommunicationHouse RentingOther Private Services, Business ActivitiesPublic SectorPrivate Households, Non-Profit OrganizationsAll Sectors
1,000 DM
1988
68.0291.0191.0267.0977.0
1970
11.537.418.021.7
100.0
Security Statistics0
1,000 DM
1988
20.110.9
213.656.0
116.035.7
e168.676.218.8
742.4
1978d
2.71.3
32.210.415.94.5
e18.19.71.9
100.0
Share %
1988
7.029.819.527.3
100.0
Share (%)
1988
2.51.5
28.87.5
15.64.8
e22.710.32.5
100.0
Schleswig-Holsteinin relation to the
Federal Republic
1970
1.350.771.011.591.00
(=1)1988
1.430.741.051.371.00
Schleswig-Holsteinin relation t
Federal Republic
1978d
2.590.560.771.301.140.96
e1.121.471.131.00
o the
•(=1)
1988
2.560.680.751.141.151.00
e1.131.511.13
1.00a. 1980-prices. b. All gainfully employed persons including persons running there own business. c. Onlydependent employed persons, without civil servents. d. No earlier disaggregated data available forSchleswig-Holstein. e. Included in Other Private services, Business Activities.
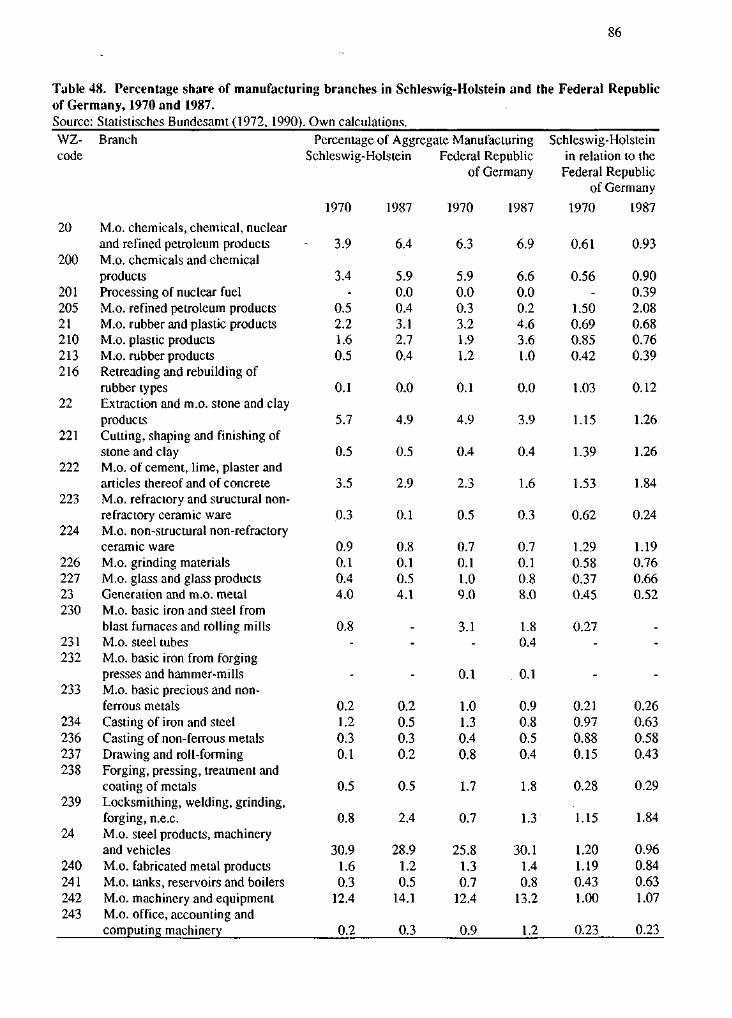
86
Table 48. Percentage share of manufacturing branches in Schleswig-Holstein and the Federal Republicof Germany, 1970 and 1987.Source: Statistisches Bundesamt (1972, 1990). Own calculations.WZ-code
20
200
20120521210213216
22
221
222
223
224
22622723230
231232
233
234236237238
239
24
240241242243
Branch
M.o. chemicals, chemical, nuclearand refined petroleum productsM.o. chemicals and chemicalproductsProcessing of nuclear fuelM.o. refined petroleum productsM.o. rubber and plastic productsM.o. plastic productsM.o. rubber productsRetreading and rebuilding ofrubber typesExtraction and m.o. stone and clayproductsCutting, shaping and finishing ofstone and clayM.o. of cement, lime, plaster andarticles thereof and of concreteM.o. refractory and structural non-refractory ceramic wareM.o. non-structural non-refractoryceramic wareM.o. grinding materialsM.o. glass and glass productsGeneration and m.o. metalM.o. basic iron and steel fromblast furnaces and rolling millsM.o. steel tubesM.o. basic iron from forgingpresses and hammer-millsM.o. basic precious and non-ferrous metalsCasting of iron and steelCasting of non-ferrous metalsDrawing and roll-formingForging, pressing, treatment andcoating of metalsLocksmithing, welding, grinding,forging, n.e.c.M.o. steel products, machineryand vehiclesM.o. fabricated metal productsM.o. tanks, reservoirs and boilersM.o. machinery and equipmentM.o. office, accounting andcomputing machinery
Percentage of Aggregate ManufacturingSchleswig-Holstein
1970
3.9
3.4-
0.52.21.60.5
0.1
5.7
0.5
3.5
0.3
0.90.10.44.0
0.8-
-
0.21.20.30.1
0.5
0.8
30.91.60.3
12.4
0.2
1987
6.4
5.90.00.43.12.70.4
0.0
4.9
0.5
2.9
0.1
0.80.10.54.1
-
-
0.20.50.30.2
0.5
2.4
28.91.20.5
14.1
0.3
Federal Republicof Germany
1970
6.3
5.90.00.33.21.91.2
0.1
4.9
0.4
2.3
0.5
0.70.11.09.0
3.1-
0.1
1.01.30.40.8
1.7
0.7
25.81.30.7
12.4
0.9
1987
6.9
6.60.00.24.63.61.0
0.0
3.9
0.4
1.6
0.3
0.70.10.88.0
1.80.4
0.1
0.90.80.50.4
1.8
1.3
30.11.40.8
13.2
1.2
Schleswig-Holsteinin relation to theFederal Republic
of Germany
1970
0.61
0.56-
1.500.690.850.42
1.03
1.15
1.39
1.53
0.62
1.290.580.370.45
0.27-
-
0.210.970.880.15
0.28
1.15
1.201.190.431.00
0.23
1987
0.93
0.900.392.080.680.760.39
0.12
1.26
1.26
1.84
0.24
1.190.760.660.52
-
-
0.260.630.580.43
0.29
1.84
0.960.840.631.07
0.23

87
Table 48 continued.
WZ-code
244245
246
247
24824925
250
252
254256
257
258
25926
260
261
264
265
268
269
27270271272275276
Branch Percentage of Aggregate Manufacturing Schleswig-HolsteinSchleswig-Holstein Federal Republic in relation to the
of Germany Federal Republicof Germany
Mo. motor vehiclesM.o. road transport equipment,n.e.c.Building and repairing of shipsand boatsM.o. railway and tramway loco-motives and rolling stockM.o. of aircraft and spacecraftRepairing of vehiclesM.o. of electrical and electronicalmachinery, precision instruments,thin plate and metal productsM.o. electrical and electronicalmachinery and apparatus, n.e.c.M.o. medical, precision andoptical instrumentsM.o. watches and clocksM.o. tools, weapons, thin plate andmetal products, n.e.c.M.o. pencils, stamps, modellingand curving ware, processing offilmsM.o. musical instruments, gamesand toys, sport goods andjewelleryRepairing of consumer durablesM.o. wooden and paper products,printingSaw-milling and planing of woods,m.o. wooden intermediateproductsM.o. wooden productsM.o. cellulose pulp, paper andpaperboardM.o. paper and paperboardproductsPrinting, publishing and repro-duction of recorded mediaRepairing of wooden consumerdurablesM.o. leather, textiles and wearingapparelTanning and dressing of leatherM.o. leather productsM.o. footwearM.o. textilesM.o. wearing apparel, dressingand dyeing of fur
19700.4
0.1
8.2
0.00.25.2
14.8
8.0
3.3
19871.2
0.1
4.3
_
0.27.1
21.4
10.7
6.3_
19705.6
0.1
0.7
0.00.52.1
18.8
11.2
1.80.3
19878.8
0.2
0.5
0.20.73.1
20.0
12.0
2.50.1
19700.07
0.89
11.14
0.800.292.45
0.79
0.71
1.87
19870.13
0.40
8.78
0.322.28
1.07
0.89
2.57
3.3
13.5
2.9
0.3
12.9
4.7 3.9
0.3
10.4 9.9
0.69
1.30
0.74
1.28
0.20.0
0.20.8
0.80.0
0.70.5
0.301.52
0.331.65
1.30
0.84.4
0.9
1.6
5.8
-
7.60.10.20.72.9
0.33.9
0.9
1.8
5.8
0.1
3.70.00.00.21.1
0.94.4
0.7
1.5
3.0
-
12.10.20.51.25.4
0.74.2
0.5
1.3
3.1
0.1
7.30.10.30.62.8
0.891.01
1.26
1.06
1.96
-
0.630.370.400.580.55
0.460.95
1.75
1.30
1.89
1.11
0.500.570.160.340.40
3.7 2.0 4.8 3.4 0.77 0.59
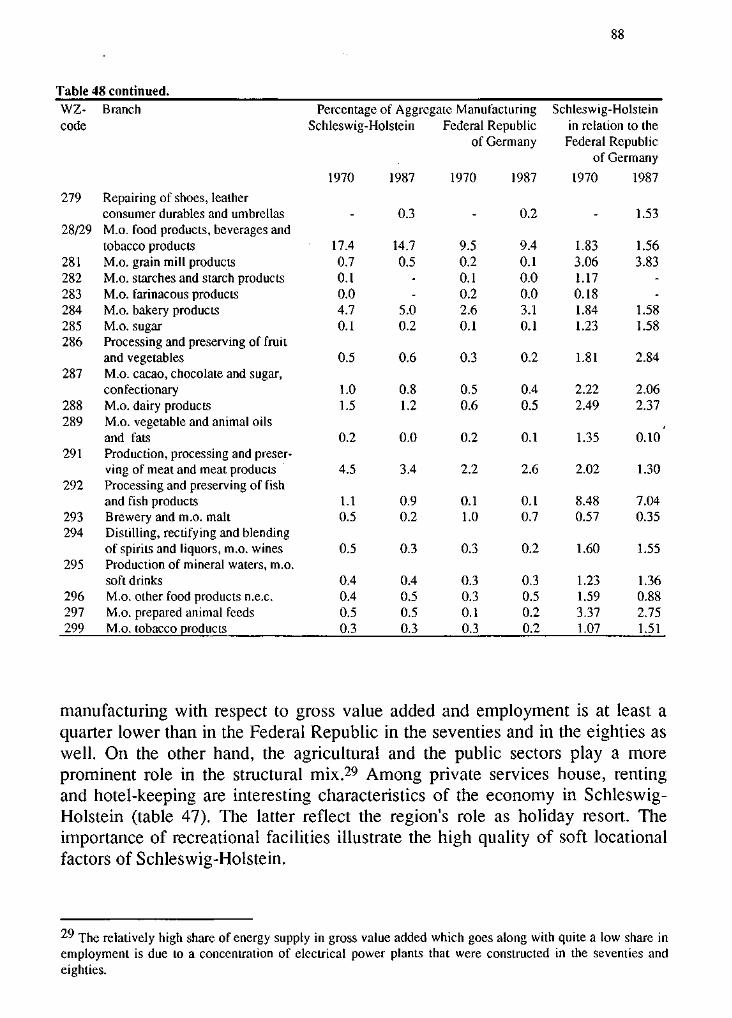
Table 48 continued.
WZ-code
Branch Percentage of Aggregate ManufacturingSchleswig-Holstein Federal Republic
of Germany
1970 1987 1970 1987
Schleswig-Holsteinin relation to theFederal Republic
of Germany
1970 1987
279
28/29
281282283284285286
287
288289
291
292
293294
295
296297299
Repairing of shoes, leatherconsumer durables and umbrellasM.o. food products, beverages andtobacco productsM.o. grain mill productsM.o. starches and starch productsM.o. farinacous productsM.o. bakery productsM.o. sugarProcessing and preserving of fruitand vegetablesM.o. cacao, chocolate and sugar,confectionaryM.o. dairy productsM.o. vegetable and animal oilsand fatsProduction, processing and preser-ving of meat and meat productsProcessing and preserving of fishand fish productsBrewery and m.o. maltDistilling, rectifying and blendingof spirits and liquors, m.o. winesProduction of mineral waters, m.o.soft drinksM.o. other food products n.e.c.M.o. prepared animal feedsM.o. tobacco products
-
17.40.70.10.04.70.1
0.5
1.01.5
0.2
4.5
1.10.5
0.5
0.40.40.50.3
0.3
14.70.5
--
5.00.2
0.6
0.81.2
0.0
3.4
0.90.2
0.3
0.40.50.50.3
-
9.50.20.10.22.60.1
0.3
0.50.6
0.2
2.2
0.11.0
0.3
0.30.30.10.3
0.2
9.40.10.00.03.10.1
0.2
0.40.5
0.1
2.6
0.10.7
0.2
0.30.50.20.2
-
1.833.061.170.181.841.23
1.81
2.222.49
1.35
2.02
8.480.57
1.60
1.231.593.371.07
1.53
1.563.83
--
1.581.58
2.84
2.062.37
o.io'
1.30
7.040.35
1.55
1.360.882.751.51
manufacturing with respect to gross value added and employment is at least aquarter lower than in the Federal Republic in the seventies and in the eighties aswell. On the other hand, the agricultural and the public sectors play a moreprominent role in the structural mix.29 Among private services house, rentingand hotel-keeping are interesting characteristics of the economy in Schleswig-Holstein (table 47). The latter reflect the region's role as holiday resort. Theimportance of recreational facilities illustrate the high quality of soft locationalfactors of Schleswig-Holstein.
2 9 The relatively high share of energy supply in gross value added which goes along with quite a low share inemployment is due to a concentration of electrical power plants that were constructed in the seventies andeighties.
89
The Industry Mix
With respect to manufacturing the high share of agriculture is reflected in theimportance of food production in Schleswig-Holstein. The second largest indu-strial sector. Grain-mill products, preserving of vegetables, dairy products, pre-serving of fish and production of prepared animal feed are concentrated inSchleswig-Holstein. Mining is almost completely lacking. The only mineralresources of Schleswig-Holstein are sand and clay. So the extraction of sand andclay, cement production and related ceramic production play a more prominentrole in the industrial pattern than in the Federal Republic (table 48).
The largest share of all sectors is occupied by the manufacturing of steelproducts, machinery and vehicles. This is due to a concentration of machineryproduction, the repairing of vehicles and especially shipbuilding. Similarly, thethird main sector is the manufacture of electrical and precision instruments. Herethe strong position of Schleswig-Holstein's industry is nearly completely due toa concentration on medical and precision instruments. The region's enterprisesare among the most important on world markets.
STRUCTURAL CHANGE IN SCHLESWIG-HOLSTEIN
The process of structural change in the Federal Republic in the seventies andeighties is characterised - as in other countries at the top of the income pyramid -by a relative decline of manufacturing in favour of services. This is in agreementwith Fourastie's and Clark's "three-sector hypothesis". For the Federal Republicthere is only one branch at the two-digit-level of the WZ-code with positiveemployment growth rates from 1970 to 1987: rubber and plastic products (WZ-code 21), all other branches are indeed decreasing in employment (table 49).
For Schleswig-Holstein the data exhibit a somewhat different picture. Chemicalproducts (20) and electrical and precision instruments (25) have grown inemployment instead of shrinking as in the Federal Republic as a whole. Forstone and clay products (22), generation of metal (23), and wooden products(26) the decrease in employment has been less pronounced in Schleswig-Holstein. Employment in the manufacture of steel products and machinery (24),leather and textiles (27), and food products (28/29) decreased even more than inthe Federal Republic.
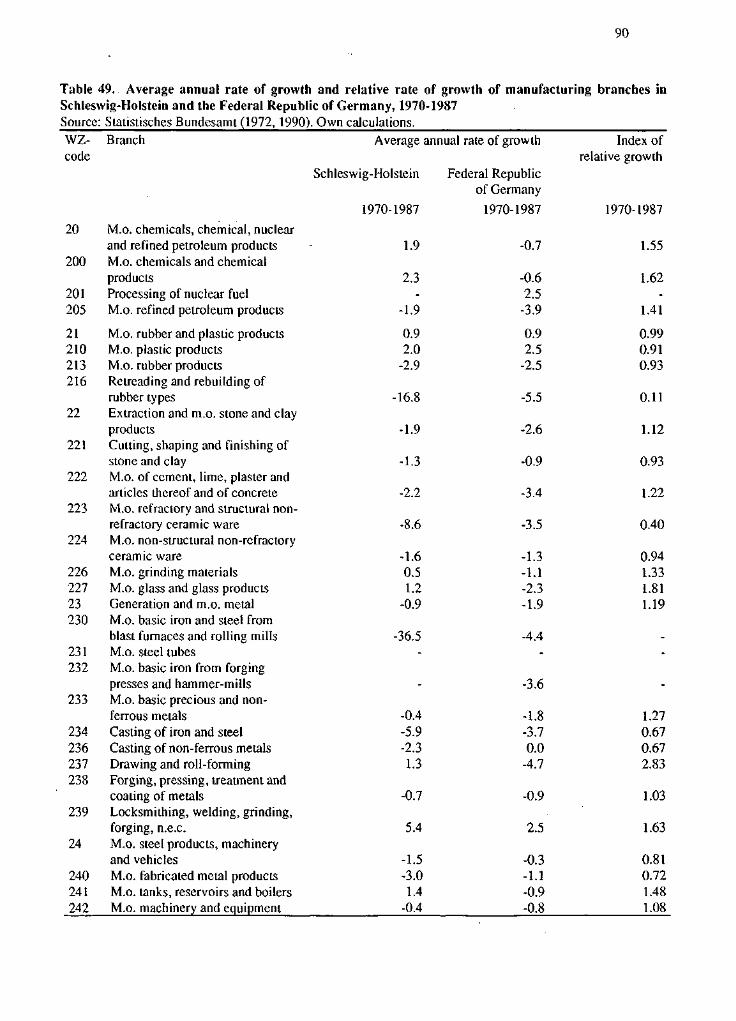
90
Table 49. Average annual rate of growth and relative rate of growth of manufacturing branches inSchleswig-Holstein and the Federal Republic of Germany, 1970-1987Source: Statistisches Bundesamt (1972, 1990). Own calculations.
wz-code
20
200
201205
21210213216
22
221
222
223
224
22622723230
231232
233
234236237238
239
24
240241242
Branch
M.o. chemicals, chemical, nuclearand refined petroleum productsM.o. chemicals and chemicalproductsProcessing of nuclear fuelM.o. refined petroleum products
M.o. rubber and plastic productsM.o. plastic productsM.o. rubber productsRetreading and rebuilding ofrubber typesExtraction and m.o. stone and clayproductsCutting, shaping and finishing ofstone and clayM.o. of cement, lime, plaster andarticles thereof and of concreteM.o. refractory and structural non-refractory ceramic wareM.o. non-structural non-refractoryceramic wareM.o. grinding materialsM.o. glass and glass productsGeneration and m.o. metalM.o. basic iron and steel fromblast furnaces and rolling millsM.o. steel tubesM.o. basic iron from forgingpresses and hammer-millsM.o. basic precious and non-ferrous metalsCasting of iron and steelCasting of non-ferrous metalsDrawing and roll-formingForging, pressing, treatment andcoating of metalsLocksmithing, welding, grinding,forging, n.e.c.M.o. steel products, machineryand vehiclesM.o. fabricated metal productsM.o. tanks, reservoirs and boilersM.o. machinery and equipment
Average
Schleswig-Holstein
1970-1987
1.9
2.3-
-1.9
0.92.0
-2.9
-16.8
-1.9
-1.3
-2.2
-8.6
-1.60.51.2
-0.9
-36.5-
-
-0.4-5.9-2.31.3
-0.7
5.4
-1.5-3.01.4
-0.4
annual rate of growth
Federal Republicof Germany
1970-1987
-0.7
-0.62.5
-3.9
0.92.5
-2.5
-5.5
-2.6
-0.9
-3.4
-3.5
-1.3-1.1-2.3-1.9
-4.4
-3.6
-1.8-3.70.0
-4.7
-0.9
2.5
-0.3-1.1-0.9-0.8
Index ofrelative growth
1970-1987
1.55
1.62-
1.41
0.990.910.93
0.11
1.12
0.93
1.22
0.40
0.941.331.811.19
-
-
1.270.670.672.83
1.03
1.63
0.810.721.481.08
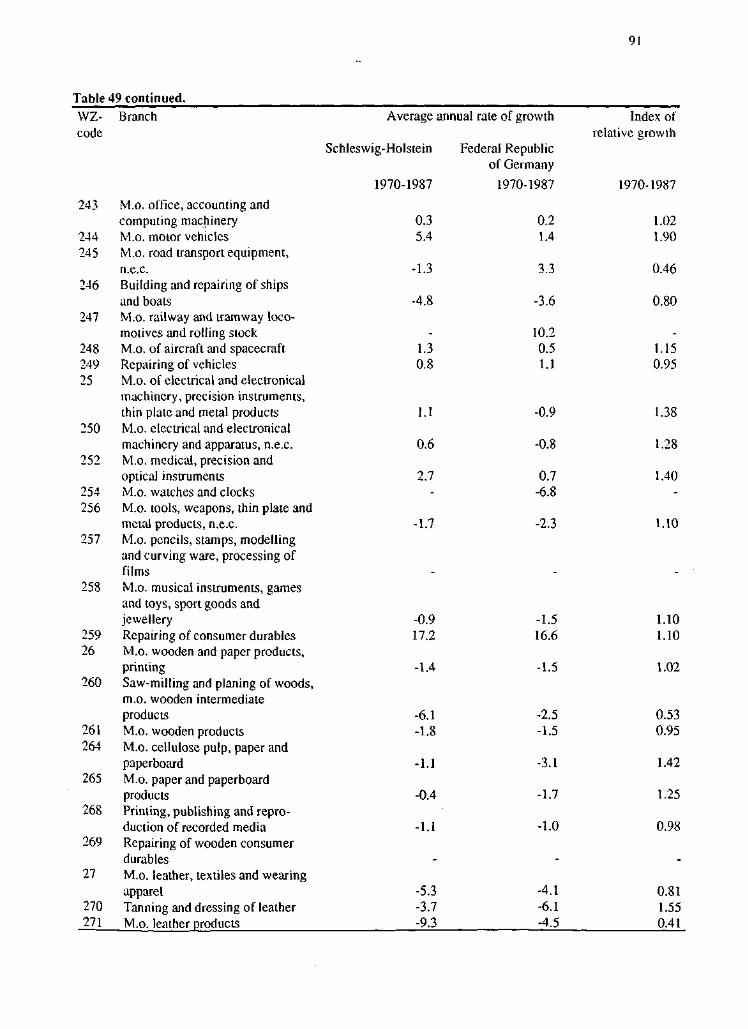
91
Table 49 continued.
WZ-code
243
244245
246
247
24824925
250
252
254256
257
258
25926
260
261264
265
268
269
27
270271
Branch
M.o. office, accounting andcomputing machineryM.o. motor vehiclesM.o. road transport equipment,n.e.c.Building and repairing of shipsand boatsM.o. railway and tramway loco-motives and rolling stockM.o. of aircraft and spacecraftRepairing of vehiclesM.o. of electrical and electronicalmachinery, precision instruments,thin plate and metal productsM.o. electrical and electronicalmachinery and apparatus, n.e.c.M.o. medical, precision andoptical instrumentsM.o. watches and clocksM.o. tools, weapons, thin plate andmetal products, n.e.c.M.o. pencils, stamps, modellingand curving ware, processing offilmsM.o. musical instruments, gamesand toys, sport goods andjewelleryRepairing of consumer durablesM.o. wooden and paper products,printingSaw-milling and planing of woods,m.o. wooden intermediateproductsM.o. wooden productsM.o. cellulose pulp, paper andpaperboardM.o. paper and paperboardproductsPrinting, publishing and repro-duction of recorded mediaRepairing of wooden consumerdurablesM.o. leather, textiles and wearingapparelTanning and dressing of leatherM.o. leather products
Average
Schleswig-Holstein
1970-1987
0.35.4
-1.3
-4.8
1.30.8
1.1
0.6
2.7
annual rate of growth
Federal Republicof Germany
1970-1987
0.21.4
3.3
-3.6
10.20.51.1
-0.9
-0.8
0.7-6.8
Index ofrelative growth
1970-1987
1.021.90
0.46
0.80
1.150.95
1.38
1.28
1.40
-1.7
-0.917.2
-1.4
-2.3
-1.516.6
-1.5
1.10
1.101.10
1.02
-6.1-1.8
-1.1
-0.4
-1.1
-5.3-3.7-9.3
-2.5-1.5
-3.1
-1.7
-1.0
-4.1-6.1-4.5
0.530.95
1.42
1.25
0.98
0.811.550.41
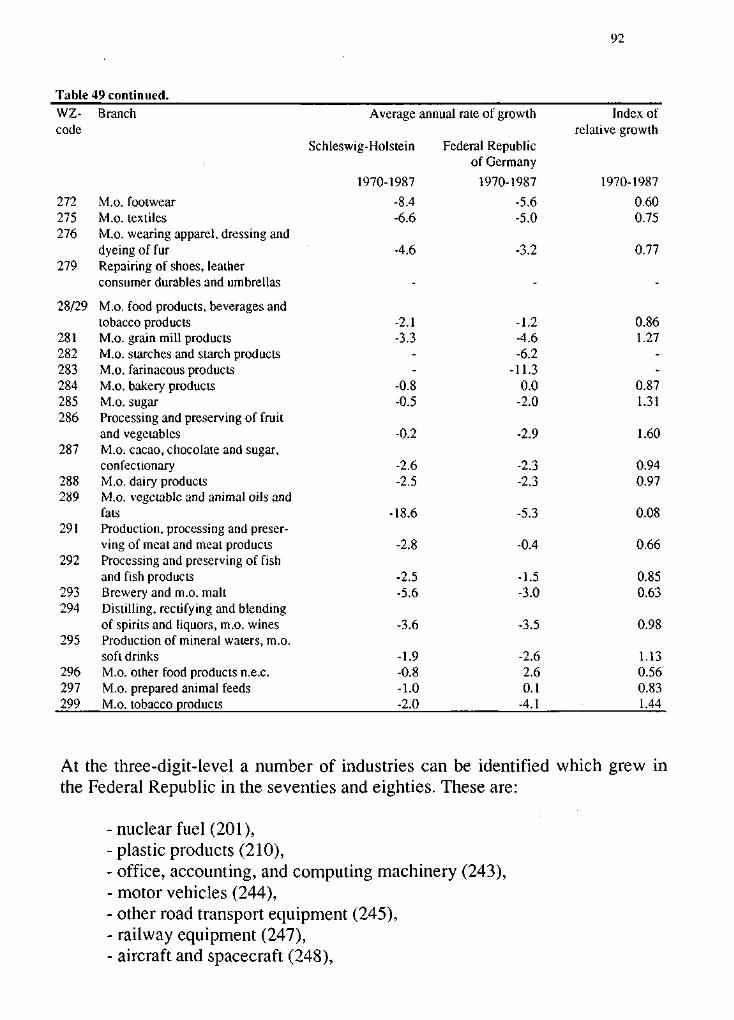
92
Table 49 continued.WZ-code
272275276
279
28/29
281282283284285286
287
288289
291
292
293294
295
296297299
Branch
M.o. footwearM.o. textilesM.o. wearing apparel, dressing anddyeing of furRepairing of shoes, leatherconsumer durables and umbrellas
M.o. food products, beverages andtobacco productsM.o. grain mill productsM.o. starches and starch productsM.o. farinacous productsM.o. bakery productsM.o. sugarProcessing and preserving of fruitand vegetablesM.o. cacao, chocolate and sugar,confectionaryM.o. dairy productsM.o. vegetable and animal oils andfatsProduction, processing and preser-ving of meat and meat productsProcessing and preserving of fishand fish productsBrewery and m.o. maltDistilling, rectifying and blendingof spirits and liquors, m.o. winesProduction of mineral waters, m.o.soft drinksM.o. other food products n.e.c.M.o. prepared animal feedsM.o. tobacco products
Average
Schleswig-Holstein
1970-1987
-8.4-6.6
annual rate ot growth
Federal Republicof Germany
1970-1987
-5.6-5.0
Index ofrelative growth
1970-1987
0.600.75
-4.6 -3.2 0.77
-2.1-3.3
--
-0.8-0.5
-0.2
-2.6-2.5
18.6
-2.8
-2.5-5.6
-3.6
-1.9-0.8-1.0-2.0
-1.2-4.6-6.2
-11.30.0
-2.0
-2.9
-2.3-2.3
-5.3
-0.4
-1.5-3.0
-3.5
-2.62.60.1
-4.1
0.861.27
--
0.871.31
1.60
0.940.97
0.08
0.66
0.850.63
0.98
1.130.560.831.44
At the three-digit-level a number of industries can be identified which grew inthe Federal Republic in the seventies and eighties. These are:
-nuclearfuel (201),- plastic products (210),- office, accounting, and computing machinery (243),- motor vehicles (244),- other road transport equipment (245),- railway equipment (247),- aircraft and spacecraft (248),
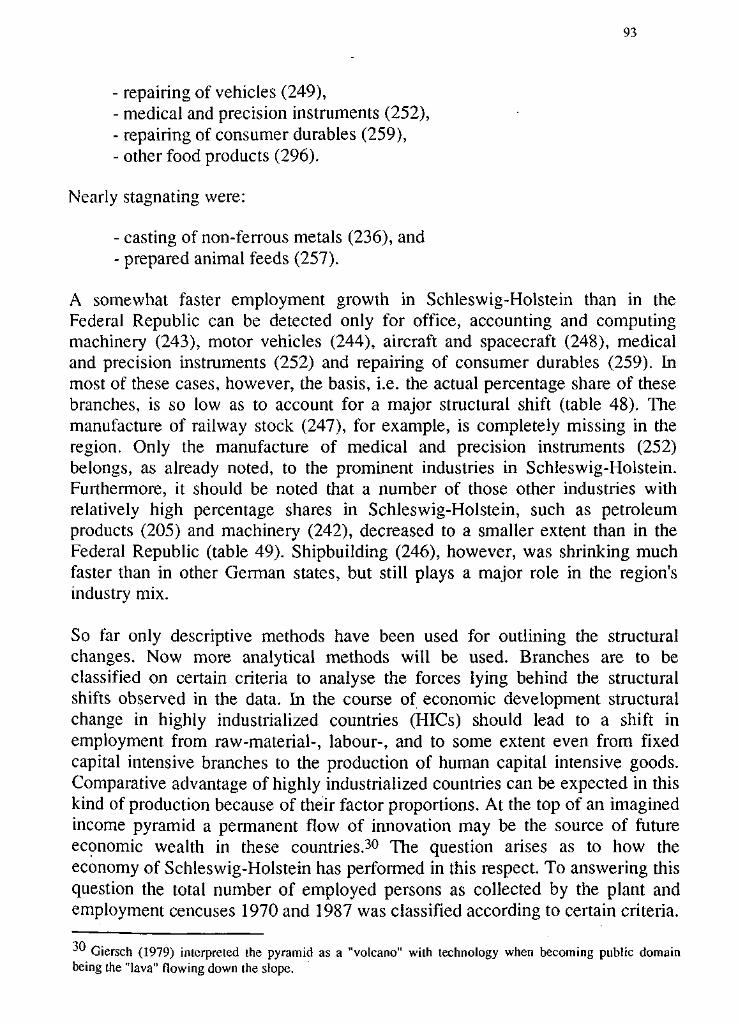
93
- repairing of vehicles (249),- medical and precision instruments (252),- repairing of consumer durables (259),- other food products (296).
Nearly stagnating were:
- casting of non-ferrous metals (236), and- prepared animal feeds (257).
A somewhat faster employment growth in Schleswig-Holstein than in theFederal Republic can be detected only for office, accounting and computingmachinery (243), motor vehicles (244), aircraft and spacecraft (248), medicaland precision instruments (252) and repairing of consumer durables (259). Inmost of these cases, however, the basis, i.e. the actual percentage share of thesebranches, is so low as to account for a major structural shift (table 48). Themanufacture of railway stock (247), for example, is completely missing in theregion. Only the manufacture of medical and precision instruments (252)belongs, as already noted, to the prominent industries in Schleswig-Holstein.Furthermore, it should be noted that a number of those other industries withrelatively high percentage shares in Schleswig-Holstein, such as petroleumproducts (205) and machinery (242), decreased to a smaller extent than in theFederal Republic (table 49). Shipbuilding (246), however, was shrinking muchfaster than in other German states, but still plays a major role in the region'sindustry mix.
So far only descriptive methods have been used for outlining the structuralchanges. Now more analytical methods will be used. Branches are to beclassified on certain criteria to analyse the forces lying behind the structuralshifts observed in the data. In the course of economic development structuralchange in highly industrialized countries (HICs) should lead to a shift inemployment from raw-material-, labour-, and to some extent even from fixedcapital intensive branches to the production of human capital intensive goods.Comparative advantage of highly industrialized countries can be expected in thiskind of production because of their factor proportions. At the top of an imaginedincome pyramid a permanent flow of innovation may be the source of futureeconomic wealth in these countries.30 The question arises as to how theeconomy of Schleswig-Holstein has performed in this respect. To answering thisquestion the total number of employed persons as collected by the plant andemployment cencuses 1970 and 1987 was classified according to certain criteria.
j U Giersch (1979) interpreted the pyramid as a "volcano" with technology when becoming public domainbeing the "lava" flowing down the slope.
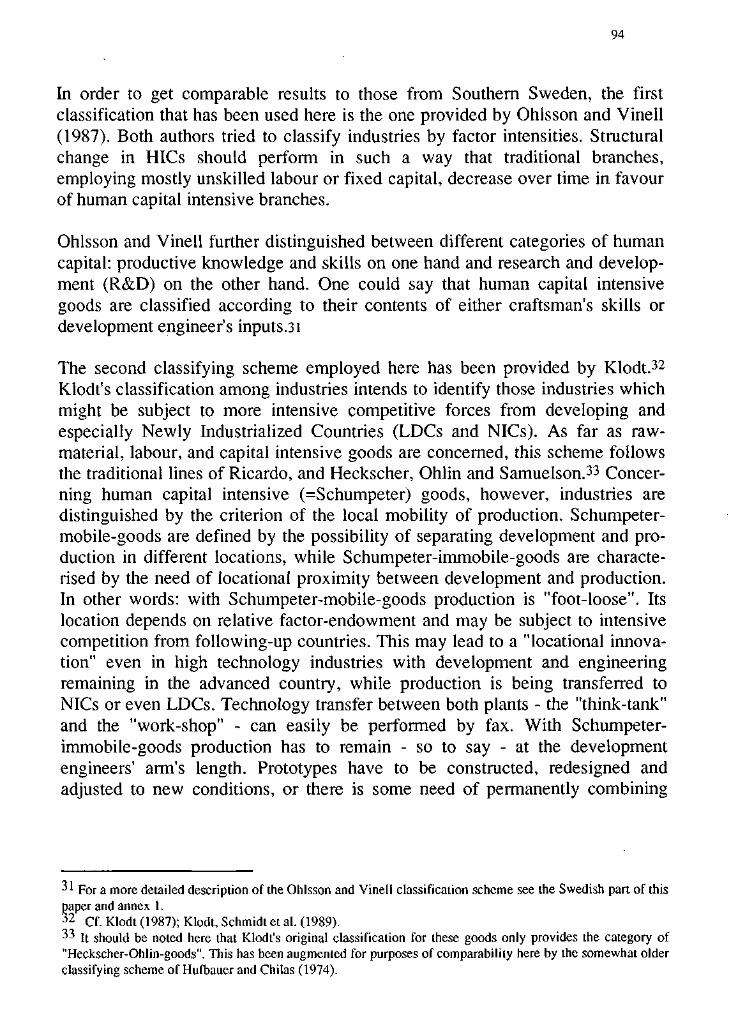
94
In order to get comparable results to those from Southern Sweden, the firstclassification that has been used here is the one provided by Ohlsson and Vinell(1987). Both authors tried to classify industries by factor intensities. Structuralchange in HICs should perform in such a way that traditional branches,employing mostly unskilled labour or fixed capital, decrease over time in favourof human capital intensive branches.
Ohlsson and Vinell further distinguished between different categories of humancapital: productive knowledge and skills on one hand and research and develop-ment (R&D) on the other hand. One could say that human capital intensivegoods are classified according to their contents of either craftsman's skills ordevelopment engineer's inputs.31
The second classifying scheme employed here has been provided by Klodt.32
Klodt's classification among industries intends to identify those industries whichmight be subject to more intensive competitive forces from developing andespecially Newly Industrialized Countries (LDCs and NICs). As far as raw-material, labour, and capital intensive goods are concerned, this scheme followsthe traditional lines of Ricardo, and Heckscher, Ohlin and Samuelson.33 Concer-ning human capital intensive (=Schumpeter) goods, however, industries aredistinguished by the criterion of the local mobility of production. Schumpeter-mobile-goods are defined by the possibility of separating development and pro-duction in different locations, while Schumpeter-immobile-goods are characte-rised by the need of locational proximity between development and production.In other words: with Schumpeter-mobile-goods production is "foot-loose". Itslocation depends on relative factor-endowment and may be subject to intensivecompetition from following-up countries. This may lead to a "locational innova-tion" even in high technology industries with development and engineeringremaining in the advanced country, while production is being transferred toNICs or even LDCs. Technology transfer between both plants - the "think-tank"and the "work-shop" - can easily be performed by fax. With Schumpeter-immobile-goods production has to remain - so to say - at the developmentengineers' arm's length. Prototypes have to be constructed, redesigned andadjusted to new conditions, or there is some need of permanently combining
31 For a more detailed description of the Ohlsson and Vinell classification scheme see the Swedish part of thispaper and annex 1.3 2 Gf. Klodt (1987); Klodt, Schmidt et al. (1989).3 3 It should be noted here that Klodt's original classification for these goods only provides the category of"Heckscher-Ohlin-goods". This has been augmented for purposes of comparability here by the somewhat olderclassifying scheme of Hufbauer and Chilas (1974).
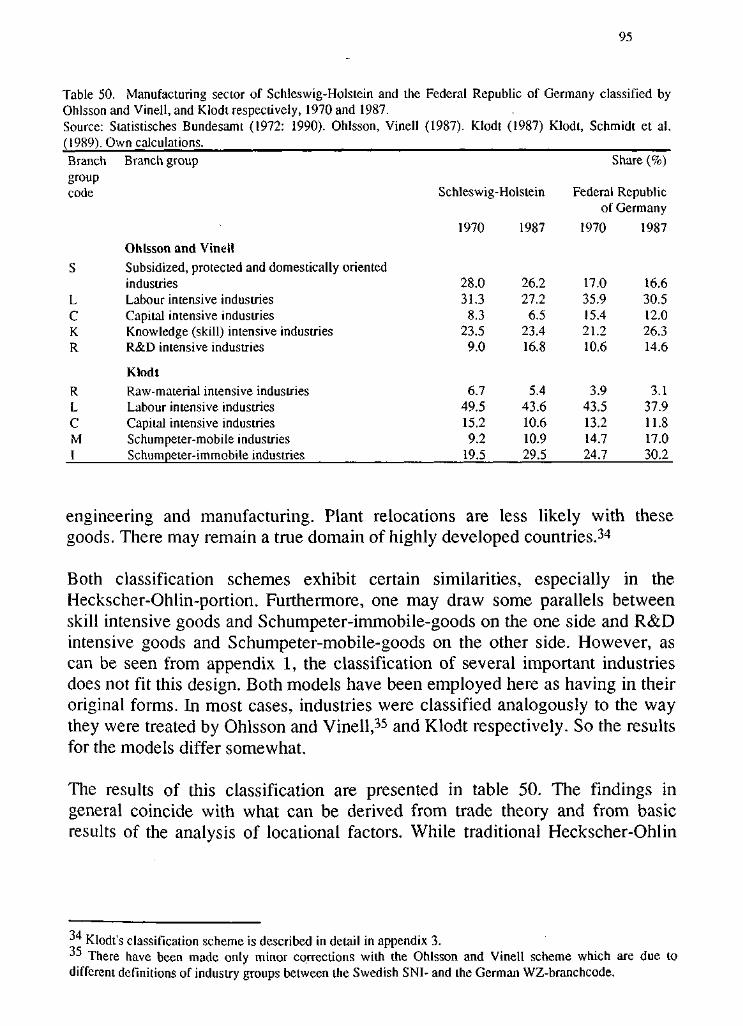
95
Table 50. Manufacturing sector of Schleswig-Holstein and the Federal Republic of Germany classified byOhlsson and Vinell, and Klodt respectively, 1970 and 1987.Source: Statistisches Bundesamt (1972: 1990). Ohlsson, Vinell (1987). Klodt (1987) Klodt, Schmidt et al.(1989). Own calculations.Branchgroupcode
S
LCKR
RLCMI
Branch group
Ohlsson and VinellSubsidized, protected and domestically orientedindustriesLabour intensive industriesCapital intensive industriesKnowledge (skill) intensive industriesR&D intensive industries
KlodtRaw-material intensive industriesLabour intensive industriesCapital intensive industriesSchumpeter-mobile industriesSchumpeter-immobile industries
Schleswig-Holstein
1970
28.031.3
8.323.5
9.0
6.749.515.29.2
19.5
1987
26.227.2
6.523.416.8
5.443.610.610.929.5
Share (%)
Federal Republicof Germany
1970
17.035.915.421.210.6
3.943.513.214.724.7
1987
16.630.512.026.314.6
3.137.911.817.030.2
engineering and manufacturing. Plant relocations are less likely with thesegoods. There may remain a true domain of highly developed countries.34
Both classification schemes exhibit certain similarities, especially in theHeckscher-Ohlin-portion. Furthermore, one may draw some parallels betweenskill intensive goods and Schumpeter-immobile-goods on the one side and R&Dintensive goods and Schumpeter-mobile-goods on the other side. However, ascan be seen from appendix 1, the classification of several important industriesdoes not fit this design. Both models have been employed here as having in theiroriginal forms. In most cases, industries were classified analogously to the waythey were treated by Ohlsson and Vinell,35 and Klodt respectively. So the resultsfor the models differ somewhat.
The results of this classification are presented in table 50. The findings ingeneral coincide with what can be derived from trade theory and from basicresults of the analysis of locational factors. While traditional Heckscher-Ohlin
3 4 Klodt's classification scheme is described in detail in appendix 3.•" There have been made only minor corrections with the Ohlsson and Vinell scheme which are due todifferent definitions of industry groups between the Swedish SNI- and the German WZ-branchcode.
96
branches have decreased over time in Schleswig-Holstein and in the FederalRepublic, the human capital industries gained employment shares.
This shift is true for the Federal Republic as well as for Schleswig-Holstein andis shown by applying both classification schemes. However, although theemployment shares of subsidized, protected and domestically oriented indust-ries, the raw-material intensive, and the labour intensive decreased in Schleswig-Holstein in the seventies and the eighties, it remained behind the FederalRepublic in terms of the industry mix. These industries, which were the losers inthe structural changes, are more important in Schleswig-Holstein than in theFederal Republic.
hi terms of the human capital intensive industries Schleswig-Holstein lost itsgood position in the skill intensive K-sectors. The share of productive-know-ledge intensive employment stagnated while it was increasing at the federallevel. This development is heavily influenced by the relative decline of ship-building (246), as will be shown later. On the other hand, the R&D intensive R-sector has grown faster in Schleswig-Holstein and even bypassed the growth rateof the Federal Republic between 1970 and 1987. This is mainly due to fourindustries: pharmaceutical products (20031),36 communication equipment andelectronical appliances for measuring, checking, testing and navigating (2506),precision instruments (2525), and medical equipment (2527). Their shares alonein Schleswig-Holstein account for 2.6 resp. 5.1 resp. 0.8 resp. 4.4%, but only 1.1resp. 3.8 resp. 0.4 resp. 1.1% in the whole Federal Republic. In the otherindustries of the R-sector,37 Schleswig-Holstein has substantially lower employ-ment shares.
Employing the Klodt-scheme, additional aspects can be revealed. It shows animpressive upward shift for Schleswig-Holstein of the share of production ofSchumpeter-immobile-goods (I-sector), 10% in Schleswig-Holstein, but only5.5% in the Federal Republic (table 50). A closer look at the data shows againthat pharmaceutical products (20031) and communication equipment andelectronical appliances for measuring, checking, testing and navigating (2506)account for this development. Also the production of machinery (242), opticaland optometrical equipment (2521), precision instruments (2525) and especially
3 " It has to be noted that the 1970 census does not provide informations at the five-digit-level of the WZ-code.For this year data on pharmaceutical products are contained in the number for the three-digit category"Manufacture of chemicals and chemical products" (200), which for 1970 completely and for 1987 with theexception of 20031 belongs to the C-sector. So the reported faster structural shift for Schleswig-Holstein in thissub-branch may be somewhat overstated.37Office, accounting and computing machinery (243), aircraft and spacecraft (248), electrical power stationequipment (2503), and consumer electronics (2507) make up for the rest of the R-sector.
97
medical instruments and equipment (2527) have contributed, where Schleswig-Holstein's industry has a quantitative and qualitative focus as noted above.38
Applying the Klodt scheme as well as the Ohlsson and Vinell scheme shows arapid structural change to modern human capital intensive industries(Schumpeter-immobile industries and R&D intensive industries respectively),which was clearly faster than in the Federal Republic. This is mainly due to afew "diamonds" among the region's manufacturing industries and firms. On theother hand, the structural shift to Knowledge intensive industries (Ohlsson andVinell) and to the Schumpeter-mobile industries (Klodt) was distinctly lesspronounced than in the Republic or did not take place. It seems clear from theabove that insufficient wage differentiation in the region does not offer veryfavourable conditions for the production of Schumpeter-mobile industries. Alsoresearch in these branches takes place at other locations, as the data on researchinputs show. The overall shift towards modern industries is mainly due tomachinery and precision instruments, where there seems to be a concentration ofinputs and efforts in Schleswig-Holstein. These branches employ more R&Dpersonnel than the average in the Federal Republic (table 47). So, the pictureaccording to the Klodt-scheme exhibits a dual structure in the R&D sector: Fewdiamonds that have driven forward structural change, but a lack of "foot-loose"firms which could strengthen the human capital intensive sector.
We have made additional calculations to look at Schleswig-Holstein's manu-facturing when the fastly shrinking, but still prominent, shipbuilding industry(246) is excluded. The data are presented in table 51.
In the human capital intensive industries the region remains behind in the shareof the K-sector using the Ohlsson and Vinell model. The lag is even larger with-out shipbuilding because of its minor importance on the federal level. Whatcounts, however, is the fact that Schleswig-Holstein now exhibits a positivestructural change in the K-sector, too, though it still remains smaller than in theFederal Republic. Taken together the strucutural change in the K- and R-sectorstowards the modern sectors was even faster in Schleswig-Holstein than in therest of the country.
According to the Klodt-scheme there remains a widening gap between the shareof Schumpeter-mobile-goods of Schleswig-Holstein and the Federal Republic,but this tendency is slightly less pronounced. The increase of the Schumpeter-immobile-goods in Schleswig-Holstein, however, is not only faster than in the
™ Just to explain the differences between the two classification schemes employed here: Ohlsson and Vinelldo not - as Klodt does - classify the latter branches as belonging to the R-sector but to the K-sector, while theformer are a central part of the R-sector.

98
Table 51. Manufacturing sector of Schleswig-Holstein and the Federal Republic of Germany classifiedby Ohlsson and Vinell, and Klodt respectively, shipbuilding excluded, 1970 and 1987.Source: Statistisches Bundesamt (1972: 1990). Ohlsson, Vinell (1987). Klodt (1987) Klodt, Schmidt et al.(1989). Own calculations.Branchgroupcode
S
LCKR
RLCMI
Branch group
Ohlsson and Vinell
Subsidized, protected and domestically orientedindustriesLabour intensive industriesCapital intensive industriesKnowledge (skill) intensive industriesR&D intensive industries
KlodtRaw-material intensive industriesLabour intensive industriesCapital intensive industriesSchumpeter-mobile industriesSchumpeter-immobile industries
Schleswig-Holstein
1970
29.034.1
9.016.69.8
7.353.9
7.69.9
21.3
1987
27.328.5
6.719.917.5
5.645.6
6.711.430.8
Share (%)
Federal Republicof Germany
1970
17.036.115.520.610.7
3.943.812.614.824.9
1987
16.730.712.026.014.7
3.138.111.417.130.4
Federal Republic, but Schleswig-Holstein even outperformed the FederalRepublic with respect to the absolute level of the share.
Notwithstanding the differences between the models they show the same results.The modern Human capital intensive sector as a whole (K- and R-sectors inOhlsson and Vinell, M- and I-sectors in Klodt) grew faster between 1970 and1987 in Schleswig-Holstein (by 11% with both models) than in the FederalRepublic (by 9.4 resp. 7.8%). However, it is still smaller in Schleswig-Holstein(3.5 resp. 5.3%).
Conclusions
From these results one may conclude that in the course of structural change inmanufacturing Schleswig-Holstein indeed had caught up in the seventies and theeighties. However, the country's economy is still lagging behind that of other,more prosperous German states with respect to the overall share of modernhuman capital intensive industries. At the top of the R&D intensive industriesindeed the gap to the other states was only of minor importance in 1987 or haseven disappeared. However, deficits can be detected with industries, wherecraftman's skills are called for or where production sites ought to be transferred
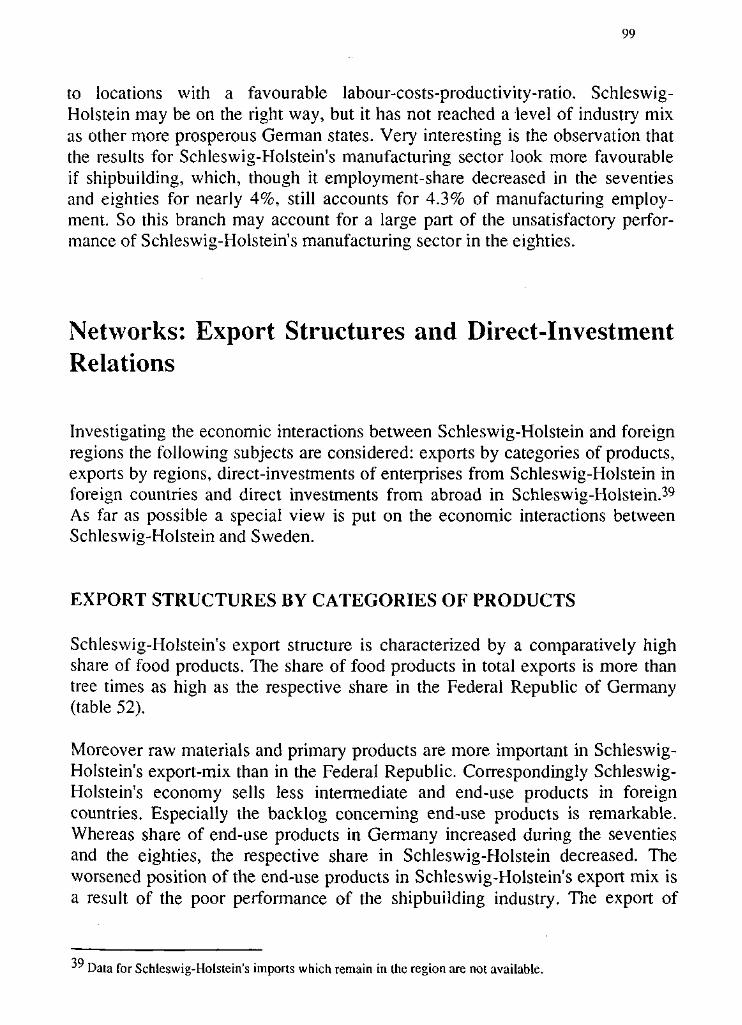
99
to locations with a favourable labour-costs-productivity-ratio. Schleswig-Holstein may be on the right way, but it has not reached a level of industry mixas other more prosperous German states. Very interesting is the observation thatthe results for Schleswig-Holstein's manufacturing sector look more favourableif shipbuilding, which, though it employment-share decreased in the seventiesand eighties for nearly 4%, still accounts for 4.3% of manufacturing employ-ment. So this branch may account for a large part of the unsatisfactory perfor-mance of Schleswig-Holstein's manufacturing sector in the eighties.
Networks: Export Structures and Direct-InvestmentRelations
Investigating the economic interactions between Schleswig-Holstein and foreignregions the following subjects are considered: exports by categories of products,exports by regions, direct-investments of enterprises from Schleswig-Holstein inforeign countries and direct investments from abroad in Schleswig-Holstein.39
As far as possible a special view is put on the economic interactions betweenSchleswig-Holstein and Sweden.
EXPORT STRUCTURES BY CATEGORIES OF PRODUCTS
Schleswig-Holstein's export structure is characterized by a comparatively highshare of food products. The share of food products in total exports is more thantree times as high as the respective share in the Federal Republic of Germany(table 52).
Moreover raw materials and primary products are more important in Schleswig-Holstein's export-mix than in the Federal Republic. Correspondingly Schleswig-Holstein's economy sells less intermediate and end-use products in foreigncountries. Especially the backlog concerning end-use products is remarkable.Whereas share of end-use products in Germany increased during the seventiesand the eighties, the respective share in Schleswig-Holstein decreased. Theworsened position of the end-use products in Schleswig-Holstein's export mix isa result of the poor performance of the shipbuilding industry. The export of
9 Data for Schleswig-Holstein's imports which remain in the region are not available.
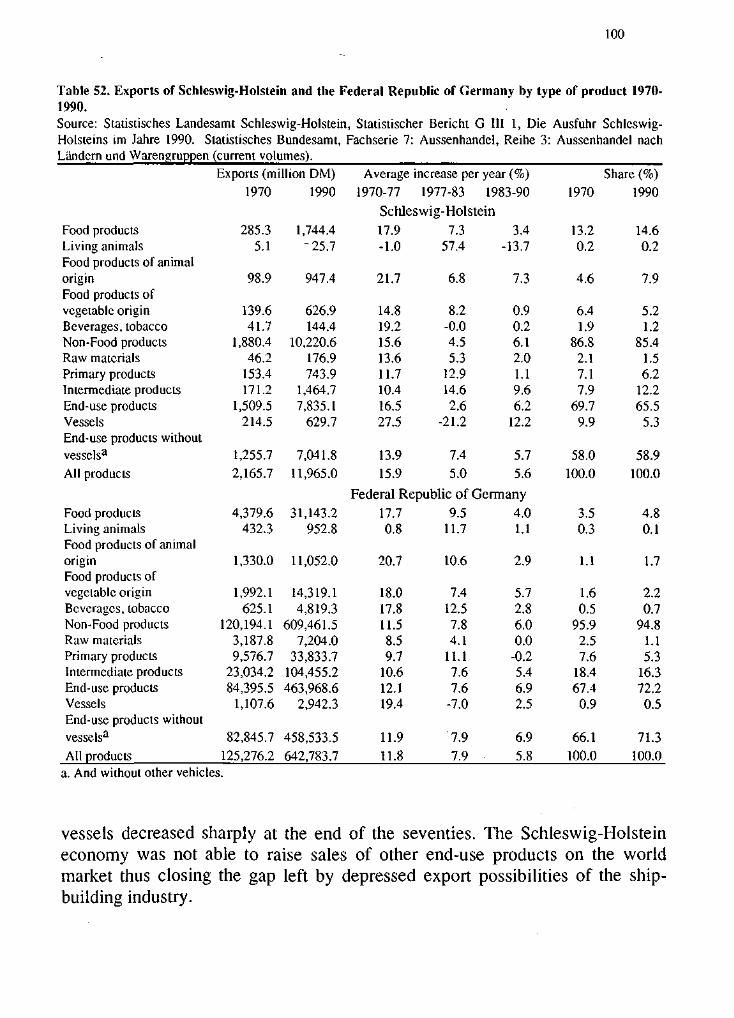
100
Table 52. Exports of Schleswig-Holstein and the Federal Republic of Germany by type of product 1970-1990.Source: Slatistisches Landesamt Schleswig-Holstein, Statistischer Bericht G III 1, Die Ausfuhr Schlcswig-Holsteins im Jahre 1990. Statistisches Bundesamt, Fachserie 7: Aussenhandel, Reihe 3: Aussenhandel nachLandern und Warengruppen (current volumes).
Food productsLiving animalsFood products of animaloriginFood products ofvegetable originBeverages, tobaccoNon-Food productsRaw materialsPrimary productsIntermediate productsEnd-use productsVesselsEnd-use products withoutvesselsa
All products
Food productsLiving animalsFood products of animaloriginFood products ofvegetable originBeverages, tobaccoNon-Food productsRaw materialsPrimary productsIntermediate productsEnd-use productsVesselsEnd-use products withoutvesselsa
All products
Exports (million DM)1970
285.35.1
98.9
139.641.7
1,880.446.2
153.4171.2
1,509.5214.5
1,255.72,165.7
4,379.6432.3
1,330.0
1,992.1625.1
120,194.13,187.89,576.7
23,034.284,395.5
1,107.6
82,845.7125,276.2
1990
1,744.4-25.7
947.4
626.9144.4
10,220.6176.9743.9
1,464.77,835.1
629.7
7,041.811,965.0
31,143.2952.8
11,052.0
14,319.14,819.3
609,461.57,204.0
33,833.7104,455.2463,968.6
2,942.3
458,533.5642,783.7
Average1970-77
increase pei1977-83
- year (%)
1983-90
Schleswig-Holstein17.9-1.0
21.7
14.819.215.613.611.710.416.527.5
13.915.9
7.357.4
6.8
8.2-0.04.55.3
12.914.62.6
-21.2
7.4
5.0
3.4-13.7
7.3
0.90.26.12.01.19.66.2
12.2
5.75.6
Federal Republic of Germany17.70.8
20.7
18.017.811.58.59.7
10.612.119.4
11.911.8
9.511.7
10.6
7.412.57.84.1
11.17.67.6
-7.0
7.97.9
4.01.1
2.9
5.72.86.00.0
-0.25.46.92.5
6.95.8
1970
13.20.2
4.6
6.41.9
86.82.17.17.9
69.79.9
58.0100.0
3.50.3
1.1
1.60.5
95.92.57.6
18.467.40.9
66.1100.0
Share (%)1990
14.60.2
7.9
5.21.2
85.41.56.2
12.265.55.3
58.9100.0
4.80.1
1.7
2.20.7
94.81.15.3
16.372.20.5
71.3100.0
a. And without other vehicles.
vessels decreased sharply at the end of the seventies. The Schleswig-Holsteineconomy was not able to raise sales of other end-use products on the worldmarket thus closing the gap left by depressed export possibilities of the ship-building industry.
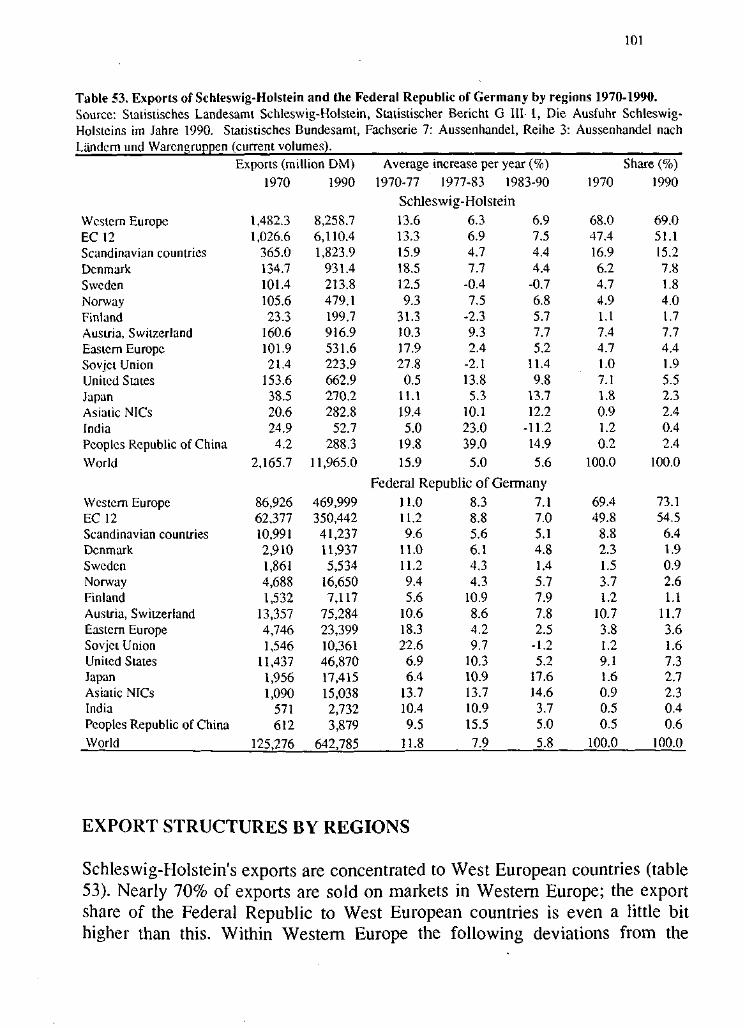
101
Table 53. Exports of Schleswig-Holstein and the Federal Republic of Germany by regions 1970-1990.Source: Statistisches Landesamt Schleswig-Holstein, Statistischer Bericht G III 1, Die Ausfuhr Schleswig-Holsteins im Jahre 1990. Statistisches Bundesamt, Fachserie 7: Aussenhandel, Reihe 3: Aussenhandel nachLandcrn und Warengruppen (current volumes).
Western EuropeEC 12Scandinavian countriesDenmarkSwedenNorwayFinlandAustria, SwitzerlandEastern EuropeSovjet UnionUnited StatesJapanAsiatic NICsIndiaPeoples Republic of China
World
Western EuropeEC 12Scandinavian countriesDenmarkSwedenNorwayFinlandAustria, SwitzerlandEastern EuropeSovjet UnionUnited StatesJapanAsiatic NICsIndiaPeoples Republic of ChinaWorld
Exports (million DM)
1970
1,482.31,026.6
365.0134.7101.4105.623.3
160.6101.921.4
153.638.520.624.94.2
2,165.7
86,92662,37710,9912,9101,8614,6881,532
13,3574,7461,546
11,4371,9561,090
571612
125,276
1990
8,258.76,110.41,823.9
931.4213.8479.1199.7916.9531.6223.9662.9270.2282.8
52.7288.3
11,965.0
469,999350,44241,23711,9375,534
16,6507,117
75,28423,39910,36146,87017,41515,0382,7323,879
642,785
Average
1970-77
increase per1977-83
• year (%)
1983-90
Schleswig-Holstein13.613.315.918.512.59.3
31.310.317.927.8
0.511.119.45.0
19.815.9
6.36.94.77.7
-0.47.5
-2.39.32.4
-2.113.85.3
10.123.039.0
5.0
6.97.54.44.4
-0.76.85.77.75.2
11.49.8
13.712.2
-11.214.95.6
Federal Republic of Germany11.011.29.6
11.011.29.45.6
10.618.322.6
6.96.4
13.710.49.5
11.8
8.38.85.66.14.34.3
10.98.64.29.7
10.310.913.710.915.5
7.9
7.17.05.14.81.45.77.97.82.5
-1.25.2
17.614.63.75.0
5.8
1970
68.047.416.96.24.74.91.17.44.71.07.11.80.91.20.2
100.0
69.449.8
8.82.31.53.71.2
10.73.81.29.11.60.90.50.5
100.0
Share (%)1990
69.051.115.27.81.84.01.77.74.41.95.52.32.40.42.4
100.0
73.154.56.41.90.92.61.1
11.73.61.67.32.72.30.40.6
100.0
EXPORT STRUCTURES BY REGIONS
Schleswig-Holstein's exports are concentrated to West European countries (table53). Nearly 70% of exports are sold on markets in Western Europe; the exportshare of the Federal Republic to West European countries is even a little bithigher than this. Within Western Europe the following deviations from the
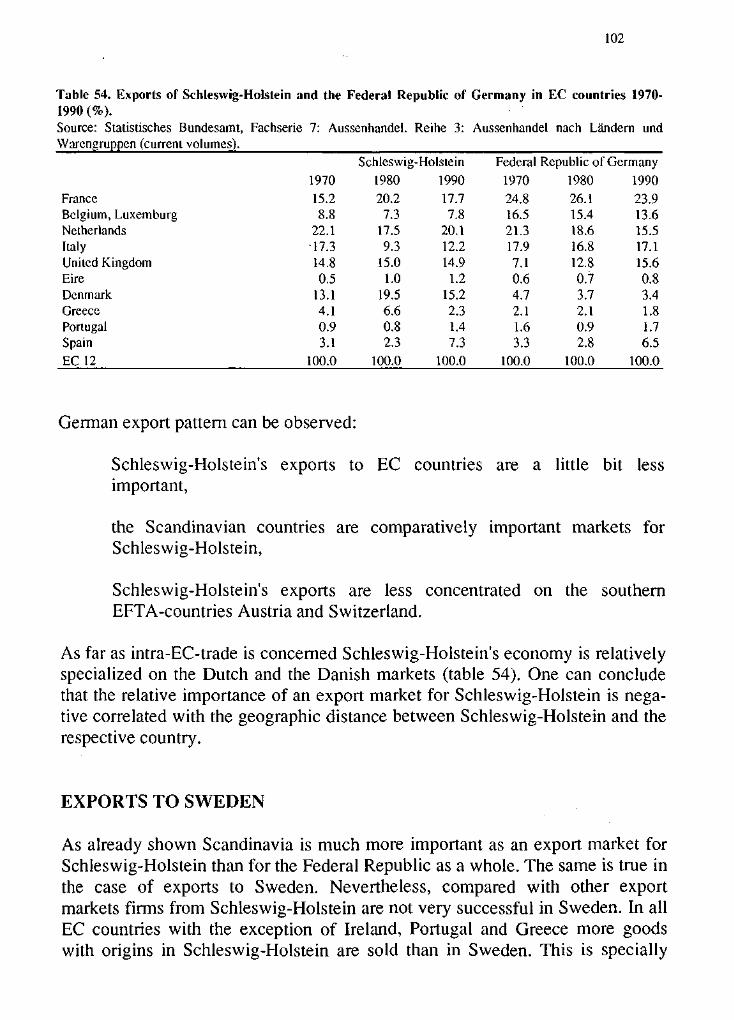
14.80.5
13.14.10.93.1
15.01.0
19.56.60.82.3
14.91.2
15.22.31.47.3
7.10.64.72.11.63.3
12.80.73.72.10.92.8
15.60.83.41.81.76.5
102
Table 54. Exports of Schleswig-Holstein and the Federal Republic of Germany in EC countries 1970-1990 (%).Source: Statistisches Bundesamt, Fachserie 7: Aussenhandel. Reihe 3: Aussenhandel nach Landern undWarengruppen (current volumes).
Schleswig-Holstein Federal Republic of Germany1970 1980 1990 1970 1980 1990
France 15.2 20.2 17.7 24.8 26.1 23.9Belgium, Luxemburg 8.8 7.3 7.8 16.5 15.4 13.6Netherlands 22.1 17.5 20.1 21.3 18.6 15.5Italy -17.3 9.3 12.2 17.9 16.8 17.1United KingdomEireDenmarkGreecePortugalSpainEC 12 100.0 100.0 100.0 100.0 100.0 100.0
German export pattern can be observed:
Schleswig-Holstein's exports to EC countries are a little bit lessimportant,
the Scandinavian countries are comparatively important markets forSchleswig-Holstein,
Schleswig-Holstein's exports are less concentrated on the southernEFTA-countries Austria and Switzerland.
As far as intra-EC-trade is concerned Schleswig-Holstein's economy is relativelyspecialized on the Dutch and the Danish markets (table 54). One can concludethat the relative importance of an export market for Schleswig-Holstein is nega-tive correlated with the geographic distance between Schleswig-Holstein and therespective country.
EXPORTS TO SWEDEN
As already shown Scandinavia is much more important as an export market forSchleswig-Holstein than for the Federal Republic as a whole. The same is true inthe case of exports to Sweden. Nevertheless, compared with other exportmarkets firms from Schleswig-Holstein are not very successful in Sweden. In allEC countries with the exception of Ireland, Portugal and Greece more goodswith origins in Schleswig-Holstein are sold than in Sweden. This is specially
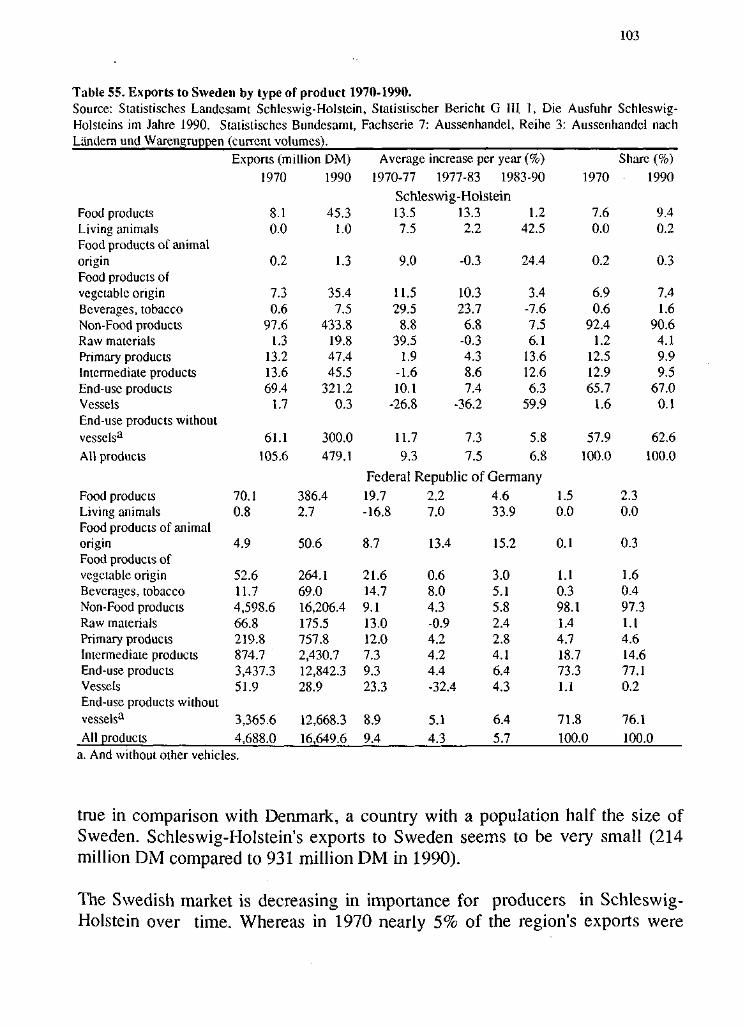
103
Table 55. Exports to Sweden by type of product 1970-1990.Source: Statistisches Landesamt Schleswig-Holstein, Statistischer Bericht G III 1, Die Ausfuhr Schleswig-Holsteins im Jahre 1990. Statistisches Bundesamt, Fachserie 7: Aussenhandel, Reihe 3: Aussenhandel nachLandern und Warengruppen (current volumes).
Food productsLiving animalsFood products of animaloriginFood products ofvegetable originBeverages, tobaccoNon-Food productsRaw materialsPrimary productsIntermediate productsEnd-use productsVesselsEnd-use products withoutvesselsa
All products
Food productsLiving animalsFood products of animaloriginFood products ofvegetable originBeverages, tobaccoNon-Food productsRaw materialsPrimary productsIntermediate productsEnd-use productsVesselsEnd-use products withoutvessels3
All products
Exports (million DM)
1970
8.10.0
0.2
7.30.6
97.61.3
13.213.669.4
1.7
61.1105.6
70.10.8
4.9
52.611.74,598.666.8219.8874.73,437.351.9
3,365.64,688.0
1990
45.31.0
1.3
35.47.5
433.819.847.445.5
321.20.3
300.0479.1
386.42.7
50.6
264.169.016,206.4175.5757.82,430.712,842.328.9
12,668.3
16,649.6
Average1970-77
; increase per year (%)
1977-83 1983-90
Schleswig-Holstein13.57.5
9.0
11.529.5
8.839.5
1.9-1.610.1
-26.8
11.7
9.3
13.32.2
-0.3
10.323.76.8
-0.34.38.67.4
-36.2
7.37.5
1.242.5
24.4
3.4-7.67.56.1
13.612.66.3
59.9
5.86.8
Federal Republic of Germany19.7-16.8
8.7
21.614.79.113.012.07.39.323.3
8.99.4
2.27.0
13.4
0.68.04.3-0.94.24.24.4-32.4
5.1
4.3
I
4.633.9
15.2
3.05.15.82.42.84.16.44.3
6.4
5.7
1.50.0
0.1
1.10.398.1.44.718.73.1.1
71.
1970
7.60.0
0.2
6.90.6
92.41.2
12.512.965.7
1.6
57.9
100.0
1
73
8100.0
Share (%)
2.30.0
0.3
1.60.497.31.14.614.677.10.2
76.1
100.
1990
9.40.2
0.3
7.41.6
90.64.19.99.5
67.00.1
62.6100.0
0a. And without other vehicles.
true in comparison with Denmark, a country with a population half the size ofSweden. Schleswig-Holstein's exports to Sweden seems to be very small (214million DM compared to 931 million DM in 1990).
The Swedish market is decreasing in importance for producers in Schleswig-Holstein over time. Whereas in 1970 nearly 5% of the region's exports were
104
sold in Sweden this figure was less than 2% in 1990. On no other important ex-port market have sales relatively decreased as much as on the Swedish market.
The product mix sold on the Swedish market from Schleswig-Holstein is specia-lized on the following products (in comparison with the export-pattern of theFederal Republic to Sweden, as well as in comparison with the export-pattern ofSchleswig-Holstein to the world):
- food products of vegetable origin- raw materials- primary products (table 55)
The poor performance of exports to Sweden could be caused by a low Swedishimport demand. Another explanation could be that the access to other marketsbecame relatively easier, for example Denmark, the United Kingdom and Spainjoined the common market.
DIRECT INVESTMENT RELATIONS
The balance of Schleswig-Holstein's direct investment links with foreigncountries suggests that the region is behind in economic development comparedwith the Federal Republic. The German direct investment in foreign countriesexceeds direct investment from abroad in Germany. This is to be expected in aneconomy with a high per-capita-income (table 56). The opposite is true in thecase of Schleswig-Holstein. The stock of investments from abroad in Schleswig-Holstein is higher than the stock of investments in foreign countries fromSchleswig-Holstein.
During the eighties the region's direct investments in foreign countries acce-lerated more than the national average. This shows that the ability of Schleswig-Holstein's firms to locate production plants or build up distribution systems inother countries increased. But this is true only for some industries: machinery(non electric), precision mechanics, optic, wholesale and retail trade. Besidesmachinery (non electric) Germany's direct investments in foreign countries areconcentrated in the following industries: chemicals, road motor vehicles, electri-cal machines and equipment, and banking (table 57).
In the case of Schleswig-Holstein as well as in the case of the Federal Republic,firms undertaking investment abroad belong to industries which had a good eco-nomic performance in the eighties. That indicates that a precondition for foreignengagements is a strong home base.
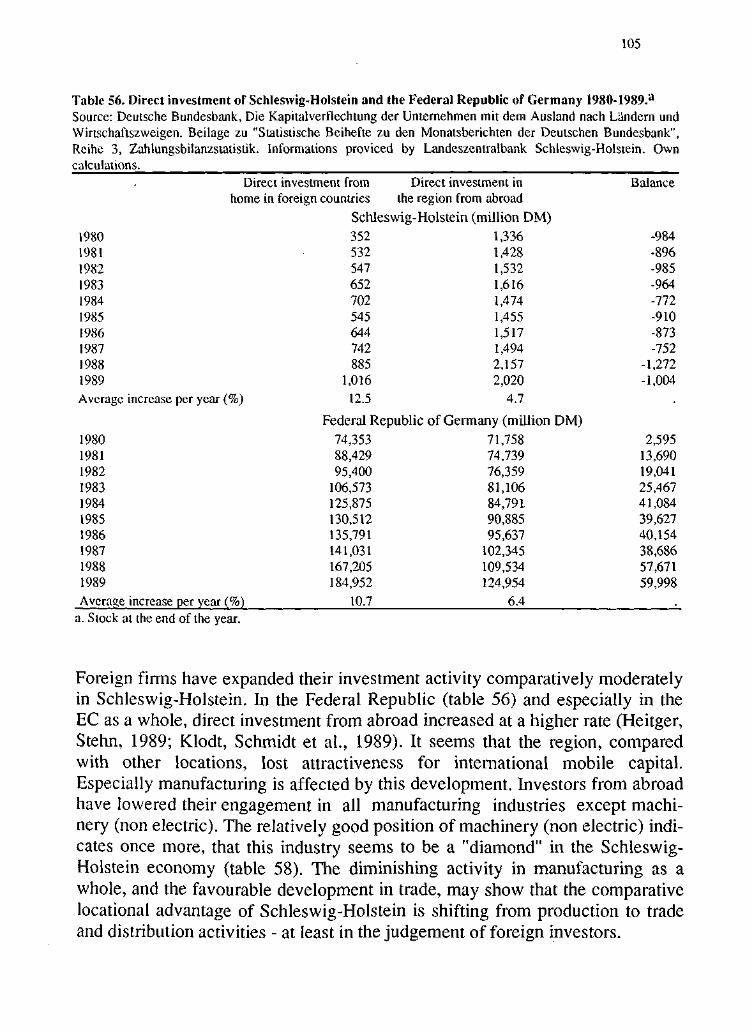
105
Table 56. Direct investment of Schleswig-Holstein and the Federal Republic of Germany 1980-1989.a
Source: Deutsche Bundesbank, Die Kapitalverflechtung der Unternehmen mit dem Ausland nach Landern undWirtschaftszweigen. Beilage zu "Statistische Beihefte zu den Monatsberichten der Deutschen Bundesbank",Reihe 3, Zahlungsbilanzstatistik. Informations proviced by Landeszentralbank Schleswig-Holstein. Owncalculations.
Direct investment from Direct investment in Balancehome in foreign countries the region from abroad
Schleswig-Holstein (million DM)
1980 352 1,336 -9841981 532 1,428 -8961982 547 1,532 -9851983 652 1,616 -9641984 702 1,474 -7721985 545 1,455 -9101986 644 1,517 -8731987 742 1,494 -7521988 885 2,157 -1,2721989 1,016 2,020 -1,004Average increase per year (%) 12.5 4.7
Federal Republic of Germany (million DM)
1980 74,353 71,758 2,5951981 88,429 74,739 13,6901982 95,400 76,359 19,0411983 106,573 81,106 25,4671984 125,875 84,791. 41,0841985 130,512 90,885 39,6271986 135,791 95,637 40,1541987 141,031 102,345 38,6861988 167,205 109,534 57,671
1989 184,952 124,954 59,998
Average increase per year (%) 10.7 &A ._a. Stock at the end of the year.
Foreign firms have expanded their investment activity comparatively moderatelyin Schleswig-Holstein. In the Federal Republic (table 56) and especially in theEC as a whole, direct investment from abroad increased at a higher rate (Heitger,Stehn, 1989; Klodt, Schmidt et al., 1989). It seems that the region, comparedwith other locations, lost attractiveness for international mobile capital.Especially manufacturing is affected by this development. Investors from abroadhave lowered their engagement in all manufacturing industries except machi-nery (non electric). The relatively good position of machinery (non electric) indi-cates once more, that this industry seems to be a "diamond" in the Schleswig-Holstein economy (table 58). The diminishing activity in manufacturing as awhole, and the favourable development in trade, may show that the comparativelocational advantage of Schleswig-Holstein is shifting from production to tradeand distribution activities - at least in the judgement of foreign investors.
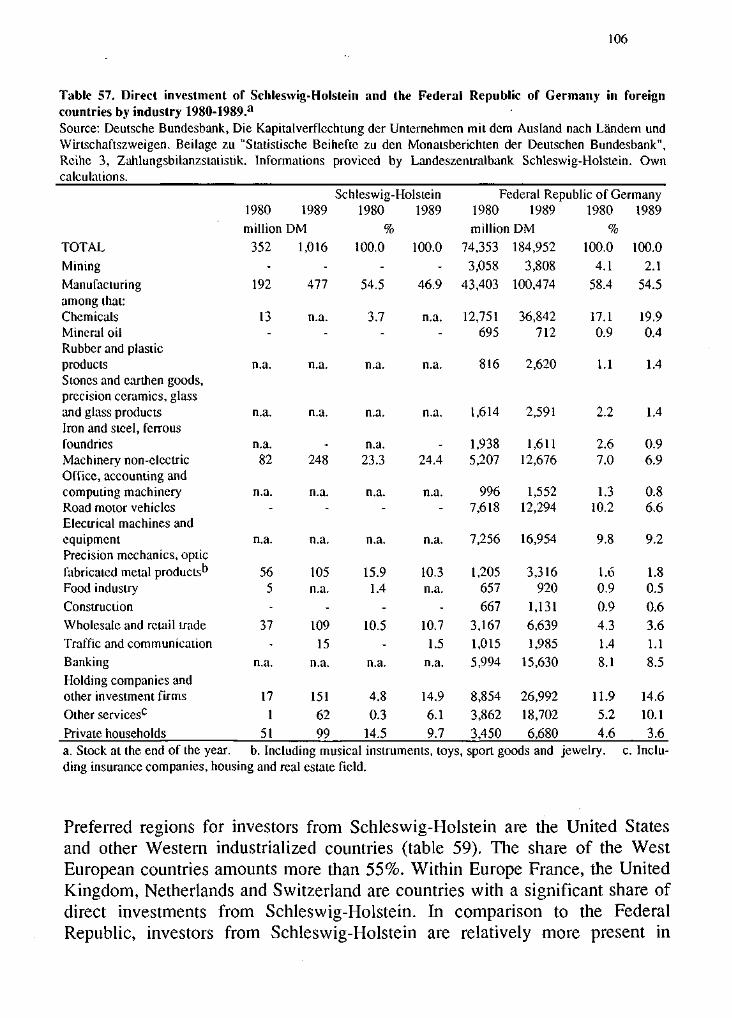
106
Table 57. Direct investment of Schleswig-Holstein and the Federal Republic of Germany in foreigncountries by industry 1980-1989.a
Source: Deutsche Bundesbank, Die Kapitalverflcchtung der Unternehmen mit dem Ausland nach Landern undWirtschaftszweigen. Beilage zu "Statistische Beihefte zu den Monatsberichten der Deutschen Bundesbank",Rcihe 3, Zahlungsbilanzstatistik. Informations proviced by Landeszentralbank Schleswig-Holstein. Owncalculations.
Schleswig-Holstein1980 1989 1980 1989million DM %
Federal Republic of Germany1980 1989 1980 1989million DM %
TOTALMining
Manufacturingamong that:ChemicalsMineral oilRubber and plasticproductsStones and earthen goods,precision ceramics, glassand glass productsIron and steel, ferrousfoundriesMachinery non-electricOffice, accounting andcomputing machineryRoad motor vehiclesElectrical machines andequipmentPrecision mechanics, opticfabricated metal products"Food industryConstruction
Wholesale and retail tradeTraffic and communicationBankingHolding companies andother investment firms
Other services0
Private households
352-
192
13-
n.a.
n.a.
n.a.82
n.a.-
n.a.
565-
37-
n.a.
171
51
1,016-
477
n.a.-
n.a.
n.a.
-248
n.a.-
n.a.
105n.a.
-
10915
n.a.
15162
99
100.0-
54.5
3.7_
n.a.
n.a.
n.a.23.3
n.a.-
n.a.
15.91.4
-
10.5-
n.a.
4.80.3
14.5
100.0-
46.9
n.a.-
n.a.
n.a.
-24.4
n.a.-
n.a.
10.3n.a.
-
10.71.5
n.a.
14.96.19.7
74,3533,058
43,403
12,751695
816
1,614
1,9385,207
9967,618
7,256
1,205657
6673,1671,0155,994
8,854
3,862
3,450
184,9523,808
100,474
36,842712
2,620
2,591
1,61112,676
1,55212,294
16,954
3,316920
1,1316,6391,985
15,630
26,99218,702
6,680
100.04.1
58.4
17.10.9
1.1
2.2
2.67.0
1.310.2
9.8
1.60.90.94.31.48.1
11.95.2
4.6
100.02.1
54.5
19.90.4
1.4
1.4
0.96.9
0.86.6
9.2
1.80.5
0.63.61.18.5
14.610.13.6
a. Stock at the end of the year. b. Including musical instruments, toys, sport goods and jewelry,ding insurance companies, housing and real estate field.
c. Inclu-
Preferred regions for investors from Schleswig-Holstein are the United Statesand other Western industrialized countries (table 59). The share of the WestEuropean countries amounts more than 55%. Within Europe France, the UnitedKingdom, Netherlands and Switzerland are countries with a significant share ofdirect investments from Schleswig-Holstein. In comparison to the FederalRepublic, investors from Schleswig-Holstein are relatively more present in
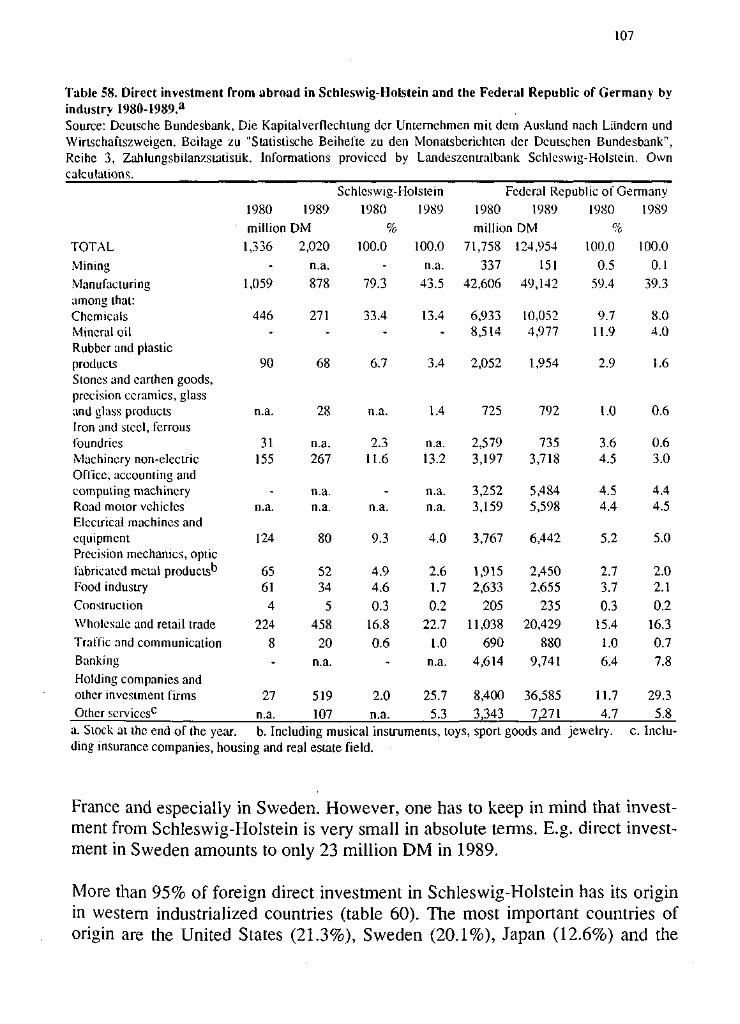
107
Table 58. Direct investment from abroad in Schleswig-Holstein and the Federal Republic of Germany byindustry 1980-1989.a
Source: Deutsche Bundesbank, Die Kapitalverflechtung der Unternehmen mit dem Ausland nach Liindern undWirtschaftszweigen. Beilage zu "Statistische Beihefte zu den Monatsbcrichtcn dcr Deutschen Bundesbank",Rcihe 3, Zahlungsbilanzstatistik. Informations proviccd by Landeszenlralbank Schleswig-Holstein. Owncalculations.
TOTAL
MiningManufacturingamong that:ChemicalsMineral oilRubber and plasticproductsStones and earthen goods,precision ceramics, glassand glass productsIron and steel, ferrousfoundriesMachinery non-electricOffice, accounting andcomputing machineryRoad motor vehiclesElectrical machines andequipmentPrecision mechanics, opticfabricated metal products'3
Food industryConstruction
Wholesale and retail tradeTraffic and communicationBanking
Holding companies andother investment firmsOther services0
1980million
1,336-
1,059
446-
90
n.a.
31155
-n.a.
124
65614
224
8-
27n.a.
1989DM
2,020n.a.
878
271-
68
28
n.a.267
n.a.n.a.
80
5234
5458
20n.a.
519107
Schleswig-Holstein1980
%100.0
-
79.3
33.4-
6.7
n.a.
2.311.6
-n.a.
9.3
4.94.6
0.316.80.6
-
2.0n.a.
1989
100.0n.a.
43.5
13.4-
3.4
1.4
n.a.13.2
n.a.n.a.
4.0
2.61.70.2
22.71.0
n.a.
25.75.3
Federal Republic of Germany1980million
71,758
33742,606
6,9338,514
2,052
725
2,5793,197
3,2523,159
3,767
1,9152,633
20511,038
6904,614
8,400
3,343
1989iDM124,954
15149,142
10,0524,977
1,954
792
7353,718
5,4845,598
6,442
2,4502,655
23520,429
8809,741
36,5857,271
1980%
100.00.5
59.4
9.711.9
2.9
1.0
3.64.5
4.54.4
5.2
2.73.7
0.315.4
1.06.4
11.74.7
1989
100.00.1
39.3
8.04.0
1.6
0.6
0.63.0
4.44.5
5.0
2.02.10.2
16.30.77.8
29.35.8
a. Stock at the end of the year. b. Including musical instruments, toys, sport goods and jewelry,ding insurance companies, housing and real estate field.
c. Inclu-
France and especially in Sweden. However, one has to keep in mind that invest-ment from Schleswig-Holstein is very small in absolute terms. E.g. direct invest-ment in Sweden amounts to only 23 million DM in 1989.
More than 95% of foreign direct investment in Schleswig-Holstein has its originin western industrialized countries (table 60). The most important countries oforigin are the United States (21.3%), Sweden (20.1%), Japan (12.6%) and the
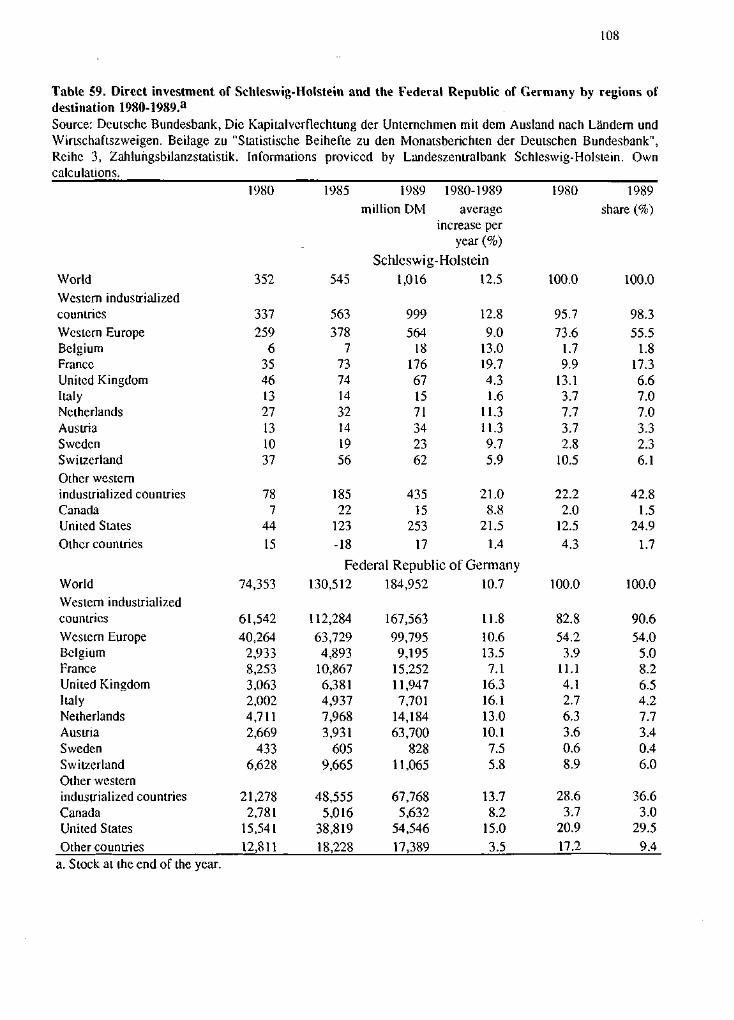
108
Table 59. Direct investment of Schleswig-Holstein and the Federal Republic of Germany by regions ofdestination 1980-1989.a
Source: Deutsche Bundesbank, Die Kapitalverflechtung der Untemchmen mit dem Ausland nach Landern undWirtschaftszweigen. Beilage zu "Statistische Beihefte zu den Monatsberichten der Deutschen Bundesbank",Reihe 3, Zahlungsbilanzstatistik. Informations proviced by Landeszentralbank Schleswig-Holstein. Owncalculations.
WorldWestern industrializedcountriesWestern EuropeBelgiumFranceUnited KingdomItalyNetherlandsAustriaSwedenSwitzerlandOther westernindustrialized countriesCanadaUnited StatesOther countries
WorldWestern industrializedcountriesWestern EuropeBelgiumFranceUnited KingdomItalyNetherlandsAustriaSwedenSwitzerlandOther westernindustrialized countriesCanadaUnited StatesOther countries
1980
352
337259
635461327131037
787
44
15
74,353
61,54240,264
2,9338,2533,0632,0024,7112,669
4336,628
21,2782,781
15,541
12,811
1985
545
563378
773741432141956
18522
123-18
1989million DM
1980-1989average
increase peryear (%)
Schleswig-Holstein1,016
999564
18176671571342362
43515
25317
12.5
12.89.0
13.019.74.31.6
11.311.39.75.9
21.08.8
21.51.4
Federal Republic of Germany130,512
112,284
63,7294,893
10,8676,3814,9377,9683,931
6059,665
48,5555,016
38,81918,228
184,952
167,56399,795
9,19515,25211,9477,701
14,18463,700
82811,065
67,7685,632
54,54617,389
10.7
11.810.613.57.1
16.316.113.010.17.55.8
13.78.2
15.03.5
1980
100.0
95.7
73.61.79.9
13.13.77.73.72.8
10.5
22.22.0
12.54.3
100.0
82.854.2
3.911.14.12.76.33.60.68.9
28.63.7
20.917.2
1989share (%)
100.0
98.355.5
1.817.36.67.07.03.32.36.1
42.81.5
24.91.7
100.0
90.654.0
5.08.26.54.27.73.40.46.0
36.63.0
29.59.4
a. Stock at the end of the year.
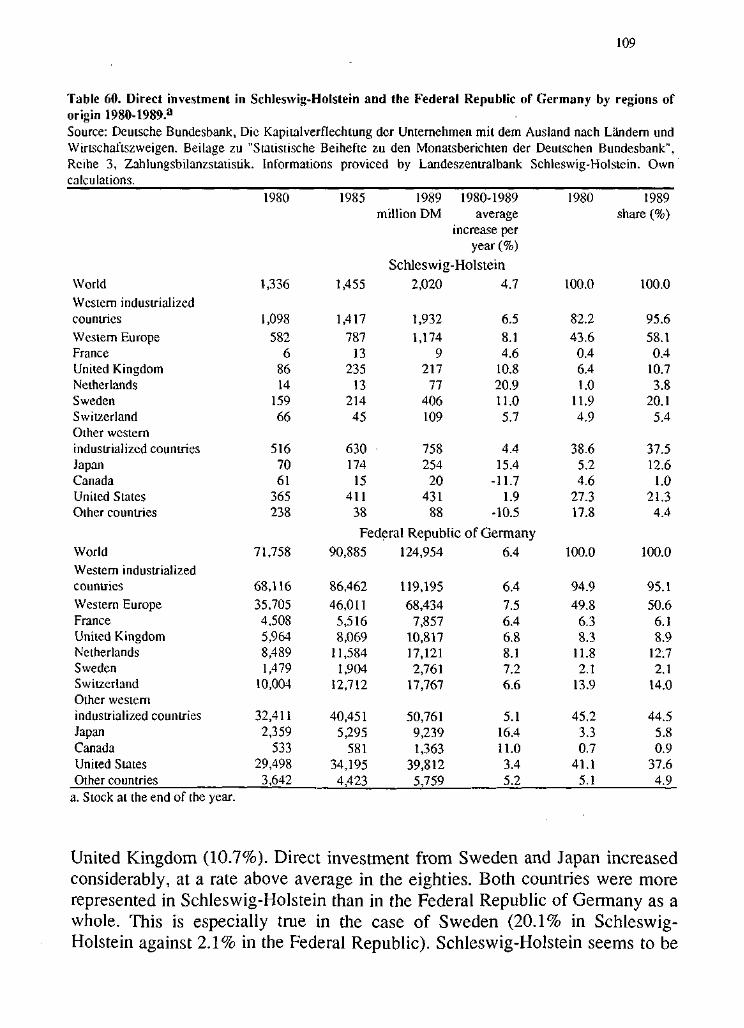
109
Table 60. Direct investment in Schleswig-Holstein and the Federal Republic of Germany by regions oforigin 1980-1989.a
Source: Deutsche Bundesbank, Die Kapitalverflechtung der Unternehmen mit dem Ausland nach Landern undWirtschaftszweigen. Beilage zu "Statistische Beihefte zu den Monatsberichten der Deutschen Bundesbank",Reihe 3, Zahlungsbilanzstatistik. Informations proviced by Landeszentralbank Schleswig-Holstein. Owncalculations.
World
Western industrializedcountriesWestern EuropeFranceUnited KingdomNetherlandsSwedenSwitzerlandOther westernindustrialized countriesJapanCanadaUnited StatesOther countries
WorldWestern industrializedcountriesWestern EuropeFranceUnited KingdomNetherlandsSwedenSwitzerlandOther westernindustrialized countriesJapanCanadaUnited StatesOther countries
1980
1,336
1,098582
68614
15966
5167061
365238
71,758
68,11635,7054,5085,9648,4891,479
10,004
32,4112,359
53329,498
3,642
1985
1,455
1,417787
13235
1321445
630174
15411
38
1989million DM
Schleswig2,020
1,9321,174
9217
77406109
758254
20431
88
1980-1989average
increase peryear (%)
;-Holstein4.7
6.58.14.6
10.820.911.05.7
4.415.4
-11.71.9
-10.5
Federal Republic of Germany90,885
86,462
46,0115,5168,069
11,5841,904
12,712
40,4515,295
58134,1954,423
124,954
119,19568,434
7,85710,81717,1212,761
17,767
50,7619,2391,363
39,8125,759
6.4
6.4
7.56.46.88.17.26.6
5.116.411.03.45.2
1980
100.0
82.2
43.60.46.41.0
11.94.9
38.65.24.6
27.317.8
100.0
94.949.8
6.38.3
11.82.1
13.9
45.23.30.7
41.15.1
1989share (%)
100.0
95.658.1
0.410.73.8
20.15.4
37.512.6
1.021.34.4
100.0
95.150.6
6.18.9
12.72.1
14.0
44.55.80.9
37.64.9
a. Stock at the end of the year.
United Kingdom (10.7%). Direct investment from Sweden and Japan increasedconsiderably, at a rate above average in the eighties. Both countries were morerepresented in Schleswig-Holstein than in the Federal Republic of Germany as awhole. This is especially true in the case of Sweden (20.1% in Schleswig-Holstein against 2.1% in the Federal Republic). Schleswig-Holstein seems to be
110
a preferred location for Swedish firms wishing to be present on the Germanmarket.40
Effects of the Completion of the European SingleMarket on the Economy of Schleswig-Holstein
METHODICAL CONSIDERATIONS
Usually the question of the effect of the ESM-program answered by what iscalled the "top-down-sectoral-approach". To begin with one looks at the regionalconcentration of those industries that may be substantially affected by measuresof the ESM-programme.41 If these industries are of some importance for thelocal industry mix the region as a whole is said to be affected by the completionof the ESM. Furthermore, dynamic effects are to be captured by providinginformation on the competitiveness as measured by the economic performanceof a region in the past.42 Concerning the sectoral effect on Schleswig-Holstein'smanufacturing sector we shall follow a similar process in the following two partsof this chapter.43 The more sophisticated classification of ESM related effectsprovided by Buigues and Ilzkowitz (1988) and Buigues, Ilzkowitz and Lebrun(1990) is used. In the second part of this chapter we present the views andjudgements of Schleswig-Holstein's enterprises themselves as expressed in aquestionnaire performed by the Schleswig-Holstein Chambers of Industry andCommerce in January 1992.
4 0 Whether Schleswig-Holstein is also a preferred location within the EC is still open. An answer needs infor-mations concerning the Swedish pattern of direct investments in the EC countries.41 These are (i) the abolition of border controls, (ii) the dismissal of non-tariff-barriers (like technical or healthprovision norms) as far as they discriminate against suppliers from other EC member countries, by establishingthe country-of-origin-principle, (iii) deregulating major service markets like transportation or insurancemarkets by permitting entry of firms from other EC member countries to domestic markets, (iv) liberalisationof public procurement to bidders from all EC member countries and - probably - (v) harmonisation of indirecttaxes.4 2 Cf. Dohrn (1989), empirica (1989), Richert and Thiel (1989), Nerb, Reuter and Weichselberger (1990),Sinz and Steinle (1989), Buigues and Ilzkowitz (1988), Buigues, Ilzkowitz and Lebrun (1990). The latter threeprovide more sophisticated analyses concerning regional competitiveness resp. regional affectedness.4 3 Also the service sector will be largely affected because of major deregulating steps. These will come inhere with respect to overall effects of the ESM.
I l l
"SECTORAL AFFECTEDNESS" OF SCHLESWIG-HOLSTEIN'SMANUFACTURING SECTOR
According to Buigues and Ilzkowitz (1988) and Buigues, Ilzkowitz and Lebrun(1990), there are five categories of affected industries with different featuresrespect to the effect of the completion of the ESM, and one residual group ofless affected industries:
More Price Competition group. The largest group is formed by industries,whose markets are moderately protected by non-tariff barriers, which are inten-sively involved on the EC level and with markets outside, too. These enterprisesexhibit strong economies of scale. In this group sales systems will adjust tolarger market areas and price competition will increase (PC-group).44
De-Monopolization group. In the second group high non-tariff-barrierscoincide with high price differentials at the EC level and a low level of marketinvolvement inside and outside the EC. There are high economies of scale and ahigh dependency on sales to public procurement agencies. In this groupstructural change will be intensive. National monopolies will cease to exist, andconcentration processes may be necessary to take advantage of scale economies(DM-group).
More Structural Change group. In the third group, there are high non-tariffbarriers, a low level of market involvement in the EC, high scale economies, anda high dependency on sales to public procurement agencies, too. There are,however, only marginal price differentials between EC markets. Furthermore,market intervolvement with markets outside the EC is somewhat higher. In thisgroup structural change is expected to intensify (SC-group).
Good Growth Prospects group. In the fourth group, there are high non-tariffbarriers as well, combined with a high level of market involvement inside theEC and with markets outside, low price differentials and a high dependency onsales to public procurement agencies. Scale economies tend to be of some, butnot overall, importance. Insofar scale economies are important, certain concent-ration processes may occur. For the industries of this group growth prospectslook quite favourable (GP-group).
National Pecularities group. In the last group of affected industries, there areno common features. All industries belong to this group, which might beaffected because of national peculiarities (NP-group).
4 4 For the branches belonging to the various groups see appendix 3.
112
Not Affected group. The residual group is formed by those industries that areexpected not to be substantially affected by the completion of the ESM (NA-group).
If one looks at Schleswig-Holstein's manufacturing sector, at least in 1987, theshare of the NA-group was 5% larger than in the whole Federal Republic (table61). So Schleswig-Holstein's manufacturing sector would not be as affected asthat of the Federal Republic. A closer look at the data, however, reveals that thisresult is due to the markedly lower share of the PC-group which over-compensates the higher shares of all other groups. Within the PC-group we findonly 5 of probably 20 affected branches with higher employment shares inSchleswig-Holstein:
- chemical fibres (2004),- non-structural non-refractory ceramic ware (224),- machinery and equipment (242),- electrical household appliances (2505),- pencils, stamps, modelling and curving ware (2571-5).
Machinery and equipment cannot compensate the lower share in the other 15industries including motor vehicles (244), road transport equipment (244), andaircraft and spacecraft (248), which together account for 9.8% on the federallevel, but only for 1.5% in Schleswig-Holstein. The markedly lower share ofindustries which might be subject to a more intensive price competition underESM circumstances thus may indicate lower adjustment costs for Schleswig-Holstein's manufacturing sector, at least in the first phase of adjustment needs.
The markedly lower shares of the bulk of the PC-industries, on the other hand,hides the higher effect to all other groups in Schleswig-Holstein. In the secondgroup (DM-group) which will face a de-monopolization and mutual involvementof market segments the higher affectedness is due mainly to the prominent rolewhich pharmaceuticals (20031) play in Schleswig-Holstein's industry mix. Theeffect would be even higher if railway equipment (247) was not lacking inSchleswig-Holstein. Especially the pharmaceutical industry may have to copewith additional competitive pressures, if the ESM measures will be installed intime.
As can be concluded from the third and fourth column in table 61, in the SC-group it is mainly shipbuilding which accounts for the higher impact inSchleswig-Holstein. Schleswig-Holstein's manufacturing sector faces adjustmentneeds from this sector that once could be interpreted as the central industry thatnow, however, is one of its main problem industries. Among the industries for
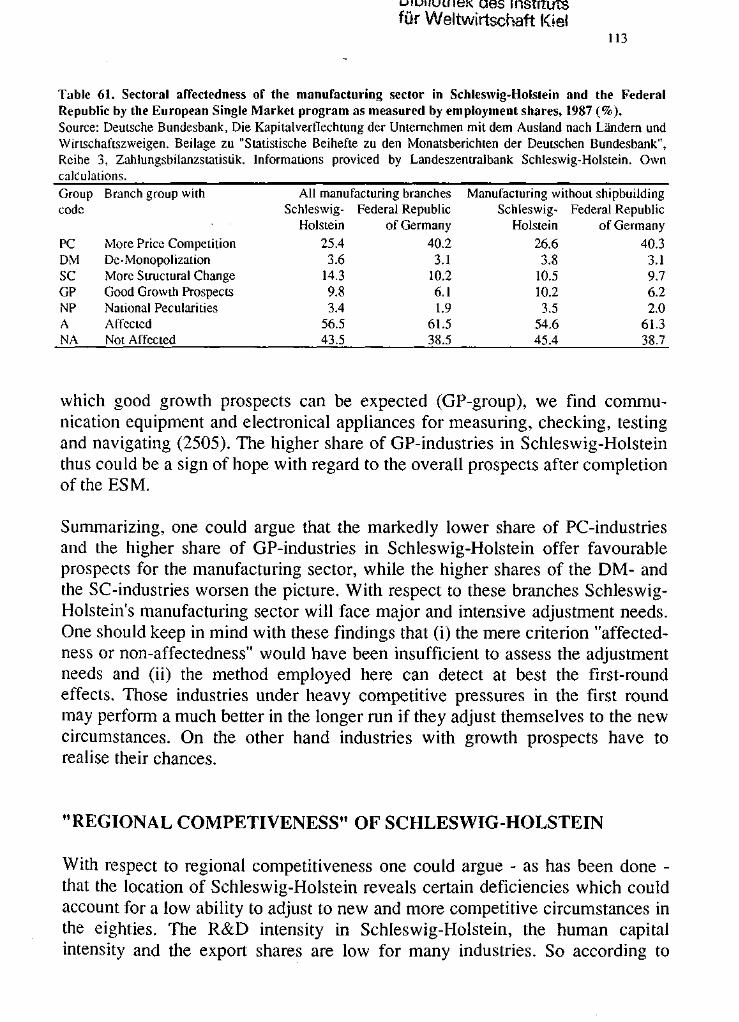
aes mstftutsfiir Weltwirtschaft Kfei
113
Table 61. Sectoral affectedness of the manufacturing sector in Schleswig-Holstein and the FederalRepublic by the European Single Market program as measured by employment shares, 1987 (%).Source: Deutsche Bundesbank, Die Kapitalverflechtung der Unternehmen mit dem Ausland nach Landern undWirtschaftszweigen. Beilage zu "Statistische Beihefte zu den Monatsberichten der Deutschen Bundesbank",Reihe 3, Zahlungsbilanzstatistik. Informations proviced by Landeszentralbank Schleswig-Holstein. Owncalculations.Groupcode
PCDMSCGPNPANA
Branch group with
More Price CompetitionDe-MonopolizationMore Structural ChangeGood Growth ProspectsNational PecularitiesAffectedNot Affected
All manufacturing branchesSchleswig- Federal Republic
Hoi stein25.4
3.614.39.83.4
56.543.5
of Germany40.2
3.110.26.11.9
61.538.5
Manufacturing without shipbuildingSchleswig- Federal Republic
Holstein26.6
3.810.510.23.5
54.645.4
of Germany40.3
3.19.76.22.0
61.338.7
which good growth prospects can be expected (GP-group), we find commu-nication equipment and electronical appliances for measuring, checking, testingand navigating (2505). The higher share of GP-industries in Schleswig-Holsteinthus could be a sign of hope with regard to the overall prospects after completionoftheESM.
Summarizing, one could argue that the markedly lower share of PC-industriesand the higher share of GP-industries in Schleswig-Holstein offer favourableprospects for the manufacturing sector, while the higher shares of the DM- andthe SC-industries worsen the picture. With respect to these branches Schleswig-Holstein's manufacturing sector will face major and intensive adjustment needs.One should keep in mind with these findings that (i) the mere criterion "affected-ness or non-affectedness" would have been insufficient to assess the adjustmentneeds and (ii) the method employed here can detect at best the first-roundeffects. Those industries under heavy competitive pressures in the first roundmay perform a much better in the longer run if they adjust themselves to the newcircumstances. On the other hand industries with growth prospects have torealise their chances.
"REGIONAL COMPETIVENESS" OF SCHLESWIG-HOLSTEIN
With respect to regional competitiveness one could argue - as has been done -that the location of Schleswig-Holstein reveals certain deficiencies which couldaccount for a low ability to adjust to new and more competitive circumstances inthe eighties. The R&D intensity in Schleswig-Holstein, the human capitalintensity and the export shares are low for many industries. So according to
114
other studies dealing with the effects of the ESM-program, Schleswig-Holstein'smanufacturing would find itself in a somewhat less favourable situation concer-ning its adjustment ability. On the other hand, our analysis of structural changein Schleswig-Holstein in the seventies and the eighties has shown that the shifttowards modern human capital intensive industries was faster than in the FederalRepublic. This would lead to the conclusion that the ability to adjust to newcircumstances is not bad at all. However, the problem is whether past trends canbe prolonged into the future. This is at least an open question. How muchSchleswig-Holstein can gain from the ESM-program depends on the competitiveattitude of its enterprises and their willingness to avail themselves of the oppor-tunities the Schumpeterian event of the internal market is offering. Furthermorethe deregulation of border crossing transportation, which is a part of the ESM-program, will lead to a deregulation of domestic transport markets. This willlower transport costs substantially which should turn out to be favourable for aperipheral region like Schleswig-Holstein. Last but not least the region wouldgain from the beneficial effects of further lowering the economic barriers of itsnorthern border to Denmark and - as a result of the treaty of the EuropeanEconomic Space - to the other Scandinavian countries.
Potential Effects of the ESM-Program in theJudgement of Enterprises from Schleswig-Holstein
The insights gained from the general analysis of the preceding part of thischapter are supported by the views and judgements of manufacturing enterprisesfrom Schleswig-Holstein. This can be seen from the results of a questionnaireperformed by the Schleswig-Holstein Chambers of Industry and Commerce(SHCIC) in January 1992, which are presented on the following pages.
Three questions on the effects of the ESM-program were posed in addition to thenormal business cycle questionnaire of the SHCIC:
1. Which consequences of the ESM-program do you expect for your owncompetitiveness on EC markets?
a. on average positive consequences,b. no or neglectable consequences,c. negative consequences.
115
2. Have you taken special actions in response to the ESM-program?
a. provisions already completed,b. provisions planned or prepared,c. no provisions considered.
3. Which provisions as reaction to the ESM-program have or had priority foryour management strategy?
a. further rationalization,b. innovations,c. improved marketing,d. relocation of economic activity to countries with lower factor costs,e. other provisions.
As membership with Chambers of Industry and Commerce is mandatory thedata base should be representative.45
Taken together, all manufacturing and mining firms46 share the opinion that theywill be affected of the ESM-program to a lesser extent than those in otherregions. More than three of four enterprises do not expect any change of theircompetitiveness on EC markets (table 62). Among those who feel affected bythe ESM-program the optimists with 13% slightly outweigh the pessimists with11%. Perceived affectedness, as well as positive and negative expectations arenot evenly distributed among branches and branch groups. The most affectedand the most optimistic group is that of investment goods industries (I). For theremaining three groups the level of perceived affectedness lies around 80%.Food products industries (N), however, are optimistic while basic materialsindustries (G) and consumer goods (V) industries seem pessimistic. Consistentwith this picture is the fact that the majority of Schleswig-Holstein's manu-facturing enterprises do not see a need for any special measures or provisions inreaction to the ESM-program to meet the competitive challenges. Again theshare of no reactions is lowest for investment goods and food product industries.The latter, however, only plan provisions and have not completed any so far.
Some branches are missing. The employment shares- from 1987 add up to some 89%. See appendix 4,where the complete database is presented.
In the database only this category is reported, not manufacturing without mining, which in Schleswig-Holstcin is mainly represented by the extraction of crude oil. The database furthermore comprises answers ofenterprises from the construction, service, trade and transportation sector, which are omitted here.
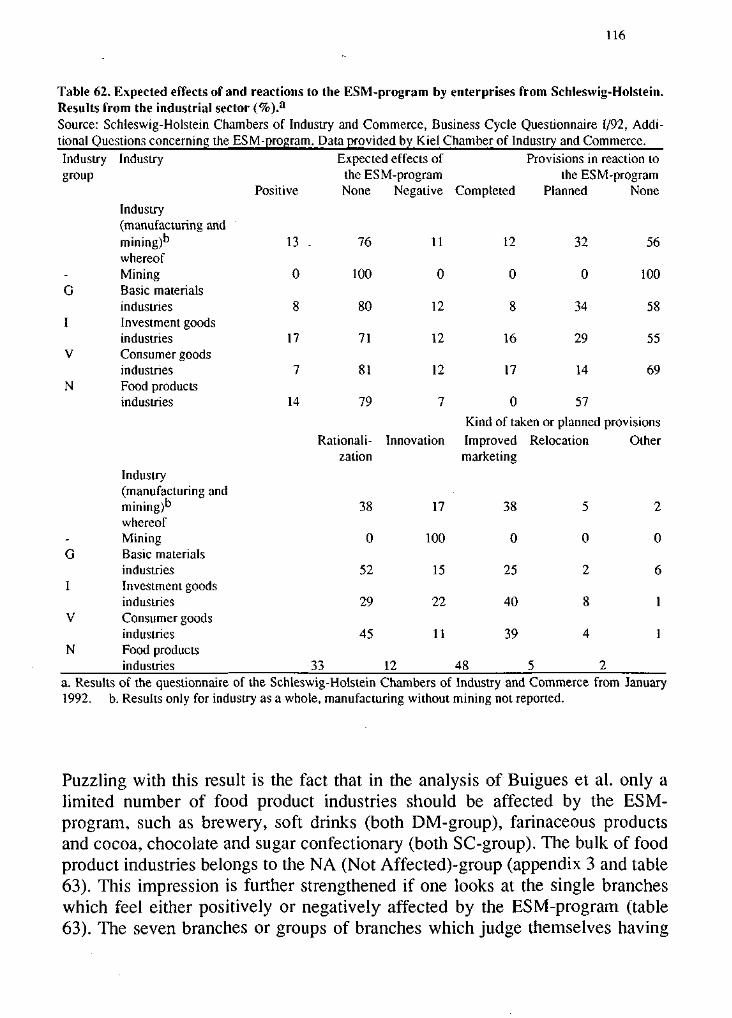
116
Table 62. Expected effects of and reactions to the ESM-program by enterprises from Schleswig-Holstein.Results from the industrial sector (%).a
Source: Schleswig-Holstein Chambers of Industry and Commerce, Business Cycle Questionnaire 1/92, Addi-tional Questions concerning the ESM-program. Data provided by Kiel Chamber of Industry and Commerce.
Expected effects of Provisions in reaction tothe ESM-program the ESM-program
Positive None Negative Completed Planned None
Industrygroup
-G
I
V
N
Industry
Industry(manufacturing andmining)^whereofMiningBasic materialsindustriesInvestment goodsindustriesConsumer goodsindustriesFood productsindustries
-G
I
V
N
Industry(manufacturing andmining)"whereofMiningBasic materialsindustriesInvestment goodsindustriesConsumer goodsindustriesFood productsindustries
13 -
0
8
17
7
14
76
100
80
71
81
79
11
0
12
12
12
7
12
0
8
16
17
0
32
0
34
29
14
57
56
100
58
55
69
Kind of taken or planned provisionsRationali- Innovation Improved Relocation Other
zation marketing
38
0
52
29
45
17
100
15
22
11
38
0
25
40
39
5
0
2
8
4
2
0
6
1
1
33 12 48a. Results of the questionnaire of the Schleswig-Holstein Chambers of Industry and Commerce from January1992. b. Results only for industry as a whole, manufacturing without mining not reported.
Puzzling with this result is the fact that in the analysis of Buigues et al. only alimited number of food product industries should be affected by the ESM-program, such as brewery, soft drinks (both DM-group), farinaceous productsand cocoa, chocolate and sugar confectionary (both SC-group). The bulk of foodproduct industries belongs to the NA (Not Affected)-group (appendix 3 and table63). This impression is further strengthened if one looks at the single brancheswhich feel either positively or negatively affected by the ESM-program (table63). The seven branches or groups of branches which judge themselves having
117
promising competitive chances on EC markets include not only two separablefood industries groups (beverages and the aggregate of animal feeds and of oilsand fats) but also the rest of the food products sector. Moreover the same is truefor thin plate and metal products, which includes the most optimistic sub-industry, heating and air conditioning. On the pessimistic side, there are someindustries which are said not to be affected but which feel uncomfortable whenthinking of 1993. These include plastic products and generation, manufacturingand the casting of metals. These results seem to back our hypothesis, posed inthe first part of this chapter, that beyond all theoretical reasoning on affectednessand competitiveness it depends on the single enterprises whether they reactdynamically to the competitive challenges of the ESM-programme.47
Concerning positive and negative expectations we find interesting the fact thatthe manufacture of machinery and equipment, which we already learned to beone of Schleswig-Holstein's leading branches, is among the most optimisticbranches. On the other hand, electrical and electronical machinery includingmedical and precision instruments tend to be more pessimistic. Whether thespecific manufacturers of medical and precision instruments share thus view,cannot be inferred from the data-base because of its high aggregation level.
If one looks at the responses to the second question, whether enterprises havetaken or plan provisions to maintain their competitive position, one gets theimpression that optimists and pessimists equally plan to react (table 64). Thevarious food industries are among these. They plan to react, but have notcompleted any provisions so long. Besides textiles, thin plate and metal pro-ducts, casting, electric industries and machinery seem to be the best preparedbest already. Three extreme cases may be mentioned: (i) heating and airconditioning equipment, whose manufactures apparently expect to harvest wind-fall profits from the Single Market so that they do not intend to do anything, (ii)highly subsidized shipbuilders who, despite pessimistic outlooks do not feelforced to react in any way either, and (iii) the few fur dressers and dyers who areabsolutely pessimistic and do not think it worthwhile to take any actions againstthe unpromising prospects.
4 ' Also the other way round can be found: branches which should be affected according to Buigues et al., butwhose members do not feel any change of their competitive situation to come with the ESM-program, e.g.rubber products, road transport equipment, air- and spacecraft and wearing apparel. While the generalexplanation should come true here, too, there may be the additional reason that all of them play only a minorrole in Schleswig-Holstein and are to a greater extent only pre-product manufacturers. They either may defendtheir market shares independently who is the end-product manufacturer or they might already have seriousproblems in engaging in the interregional division of labour because of the traffic congestions preventing just-in-time logistics concepts.
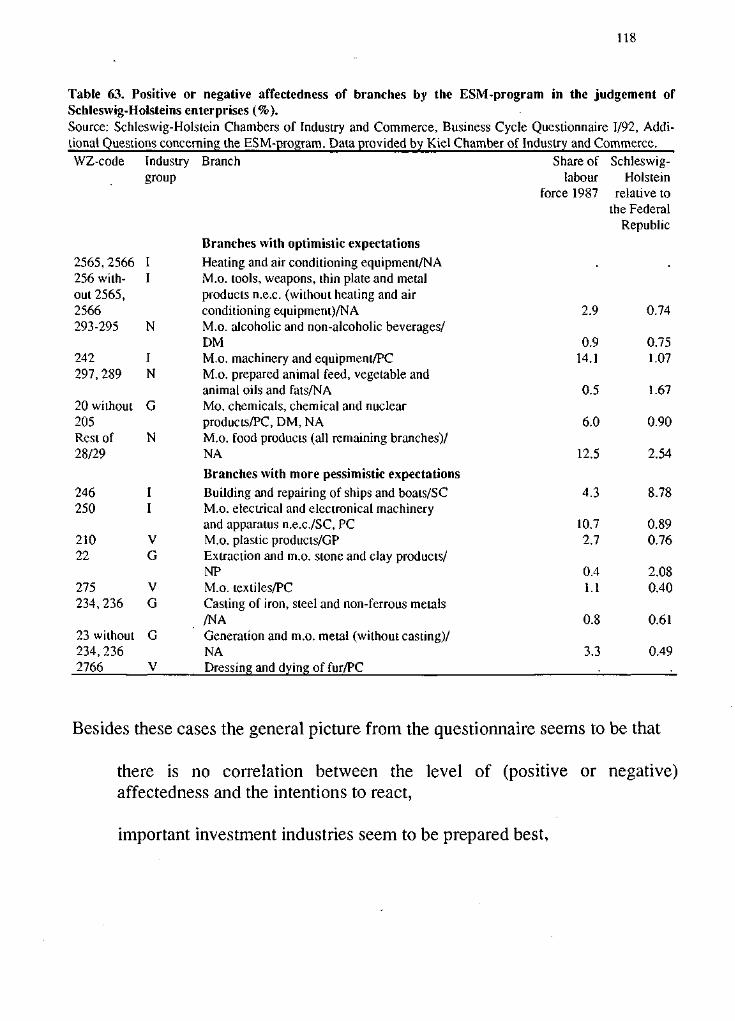
118
Table 63. Positive or negative affectedness of branches by the ESM-program in the judgement ofSchleswig-Holsteins enterprises (%).Source: Schleswig-Holstein Chambers of Industry and Commerce, Business Cycle Questionnaire 1/92, Addi-tional Questions concerning the ESM-program. Data provided by Kiel Chamber of Industry and Commerce.WZ-code Industry
groupBranch
2565,2566256 with-out 2565,2566293-295
242297,289
20 without205Rest of28/29
246250
21022
275234,236
23 without234, 2362766
II
N
IN
G
N
II
VG
VG
G
V
Branches with optimistic expectationsHeating and air conditioning equipment/NAM.o. tools, weapons, thin plate and metalproducts n.e.c. (without heating and airconditioning equipment)/NAM.o. alcoholic and non-alcoholic beverages/DMM.o. machinery and equipment/PCM.o. prepared animal feed, vegetable andanimal oils and fats/NAMo. chemicals, chemical and nuclearproducts/PC, DM, NAM.o. food products (all remaining branches)/NA
Branches with more pessimistic expectationsBuilding and repairing of ships and boats/SCM.o. electrical and electronical machineryand apparatus n.e.c./SC, PCM.o. plastic products/GPExtraction and m.o. stone and clay products/NPM.o. textiles/PCCasting of iron, steel and non-ferrous metals/NAGeneration and m.o. metal (without casting)/NADressing and dying of fur/PC
Share of Schleswig-labour Holstein
force 1987 relative tothe Federal
Republic
2.9
4.3
0.74
0.914.1
0.5
6.0
12.5
0.751.07
1.67
0.90
2.54
8.78
10.72.7
0.41.1
0.8
3.3
0.890.76
2.080.40
0.61
0.49
Besides these cases the general picture from the questionnaire seems to be that
there is no correlation between the level of (positive or negative)affectedness and the intentions to react,
important investment industries seem to be prepared best,
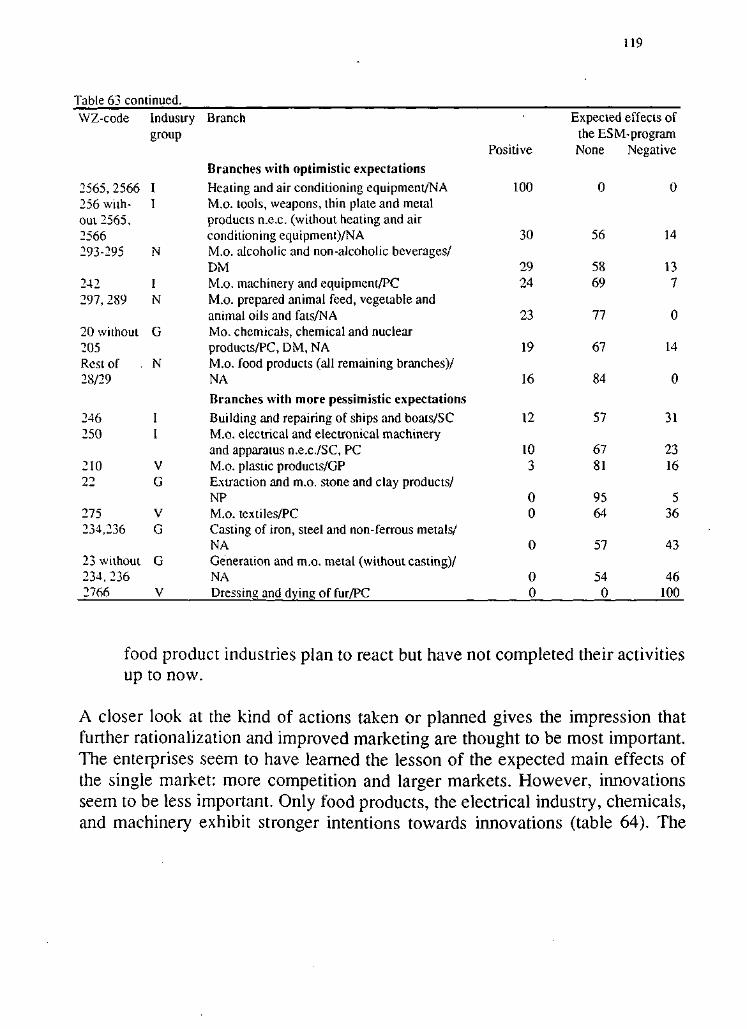
119
Table 63 continued.WZ-code
2565, 2566256 with-out 2565,2566293-295
242297, 289
20 without205Rest of28/29
246250
21022
275234,236
23 without234,2362766
Industrygroup
II
N
IN
G
N
II
VG
VG
G
V
Branch
Branches with optimistic expectationsHeating and air conditioning equipment/NAM.o. tools, weapons, thin plate and metalproducts n.e.c. (without heating and airconditioning equipment)/NAM.o. alcoholic and non-alcoholic beverages/DMM.o. machinery and equipment/PCM.o. prepared animal feed, vegetable andanimal oils and fats/NAMo. chemicals, chemical and nuclearproducts/PC, DM, NAM.o. food products (all remaining branches)/NA
Branches with more pessimistic expectationsBuilding and repairing of ships and boats/SCM.o. electrical and electronical machineryand apparatus n.e.c./SC, PCM.o. plastic products/GPExtraction and m.o. stone and clay products/NPM.o. textiles/PCCasting of iron, steel and non-ferrous metals/NAGeneration and m.o. metal (without casting)/NADressing and dying of fur/PC
Positive
100
30
2924
23
19
16
12
103
00
0
00
Expected effects ofthe ESM-programNone
0
56
5869
77
67
84
57
6781
9564
57
540
Negative
0
14
137
0
14
0
31
2316
536
43
46100
food product industries plan to react but have not completed their activitiesup to now.
A closer look at the kind of actions taken or planned gives the impression thatfurther rationalization and improved marketing are thought to be most important.The enterprises seem to have learned the lesson of the expected main effects ofthe single market: more competition and larger markets. However, innovationsseem to be less important. Only food products, the electrical industry, chemicals,and machinery exhibit stronger intentions towards innovations (table 64). The
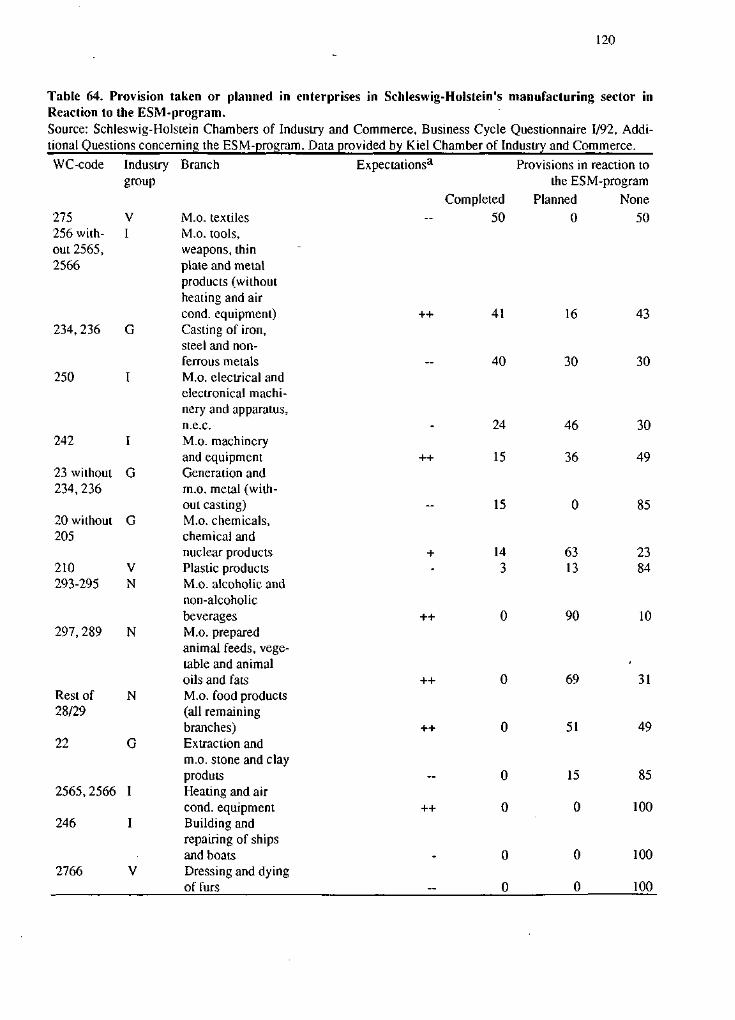
120
Table 64. Provision taken or planned in enterprises in Schleswig-Holstein's manufacturing sector inReaction to the ESM-program.Source: Schleswig-Holstein Chambers of Industry and Commerce, Business Cycle Questionnaire 1/92, Addi-tional Questions concerning the ESM-program. Data provided by Kiel Chamber of Industry and Commerce.
WC-code
275256 with-out 2565,2566
234,236
250
242
23 without234, 236
20 without205
210293-295
297, 289
Rest of28/29
22
2565,2566
246
2766
Industrygroup
VI
G
I
I
G
G
VN
N
N
G
I
I
V
Branch
M.o. textilesM.o. tools,weapons, thinplate and metalproducts (withoutheating and aircond. equipment)Casting of iron,steel and non-ferrous metalsM.o. electrical andelectronical machi-nery and apparatus,n.e.c.M.o. machineryand equipmentGeneration andm.o. metal (with-out casting)M.o. chemicals,chemical andnuclear productsPlastic productsM.o. alcoholic andnon-alcoholicbeveragesM.o. preparedanimal feeds, vege-table and animaloils and fatsM.o. food products(all remainingbranches)Extraction andm.o. stone and clayprodutsHeating and aircond. equipmentBuilding andrepairing of shipsand boatsDressing and dyingof furs
Expectations3
Completed50
++ 41
40
24
++ 15
15
+ 143
++ 0
++ 0
++ 0
0
++ 0
0
0
Provisions in reaction tothe ESM-program
Planned0
16
30
46
36
0
6313
90
69
51
15
0
0
0
None50
43
30
30
49
85
2384
10
-31
49
85
100
100
100
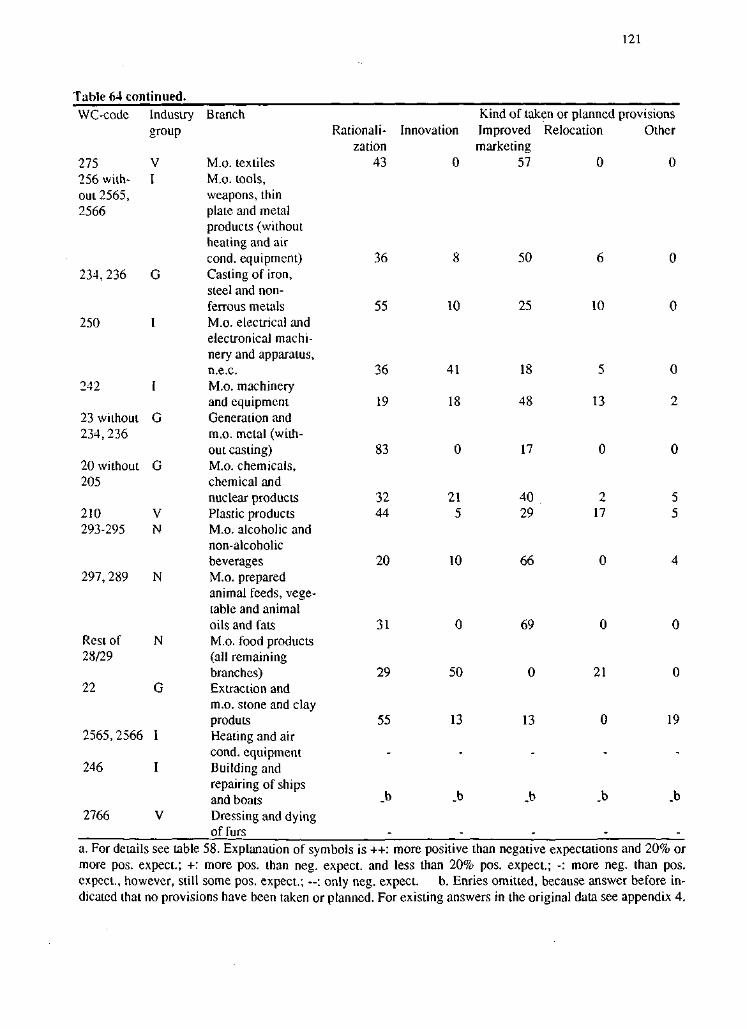
121
Table 64 continued.VVC-code
275256 with-out 2565,2566
234, 236
250
242
23 without234,236
20 without205
210293-295
297, 289
Rest of28/29
22
2565, 2566
246
2766
Industrygroup
VI
G
I
I
G
G
VN
N
N
G
I
I
V
Branch
M.o. textilesM.o. tools,weapons, thinplate and metalproducts (withoutheating and aircond. equipment)Casting of iron,steel and non-ferrous metalsM.o. electrical andelectronical machi-nery and apparatus,n.e.c.M.o. machineryand equipmentGeneration andm.o. metal (with-out casting)M.o. chemicals,chemical andnuclear productsPlastic productsM.o. alcoholic andnon-alcoholicbeveragesM.o. preparedanimal feeds, vege-table and animaloils and fatsM.o. food products(all remainingbranches)Extraction andm.o. stone and clayprodutsHeating and aircond. equipmentBuilding andrepairing of shipsand boatsDressing and dyingof furs
Rationali-zation
43
36
55
36
19
83
3244
20
31
29
55
-
_b
-
Innovation
0
8
10
41
18
0
215
10
0
50
13
-
_b
-
Kind of taken or plannedImproved Relocationmarketing
57
50
25
18
48
17
4029
66
69
0
13
-
_b
-
0
6
10
5
13
0
217
0
0
21
0
-
_b
-
provisionsOther
0
0
0
0
2
0
55
4
0
0
19
-
_b
-a. For details see table 58. Explanation of symbols is ++: more positive than negative expectations and 20% ormore pos. expect.; +: more pos. than neg. expect, and less than 20% pos. expect.; -: more neg. than pos.expect., however, still some pos. expect.; —: only neg. expect. b. Enries omitted, because answer before in-dicated that no provisions have been taken or planned. For existing answers in the original data see appendix 4.
122
manufacture of machinery belongs to the R&D intensive industries inSchleswig-Holstein (table 53).48
It is also interesting that quite a number of enterprises in several industries planto relocate their production to regions or countries where factor costs - especiallylabour costs - are lower. It should be noted that the most prominent among themare food products - forming an important part of Schleswig-Holstein's manu-facturing sector -, plastic products and the important manufacture of machinery.Given the high employment share of food products and machinery as well as thelatter's role as technological leader, this tendency should give rise to seriousconsideration about improving Schleswig-Holstein's locational factors of whichlabour costs are an important issue.
Summing up one may infer from the results of the questionnaire that
Schleswig-Holstein's enterprises taken together feel affected by the ESM-program to a lesser extent,
positive, negative, or non-affectedness are not always distributed along thelines one would forecast from theory, but that
most branches tend to behave as expected,
the level of preparedness among those who feel affected in general seemshigh, especially among the most positively or negatively affectedbranches,
cost cuts and improved marketing play the most important role amongbusiness strategies, while innovations seem limited to a few exceptions, towhich the manufacture of machinery - one of the "diamonds" - belongs.
48 A very high degree of planned innovations of 32% we find also with the R&D intensive manufacturing ofmedical, optical and precision instruments (see appendix 4), but the enterprises of this branch do not expectany change of competitiveness with respect of the ESM-program.
123
Part 4
. y k3JL>3
124
Economic Performance and Structural Change
The investigated regions reveal several similiarities, but there can be found alsoimportant differences between them. The most apparent common characteristicof Schleswig-Holstein and Southern Sweden appears to be that neither belongsto the economic center of its home country. They are border regions to othercountries and even to different economic areas (the EC respectively the EFTA).As in most other regions which do not belong to the economic core, income percapita is below the national average (table 65). A further common feature is thatboth regions have lagged behind the national development in terms of economicgrowth in the eighties.49
The density of population in Schleswig-Holstein is distinctly below the nationalaverage. In Southern Sweden the opposite is true. However, the density ofpopulation in Schleswig-Holstein with 164 inhabitants per square kilometre ismore than three times as high as in Southern Sweden. This reflects Swedenbeing a country with a low density of population in general. Compared with theeconomic centres in Gothenburg and Stockholm, Southern Sweden has a lowerdensity of population. Thus the difference between Southern Sweden andSchleswig-Holstein in this respect is caused by national differences.
The regions, however, differ clearly with respect to the relative importance ofmanufacturing industry. Whereas in Southern Sweden the manufacturing sectoremploys 122 persons per 1,000 inhabitants and thus more than the Swedishaverage (112 persons), in Schleswig-Holstein the respective indicator onlyamounts to 66 persons (average in the Federal Republic is 112). Compared toSchleswig-Holstein, Southern Sweden could be characterised as an industria-lized region. However, the industry is widely dispersed and only concentrated insome urban areas such as Malmo and Helsingborg. The difference in theimportance of the manufacturing industry between the regions is surprising.Schleswig-Holstein's lagging behind the national economic growth rate could bepartly explained by the relative small manufacturing sector. In the eighties theFederal Republic and Sweden experienced a strong export driven upswing whichled to what is often called "re-industrialization". Regions with a relatively largemanufacturing sector were normally in a favourable position. If SouthernSweden is lagging behind the national development in terms of economic growth
4 9 In the case of Schleswig-Holstein the available data clearly show a lagging behind the nationaldevelopment since the late seventies. Comparable figures for Southern Sweden do not exist, but the conclusionof a lagging behind could be based on a row of empirical evidence.
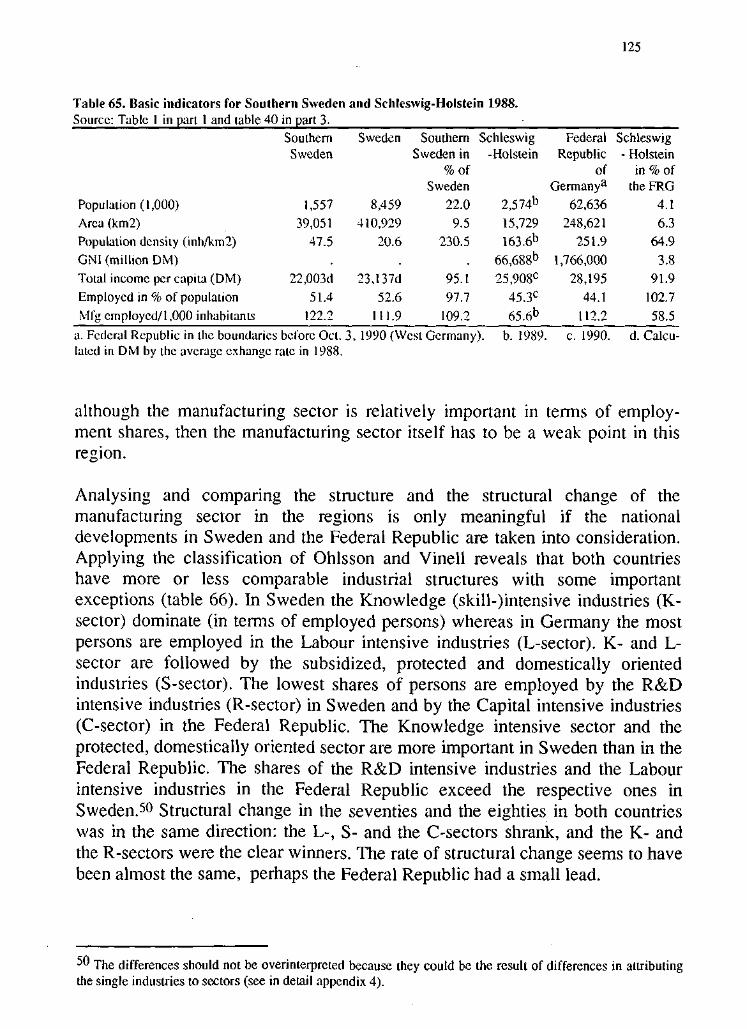
125
Table 65. Basic indicators for Southern Sweden and Schleswig-Holstein 1988.Source: Table 1 in part 1 and table 40 in part 3.
Population (1,000)Area (km2)Population density (inh/km2)GNI (million DM)Total income per capita (DM)
Employed in % of populationtVlfg employed/1,000 inhabitants
SouthernSweden
1,557
39,05147.5
22,003d51.4
122.2
Sweden
8,459410,929
20.6
23,137d52.6
111.9
SouthernSweden in
%ofSweden
22.09.5
230.5
95.197.7
109.2
Schleswig-Holstein
2,574b
15,729163.6b
66,688b
25,908c
45.3C
65.6b
FederalRepublic
ofGermanya
62,636248,621
251.91,766,000
28,19544.1
112.2
Schleswig- Holstein
in % oftheFRG
4.16.3
64.93.8
91.9
102.758.5
a. Federal Republic in the boundaries before Oct. 3, 1990 (West Germany),lated in DM by the average exhangc rate in 1988.
b. 1989. c. 1990. d. Calcu-
although the manufacturing sector is relatively important in terms of employ-ment shares, then the manufacturing sector itself has to be a weak point in this
region.
Analysing and comparing the structure and the structural change of themanufacturing sector in the regions is only meaningful if the nationaldevelopments in Sweden and the Federal Republic are taken into consideration.Applying the classification of Ohlsson and Vinell reveals that both countrieshave more or less comparable industrial structures with some importantexceptions (table 66). In Sweden the Knowledge (skill-)intensive industries (K-sector) dominate (in terms of employed persons) whereas in Germany the mostpersons are employed in the Labour intensive industries (L-sector). K- and L-sector are followed by the subsidized, protected and domestically orientedindustries (S-sector). The lowest shares of persons are employed by the R&Dintensive industries (R-sector) in Sweden and by the Capital intensive industries(C-sector) in the Federal Republic. The Knowledge intensive sector and theprotected, domestically oriented sector are more important in Sweden than in theFederal Republic. The shares of the R&D intensive industries and the Labourintensive industries in the Federal Republic exceed the respective ones inSweden.50 Structural change in the seventies and the eighties in both countrieswas in the same direction: the L-, S- and the C-sectors shrank, and the K- andthe R-sectors were the clear winners. The rate of structural change seems to havebeen almost the same, perhaps the Federal Republic had a small lead.
5 0 The differences should not be overinterpreted because they could be the result of differences in attributingthe single industries to sectors (see in detail appendix 4).
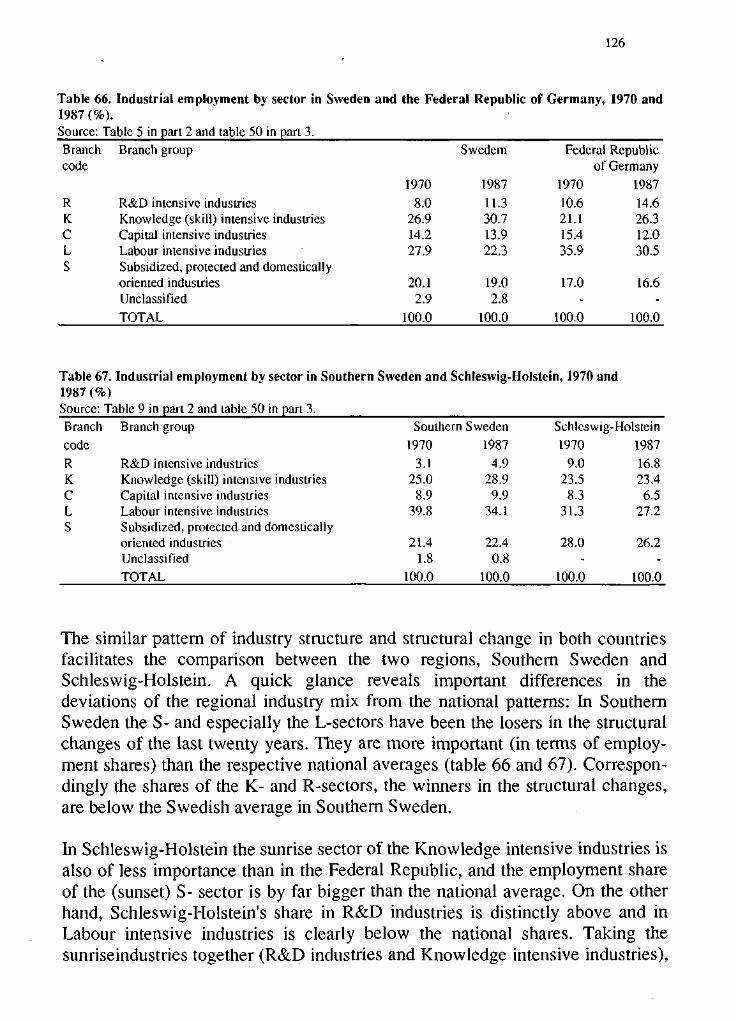
126
Table 66. Industrial employment by sector in Sweden and the Federal Republic of Germany, 1970 and1987 (%).Source: Table 5 in part 2 and table 50 in part 3.Branchcode
RKCLS
Branch group
R&D intensive industriesKnowledge (skill) intensive industriesCapital intensive industriesLabour intensive industriesSubsidized, protected and domesticallyoriented industriesUnclassifiedTOTAL
19708.0
26.914.227.9
20.12.9
100.0
Swedem
1987
11.330.713.922.3
19.02.8
100.0
Federal Republicof Germany
197010.621.115.435.9
17.0-
100.0
198714.626.312.030.5
16.6-
100.0
Table 67. Industrial employment by sector in Southern Sweden and Schleswig-Holstein, 1970 and1987 (%)Source: Table 9 in part 2 and table 50 in part 3.Branch
codeRKCLS
Branch group
R&D intensive industriesKnowledge (skill) intensive industriesCapital intensive industriesLabour intensive industriesSubsidized, protected and domesticallyoriented industriesUnclassifiedTOTAL
Southern
19703.1
25.08.9
39.8
21.41.8
100.0
Sweden1987
4.928.9
9.934.1
22.40.8
100.0
Schleswig-Holstein1970
9.023.5
8.331.3
28.0-
100.0
198716.823.46.5
27.2
26.2-
100.0
The similar pattern of industry structure and structural change in both countriesfacilitates the comparison between the two regions, Southern Sweden andSchleswig-Holstein. A quick glance reveals important differences in thedeviations of the regional industry mix from the national patterns: In SouthernSweden the S- and especially the L-sectors have been the losers in the structuralchanges of the last twenty years. They are more important (in terms of employ-ment shares) than the respective national averages (table 66 and 67). Correspon-dingly the shares of the K- and R-sectors, the winners in the structural changes,are below the Swedish average in Southern Sweden.
In Schleswig-Holstein the sunrise sector of the Knowledge intensive industries isalso of less importance than in the Federal Republic, and the employment shareof the (sunset) S- sector is by far bigger than the national average. On the otherhand, Schleswig-Holstein's share in R&D industries is distinctly above and inLabour intensive industries is clearly below the national shares. Taking thesunriseindustries together (R&D industries and Knowledge intensive industries),

127
Schleswig-Holstein's economy is not behind the rest of the country. The oppositeis true for Southern Sweden: The employment share of these two sectorsamounts 33% in Southern Sweden, but 42% in the whole country. Due to thefact that Southern Sweden's economy relies on manufacturing industries to amuch greater extent than this is the case in Schleswig-Holstein, the fact thatSouthern Sweden is behind gains still more importance. This means thatSouthern Sweden will be confronted with the loss of workplaces in traditionalindustries much more than other regions in Sweden. The only way to meet theproblem is to be open for structural change, for new industries, new firms, newproducts and new forms of cooperation. If the region is not able to manage theneed for restructuring, Southern Sweden will face a shrinkage in workplacesand the possibilities to earn money in the region will deteriorate relatively toother regions.
The impression that the manufacturing sector, seen as a whole, seems to be aweak point in Southern Sweden's economy is supported by direction and speedof structural change in the seventies and the eighties. The industry structure hasonly partially changed in the direction which is observable in Sweden andGermany as a whole. Against the national trend the Capital intensive industriesand the protected, domestically oriented industries gained employment shares.The R&D sector and the Knowledge intensive sector indeed got more impor-tance in line with the national development but the gains were comparativelysmall. Just the opposite has been true in the case of Schleswig-Holstein. Theindustry mix has changed in the same direction as in the Federal Republic.51 Theregional change has in some ways been more pronounced than the national one.The fast growth of R&D sector's employment share is especially remarkable.Thus, one may conclude that the structure of the manufacturing sector inSchleswig-Holstein is more favourable than in Southern Sweden.
The conclusion that Schleswig-Holstein's manufacturing industry mix is morefavourable than that of Southern Sweden needs some qualifications. The firstone is that Southern Sweden's economy will no longer be confronted with theshipbuilding problem because the big yards of the region, engaged in buildingcommercial ships, closed down their gates in the eighties (at Landskrona in1980, at Malmo in 1986).52 Nearly 8,000 jobs at the yards were lost. InSchleswig-Holstein many workers at the yards lost their jobs in the eighties(6,OOO).53 But in contrast to Southern Sweden, Schleswig-Holstein still has a
5* Only the share of the knowledge-intensive industries decreased very slightly (by 0.1%, whereas in theFederal Republic the share increased by 4.0%).*2 Still left are a submarine yard at Malm", a naval yard at Karlskrona with some 800 workplaces each and avery small yard at Landskrona.53 More than 7,000 workplaces were already lost in the seventies.
128
considerable shipbuilding industry with nearly 9,000 employees. The yards inSchleswig-Holstein would have been forced to close down their gatescompletely, as was the case in Sweden, if the federal government and thegovernment of Schleswig-Holstein had not paid subsidies to a large extent.Facing severe price competition from Far East and other developing ship-building countries, the yards in Schleswig-Holstein can only survive if subsidi-zation continues. Due to budgetary problems as a result of German unification, afairly restrictive shipbuilding policy in Brussels and increased (highly subsidi-zed) competition by the yards in Mecklenburg-Vorpommern this is highlydoubtful. Thus, the Schleswig-Holstein economy presumably has to face afurther shrinkage of the shipbuilding industry whereas Southern Sweden hasalready dealt with this problem. In this respect the economic prospects seem tobe more favourable in Southern Sweden than in Schleswig-Holstein.
The different strategies to handle the shipbuilding problem in Southern Swedenand Schleswig-Holstein in the past are only partly shown by the figures ofstructural change (table 67). According to the classification of Ohlsson andVinell we attributed the shipbuilding industry to the Knowledge intensiveindustries. Although in Southern Sweden nearly all jobs at the yards were lost,the share of the Knowledge intensive industries increased considerably. InSchleswig-Holstein only the much moderate lost of workplaces at the yards werecompensated by new jobs in other Knowledge intensive industries. This meansthat structural change within the Knowledge intensive industries is much deeperand faster in Southern Sweden than in Schleswig-Holstein.
A second modification to the conclusion that Schleswig-Holstein's manu-facturing industry mix is more favourable than Southern Sweden ones has to beseen in the fact that the industry structure in Schleswig-Holstein is more hetero-geneous. The "modern" R&D industries play a considerable role in Schleswig-Holstein while the "old fashioned" subsidized, protected and home market orien-ted industries are relative important (in terms of employment shares), too. Insome sense one could characterise Schleswig-Holstein's industry structure as adualistic one. In Southern Sweden the industry mix is much more balanced witha considerable share of skill intensive industries, in spite of the fact that ship-building industry disappeared.54
The share of Labour intensive industries which are not of the seemy side ofstructural change is far above the national average. But as the experience inother regions originally dominated by Labour intensive industries shows,
54 From a dynamic point of view one could even argue that the disappearance of the shipbuilding industry haspossibly caused the growth of this sector.
129
structural change from Labour intensive industries to other industries normallyhappened without severe frictions.
PROBLEiM SECTORS AND PROSPEROUS SECTORS
In spite of a different industry mix in Southern Sweden and Schleswig-Holsteinboth regions exhibit a number of similarities with respect to problem sectors aswell as to prosperous sectors.
Problem sectors
As far as problem sectors are concerned, both regions have quite a large share ofagriculture compared to the level of national account statistics: 5.9% of aggre-gate employment in Southern Sweden, but 4.2% in Sweden as a whole, and7.0% in Schleswig-Holstein in relation to only 4.9% in the Federal Republic.
As agriculture is confronted with low income elasticities of demand and pricecompetition from countries with natural comparative and even absolute advan-tages in production, this sector could hardly be expected to be an engine ofgrowth. This is all the more true as a reform of agricultural policy in Sweden aswell in the EC consisting of a reduction of production subsidies seems to beinevitable. Either the Uruguay-round or budgetary constraints in Brussels andStockholm will sooner or later force a cut of subsidies. Furthermore the highlevel of protection cannot be maintained if the West European countries makeserious efforts to assist the economic recovery of the Eastern European coun-tries. A serious step toward integrating these countries into a market orientateddivision of labour would consist of opening up the markets for agriculturalproducts.55
The figures render the impression, that the agricultural problem is not as distinctin Southern Sweden as in Schleswig-Holstein. The difference can be explainedby the greater importance of manufacturing there. Southern Sweden has a largermanufacturing sector than Sweden as a whole (24.2% employment share inSouthern Sweden, but only 21.3% in Sweden), whereas one of Schleswig-
In any case Sweden has presumably to reduce agricultural subsidies if the country becomes a member ofthe EC. Until now the level of agricultural protection in Sweden still exceeds the level of the EC. It is verylikely that the new members have to adjust their system to that of the community.
130
Holstein's problems is its rather small manufacturing sector (28.8 % relative to38.4 % in the Federal Republic56).
So one is inclined to describe Southern Sweden as an industrial region whichfaces some agricultural problems, too, whereas Schleswig-Holstein is moredependent on economic activities which are not market orientated and stronglyinfluenced by state interventions. Schleswig-Holstein's economy relies to a largeextent on public sector activities. The share of public sector value-added is17.0%, one and a half times larger than in the Federal Republic. This rests on theconcentration of military in Schleswig-Holstein. The high dependence ofSchleswig-Holstein's economy on political influences became evident when thedecision was taken to reduce the military man power in Germany by one third asa result of the agreement of German unification. Southern Sweden is notconfronted with a similar problem; public sector activities are at the level ofSweden as a whole.
If one looks at the industries within manufacturing, a similarity is found in theimportance of food product industries in both regions. In Schleswig-Holsteinwith an employment share of 14.7% which is more than one and a half timesthat of the Federal Republic, the predominance of food production is strongerthan in Southern Sweden. There the employment share of 10% is only one ninthabove that of Sweden. However, in the Malmo region we find the employmentshare at 21%, more than twice of the Swedish share.
As a result of the European Economic Space between EC and EFTA, existingtrade barriers in the food business between EC and Sweden will be lowered. Theopportunities for Swedish food industries might become more promising.57 Itshould be noted, however, that an important competitor in this game is Denmarkbeing EC member since 1972. The Danish food industry holds a supremacy indeveloping and marketing food products in the world market. Anotherinteresting actor in the Baltic food game could be Poland with long agriculturaltraditions and a possibly strong, low cost position. The currently negotiatedassociation contracts between EC and Poland, CSFR and Hungary may bejudged as more far reaching in granting trade preferences even in the foodbusiness than any other deal before (Langhammer, 1992). It remains an open
5 " These latter figures are based on compulsory social security statistics.5 7 The lowering of trade barriers in the field of food products is a result of applying the "country-of-origin-principle", which is a constitutive element of the completion of the internal market and which - due to theEES-treaty - will also be valid between EFTA and EC countries. However, many regulations in the food areaare the outcome of EC agricultural policy. A further liberalisation in trade with food products betweenSweden and the EC is only possible if the EC will change the common agricultural policy. Of course, the tradebarriers will no longer exist if Sweden becomes a member of the EC.
131
question how the EC will react if Poland should exhibit strong competitivethreats for EC food producers. In any case chances for cooperation in the foodbusiness around the Baltic would probably be based on further specializationand making use of market niches.
Prosperous Sectors
A similarity between both regions can be seen in the non-existence of industrieswhich are from a national point of view often seen as dynamic and prosperous.This is true, for example, with respect to office, accounting and computingmachi-nery, railway equipment, and aircraft and spacecraft, which do not play amajor role (or none at all) in the respective industry mix of both regions. In thearea of manufacturing motor vehicles subcontractors to the major car producershave plants in Schleswig-Holstein and Sweden. There is a difference, however:while those subcontractors are of minor importance for Schleswig-Holstein(1.2% of employment, one eighth of that in the Federal Republic) they play alarger role in Southern Sweden. The absence of a certain industrys in a regiondoes not mean that the industry structure as a whole is unfavourable. The regionmy have other prosperous industries which indicates that an efficientspecialization has taken place.
Apart from this general restriction Southern Sweden and Schleswig-Holsteinhave some industries which are, no doubt, on the sunside of structural change.Both manufacturing sectors are characterised by what may be called a"diamond-gravel-structure". There exist a few "diamond" industries whichaccount for prosperous development, competitiveness on world markets, advan-ced technology, and a high rate of innovations. In some cases a few enterpriseswithin these "diamond" industries are able to compensate the weak performanceof other industries or even their industry colleagues. They are occupying leadingpositions among world market suppliers. The only problem in Southern Swedenand Schleswig-Holstein is that they are not so numerous as to dominate aggre-gate manufacturing growth.
We find these companies in the areas of medical, optical and precisioninstruments and pharmaceuticals. They exhibit higher R&D shares, a betterperformance and a higher employment share than at the national average.58
5 ° Instruments account for 3.7% employment share in the Malmo region, 1.5% in the rest of Southern Sweden,and 1.3% in Sweden, for 4.0% in Schleswig-Holstein, and 2.4% in the Federal Republic. The respectivefigures for pharmaceuticals are 3.1% in the Malmo" region, 0.8% in the rest of Southern Sweden, and 1.3% inSweden, 2.6% for Schleswig-Holstein, and 1.1% for the Federal Republic.
132
Moreover, there is a "diamond" in Schleswig-Holstein, machinery, whichaccounts for a lot of manufacturing performance in the region. This branch,however, is rather weak in Southern Sweden. Only in the Malmo-Lund area wecan find a certain concentration of machinery enterprises.
Summing up, one could say that in both regions the same problem sectors aswell as the same prosperous industries are of particular importance. The enter-prises of the respective industries in Southern Sweden and Schleswig-Holsteinshould investigate whether the scope for cooperation on world markets exist.
Locational and production factors
Both regions - Southern Sweden as well as Schleswig-Holstein - can be charac-terised as border regions outside their respective national centres, but they areneighbours at the Baltic rim. As far as geographic distance to economic centresplays a role as determinant for economic activities, both regions have a dis-advantage in their competitive position towards buying and selling networks.Schleswig-Holstein is farther from German and Middle European Centres - theso-called Euro-Banana - than, for example, Nordrhein-Westfalen, Hessen,Bayern, or Baden-Wurttemberg. Southern Sweden is (with the exception ofregions in the very north of Sweden) the most distant region relative to theStockholm agglomeration. However, it is situated near the Danish CopenhagenCentre. Furthermore, it can be viewed - as it is the case in Denmark for Sonder-jyllands Amtskommune59 as the most southward Swedish region thus beinglocated nearest to the economic centres of the European Community.
As far as transport infrastructure connections are concerned both regions sharethe problem that Hamburg is a bottleneck in road and rail traffic to the middleand south of the continent. This is more important for Schleswig-Holsteinbecause Southern Sweden has good connections to the national centres inMiddle Sweden.60 For the future, the Oresund-bridge and the Belt-bridge willimprove the traffic connections between Southern Sweden and Schleswig-Holstein. Because of the deficiencies in the southward connections throughHamburg, however, Swedish shippers are pondering redirecting transport linksaway from Schleswig-Holstein and Hamburg, unless Elbe tunnel capacities areaugmented and a new Elbe crossing at some distance from Hamburg will bebuilt.
5 9 See Bode, Holler et al. (1991).6 0 According to Lundquist and Olander (1992, p. 12) the attainability index - the normalised number ofconnections to other regions - for Southern Sweden is equal to the Swedish average.
133
Concerning the R&D environment both regions are by and large lagging behindthe respective national averages. The exception is the Malmo-Lund county,where one can find even more researchers in universities and public researchinstitutions per 1,000 employees than in Stockholm.61 Schleswig-Holstein isbehind in general R&D and especially concerning the endowment with publicand university research capacities in the field of technical and engineeringsciences.62 Though efforts have been pursued by the state's government to add tothese capacities, Schleswig-Holstein has not yet caught up. Not surprisinglyR&D activities in enterprises are below national average.
In Malmo we only find slightly more than half of the number of researchers per1,000 employees as in Stockholm (7 in Malmo, but 12 in Stockholm). The gap iseven wider between the rest of Southern Sweden with 1 and Sweden with 8R&D employees per 1,000 employees (cf. Lundquist and Olander, 1992, p. 12).In Schleswig-Holstein, too, the share of R&D personnel amounts to only half ofthat of the Federal Republic.
Another feature both regions have in common is the discrepancy betweeneducation level measured by successful passed high school examinations and theabsorption of highly qualified people. The latter is a structural deficiency ratherthan a locational factor. Indeed, the number of highly qualified jobs is con-ciderably lower than the respective national average.63
From the position of labour costs there are no distinct differences between bar-gained wages (minimum wages) in Schleswig-Holstein and the FederalRepublic. Only effectively paid wages differ somewhat. For Southern Swedensimilar tendencies are true. Furthermore, both regions share the fact that therespective national tax level concerning business taxation seems high by inter-national comparison. In the Federal Republic this is despite a moderate businesstax reform in 1990.64 In Sweden, however, business taxes have been loweredmarkedly and substituted by higher indirect tax rates.
The figures are 6 public sector researchers per 1,000 employees in Malmo/Lund, 5 in Stockholm, 4 inSweden, but none in Southern Sweden excluding Malmo/Lund. Cf. Lundquist and Olander (1992, p. 12).
1987 there were 3.4 researchers per 1,000 employees in Schleswig-Holstein, but 3.6 in the FederalRepublic. The share of university researchers in technical and engineering sciences in Schleswig-Holstein isonly 6.9% compared to 17.2% on national level. Cf. Hoffmeyer et al. (1990, pp. 133 f.).6 3 For Southern Sweden see Lundquist and Olander (1992, p. 12), for Schleswig-Holstein see Hoffmeyer et al.(1990, pp. 70 ff.). .6 4 Cf. Klodt, Schmidt et al. (1989, pp. 155 ff.).
134
All issues taken together, it looks like both regions have much in common con-cerning locational and production factors. They can be viewed as competitors inthe international locational competition for more or less the same fields ofproduction.
Interaction and Internationalization
Germany is the most important market for Swedish exports. Around 14% weresold in Germany in 1990, that is a little more than was suggested as a total sharein the analysis above, based on a sample of regions. The Swedish export share toGermany increased in the 1980s, while on the other hand, the Swedish importshare from Germany decreased during the same period. Nevertheless, Sweden'sgreatest trade deficit with any single country is still with Germany. More than50% of Swedish exports to Germany are products from the C-sector (pulp,paper, chemical and mineral products). Remaining shares come mainly from theR-and K-sectors, such as electrical machines and equipment, other machines andcars. Machines of different kinds, private cars and trucks showed the highestexport growth rate in the 1980s.65
Swedish investments and production in Germany are impressing in absolutefigures. However, Germany's relative share of Swedish investments is smallerthan its export share. Germany is ranked fourth and seventh respectively amongcountries when Swedish foreign interests are measured in number of employeesor value of fixed assets abroad. The figures suggest that Swedish firms have nosevere problems to enter the German market without having production of theirown or sales capacities in the country.
Germany is an even more important market to Southern Sweden than to Swedenin general. Especially direct investments from Southern Sweden to Germany aresurprisingly high. In this case neither exports nor investments can be explainedby the blend of manufacturing industries in Southern Sweden. It can be shownindustry by industry that the general attraction to the German market is genuine.
Of course, Sweden as an export market is much less important to Germany thanthe other way round. Barely 1% of the German export is addressed to Sweden.
Statistics Sweden: The export/import year 1990.
135
This share has been decreasing for quite some time whereas the shares of theEC, Japan and the expanding countries of Asia have been increasing. AllScandinavian countries, and Sweden most, are now receiving smaller Germanexport shares than ten to twenty years ago.
More than 60% of the German export to Sweden come from the R- and K-sectors (electrical machines and equipment, motor vehicles and other kinds ofmachines).66 Products from the C-sector (chemicals) dominate the remainingpart. Also German direct investments in Sweden are small compared with thetotal German direct investments (about 0.5%). Sweden's share has diminishedduring the last decade.'to
Sweden as an export market is more important to Schleswig-Holstein than to theGerman republic. The Swedish export share from Schleswig-Holstein is twice ashigh as that from the Federal Republic. However, like the total export share fromGermany it has decreased over the years. Export from Schleswig-Holstein haschanged its geographic pattern more or less in the same way as the Germanexport on the whole: an increased share to the EC and Asia and a smaller shareto the Scandinavian countries except for Denmark. Denmark has become one ofSchleswig-Holstein's most important single markets. Schleswig-Holstein hasrelatively more direct investment in Sweden than the republic (within precisionmechanics, optic, machines and trade). However, its investments in Swedenhave been rather sluggish during the last years.
Two conclusions can be drawn. Not surprising is that Sweden's interest in expor-ting to Germany is greater than Germany's interest in exporting to Sweden. Thesame goes for direct investments. These differences are by and large caused bythe different magnitude of the countries and their markets. However, remarkableis that Schleswig-Holstein as well as the Federal Republic have more and moreaddressed their export to the fast growing countries of the world and theirinvestments to the United States and Western Europe (mainly within the socalled banana or boomerang reaching from South England across Belgium,southern parts of the Netherlands, through the Rhein valley and into North Italy).The diminishing share to Sweden and most of the other Scandinavian countriesmight be explained by the fact that all these countries except Denmark areoutside the EC and that their separate national markets are considered to be toosmall and not very profitable. Being outside the EC Scandinavian countriescannot be regarded as one market where marketing and sales promotion can becoordinated. Moreover, there is no doubt that Sweden has increased its export toGermany and other EC members since the middle of the 1980s as a marginal
6 6 Ibid.
136
and peripheral result of the international growth of the EC economies without acorresponding increase on the import side. Sweden has been considered a smalland peripheral market by EC members whose increasing trade within Europehas, to a great extent, an internal affair. Probably Sweden will not get fulladvantage from the dynamic European trade until it becomes a member of EC,or at least the inner market.
The second conclusion that can be drawn is that the distance to Sweden fromvarious parts of Germany has an impact on their commitment to the Swedishmarket, as was found the other way round from various parts of Sweden to therepublic. Schleswig-Holstein is after all more oriented towards Sweden thanGermany as a whole. Whether this distance decay goes on within Sweden fromsouth to north cannot be revealed from data available.
Whether Swedish or South Swedish export and foreign production are relativelymore headed for Northern Germany than for other parts of the republic will bediscussed using data that has not yet been used in this paper (unfortunately dataon the German relations with various parts of Sweden is not available). Whenexports and foreign production from Swedish regions were mapped, all the firmstaking part in the investigation were asked to register all face-to-face contactsand foreign travel during a week.67 The contacts were classified according to thepurpose of the meetings and connected to city regions within the countriesvisited. Among the purposes classified were contacts with customers, suppliers,related industries, affiliated companies, conferences and exhibitions.
There is a rather well known strong correlation between contact patterns andeconomic relations in general.68 Due to national corporate structure, however,the spatial correlation between the two variables is somewhat weaker. The corre-lation is usually significant and positive, but the spatial relation between the twovariables is not completely linear. So, when using the data to investigate therelations between Sweden/South Sweden and various parts of Germany a criticalmind is certainly recommendable.
The share of travel from Sweden/South Sweden to the republic in generalexceeds the corresponding export shares, probably because face-to-face contactshave a steeper distance decay-curve compared with those of economic and
6 7 Primary data from The Research Group in Economic Geography, Lund University.6 ° Goddard, J. B: Office Location in Urban and Regional Development, Oxford University Press 1975;Olander, L-O: Office activities as activity systems. In Daniels, J.W: Spatial Patterns of Office Growth andLocation. John Wiley and Sons 1979; Tornqvist, G: Contact Systems and Regional Development, LundStudies in Geography (B) No 35, 1970.
137
physical flows. Sweden's personal contacts with European countries are, forinstance, probably more frequent than contacts with transoceanic countries, evenin case of constant value of export flows. Moreover, Southern Sweden'scontacts with the republic are somewhat more frequent than national contacts,which is similar to export patterns and direct investments.
Furthermore, the relative number of trips (both kinds) from Sweden as well asfrom Southern Sweden to Northern Germany is higher than was expected.Thus, a certain friction of distance within Germany can be detected. Whetherthis is true for travelling only and not for economic flows cannot easily beproved.
However, a bit more surprising, is the fact that travels from Southern Sweden toNorthern Germany are not more frequent than travels from Sweden in general.On the contrary, there are figures supporting the opposite statement. Thefollowing explanation can be put forward: If Sweden's comparative advantagesmatch Northern Germany's industry in a better way than the advantages ofSouthern Sweden this would lead to more intensive relations than expectedconsidering the distance separating them. The industrial structure and compara-tive advantages of Southern Sweden and Northern Germany are in fact verysimilar. This might create less complementary and less interaction than other-wise expected between the two regions, considering only the cultural andphysical distance. Using concepts from trade theory, one might say that tradebetween Southern Sweden and Northern Germany is limited by lack of dyna-mism within intra-industry trade, whereas trade between other parts of the twocountries has somewhat more dynamism and consists of both Ricardo-trade andintra-industry trade.
The completion of the European Single Market will most certainly strengthenregional advantages and disadvantages. From this follows that the structuralsimilarities between Southern Sweden and Northern Germany may not intensifytrade as much as competition (on other markets) between the two regions. Inturn this might lead to an increasing rate of direct investment across the border.Business firms on both sides may find it advantageous to coordinate productionand marketing thereby increasing their competitive advantage in other parts ofthe single market. An interesting future for Southern Sweden and NorthernGermany (pro-vided political efforts to upgrade infrastructure) may lie increating strong inter-sected home bases through direct investments andcooperation rather than increasing trade across the border and compete on othermarkets. However, direct investments and cooperation generally make oldindustrial structures more productive and competitive but do not vitalize them.Certainly Southern Sweden and Northern Germany need a more dynamic
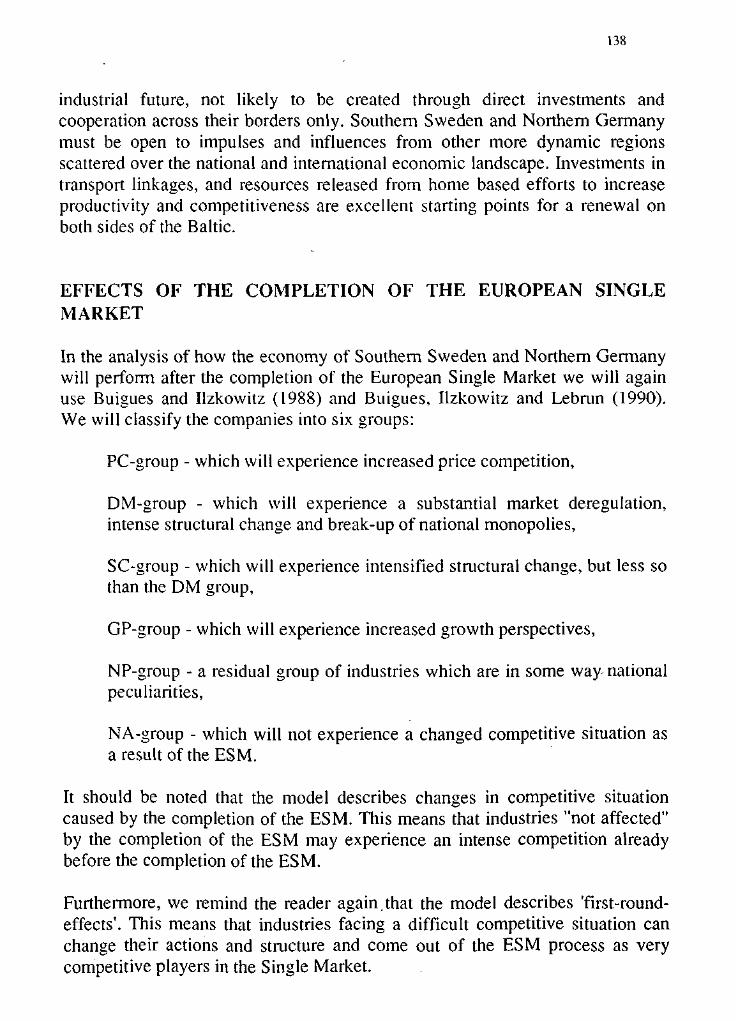
138
industrial future, not likely to be created through direct investments andcooperation across their borders only. Southern Sweden and Northern Germanymust be open to impulses and influences from other more dynamic regionsscattered over the national and international economic landscape. Investments intransport linkages, and resources released from home based efforts to increaseproductivity and competitiveness are excellent starting points for a renewal onboth sides of the Baltic.
EFFECTS OF THE COMPLETION OF THE EUROPEAN SINGLEMARKET
In the analysis of how the economy of Southern Sweden and Northern Germanywill perform after the completion of the European Single Market we will againuse Buigues and Ilzkowitz (1988) and Buigues, Ilzkowitz and Lebrun (1990).We will classify the companies into six groups:
PC-group - which will experience increased price competition,
DM-group - which will experience a substantial market deregulation,intense structural change and break-up of national monopolies,
SC-group - which will experience intensified structural change, but less sothan the DM group,
GP-group - which will experience increased growth perspectives,
NP-group - a residual group of industries which are in some way- nationalpeculiarities,
NA-group - which will not experience a changed competitive situation asa result of the ESM.
It should be noted that the model describes changes in competitive situationcaused by the completion of the ESM. This means that industries "not affected"by the completion of the ESM may experience an intense competition alreadybefore the completion of the ESM.
Furthermore, we remind the reader again.that the model describes 'first-round-effects1. This means that industries facing a difficult competitive situation canchange their actions and structure and come out of the ESM process as verycompetitive players in the Single Market.
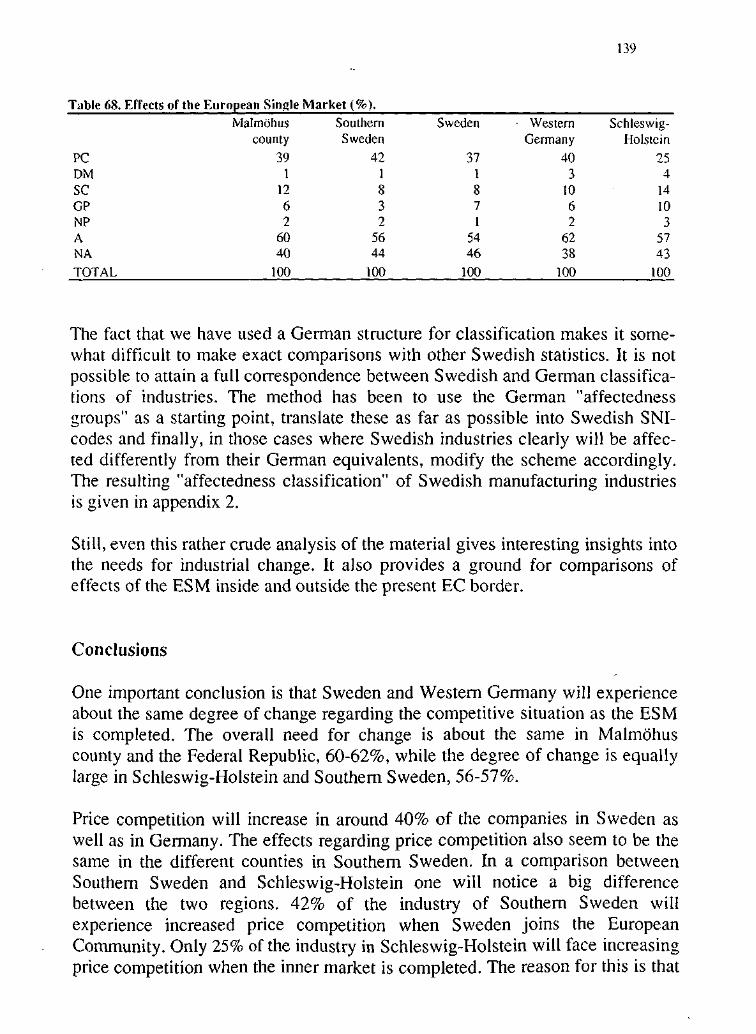
139
Table 68. Effects of the European Single Market (%).
Malmohuscounty
391
1262
6040
100
SouthernSweden
421832
5644
100
371871
5446
Germany40
31062
6238
Holstein25
414103
5743
Sweden • Western Schleswig-county Sweden
PCDMSCGPNPANATOTAL 100 100 100 100 100
The fact that we have used a German structure for classification makes it some-what difficult to make exact comparisons with other Swedish statistics. It is notpossible to attain a full correspondence between Swedish and German classifica-tions of industries. The method has been to use the German "affectednessgroups" as a starting point, translate these as far as possible into Swedish SNI-codes and finally, in those cases where Swedish industries clearly will be affec-ted differently from their German equivalents, modify the scheme accordingly.The resulting "affectedness classification" of Swedish manufacturing industriesis given in appendix 2.
Still, even this rather crude analysis of the material gives interesting insights intothe needs for industrial change. It also provides a ground for comparisons ofeffects of the ESM inside and outside the present EC border.
Conclusions
One important conclusion is that Sweden and Western Germany will experienceabout the same degree of change regarding the competitive situation as the ESMis completed. The overall need for change is about the same in Malmohuscounty and the Federal Republic, 60-62%, while the degree of change is equallylarge in Schleswig-Holstein and Southern Sweden, 56-57%.
Price competition will increase in around 40% of the companies in Sweden aswell as in Germany. The effects regarding price competition also seem to be thesame in the different counties in Southern Sweden. In a comparison betweenSouthern Sweden and Schleswig-Holstein one will notice a big differencebetween the two regions. 42% of the industry of Southern Sweden willexperience increased price competition when Sweden joins the EuropeanCommunity. Only 25% of the industry in Schleswig-Holstein will face increasingprice competition when the inner market is completed. The reason for this is that
140
Southern Sweden has a large part of its industry - more than 55% in the Labourintensive and Sheltered sectors. The productivity development need, thus, isbigger in Southern Sweden. The joining of the European Community will meanthat a high pressure will put on the industry of Southern Sweden. The need foradjustment to the first round of effects can be used as a tool to restructure theindustry and develop competitiveness for a strong position in the followingrounds. It is not realistic to assume that industrial slack can be preserved in thelong run with unilateral protective measures. Neither is it desirable to protectcompanies so that the incentives to be more effective and to compete arereduced.
The share of industries facing intensified structural change in the ESM is 50%greater in Malmohus county than in Sweden as a whole. For Malmohus county,the 12% structural change share of industry is similar to the 14% in Scheswig-Holstein. The need for structural change above the national average is a commonfeature for both Schleswig-Holstein and Malmohus county.
Companies with increasing growth perspectives are most frequent in Schleswig-Holstein, 10%, while Malmohus county is close to the national average both forGermany and Sweden. The rest of Southern Sweden constitutes a problem inthis respect. Only 3% of the industry will experience increasing growth perspec-tives as a result of the completion of the ESM. Again we experience differencesin the Southern Swedish region, concerning the competitiveness of the industry.
These results are important in relation to the debate in countries joining theEuropean Community. There are many discussions about the effects that theESM will have on the countries that are applying for membership in theEuropean Community. Not as much attention is paid to the major changes thatwill occur .inside ihe present EC as the ESM is completed. The results from ouranalysis remind us of the fact that the completion of the single market aims atthe creation of a more competitive Europe. The increased competitiveness willnot come as an immediate result of trade negotiations and political agreements.The increased competitiveness will arise from the ability of companies withinthe European community to improve their performance and increase theircompetitive edge. The contribution from the statesmen and politicians is tocreate a competitive environment in which companies who are willing to focuson a long term competitive posture will be rewarded. Rewards come from accessto a larger capital base, removal of artificial barriers and national safety belts forlow performing industries, and finally from access to a large home market.
Thus, the competitive companies inside the European Single Market shallflourish. The other side of the same coin is that casualties will occur. An
141
inevitable effect of the support of competitive forces is that they actually dowork if artificial barriers are removed. Thus, inefficient companies will gobankrupt, jobs will be lost and whole regions may get into serious trouble. Themain emphasis of an economic and infrastructural policy under these conditionsshould be to continue the offensive and support the growth of strong industries.This is the outspoken agenda and strategy behind the ESM. When othercountries join the EC, therefore, it means increased industrial ambitions and acertain amount of blood, toil, sweat and tears. The newcomers should rememberthat they play by the same rules as those who have already joined the compe-titive game. Supremacy in the world market is the goal and the road to thatposition is by no means simple.
An important conclusion in this area is that Malmohus county and Schleswig-Holstein are industrial development areas of great strategic importance. Fromour analysis follows that the need for structural change is clearly above thenational averages in the two areas. At the same time there are growth prospectsaround the national averages in both areas. The implication is that regionalefforts are of utmost importance for a rapid transformation of the parts of theindustry that need restructuring. At the same time the growth prospect industriesshould be encouraged to capture and develop a strong competitive position.Regional efforts to promote change and dynamics in the allocation of resources,capital and labour as well as research and development in Malmohus county andSchleswig-Holstein are crucial for the development and wealth of the regions.Federal/national laws are, of course, essential for the business and developmentclimate. However, it is important that the national control measures do not createobstacles for regional dynamism and competitive actions in the regionalmarkets.
An interesting part of the comparison is the evaluation of the effects of change inthe agricultural sector. In Sweden joining the EC is expected to create anincreased pressure on the food & agriculture businesses. In Schleswig-Holsteinno such effect is expected. It has been said that the German agricultural sectorhas transformed and become more competitive than the corresponding Swedishindustries. This argument is based on food prices. However, in direct compari-son between different food-producing companies the picture is more diverse. Indirect comparison several Swedish food companies are quite competitive, whilethe regulation system in Sweden seen as a whole creates competitive dis-advantages. On the company level, therefore, the evaluation of effects is relatedto the company's attitude to future challenges and change. In the survey wenoted that the attitude towards the future was rather inactive. Judging from thepresent debate and corporate activities in Southern Sweden, the level of aware-ness is increasing rapidly. This increasing awareness may be an important asset
142
in the cost cutting, restructuring and market investments that are necessary forthe development of the competitive posture and the future position of theSwedish agricultural sector.
Perhaps the McSharry plan with its low-price profile can change the picture alsoin Schleswig-Holstein? The position in the GATT negotiation when this reportwas written is that there seems to be a possibility to reach an agreement whichwould imply a price reduction inside the EC of 35% - compared with the prices1986-1988. In Sweden the prices of agricultural products have increased compa-red to the rest of the world since. Thus, the price reductions will be larger than35% on the Swedish market if an agreement is made.
A more general conclusion is that the completion of the ESM will createincreased competitive pressure and needs for substantial industrial change bothin Southern Sweden and Schleswig-Holstein. In both regions, however, there areimportant and competitive companies in industries with development possibi-lities like Pharmaceuticals, instruments, food and specialized chemicals. Theseindustries may in the two regions create important winners in the developmentof the European Single Market.
BALTIC COOPERATION - BASED ON WHAT?
In previous sections of this report we have described the increased interest infurther cooperation among the countries around the Baltic. The political inten-tions exist and the feeling of joint interests exist. What about the conditions forcooperation? Is the idea of a new Hanse a dream without linkages to economicrealities? We shall examine the evidence.
First, one must appreciate the fact that a substantial amount of trade alreadytakes place in the Baltic rim. The trade between the Baltic rim states amounts toapproximately 107,000 million USD which is equivalent to 3.7% of worldexports.69 The pattern of trade is further described in table 69.
From the table we see that the trade between Germany and former Soviet Unionis an important part of the trade in the area. Furthermore, it can be noted that thetrade between Germany, Denmark and Sweden is important. This trade amountsto around 32% of the total trade in the area. The measurement was made in 1988when the Soviet Union still existed. After the downfall of the Soviet empire and
6 9 Cornett, A.P & Iversen, S. P: Commercial relations in an integration/network perspective - the case of theBaltic Rim. Paper prepared for the Regional Science Conference in Sonderborg, Denmark 1991.
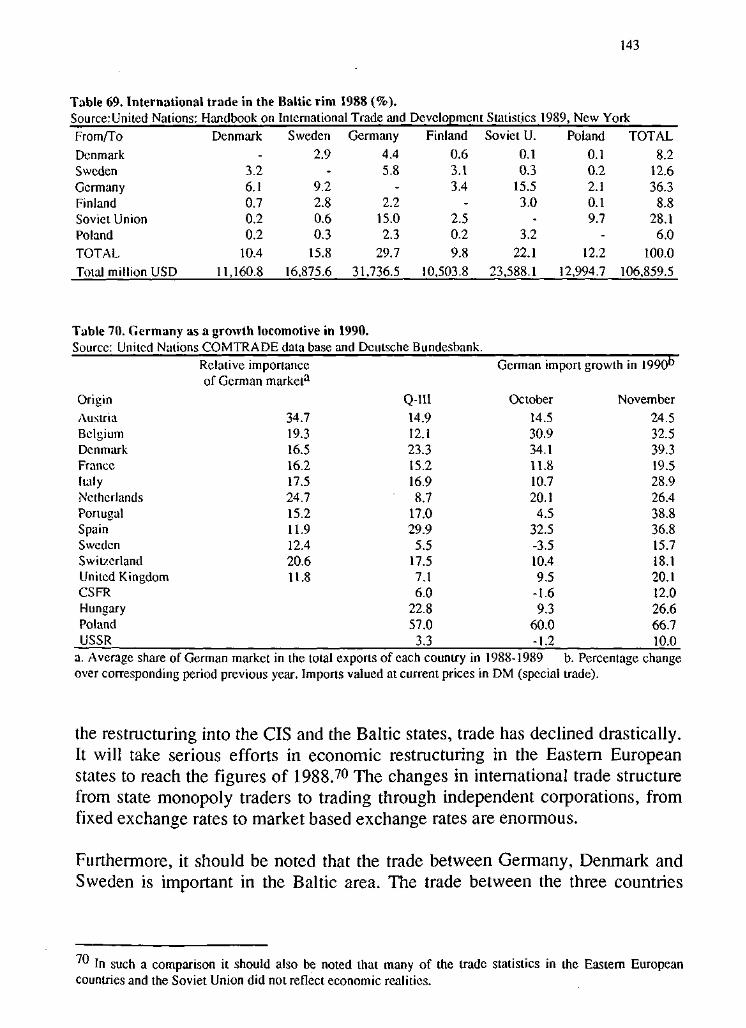
143
Table 69. International trade in the Baltic rim 1988 (%).Source:United Nations: Handbook on International Trade and Development Statistics 1989, New York
From/ToDenmarkSwedenGermanyFinlandSoviet UnionPolandTOTALTotal million USD
Denmark-
3.26.10.70.20.2
10.4
11,160.8
Sweden
2.9-
9.22.80.60.3
15.8
16,875.6
Germany4.45.8
-2.2
15.02.3
29.731,736.5
Finland
0.63.13.4
-2.50.29.8
10,503.8
Soviet U.
0.10.3
15.53.0
-3.2
22.1
23,588.1
Poland0.10.22.10.19.7
-
12.2
12,994.7
TOTAL8.2
12.636.3
8.828.1
6.0100.0
106,859.5
Table 70. Germany as a growth locomotive in 1990.Source: United Nations COMTRADE data base and Deutsche Bundesbank.
OriginAustriaBelgiumDenmarkFranceItalyNetherlandsPortugalSpainSwedenSwitzerlandUnited KingdomCSFRHungaryPolandUSSR
Relative importanceof German marketa
34.719.316.516.217.524.715.211.912.420.611.8
Q-III
14.912.123.315.216.98.7
17.029.95.5
17.57.16.0
22.857.0
3.3
German import
October
14.530.934.111.810.720.14.5
32.5-3.510.49.5
-1.69.3
60.0-1.2
growth in 1990b
November
24.532.539.319.528.926.438.836.815.718.120.112.026.666.710.0
a. Average share of German market in the total exports of each country in 1988-1989 b. Percentage changeover corresponding period previous year. Imports valued at current prices in DM (special trade).
the restructuring into the CIS and the Baltic states, trade has declined drastically.It will take serious efforts in economic restructuring in the Eastern Europeanstates to reach the figures of 1988.70 The changes in international trade structurefrom state monopoly traders to trading through independent corporations, fromfixed exchange rates to market based exchange rates are enormous.
Furthermore, it should be noted that the trade between Germany, Denmark andSweden is important in the Baltic area. The trade between the three countries
™ In such a comparison it should also be noted that many of the trade statistics in the Eastern Europeancountries and the Soviet Union did not reflect economic realities.
144
amounts to around 32% of the trade in the Baltic rim. A potential exists for moretrade and economic exchange when the border transaction costs are reduced.
The German economy plays a crucial part in the development of the Baltic area.The German export amounted to more than one third of the region's total exportsin 1988. Thus, Germany is the leading and focal economy of the Baltic network.This has also been described in a study by the United Nations and is illustratedin table 70.71
The fact that two areas are close to each other does not automatically createeconomic and social integration. A very interesting study of the border betweenDenmark and Germany has concluded that several social factors will limitinteraction even if border barriers are removed.72
We may conclude that between the two parts of the Danish border regionsthere seems to be only little integration in the sense of the type ofeconomic relations such as one would find between comparableneighbouring areas without a border. ... The main factors behind the lowdegree of integration may be seen in differences in legislation with regardto indirect taxes, income taxes and corporation taxes, ... in different socialsecurity systems, ... in divergent educational systems, ... in differentadmissions to a trade or a profession, ... in different technical standardsand so on. Also the different languages constitute barriers, which, as itseems are not easily overcome - ...73
Although exports from Germany and especially from Schleswig-Holsteinincreased extraordinarily after Denmark joined the common market in the earlyseventies, several economic and social factors have limited further interactions.The integration took place in the trade area between the countries, but led toonly limited cooperation between companies in the regions on both sides of theborder. Krieger-Boden's conclusion is that the economic integration has manynon-economic aspects that could create restrictions. The effect of Denmarkjoining the European Community has been quite noticeable in Schleswig-Holstein and has created economic growth. During the 1970s, when Denmarkjust had joined the European Community, Schleswig-Holstein experienced agrowth in GDP of 3.5%, which was nearly 0.8% higher than the Federal
7* Economic Commision for Europe: Economic Survey of Europe in 1990-1991, United Nations 1991.7 2 Krieger-Boden, C: The German-Danish Border Region: Does the Border Matter and Can It Be Overcome.Institut fur Weltwirtschaft, Kiel 1991.7 3 Ibid pp. 11-12.
145
Republic. The positive effects have been even larger in Sonderjylland and havelasted longer than in Schleswig-Holstein.
However, one major observation with regard to the German-Danish borderregion cannot be explained easily, namely the remarkably favourableperformance of Sonderjylland.74
One explanation to the positive performance of Sonderjylland is that companiesthat have important markets in central Europe locate as close to the border aspossible. Thus they can gain through closer customer contacts, improvedlogistics and reduced distribution cost. At the same time they have the advantageof staying in the same regulatory environment. The increased dynamism in theregion close to the border has also created opportunities for new firms incomplementary businesses.
Another more possibility is an increased dynamism in the factor markets aroundthe border. In the Danish-German case, the integration has been limited due todifferences in regulatory environment, language and social security systems. Ifan increased dynamism in the factor markets is to occur when Sweden joins theEC, efforts must be made to stimulate the mobility of the labour market, e.g.through infrastructure for transportation. The biggest possibilities in this respectexist around the Swedish-Danish border in the Oresund area. The same comestrue in the case of Denmark and Germany. Danish firms are much more presentin Northern Germany and companies from Schleswig-Holstein are much morepresent in Southern Denmark.75 Possibly the picture will change in the Balic rimwhen the EES is created and when Sweden joins the European Community. Onthe one hand, Swedish firms will not have to settle in Northern Germany to getinside the EC border. On the other hand, incentives for cooperation in the largermarket will increase. As there are similarities in the industrial structure betweenSouthern Sweden and Northern Germany there are opportunities for intensifiedinteraction. Southern Sweden may improve its competitive position and attractforeign investors. Likewise companies in Southern Sweden may use theincreased possibilities to build efficient production and sales units with theBaltic region as a home base. Southern Sweden will be the nearest Swedishregion to the common market and central Europe. Judging from the Danishexperience this can lead to good economic development.
We find possibilities for increased exchange in the future, but today a number offactors limits the integration of the economies around the Baltic. We can add to
7 4 Ibid p. 14.7 5 See Krieger-Boden.
146
these difficulties and mention that we found in our own Survey II that thesubcontractors for the manufacturing industry in Southern Sweden could befound in Germany - but unfortunately in central or Southern Germany. Only onecompany reported a supplier in Schleswig Holstein. We can also note that theefforts from Rendsburg to stimulate companies in Southern Sweden to makedirect investments in Rendsburg has so far not given any results. Only twoDanish companies have started in Rendsburg.
Looking at the statistics, we find that only 2.3% of Schleswig-Holstein's foreigndirect investments in 1989 were made in Sweden - investments worth DM 23million. The total German investment in Sweden was DM 828 million,corresponding to 0.4% of Germany's foreign direct investment. At the same timethe Swedish direct investments in Schleswig-Holstein amounted to DM 406million, which makes Sweden the second largest investor in Schleswig-Holstein,with twice the investment of Great Britain and almost twice the investment ofJapan. The United States invested 21.3% of the total foreign direct investmentsin Schleswig-Holstein, while Sweden invested 20.1%. These figures deviatefrom the figures for Germany as a whole where Swedish investments are only2.1 % of total foreign investments. For Germany as a whole, France investsthree times as much as Sweden, but in Schleswig-Holstein Sweden invests 45times more than France.76
So, there is evidence to support the view that Schleswig-Holstein is a favouredlocation for Swedish direct investments in Germany. The interest fromcompanies in Schleswig-Holstein to move north is more limited. In the future,following the research results from the Danish-German border, the picture maychange. Swedish companies will not invest any more in Schleswig-Holstein inorder to get a location inside the European Community. When Swedishcompanies invest in Schleswig -Holstein in the future it will be for other reasons.One reason may be nearness to customers, another reason may be rationa-lizations in order to increase the effectiveness in a cross-border corporation. Thesame reasons may be valid in the future for German companies entering theSwedish market. Thus, the removal of the border transaction cost may stimulateGerman direct investments in Southern Sweden.
Substantial parts of Swedish exports to Germany go to the northern parts.Several Swedish companies are represented in the Hamburg area.77 It is alsoreported that consumer tastes and preferences are more similar to the Swedishstandards in the northern parts of Germany than in the Southern parts. The
7 6 Statistics from Institut fur Weltwirtschaft, table 102.7 7 Von Friesen, H: Ett land men tre olika marknader, Svensk Export 10/1988 p. 30-35.
147
successful introduction of the Swedish chocolate-bar Daim and other brandsfrom the food-company Freia-Marabou in Hamburg has been based with astrong partner in distribution. This effort by Freia-Marabou is one of the fewsuccessful introductions of Swedish food-products on the German market.
Thus, we can find a solid Swedish interest in the Northern German region - atleast until now. However there is no evidence to support a German industrialinterest in Southern Sweden. We would also have liked to establish as a fact thatthe interest in Northern Germany primarily comes from companies in SouthernSweden. Unfortunately, we do not have evidence to support that hypothesis. Ourbelief is that the picture will change when Sweden joins the EC and newpossibilities for agriculture and food businesses are created. For other parts ofthe industry, a successful EES-treaty may be a good platform.
149
References
ADLUNG, R., H. J. M. GOTZINGER, K. LAMMERS, K-W. SCHATZ, J.SEITZ, C. THOROE, Konzeption und Instrumente einer potentialorientiertenRegionalpolitik. Institut der Kommunalwissenschaften der Konrad-Adenauer-Stiftung, St. Augustin 1979.
ALSEN et al., Skane infor 2000-talet. Foretagsekonomiska Institutionen, LundsUniversitet, 1991.
BODE, E., M. HOFFMEYER, L. HOLLER, Ch. KRIEGER-BODEN, C-F.LAASER, K. LAMMERS, Struktur und Entwicklungsmoglichkeiten der Wirt-schaft in der deutsch-danischen Grenzregion. Institut fur Weltwirtschaft, KielerSonderpublikationen, Kiel 1991.
BOSS, A., Unternehmensbesteuerung und Standortqualitat. Ein internationalerVergleich. Institut fur Weltwirtschaft, Kieler Diskussionsbeitrage, 145/146,November 1988.
BUIGUES, P. A., F. ILZKOVITZ, The Sectoral Impact of the Internal Market.Brtissel 1988.
J.-F. LEBRUN, "The Impact of the Internal Market by Industrial Sector". In:BUIGUES, P. A., F. ILZKOVITZ, J.-F. LEBRUN (Eds.), The Impact of theInternal Market by Industrial Sector: The Impact of the Internal Market for theMember States. European Economy, Social Europe, Special Edition. Briissel1990, S. 9-113.
CORNETT, A.P., S.P. IVERSEN, Commercial relations in an integration/network perspective - the case of the Baltic Rim. Paper prepared for theNordrefo, Regional Science Conference, Sonderborg, Denmark, November 27-29, 1991.
DEUTSCHE BUNDESBANK, Statistische Beihefte zu den Monatsberichten derDeutschen Bundesbank, Reihe 3: Zahlungsbilanzstatistik, Beilage. Frankfurt/M.,current issues.
DONGES, J. B., K.-W. SCHATZ,- Staatliche Interventionen in derBundesrepublik Deutschland. Umfang, Struktur, Wirkungen. Institut furWeltwirtschaft, Kieler Diskussionsbeitrage, 119/120, Mai 1986.
150
DOHRN, R., Der europaische Binnenmarkt - Eine Bestandsaufnahme undUberlegungen zu den Chancen und Risiken fiir Nordrhein-Westfalen. RWI-Mitteilungen, Vol. 40, 1989, S. 149-181.
ECHTERHOFF-SEVERITT, H., Ch. GRENZMANN, E. HARDT, R.MARQUARDT, A. WEISSBURGER, J. WUDTKE, Forschung und Entwick-lung in der Wirtschaft 1983 - mit ersten Daten 1985. Gemeinniitzige Gesell-schaft fiir Wissenschaftsstatistik, Arbeitsschrift A, Essen 1986.
ECHTERHOFF-SEVERITT, H., Ch. GRENZMANN, E. HARDT, R.MARQUARDT, A. WEISSBURGER, J. WUDTKE, Forschung und Entwick-lung in der Wirtschaft 1985 - mit ersten Daten 1987. Gemeinniitzige Gesell-schaft fiir Wissenschaftsstatistik, Arbeitsschrift A, Essen 1988.
ECHTERHOFF-SEVERITT, H. et al., Forschung und Entwicklung in derWirtschaft 1987 - mit ersten Daten 1989. Gemeinniitzige Gesellschaft furWissenschaftsstatistik, Arbeitsschrift A, Essen 1990.
ECONOMIC COMMISSION FOR EUROPE: Economic Survey of Europe in1990-1991, United Nations, 1991.
EMPIRICA, Die wirtschaftlichen Auswirkungen der Entwicklung zum Binnen-markt auf Sektoren und Regionen der Bundesrepublik Deutschland. Bonn,Januar 1989, Kurzfassung.
GIERSCH, H., "Aspects of Growth, Structural Change, and Employment - ASchumpeterian Perspective". Weltwirtschaftliches Archiv, Vol. 115, 1979, Nr. 4,pp. 629-652.
GODDARD, J. B., Office Location in Urban and Regional Development.Oxford University Press. London 1975.
HEITGER, B., J. STEHN, "Japanische Direktinvestitionen in der EG - eintrojanisches Pferd fiir 1993?". Die Weltwirtschaft, 1989, H. 1, pp. 124-136.
HERRMANN, H., Die Beschaftigtenentwicklung in Schleswig-Holstein 1980-1987, gegliedert nach Tatigkeitsbereichen, Berufsgruppen und Qualifikationen.Beitrage aus dem Institut fiir Regionalforschung der Universitat Kiel, 10, Juni1989.
151
HOFFMEYER, M., Ch. KRIEGER-BODEN, C.-F. LAASER, K. LAMMERS,M. MERZ, Struktur und Perspektiven der Wirtschaft Schleswig-Holsteins.histitut fiir Weltwirtschaft, Kieler Sonderpublikationen, Kiel 1990.
HUFBAUER, G. C , J. G. CHILAS, "Specialization by Industrial Countries -Extent and Consequences". In: Herbert GIERSCH (Ed.), The InternationalDivision of Labour: Problems and Perspectives. Institut fur Weltwirtschaft Kiel,International Syposium, Tubingen 1974, pp. 3-38.
KEEBLE, D., P. L. OWENS, Ch. THOMPSON, The Influence of Peripheral andCentral Locations on the Relative Development of Regions. University ofCambridge, Department of Geography, Cambridge, Mass., 1981.
KLODT, H., Wettlauf um die Zukunft. Technologiepolitik im internationalenVergleich. Kieler Studien, 206, Tubingen 1987.
KLODT, H., K.-D. SCHMIDT, A. BOSS, A. BUSCH, A. ROSENSCHON, W.SUHR, Weltwirtschaftlicher Strukturwandel und Standortwettbewerb. Diedeutsche Wirtschaft auf dem Prufstand. Kieler Studien, 228, Tubingen 1989.
KRIEGER-BODEN, Ch., The German-Danish Border Region: Does the BorderMatter and Can It Be Overcome? Paper prepared for the conference "PeripheryStrategies in European Integration", helt in Sonderburg, Danmark, November27-29, 1991.
LAMMERS, K., Regionalforderung und Schiffbausubventionen in derBundesrepublik. Kieler Studien, 224, Tubingen 1989.
LANDESZENTRALBANK SCHLESWIG-HOLSTEIN, Angaben zu denDirektinvestitionen des Landes (unpublished).
LANGHAMMER, R. J., Die Assoziierungsabkommen mit der CSFR, Polen undUngarn: wegweisend oder abweisend? Institut fur Weltwirtschaft, KielerDiskussionsbeitrage, 182, Marz 1992.
LEGLER, H., Datenmaterial zur Forschungs- und Entwicklungstatigkeit vonUnternehmen in Norddeutschland, Hannover 1991 (unpublished).
LUNDQUIST, K.-J., L.-O. OLANDER, Svenska Regioner i InternationellKonkurrens. Redovisning av ett Pagaende Forskningsprojekt. Institutionen forKulturgeografi och Ekonomisk Geografi vid Lunds Universitet, Rapporter ochNotiser, 107, Lund 1992.
152
MOSCHEL, W., Recht der Wettbewerbsbeschrankungen. Koln 1983.
NERB, G., J. REUTER, A. WEICHSELBERGER, Die Auswirkungen des EG-Binnenmarktes auf Schleswig-Holstein - Gesamtwirtschaftliche, sektorale undregionale Effekte. Denkfabrik Schleswig-Holstein, Kiel 1990.
OHLSSON, L., Industry and EC- Federation of Swedish Industries. Stockholm1988. Mimeo.
OHLSSON, L., L. VINELL, Tillvaxtens Drivkrafter. En Studie av IndustriesFramtidsvillkor. Stockholm 1987.
OLANDER, L.-O., Office Activities as Activity Systems. In Daniels, J.W.:Spatial Patterns of Office Growth and Location. John Wiley and Sons. London1979.
PAQUE, K.-H., "Hysteresis, Structural Change, and Long-TermUnemployment: The West German Labour Market in the 1980's". Paperpresented at the conference "The Art of Full Employment" September 28-30,1989, at the Rijksuniversitat Limburg. In print.
PORTER, M., The Competitive Advantage of Nations. MacMillan. London1990.
THE RESEARCH GROUP in ECONOMIC GEOGRAPHY, Primary data fromvarious unpublished projects. Lund University. Lund 1982.
RICHERT, R., E. THIEL, "Neue Perspektiven fur Norddeutschland nach 1992?"In: O. G. MAYER, H.-E. SCHARRER, H.-J. SCHMAHL (Hrsg.), Dereuropaische Binnenmarkt. Perspektiven und Probleme. Hamburg 1989, pp. 379-405.
SIDENIUS, N. K., The Impact of the International Market on the PoliticalContacts. Associational Cooperation and Organizational Structure of DanishManufacturing Firms and Trade Associations. Paper presented at the Nordrefo,Regional Science Conference, Sonderborg, Denmark, November 27-29, 1991.
SINZ, M., W. J. STEINLE, "Regionale Wettbewerbsfahigkeit, Nr. 1, 1989, pp.10-21.
153
SCHLESWIG-HOLSTEIN CHAMBERS OF INDUSTRY AND COMMERCE,Business Cycle Questionnaire 1/92, Additional Questions Concerning the ESM-Program, unpublished data, Kiel 1992.
SOLTWEDEL, R., A. BUSCH, A. GROSS, C.-F. LAASER, Deregulierungs-potentiale in der Bundesrepublik. Kieler Studien, 202, Tubingen 1986.
SOLTWEDEL, R., A. BUSCH, A. GROSS, C.-F. LAASER, Zur staatlichenMarktregulierung in der Bundesrepublik. Institut fur Weltwirtschaft, KielerSonderpublikationen, Kiel 1987.
STATISTISCHES BUNDESAMT, Unternehmen und Arbeitsstatten, Arbeits-stattenzahlung vom 27. Mai 1970, Heft 2, Nichtlandwirtschaftliche Arbeits-statten und Beschaftigte. Wiesbaden 1972.
STATISTISCHES BUNDESAMT, Fachserie 2, Unternehmen und Arbeits-statten, Arbeitsstattenzahlung vom 25. Mai 1987, Heft 2, Arbeitsstatten undBeschaftigte. Wiesbaden 1990.
STATISTISCHES BUNDESAMT, Statistisches Jahrbuch fur die Bundes-republik Deutschland, various issues.
STATISTISCHES BUNDESAMT, Fachserie 7, Aussenhandel, Reihe 3, currentvolumes.
STATISTISCHES LANDESAMT SCHLESWIG-HOLSTEIN, StatistischesJahrbuch, various issues.
STATISTISCHES LANDESAMT SCHLESWIG-HOLSTEIN, StatistischerBericht G III 1, Die Ausfuhr Schleswig-Holsteins im Jahre 1990, various issues.
TORNQVIST, G., Contact Systems and Regional Development. Lunds Studiesin Geography (B), No 35. Lund 1970.
VON FRIESEN, H.: Ett land men tre olika marknader. Svensk Export 10/1988.
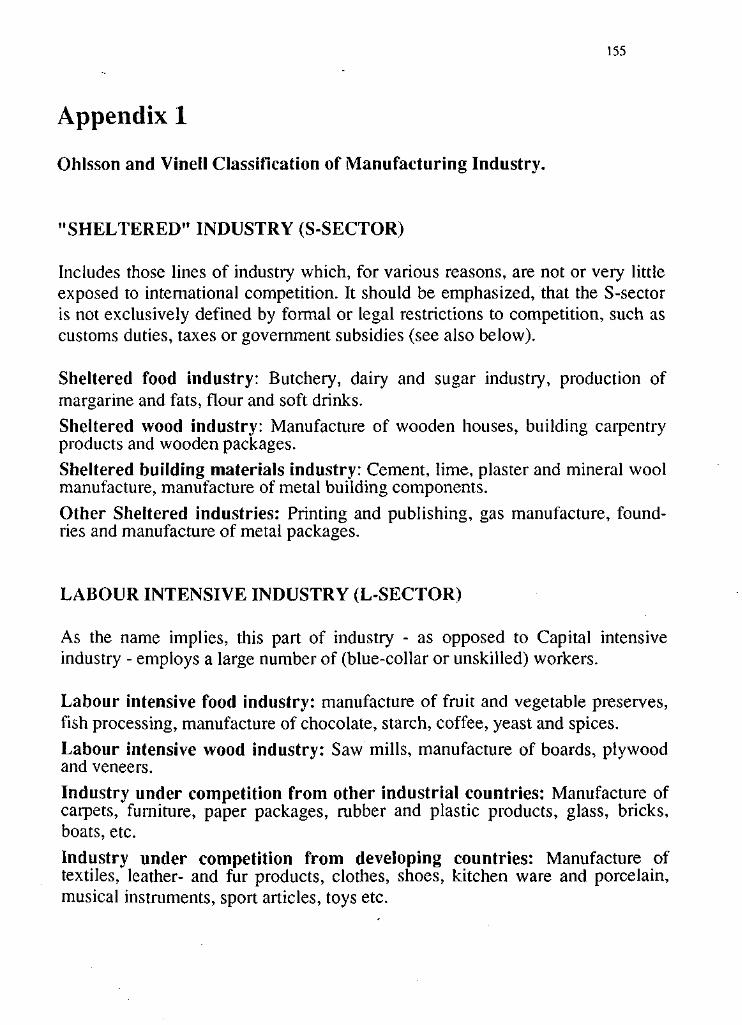
155
Appendix 1
Ohlsson and Vinell Classification of Manufacturing Industry.
"SHELTERED" INDUSTRY (S-SECTOR)
Includes those lines of industry which, for various reasons, are not or very littleexposed to international competition. It should be emphasized, that the S-sectoris not exclusively defined by formal or legal restrictions to competition, such ascustoms duties, taxes or government subsidies (see also below).
Sheltered food industry: Butchery, dairy and sugar industry, production ofmargarine and fats, flour and soft drinks.Sheltered wood industry: Manufacture of wooden houses, building carpentryproducts and wooden packages.Sheltered building materials industry: Cement, lime, plaster and mineral woolmanufacture, manufacture of metal building components.Other Sheltered industries: Printing and publishing, gas manufacture, found-ries and manufacture of metal packages.
LABOUR INTENSIVE INDUSTRY (L-SECTOR)
As the name implies, this part of industry - as opposed to Capital intensiveindustry - employs a large number of (blue-collar or unskilled) workers.
Labour intensive food industry: manufacture of fruit and vegetable preserves,fish processing, manufacture of chocolate, starch, coffee, yeast and spices.
Labour intensive wood industry: Saw mills, manufacture of boards, plywoodand veneers.
Industry under competition from other industrial countries: Manufacture ofcarpets, furniture, paper packages, rubber and plastic products, glass, bricks,boats, etc.
Industry under competition from developing countries: Manufacture oftextiles, leather- and fur products, clothes, shoes, kitchen ware and porcelain,musical instruments, sport articles, toys etc.
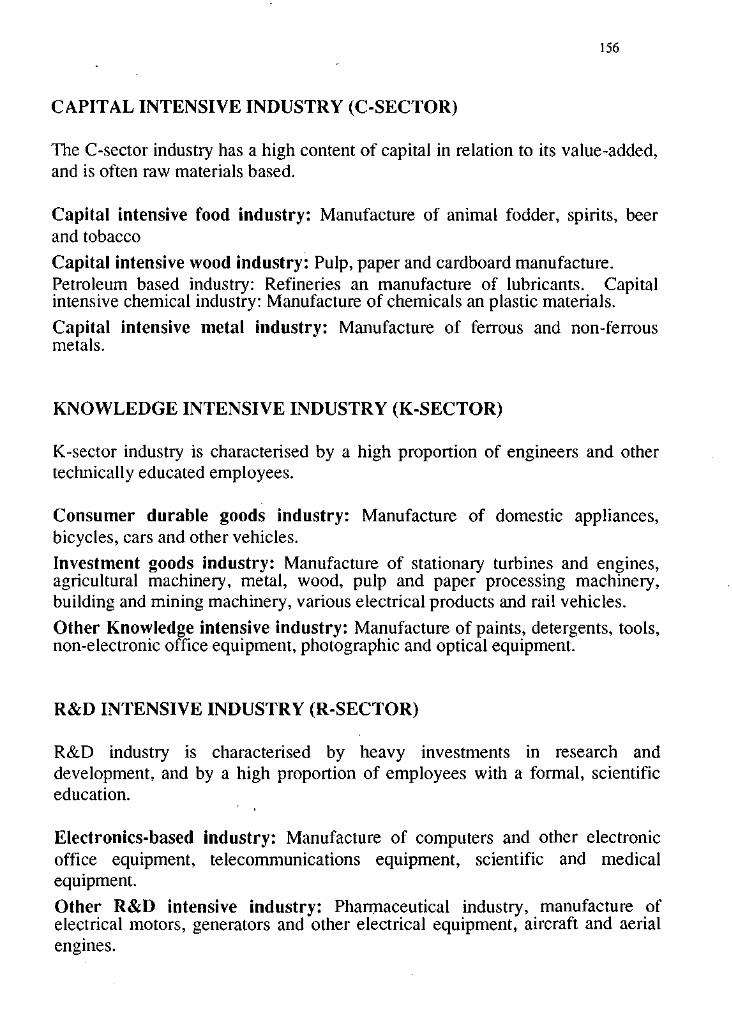
156
CAPITAL INTENSIVE INDUSTRY (C-SECTOR)
The C-sector industry has a high content of capital in relation to its value-added,and is often raw materials based.
Capital intensive food industry: Manufacture of animal fodder, spirits, beerand tobacco
Capital intensive wood industry: Pulp, paper and cardboard manufacture.Petroleum based industry: Refineries an manufacture of lubricants. Capitalintensive chemical industry: Manufacture of chemicals an plastic materials.
Capital intensive metal industry: Manufacture of ferrous and non-ferrousmetals.
KNOWLEDGE INTENSIVE INDUSTRY (K-SECTOR)
K-sector industry is characterised by a high proportion of engineers and othertechnically educated employees.
Consumer durable goods industry: Manufacture of domestic appliances,bicycles, cars and other vehicles.Investment goods industry: Manufacture of stationary turbines and engines,agricultural machinery, metal, wood, pulp and paper processing machinery,building and mining machinery, various electrical products and rail vehicles.
Other Knowledge intensive industry: Manufacture of paints, detergents, tools,non-electronic office equipment, photographic and optical equipment.
R&D INTENSIVE INDUSTRY (R-SECTOR)
R&D industry is characterised by heavy investments in research anddevelopment, and by a high proportion of employees with a formal, scientificeducation.
Electronics-based industry: Manufacture of computers and other electronicoffice equipment, telecommunications equipment, scientific and medicalequipment.
Other R&D intensive industry: Pharmaceutical industry, manufacture ofelectrical motors, generators and other electrical equipment, aircraft and aerialengines.

157
UNCLASSIFIED INDUSTRY
Includes a small number of "manufacturing industries", which although they arestatistically classified as such, for several reasons do not fit into any of thesectors, such as craft-based rather than industrial production, home industriesand repair work. Unclassified industry, which in most regions has a very limitedportion of total employment, is not commented in the following analyses.

159
Appendix 2
"ESM Affectedness Classification" of Swedish Manufacturing Industries.
PC (Increased Price Competition)3111 1 Butchery31112 Production of meat products31121 Dairies and production of milk-based products31122 Mfg of ice cream3113 Production, processing and preserving of fruit and vegetables3114 Production, processing and preserving of fish and fish products31151 Mfg of margarine31159 Mfg of oils and fats3116 Mfg of grain mill products3118 Sugar industry31211 Mfg of starch31212 Mfg of coffee31219 Mfg of other food products (spices, yeast, chocolate etc.)3122 Mfg of animal fodders32111 Mfg of yarn32112 Mfg of woven textiles32113 Bleaching and dyeing of textiles3212 Sewing industry3213 Mfg of tricot3214 Mfg of carpets3215 Mfg of ropes etc.3219 Mfg of other textile products3220 Mfg of clothes (textile, leather and fur)3232 Processing of furs3240 Mfg of shoes3511 Mfg of chemicals and gases3512 Mfg of fertilizers, herbicides and pesticides3513 Mfg of plastic, synthetic fibres3523 Mfg of detergents and toilet preparat ions3551 Mfg of rubber tyres and inner tubes3559 Mfg of other rubber products35609 Mfg of plastic products except packages3610 Mfg of porcelain and ceramics3620 Mfg of glass and glass products
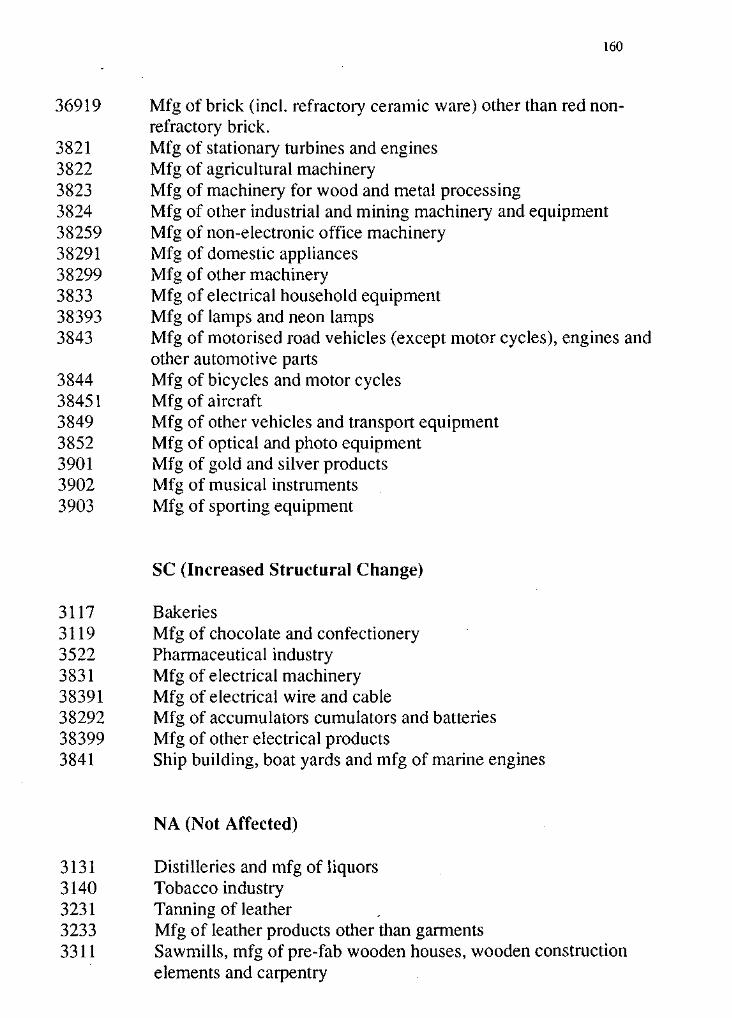
160
36919 Mfg of brick (incl. refractory ceramic ware) other than red non-refractory brick.
3821 Mfg of stationary turbines and engines3822 Mfg of agricultural machinery3823 Mfg of machinery for wood and metal processing3824 Mfg of other industrial and mining machinery and equipment38259 Mfg of non-electronic office machinery38291 Mfg of domestic appliances38299 Mfg of other machinery3833 Mfg of electrical household equipment38393 Mfg of lamps and neon lamps3843 Mfg of motorised road vehicles (except motor cycles), engines and
other automotive parts3844 Mfg of bicycles and motor cycles38451 Mfg of aircraft3849 Mfg of other vehicles and transport equipment3852 Mfg of optical and photo equipment3901 Mfg of gold and silver products3902 Mfg of musical instruments3903 Mfg of sporting equipment
SC (Increased Structural Change)
3117 Bakeries3119 Mfg of chocolate and confectionery3522 Pharmaceutical industry3831 Mfg of electrical machinery38391 Mfg of electrical wire and cable38292 Mfg of accumulators cumulators and batteries38399 Mfg of other electrical products3841 Ship building, boat yards and mfg of marine engines
NA (Not Affected)
3131 Distilleries and mfg of liquors3140 Tobacco industry3231 Tanning of leather3233 Mfg of leather products other than garments3311 Sawmills, mfg of pre-fab wooden houses, wooden construction
elements and carpentry
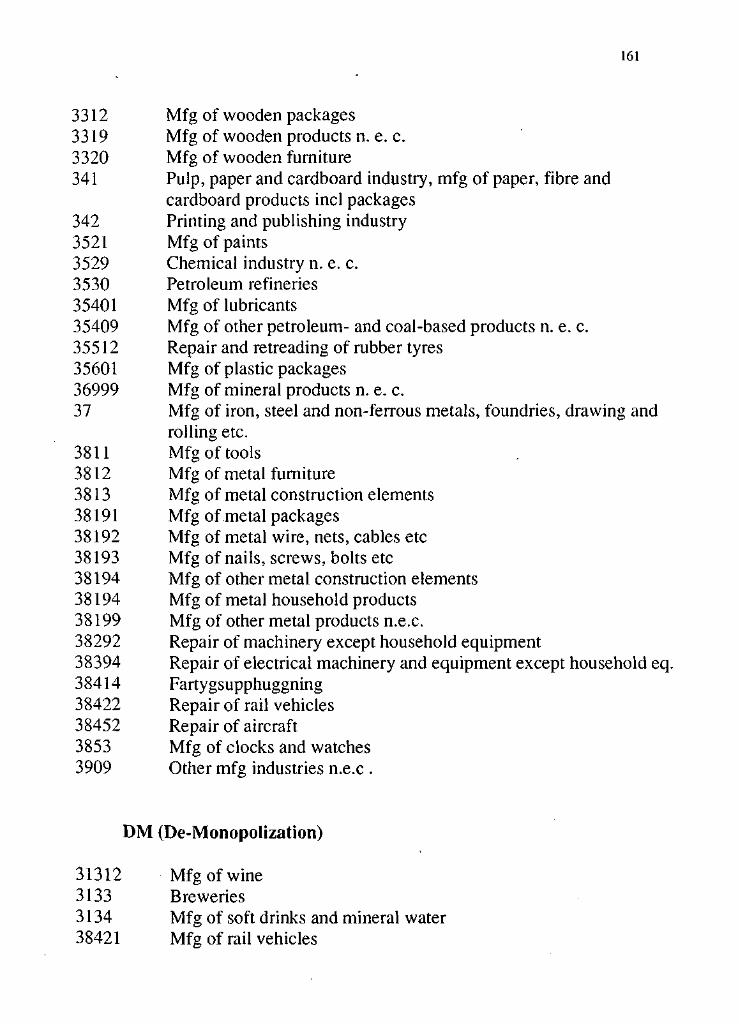
161
3312 Mfg of wooden packages3319 Mfg of wooden products n. e. c.3320 Mfg of wooden furniture341 Pulp, paper and cardboard industry, mfg of paper, fibre and
cardboard products incl packages342 Printing and publishing industry3521 Mfg of paints3529 Chemical industry n. e. c.3530 Petroleum refineries35401 Mfg of lubricants35409 Mfg of other petroleum- and coal-based products n. e. c.35512 Repair and retreading of rubber tyres35601 Mfg of plastic packages36999 Mfg of mineral products n. e. c.37 Mfg of iron, steel and non-ferrous metals, foundries, drawing and
rolling etc.3811 Mfg of tools3812 Mfg of metal furniture3813 Mfg of metal construction elements38191 Mfg of metal packages38192 Mfg of metal wire, nets, cables etc38193 Mfg of nails, screws, bolts etc38194 Mfg of other metal construction elements38194 Mfg of metal household products38199 Mfg of other metal products n.e.c.38292 Repair of machinery except household equipment38394 Repair of electrical machinery and equipment except household eq.38414 Fartygsupphuggning38422 Repair of rail vehicles38452 Repair of aircraft3853 Mfg of clocks and watches3909 Other mfg industries n.e.c .
DM (De-Monopolization)
31312 Mfg of wine3133 Breweries3134 Mfg of soft drinks and mineral water38421 Mfg of rail vehicles
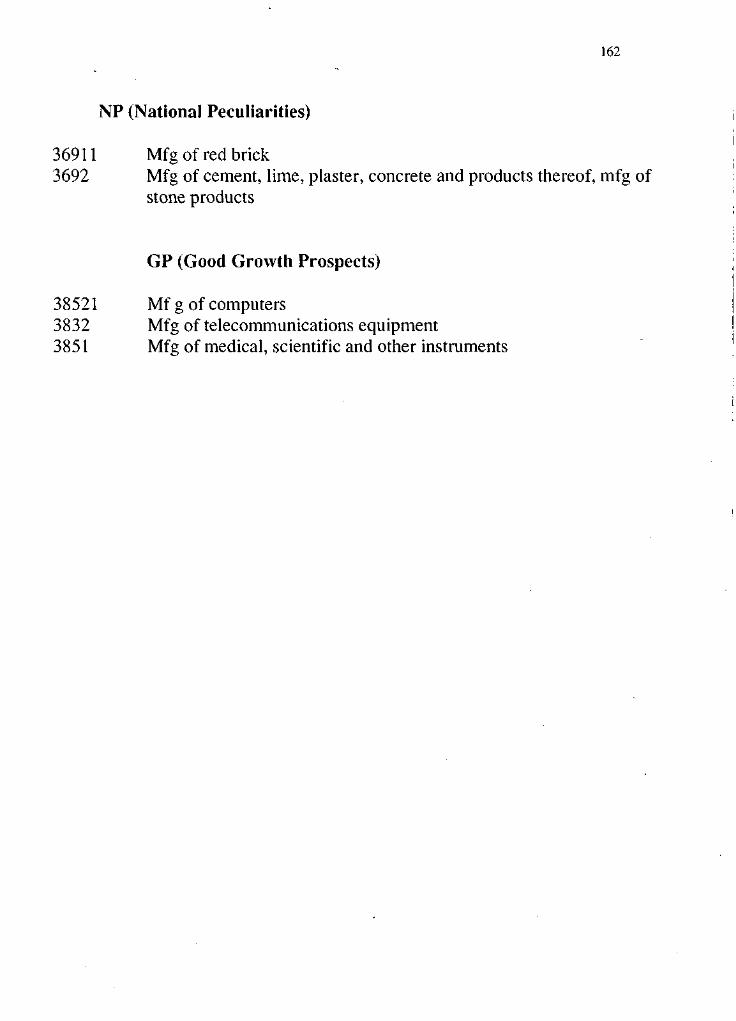
162
NP (National Peculiarities)
36911 Mfg of red brick3692 Mfg of cement, lime, plaster, concrete and products thereof, mfg of
stone products
GP (Good Growth Prospects)
38521 Mf g of computers3832 Mfg of telecommunications equipment3851 Mfg of medical, scientific and other instruments
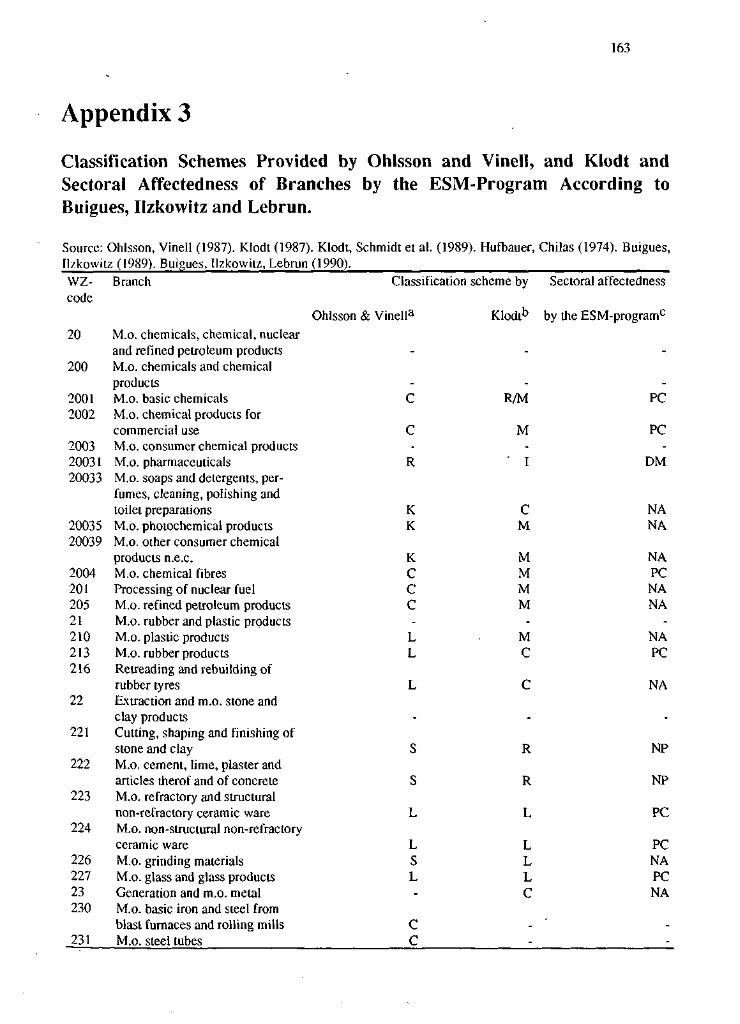
163
Appendix 3
Classification Schemes Provided by Ohlsson and Vinell, and Klodt andSectoral Affectedness of Branches by the ESM-Program According toBuigues, Ilzkowitz and Lebrun.
Source: Ohlsson, Vinell (1987). Klodt (1987). Klodt, Schmidt et al. (1989). Hufbauer, Chilas (1974). Buigues,Il/.kowitz (1989). Buigues, Ilzkowitz, Lebrun (1990).WZ- Branch Classification scheme by Sectoral affectednesscode
Ohlsson & Vinella Klodtb by the ESM-programc
20 M.o. chemicals, chemical, nuclearand refined petroleum products
200 M.o. chemicals and chemicalproducts
2001 M.o. basic chemicals C R/M PC2002 M.o. chemical products for
commercial use C M PC2003 M.o. consumer chemical products20031 M.o. Pharmaceuticals R ' I DM20033 M.o. soaps and detergents, per-
fumes, cleaning, polishing andtoilet preparations K C NA
20035 M.o. photochemical products K M NA20039 M.o. other consumer chemical
products n.e.c. K M NA2004 M.o. chemical fibres C M PC201 Processing of nuclear fuel C M NA205 M.o. refined petroleum products C M NA21 M.o. rubber and plastic products210 M.o. plastic products L • M NA213 M.o. rubber products L C PC216 Retreading and rebuilding of
rubber tyres L C NA22 Extraction and m.o. stone and
clay products221 Cutting, shaping and finishing of
stone and clay S R NP222 M.o. cement, lime, plaster and
articles therof and of concrete S R NP223 M.o. refractory and structural
non-refractory ceramic ware L L PC224 M.o. non-structural non-refractory
ceramic ware L L PC226 M.o. grinding materials S L NA227 M.o. glass and glass products L L PC23 Generation and m.o. metal - C NA230 M.o. basic iron and steel from
blast furnaces and rolling mills C -231 M.o. steel tubes C
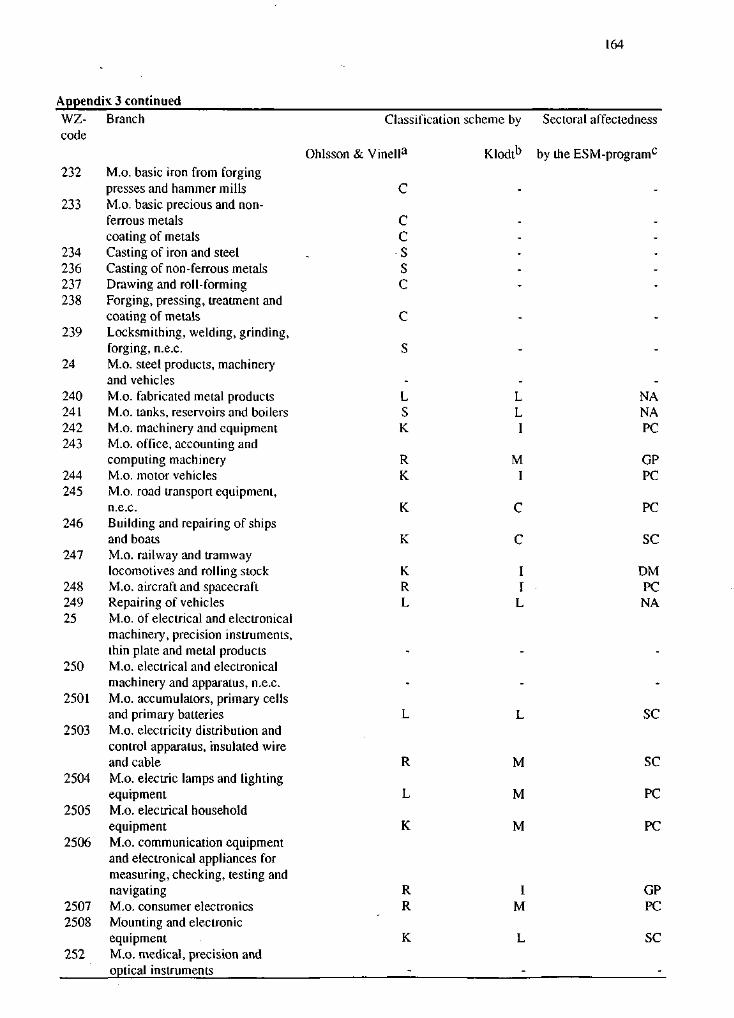
164
Appendix 3 continued
WZ- Branchcode
232 M.o. basic iron from forgingpresses and hammer mills
233 M.o. basic precious and non-ferrous metalscoating of metals
234 Casting of iron and steel236 Casting of non-ferrous metals237 Drawing and roll-forming238 Forging, pressing, treatment and
coating of metals239 Locksmithing, welding, grinding,
forging, n.e.c.24 M.o. steel products, machinery
and vehicles240 M.o. fabricated metal products241 M.o. tanks, reservoirs and boilers242 M.o. machinery and equipment243 M.o. office, accounting and
computing machinery244 M.o. motor vehicles245 M.o. road transport equipment,
n.e.c.246 Building and repairing of ships
and boats247 M.o. railway and tramway
locomotives and rolling stock248 M.o. aircraft and spacecraft249 Repairing of vehicles25 M.o. of electrical and electronical
machinery, precision instruments,thin plate and metal products
250 M.o. electrical and electronicalmachinery and apparatus, n.e.c.
2501 M.o. accumulators, primary cellsand primary batteries
2503 M.o. electricity distribution andcontrol apparatus, insulated wireand cable
2504 M.o. electric lamps and lightingequipment
2505 M.o. electrical householdequipment
2506 M.o. communication equipmentand electronical appliances formeasuring, checking, testing andnavigating
2507 M.o. consumer electronics2508 Mounting and electronic
equipment252 M.o. medical, precision and
optical instruments
Ohlsson & Vinella
Classification scheme by Sectoral affectedness
Klodt*3 by the ESM-programc
CCSSC
LSK
R
K
K
K
KRL
L
R
K
RR
K
LLI
MI
II
L
M
M
M
IM
NANAPC
GPPC
PC
SC
DMPCNA
SC
SC
PC
PC
GPPC
SC
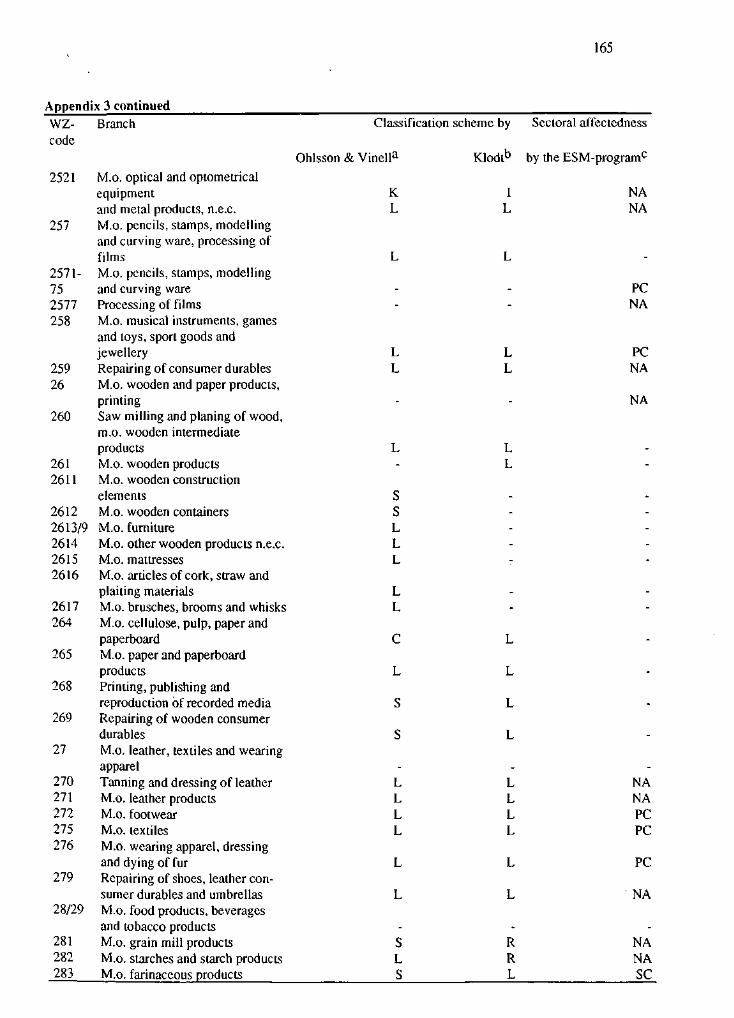
165
Appendix 3 continued
WZ- Branchcode
2521 M.o. optical and optometricalequipmentand metal products, n.e.c.
257 M.o. pencils, stamps, modellingand curving ware, processing offilms
2571- M.o. pencils, stamps, modelling75 and curving ware2577 Processing of films258 M.o. musical instruments, games
and toys, sport goods andjewellery
259 Repairing of consumer durables26 M.o. wooden and paper products,
printing260 Saw milling and planing of wood,
m.o. wooden intermediateproducts
261 M.o. wooden products2611 M.o. wooden construction
elements2612 M.o. wooden containers2613/9 M.o. furniture2614 M.o. other wooden products n.e.c.2615 M.o. mattresses2616 M.o. articles of cork, straw and
plaiting materials2617 M.o. brusches, brooms and whisks264 M.o. cellulose, pulp, paper and
paperboard265 M.o. paper and paperboard
products268 Printing, publishing and
reproduction of recorded media269 Repairing of wooden consumer
durables27 M.o. leather, textiles and wearing
apparel270 Tanning and dressing of leather271 M.o. leather products272 M.o. footwear275 M.o. textiles276 M.o. wearing apparel, dressing
and dying of fur279 Repairing of shoes, leather con-
sumer durables and umbrellas28/29 M.o. food products, beverages
and tobacco products281 M.o. grain mill products282 M.o. starches and starch products283 M.o. farinaceous products
Classification scheme by Sectoral affectedness
Ohlsson & Vinella
KL
LL
L
SSLLL
LL
L
LLLL
IL
LL
LL
LLLL
sLS
RRL
by the ESM-programc
NANA
PCNA
PCNA
NA
NANAPCPC
PC
NA
NANA
sc
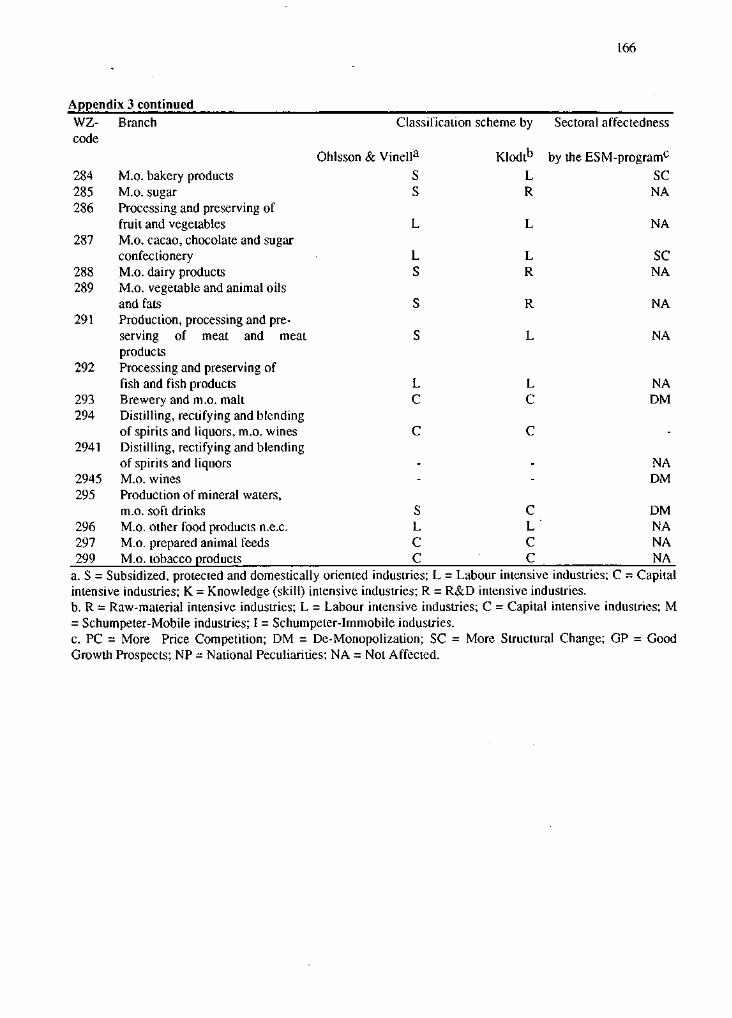
166
Appendix 3 continuedWZ-code
284285286
287
288289
291
292
293294
2941
2945295
296297299
Branch
M.o. bakery productsM.o. sugarProcessing and preserving offruit and vegetablesM.o. cacao, chocolate and sugarconfectioneryM.o. dairy productsM.o. vegetable and animal oilsand fatsProduction, processing and pre-serving of meat and meatproductsProcessing and preserving offish and fish productsBrewery and m.o. maltDistilling, rectifying and blendingof spirits and liquors, m.o. winesDistilling, rectifying and blendingof spirits and liquorsM.o. winesProduction of mineral waters,m.o. soft drinksM.o. other food products n.e.c.M.o. prepared animal feedsM.o. tobacco products
Classification
Ohlsson & Vinella
SS
L
LS
S
S
LC
C
--
sLCC
scheme by
Klodtb
LR
L
LR
R
L
LC
C
--
cLCC
Sectoral affectedness
by the ESM-programc
SCNA
NA
SCNA
NA
NA
NADM
-
NADM
DMNANANA
a. S = Subsidized, protected and domestically oriented industries; L = Labour intensive industries; C = Capitalintensive industries; K = Knowledge (skill) intensive industries; R = R&D intensive industries.b. R = Raw-material intensive industries; L = Labour intensive industries; C = Capital intensive industries; M= Schumpeter-Mobile industries; I = Schumpeter-Immobile industries.c. PC = More Price Competition; DM = De-Monopolization; SC = More Structural Change; GP = GoodGrowth Prospects; NP = National Peculiarities; NA = Not Affected.
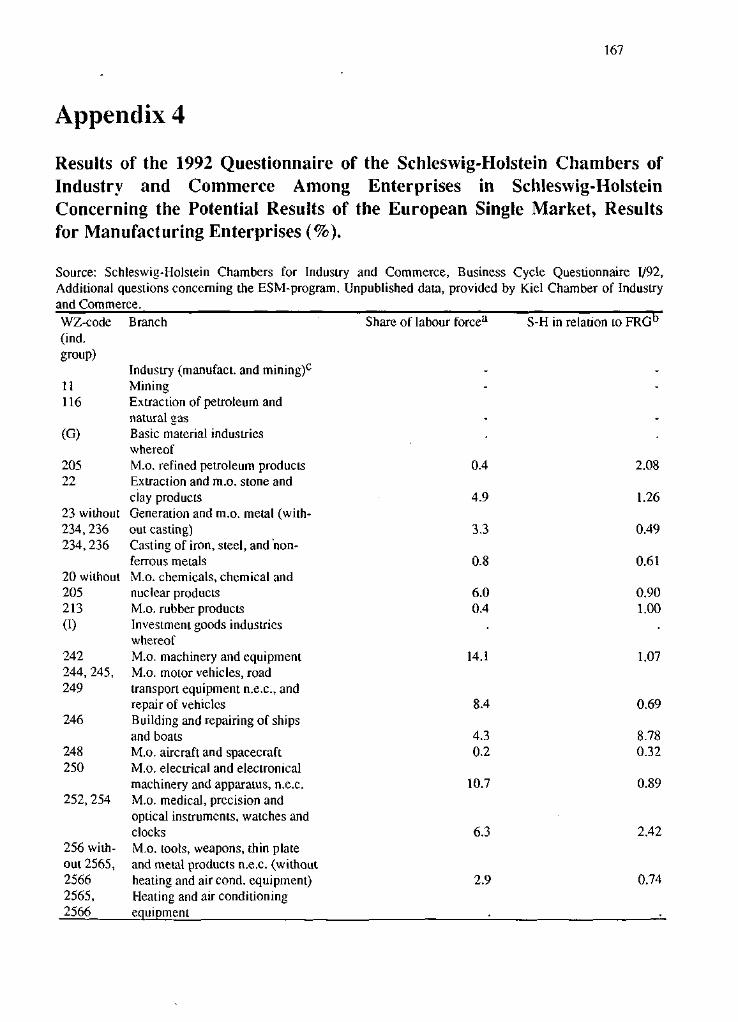
167
Appendix 4
Results of the 1992 Questionnaire of the Schleswig-Holstein Chambers ofIndustry and Commerce Among Enterprises in Schleswig-HolsteinConcerning the Potential Results of the European Single Market, Resultsfor Manufacturing Enterprises (%).
Source: Schleswig-Holstein Chambers for Industry and Commerce, Business Cycle Questionnaire 1/92,Additional questions concerning the ESM-program. Unpublished data, provided by Kiel Chamber of Industryand Commerce.
Share of labour forcea S-H in relation to FRG"WZ-code(ind.group)
11116
(G)
20522
23 without234,236234,236
20 without205213(I)
242244, 245,249
246
248250
252, 254
256 with-out 2565,25662565,2566
Branch
Industry (manufact. and mining)0
MiningExtraction of petroleum andnatural gasBasic material industrieswhereofM.o. refined petroleum productsExtraction and m.o. stone andclay productsGeneration and m.o. metal (with-out casting)Casting of iron, steel, and non-ferrous metalsM.o. chemicals, chemical andnuclear productsM.o. rubber productsInvestment goods industrieswhereofM.o. machinery and equipmentM.o. motor vehicles, roadtransport equipment n.e.c, andrepair of vehiclesBuilding and repairing of shipsand boatsM.o. aircraft and spacecraftM.o. electrical and electronicalmachinery and apparatus, n.e.c.M.o. medical, precision andoptical instruments, watches andclocksM.o. tools, weapons, thin plateand metal products n.e.c. (withoutheating and air cond. equipment)Heating and air conditioningequipment
0.4
4.9
3.3
0.8
6.00.4
14.1
8.4
4.30.2
10.7
6.3
2.9
2.08
1.26
0.49
0.61
0.901.00
1.07
0.69
8.780.32
0.89
2.42
0.74
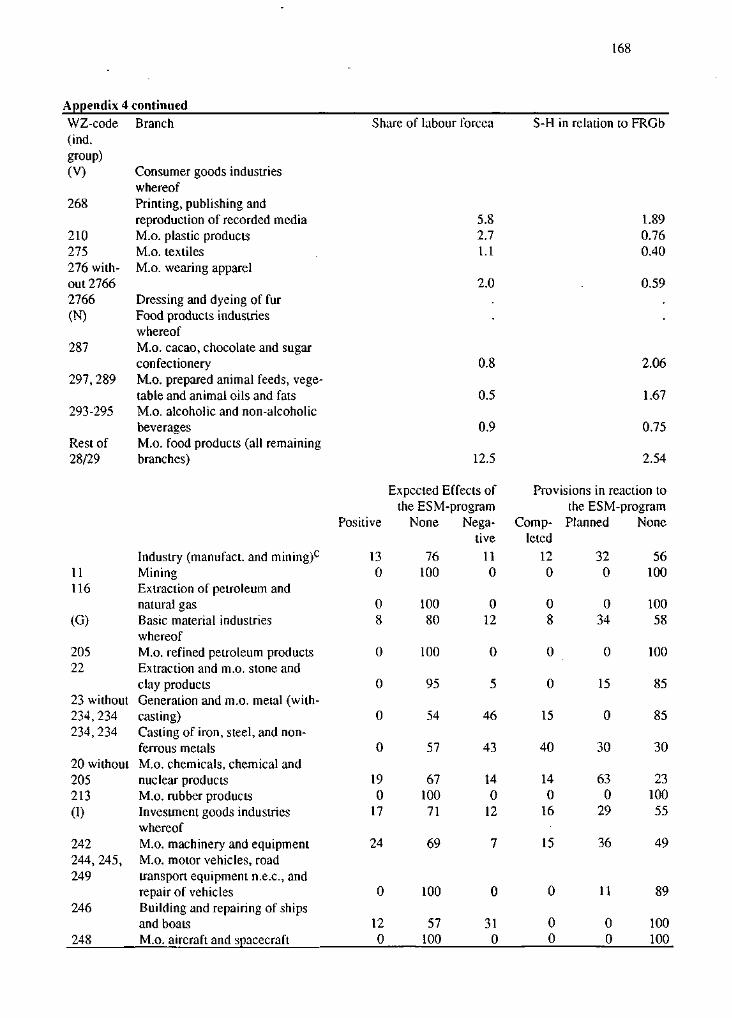
168
Appendix 4 continuedWZ-code(ind.group)(V)
268
210275276 with-out 2766
Branch
Consumer goods industrieswhereofPrinting, publishing andreproduction of recorded mediaM.o. plastic productsM.o. textilesM.o. wearing apparel
Share of labour forcea S-H in relation to FRGb
2766(N)
287
297, 289
293-295
Rest of28/29
Dressing and dyeing of furFood products industrieswhereofM.o. cacao, chocolate and sugarconfectioneryM.o. prepared animal feeds, vege-table and animal oils and fatsM.o. alcoholic and non-alcoholicbeveragesM.o. food products (all remainingbranches)
Industry (manufact. and mining)0
11 Mining116 Extraction of petroleum and
natural gas(G) Basic material industries
whereof205 M.o. refined petroleum products22 Extraction and m.o. stone and
clay products23 without Generation and m.o. metal (with-234,234 casting)234, 234 Casting of iron, steel, and non-
ferrous metals20 without M.o. chemicals, chemical and205 nuclear products213 M.o. rubber products(I) Investment goods industries
whereof242 M.o. machinery and equipment244, 245, M.o. motor vehicles, road249 transport equipment n.e.c, and
repair of vehicles246 Building and repairing of ships
and boats248 M.o. aircraft and spacecraft
Positive
5.82.71.1
2.0
1.890.760.40
0.59
0.8
0.5
0.9
12.5
2.06
1.67
0.75
2.54
Expected Effects of Provisions in reaction tothe ESM-program the ESM-program
None Nega- Comp- Planned Nonetive letcd
130
08
0
0
0
0
190
17
76100
10080
100
95
54
57
6710071
110
012
0
5
46
43
140
12
120
08
0
0
15
40
140
16
320
034
0
15
0
30
630
29
56100
10058
100
85
85
30
2310055
24 69
100
15 36
11
49
89
120
57100
310
00
00
100100
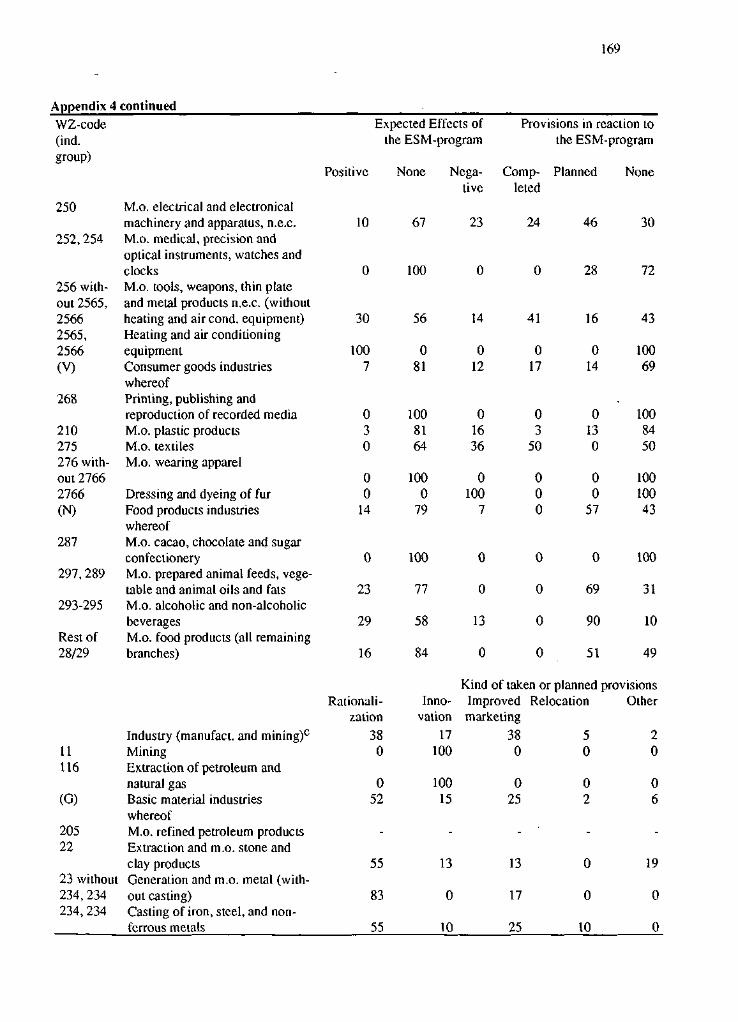
169
Appendix 4 continued
WZ-code(ind.group)
250
252,254
256 with-out 2565,25662565,
Expected Effects ofthe ESM-program
Positive None Nega-tive
Provisions in reaction tothe ESM-program
Comp- Plannedleted
M.o. electrical and electronicalmachinery and apparatus, n.e.c.M.o. medical, precision andoptical instruments, watches andclocksM.o. tools, weapons, thin plateand metal products n.e.c. (withoutheating and air cond. equipment)Heating and air conditioning
10
30
67
100
56
23 24
14 41
46
28
16
None
30
72
43
2566(V)
268
210275276 with-out 27662766(N)
287
297,289
293-295
Rest of28/29
11116
(G)
20522
23 without234,234234, 234
equipmentConsumer goods industrieswhereofPrinting, publishing andreproduction of recorded mediaM.o. plastic productsM.o. textilesM.o. wearing apparel
Dressing and dyeing of furFood products industrieswhereofM.o. cacao, chocolate and sugarconfectioneryM.o. prepared animal feeds, vege-table and animal oils and fatsM.o. alcoholic and non-alcoholicbeveragesM.o. food products (all remainingbranches)
Industry (manufact. and mining)c
MiningExtraction of petroleum andnatural gasBasic material industrieswhereofM.o. refined petroleum productsExtraction and m.o. stone andclay productsGeneration and m.o. metal (with-out casting)Casting of iron, steel, and non-ferrous metals
1007
030
00
14
0
23
29
16
Rationali-zation
380
052
-
55
83
55
081
1008164
1000
79
100
77
58
84
Inno-vation
17100
10015
-
13
0
10
012
01636
0100
7
0
0
13
0
017
03
50
000
0
0
0
0
014
0130
00
57
0
69
90
51
Kind of taken or plannedImprovedmarketing
380
025
-
13
17
25
Relocation
50
02
-
0
0
10
10069
1008450
10010043
100
31
10
49
provisionsOther
20
06
-
19
0
0
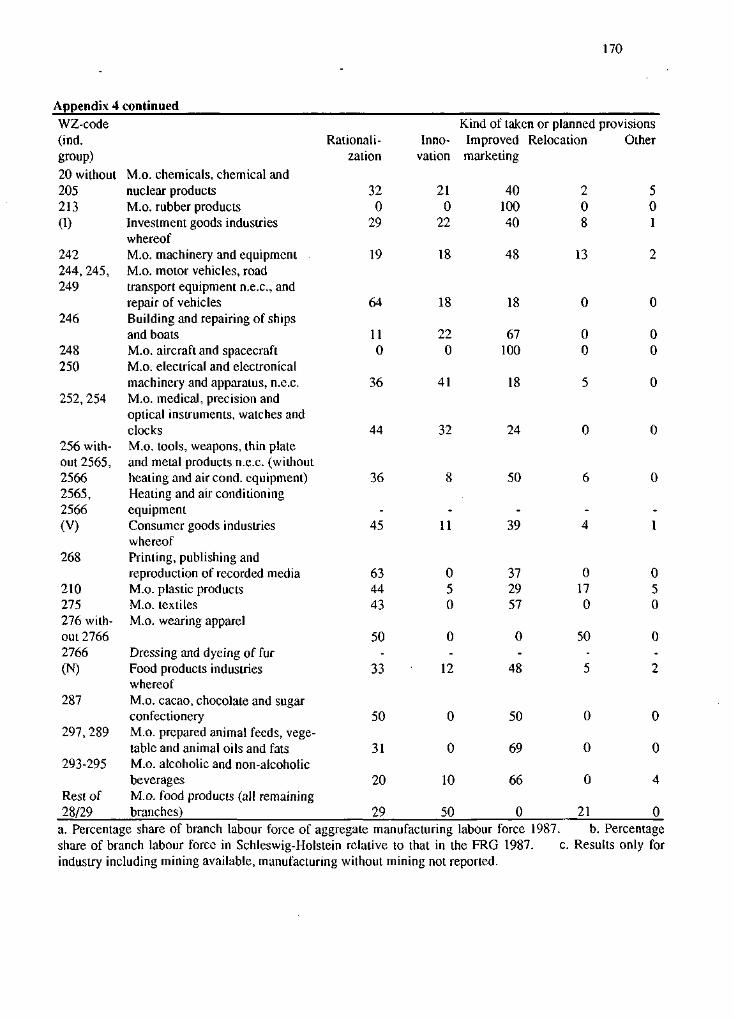
170
Appendix 4 continued
WZ-code(ind.group)20 without205213(I)
242244,245,249
246
248250
252, 254
M.o. chemicals, chemical andnuclear productsM.o. rubber productsInvestment goods industrieswhereofM.o. machinery and equipmentM.o. motor vehicles, roadtransport equipment n.e.c, andrepair of vehiclesBuilding and repairing of shipsand boatsM.o. aircraft and spacecraftM.o. electrical and electronicalmachinery and apparatus, n.e.c.M.o. medical, precision andoptical instruments, watches andclocks
Rationali-zation
320
29
19
64
110
36
44
Kind of taken or planned provisionsInno- Improved Relocation Other
vation marketing
210
22
18
18
220
41
32
4010040
48
18
67100
18
24
20
13
00
501
00
256 with-out 2565,25662565,2566(V)
268
210275276 with-out 27662766(N)
287
297, 289
293-295
Rest of28/29
M.o. tools, weapons, thin plateand metal products n.e.c. (withoutheating and air cond. equipment)Heating and air conditioningequipmentConsumer goods industrieswhereofPrinting, publishing andreproduction of recorded mediaM.o. plastic productsM.o. textilesM.o. wearing apparel
Dressing and dyeing of furFood products industrieswhereofM.o. cacao, chocolate and sugarconfectioneryM.o. prepared animal feeds, vege-table and animal oils and fatsM.o. alcoholic and non-alcoholicbeveragesM.o. food products (all remainingbranches)
36
-45
634443
50-
33
50
31
20
29
8
-11
050
0-
12
0
0
10
50
50
-39
372957
0-
48
50
69
66
0
6
-4
0170
50-5
0
0
0
21
0
-1
050
0-2
0
0
4
0a. Percentage share of branch labour force of aggregate manufacturing labour force 1987. b. Percentageshare of branch labour force in Schleswig-Holstein relative to that in the FRG 1987. c. Results only forindustry including mining available, manufacturing without mining not reported.