The Atlas of Islamic World Science and Innovation Final Report
50
The Atlas of Islamic World Science and Innovation Final Report
-
Upload
khangminh22 -
Category
Documents
-
view
3 -
download
0
Transcript of The Atlas of Islamic World Science and Innovation Final Report

The Atlas of Islamic World Science and Innovation Final Report

The Atlas of Islamic World Science and Innovation is supported by an international consortium of partners listed below.
The views outlined in this report do not necessarily reflect the policy position of these partner organisations.
Cover image: An Arabian style mosaic.

The Atlas of Islamic World Science and Innovation Final Report
Project Representatives Professor Savaş Alpay, Director General, SESRIC Dr Julie Maxton, Executive Director, Royal Society
Project team Luke Clarke, Senior Policy Adviser, Royal Society Hakan Huseyin Eryetli, Director of IT and Publications, SESRIC Zehra Zümrüt Selçuk, Senior Researcher, SESRIC

ISBN: 978-1-78252-005-4
NonCommercial-NoDerivs 3.0 Unported License. To view a copy of this license, visit http://creativecommons.org/licenses/by-nc-nd/3.0/ or send a letter to Creative Commons, 171 Second Street, Suite 300, San Francisco, California, 94105, USA.

Foreword 7
Executive Summary 8
Recommendations 9
Introduction 11
1 Science and Technology in the OIC: Current Status and Future Prospects 14
1.1 The Overall Picture 14
1.2 A Brief Snapshot of Science and Innovation across the Islamic World 15
2 Inputs to Science and Technology in the OIC 19
2.1 Funding 19
Figure 2.1 Gross Expenditure on Research and Development (GERD), % of World Total (most recent year available 2000–2011) 19
Figure 2.2 GERD as a percentage of GDP in OIC Member Countries 20
2.1.1 Funding by Sector 21
Figure 2.3 Distribution of GERD by Source of Funds (most recent year available between 2000–2011) 22
Figure 2.4 Distribution of GERD in OIC Member Countries by Source of Funds 23
Figure 2.5 Distribution of GERD by Sector of Performance (most recent year available between 2000–2011) 24
Figure 2.6 Distribution of GERD in OIC Member Countries by Sector of Performance 25
Figure 2.7a/b Higher Education Expenditure on R&D in OIC Countries (% of GDP) 27
Figure 2.8 Higher Education Expenditure on R&D in OIC Countries (in current million PPP $) 28
2.1.2 Foreign Direct Investment 28
Figure 2.9 Foreign Direct Investment (FDI) Inflows across the OIC (Billion USD, 2012) 292.2 Researchers 30
Figure 2.10 Researchers (Head Count) in OIC Member Countries 31
Contents | 5

6 | The Atlas of Islamic World Science and Innovation Final Report
3 Outputs from Science and Technology in the OIC 32
3.1 Publications 32
Figure 3.1 Distribution of Global Publications (2000–2012) 32
Figure 3.2 Total Number of Publications in OIC Member Countries*, 2012 33
3.3 Patents 34
Figure 3.3 Total Patent Applications in the World by Filing Office (most recent year available between 2000–2011) 35
Figure 3.4 Total Patent Applications in OIC Member Countries by Filing Office 36
Figure 3.5 Total Patent Grants in the World by Filing Office 37
Figure 3.6 Total Patent Grants in OIC Member Countries by Filing Office 38
3.4 High-Technology Exports (HTE) 39
Figure 3.7 High-Technology Exports in OIC Member Countries 39
4 Conclusions and recommendations 40
Appendix A: Technical Note 42
Appendix B: Acronyms 43
Appendix C: Definitions 44
Appendix D: Classification of Countries 48
Acknowledgements 49

Foreword | 7
Foreword Foreword from His Excellency Iyad Ameen Madani, Secretary General of the Organization of Islamic Cooperation (OIC)
I am pleased to see the launch of the Final Report marking the completion of the Atlas of Islamic World Science and Innovation project. The Atlas project has been a unique initiative based on collaboration between
institutions across the Islamic world and partners in Europe and northern America (Canada). The objective of the project has been to map key trends and trajectories in science and technology-based innovation in selected OIC Member States and thus facilitate formulation of evidence-based Science, Technology and Innovation (STI) policy in these countries.
The crucial role of education, science, technology and innovation in addressing the contemporary global challenges of poverty, disease, environmental degradation, climate change, energy, food and water security, can hardly be over emphasized. For this reason, acquisition and popularization of knowledge, enhancing and developing science, technology and innovation; and encouraging research and cooperation among Member States in these fields, figure highly among the objectives of the OIC Charter. The promotion of science, technology and innovation hinges upon STI policies that are founded on realistic and accurate assessment, foresight and planning. Hence the Atlas project is seen as one of the key instruments for the realization of the objectives of the Charter and broader OIC development agenda.
I congratulate the project managers, SESRIC and the Royal Society, and all other project partners i.e. IDB, COMSTECH, ISESCO, British Council, Nature, Qatar Foundation and the International Development Research Centre (IDRC) from Canada for the successful completion of country reports on Egypt, Indonesia, Jordan, Kazakhstan and Malaysia and this final overview. It is my hope that the Atlas project will serve as a model for initiating broader partnerships in Science, Technology and Innovation between the OIC Member States and other partners.
STI assessment, foresight and planning is not a one-time effort. It has to be a continuous process to provide evidence based inputs for policy makers for effective planning. I, therefore, urge the relevant OIC institutions to apply the experience gained and lessons learned during the Atlas project and coordinate for the initiation of such reports covering all the OIC Member States. Such a report should map innovations in all the OIC countries after regular intervals of every 3–4 years. I am confident that the process will help strengthen the STI capabilities and foster a culture of science, innovation and entrepreneurship in our societies.

8 | The Atlas of Islamic World Science and Innovation Final Report
Executive Summary• The Islamic world, as defined by the 57 member states of the Organisation
of Islamic Cooperation (OIC), is a country grouping of considerable diversity, encompassing some of the world’s richest and poorest countries. Unsurprisingly, there are considerable disparities in terms of scientific and technological output and development within the group.
• Overall, scientific investment and productivity across the OIC, as measured by R&D expenditure and numbers of publications/patents, is lower than might be expected relative to its population size. The OIC has nearly a quarter of the world’s population, 2.4% of its research expenditure, 1.6% of its patents and 6% of its publications. The OIC has an ambitious vision to address this ‘knowledge gap’, but considerable progress will be required in order to achieve it.
• Many OIC countries have, however, demonstrated rapid growth on a number of science and technology indicators, sometimes from a low base.
• Tunisia, Malaysia, Turkey and Iran are the biggest spenders on R&D in the OIC, while Tunisia, Jordan, Turkey and Iran have the highest numbers of researchers as a proportion of their populations. Turkey and Iran also publish nearly half of the OIC’s scientific papers, while Iran applies for, and is granted, the most patents.
• Malaysia is the leading OIC country in terms of high-technology exports, accounting for over 80% of the OIC total and is also the OIC’s third most prolific publisher of academic articles.
• The R&D expenditure and performance of the OIC countries are, on average, proportionally more dependent on the government and higher education sectors than the average figures for equivalent non-OIC countries in similar income brackets.
• Some of the wealthiest countries in the OIC still have low levels of R&D expenditure, despite recent high-profile investments such as the new universities and campuses that have been built in the Gulf states in the early 21st century.

Executive Summary and Recommendations | 9
Recommendations• More OIC countries need to draw up science and technology policies to
address national and international challenges and contribute to national socioeconomic development. Science and technology should be supported at the highest level in order to address critical issues such as food, water and energy security, as well as sustainable and equitable socioeconomic development.
• International scientific collaboration needs to be strengthened and promoted. The OIC is a diverse group of countries with many shared and common challenges. As many OIC nations’ R&D expenditures are low, pooling these scarce resources to more effectively meet these challenges should be encouraged. Collaboration within the OIC and with the rest of the world will also enhance the quality of scientific research, accelerate access to new markets, and allow the financial costs of research to be shared.
• More investment in R&D is needed. The OIC as a whole currently under-invests in R&D relative to its population. OIC countries account for nearly a quarter of the world’s population but contribute just 2.4% of the world’s total R&D expenditure.
• More private sector investment in R&D is required. There is currently a lower level of private sector investment in R&D in the OIC as a whole compared to the rest of the world, and in some OIC countries it is virtually non-existent.
• More investment in human capital is needed. The OIC currently only provides a small proportion of the world’s researchers relative to its population, at just over 10%. Along with increased investment in R&D, every effort should be made by OIC countries to build up institutional and human scientific capacity in order to benefit properly from any such expenditure.
• More OIC countries need to measure science, technology and innovation indicators. No data exist for over half the OIC countries on such crucial indicators as how much they spend on R&D, or the number of researchers in their countries. The OIC should urgently prioritise the measurement, monitoring and publication of these figures, to enable effective monitoring of national science policies and to measure progress against objectives such as those set out in Vision 1441H, the OIC’s fifteen year plan for scientific and technological development.
• Robust intellectual property (IP) regimes should be introduced and/or strengthened in order to protect the creative output of scientists, increase the number of patents filed and granted in the OIC, and strengthen links between research outputs and industry.

10 | The Atlas of Islamic World Science and Innovation Final Report
• The OIC member countries should focus on fostering scientific excellence and high quality research. The OIC’s share of global publications is relatively small, at nearly 6%. Additionally, patenting activity across the OIC is low, with just 1.7% of global patents filed and 1.5% of patents granted. Furthermore, the vast majority of the high-technology exports of the OIC are delivered by Malaysia, with the other OIC countries contributing less than a fifth of the total. Robust peer review systems, merit-based academic career structures, incentives which encourage the commercialisation of research, and research evaluation programmes should be established and/or supported across the OIC to ensure that further investment leads to research excellence.
Country-specific recommendations• OIC countries rich in natural resources should set up dedicated endowment
funds for science and technology. Many Gulf states such as Saudi Arabia, Qatar and the United Arab Emirates have already put significant effort into transforming themselves into knowledge economies and there are signs that investment is increasing in countries such as Kazakhstan. However, overall expenditure on R&D as a percentage of GDP for these countries remains relatively low, which suggests that more of this wealth could be channelled directly into supporting high-quality research.
• Collaboration should be encouraged between resource-rich but underpopulated OIC countries and those countries where the reverse applies. The young and talented populations in many OIC countries, when combined with the considerable wealth of the OIC’s emerging powers, could be a formidable combination if utilised correctly.
• The OIC’s more established scientific nations, such as Turkey, Tunisia, Iran and Egypt, should offer their expertise, guidance and insights to less-well developed OIC countries, which can learn much from their experiences of recent rapid growth.

1 Obama B (2009). Remarks by the President On A New Beginning. Speech by US President Barack Obama at Cairo University, June 4, 2009.
2 Friedman T (2004). The Secret of Our Sauce. New York Times, March 7 2004.
Introduction and summary | 11
Introduction“As a student of history, I also know civilization’s debt to Islam. It was Islam – at places like Al-Azhar – that carried the light of learning through so many centuries, paving the way for Europe’s Renaissance and Enlightenment. It was innovation in Muslim communities that developed the order of algebra; our magnetic compass and tools of navigation; our mastery of pens and printing; our understanding of how disease spreads and how it can be healed.”
US President Barack Obama, Cairo, Egypt, 20091
Most analyses of the status of science in the Islamic world tend to take two starting points: the rich heritage of the ‘golden age’ of Islamic civilisation between the mid-8th to the mid-13th centuries; and the ‘scientifically lagging’ status of science in the Islamic world today. The ancient and modern positions are frequently compared and contrasted. Many theories have been put forward to account for the apparent decline and a number of historical, political, cultural and economic factors have been suggested as possible explanations. To reverse this trend, a climate that is supportive of science and technology is needed. Freedom of thought, independent thinking, measures to address ‘brain drain’, supportive government and competitive financial markets have been described as essential elements of such a climate.2
This report is concerned with the current status of science in the Islamic world. It takes the form of a statistics-based analysis of science, technology and innovation indicators across the 57 member countries of the Organisation of Islamic Cooperation (OIC), which are used in this report as a proxy for the Islamic world. These member states self-identify as part of the Islamic world through their membership of the OIC, although they do not always have Muslim-majority populations, and such a definition also excludes non-OIC countries with large Muslim populations such as India or Russia. With this caveat, the phrase “Islamic world” is used as shorthand for the OIC member countries, collectively.
The report is based on available data from authoritative international sources such as the United Nations Educational, Scientific and Cultural Organization (UNESCO), the United Nations Conference on Trade and Development (UNCTAD), the World Bank, and the World Intellectual Property Organization (WIPO). The indicators

12 | The Atlas of Islamic World Science and Innovation Final Report
3 OECD (2002). Frascati Manual: Proposed Standard Practice for Surveys on Research and Experimental Development, 6th edition. The Frascati Manual identifies researchers as “professionals engaged in the conception or creation of new knowledge, products, processes, methods and systems
and also in the management of the projects concerned”. Researchers are measured by UNESCO in two ways: according to headcount (HC) or full time equivalent (FTE). This report uses HC, which reflects the total number of people involved in research. HC data coverage is more comprehensive and covers
a wider range of countries than FTE data. See Appendix C for a more detailed definition of how these indicators are calculated. Organisation for Economic Cooperation and Development (OECD): Paris, France.
included are expenditure on research and development (R&D, see Appendix C); R&D intensity (R&D expenditure as a percentage of GDP), numbers of researchers,3 publications and patents.
This report represents the culmination of the Atlas of Islamic World Science and Innovation project, which has brought together diverse partners from Europe, North America and the Islamic world to explore the changing dynamics of science and innovation in a wide range of countries with large Muslim populations in the Middle East, Africa and Asia. It has done so at a time of momentous political change, the implications of which for science and technology are far from certain.
This report is composed of three parts. The first part of the report examines some key data which highlight the current overall status of science and technology across the OIC, before embarking on a brief “tour” of the scientific diversity of the individual countries of the OIC through a series of short snapshots.
The second and third parts seek to map the overall health of science and technology across the OIC more systematically, by concentrating on specific inputs to, and outputs from, science and technology. They are based on the following six science, technology and innovation indicators:
Inputs to science and technology in the OIC• Funding
• Foreign Direct Investment (FDI)
• Researchers
Outputs from science and technology in the OIC• Publications
• Patents
• High-technology Exports (HTE)

Introduction and summary | 13
4 Country case studies have been published for Egypt, Jordan, Indonesia, Kazakhstan and Malaysia. See http://www.aiwsi.org and http://royalsociety.org/policy/projects/atlas-islamic-world/
5 These classifications do not necessarily reflect development status, and these terms are only used as convenient shorthand to enable appropriate comparisons. Please see the appendix for the list of countries, or http://www.imf.org
6 See Rosling H (2013). The River of Myths. TED Talk, February 2014. TED Conferences: New York, NY, USA.
These data and indicators, which form the basis of this analysis, can only provide a partial reflection of the state and vitality of science and innovation in the Islamic world. The scientific enterprise does not exist in a vacuum. Other important factors describe and influence science and can enable or prevent scientific enquiry from flourishing. These include: the freedom of scientists to pursue and publish their research as they see fit; the ability of scientists to collaborate freely; the provision of robust and independent scientific advice to government; understanding of the scientific enterprise by government; the political will to ensure that scientific enterprise can flourish; investment in scientists as well as investments in infrastructure; access to venture capital; the provision of evidence-based education and learning; a climate conducive to entrepreneurship; a focus on research excellence; and a society supportive of free scientific enquiry. These are critical elements of strong and healthy science and innovation ecosystems. Although not part of the scope of this final report, individual country case studies prepared as part of the Atlas of Islamic World Science and Innovation project offer a more in-depth analysis of how some OIC countries might develop their scientific and technological capabilities.4
A note on the dataWhere possible, comparisons are made using classifications of ‘developing’ and ‘developed’ countries. Where these terms are used, the International Monetary Fund (IMF) classifications are used for emerging and advanced economies.5 As OIC countries are all classified as ‘developing’ by these measures, such comparisons between the OIC and the rest of the ‘developing’ bloc are simplified. It should be noted, however, that there is a growing school of thought which argues that the differences between ‘developing’ and ‘developed’ countries are diminishing.6

14 | The Atlas of Islamic World Science and Innovation Final Report
7 OIC (2003). Vision 1441H: Declaration On Science And Technology For Economic Well-being Of The Ummah. Organisation of Islamic Cooperation: Jeddah, Saudi Arabia. ‘1441’ in the Islamic or Hijri calendar (hence the ‘H’) equates to the year 2020 in the Gregorian calendar.
8 OIC (2005). Ten Year Programme of Action to Meet the Challenges Facing the Muslim Ummah in the 21st Century. Organisation of Islamic Cooperation: Jeddah, Saudi Arabia.
9 Data from SESRIC (2013). SESRIC – The Statistical, Economic and Social Research and Training
Centre for Islamic Countries: Ankara, Turkey.
10 SESRIC (2012). Current Stance of Science and Technology in OIC Countries. SESRIC – The Statistical, Economic and Social Research and Training Centre for Islamic Countries: Ankara, Turkey.
1 Science and Technology in the OIC: Current Status and Future Prospects1.1 The Overall Picture“Two primary findings can be highlighted about the state of science and technology in OIC countries. First, major indicators on research and scientific development display a large disparity within the OIC Countries. Second, the OIC Members, individually or as a group, lag far behind the rest of the world, particularly the developed countries, with a few exceptions.”
Professor Savaş Alpay, Director General of SESRIC, Kuala Lumpur, Malaysia, 2010
In its “Vision 1441H”, a 15 year plan for scientific and technological development, the OIC acknowledged that “the Muslim world is facing a knowledge gap because of its deficiency in science, technology and innovation”, and set itself an ambition of achieving 14% of the world’s scientific output by 2020, and 1.4% of GDP spent on R&D by 2020.7 This was complemented by a Ten Year Programme of Action, launched in 2005, which pledged to prioritise science and technology and called upon member states to spend 1% of GDP on R&D by 2015.8
The scale of the challenge facing the OIC in seeking to re-establish the Islamic world as a centre of scientific and technological excellence is recognised. The main factors leading to the ‘knowledge gap’ described above (i.e. the uneven distribution of knowledge among countries) can be summarised as follows:
• The 57 member countries of the OIC comprise almost one quarter of the world population, yet contribute 2.4% of world total expenditure on R&D.9
• OIC countries are also some way short of the world average in terms of researchers (HC) per million people, at just 457 versus 1,549 respectively.10 Nearly half of the R&D expenditure in the OIC comes from government and just over a third from business enterprise. This is proportionately much less from business, and more from government, than the world average – arguably demonstrating a relatively weak private sector R&D performance.

Science and Technology in the OIC: Current Status and Future Prospects | 15
11 Forbes (2012). The World’s Richest Countries. Forbes magazine, 22 February 2012.
12 Based on purchasing power parity (PPP). See SESRIC (2012). Annual Economic Report on the OIC Countries 2012. SESRIC – The Statistical, Economic and Social Research and Training Centre for Islamic Countries: Ankara, Turkey.
13 Source: UNDP (2014). See http://hdr.undp.org/en/ United Nations
Development Programme: New York, NY, USA.
14 However, this is not the lowest share of research expenditure as a percentage of GDP within the OIC.
15 Source: UNESCO Institute for Statistics (2013).Data in current PPP $. See Appendix C for definitions.
16 JRC (2011). Erawatch Country Reports: Turkey. Joint Research Centre: Seville, Spain.
17 Royal Society (2011). Knowledge, networks and nations: global scientific collaboration in the 21st century. Royal Society: London, UK.
18 Royal Society (2011). Knowledge, networks and nations: global scientific collaboration in the 21st century. Royal Society: London, UK.
19 TÜBİTAK (2010). Science, Technology and Innovation in Turkey. The Scientific and Technological Research Council of Turkey (TÜBİTAK): Ankara, Turkey.
Other factors such as academic freedom, quality of infrastructure, a good education system, and the extent to which legal frameworks protect intellectual property rights, can contribute to narrowing the knowledge gap.
1.2 A Brief Snapshot of Science and Innovation across the Islamic World“Where is the wisdom we have lost in knowledge? Where is the knowledge we have lost in information?”
T.S. Eliot, The Rock, 1934
Before embarking upon this analysis, it is important to note the “large disparity within the OIC countries” mentioned in Professor Savaş Alpay’s quote at the start of this chapter. The 57 member countries of the OIC are very diverse in geography, demography, politics, wealth, resources and levels of development. Discussion of the OIC as a whole in this report is therefore undertaken with this caveat in mind.
The geographic diversity of the OIC member countries is apparent when considering the wide area of the globe over which they are dispersed. It encompasses four continents and stretches from Kazakhstan in the north to Mozambique in the south and from Guyana in the west to Indonesia in the east.
The OIC’s economic diversity is demonstrated by the fact that it includes Qatar (recently named as the world’s richest country by Forbes magazine,11 with its GDP per capita recently estimated at US$102.9k – nearly 19 times the OIC average)12 and Niger, which is ranked 187th on the Human Development Index (HDI) with GDP per capita of US$884.13 The lowest gross expenditure on R&D (GERD) in the OIC for which figures are available is Gambia with spending of US$ 4.28 million that accounted for 0.13% of its GDP on R&D in 2011.14 Turkey is the leading OIC country in this regard, with US$10 billion GERD in 2011.15
Turkey is also one of the leading OIC countries as measured by many important STI indicators. It has the highest number of researchers (HC) at 124,796, the fourth highest proportion of researchers (HC) per million inhabitants (1,729), and the third highest proportion of GDP spent on R&D (0.84%).16 The improvement of Turkey’s scientific performance in recent years has taken place at a rate which almost rivals that of China.17 The Turkish government’s spending on R&D increased nearly six-fold between 1995 and 2007.18 In the same period, the proportion of Turkey’s GDP spent on R&D more than doubled from 0.37% to 0.85% and the number of researchers tripled,19 while it increased its publication output four-fold.

16 | The Atlas of Islamic World Science and Innovation Final Report
20 TÜBİTAK (2010). Science, Technology and Innovation in Turkey. The Scientific and Technological Research Council of Turkey (TÜBİTAK): Ankara, Turkey.
21 Source: UNESCO Institute for Statistics (2013).
22 Source: The Agency of Statistics of the Republic of Kazakhstan (2014).
23 Day N and Muhammad A (2011). Malaysia: The Atlas of Islamic World Science and Innovation Country Case Study No. 1.
24 UNESCO (2010). UNESCO Science Report 2010. United Nations Educational Scientific and Cultural Organization: Paris, France.
25 Day N and Muhammad A (2011). Malaysia: The Atlas of Islamic World Science and Innovation Country Case Study No. 1.
26 Deloitte (2011). Global Survey of R&D Tax Incentives. Deloitte LLP: London, UK.
27 Day N and Muhammad A (2011). Malaysia: The Atlas of Islamic World Science and Innovation Country Case Study No. 1.
28 Day N and Muhammad A (2011). Malaysia: The Atlas of Islamic World Science and Innovation Country Case Study No. 1.
This rapid growth has coincided with the launch of a national STI policy and strategy which includes the Turkish Research Area (TARAL) programme, which aims to bring together all of its science and innovation stakeholders into a single institutional framework. It is hoped that these efforts will contribute towards building a strong and effective National Innovation System (NIS).20
Like its Central Asian neighbours, Kazakhstan’s R&D expenditure is around 0.16% of its GDP, although it has the highest number of higher education and research institutes in the region, at 167 and 271 respectively.21 Kazakhstan’s government has recently given special attention to policies in support of science and technology. Plans for increased spending on innovation by large state companies may provide new impetus, including the decision to allocate 10% of the net profit of Samruk-Kazyna, the country’s National Welfare Fund, to innovation-related projects. In 2013, the total amount of funding for R&D was around US$ 405 million (61.7 billion tenges) – part of a wider plan in which Kazakhstan intends to increase its expenditure on R&D as a percentage of GDP to an average of 1% by 2014.22
Malaysia is the OIC’s strongest performer in the area of high-technology exports, accounting for over 80% of the OIC total (see Chapter 3, Figure 3.7). It has one of the highest ratios of business R&D in the world according to UNESCO,23 and the highest in the OIC. It is the OIC country which is granted the most patents and is the fastest-growing patent producer in South-East Asia, albeit from a low base.24 Some of the national policies which may have helped to contribute to Malaysia’s relatively strong performance in these areas include fiscal incentives to promote R&D in technology-intensive industries, the establishment of free trade zones, the establishment of specialised technology finance mechanisms, and embedding technology transfer and development in foreign investment negotiations.25
Tax breaks for R&D expenditure form an important plank of Malaysia’s policies. For example, companies performing in-house R&D to further their business may qualify for an investment tax allowance (ITA) of 50% on the company’s qualifying capital expenditure incurred within a decade.26 In addition, Malaysia’s government started providing tax breaks for venture capital companies investing up to 75% in hi-tech projects in the 1990s, and Malaysia’s science and technology parks also include tax incentives alongside a number of methods of government support, although university links are relatively weak.27 Such support is characteristic of the clear framework for science and technology in the country, with detailed plans, targeted sectors, and a comprehensive overview of its strategic priorities; although it should be said that there is room for improvement in their implementation.28
Science and Technology in the OIC: Current Status and Future Prospects | 17
29 Shetty P et al (2014). Indonesia: the Atlas of Islamic World Science and Innovation Country Case Study.
30 Articles published in journals that are covered by Science Index Expanded (SCI-EXPANDED), Social Science Citation Index (SSCI) and Arts & Humanities Citation Index (A&HCI).
31 Source: UNESCO Institute for Statistics (2013).Data in ‘000 current PPP$. Based on the most recent year available (2008 in the case of Iran).
32 Source: UNESCO Institute for Statistics (2013).
33 Bond M et al (2012). Science and Innovation in Egypt: The Atlas of Islamic World Science and Innovation Country Case Study.
34 Bond M et al (2012). Science and Innovation in Egypt: The Atlas of Islamic World Science and Innovation Country Case Study.
35 Dollar figures based on authors’ calculations from http://www.xe.com, 27 June 2013.
36 Bond M et al (2012). Science and innovation in Egypt. The Atlas of Islamic World Science and Innovation Country Case Study.
37 Source: Thomson Reuters Web of Science (2014).
38 Source: UNESCO Institute for Statistics (2013).
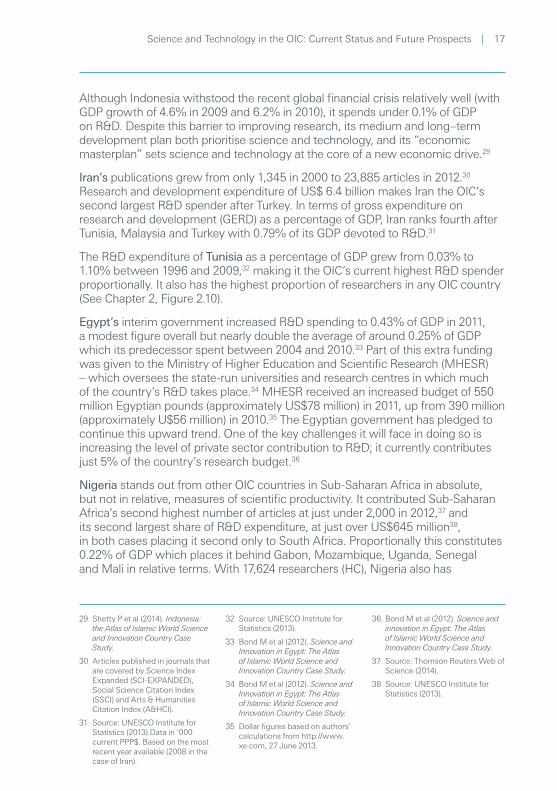
Although Indonesia withstood the recent global financial crisis relatively well (with GDP growth of 4.6% in 2009 and 6.2% in 2010), it spends under 0.1% of GDP on R&D. Despite this barrier to improving research, its medium and long–term development plan both prioritise science and technology, and its “economic masterplan” sets science and technology at the core of a new economic drive.29
Iran’s publications grew from only 1,345 in 2000 to 23,885 articles in 2012.30 Research and development expenditure of US$ 6.4 billion makes Iran the OIC’s second largest R&D spender after Turkey. In terms of gross expenditure on research and development (GERD) as a percentage of GDP, Iran ranks fourth after Tunisia, Malaysia and Turkey with 0.79% of its GDP devoted to R&D.31
The R&D expenditure of Tunisia as a percentage of GDP grew from 0.03% to 1.10% between 1996 and 2009,32 making it the OIC’s current highest R&D spender proportionally. It also has the highest proportion of researchers in any OIC country (See Chapter 2, Figure 2.10).
Egypt’s interim government increased R&D spending to 0.43% of GDP in 2011, a modest figure overall but nearly double the average of around 0.25% of GDP which its predecessor spent between 2004 and 2010.33 Part of this extra funding was given to the Ministry of Higher Education and Scientific Research (MHESR) – which oversees the state-run universities and research centres in which much of the country’s R&D takes place.34 MHESR received an increased budget of 550 million Egyptian pounds (approximately US$78 million) in 2011, up from 390 million (approximately U$56 million) in 2010.35 The Egyptian government has pledged to continue this upward trend. One of the key challenges it will face in doing so is increasing the level of private sector contribution to R&D; it currently contributes just 5% of the country’s research budget.36
Nigeria stands out from other OIC countries in Sub-Saharan Africa in absolute, but not in relative, measures of scientific productivity. It contributed Sub-Saharan Africa’s second highest number of articles at just under 2,000 in 2012,37 and its second largest share of R&D expenditure, at just over US$645 million38, in both cases placing it second only to South Africa. Proportionally this constitutes 0.22% of GDP which places it behind Gabon, Mozambique, Uganda, Senegal and Mali in relative terms. With 17,624 researchers (HC), Nigeria also has

18 | The Atlas of Islamic World Science and Innovation Final Report
39 UNESCO (2010). UNESCO Science Report 2010. United Nations Educational Scientific and Cultural Organization: Paris, France.
40 Source: UNESCO Institute for Statistics (2013).
41 UNESCO (2010). UNESCO Science Report 2010. United Nations Educational Scientific and Cultural Organization: Paris, France.
42 Source: UNESCO Institute for Statistics (2013).
43 Royal Society (2010). A new golden age? The prospects for science and innovation in the Islamic world. Royal Society: London, UK.
44 Shukman D (2012). SESAME Synchrotron is a flash of unity in Middle East. BBC News Online, 26 November 2012.
the highest number of researchers in Sub-Saharan Africa after South Africa, although this equates to 120 per million inhabitants, which places it among the middle rank of Sub-Saharan OIC countries by this measure.39
Senegal has the highest proportion of researchers in Sub-Saharan Africa after South Africa, at 384 per million population,40 and the fourth highest number of researchers in Sub-Saharan Africa overall, at just over 3,000.41 The national R&D expenditure is around US$81 million which constitutes 0.37% of GDP. This ratio is also the fourth highest proportional R&D expenditure among Sub-Saharan OIC countries, after Gabon, Mozambique and Uganda.42
While the Gulf states each spend less than 1% of their GDP on research, they have been investing more in education in recent years: the fruits of Saudi Arabia’s investments include new institutions such as the King Abdullah University of Science and Technology (KAUST) which opened in 2009 with a US$20 billion endowment.43 Meanwhile, Qatar and the United Arab Emirates have attracted a number of international universities through initiatives such as Qatar’s Education City, which hosts a number of branch campuses in Doha including the likes of Carnegie Mellon University, Weill Cornell Medical College and University College London, and a similar approach in Abu Dhabi which has brought campuses from New York and Sorbonne Universities to the emirate.
Meanwhile, Jordan is home to an extraordinary exercise in science diplomacy called SESAME (Synchrotron-light for Experimental Science and Applications in the Middle East) which is a multi-million dollar particle accelerator, set up to allow collaboration between researchers from across the Middle East, just as CERN brought together scientists from across post-war Europe.44 Due to open in 2015, the project stands out as a model of how science can foster regional cooperation. Notable OIC members of SESAME include Bahrain, Egypt, Iran, Jordan, Pakistan, Palestine and Turkey.

Inputs to Science and Technology in the OIC | 19
2 Inputs to Science and Technology in the OICNotwithstanding the wide variety of science and technology systems that exist in OIC countries, and the fact that some OIC countries do not have national science policies,45 one of the main challenges involved in accurately measuring the inputs to science and innovation in the Islamic world is the relative lack of data. For example, data do not exist for more than half the OIC member states on crucial indicators such as R&D spending and the number of researchers, as measured by international organisations such as UNESCO. Furthermore, where such data do exist, they are often years out of date. This lack of data makes it problematic to benchmark these countries against international comparators and to set achievable targets, and also makes it difficult to objectively assess the effectiveness or otherwise of current R&D spending. A more concerted effort to measure, disseminate and monitor these data is therefore essential across OIC countries if the health of OIC science is to be more accurately measured, and if common goals such as those outlined in Vision 1441H are to be achieved.
2.1 Funding• As Figure 2.1 shows, over half of the world’s gross expenditure on R&D (GERD)
comes from the USA and the more advanced economies within the EU,46 at 30.6% and 22.6% respectively, with the OIC’s share at around 2.4%.
Figure 2.1 Gross Expenditure on Research and Development (GERD), % of World Total (most recent year available 2000–2011)47
2.4%
30.6%
10.3%
22.6%
9.8%
15.3%
9.1%
USA
Japan
Developed EU Countries
Other Developed
China
Other Developing
OIC
45 Mahroum S et al (2013). Jordan: The Atlas of Islamic World Science and Innovation Country Case Study.
46 This analysis includes EU members which are classified as “developed” in “Developed EU countries”. Developing EU members (i.e. Bulgaria, Croatia,
Hungary, Latvia, Lithunia, Poland and Romania) are included in “Other developing”.
47 Source: UNESCO Institute for Statistics (2013).

20 | The Atlas of Islamic World Science and Innovation Final Report
48 Source: UNESCO Institute for Statistics (2013).
49 Source: UNESCO Institute for Statistics (2013). This analysis is based on the weighted average obtained through dividing total GERD (in current PPP US$) by total GDP (in current PPP US$) of the OIC countries for which data is available.
50 Source: UNESCO Institute for Statistics (2013).
51 Source: UNESCO Institute for Statistics (2013).
52 Source: UNESCO Institute for Statistics (2013).
53 UNESCO (2010). UNESCO Science Report 2010. United Nations Educational Scientific and Cultural Organization: Paris, France.
The highest proportional spenders on R&D in the OIC, as measured by R&D expenditure as a percentage of GDP, are Tunisia (1.10 %, 2009), Malaysia (1.07%, 2011), Turkey (0.84%, 2010) and Iran (0.79%, 2008) (see Figure 2.2). In two of the leading cases, this represents rapid growth from an extremely low base. Tunisia spent 0.03% of its GDP on R&D in 2006, while Turkey has increased its spending by nearly six-fold between 1995 and 2007.
Figure 2.2 GERD as a percentage of GDP in OIC Member Countries48
Most recent year available between 2004–2011
0.2
0.4
0.6
1.0
0.8
1.2
0
Latest year available before 2004
Tu
nis
iaM
alay
sia
Turk
eyIr
anM
oro
cco
Gab
on
UA
EM
oza
mb
iqu
eJo
rdan
Eg
ypt
Ug
and
aS
eneg
alPak
ista
nM
ali
Nig
eria
Aze
rbai
jan
Bu
rkin
a Fa
soK
azak
hst
anK
yrg
yzst
anA
lban
iaG
amb
iaO
man
Tajik
ista
nK
uw
ait
Sau
di A
rab
iaIn
do
nes
iaA
lger
iaIr
aqB
run
ei
GE
RD
% o
f G
DP
OIC Member Country
• On average, the OIC countries spend 0.46 % of their GDP on R&D.49 This represents a modest increase on the 2003 OIC average (which was then 0.30%)50, the year Vision 1441H was launched, but there is still a significant way to go to meet the target of 1.4% of GDP on R&D by 2020.51
• Strikingly, even some of the most wealthy and resource-rich OIC countries spend a very small proportion of their GDP on R&D – just 0.08% in the case of Saudi Arabia,52 0.09% in Kuwait, while the most recent available figure for Qatar’s R&D expenditure was 0.33% of GDP in 2006 and 0.47% for UAE in 2011.53

Inputs to Science and Technology in the OIC | 21
54 Scully T (2011). Science investment paying off in the Middle East. Nature Middle East, 3 April 2011.
55 Sawahel W (2009). Iran: 20-year plan for knowledge-based economy. University World News, 30 August 2009.
56 El-Akkad D (2012). A university professor becomes Egypt’s president. Nature Middle East, 26 June 2012.
There is certainly no shortage of ambitious national targets to increase R&D spending. In 2006, the former Emir of Qatar, Sheikh Hamad Bin Khalifa Al-Thani, announced that Qatar would spend 2.8% of GDP on R&D by 2015.54 Meanwhile, Iran has announced it intends to achieve 4% expenditure of GDP on R&D by 2030,55 and Egypt’s government pledged to increase R&D spending to 2.5% of GDP in 2012.56
These targets, if met, would represent very significant increases on their most recent verified R&D expenditures of 0.33%, 0.79%, and 0.21% of their GDP respectively. The big questions are whether they can be achieved and whether such countries can develop their scientific and technological capabilities quickly enough to exploit such funding if and when it becomes available.
2.1.1 Funding by SectorFurther analysis of the sources of R&D funding (see Figure 2.3) shows that the OIC countries’ R&D funding is also more proportionally dependent on government and higher education than the average for the world (where business is the major R&D funder, at 61%). Indeed, it is usually the case that higher education expenditure on R&D is also government-funded R&D.
It suggests a relatively underperforming business sector in many OIC countries, with only just over a third of expenditure on R&D across the OIC coming from this source. This is also unsurprising as in many of the poorest OIC countries, the amount of businesses that support R&D are few. Only Malaysia (whose relatively strong private sector is discussed later), Kazakhstan (with its natural gas wealth) and Turkey (the OIC’s highest performer on a number of indicators) have a larger proportion of their R&D funded by business than government.

22 | The Atlas of Islamic World Science and Innovation Final Report
57 Source: UNESCO Institute for Statistics (2013). This graph is based on the breakdown of gross expenditure on R&D by source of funds according to UNESCO definitions given in Appendix C.
58 Day N and Muhammad A (2011). Malaysia: The Atlas of Islamic World Science and Innovation Country Case Study No. 1.
Figure 2.3 Distribution of GERD by Source of Funds (most recent year available between 2000–2011)57
10
30
20
50
40
70
60
80
90
100
OIC Non-OIC Developing
Developed World EU0
Government (%) Business Enterprise (%) Higher Education (%)Private Non-profit (%) Abroad (%) Not Specified (%)
% o
f G
ER
D
Group of Countries
This overall picture masks a wide spectrum. Figure 2.4 breaks down the distribution of R&D spending by source of funds across the OIC’s highest R&D spenders, from which the following conclusions can be drawn:
• With a share of 55%, the majority of Malaysia’s R&D is funded by business enterprise. As the Atlas of Islamic World Science and Innovation country case study demonstrated, Malaysia has shown an increasing capacity to nurture entrepreneurial and high value industries, although a number of Malaysia’s high profile companies, such as Petronas, are linked to the government. Meanwhile, the government sector provides 41.4% of R&D funds.58
• At the other end of the scale, the OIC contains a number of countries (Nigeria, Iraq, Pakistan, Gambia and Mozambique) in which private sector investment in R&D appears virtually non-existent.
• There are also some outliers such as Morocco, for whom 49% of GERD is performed in the higher education sector, and the Sub-Saharan countries of Mozambique and Burkina Faso, for whom most R&D is funded from abroad (78% and 60% respectively).

Inputs to Science and Technology in the OIC | 23
59 IFPRI (2010). Mozambique: Recent Developments in Agricultural Research. International Food Policy Research Institute: Washington, DC, USA.
60 ASTI (2010). Booms and busts: the case of agricultural R&D spending in Burkina Faso. ASTI News and Notes. Agricultural Science and Technology Indicators,
International Food Policy Research Institute: Washington, DC, USA.
61 Source: UNESCO Institute for Statistics (2013).
• Mozambique’s high degree of dependence on international research funders leaves its research base vulnerable to changes in the priorities of those donors.59 Burkina Faso’s R&D, at least in the field of agriculture, has seen increased spending largely as a result of a high degree of reliance on projects funded by World Bank loans.60
Figure 2.4 Distribution of GERD in OIC Member Countries by Source of Funds61
Government (%) Business Enterprise (%)Higher Education (%) Private Non-profit (%)Abroad Not Specified (%)
Iraq (2011)
Mali (2007)
Nigeria (2007)
Kuwait (2011)
Brunei (2004)
Azerbaijan (2011)
Indonesia (2001)
Pakistan (2011)
Tajikistan (2011)
Albania (2008)
Tunisia (2009)
Iran (2008)
Gabon (2009)
Kyrgyzstan (2011)
Senegal (2008)
Uganda (2009)
Oman (2011)
Malaysia (2011)
Gambia (2011)
Turkey (2010)
Kazakhstan (2011)
Morocco (2010)
Mozambique (2010)
Burkina Faso (2009)
90
70
80
50
60
30
40
20
100
100
OIC
Mem
ber
Co
un
try
% of GERD
An examination of gross domestic expenditure on R&D by sector of performance (see Figure 2.5) provides a similar picture of a much higher ratio of government to business R&D performance in the OIC.

24 | The Atlas of Islamic World Science and Innovation Final Report
62 Source: UNESCO Institute for Statistics (2013). This graph is based on the breakdown of gross expenditure on R&D by sector
of performance according to UNESCO definitions given in Appendix C.
Figure 2.5 Distribution of GERD by Sector of Performance (most recent year available between 2000–2011)62
Government (%)
10
30
20
50
40
70
60
80
90
100
OIC Non-OIC Developing
Developed World EU0
Business Enterprise (%) Higher Education (%)Private Non-profit (%) Not Specified (%)
% o
f G
ER
D
Group of Countries
A breakdown of R&D performance by individual countries (Figure 2.6) shows that in many OIC countries, the vast majority of R&D is performed either by government itself or the higher education sector to the virtual exclusion of all other actors. The overall picture of a relatively weak business sector in terms of R&D performance, notwithstanding some important exceptions such as Malaysia, Kazakhstan and Turkey, is reinforced.

Inputs to Science and Technology in the OIC | 25
63 Source: UNESCO Institute for Statistics (2013).
Figure 2.6 Distribution of GERD in OIC Member Countries by Sector of Performance63
Government (%) Business Enterprise (%)Higher Education (%) Private Non-profit (%)Abroad Not Specified (%)
90
70
80
50
60
30
40
20
100
100
Iraq (2011)
Mali (2007)
Nigeria (2007)
Kuwait (2011)
Brunei (2004)
Azerbaijan (2011)
Indonesia (2001)
Pakistan (2011)
Tajikistan (2011)
Albania (2008)
Tunisia (2009)
Iran (2008)
Gabon (2009)
Kyrgyzstan (2011)
Senegal (2008)
Uganda (2009)
Oman (2011)
Malaysia (2011)
Gambia (2011)
Turkey (2010)
Kazakhstan (2011)
Morocco (2010)
Mozambique (2010)
Burkina Faso (2009)
OIC
Mem
ber
Co
un
try
% of GERD

26 | The Atlas of Islamic World Science and Innovation Final Report
64 Naim T and ur-Rahman A (2009). Mapping scientific research in member states of the Organization of Islamic Conference (OIC): Research summary. Occasional Paper No. 17. UNESCO Forum on Higher Education, Research and Knowledge. United Nations Educational Scientific and Cultural Organization: Paris, France.
65 See Shanghai Academic Ranking of World Universities (2014): http://www.shanghairanking.com/ and Times Higher EducationWorld University Rankings (2013–14): http://www.timeshighereducation.co.uk/world-university-rankings/
There is a need to promote and encourage more R&D investment by private enterprise in many OIC countries. This applies particularly to countries which have a growing private sector active in the domain of high technology industry, or those which have a stronger ICT sector capable of developing ICT products and services of high added value. Such measures could include encouraging the commercialisation of academic research, providing incentives for collaboration between universities and industry, and offering training in entrepreneurship. Robust protection of intellectual property rights (IPR) will also be required.
While SESRIC has reported the existence of 1,900 universities in OIC countries, none are in the top 100 universities as ranked by Times Higher Education (THE) and Jiao Tong.64 Here there is a clear gap in the market which could be met by the creation and support of more research-intensive universities. Good universities require good research facilities and infrastructure, grants for researchers and funding from government. Some exceptions are beginning to be discernible in the Gulf, with three of its universities (King Saud University and King Fahd University in Saudi Arabia, and UAE University) now in the top 400 of the THE rankings, although only KSU makes the top 500 of the Jiao Tong.65
As shown in Figures 2.7a and 2.7b, higher education expenditure on R&D (HERD) is proportionally greater in the OIC than the world average, accounting for 36.1% of total R&D spending, compared to the averages of non-OIC developing countries (10%) and developed countries (18.5%).
Figures 2.7a, 2.7b and 2.8 show the OIC countries with respect to HERD as a percentage of GDP and absolute HERD in current million PPP$. The investment in Turkey’s higher education sector, both in terms of HERD as a percentage of GDP and total GERD performed by higher education, is most notable here.

Inputs to Science and Technology in the OIC | 27
Figure 2.7a Higher Education Expenditure on R&D in OIC Countries (% of GDP)66
0.05
0.10
0.15
0.25
0.20
0.30
0.35
0.40
0.50
0.45
0.00
Turk
ey (
201
0)
Mo
rocc
o (2
010
)
Tun
isia
(2
00
5)
Mal
aysi
a (2
011)
Iran
(20
08
)
Mal
i (20
07
)
Mo
zam
biq
ue
(201
0)
Sen
egal
(20
08
)
Nig
eria
(20
07
)
UA
E (201
1)
Pak
ista
n (
201
1)
Alb
ania
(2
00
8)
Ug
and
a (2
00
9)
Om
an (
201
1)
Tajik
ista
n (
201
1)
Ind
on
esia
(2
00
9)
Kaz
akh
stan
(201
1)
Kyr
gyz
stan
(201
1)
Aze
rbai
jan (
201
1)
Iraq
(201
0)
Bru
nei
(20
04)
Higher Education Expenditure on Research and Development (HERD) (% of GDP)
% o
f G
DP
OIC Member Country
Figure 2.7b
66 Source: UNESCO Institute for Statistics (2013).
0.05
0.10
0.15
0.25
0.20
0.30
0.35
0.40
0.50
0.45
0.00
Turk
ey (
201
0)
Mo
rocc
o (2
010
)
Tun
isia
(2
00
5)
Mal
aysi
a (2
011)
Iran
(20
08
)
Mal
i (20
07
)
Mo
zam
biq
ue
(201
0)
Sen
egal
(2
00
8)
Nig
eria
(20
07
)
UA
E (2
011)
Pak
ista
n (
201
1)
Alb
ania
(2
00
8)
Ug
and
a (2
00
9)
Om
an (
201
1)
Tajik
ista
n (
201
1)
Ind
on
esia
(2
00
9)
Kaz
akh
stan
(201
1)
Kyr
gyz
stan
(201
1)
Aze
rbai
jan (
201
1)
Iraq
(201
0)
Bru
nei
(20
04)
HE
RD
GE
RD
0
500
1,000
1,500
2,000
2,500
3,000
3,500
4,000
4,500
5,000
Higher Education Expenditure on Research and Development (HERD) (% of GDP)Gross Expenditure on Research and Development (GERD) (% of GDP)
OIC Member Country

28 | The Atlas of Islamic World Science and Innovation Final Report
67 Source: UNESCO Institute for Statistics (2013).
68 The OECD defines foreign direct investment as follows: Foreign direct investment (FDI) is a key element in international economic integration. FDI creates direct, stable and long-lasting links between economies. It encourages the transfer of technology and know-how between countries, and allows the host economy to promote
its products more widely in international markets. FDI is also an additional source of funding for investment and, under the right policy environment, it can be an important vehicle for development. Organisation for Economic Cooperation and Development: Paris, France.
69 Baskaran A and Muchie M (2008). Foreign direct investment and internationalization of R&D: the
case of BRICS economies. Aalborg University: Aalborg, Denmark.
70 Source: UNCTAD (2013), UNCTADStat. United Nations Conference on Trade and Development: Geneva, Switzerland.
71 Source: UNCTAD (2013), UNCTADStat. United Nations Conference on Trade and Development: Geneva, Switzerland.
Figure 2.8 Higher Education Expenditure on R&D in OIC Countries (in current million PPP $)67
500
1,000
1,500
2,500
2,000
3,000
3,500
4,000
4,500
5,000
0
Turk
ey (
201
0)
Iran
(20
08
)
Mal
aysi
a (2
011)
UA
E (2
011)
Mo
rocc
o (2
010
)
Nig
eria
(20
07
)
Pak
ista
n (
201
1)
Ind
on
esia
(2
00
9)
Tun
isia
(2
00
5)
Kaz
akh
stan
(201
1)
Om
an (
201
1)
Mo
zam
biq
ue
(201
0)
Sen
egal
(2
00
8)
Mal
i (20
07
)
Ug
and
a (2
00
9)
Aze
rbai
jan (
201
1)
Alb
ania
(2
00
8)
Tajik
ista
n (
201
1)
Iraq
(201
0)
Kyr
gyz
stan
(201
1)
Bru
nei
(20
04)
Mill
ion
US
D P
PP
OIC Member Country
2.1.2 Foreign Direct InvestmentAnother indicator of private sector activity and economic health in any given country can be measured by the total level of foreign direct investment (FDI), which gives an indication of the attractiveness of that country’s economy to overseas investors.68 The relationship between FDI and expenditure on R&D is a complex one; the volume and nature of FDI, the ability to absorb and benefit from FDI and its impact on productivity varies greatly across emerging and less developed economies.69
• OIC FDI grew by 662.5% between 1995 and 2012, more than double the world average growth of 293.2%.70
• In 2012, OIC countries took in 10.32% of the world’s FDI – a figure that has fluctuated significantly in past decades, reaching highs of nearly 15% in 1975 and just over 25% in 1982. In both of those years, Saudi Arabia accounted for the majority of OIC FDI (52% in 1975 and 78% in 1982).71

Inputs to Science and Technology in the OIC | 29
72 Kusuma AN and Rahadiana R (2012). UPDATE 2-Indonesia’s FDI level shows country still attractive. Reuters, 25 July 2012.
73 Source: UNCTAD (2013), UNCTADStat. United Nations Conference on Trade and Development: Geneva, Switzerland.
• The largest OIC recipients of FDI in 2012 (see Figure 2.9) were Indonesia (US$ 19.9bn)72 – the new G20 member and South-East Asia’s largest economy – a reflection of its large domestic market, abundant natural resources, and burgeoning mining and manufacturing sectors; Kazakhstan (US$ 14.0 bn) – another resource-rich country, this time in natural gas; Turkey (US$ 12.4 bn); and Saudi Arabia (US$ 12.2 bn) – a consistently high FDI recipient whose attracvtiveness to investors is largely due to its oil industry.
Figure 2.9 Foreign Direct Investment (FDI) Inflows across the OIC (Billion USD, 2012)73
IndonesiaKazakhstanTurkeySaudi ArabiaMalaysiaUAENigeriaMozambiqueIranLebanonTurkmenistanMoroccoEgyptIraqSudanAzerbaijanTunisiaKuwaitUgandaOmanAlgeriaJordanMauritaniaUzbekistanBangladeshAlbaniaBahrainBruneiPakistanNigerGuineaSierra LeoneGabonCameroonCôte d’IvoireKyrgyzstanYemenSenegalQatarChadMaliTajikistanMaldivesPalestineGuyanaTogoBeninSomaliaDjiboutiAfghanistanGambiaSurinameBurkina FasoComorosGuinea-Bissau
19.8514.02
12.4212.18
10.079.60
7.035.22
4.873.79
3.162.842.80
2.552.47
2.001.921.851.72
1.511.481.401.201.090.990.960.890.850.850.790.740.740.700.510.480.370.350.340.330.320.310.290.280.240.230.170.160.110.100.090.080.070.040.020.02
Co
un
try
FDI (Billion USD in 2012)

30 | The Atlas of Islamic World Science and Innovation Final Report
74 Source: UNESCO Institute for Statistics (2013).
75 Corbyn Z (2009). Oasis in the desert. Times Higher Education, 5 November 2009.
76 Mahroum S et al (2013). Jordan: The Atlas of Islamic World Science and Innovation Country Case Study.
77 Authors calculations based on UNESCO data. It should be noted that when measured by full-time
equivalent (FTE) data, the OIC total is much lower, at just over 4%.
78 Source: United Nations Department of Economics and Social Affairs (2012). See http://esa.un.org
Despite consistently attracting the highest levels of FDI in the OIC (nearly US$150bn in the last decade), Saudi Arabia only spends 0.08% of its GDP on R&D.74 It remains to be seen to what extent this figure will change following the establishment of high profile new universities in the Kingdom in recent years, among other recent investments in research infrastructure.75
The most striking growth in FDI in OIC countries over the last fifteen years has been seen in Sudan (1,528, 411%), Sierra Leone (35,808%), Iran (13,929%), Afghanistan and Jordan (10,864% and 10,540% respectively). Sudan and Iran, like many of the OIC’s biggest recipients of foreign investment, are rich in hydrocarbon resources, while the strong growth of Sierra Leone and Sudan may reflect their post-conflict rise from a relatively low base, although neither of these factors applies to Jordan.76
2.2 ResearchersResearchers are under-represented among the populations of OIC countries by comparison with the rest of the world, as Figure 2.10 demonstrates.
• Taking the most recent available figure for the total number of researchers in each country, researchers (HC) in OIC countries constitute 693,150 out of a global total of around 6.7m, or just over 10% of the total number of researchers recorded in the world.77
• The OIC countries with the most researchers in absolute terms are Turkey (124,796), Iran (107,810) and Egypt (89,270). Those with the highest proportion of researchers amongst their populations (Figure 2.10), as measured by researchers per million people (HC), are Tunisia, Turkey and Jordan.
• Some of the OIC’s most populous countries, such as Indonesia, Pakistan, Bangladesh and Egypt (all of whom have populations between 75 and 237 million) have relatively few natural resources, while some of the least populated, such as Qatar, the United Arab Emirates and Kuwait (all under 10 million) have some of the richest resource wealth. There is surely an opportunity here for countries low in human capital but rich in resources to collaborate with those to whom the reverse applies.78

Inputs to Science and Technology in the OIC | 31
79 Source: UNESCO Institute for Statistics (2013). Data from latest year available, 1997–2010. United Nations Educational, Scientific and Cultural Organisation: Paris, France.
Figure 2.10 Researchers (Head Count) in OIC Member Countries79
33,199
Researchers (HC) Researchers (HC) per million people
11,310
124,796
107,810
11,041
81,114
29,276
19,021
244
7,859
10,095
2,348
1,721
2,290
13,805
531
54,689
11,208
1,722
2,117
4,562
41,143
402
834
2,397
1,000
17,624
179
460
1,144
877
1,703
6,097
1,520
1,271
522
129
3,240
1,934
1,715
1,491
1,218
1,018
935
715
686
667
637
581
541
434
420
359
321
292
254
254
243
173
152
148
133
123
120
106
73
69
63
53
50
49
47
24
10
Tunisia
Jordan
Turkey
Iran
Azerbaijan
Egypt
Morocco
Malaysia
Brunei
Senegal
Kazakhstan
Palestine
Albania
Kyrgyzstan
Algeria
Gabon
Pakistan
Sudan
Tajikistan
Guinea
Cameroon
Indonesia
Kuwait
Togo
Côte d'Ivoire
Benin
Nigeria
Gambia
Libya
Burkina Faso
Mali
Uganda
Bangladesh
Iraq
Saudi Arabia
Mozambique
Niger
OIC MemberCountry

32 | The Atlas of Islamic World Science and Innovation Final Report
3 Outputs from Science and Technology in the OICThe previous section has illustrated that there are many targets across the OIC to increase research expenditure. Increased investment in R&D, research and science is an important first step. It should, however, form part of a coherent national science and innovation policy to ensure that investments yield the best possible results in terms of output. The following section examines the outputs of science and technology across the OIC, and considers to what extent the inputs discussed in the previous chapter lead to outputs of the highest quality.
3.1 PublicationsIn 2012, OIC member countries published over 100,000 articles in journals that are indexed by Thomson Reuters Web of Science. This represents a fivefold increase compared to the 20,038 articles published in 2000. During the same period, global publications grew from 931,000 to 1.27 million. Therefore the OIC’s share of global publications has been steadily growing, from just 2.2% in 2000 to 5.9% in 2012 (Figure 3.1).
Figure 3.1 Distribution of Global Publications (2000–2012)80
Share of OIC in the World (%)
0
200,000
400,000
600,000
800,000
1,000,000
Nu
mb
er o
f p
ub
licat
ion
s
%
1,200,000
0
1
2
3
4
5
6
20
00
20
01
20
02
20
03
20
04
20
05
20
06
20
07
20
08
20
09
201
0
201
1
201
2
OIC
Developed
Non-OIC DevelopingYear
80 Source: Thomson Reuters Web of Science (2013).
Outputs from Science and Technology in the OIC | 33
81 The highest growth rates described here only include countries with at least 100 publications in 2012.
82 Day N and Muhammad A (2011). Malaysia: The Atlas of Islamic World Science and Innovation Country Case Study No. 1.
83 Source: Thomson Reuters Web of Science (2013).
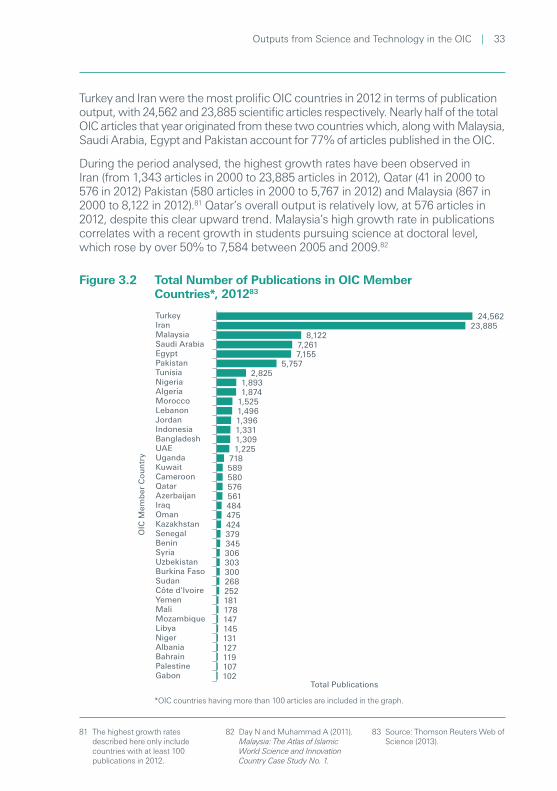
Turkey and Iran were the most prolific OIC countries in 2012 in terms of publication output, with 24,562 and 23,885 scientific articles respectively. Nearly half of the total OIC articles that year originated from these two countries which, along with Malaysia, Saudi Arabia, Egypt and Pakistan account for 77% of articles published in the OIC.
During the period analysed, the highest growth rates have been observed in Iran (from 1,343 articles in 2000 to 23,885 articles in 2012), Qatar (41 in 2000 to 576 in 2012) Pakistan (580 articles in 2000 to 5,767 in 2012) and Malaysia (867 in 2000 to 8,122 in 2012).81 Qatar’s overall output is relatively low, at 576 articles in 2012, despite this clear upward trend. Malaysia’s high growth rate in publications correlates with a recent growth in students pursuing science at doctoral level, which rose by over 50% to 7,584 between 2005 and 2009.82
Figure 3.2 Total Number of Publications in OIC Member Countries*, 201283
TurkeyIranMalaysiaSaudi ArabiaEgyptPakistanTunisiaNigeriaAlgeriaMoroccoLebanonJordanIndonesiaBangladeshUAEUgandaKuwaitCameroonQatarAzerbaijanIraqOmanKazakhstanSenegalBeninSyriaUzbekistanBurkina FasoSudanCôte d'IvoireYemenMaliMozambiqueLibyaNigerAlbaniaBahrainPalestineGabon
24,56223,885
8,1227,2617,155
5,7572,825
1,8931,874
1,5251,4961,3961,3311,3091,225
718589580576561484475424379345306303300268252181178147145131127119107102
OIC
Mem
ber
Co
un
try
Total Publications *OIC countries having more than 100 articles are included in the graph.

34 | The Atlas of Islamic World Science and Innovation Final Report
84 Source: SCImago (2014). SJR — SCImago Journal & Country Rank. Retrieved July 14, 2014, from http://www.scimagojr.com.
85 Royal Society (2011). Knowledge, networks and nations: global scientific collaboration in the 21st century. Royal Society: London, UK.
86 Authors’ calculations based on data from SciMago. See also Shetty P et al (2014).Indonesia: The Atlas of Islamic World Science and Innovation Country Case Study
87 Royal Society (2011). Knowledge, networks and nations: global scientific collaboration in the 21st century. Royal Society: London, UK.
88 Authors’ calculations based on data from WIPO Statistics Database, July 2013. Due to limited data availability for OIC member countries, the analysis is based on data from 2013 or the most recent year available.
The measure of citations per document is generally used as a crude proxy for quality. On this measure, Lebanon, Saudi Arabia and Indonesia lead the way in the OIC with 1.05, 0.95 and 0.91 citations per document respectively.84 Lebanon’s high score may be a reflection of the fact that the publication output of smaller countries tends to be more internationally collaborative – and thus more highly cited.85
Elsewhere, the relatively high impact of Indonesia’s papers should encourage its policymakers, considering its relatively low R&D spend and overall publication output for a country of its size and population. The overall average citation impact of papers authored or co-authored in the OIC is still below that of the rest of the world – at just 0.99 compared to the world average of 1.23.86
One way in which OIC countries could seek to improve their research performance is to promote international collaboration, both within and outside the OIC. International collaboration, as measured by internationally co-authored publications, enhances the quality of scientific research; it increases the citation impact of that research, facilitates access to new markets, and broadens research horizons.87
3.3 PatentsIntellectual property rights, especially in the form of patents, contribute to advances in innovation and scientific development. The registration of patents is a clear indication of a desire to commercialise research in the jurisdiction in which the patent is filed. As a product of R&D activities, patents strengthen the link between science and technology, as the outcomes of research translate into new and original products or services, for which patents are granted. Although not all inventions are patented, the quantity of patent applications may be considered as a proxy for the degree of innovative capability in a country.
• Based on the latest available data, OIC member countries account for approximately 1.7% of global patent filings.88

Outputs from Science and Technology in the OIC | 35
89 Source: WIPO (2013). Statistics Database. In this graph, “Developed EU countries” denotes EU members which are classified as “developed”. Developing EU members (i.e. Bulgaria, Croatia, Hungary, Latvia, Lithunia, Poland and Romania) are included in “other developing”. Note that these patent data apply to patents filed in the country
concerned – so China’s patents were all filed in China by residents and non-residents alike, Japan’s in Japan, and so on. For a discussion on patent indicators, see WIPO (2007). Wipo Patent Report. World Intellectual Property Organization: Geneva, Switzerland.
90 Both Indonesia and Turkey’s figures are from 2011.
Figure 3.3 Total Patent Applications in the World by Filing Office (most recent year available between 2000–2011)89
1.7%
26.3%
9.5%
25.1%
17.1%
8.9%
6.4%
5.0%
China
Other Non-OIC Developing
USA
Japan
Korea, Rep.
Developed EU Countries
Other Developed
OIC
• For the period 2000–2011, Iran demonstrated the highest patent activity in the OIC with 6,527 applications in 2006. Underlining its relatively strong business sector within the OIC, Malaysia followed Iran with 6,452 applications in 2011.
• Adding the patent applications of Indonesia (5,838) and Turkey (4,113),90 these four OIC countries alone constitute nearly 69% of the OIC total.
• Egypt, Kazakhstan and Morocco are the other OIC member countries that filed over 1,000 applications each.

36 | The Atlas of Islamic World Science and Innovation Final Report
91 Source: WIPO (2013). Statistics Database. Data from most recent year available between 2000–2011. See previous caveats above.
World Intellectual Property Organization: Geneva, Switzerland.
Figure 3.4 Total Patent Applications in OIC Member Countries by Filing Office91
Iran (2006)
Malaysia (2011)
Indonesia (2011)
Turkey (2011)
Egypt (2011)
Kazakhstan (2011)
Morocco (2011)
Saudi Arabia (2011)
Pakistan (2011)
Algeria (2011)
Uzbekistan (2011)
Tunisia (2008)
Jordan (2011)
Bangladesh (2011)
Syria (2006)
2,0001,000 3,000 4,000 5,000 6,000 7,0000
Resident Non-resident
Azerbaijan (2011)
Kyrgyzstan (2010)
Bahrain (2011)
Yemen (2011)
Brunei (2009)
Mozambique (2007)
Sudan (2007)
Albania (2011)
Uganda (2007)
Tajikistan (2011)
Burkina Faso (2010)
0 50 100 150 200 250
OIC
Mem
ber
Cou
ntry
OIC
Mem
ber
Cou
ntry
Patent Applications
Patent Applications
• In terms of patents granted, the OIC share is even lower. Based on the most recent available data between 2000–2011, the OIC member countries were granted 14,211 patents out of a world total of 936,266, representing 1.5% of all patents granted worldwide.

Outputs from Science and Technology in the OIC | 37
92 Source: WIPO (2013). Statistics Database. Data from most recent year available between 2000–2011. See previous caveats above.World Intellectual Property Organization: Geneva, Switzerland.
Figure 3.5 Total Patent Grants in the World by Filing Office92
1.5%
18.4%
9.0%
24.0%25.5%
10.1%
5.0%
6.6%
China
Other Non-OIC Developing
USA
Japan
Korea, Rep.
Developed EU Countries
Other Developed
OIC
During the period 2000–2011, Iran was granted 4,513 patents (31.8% of the OIC total) and Malaysia was granted 2,353 patents (16.6% of the total). Malaysia was followed by Kazakhstan and Algeria which were granted 1,887 and 1,546 patents in 2011 respectively. These four countries alone constituted 72% of the OIC total patent grants.
Notwithstanding relative bright spots such as Malaysia, these low numbers clearly demonstrate that more could be done to link the OIC’s research output to wealth creation and industry. The creation of robust intellectual property rights (IPR) regimes should be a priority across the OIC. Consideration should also be given to measuring other key indicators such as the “impact factor” of patents (the percentage of patents that are commercialised), the number of new products developed, revenues from new products, and the number of start up companies.

38 | The Atlas of Islamic World Science and Innovation Final Report
93 Source: WIPO (2013). Statistics Database. Data from most recent year available between 2000–2011. See previous caveats above.World Intellectual
Property Organization: Geneva, Switzerland.
Figure 3.6 Total Patent Grants in OIC Member Countries by Filing Office93
Iran (2006)
Malaysia (2011)
Kazakhstan (2011)
Algeria (2011)
Morocco (2011)
Turkey (2011)
Egypt (2011)
Pakistan (2011)
Saudi Arabia (2011)
Uzbekistan (2011)
Sudan (2007)
Azerbaijan (2011)
Kyrgyzstan (2010)
2,0001,000 3,000 4,000 5,0000
Bangladesh (2011)
Syria (2009)
Brunei (2009)
Mozambique (2007)
Jordan (2011)
Albania (2011)
Gambia (2007)
Tajikistan (2011)
0 20 40 60 80 100
Resident Non-resident
OIC
Mem
ber
Cou
ntry
OIC
Mem
ber
Cou
ntry
Patent Grants
Patent Grants

Outputs from Science and Technology in the OIC | 39
94 Source: World Bank (2014), World Development Indicators (WDI) Online. World Bank: Washington, DC, USA.
95 Source: World Bank (2014), World Development Indicators (WDI) Online. The data are from
the most recent year available (2000–2011). World Bank: Washington, DC, USA.
96 Day N and Muhammad A (2011). Malaysia: The Atlas of Islamic World Science and Innovation Country Case Study No. 1.
97 Day N and Muhammad A (2011). Malaysia: The Atlas of Islamic World Science and Innovation Country Case Study No. 1.
3.4 High-Technology Exports (HTE)High-technology exports (HTE) are defined as products with high R&D intensity, such as computers, pharmaceuticals, scientific instruments and electrical machinery.94 With HTE worth over US$61 billion, Malaysia accounts for over four fifths of the OIC total. Adding Indonesia, the combined contribution of these two South East Asian OIC countries is around 90% of the US$75 billion OIC HTE total. They were followed by Kazakhstan and Turkey with shares of 2.8% and 2.6%, respectively.
Figure 3.7 High-Technology Exports in OIC Member Countries95
1.2%2.6%
2.8%
81.7%
7.7%
4.1%
Malaysia
Indonesia
Kazakhstan
Turkey
Morocco
Other OIC MCs
Malaysia’s performance in this area, which far outstrips its fellow OIC countries, bears closer examination. It attracted foreign direct investment of over $10 billion in 2011 and has drawn multinational technology corporations to science parks across the country, including Dell, HP, Motorola and Ericsson.96 According to Malaysia’s government, the increase in private sector R&D expenditure has been partially stimulated by strategic grants in high-technology sectors.97
40 | The Atlas of Islamic World Science and Innovation Final Report
4 Conclusions and recommendationsSeveral conclusions emerge from this analysis. There is great diversity and disparity among the 57 member states of the OIC, and although conclusions can be drawn about the OIC as a whole and comparisons made with the rest of the world, it should be noted that such conclusions do not, and cannot, apply equally to all 57 member countries at all times.
However, some general recommendations can be made which may apply to many OIC countries:
• More OIC countries need to draw up science and technology policies to address national and international challenges and contribute to national socioeconomic development. Science and technology should be supported at the highest level in order to address critical issues such as food, water and energy security, as well as sustainable and equitable socioeconomic development.
• International scientific collaboration needs to be strengthened and promoted. The OIC is a diverse group of countries with many shared and common challenges. As many OIC nations’ R&D expenditures are low, pooling these scarce resources to more effectively meet these challenges should be encouraged. Collaboration within the OIC and with the rest of the world will also enhance the quality of scientific research, accelerate access to new markets, and allow the financial costs of research to be shared.
• More investment in R&D is needed. The OIC as a whole currently under-invests in R&D relative to its population. OIC countries account for nearly a quarter of the world’s population but contribute just 2.4% of the world’s total R&D expenditure.
• More private sector investment in R&D is required. There is currently a lower level of private sector investment in R&D in the OIC as a whole compared to the rest of the world, and in some OIC countries it is virtually non-existent.
• More investment in human capital is needed. The OIC currently only provides a small proportion of the world’s researchers relative to its population, at just over 10%. Along with increased investment in R&D, every effort should be made by OIC countries to build up institutional and human scientific capacity in order to benefit properly from any such expenditure.

Conclusions and recommendations | 41
• More OIC countries need to measure science, technology and innovation indicators. No data exist for over half the OIC countries on such crucial indicators as how much they spend on R&D, or the number of researchers in their countries. The OIC should urgently prioritise the measurement, monitoring and publication of these figures, to enable effective monitoring of national science policies and to measure progress against objectives such as those set out in Vision 1441H, the OIC’s fifteen year plan for scientific and technological development.
• Robust intellectual property (IP) regimes should be introduced and/or strengthened in order to protect the creative output of scientists, increase the number of patents filed and granted in the OIC, and strengthen links between research outputs and industry.
• The OIC member countries should focus on fostering scientific excellence and high quality research. The OIC’s share of global publications is relatively small, at nearly 6%. Additionally, patenting activity across the OIC is low, with just 1.7% of global patents filed and 1.5% of patents granted. Furthermore, the vast majority of the high-technology exports of the OIC are delivered by Malaysia, with the other OIC countries contributing less than a fifth of the total. Robust peer review systems, merit-based academic career structures, incentives which encourage the commercialisation of research, and research evaluation programmes should be established and/or supported across the OIC to ensure that further investment leads to research excellence.
Country-specific recommendations• OIC countries rich in natural resources should set up dedicated endowment
funds for science and technology. Many Gulf states such as Saudi Arabia, Qatar and the United Arab Emirates have already put significant effort into transforming themselves into knowledge economies and there are signs that investment is increasing in countries such as Kazakhstan. However, overall expenditure on R&D as a percentage of GDP for these countries remains relatively low, which suggests that more of this wealth could be channelled directly into supporting high-quality research.
• Collaboration should be encouraged between resource-rich but underpopulated OIC countries and those countries where the reverse applies. The young and talented populations in many OIC countries, when combined with the considerable wealth of the OIC’s emerging powers, could be a formidable combination if utilised correctly.
• The OIC’s more established scientific nations, such as Turkey, Tunisia, Iran and Egypt, should offer their expertise, guidance and insights to less-well developed OIC countries, which can learn much from their experiences of recent rapid growth.

42 | The Atlas of Islamic World Science and Innovation Final Report
Appendix A: Technical NoteExpenditure on research and development (R&D) is used throughout this report as a proxy for spending on science and/or research. Gross expenditure on research and development (GERD) is collated by bodies such as the OECD and UNESCO, and includes investment by government, business enterprise, and funding from other sources which can include funding by private foundations and charities. Areas of the report distinguish between the proportion of this gross expenditure spent by business (BERD), government (GOVERD) and higher education (HERD).
This is a widely used, but not entirely satisfactory proxy for science and/or research spending. A large proportion of research and development expenditure is spent on development rather than research, with the largest proportion being spent on product development. This figure therefore goes beyond the amount of money dedicated to funding research. However, it is usually assumed to have some relationship to the investment in science which preceded it.
Unless otherwise stated, figures for R&D expenditure are based on current US$ prices and purchasing power parity, as calculated by UNESCO.

Appendix | 43
Appendix B: Acronymsbn billionFDI Foreign Direct InvestmentGDP Gross Domestic ProductGCC Gulf Cooperation CouncilEU European UnionFTE Full-time EquivalentHC HeadcountIPR Intellectual Property RightsMHESRT Ministry of Higher Education and Scientific Research (Egypt)mln millionNIS National Innovation SystemOIC Organisation of Islamic CooperationPPP Purchasing Power ParityR&D Research and DevelopmentSESRIC Statistical, Economic and Social Research and Training Centre
for Islamic CountriesSTI Science and Technology IndicatorsUN United NationsUNCTAD United Nations Conference on Trade and DevelopmentUNESCO United Nations Educational, Scientific and Cultural OrganizationUNSD United Nations Statistics DivisionUSD United States DollarWDI World Development IndicatorsWIPO World Intellectual Property Organization

44 | The Atlas of Islamic World Science and Innovation Final Report
98 Merriam-Webster Dictionary (2014).
Appendix C: DefinitionsIndicator Definition
Brain Drain A situation in which many educated or professional people leave a particular place or profession and move to another one that gives them better pay or living conditions.98
Business intramural expenditure on R&D (BERD)
R&D expenditure in the business sector, where the business sector in the context of R&D statistics includes:
• All firms, organizations and institutions whose primary activity is the market production of goods or services (other than higher education) for sale to the general public at an economically significant price.
• The private non-profit institutions mainly serving them.
Full-time equivalence (FTE)
Full-time equivalence (FTE) R&D data are a measure of the actual volume of human resources devoted to R&D and are especially useful for international comparisons. One full-time equivalent may be thought of as one person-year. Thus a person who normally spends 30% of their time on R&D and the rest on other activities (such as teaching, university administration and student counselling) should be considered as 0.3 FTE. Similarly, if a full-time R&D worker is employed at an R&D unit for only six months, this results in an FTE of 0.5.
GERD (% of GDP) Total domestic intramural expenditure on R&D during a given period as a percentage of GDP (i.e. the sum of gross value added by all resident producers in the economy, including distributive trades and transport, plus any product taxes and minus any subsidies not included in the value of the products).
GERD by sector of performance (%)
Total domestic intramural expenditure on R&D during a given period, performed by institutions corresponding to each sector (business enterprise, government, higher education and private non-profit organisations), independent of the source of funds and expressed as a percentage.
GERD by source of funds (%)
Total domestic intramural expenditure on R&D during a given period, financed by different sectors of the economy (business enterprise, government, higher education, private non-profit organisations) or from abroad and expressed as a percentage.
GERD per capita Total domestic intramural expenditure on R&D during a given period per inhabitant (using mid-year population as reference).

Appendix | 45
99 OECD (2014). See http://stats.oecd.org/glossary Organisation for Economic Cooperation and Development: Paris, France.
Indicator Definition
Government intramural expenditure on R&D (GOVERD)
R&D expenditure in the government sector, which is defined as:
• All departments, offices and other bodies which furnish, but normally do not sell to the community, those common services, other than higher education, which cannot otherwise be conveniently and economically provided, as well as those that administer the state and the economic and social policy of the community. Public enterprises are included in the business enterprise sector.
• The non-profit institutions (NPIs) controlled and mainly financed by government but not administered by the higher education sector.
Gross domestic expenditure on R&D (GERD)
Total domestic intramural expenditure on R&D during a given period.
Headcount (HC) Data on the total number of persons who are mainly or partially employed in R&D. This includes both full-time and part-time staff. Headcount data reflect the total number of persons employed in R&D, independently from their dedication. These data allow links to be made with other data series, such as education and employment data, or the results of population censuses. They are also the basis for calculating indicators analysing the characteristics of the R&D workforce with respect to age, gender or national origin.
Higher education intramural expenditure on R&D (HERD)
R&D expenditure in the higher education sector, which is defined as:
• All universities, colleges of technology and other institutions of post-secondary education, whatever their source of finance or legal status.
• It also includes all research institutes, experimental stations and clinics operating under the direct control of or administered by or associated with higher education institutions.
High-technology exports (current US$)
High-technology exports are products with high R&D intensity, such as aerospace products, computers, pharmaceuticals, scientific instruments, and electrical machinery. Data are in current U.S. dollars.
Intramural expenditure
Intramural expenditures are all expenditures for research and development (R&D) performed within a statistical unit or sector of the economy during a specific period, whatever the source of funds.
Expenditures made outside the statistical unit or sector but in support of intramural R&D (e.g. purchase of supplies for R&D) are included. Both current and capital expenditures are included.99

46 | The Atlas of Islamic World Science and Innovation Final Report
Indicator Definition
Intellectual property (IP)
Creations of the mind: inventions, literary and artistic works, and symbols, names, images and designs used in commerce. IP is divided into two categories: industrial property, which includes patents, trademarks, industrial designs and geographical indications of source; and copyright, which includes literary and artistic works such as novels, poems and plays, films, musical works, artistic works such as drawings, paintings, photographs and sculptures, and architectural designs. Rights related to copyright include those of performing artists in their performances, producers of phonograms in their recordings, and those of broadcasters in their radio and television programmes.
Patent A set of exclusive rights granted by law to applicants for inventions that are new, non-obvious and commercially applicable. It is valid for a limited period of time (generally 20 years), during which patent holders can commercially exploit their inventions on an exclusive basis. In return, applicants are obliged to disclose their inventions to the public in a manner that enables others, skilled in the art, to replicate the invention. The patent system is designed to encourage innovation by providing innovators with time-limited exclusive legal rights, thus enabling innovators to reap the benefits of their innovative activity.
Patent grant Exclusive IP rights conferred to an applicant by an IP office. For example, patents are granted to applicants (assignees) to make use of and exploit an invention for a limited period of time. The holder of the rights can prevent unauthorized use of the invention.
Patent application Patent applications, as defined here, are worldwide patent applications filed through the Patent Cooperation Treaty procedure or with a national patent office for exclusive rights for an invention – a product or process that provides a new way of doing something or offers a new technical solution to a problem.
Patent application by non-resident
An application filed with a patent office of a given country/jurisdiction by an applicant residing in another country/jurisdiction. For example, a patent application filed with the United States Patent and Trademark Office (USPTO) by an applicant residing in France is considered a non-resident application for the USPTO. Non-resident applications are sometimes also referred to as foreign applications. A non-resident grant is a patent granted on the basis of a non-resident application.
Patent application by resident
An application filed with an intellectual property (IP) office by an applicant residing in the country/region in which that office has jurisdiction. For example, an application filed with the Japan Patent Office (JPO) by a resident of Japan is considered a resident application to the JPO. Resident applications are sometimes referred to as domestic applications. A resident grant/registration is an IP right issued on the basis of a resident application.

Appendix | 47
Indicator Definition
Private non-profit sector
The Private non-profit sector in the context of R&D statistics includes:
• Non-market, private non-profit institutions serving households (i.e. the general public).
• Private individuals or households.
Purchasing power parity (PPP)
The currency exchange rate that equalises the purchasing power of different currencies. This means that a given sum of money, when converted into U.S. dollars at the PPP exchange rate (PPP dollars), will buy the same basket of goods and services in all countries. In other words, PPP is the rate of currency conversion which eliminates the differences in price levels among countries. Thus, comparisons between countries reflect only differences in the volume of goods and services purchased.
Research and development (R&D)
Creative work undertaken on a systematic basis in order to increase the global stock of knowledge, including knowledge of humanity, culture and society, and the use of this stock of knowledge to devise new applications. The term R&D covers three activities: basic research, applied research and experimental development.
Researchers Professionals engaged in the conception or creation of new knowledge, products, processes, methods and systems, as well as in the management of these projects. Postgraduate PhD students (ISCED97 level 6) engaged in R&D are included.
Researchers per million inhabitants
The total number of researchers in R&D divided by the total population (using the mid-year population as reference) and multiplied by one million.

48 | The Atlas of Islamic World Science and Innovation Final Report
Appendix D: Classification of CountriesOIC (57) Afghanistan, Albania, Algeria, Azerbaijan, Bahrain, Bangladesh,
Benin, Brunei Darussalam, Burkina Faso, Cameroon, Chad, Comoros, Côte d’Ivoire, Djibouti, Egypt, Gabon, Gambia, Guinea, Guinea-Bissau, Guyana, Indonesia, Iran, Iraq, Jordan, Kazakhstan, Kuwait, Kyrgyz Republic, Lebanon, Libya, Malaysia, Maldives, Mali, Mauritania, Morocco, Mozambique, Niger, Nigeria, Oman, Pakistan, Palestine, Qatar, Saudi Arabia, Senegal, Sierra Leone, Somalia, Sudan, Suriname, Syria, Tajikistan, Togo, Tunisia, Turkey, Turkmenistan, Uganda, United Arab Emirates, Uzbekistan, Yemen
Non-OIC Developing (or Non-OIC Emerging)
Angola, Antigua and Barbuda, Argentina, Armenia, The Bahamas, Barbados, Belarus, Belize, Bhutan, Bolivia, Bosnia and Herzegovina, Botswana, Brazil, Bulgaria, Burundi, Cambodia, Cape Verde, Central African Republic, Chile, China, Colombia, Democratic Republic of the Congo, Republic of Congo, Costa Rica, Croatia, Dominica, Dominican Republic, Ecuador, El Salvador, Equatorial Guinea, Eritrea, Ethiopia, Fiji, Georgia, Ghana, Grenada, Guatemala, Haiti, Honduras, Hungary, India, Jamaica, Kenya, Kiribati, Kosovo, Lao PDR, Latvia, Lesotho, Liberia, Lithuania, FYR Macedonia, Madagascar, Malawi, Marshall Islands, Mauritius, Mexico, Micronesia, Moldova, Mongolia, Montenegro, Myanmar, Namibia, Nepal, Nicaragua, Panama, Papua New Guinea, Palau, Paraguay, Peru, Philippines, Poland, Romania, Russia, Rwanda, Samoa, São Tomé and Príncipe, Serbia, Seychelles, Solomon Islands, South Africa, South Sudan, Sri Lanka, St. Kitts and Nevis, St. Lucia, St. Vincent and the Grenadines, Swaziland, Tanzania, Thailand, Timor-Leste, Tonga, Trinidad and Tobago, Tuvalu, Ukraine, Uruguay, Vanuatu, Venezuela, Vietnam, Zambia, Zimbabwe.
Developed (or Advanced)
Australia, Austria, Belgium, Canada, Cyprus, Czech Republic, Denmark, Estonia, Finland, France, Germany, Greece, Hong Kong, Iceland, Ireland, Israel, Italy, Japan, Korea, Luxembourg, Malta, Netherlands, New Zealand, Norway, Portugal, San Marino, Singapore, Slovak Republic, Slovenia, Spain, Sweden, Switzerland, Taiwan, United Kingdom, United States of America.
Source: IMF (2013). World Economic Outlook. See http://www.imf.org. International Monetary Fund: Washington, DC, USA.
Appendix | 49
AcknowledgementsWe would like to thank the following individuals who reviewed this report prior to publication:
• Professor Yunus A. Çengel, Dean of the Faculty of Mechanical Engineering and the Director of the Energy Center at Yildiz Technical University in Istanbul, Turkey, and Professor Emeritus at the University of Nevada, Reno, USA
• Professor Sir Roy Anderson FRS, Professor of Infectious Disease Epidemiology, Imperial College London
• Dr. Hüseyin Güler, Head of Science, Technology and Innovation Policy Department, The Scientific and Technological Research Council of Turkey (TÜBİTAK)
• Professor Sir Magdi Yacoub KBE FRS, Professor of Cardiothoracic Surgery, Imperial College London
• Professor Moneef Zou’bi, Director General, Islamic World Academy of Sciences (IAS)
• Professor Atta ur Rahman FRS, President, Pakistan Academy of Sciences and President, Network of Academies of Sciences of Islamic Countries
The reviewers were not asked to endorse the conclusions or recommendations of the report. Thanks also go to Susan Gillespie, Keri Hildick, Peter Gallimore and Franck Fourniol who worked on the report at the Royal Society.

Most analyses of the status of science in the Islamic world tend to take two starting points: the rich heritage of the ‘golden age’ of Islamic civilisation between the mid-8th to the mid-13th centuries; and the ‘scientifically lagging’ status of science in the Islamic world today. The ancient and modern positions are frequently compared and contrasted. Many theories have been put forward to account for the apparent decline and a number of historical, political, cultural and economic factors have been suggested as possible explanations. To reverse this trend, a climate that is supportive of science and technology is needed.
This report is concerned with the current status of science in the Islamic world. It takes the form of a statistics-based analysis of science, technology and innovation indicators across the 57 member countries of the Organisation of Islamic Cooperation (OIC), which are used in this report as a proxy for the Islamic world. In its “Vision 1441H”, a 15 year plan for scientific and technological development, the OIC acknowledged that “the Muslim world is facing a knowledge gap because of its deficiency in science, technology and innovation”, and set itself an ambition of achieving 14% of the world’s scientific output by 2020, and 1.4% of GDP spent on R&D by 2020. This was complemented by a Ten Year Programme of Action, launched in 2005, which pledged to prioritise science and technology and called upon member states to spend 1% of GDP on R&D by 2015.
This is the final report of the Atlas of Islamic World Science and Innovation project, which has brought together diverse partners from Europe, North America and the Islamic world to explore the changing dynamics of science and innovation in a wide range of countries with large Muslim populations in the Middle East, Africa and Asia. It has done so at a time of momentous political change, the implications of which for science and technology are far from certain.
9 781782 521051