The association between mathematics pedagogy and learners’ dispositions for university study
25
This article was downloaded by: [The University of Manchester Library] On: 27 July 2012, At: 09:43 Publisher: Routledge Informa Ltd Registered in England and Wales Registered Number: 1072954 Registered office: Mortimer House, 37-41 Mortimer Street, London W1T 3JH, UK British Educational Research Journal Publication details, including instructions for authors and subscription information: http://www.tandfonline.com/loi/cber20 The association between mathematics pedagogy and learners’ dispositions for university study Maria Pampaka a , Julian Williams a , Graeme Hutcheson a , Geoff Wake a , Laura Black a , Pauline Davis a & Paul Hernandez‐Martinez a a University of Manchester, Manchester, UK Version of record first published: 24 Jun 2011 To cite this article: Maria Pampaka, Julian Williams, Graeme Hutcheson, Geoff Wake, Laura Black, Pauline Davis & Paul Hernandez‐Martinez (2012): The association between mathematics pedagogy and learners’ dispositions for university study, British Educational Research Journal, 38:3, 473-496 To link to this article: http://dx.doi.org/10.1080/01411926.2011.555518 PLEASE SCROLL DOWN FOR ARTICLE Full terms and conditions of use: http://www.tandfonline.com/page/terms-and- conditions This article may be used for research, teaching, and private study purposes. Any substantial or systematic reproduction, redistribution, reselling, loan, sub-licensing, systematic supply, or distribution in any form to anyone is expressly forbidden. The publisher does not give any warranty express or implied or make any representation that the contents will be complete or accurate or up to date. The accuracy of any instructions, formulae, and drug doses should be independently verified with primary sources. The publisher shall not be liable for any loss, actions, claims, proceedings, demand, or costs or damages whatsoever or howsoever caused arising directly or indirectly in connection with or arising out of the use of this material.
-
Upload
nottingham -
Category
Documents
-
view
1 -
download
0
Transcript of The association between mathematics pedagogy and learners’ dispositions for university study

This article was downloaded by: [The University of Manchester Library]On: 27 July 2012, At: 09:43Publisher: RoutledgeInforma Ltd Registered in England and Wales Registered Number: 1072954 Registeredoffice: Mortimer House, 37-41 Mortimer Street, London W1T 3JH, UK
British Educational Research JournalPublication details, including instructions for authors andsubscription information:http://www.tandfonline.com/loi/cber20
The association between mathematicspedagogy and learners’ dispositions foruniversity studyMaria Pampaka a , Julian Williams a , Graeme Hutcheson a , GeoffWake a , Laura Black a , Pauline Davis a & Paul Hernandez‐Martineza
a University of Manchester, Manchester, UK
Version of record first published: 24 Jun 2011
To cite this article: Maria Pampaka, Julian Williams, Graeme Hutcheson, Geoff Wake, Laura Black,Pauline Davis & Paul Hernandez‐Martinez (2012): The association between mathematics pedagogyand learners’ dispositions for university study, British Educational Research Journal, 38:3, 473-496
To link to this article: http://dx.doi.org/10.1080/01411926.2011.555518
PLEASE SCROLL DOWN FOR ARTICLE
Full terms and conditions of use: http://www.tandfonline.com/page/terms-and-conditions
This article may be used for research, teaching, and private study purposes. Anysubstantial or systematic reproduction, redistribution, reselling, loan, sub-licensing,systematic supply, or distribution in any form to anyone is expressly forbidden.
The publisher does not give any warranty express or implied or make any representationthat the contents will be complete or accurate or up to date. The accuracy of anyinstructions, formulae, and drug doses should be independently verified with primarysources. The publisher shall not be liable for any loss, actions, claims, proceedings,demand, or costs or damages whatsoever or howsoever caused arising directly orindirectly in connection with or arising out of the use of this material.
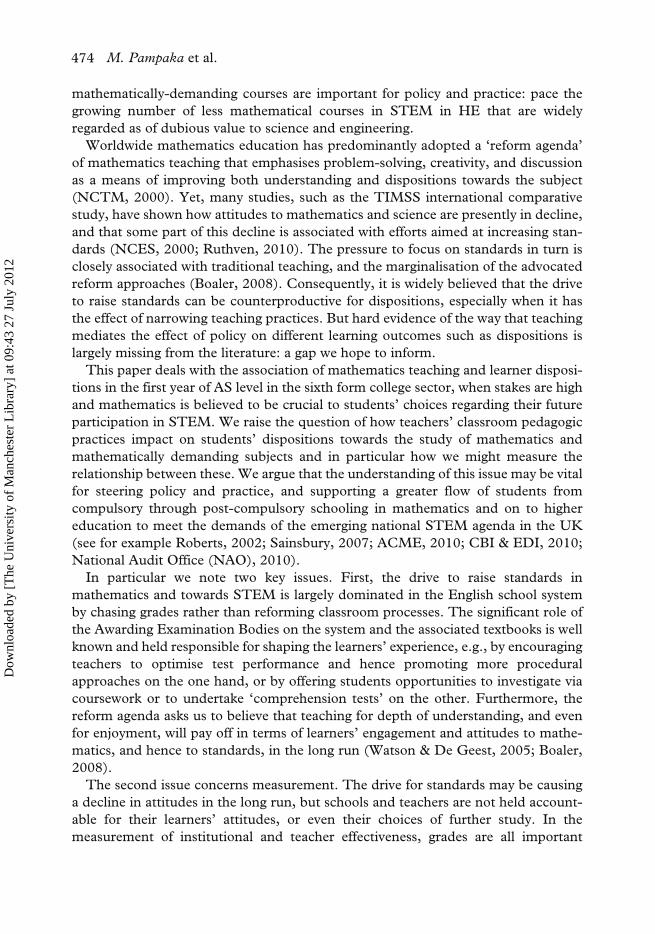
British Educational Research Journal
ISSN 0141-1926 (print)/ISSN 1469-3518 (online)/12/030473-24© 2012 British Educational Research Association
The association between mathematics pedagogy and learners’ dispositions for university studyMaria Pampaka*, Julian Williams, Graeme Hutcheson, Geoff Wake, Laura Black, Pauline Davis and Paul Hernandez-MartinezUniversity of Manchester, Manchester, UKTaylor and FrancisCBER_A_555518.sgm10.1080/01411926.2011.555518British Education Research Journal0141-1926 (print)/1469-3518 (online)Original Article2011Taylor & [email protected]
We address the current concerns about teaching-to-the-test and its association with decliningdispositions towards further study of mathematics and the consequences for choice of STEM sub-jects at university. In particular, through a mixed study including a large survey sample of over 1000students and their teachers, and focussed qualitative case studies, we explored the impact of ‘trans-missionist’ pedagogic practices on learning outcomes. We report on the construction and validationof a scale to measure teachers’ self-reported pedagogy. We then use this measure in combinationwith the students’ survey data and through regression modelling we illustrate significant associationsbetween the pedagogic measure and students’ mathematics dispositions. Finally, we discuss thepotential implications of these results for mathematics education and the STEM agenda.
Introduction
Participation in advanced level study of mathematics post-16 is increasing in line withthe growth of participation in post-compulsory education as a whole, but participa-tion in mathematics and STEM (science, technology, engineering and mathematics)generally remains problematic with many youngsters seemingly ill-disposed towardsthem. With an ambitious government target of 80,000 higher education (HE) STEMentries per year by 2014 attention must be increasingly turned to students’ attitudesand not only to grades. According to a recent report (NAO, 2010) the efforts topromote mathematics and science take-up in schools ‘had only patchy success’. Itmay be that new government policies to stop funding non-STEM programmes solvesany real STEM shortage, but we would still argue that dispositions to study
*Corresponding author. School of Education, Room B4,10 Ellen Wilkinson Building, University ofManchester, Oxford Road, Manchester, M13 9PL, UK. Email: [email protected]
http://dx.doi.org/10.1080/01411926.2011.555518
Vol. 8, No. 3, June 2012, pp. 473–4963
Dow
nloa
ded
by [
The
Uni
vers
ity o
f M
anch
este
r L
ibra
ry]
at 0
9:43
27
July
201
2
2 M. Pampaka et al.
mathematically-demanding courses are important for policy and practice: pace thegrowing number of less mathematical courses in STEM in HE that are widelyregarded as of dubious value to science and engineering.
Worldwide mathematics education has predominantly adopted a ‘reform agenda’of mathematics teaching that emphasises problem-solving, creativity, and discussionas a means of improving both understanding and dispositions towards the subject(NCTM, 2000). Yet, many studies, such as the TIMSS international comparativestudy, have shown how attitudes to mathematics and science are presently in decline,and that some part of this decline is associated with efforts aimed at increasing stan-dards (NCES, 2000; Ruthven, 2010). The pressure to focus on standards in turn isclosely associated with traditional teaching, and the marginalisation of the advocatedreform approaches (Boaler, 2008). Consequently, it is widely believed that the driveto raise standards can be counterproductive for dispositions, especially when it hasthe effect of narrowing teaching practices. But hard evidence of the way that teachingmediates the effect of policy on different learning outcomes such as dispositions islargely missing from the literature: a gap we hope to inform.
This paper deals with the association of mathematics teaching and learner disposi-tions in the first year of AS level in the sixth form college sector, when stakes are highand mathematics is believed to be crucial to students’ choices regarding their futureparticipation in STEM. We raise the question of how teachers’ classroom pedagogicpractices impact on students’ dispositions towards the study of mathematics andmathematically demanding subjects and in particular how we might measure therelationship between these. We argue that the understanding of this issue may be vitalfor steering policy and practice, and supporting a greater flow of students fromcompulsory through post-compulsory schooling in mathematics and on to highereducation to meet the demands of the emerging national STEM agenda in the UK(see for example Roberts, 2002; Sainsbury, 2007; ACME, 2010; CBI & EDI, 2010;National Audit Office (NAO), 2010).
In particular we note two key issues. First, the drive to raise standards inmathematics and towards STEM is largely dominated in the English school systemby chasing grades rather than reforming classroom processes. The significant role ofthe Awarding Examination Bodies on the system and the associated textbooks is wellknown and held responsible for shaping the learners’ experience, e.g., by encouragingteachers to optimise test performance and hence promoting more proceduralapproaches on the one hand, or by offering students opportunities to investigate viacoursework or to undertake ‘comprehension tests’ on the other. Furthermore, thereform agenda asks us to believe that teaching for depth of understanding, and evenfor enjoyment, will pay off in terms of learners’ engagement and attitudes to mathe-matics, and hence to standards, in the long run (Watson & De Geest, 2005; Boaler,2008).
The second issue concerns measurement. The drive for standards may be causinga decline in attitudes in the long run, but schools and teachers are not held account-able for their learners’ attitudes, or even their choices of further study. In themeasurement of institutional and teacher effectiveness, grades are all important
474
Dow
nloa
ded
by [
The
Uni
vers
ity o
f M
anch
este
r L
ibra
ry]
at 0
9:43
27
July
201
2
Mathematics pedagogy and learners’ dispositions 3
outcomes, while dispositions and future trajectories, are rarely, if ever, counted oreven recorded. Thus, to understand and intervene in this high stakes debate, we musttackle the issue of the measurement of attitudes and choices, and show their connec-tion to teaching practices.
Therefore, we report the construction and validation of a specially designedinstrument to measure teacher-centredness or ‘transmissionist’ pedagogy. We thenexplore the association between the level of teachers’ transmissionism and students’learning outcomes including dispositions. We describe how the development of thisinstrument involved recursive cycles of qualitative interpretation and statisticalmodelling, and the role that the validation process plays in helping our research toquestion or substantiate claims about widening participation in mathematics. Thequalitative data emanate from case studies of classrooms and institutional practicesin five colleges, while the quantitative data come from surveys of up to 1800 studentstaught in approximately 100 classrooms by over 90 teachers in 39 colleges. Thus, thestudy explores and measures the effects of pedagogic practice and involves theinterplay of these different quantitative and qualitative data sources, with an emphasison quantitative results.
Pedagogic practices: towards a conceptual framework
When one attempts to conceptualise pedagogic practices one faces a vast amount ofliterature, coming from different perspectives. From one standpoint we have the liter-ature on the intertwining of teaching and learning into ‘a single entity’ (Shuell, 1993,p. 291; Vermunt & Verloop, 1999). Research on classroom learning environmentshas evolved to address this question, and found moderate positive associationsbetween the learning environment and students’ attitudes to mathematics. Under thesame research agenda, Roelofs et al. (2003) report on six dimensions in which learn-ing environments can differ describing them as opposites. However, the authors stressthat these can also be considered as continua with two extremes, representing atraditional, transmission model for the latter opposite each time (e.g., constructionversus transmission of knowledge, personal versus teacher-led meaning, etc). Other‘opposites’ to transmission are quite often met in literature that contrasts some kindof reform teaching with the existing dominant ‘traditional’ practice: ‘facilitating’ asagainst ‘telling’; ‘direct’ versus ‘indirect’ instruction (Westerhof, 1992); ‘scaffolding’(from a Vygotskian perspective), ‘individualised diagnostic learning approaches’(Bell, 1993); discussion-based approaches (Swan, 2000); guided discovery teachingapproach; and ‘dialogic mathematics teaching’ (Ryan & Williams, 2007).
A very common categorisation of classroom practices in the relevant literature isthat between ‘teacher-centred’ and ‘learner-centred’ instruction or practices. Bothare broadly applied to include a variety of views and strategies for teaching andlearning (Cuban, 1983; Kember & Gow, 1994). The first, according to Schuh(2004), is usually associated with ‘transmission’ models of teaching where teacherand instruction are the focus, whereas ‘learner-centred’ practices move the focus tostudents and learning outcomes.
475
Dow
nloa
ded
by [
The
Uni
vers
ity o
f M
anch
este
r L
ibra
ry]
at 0
9:43
27
July
201
2

4 M. Pampaka et al.
It is now a widely accepted premise in the English mathematics education commu-nity, as represented by the Advisory Committee on Mathematics Education (ACME)and the National Centre for Excellence in Teaching Mathematics (NCETM)communities (and similar professional communities in relation to US mathematicseducation reforms) that effective mathematics teaching should be connectionist intwo senses:
● connecting teaching to students’ mathematical understandings, and productions(hence student-centred, but also involving assessment for learning, dialogic anddiscussion-based communicative mathematics); and
● connecting teaching and learning across mathematics’ topics, and between math-ematics and other (e.g., scientific) knowledge.
There is, therefore, currently much rhetoric that favours connectionist pedagogicpractices at all levels of mathematics education in the UK. In some ways this appearsas ‘a given’ and permeates in a subtle way much ‘official’ writing that is influential inthe policy debate. For example, ACME, in a recent report to inform the STEM HighLevel Strategy Group, write, ‘There is strong support for a pluralistic approach tomathematics in the classroom, including open ended investigative work, group workand oral presentations’ (ACME, 2009, p. 9). The most recent overview of mathemat-ics education across compulsory and post-compulsory schooling from Ofsted recom-mends that the DCSF and National Strategies should ‘devise guidance for teacherson the effective use of mathematics-specific pedagogy to aid the development ofpupils’ understanding’ (Ofsted, 2008, p. 8).
Ofsted also highlights ‘inadequate teaching’ as a frequent phenomenon, andalso states that ‘too much teaching is just satisfactory and fails to inspire, chal-lenge and extend children, young people and adult learners’ (Ofsted, 2009, p. 8).Nonetheless, whilst there have been major interventions supporting pedagogicpractices in the teaching of mathematics in both primary and secondary phasesthrough the National Numeracy and National Strategies there has been nothingon a similar scale to support teachers of post-16 students. With a few exceptions(notably Swan, 2005), large-scale curriculum development of the type under-taken in the 1990s by groups such as the School Mathematics Project (SMP),has, in recent years, been noticeably absent, with influential stakeholders in thepolicy debate usually focussing instead on structures and systems in relation to ASand A level. The targets of greater participation in A level mathematics for exam-ple look to support mechanisms such as the Further Mathematics SupportProgramme (formerly Further Mathematics Network) and discussion of the struc-tural design of A level programmes as providing an answer (Sainsbury, 2007;ACME, 2009, 2010).
What seems to be missing from the debate is an informed analysis of teachers’pedagogy at this level and the impact that this has on student outcomes in terms notonly of attainment in, but also developing dispositions towards, mathematics andmathematically demanding subjects. It is this under-researched area that we seek toinform and understand.
476
Dow
nloa
ded
by [
The
Uni
vers
ity o
f M
anch
este
r L
ibra
ry]
at 0
9:43
27
July
201
2

Mathematics pedagogy and learners’ dispositions 5
The need for a measure of pedagogic practice: the context of this study
The context of this study is provided by a widening participation research projectwhich aimed to understand how learning and teaching can help deepen engagementin mathematically demanding courses in further and higher education, and indeed tomeasure the effect on learner outcomes of pedagogy and programmes designed towiden participation. The project contrasted a traditional mathematics programmewith a new ‘Use of Mathematics’ programme in England at ‘AS’ level, i.e., forstudents usually aged 16–19 who have completed compulsory schooling and havechosen to study some advanced mathematics. The ‘traditional’ AS (hereafterASTrad) programme is designed to help students prepare for mathematically-demanding degree courses in university. The new ‘Use of Mathematics’ (hereafterUoM) programme is designed to widen participation to include those who may ormay not progress into very mathematical courses and who may not have as strong aprior mathematical attainment as those opting for the ASTrad programme (whichleads to a full A level in contrast to UoM which terminates1 with an AS qualification,that is, after only one-year of advanced study). The overarching intent of the UoMcourse is to make mathematics more accessible to a wider range of students by provid-ing opportunities for students to develop understanding through ‘uses’ of mathemat-ics, mathematical modelling, uses of technology (e.g., graphic calculators andspreadsheets) and non-traditional assessment (e.g., comprehension tests andcoursework). Collectively we conceptualise these as ‘modelling and communicative’mathematical practices. We found (Williams et al., 2008) that this programme‘works’ for retention, and that it enables students with weaker mathematicsbackground to achieve some success in post-compulsory mathematics up to the ASlevel (see Table 1).
Table 1. Dropout and U-grade frequencies and percentages within GCSE grade, by course
GCSE grade
Course outcome A* and A BHigher BIntermediate CHigher CIntermediate Total
ASTrad Total Number
366 285 231 39 75 996
Dropout 32 (9%) 54 (19%) 69 (30%) 11 (28%) 33 (44%) 199 (20%)U grade 29 (8%) 96 (34%) 68 (30%) 14 (36%) 27 (36%) 234 (23.5%)Combined 61 (17%) 150 (53%) 137 (60%) 25 (64%) 60 (80%) 433 (43.5%)
UoM Total Number
16 54 113 38 118 340
Dropout 1 (6%) 8 (15%) 10 (9%) 10 (26%) 26 (22%) 55 (16%)U-grade 1 (6%) 4 (7%) 16 (14%) 10 (26%) 30 (25%) 61 (18%)Combined 2 (12%) 12 (22%) 26 (23%) 20 (52%) 56 (47%) 116 (34%)
Note: ‘Higher’ and ‘Intermediate’ refer to GCSE tiers. At the time of the study it was possible to attain a gradeA*–D by sitting ‘Higher’ tier examination papers that examined appropriate material or a grade B–E by sitting‘Intermediate’ tier papers that examined material appropriate to these grades.
477
Dow
nloa
ded
by [
The
Uni
vers
ity o
f M
anch
este
r L
ibra
ry]
at 0
9:43
27
July
201
2

6 M. Pampaka et al.
In our case study colleges we had the opportunity to observe teaching and learningon both ASTrad and UoM programmes in some considerable detail, and to use ananalytic framework that includes dimensions of pedagogic practices to make sense ofthe ways in which teachers engage students in learning (Williams et al., 2009). Thisallowed us to identify ways in which the different mathematics programmes mightconstrain or afford different pedagogies and learning approaches. In fact, we observedthat while most traditional teaching is transmissionist and teacher-centred, there wereteachers of the ASTrad mathematics programme who described their teaching asconnectionist and whose practices we observed to be consistent with this description.This connectionist approach was student-centred and involved students in conceptu-ally-focussed discussions which are certainly communicative, but not necessarily use-or modelling-orientated. The connectionist approach that these teachers adhered tosits comfortably within the reform agenda and is seen as a means of engaging learners,and is believed to be significant in widening participation in mathematics (Swan,2005; Watson & De Geest, 2005). We therefore wondered if this pedagogic approachmight (a) be more important than the programme, or (b) interact with the programmebeing taught (i.e., UoM versus ASTrad) in its impact on learning outcomes.
However, it was clearly impractical to measure teachers’ practices directly throughobservation across the wider sample of some 30 plus additional colleges: our solutionwas to develop an instrument to measure the balance of the pedagogies a teacheremploys (according to the teacher’s self-report) which can be used as an explanatoryvariable in modelling the students’ dispositions and achievement (as will be presentedin more detail below). We should note here Argyris and Schon’s (1978; Schon, 1990)distinction between ‘espoused theories’ and ‘theories in action’. In this context, wemust think of the teachers’ self-report as being their account for us of what they do,refracting their espoused theory of teaching practice, through the items in theinstrument that refer them to their concrete, practical actions. The best we could doto validate these evaluations was to triangulate our observations of the teachers’ prac-tices and approach with their self-reports; this we endeavoured to do through our casestudy work. It should be noted that even though we could have collected students’perceptions of these practices (as well), this was impractical for our project given theexisting length of our student surveys.
We therefore set about measuring pedagogic practice and its association withlearning outcomes, especially dispositions. The research questions are twofold:
● Can/how can we measure ‘teacher-centred’ or ‘transmissionist’ pedagogicpractice?
● How is pedagogic practice associated with learners’ dispositions for further study?
Following a description of our methodology, in the main part of the paper we dealwith the validation procedures employing a Rasch measurement approach andtriangulation of these results with qualitative data from interviews with some of theteachers involved in our case studies. Finally, we illustrate some implications fromthe use of this measure of pedagogy, through the association between the measuredpractices with students’ mathematics disposition and other learning outcomes.
478
Dow
nloa
ded
by [
The
Uni
vers
ity o
f M
anch
este
r L
ibra
ry]
at 0
9:43
27
July
201
2

Mathematics pedagogy and learners’ dispositions 7
Methodology: instrument development and validation procedures
Teacher instrument development
A review revealed a variety of instruments designed to measure classroom pedagogy,either based on the above distinctions or more generally oriented (e.g., Fraser, 1998;McCaffrey et al., 2001; Swanson & Stevenson, 2002; Roelofs et al., 2003; Webster &Fisher, 2003). None of these instruments fulfilled our needs, either because they arenot applicable to the British post-compulsory system or because they were notdeveloped for mathematics lessons. They mostly focus on measuring teachers’ beliefsrather than practices and they are usually targeted at the teaching of younger studentsin compulsory schooling.
For our study, in post-compulsory, ‘advanced’ level mathematics college classrooms,the work of Swan (2006) was particularly appropriate. Conceptually, Swan built onthe research findings of Askew et al. (1997) and Ernest (1991) as a basis for the devel-opment of his instruments and the interpretation of his results. He adapted threecomponents that can be used to characterise the teachers’ belief system (i.e., the natureof mathematics as a subject, the nature of mathematics teaching and the nature of theprocesses of learning mathematics). From the work of Askew and colleagues he derivedthe ‘ideal’ categories of teachers’ orientation towards each component (i.e., transmis-sion, discovery and connectionist). We decided to use the items of Swan’s ‘practicescale’ (Swan, 2006) because this instrument was designed to evaluate the implemen-tation of a national development project aiming to promote students’ understandingthrough collaboration and discussion using a population of mathematics sixth formcollege teachers with almost exactly the same characteristics as those involved in ourstudy: therefore the items were highly appropriate for our target teacher population.
An analysis of Swan’s (2006) original data with 120 teachers showed acceptable fitto a one-dimensional scale using Rasch modelling techniques but suggested somemodifications. A revised version of the instrument was then given to a teachers’ seminarto test its face validity. The items were presented in the form of statements asking teach-ers to report the frequency with which certain activities take place in their classroom(using a five-point scale: almost never, occasionally, about half the time, most of thetime, almost always). The usability and functionality of the stem of the items wasdiscussed with the teachers and it was clear to them that they had to nominate thefrequencies of the various activities in their lessons. Following from this, one can thenassume that if they said they ‘practice examples’ ‘most of the time’ this would meanthat they include ‘practice examples’ in most lessons, and it does not exclude them fromalso doing other things (like discussing students’ ideas) ‘most of the time’ also. Theusefulness of the instrument was also discussed and teachers commented on the presen-tation and meaningfulness of the items. This led to the final instrument of 28 items.2
Methodological framework for validation
By ‘validation process’ we refer to the accumulation of evidence to support validityarguments. Our psychometric analysis for this purpose was conducted within the
479
Dow
nloa
ded
by [
The
Uni
vers
ity o
f M
anch
este
r L
ibra
ry]
at 0
9:43
27
July
201
2

8 M. Pampaka et al.
Rasch measurement framework and therefore we follow the guidelines summarisedby Wolfe and Smith Jr. (2007) based on Messick’s (1988, 1989) validity definitions.In sum, we employ a measurement perspective on validity, drawing on the meansprovided by Rasch modelling, and interpreting our statistical results with qualitativeevidence and judgement.
We do not intend to rehearse the debate held (mainly in the 1980s) regarding thevalidity and use of Rasch models in general (Bryce, 1981; Goldstein, 1979; Goldstein& Blinkhorn, 1982; Preece, 1980). Our views were summarised in Williams and Ryan(2000) and are consistent with those of Panayides et al. (2009). The model is widelyused internationally in educational assessment and even more widely in healthsciences; Rasch models have been commonly used and discussed in the academicmeasurement literature as well. We prefer instead to discuss the applicability of themore rarely used Rasch Rating Scale model (RSM) to the purpose of the pedagogicmeasure.
The Rasch model was selected because it provides the means for constructing inter-val measures from raw data and because the total raw score is sufficient for estimationof measures. In its simplest form (i.e., for dichotomous responses) the modelproposes a mathematical relationship between a person’s ability, the difficulty of thetask, and the probability of the person succeeding on that task. The Rasch model inthis case will help us construct simple, fit for purpose, one-dimensional measures. Inour case, the data from the teachers’ survey were analysed using the one-parameterRasch rating scale model3 (RSM), which is an extension of the simple Rasch modelto rating scale observations like ours (i.e., with five ordered response categories:almost never, occasionally, about half the time, most of the time, almost always). Themodel allows the item ‘difficulty’ (in our case the endorsement of each practice state-ment) to be based on the way in which an appropriate group of subjects (i.e., theteachers) actually responded to that question. The model establishes the relativedifficulty of each item stem in recording the development of an attitude from thelowest to the highest levels the instrument is able to record (Andrich, 1999; Bond &Fox, 2001; Wright & Mok, 2000). It should also be noted that for the purposes of thisanalysis and in order for results to be meaningful, the scoring of the more student-centred items was reversed (e.g., the responses to item ‘I try to cover everything in atopic’ were coded as ‘1’ = ‘almost never’ and ‘5’ = ‘almost always’, whereas theresponses to the item ‘Students invent their own method’ were coded in reverse, i.e.,‘5’ = ‘almost never’ and ‘1’ = ‘almost always’).
Data sources
The distribution of the student sample regarding gender and their mathematicscourse at the beginning of the academic year 2006–2007 is shown in Table 2. Mostof the results regarding students’ surveys are based on the analysis of data from thefirst two data points of our longitudinal study (DP1 and DP2). In summary, datacome from a sample of 1792 AS students from 39 different institutions during the2006–2007 academic year. Some results are based on analysis of further data
480
Dow
nloa
ded
by [
The
Uni
vers
ity o
f M
anch
este
r L
ibra
ry]
at 0
9:43
27
July
201
2

Mathematics pedagogy and learners’ dispositions 9
collected at the beginning of the next academic year (i.e., DP3), with 608 of thestudents of our initial sample (i.e., DP1).
The teachers’ instrument was sent to the teachers of the students involved in ourstudent survey, as part of DP2. Teachers were asked to complete one survey for eachof the mathematics classes involved in our study that they teach, so that studentscould be matched to the corresponding teacher’s practice. Data for this paper comefrom 110 ‘cases’ of pedagogy from 31 of the 39 further education colleges in oursample in England. We use ‘case’ (for most of the analyses) instead of ‘teachers’because teachers were asked to report a different survey for each of the surveyedclasses that they taught, hence our unit of analysis is a classroom case of pedagogy.There were a total of 95 individual teachers in our sample, and 12 of them respondedmore than once (nine for two different classes and three for three different classes).Some of the teachers surveyed teach both the ASTrad as well as the UoM course. Intotal we have 31 cases of UoM pedagogy and 78 of ASTrad. We additionally draw oninterviews and observations of pedagogy with nine of the teachers from our five casestudy colleges.
Results of instrument validation and measure construction: the teachers’ self-reported practices
This section deals with the procedures we employed for ensuring construct validity,and the presentation and interpretation of the constructed measure enriched withqualitative data.
In the Rasch context, fit statistics indicate how accurately the data fit the model.Fit statistics are local indicators of the degree to which the data is cooperating withthe model’s requirements. Inconsistent data (e.g., misfit items) may become a source
Table 2. Distribution (frequencies) of students according to gender and course
Mathematics course
Data collection Gender AS Trad AS UoM Total
DP1 – Beginning of AS[September 2006]
MaleFemale
773512
340154
1113666
Total DP1 1285 494 1779 [1792]*
DP2 – End of AS[May–June 2007]
MaleFemale
428302
236110
664412
Total DP2 730 346 1076 [1082]
DP3 – Following year[November 2007–January 2008]
MaleFemale
244215
9847
342262
Total DP3 459 145 604 [608]
Notes: *The number in brackets is the total number of students in each DP; the difference is due to missingdata about the course for 13 students.
481
Dow
nloa
ded
by [
The
Uni
vers
ity o
f M
anch
este
r L
ibra
ry]
at 0
9:43
27
July
201
2

10 M. Pampaka et al.
of further inquiry. Fit statistics may also flag items to which responses are verypredictable (overfits), an indication that, in some way, they are overly dependent onthe other items and might be the first choices for deletion (Wright, 1994). Acceptableranges for fit statistics vary in the literature (Smith et al., 1998; Linacre, 2002) andare usually defined by an interval close to 1 (e.g., within the range 0.5 to 1.5 in somecases, 0.7 to 1.3 for others). For this analysis we decided not to define absolute cut-off points. However we consider existing recommendations regarding the format ofour data and take any value of infit and outfit mean squares higher than 1.3 as a valuethat suggests cause for concern. In addition we endorse the recommendation ofBohlig et al. (1998) who state that ‘less than pleasing fit statistics say “think again”,not “throw it out”’ (p. 607), and hence we seek explanations and interpretations forthe high fit values.
For our pedagogic practice instrument, Rasch analysis showed acceptable fitoverall of almost all the items suggesting that they could constitute a scale, i.e., theymeasure something we choose to call ‘transmissionist self reported pedagogic prac-tices in pre-university mathematics classrooms’. A significant exception to this wasone item which presented an INFIT mean square of 2.4 (B274: ‘I encouragestudents to discuss the mistakes they make’) and it was decided to delete it fromthe scale. The decision was not based on statistical results alone but also on the factthat some teachers found this item ambiguous. Re-calibration of the remainingitems was performed and the results (fit statistics and items measures) are shown inTable 3.
Five possibly misfitting items (B6, B8, B22, B24, B26) are in bold within theresults in Table 3 and contextually presented at the bottom. On theoretical andmethodological grounds we decided not to exclude these items at this point. Theitems B8 and B22 (scored in reverse) clearly signal an approach to formative assess-ment: this is an important part of ‘connectionist’ and ‘dialogical’ teaching but maynot be present in all student-centred teaching, which after all can include pure‘discovery’ or even laissez-faire approaches. Similarly the other three misfittingitems all have meaning to a connectionist teacher and may belong in a seconddimension/construct of connectionist teaching, and yet they may be interpretedotherwise by some teachers:
● B6, B24: ‘working more slowly’ and ‘covering the most important ideas’ (only) insome contexts may be seen as laissez-faire rather than encouraging more thought-ful work. The fact that these items fit less well than B20 (‘I encourage students towork more quickly’) may support this.
● B26 (‘knowing exactly what maths the lesson will contain’) similarly might beviewed as signalling a transmissionist (not connectionist) attribute, suggesting thelesson is controlled to ensure that the mathematics does not include non-standardmethods, misconceptions or alternative approaches. But it may also be viewed bysome non-connectionist but student-centered teachers as an issue of teachers’subject matter knowledge, i.e., that they should know all the mathematics that‘might’ arise.
482
Dow
nloa
ded
by [
The
Uni
vers
ity o
f M
anch
este
r L
ibra
ry]
at 0
9:43
27
July
201
2

Mathematics pedagogy and learners’ dispositions 11
Because these elements of connectionist practice were viewed as important by someconnectionist teachers in our study (as mentioned in their interviews), for the timebeing we decided not to exclude these items, as any construct-irrelevant variance theyintroduce might be balanced by construct validity arguments. Furthermore they may
Table 3. Measures and fit statistics for the items of the pedagogy scale
Infit Outfit
Item Entry No Raw Score Count Measure SE MNSQ ZSTD MNSQ ZSTD
B1 1 355 110 .42 .10 0.8 −2 0.8 −1B2 2 339 110 .57 .10 0.9 0 1.0 0B3 3 431 110 −.44 .12 0.8 −1 0.9 −1B4 4 435 110 −.50 .12 1.2 1 1.1 0B5 5 452 110 −.83 .13 1.0 0 0.9 0B6 6 456 110 −−−−.84 .13 1.5 2 1.5 2B7 7 411 110 −.18 .11 0.7 −2 0.7 −2B8 8 405 110 −−−−.11 .11 1.4 2 1.3 2B9 9 434 110 −.49 .12 0.5 −3 0.5 −3B10 10 426 110 −.43 .12 1.1 0 1.1 0B11 11 295 110 .96 .09 1.0 0 1.0 0B12 12 391 110 .05 .10 0.7 −2 0.7 −2B13 13 367 105 .07 .11 1.2 1 1.3 1B14 14 268 110 1.18 .10 1.2 1 1.2 1B15 15 302 110 .90 .09 0.7 −2 0.7 −2B16 16 348 110 .48 .10 0.7 −2 0.8 −2B17 17 460 109 −1.06 .14 0.8 −1 0.8 −1B18 18 405 110 −.15 .11 1.2 1 1.2 1B19 19 426 110 −.43 .12 1.0 0 1.0 0B20 20 317 110 .76 .09 0.8 −2 0.8 −2B21 21 347 109 .45 .10 0.9 0 0.9 0B22 22 398 110 −−−−.03 .11 1.4 2 1.4 2B23 23 382 109 .06 .11 1.2 1 1.2 1B24 24 392 109 −−−−.04 .11 1.5 3 1.5 3B25 25 391 110 .05 .10 0.9 0 0.9 0B26 26 444 109 −−−−.77 .13 1.4 2 1.2 1B28 27 359 110 .34 .10 1.1 0 1.1 0
Mean: .00 .11 1.0 −0.1 1.0 −0.1SD: .58 .01 0.3 1.9 0.3 1.8
Notes: RMSE (Model) .11 Adj S.D. .57 Separation 5.13 Reliability .96Fixed (all same) chi-square: 742.2 d.f.: 26 significance: .00Random (normal) chi-square: 26.0 d.f.: 25 significance: .41B6: I encourage students to work more slowly.B8: I teach each topic from the beginning, assuming they know nothing.B22: I find out which parts students already understand and don’t teach those parts.B24: I cover only the important ideas in a topic.B26: I know exactly what maths the lesson will contain.
483
Dow
nloa
ded
by [
The
Uni
vers
ity o
f M
anch
este
r L
ibra
ry]
at 0
9:43
27
July
201
2

12 M. Pampaka et al.
be the first signs of a second dimension of connectionism that might be orthogonal tostudent-centrism: we therefore proceed with caution, bracketing for the momentwhether the opposite end of the spectrum from ‘transmissionism’ here is ‘connection-ism’ or ‘student-centrism’ more generally. This assumption is also justified with theDifferential Item Functioning (DIF) analysis (Bond & Fox, 2001), for which theitems’ scores derived from the two sub-groups of teachers (i.e., UoM and AS Trad)were contrasted. Results showed that some items are functioning differently for thetwo groups of teachers (B1, B2, B7, B10, B18). These differences we believe aremostly interpretable and credible, because the UoM curriculum and assessmentallow the teacher to ‘engage the students in substantial tasks’ in coursework (B18)and ‘compare different methods’ in modelling (B7), and because the texts in use havegenerally a greater variety of activities than just ‘working through exercises’ (B1). DIFfor B2 and B10 may be relevant to the fact that students on the UoM programme aregenerally weaker students. In sum, we suggest that in this case DIF might be due to‘real’ differences in the teaching practices that the curriculum affords, and that maysuggest a nascent ‘second dimension’ of self-reported practice that the rest of the scaledoes not measure. Therefore the multi-dimensionality of the construct is worthy offurther study in our view.
Figure 1 shows the resulting measurement scale. At the right side of the figure, thedistribution of pedagogic measures is shown (as a histogram). The higher the placeof the ‘practice’, the more teacher-centred or transmissionist the pedagogy. Pedagogythat is mainly student-centred or connectionist is at the bottom. On the left hand sideof the figure the items that constitute the scale are presented, ranging from those easi-est to report as frequent to the most ‘difficult’ to report being frequent. For reverseditems the opposite happens, e.g., B17.Figure 1. The ‘transmissionist’ self-reported pedagogic practices scaleIn the centre of Figure 1, the location of the pedagogies found in our case studycolleges are tested to check for the validity and meaningfulness of our measures. Eachpedagogy is identified with teachers we interviewed and observed teaching and havedescribed and analysed in some depth (see Williams et al., 2009). It should be notedthat the two teachers who define the ends of the scale (maximum and minimumscore) are within our case study sample: we have been able to confirm that they agreewith their practices being described as more or less transmissionist and teacher-centered versus connectionist and student-centred, respectively.
Three hierarchical categories of this ‘teacher centredness’ measure can perhaps bedistinguished (as shown in Figure 1, by the dotted lines) based on both the statisticalresults (i.e., item and person separation, Table 3) and the qualitative analysis of thehomogeneity of the item content. Figure 2 presents some extracts from the interviewswith the nine teachers from our case studies who had completed the teacher survey.The teachers are split into the three levels defined also in Figure 1 (starting here fromthe left):5 (a) at level 1 teachers’ practice is frequently student-centred and moreconnectionist; (b) level 2 involves teachers’ practices from both ends of the spectrumin moderate frequencies (e.g., small group work, but also emphasises ‘careful expla-nation’ by the teacher; and (c) level 3 corresponds to more teacher-centred practices,transmissionist, fast paced, exam orientated teaching. The key points that illustrate
484
Dow
nloa
ded
by [
The
Uni
vers
ity o
f M
anch
este
r L
ibra
ry]
at 0
9:43
27
July
201
2

Mathematics pedagogy and learners’ dispositions 13
Figure 1. The ‘transmissionist’ self-reported pedagogic practices scale
485
Dow
nloa
ded
by [
The
Uni
vers
ity o
f M
anch
este
r L
ibra
ry]
at 0
9:43
27
July
201
2

14 M. Pampaka et al.
Figure 2. Qualitative justification of the validity of the ‘transmissionist pedagogic practices’ scale
486
Dow
nloa
ded
by [
The
Uni
vers
ity o
f M
anch
este
r L
ibra
ry]
at 0
9:43
27
July
201
2

Mathematics pedagogy and learners’ dispositions 15
how these teachers’ narratives match the measures (recorded with their names)obtained by their self-reported surveys are underlined. For example, Sally points outhow important formative assessment is to connectionism, thus justifying ourinclusion of items B8 and B22.Figure 2. Qualitative justification of the validity of the “teacher-centrism’ scaleSome educational implications can also be derived from the observation of thescores of pedagogic practices for these classes, and particularly the largely differentscores reported for different classes: for instance the extreme cases of Sally’s andJohn’s self-reported practice of the traditional course. Having interviewed these twoteachers on a number of occasions, we were able to relate our observations withtheir intentions, beliefs and professional identity. These cases have been studiedand reported elsewhere (Williams et al., 2009). In sum, both teachers are regardedas highly effective by their college peers and senior managers, getting good resultsfor their students in examinations. However, Sally is a committed ‘connectionist’teacher who believes (and was observed to practice her beliefs) in working withsmall groups, problem-solving, and group- and class-discussions; for her, eliciting avariety of methods and even misconceptions is important, and the aim is always tobuild understandings that under-pin procedures in mathematics, so that learnersthink ‘like mathematicians’. Concepts are never, as far as we observed, simplydeclared. Rather, a lesson ‘narrative’ leads the students actively to put together theingredients and connect them into the conceptual whole (Wake & Pampaka,2008).
On the other hand John emphasises what the students need for the exam, teachingis highly paced and there is often said not to be enough time for concepts, discussionand problem-solving or investigation. John sometimes says there is no time for aproof, and they do not need to know one, as the examiners won’t ask for one. Hehimself is in control of the explanation-giving, while his students mainly have the taskof practising exercises that involve procedures for getting the answers to exemplary,test-type questions. He says this is what his college management team and hisstudents want, as it optimises their grades (Williams 2011).
Educational importance of pedagogical practice
The purpose of the constructed measure was to associate pedagogy with the students’learning outcomes. Before presenting the results of this, it is worth giving a briefsummary of the measure of mathematics dispositions.
In sum, we managed to develop a powerful instrument that measures learners’dispositions to study mathematics in the future, based on items from student inter-views, whose measurement properties according to our validation framework and theRasch Partial Credit Modelling (Bond & Fox, 2001) were good, and which provideus with a map of students’ dispositions that is interpretable. Table 4 shows thedescription of the items that make up this measure.
Students’ scores on this measure ranged from −3.5 to +5.7 logits. Increase in thisscore implies increase in students’ mathematical disposition; in other words studentswith high scores on this measure are more disposed to continue with mathematically
487
Dow
nloa
ded
by [
The
Uni
vers
ity o
f M
anch
este
r L
ibra
ry]
at 0
9:43
27
July
201
2

16 M. Pampaka et al.
demanding subjects in the future. The interpretability of this measure is also justifiedby the consistent, steady decline in these dispositions as shown in Figure 3.Figure 3. The decline in students’ mathematics dispositions over more than a year (AS to A2) In particular, Figure 3 shows the plots of means of mathematics dispositions withthe error bars around the means, at the three survey occasions for two versions of thesample: one with the full sample with all available data at each follow up, and a sub-sample including the 473 students who completed all surveys. There is an obviousdecline in dispositions that is independent of the sample chosen. The apparent differ-ence between the two samples is that the students who stayed in our sample till theend had higher maths dispositions at the beginning of their AS studies, as expected.
What is also interesting, beyond this apparent decline, is the effect of the students’mathematics dispositions on their university choices. To test this we modelled (withmultinomial regression) students’ choices at DP3 (close to the time of their universityapplications) based on their mathematics dispositions at the end of the previous yearand found a significant effect. The full presentation of this model goes beyond thescope of this paper, but in Figure 4 we present the association plot between universitysubject choice and mathematics disposition at DP2 (reduced to an ordered categori-cal variable: low, medium, high). The university choices of the students are classifiedin Table 5.Figure 4. Extended association plot between university choice at DP3 and mathematics disposition at the end of ASThe extended association plot (Meyer et al., 2003) of Figure 4 clearly displays thedifferences between the subject choices and the level of mathematics dispositions ofthe students (the shading of the groups indicates the significance of the differences).It can be inferred from this figure and the results of the multinomial model that highmathematics disposition is associated with mathematically demanding choiceswhereas low dispositions are associated with choices without any mathematicaldemand. This gives some credibility to our assertion that the variable is an importantindicator for STEM choices and outcomes.
In order to match the two databases (students and teachers) a score of average‘pedagogy’ is given for each student based on their teachers’ responses to the teacher
Table 4. The items of the mathematics disposition measure
Item DescriptionNumber of response
categories
Plan Are you planning to study any more mathematics courses or units after this AS course?
2 (YES, NO)
Amount My preferred options for a course at university will include:
5 (No mathematics, …, A lot of mathematics)
Importance The amount of mathematics in my preferred options for the course at university was:
3 (Not at all, … Very Important)
Feelings If I find out that my future course involves studying more mathematics than I thought, this would make me feel:
5 (Very unhappy, …, very happy)
Math Type If in the future I am studying a course involving mathematics, then I would prefer it to be:
3 (New, mix, familiar)
488
Dow
nloa
ded
by [
The
Uni
vers
ity o
f M
anch
este
r L
ibra
ry]
at 0
9:43
27
July
201
2

Mathematics pedagogy and learners’ dispositions 17
Figure 3. The decline in students’ mathematics dispositions over more than a year (AS to A2)
Table 5. Description and distribution of university choices at DP3
Category Description Sample
STEM+M Mathematically demanding subjects (including engineering, physical sciences, economics)
225 (41%)
Medical Medicine and other related subjects 65 (12%)NonSTEM Subjects without any mathematical demand 160 (29%)NotUNI Students reported no intention to study at university 43 (8%)Undecided They are undecided about their options 56 (10%)
489
Dow
nloa
ded
by [
The
Uni
vers
ity o
f M
anch
este
r L
ibra
ry]
at 0
9:43
27
July
201
2

18 M. Pampaka et al.
survey6 as an indication of the average pedagogy the student was—according to theteachers—exposed to. Hence, the following results are based on the 750 students(475 AS mathematics, 275 AS use of mathematics) for whom we have matched thelearning outcome data with the teachers’ pedagogy measure.
A first observation from our analysis revealed no significant differences between thescores of the teachers of the two different courses involved in our study. More impor-tantly, in results reported elsewhere we did not find any significant association ofpedagogy with test outcomes, such as grades or drop-out (Hutcheson et al., 2011).Here we focus on models where pedagogy has a significant effect on outcomemeasures, and in particular dispositions.
Figure 4. Extended association plot between university choice at DP3 and mathematics disposi-tion at the end of AS
490
Dow
nloa
ded
by [
The
Uni
vers
ity o
f M
anch
este
r L
ibra
ry]
at 0
9:43
27
July
201
2

Mathematics pedagogy and learners’ dispositions 19
The survey data analysis employed generalised linear modelling of these learningoutcome variables over different time intervals (Hutcheson & Sofroniou, 1999; Hoff-man, 2004). Variable selection was based on procedures where the emphasis is onselecting ‘useful’ models that incorporate theoretical judgements as well as statisticalcriteria applied to the sample data (Weisberg, 1985; Agresti, 1996). To this end, wehave avoided selecting models based entirely on statistical criteria and automatedprocedures such as step-wise selection and all-subsets selection.7
Table 6 shows a model with response variable students’ mathematical dispositionsat DP2 and explanatory variables mathematics disposition at DP1, a measure of thecombined mathematical demand of the other subjects the students were studying andthe average pedagogy the students had been exposed to. The addition of backgroundand other variables (i.e., prior GCSE grade and course) did not produce any otherstatistically significant effect.
Overall we find that the pedagogy has a negative effect, that is, teacher- andsubject-centred or transmissionist teaching is likely to further depress the students’mathematics-disposition. The educational importance of the above model is illus-trated through predictions derived from the model (of Table 6), of the expectedmeasure of mathematics dispositions at DP2. In particular, Table 7 shows thepredicted measures (and the 95% confidence intervals for these predictions) formathematics dispositions at the end of the AS year, for high and low scores ofmathematics dispositions at the beginning of the AS year (DP1), high and lowvalues for the measure of mathematical demand of the other courses the student isattending at AS, and finally for low and high pedagogic values (i.e., teacher-centredversus connectionist pedagogy); high and low values are based on the 25th and 75thquartiles, in all cases.
Table 7 shows clearly the effects that changes in the explanatory variables haveon the measure of dispositions to study mathematically demanding subjects atDP2. The lowest scores are associated with students with initially low disposition tostudy mathematically demanding subjects, who did not do other mathematicallydemanding courses at this point and who had been exposed to transmissionistpedagogy. In contrast the highest scores are associated with students with initiallyhigh mathematics disposition, who also attended other mathematically demandingcourses at this point and who had been exposed to more connectionist, student-centred pedagogy.
Table 6. A regression model for mathematics disposition at the end of AS year
Coefficient B s.e. t p
(Constant) −0.609 0.079 −7.754 3.11e-14Maths disposition at DP1 0.645 0.035 18.342 <2e-16Math demand of other subjects at DP2 0.191 0.031 6.179 1.09e-09Pedagogical practice −0.288 0.082 −3.519 0.0005
Notes: F (3, 708) = 144, p < 0.001, R2 = 0.379 (Adjusted R2 = 0.376).
491
Dow
nloa
ded
by [
The
Uni
vers
ity o
f M
anch
este
r L
ibra
ry]
at 0
9:43
27
July
201
2

20 M. Pampaka et al.
Discussion and conclusions
What, in summary, has this paper established?First, we have built a measure of teachers’ self-reported transmissionist practice
that has sound statistical properties and credible validity for the targeted teachers ofAS/A level mathematics in English colleges. Most of our sample of teachers’ scoreswere high on this measure, with the few very low scores revealing connectionist prac-tices which official mathematics education policy seeks to promote. No significantsubgroup variations in pedagogic practice were found, e.g., between teachers oftraditional and ‘Use of mathematics’ programmes. The implications for policy,practice, and future research will be discussed below.
Second, no significant associations between pedagogic practice and AS grades ordrop out were found, despite the well-established, clearly significant effects of theprogramme studied. The disposition to study mathematics, on the other hand, isshown to decline significantly over the time period studied, and has significantassociation with intentions regarding STEM study in HE.
Third, the association of transmissionist teaching with declining dispositions issmall but significant, representing about half the average decline in disposition overthe 15-month period. Evidently quite substantial changes in pedagogic practice(from the teachers’ perspective) would be required to make a significant impact orreverse the decline (assuming the association were causal).
We now turn to a discussion of the significance, limitations and implications of theseconclusions. To see this, one must bear in mind the particular policy and practiceperspective in England with regard to mathematics education in this period. On theone hand, the performance management system which focuses on grades is thoughtto encourage ‘low risk’ teaching to the test, i.e., transmissionist teaching, and indeedwe found no statistically significant evidence of a negative effect of such teaching ongrades over this period. On the other hand, the mathematics education profession, asexpressed through ACME/NCTEM and encouraged by Ofsted, promotes connec-tionist teaching (which we have described as akin to US reform teaching proposed by
Table 7. Predictions from the model of mathematics disposition at the end of AS year
Predictions for maths dispositions at end of AS estimate (lower 95% CI, upper 95% CI)
Mathematics disposition at the beginning of AS
Combined mathematical demand of other subjects
studied at ASConnectionist pedagogy
[0.26]Transmissionist
pedagogy [0.735]
Low [−0.78] Low [0] −1.19 (−1.34, −1.034) −1.32 (−1.49, −1.16)High [3] −0.61 (−0.77, −0.46) −0.75 (−0.91, −0.59)
High [1.11] Low [0] 0.03 (−0.13, 0.19) −0.11 (−0.28, 0.07)High [3] 0.61 (0.46, 0.75) 0.47 (0.32, 0.61)
492
Dow
nloa
ded
by [
The
Uni
vers
ity o
f M
anch
este
r L
ibra
ry]
at 0
9:43
27
July
201
2

Mathematics pedagogy and learners’ dispositions 21
NCTM). The ‘teacher’ in policy and practice is caught between the two trends, whichcan only be resolved if (a) teachers come to believe that in the long run connectionistteaching will bear fruit in terms of the grades that count, or (b) the learning outcomesthat count are broadened, e.g., to include dispositions or choices for STEM.
Thus, our study cuts to the heart of this conflict by producing relevant measuresand investigating the association between teaching and a range of learning outcomes.Nevertheless, we recognise that our findings are thus far less conclusive than policy-makers might wish. For one thing, there were apparently very few teachers in oursample ‘taking the risk’ with connectionist teaching. Then there is the lack of signifi-cant impacts of teaching on the learning outcomes in general, and even the impact ondispositions is not as strong as the general decline over time.
One explanation, we speculate, is that the key missing construct in this model is thelearners’ test-centeredness, or surface learning approach (Marton & Booth, 1997).There is some qualitative evidence in our project reported elsewhere that this mightbe important (Williams et al., 2009). It may be argued that the effect of the learningexperience is decisive for learner dispositions and that the effect of teachers’ pedagogyis only one part of this. Certainly, this view is consistent with learners becoming increas-ingly exam pressured as the mathematics course progresses over the AS/A level period.
Exploring this speculation further, one expects that the learners’ experience oflearning is a factor in all the learning outcomes, and that this would be mediated bythe programme (curriculum and assessment) as well as the teaching. Indeed, weknow that grades and drop out were associated with the programmes in the study (seeTable 1). We suggest that the communicative practices of the ‘Use of mathematics’programme (UoM) were associated with better outcomes, but not with dispositionsto study mathematics further. We believe that this is indicative of the pre-dispositionsof students who chose UoM, which was a one year terminal AS course, designed forthose students who mostly do not intend to study mathematics or STEM further.
Finally, this study has shed light on a highly complex problem. Not only have someof the contours of this complexity emerged but also the difficulties inherent in pinningthe problem down with measurement. Nevertheless we believe that the discipline ofmeasurement has been helpful here and will serve other research that follows.
Acknowledgments
The authors would like to acknowledge the support of the ESRC-TLRP programmeof research into widening participation, funded by ESRC: RES-139-25-0241and thecontinuing support of the ESRC project with grant number RES-062-23-1213. Wewould also like to thank Malcolm Swan for providing his data to inform our initialcalibration work.
Notes
1. At least when the project took place: there is now an A2 available in 2011.2. An example item: ‘Students work through exercises’. All items are listed in Figure 1.
493
Dow
nloa
ded
by [
The
Uni
vers
ity o
f M
anch
este
r L
ibra
ry]
at 0
9:43
27
July
201
2

22 M. Pampaka et al.
3. Analysis was performed with the FACETS software.4. Items were named as ‘B’ because they were presented as the second part (Section B) of the
teacher’s survey, the first being a personal information section.5. Please note that the location of the teacher is not done in scale.6. It should be noted though that for the majority of the students we got only one teacher survey;
for most of the cases with more than one teacher, the scores were mostly within similar peda-gogic category.
7. Multilevel models were considered relevant even though our dataset was only partly hierarchi-cal (due to missing and multiple links between teachers and classes). However two levelmodels, applied to appropriate subsets of our data, did not yield significant intra-classcorrelation. We therefore did not pursue this further.
References
ACME (2009) The mathematics education landscape in 2009. A report of the Advisory Committeeon Mathematics Education (ACME) for the DCSF/DIUS STEM High Level Strategy GroupMeeting (12 June 2009). Available online at: http://www.acme-uk.org/download-doc.asp?id=139 (acessed March 2010).
ACME (2010) Post-16 in 2016. Proposals for 16-19 mathematics in anticipation of the review of qualifi-cations scheduled for 2013 with resulting changes to be implemented from 2016. Available online at:http://www.acme-uk.org/downloaddoc.asp?id=228 (accessed October 2010).
Agresti, A. (1996) An introduction to categorical data analysis (London, John Wiley & Sons).Andrich, D. (1999) Rating scale model, in: G. N. Masters & J. P. Keeves (Eds) Advances in
measurement in educational research and assessment (Oxford, Pergamon), 110–121.Argyris, C. & Schon, D. (1978) Organisational learning: A theory of action perspective (Reading, MA,
Addison Wesley).Askew, M., Brown, M., Rhodes, V., Johnson, D. & Wiliam, D. (1997) Effective teachers of numeracy
(final report) (London, King’s College).Bell, A. (1993) Principles for the design of teaching, Educational Studies in Mathematics, 24(1),
5–34.Boaler, J. (2008) When politics took the place of inquiry: A response to the National Mathematics
Advisory Panel’s review of instructional practices, Educational Researcher, 37(9), 588–594.Bohlig, M., Fisher, W. P. J., Masters, G. N. & Bond, T. (1998) Content validity and misfitting
items, Rasch Measurement Transactions, 12(1), 607.Bond, T. & Fox, C. M. (2001) Applying the Rasch model: Fundamental measurement in the human
sciences (Mahwah, NJ, Lawrence Erlbaum).Bryce, T. G. K. (1981) Rasch-fitting, British Educational Research Journal, 7(2), 137–153.CBI & EDI (2010) Ready to grow: Business priorities for education and skills. Available online at: http:/
/www.cbi.org.uk/pdf/20100501-cbi-education-and-skills-survey-2010.pdf (accessed October2010).
Cuban, L. (1983) How did teachers teach, 1890–1980, Theory into Practice, 22(3), 160–165.Ernest, P. (1991) The philosophy of mathematics education (Basingstoke, Falmer).Fraser, B. J. (1998) Classroom environment instruments: Development, validity and applications,
Learning Environments Research, 1, 7–33.Goldstein, H. (1979) Consequences of using the Rasch model for educational assessment, British
Educational Research Journal, 5(2), 211–220.Goldstein, H. & Blinkhorn, S. (1982) The Rasch model still does not fit, British Educational
Research Journal, 8(2), 167–170.Hoffman, J. P. (2004) Generalized linear models: An applied approach (London, Pearson Education).Hutcheson, G. & Sofroniou, N. (1999) The multivariate social scientist. Introductory statistics using
generalized linear models (London, Sage).
494
Dow
nloa
ded
by [
The
Uni
vers
ity o
f M
anch
este
r L
ibra
ry]
at 0
9:43
27
July
201
2

Mathematics pedagogy and learners’ dispositions 23
Hutcheson, G., Pampaka, M. & Williams, J. (2011) A comparison of students on ‘traditional ASmathematics’ and ‘uses of mathematics’ courses: Enrolment and achievement. Research inMathematics Education.
Kember, D. & Gow, L. (1994) Orientations to teaching and their effect on the quality of studentlearning, Journal of Higher Education, 65(1), 58–74.
Linacre, J. M. (2002) Optimizing rating scale category effectiveness, Journal of Applied Measure-ment, 3(1), 85–106.
Marton, F. & Booth, S. (1997) Learning and awareness (New Jersey, Lawerence Erlbaum Associates).McCaffrey, D. F., Hamilton, L.S., Stecher, B.M., Klein, S.P., Bugliari, D. & Robyn, A. (2001)
Interactions among instructional practices, curriculum, and student achievement: The case ofstandards-based high school mathematics, Journal for Research in Mathematics Education,32(5), 493–517.
Messick, S. (1988) The once and future issues of validity: Assessing the meaning and conse-quences of measurement, in H. Wainer & H. I. Braun (Eds) Test validity (London, LawrenceErlbaum Associates), 33–45.
Messick, S. (1989) Validity, in: R. L. Linn (Ed) Educational measurement (USA, American Councilof Education and the Oryx Press), 13–103.
Meyer, D., Zeileis, A. & Hornik, K. (2003) Visualizing independence using extended associationplots, in: K. Hornik, F. Leisch & A. Zeileis (Eds) Proceedings of the 3rd International Workshopon Distributed Statistical Computing. Available online at: http://www.ci.tuwien.ac.at/Confer-ences/DSC-2003/Proceedings/
National Audit Office (NAO) (2010) Educating the next generation of scientists. Available online at:http://www.nao.org.uk/young-scientists-2010 (accessed November 2010).
NCES (2000) Mathematics and science in the eighth grade: Findings from the Third International Math-ematics and Science Study (US Department of Education Office of Educational Research andImprovement).
NCTM (2000) Principles and standards for school mathematics (Reston, VA, National Council ofTeachers of Mathematics).
Ofsted (2008) Mathematics—understanding the score (London, Ofsted).Ofsted (2009) The Annual Report of Her Majesty’s Chief Inspector of Education, Children’s Services
and Skills 2008/09 (London, Ofsted).Panayides, P., Robinson, C. & Tymms, P. (2009) The assessment revolution that has passed
England by: Rasch measurement, British Educational Research Journal.Preece, P. F. W. (1980) On rashly rejecting Rasch: A response to Goldstein (with a rejoinder from
Goldstein), British Educational Research Journal, 6(2), 209–212.Roberts, G. (2002) SET for success. The supply of people with science, technology, engineering and
mathematics skills (London, HM Stationery Office).Roelofs, E., Visser, J. & Terwel, J. (2003) Preferences for various learning environments: teachers’
and parents’ perceptions, Learning Environments Research, 6(1), 77–110.Ruthven, K. (2010) Using longitudinal, cross-system and between-subject analysis of the TIMSS
study series to calibrate the performance of lower-secondary mathematics education inEngland. Paper presented at the Proceedings of the British Congress for Mathematics Education(BCME) (pp. 183 –190).
Ryan, J. T. & Williams, J. S. (2007) Children’s mathematics 4–15 (Milton Keynes, Open UniversityPress).
Sainsbury, L. (2007) The race to the top: A review of government’s science and innovation policies(London, HM Stationery Office).
Schon, D. (1990) Educating the reflective practitioner (Oxford, Jossey-Bass Publishers).Schuh, K. L. (2004) Learner-centered principles in teacher-centered practices?, Teaching and
Teacher Education, 20(8), 833–846.Shuell, T. J. (1993) Toward an integrated theory of teaching and learning, Educational Psychologist,
28(4), 291–311.
495
Dow
nloa
ded
by [
The
Uni
vers
ity o
f M
anch
este
r L
ibra
ry]
at 0
9:43
27
July
201
2

24 M. Pampaka et al.
Smith, R. M., Schumacker, R. E. & Busch, M. J. (1998) Using item mean squares to evaluate fitto the Rasch model, Journal of Outcome Measurement, 2(1), 66–78.
Swan, M. (2000) The purpose of mathematical activities and pupils’ perceptions of them, Researchin Education, 63, 199–223.
Swan, M. (2005) Improving learning in mathematics: challenges and strategies (London, Departmentfor Education and Skills).
Swan, M. (2006) Designing and using research instruments to describe the beliefs and practices ofmathematics teachers, Research in Education, 75, 58–70.
Swanson, C. B. & Stevenson, D. L. (2002) Standards-based reform in practice: Evidence on statepolicy and classroom instruction from the NAEP state assessments, Educational Evaluationand Policy Analysis, 24(1), 1–27.
Vermunt, J. D. & Verloop, N. (1999) Congruence and friction between learning and teaching,Learning and Instruction, 9(3), 257–280.
Wake, G. & Pampaka, M. (2008). The central role of the teacher: Even in student centred pedago-gies. Proceedings of the Joint Meeting of the 32nd Conference of the International Group for thePsychology of Mathematics Education and the XX North American Chapter, Morelia, Michoacán,México.
Watson, A. & De Geest, E. (2005) Principled teaching for deep progress: improving mathematicallearning beyond methods and materials, Educational Studies in Mathematics, 58, 209–234.
Webster, B. J. & Fisher, D. L. (2003) School-level environment and student outcomes inmathematics, Learning Environments Research, 6(3), 309–326.
Weisberg, S. (1985) Applied linear regression. New York: John Wiley & Sons.Westerhof, K. J. (1992) On the effectiveness of teaching: direct versus indirect instruction, School
Effectiveness and School Improvement: An International Journal of Research, Policy and Practice,3(3), 204–215.
Williams, J. (2011) Teachers telling tales. Research in Mathematics Education.Williams, J.S., Black, L., Davis, P., Hernandez-Martinez, P., Hutcheson, G., Nicholson, S.,
Pampaka, M. & Wake, G. (2008) Keeping open the door to mathematically demandingprogrammes in further and higher education. TLRP Research Briefing No 38, School ofEducation, University of Manchester.
Williams, J. S., Black, L., Hernandez-Martinez, P., Davis, P., Pampaka, M. & Wake, G. (2009)Repertoires of aspiration, narratives of identity, and cultural models of mathematics in prac-tice, in: M. César & K. Kumpulainen (Eds.), Social interactions in multicultural settings(Rotterdam, Sense Publishers), 39–69.
Wolfe, E. W. & Smith Jr., E. V. (2007) Instrument development tools and activities for measurevalidation using Rasch models: Part I – instrument development tools, Journal of AppliedMeasurement, 8(1), 97–123.
Wright, B. D. (1994) Data analysis and fit, Rasch Measurement Transactions, 7(4), 324.Wright, B. D. & Mok, M. (2000) Rasch models overview, Journal of Applied Measurement, 1(1),
83–106.
496
Dow
nloa
ded
by [
The
Uni
vers
ity o
f M
anch
este
r L
ibra
ry]
at 0
9:43
27
July
201
2