The ascorbic acid content of tomato fruits is associated with the expression of genes involved in...
11
RESEARCH ARTICLE Open Access The ascorbic acid content of tomato fruits is associated with the expression of genes involved in pectin degradation Antonio Di Matteo 1 , Adriana Sacco 1 , Milena Anacleria 1 , Mario Pezzotti 2 , Massimo Delledonne 2 , Alberto Ferrarini 2 , Luigi Frusciante 1 , Amalia Barone 1* Abstract Background: High levels of ascorbic acid (AsA) in tomato fruits provide health benefits for humans and also play an important role in several aspects of plant life. Although AsA metabolism has been characterized in detail, the genetic mechanisms controlling AsA accumulation in tomatoes are poorly understood. The transcriptional control of AsA levels in fruits can be investigated by combining the advanced genetic and genomic resources currently available for tomato. A comparative transcriptomic analysis of fruit tissues was carried out on an introgression line containing a QTL promoting AsA accumulation in the fruit, using a parental cultivar with lower AsA levels as a reference. Results: Introgression line IL 12-4 (S. pennellii in a S. lycopersicum background) was selected for transcriptomic analysis because it maintained differences in AsA levels compared to the parental genotypes M82 and S. pennellii over three consecutive trials. Comparative microarray analysis of IL 12-4 and M82 fruits over a 2-year period allowed 253 differentially-expressed genes to be identified, suggesting that AsA accumulation in IL 12-4 may be caused by a combination of increased metabolic flux and reduced utilization of AsA. In particular, the upregulation of a pectinesterase and two polygalacturonases suggests that AsA accumulation in IL12-4 fruit is mainly achieved by increasing flux through the L-galactonic acid pathway, which is driven by pectin degradation and may be triggered by ethylene. Conclusions: Based on functional annotation, gene ontology classification and hierarchical clustering, a subset of the 253 differentially-expressed transcripts was used to develop a model to explain the higher AsA content in IL 12-4 fruits in terms of metabolic flux, precursor availability, demand for antioxidants, abundance of reactive oxygen species and ethylene signaling. Background Oxidation reactions are essential for life, but they pro- duce reactive oxygen species that can cause significant damage to cells. Therefore, complex protection systems have evolved based on antioxidants that help to elimi- nate these dangerous molecules [1]. Oxidative stress plays a role in many human diseases, but its impact can be reduced by the consumption of dietary antioxidants such as ascorbic acid (AsA), which is also known as vitamin C [2]. Humans and other primates are unable to synthesize AsA because the final step in its biosynthesis is blocked. Therefore, there has been great interest in the development of genetically modified food crops with high levels of antioxidants such as AsA [3,4]. As well as providing health benefits to humans, higher AsA levels improve both biotic and abiotic stress tolerance in plants [5,6] and enhance postharvest fruit quality [7]. The amount of AsA in plant cells depends on the strict regulation of its synthesis [8], metabolic recycling and degradation [9], and its transport [10]. The recycling of AsA is particularly important under stress conditions because reduced AsA is converted into an unstable radi- cal (monodehydroascorbic acid), which dissociates into AsA and dehydroascorbic acid. Since the latter is also * Correspondence: [email protected] 1 Department of Soil, Plant, Environment and Animal Sciences, University of Naples “Federico II”, Via Università 100, 80055 Portici, Italy Full list of author information is available at the end of the article Di Matteo et al. BMC Plant Biology 2010, 10:163 http://www.biomedcentral.com/1471-2229/10/163 © 2010 Di Matteo et al; licensee BioMed Central Ltd. This is an Open Access article distributed under the terms of the Creative Commons Attribution License (http://creativecommons.org/licenses/by/2.0), which permits unrestricted use, distribution, and reproduction in any medium, provided the original work is properly cited.
Transcript of The ascorbic acid content of tomato fruits is associated with the expression of genes involved in...

RESEARCH ARTICLE Open Access
The ascorbic acid content of tomato fruits isassociated with the expression of genes involvedin pectin degradationAntonio Di Matteo1, Adriana Sacco1, Milena Anacleria1, Mario Pezzotti2, Massimo Delledonne2, Alberto Ferrarini2,Luigi Frusciante1, Amalia Barone1*
Abstract
Background: High levels of ascorbic acid (AsA) in tomato fruits provide health benefits for humans and also playan important role in several aspects of plant life. Although AsA metabolism has been characterized in detail, thegenetic mechanisms controlling AsA accumulation in tomatoes are poorly understood. The transcriptional controlof AsA levels in fruits can be investigated by combining the advanced genetic and genomic resources currentlyavailable for tomato. A comparative transcriptomic analysis of fruit tissues was carried out on an introgression linecontaining a QTL promoting AsA accumulation in the fruit, using a parental cultivar with lower AsA levels as areference.
Results: Introgression line IL 12-4 (S. pennellii in a S. lycopersicum background) was selected for transcriptomicanalysis because it maintained differences in AsA levels compared to the parental genotypes M82 and S. pennelliiover three consecutive trials. Comparative microarray analysis of IL 12-4 and M82 fruits over a 2-year periodallowed 253 differentially-expressed genes to be identified, suggesting that AsA accumulation in IL 12-4 may becaused by a combination of increased metabolic flux and reduced utilization of AsA. In particular, the upregulationof a pectinesterase and two polygalacturonases suggests that AsA accumulation in IL12-4 fruit is mainly achievedby increasing flux through the L-galactonic acid pathway, which is driven by pectin degradation and may betriggered by ethylene.
Conclusions: Based on functional annotation, gene ontology classification and hierarchical clustering, a subset ofthe 253 differentially-expressed transcripts was used to develop a model to explain the higher AsA content in IL12-4 fruits in terms of metabolic flux, precursor availability, demand for antioxidants, abundance of reactive oxygenspecies and ethylene signaling.
BackgroundOxidation reactions are essential for life, but they pro-duce reactive oxygen species that can cause significantdamage to cells. Therefore, complex protection systemshave evolved based on antioxidants that help to elimi-nate these dangerous molecules [1]. Oxidative stressplays a role in many human diseases, but its impact canbe reduced by the consumption of dietary antioxidantssuch as ascorbic acid (AsA), which is also known asvitamin C [2]. Humans and other primates are unable to
synthesize AsA because the final step in its biosynthesisis blocked. Therefore, there has been great interest inthe development of genetically modified food crops withhigh levels of antioxidants such as AsA [3,4]. As well asproviding health benefits to humans, higher AsA levelsimprove both biotic and abiotic stress tolerance inplants [5,6] and enhance postharvest fruit quality [7].The amount of AsA in plant cells depends on the strictregulation of its synthesis [8], metabolic recycling anddegradation [9], and its transport [10]. The recycling ofAsA is particularly important under stress conditionsbecause reduced AsA is converted into an unstable radi-cal (monodehydroascorbic acid), which dissociates intoAsA and dehydroascorbic acid. Since the latter is also
* Correspondence: [email protected] of Soil, Plant, Environment and Animal Sciences, University ofNaples “Federico II”, Via Università 100, 80055 Portici, ItalyFull list of author information is available at the end of the article
Di Matteo et al. BMC Plant Biology 2010, 10:163http://www.biomedcentral.com/1471-2229/10/163
© 2010 Di Matteo et al; licensee BioMed Central Ltd. This is an Open Access article distributed under the terms of the CreativeCommons Attribution License (http://creativecommons.org/licenses/by/2.0), which permits unrestricted use, distribution, andreproduction in any medium, provided the original work is properly cited.

unstable and is rapidly degraded, the AsA pool can bedepleted if the oxidized forms are not recovered by tworeductases: monodehydroascorbic acid reductase(MDHAR) and dehydroascorbic acid reductase (DHAR)[11]. Both enzymes have been targeted by genetic engi-neering, their overexpression leading to elevated AsAlevels [12] and, in the case of MDHAR, increased stresstolerance [13].Although several metabolic pathways converge to
generate AsA in plants [14] the l-galactose Wheeler-Smirnoff pathway is considered the primary route(Figure 1) and the roles of many of the genes andenzymes have been confirmed [15]. l-gulose [16] andmyo-inositol have also been proposed as intermediatesin AsA biosynthesis, indicating that part of the animalpathway could also operate in plants [17]. An alternativepathway with an l-galactonic acid intermediate has beenalso reported in strawberry [18] and grape fruit [19].Although tomato fruits are considered a good dietary
source of AsA, cultivated varieties of Solanum lycopersi-cum tend to have much lower levels than wild progenitorssuch as S. pennellii [20]. This reflects a range of geneticand environmental factors that result in quantitative varia-tion across varieties and wild species [21]. The AsA con-tent of tomato fruits is therefore suitable for QTL analysis[20,22]. Differences among several varieties have beendescribed based on the metabolite content and antioxidantactivities [23], but the precise genetic mechanisms control-ling AsA levels remain elusive. Some insight has beengained by introgressing segments of the S. pennellii gen-ome into a S. lycopersicum background [24] and identify-ing QTLs for fruit AsA content [20,22,25].As tomato genomic resources have become more
abundant [26], it has been possible to investigate thetranscriptional control of fruit soluble solid content(Brix) by studying the transcriptomic changes in intro-gression lines with different Brix levels [27]. This type of
analysis could also provide insight into the geneticmechanisms controlling AsA metabolic pathways. Whenthis investigation began, 22,250 tomato Tentative Con-sensus sequences (TCs) were available in the TIGRdatabase Gene Index Release 11.0 (June 21, 2006; http://compbio.dfci.harvard.edu/tgi/cgi-bin/tgi/gimain.pl?gudb=tomato). This facilitated the fabrication of theCombiMatrix TomatArray 1.0, a versatile tomato oligo-nucleotide microarray containing 20,200 specific 35-40mers, each replicated four times [28]. Using this plat-form, we set out to determine whether the higher AsAlevels in the fruits of an introgression line were asso-ciated with specific changes in steady state mRNAlevels, which might provide some insight into the tran-scriptional regulation of AsA synthesis. Several geneswith differential expression between the introgressionline and the parental cultivated variety were identified,allowing us to develop a unified model that explainsAsA synthesis in terms of the regulation of specificfunctional groups of genes.
ResultsAscorbic acid contentWithin the framework of a research project to investigateQTLs controlling tomato fruit quality, we analyzed anumber of introgression lines in which segments of theS. pennellii genome were introgressed into S. lycopersi-cum cv. M82. We selected IL12-4 for further analysisbecause it maintained differences in AsA levels comparedto the parental genotypes M82 and S. pennellii over threeconsecutive trials (years 2006, 2007, 2008) in a green-house environment (Figure 2).The average AsA concentrations in ripe M82 and S.
pennellii fruit were 122 and 475 μg g-1 fresh weight(FW), respectively, whereas in IL 12-4 the average AsAconcentration was 199 μg g-1 FW. These differences werestatistically significant (Univariate ANOVA procedure;F2, 41 = 53.13; P < 0.001), and Dunnet’s post-hoc testrevealed significant differences when IL12-4 and S. pen-nellii were separately compared with M82 (P < 0.05).A significant genotype × year interaction over the threeconsecutive trials was also observed (Univariate ANOVAmodel, F4,41 = 3.060, P < 0.05). Our analysis thereforeconfirmed that the introgression of S. pennellii geneticmaterial into IL12-4 contributed to the higher fruit AsAcontent compared to M82. Indeed, the AsA content inIL12-4 fruit was on average 45% higher than M82 in2006, 55% higher in 2007 and 87% higher in 2008. There-fore, IL12-4 was chosen for further comparative tran-scriptome analysis together with the parental line M82.
Comparative microarray analysisIn order to identify transcripts expressed at differentlevels in the two selected genotypes, total RNA was
Figure 1 Alternative pathways for l-Ascorbic acid biosynthesisin plants. From left to right: d-galacturonate pathway [18], l-galactose pathway [11], l-gulose pathway [16] and myo-inositolpathway [17].
Di Matteo et al. BMC Plant Biology 2010, 10:163http://www.biomedcentral.com/1471-2229/10/163
Page 2 of 11

extracted from three biological replicate samples takenfrom each genotype in two consecutive years (2007 and2008). Differential transcript accumulation was docu-mented using single-color hybridization on the Toma-tArray 1.0 microarray followed by a two-factorialANOVA test (P < 0.01) with the M82 transcriptome asa reference. Because small changes in gene expressionmight underlie differences in AsA accumulation, differ-entially-expressed transcripts were not filtered using afold-change threshold, and differences were consideredirrespective of the intensity of the change. Thus weidentified 253 sequences (1.17% of those represented onthe TomatArray1.0) that were differentially expressed atthe red-ripe stage (Additional file 1), 7.9% of whichsignificantly matched (e value <1 × 10⁻¹⁰) with non-annotated sequences in the NCBI’s non-redundant NRdatabase and 7.5% of which showed no matches. Amongthese transcripts, 61 (24.1%) were upregulated and 192(75.9%) were downregulated in IL 12-4.The distribution of GO categories according to Biologi-
cal Process (BP), Molecular Function (MF) and CellularComponent (CC) was complex. The BP terms “trans-port”, “cellular component organization and biogenesis”and “amino acid and derivative metabolic process” werethe highest ranked (14.8%, 11.8% and 10.1%, respectively)and were similarly represented among both the upregu-lated and downregulated genes (Additional file 2). TheMF terms “hydrolase activity”, “protein binding” and“nucleotide binding” occurred most frequently (21.1%,18.4% and 14.7%, respectively) and again were similarlyrepresented among the upregulated and downregulatedgenes (Additional file 3). Finally, the most frequent CCterms indicated that the differentially expressed geneswere preferentially active in the “plastid” (33.9%),
“mitochondrion” (22.6%) and “ribosome” (8.7%) (Addi-tional file 4). Notably, this preferential order was pre-served for downregulated genes but not for upregulatedgenes, perhaps because of the paucity of the latter group(61 sequences and 25 classifications).Hierarchical clustering (HC) using Pearson’s correla-
tion metric identified sub-clusters of tightly co-regulatedtranscripts, which should provide new insights in to thetranscriptional regulation of AsA metabolism and pro-vide putative functions for non-annotated sequences.Among the transcripts that are upregulated in IL 12-4(Additional file 5) the HC output indicated a sub-clusterthat grouped together sequences such as a propionylcarboxylase beta chain (TC177185), two pyridoxal-phosphate dependent TrpB-like enzymes (TC172849and TC183991), a pectinesterase family protein(TC177576), a 21-kDa protein precursor (TC182308)and a number of non-annotated transcripts. Anothercluster brought together ethylene-related transcriptssuch as a 1-aminocyclopropane-1-carboxylate synthase(TC169916) and a cystathionine g-synthase (TC184006),with an amino acid permease-like protein (TC170812), aDnaJ-like chaperone protein (TC174366), a phosphogly-cerate kinase (TC190107) and again a number of non-annotated transcripts. In contrast, among the transcriptsthat are downregulated in IL 12-4 (Additional file 6), anAsA peroxidase (TC172881) was coregulated with aSec23-Sec24 transport family protein (TC188915), ab-glucosidase (TC170324), a Dof zinc finger protein(TC188776), a SelT-like protein precursor (TC174342)and a small number of non-annotated transcripts.Based on functional annotation, gene ontology (GO)
classification and hierarchical clustering, a subset of the253 differentially-expressed TCs (Table 1) was used todevelop a model that could explain the higher AsA con-tent in IL 12-4. Within this select group, four TCs wererelated to AsA pathways, six to hormone metabolism,five to glycolysis and the Calvin cycle and three to glu-tathione metabolism. Together, these help to character-ize the essential changes in IL 12-4 cellular metabolismthat may underpin the increased accumulation of AsAin the fruits. A further six TCs involved in stressresponses and three involved in plastid metabolismcould also be linked into the model.
Expression of transcripts related to AsA metabolismAmong the different AsA synthesis pathways mentionedabove, our microarray data ruled out the Wheeler-Smirnoff pathway as the predominant source of higherAsA levels in IL 12-4 fruit because probes specific forgenes controlling key steps in this pathway (e.g. genesencoding GDP-d-mannose pyrophosphorylase, GDP-l-galactose phosphorylase, l-galactose-1-P phosphataseand l-galactose dehydrogenase) were included on the
Figure 2 Ascorbic acid (AsA) concentration in ripe fruit fromthe tomato IL 12-4 and its parental lines. AsA concentration isexpressed as μg * g-1 fresh weight (FW). Mean values ± SE arereported for three consecutive greenhouse trials (in 2006, 2007 and2008). An asterisk indicates that differences between IL 12-4 and S.lycopersicum cv. M82 are statistically significant in Student’s t-test. *:0.001 < P < 0.01; **: P < 0.001.
Di Matteo et al. BMC Plant Biology 2010, 10:163http://www.biomedcentral.com/1471-2229/10/163
Page 3 of 11

chip and showed no evidence of differential expression.However, among 23 probes representing putative pecti-nesterase transcripts, one in particular (TC177576) was4.4-fold more abundant in IL12-4 than M82, suggestingthat increased pectin degradation could provide much ofthe additional AsA in IL 12-4 fruits (Figure 3). Thebreakdown of other structural polymers in the cell walldid not seem to provide intermediates for AsA synth-esis, e.g. transcripts for b-glucosidase (TC170324) andb-glucuronidase (TC182248) were repressed, whichwould delay the conversion of cellobiose into b-D-glucose and reduce the rate of D-glucuronic acid synth-esis from b-D-glucuronoside. Finally, a putative AsAperoxidase transcript (TC172881) was downregulated(1.36-fold more abundant in M82 than IL12-4),
suggesting the accumulation of AsA might also reflect alower rate of oxidation.Upregulation of pectinesterase transcript TC177576
was confirmed in both the 2007 and 2008 samples byqRT-PCR (Figure 4). To investigate the possibility thatpectin catabolism might boost AsA levels, perhaps byincreasing flux through the L-galactonic acid pathway,we turned our attention to the transcripts for two puta-tive polygalacturonases (TC175912 and TC184291),which had been overlooked in the original microarrayexperiment because they were filtered out of the rawdata. The qRT-PCR results indicated that both wereupregulated in IL12-4 compared to M82 (Figure 4).The downregulation of two TCs involved in the D-glucuronic acid pathway (TC170324 and TC182248) was
Table 1 List of TCs affecting AsA accumulation that are differentially expressed in IL 12-4 and M82 according tomicroarray data
TC ID Fold change IL12-4 vs. M82 Annotation
AsA pathways
TC177576 4.439 pectinesterase family protein
TC182248 -1.198 beta-glucuronidase precursor
TC170324 -1.370 beta-glucosidase 01
TC172881 -1.360 ascorbate peroxidase
Hormone metabolism
TC172849 4.864 pyridoxal-phosphate dependent-like enzyme
TC183991 3.812 pyridoxal-phosphate dependent-like enzyme
TC184220 2.611 adenosine 5’-phosphosulfate reductase
TC184006 2.504 cystathionine gamma-synthase
TC169916 1.443 1-aminocyclopropane-1-carboxylate synthase
TC172320 -0.901 s-adenosylmethionine-dependent methyltransferase
Glycolysis and Calvin cycle
TC188751 4.842 RuBisCO small subunit protein
TC190107 1.868 phospho-glycerate kinase
TC182193 1.539 RuBisCO subunit binding-protein alpha subunit
TC183220 0.961 pfkb-type carbohydrate kinase family protein
TC172505 -1.166 pyruvate kinase
Glutathione metabolism
TC175970 -0.542 spermidine synthase
TC181406 -1.095 cysteine synthase
TC189778 -9.031 glutathione s-transferase
Stress response
TC180786 4.167 wound responsive protein
TC174575 1.531 anther-specific proline-rich apg-like protein
TC170015 -3.196 stress-related protein
TC182497 -3.783 calmodulin
TC180230 -4.273 pto kinase interactor 1
TC180552 -4.567 leucine-rich repeat receptor-like kinase
Plastid metabolism
TC185020 1.011 NADP adrenodoxin-like ferredoxin reductase
TC186521 -1.214 ATPase-like protein
TC180781 -2.197 ATP synthase subunit h family protein
Di Matteo et al. BMC Plant Biology 2010, 10:163http://www.biomedcentral.com/1471-2229/10/163
Page 4 of 11
also validated by qRT-PCR. A correlation analysisbetween microarray and qRT-PCR expression data (log2of the expression value) yielded a Pearson’s value of0.878 (P < 0.001).
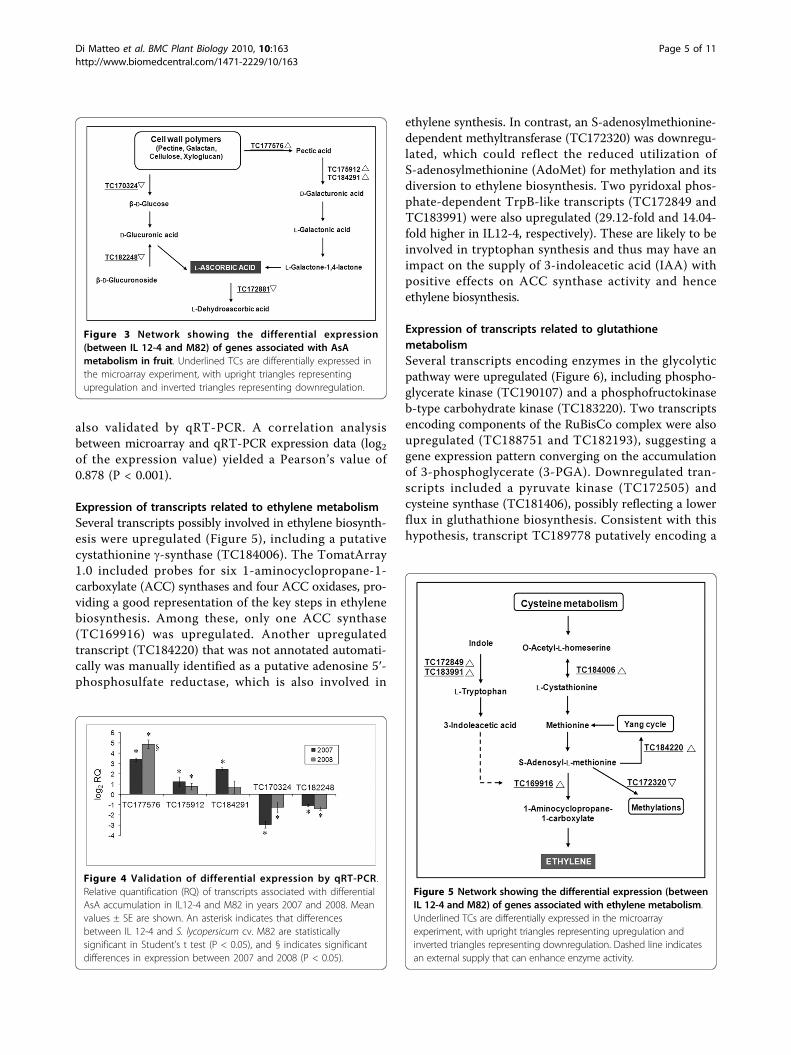
Expression of transcripts related to ethylene metabolismSeveral transcripts possibly involved in ethylene biosynth-esis were upregulated (Figure 5), including a putativecystathionine g-synthase (TC184006). The TomatArray1.0 included probes for six 1-aminocyclopropane-1-carboxylate (ACC) synthases and four ACC oxidases, pro-viding a good representation of the key steps in ethylenebiosynthesis. Among these, only one ACC synthase(TC169916) was upregulated. Another upregulatedtranscript (TC184220) that was not annotated automati-cally was manually identified as a putative adenosine 5′-phosphosulfate reductase, which is also involved in
ethylene synthesis. In contrast, an S-adenosylmethionine-dependent methyltransferase (TC172320) was downregu-lated, which could reflect the reduced utilization ofS-adenosylmethionine (AdoMet) for methylation and itsdiversion to ethylene biosynthesis. Two pyridoxal phos-phate-dependent TrpB-like transcripts (TC172849 andTC183991) were also upregulated (29.12-fold and 14.04-fold higher in IL12-4, respectively). These are likely to beinvolved in tryptophan synthesis and thus may have animpact on the supply of 3-indoleacetic acid (IAA) withpositive effects on ACC synthase activity and henceethylene biosynthesis.
Expression of transcripts related to glutathionemetabolismSeveral transcripts encoding enzymes in the glycolyticpathway were upregulated (Figure 6), including phospho-glycerate kinase (TC190107) and a phosphofructokinaseb-type carbohydrate kinase (TC183220). Two transcriptsencoding components of the RuBisCo complex were alsoupregulated (TC188751 and TC182193), suggesting agene expression pattern converging on the accumulationof 3-phosphoglycerate (3-PGA). Downregulated tran-scripts included a pyruvate kinase (TC172505) andcysteine synthase (TC181406), possibly reflecting a lowerflux in gluthathione biosynthesis. Consistent with thishypothesis, transcript TC189778 putatively encoding a
Figure 3 Network showing the differential expression(between IL 12-4 and M82) of genes associated with AsAmetabolism in fruit. Underlined TCs are differentially expressed inthe microarray experiment, with upright triangles representingupregulation and inverted triangles representing downregulation.
Figure 4 Validation of differential expression by qRT-PCR.Relative quantification (RQ) of transcripts associated with differentialAsA accumulation in IL12-4 and M82 in years 2007 and 2008. Meanvalues ± SE are shown. An asterisk indicates that differencesbetween IL 12-4 and S. lycopersicum cv. M82 are statisticallysignificant in Student’s t test (P < 0.05), and § indicates significantdifferences in expression between 2007 and 2008 (P < 0.05).
Figure 5 Network showing the differential expression (betweenIL 12-4 and M82) of genes associated with ethylene metabolism.Underlined TCs are differentially expressed in the microarrayexperiment, with upright triangles representing upregulation andinverted triangles representing downregulation. Dashed line indicatesan external supply that can enhance enzyme activity.
Di Matteo et al. BMC Plant Biology 2010, 10:163http://www.biomedcentral.com/1471-2229/10/163
Page 5 of 11

gluthathione S-transferase was also downregulated. Atranscript encoding spermidine synthase (TC175970) wasalso repressed, which is relevant because spermidine is aprecursor of trypanothione, which spontaneously reducesdehydroascorbic acid to AsA. This fits well with the coor-dinated downregulation of AsA peroxidase (TC172881)described above.
DiscussionThe antioxidant activity of AsA makes it a crucial com-ponent of the stress response in plants [29]. However,the analysis of mutants deficient in AsA synthesisreveals downstream effects on hundreds of genes, sug-gesting it is also a key signaling molecule in defense anddevelopment [30]. To fulfill such an important role, AsAsynthesis must be tightly regulated. Several alternativebiosynthetic pathways have been identified and it istherefore difficult to pin down exactly how synthesis iscontrolled in the context of development, stressresponses and normal homeostasis [14].In order to determine how AsA synthesis is controlled
in tomato fruits we combined introgression lines pre-viously used for QTL mapping, and transcriptome ana-lysis using the new CombiMatrix microarray platform.Because the AsA content of tomato fruits shows quanti-tative variation, introgression lines involving tomato
varieties with strikingly different AsA levels are a usefultool to track down QTLs. Such lines have been gener-ated by introgressing DNA from S. pennellii, a wildtomato species with high AsA levels, into the back-ground of a common processing cultivar of S. lycopersi-cum (M82), which has a lower AsA content [20,22].Among six QTLs affecting AsA levels that were identi-fied by Rousseaux et al. [22], only one (asa12-4)increased fruit AsA concentration, and this was foundin IL 12-4. Stevens et al. [20] also identified 11 QTLsaffecting fruit AsA levels; eight increased the AsA con-tent but none of them was observed in IL 12-4.Under our experimental conditions, S. pennellii
LA0716 achieved on average a 3.9-fold increase in fruitAsA levels compared to M82, showing that this wildspecies is a useful reservoir of genetic variability fortomato fruit quality enhancement. Our data confirmedthose of Rosseaux et al. [22] who observed higher levelsof AsA in IL12-4 fruits, but only in one season. Theaverage AsA content in IL12-4 fruit is higher than thatusually observed in commercial varieties [23,31,32],although there are some exceptions [33]. The asa12-4QTL therefore provided us with a valuable tool to facili-tate the transcriptomic analysis of fruit AsA metabolismin tomato even though asa12-4 does not increase AsAlevels to those seen in S. pennellii.
Figure 6 Network showing the differential expression (between IL 12-4 and M82) of genes associated with the glycolytic pathway andglutathione metabolism. Underlined TCs are differentially expressed in the microarray experiment, with upright triangles representingupregulation and inverted triangles representing downregulation. Abbreviations: 1,3-DPGA, 1,3-diphosphoglyceric acid; 3PGA, 3 phosphoglycericacid; RuBP, Ribulose 1,5-biphosphate; PEP, phosphoenolpyruvic acid; GSH, glutathione; DHA, dehydroascorbic acid.
Di Matteo et al. BMC Plant Biology 2010, 10:163http://www.biomedcentral.com/1471-2229/10/163
Page 6 of 11

Comparative microarray analysis revealed 253 differen-tially-expressed transcripts, 24% of which were upregu-lated in IL12-4 fruit and 76% of which weredownregulated. Gene Ontology classifications automati-cally retrieved from the GO Consortium [34] using Blas-t2GO provided a useful framework for annotation,classification and comparison of groups of sequencesaccording to biological process, molecular function andcellular component terms. Combining functional anno-tation and GO classifications with hierarchical clusteringhelped to identify groups of co-regulated transcripts.One of these (Additional file 5) included upregulatedtranscripts involved in glycolysis, the Calvin cycle, pectinbreakdown, tryptophan synthesis and the woundresponse, whereas another (Additional file 6) includeddownregulated transcripts involved in AsA peroxidation,glucuronoside metabolism and glutathione metabolism.Overall, our results suggested that metabolic changes
associated with AsA accumulation in tomato fruits werefocused on the L-galactonic acid and d-glucuronic acidpathways (Figure 3), rather than the main Smirnoff-Wheeler AsA pathway. Indeed, the upregulation oftranscripts encoding a pectinesterase and two polygalac-turonases suggests that the accelerated breakdown ofpectin polymers may increase the availability of inter-mediates for the L-galactonic acid pathway, increasingthe flux towards of AsA biosynthesis. The importance ofthe L-galactonic acid pathway in AsA biosynthesis wasdemonstrated in transgenic Arabidopsis plants overex-pressing a strawberry D-galacturonic acid reductase; thetransgenic plants had higher AsA levels than wild typeplants, reflecting the conversion of D-galacturonic acidinto L-galactonic acid as the key control point in theL-galactonic acid branch of AsA metabolism [18].The above results suggest that accelerated pectin poly-
mer breakdown increases the availability of precursorsfor AsA biosynthesis in the L-galactonic acid pathway,resulting in the accumulation of AsA in fruits. Thebreakdown of other cell wall polymers such as cellulosecould have a similar impact, but our data strongly indi-cate that cellulose does not contribute to AsA biosynth-esis in this manner. A b-glucosidase transcript isdownregulated, indicating that precursors for the D-glucuronic acid branch of the pathway would becomescarcer and flux would be reduced. The coordinatedownregulation of a b-glucuronidase transcript also sup-ports the hypothesis of reduced flux through the D-glucuronic acid pathway (Figure 3). Consistent with thehypothesis that substrate availability limits the amountof AsA produced via an alternative pathway, plants withlower pectate lyase activity accumulate less AsA [18].Enhancing the breakdown of cell wall components
therefore appears to be a useful strategy for the creationof transgenic fruit crops with higher levels of AsA.
However, where this has been attempted, it has oftenled to changes in the process of fruit softening and over-all firmness. The knockdown of polygalacturonase genesdelays softening and thus increases shelf life [35] whilemaking the fruits firmer [36]. In contrast, the knock-down of a pectin methylesterase had the opposite effect,significantly reducing shelf life [37]. This is in line withthe reduced firmness of IL12-4 fruit we observed at thered-ripe stage (unpublished data), which providesfurther support for pectin catabolism as the mainmechanism underlying the increase in AsA levels.The higher accumulation of AsA in IL12-4 fruits may
involve additional mechanisms that have not been eluci-dated so clearly as the pectin degradation process. Forexample, the upregulation of both a pyrophosphate-dependent phosphofructo-1-kinase and a phosphoglyce-rate kinase may indicate an increase in the catabolism ofreducing monosaccharides in the cytosol. Nevertheless,glycolytic flux in IL12-4 fruit might be limited given thedownregulation of a pyruvate kinase. Together with theupregulation of two RuBisCO components, the supplyof 3-phosphoglycerate may increase (Figure 6), leadingto an increase in the synthesis of hexoses that are thenmade available for the AsA biosynthetic pathway.The higher AsA content in IL 12-4 fruits could also
result from the reduced utilization of AsA, as indicatedby the downregulation of an AsA peroxidase (Figure 3).This is also in line with the downregulation of a spermi-dine synthase (possibly involved in trypanothione bio-synthesis), which would therefore be less required fordehydroascorbate regeneration to AsA (Figure 6).Accordingly, the downregulation of a pyruvate kinaseand a cysteine synthase indicates that the synthesis ofglutathione is repressed, while the downregulation of agluthathione S-transferase indicates that glutathione uti-lization is also reduced. Taken together, these resultsare consistent with a hypothesis based on lower overalldemand for cellular antioxidant activity, in turn redu-cing glutathione biosynthesis and allowing AsA to accu-mulate. Additional changes to plastid metabolism areevident from the data presented in Table 1, includingthe upregulation of two RuBisCO proteins and anNADP ferredoxin reductase, and the downregulation ofan ATP synthase, all of which may be involved in redu-cing the abundance of reactive oxygen species by limit-ing the electron flux from water to NADPH [38,39].The presence of fewer reactive oxygen species is alsoconsistent with the observed downregulation of stressresponse genes encoding calmodulin, a Pto kinase-binding protein and a leucine-rich repeat receptor-likekinase.Finally, given that pectin catabolism can be triggered
by ethylene, we focused on the modulation of transcriptsassociated with the ethylene biosynthesis pathway. Some
Di Matteo et al. BMC Plant Biology 2010, 10:163http://www.biomedcentral.com/1471-2229/10/163
Page 7 of 11

of the observed changes may account for major effectson ethylene biosynthetic flux, e.g. the upregulation of acystathionine g-synthase, which catalyzes the first com-mitted step in methionine biosynthesis and whose roleas a key step in the regulation of ethylene metabolismhas been proven in transgenic tobacco plants overex-pressing a truncated cystathionine g-synthase gene [40].Furthermore, the upregulation of a putative adenosine5′-phosphosulfate transcript suggested that the efficiencyof the Yang cycle may be increased [41] (Figure 5), andthe downregulation of a putative S-adenosylmethionine-dependent methyltransferase suggested that AdoMet isbeing used less frequently for substrate methylations.Both these changes correspond to an increase in ethy-lene flux, as does the upregulation of a 1-aminocyclo-propane-1-carboxylate (ACC) synthase. Indeed, ethyleneproduction is tightly regulated by feedback control ofACC synthase and/or ACC oxidase (reviewed by Kende[42]). In tomato fruit, both ACC synthase and ACC oxi-dase activity are induced by exogenous ethylene [43],and the induction is achieved by transcriptional regula-tion [44]. ACC synthase may also promote ethylene bio-synthesis driven by IAA [45], which is consistent withour observation that two tryptophan synthase transcriptsare upregulated (Figure 5). Overall, the transcriptionalmodulation of genes associated with ethylene biosynth-esis appears to enhance ethylene levels in IL 12-4 fruit,which may trigger the pectin degradation that leads toAsA accumulation.
ConclusionsComparative transcriptome analysis in tomato fruitsfrom an introgression line with high levels of AsA and aparent with low levels has suggested that the higherlevel of AsA in IL12-4 fruits may reflect a combinationof increased AsA synthesis and reduced utilization. Inparticular, the higher AsA content in IL 12-4 may betranscriptionally controlled through the upregulation ofgenes driving pectin degradation, thus releasing inter-mediates for the L-galactonic acid pathway, which istherefore likely to affect AsA biosynthesis in IL12-4fruit. We found no evidence supporting the specificinvolvement of the glucuronic acid and Smirnoff-Wheeler pathways. The accelerated pectin degradationmight itself be triggered by an increase in ethylene bio-synthesis, which may be related to the upregulation ofseveral genes in the ethylene biosynthetic pathway. Anincrease in the supply of hexoses for AsA biosynthesismay also help to boost AsA levels, which is suggestedby the transcriptional upregulation of genes involved inprocesses converging on 3-PGA accumulation. Finally,we note that several plastidial genes identified in thecomparative analysis could conceivably help to reducethe abundance of reactive oxygen species, in turn
preventing AsA peroxidation and allowing AsA toaccumulate.It will be necessary to carry out additional metabolic
studies to characterize the regulatory mechanisms wehave identified, and to establish the chain of events lead-ing to AsA accumulation and the trigger that induces it.We also need to determine whether AsA levels can becontrolled through the L-galactonic acid pathway intomato, as this has been demonstrated only in straw-berry thus far, and whether this is a specific mechanismacting only in IL 12-4 fruit, or if it is a general mechan-ism controlling AsA accumulation in the fruits of alltomato varieties.
MethodsPlant materialThe tomato plants used in this study were the introgres-sion line (IL) 12-4 and its parental genotypes. IL 12-4(accession LA4102) contains a 52 cM homozygous intro-gression from S. pennellii (accession LA0716) in a S. lyco-persicum cv. M82 background (accession LA3475) [24].LA0716 is a homozygous, self-fertile indeterminate acces-sion from Atico, Peru, with green fruits. M82 is a determi-nate, red-fruited variety used for processing. All seeds wereprovided by the C.M. Rick Tomato Genetics ResourceCenter at the University of California (Davis, USA).
Greenhouse trialsIL12-4 and its parental genotypes were cultivated overthree consecutive years (2006-2008) in a greenhouse atthe Department of Soil, Plant, Environmental and Ani-mal Production Sciences at the University of Naples(Portici, Italy). Six plants from IL 12-4 and 15 fromeach parental line were transferred into 20-cm pots con-taining a 1:1 mixture of medium sandy soil and compostat the beginning of March. Pots were distributed ran-domly 15 cm apart in rows separated by a 50-cm chan-nel, and were supplemented with Nitrophoska BluSpezial 12-12-17 (+2+20) (Compu) slow-release fertilizer(5 g). Plants were watered twice daily using an auto-mated irrigation device with individual drip lines. Priorto flowering, the plants were supplied every two weekswith 30-10-10 liquid fertilizer (Grow More, USA). Fruitswere collected from IL 12-4 and its cultivated parentwhen 75% were full sized and red-ripe, softening hadincreased and the inside of the columella was comple-tely red. For S. pennellii, the maturity of the green fruitwas based on size and softness. Samples were generatedby pooling ripe fruits from the same plant (at least threesamples per line) and discarding the seeds, jelly par-enchyma, columella and placenta tissues. Samples werefrozen under liquid nitrogen and stored at -80°C priorto homogenization in a Waring blender and processingfor the extraction of total RNA and AsA.
Di Matteo et al. BMC Plant Biology 2010, 10:163http://www.biomedcentral.com/1471-2229/10/163
Page 8 of 11

Ascorbic acid quantificationAsA levels were measured using a modified version ofthe procedure described by Kampfenkel et al. [46]. Fro-zen tissue (250 mg) was placed in a 1.5-ml tube with abead and 200 μl of ice-cold 6% trichloroacetic acid(TCA) (Sigma), and was homogenized at 50 Hz in a Tis-sueLyzer (Qiagen) for 2 × 1 min. Samples were thenincubated on ice for 10 min and centrifuged for 25 minat 25,000 × g and 4°C. The supernatant was supplemen-ted with 6% TCA to a total volume of 500 μl, and thencentrifuged as above for 10 min. A 50-μl aliquot wastransferred to a fresh 1.5-ml tube containing 150 μl 0.2M phosphate buffer (pH 7.4) and this was supplementedwith 50 μl double distilled water, 250 μl 10% TCA, 200μl 42% H3PO4, 200 μl 2,2′-dipyridyl and 100 μl 3%FeCl3. The mixtures were vortexed and incubated at 42°C for 40 min prior to measurement at 525 nm in aBeckman DU-640 UV spectrophotometer using 6% TCAas a reference. The AsA concentration was expressed inμmol g-1 fresh weight according to the standard curveA525 = 3.6593 × μmol AsA, designed over a dynamicrange of 0-0.7 μmol AsA (R2 = 0.9982). The value wasthen converted into μg g-1.
Statistical analysis of phenotypic dataStatistical analysis was performed using SPSS 15.0 forWindows (evaluation version release 15.0.0). The signifi-cance of genotype with respect to AsA levels in fruitover three consecutive greenhouse trials was determinedby comparing mean AsA levels in IL 12-4, M82 and S.pennellii samples using a Univariate ANOVA with Dun-net’s post-hoc test. Because of the significant interactionbetween genotype and year (P < 0.05), an independent-sample Student’s t-test was used to compare IL12-4 andits wild parent to the M82 reference within each trial.
Chip design and synthesisTranscriptomic analysis was performed on a 90K Toma-tArray1.0 microarray synthesized using the CombiMatrixplatform at the Plant Functional Genomics Center of theUniversity of Verona http://ddlab.sci.univr.it/Functional-Genomics/. CombiMatrix technology combines phos-phoramidite chemistry and semiconductors for the digitalcontrol of probe synthesis on the chip surface. The 90KTomatArray1.0 contains 90,000 siliceous electrodes (fea-tures) supporting 20,200 unique 35-40 mer DNA oligo-nucleotide probes synthesized in situ with fourreplications. Probes were designed to target single tran-scripts using OligoArray 2.1 [47] to match specificallywith the 21,550 tomato Tentative Consensus sequences(TCs) available in the TIGR database Gene Index Release11.0 (June 21, 2006). Missed TCs were not representedon the chip because it was not possible to design specificprobes with the necessary thermodynamics. Nine
bacterial oligonucleotide sequences provided by Combi-Matrix were used as negative controls. The four replicatesof each probe were distributed randomly across the arrayto control for internal variability.
RNA isolation and microarray hybridizationTotal RNA was extracted from frozen, homogenized andpowdered tomato fruit tissue using the CTAB (hexade-cyltrimethylammonium bromide) method [48]. Sampleswere taken from IL12-4 and M82 using three plants pergenotype in the 2007 and 2008 growing trials.Microarray experiments were designed and conducted
according to the MIAME guidelines http://www.mged.org/miame. Total RNA (1 μg) was used as a template tosynthesize antisense RNA (aRNA) with the SuperScript™Indirect RNA Amplification System Kit (Invitrogen)incorporating Alexa Fluor 647 Reactive Dye. Pre-hybridization, RNA fragmentation, hybridizationwith 3 μg of labeled and fragmented aRNA and post-hybridization washes were performed according to Com-biMatrix protocols http://www.combimatrix.com/docs/PTL020_00_90K_Hyb_Imaging.pdf.After hybridization and washing, the microarray was
dipped in imaging solution, covered with LifterSlip™,and then scanned using a Perkin Elmer ScanArray4000XL and the accompanying acquisition software(ScanArray Express Microarray Analysis System v4.0).The resulting TIFF images were processed to extractraw data using the CombiMatrix Microarray ImagerSoftware v5.8.0. Signal probe medians and standarddeviations were imported into the SPSS software, andnormalization was achieved by correcting each probemedian based on the ratio between the median of thearray and the average median of arrays. Following datanormalization and quality control, all values were logtransformed (base 2). Finally, probe signals with a varia-bility coefficient higher than 0.5 as well as spikes andfactory probes were filtered out. Also, probes with signalintensities in the uppermost and lowermost 10% ofvalues were deleted. The microarray data were depositedin Gene Expression Omnibus (GEO) under the seriesaccession GSE19897.
Table 2 Primer pairs used for qPCR validation of genesinvolved in AsA accumulation that are differentiallyexpressed in IL 12-4 and M82
Forward Primer Reverse Primer
TC170324 5’-aatcggtaactctggcactga-3’ 3’-cagcagcatgagcaagaagt-5’
TC175912 5’-ccattcaagtcagccctttt-3’ 3’-ggtagagcatgcaccagtttt-5’
TC177576 5’-taacatttgctgaggaaagatgca-3’ 3’-tttttgaagtgtttgatcccattc-5’
TC182248 5’-ttcagctgtagcatgggttg-3’ 3’-aaacaagattgcgaccactgt-5’
TC184291 5’-ggagagcagcatgtcaatca-3’ 3’-ggcatttccttgtccgttta-5’
Di Matteo et al. BMC Plant Biology 2010, 10:163http://www.biomedcentral.com/1471-2229/10/163
Page 9 of 11

Differential signals in the IL12-4 vs. M82 fruit tran-scriptomes were identified using the two-factor ANOVAmodule in the TIGR Multiple Experiment Viewer Soft-ware v4.0 http://www.tigr.org/software/tm4/[49]. Hier-archical clustering of differentially-expressed signals wasachieved using Pearson correlation as a metric to inves-tigate gene expression co-regulation.Blast2GO http://blast2go.bioinfo.cipf.es/ was used to
provide automatic high-throughput annotation, geneontology mapping and categorization of TCs showingdifferential transcription signals [50]. Sequences whoseannotation was not automatically provided throughsimilarity matching in the NCBI’s non-redundant NRdatabase were processed manually using the similaritysearch tools FASTA33 http://www.ebi.ac.uk/Tools/fasta33/index.html and/or SGN BLAST http://sgn.cor-nell.edu/tools/blast/. In each case, an expectation valuethreshold of 10-10 was used.
Experimental validationThe expression profiles of TCs considered to be keycontrol points for AsA accumulation were validated byreal-time quantitative RT-PCR in a 7900HT Fast Real-Time PCR System (Applied Biosystems). Amplificationwas performed in 12.5-μl reaction volumes using aPower SYBR® Green PCR Master Mix (Applied Biosys-tems). Relative quantification was achieved by the ΔΔCtmethod [51]. Primer pairs were validated using a stan-dard curve over a dilution range 1-10-3 (R2 > 0.98; slopeclose to -3.32). The primer pair sequences are listed inTable 2.
Additional material
Additional file 1: List of 253 probes showing differentialhybridization signals in the IL12-4 and M82 transcriptomes.Statistical and annotation details of 253 probes showing differentialhybridization signals at a 2-Factorial ANOVA model (P < 0.01) in the IL12-4 transcriptome compared to M82. Statistical analysis was performed bythe TM4:MeV microarray software suite and the IL 12-4 vs. M82 signalratio together with the Adjusted P value were reported. The automaticBLAST annotation of TC sequences was performed by the BLAST2GOsoftware suite and the expectation value (e value), sequence similarityand corresponding Gene Ontology terms were reported. TCs are listedaccording to a decreasing IL12-4 vs. M82 fold change.
Additional file 2: Ontology categorization for Biological Process.Functional categorization according to GO Biological Process (BP)vocabulary of Tentative Consensus (TCs) showing differentialhybridization signals in IL12-4 vs. M82.
Additional file 3: Ontology categorization for Molecular Function.Functional categorization according to GO Molecular Function (MF)vocabulary of Tentative Consensus (TCs) showing differentialhybridization signals in IL12-4 vs. M82.
Additional file 4: Ontology categorization for Cellular Component.Functional categorization according to GO Cellular Component (CC)vocabulary of Tentative Consensus (TCs) showing differentialhybridization signals in IL12-4 vs. M82.
Additional file 5: Heat map of upregulated transcripts. The map wasobtained from HCL clustering using Pearson’s correlation as metrics.Normalized log transformed microarray data are represented accordingto a color scale.
Additional file 6: Heat map of downregulated transcripts. The mapwas obtained from HCL clustering using Pearson’s correlation as metrics.Normalized log transformed microarray data are represented accordingto a color scale.
AcknowledgementsThis work was funded principally by the MiPAF AGRONANOTECH and MiURGENOPOM programs. It was also supported by the Project “Programmaquadriennale per il completamento e l’attività del Centro di GenomicaFunzionale Vegetale dell’ Università degli Studi di Verona” granted byCARIVERONA Bank Foundation. Contribution No. 224 from the DISSPAPA.
Author details1Department of Soil, Plant, Environment and Animal Sciences, University ofNaples “Federico II”, Via Università 100, 80055 Portici, Italy. 2Department ofBiotechnology, University of Verona, Strada Le Grazie 15 - 37134 Verona,Italy.
Authors’ contributionsADM conceived the experiment, carried out plant growth and AsAquantification, microarray analysis, data mining and drafted the manuscript.AS contributed to plant growth and AsA quantification, and to themanuscript writing. MA carried out qRT-PCR experiments. AF carried out thechip synthesis and contributed to the microarray hybridization. MPparticipated to experimental design and to the manuscript revision. MDdeveloped chip design and revised the manuscript. LF critically revised themanuscript. AB coordinated the study, partecipated to interpretation of dataand largely contributed to the manuscript revision. All authors have readand approved the final manuscript.
Received: 21 January 2010 Accepted: 6 August 2010Published: 6 August 2010
References1. Sies H: Oxidative stress: oxidants and antioxidants. Experimental Physiology
1997, 82:291-5.2. Giovannucci E: Nutritional factors in human cancers. Advances in
Experimental Medicine and Biology 1999, 472:29-42.3. Davuluri GR, van Tuinen A, Fraser PD, Manfredonia A, Newman R,
Burgess D, Brummell DA, King SR, Palys J, Uhlig J, Bramley PM,Pennings HMJ, Bowler C: Fruit-specific RNAi-mediated suppression ofDET1 enhances carotenoid and flavonoid content in tomatoes. NatureBiotechnology 2005, 23:890-895.
4. Hancock RD, Viola R: Improving the nutritional value of crops throughenhancement of L-ascorbic acid (vitamin C) content: rationale andbiotechnological opportunities. Journal of Agricultural and Food Chemistry2005, 53:5248-5257.
5. Muckenschnabel I, Goodman BA, Williamson B, Lyon GD, Deighton N:Infection of leaves of Arabidopsis thaliana by Botrytis cinerea: changes inascorbic acid, free radicals and lipid peroxidation products. Journal ofExperimental Botany 2002, 53:207-214.
6. Kuzniak E, Sklodowska M: Fungal pathogen-induced changes in the anti-oxidant systems of leaf peroxisomes from infected tomato plants. Planta2005, 222:192-200.
7. Malacrida C, Valle E, Boggio S: Postharvest chilling induces oxidativestress response in the dwarf tomato cultivar Micro-Tom. PhysiologiaPlantarum 2006, 127:10-18.
8. Smirnoff N, Conklin PL, Loewus FA: Biosynthesis of ascorbic acid in plants:a renaissance. Annual Review of Plant Physiology and Plant MolecularBiology 2001, 52:437-467.
9. Green MA, Fry SC: Vitamin C degradation in plant cells via enzymatichydrolysis of 4-Ooxalyl- L-threonate. Nature 2005, 433:83-87.
Di Matteo et al. BMC Plant Biology 2010, 10:163http://www.biomedcentral.com/1471-2229/10/163
Page 10 of 11

10. Horemans N, Foyer CH, Asard H: Transport and action of ascorbate at theplant plasma membrane. Trends in Plant Science 2000, 5:263-267.
11. Smirnoff N, Wheeler GL: Ascorbic acid in plants: biosynthesis andfunction. Critical Reviews in Biochemistry and Molecular Biology 2000,35:291-314.
12. Chen Z, Young TE, Ling J, Chang SC, Gallie DR: Increasing vitamin Ccontent of plants through enhanced ascorbate recycling. Proceedings ofthe National Academy of Sciences, USA 2003, 100:3525-3530.
13. Eltayeb AE, Kawano N, Badawi GH, Kaminaka H, Sanekata T, Shibahara T,Inanaga S, Tanaka K: Overexpression of monodehydroascorbate reductasein transgenic tobacco confers enhanced tolerance to ozone, salt andpolyethylene glycol stresses. Planta 2007, 225:255-1264.
14. Valpuesta V, Botella MA: Biosynthesis of L-ascorbic acid in plants: newpathways for an old antioxidant. Trends in Plant Science 2004, 9:573-577.
15. Laing WA, Wright MA, Cooney J, Bulley SM: From the cover: the missingstep of the L-galactose pathway of ascorbate biosynthesis in plants, anL-galactose guanyltransferase, increases leaf ascorbate content.Proceedings of the National Academy of Sciences, USA 2007, 104:9534-9539.
16. Wolucka BA, Van Montagu M: GDP-mannose 3’,5’-epimerase forms GDP-L-gulose, a putative intermediate for the de novo biosynthesis of vitaminC in plants. Journal of Biological Chemistry 2003, 278:47483-47490.
17. Lorence A, Chevone BI, Mendes P, Nessler CL: myo-inositol oxygenaseoffers a possible entry point into plant ascorbate biosynthesis. PlantPhysiology 2004, 134:1200-1205.
18. Agius F, Gonzalez-Lamothe R, Caballero JL, Munoz-Blanco J, Botella MA,Valpuesta V: Engineering increased vitamin C levels in plants byoverexpression of a D-galacturonic acid reductase. Nature Biotechnology2003, 21:177-181.
19. Cruz-Rus E, Botella MA, Valpuesta V, Gomez-Jimenez MC: Analysis of genesinvolved in L-ascorbic acid biosynthesis during growth and ripening ofgrape berries. Journal of Plant Physiology 2010, 167(9):739-48.
20. Stevens R, Buret M, Duffe P, Garchery C, Baldet P, Rothan C, Causse M:Candidate genes and quantitative trait loci affecting fruit ascorbic acidcontent in three tomato populations. Plant Physiology 2007,143:1943-1953.
21. Dumas Y, Dadomo M, Di Lucca G, Grolier P: Effects of environmentalfactors and agricultural techniques on antioxidant content of tomatoes.Journal of the Science of Food and Agriculture 2003, 83:369-382.
22. Rousseaux MC, Jones CM, Adams D: QTL analysis of fruit antioxidants intomato using Lycopersicon pennellii introgression lines. Theoretical andApplied Genetics 2005, 111:1396-1408.
23. Frusciante L, Carli P, Ercolano MR, Pernice R, Di Matteo A, Fogliano V,Pellegrini N: Antioxidant nutritional quality of tomato. Molecular Nutritionand Food Research 2007, 51:609-617.
24. Eshed Y, Zamir D: An introgression line population of Lycopersiconpennellii in the cultivated tomato enables the identification and finemapping of yield-associated QTLs. Genetics 1995, 141:1147-1162.
25. Lippman ZB, Semel Y, Zamir D: An integrated view of quantitative traitvariation using tomato interspecific introgression lines. Current Opinion inGenetics & Development 2007, 17:545-542.
26. Barone A, Chiusano ML, Ercolano MR, Giuliano G, Grandillo S, Frusciante L:Structural and functional genomics of tomato. International Journal ofPlant Genomics 2008.
27. Baxter CJ, Sabar M, Quick PW, Sweetlove LJ: Comparison of changes in fruigene expression in tomato introgression lines provides evidence ofgenome-wide transcriptional changes and reveals links to mapped QTLsand described traits. Journal of Experimental Botany 2005, 56:1591-1604.
28. Barone A, Di Matteo A, Carputo D, Frusciante L: High-throughputgenomics enhances tomato breeding efficiency. Current Genomics 2009,10:1-9.
29. Conklin PL, Barth C: Ascorbic acid, a familiar small molecule intertwinedin the response of plants to ozone, pathogens, and the onset ofsenescence. Plant Cell Environment 2004, 27:959-970.
30. Pastori GM, Kiddle G, Antoniw J, Bernard S, Veljovic-Jovanovic S, Verrier PJ,Noctor G, Foyer CH: Leaf vitamin C contents modulate plant defensetranscripts and regulate genes that control development throughhormone signaling. Plant Cell 2003, 15:939-951.
31. Abushita AA, Daood HG, Biacs PA: Change in carotenoids and antioxidantvitamins in tomato as a function of varietal and technological factors.Journal of Agricultural and Food Chemisrty 2000, 48:2075-2081.
32. Raffo A, Leonardo C, Fogliano V, Ambrosino P, Salucci M, Gennaro L,Bugianesi R, Giuffrida F, Quaglia G: Nutritional value of cherry tomatoes(Lycopersicon esculentum cv. Naomi F1) harvested at different ripeningstages. Journal of Agricultural and Food Chemistry 2002, 50:6550-6556.
33. Guil-Guerrero JL, Rebolloso-Fuentes MM: Nutrient composition andantioxidant activity of eight tomato (Lycopersicon esculentum) varieties.Journal of Food Composition and Analysis 2009, 22:123-129.
34. Ashburner M, Ball CA, Blake JA, Botstein D, Butler H, Cherry JM, Davis AP,Dolinski K, Dwight SS, Eppig JT, Harris MA, Hill DP, Issel-Tarver L, Kasarskis A,Lewis S, Matese JC, Richardson JE, Ringwald M, Rubin GM, Sherlock G: GeneOntology: tool for the unification of biology. The Gene OntologyConsortium. Nature Genetics 2000, 25:25-29.
35. Kramer M, Sanders R, Bolkan H, Waters C, Sheehey RE, Hiatt WR: Post-harvest evaluation of transgenic tomatoes with reduced levels ofpolygalacturonase: processing, firmness and disease resistance.Postharvest Biology and Technology 1992, 1:241-255.
36. Langley KR, Martin A, Stenning R, Murray AJ, Hobson GE, Schuch WW,Bird CR: Mechanical and optical assessment of the ripening of tomatofruit with reduced polygalacturonase activity. Journal of the Science ofFood and Agriculture 1994, 66:547-554.
37. Tieman DM, Handa AK: Reduction in pectin methylesterase activitymodifies tissue integrity and cation levels in ripening tomato(Lycopersicon esculentum Mill.) fruits. Plant Physiology 1994, 106:429-436.
38. Allen JF: Control of gene expression by redox potential and therequirement for chloroplast and mitochondrial genomes. Journal ofTheoretical Biology 1993, 165:609-631.
39. Frilyand LE, Scheibe R: Controlled distribution of electrons betweenacceptors in chloroplasts. A theoretical consideration. BiochimicaBiophysica Acta 1999, 1413:31-42.
40. Amir R, Hacham Y, Galili G: Cystathionine g-synthase and threoninesynthase operate in concert to regulate carbon flow towardsmethionine in plants. Trends in Plant Science 2002, 7:153-156.
41. Alexander L, Grierson D: Ethylene biosynthesis and action in tomato: amodel for climateric fruit ripening. Journal of Experimental Botany 2002,53:2039-2055.
42. Kende H: Ethylene biosynthesis. Annual Review of Plant Physiology andPlant Molecular Biology 1993, 44:283-307.
43. Yang SF: The role of ethylene and ethylene synthesis in fruit ripening.Plant Senescence: Its Biochemistry and Physiology Thomson WW, NothnagelEA, Huffaker RC 1987, 156-166.
44. Barry CS, Blume B, Bouzayen M, Cooper W, Hamilton AJ, Grierson D:Differential expression of the 1-aminocyclopropane-1-carboxylateoxidase gene family of tomato. Plant Journal 1996, 9:525-535.
45. Miller AN, Walsh CS, Cohen JD: Measurement of indole-3-acetic acid inpeach fruits (Prunus persica L. Batsch cv. Redhaven) duringdevelopment. Plant Physiology 1987, 84:491-494.
46. Kampfenkel K, Van Montagu M, Inze D: Effects of iron excess on Nicotianaplumbaginifolia plants (implications to oxidative Stress). Plant Physiology1995, 107:725-735.
47. Rouillard JM, Zuker1 M, Gulari E: OligoArray 2.0: design of oligonucleotideprobes for DNA microarrays using a thermodynamic approach. NucleicAcids Research 2003, 31:3057-3062.
48. Griffiths A, Barry C, Alpuche-Solis AG, Grierson D: Ethylene anddevelopmental signals regulate expression of lipoxygenase genesduring tomato fruit ripening. Journal of Experimental Botany 1999,50:793-798.
49. Zar JH: Biostatistical analysis. Prentice-Hall, Upper Saddle River, New Jersey,4 1999, ISBN 0-13-081542-X.
50. Conesa A, Götz S, García-Gómez JM, Terol J, Talón M, Robles M: Blast2GO: auniversal tool for annotation, visualization and analysis in functionalgenomics research. Bioinformatics 2005, 21:3674-3676.
51. Livak KJ, Schmittgen TD: Analysis of relative gene expression data usingrealtime quantitative PCR and the 2-DDCT method. Methods 2001,25:402-408.
doi:10.1186/1471-2229-10-163Cite this article as: Di Matteo et al.: The ascorbic acid content of tomatofruits is associated with the expression of genes involved in pectindegradation. BMC Plant Biology 2010 10:163.
Di Matteo et al. BMC Plant Biology 2010, 10:163http://www.biomedcentral.com/1471-2229/10/163
Page 11 of 11