The adoption of IPM techniques by vegetable growers in Florida, Michigan and Texas
15
The Adoption of 1PM Techniques By Vegetable Growers in Florida, Michigan and Texas Jorge Fernandez-Cornejo, E. Douglas Beach, and Wen-Yuan Huang* Abstract Factors influencing the adoption of Integrated Pest Management(1PM)techniques are studied using survey data from individualvegetableproducersfrom Florida, Michigan,and Texas, Farmers who adopt 1PMtend to be less risk averseand use more managerialtime on farm activities than nonadopters. Adopters are also more likely to operate large, irrigated farms and use more family labor. Locational factors and the type of crop grown are also influentialin 1PMadoption. The analysisuses a logit frameworkand introducesadoptercategoriesfirst conceptualizedby rural sociologists. Key Words: diffusion of innovations, integrated pest management, technology adoption, vegetables Introduction Synthetic pesticides were first actively marketed in the United States in the late 1940s, and their use has since played an integral role in the technological advances that have reduced agricultural labor requirements by half and doubled total factor productivity (USDA, ECIFS). Pesticide use, however, has also caused health and environmental concerns (Hallberg, Harper and Zilberman, Cooper and Loomis, Mott). Food safety considerations about pesticide residues are especially important in fruits and vegetables, because these commodities are often consumed with little post-harvest processing (National Academy of Sciences). In addition, fruit and vegetable production is particularly intensive in pesticidal inputs. In 1990, pesticide expenditures per acre by fruit and vegetable growers were nearly 7 times the agricultural average; U.S. farmers as a whole spent approximately $16 per acre for pesticides, while fruit and vegetable growers spent more than $100 per acre (USDA, Gianessi and Puffer). Integrated Pest Management (1PM) techniques were designed to meet some of these health and environmental concerns and to address the problem of pest resistance to pesticides.’ 1PM combines biological, cultural, and chemical pest control techniques to reduce pest infestation to economical] y acceptable levels (Gianessi and Puffer). While 1PM gained prominence in the late 1960s and first received significant Federal support in 1972, 1PM adoption has moved quite slowly (Virginia Cooperative Extension Service). There is a rich literature on the adoption of technological innovations in agriculture (Feder, Just, *Resourcesand TechnologyDivision,EconomicResearchService,U.S.Departmentof Agriculture. Helpfulcomments from George Frisvold,UtpaJVasavada,MartinShields,and two anonymousrefereesare gratefullyacknowledged. The views expressedare those of the authors and do not necessarilyrepresentviews or policiesof the U.S. Departmentof Agriculture. J. Agr. and Applied .Ecm. 26 (1), July, 1994:158-172 Copyright 1993 SouthernAgriculturalEconomicsAssociation
-
Upload
independent -
Category
Documents
-
view
0 -
download
0
Transcript of The adoption of IPM techniques by vegetable growers in Florida, Michigan and Texas

The Adoption of 1PM Techniques ByVegetable Growers in Florida, Michiganand Texas
Jorge Fernandez-Cornejo, E. Douglas Beach, and Wen-Yuan Huang*
Abstract
Factors influencing the adoption of IntegratedPest Management(1PM)techniques arestudiedusing surveydata from individualvegetableproducersfrom Florida, Michigan,and Texas,Farmerswho adopt 1PMtend to be less risk averseand use moremanagerialtime on farm activitiesthan nonadopters. Adopters are also more likely to operate large, irrigated farms and use morefamily labor. Locationalfactors and the type of crop grown are also influentialin 1PMadoption.The analysisuses a logit frameworkand introducesadoptercategoriesfirst conceptualizedby ruralsociologists.
Key Words: diffusion of innovations, integrated pest management, technology adoption,vegetables
Introduction
Synthetic pesticides were first activelymarketed in the United States in the late 1940s, andtheir use has since played an integral role in thetechnological advances that have reducedagricultural labor requirements by half and doubledtotal factor productivity (USDA, ECIFS). Pesticideuse, however, has also caused health andenvironmental concerns (Hallberg, Harper andZilberman, Cooper and Loomis, Mott). Food safetyconsiderations about pesticide residues areespecially important in fruits and vegetables,because these commodities are often consumed withlittle post-harvest processing (National Academy ofSciences). In addition, fruit and vegetableproduction is particularly intensive in pesticidalinputs. In 1990, pesticide expenditures per acre byfruit and vegetable growers were nearly 7 times theagricultural average; U.S. farmers as a whole spent
approximately $16 per acre for pesticides, whilefruit and vegetable growers spent more than $100per acre (USDA, Gianessi and Puffer).
Integrated Pest Management (1PM)techniques were designed to meet some of thesehealth and environmental concerns and to addressthe problem of pest resistance to pesticides.’ 1PMcombines biological, cultural, and chemical pestcontrol techniques to reduce pest infestation toeconomical] y acceptable levels (Gianessi andPuffer). While 1PM gained prominence in the late1960s and first received significant Federal supportin 1972, 1PM adoption has moved quite slowly(Virginia Cooperative Extension Service).
There is a rich literature on the adoption oftechnological innovations in agriculture (Feder, Just,
*Resourcesand TechnologyDivision,EconomicResearchService,U.S.Departmentof Agriculture. HelpfulcommentsfromGeorgeFrisvold,UtpaJVasavada,MartinShields,and two anonymousrefereesare gratefullyacknowledged. Theviews expressedare those of the authors and do not necessarilyrepresentviews or policiesof the U.S. DepartmentofAgriculture.
J. Agr. and Applied .Ecm. 26 (1), July, 1994:158-172Copyright 1993 SouthernAgriculturalEconomicsAssociation

J. Agr. andAppliedEcon., July, 1994 159
and Zllberman). Early research focused on thediffusion process: after a slow start in which onlya few farmers adopt the innovation, adoptionexpands at an increasing time rate. Later, the rate ofadoption decreases as the number of adopters beginsto exceed the number of farmers who have not yetadopted. Finally, adoption asymptoticallyapproaches its maximum level, until the processends. This process results in an s-shaped diffusioncurve, first discussed by rural sociologists andintroduced to economics by Griliches in 1957.2
Economists and sociologists also want tounderstand what causes adoption rates to differ andwhat constrains the adoption of innovations,Several researchers have examined the influence offarmers’ attributes on the adoption of agriculturalinnovations (e.g., Rahm and Huffrnan, Caswell andZilberrnan). In the past, most adoption studiesfocused on technological innovations that increaseproductivity. Recent interest has shifted towardstudies on the adoption of environmentallypreferable technologies, such as 1PM. The adoptionof 1PM techniques has recently been analyzed byKovach and Tette for New York apple producers,J. K. Harper and others for Texas rice farmers, andMcNamara and others for Georgia peanut growers.
The objective of this paper is to identifyand quantify factors or attributes that influence 1PMadoption decisions of individual vegetable producersin Florida, Michigan, and Texas. The identificationand quantification of these factom will allow anincreased understanding of the process of 1PMadoption and will help provide policy guidance topromote adoption.
Most previous empirical studies have beenlimited to a local setting (county or clusters ofcounties) and have used mail or phone surveys,These surveys often have low response rates andare, consequently, subject to response bias.3 Theinformation used in this study was obtained throughpersonal interviews conducted by trained andexperienced enumerators. This study is also uniquein that it considers three states, each with a differentdegree of 1PM adoption,
Florida, Michigan, and Texas are amongthe most important vegetable-producing states.They cover a wide range of climates and produce alarge variety of vegetables, including high-
consumption items such as fresh tomatoes, onions,snap beans, sweet corn, cucumbers, andwatermelons. Of the three states, Florida had thelargest acreage in its vegetable farms, with 358,600acres planted in 1990, followed by Texas, with205,600 acres, and Michigan, with 159,200 acres(USDA, NASS). Pesticides were a very importantinput in vegetable production in all three states. Intotal, more than 80 percent of these acres weretreated with insecticides in 1990, more than 75percent were treated with herbicides, and more than50 percent were treated with fungicides.
Sociological Views on the Adoption ofInnovations
Rural sociologists conceptualize theinnovation decision as a process comprised ofseveral stages (Rogers). The farmer sequentiallybecomes aware, seeks information, and forms anopinion about the innovation. Next, the farmerdecides whether or not to adopt. If the decisionfavors adoption, implementation follows. Theprocess ends with confirmation of the decision or itseventual reversal. A major difference between thisadoption process and other types of decision-makingis the asymmetry in the uncertainty involved indeciding between the new and the knowntechniques, New techniques are usually adoptedwith incomplete information, whereas currently usedtechniques are better known and often applied withfull information. The average time required for theadoption process varies across innovations anddepends on the characteristics of the innovation, asperceived by the farmers,
Characteristics of Innovations and Their Rate ofAdoption
According to Rogers, five characteristics ofan innovation are essential to explain its rate ofadoption: (1) the perception that the innovation isbetter than the traditional practice, due to economicor social factors, (2) its compatibility with traditionand past experience, (3) its complexity, (4) thefeasibility that the innovation can betried/experimented on a limited basis, and (5) thevisibility of the results of the innovation.
The process of 1PM adoption in the UnitedStates is now more than 20 years old. However, theprocess is far from complete. The slow rate of

160 Fernaniiez-Corn ejo, Beach and Huang: The Adoption of lpM Tech@lieSBY vegetable Growers
diffusion of 1PM appears to be related to several ofthe characteristics listed above. First, given thestochastic nature of yields and production costs,quantifying the economic advantage of 1PM isdifficult for growers, at least in the short run.Second, unlike traditional chemical methods, whichprovide the farmer with precise recommendations,1PM is less precise and its recommendations areoften in conflict with a farmers’ intuition. Forexample, a recommendation to do nothing isinconsistent with the farmer’s traditional notion ofpest control, Also, IPM is often at odds with agrower’s quality needs; for example, to controlcosmetic damage (Kovach and Tette). Third, 1PMis a complex, knowledge- and information-intensivetechnology (Hall and Duncan). Bultena reports that49 percent of Iowa farmers acquainted with 1PMthought that it was “complicated and difficult touse.” Fourth, due to production externalities,experimenting with 1PM on small portions of thefarm may be difficult. Finally, results of using 1PMare not clearly evident. It has been observed thatfarmers are naturally “skeptical when presented withan ill defined departure from a recognized practicethat sounds more like ideology than usableprocedure” (Office of Technology Assessment).4
Adopter Categories
Rural sociologists recognized early thatessential differences among farmers can explainwhy all farmers do not adopt an innovation at thesame time. Rogers used a time continuum toclassify adopters into five categories based on theirinnovativeness, defined as the degree by which afarmer is relatively earlier in adopting, comparedwith other members in the system, Because manyhuman attributes (physical or psychological) arenormally distributed, Rogers hypothesized that thetime to learn a given task is also normallydistributed. Furthermore, he argued that substitutinga social system for an individual, also leads to thenormal distribution, which in the cumulative formapproximates the typical s-shaped diffusion curve,sFor that reason, Rogers used the standard normaldistribution to define adopter categories.
Farmers in the first category are the“innovators.” These individuals are characterized asventuresome and willing to assume the risk of usingthe innovation. They experiment and learn to adaptthe innovation to local conditions. This category
includes the first 2.5 percent of the adopters. Thenext 13.5 percent are the “early adopters.” Farmersin this group play a key role in the diffusionprocess, because they are well respected by otherfarmers and exert a large degree of “opinionleadership.” Next to adopt are the “early majority,”which include 34 percent of the adopters. Farmersin this group deliberate for some time beforeadopting, waiting until sufficient experience hasaccumulated. Individuals in the “late majority”group (34 percent) are skeptics who are notconvinced until most of their peers have adopted.The last group to adopt, the “laggards” (16 percent),are attached to tradition and suspicious ofinnovations and of “change agents.” Laggards adoptonly when they are certain that the innovation willnot fail, because they can not afford failure due totheir “precarious economic condition.”
A drawback of this classification schemefor innovations that never reach 100-percentadoption is that it is not exhaustive because itexcludes farmers that choose not to adopt.However, this problem is easily overcome by addinga long-run nonadopter category (which is assumedto account for 10 percent of the total population, asin Rogers) and renormalizing. The results are shownin Figure 1.
A New Consensus
The views described in this section formpart of the adoption-diffusion perspective, whichAshby, Dunlap and Martin, and others criticized inthe early 1980s. These critics accuse proponents ofthe adoption-diffusion perspective of havingdisciplinary blinders, neglecting crucial factors, suchas the physical environment, in their analyses.More recently, a new consensus has emerged,integrating innovation-diffusion with physical,economic, and other factors (Nowak; Thomas et al.)This is the approach that we take in this study toformulate our hypotheses and analyze the results,
Hypotheses About the Factors InfluencingAdoption
This section examines farmer attributes andlocational factors that are hypothesized to beinfluential in the decision to adopt 1PM. Thesehypotheses are later tested in a logit regressionframework,

J. Agr. and Applied Econ., July, 1994 161
Figure 1. 1PM adopter categories for Mi, TX, and FL vegetable growers
_ Ml Adopters 69.8% -l— Ml Nonadopters 40.2% —
— TX Adopters 38.2% –l-----_ FL Adopters 30.6% 1-
Early adoptere
12.2%
Risk Perceptions
Early majority
30.6%
In agriculture, the notion that innovationsare perceived to be more risky than traditionalpractices has received considerable support in theliterature. Many researchers argue that theperception of increased risk inhibits adoption (Feder,Just, and Zilberman), In general, when aninnovation first appears, potential users are uncertainof its effectiveness and tend to view its use asexperimental (Mansfield). Hiebert views adoptionas a decision problem under uncertainty anddevelops a model to examine the effect of learningunder uncertainty on the adoption decision. Federand O’Mara further develop this idea using aBayesian learning process to show that uncertaintydeclines with learning and experience, thus inducingmore risk-averse farmers to adopt an innovation,provided it is profitable.
Risk is believed to be particular] y criticalin the adoption of a new technology for pestmanagement because the effects of a subsequentcrop loss are uncertain at the time a pest controlstrategy is used (Greene et al.). Bultena and
Late major
30.6%
1
TX Nonadopters 61.2% —
FL Nonadopters 69.6% —
/
aggarda
14.4%\
Longrun
Nonadoptera
Hoiberg empirically support this view, finding thatadopters are less risk-averse than nonadopters.Kovach and Tette find that users of apple 1PMindicate “a greater willingness to accept some riskin order to use all the scientific knowledge availableto protect their crop. ” On the other hand, theyreport that a large percentage of non-users of 1PMpreferred to spray on an insurance or calendar basis.
In this study, the perception of risk ishypothesized to have a negative influence on 1PMadoption. Innovators and early adopters of 1PM arebelieved to be more inclined to take risks (they arerelatively less risk averse) than are early- and late-majority farmers. Late adopters and laggards arelikely to be the most risk averse.
To operationalize the concept of riskpreferences using farmer attributes obtained fromthe survey, the study considers three factorsgenerally associated with a farmer’s risk attitudes.The first, debt-to-assets (DA) ratio, measuresfinancial risk. Robison and Barry show that theoptimal debt is inversely related to risk aversion,which is expected to be negatively related to

162 Fernandez-Cornejo, Beach and Huang: The Adoptmn of 1PM Techmquef By Vegetable Growers
adoption, leading to a positive relation between theDA ratio and adoption. However, Barry argues thatfarmers with a large DA ratio may also want toreduce their business risk, which would lead to theopposite sign for the correlation between the DAratio and 1PM adoption, This study appears toconfh-m that the first effect is larger.
Next, crop insurance is used as a proxy fora grower’s revealed reluctance to assume risk,When growers purchase crop insurance, theytransfer a portion of the yield risk to the insuranceagency. Thus, the purchase of insurance reveals arisk-averse attitude and purchasers of insurance areless likely to adopt because of their aversion torisk.b Last, the total number of vegetable cropsgrown in a farm is used as a crude measure ofoutput diversification, often associated with riskaversion (Freund).
Farm Structure
Another basic hypothesis is that theadoption of an innovation will tend to take placeearlier on larger farms than on smaller farms. Just,Zilberrnan, and Rauser show that given theuncertainty, and the fixed transaction andinformation costs associated with innovations, theremay be a critical lower limit on farm size, whichprevents smaller farms from adopting. As thesecosts increase, the critical size also increases. Itfollows that innovations with large fixed transactionand/or information costs are less likely to beadopted by smaller farms. Nevertheless, Feder,Just, and Zilberrnan caution that farm size may bea surrogate for other factors, such as wealth andaccess to credit, scarce inputs, or information.
It is widely believed that landownershipencourages adoption. Several empirical studiessupport this hypothesis, The views expressed in theliterature are not unanimous, however, and thesubject has been widely debated (Feder, Just, andZilberman). For example, Bultena and Hoiberg findno support for the hypothesis that land tenure had asignificant influence on the adoption of conservationtillage. In our view, the apparent inconsistencies inthe empirical results are due to the nature of theinnovation. Landownership is likely to influenceadoption if the innovation requires investments tiedto the land. Tenants are less likely to adopt thesetypes of innovations because they perceive that the
benefits of adoption will not necessarily accrue tothem. Since 1PM does not require land-tiedinvestments, land tenure is not expected to affect1PM adoption.’
Operator labor measures the amount oftime that the operator dedicates to farm activitiesand is inversely related to off-farm labor of theoperator, As McNamara and others argue, 1PMrequires a substantial amount of the operator’s time.Off-farm employment may present a constraint to1PM participation, because it competes for onfarmmanagerial time. Consequently, the availability ofoperator labor is hypothesized to have a positiveinfluence on 1PM adoption. Similarly, adoption oflabor-intensive practices such as 1PM is expected tobe positively associated with the availability offamily labor.
Crops Grown, Locational and Other Factors
Crop production variables are used tocapture the effects of producing each majorvegetable on 1PM adoption. There are importantdifferences on 1PM adoption between the cropsbecause of differences in the value of the crops,which influence profitability, as well as differencesin the pests, in the availability of reliable 1PMtechniques, in the amount of managerial control andlabor requirements, etc.8 Crop variables aredefined as indicator functions equal to one if agiven crop is grown, zero otherwise, A positive(negative) and significant coefficient for a givenvegetable crop indicates an increased (decreased)probability of 1PM adoption if that crop is grown ona given farm. By comparison, livestock productionis believed to limit 1PM adoption, because livestockproduction is intensive in managerial and otherlabor.
Locational factors, such as soil fertility,rainfall, and temperature influence profitabilityydifferences among farms. The physical environmentof the farm may affect profitability directly throughincreased fertility, and indirectly through itsinfluence on pests. It is plausible that a farmlocated in a dry, infertile area is less likely to adopt1PM than a farm located in an adequately wet,fertile area. While weather (for example, monthlyprecipitation, temperature, and daylight hours), soiltype, and other locational variables may affect theadoption decision, degrees of freedom and

J. Agr. and Applied Eccm., July, 1994 163
collinearity considerations often limit their use in a derivative of Pi with respect to Zip In the discreteregression context. In this study, dummy variables case, the change in probability attributable to the kthfor regions within a state are used as locational variable or attribute is equal to the difference inproxies to account for the potential effect of probability Pi ( Z,~= 1) - Pi ( Zi~ = 0) (Putler andenvironmental factors on adoption. Zilbennan).
Irrigation may also influence adoption.Generally, irrigation increases yields andprofitability, and reduces production risk, However,irrigation may also increase pest risk, because itencourages certain pest populations (Harper andZilberman). Therefore, the net effects of irrigationcannot be predicted a priori.
Modeling Adoption Choices
A new technology will likely be adopted ifits perceived utility is higher than the perceivedutility of the old technology. Choice modelsdeveloped in consumer theory have been used tomotivate adoption decision models. In this context,vegetable growers are assumed to make theirdecisions by choosing the alternative that maximizestheir perceived utility. Thus, the ith grower willadopt 1PM if the utility of adopting, U,l, is largerthan the utility of not adopting, U,. Because thereare errors in optimization and perception, the utilityfunction is assumed to be random (McFadden).Thus, Uij = V,, + eti,j = 1, 0, where V,j is a functionof profits (which generally depend on a vector ofchoice characteristics, X,,, and a vector of individualgrower attributes and locational factors, Zi), and therandom disturbance (eij) accounts for unobservedvariations in preferences and errors in perceptionand optimization. The probability of adoption isthen Pil = P ( U,l > U,O) = P ( Vi, - V,fl> eio-ei,).Assuming that the stochastic components ei, and eiOare independently and identically distributed with aWeibull distribution, then their difference follows alogistic distribution (Maddala). Thus, the adoptiondecision may be analyzed using a Iogit model. Dueto limitations in the data, it is often assumed thatchoice probabilities only depend on observedindividual-specific characteristics (Judge et al.) Inthis case, taking a first-order Taylor seriesexpansion of the functions Vij in the parameters ~,the log of relative odds of adopting 1PM are: log(f’illPiO) = Zi’~, where the parameter vector (3 isalternative-specific. For continuous variables, thechange in the probability of adoption relative to thechange of the kth individual attribute is just the
Data and Estimation
The Agricultural Chemical Use Survey andits Economic Follow-On for vegetables wasadministered by the National Agricultural StatisticalService between October 1990 and February 1991in Arizona, Florida, Texas, and Michigan.9 Thissurvey employed a two frame probability sample:a list frame and an area frame. The list frame wasbased on all known commercial growers of freshandfor processed vegetables, strawberries, or melons(hereafter called vegetables). These growers wererequired to have at least one-tenth of an acre ofproduction to be included on the list. Incomparison, the area frame was taken from the1990 June Agricultural Survey Tracts, and was usedonly to provide additional information for the listframe.
A stratified sampling technique was used todraw the sample. Each stratum is a mutuallyexclusive set of the commodities of interest. Farmsare partitioned such that each farm is associatedwith only one stratum. With respect to 1PM, eachinterviewed farmer was asked to report the use ofscouting for pest damage. In addition, farmers wereasked about specific practices such as use ofparasites (e.g., trichogamma), biochemical ormicrobial agents (B.t., pheromones, etc.), andcultural practices (rotation), which are usuallyconsidered to be 1PM techniques. In this study theuse of any of these practices classifies the farmer asa user of 1PM techniques. After excluding variableswith missing values, 190 usable observationsremained for Florida, 178 for Texas, and 160 forMichigan,
Commonly used econometric estimationmethods are inappropriate in this study, because thesurvey data were obtained from a stratified sample,Unlike simple random sampling, the selection of anindividual farm for the survey is not equally likelyacross all farms on the list. Some farms have ahigher probability of selection than others.Differences in the probability of selection introduce

164 Fernandez-Cornejo, Beach and Huang: The Adoption of [PM Techniques By Vegetable Growers
bias in simple maximum likelihood (ML) estimatesof the parameters and their variances. In this study,Iogit models are estimated using a weighted leastsquares version of the ML method, where theweights are equal to the inverse of the probability ofselection. Separate Iogit regressions are run foreach state. 10
The dependent variable is a binary variableequal to 1 if one or more 1PM techniques is adoptedand Ootherwise, The following factors or attributesare included in the model as regressors:
1. Size: Dummy variable, equal to 1 ifthe farm is larger than 250 acres, Ootherwise.
2. Operator labor: 1000 hours per year.
3. Family labor: Unpaid family labor,1000 hours per year.
4. Debt ratio: Debt-to-total assets ratio.
5. Number of vegetables: Discretevariable equal to the total number ofvegetables grown on each farm,
6. Crop insurance: Dummy variable, 1 ifcrop insurance is purchased, O otherwise,
7. Land tenure: Percent of land owned bythe operator.
8. Irrigation: Percent of acres irrigated.
9, Livestock: Livestock revenues as apercent of total revenues.
10. Locational dummies: Two regions areconsidered for both Florida and Texas. InTexas, the east, with an annualprecipitation of more than 50 inches,includes the 51 eastern counties(EASTD=I), and the west includes theremaining, dryer counties (less than 8inches of precipitation). In Florida, thesouth includes the 10 southern counties(SOUTHD=l). While precipitationdifferences between the south and north areminor, temperature differences have
caused Florida’s fresh winter vegetableproduction to be located primarily in thesouth. Dummies are not used in Mtchigan,because large regional differences are notobserved.
11. Crop variables: Binary indicatorvariables for each of the main crops grownin each State: tomatoes, melons, and sweetcorn for Floridq melons, onions, andcabbage for Texas asparagus, cucumbers,and snap beans for Michigan. The binaryvariable equals one if the given crop isgrown on that farm.
To help analyze the logit regression results,Rogers’ classification is used to characterize thetypes of farmers that comprise the adopter andnonadopter groups in each of the three Statesstudied. The long-run nonadopters category isincluded in addition to the five groups proposed byRogers, Accordingly, the bell-shaped curve isdivided into six categories and renormalized to keepRogers’ relative proportions of the individuals percategory (Fig. 1). An advantage of thismodification is that the classification of adoptercategories becomes mutually exclusive andexhaustive.
Results
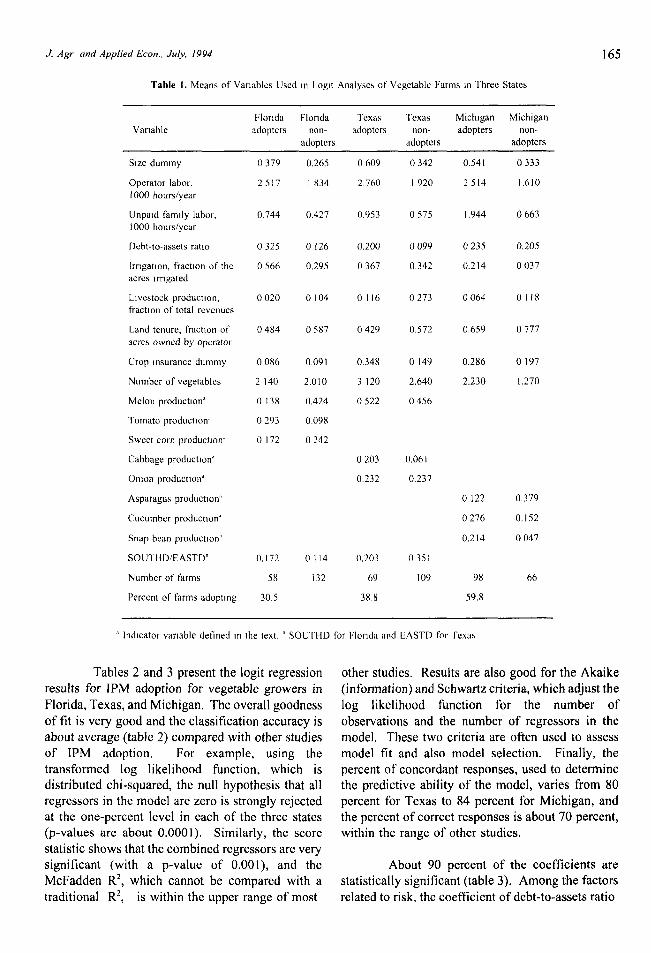
Tables 1, 2, and 3 present the results fromthe statistical analysis of the vegetable survey data.Table 1 provides the mean values of the variablesused in the logit analysis for both adopters and non-adopters. For a binary indicator variable, the meanrepresents the fraction of growers of each groupwith that attribute. For example, the farm-sizevariable for Texas shows that 60.9 percent of theadopters operated farms larger than 250 acres, whileonly 34.2 percent of the nonadopters operated largerfarms. In comparison, the continuous variablesrepresent the actual means. For instance, the meandebt-to-asset ratio for Michigan adopters is 0.235and 0.205 for nonadopters. Table 1 also shows thedegree of 1PM adoption for each state, In Florida30.5 percent of the farms have adopted 1PM,compared with 38.8 percent in Texas, and 59.8percent in Michigan.
J. Agr and Applied Econ., July, 1994
Table 1. Means of Vanabies Used ]n Logit Analyses of Vegctabk Fmms m Three States
165
Florida Florida Texas Texas Michigan MichiganVariable adopters non- adoptcrs nOn- adopters non-
adoptcrs adopters adopters
Size dummy
(3perator labor.
1000 hours/year
Unpaid family labor,1000 hours/year
Debt-to-assets ratio
Irmgatlon, fraction of the
acres Irngated
L!vcstock production,
fraction of total revenues
Land tenure, fract!on of
acres owned by operator
Crop Insurance dummy
Number of vegetables
Melon production’
Tomato production”
Sweet com production’
Cabbage production’
onIon production’
Asparagus production”
Cucumber production’
Snap bean producwon{
SOUTH D/EASTDh
Number of farms
Percent of farms adopting
0379
2517
0,744
0325
0566
0020
0484
0,086
2140
0,138
0293
0172
0,172
58
30.5
0.265
1834
0.427
0126
0,295
0104
0587
0091
2,010
0,424
0,098
0242
0114
i 32
0609
2,760
0,953
0,200
0367
01[6
0429
0,348
3120
0522
0203
0.232
(),203
69
38,8
0342 0.54 I 0333
I 920 2514 1,610
0575 I ,944 0663
0099 0235 0.205
0.342 0.214 0037
() 273 0064 0 [18
0.572 0.659 0777
0149 0.286 0197
2.640 2.230 1.270
0456
0.06 i
0.237
0122 0,379
0276 0.152
0,214 0047
0351
I 09 98 66
59,8
“ lndlcator variable defined in the text. h SOUTHD for Florlda and EASTD for Texas
Tables 2 and 3 present the Iogit regressionresults for 1PM adoption for vegetable growers inFlorida, Texas, and Michigan. The overall goodnessof fit is very good and the classification accuracy isabout average (table 2) compared with other studiesof 1PM adoption. For example, using thetransformed log likelihood function, which isdistributed chi-squared, the null hypothesis that allregressors in the model are zero is strongly rejectedat the one-percent level in each of the three states(p-values are about 0.0001). Similarly, the scorestatistic shows that the combined regressors are verysignificant (with a p-value of 0.001), and theMcFadden R2, which cannot be compared with atraditional R*, is within the upper range of most
other studies. Results are also good for the Akaike(information) and Schwartz criteria, which adjust thelog likelihood function for the number ofobservations and the number of regressors in themodel, These two criteria are often used to assessmodel fit and also model selection. Finally, thepercent of concordant responses, used to determinethe predictive ability of the model, varies from 80percent for Texas to 84 percent for Michigan, andthe percent of correct responses is about 70 percent,within the range of other studies.
About 90 percent of the coefficients arestatistically significant (table 3). Among the factorsrelated to risk, the coefficient of debt-to-assets ratio

166 Fernandez-Corne p),Beach and f{uang The Adoption of 1PMTechtllques By Vegetable Growers
‘l’able 2. Log]t P,cgrcssion Results Ovcrall Mmsurc of [:lt
in Florida and Texas isthe one-percent level.
Dcpcndcnt vti!lahlc Florida ICXJS Michigan
Number ofobsewatlons
-2 Iogllkcllhoodfunction for
covzmatcs
p-valoc (forIIkcllhoocl
I’unction)
McFadden R?
Score statlstlc
Concordant, pcrccnt’
(“orrcct, percent
Sensltlvlty, pcrccntb
I90
359***
() 0001
0305
318
813
7t 4
517
I 7x
313”””
00001
0,229
2X4
79 x
685
.536
166
945***
0000 I
0.440
736
842
719
796
Spcclficlty, pcrccnt’ 80.6 7X o 597
“ Pcrccnt of pails of nbscrvatlorrs wltb dlff’erent responses ]n wh]ch thelargcrresponsebas ahlghcrprobab!l(ty than thcsmaller rcspcrnse,
“Pc[ccnt ofl PM adopters ptcdlctcd as such‘ Percent ofnonadoptcrs prechctcd as such
(*) Slgnlficant at the 10-pcrccnt level
(**) Slgnlficant atthc 5-percent Ievcl
(***) Slgnlficantatttle l-percent Icvel
positive and significant atThis positive relationship
between the DA ratio and adoption indicates that thenegative effect of risk aversion on adoption is largerthan the “Barry effect” (farmers with a high DAratio may be seeking to reduce their business risk).However, the DA ratio in Michigan is significantand of the opposite sign. This may be due to astronger Barry effect for Michigan farmers.Alternatively, the negative sign may be explained bythe advanced degree of 1PM adoption in Michigancompared with the other two states, As the degreeof adoption increases, later adopters who havedifferent attributes than innovators and earlyadopters are included in the adopters group.Adopters in Florida and Texas include allinnovators, early adopters, and a fraction of theearly majority (fig. 1). On the other hand, theadopters in Michigan include all innovators, earlyadopters, early majority, and a large fraction of latemajority adopters (fig. 1). As a result, many of thedifferences in farmer attributes between adoptersand nonadopters in Michigan become blurred,
reducing the reliability of the individual coefficientsin the regression.
The crop insurance variable does notappear to be related to adoption. The coefficient isnegative, as expected under the hypothesis that riskaversion hinders adoption, but insignificant forFlorida and Michigan. The coefficient is positiveand insignificant in Texas. The third variable usedto capture a grower’s risk preference is the numberof vegetable crops grown. The coefficient ispositive in all three states, as expected if riskaversion is to be negatively related to adoption,although it is insignificant in Florida. The result forFlorida may be due to the fact that this variable isinfluenced by other factors in addition to riskdiversification; for example, for many farms thisvariable may be measuring the effect of multiplecropping, where several crops may be grownsequentially on the same field during the same year.In any case, considering the overall effect of thethree proxies of risk aversion, the hypothesis thatrisk preferences have no influence on a grower’s

J. Agr, and Applied ECOII.,July, 1994
Table 3 Loglt Rcgrcsslon Results of 1PM Adoption by Vegetable Growers {n Three States’
167
Depcndcm Florlda lexas M!ch!gan
Dependent variable Parameter Change m Parameter Change In Parameter Change In
[PM esilmatcs pn>babjltly’ esornalcs probabilt[yh es[nnate probabll!tyh
hllerccpl
S,{e
Operak]r labor
Unpa!d fam{ly labor
Oebt-m.assc[s ratm
[rngauon
Llvcsk>ck productmn
Crop msurmce
Numtw of vegetables
Melon pruduc[mr
Tomato producuon
Swcc[ com producmm
Cabbage produchon
f)nmn proclucuon
Asparagu? produc$mn
Cu~umbcr produc[mn
Snap bean prwluchon
SOU”H113/EASTD:
-221
(O 27]
0 40*(O23)
031***(o 10)
043***((310)
I 04***(o34)
I 46***(o2X)
-1 93**(0 7x)
-035(o 35)
005(o08)
.! 94**.(o 22)
I 17***(o 28)
-011(O28)
-O78***
-278
(o 26]
0068 072***
(o 19)
0050 057***
(o 09)
0071 010*(o06)
0170 099***(o36)
O239 I 2x*”*(O27)
-0316 -1 30***(o32)
-0052 -012[0 20)
O008 011***(o04)
.0 2S7 oox(o 19)
()761
0019
0212
0097
0018
0168
0218
-022 I
0020
0019
0013
I 39*** 0302
(o 35)
-1 65*** .0202
(0 26)
.0015 032
(021)
0058
-159(021,
() 10
(o 18)
o 79***
(oIo)
o 35***
(o 07)
-O 87***
(0 30)
.2 57***
(o 34)
-008
(o 20)
o 20***
(o 07)
-1 98***
[0 20)
061**
(O 24)
228***
(o 35)
o 0(19
0371
0098
-o 04X
0063
-0056
-0004
0082
-0202
0023
0069
2 Standard wrors m parentheses Ualculatcd a[ the means lAs IUI or Iexas and SUU HII) Ior Plonda
(’)S!gn!ficant al [hc 10-pcrmn[ Ievcl (**) S!gn, ficant a[tbc 5-pcrcm[ level (***) S!gnlficmta[ the l-percent level
decision to adopt 1PM is rejected at the 1 percentlevel for Texas and Michigan andatthe5 percentlevel for Florida.
For the variety of reasons mentionedearlier, large farms are more likely to adopt IPMthan are smaller farms. In all three states, farm sizeis positively correlated with adoption. Thecoefficient is significant in Florida and Texas. Thepositive, yet insignificant, effect of farm size onadoption in Michigan is not surprising, given therelatively advanced degree of adoption in that state.
Operator labor, which also reflects off-farmactivities by some operators, is positive andsignificant at the one-percent level in all threestates. This suggests that managerial time has asignificant influence on a grower’s decision to adopt1PM. Unpaid family labor is also significant andpositive in all three states. The availability ofunpaid family labor increases the probability ofadoption. Irrigation is positive and significant atthe one-percent level in all three states. Thissuggests that the increased yield and profitabilitycharacteristics outweigh any increase in pest risk,

168 Fernandez-Cornejo, Beach und Huang: The Adopuon of 1PM Technique.v By Vegetable Growers
which may be associated with irrigation in the 1PMadoption decision. Only the regressions for Floridaand Texas include location variables. In Texas, wefind a positive but insignificant (p-value of O.13)relationship between precipitation (prevalent in eastTexas) and 1PM adoption. In contrast, in Floridathe relationship is negative and significant,suggesting that southern Florida growers were lesslikely to adopt 1PM. The reason for this sign isunclear, although the increased incidence of pests inSouth Florida may partially account for it.
The differences in 1PM adoption among themajor vegetables grown is captured by the cropproduction variables (table 3). The production offive of the major vegetables increases theprobability of 1PM adoption. For example, inFlorida, the probability of adopting 1PM for agrower producing tomatoes is 26.1 percent higherthan that of a farmer not growing tomatoes. On theother hand, the probability of adoption is 28.7percent lower for a Florida grower producingmelons compared to a Florida grower not producingmelons. With respect to the livestock productionvariable, a negative and significant effect oflivestock production on 1PM adoption is found in allthree states. This supports our hypothesis thatraising livestock limits the amount of time theoperator can devote to 1PM.
The land tenure variable was dropped fromthe final model because, as hypothesized, thevariable was statistically insignificant in all threestates, While it is sometimes believed that adoptionis positively correlated with landownership, asmentioned earlier, 1PM does not require costly fixedcapital, such as buildings, land-improvements, orother investments tied to the land that a tenantwould probably forgo. Rather, the 1PM investmentis in human capital and not tied to rented land.
Conclusions
Given the distributional consequences ofadoption, which became apparent in many countriesafter the Green Revolution, examining the influenceof farm structure on technology adoption isparticularly interesting. A unique feature of this
study is the different degrees of adoption acrossthree states, ranging from 31 percent in Florida to60 percent in Michigan. By incorporating into ouranalysis some perspectives of rural sociologists,especially the classification of adopters, we improveour interpretation of the empirical results. Inparticular, the more advanced degree of 1PMadoption in Michigan compared with the other twostates explains the decreased reliability of several ofthe coefficients in the logit regression for Michigan.
Our results generally support the notionthat early adopters are more inclined to risk-takingthan are nonadopters. Farm size is a significantfactor in Florida and Texas, confirming ourexpectation that large farms are more likely to adopt1PM than smaller farms. Furthermore, the positive,yet insignificant effect of farm size on adoption inMichigan is explainable, The degree of 1PMadoption is more advanced in Michigan, blurring thedifferences in farmer attributes between adoptersand nonadopters, and consequently reducing thereliability of individual coefficients in theregression. Operator and unpaid family labor aresignificant and positive in all three states, showingthat both the quantity and quality (managerial andnon-managerial) of labor affect the adoptiondecision, Moreover, the significant and negativeeffect of the livestock production variable reinforcesour hypothesis that managerial time is essential inthe adoption of 1PM.
1PM and irrigation are found to becomplementary technologies, perhaps because theincreased profitability that irrigation affords tofarms, also makes 1PM profitable. Crop andlocational variables are also influential in the 1PMadoption decision. Farm ownership is not a factorin 1PM adoption because 1PM does not requireinvestments tied to the land.
The data limits this study, particularly inrelation to the amount of information on farmerattributes, such as education, age, use of extensionservices, etc. Also, the lack of information aboutthe timing of various 1PM practices in relationshipto different pest populations prevents a sequentialanalysis of the decision process.
J. Agr. and Applied Econ., July, 1994 169
References
Ashby, J. A. “The Social Ecology of Soil Erosion in a Colombian Fanning System.” Rur. Sot. 50(1985):377-96.
Bultena, G. L. “Sociological Factors in Conservation Adoptions: A Study of Reduced Tillage and 1PM.”Integration of Pest Management and Conservation Tillage, Proceedings of North Central RegionWorkshop, St. Louis, MO, 1985.
Bultena, G. L., and E. O. Hoiberg. “Factors Affecting Farmers’ Adoption of Conservation Tillage.” J, Soiland Water Conserv. May-June( 1983):281-84.
Burrows, T. M. “Pesticide Demand and Integrated Pest Management: A Limited Dependent VariableAnalysis.” Am. J. Agr. Econ, 65(1983):806-10.
Caswell, M., and D. Zilberman. “The Choices of Irrigation Technologies in California.” Am. J. Agr. Econ.67(1985):224-34.
Cooper, J., and J. Loomis. “Economic Value of Wildlife Resources in the San Joaquin Valley: Huntingand Viewing Values.” In The Economics and Management of Water and Drainage in Agriculture,edited by A. Dinar and D. Zilberman. Norwell, MA: Kluwer Acad. Press, 1991.
Council on Environmental Quality, “Report to the President: Progress Made by Federal Agencies in theAdvancement of Integrated Pest Management.” Washington, D.C., 1980.
Dunlap, R. E,, and K, E. Martin, “Bringing Environment into the Study of Agriculture: Observations andSuggestions Regarding the Sociology of Agriculture.” Rur. Sot. 48(1983):201-18.
Feder, G,, and G, O’Mara, “Farm Size and the Diffusion of Green Revolution Technology,” Econ, Develop.and Cultur. Change. 30(1981):59-76.
“On Information and Innovation Diffusion: A Bayesian Approach.” Am. J.Agr. Econ. 64(1982):145-47.
Feder, G., R. J. Just, and D. Zilbennan. “Adoption of Agricultural Innovations in Developing Countries:A Survey.” Econ. Develop. and Cultur. Change, (1985):255-98.
Fomby, T, B., R. C. Hill, and S, R. Johnson, Advanced Econometric Methods, New York: Springer-Verlag,1984.
Freund, R. J. “The Introduction of Risk into a Programming Model,” Econometrics. 21(1954):253-63.
Greene, C. R., R. A. Kramer, G. W, Norton, E, C, Rajotte, and R. M, McPherson, “An Economic Analysisof Soybean Integrated Pest Management.” Am. J, Agr, Econ. 67(1985):567-72.
Gianessi, L. P., and C. A. Puffer, “Reregistration of Minor Pesticides: Some Observations andImplications.” Inputs Situation and Outlook Report. U.S. Dept. of Agr., Economic ResearchService, February (1992):52-60.
Grilliches, Z. “Hybrid Corn: An Exploration in the Economics of Technological Change.” Econometrics.25(1957):501-22.

170 Fernandez-Cornejo, Beach and Huang: The Adoption of 1PM Techniques By Vegetable Growers
Hall, C. H., and G. Duncan. “Econometric Evaluation of New Technology with an Application to IntegratedPest Management,” Am. J. Agr. Econ. 66(1984):624-33.
Hallberg, G. R. “Agricultural Chemicals in Ground Water: Extent and Implications.” Am. J. Alternative Agr.2(1987):3-15.
Harper, C. R., and D. Zilberman. “Pest Externalities from Agricultural Inputs.” Am. J. Agr. Econ.7 1(1989):692-702.
Harper, J. K., M, E. Rister, J. W. Mjelde, B. M. Drees, and M. O. Way. “Factors Influencing the Adoptionof Insect Management Technology. ” Am. J. Agr. Econ. 72(1990):996-1005.
Hiebert, L. D. “Risk, Learning, and the Adoption of Fertilizer Responsive Seed Varieties.” Am, J. Agr.Econ. 56(1974):764-68.
Judge, G. C., W. E. Griffiths, R. C. Hill, H. Lutkepohl, and Tsoung-Chao Lee. The Theory and Practiceof Econometrics, second edition. New York: John Wiley & Sons, 1985.
Just, R. E., D. Zilberman, and G. C. Rauser. “A Putty-Clay Approach to the Distributional Effects of NewTechnology Under Risk.” In Operations Research in Agriculture and Water Resources, edited byD. Yaron and C. Tapiero. New York: North Holland Publishing Company, 1980.
Kovach, J. and J. P. Tette, “A Survey of the Use of 1PM by New York Apple Producers.” AgriculturalEcosystems and Environment. 20( 1988):101-8.
Maddala, G. S. Limited-Dependent and Qualitative Variables in Econometrics, Cambridge University Press,1983.
Mansfield, C. K. Industrial Research and Technological Innovation. New York: Norton, 1966.
McFadden, D. “Conditional Logit Analysis of Qualitative Choice Behavior.” In Frontiers in Econometrics,ed. P. Zaremka, New York: Academic Press, 1974,
McNamara, K, T., M. E. Wetzstein, and G. K. Deuce. “Factors Affecting Peanut Producer Adoption ofIntegrated Pest Management.” Rev. Agr. Econ. 13(1991):129-39.
Mott, L. “The Public Residue Database.” In Pesticide Residues and Food Safety: A Harvest of Viewpoints,ed. B. G. Tweedy, H, J. Dishburger, L. G. Balantine, and J, McCarthy. Washington, DC: AmericanChemical Society, 1991.
National Academy of Sciences. Regulating Pesticides in Food, Washington, D.C.: National AcademyPress. 1987.
Nowak, P. J, “The Adoption of Agricultural Conservation Technologies: Economic and DiffusionExplanations.” Rur. Sot. 52(1987):208-20.
Putler, D. S., and D. Zllberman. “Computer Use in Agriculture: Evidence from Tulare County, California,”Am. J. Agr. Econ. 70(1988):790-802,
Office of Technology Assessment. Pest Management Strategies: Volume II - Working Papers. Washington,D.C,, 1979.

J, Agr. and Applied Econ., July, 1994 171
Rahm, M. R., and E. Huffman. “Adoption of Reduced Tillage: The Role of Human Capital and OtherVariables.” Am. J. Agr. Econ. 66(1984):405-13.
Robison, L. J,, and P, J. Barry. The Competitive Firm’s Response to Risk. New York: MacmillanPublishing Company, 1987.
Rogers, E. M. D@sion of Innovations, third edition. New York: Free Press, 1983.
Slavin, R, E. Educational Psychology: Theory into Practice, second edition. Englewood Cliffs, NJ: PrenticeHall, 1988,
Thomas, J. K., H. Ladewig and W. A. McIntosh. “The Adoption of Integrated Pest Management PracticeAmong Texas Cotton Growers,” Rur. Sot. 55(1990):395-410.
U.S, Dept. of Agr,, Economic Research Service. Agricultural Resources: Inputs, Situation and OutlookReport. Selected years.
U.S. Dept. of Agr., Economic Research Service. Economic Indicators of the Farm Sector: Production andEficiency Statistics, 1990, ECIFS 10-3, May 1992.
U.S. Dept. of Agr., National Agricultural Statistics Service (NASS). “Agricultural Chemical Use: 1990Vegetables Summary.” June 1991.
Virginia Cooperative Extension Service (VCES). “The National Evaluation of Extension’s Integrated PestManagement Programs.” In association with Virginia Technical University and the U.S.Department of Agriculture, Blacksburg, VA. 1987.
Willey, W. R. Z, “Barriers to the Diffusion of 1PM in Commercial Agriculture,” In Pest Control Strategies,ed. E. Smith and D. Pimentel. New York: Academic Press, 1978:285-307.
Endnotes
1. The Office of Technology Assessment (OTA) defines 1PM as “the optimization of pest control in aneconomically and ecologically sound manner, accomplished by the coordinated use of multiple tactics toassure stable crop production and to maintain pest damage below the economic injury level whileminimizing hazards to humans, plants, and the environment, ” 1PM is likely to play a lead role in thetransition from a chemical-intensive to a low-input sustainable agriculture.
2. S-shaped diffusion was first observed by the French sociologist Tarde in 1903. As Rogers notes, Tardealso offered his “laws of imitation,” including the view that adoption is more likely for innovations that havesome similarity to ideas already accepted.
3, The average response rate from six recent adoption studies in agriculture was approximately 60 percent,with a range of 17 to 89 percent.
4. In addition, Gianessi and Puffer argue that pesticide registration has disrupted several successful 1PMprograms used in the production of vegetables. Because of the expense and time necessary to reregisterpesticides, chemical manufacturers have dropped many of their low volume products, including manyselective pesticides necessary for IPM programs,

172 Fernandez-Cornejo, Beach unil Huang: The Adoption @ [Pkl Techniques By Vegetable Growers
5. A social system is a group of interrelated units (individuals or organizations) seeking to solve a commonproblem in order to reach a collective goal (Rogers).
6, Moral hazard, in the sense that insurance purchasers would be more inclined to adopt 1PM because theyfeel protected bycropinsurance, isunlikely tooccur because agrower that purchases crop insurance canonly be protected up to 75 percent of previous (average) yields.
7. It is also plausible that landowners may have some influence on the adoption decisions of their tenants,as pointed out by a referee, This situation may occur in some special cases (e.g., for share croppers) andposes additional hurdles to adoption. We have no evidence to support this possibility among vegetablefarmers, In addition, the statistical tests show the ownership variable to be insignificant.
8, Griliches showed in 1957 that, in the longer run, differences in the rate of adoption of hybrid com canbe explained by differences in profitability.
9. Arizona was excluded from our study due to the small number of usable observations.
10. Tests in preliminary runs showed that pooling all the data together and using intercept shifters was notadequate. Large interstate differences in production structure, degree of adoption, weather, and soils affectboth the intercept and tbe slopes of the logit regression.