Th e v o lvo g ro u p 2 0 1 2 - Volvo Financial Services
190
WORLD TOGETHER WE MOVE THE THE VOLVO GROUP ANNUAL REPORT 2012
-
Upload
khangminh22 -
Category
Documents
-
view
2 -
download
0
Transcript of Th e v o lvo g ro u p 2 0 1 2 - Volvo Financial Services

worldTogeTher we move The
ww
w.volvogroup.com
The v
olvo
gro
up 2
012
The volvo groupannual reporT 2012
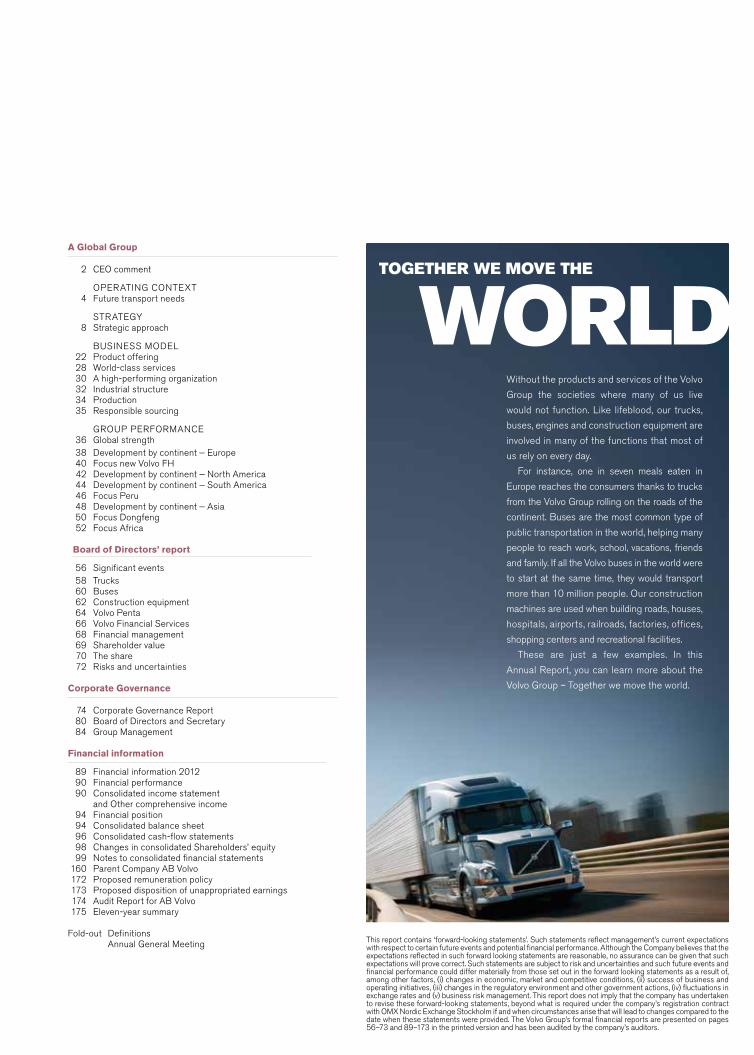
Without the products and services of the Volvo
Group the societies where many of us live
would not function. Like lifeblood, our trucks,
buses, engines and construction equipment are
involved in many of the functions that most of
us rely on every day.
For instance, one in seven meals eaten in
Europe reaches the consumers thanks to trucks
from the Volvo Group rolling on the roads of the
continent. Buses are the most common type of
public transportation in the world, helping many
people to reach work, school, vacations, friends
and family. If all the Volvo buses in the world were
to start at the same time, they would transport
more than 10 million people. Our construction
machines are used when building roads, houses,
hospitals, airports, railroads, factories, offices,
shopping centers and recreational facilities.
These are just a few examples. In this
Annual Report, you can learn more about the
Volvo Group – Together we move the world.
A Global Group
2 CEO comment
OPERATInG COnTExT 4 Future transport needs
STRATEGy 8 Strategic approach
BuSInESS MODEL 22 Product offering 28 World-class services 30 A high-performing organization 32 Industrial structure 34 Production 35 Responsible sourcing
GROuP PERFORMAnCE 36 Global strength 38 Development by continent − Europe 40 Focus new Volvo FH 42 Development by continent − north America 44 Development by continent − South America 46 Focus Peru 48 Development by continent − Asia 50 Focus Dongfeng 52 Focus Africa Board of Directors’ report
56 Significant events 58 Trucks 60 Buses 62 Construction equipment 64 Volvo Penta 66 Volvo Financial Services 68 Financial management 69 Shareholder value 70 The share 72 Risks and uncertainties Corporate Governance
74 Corporate Governance Report 80 Board of Directors and Secretary 84 Group Management Financial information
89 Financial information 2012 90 Financial performance 90 Consolidated income statement
and Other comprehensive income 94 Financial position 94 Consolidated balance sheet 96 Consolidated cash-flow statements 98 Changes in consolidated Shareholders’ equity 99 notes to consolidated financial statements 160 Parent Company AB Volvo 172 Proposed remuneration policy 173 Proposed disposition of unappropriated earnings 174 Audit Report for AB Volvo 175 Eleven-year summary Fold-out Definitions Annual General Meeting This report contains ‘forward-looking statements’. Such statements reflect management’s current expectations
with respect to certain future events and potential financial performance. Although the Company believes that the expectations reflected in such forward looking statements are reasonable, no assurance can be given that such expectations will prove correct. Such statements are subject to risk and uncertainties and such future events and financial performance could differ materially from those set out in the forward looking statements as a result of, among other factors, (i) changes in economic, market and competitive conditions, (ii) success of business and operating initiatives, (iii) changes in the regulatory environment and other government actions, (iv) fluctuations in exchange rates and (v) business risk management. This report does not imply that the company has undertaken to revise these forward-looking statements, beyond what is required under the company’s registration contract with OMx nordic Exchange Stockholm if and when circumstances arise that will lead to changes compared to the date when these statements were provided. The Volvo Group’s formal financial reports are presented on pages 56–73 and 89–173 in the printed version and has been audited by the company’s auditors.
worldToGeTher we moVe The

VolVo Group
Complete partnerThe Volvo Group is one of the world’s leading manufacturers of trucks, buses, con-
struction equipment and marine and industrial engines. The Group also provides
complete solutions for financing and service. The Volvo Group, which employs about
115,000 people, has production facilities in 18 countries and sells its products in
more than 190 markets. In 2012 the Volvo Group’s sales amounted to about SEK
304 billion. The Volvo Group is a publicly-held company headquartered in Göteborg,
Sweden. Volvo shares are listed on OMx nordic Exchange Stockholm.
Strong brandsBy selling products under different brands, the Group can address many different
customer and market segments in mature as well as growth markets.
Strong positions• One of the world’s largest manufacturers of trucks.
• One of the largest within construction equipment.
• One of the world’s largest manufacturers
of heavy-duty diesel engines.
• Global market presence.
Global strengthSince the streamlining towards commercial vehicles was initiated more than ten
years ago, the Volvo Group has significantly strengthened its positions outside the
traditionally big markets of Western Europe and north America. Positions have been
moved forward by acquisitions in primarily Asia and expansion of the distribution and
service networks in for instance Eastern Europe and South America. In the year 2000,
markets outside of Western Europe and north America accounted for 16% of Group
sales. In 2012 that share had grown to 47%.
Volvo Group net sales 2000–2012, SEK bn
2012
303.6
2000
130.1
+133%
Share of net sales by market 2012
Rest of the world
23%
10%
23%
37%
7%
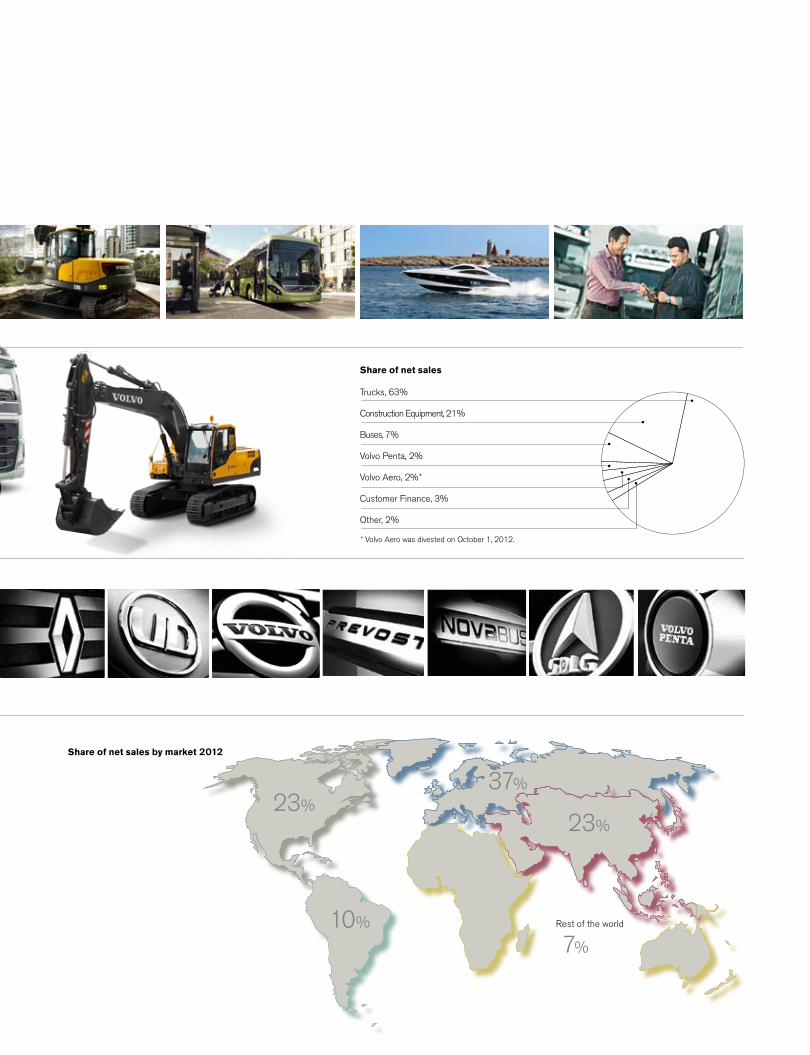
Share of net sales
Trucks, 63%
Construction Equipment, 21%
Buses, 7%
Volvo Penta, 2%
Volvo Aero, 2%*
Customer Finance, 3%
Other, 2%
* Volvo Aero was divested on October 1, 2012.

The VolVo Group 2012
new strategy for the future
Key ratios 2012 2011
net sales Volvo Group, SEK M 303,647 310,367
Operating income Volvo Group, SEK M 17,622 26,899Operating income Industrial Operations, SEK M 16,130 25,930
Operating income Customer Finance, SEK M 1,492 969
Operating margin Volvo Group, % 5.8 8.7
Income after financial items, SEK M 15,355 24,929
Income for the period, SEK M 11,258 18,115
Diluted earnings per share, SEK 5.44 8.75
Dividend per share, SEK 3.001 3.00
Return on shareholders' equity, % 12.9 23.1
number of permanent employees 98,717 98,162
Share of women, % 17 18
Share of women, Presidents and other senior executives, % 19 17
Employee Engagement Index, % 76 76
Energy consumption, MWh/SEK M 8.5 8.1
CO2 emissions, tons/SEK M 0.8 0.8
Water consumption, m3/SEK M 24.9 26.2Share of direct material purchasing spend from CSR assessed suppliers, % 66 60
1 According to the Board’s proposal.
net sales declined by 2% to SEK 303.6 billion (310.4).
Operating income amounted to SEK 17.6 billion (26.9).
Operating margin decreased to 5.8% (8.7).
net debt in the Industrial Operations of 29.3% of shareholders’ equity.
Proposed dividend of SEK 3.00 per share (3.00).
Net sales, SEK bn
1211100908304310265218304
Operating income, SEK bn
100808
09(17.0)
18.015,915.912
17.611
26.9
New strategy put in place.
Volvo Aero divested.
Extensive product renewal under way.
new Volvo FH launched.
In early 2013, an agreement to acquire 45% of Dongfeng Commercial Vehicles in China was signed.
1

A GLOBAL GROuP 2012
When I look back at 2012, I see a year when the Volvo Group experienced major changes. In rapid sequence, we implemented a major organizational change, we started work toward new strategic objectives, we sold Volvo Aero and we launched a very important product with the new Volvo FH truck. At the same time, it was a year when we faced some tough challenges.
Ceo CommenT
A year of major changes
Financially strong
The year started out strong, with increasing
sales and improved profitability during the first
half, but during the second half we were
impacted by the decline in the global economy.
During the autumn, demand fell in nearly all of
our markets. From a full-year perspective, the
truck markets in north America and Japan grew,
Europe was slightly lower than in 2011 and Bra-
zil saw a big decline.
For the Volvo Group, net sales in 2012
dropped to SEK 303.6 billion, compared with
SEK 310.4 billion in 2011. Operating income
amounted to SEK 17.6 billion (26.9) and the
operating margin was 5.8% (8.7). A part of the
explanation for the lower earnings is the meas-
ures we implemented in the Group to cope with
the declining demand. We cut production but
were not able to lower our costs at the speed of
the drop in demand. At the same time, we
worked hard to reduce inventories. This
impacted Group earnings in the short-term, but
enabled us to get inventories in balance by year-
end. We also took restructuring charges for a
number of important activities aimed at increas-
ing long-term efficiency and profitability. none-
theless, sales above SEK 300 billion and an
operating margin close to 6% in relatively weak
market conditions are proof of our products and
services being appreciated by customers and
also of the dedicated work of the Group’s
employees.
From a financial viewpoint we remain strong,
with a net debt to equity ratio of 29% in the
Industrial Operations, and for 2012 the Board of
Directors proposes an ordinary dividend of SEK
3.00 per share. This is on the same level as last
year and it would mean that the Volvo Group
would distribute SEK 6.1 billion to its owners.
Intensive phase of product renewal
Overall, we maintained our market positions in
most truck markets around the world, and Volvo
CE strengthened its position as number one in
China – the world’s largest market for construc-
tion equipment. Volvo Buses made inroads into
new customer segments thanks to hybrid buses
at the forefront of the bus industry and Volvo
Penta has a modern and competitive product
range. But we do not stop there. To secure com-
petitive future products for all our businesses,
we are in a very intense phase of renewing and
broadening the product portfolios.
In addition to the new Volvo FH, we are devel-
oping a completely new range for Renault
Trucks which will be launched in 2013, a new
series of trucks for the lower price segments in
emerging markets and a new medium-duty
engine range. We are also in the latter stages of
development of engines for the Euro 6 emission
legislation for trucks and buses and Tier 4f for
construction equipment and Volvo Penta. All of
these products will strengthen our position as a
front-runner in our industries and contribute to
taking us closer to our vision to be the world
leader in sustainable transport solutions.
Full focus on strategy
2012 was the year when we laid a new foundation
for the Group, and 2013 is the year when we are
to start executing on our strategic objectives for
2015, which are clearly aimed at improving the
Group’s overall profitability. We have full focus on
our strategy, and road maps have been developed
for each of the 20 strategic objectives. The road
maps have been further detailed and broken
down into over 400 main activities that will be
executed in order to improve profitability. Our
strategy is described in detail in this report.
The high activity level has been evident at the
start of the 2013. The newly signed agreement
with Dongfeng, which is pending approval by
authorities, is a key event in the history of the Volvo
Group. It will take us into the important Chinese
truck market and when the transaction has been
finalized the Volvo Group will become the world’s
largest manufacturer of heavy-duty trucks.
I would also like to extend my gratitude to all
employees in the Group for all their efforts dur-
ing 2012. In 2013 we continue with full speed
ahead. We have an intense and exciting period
ahead of us, and I am convinced that the Volvo
Group will stand even stronger in the market
when the economy turns upwards again.
Olof Persson
President and CEO
Foundation in place
Revised Group vision
New financial targets
New incentive program aligned with financial targets
New strategic objectives
New organization
New management teams
New process-oriented workflow
New corporate governance
New brand positioning
2

“ To secure competitive future products for all our businesses, we are in a very intense phase of renewing and broadening the product portfolios.”
3

examples of our soluTions
Efficient transport with BRT systemsBus Rapid Transit (BRT) is a public transport system with dedicated bus lanes, high service frequency and simplicity of boarding and alighting. It is fast, comfort-able, safe and reliable. Furthermore, the investment cost is lower than alternatives such as public transport by rail and subway and the environmental impact is decreased when compared with individual travel by car. The concept was developed in the Brazilian city of Curitiba and many cities worldwide view BRT as a prom-ising solution for public transport. Volvo Buses is a world- leading supplier of buses to modern BRT systems such as in Mexico City in the photo.
Fuel efficiency and new drivelinesThe Volvo Group constantly strives to reduce the nega-tive impact that our products have on the environ-ment. This naturally entails increasing fuel efficiency. The Volvo Group estimates the fuel-saving potential for a standard truck will be 15% in 2020 compared with fuel consumption in 2005. We are also investing considerable resources in the development of alter-native drivelines, for example hybrid solutions and drivelines optimized for renewable fuels, such as Methane Diesel and DME (dimethyl ether).
1
In 2050, the world’s population is expected to
exceed nine billion. Since 2008, more than half
the world’s population live in cities and in fifty years
that figure is expected to reach two-thirds. This
trend leads to an increased need for transporta-
tion and better infrastructure. Large quantities of
goods, products and people are transported daily
within as well as to and from cities. Cities, particu-
larly major cities, have particular requirements for
city and traffic planning. Furthermore, traffic jams
as well as pollution and noise need to be
addressed, for instance by vehicles which are
specially adapted for urban environments.
demographic changes and urbanization
Climate change comprises one of the most com-
plex and difficult questions of our time, and the
burning of fossil fuels such as oil is the single larg-
est source of greenhouse-gas emissions. This
means that increased fuel efficiency is of utmost
importance, and it has also increased the interest
in alternative, renewable-energy sources. The
development of alternative fuels and electromobil-
ity differs widely in different regions depending on
the natural resources available, which in turn drives
the development of vehicles adapted for various
types of energy sources. The move towards large-
scale use of renewable energy is also dependent
on political decisions and investment capacity to
create the necessary infrastructure.
Climate change and alternative fuels
2
The world is rapidly changing and it is crucial to keep up with the pace. Today, it is more important than ever to understand the operating environment, how it impacts the Volvo Group and, first and foremost, to act on these changes to meet future transport needs. Here some of the more significant challenges and the actions being under-taken by the Volvo Group to meet these challenges and turn them into business opportunities are defined.
A GLOBAL GROuP 2012 operaTinG ConTexT
fuTure TransporT needs
Challenges create opportunities
4

Recyclable productsThe Volvo Group’s products are largely recyclable, since by weight they consist of almost 85% metal, mostly iron, steel and aluminum. The additional materials are mainly plastic, rubber and material from electronics compo-nents. There are disassembly stations where trucks, buses and construction machines can be disassembled for re-use of some product parts and recycling of others. The photo shows remanufacturing within Volvo Con-struction Equipment Reman.
Smart vehicles90% of all traffic accidents arise from the human fac-tor. Smart vehicles with active safety systems that communicate with other vehicles and the surrounding infrastructure enable the driver to be liberated from monotonous tasks and instead create the possibility for the driver to focus his or her attention where it is really needed. With advanced technology for detec-tion, electronic surveillance of transportation and electronic document management, drivers, vehicles and cargo can be better protected against crime.
An attractive employerThe Volvo Group’s success hinges on having moti-vated and engaged employees, who are willing to take an active part in the Group’s development and future. Therefore, The Group invests in the develop-ment, health and wellbeing of its employees. The Volvo Group also strives for a company culture in which employees are encouraged to develop and seek out new challenges in their careers.
Building the future ...
Population growth, a rapidly growing middle class
and increased purchasing power leads to larger
numbers of people increasing their consumption.
Mankind is utilizing an increasing amount of land,
water and other resources. More efficient use of
resources is required and the recovery of a greater
proportion of material is becoming increasingly
important to secure future access to material.
shortage of natural resources and raw material
Traffic and road safety is becoming increasingly
important as demands on transportation increases.
The subject is a high priority for governments and
institutions the world over. In the future, the focus on
safety in a broader sense will continue to increase.
This will impact the security of drivers, vehicles and
goods.
safety and security
For many years, interest has waned for education
and careers in the fields of mathematics, natural
sciences and engineering in some developed
countries while interest has grown in some
emerging markets. The need, however, for com-
petent employees with these types of specialist
skills will increase as the products and services
are becoming increasingly sophisticated.
Competent labor
3 4 5
5

Closely linked to the GDP development
The Volvo Group is one part of the transport indus-
try that connects production with consumption.
We are what you might call the life blood. Demand
for transport capacity and thus for many of
the Group’s products is closely linked to the
GDP trend.
The extent of investment in infrastructure,
which drives demand for building and construc-
tion equipment, is also closely linked to the GDP
trend. Increased global wealth means that there
is a long-term need to build roads, airports, rail-
ways, factories, offices, shopping centers, as
well as housing and recreational facilities. In the
short term, demand is affected by a number of
factors including fuel prices, the implementation
of new emission regulations, interest rates, etc.
The registration of new trucks on a particular
market often follows the same pattern as eco-
nomic growth in the region.
– The transport industry is largely in tune with
the overall economic development, but demand
for our products is also governed very largely by
expectations about the future, says Johan Adler,
Head of Economic Research in the Volvo Group.
This is one of the explanations why many
north American haulage companies chose to
postpone their investment decisions in the
autumn of 2012. Even if there was business to
be done and goods to transport, with both the
presidential election and federal budget negoti-
ations around the corner, customers decided it
was better to be safe than sorry and therefore
postponed their purchases.
Markets move at different paces
The transportation industry is directly linked to
economic developments, but the global econo-
mies do not move at the same pace. Countries that
are heavily dependent on exports, such as
Sweden and Germany, are more affected when
consumers in other countries tighten their belts.
Countries like the uSA and Brazil are also
impacted by a slowdown, but to a lesser degree, as
they have such large domestic markets and a rela-
tively small part of what they produce is exported.
− The fact that the Volvo Group is global is
an enormous advantage. If we had not been
established on the growth markets, we wouldn’t
have been in the position we currently enjoy,
says Johan Adler.
Another kind of event that impacts the whole
Economic growth in the U.S., Europe and BrazilAnnual GDP-growth, %
Source: Consensus Economics
EUBrazil
11
1.62.7
1.8
12
(0.3)1.0
2.2 USA
10
1.97.5
3.0
09
(4.1)(0.3)
(3.5)
08
0.65.2
(0.3)
0
Economic growth in AsiaAnnual GDP-growth, %
Asia/Pacific*
India
Japan
* China, Hong Kong, South Korea, Taiwan, Indonesia, Malaysia, Singapore, Thailand, Phillippines, Vietnam, Australia, New Zealand, India, Japan, Sri Lanka
Source: Consensus Economics
11
4.66.5
1.9
9.312
4.75.37.8 China
10
7.18.5
(0.5)
10.409
1.98.0
4.5
9.208
3.86.8
(5.5)
9.6
0
(1.1)
First up and then down again. The transportation industry is cyclical with swings up and down in the short term. Then add emission standards, political decisions and expectations about the future, all of which impact customers’ decisions to purchase now or wait until later. However, in the longer term, the industry’s growth is closely linked to an increasing need for transports as economies grow.
long-term growth
of the commercial vehicle industry is the intro-
duction of new emission legislation. new stand-
ards have traditionally resulted in more expen-
sive, more technically complex trucks. This has
generated an advance purchasing effect, a
prebuy, as haulage companies have taken the
opportunity to update their fleets just before the
new regulations come into force. At the same
time, new regulations have positive effects on
the environment.
Growth rates in different parts of the world
According to Consensus Economics, global GDP
grew by 2.5% during 2012 compared with 3.1% in
2011. GDP in the Eu declined by 0.3% following
and increase by 1.6% in 2011. uS GDP increased
by 2.2% (1.8%). Japan’s GDP expanded by 1.9%
following a decline of 0.5% in 2011. Growth in
countries such as Brazil, India and China hit cycli-
cal lows during 2012. For 2013, global GDP is
expected to grow by 2.6%. The emerging markets
in primarily Asia and Latin America are foreseen
to be the prime drivers of global growth.
(6)(5)(4)(3)(2)(1)
0123456
% %Euro Area GDP and heavy-duty trucks registration growth
(60)(50)(40)(30)(20)(10)
0102030405060
1210 1106 07 08 090504
GDP growth (left axis)New heavy-duty trucks registration growth (right axis)
The Volvo business moves in close tandem with macroeconomic development
A GLOBAL GROuP 2012 operaTinG ConTexT FuTuRE TRAnSPORT nEEDS
6
The Volvo Group is one of the world’s largest
manufacturers of commercial vehicles and a
leader in terms of developing sustainable
transport solutions of the future. In 2012, the
Volvo Group invested almost SEK 15 billion in
research and development.
Research and development has always been
the most secretive aspect of a company. This is
natural, since it involves launching new solutions
ahead of competitors. nevertheless, the Volvo
Group has decided to display some of the com-
pany’s work for the future on its new website
Tech World.
− Times are different
and being open about
where we are heading is
now beneficial for us, our
customers and society,
says Torbjörn Holmström,
Executive Vice President
Group Trucks Technology
and Chief Technology
Officer of the Volvo Group.
We will have the greatest
opportunity to address
current challenges and
those of the future through
cooperation.
Another key aim of the
website is to show existing
and future engineers the
width of the subject areas
that are encompassed by the Volvo Group.
Tech World features a large number of exam-
ples of future projects: automatic construction
equipment, vehicle fuel from forest raw material,
vehicles that communicate with each other,
electricity generation from surplus engine heat,
boat simulators and much more. The Volvo
Group’s engineers share their expertise and
also present some of the challenges that
remain to be overcome.
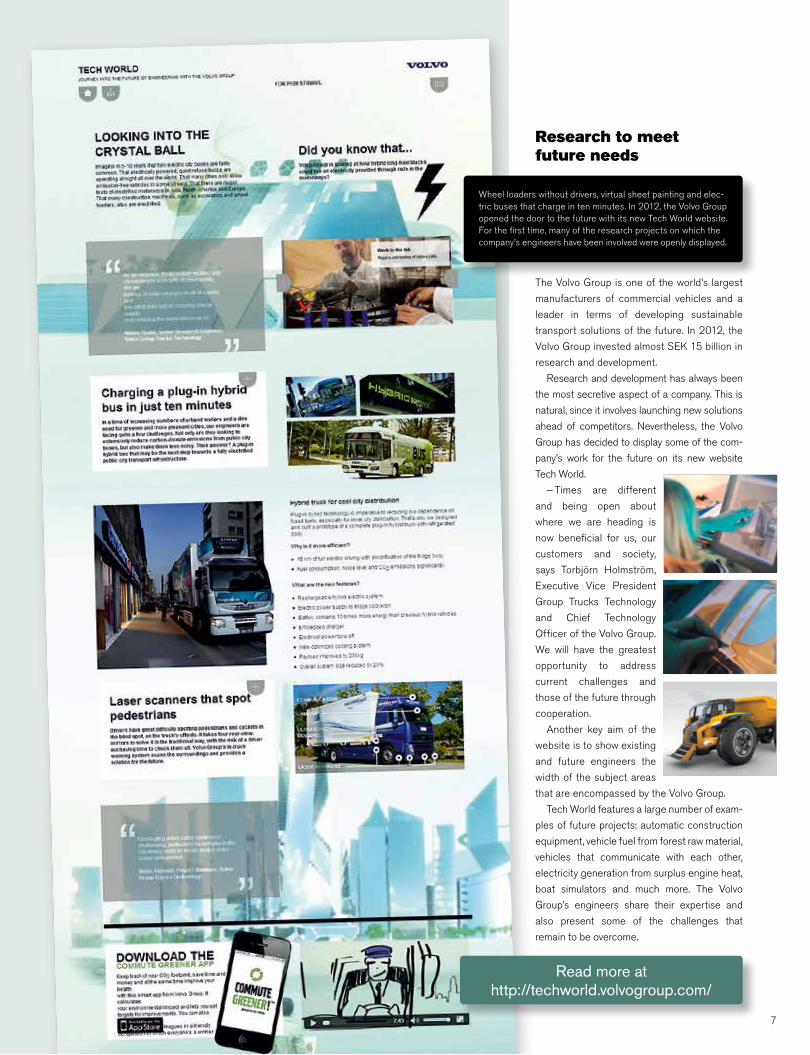
research to meet future needs
Read more at http://techworld.volvogroup.com/
Wheel loaders without drivers, virtual sheet painting and elec-tric buses that charge in ten minutes. In 2012, the Volvo Group opened the door to the future with its new Tech World website. For the first time, many of the research projects on which the company’s engineers have been involved were openly displayed.
7

sTraTeGiC approaCh
The road we are takingThe Volvo Group’s long-term plans stake out the road to success – to our vision, our target, as well as our wanted position. Our core values, focus areas, strategic objectives, road maps toward targets and activity plans will help us to achieve this as efficiently as possible.
During 2012, we adapted the Volvo Group’s gov-
ernance to becoming more efficient and
launched a new strategy to achieve the Volvo
Group’s targets, wanted position and ultimately,
our vision.
All work within the Volvo Group is based on a
long-term sustainable perspective, since we are
convinced that corporate social responsibility will
contribute to long-term success. Assuming
responsibility is deeply rooted in our culture and
has its base in our core values and policies in the
Group’s Code of Conduct. We strive to assume
economic, environmental and social responsibility
for the operation, products and services in the
areas where the Group has the potential to exert
influence.
This will enable us to strengthen our brands and
relations with business partners and thus create
new business opportunities that offer long-term
growth and improved profitability.
Changed prerequisites
The global presence of the Volvo Group has
undergone a dramatic change in the past decade.
The Group has grown considerably in emerging
markets and has welcomed new employees and
companies. As a consequence of this, the Group
currently has operations in approximately 190
markets and employs about 115,000 individuals,
who strive to create efficient and sustainable
transport solutions for our customers.
Adaptation of governance
In the past year, we made extensive efforts to
adapt the Volvo Group to the conditions and
expectations of the business world and the future
– and to achieve our wanted position by 2020.
The efforts resulted in us taking a step toward
governance as one Group with coordinated long-
term plans for the business areas. The pace has
increased with respect to governance and recon-
ciliations connected to the development of the
business areas. We have established a distinct
brand portfolio and have moved from a regional
focus with individual brands to a globally coordi-
nated approach. In addition, we have created a
more distinct distribution of responsibility with
measurable targets. It is necessary to have all of
this in place prior to the commencement of work
based on the new strategies.
Strategy process to achieve the wanted
position and vision
During 2012, a new strategy process was
launched, which has resulted in three-year strat-
egies for the individual business areas of the
Volvo Group. The process resulted in five to nine
focus areas, which are particularly significant for
the future development, and approximately 20
strategic objectives per business area. The stra-
tegic objectives have been divided into more
than 100 road maps and a large number of
activity plans.
Our structure for governance encourages
close monitoring, as well as rapid and efficient
decisions and early adjustments, when necessary.
The system also aims to involve all employees,
by clarifying how each individual is important to
achieving the targets.
Strategies 2013–2015
Wanted position 2020
Our vision: World leader in
sustainable transport solutions
2012
The right product or service in order
to contribute to high productivity in the transport system
Safe and secure transport solutions
Energy efficient transport solutions
with very low emissions of CO2, PM, NOx
and noise
Sustainable Transport SolutionsSustainable transport solutions to the Volvo Group are solutions that “improve the short and long term economic and environmental performance meanwhile social impact is considered".
A GLOBAL GROuP 2012 STRATEGy
The Global CompactIn 2001, the Volvo Group signed Global Compact, un's initiative on socially responsible business prac-tices. The Volvo Group's principles for responsible business are based on Global Compact among other.
8

All work in the Volvo Group is based on our vision, our values and the wanted position. Based on this core, outer rings are created in the form of objectives and focus areas all the way to tangible activities with clearly defined responsible parties. This will lead to responsible governance, based on a long-term sustainability perspective.
The following pages describe our strategic work, from the
vision to the focus areas and strategic objectives. The new
strategy, which was announced in autumn 2012, applies for the
2013 – 2015 period.
9

Our valuesThe Volvo Group views its corporate culture as a unique asset, since it is difficult for competi-tors to copy. By applying and strengthening the expertise and culture we have built up over the years, we can achieve our vision.
Quality, safety and environmental care are the values that form the Volvo Group’s common base and are important components of our corporate culture. The core values have a long tradition and permeate our organization, our products and our way of working. They are an important part of corporate social responsibility, and our goal is to maintain a leading position in these areas.
Our visionThe Volvo Group's vision is to become the world leader in sustainable transport solutions by: • creating value for customers in
selected segments • pioneering products and services for
the transport and infrastructure industries • driving quality, safety and environmental care • working with energy, passion and respect
for the individual.
A GLOBAL GROuP 2012 STRATEGy STRATEGIC APPROACH
Volvo Group Wanted position 2020• We are among the most profitable
in our industry.• We are our customers’ closest
business partners.• We have captured profitable
growth opportunities.• We are proven innovators of energy-efficient
transport and infrastructure solutions.• We are a global team of high
performing people.
QualityQuality is an expression of our goal to offer reli-able products and services. In all aspects of our operations, from product development and pro-duction to delivery and customer support, the focus shall be on customers’ needs and expect-ations. Our goal is to meet or exceed their expect-ations. With a customer focus based on every-one’s commitment and participation, our aim is to be number one in customer satisfaction. This is based on a culture in which all employees are responsive and aware of what must be accom-plished to be the best business partner.
SafetySafety pertains to how our products are used in society. We have had a leading position in issues regarding safety for a long time; our goal is to main-tain this position. A focus on safety is an integral part of our product development work. Our employees are highly aware of safety issues, and the know-ledge gained from our internal crash investigations is applied in product development. Our goal is to reduce the risk of accidents and mitigate the con-sequences of any accidents that may occur as well as to improve the personal safety and the work environment of the drivers of our vehicles and equipment. Our long-term vision is zero accidents.
Environmental careWe believe that it is self-evident that our products and our operations shall have the lowest possible adverse impact on the environment. We are work-ing to further improve energy efficiency and to reduce emissions in all aspects of our business, with particular focus on the use of our products. Our goal is for the Volvo Group to be ranked as a leader in environmental care within our industry. To achieve this goal, we strive for a holistic view, continuous improvement, technical development and efficient resource utilization.
The Volvo Group is part of the global society as well as many local societies. This provides us with the
opportunity and ability to influence and contribute to social and business development. We strive to act
responsibly, take into account the opinions of various stakeholders and create value for our shareholders
and society. The overall objective is to become the world leader in sustainable transport solutions.
Vision, Core values and wanted position
10

Financial targets from 2012
IndustrIal OperatIOns
7.311
12.512
12.608
(10)
0
(6.2)09
0.410
15105
(5)
Target: 12−15%
Return on shareholders' equity, %
CustOmer FInanCe OperatIOns
Target and outcomeThe target for Customer Finance is a return on shareholders’ equity of 12–15% and an equity ratio above 8%. The return on shareholders' equity for 2012 amounted to 12.5%. At year end 2012 the equity ratio was 8.1%.
Target Comparison group Preliminary outcome*
The annual organic sales growth for the truck and bus operations shall be equal to or exceed a weighted-average for comparable competitors.
Each year, the operating margin for the truck and bus operations shall be ranked among the top two companies when benchmarked against relevant competitors.
Daimler, Iveco, MAN, Navistar, Paccar, Scania and Sinotruk.*
* Navistar's figures are based on rolling four quarters as of the third quarter of 2012 and Sinotruk's figures are based on rolling four quarters as of the second quarter of 2012.
The organic sales decreased by 3.2% for the Volvo Group's truck and bus operations and was below the weighted average of –1.0% for the competitors.
The operating margin of 4.3% for the Volvo Group's truck and bus operations was ranked number four in comparison with the competitors.
Construction Equipment and Volvo Penta
Target Comparison group Preliminary outcome
The annual organic sales growth for the con-struction equipment operations and Volvo Penta, shall be equal to or exceed a weighted-average for comparable competitors.
Each year, the operating margin for the con-struction equipment operations and Volvo Penta, shall be ranked among the top two companies when benchmarked against relevant competitors.
Brunswick, Caterpillar, CNH, Cummins, Deere, Hitachi, Komatsu and Terex.
The organic sales decreased by 2.9% for the Volvo Group's construction equipment opera-tions and Volvo Penta and was below the weighted average of 2.3% for the competitors.
The operating margin of 8.3% for the Volvo Group's construction equipment operations and Volvo Penta was ranked number five in comparison with the competitors.
Trucks and Buses
25.211
29.312
39.708
0−(((20)
(40)
70.909
37.410
4020
8060
Net
cas
hN
et d
ebt
Target: below 40%
Net financial debt as a percentage of shareholders' equity, %
Target and outcomeThe financial net debt, including provisions for post-employment benefits, for the Industrial Oper-ations shall be a maximum of 40% of sharehold-ers’ equity under normal conditions. At the end of 2012, the financial net debt amounted to 29.3% of shareholders' equity.
As of January 1, 2013, new accounting rules for employee benefits was effective. As a conse-quence, AB Volvo’s Board of Directors has decided to exclude pension obligations from the
Industrial Operations
target. According to the new target, the Industrial Operations’ net financial debt, excluding pension obli-gations, shall be a maximum of 35% of shareholders' equity under normal conditions. The new target of 35% corresponds to the previous financial target of 40% in which pension obligations were included.
Starting in 2012 new financial targets for the Volvo Group were implemented. The new targets have been set in order to enable the growth and profitability of the various operations to be measured and benchmarked annually against competitors. This creates a clear pic-ture of how the operations are developing compared to the industry. Information on how the comparison with competitors is made is avail-able under the heading Investors on www.volvogroup.com.
11

drive organic revenue growth
improve profitability
The strategy for 2013–2015 will ultimately lead to higher organic growth, while profitability will improve as we improve cost-efficiency and apply effective pricing and optimized positioning of our brands and products.
Targets to secure improved Group profitability
The targets for the coming strategy period, 2013 – 2015, was announced in autumn 2012. The overall
target is to increase the operating margin by 3 percentage points for the Group as a whole. The truck
operation has the greatest impact on profitability. The calculation below is based on Group sales of
SEK 300 billion and truck sales of SEK 200 billion. To safeguard against unexpected events, 2 percent-
age points in the form of “headwind factor” have been deducted.
percentage points+3
expected impact onstrategic objectives Group operating margin Trucks’ impact + app. 4.0 percentage pointson Group
Business areas: + app. 0.5 percentage pointsVolvo Ce, Buses, Volvo penta, Governmental sales,financial services
iT cost at 2% + app. 0.5 percentage pointsof total Group costs
= app. 5.0 percentage points headwind factor
Targeted net improvement = app. 3 percentage points
A GLOBAL GROuP 2012 STRATEGy STRATEGIC APPROACH
12

drive organic revenue growth
improve profitability
Truck operations' focus areas and strategic objectives
After 15 years of active acquisition strategy and streamlining to commercial vehicles, the Volvo Group is now entering a
new phase, with a focus on driving organic growth and improving profitability. In the strategy for 2013 – 2015, we have
identified five focus areas that have particularly high impact on the truck operation, for which there are 20
strategic objectives. Each objective is clearly restricted and measurable and is connected to both financial and operational
key figures. In addition, there is a clearly defined responsible party for each individual strategic objective.
1.1 Increase vehicle gross profit margin per region by 3 percentage points To increase the vehicle gross profit margin we must sell our products at the optimal price level and offer the right product mix in various markets. It also requires that we understand our customers – and their customers – and that we continuously improve the sales process.
1.2 Reduce actual standard cost of sales on total cost for current offer by 10% Reducing the actual standard cost of sales will improve the bottom line, lower the break-even point and enable profitable growth. The main components of standard cost of sales include the material cost, manufacturing cost, logistics cost, warranty and technical goodwill.
1.3 Decrease wholesale selling expenses to 5% of sales To reduce selling expenses we must align our whole-sale organizations – from region to end customers – to drive productivity and efficiency. Sharing best practice and fine-tuning our processes will play an important role.
1.4 Increase own dealer soft offer absorption rate by 10 percentage points A healthy aftermarket business with a total offer approach will reduce the vulnerability of our dealers to the cyclical demand for new trucks. A first-rate dealer network is also an important driver of cus-tomer loyalty and a way for us to become a real solutions provider. We need an appropriate number of workshops in the right locations, with the right tools, methods, and personnel skills, working according to the Genuine Service Process.
1.5 Reduce R&D cost (spending pace) to 11.5 BSEK A flexible, scalable research and development structure is key to increasing R&D efficiency. This will help us to more effectively manage multiple demands in various markets. An opti-mized project portfolio is another key factor.
1.6 IT cost on 2% of Volvo Group total cost by 2015 This strategic objective is to optimize the busi-ness value from IT over time. The use of global processes enables the deployment of a larger proportion of common applications and the phasing out of redundant applications. One goal is to improve the balance between running and development cost. It is crucial that we keep a tight rein on IT costs even in an upturn when margins are better.
Among the activities to increase the gross margin are the coordination of the brand and product positioning (Read more on page 22), the launch of a new truck series for the lower price segments in emerging markets (Page 48) and the phase-out of unprofitable products and markets (Read more about uD Trucks in north America on page 42).
Focus area 1: Secure number 1 or 2 in profitabilityWe operate in a capital-intensive industry. Significant investments
are necessary to simply comply with new regu-lations. Furthermore, a strong financial position affords us the opportunity to act, and to fund innovation and development, and our own expansion. To achieve this, we must excel in turning “volumes into profit” and capture the potential for efficiency that is associated with being a truly global player.
1
13

driva organisk tillväxt
förbättra lönsamheten
2.1 We will achieve 99% product availability contributing to “strengthen customer business partnership” The first strategic objective within this area is to achieve up to 99% product availability, since uptime is a decisive factor for our customers. Reaching this level will require improved product quality, measures to avoid unplanned stops, rapid truck repair, and opti-mized preventive maintenance to reduce downtime.
2.2 Drive retail excellence by implementation of an integrated customer interface tool We must strengthen the way our processes and tools support our personnel at all customer touch points, providing them with an overview of the total business relationship with a particular customer. This will improve our ability to offer our customers the right products and services. Examples of areas to address include the retail process, system architecture, infor-mation management and information sharing.
2.3 Each brand to rank number 1 on decided brand attributes in competitive set The Volvo Group’s portfolio of brands as a whole can capture a larger share of the total trucks market if we utilize the full potential of each of our brands. Working with customer segmentation and distinct brand attributes will be decisive in terms of how we position each brand in the market to enable the best opportunities for growth.
The Group's strong brand are important assets. By selling products under different brands, the Group can address many different customer and market segments in mature as well as growth markets. Read more on page 22. More information on the Volvo Groups' service offering is available on page 28.
drive organic revenue growth
improve profitability
Focus area 2: Strengthen customer business partnershipSuccess is based on being the
best at solving our customers’ problems and strengthening their operational performance. This is a key factor in building customer loyalty and becoming our customers’ preferred busi-ness partner.
2
A GLOBAL GROuP 2012 STRATEGy STRATEGIC APPROACH
14

3.2 Establish required commercial presence to support revenue growth by 50% in APAC (Asia Pacific) and 25% in Africa new markets are emerging and we must lie ahead of the projected growth curve. This requires that we cover strategic locations, understand the specifics of selected emerging markets, and adapt our busi-ness models accordingly.
3.3 Establish required Order to Delivery footprint and supply chain in APAC and Africa achieving lead time reduction by 15% and capital tied up reduction by 15% This relates to further developing what has already been built up and set in motion in the Asia Pacific region, and gearing up in Africa to match our com-mercial ambitions for that continent. Reaching this target will require action in such areas as sourcing strategies and supplier performance, as well as industrial and logistical structure.
3.4 Increase aftermarket sales per unit in operation by 12%, including total commercial solution offer for second and third owner This objective aims to increase our share of the aftermarket business, covering the first, second and third owner of the trucks. We will achieve this by providing a competitive offering for parts and services wherever the location of the vehicles. Our offering should encompass all of our customers’ needs.
3.5 Build 1 billion SEK new businesses complementary to existing offering We recognize the potential for new business, and for expanding our current offering, in such areas such as vehicle productivity. Other examples include revenue streams from the truck end-of-life phase and from services facilitated by connected vehicles.
In addition to South America and Eastern Europe, Asia and Africa are important growth markets for the Volvo Group. Read more about the Volvo Group's development in Africa on page 52.
3.1 By optimizing the brand assets become number 1 or 2 in combined Group Trucks HD market share Our brand portfolio represents a unique strength. It is our goal to become number 1 or 2 in combined Group Trucks market share for heavy duty trucks in mature markets. In a number of markets we can optimize the manner in which we use our brand portfolio, also addressing new customer segments. Other measures include ensuring the right product quality and the appropriate coverage in sales and service networks.
Focus area 3: Capture profitable growth opportunities We want to retain and strengthen
our position as a profitable and global player in the truck industry. This is crucial given that high volumes help us achieve economies of scale and maintain our priority position among sup-pliers and retailers. Organic sales growth should be on par with or surpass the weighted average for our competitors.
3
15

4.1 Fuel efficiency to be improved by 2% per annum through vehicle optimization, diesel efficiency and electromobilityWe aim to remain the leader in fuel economy. To reach our annual goal of 2%, we need to pursue fuel-efficiency improvements and optimization of Group Trucks vehicles and the existing diesel engine platform. We must also continue to develop hybrid solutions and alternative drivelines.
The Volvo Group's product development is affected by the cost and supply of fuel as well as environmental legislation. The Group's research and development is therefore focus-ing on energy-efficient drivelines, hybrid drivelines and on vehicles that can be run on renewable fuels. Read more on page 26.
4.2 Commercialize alternative fuel technology by launching concepts or products in all regionsComing up with groundbreaking innovations is not enough. We must turn them into commercially via-ble products and bring them to market. To succeed in this respect, we must work in close partnership with customers and providers of infrastructure and alternative fuels.
drive organic revenue growth
improve profitability
Focus area 4: Innovate energy-efficient transport and infrastructure solutionsEnvironmental concerns, political
demands, megacities and fuel prices are driving regulation and green technology. We must be able to anticipate and act on changing market demands and shifts in technology, and have the capacity to rapidly bring new solutions to market.
4
A GLOBAL GROuP 2012 STRATEGy STRATEGIC APPROACH
16

The Volvo Group's vision is to become the world leader in sustainable transport solu-tions. A deciding factor in fulfilling this vision is our employees and their knowledge and commitment. Read more on page 30.
5.1 Become an attractive employer measured by reaching the employee engagement level (EEI) of high performing companies We want to have committed employees with a level of engagement that is on par with high per-forming companies, defined as the top 25 percent. This will enable us to deliver on our business objectives and make us an attractive employer. Furthermore, our workplaces should have an open and inclusive culture, providing a healthy and inspiring work environment.
5.2 Drive high performance measured by reaching performance excellence level (PEI) of high performing companies This objective aims to drive continuous improve-ments and high performance. Each individual needs clear personal objectives that are aligned with the strategic objectives of Group Trucks. Man-agers must provide clear feedback to employees and reward and recognize performance.
5.3 Secure leadership and strategic competencies, primary focus is the implementation of Volvo Group University By establishing a Volvo Group university, we will gather training and development activities in a shared, efficient organization. Other aspects of this objective include enhancing knowledge transfer and mobility in the Group, carrying out talent reviews on all levels and improving our ability to plan and secure our future competency requirements.
5.4 Build an efficient and inclusive organization by implementing common global level 1 and 2 processes Effectively utilizing process orientation and standardization will help us create a more effi-cient organization and provide us with a map that more clearly defines roles and responsibilities. By implementing shared global processes we will truly become one company, with a cohesive cul-ture based on the Volvo Way.
Focus area 5: Build high performing global teamsTo outperform competitors and achieve agreed objectives, we must
attract and retain people with the right compe-tencies across all of our businesses. Fully lever-aging the existing in-depth business expertise and adopting best practices throughout our global organization will set us apart from the competition.
5
17

Volvo Buses' focus areas
• number 1 in customer satisfaction.
• Profitable core market clusters.
• Soft product acceleration.
• Asia leverage.
• Profitable product portfolio.
• Manufacturing efficiency.
• Research and development efficiency.
• One company culture with high performing
people and organization.
The challenge for Volvo Buses is to obtain a sharp improve-
ment in profitability by 2015. One way of achieving this is to
expand in Asia.
− Growth in Asia is really significant and we already enjoy
a strong position there. We are now going to continue along the same lines,
says the acting president of Volvo Buses, Håkan Karlsson.
Volvo Buses has identified eight areas on which it is especially important
to focus during the next three-year period. They will all help to improve prof-
itability and make Volvo Buses one of the most profitable bus companies.
− This is our absolutely top priority. We are talking about an aggressive,
powerful increase and it’s essential that
all the employees are both aware of and
committed to it, says Håkan Karlsson.
Volvo Buses
Read more about Volvo Buses' new telematics system, which is currently being used in more than 20 countries, on page 60.
Volvo CE's focus areas
• Profitably grow SDLG business globally.
• Develop Volvo branded products for emerging markets.
• Significantly increase Customer Solutions revenues.
• Significantly increase dealer and supply chain capability.
• Increase share and profitability of Road products.
• Increase gross margin per machine.
• Increase product portfolio development (PPD) efficiency.
• Deploy CAST globally (Common Architecture,
Shared Technology).
• Develop, recognize and promote excellent leadership.
Business areas strategies
Growing and becoming more profitable are the main focus areas for Volvo CE, Volvo Buses, Volvo Penta and Volvo Financial Services for the next three-year period, 2013–2015. Developing on more markets is another common denominator. Here, the presidents of Volvo Buses, Volvo CE and Volvo Penta as well as Volvo Financial Services outline their respective strategies.
For Volvo CE, the next three years will focus on growth and
profitability and, according to company president, Pat Olney,
the potential for success is there for all to see.
− The important thing now is to make the whole organiza-
tion understand that we need to change the way we think. We are
transforming Volvo CE to meet the opportunity of the future, he says.
Growth, efficiency and leadership are Volvo CE’s three cornerstones in
the new strategy for 2013–2015. using these three guiding principles as
the starting point, Volvo CE has selected nine key focus areas.
They include allowing Volvo CE’s two brands, Volvo and SDLG (Shandong
Lingong) to develop and expand on
more markets than today – SDLG out-
side China and Volvo in India, China
and Brazil, for example.
Volvo CE
Read more about Volvo CE's wheel loader L105, developed specifically for the Chinese market, on page 48.
drive organic revenue growth
improve profitability
A GLOBAL GROuP 2012 STRATEGy STRATEGIC APPROACH
18

Volvo Financial Services’ focus areas
• Strengthen customer and dealer partnerships throughout
product lifecycle.
• Capture profitable growth opportunities.
• Drive operational excellence in support of efficient
customer solutions.
• Attract, develop and retain high-performing employees.
• Optimize shareholder return on equity.
Volvo Penta's focus areas
• Grow the Industrial Versatile Engine (VE) business.
• Grow the Marine Commercial business.
• Leverage on growth in emerging markets.
• Build a world-class supply system.
• Build a customer- and quality-focused company culture.
Profitability, integrated offerings for dealers and customers,
increased opportunities for profitable growth and leadership
development – these are Volvo Financial Services’ (VFS)
cornerstones in the new strategy for 2013–2015, according
to VFS President, Martin Weissburg.
Five key focus areas will guide VFS to higher and measurable levels of
performance as a key element of the Volvo Group’s success.
The direction outlined for VFS in the new strategy is more integrated
and aligned with Group Trucks and the other Business Area strategies
than ever before. As a result, VFS will play an increasingly important role
in the delivery of the Volvo Group’s total customer solution.
The strategy provides a path to operational excellence, so that VFS oper-
ates with more speed and increased productivity. It will also guide on how
to grow VFS’ offerings and market presence in the most profitable way.
Volvo Penta holds world-leading positions as an engine sup-
plier to leisure boats, but the largest potential for growth in
coming years is expected to be found within the company’s
other business segments. According to President Björn
Ingemanson this is because the leisure boat industry has not recuperated
after the severe crisis in 2009.
− Marine Leisure is still our core business, but we do not expect a quick
recovery in this market. If we are to increase our sales, growth must come
from Industrial and Marine Commercial, says Björn Ingemanson.
Within versatile industrial engines, i.e engines used in for example mining
vehicles, stone crushers, cranes and forklift trucks, Volvo Penta has more to
harvest on a growing market, according to Björn Ingemanson.
− Currently, we hold a small portion of this market, but our ambition is to
increase substantially, he says.
The other area with considerable potential for growth is the commercial
boat segment, which is not as sensitive to economic ups and downs as the
market for leisure boats. Volvo Penta’s objective is to double the business
in this area by 2015. Volvo Penta is also to prepare for new markets, mainly
in Asia but also in Africa and South America.
Volvo Financial ServicesVolvo Penta
19

Creating value for many stakeholders
Valu
e c
reat
ion
The Group is dependent on stakeholders to develop its competitiveness, in the same manner as its
stakeholders are dependent on the Group in many respects. Accordingly, the Volvo Group strives,
jointly with stakeholders, to create common values in a manner that is sustainable in the long-term.
The Volvo Group’s operation
comprises several activities
and products that create
value for our stakeholders.
Here are a few examples.
A GLOBAL GROuP 2012 Business model
Product development Purchasing Production
• The Volvo Group has approximately 36,000 subcontractors in the first tier, of which about 6,000 supply components for the Group’s products.
• In 2012, the Group made purchases of goods and services in an amount of SEK 211.5 billion.
• Corporate social responsibility is an integrated part of the purchasing process.
• One job within the Volvo Group generates a number of other job opportunities directly at subcontractors and indirectly in the rest of society.
• At yearend 2012, the Volvo Group had 98,717 employees and 16,548 temporary employees and consultants, of whom 48,152 employees and 7,548 temporary employees and consultants were blue collar.
• The Volvo Group has 61 factories in 18 countries around the world.
• In 2012, the Volvo Group delivered 224,000 trucks, 10,700 buses, 78,500 units of construction equipment, 17,200 marine engines and 17,600 industrial engines.
su
stain
ab
ility
pers
pect
ive The sustainability perspec-
tive is an integrated part of
the Group’s operation. Here
are a few examples of what
we do and the effects of
each step in the value chain.
We work to reduce the environmental impact of our products and on developing energy efficient solutions for our customers. Each new product must have less environ mental impact than the product it replaces. The Group works continuously to improve the performance of products and our longterm research and development focuses on sustainable transport solutions, with a focus on transport efficiency, lower fuel consumption and thus lower emissions, as well as on hybrid solutions and alternative fuels. This is profitable for the customer, good for the environment and a competitive advantage for the Volvo Group.
Responsible purchasing involves encouraging behavior, managing risks and building longterm relations with our suppliers to improve social, environmental and business ethical relations in the supply chain. The Volvo Group strives to ensure that unethical values are not incorporated into our products and services and bases the work on a minimum standard in its Code of Conduct. The Group believes that a high standard of corporate social responsibility will result in high productivity and stable longterm relations, which will benefit all parties.
Environmental work is governed by a common environmental policy. Another important tool is Volvo Production System, with methods for streamlining the operation and minimizing productivity losses and also tools for documenting workrelated risks, indicators for measuring health and safety and methods for ergonomic workplaces. At the end of 2012, 97% of employees in production worked in units that are certified according to environmental and quality management systems, primarily ISO 14001 and ISO 9001.
• Costs for research and development amounted to SEK 14.8 billion (13.3) for 2012, corresponding to 4.9% (4.4) of net sales.
• Product development is controlled by the needs of customers, legislation, changes in society and new technology.
• Safety and environmental issues are integrated in product development.
• Approximately 90% of the environmental impact from a truck occurs during use. Consequently, product development focuses on sustainable transport solutions.
20
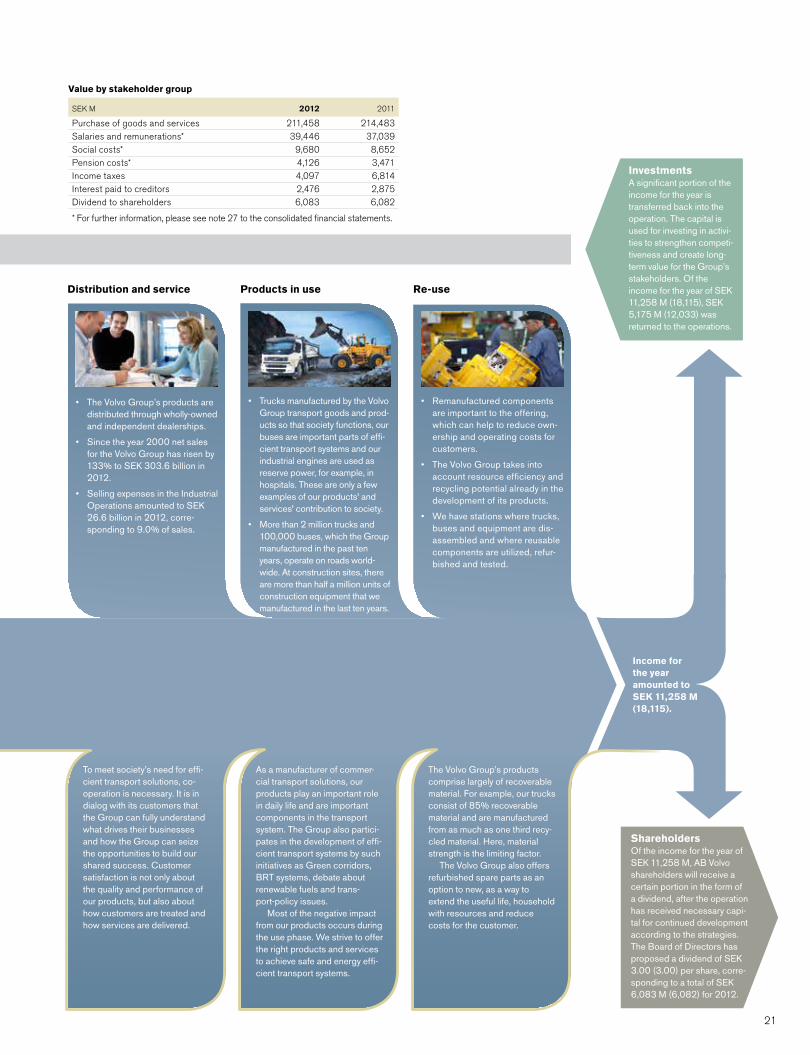
InvestmentsA significant portion of the income for the year is transferred back into the operation. The capital is used for investing in activities to strengthen competitiveness and create longterm value for the Group’s stakeholders. Of the income for the year of SEK 11,258 M (18,115), SEK 5,175 M (12,033) was returned to the operations.
Distribution and service Products in use Re-use
• The Volvo Group’s products are distributed through whollyowned and independent dealerships.
• Since the year 2000 net sales for the Volvo Group has risen by 133% to SEK 303.6 billion in 2012.
• Selling expenses in the Industrial Operations amounted to SEK 26.6 billion in 2012, corresponding to 9.0% of sales.
• Remanufactured components are important to the offering, which can help to reduce ownership and operating costs for customers.
• The Volvo Group takes into account resource efficiency and recycling potential already in the development of its products.
• We have stations where trucks, buses and equipment are disassembled and where reusable components are utilized, refurbished and tested.
ShareholdersOf the income for the year of SEK 11,258 M, AB Volvo shareholders will receive a certain portion in the form of a dividend, after the operation has received necessary capital for continued development according to the strategies. The Board of Directors has proposed a dividend of SEK 3.00 (3.00) per share, corresponding to a total of SEK 6,083 M (6,082) for 2012.
To meet society’s need for efficient transport solutions, co operation is necessary. It is in dialog with its customers that the Group can fully understand what drives their businesses and how the Group can seize the opportunities to build our shared success. Customer satisfaction is not only about the quality and performance of our products, but also about how customers are treated and how services are delivered.
As a manufacturer of commercial transport solutions, our products play an important role in daily life and are important components in the transport system. The Group also participates in the development of efficient transport systems by such initiatives as Green corridors, BRT systems, debate about renewable fuels and transportpolicy issues.
Most of the negative impact from our products occurs during the use phase. We strive to offer the right products and services to achieve safe and energy efficient transport systems.
The Volvo Group’s products comprise largely of recoverable material. For example, our trucks consist of 85% recoverable material and are manufactured from as much as one third recycled material. Here, material strength is the limiting factor.
The Volvo Group also offers refurbished spare parts as an option to new, as a way to extend the useful life, household with resources and reduce costs for the customer.
Value by stakeholder group
SEK M 2012 2011
Purchase of goods and services 211,458 214,483Salaries and remunerations* 39,446 37,039Social costs* 9,680 8,652Pension costs* 4,126 3,471Income taxes 4,097 6,814Interest paid to creditors 2,476 2,875Dividend to shareholders 6,083 6,082
* For further information, please see note 27 to the consolidated financial statements.
Income for the year amounted to SEK 11,258 M (18,115).
• Trucks manufactured by the Volvo Group transport goods and products so that society functions, our buses are important parts of efficient transport systems and our industrial engines are used as reserve power, for example, in hospitals. These are only a few examples of our products' and services' contribution to society.
• More than 2 million trucks and 100,000 buses, which the Group manufactured in the past ten years, operate on roads worldwide. At construction sites, there are more than half a million units of construction equipment that we manufactured in the last ten years.
21

A GLOBAL GROuP 2012 Business model
produCT offerinG
Strong brands are important assets
By selling products with different brands, the Volvo Group can penetrate many different customer and market segments in mature markets as well as growth markets.
olvo Group does business under sev-
eral leading and respected brands.
Each brand in the portfolio is focused
on different industry and market seg-
ments. Several brands are available globally, while
some are focused on specific regions of the world.
Brand positioning project aims to unlock
hidden potential
Increasing market coverage, sharing and better
utilizing resources, and increasing market share
– these are the aims of the new Brand Positioning
Project, which is a key part of the Volvo Group’s
growth strategy.
− The brands are at the centre of the Group
Trucks organization. By aligning the brands, we
are going to increase our market coverage and
be able to sell trucks to a broader customer base,
says Olof Persson, President and CEO of the
Volvo Group. Furthermore, we will be able to bet-
ter utilize the strategic assets we have built over
time – our customer relations, scale, industrial
footprint, distribution networks and supply chains.
In some countries, we may even be able to add
additional brands from our portfolio to an existing
network base, which will grow and strengthen the
business of our dealers.
Since taking the strategic decision to focus on
commercial vehicles, the Volvo Group has built a
strong portfolio of truck brands, including Renault
Trucks, Mack, uD Trucks, and of course Volvo, as
well as a joint venture with Eicher Motors in India.
Over the past decade, the Group has also invested
heavily in developing technology platforms, cus-
tomer relations, a global industrial footprint and
global distribution networks.
until recently each truck brand has been
operating relatively independently and often in
the same segments. By aligning brands so they
focus on different segments, while also sharing
resources and networks, the Volvo Group can
better leverage its assets in the brand portfolio.
− The brand positioning project is extremely
important because we’re taking the Volvo Group
into a completely new phase, says Peter Karlsten.
− We are going from a brand-by-brand strategy,
to having a full brand portfolio and taking a com-
pletely different approach to the markets.
Joint view on markets
The first step in the brand positioning project
was to define market segments, so that the
entire group views the market in the same man-
ner. Group Trucks has agreed on four key seg-
ments of the truck industry: basic, value, high-
end and premium.
− By combining the brands and networks we
open new opportunities, stresses Peter Karlsten.
− For example, currently most of our brands
are in the high-end or premium segments, while
there is an empty spot in the value segment –
this represents a great opportunity.
under the new plan Volvo and Mack will con-
tinue to service the high-end and premium seg-
ments. Outside of Japan, uD Trucks will focus
on the value segment, while uD Trucks in Japan
remains in the high-end segment. Renault
Trucks will concentrate on the high-end seg-
ment and will stretch into the value segment.
Eicher, which currently services the basic seg-
ment, will also stretch into the value segment.
With each truck brand being assigned a specific
segment and customer base, Group Trucks can
increase its market share, and contribute to the
overall growth of the Volvo Group. The brand posi-
tioning project has also provided valuable input
when the Group Trucks organization was design-
ing road maps to reach their strategic objectives.
− We now have a very clear view on where
we are going and how we can do things in a
more efficient way, says Olof Persson. This is a
new ap proach and it will open up fantastic
opportunities.
V
22

Volvo
The Volvo brand, which has been built up since 1928, enjoys a solid position world-wide. It is one of the world's best known and respected brands within trucks. It is asso-ciated with the Group's core values - quality, safety and environmental care.
Renault Trucks
Renault Trucks is one of the largest European manufactur-ers of commercial vehicles, with its origins in the Renault auto-mobile company that was founded in 1898, and in Berliet, founded in 1895. Renault Trucks are renowned for its innovative and caring approach to efficiency and economy.
UD Trucks
uD Trucks was established in 1935 and is one of the world's leading manufacturers of trucks and buses. uD Trucks markets light, medium and heavy-duty trucks, buses and bus chassis, engines and vehicle components.
Mack
For more than a century Mack has been one of the largest manufacturers of heavy-duty trucks in north America, and focused on commercial vehi-cles from the start. Today, Mack is one of the strongest heavy- duty truck brands in the north American market.
Eicher
Eicher is one of the largest players in the Indian commer-cial vehicle market and the obvious choice in the basic and value segments for customers with high demands on profita-bility, flexibility and driver effectiveness.
Volvo Penta
Volvo Penta is one of the strongest and most global brand names in the engine industry. In addition to quality, safety and environment, Volvo Penta is associated with innova-tive and performance-oriented products.
SDLG
SDLG is a leading brand in the Chinese construction machinery industry, especially for wheel loaders. The SDLG brand is sold primarily in China and other emerging markets.
Volvo
The Volvo brand, which has been built up over decades, enjoys a solid position world-wide. It is one of the world's best known and respected brands within buses and con-struction equipment. It is asso-ciated with the Group's core values - quality, safety and environmental care.
Prevost
Prevost is a leading north American manufacturer of pre-mium touring coaches and bus shells for high-end motorhomes and specialty conversions.
Nova Bus
nova Bus is a leading north American provider of sustaina-ble transit solutions, including environmentally-friendly buses, high-capacity vehicles and integrated intelligent transportation systems.
TruCK Brands– full market coverage with future positioning
Brands in oTher areas
Demand for total solutions
Premium segment
High-end segment
Value segment
Basic segment
Vocational
Japan
23

Efficient products
City distributionRegional distribution ConstructionLong-haul
TrucksAll brands in the Volvo Group’s truck operations have a unique and distinct brand-specific character that attracts customers in their market segments.
The trucks are sold and marketed under the brands Eicher, Mack, Renault Trucks, uD Trucks and Volvo, which all offer customers a broad range of products and ser-vices for efficient and eco-nomic transports.
Special-purpose vehiclesThe Volvo Group manufac-tures special-purpose vehi-cles for use by for instance government, defense, peace-keeping and relief organizations.
BusesVolvo Buses’ product range includes complete buses and bus chassis for city, intercity and coach traffic. The com-pany has a total offering that, in addition to buses, includes a global service network, effi-cient spare parts handling, service and repair contracts, financial services and traffic information systems.
Long-haul trucks from Volvo are a common sight on the roads.
A GLOBAL GROuP 2012 Business model PRODuCT OFFERInG
nova BusVolvo Buses Prevost
Mack
Eicher
UD Trucks
Volvo
Renault Trucks
All of the Volvo Group's products have been developed to contribute to efficient transport and infrastructure solutions in all parts of society.
24

Compact construction equipment
Skidsteer loaders
Road machinery
Asphalt milling machines
Heavy construction equipment
Backhoe loaders Compaction equipmentWheeled excavators Wheel loaders
Wheel loaders Crawler excavators Articulated haulers Motor graders
Crawler excavators PaversCrawler excavators from Lingong Lingong wheel loaders
Construction equipmentVolvo Construction Equip-ment develops, manufactures and markets equipment for construction and related industries under the brands Volvo and SDLG. Its products are leaders in many world markets, and include a com-prehensive range of wheel loaders, hydraulic wheeled and crawler excavators, articulated haulers, road machinery and a wide range of compact equipment.
Industrial enginesMarine enginesEngines for boats and industrial applicationsVolvo Penta manufactures engines and drive systems for both leisure boats and commercial craft, with an engine range of 10 to 900 hp and has a global service net-work of approximately 4,000 dealers. Volvo Penta also supplies industrial engines ranging from 75 kW to 640 kW for container hand-ling, mining equipment and other industrial applications.
All over the world, Volvo CE is a leading provider when customers want to buy super-ior construction equipment.
Expanded partnership with WWF During 2012 Volvo CE and Volvo Buses joined the Volvo Group’s cooperation with WWF Climate Savers. The coopera-tion is based on the Volvo Group’s commitment to reduce car-bon-dioxide emissions by 30 million tons from construction equipment, buses and trucks manufactured through 2014 compared to a baseline of 2008. The Volvo Group’s company, SDLG, becomes the first-ever Chinese company to be a mem-ber of Climate Savers.
Climate Savers involves multinational companies in the battle to reduce carbon-dioxide emissions. The results will be reviewed by independent technical experts. The agreed target
must be more ambitious than the company would have set on its own, and must also signify that the company is leading its sector in the reduction of greenhouse gas emissions.
In autumn 2010, the Volvo Group became the world’s first automotive manufacturer to join Climate Savers.
In addition, Volvo Buses has also committed to expand the number of field tests with plug-in hybrid buses during the commitment period. The plug-in technology has excellent fuel-savings potential for city buses. During the development of fuel-saving technology, Volvo Construction Equipment will prepare a new prototype with additionally improved fuel per-formance, compared with existing models.
The agreement between Volvo and WWF also states that:
• Volvo will develop a new truck prototype with 20% lower fuel consumption than a corresponding truck manufactured in 2008.
• Prior to 2014, Volvo will offer the commercial market trucks that operate on renewable gas.
• The Volvo Group will also reduce carbon-dioxide emissions from its production plants by 0.2 million tons (12%) before
2014, com-pared with 2008.
Financial servicesFinancial solutions such as customer financing and leasing, dealer financing, and other fee-based products such as insurance, contribute to the Volvo Group total solution offering by creating customer value such as convenience, speed and peace of mind. Providing attractive financial solutions and other support services is essential to meeting today’s high customer demands, and to attracting and retaining Volvo Group custom-ers.
25

A GLOBAL GROuP 2012 Business model PRODuCT OFFERInG
It is critical for the Volvo Group's future success to continue to be innovative and develop technologies, which can be converted into financially viable products and services.
limate change is one of the greatest
challenges faced by mankind.
Research shows that transport is
responsible for approximately 13%
of the total greenhouse gas emissions caused by
humans. As one of the world’s largest manufac-
turers of commercial vehicles the Volvo Group
works to reduce CO2 emissions from the use of
its products.
Three areas of focus
The Group's product development is affected by
the cost of, access to and availability of fuel, as
well as legislation in the environmental area.
Therefore, the Volvo Group focuses its research
and development on the development of ener-
gy-efficient drivelines, hybrid and electric drive-
lines and vehicles that can be operated on
renewable fuels.
The Volvo Group also participates in public
and private partnerships to develop sustainable
and efficient transport systems such as Bus
Rapid Transport System (BRT) and Intelligent
Transport Solutions (ITS).
Energy-efficient drivelines
The Group's products have the largest impact on
the environment in the usage phase. Therefore
the Group has a life-cycle perspective and con-
sider the environmental impact from the prod-
ucts, from them being developed all the way to
them being phased out and recycled. Since
approximately 90% of the environmental impact
results from the use of the products, the Group's
main focus is on reducing fuel consumption, CO2
emissions and other emissions to the air. The
basic principle is that each new product shall
have less impact on the environment than the
product it replaces.
The Volvo Group estimates the fuel-saving
potential for a standard truck will be 15% in
2020 compared with fuel consumption in 2005.
new technology can lead to even more signifi-
cant savings. For instance, the use of a hybrid
driveline may improve fuel savings by up to 39%
in certain bus operations.
39% makes this bus a commercially viable option.
In 2011 Volvo Trucks commenced sales of
hybrid trucks, under the name Volvo FE Hybrid, to
customers in selected European markets. With a
plug-in solution, the fuel saving potential of a Volvo
FE Hybrid is up to 30% in refuse applications. In
distribution applications the saving is 15–20%.
Renewable and alternative fuels
Carbon dioxide neutral vehicles are powered by
fuel produced from renewable raw materials
such as biomass. Reducing dependency on fossil
fuels such as oil, coal and natural gas by increas-
ing the use of renewable fuels makes business
and environmental sense. The Volvo Group’s
research on renewable fuels is mainly focused
on Methane Diesel and DME (dimethyl ether).
Joint DME project
DME is a potential alternative to fossil fuel; it is
energy-efficient and has a proven lower environ-
mental impact. Estimates show that by replacing
conventional diesel with Bio-DME carbon dioxide
emissions will be cut by 95%.
The BioDME project is a joint venture with,
among others, the Eu and the Swedish Energy
Agency. The aim is to involve the entire chain;
from production of DME from biomass, distribu-
tion to DME used as vehicle fuel.
Combining methane and diesel
The benefit of methane diesel technology is
that methane fuel is already available as a fuel
for vehicles. Volvo FM and Volvo FL/FE are
available in methane diesel versions. The trucks
are powered by up to 75% gas and therefore
the CO2-emissions are reduced. Volvo Trucks is
the first manufacturer in Europe that sells
gas-powered trucks for long-haul operations.
Environmentally enhanced products
C
energy-efficient drivelines
renewable fuels
hybrid and electric drivelines
Three areas of focus
Hybrid and electric drivelines
Hybrid technology is one of the most promising
and competitive technologies for commercial
vehicles, because of its potential for saving fuel,
hybrid technology means lower operating costs
for customers while at the same time significantly
reducing environmental impact.
The most appropriate vehicles for hybrid
drivelines are those operating in continuous
stop-go conditions, such as city buses and
refuse or distribution trucks.
The Volvo Group’s I-SAM concept consists of an
electric motor and a diesel engine working in par-
allel, whereby each of them can be used where
they are most effective. Production of the Volvo
Hybrid city bus and the Volvo Hybrid double-decker
started in 2010. Significant fuel savings of up to
26

In January 2010, EPA 2010 was implemented in North America and on January 1, 2014 Euro 6 will be introduced in the EU. With the implementation of EPA 2010, emission levels for particulates and NOx are close to zero. Euro 6 entails that emissions of NOX (Nitrogen Oxides), and PM (Particulate Matter) will be reduced by 97% compared to a truck from the early 1990s.
2006Euro 4
2009Euro 5
2007EPA 2007
2002EPA 2002
2014Euro 6
2010EPA 2010
Particles, g/kWh NOx, g/kWh
8
6
4
2
0
Europe USA
Particles, g/kWh NOx g/kWh
0.16
0.12
0.08
0.04
02002Euro 3
Emissions regulations for trucks and buses
Within the EU all road transport emissions except for CO2 are expected to decrease in the future. This is the result of stringent emission regulations.
20000
20
60
40
80
120
100
1995 2005 2010 2015 2020Source: ACEA – European Automobile Manufacturers' Association.
Particulate matter (PM) from diesel
Sulphur dioxide (SO2)
Solvents (VOCs)
Carbon dioxide (CO2 )
Carbon monoxide (CO)Nitrogen oxides (NOX)
Benzene
Significantly reduced emissions
30% Exhaust emissions including CO2 from fuel use
-5% Recycling
12% Producing the truck
58% FuelResource use of crude oil
and fuel production
5% Maintenance
93% Driving the truck
Life Cycle Assessment Each new product from the Volvo Group should have less environmental impact than the product it replaces. The Group uses Life Cycle Analysis (LCA) to map a product’s environmental impact in order to make well- informed decisions in the development process.
Findings from analyses indicate approximately 90% of the environmen-tal impact results from the use of the products. The Group's main focus is therefore on reducing the environmental impact of products in use.
New engine for Euro 6
The Euro 6 legislation, which will come into
effect in the Eu in 2014 entails that emissions
of nOx (nitrogen Oxides), and PM (Particulate
Matter) will be reduced by 97% compared to a
truck from the early 1990s. During 2012, the
Volvo Group launched an engine that will comply
with Euro 6.
Full lineup of Volvo Group trucks in the US
earns 2014 greenhouse gas certification
The uS Environmental Protection Agency and
national Highway Traffic Safety Administration
have certified all Volvo Group truck models in
the uS, both Mack and Volvo branded, in accord-
ance with 2014 fuel efficiency and greenhouse
gas regulations.
27

industries. The reliability and productivity of the
products are important and in many cases crucial
to the customers' success and profitability. A
competent and professional dealer and service
network, which makes sure that customers' vehi-
cles and machines can be used to the maximum
and are free from unwanted stoppages, is of vital
importance for the Volvo Group and assists in
strengthening the Group's various brands.
The goal is that Volvo Group companies shall
be regarded as number one in customer satis-
faction, in terms of both products and services.
The Volvo Group shall also be number one when
the dealers’ customers assess customer satis-
faction.
Growing aftermarket business
In addition to vehicles and machines, the Volvo
Group’s offering includes various types of finan-
cing solutions, insurance, rental services, spare
parts, preventive maintenance, service agree-
ments, assistance services and IT services. The
range and flexibility of the offering means that the
solutions can be customized for each customer.
hen customers choose a sup-
plier of vehicles or machinery,
the offering of supplementary
services combined with excel-
lent products is a crucial factor.
Customer surveys show that the Volvo Group's
companies get high ratings in terms of service
and spare parts availability in most markets. As
important as getting the customers' vehicles and
machines back in operation quickly, is the way
customers are treated. This does not apply to
just a specific workshop, instead customers
must be able to count on receiving the same,
first-class service wherever they are.
The Volvo Group offers such services as finan-
cing and insurance, various forms of service agree-
ments, accessories and spare parts. The Volvo
Group’s increasingly broad range of these services
and aftermarket products is of ever-increasing
importance to the Group's competitiveness.
Develop and increase interface
with customers
The majority of Volvo Group’s customers are com-
panies within the transportation or construction
world-Class serViCes
Strengthen customer relationships
Many customers want long-term cooperation around total solutions to execute their work as efficiently as possible with maximum profitability and reliability.
Distribution of net sales 2012
W
A GLOBAL GROuP 2012 Business model
Since a large part of the offering within the
aftermarket business is requested as long as
products are being used, they contribute to bal-
ancing the fluctuations in the business cycle for
the Group. By strengthening the aftermarket
offering, profitability and revenue sustainability
can improve for the Group throughout the busi-
ness cycle.
The strategy to increase sales of services and
aftermarket products is an important element in
the Volvo Group’s effort to achieve targets for
profitability and growth, both in mature markets
and in the Group’s new markets. During 2012, the
services and aftermarket products business (soft
products) represented approximately 27% of net
sales in the Industrial Operations compared to
26% in 2011. The extended product offering
such as used vehicles and machines, trailers and
superstructures and special vehicles were previ-
ously defined as soft products. As of January 1,
2012 these are instead defined as hard products.
Sales of soft products (services and aftermarket products), 27% (26)
Sales of hardproducts, 73% (74)
28

Fuel costs represent between 25% and 35% of total haulage firm costs.
At the same time, the hauliers' profit margins are often very small, which
means that all savings make an important difference. In order to succeed
in cutting the haulage firm's overall fuel consumption, the part played by
the drivers is vital. Driver training courses in eco-driving have proven them-
selves to be effective, but without professional follow-up the results are
often short-term. That is why the Volvo Group’s various businesses offer
extensive services in this area. Some of them are described below.
Volvo Trucks Fuel Advice
Volvo Trucks’ new Fuel Advice is a personal fuel advisor whose aim is to help
hauliers cut their fuel costs while at the same time maintaining these
improvements in the long-term perspective. The results are long-term, with
savings as high as 5%.
Fuel Advice consist of three modules:
1) Fuel Coaching. The fuel advisors register and analyze each driver's indi-
vidual driving techniques. The advisors provide practical tips on how fuel
consumption can be reduced, as well as help with planning and with
structuring the necessary follow-up.
2) Fuel Management Toolbox. A web-based toolbox with tools that provide
inspiration, guidance and practical information about the best and sim-
plest ways of working with fuel savings.
3) Fuel Management Support. The customer's interface for contacts with
his or her individual fuel advisor, who is there to answer questions and
offer advice.
Fuel Advice is primarly targeted to small and medium sized companies and
complements Volvo Trucks' existing Fuel Management Service, which is pri-
marily designed for larger haulage firms.
Renault Trucks Optifuel
Renault Trucks offers customers the possibility for further increasing the
savings through its Optifuel solutions, which is an offer consisting of both
products and services. It consists of Optifuel Technology, including the auto-
matic gearbox Optidriver+, Optifuel Infomax, a tool for measuring and analyz-
ing fuel consumption that is very precise and Optifuel Training, which trains
drivers in economical driving.
Eco Operator from Volvo CE
EcoOperator is a training program from Volvo Construction Equipment that
gives operators the practical and theoretical knowledge they need to become
safer, more efficient and extra environmentally conscious while operating
equipment. no matter how fuel efficient a piece of equipment is, the operator
has a significant effect on fuel consumption and productivity.
The program teaches correct machine operation and maneuvering as well
as how to plan work in the smartest, most efficient way. By following these
techniques operators can help save money on fuel, increase overall productiv-
ity, reduce maintenance expenses and reduce the impact on the environment.
Efficient driving with Volvo Buses
Volvo Buses also offers courses in efficient driving to help drivers save fuel
and provide passengers with a pleasant ride. Together with Volvo Buses’ new
web-based tool – Volvo Bus Telematics – that gives bus operators better
control over their vehicles’ fuel consumption and allows them to tailor main-
tenance to meet individual needs, these measures can deliver fuel savings of
about 10%. The hardware is fitted as standard in Volvo’s hybrid bus.
Training and advice to save even more fuel
In addition to products at the forefront in terms of fuel efficiency, the Volvo Group also offers training and advice that can contribute to further fuel savings.
Volvo Fuel Advice
29

research institutes in areas of special interest.
The program aims to provide the Group with a
picture of important collaborative partners and to
increase the Group’s visibility to students and
researchers. The cooperation with universities is
also important for creating relationships with
students and potential employees to secure
access to future competence. The Volvo Group
has eight talent partners in APP globally: EM
Lyon and InSA Lyon in France, Tsinghua univer-
sity and Tongji university in China, Chalmers
university of Technology and the School of
Business, Economics and Law at the university
of Gothenburg, Sweden and north Carolina
State university and Pennsylvania State univer-
sity in the u.S.
Competence development
Investing in the Group's employees is a funda-
mental part of staying competitive, sustainable
and profitable. The Volvo Group’s training pro-
grams are offered at all levels for employees, and
the activities range from traditional and e-based
training to individual coaching and mentoring.
Individual competence development is based
on a personal business plan, which provides sup-
port for translating corporate strategic objectives
into individual objectives and contribution. The
purpose is to ensure that employees clearly
understand their role in the team and what is
expected of them.
Developing talents
Every manager is responsible for assessing and
developing talent in the organization. The Leader-
ship Pipeline provides the Group with a structured
approach to developing and preparing present
leaders as well as potential leaders for future roles.
The Leadership Pipeline has been set up
ncreased global presence, new products,
new technologies, demographic changes
and more rapid fluctuations in the global
economy will lead to challenges in the
supply of expertise and resources.
Attracting and retaining competence
The Volvo Group's ambition is to offer interesting
opportunities and a unique company culture that
help us attract and retain the best people, whoever
they are and wherever we do business.
Without engaged employees, who are willing
to take an active part in the Group’s development
and future, the Volvo Group will not succeed in
pursuing its strategies. It is therefore important
that we attract the right expertise and competent
engineers to continue the development of envi-
ronmentally enhanced products. The Volvo Group
regularly maps the strategic competence needs,
and annually aggregate findings on a Group level
to identify the most important future needs.
The Volvo Group's Code of Conduct prescribes
the minimum standard our emplyees can expect
from their employer, but also their own responsi-
bilities. All employees are offered education on
the policy's principles.
Academic Partner Program
The number of people in Europe graduating with
degrees in mathematics, science and technology
is declining, and this trend may have an effect on
the future competitiveness of Europe. The Volvo
Group is involved in a comprehensive series of
cooperative ventures with research bodies and
academic institutions to advance the technolo-
gies needed for future product development.
One example is the Academic Partner Program
(APP), which is a systematic approach for long-
term cooperation with selected universities and
jointly with research institutes and is based on
global research. It is also designed to support
the Volvo Group’s culture and values as well as
the strategic objectives.
Diversity enhances innovation
To create the dynamics required to succeed at a
global level the Volvo Group needs to recruit and
retain a broad spectrum of employees with differ-
ent backgrounds, experience and perspectives. In
the Volvo Group diversity is considered to be a
catalyst for innovation and a source of competi-
tiveness and profitability. By expanding the knowl-
edge base, skills and understanding, the Group
becomes more responsive to customer needs and
it strengthens the Group's market position. Diver-
sity and inclusion have long been pri oritized
within the Volvo Group.
Employee engagement
In 2011, an Employee Engagement Index was
added to the Volvo Group Attitude Survey (VGAS).
By including engagement there is a clearer con-
nection to the Group’s wanted position, culture and
business success. The results from VGAS is
benchmarked against an international database
with data gathered from over 14 million employees,
representing over 80 countries. In the 2012 VGAS,
the Volvo Group reached an Employee Engage-
ment Index of 76%, which was on the same level as
the year before. This means that the Volvo Group is
one of the top 25% companies. The response rate
in VGAS was 92%. In 2012 a measurement on the
organization's status was also included, PEI – Per-
formance Excellence Index, which measures if the
company has the right prerequisites to perform and
deliver, but also factors such as cooperation, clear
targets, customer service as well as quality and
efficiency. PEI ended up at 74%, which is good, but
below the level of the top 25% companies.
a hiGh-performinG orGanizaTion
Committed employees
The Volvo Group's vision is to become the world leader in sustainable transport solutions. A deciding factor in fulfilling this vision is our employees and their knowledge and skills.
Europe 54%
North America 17%
South America 6%
Asia 20%
Other countries 3%
Geographic distribution of employees
i
A GLOBAL GROuP 2012 Business model
30

Key figures 2012 2011number of permanent employees at year-end 98,717 98,162number of temporary employees and consultants 16,548 19,675Share of women, % 17 18Share of women, Board Members, % 14 13
Share of women, Presidents and other senior executives, % 19 17
The Volvo Group's company culture – The Volvo WayThe Volvo Group views its corporate culture as a unique asset, since it is difficult for competitors to copy. By applying and strengthening the exper-tise and culture we have built up over the years, we can achieve our vision.
The Volvo Way shows what we stand for and aspire to be in the future. It lays the foundation for developing the Volvo Group into the world’s lead-ing provider of commercial transport solutions. It is a recipe for success in which we strongly believe. It expresses the culture, behaviors and values shared across the Volvo Group.
The Volvo Way is based on the con-viction that every individual has the capability and the determination to improve our business operations, and the desire to develop professionally.
The Volvo Way is the lively dialogue between leaders, within teams, and among colleagues around the world. This is the way we conduct business and deliver results. This is how we partner with customers and suppliers, how we work and change, and how we build the future together.
31

A GLOBAL GROuP 2012 Business model
indusTrial sTruCTure
Global industrial structure
The Volvo Group has an established and strong position in Europe, North America, and South America. Through the acquisitions of UD Trucks and Lingong and the coopera-tion within trucks and buses with India-based Eicher Motors the posi-tion has been strengthened in many markets in Asia. Through its acquisi-tions the Volvo Group has also estab-lished a global industrial structure with manufacturing as well as sales and distribution channels on all continents.
Share of employees
5,977 employees6%
south america
16,569 employees17%
north america
Employees worldwide 2012
Major production facilities North America South America Europe Asia Rest of the world
Eicher* Pithampur* (IN)
Mack Macungie (US) Las Tejerias (VE) Brisbane (AU)
Renault Trucks Blainville, Bourg-en-Bresse, Limoges, Vénissieux (FR), Kaluga (RU)
UD Trucks Ageo (JP), Hangzhou* (CN) Johannesburg* (ZA)
Volvo New River Valley (US) Curitiba (BR) Göteborg, Umeå (SE), Gent (BE), Kaluga (RU) Bangalore (IN), Bangkok (TH) Durban (ZA), Brisbane (AU)
Engines and transmissions Hagerstown (US) Curitiba (BR) Köping, Skövde (SE), Vénissieux (FR) Ageo, Kounosu, Hanyu (JP)
Construction Equipment Mexico City (MX), Shippensburg (US) Pederneiras (BR) Arvika, Braås, Eskilstuna, Hallsberg (SE), Konz-Könen, Hameln (DE), Belley (FR), Wroclaw (PL)
Changwon (KR), Shanghai, Linyi* (CN), Bangalore (IN)
BusesSt Claire, St Eustache (CA), Mexico City (MX), Plattsburgh (US) Curitiba (BR) Borås, Säffle, Uddevalla (SE), Wroclaw (PL) Bangalore (IN) Shanghai* (CN)
Volvo Penta Lexington (US) Göteborg, Vara (SE) Shanghai (CN)
* Ownership ≥ 50%
Gro
up T
ruck
s O
pera
tions
32

53,434 employees54%
Europe
2,515 employees3%
Other markets
20,222 employees20%
Asia
Major production facilities North America South America Europe Asia Rest of the world
Eicher* Pithampur* (IN)
Mack Macungie (US) Las Tejerias (VE) Brisbane (AU)
Renault Trucks Blainville, Bourg-en-Bresse, Limoges, Vénissieux (FR), Kaluga (RU)
UD Trucks Ageo (JP), Hangzhou* (CN) Johannesburg* (ZA)
Volvo New River Valley (US) Curitiba (BR) Göteborg, Umeå (SE), Gent (BE), Kaluga (RU) Bangalore (IN), Bangkok (TH) Durban (ZA), Brisbane (AU)
Engines and transmissions Hagerstown (US) Curitiba (BR) Köping, Skövde (SE), Vénissieux (FR) Ageo, Kounosu, Hanyu (JP)
Construction Equipment Mexico City (MX), Shippensburg (US) Pederneiras (BR) Arvika, Braås, Eskilstuna, Hallsberg (SE), Konz-Könen, Hameln (DE), Belley (FR), Wroclaw (PL)
Changwon (KR), Shanghai, Linyi* (CN), Bangalore (IN)
BusesSt Claire, St Eustache (CA), Mexico City (MX), Plattsburgh (US) Curitiba (BR) Borås, Säffle, Uddevalla (SE), Wroclaw (PL) Bangalore (IN) Shanghai* (CN)
Volvo Penta Lexington (US) Göteborg, Vara (SE) Shanghai (CN)
* Ownership ≥ 50%
33

A GLOBAL GROuP 2012 Business model
produCTion
With the environment in focus
The environmental effort is and has long been one of the cornerstones of the Group’s efforts. The common environmental policy is one of the most important documents for governance. The policy is based on the Group’s environmental management system, strategies and targets, reviews and measures.
he Volvo Group conducts manufac-
turing in 18 countries around the
globe. An important tool is Volvo
Production System (VPS), which
includes methods for streamlining the operation
and minimizing productivity losses. VPS includes
tools for documenting work-related risks, indicators
for measuring health and safety and methods for
ergonomic workplaces. Today, 17 of the Group's
production facilities are certified according to the
international standard for occupational health and
safety, OHSAS 18001. Environmental issues are
also partly managed in VPS. At the end of 2012,
97% of employees in production worked in units
certified according to environmental and quality
management systems, primarily ISO 14001 and
ISO 9001. At each production unit, there are envi-
ronmental coordinators, safety delegates and qual-
ity coordinators. Indicators are used to measure
and monitor work in environment, health and safety.
The Group’s environmental goals are used to
govern, develop and monitor the environmental
work. Focusing on energy-saving measures is
good for the environment and for the Group’s
financial results. A couple of years ago, when
the Volvo Group launched the world’s first car-
bon-neutral plant, the primary reason was to
reduce the environmental load, but it soon
became clear that it was also a good financial
investment, which will generate considerable
cost savings in the long-term.
All production facilities must comply with
common minimum requirements in terms of
chemicals, energy consumption, emissions to air
and water, waste management, environmental
organization and improvement work. Since
1989, environmental audits have been con-
ducted to ensure compliance with the environ-
mental policy and during acquisitions, compa-
nies and properties are reviewed with respect to
environmental aspects and risks.
In 2012, there were 15 licensable facilities in
Sweden. All have the necessary environmental
permits and no permit must be renewed in 2013.
An inventory of any contaminated land among
the Group’s properties is conducted annually.
During 2012, post-remediation work was con-
ducted on one case of contaminated land
among the Volvo Group’s properties in Sweden.
During 2012, one major environmental incident
occurred in Eskilstuna, Sweden. A leakage of oil
was discovered in time for it to be stopped
before it reached a nearby stream. no environ-
mental disputes are in progress.
The New River Valley plant is the first in
the US with two high energy certifications
The plant in new River Valley (nRV), which is the
largest for Volvo Trucks, was certified according
to ISO 50001 and SEP (Superior Energy Perfor-
mance). ISO 50001 is an international standard
An important tool in production is Volvo Production System (VPS), which includes methods for streamlining the operation and minimizing productivity losses.
T
and SEP is a certification program in the uS for
the development of continuous improvements in
energy efficiency. The nRV plant was SEP-certi-
fied at platinum level – the highest possible – for
implementing more than 15% energy improve-
ments over a three-year period. To achieve ISO
50001 and SEP standards entail a milestone for
nRV, on the way to becoming a carbon-dioxide
neutral plant.
Jointly with 32 other major companies, nRV is
participating in the DOE’s Better Buildings/Better
Plants improvement program. The commitment
includes reducing energy intensity, within a ten-
year period, by 25% per unit, and Volvo achieved
the program’s target within one year instead of ten.
Some of the solutions that helped to reduce nRV’s
energy consumption were technical, for example,
automation system, heating with solar energy and
infrared heat, and many of the ideas were contrib-
uted by employees.
34

responsiBle sourCinG
Continuously increasing demands
Responsible sourcing is about managing risk, promoting responsible behaviour and building long-term relationships with suppliers to improve social, environ mental and business ethics in the supply chain.
nsuring good standards in the sup-
ply chain is important to the Volvo
Group and its stakeholders. The
Group wants to ensure that unethi-
cal values are not built into the Group's products
and services. Since 1996 the Volvo Group has
gradually increased requirements for suppliers
regarding environmental, business ethics and
social responsibility aspects. The requirements
placed on suppliers are based on the principles
contained in the Volvo Group's Code of Conduct
and international norms of behaviour.
Sourcing and risk assessments
In 2012, more than 36,000 suppliers delivered
products and services to the Volvo Group. Approx-
imately 6,000 are suppliers of direct material
used in automotive products. 8% of these suppli-
ers are located in countries assessed as ‘high risk’
identified in the Volvo Group's risk model. The risk
assessments are based on analyses conducted
by internationally recognized institutions and
include factors such as human rights, labour
standards and incidence of corruption.
Results from the assessments in 2012
In 2012, 66% (60) of Volvo Group purchasing
spend for direct material derived from suppliers
of that during 2010 to 2012 had completed a
self-assessment based on the Volvo Group's
CSR requirements (CSR – Corporate Social
Responsibility).
Of the 66% of the suppliers that completed
the self-assessment 80% passed. Almost
exclusively, the main reason for failing to comply
with the assessment is a lack of adequate sys-
tems to pass on the requirements to their suppli-
ers, which is one of the requirements. The rest
failed beacuse of a lack of other processes to
comply with the requirements. Suppliers that do
not pass are asked to draw up an action plan.
Of the suppliers in high-risk countries from a
CSR perspecitve 64% completed the test. In
terms of volume the share was 84%. Of the sup-
pliers in high -risk countries that completed the
assessment 74% passed.
In 2013, the Group will continue to focus on
assessing suppliers in identified high- and
medium risk countries from a CSR perspective
and to work with the non-approved suppliers to
ensure that the Group's requirements are met.
The Volvo Group has a process for the evaluation of its suppliers, based on the prin-ciples in the Volvo Group Code of Conduct.
e
66% of the purchased direct material, measured in cost, came from suppliers that have undergone CSR evaluation during 2010 to 2012.
35

A GLOBAL GROuP 2012
During this time, a number of acquisitions have been made, which have
brought economies of scale and increased geographical reach.
Volvo Group has during this time also successfully established itself out-
side its historical markets of Europe and north America and gained a strong
foothold in the growing markets of Eastern Europe, South America and Asia.
During 2012, the markets outside of Western Europe and north America
accounted for 47% of the Industrial Operations' total sales, compared with
16% in 2000.
Strong market channels
The Volvo Group's products are sold and serviced through wholly-owned as
well as independent dealers and service workshops. In order to attain a
market position which is strong over the long term, good products are not
enough. Of at least equal importance is a finely-meshed network of dealers
and service points that can support customers in demanding transport and
construction businesses. A testament to the strength of the Volvo Group's
distribution and service network is the market positions that have been
attained. The table to the right shows the truck brands' combined market
shares in heavy-duty trucks in a number of important markets.
On the following pages there is more information about the development
on important markets and on some of the Volvo Group's investments and
successes on them.
GloBal sTrenGTh
In a changing world
A GLOBAL GROUP 2012 Group performanCe
1998 Acquisition of the excavator operations of Samsung Heavy Industries.
1999 Sale of Volvo Cars to Ford.
2001 Acquisition of the truck manufacturers Mack and Renault VI.
2003 Acquisition of Bilia's European truck and construction equipment dealers.
2004 Acquisition of remaining 50% of the Canadian bus manufacturer Prévost.
2006 Acquisition of Japanese nissan Diesel (now uD Trucks). Completed in 2007.
2007 Acquisition of Chinese wheel loader manufacturer Lingong (SDLG).
2007 Acquisition of Ingersoll Rand's road development division.
2008 Formation of joint venture with Eicher Motors of India within trucks and buses.
2012 Acquisition of the French vehicle manufacturer Panhard.
2012 Divestment of Volvo Aero to the British company GKn.
2012 Increase to just over 25% ownership in engine manufacturer Deutz.
2013 Agreement to acquire 45% of Chinese truck company Dongfeng Commercial Vehicles.
The Volvo Group's larger acquisitions and divestments
Since the streamlining towards commercial vehicles was initiated more than ten years ago, the Volvo Group has grown into one of the world's larg-est manufacturers of heavy-duty trucks, buses and construction equipment and is today also a leading manufacturer of heavy-duty diesel engines and marine and industrial engines.
Group market shares
Heavy-duty trucks
2012 2011
EU29 25.7 26.3
North America 18.3 18.2
Brazil 18.2 17.1
Japan 17.5 20.3
India* 3.9 3.1
Australia 21.4 23.4
South Africa 23.5 24.5
* In India Eicher has a particularly strong position within mediumduty trucks with a market share of 31.4% (30.5).
3636

Trucks, 63%
Construction Equipment, 21%
Buses, 7%
Volvo Penta, 2%
Volvo Aero, 2%*
Customer Finance, 3%
Other, 2%
* Volvo Aero was divested on October 1, 2012.
Distribution of Group's net sales 2012
Europe, 37%
North America, 23%
South America, 10%
Asia, 23%
Rest of the world, 7%
Distribution of net sales by geography 2012
strong positions• One of the world's largest manufacturers of trucks.
• One of the world's largest within construction equipment.
• One of the world's largest manufacturers of heavyduty diesel engines.
• Strong brands.
• Good market presence globally.
03 04 05 06 07 08 09 10 11 120
75
150
225
300
Volvo Group net sales, SEK bn
3737

A GLOBAL GROuP 2012 Group performanCe
Weak markets
In 2012 the heavy-duty truck market in Europe
28 (Eu's 27 member states minus Bulgaria plus
norway and Switzerland) decreased by 9% to
221,000 trucks compared to 242,200 in the
preceding year. The markets in Southern Europe
weakened further during the year and the
weaker market conditions spread to large parts
of Europe. Demand held up better in Germany,
Scandinavia and the uK. The Russian market
was strong for most of the year. In 2013, the
market in Europe 29 is expected to amount to
about 230,000 heavy-duty trucks.
The Group’s truck business had somewhat
lower market shares during 2012 compared
with the previous year. Part of the reason is the
weak market development in Southern Europe,
where Renault Trucks has a traditionally strong
position. A shift in market mix with a relatively
stronger demand in Germany, where the Volvo
Group's position is relatively weak, also impacted
the development negatively. In Europe 29 the
Group's combined market share amounted to
25.7% (26.3) in heavy-duty trucks.
The construction equipment market continued
to grow during the first half of 2012, however with
a gradually weakening growth rate. During the
second half of the year demand weakened signifi-
cantly. Measured in number of units, the total
market decreased by 4%. The European market
for construction equipment is expected to decline
by 5–15% during 2013.
Also in 2012 the European bus market was
characterized by weak demand, fierce competition
and considerable price pressure in tenders. Volvo
Buses strengthened its market share to 13%.
Demand for marine engines was negatively
impacted by the continued uncertainty regarding
the economic development, not least in the pre-
viously strong boat markets in Southern Europe.
The slower economic activity and the financial
turmoil had a negative impact also on the market
for industrial engines.
New organization for truck business
in Europe
On January 1, 2013, the Volvo Group introduced a
new organization for its sales and marketing of
trucks in Europe, the Middle East and Africa
(EMEA). The reorganization aims to capitalize
more effectively on opportunities for the Group’s
brands and products. At the same time, an optimi-
zation of the dealer and service networks in East-
ern and Central Europe is carried out, with the aim
to considerably increase the service availability,
primarily for Renault Trucks. The number of service
points is expected to increase by 30–40% for
Renault Trucks and by 10% for Volvo.
The new organization is a stage in the imple-
mentation of the new strategy for the Volvo
Group’s truck operation, which is a key compo-
nent of efforts to improve the Volvo Group’s
operating margin by three percentage points.
−By making smarter use of existing networks,
we can capitalize more effectively on our various
brands and products in the truck operation while
improving our service to customers, says Peter
Karlsten, Executive Vice President of Group
Trucks Sales & Marketing EMEA.
Volvo Buses consolidates manufacture
of complete buses in Europe
In October, Volvo Buses announced its plans to
concentrate its European production of com-
plete buses in the company’s main plant in
Wroclaw, Poland. The consolidation is done to
address a structural overcapacity in Europe.
Production at the Volvo Buses plant in Säffle,
Sweden, is planned to end at June 2013.
Volvo Group invests in Russia
The Volvo Group invests SEK 783 M in a new
facility for the production of cabs at the plant in
the Russian city of Kaluga. The facility, which is
expected to become operational in 2014, will
manufacture cabs for the Volvo and Renault
Trucks brands with a total annual capacity of
15,000 cabs.
During 2012, the European market accounted for SEK 112 billion, corresponding to 37%, of Group net sales. Europe is the historical home market, where the Group has a considerable industrial structure with a relatively large share of its manufacturing and sizeable exports.
deVelopmenT By ConTinenT
Europe – the largest market
38
The plant in Kaluga, situated about 200 kilo-
meters south of Moscow, was inaugurated in
2009 and currently supplies Russia and sur-
rounding countries with trucks under the Volvo
and Renault Trucks brands. The total annual
capacity of the facility is 15,000 trucks. Volvo
sold 6,973 heavy-duty trucks in Russia and
Renault Trucks sold 1,777 trucks.
New Volvo engine for Euro 6
In July, Volvo presented an engine tailored for
the tough Euro 6 environmental standards.
nitrogen oxide emissions will drop by 77% and
particulate emissions will be halved. The first
engine is Volvo’s D13 460 hp engine, which
today powers more than one-third of all Volvo
trucks.
New Volvo FH truck
The new generation of Volvo FH was presented
to the public in early September through parallel
launches in some of our most important markets
in Europe. It was also displayed at the automo-
tive fair in Hannover where it got very positive
reviews. The advanced technology of the new
Volvo FH will create a new platform for strength-
ening Volvo's competitiveness. Production will
start during the spring of 2013.
The truck contains ten top news that all will
contribute to increasing customer profitability.
On the next spread you can read more about the
new Volvo FH.
38

Volvo Group in Europe
• Net sales: SEK 111,606 M (120,828)
• Share of net sales: 37%
• Number of employees: 53,434
• Share of Group employees: 54%
• Largest markets: France, the UK, Sweden and Russia.
1211100908221242179165319
Market development, construction equipment, Europe, Thousands
12111009081201259476173
Market shares in Europe, heavy-duty trucks, %
1211121110.110.315.616.0
Volvo Renault
Volvo Buses is world leading within hybrid buses and has sold close to 1,000 hybrid vehicles in 20 countries. In June, 25 new hybrid buses were delivered to Gothenburg, Sweden.
Market development, heavy-duty trucks, Europe, Thousands
Facts about Euro 6• New emissions regulations within
the EU as of January 1, 2014. • Onefifth the nitrogen oxide emissions of a Euro
5 engine. • Half the particulate emissions of a Euro 5 engine. • Certification rules have been changed so
that it will be compulsory to meet emissions legislation
down to an ambient temperature of at least –7° C. • Emissions legislation encompasses nitrogen oxides (NOx), particulates (mass), particulates (quantity), ammonia (NH3), carbon monoxide (CO) and hydrocarbons (HC).
in cab plant in Russia
Volvo Group invests SEK
783 m
39

Ten important news on the new Volvo FHThe new Volvo FH containts ten news that will change the world. At least for truck driv-ers. Improvements have been made on:
• Design• Handling• Fuel• Workplace• Space• Accommodation• Safety• Security• Loading• Uptime
Read more about all the news on www.volvotrucks.com/fh
Focus new VolVo FH
A GLOBAL GROUP 2012 Group perFormance DEVELOPMENT BY CONTINENT – EurOPE
a truck that will carry us far into the future
40

– For almost two decades, the Volvo FH Series
has provided haulage companies with safety,
efficient transport and high quality. With our new
replacements, we are going to be even better in
all three areas, says Claes Nilsson.
Setting a new standard
Never before has Volvo conducted so many tests
among drivers and haulage firms with the aim of
ensuring that the new model meets the highest
requirements. The result is a product that not only
meets today’s needs, it also offers properties that
nobody has previously experienced in a truck.
– It really is our customers who have influ-
enced the end-product, and I’m convinced that
we’re setting a new benchmark for the entire
truck industry, says Claes Nilsson.
“More like a car”
One prioritized goal in the development process
was to create a truck with the market’s best han-
dling. Several structural improvements give the
new Volvo FH series a stable and flexible design,
something that can be seen in a film entitled “The
Bal lerina Stunt” on www.volvotrucks.com/fh where
slackline walker Faith Dickey walks the tightrope
between two trucks travelling at 80 km/h.
– We’ve surpassed our expectations. The Volvo
FH is more like a car than a truck when it comes
to precise response and confidence-inspiring
directional stability, says Martin Palming, Product
Manager at Volvo Trucks.
“A truck that will carry us far into the future.” That is how Claes Nilsson, head of Volvo Trucks, summarizes the new versions of the Volvo FH and Volvo FH16 that was launched in September 2012.
“Revolutionary” front suspension
With the new Volvo FH series comes a new Indi-
vidual Front Suspension (IFS) system for heavy
trucks with left-hand drive.
– The Volvo FH without IFS will be number
one on the market, but IFS is all set to revolu-
tionise handling in the truck world. The Volvo FH
with IFS will have the world’s best road handling,
says Martin Palming.
Individual front suspension means that each
front wheel is suspended separately from the
other so it does not affect the movement of the
other wheel. Since both front wheels move indi-
vidually, the result is gentler, more settled pro-
gress on the road. Thanks to the fact that move-
ments are not transmitted from one wheel to the
other, the sense of precision and control also
increases.
– For more than 15 years now the Volvo FH
has been a reliable growth engine for both Volvo
Trucks and haulage companies the world over.
The new Volvo FH will play the same significant
role. It’s an innovative truck that puts the driver
in firm focus while at the same time allowing
haulage firms to do the best business possible.
It’s a truck that’s going to carry us far into the
future, says Claes Nilsson.
New series Volvo FH trucks
41
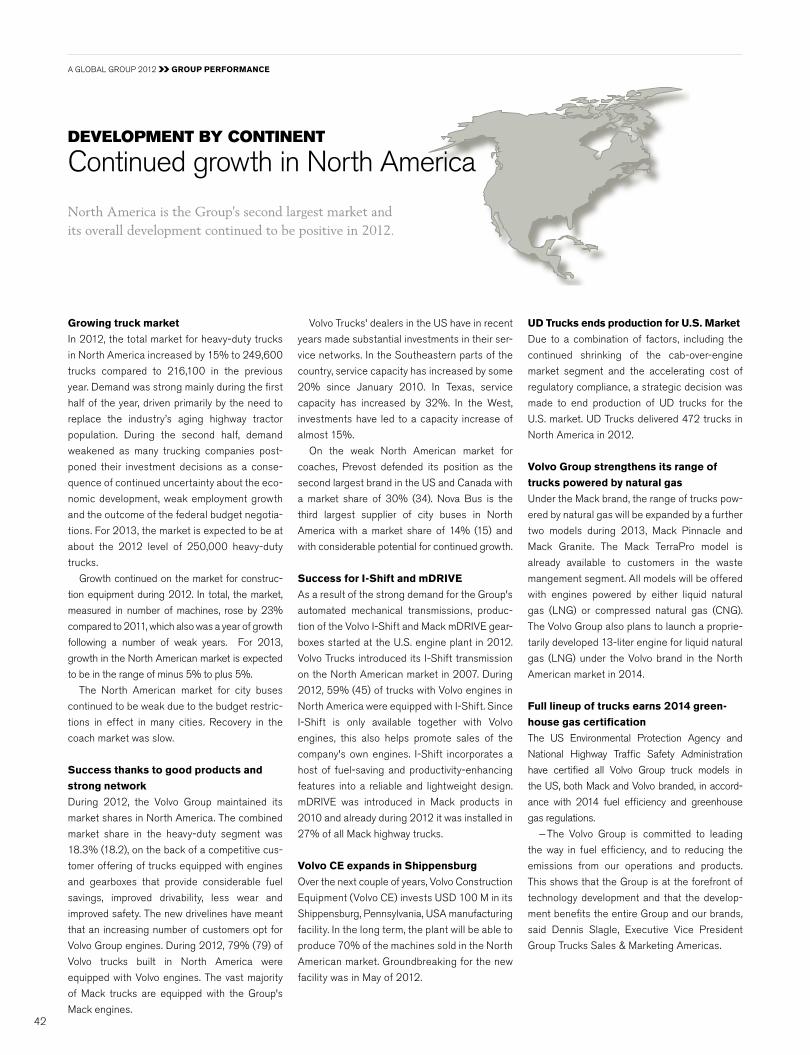
A GLOBAL GROuP 2012 GROUP PERFORMANCE
Growing truck market
In 2012, the total market for heavy-duty trucks
in north America increased by 15% to 249,600
trucks compared to 216,100 in the previous
year. Demand was strong mainly during the first
half of the year, driven primarily by the need to
replace the industry’s aging highway tractor
population. During the second half, demand
weakened as many trucking companies post-
poned their investment decisions as a conse-
quence of continued uncertainty about the eco-
nomic development, weak employment growth
and the outcome of the federal budget negotia-
tions. For 2013, the market is expected to be at
about the 2012 level of 250,000 heavy-duty
trucks.
Growth continued on the market for construc-
tion equipment during 2012. In total, the market,
measured in number of machines, rose by 23%
compared to 2011, which also was a year of growth
following a number of weak years. For 2013,
growth in the north American market is expected
to be in the range of minus 5% to plus 5%.
The north American market for city buses
continued to be weak due to the budget restric-
tions in effect in many cities. Recovery in the
coach market was slow.
Success thanks to good products and
strong network
During 2012, the Volvo Group maintained its
market shares in north America. The combined
market share in the heavy-duty segment was
18.3% (18.2), on the back of a competitive cus-
tomer offering of trucks equipped with engines
and gearboxes that provide considerable fuel
savings, improved drivability, less wear and
improved safety. The new drivelines have meant
that an increasing number of customers opt for
Volvo Group engines. During 2012, 79% (79) of
Volvo trucks built in north America were
equipped with Volvo engines. The vast majority
of Mack trucks are equipped with the Group's
Mack engines.
Volvo Trucks' dealers in the uS have in recent
years made substantial investments in their ser-
vice networks. In the Southeastern parts of the
country, service capacity has increased by some
20% since January 2010. In Texas, service
capacity has increased by 32%. In the West,
investments have led to a capacity increase of
almost 15%.
On the weak north American market for
coaches, Prevost defended its position as the
second largest brand in the uS and Canada with
a market share of 30% (34). nova Bus is the
third largest supplier of city buses in north
America with a market share of 14% (15) and
with considerable potential for continued growth.
Success for I-Shift and mDRIVE
As a result of the strong demand for the Group's
automated mechanical transmissions, produc-
tion of the Volvo I-Shift and Mack mDRIVE gear-
boxes started at the u.S. engine plant in 2012.
Volvo Trucks introduced its I-Shift transmission
on the north American market in 2007. During
2012, 59% (45) of trucks with Volvo engines in
north America were equipped with I-Shift. Since
I-Shift is only available together with Volvo
engines, this also helps promote sales of the
company's own engines. I-Shift incorporates a
host of fuel-saving and productivity-enhancing
features into a reliable and lightweight design.
mDRIVE was introduced in Mack products in
2010 and already during 2012 it was installed in
27% of all Mack highway trucks.
Volvo CE expands in Shippensburg
Over the next couple of years, Volvo Construction
Equipment (Volvo CE) invests uSD 100 M in its
Shippensburg, Pennsylvania, uSA manufacturing
facility. In the long term, the plant will be able to
produce 70% of the machines sold in the north
American market. Groundbreaking for the new
facility was in May of 2012.
North America is the Group's second largest market and its overall development continued to be positive in 2012.
42
deVelopmenT By ConTinenT
Continued growth in north America
UD Trucks ends production for U.S. Market
Due to a combination of factors, including the
continued shrinking of the cab-over-engine
market segment and the accelerating cost of
regulatory compliance, a strategic decision was
made to end production of uD trucks for the
u.S. market. uD Trucks delivered 472 trucks in
north America in 2012.
Volvo Group strengthens its range of
trucks powered by natural gas
under the Mack brand, the range of trucks pow-
ered by natural gas will be expanded by a further
two models during 2013, Mack Pinnacle and
Mack Granite. The Mack TerraPro model is
already available to customers in the waste
mangement segment. All models will be offered
with engines powered by either liquid natural
gas (LnG) or compressed natural gas (CnG).
The Volvo Group also plans to launch a proprie-
tarily developed 13-liter engine for liquid natural
gas (LnG) under the Volvo brand in the north
American market in 2014.
Full lineup of trucks earns 2014 green-
house gas certification
The uS Environmental Protection Agency and
national Highway Traffic Safety Administration
have certified all Volvo Group truck models in
the uS, both Mack and Volvo branded, in accord-
ance with 2014 fuel efficiency and greenhouse
gas regulations.
− The Volvo Group is committed to leading
the way in fuel efficiency, and to reducing the
emissions from our operations and products.
This shows that the Group is at the forefront of
technology development and that the develop-
ment benefits the entire Group and our brands,
said Dennis Slagle, Executive Vice President
Group Trucks Sales & Marketing Americas.
42

Volvo Group in North America
• Net sales: SEK 71,101 M (60,560)
• Share of net sales: 23%
• Number of employees: 16,569
• Share of Group employees: 17%
• Largest markets: USA, Canada and Mexico.
1211100908250216142118185
During the year all of the Volvo Group's truck models under the brands Volvo and Mack were certified according to the emission regulations coming into effect in 2014. On the photo is Volvo VnL 780.
During 2013, Mack will strengthen its lineup of trucks that run on natural gas. On the photo is the Mack Granite.
15%In 2012, the heavy-duty truck market increased by
Market development, heavy-duty trucks, North America, Thousands
43
Market development, construc-tion equipment, North America, Thousands
12111009081381128268137
Market shares in North America, heavy-duty trucks, %
121112117.96.810.411.4
Volvo Mack
Volvo CE is expanding its production of machines at the factory in Shippensburg, Pennsylvania.
43

A GLOBAL GROuP 2012 GROUP PERFORMANCE
Volvo strong on a weaker truck market
The South American market for heavy-duty
trucks decreased to approximately 146,000
trucks in 2012 compared to 148,000 the year
before. Brazil is the largest market by far in
South America and accounted for approximately
60% of the total market in the region. In 2012,
the Brazilian market decreased by 22% from
111,500 trucks to 87,400, impacted by the gen-
eral slowdown in the Brazilian economy during
the first nine months of 2012 and the transition
from Euro 3 emissions regulations to Euro 5.
During the fourth quarter demand picked up.
Lower financing rates for truck purchases, com-
bined with good customer profitability and the
positive outlook for economic recovery in 2013,
significantly improved demand. The total Brazil-
ian market for heavy-duty trucks is expected to
increase and reach a level of about 105,000
trucks in 2013.
The construction equipment market contin-
ued to grow during 2012, although the growth
rate slowed down during the year. In total, the
market increased by 6% in 2012 compared to
the strong 2011. Growth in the South Ameri-
can market for construction equipment is
expected to be in the range of minus 5% to
plus 5% during 2013.
The South American bus market weakened
during the year. During 2011, many operators
invested in buses with engines adapted to Euro
3 ahead of the changeover to Euro 5 on Janu-
ary 1, 2012, which entailed a price increase on
buses. Against that background, investments in
buses were fewer during 2012. In Brazil, the
market towards the end of the year was also
negatively affected by operators awaiting the
outcome of municipal elections. The total
heavy bus market in Brazil decreased by 9% to
4,400 buses (4,900). With a market share of
25% (23), Volvo is the second largest bus
brand in Brazil.
Increased market shares in
heavy-duty trucks in Brazil
Volvo reaped success in the Brazilian market, not
least with its new Euro 5 trucks. In the segment
for trucks above 16 tons in Brazil, the market
share increased to 18.2% compared with 17.1%
in 2011 and Volvo strengthened its position as
market leader. Volvo has gained market share
continuously in recent years. In 2010 the market
share was 14.8% and in 2009 it was 13.3%.
Within the segment for new Euro 5 trucks, Volvo
was the leader with 23.3% of the Brazilian mar-
ket. The Volvo Group is the market leader in
heavy-duty trucks also in Peru with the Volvo
brand and in Venezuela with the Mack brand.
Volvo Buses leading in Bus Rapid Transit
Volvo Buses is the world’s leading manufacturer
of high capacity buses and Bus Rapid Transit
(BRT) systems. During the year, deliveries started
for the contract of 688 bus chassis to Colombia’s
capital Bogotá, which was signed towards the end
of 2011. It was Volvo Buses largest contract ever
in Colombia. The contract covers conventional
buses, articulated buses and bi-articulated buses.
The new vehicles were sold for the third phase
expansion of Transmilenio in Bogotá, the conti-
nent’s most efficient and advanced BRT-system.
With its high capacity and fast transport, BRT is a
cost efficient alternative to rail-bound transport
systems.
Volvo CE expands in Brazil
Following a rapid rise in demand for SDLG
branded machines in Latin America Volvo CE is
investing uSD 10 M to start manufacturing
SDLG excavators in its Pederneiras, Brazil plant.
In January 2013, Volvo CE also decided to
consolidate its production capacity in the Amer-
icas by relocating the manufacturing of Volvo
branded backhoe loaders from Tultitlan, Mexico
to Pederneiras.
After a very strong growth in 2011, the South American market weakened during 2012, chiefly as an effect of a slowdown in the Brazilian economy. Despite the slowdown the Volvo Group had its second best year to date in terms of truck deliveries.
During the year, deliveries started of bus chassis to be used in the third phase of Bogotá's public transport system, Transmilenio.
deVelopmenT By ConTinenT
Strengthened market position in Brazil
44

Volvo Group in South America
• Net sales: SEK 29,164 M (35,142)
• Share of net sales: 10%
• Number of employees: 5,977
• Share of Group employees: 6%
• Largest markets: Brazil, Chile and Peru.
121110090814614813986117
Market development, construction equipment, South America,Thousands
12111009084442352133
Chile is one of many truck markets in South America where the Volvo Group holds a strong position.
18.2%Volvo's market share for heavy-duty trucks in Brazil in 2012.
Market development, heavy-duty trucks, South America, Thousands
Market shares, heavy-duty trucks, Brazil, %
121118.217.1
Volvo
The South American market for construction equipment is of large importance for Volvo CE, which has production in Pederneiras, Brazil.
45
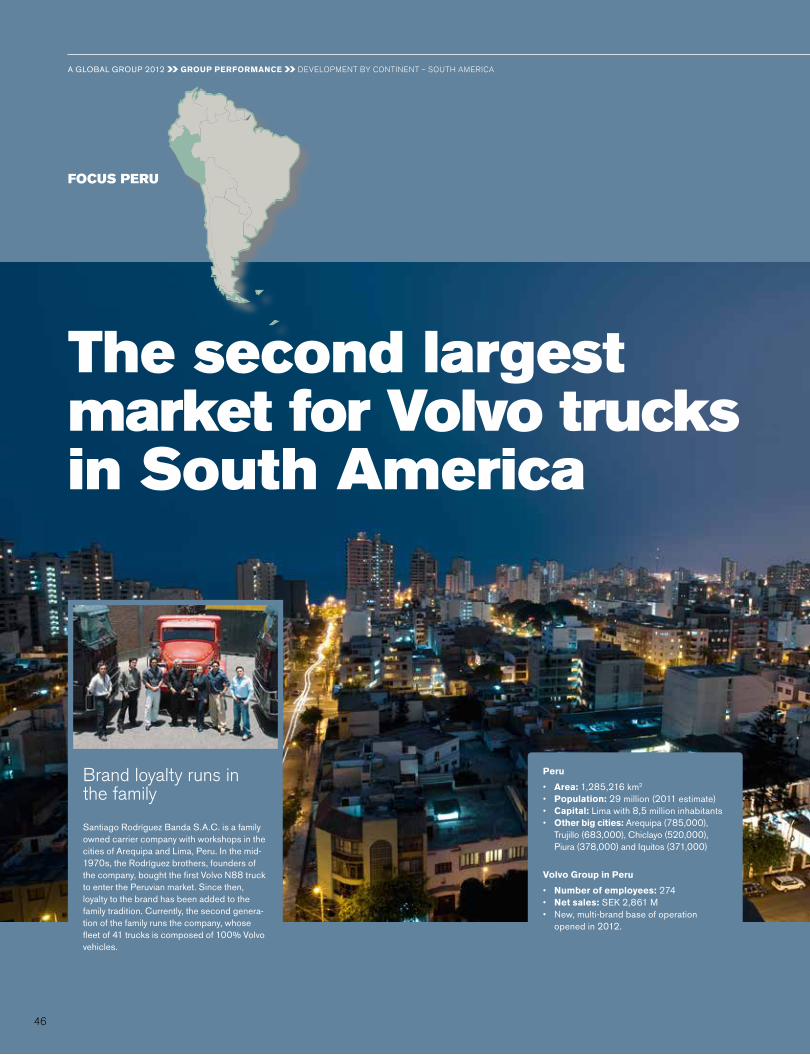
A GLOBAL GROUP 2012 GROUP PERFORMANCE DEVELOPMEnT By COnTInEnT – SOuTH AMERICA
The second largest market for Volvo trucks in south america
Peru
• Area: 1,285,216 km2 • Population: 29 million (2011 estimate) • Capital: Lima with 8,5 million inhabitants • Other big cities: Arequipa (785,000),
Trujillo (683,000), Chiclayo (520,000), Piura (378,000) and Iquitos (371,000)
Volvo Group in Peru
• Number of employees: 274 • Net sales: SEK 2,861 M • New, multibrand base of operation
opened in 2012.
Brand loyalty runs in the family
Santiago Rodríguez Banda S.A.C. is a family owned carrier company with workshops in the cities of Arequipa and Lima, Peru. In the mid1970s, the Rodríguez brothers, founders of the company, bought the first Volvo N88 truck to enter the Peruvian market. Since then, loyalty to the brand has been added to the family tradition. Currently, the second generation of the family runs the company, whose fleet of 41 trucks is composed of 100% Volvo vehicles.
foCus peru
46

− We have a very strong presence in Peru, a
strong image and a high level of customer satis-
faction, says Roger Alm, president of Latin
American sales for Volvo Group Trucks Sales
and Marketing Americas. We are market leaders
in heavy-duty trucks and the new investment will
help us support the expansion of our business in
the country. The Volvo truck fleet in Peru is
around 17,500 trucks and the fleet is expanding.
The Peruvian facility is the first multi-brand
operation of the Volvo Group in South America,
given that it will support Volvo, Mack and uD
Trucks.
Strong position
The Peruvian market for heavy-duty trucks
amounted to 9,985 vehicles during 2012, com-
pared with 8,441 trucks during 2011.
In terms of the Volvo truck brand, Peru is the
second largest market in the continent. 2011
was a record year in Peru and a total of 2,040
Volvo branded trucks were sold, a historical
record since Volvo entered the market 50 years
ago. During 2012, the market weakened some-
what in the mining segment, compensated with
increase in the long haul. During the year 1,973
Volvo trucks were sold, which gave Volvo a
market-leading position and a market share of
19.8%.
The Volvo Group has been successful in the
Peruvian market and has increased the sales
volume in the heavy-duty segment in recent
years, from 241 units in 2000 to 2,100 units in
2012.
On June 12, the Volvo Group opened its new base of operations in Peru. With a total area of 56,500 square meters, the facilities will serve as a hub for commercial and after-market activities supporting Volvo, Mack and UD Trucks, Volvo Buses, as well as Volvo Penta marine and industrial engines. SEK 130 M is being invested in the new facilities.
During 2012, 127 Mack trucks were also sold,
which gave a market share of 1.4%. Having
access to several brands means that the Volvo
Group can offer customers in many important
segments of the market the exact type of truck
they demand.
Large mining transports
Peru is one of the world’s largest producers of
copper and silver and a major supplier of gold,
zinc, lead and other minerals. The mining industry
accounts for roughly 15% of the country’s GDP.
− Our trucks are ideal to address the require-
ments of Peruvian carriers in the mining and
long distance freight segments, said Rolf Smed-
berg, who was Managing Director of Volvo Peru
from 2006 to 2012, when he retired and was
succeeded by Marcus Högberg.
Training center for mechanics and drivers
The new Volvo Group Peru facilities are located
in Lurín along the coast south of the capital,
Lima. Lurín is a popular area which is attractive
for both employees and other stakeholders. The
new venue will also feature a training center for
service technicians and drivers/operators,
equipped with the leading edge in Volvo, Mack,
uD and Volvo Penta equipment and training
infrastructure.
11 12
2.9
2.4
Volvo Group net sales in PeruSEK bn
The Volvo Group invests in Peru
47

A GLOBAL GROuP 2012 Group performanCe
Weakening markets
Asia accounted for 23% (24) of net sales during
2012. In 2000 the figure was 7%. The sharp
increase has primarily been achieved by the
acquisitions of uD Trucks of Japan (named nis-
san Diesel at the time of the acquisition), the
majority in Lingong of China and through the joint
venture VECV in India, but also through organic
growth. In the beginning of 2013, the Volvo Group
signed an agreement to purchase 45% of the
Chinese truck manufacturer Dongfeng Commer-
cial Vehicles, which will give a strong presence on
the Chinese truck market – the world’s largest.
In Japan the total market for heavy-duty trucks
in 2012 rose by 28% to 31,800 vehicles (24,800)
partly driven by government incentives as well as
the need for trucks for reconstruction work follow-
ing the earthquake and the tsunami. For 2013, the
total Japanese market is expected to increase to
about 35,000 heavy-duty trucks on the back of
expectations of higher economic activity stem-
ming from governmental stimulus activities and a
weaker currency.
In India, the total 2012 market for heavy-duty
trucks declined by 18% to 195,140 trucks (237,300).
In China the largest part of net sales stem from
construction equipment. The Chinese construc-
tion equipment market continued to weaken in
2012 and declined by 37% (+7%). In Asia outside
of China, the market for construction equipment
grew by 11% (28). For 2013 the total market
growth in China is expected to be in the range of
minus 5% to plus 5%. Asia excluding China is
expected to decline by 0% to 10%.
Volvo CE number 1 in China
With a volume totaling 248,000 wheel loaders and
excavators in 2012, the Chinese market is by far the
world’s largest, and the Volvo Group is the number
1 in these segments. During 2012 Volvo CE with
the brands Volvo and SDLG had a combined mar-
ket share of 15.0% (12.0) within wheel loaders and
excavators. That increased the distance even fur-
ther to the number two on the market.
Part of Volvo CE’s strategy is to develop prod-
ucts for growth markets under the Volvo brand.
In november 2012, the medium-heavy wheel
loader Volvo L105 was launched. It was devel-
oped specifically to meet the needs of customers
in China.
Since 1998, Volvo CE’s main facility for the
development and manufacture of excavators is
situated in Changwon, South Korea.
Sunwin, leading within large electric buses
China is a large market for electric buses. Cur-
rently there are 1,700 large (over 10 meters)
electric buses in China, an increase of 1,000
buses during 2012 alone. Here Sunwin Bus, a
Volvo Buses and SAIC Motor joint-venture, has a
market share of approximately 40%. During the
year, Sunwin Bus delivered 3,250 buses. 512 of
these were so called new energy buses, of which
413 were fully electric. That made Sunwin leading
in China and a world-leading supplier of large,
fully electric buses in 2012.
Plans to launch Value Trucks
In the next few years, the Volvo Group plans to
launch a new series of trucks in the so called
value segment, i.e the lower price segments, in
emerging market in for instance Asia, South
America and Africa. Production is being pre-
pared in Thailand and India. The Group also
intends to manufacture these trucks for the
Chinese market in the joint venture DnD.
Restructuring in Japan
In Japan, a voluntary leave program was launched
with the aim of reducing costs by 10% to improve
competitiveness. Compared with mid-2012, the
organization was reduced by 1,000 employees
and consultants as of January 1, 2013.
In the beginning of 2013, a program to
improve the total efficiency in the Japanese pro-
duction system was launched.
Success and investments in India
During the year, VECV (the joint venture together
with Eicher Motors) strengthened its position in
the Indian market. The total market for trucks and
buses above 5 tons decreased by 12% but VECV’s
deliveries remained on the same level as the previ-
ous year and the market share rose to 12.7%
(11.1); the highest so far. Within buses Eicher’s
share rose to 11.9% (9.7), for trucks 5-14 tons to
31.4% (30.5) and in the heavy-duty segment over
16 tons to 3.9% (3.1).
VECV continues to invest in India. During 2012
and the next few years, some SEK 2 billion is
invested in a new factory for medium-duty engines
that will be up and running in 2013, a new paint
shop, tooling for new products and a new facility
for bus chassis. The sum also includes research
and development related to a number of new
products to be launched the next few years. The
investments are made with funds already in VECV
and with the company’s future cashflow.
Furthermore, Volvo India invests approxi-
mately SEK 2.5 billion the next few years, among
other things in a new factory in Bangalore for the
production of the new truck series planned for
the value segment. In addition, investments are
made in the development of new products and in
a new office in Bangalore where backoffice
functions that were previously spread out over
the city are to be gathered.
Volvo Buses strong in India
Volvo Buses has a strong position in India and is
one of the most well-known brands on the market.
In total, 4,500 buses from Volvo are in operation in
India. Volvo’s city buses run in 13 cities and in the
segment for coaches, the company is represented
on all important routes. During the year a number
of new models were launched, among them the
long-distance coach Volvo 9100, which opens up
new market segments and increases the potential
for growth.
Through both acquisitions and organic growth, the Volvo Group has created a good position from which to develop further in the dynamic markets in Asia.
deVelopmenT By ConTinenT
Asia growing in importance
4848

Volvo Group in Asia
• Net sales: SEK 69,278 M (73,586)
• Share of net sales: 23%
• Number of employees: 20,222
• Share of Group employees: 20%
• Largest markets: China, Japan, India and Indonesia.
Market development, construction equipment, China, Thousands
12111009083225251935
1211100908253399371230251
In India, success continued for VECV with trucks under the brand Eicher. Currently investments are made in the development of new products and in new facilities.
Market development, heavy-duty trucks, Japan, Thousands
23%of Group sales come from Asia
Volvo CE’s new wheel loader L105 has been developed specifically for the Chinese market.
On September 19, 2012 uD Trucks was launched in South Korea. First off the mark was the Quon 6x4 truck. uD Trucks Korea plans to launch a number of new models and fully leverage the Volvo Group’s solid, nationwide network of 25 service points.
49

A GLOBAL GROUP 2012 Group performanCe DEVELOPMEnT By COnTInEnT – ASIA
Volvo Group to become world’s largest heavy-duty truck manufacturer
foCus donGfenG
Chinese truck market development Thousands
10 12080604020
200
400
600
800
1,000
1,200
Heavy-duty trucks Medium-duty trucks
50

− This is a very exciting venture that will combine
the best of two worlds, strengthening the pos-
itions of the Volvo Group and Dongfeng and
offering excellent opportunities to both parties,
says Volvo’s President and CEO Olof Persson.
Combining Dongfeng’s strong domestic pos-
ition and know-how with the Volvo Group’s tech-
nological expertise and global presence will
offer DFCV excellent potential for growth and
profitability in and outside China.
Completion within a year
Completion of the transaction is subject to certain
conditions, including the approval of relevant anti-
trust agencies and Chinese authorities. The pur-
chase consideration amounts to RMB 5.6 billion.
The ambition is to complete the transaction as
soon as possible and completion is expected to
take place within approximately 12 months from
signing. Payment of the purchase price will increase
Volvo’s net debt by approximately SEK 6 billion.
The Volvo Group is the world’s third largest
manufacturer of heavy-duty trucks with 180,000
units sold in 2011. Dongfeng was the second
largest producer of heavy-duty trucks in 2011,
with total sales of 186,000 units, of which
approximately 142,000 units were produced by
the part of the company that will be included in
DFCV.
− We are pursuing a clear strategy to achieve
our vision of becoming the world leader in sus-
tainable transport solutions, says Olof Persson.
With this agreement in place, we take a crucial
In January of 2013, AB Volvo signed an agreement with the Chinese vehicle manufacturer Dongfeng Motor Group Company Limited (DFG) to acquire 45% of a new subsidiary of DFG, Dongfeng Commercial Vehicles (DFCV), which will include the major part of DFG’s medium- and heavy-duty com-mercial vehicles business. At completion of the transaction, the Volvo Group will become the world’s largest manufacturer of heavy-duty trucks.
step toward reaching a number of our key stra-
tegic objectives such as size and growth in Asia.
The world’s largest truck market
During 2012, the Chinese market for heavy-duty
trucks totaled approximately 636,000 vehicles,
while the corresponding figure for the medium-
duty market was 290,000 vehicles. DFCV occu-
pied a leading position in China in both the
heavy- and medium-duty segments, with sales
of 102,000 heavy-duty trucks and 45,500
medium-duty trucks, corresponding to market
shares of 16.1% and 15.7%, respectively.
The partnership with DFG not only provides
the Volvo Group with ownership in the largest
heavy-duty and medium-duty truck manufacturer
in China, but also offers excellent opportunities to
achieve economies of scale in terms of sourcing,
development and production for the Group’s
truck operations. There are a number of areas in
which cooperation is planned between DFCV and
the Volvo Group, such as engines and powertrain
components, product platforms and purchasing.
− In Dongfeng, we have a partner that we
know well, having worked together for several
years, and with a management team and a prod-
uct range that we really appreciate, says Olof
Persson, Volvo President and CEO. Joining
forces will provide clear benefits for both parties
and the right conditions to develop DFCV into a
competitive and successful international truck
manufacturer with healthy profitability.
Strategic alliance with Chinese company Dongfeng Motor Group
Volvo Group to become world’s largest heavy-duty truck manufacturer
China, 46%India, 12%EU29, 13%North America, 11%South America, 8%Russia, 4%Other, 6%
881,000 units in China
World’s largest truck markets above 14 tons in 2011
51

Focus AFricA
Mack enjoys a special position in Nigeria.
A GLOBAL GROUP 2012 Group perFormAnce
A continent with large opportunities
Volvo Construction Equipment (Volvo CE) is con-fronting a shortage of technicians in Sub-Saharan Africa with a Sida (Swedish International Develop-ment Cooperation Agency) project to help support and modernize technical schools in Africa. Volvo CE will take a hands-on approach with a project at Selam Technical and Vocational College in Addis Ababa, Ethiopia, providing new equipment, training materials, teacher training, ongoing curriculum development and apprenticeship opportunities for students.
A lack of well-trained machine technicians is a serious problem in much of Africa and has meant that equipment dealers operating in countries like Ethiopia are often forced to hire expatriate techni-cians, rather than invest in local workers who would remain in the country permanently – and keep more money in the local economy. Developing a technical program will benefit OEMs like Volvo CE by provid-ing a larger pool of skilled workers. Though students and apprentices won’t be under any obligation to
work for Volvo CE, the project will provide Volvo CE a very powerful way of building relationships with poten-tial employees.
The project, which will train about 30 students a year, is a first for Volvo CE in Africa, but a similar Volvo program that trains homeless teenagers in Brazil has had a great deal of success. If the new program works well, the company hopes to expand into other African countries in the future.
Volvo CE supports training of technicians in Africa
52

Growth boom
There are a number of explanations for the
upswing in recent years. The conflicts have come
to an end in many countries, and the excessive
lending of the 1980s and 1990s has now been
rectified in a growing number of African states.
The external factors include a more accommo-
dating international climate, with different pro-
Africa initiatives, and the appearance of new eco-
nomic superpowers, China and India in particular.
The emerging countries are playing a particularly
critical role in infrastructure financing that is
essential in order to harness Africa’s potential.
This has helped to boost the demand for African
raw materials.
For a number of African countries, the world’s
hunger for oil, gas, metals and precious stones
has resulted in a jackpot. After 27 years of war,
Angola began its journey from poverty thanks to
oil exports. Between 2001 and 2010, the coun-
try’s GDP grew by an average of 11.3% a year.
This gave Angola a very close victory over China,
in the rapid expansion league. In recent years,
African countries have experienced success in
turning their export revenue into investments in
the future in the form of infrastructure and more
diversified trade and industry. This often involves
contracts with foreign companies that are given
access to natural resources in return for con-
structing roads and railways, schools, hospitals
or oil refineries.
Not everything is, however, linked to black oil
and sparkling diamonds. The internet and mobile
telephony have given the African farmer or busi-
nessman new opportunities to find information
and do business. Industries such as tourism,
banking and telecommunications have also
expanded more rapidly than those based on raw
materials. Taken together, all these factors have
created a growing middle class which is con-
suming and drives growth further.
Enormous differences
There is no doubt that double-digit growth figures
are good news. However, this growth has taken
place from very low levels and it is distributed une-
qually. From a business angle, there is no point in
talking about Africa as a cohesive market.
− If you are going to generalize, you can talk
about three areas. North Africa has gas and oil.
Provided that the political climate is stable in the
future, growth is going to continue in countries
such as Algeria and Libya. Unfortunately, Cen-
tral Africa still has a long way to go. The poverty
is still enormous. The largest potential for
growth can be found in southern Africa: from
Angola down to Namibia, Botswana and South
Africa and then up again to Mozambique, Tanza-
nia and Kenya, says Anders Petersson, Manager
Transport Industry Analysis at Group Trucks
Sales & Marketing EMEA, in response to the dif-
ficult question: Can you describe in simple terms
how things look in Africa?
He is, however, quick to stress that anyone look-
ing to sell a product in Africa should not simply
study the growth figures. It is also necessary to
11 12
12.211.4
Volvo Group sales in AfricaSEK bn
A new Africa
A continent with large opportunities
The roar from the Lion Economies in Africa is becoming ever louder. In the Volvo Group, many people are listening. After several decades characterized by war, weak economic growth and a decline in productivity, developments gathered speed at the beginning of this century.
53
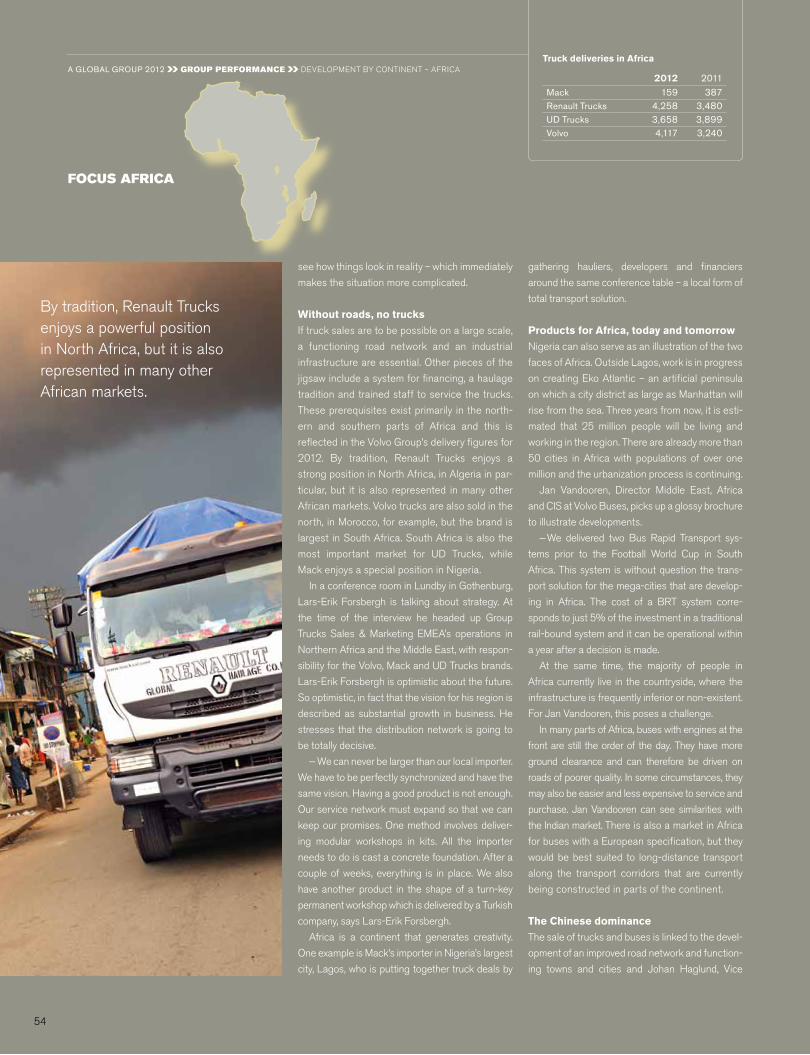
see how things look in reality – which immediately
makes the situation more complicated.
Without roads, no trucks
If truck sales are to be possible on a large scale,
a functioning road network and an industrial
infrastructure are essential. Other pieces of the
jigsaw include a system for financing, a haulage
tradition and trained staff to service the trucks.
These prerequisites exist primarily in the north-
ern and southern parts of Africa and this is
reflected in the Volvo Group’s delivery figures for
2012. By tradition, Renault Trucks enjoys a
strong position in north Africa, in Algeria in par-
ticular, but it is also represented in many other
African markets. Volvo trucks are also sold in the
north, in Morocco, for example, but the brand is
largest in South Africa. South Africa is also the
most important market for uD Trucks, while
Mack enjoys a special position in nigeria.
In a conference room in Lundby in Gothenburg,
Lars-Erik Forsbergh is talking about strategy. At
the time of the interview he headed up Group
Trucks Sales & Marketing EMEA’s operations in
northern Africa and the Middle East, with respon-
sibility for the Volvo, Mack and uD Trucks brands.
Lars-Erik Forsbergh is optimistic about the future.
So optimistic, in fact that the vision for his region is
described as substantial growth in business. He
stresses that the distribution network is going to
be totally decisive.
− We can never be larger than our local importer.
We have to be perfectly synchronized and have the
same vision. Having a good product is not enough.
Our service network must expand so that we can
keep our promises. One method involves deliver-
ing modular workshops in kits. All the importer
needs to do is cast a concrete foundation. After a
couple of weeks, everything is in place. We also
have another product in the shape of a turn-key
permanent workshop which is delivered by a Turkish
company, says Lars-Erik Forsbergh.
Africa is a continent that generates creativity.
One example is Mack’s importer in nigeria’s largest
city, Lagos, who is putting together truck deals by
gathering hauliers, developers and financiers
around the same conference table – a local form of
total transport solution.
Products for Africa, today and tomorrow
nigeria can also serve as an illustration of the two
faces of Africa. Outside Lagos, work is in progress
on creating Eko Atlantic – an artificial peninsula
on which a city district as large as Manhattan will
rise from the sea. Three years from now, it is esti-
mated that 25 million people will be living and
working in the region. There are already more than
50 cities in Africa with populations of over one
million and the urbanization process is continuing.
Jan Vandooren, Director Middle East, Africa
and CIS at Volvo Buses, picks up a glossy brochure
to illustrate developments.
− We delivered two Bus Rapid Transport sys-
tems prior to the Football World Cup in South
Africa. This system is without question the trans-
port solution for the mega-cities that are develop-
ing in Africa. The cost of a BRT system corre-
sponds to just 5% of the investment in a traditional
rail-bound system and it can be operational within
a year after a decision is made.
At the same time, the majority of people in
Africa currently live in the countryside, where the
infrastructure is frequently inferior or non-existent.
For Jan Vandooren, this poses a challenge.
In many parts of Africa, buses with engines at the
front are still the order of the day. They have more
ground clearance and can therefore be driven on
roads of poorer quality. In some circumstances, they
may also be easier and less expensive to service and
purchase. Jan Vandooren can see similarities with
the Indian market. There is also a market in Africa
for buses with a European specification, but they
would be best suited to long-distance transport
along the transport corridors that are currently
being constructed in parts of the continent.
The Chinese dominance
The sale of trucks and buses is linked to the devel-
opment of an improved road network and function-
ing towns and cities and Johan Haglund, Vice
Truck deliveries in Africa
2012 2011
Mack 159 387Renault Trucks 4,258 3,480UD Trucks 3,658 3,899Volvo 4,117 3,240
foCus afriCa
A GLOBAL GROUP 2012 Group performanCe DEVELOPMEnT By COnTInEnT – AFRICA
By tradition, Renault Trucks enjoys a powerful position in north Africa, but it is also represented in many other African markets.
54

President EMEA Hub South at Volvo CE, feels that
this offers huge business potential. At the same
time, the real-life situation differs to some degree.
− The focal point for Volvo CE in Africa is the
mining industry. This is where we are largest and
where we are making the most money. There is
no customer in this industry that dares to risk
having machines that are out of action. If you
purchase our machines, you can keep a mine
operating. Chinese companies are capturing a
large number of projects, but they, too, are pur-
chasing their critical equipment from western
companies. At the same time, Chinese excava-
tors have recently started appearing.
In spite of the competition, Johan Haglund
has some winning cards up his sleeve.
− After all, we own a majority of Shandong
Lingong (SDLG). We are Chinese, so to speak.
Historically, Chinese companies have enjoyed a
strong position within wheel loaders. What we
have done now is to establish a network of SDLG
dealers. We also have know-how relating to distri-
bution in Africa, which our Chinese competitors
lack. Taken together, this should be a good argu-
ment for us to sell SDLG in China, to Chinese
companies that are operating in Africa.
Like Jan Vandooren, Johan Haglund is eager
to stress the need for products that are suitable
for the African market. Products of high quality
but with fewer integrated features to enhance
driver comfort, for example, for which customers
in Africa are not prepared to pay.
When Africa is discussed with people in differ-
ent parts of the Volvo Group, Volvo CE is always
mentioned with respect. They have a long history
in Africa, are well positioned and close to their
customers in geographical terms. This is some-
thing of which Hannes norrgren, Director Mar-
keting & Sales at Volvo Penta with responsibility
for Africa, is keen to take even greater advantage.
− Partnership with Volvo CE is important and it
is often a good match into the bargain. However,
our only chance of quickly increasing our coverage
is through distributors that have the critical mass
to re-invest in their operations, he says.
Engines for gensets constitute Volvo Penta’s
largest business sector in Africa. The manufac-
turing industry is expanding more rapidly than
the infrastructure for electricity distribution.
− A few years ago, our sales of engines for
locally manufactured gensets in South Africa rose
from 50 to 2,000 in the space of one year when
the country found itself in an energy crisis. We are
now relatively stable at approximately 500 engines
a year. There are no alternatives to the diesel
engine when it comes to efficiency and flexibility.
In overall terms, he describes Africa as a pure
aftersales market. It is a question of offering
service and parts in order to increase the num-
ber of engines in imported machines, because
very few machines are actually built in Africa.
Hannes norrgren therefore faces the same
dilemma as so many others: the potential in
Africa is huge, but we are still not in a position to
take advantage of it.
A joint road ahead
Representatives from the different business
units in the Volvo Group meet regularly at differ-
ent levels to chart their common way forward in
Africa. Coordination is key.
− We already have a strong position in Africa,
but, if we adopt an even more coordinated
approach, we can obtain both improved market
coverage and more effective distribution, as
Peter Karlsten, head of Group Trucks Sales &
Marketing EMEA and a member of the Group’s
executive management team, puts it.
Currently, the truck operations are working
together with a large number of importers in
Africa. However, there are only six in which two
brands share the same importer.
− So there is enormous potential to offer the
same importer much more business with more
brands aimed at different customer segments. This
gives the importer the opportunity to invest more in
his business relationship with us, in the form of an
improved service network, for example. Local con-
ditions naturally influence the best way of working,
says Peter Karlsten and he goes on to underline
Volvo Group in Africa
• Number of employees: 1,120 • Production: Durban and Johannesburg. • Net sales: SEK 12.168 M (11.371), 4% of
Group sales • The goal is to increase the truck operation’s
net sales in Africa by 25% by 2015.
Africa
• Area: 30,244,050 km2 (the second largest continent in the world)
• Population: roughly 1 billion in 55 countries.• Large countries: Nigeria with 152 million
inhabitants, Egypt (80), Ethiopia (77), Democratic Republic of the Congo (66) and South Africa (44).
The focal point for Volvo CE in Africa is the mining industry. This is where they are largest and it is a profitable segment. There is no customer in this industry that dares to risk having machines that are out of action.
the fact that the Group is currently reviewing the
whole of its strategy for all its truck brands. This is
going to clarify how the different brands and prod-
ucts are going to target different customer seg-
ments. This could also include introducing trucks
from our joint venture with Eicher Motors in India in
the African market.
Engines for dieselpowered gensets constitute Volvo Penta’s largest business sector in Africa. Industry is expanding more rapidly than the infrastructure for electricity distribution.
55
BOARD OF DIRECTORS’ REPORT 2012 Group performanCe
siGnifiCanT eVenTs
During 2012
The divestment of Volvo Aero, increased ownership in Deutz and the launch of the new Volvo FH truck series were some of the important events in 2012.
Annual General Meeting of AB Volvo
The Annual General Meeting of AB Volvo held on
April 4, 2012 approved the Board of Directors’
motion that a dividend of SEK 3.00 per share be
paid to the company’s shareholders.
Peter Bijur, Jean-Baptiste Duzan, Hanne de
Mora, Anders nyrén, Olof Persson, Ravi Venkatesan,
Lars Westerberg and ying yeh were reelected as
members of the AB Volvo Board. In addition,
Carl-Henric Svanberg was elected member of the
Board and Board Chairman, replacing Louis
Schweitzer who had declined reelection.
Carl-Olof By, representing AB Industrivärden,
Jean-Baptiste Duzan, representing Renault s.a.s,
Lars Förberg, representing Violet Partners LP,
Håkan Sandberg, representing Svenska Handels-
banken, SHB Pension Fund, SHB Employee
Fund, SHB Pensionskassa and Oktogonen and
the Chairman of the Board were elected members
of the Election Committee.
AB Volvo signs memorandum
of understanding with Deutz
On April 5 it was announced that AB Volvo had
signed a non-binding memorandum of under-
standing with Deutz AG with the intention to
explore the potential to extend the long-term
cooperation with a joint development of the next
generation of medium-duty engines for off-road
applications.
The memorandum of understanding also aims
at analyzing the conditions for establishing a
Deutz majority-owned joint-venture company in
China for the production of medium-duty engines
for off-road applications. The production com-
pany is intended to provide support for the Volvo
Group’s anticipated growth in off-road applica-
tions in Asia. Any implementation requires both
companies to agree on the final terms and con-
ditions in a binding contract.
Unfavorable court ruling in the U.S.
pertaining to Volvo Penta engines
Volvo Powertrain Corporation and the u.S. Envi-
ronmental Protection Agency are in a dispute per-
taining to emission compliance of 8,354 model
year 2005 Volvo Penta engines under a 1999
Consent Decree entered between the parties. On
April 13, 2012, the u.S. District Court for the Dis-
trict of Columbia issued an order directing Volvo
to pay a total of uSD 72 M in penalties and inter-
est. The decision has been appealed.
AB Volvo acquires shares in Deutz AG
On June 13 AB Volvo announced that it had
signed an agreement under which the company
was offered the opportunity to increase its share-
holding in Deutz AG from 6.7% to just over 25%
by acquiring a total of 22,117,693 shares from
Same Deutz-Fahr Group at a price of EuR 5.88
per share, EuR 130 M in total. The transaction
was completed in September and made AB
Volvo the largest shareholder in Deutz AG, which
since many years is a strategic partner within
medium- duty engines.
AB Volvo divests Volvo Aero to British
GKN for SEK 6.9 billion
On July 5 it was announced that AB Volvo divests
the Group’s subsidiary Volvo Aero to the British
engineering company GKn for an enterprise
value of SEK 6.9 billion. The transaction was com-
pleted on October 1, 2012. The transaction gener-
ated a positive effect on the Group’s operating
income of SEK 568 M of which SEK 254 M in
the fourth quarter. The divestment reduced the
Group’s financial net debt by SEK 5.5 billion.
New Volvo engine for Euro 6
On July 5 Volvo Trucks presented an engine tai-
lored for the Euro 6 environmental standards.
nitrogen oxide emissions will drop by 77% and
particulate emissions will be halved from already
low levels. First off the mark is Volvo’s D13 460
horsepower engine, which powers more than
one-third of all Volvo trucks.
Renault Trucks Defense acquires French
manufacturer Panhard
On July 26 it was announced that Renault Trucks
Defense, which is included in the Volvo Group’s
Governmental Sales business area, acquires the
French company Panhard, which specializes in
manufacturing light transport vehicles adapted for
defense operations. In 2011, Panhard reported
sales of EuR 81 M and operating profit amounted
to EuR 9.4 M. The transaction was finalized in
October 2012.
New Volvo FH launched
On September 5, Volvo introduced its new Volvo
FH series. The new Volvo FH is pushing the
envelope for what a premium truck can offer. The
Volvo FH is a truck built with the driver in mind and
with the focus on improving the haulage firm’s
profitability.
Volvo Group invests in Russia
On September 13, the Volvo Group announced
that it will invest SEK 783 M in a new facility for
the production of cabs at the plant in Kaluga,
Russia. The facility, which is expected to become
operational in 2014, will manufacture cabs for the
Volvo and Renault Trucks brands with a total
annual capacity of 15,000 cabs.
Volvo Group announced new truck strat-
egy to achieve profitability improvement
The new strategy, which is an important step for
the Group towards achieving the objective to
improve the operating margin by 3 percentage
56

points, was presented in detail at the Capital Mar-
ket Day on September 25.
Volvo Buses to consolidate the manufac-
ture of complete buses in Europe
On October 3, Volvo Buses announced plans to
concentrate its European production of complete
buses to the main plant in Wroclaw, Poland.
Production at the plant in Säffle, Sweden, will be
terminated at end June 2013.
New organization for the truck dealer
networks in Europe, the Middle East
and Africa
On October 10, the Volvo Group announced that it
as of January 1, 2013 introduces a new organiza-
tion for its truck dealer networks in Europe, the
Middle East and Africa (EMEA). The reorganiza-
tion aims to capitalize more effectively on oppor-
tunities for the Group’s brands and products in
line with the new truck strategy.
Full lineup of Volvo Group trucks in the US
earns 2014 greenhouse gas certification
On December 12, 2012 the Volvo Group
announced that the uS Environmental Protection
Agency (EPA) and national Highway Traffic
Safety Administration (nHTSA) had certified all
Volvo Group truck models in the uS, both Mack
and Volvo branded, in accordance with 2014 fuel
efficiency and greenhouse gas regulations.
Renault s.a.s. divests entire holding
in AB Volvo
On December 13, 2012, AB Volvo received a
request for the conversion of 110,048,945
Series A shares to Series B shares. Furthermore,
AB Volvo’s largest shareholder, Renault s.a.s.,
announced that the company had divested all of
its shares in AB Volvo through the sales of
138,604,945 Series A shares on the stock market.
In connection with Renault’s divestment, Industri-
värden increased its holding and at year-end was
the largest owner with 6.5% of the outstanding
number of shares (19.5% of the votes). norges
Bank Investment Management also increased its
holding and at year-end was the second largest
owner based on capital with 4.9% of the out-
standing number of shares (5.1% of the votes).
Consolidation of the Volvo Group indus-
trial operation in Japan
On January 11, 2013 the Volvo Group announced
that it had decided to consolidate its industrial
operation in Japan in order to improve the overall
efficiency. In May 2013 the Ota remanufacturing
plant will be closed and the operation moved to
Ageo, the main plant in Japan. The project also
includes cleaning of the land, demolishing of old
and outdated buildings as well as moving or
phasing out equipment for old products. In total,
costs corresponding to SEK 280 M related to
these activities were recorded in the fourth quarter
of 2012, affecting the truck segment.
Events after balance sheet date
Strategic alliance with Chinese company
Dongfeng Motor Group
On January 26, 2013 AB Volvo announced that
it had signed an agreement with the Chinese
vehicle manufacturer Dongfeng Motor Group
Company Limited (DFG) to acquire 45% of a
new subsidiary of DFG, Dongfeng Commercial
Vehicles (DFCV), which will include the major
part of DFG’s medium- and heavy-duty commer-
cial vehicles business. At completion of the
transaction, the Volvo Group will become the
world’s largest manufacturer of heavy-duty trucks.
Completion of the transaction is subject to certain
conditions, including the approval of relevant
Volvo has issued a corporate governance report which is separate from the annual report and which is found on pages 74–88.
anti-trust agencies and Chinese authorities. The
purchase consideration amounts to RMB 5.6
billion. The ambition is to complete the transaction
as soon as possible and completion is expected
to take place within approximately 12 months
from signing.
Detailed information about the events is available
at www.volvogroup.com
57
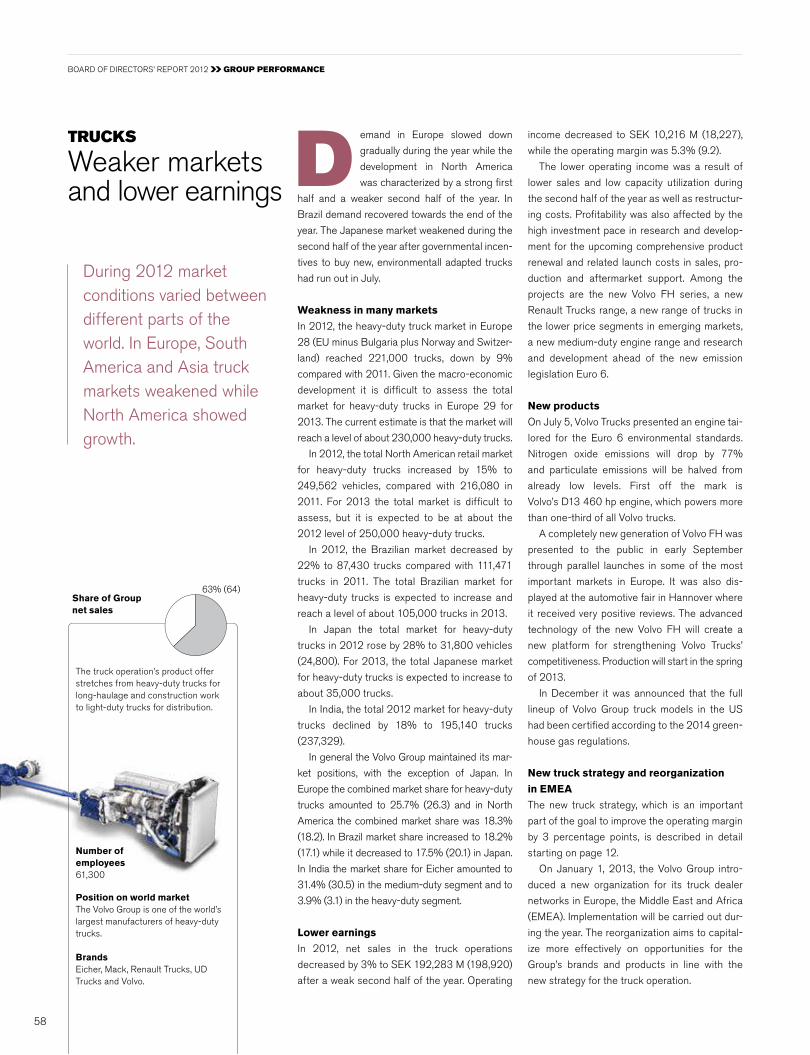
BOARD OF DIRECTORS’ REPORT 2012 Group performanCe
TruCKs
Weaker markets and lower earnings
emand in Europe slowed down
gradually during the year while the
development in north America
was characterized by a strong first
half and a weaker second half of the year. In
Brazil demand recovered towards the end of the
year. The Japanese market weakened during the
second half of the year after governmental incen-
tives to buy new, environmentall adapted trucks
had run out in July.
Weakness in many markets
In 2012, the heavy-duty truck market in Europe
28 (Eu minus Bulgaria plus norway and Switzer-
land) reached 221,000 trucks, down by 9%
compared with 2011. Given the macro-economic
development it is difficult to assess the total
market for heavy-duty trucks in Europe 29 for
2013. The current estimate is that the market will
reach a level of about 230,000 heavy-duty trucks.
In 2012, the total north American retail market
for heavy-duty trucks increased by 15% to
249,562 vehicles, compared with 216,080 in
2011. For 2013 the total market is difficult to
assess, but it is expected to be at about the
2012 level of 250,000 heavy-duty trucks.
In 2012, the Brazilian market decreased by
22% to 87,430 trucks compared with 111,471
trucks in 2011. The total Brazilian market for
heavy-duty trucks is expected to increase and
reach a level of about 105,000 trucks in 2013.
In Japan the total market for heavy-duty
trucks in 2012 rose by 28% to 31,800 vehicles
(24,800). For 2013, the total Japanese market
for heavy-duty trucks is expected to increase to
about 35,000 trucks.
In India, the total 2012 market for heavy-duty
trucks declined by 18% to 195,140 trucks
(237,329).
In general the Volvo Group maintained its mar-
ket positions, with the exception of Japan. In
Europe the combined market share for heavy-duty
trucks amounted to 25.7% (26.3) and in north
America the combined market share was 18.3%
(18.2). In Brazil market share increased to 18.2%
(17.1) while it decreased to 17.5% (20.1) in Japan.
In India the market share for Eicher amounted to
31.4% (30.5) in the medium-duty segment and to
3.9% (3.1) in the heavy-duty segment.
Lower earnings
In 2012, net sales in the truck operations
decreased by 3% to SEK 192,283 M (198,920)
after a weak second half of the year. Operating
income decreased to SEK 10,216 M (18,227),
while the operating margin was 5.3% (9.2).
The lower operating income was a result of
lower sales and low capacity utilization during
the second half of the year as well as restructur-
ing costs. Profitability was also affected by the
high investment pace in research and develop-
ment for the upcoming comprehensive product
renewal and related launch costs in sales, pro-
duction and aftermarket support. Among the
projects are the new Volvo FH series, a new
Renault Trucks range, a new range of trucks in
the lower price segments in emerging markets,
a new medium-duty engine range and research
and development ahead of the new emission
legislation Euro 6.
New products
On July 5, Volvo Trucks presented an engine tai-
lored for the Euro 6 environmental standards.
nitrogen oxide emissions will drop by 77%
and particulate emissions will be halved from
already low levels. First off the mark is
Volvo’s D13 460 hp engine, which powers more
than one-third of all Volvo trucks.
A completely new generation of Volvo FH was
presented to the public in early September
through parallel launches in some of the most
important markets in Europe. It was also dis-
played at the automotive fair in Hannover where
it received very positive reviews. The advanced
technology of the new Volvo FH will create a
new platform for strengthening Volvo Trucks’
competitiveness. Production will start in the spring
of 2013.
In December it was announced that the full
lineup of Volvo Group truck models in the uS
had been certified according to the 2014 green-
house gas regulations.
New truck strategy and reorganization
in EMEA
The new truck strategy, which is an important
part of the goal to improve the operating margin
by 3 percentage points, is described in detail
starting on page 12.
On January 1, 2013, the Volvo Group intro-
duced a new organization for its truck dealer
networks in Europe, the Middle East and Africa
(EMEA). Implementation will be carried out dur-
ing the year. The reorganization aims to capital-
ize more effectively on opportunities for the
Group’s brands and products in line with the
new strategy for the truck operation.
The truck operation’s product offer stretches from heavy-duty trucks for long-haulage and construction work to light-duty trucks for distribution.
Number of employees61,300
Position on world market The Volvo Group is one of the world’s largest manufacturers of heavy-duty trucks.
BrandsEicher, Mack, Renault Trucks, uD Trucks and Volvo.
d
Share of Group net sales
63% (64)
During 2012 market conditions varied between different parts of the world. In Europe, South America and Asia truck markets weakened while north America showed growth.
58

Net salesSEK bn
1211100908
192.3
198.9 192.3167.3138.9203.6
Operating income (loss) and operating margin
SEK M%
10,216
1118,227
9.2
1210,216
5.3
1010,112
6.0
09(10,805)
(7.8)
08 12,167
6.0
Net sales by market
SEK M 2012 2011Europe 76,365 83,451North America 42,650 37,042South America 21,172 26,847Asia 36,531 37,840Other markets 15,565 13,741Total 192,283 198,920
Deliveries by market
Number of trucks 2012 2011Europe 84,355 95.113North America 47,806 42.613South America 23,443 29.274Asia 51,514 56.165Other markets 16,899 15.226Total 224,017 238.391
1211121110.3 10.115.616.0
Volvo Renault Trucks
Market shares in Europe, heavy-duty trucks
121112116.8 7.910.411.4
Volvo Mack
Market shares in North America, heavy-duty trucks
121117.520.1
UD Trucks
Market shares in Japan, heavy-duty trucks
Volvo VMThe Volvo VM is a truck developed spe-cifically for the South American market, where it is used for regional transports and city distribution.
Continued product renewal
59

BOARD OF DIRECTORS’ REPORT 2012 Group performanCe
Buses
Weak market development and lower volumes
olvo Buses is one of the world’s
leading manufacturers of buses
and bus chassis. The product pro-
gram comprises complete trans-
port solutions, city buses, intercity buses and
coaches, as well as services in financing, vehicle
service, vehicle diagnostics and traffic informa-
tion. Volvo Buses has sales in 85 countries and
one of the industry’s strongest service networks,
with more than 1,500 dealerships and workshops
worldwide. Production facilities are found in
Europe, north America, South America and Asia.
Lower fuel consumption and emissions
During 2012, Volvo Buses presented a number
of new products, including a program of city
buses, intercity buses and coaches for the com-
ing European emission requirements Euro 6.
The new buses generate significantly lower
emissions of nitrogen oxide and particles, while
improving both fuel economy and climate impact,
compared with current vehicles. Two of the three
new engines included in the program can be
driven on bio-diesel. Sales will commence during
the second half of 2013.
In India, the product program was increased
with three new models, including the Volvo 9100
coach, which will provide Volvo Buses with good
opportunities to expand in a new, key seg ment. At
the same time, the expansion of the company’s
industrial capacity in India was intensified.
Increased sales of hybrid buses
Volvo Buses is world-leading in hybrid buses
and has sold a total of nearly 1,000 vehicles to
customers in 20 countries. In 2012, hybrid
buses were sold to cities including Curitiba,
Hamburg and Gothenburg. The most recent
model, the Volvo 7900 Hybrid, has up to 39%
lower fuel consumption and climate impact than
corresponding diesel buses. During the year, a
Volvo 7900 Hybrid articulated bus was intro-
duced, which meant an important strengthening
of the hybrid program. From 2014, all low-floor
buses sold by Volvo Buses in Europe will be
hybrid buses. To satisfy the increasing global
demand, Volvo Buses has also started the manu-
facturing of hybrid bus chassis in Brazil. The first
30 Brazilian-manufactured hybrid buses were
put in service in Curitiba in September 2012.
In parallel, the business area continued to
develop the next generation of hybrid buses – so
called plug-in hybrids. The technology means
that the bus batteries can be charged directly
from the electricity mains and that the bus can
operate silently and exhaust-free longer distances
on electricity alone. Diesel consumption and cli-
mate impact emission can be reduced by up to
75%, compared with comparable diesel-driven
buses. Field tests using three plug-in hybrids
will commence in Gothenburg in spring 2013.
In China, Volvo Buses is a driving force in
electro-mobility, partly through the partnership
in the bus manufacturer Sunwin Bus, one of the
world’s largest manufacturers of fully electric
buses, partly through a newly started company
for hybrid and electrical drive lines, Shanghai
Green Bus Drive System. Sunwin Bus delivered
413 fully electric buses during the year, which
made the company the leader in China and a
world-leading supplier of fully electric buses
over 10 meters in 2012.
Positive reception for new telematic system
Volvo Buses’ new telematic system, which was
presented in 2011, has been positively received
in the market and is now being used in over 20
countries. Volvo Bus Telematics provides bus
operators with better control of the vehicle’s fuel
consumption and the opportunity to adapt main-
tenance to exact requirements. Measures that
can generate fuel savings of approximately 10%.
Volvo’s hybrid buses are now equipped with the
Volvo Bus Telematics hardware.
Fewer deliveries and lower order intake
With the exception of China and India, the global
bus market declined in 2012. Volvo Buses deliv-
ered 10,678 buses and bus chassis (12,786). At
the same time, Volvo Buses’ market share in
Europe rose to 13%, thanks to sales of hybrid
buses. Markets shares were also strengthened in
north America and South America. The total order
intake was also lower for 2012 than in the preced-
ing year. However, several important orders were
signed during the year, for example, 460 front-
engine buses were sold to Belo Horizonte, Brazil
– a strategic breakthrough in a new segment – and
475 nova hybrid buses to Quebec, Canada.
Due to lower volumes and higher pressure on
prices, Volvo Buses will concentrate manufac-
turing of complete buses in Europe to the com-
pany’s production facilities in Wroclaw, Poland.
This means that manufacturing at Volvo Buses
in Säffle, Sweden, will discontinue mid-2013.
Sales and earnings fell
During 2012, net sales fell to SEK 20,295 M
(21,823). Operating income declined to SEK 51
M (1,114) and the operating margin decreased to
0.3% (5.1) due to low volumes, a negative market
mix and low capacity utilization.
Buses offers complete buses and chassis within city buses, intercity buses and coaches as well as services within vehicle service, vehicle diagnos-tics and traffic information.
Number of employees7,500
Position on world marketThe business area is one of the world’s largest producers of buses.
BrandsVolvo, Prevost, nova and Sunwin.
VThe global market for buses declined in 2012. Sales for Volvo Buses fell and profitability declined.
Share of Group net sales
7% (7)
60

Success for Volvo Hybrids Volvo Buses hybrids are successful around the world thanks to the combi-nation of environmental performance, drivability, fuel economy and reliability. On the photo is one of Volvo’s hybrid buses in operation in Mexico City.
The right wayin city traffic
Net sales by market
SEK M 2012 2011Europe 6,200 6,631north America 6,675 7,532South America 2,794 2,715Asia 2,853 2,953Other markets 1,774 1,992Total 20,295 21,823
Deliveries by market
number of buses 2012 2011Europe 2,491 2,695north America 1,826 3,014South America 2,560 2,620Asia 2,945 3,417Other markets 856 1,040Total 10,678 12,786
Net salesSEK bn
1221.8 20.311
20.510
18.509
17.308
20.3
Operating income (loss) and operating margin
SEK M%
111,114
5.1
12510.3
107803.8
(350)(1.9)
09 (76)(0.4)
08
51
61

BOARD OF DIRECTORS’ REPORT 2012 Group performanCe
ConsTruCTion eQuipmenT
Continued investments in growth
ollowing a comprehensive product
renewal program that has seen over
100 new products launched in the
last two years, Volvo CE offers a
modern fleet of excavators, haulers, wheel load-
ers and a range of smaller equipment such as
backhoe and skidsteer loaders. The road machin-
ery range includes graders, compactors and pav-
ers. Its Chinese-built range of SDLG branded
products includes excavators and wheel loaders.
Volvo CE equipment is distributed to custom-
ers through a global network of independent and
Volvo-owned dealerships. SDLG branded prod-
ucts are distributed through separate sales chan-
nels. The offering also includes services such
as customer support agreements, attachments,
financing, leasing and used equipment sales.
Market turbulence
Measured in units sold, the total European market
for heavy, compact and road machinery equipment
shrank by 4% compared to 2011, while Asia
(excluding China) increased by 11% and demand
in China itself fell by a significant 37%. Bucking
the trend however were north and South America,
who saw market growth during 2012 of 23% and
6% respectively.
Lower economic activity and the uncertainty
about the future impacted customers’ willingness
to invest in new equipment during 2012. As a
consequence Volvo CE reacted quickly to the
slowing global market, cutting production in its
facilities and reducing inventories throughout the
supply chain. During the year the company sold
78,500 machines, compared with 84,000 in 2011.
In 2012, net sales were flat at SEK 63,558 M
(63,500). Operating income decreased to SEK
5,773 M (6,812) and operating margin was 9.1%
(10.7). After a strong first half of the year, sales
and earnings during the second half were nega-
tively impacted by much lower volumes and a
negative product mix as well as lower activity in
the global mining industry affecting sales of
larger and more profitable products. Low cap-
acity utilization also affected profitability.
Investing in new products
At the Intermat exhibition in France in April,
Volvo CE launched 60 new products. These
machines, in addition to a further 55 new models
introduced in 2011, represents the most funda-
mental overhaul of the company’s product port-
folio ever. On show in Paris were the new D-Series
excavators in the 13 to 25 ton classes, two short
swing excavators and four new models of EW
wheeled excavators in the 14 to 21 ton classes.
The new G-Series wheel loaders also fea-
tured prominently as did the European launch of
the innovative range of C-Series skid steer and
tracked loaders. under the theme ‘Discover a
new way’ Volvo CE’s also showcased its new
road construction machinery.
Meeting the divergent needs of local markets
around the world, new product introductions are
designed to meet a broader audience, with a
host of new products designed to meet the spe-
cific requirements of customers in Asia and
other international markets.
Production and distribution
2012 saw the roll out of the latest phase of the
company’s factory and distribution investment
program. Russia featured in both aspects, with
excavator production set to begin in 2013 at a
new factory in Kaluga, while the dealer network
in Russia is set to double to 90 locations by
2015. There were also capacity and product
expansion programs ongoing in India, Brazil,
China and the uS. In Bangalore, India, a new
factory was inaugurated during 2012 to make
excavators alongside the existing road machin-
ery already produced at the facility.
In the Chinese city of Jinan, meanwhile, a
Technology Centre is under construction that
will, when completed in June 2013, employ up to
200 engineers to design products and compo-
nents primarily for emerging markets.
In May a ground breaking ceremony was held
on the uSD 100 million expansion of Volvo CE’s
facility in Shippensburg, Pennsylvania, uSA.
When completed it will create a new Americas
headquarters, demonstration center and the
ability to localize production of larger machines.
Industry recognitions
The company picked up a number of important
honours for its innovative products during the
year. Out of a field of more than 80 entries from
leading manufacturers, Volvo CE scooped a gold
prize at this year’s Intermat 2012 Innovation
Award for its revolutionary On Board Weighing
system, designed for its F-Series Full Suspension
articulated haulers. This allows complete payload
management, giving access to data such as total
transported load in tons, tons transported per liter
of fuel and number of cycles.
Volvo CE manufactures equipment for construction applications and related industries.
Number of employees14,800
Position on world marketVolvo CE is the world’s leading manu-facturer of articulated haulers and one of the world’s leading manufacturers of wheel loaders, excavators, road development machines and compact construction equipment.
BrandsVolvo and SDLG (Lingong).
f
Share of Group net sales
21% (21)
Celebrating a heritage that dates back 180 years, Volvo Construction Equipment (Volvo CE) is one of the largest and arguably the old-est global producer of prod-ucts and services for the construction, extraction, waste processing and mate-rials handling industries.
62
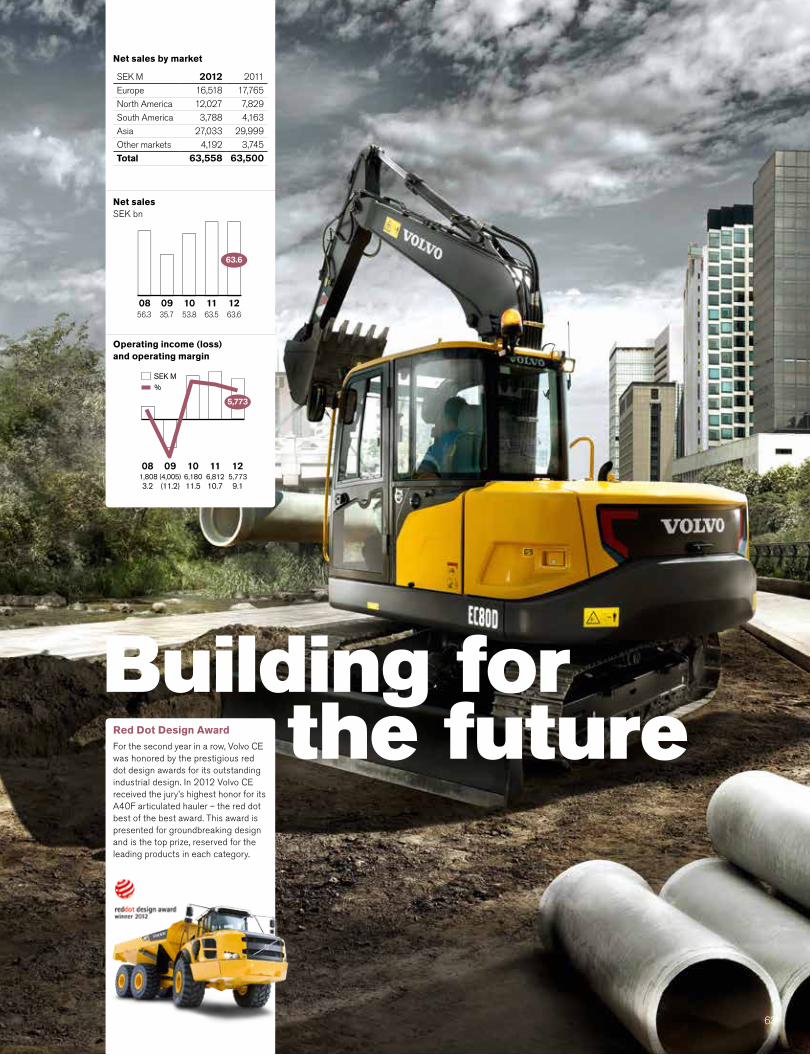
Volvo 9700
Red Dot Design AwardFor the second year in a row, Volvo CE was honored by the prestigious red dot design awards for its outstanding industrial design. In 2012 Volvo CE received the jury’s highest honor for its A40F articulated hauler – the red dot best of the best award. This award is presented for groundbreaking design and is the top prize, reserved for the leading products in each category.
Building for the future
Net salesSEK bn
1163.5
1263.6
1053.8
0935.7
0856.3
63.6
Operating income (loss) and operating margin
SEK M%
5,773
116,81210.7
125,7739.1
106,18011.5
09(4,005)(11.2)
08 1,808
3.2
Net sales by market
SEK M 2012 2011Europe 16,518 17,765north America 12,027 7,829South America 3,788 4,163Asia 27,033 29,999Other markets 4,192 3,745Total 63,558 63,500
63

BOARD OF DIRECTORS’ REPORT 2012 Group performanCe
VolVo penTa
Good profitability despite weak demand
he Industrial business segment is
the part of Volvo Penta’s operation
that generates the largest volumes
based on the Volvo Group’s diesel
platforms. Volvo Penta’s product range in the
Industrial segment comprises high-technological
diesel engines for industrial applications, for
example, power generation, cranes, mining vehi-
cles and container handling equipment. With
unique performance, operating and environ-
mental features, Volvo Penta’s industrial engines
create strengthened competitiveness for such
world-leading customers as Sandvik, Cargotec
and SDMO. By utilizing the strength of the Volvo
Group’s combined service offering, Volvo Penta
is also able to offer efficient support in the form
of global service and aftermarket services.
Within the Marine Commercial business seg-
ment, Volvo Penta delivers diesel engines for
use under the toughest possible offshore condi-
tions. Coast guards and sea-rescue organiza-
tions, ferry companies, port authorities and ship-
yards worldwide install Volvo Penta’s reliable
engines in boats for sea rescue, patrol, passen-
ger transport, security and maintaining offshore
wind turbines.
Within the Marine Leisure business segment,
Volvo Penta delivers diesel engines, gasoline
engines and complete drive systems for most of
the leading boat brands in the industry, for
example, Fairline, Sunseeker and Princess of
the uK, Jeanneau/Beneteau of France, Bavaria
of Germany and Intermarine of Brazil.
using innovative, technical solutions for
boats, Volvo Penta creates significant advan-
tages for customers in the form of lower fuel
consumption, simpler maneuvering and reduced
installation time. With joystick maneuvering,
sophisticated communication and navigation
equipment and fully integrated drive system,
Volvo Penta is quickly moving toward delivering
complete boat-driver environments, with a strong
focus on comfort and user-friendliness.
Volvo Penta’s marine customers have access
to one of the world’s strongest offering of after-
market services and a global service and dealer-
ship organization with approximately 4,000
dealerships worldwide.
Total market
The total market for industrial engines primarily
in Europe, but also north America, was weak
during the year due to the continued decline in
the global economy. The major manufacturers of
equipment and industrial vehicles were forced to
successively reduce production as a result of
weaker demand. A slightly stronger trend in
China and the rest of Asia during the first half of
the year weakened toward the end of the year
due to the global financial turmoil.
The total market for marine diesel engines
was largely unchanged, compared with the weak
trend in recent years. European boat sales were
negatively impacted by austerity packages and
financial restrictions in mainly Southern Europe.
In Italy, traditionally Volvo Penta’s largest marine
market, sales in many boat segments are currently
about 70–80% lower than a few years ago.
In north America, sales of marine diesel
engines and gasoline engines rose during the
year as a result of the continued increased
demand for leisure boats in the uS, but volumes
still remained low compared with the peak years.
Earnings trend
Total sales amounted to SEK 7,631 M, com-
pared with SEK 8,458 M in 2011. Operating
income amounted to SEK 541 M, compared with
SEK 825M in the preceding year. The operating
margin was 7.1% (9.8). Earnings were negatively
impacted mainly by lower sales and an unfavor-
able product mix.
New products
using aggressive investments in product devel-
opment, Volvo Penta has created a modern and
highly competitive product program for industrial
engines in recent years. With the SCR technology,
well-proven by the Volvo Group, the industrial pro-
gram meets the emission legislations for coming
years, while Volvo Penta is able to offer high fuel
efficiency and installation benefits.
During the year, Volvo Penta’s Tier4i-approved
13-liter engine received important north American
mining certifications. These mining certificates
take into account the amount of emissions from the
engine and make calculations based on the venti-
lation rate. The lower the ventilation rate, the more
cost-efficient mining operations can be conducted
and here, Volvo Penta’s SCR technology has
demonstrated major competitive advantages.
On the marine side, Volvo Penta launched
the V8-380 for leisure boats during the year.
This state-of-the-art gasoline engine at 380
horsepower has been awarded and attracted
major attention within the marine industry, not
least thanks to good environmental features
and performance.
Volvo Penta provides engines and power systems for leisure and com-mercial boats, as well as for industrial applications such as power generation and container trucks.
Number of employees1,400
Position on world marketVolvo Penta is the world’s largest producer of diesel engines for leisure boats and a leading, independent producer of industrial engines.
TVolvo Penta contributes significant synergies and economies of scale to the Volvo Group’s total diesel engine manufacturing. Approximately 10% of the total volumes in the Group’s diesel-engine plants in Europe and more than half of the Group’s global volumes of 16-liter engines are delivered to Volvo Penta’s customers.
2% (3)Share of Group net sales
64
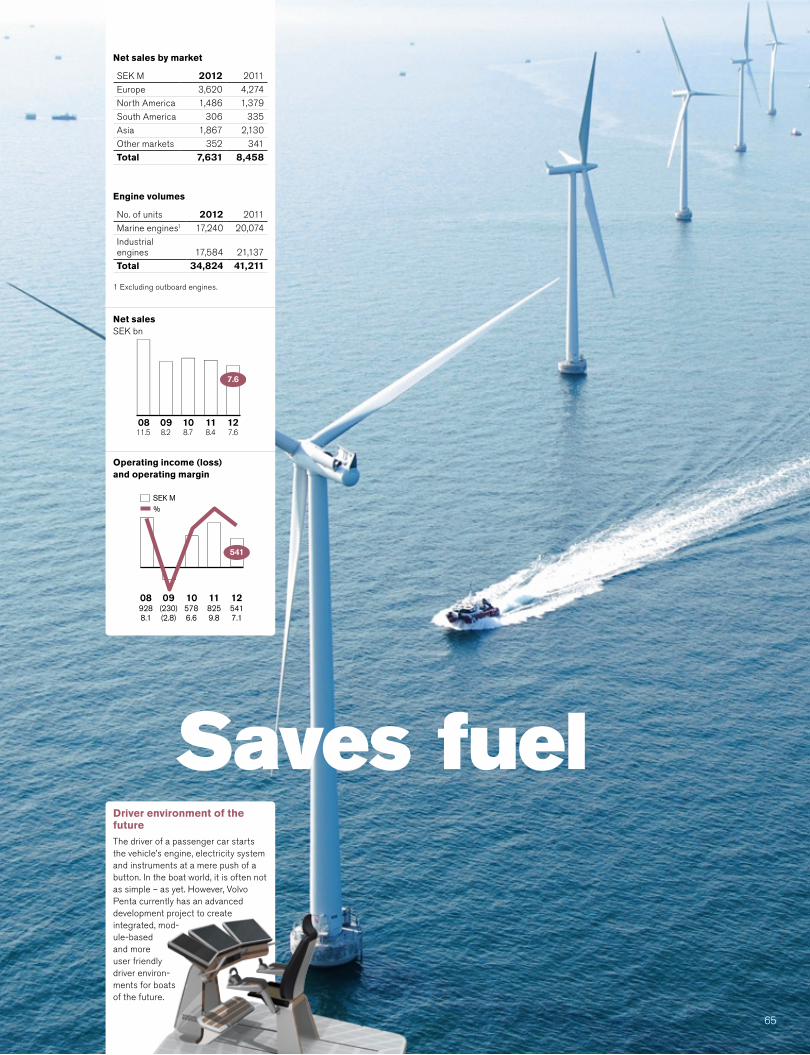
Driver environment of the futureThe driver of a passenger car starts the vehicle’s engine, electricity system and instruments at a mere push of a button. In the boat world, it is often not as simple – as yet. However, Volvo Penta currently has an advanced development project to create integrated, mod-ule-based and more user friendly driver environ-ments for boats of the future.
Saves fuel
Net sales by market
SEK M 2012 2011Europe 3,620 4,274North America 1,486 1,379South America 306 335Asia 1,867 2,130Other markets 352 341Total 7,631 8,458
Engine volumes
No. of units 2012 2011Marine engines1 17,240 20,074Industrial engines 17,584 21,137Total 34,824 41,211
1 Excluding outboard engines.
Net salesSEK bn
127.6
118.4
108.7
098.2
0811.5
7.6
Operating income (loss) and operating margin
SEK M%
125417.1
118259.8
5786.6
09 10(230)(2.8)
089288.1
541
65

BOARD OF DIRECTORS’ REPORT 2012 Group performance
VolVo financial serVices
Profitable growth
The demand for VFS products in 2012 was
good and the global VFS credit portfolio reached
historically high levels. In the Americas, Brazil
rebounded well after a short downturn during
Q3 and the US and Canadian credit portfolios
continued to grow and perform well throughout
the year. In EMEA (Europe, Middle East and
Africa), the market remained soft but the VFS
portfolio grew nonetheless and the perfor-
mance of the credit portfolio improved steadily
throughout the year. In APAC (Asia Pacific), the
slowdown in China experienced towards the latter
half of the year negatively impacted VFS growth
rates in that country. However, portfolio perfor-
mance remained good in China during the year
even in light of the weakening economic condi-
tions. In 2012, VFS continued to serve the markets
of South Africa, India and Indonesia with third
party finance alliances.
Customer finance operations
Total new financing volume in 2012 amounted to
SEK 46.6 billion (44.8). Adjusted for changes in
exchange rates, new business volume increased
by 5.3% compared to 2011 as a result of increased
penetration levels. In total, 50,994 new Volvo
Group vehicles and machines (49,757) were
financed during the year. In the markets where
financing is offered, the average penetration
rate was 27% (25).
As of December 31, 2012, the net credit port-
folio amounted to SEK 99,690 M (94,275). The
funding of the credit portfolio is matched in terms
of maturity, interest rates and currencies in
accordance with Volvo Group policy. For further
information see note 15 to the Consolidated
financial statements.
The operating income for the year amounted to
SEK 1,492 M compared to SEK 969 M in the pre-
vious year. Return on shareholders’ equity was
12.5% (7.3). The equity ratio at the end of the year
was 8.1% (9.1). The improvement in profitability is
driven mainly by higher earning assets and good
margins. During the year, credit provision
expenses amounted to SEK 640 M (682) while
write-offs of SEK 577 M (804) were recorded.
The write-off ratio for 2012 was 0.58% (0.93). At
the end of December 31, 2012, credit reserves
were 1.23% (1.33) of the credit portfolio.
Conducts operations in customer and dealer financing.
Number of employees1,400
Position on world marketVolvo Financial Services operates exclusively to provide finance and leasings solutions to customers and distributors of Volvo Group products, thus enhancing the sales process and the competitiveness of the Group product offering.
y developing long-term relationships
with customers and dealers, VFS
seeks to establish a number one
market position for the financing of
Volvo Group products wherever VFS operates.
When customers choose a vehicle or equipment
supplier, the availability of financial solutions is an
important factor. Customers desire total transport
solutions that enable them to work more effi-
ciently while maximizing profitability and reliability.
VFS creates value for Volvo Group customers
by providing solutions including customer financ-
ing and leasing, dealer financing and other fee-
based products such as insurance. Financial
services are delivered to customers through VFS
in conjunction with dealers of Volvo Group prod-
ucts, allowing customers to enjoy the benefits of
a convenient, one stop-shop experience.
Good profitability levels
Although global economies and financial mar-
kets continued to be characterized by uncertainty
and slow movement during 2012, VFS continued
to achieve good profitability levels and growth
while at the same time improving credit portfolio
performance. Customer repayment patterns
improved, which resulted in continued reductions
in customer delinquencies, defaults and repos-
sessions. During the year, VFS also continued to
reduce inventories of repossessed units through
good, coordinated remarketing activities with the
other business areas.
In markets where VFS financing is offered,
market penetration and financing volumes were
strong in 2012. Through a disciplined approach to
balancing new business development with risk
and cost control, VFS managed its portfolio in a
good way while growing its operations and sup-
porting Volvo Group sales with historically high
levels of finance market penetration of 27%.
Market development
During 2012, VFS provided financial services in
40 markets around the globe. In support of
these offerings, VFS continued to strengthen its
services through operational consolidation, pro-
cess standardization and systems harmoniza-
tion. These activities have enabled VFS to capi-
talize on profitable growth opportunities with
scalable business platforms that boost efficien-
cies while improving service levels.
Volvo Financial Services (VFS) supports the Volvo Group product range with expert financial services by delivering integrated, competitive financial solu-tions that meet customer and dealer needs.
B
3% (3)Share of Group net sales
66
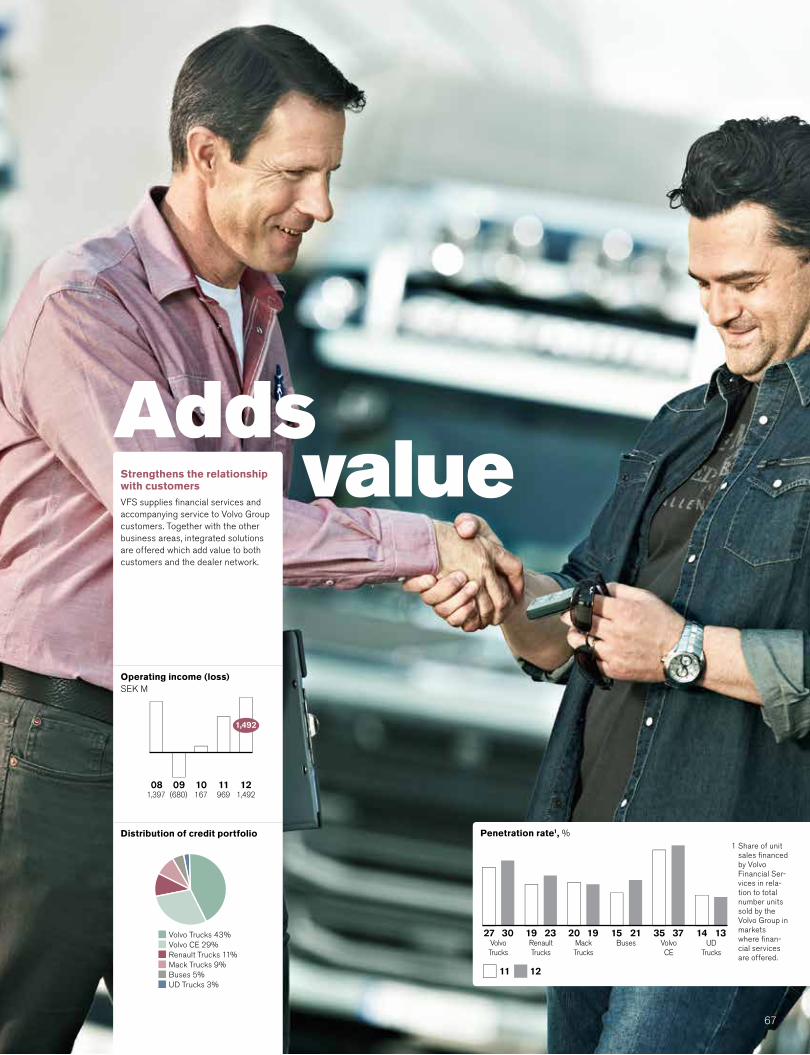
3027VolvoTrucks
RenaultTrucks
MackTrucks
Buses VolvoCE
UDTrucks
2319 1920 2115 3735 1314
11 12
1 Share of unit sales financed by Volvo Financial Ser-vices in rela-tion to total number units sold by the Volvo Group in markets where finan-cial services are offered.
Penetration rate1, %
Operating income (loss)SEK M
121,492
11969
10167
09(680)
081,397
1,492
Volvo Trucks 43%Volvo CE 29%Renault Trucks 11%Mack Trucks 9%Buses 5%UD Trucks 3%
Distribution of credit portfolio
Addsvalue Strengthens the relationship
with customersVFS supplies financial services and accompanying service to Volvo Group customers. Together with the other business areas, integrated solutions are offered which add value to both customers and the dealer network.
67
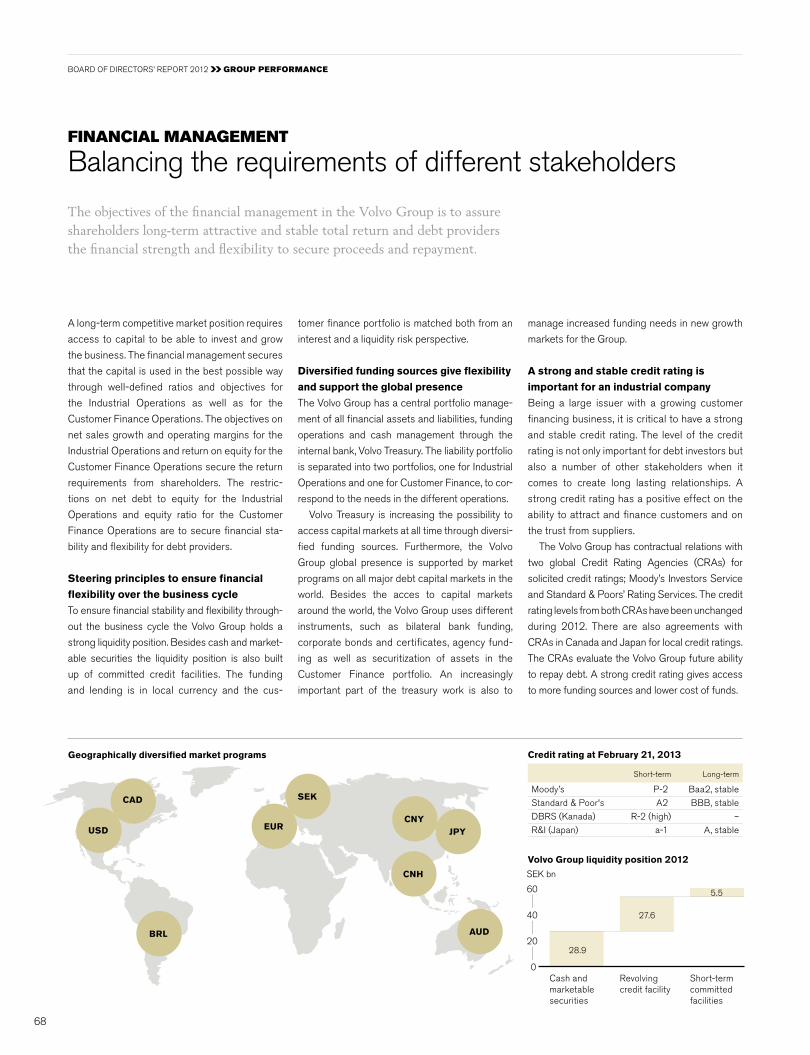
BOARD OF DIRECTORS’ REPORT 2012 Group performanCe
manage increased funding needs in new growth
markets for the Group.
A strong and stable credit rating is
important for an industrial company
Being a large issuer with a growing customer
financing business, it is critical to have a strong
and stable credit rating. The level of the credit
rating is not only important for debt investors but
also a number of other stakeholders when it
comes to create long lasting relationships. A
strong credit rating has a positive effect on the
ability to attract and finance customers and on
the trust from suppliers.
The Volvo Group has contractual relations with
two global Credit Rating Agencies (CRAs) for
solicited credit ratings; Moody’s Investors Service
and Standard & Poors’ Rating Services. The credit
rating levels from both CRAs have been unchanged
during 2012. There are also agreements with
CRAs in Canada and Japan for local credit ratings.
The CRAs evaluate the Volvo Group future ability
to repay debt. A strong credit rating gives access
to more funding sources and lower cost of funds.
finanCial manaGemenT
Balancing the requirements of different stakeholders
Credit rating at February 21, 2013
Short-term Long-term
Moody’s P-2 Baa2, stableStandard & Poor's A2 BBB, stableDBRS (Kanada) R-2 (high) –R&I (Japan) a-1 A, stable
A long-term competitive market position requires
access to capital to be able to invest and grow
the business. The financial management secures
that the capital is used in the best possible way
through well-defined ratios and objectives for
the Industrial Operations as well as for the
Customer Finance Operations. The objectives on
net sales growth and operating margins for the
Industrial Operations and return on equity for the
Customer Finance Operations secure the return
requirements from shareholders. The restric-
tions on net debt to equity for the Industrial
Operations and equity ratio for the Customer
Finance Operations are to secure financial sta-
bility and flexibility for debt providers.
Steering principles to ensure financial
flexibility over the business cycle
To ensure financial stability and flexibility through-
out the business cycle the Volvo Group holds a
strong liquidity position. Besides cash and market-
able securities the liquidity position is also built
up of committed credit facilities. The funding
and lending is in local currency and the cus-
tomer finance portfolio is matched both from an
interest and a liquidity risk perspective.
Diversified funding sources give flexibility
and support the global presence
The Volvo Group has a central portfolio manage-
ment of all financial assets and liabilities, funding
operations and cash management through the
internal bank, Volvo Treasury. The liability portfolio
is separated into two portfolios, one for Industrial
Operations and one for Customer Finance, to cor-
respond to the needs in the different operations.
Volvo Treasury is increasing the possibility to
access capital markets at all time through diversi-
fied funding sources. Furthermore, the Volvo
Group global presence is supported by market
programs on all major debt capital markets in the
world. Besides the acces to capital markets
around the world, the Volvo Group uses different
instruments, such as bilateral bank funding,
corporate bonds and certificates, agency fund-
ing as well as securitization of assets in the
Customer Finance portfolio. An increasingly
important part of the treasury work is also to
The objectives of the financial management in the Volvo Group is to assure shareholders long-term attractive and stable total return and debt providers the financial strength and flexibility to secure proceeds and repayment.
Volvo Group liquidity position 2012
Geographically diversified market programs
Cash and marketable securities
Revolving credit facility
Short-term committed facilities
0
20
40
60
27.6
5.5
28.9
SEK bn
CNy
SEK
JPy
AUD
EUR
CNH
CAD
USD
BRL
68

shareholder Value
Long-term shareholder value
The Volvo Group’s origins can be traced to 1927,
when the first serial produced Volvo car rolled
out of the factory in Gothenburg, Sweden. The
first serial produced truck saw the light of day in
1928 and was an immediate success. In 1935,
AB Volvo was listed on the Stockholm Stock
Exchange. All through its history, the Volvo
Group has strived to create long-term value for
ist shareholders.
The graph shows the total return for the Volvo B
share, measured as the share price development
with all dividends re-invested, since December 30,
1982, which is as far back as the comparison
index, SIx Return Index, stretches. SIx Return
Index measures the total return for the Stockholm
Stock Exchange as whole.
The graph shows that SEK 1,000 invested in
the Volvo B-share in 1982 had grown to SEK
60,200 at the end of 2012, under the condition
that all dividends have been reinvested in Volvo
B shares.
The Volvo Group strives to create long-term value for its shareholders.
Volvo B Total return SIX Return Index
0
2,000
4,000
6,000
8,000
%
1985 1990 1995 2000 2005 2010 2012
Volvo B+ 5,920%
SEK 1,000 invested in Volvo B shares on 30 december 1982, was worth SEK 60,200 at the end of 2012.
seK 1,000
seK 60,2001982
2012
Accumulated total return
69

BOARD OF DIRECTORS’ REPORT 2012 Group performanCe
The share
The most traded share in Stockholm
In spite of the slowdown in the economy, many of the world’s leading stock markets had a positive development in 2012. The Volvo share also had a positive development.
The Volvo share is listed on the nasdaq OMx nor-
dic Exchange in Sweden. One A share carries one
vote at Annual General Meetings and one B share
carries one tenth of a vote. Dividends are the same
for both classes of shares. The A share is traded
under the ticker code Volvo A and the B share
under Volvo B.
The Volvo share is included in a large number of
indexes that are compiled by Dow Jones, FTSE,
S&P and nasdaq OMx nordic.
Positive development on the stock market
In general, developments on the leading stock
exchanges were positive following the negative
developments in 2011. On nasdaq OMx nordic,
the broad OMxSPI index rose by 12% (–17%)
during the year.
On nasdaq OMx nordic the share price for the
Volvo A share increased by 18%, and at year-end
the price for the Volvo A share was SEK (89.40)
(75.95). The lowest price paid was SEK 73.80 on
June 28, and the highest price paid was SEK
100.50 on February 21.
The share price for the Volvo B share increased
by 18% and was SEK 88.80 (75.30) at year-end.
The lowest price paid was SEK 73.60 on June 28,
and the highest price paid was SEK 100.40 on
February 21 and March 16.
In 2012, a total of 2.1 billion (3.1) Volvo shares at
a value of SEK 188 billion (282) were traded on
nasdaq OMx Stockholm, corresponding to a daily
average of 8.5 million shares (12.0). The Volvo
share was the most traded share on nasdaq OMx
Stockholm in 2012. At year-end 2011, Volvo’s mar-
ket capitalization totalled SEK 189 billion (153).
According to Fidessa, the trading on nasdaq
OMx Stockholm accounted for 46% (56) of the
turnover in the Volvo B share while the remainder
took place at exchanges such as BATS, Chi-x,
Burgundy and Turquoise.
Share conversion option
In accordance with a resolution on the AGM on
April 6, 2011, the Articles of Association have been
amended to include a conversion clause, stipulat-
ing that series A shares may be converted into
series B shares, after a request sent to the Board.
During the year a total of 116,950,647 A shares
were converted to B shares, representing 17.6%
of the outstanding A shares at the end of 2011.
Further information on the procedure is
available on the Volvo Group’s web site:
www.volvogroup.com
Ownership changes
In December 2012, Renault s.a.s. sold its entire
holding of 138,604,945 A shares to a number of
institutions in Sweden and abroad. As part of the
transaction, Renault s.a.s. requested the conver-
sion of 110,048,945 A shares to B shares. In con-
junction with the transaction, Industrivärden
announced that it had increased its holding by
10,000,000 A shares. At year end, Industrivärden
was the largest owner in AB Volvo followed by Vio-
let Partners, SHB and norges Bank Investment
Management, when measured as share of votes.
Dividend
The Board proposes a dividend of SEK 3.00 per
share for the financial year of 2012, which would
mean that a total of SEK 6,083 M would be
transferred to AB Volvo’s shareholders. For the
preceding year a dividend of SEK 3.00 per share
was paid out, in total SEK 6,082 M.
Communication with shareholders
Dialog with the shareholders is important for
Volvo. In addition to the Annual General Meeting
and a number of larger activities aimed at profes-
sional investors, private shareholders and stock
market analysts, the relationship between Volvo
and the stock market is maintained through such
events as press and telephone conferences in
conjunction with the publication of interim reports,
meetings with retail shareholders’ associations,
investor meetings and visits, as well as road shows
in Europe, north America and Asia.
On the website www.volvogroup.com it is pos-
sible to access financial reports, search for infor-
mation concerning the share, insider trading in
Volvo and statistics for truck deliveries. It is also
possible to access information concerning the
Group’s governance, including information about
the Annual General Meeting, the Board of Direc-
tors, Group Management and other areas that
are regulated in the “Swedish Code of Corporate
Governance.” The website also offers the possi-
bility to subscribe to information from Volvo.
Earnings per share
Dividend per share
1 Proposed by the Board of Directors
084.902.00
105.362.50
(7.26)0.00
09
118.753.00
125.443.001
Earnings and dividend per share
The Volvo Group once again qualifies for the Dow Jones Sustai-nability World Index (DJSI). The Volvo Group receives a parti-cularly good rating for its handling of environmental issues. In this ranking, the world’s 2,500 largest companies are assessed on the basis of their strategies and results in spheres such as business ethics, environmental consideration and social criteria, with the focus on their ability to generate long-term value. The top 300 companies, a category that encompasses the Volvo Group, are included in the DJSI World.70

Source: NASDAQ OMX
OMX Stockholm PI Index Volvo B OMX Stockholm Machinery PI Index
08 09 10 11 1220
40
60
80
120
140
100
Price trend, Volvo Series B shares, 2008–2012, SEK
Source: NASDAQ OMX
OMX Stockholm PI Index Volvo B OMX Stockholm Machinery PI Index
7&8
9
1624
2517
1821
22&23
19
20
14&15
12&13
3
6
4
5
1&2
11
10
Q2 Q3 Q470
110
Q1
100
90
80
Price trend, Volvo Series B shares, 2012, SEK
Selected press releases
1 Truck deliveries for December 2011, February 3
2 year-end report 2011, February 3
3 Truck deliveries for January, February 22
4 Annual Report 2010, March 14
5 Truck deliveries for February, March 16
6 Annual General Meeting 2011, April 4
7 Truck deliveries for March, April 26
8 Report on the first quarter, April 26
9 Truck deliveries for April, May 16
10 AB Volvo aquires shares in Deutz AG, June 13
11 Truck deliveries for May, June 18
12 AB Volvo divests Volvo Aero, July 5
13 new Volvo engine for Euro 6, July 5
14 Truck deliveries for June, July 24
15 Report on the second quarter, July 24
16 Renault Trucks Defense acquires Panhard, July 26
17 Volvo Trucks launches new FH series, August 22
18 Truck deliveries for July, August 29
19 Truck deliveries for August, September 18
20 Volvo Group announces new truck strategy, September 25
21 new organization in Europe, Middle East and Africa, October 10
22 Truck deliveries for September, October 24
23 Report on the third quarter, October 24
24 Truck deliveries for October, november 16
25 Truck deliveries for november, December 19
The largest shareholders in AB Volvo, 31 december1
Röstandel, %
2012 2011
Industrivärden 19.5 15.6
Violet Partners LP 6.5 5.6SHB2 5.5 4.7norges Bank Investment Management 5.1 2.4AMF Insurance & Funds 5.0 3.9
Renault s.a.s., which was the largest owner at December 31, 2011, during 2012 divested its entire holding corresponding to 17.7% of the votes.
1 Adjusted for shares owned by AB Volvo, which carry no voting rights at the AGM. AB Volvo held 20,728,135 class A shares and 80,013,209 class B shares comprising in total 4.7% of the number of registered shares on December 31, 2012.
2 Comprises shares held by SHB, SHB Pension Fund, SHB Employee Fund, SHB Pensionskassa and Oktogonen.
Share capital, December 31, 2012
Registered number of shares1 2,128,420,220
of which, Series A shares2 546,544,375
of which, Series B shares3 1,581,875,845
Quota value, SEK 1,20
Share capital, SEK M 2,554
number of shareholders 242,482
Private persons 223,975 Legal entities 18,507
For further details on the Volvo share, see note 19.
1 The number of outstanding shares was 2,027,678,876 at December 31, 2012.
2 Series A shares carry one vote each.3 Series B shares carry one tenth of a vote each.
Ownership by country1
Sweden 59%USA 16%United Kingdom 10%Norway 6%Luxembourg 3%Switzerland 1%Others 5%
1 Share of capital, registered shares.
Ownership categories1
Non-Swedish owners 41%
Private shareholders 11%
Pension funds and insurance companies 11%
Savings funds 13%
Others 24%
1 Share of capital, registered shares.
The employees' ownership of shares in Volvo through pension foundations is insignificant.
More details on the Volvo share and Volvo’s holding of treasury shares are provided in note 19 to the financial statements and in the Eleven-year summary.
71

BOARD OF DIRECTORS’ REPORT 2012 Group performanCe
Extensive government regulation
Regulations regarding exhaust emission levels,
noise, safety and levels of pollutants from produc-
tion plants are extensive within the industry.
Most of the regulatory challenges regarding
products relate to reduced engine emissions. The
Volvo Group is a significant player in the commer-
cial vehicle industry and one of the world’s largest
producers of heavy-duty diesel engines. The prod-
uct development capacity within the Volvo Group is
well consolidated to be able to focus resources for
research and development to meet tougher emis-
sion regulations. Future product regulations are
well known, and the product development strategy
is well tuned to the introduction of new regulations.
Financial risk
In its operations, the Volvo Group is exposed to
various types of financial risks. Group-wide poli-
cies, which are updated and decided upon annu-
ally, form the basis of each Group company’s man-
agement of these risks. The objectives of the
Group’s policies for management of financial risks
are to optimize the Group’s capital costs by utiliz-
ing economies of scale, to minimize negative
effects on income as a result of changes in cur-
rency or interest rates, to optimize risk exposure
and to clarify areas of responsibility. Monitoring
and control that established policies are adhered
to is continuously conducted. Information about
key aspects of the Group’s system for internal
controls and risk management in conjunction with
the financial reporting is provided in the Corporate
Governance Report on page 74–88. Most of the
Volvo Group’s financial transactions are carried
out through the in-house bank, Volvo Treasury,
that conducts its operations within established
risk mandates and limits. Credit risks are mainly
managed by the different business areas.
The nature of the various financial risks and
objectives and the policies for the management of
these risks are described in detail in notes 4 and
30. Various aspects of financial risk are described
briefly in the following paragraphs. Volvo Group’s
risKs and unCerTainTies
Managed risk-taking
Risk may be due to events in the world and can
affect a given industry or market. Risk can be
specific to a single company. At the Volvo Group
work is carried out daily to identify, measure and
manage risk – in some cases the Group can
influence the likelihood that a risk-related event
will occur. In cases in which such events are
beyond the Group’s control, the Group strives to
minimize the consequences.
The risks to which the Volvo Group are exposed
are classified into three main categories:
• External-related risks – such as the cyclical
nature of the commercial vehicles business,
intense competition, changes in prices for com-
mercial vehicles and government regulations.
• Financial risks – such as currency fluctuations,
interest levels fluctuations, valuations of shares
or similar instruments, credit risk and liquidity risk.
• Operational risks – such as market reception
of new products, reliance on suppliers, protec-
tion and maintenance of intangible assets, com-
plaints and legal actions by customers and other
third parties and risk related to human capital.
External-related risk
The commercial vehicles industry
is cyclical
The Volvo Group’s markets undergoes significant
changes in demand as the general economic envi-
ronment fluctuates. Investments in infrastructure,
major industrial projects, mining and housing con-
struction all impact the Group’s operations as its
products are central to these sectors. Adverse
changes in the economic conditions for the Volvo
Group’s customers may also impact existing order
books through cancellations of previously placed
orders. The cyclical demand for the Group’s products
makes the financial result of the operations depend-
able on the Group’s ability to react to changes in
demand, in particular to the ability to adapt produc-
tion levels and production and operating expenses.
Intense competition
Continued consolidation in the industry is expected
to create fewer but stronger competitors. Our
major competitors are Daimler, Paccar, navistar,
MAn, Scania, Caterpillar, Komatsu, Cummins and
Brunswick. In recent years, new competitors have
emerged in Asia, particularly in China. These new
competitors are mainly active in their domestic
markets, but are expected to increase their pres-
ence in other parts of the world.
Prices may change
The prices of commercial vehicles have, at times,
changed considerably in certain markets over a
short period. This instability is caused by several
factors, such as short-term variations in demand,
shortages of certain component products, uncer-
tainty regarding underlying economic conditions,
changes in import regulations, excess inventory
and increased competition. Overcapacity within
the industry can occur if there is a lack of demand,
potentially leading to increased price pressure.
All business operations involve risk – managed risk-taking is a condition of maintaining a sustained favorable profitability.
Currencies Interest rates in Sweden, Europe and the U.S.
1005 06 07 08 09040302SEK/USDSEK/EURSEK/100 JPY
11 129.7 8.0 7.3 7.5 7.4 6.8 7.8 7.2 6.7 6.9 6.59.1 9.1 9.1 9.2 9.3 9.3 10.9 10.4 9.0 8.9 8.67.3 6.7 6.5 6.7 5.8 5.8 8.6 7.7 8.3 9.0 7.5Source: Reuters
SEK/100 JPY
SEK/USDSEK/EUR
074.34.34.0
082.42.92.2
025.34.84.5
034.64.14.0
044.44.04.2
053.43.44.3
063.73.84.8
Source: ReutersGovernment bonds, 10 year benchmarks
103.33.03.3
%%%
111.61.81.9
121.51.31.8
093.43.43.8
%
SwedenEurope The U.S.
72
accounting policies for financial instruments are
described in note 30. The overall impact on a com-
pany’s competitiveness is also affected however
by how various macro-economic factors interact.
Interest-related risk
Interest-related risk includes risks that changes in
interest rates will impact the Group’s income and
cash flow (cash-flow risks) or the fair value of
financial assets and liabilities (price risks).
Currency-related risk
More than 90% of the net sales of the Volvo
Group are generated in countries other than Swe-
den. Changes in exchange rates have a direct
impact on the Volvo Group’s operating income,
balance sheet and cash flow, as well as an indirect
impact on Volvo’s competitiveness, which over
time affects the Group’s earnings.
Credit-related risk
An important part of the Group’s credit risk is
related to how the financial assets of the Group
have been placed. The majority are placed in
interest-bearing bonds issued by Swedish real
estate financing institutions.
Liquidity risk
The Volvo Group ensures its financial prepared-
ness by always maintaining a certain portion of
revenues in liquid assets.
Market risk from investments in shares or
similar instruments
The Volvo Group is indirectly exposed to market
risks from shares and other similar instruments, as
a result of managed capital transferred to inde-
pendent pension plans being partly invested in
instruments of these types.
Operational risk
The profitability depends on successful
new products
The Volvo Group’s long-term profitability depends
on the Company’s ability to successfully launch
and market its new products. Product life cycles
continue to shorten, putting increased focus on
the success of the Group’s product development.
Reliance on suppliers
The Volvo Group purchases raw materials, parts and
components from numerous external suppliers. A
significant part of the Group’s requirements for raw
materials and supplies is filled by single-source sup-
pliers. The effects of delivery interruptions vary
depending on the item or component. Certain items
and components are standard throughout the
industry, whereas others are internally developed
and require unique tools that are time- consuming to
replace.
The Volvo Group’s costs for raw materials and
components can vary significantly over a business
cycle. Cost variations may be caused by changes
in world market prices for raw materials or by an
inability of our suppliers to deliver.
Intangible assets
AB Volvo owns or otherwise has rights to patents
and brands that refer to the products the Com-
pany manufactures and markets. These have
been acquired over a number of years and are
valuable to the operations of the Volvo Group.
AB Volvo does not consider that any of the
Group’s operations are heavily dependent on any
single patent or group of patents.
Through Volvo Trademark Holding AB, AB
Volvo and Volvo Car Corporation jointly own the
Volvo brand. AB Volvo has the exclusive right to
use the Volvo name and trademark for its prod-
ucts and services. Similarly, Volvo Car Corporation
has the exclusive right to use the Volvo name and
trademark for its products and services.
The Volvo Group’s rights to use the Renault
brand are restricted to the truck operations only
and are regulated by a license from Renault
s.a.s., which owns the Renault brand. The amount
paid during 2012 to Renault s.a.s. for license
fees amounted to SEK 6.4 M.
The Volvo Group’s rights to use the Panhard
brand are regulated by a license from Peugeot
SA. The amount paid during 2012 to Peugeot
SA for license fees amounted to SEK 90,000.
Complaints and legal actions
The Volvo Group could be the target of complaints
and legal actions initiated by customers, employ-
ees and other third parties alleging health, envi-
ronmental, safety or business related issues, or
failure to comply with applicable legislation and
regulations. Information about legal proceedings
involving entities within the Volvo Group are found
in note 24 Contingent Liabilities.
Even if such disputes are resolved success-
fully, without having adverse financial conse-
quences, they could negatively impact the
Group’s reputation and take up resources that
could be used for other purposes.
Risk related to human capital
A decisive factor for the realization of the Volvo
Group’s vision is our employees and their knowl-
edge and competence. Future development
depends on the company’s ability to maintain its
position as an attractive employer. To this end,
the Volvo Group strives for a work environment
in which energy, passion and respect for the
individual are guiding principles. Every year a
Group-wide survey is conducted, and according
to the survey the share of satisfied employees
has been on a high level in recent years.
Short-term risk factors
An increase in demand could potentially result in
delivery disturbances due to suppliers’ financial
instability or shortage of resources.
uncertainty regarding customers’ access to
the financing of products in emerging markets
might have a negative impact on demand.
The Volvo Group verifies annually, or more fre-
quently if necessary, the goodwill value and other
intangible assets for possible impairment. The size of
the overvalue differs between the business areas
and they are, to a varying degree, sensitive to
changes in the business environment. Instability in
the business recovery and volatility in interest and
currency rates may lead to indications of impairment.
For further information on intangible assets, see
note 12.
The reported amounts for contingent liabilities
reflect a part of the Volvo Group’s risk exposure,
see note 24 for contingent liabilities.
Contractual conditions
related to take over bids
Some of AB Volvo’s long term loan agreements
contain conditions stipulating the right for a bond-
holder to request repayment in advance under
certain conditions following a change of the con-
trol of the company. In AB Volvo’s opinion it has
been necessary to accept those conditions in
order to receive financing on otherwise accept-
able terms. Provisions stipulating that an agree-
ment can be changed or terminated if the control
of the company is changed are also included in
some of the agreements whereby Renault Trucks’
has been given the right to sell Renault s.a.s.’ and
nissan Motor Co. Ltd’s light-duty trucks as well as
in some of the Group’s purchasing agreements.
Further information note 27 Personnel contains information concerning rules on severance payments applicable for the Group Executive Team and certain other senior executives.
note 4 and 30 contain information regarding financial risks as well as goals and policies in financial risk management.
Further risk information is provided in note 24.
73
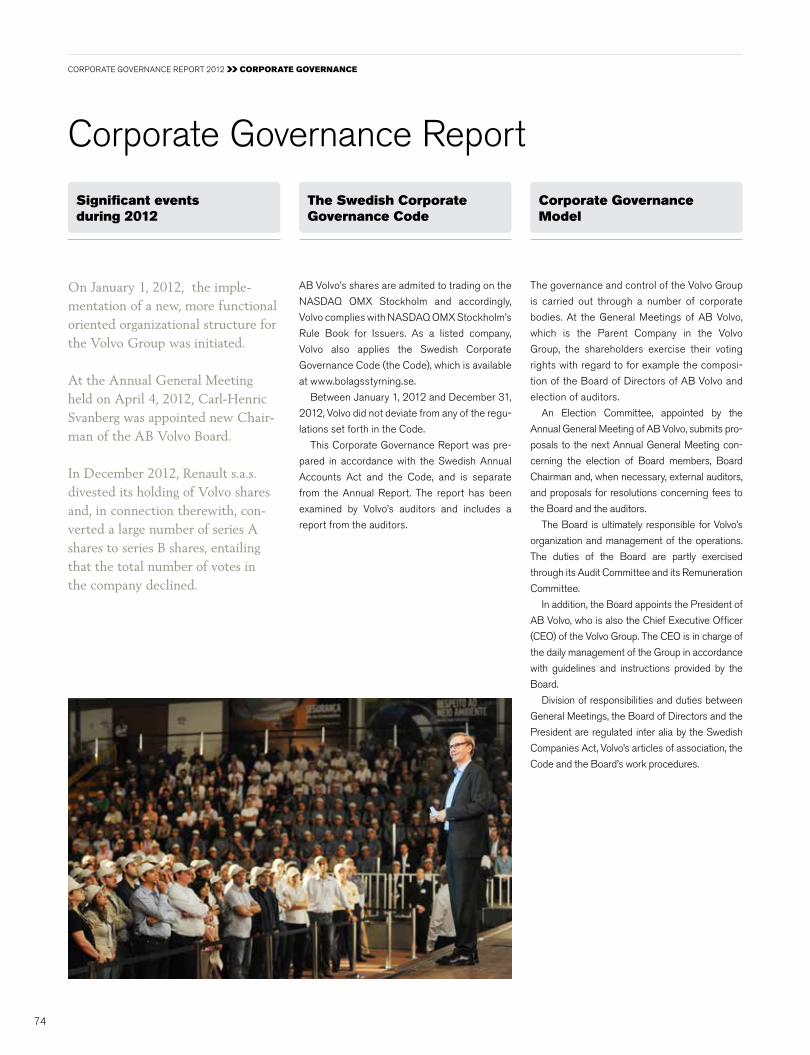
Corporate Governance Report
AB Volvo’s shares are admited to trading on the
nASDAQ OMx Stockholm and accordingly,
Volvo complies with nASDAQ OMx Stockholm’s
Rule Book for Issuers. As a listed company,
Volvo also applies the Swedish Corporate
Governance Code (the Code), which is available
at www.bolagsstyrning.se.
Between January 1, 2012 and December 31,
2012, Volvo did not deviate from any of the regu-
lations set forth in the Code.
This Corporate Governance Report was pre-
pared in accordance with the Swedish Annual
Accounts Act and the Code, and is separate
from the Annual Report. The report has been
examined by Volvo’s auditors and includes a
report from the auditors.
The governance and control of the Volvo Group
is carried out through a number of corporate
bodies. At the General Meetings of AB Volvo,
which is the Parent Company in the Volvo
Group, the shareholders exercise their voting
rights with regard to for example the composi-
tion of the Board of Directors of AB Volvo and
election of auditors.
An Election Committee, appointed by the
Annual General Meeting of AB Volvo, submits pro-
posals to the next Annual General Meeting con-
cerning the election of Board members, Board
Chairman and, when necessary, external auditors,
and proposals for resolutions concerning fees to
the Board and the auditors.
The Board is ultimately responsible for Volvo’s
organization and management of the operations.
The duties of the Board are partly exercised
through its Audit Committee and its Remuneration
Committee.
In addition, the Board appoints the President of
AB Volvo, who is also the Chief Executive Officer
(CEO) of the Volvo Group. The CEO is in charge of
the daily management of the Group in accordance
with guidelines and instructions provided by the
Board.
Division of responsibilities and duties between
General Meetings, the Board of Directors and the
President are regulated inter alia by the Swedish
Companies Act, Volvo’s articles of association, the
Code and the Board’s work procedures.
On January 1, 2012, the imple-mentation of a new, more functional oriented organizational structure for the Volvo Group was initiated.
At the Annual General Meeting held on April 4, 2012, Carl-Henric Svanberg was appointed new Chair-man of the AB Volvo Board.
In December 2012, Renault s.a.s. divested its holding of Volvo shares and, in connection therewith, con-verted a large number of series A shares to series B shares, entailing that the total number of votes in the company declined.
significant events during 2012
The swedish Corporate Governance Code
Corporate Governance model
74
CORPORATE GOVERnAnCE REPORT 2012 CorporaTe GoVernanCe

Audit Committee
Election Committee
Auditor
AB
VO
LVO
Bu
sin
es
s A
re
As
/ D
iVis
iOn
s
Vote at the General Meetings
Elects BoardPrepare
part of the Board’s work.
Elects Auditor
Appoints Election Committee
The auditors review the interim report for the period January 1 to June 30 and audit the annual report and conso-lidated financial statements
Appoints President/CEO
Shareholders
Remuneration Committee
General Meeting
1
2
7
President/CEO
Group Executive Team
Operations
9
3
5
6
8
9
Board of Directors
4
75
Submits proposals concerning election of Board members, auditors and Election Committee for the upcoming AGM
AB Volvo’s share register is kept by Euroclear
Sweden AB. On December 31, 2012, Volvo had
242,482 shareholders according to the share
register. The largest shareholder on that date
was AB Industrivärden, with 18.7% of the votes
based on the number of registered shares. Violet
Partners L.P. held 6.2% of the votes and Svenska
Handelsbanken together with SHB Pension
Fund, SHB Employee Fund, SHB Pensionskassa
and Oktogonen held 5.2% of the votes, based
on the number of registered shares.
Volvo has issued two classes of shares: series
A and series B. In a vote at a General Meeting,
series A shares carry one vote and series B sha-
res one-tenth of a vote. The two share classes
carry equal rights to a share in the assets and
earnings of the company. According to a special
share conversion clause in the Articles of Asso-
ciation, holders of series A shares are entitled to
request that their series A shares be converted to
series B shares. Implementation of such conver-
sions entails that the total number of votes in the
company decreases.
In mid-December 2012, Volvo’s largest share-
holder at that time, Renault s.a.s., announced that
the company had divested all of its Volvo shares by
selling 138,604,945 series A shares in the stock
market. In connection therewith, Volvo received a
request for conversion of 110,048,945 series A
shares into series B shares. Implementation of the
conversion entailed that the total number of votes
in the company declined. At the end of 2012,
the total number of shares in the company amoun-
ted to 2,128,420,220, of which series A shares
accounted for 546,544,375 and series B shares
accounted for 1, 581,875,845. The total number of
votes amounted to 704,731,959.50.
For more information about the Volvo share and
its shareholders, refer to the Board of Director’s
report on pages 70-71 of the Annual Report.
General meeting2shares and shareholders1
General
The General Meeting is Volvo’s highest decision-
making body. The General Meeting held within
six months after the end of the fiscal year and
that adopts the income statement and balance
sheet is called the Annual General Meeting.
The Annual General Meeting of Volvo is normally
held in Gothenburg. In addition to resolutions
concerning adoption of the income statement
and balance sheet for AB Volvo and the Volvo
Group, the Annual General Meeting also adopts
resolutions concerning allocations of profit, the
composition of Volvo’s Board, directors’ fees
and elects external auditors. notice to attend a
General Meeting is issued in the form of an
announcement in Post- och Inrikes Tidningar
(Swedish Official Gazette) and on the company’s
website. The fact that notice has been issued is
announced in Dagens nyheter and Göteborgs-
Posten.
Shareholders who are recorded in the share
register five working days prior to a General
Meeting and who have notified Volvo of their
participation in a certain order, are entitled to
participate in the Meeting, in person or by proxy,
and to vote for or against the proposals put for-
ward at the Meeting and to present questions to
the Board and the President.
A shareholder who wants the Meeting to con-
sider a special matter must submit a request to
the Board in sufficient time prior to the Meeting
to the address provided on Volvo’s website,
www.volvogroup.com.
Resolutions at a General Meeting are nor-
mally passed by simple majority and for elec-
tions, the person who receives the most votes is
considered elected. However, certain resolu-
tions, such as amendment of the Articles of
Association, require a decision by a qualified
majority.
Annual General Meeting 2012
Volvo’s Annual General Meeting 2012 was held
on Wednesday, April 4, 2012 in Gothenburg.
The Meeting was attended by 1,401 sharehol-
ders, either in person or by proxy, representing
70.17% of the votes in the company. Attorney
Sven unger was elected Chairman of the Mee-
ting. Members of the Board and the Group
Executive Team, and Volvo’s Lead Auditor
Göran Tidström representing Pricewaterhouse-
Coopers, Volvo’s elected auditing firm, were
present at the Meeting. At the Meeting, Göran
Tidström announced that he would be resigning
as Lead Auditor and that his replacement would
be Authorized Public Accountant Peter Cle-
medtson.
The Annual General Meeting 2012 adopted
inter alia the following resolutions:
• to pay a dividend of SEK 3.00 per share,
• to reelect Board Members Peter Bijur, Jean-
Baptiste Duzan, Hanne de Mora, Anders
nyrén, Olof Persson, Ravi Venkatesan, Lars
Westerberg and ying yeh,
• to elect Carl-Henric Svanberg as new Board
Member and Chairman,
• the Board’s fees for the period up until the
next Annual General Meeting,
• to adopt the proposed guidelines for remune-
ration of senior executives.
Complete minutes and information about the
Annual General Meeting 2012 are available at
www.volvogroup.com.
Annual General Meeting 2013
Volvo’s Annual General Meeting 2013 will be
held on Thursday, April 4, 2013 in Lisebergshal-
len, Gothenburg. For further information about
the Annual General Meeting 2013, please refer
to the fold-out in the end of the Annual Report
and Volvo’s website www.volvogroup.com.
76
CORPORATE GOVERnAnCE REPORT 2012 CorporaTe GoVernanCe

Duties
The Election Committee is the shareholders’
body responsible for submitting to the Annual
General Meeting the names of candidates to
serve as Chairman at the Meeting and Chair-
man and other members of the Board, as well
as proposing fees and other compensations to
be paid to the Board members.
In the years in which Volvo elects auditors, the
Election Committee presents proposals to the
Meeting for the election of auditors and for fees
to be paid to the auditors. In addition, the Elec-
tion Committee, in accordance with prevailing
instructions for Volvo’s Election Committee, pre-
sents proposals for members of the Election
Committee for the following year.
The Election Committee’s proposal shall be
presented to Volvo in sufficient time to be inclu-
ded in the notice to attend the Annual General
Meeting and to be published on Volvo’s website
at the same time. In conjunction with the notice
to attend the Annual General Meeting being
published, the Election Committee shall com-
ment on whether those persons who are propo-
sed to be elected as Board members are to be
considered as independent in relation to the
company and company management as well as
to major shareholders in the company and
further to comment on their material duties and
holding of shares in Volvo.
election Committee3
Composition
In accordance with instructions adopted by the
Annual General Meeting 2007, the Annual
General Meeting shall select five members to
serve on the Election Committee, of whom four
shall represent the largest shareholders in the
company, in terms of the number of votes, who
have expressed their willingness to participate
on the Election Committee. In addition, one of
the members shall be the Chairman of the AB
Volvo Board. Additionally, the Election Commit-
tee can offer other major shareholders to
appoint one representative as a member of the
Election Committee. If such an offer is made, it
should be directed in turn to the largest share-
holder in terms of voting rights not already
represented on the Election Committee. The
number of members on the Election Commit-
tee, however, may not exceed seven.
In accordance with its instructions, Volvo’s
Annual General Meeting 2012 resolved to
appoint the following individuals as members of
the Election Committee:
• Carl-Henric Svanberg, Chairman of the Board,
• Jean-Baptiste Duzan, representing Renault
s.a.s.,
• Carl-Olof By, representing AB Industrivärden,
• Lars Förberg, representing Violet Partners LP, and
• Håkan Sandberg, representing Svenska
Handelsbanken, SHB Pension Fund, SHB
Employee Fund, SHB Pensionskassa and
Oktogonen.
The Election Committee appointed Carl-Olof By
as Chairman.
Board of directors4
DutiesThe Board of Directors is ultimately responsible for Volvo’s organization and management of the company’s operations. The Board is responsible for the Group’s long-term development and strategy, for regularly controlling and evaluating the Group’s ope-rations and for the other duties set forth in the Swe-dish Companies Act.
Composition During the period January 1, 2012 – December 31, 2012, AB Volvo’s Board consisted of nine members elected by the Annual General Meet ing. In addition, the Board had three members and two deputy mem-bers appointed by employee organizations.
The Annual General Meeting 2012 appointed Carl-Henric Svanberg as new member and Chair-man of the AB Volvo Board. Carl-Henric Svanberg is also Chairman of the Board of BP p.l.c. He has long prior experience as a President and CEO for leading global companies.
An account of each Board member’s age, principal education, professional experience, assignments in the company, other important board memberships, their own and related parties’ ownership of shares in Volvo as of February 21, 2013, and the year they were elected on the Volvo Board, is presented in the “Board of Directors” section below on pages 80–81.
Independence requirements The Board of Directors of AB Volvo must meet inde-pendence requirements pursuant to the Code entai-ling that only one person from the company’s mana-gement may be a member of the Board, that a majority of the Board members elected by the Gene-ral Meeting shall be independent of the company and the company management and that at least two of the Board members elected by the General Mee-ting who are independent of the company and the company’s management shall also be independent of the company’s major shareholders. Prior to the Annual General Meeting 2012, the Election Com-mittee presented the following assessment concer-ning independence of the Board members elected by the Annual General Meeting 2012.
77

ness and financial position of the Volvo Group. In connection therewith, the Audit Committee was responsible for preparing the Board’s work to assure the quality of the Group’s financial reporting by revie-wing the interim reports, the Annual Report and con-solidated accounting. The Board also met with the company’s auditors at several occasions during 2012 and without the presence of management at one occasion. The Board continuously evaluates the performance of the CEO.
During 2012 the Board performed its yearly eva-lutation of the Board’s work.
The Board’s committees
5 Audit CommitteeDuties
In December 2002, the Board established an Audit Committee primarily for the purpose of overseeing the accounting and financial reporting processes and the audit of the financial statements.
The Audit Committee is responsible for preparing the Board’s work to assure the quality of the Group’s financial reporting by reviewing the interim reports, the Annual Report and consolidated accounting. The Audit Committee also has the task of reviewing and overseeing the Group’s legal and taxation matters as well as compliance with laws and regulations that may have a material impact on the financial reporting. The Audit Committee also has the task of reviewing and overseeing the impartiality and independence of the company’s auditors. The Audit Committee is also responsible for evaluating the internal and external auditors’ work, providing the Election Committee with the results of the evaluation of the external audi-tors and to assist in preparing proposals for the elec-tion of auditors. In addition, the Audit Committee’s task is to establish guidelines specifying what other services, beyond auditing, the company may procure from the auditors. The Audit Committee shall also evaluate the quality, relevance and efficiency of the Group’s system for internal control over financial reporting, and with respect to the internal audit and risk management. Finally, the Audit Committee adopts guide lines for transactions with companies and persons closely associated with Volvo.
Peter Bijur, Hanne de Mora, Carl-Henric Svan-berg, Ravi Venkatesan, Lars Westerberg and ying yeh were all considered independent of the com-pany and company management as well as of the company’s major shareholders.
Olof Persson, as AB Volvo’s President and CEO of the Volvo Group, was considered independent of the company’s major shareholders but not of the com-pany and company management.
Jean-Baptiste Duzan was considered indepen-dent in relation to the company and company mana-gement. However, in his prior capacity as an advisor to the CEO of Renault S.A., he was deemed to have such a relation to Renault s.a.s. that he could not be considered independent thereof. Since Renault s.a.s., prior to the Annual General Meeting 2012, controlled more than 10 percent of the votes in the company, Jean-Baptiste Duzan was not considered independent in relation to one of the company’s major shareholders.
Anders nyrén was deemed independent in rela-tion to the company and company management. However, due to his capacity as President and CEO of AB Industrivärden, he was not deem ed indepen-dent thereof. Since AB Industri värden, prior to the Annual General Meeting 2012, controlled more than 10 percent of the votes in the company, Anders nyrén was not considered independent in relation to one of the company’s major shareholders.
Work proceduresEvery year, the Board adopts work procedures for the Board’s work. The work procedures contain rules pertaining to the distribution of work between the Board members, the number of Board meetings, matters to be addressed at regular meetings of the Board and duties incumbent on the Chairman.
In accordance with the work procedures, Volvo’s Chairman shall organize and guide the Board’s work, be responsible for contacts with the owners regar-ding ownership matters and provide the owners’ viewpoints to the Board, ensure that the Board recei-ves adequate information and decision documents for its work and ensure compliance with the Board’s resolutions. In addition, the work procedures contain directives concerning the tasks of the Audit Commit-tee and the Remuneration Committee respectively.
The Board has also issued written instructions specifying how financial information should be repor-ted to the Board, as well as defining the distribution of duties between the Board and the President.
The Board’s work in 2012The Board’s work is mainly performed within the framework of formal Board meetings and through meetings in the respective committees of the Board. In addition, regular contact is maintained between the Chairman of the Board and the CEO in order to discuss on-going business and to ensure that the resolutions taken by the Board are executed.
In 2012, there were eight regular meetings, one statutory meeting and two extraordinary meetings. The attendance of Board members at these mee-tings is presented in the table on page 79.
During 2012 the Board devoted time to matters related to the implementation of the new organizatio-nal structure of the Group, such as the introduction of a new financial framework and new strategic objectives for 2013–2015 and discussions concer-ning a new truck brand positioning strategy. The launch of the new Volvo FH was an important event for the Volvo Group during 2012, which was the result of a long-term development project that has been discussed and decided upon by the AB Volvo Board. During 2012 the Volvo Group further divested the subsidiary Volvo Aero to the British engineering company GKn and the Group increased its share-holding in the German engine manufacturer Deutz AG, two transactions that have also been discussed and decided by the Board. Further the Board has during 2012 devoted time to matters concerning the agreement that Volvo signed with Dongfeng Motor Group Company Limited (DFG) in January 2013, to acquire 45% of a new subsidiary of DFG. As a result of the uncertainty about the macroeconomic trend, the Board specifically focused on monitoring the business environment in order to be prepared to adapt the operation to prevailing demand. The Board also continuously worked with leadership succes-sion- and leadership development issues.
The Board also reviewed the financial positions of AB Volvo and the Volvo Group on a regular basis and acted in order to ensure that there are efficient sys-tems with which to follow-up and control the busi-
78
CORPORATE GOVERnAnCE REPORT 2012 CorporaTe GoVernanCe
Composition and work in 2012
At the statutory Board meeting following the Annual General Meeting 2012, the following Board mem-bers were appointed members of the Audit Commit-tee:• Lars Westerberg,• Peter Bijur,• Jean-Baptiste DuzanLars Westerberg was appointed Chairman of the Audit Committee.
According to the Swedish Companies Act, the mem-bers of the Audit Committee may not be employees of the company and shall be independent and at least one member of the Audit Committee shall be independent and have accounting or auditing exper-tise. In addition, the Code stipulates that a majority of the members of the Audit Committee shall be inde-pendent of the company and the company manage-ment, and that at least one of the members who is independent of the company and the company management shall also be independent of the company’s major shareholders. The Election Committee’s assessment of independence prior to the Annual General Meeting 2012 is presented above under the “Independence requirements” sec-tion on pages 77–78. All members of the Audit Com-mittee are highly familiar with accounting matters and the accounting stand ards that apply for an inter-national Group such as Volvo.
The Audit Committee met with the external audi-tors without the presence of management at four occassions in connection with the Audit Committee metings. The Audit Committee has also met with the Head of Corporate Audit at the meetings of the Audit Committee.
The Audit Committee and the external auditors have, among other tasks, discussed the external audit plan and risk management. The Audit Commit-tee held eight meetings during 2012. The atten-dance of Board members at Committee meetings is presented in the table to the right on this page.
6 Remuneration CommitteeDuties
In April 2003, the Board established a Remunera-
tion Committee for the purpose of preparing and deciding on issues relating to remuneration to senior executives in the Group. The duties of the Commit-tee include presenting recommendations for resolu-tion by the Board regarding the terms and conditions of employment and remuneration for the President of AB Volvo, principles for remuneration, including pensions and severance payments, for other mem-bers of the Group Executive Team, and principles for variable salary systems, share-based incentive pro-grams, pensions and severance payment for other senior executives in the Group.
The Remuneration Committee shall monitor and evaluate ongoing programs and programs conclu-ded during the year covering variable remuneration for the executives, application of the policy for remu-neration to senior executives on which the Annual General Meeting shall decide and the current remu-neration structures and levels in the Group. The Board shall, not later than two weeks prior to the Annual General Meeting, submit a report on the results of the Remuneration Committee’s evaluation on the company’s website.
Composition and work in 2012
At the statutory Board meeting following the Annual General Meeting 2012, the following Board mem-bers were appointed members of the Remuneration Committee:• Carl-Henric Svanberg,• Anders nyrén,• ying yeh Carl-Henric Svanberg was appointed Chairman of the Remuneration Committee.
The Code sets the requirement that members of the Remuneration Committee, with the exception of the Board Chairman if a member of the Remuneration Committee, shall be independent of the company and company management. The Election committee’s assessment of independence prior to the Annual General Meeting 2012 is presented above under the “Independence requirements” section on pages 77–78.
The Remuneration Committee held four meetings during 2012. The attendance of Board members at Committee meetings is presented in the table to the right on this page.
Remuneration to Board members The Annual General Meeting resolves on the fees to be paid to the Board members elected by the share-holders. The Annual General Meet ing held on April 4, 2012, approved fee payments to the Board, for the time until the end of the next Annual General Mee-ting, as follows:
Volvo’s Chairman should receive a fee of SEK 2,100,000 and each of the remaining members elected by the shareholders should receive a fee of SEK 700,000 with the exception of the President. The Chairman of the Audit Committee should receive a fee of SEK 300,000 and other members of the Audit Committee SEK 150,000 each. In addition, the Chairman of the Remuneration Committee should receive SEK 125,000 and other members of the Remuneration Committee SEK 100,000 each.
79
The Board’s composition and attendance at meetings January 1, 2012 – December 31, 2012
Member
Board (11 incl.
statutory)
Audit Commit-
tee (8)
Remu-nerationCommit-
tee (4)
Louis Schweitzer1 3 1Carl-Henric Svanberg2 8 3Peter Bijur 10 8 Jean-Baptiste Duzan 11 8 Hanne de Mora 11 Anders nyrén 11 4Olof Persson 11Ravi Venkatesan 10 Lars Westerberg 11 8 ying yeh 10 4Peteris Lauberts, employee repre-sentative 11Mikael Sällström,employee repre-sentative 11Berth Thulin,employee repre-sentative 11Total number of meetings 11 8 4
1 Stepped down from the Board on April 4, 2012.
2 Joined the Board on April 4, 2012

80
CORPORATE GOVERnAnCE REPORT 2012 CorporaTe GoVernanCe
1. Carl-Henric SvanbergChairman of the Board Chairman of the Remuneration Committee
Born 1952. Master of Science, B. Sc. Busi-ness Administration. Board Chairman: BP p.l.c. Chairman of the Volvo Board since April 4, 2012. Holdings in Volvo, own and related parties: 700,000 Series B shares.
Principal work experience: Has held various positions at Asea Brown Boveri (ABB) and Securitas AB; President and Chief Executive Officer of Assa Abloy AB; President and Chief Executive Officer of Telefonaktiebolaget LM Ericsson; member of the External Advisory Board of the Earth Institute at Columbia university and the Advisory Board of Harvard Kennedy School.
2. Peter BijurMember of the Audit Committee
Born 1942. MBA Marketing, BA Political Science. Board member: Gulfmark Offshore Inc. Member of the Volvo Board since 2006. Holdings in Volvo, own and related par-ties: 3,000 Series B shares.
Principal work experience: numerous posi-tions with Texaco Inc, retired as Chairman and Chief Executive Officer in 2001.
3. Jean-Baptiste DuzanMember of the Audit Committee
Born 1946. Graduate of the Ecole Polytech-nique. Senior Advisor Lazard Frères. Board member: nissan Motor Co. Ltd. Member of the Volvo Board since 2009. Holdings in Volvo, own and related parties: 1,000 Series B shares.
Principal work experience: Began his career at Citibank. Has held various positions within Renault since 1982 – director of financial ser-vices at Renault V.I.; finance director of Renault credit, director of financial operations; project director for the car model Safrane; Senior Vice President, Purchasing, and joined the Renault Management Committee. He was also named Chairman and Managing Director, Renault nissan Purchasing Organization. He was then named Group Controller. Today, he works as an independant consultant.
4. Hanne de Mora
Born 1960. BA in Economics from HEC in Lausanne, MBA from IESE in Barcelona. Board Chairman: a- connect (group) ag. Board member: Sandvik AB, IMD Foundation Board. Member of the Volvo Board since 2010. Holdings in Volvo, own and related parties: 3,000 Series B shares.
Principal work experience: Credit Analyst Den norske Creditbank in Luxemburg 1984, various positions within brand management and con-trolling within Procter & Gamble 1986–1989, Partner McKinsey & Company, Inc. 1989–2002, one of the founders and owners, also Chairman of the Board, of the management company a-connect (group) ag since 2002.
5. Anders NyrénMember of the Remuneration Committee
Born 1954. Graduate of the Stockholm School of Economics, MBA at uCLA. President and Chief Executive Officer of AB Industrivärden. Board Chairman: Sandvik AB. Vice Chair-man: Svenska Handelsbanken. Board mem-ber: AB Industrivärden, Ernströmgruppen AB, SSAB Svenskt Stål AB, Svenska Cellulosa Aktiebolaget SCA, Telefonaktiebolaget LM Ericsson, Stockholm School of Economics and SSE Association. Member of the Volvo Board since 2009. Holdings in Volvo, own and rela-ted parties: 5,200 Series B shares.
Principal work experience: Has worked for AB Wilhelm Becker. He has held various positions within STC – Controller, Executive Vice Presi-dent and CFO, and President of STC Venture AB; President at OM International AB; Execu-tive Vice President and CFO at Securum; Director with executive responsibility for Mar-kets and Corporate Finance at nordbanken; Executive Vice President and CFO at Skanska.
6. Olof Persson
Born 1964. B. Sc. in Business Administration and Economics. President of AB Volvo and Chief Executive Officer of the Volvo Group since 2011. Board Chairman: The German-Swedish Chamber of Commerce. Board member: The Confederation of Swedish Enterprise and the Swedish-American Chamber of Commerce. Member of the Volvo Board since 2011. Hold-ings in Volvo, own and related parties: 76,037 Series B Shares.
Principal work experience: Began his career at ABB; has held a number of executive posi-tions at AdTranz and Bombardier; President of Volvo Aero; President of Volvo Construction Equipment.
7. Ravi Venkatesan
Born 1963. MBA, Harvard Business School, and M.Sc. Industrial Engineering, Purdue uni-versity. Director Truepoint Center in Boston. Board member: Infosys Ltd., Advisory Board of Bunge Inc., non Profit Advisory Board Har-vard Business School, Babajobs Pvt. Ltd. Member of the Volvo Board since 2008. Hold-ings in Volvo, own and related parties: 700 Series B shares.
Principal work experience: Several leading positions within the American engine manu-facturer Cummins. Chairman of Microsoft India and responsible for Microsoft’s marketing, operational and business development efforts in India.
8. Lars WesterbergChairman of the Audit Committee
Born 1948. M.Sc. Engineering, Bachelor Business Administration. Board Chairman: Husqvarna AB. Board member: SSAB Sven-skt Stål AB, Sandvik AB, Meda AB and Stena AB. Member of the Volvo Board since 2007. Holdings in Volvo, own and related parties: 60,000 Series A shares.
Principal work experience: President and CEO of Gränges AB, ESAB AB and Autoliv Inc.
9. ying yehMember of the Remuneration Committee
Born 1948. BA, Literature & International Relations. Board member: ABB Ltd, Sam-sonite International S.A., InterContinental Hotels Group PLC. Member of the Volvo Board since 2006. Holdings in Volvo, own and related parties: none.
Principal work experience: Journalist nBC, new york. numerous positions with the u.S. Government Foreign Service in Burma, Hong Kong, Taiwan and Beijing. Various positions with Eastman Kodak in China, latest as Presi-dent and Chairman, north Asia Region. Chair-man of nalco Greater China.
Board members elected by the Annual General meeting
Board of Directors

81
Secretary to the BoardBoard members and deputies appointed by employee organisations
10. Mikael Sällström
Employee representative, ordinary member. Born 1959. With Volvo 1980–1999 and since 2009. Member of the Volvo Board since 2009. Holdings in Volvo, own and related parties: none.
11. Berth Thulin
Employee representative, ordinary member. Born 1951. With Volvo since 1975. Deputy member of the Volvo Board 1999–2009, member since 2009. Holdings in Volvo, own and related parties: 1,425 Series B shares.
12. Peteris Lauberts
Employee representative, ordinary member. Born 1948. With Volvo since 1999. Deputy member of the Volvo Board 2010–2011, mem-ber since november 1, 2011. Holdings in Volvo, own and related parties: 299 Series A shares
13. Lars Ask
Employee representative, deputy member. Born 1959. With Volvo since 1982. Deputy member of the Volvo Board since 2009. Hold-ings in Volvo, own and related parties: 549 shares, including 250 Series B shares.
14. Hans Hansson
Employee representative, deputy member. Born 1964. With Volvo since 1985. Deputy member of the Volvo Board since May 4, 2012. Holdings in Volvo, own and related parties: 5,250 shares, including 250 Series B shares.
Eva Persson
Born 1953. Master of Laws. Executive Vice President Corporate Legal & Compliance and General Counsel of the Volvo Group. Secretary to the Volvo Board since 1997. Holdings in Volvo, own and related parties: 64,468 shares, including 62,909 Series B shares.
11 5 2 6 14 10 87
13
9 12143
Volvo’s auditors are elected by the Annual
General Meeting. The current auditor is Price-
waterhouseCoopers AB (PwC), which was
elected at the Annual General Meeting 2010
for a period of four years. Two partners of
PwC, Peter Clemedtson and Johan Rippe,
are responsible for the audit of Volvo. Peter
Clemedtson is Lead Auditor.
The external auditors discuss the external audit
plan and risk management with the Audit Com-
mittee. The auditors review the interim report for
the period January 1 to June 30 and audit the
Annual Report and the consolidated accounting.
The auditors also express an opinion whether this
Corporate Governance Report was prepared or
not, and in such respect whether certain informa-
tion therein coincides with the Annual Report and
consolidated accounting. The auditors report their
external auditing7
findings with regard to the annual report, consoli-
dated accounting and the Corporate Governance
Report through the audit reports and a separate
opinion regarding the Corporate Governance
Report, which they present to the Annual General
Meeting. In addition, the auditors report detailed
findings from their reviews to the Audit Commit-
tee twice a year and once a year to the full Board
of Directors.
When PwC is retained to provide services
other than the audit, it is done in accordance
with rules decided by the Audit Committee per-
taining to pre-approval of the nature of the ser-
vices and the fees.
For information concerning Volvo’s remune-
ration to the auditors, refer to note 28 “Fees to
the auditors” in the Group’s notes in the Annual
Report.
Volvo’s core values, vision and strategies
Volvo’s core values are quality, safety and environ-
mental care. These values form the common
base for the Group’s long-term goals and vision
and for the strategies and plans, the purpose of
which is to contribute to achieving our goals
and vision.
The Volvo Group’s vision is to become the
world leader in sustainable transport solutions.
The vision describes the overall long-term goal
for the operations. Volvo has also adopted a
wanted position 2020 with the aim to achieve
its long-term vision. In addition, the Board has
resolved on a number of new, financial targets
for the operations, primarily in relation to growth
and profitability, which have been implemented
as of 2012.
How Volvo will achieve the vision, the wanted
position 2020 and the financial targets are
defined in long-term plans for different areas
such as brand positioning, product develop-
ment, finance and IT, and in more short-term
strategic objectives with a duration of three
years. The long-term plans may be both Group-
wide and business area/division specific, and
even if a long-term approach is applied, they will
be updated continuously. Every third year, speci-
fic focus areas and strategic objectives are for-
mulated that are specific to the Group’s various
business areas and divisions. These focus
areas and strategic objectives define what is to
be achieved over the next three years, with the
purpose of achieving the financial targets, the
wanted position 2020 and also, in longtime-
perspective, the vision.
The implementation of activities to reach the
strategic objectives has high priority. Throug-
hout the three-year period, monthly and quar-
terly follow-ups of the strategic objectives are
reported to the management groups of each
business area/division. Potential risks of not
achieving the goals are therewith identified and
discussed at an early stage, enabling efficient
adjustment or action. The vision and strategies
thereby become management and governance
tools for the Group.
Governance and organizational structure 8
82
CORPORATE GOVERnAnCE REPORT 2012 CorporaTe GoVernanCe
Auditors
PricewaterhouseCoopers AB
Peter Clemedtson
Authorized Public Accountant.
Lead Partner.
Auditor since 2012.
Peter Clemedtson’s other listed client is Ratos. His unlisted clients include Wallenberg-stiftelserna, 3 and Proventus. Peter has pre-viously been appointed auditor in Ericsson, SEB, Electrolux, OMx and Gambro.
Born 1956.
Johan Rippe
Authorized Public Accountant.
Partner
Auditor since 2010.
Johan Rippe’s other clients are Getinge AB and Elanders AB.
Born 1968.

sales and marketing divisions: Group Trucks
Sales & Marketing Americas (with responsibility
for north and South America), Group Trucks
Sales & Marketing EMEA (with responsibility for
Europe, the Middle East and Africa) and Group
Trucks Sales & Marketing and JVs APAC (with
responsibility for Asia and the Pacific region and
for the Group’s joint-venture truck companies).
There is also a division with responsibility for
product development of engines, transmissions
and trucks as well as for purchasing: Group
Trucks Technology (GTT). Finally, Group Trucks
Operations (GTO) is a division within Group
Trucks with responsibility for production of
trucks and the Group’s engines and transmis-
sions. GTO is also responsible for the Group’s
spare parts supply and logistics operations.
There are seven Corporate Functions: Corpo-
Governance documents
Another key component of the governance and
control is the Group’s policies and directives,
such as the Code of Conduct and policies per-
taining to investments, financial risks, accoun-
ting, financial control and internal audit, which
contain Group-wide operating and financial
rules for the operations, as well as responsibility
and authority structures.
Organizational structure
The Volvo Group’s business activities are orga-
nized into six business areas: Group Trucks,
Construction Equipment, Buses, Volvo Penta,
Governmental Sales and Volvo Financial Services.
The Group Trucks operations, which account
for almost two-thirds of the Group’s total sales,
are organized into five divisions. There are three
Chief Executive Officer
Corporate Strategy
Corporate Public & Environmental Affairs Corporate Legal & Compliance
Volvo Penta
Corporate Human Resources Corporate Finance & Control
Construction Equipment
Group Trucks Sales & Marke-
ting EMEA
Group Trucks
Technology
Group Trucks Sales & Marke-ting Americas
Business Areas
Group Trucks Sales & Marke-
ting and JVs APAC
Volvo Financial Services
Group Trucks
Operations
Corporate Communication Corporate Process & IT
Buses
Governmental Sales
GROuP TRuCKS
rate Human Resources, Corporate Public &
Environmental Affairs, Corporate Communica-
tion, Corporate Finance & Control, Corporate
Legal & Compliance, Corporate Process & IT
and Corporate Strategy, providing support to the
CEO and the Group Executive Team with exper-
tise in each Corporate Function area and deve-
loping standards for the entire organization
through policies, directives and guidelines.
In addition there are more than twenty Group
Functions that provide services and/or products
to the entire Group, for example Volvo IT and
Business Services.
83
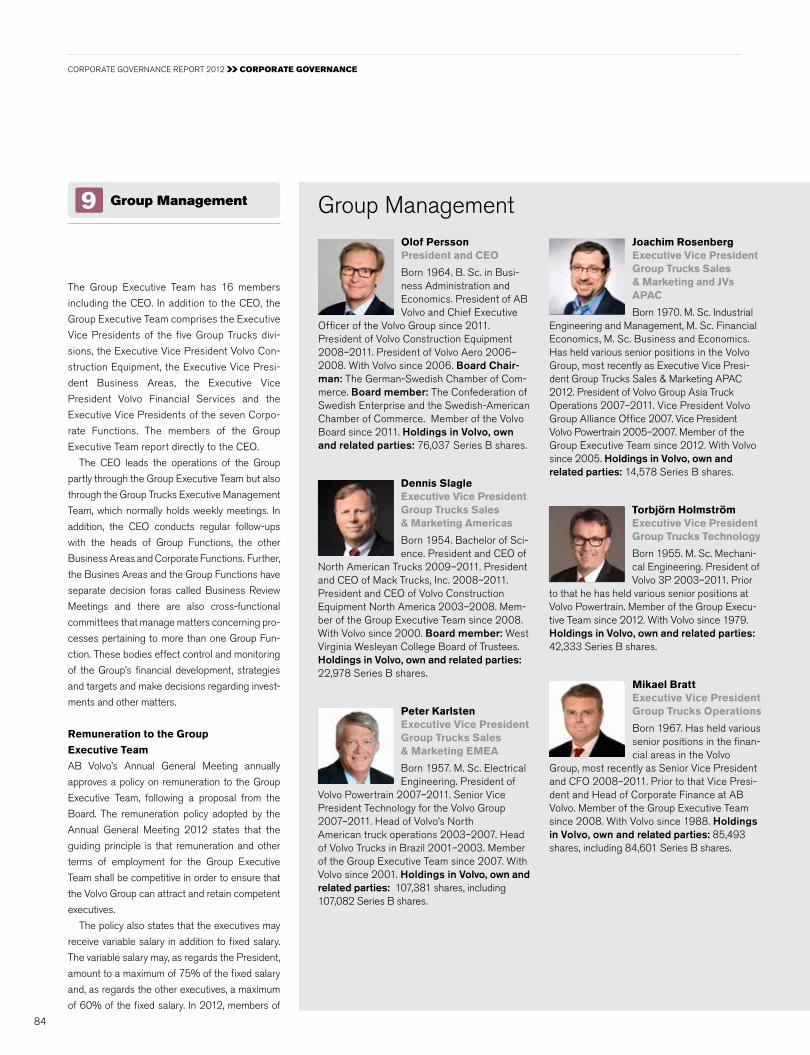
The Group Executive Team has 16 members
including the CEO. In addition to the CEO, the
Group Executive Team comprises the Executive
Vice Presidents of the five Group Trucks divi-
sions, the Executive Vice President Volvo Con-
struction Equipment, the Executive Vice Presi-
dent Business Areas, the Executive Vice
President Volvo Financial Services and the
Executive Vice Presidents of the seven Corpo-
rate Functions. The members of the Group
Executive Team report directly to the CEO.
The CEO leads the operations of the Group
partly through the Group Executive Team but also
through the Group Trucks Executive Management
Team, which normally holds weekly meetings. In
addition, the CEO conducts regular follow-ups
with the heads of Group Functions, the other
Business Areas and Corporate Functions. Further,
the Busines Areas and the Group Functions have
separate decision foras called Business Review
Meetings and there are also cross-functional
committees that manage matters concerning pro-
cesses pertaining to more than one Group Fun-
ction. These bodies effect control and monitoring
of the Group’s financial development, strategies
and targets and make decisions regarding invest-
ments and other matters.
Remuneration to the Group
Executive Team
AB Volvo’s Annual General Meeting annually
approves a policy on remuneration to the Group
Executive Team, following a proposal from the
Board. The remuneration policy adopted by the
Annual General Meeting 2012 states that the
guiding principle is that remuneration and other
terms of employment for the Group Executive
Team shall be competitive in order to ensure that
the Volvo Group can attract and retain competent
executives.
The policy also states that the executives may
receive variable salary in addition to fixed salary.
The variable salary may, as regards the President,
amount to a maximum of 75% of the fixed salary
and, as regards the other executives, a maximum
of 60% of the fixed salary. In 2012, members of
Group management 9
84
CORPORATE GOVERnAnCE REPORT 2012 CorporaTe GoVernanCe
Dennis SlagleExecutive Vice President Group Trucks Sales & Marketing Americas
Born 1954. Bachelor of Sci-ence. President and CEO of
north American Trucks 2009–2011. President and CEO of Mack Trucks, Inc. 2008–2011. President and CEO of Volvo Construction Equipment north America 2003–2008. Mem-ber of the Group Executive Team since 2008. With Volvo since 2000. Board member: West Virginia Wesleyan College Board of Trustees. Holdings in Volvo, own and related parties: 22,978 Series B shares.
Mikael BrattExecutive Vice President Group Trucks Operations
Born 1967. Has held various senior positions in the finan-cial areas in the Volvo
Group, most recently as Senior Vice President and CFO 2008–2011. Prior to that Vice Presi-dent and Head of Corporate Finance at AB Volvo. Member of the Group Executive Team since 2008. With Volvo since 1988. Holdings in Volvo, own and related parties: 85,493 shares, including 84,601 Series B shares.
Joachim RosenbergExecutive Vice President Group Trucks Sales & Marketing and JVs APAC
Born 1970. M. Sc. Industrial Engineering and Management, M. Sc. Financial Economics, M. Sc. Business and Economics. Has held various senior positions in the Volvo Group, most recently as Executive Vice Presi-dent Group Trucks Sales & Marketing APAC 2012. President of Volvo Group Asia Truck Operations 2007–2011. Vice President Volvo Group Alliance Office 2007. Vice President Volvo Powertrain 2005–2007. Member of the Group Executive Team since 2012. With Volvo since 2005. Holdings in Volvo, own and related parties: 14,578 Series B shares.
Olof PerssonPresident and CEO
Born 1964. B. Sc. in Busi-ness Administration and Economics. President of AB Volvo and Chief Executive
Officer of the Volvo Group since 2011. President of Volvo Construction Equipment 2008–2011. President of Volvo Aero 2006–2008. With Volvo since 2006. Board Chair-man: The German-Swedish Chamber of Com-merce. Board member: The Confederation of Swedish Enterprise and the Swedish-American Chamber of Commerce. Member of the Volvo Board since 2011. Holdings in Volvo, own and related parties: 76,037 Series B shares.
Torbjörn HolmströmExecutive Vice President Group Trucks Technology
Born 1955. M. Sc. Mechani-cal Engineering. President of Volvo 3P 2003–2011. Prior
to that he has held various senior positions at Volvo Powertrain. Member of the Group Execu-tive Team since 2012. With Volvo since 1979. Holdings in Volvo, own and related parties: 42,333 Series B shares.
Peter KarlstenExecutive Vice President Group Trucks Sales & Marketing EMEA
Born 1957. M. Sc. Electrical Engineering. President of
Volvo Powertrain 2007–2011. Senior Vice President Technology for the Volvo Group 2007–2011. Head of Volvo’s north American truck operations 2003–2007. Head of Volvo Trucks in Brazil 2001–2003. Member of the Group Executive Team since 2007. With Volvo since 2001. Holdings in Volvo, own and related parties: 107,381 shares, including 107,082 Series B shares.
Group Management
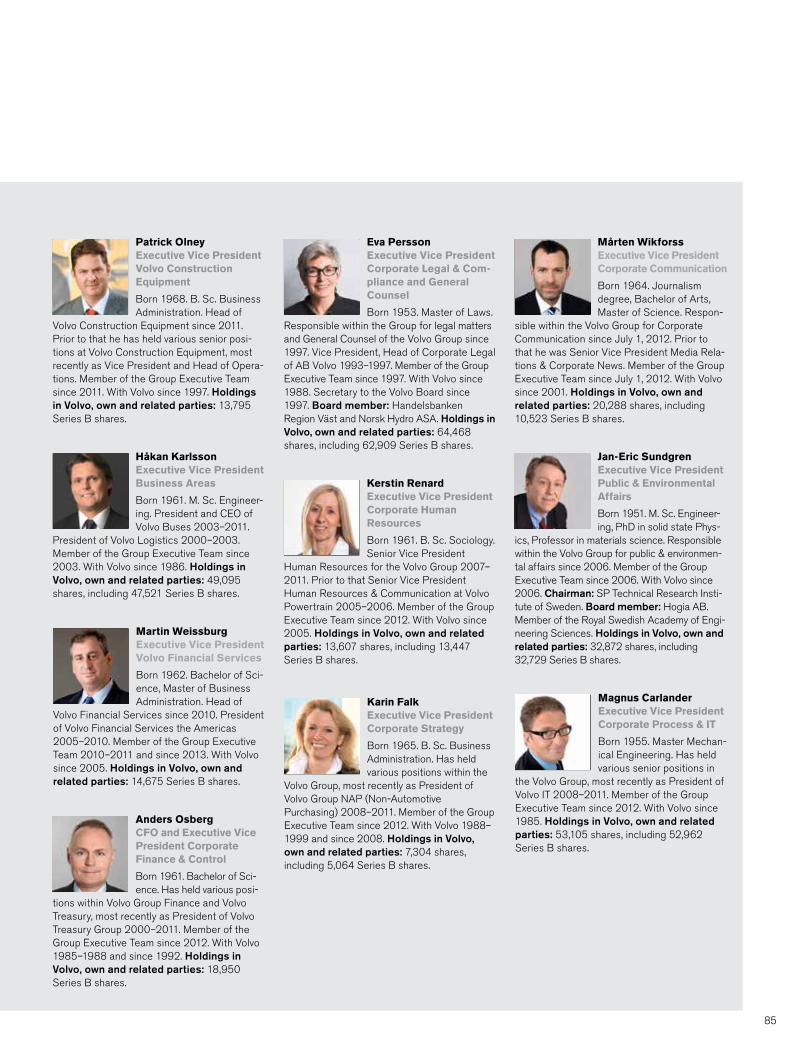
85
Mårten WikforssExecutive Vice President Corporate Communication
Born 1964. Journalism degree, Bachelor of Arts, Master of Science. Respon-
sible within the Volvo Group for Corporate Communication since July 1, 2012. Prior to that he was Senior Vice President Media Rela-tions & Corporate news. Member of the Group Executive Team since July 1, 2012. With Volvo since 2001. Holdings in Volvo, own and related parties: 20,288 shares, including 10,523 Series B shares.
Anders OsbergCFO and Executive Vice President Corporate Finance & Control
Born 1961. Bachelor of Sci-ence. Has held various posi-
tions within Volvo Group Finance and Volvo Treasury, most recently as President of Volvo Treasury Group 2000–2011. Member of the Group Executive Team since 2012. With Volvo 1985–1988 and since 1992. Holdings in Volvo, own and related parties: 18,950 Series B shares.
Kerstin RenardExecutive Vice President Corporate Human Resources
Born 1961. B. Sc. Sociology. Senior Vice President
Human Resources for the Volvo Group 2007–2011. Prior to that Senior Vice President Human Resources & Communication at Volvo Powertrain 2005–2006. Member of the Group Executive Team since 2012. With Volvo since 2005. Holdings in Volvo, own and related parties: 13,607 shares, including 13,447 Series B shares.
Magnus CarlanderExecutive Vice President Corporate Process & IT
Born 1955. Master Mechan-ical Engineering. Has held various senior positions in
the Volvo Group, most recently as President of Volvo IT 2008–2011. Member of the Group Executive Team since 2012. With Volvo since 1985. Holdings in Volvo, own and related parties: 53,105 shares, including 52,962 Series B shares.
Håkan Karlsson Executive Vice President Business Areas
Born 1961. M. Sc. Engineer-ing. President and CEO of Volvo Buses 2003–2011.
President of Volvo Logistics 2000–2003. Member of the Group Executive Team since 2003. With Volvo since 1986. Holdings in Volvo, own and related parties: 49,095 shares, including 47,521 Series B shares.
Karin FalkExecutive Vice President Corporate Strategy
Born 1965. B. Sc. Business Administration. Has held various positions within the
Volvo Group, most recently as President of Volvo Group nAP (non-Automotive Purchasing) 2008–2011. Member of the Group Executive Team since 2012. With Volvo 1988–1999 and since 2008. Holdings in Volvo, own and related parties: 7,304 shares, including 5,064 Series B shares.
Martin WeissburgExecutive Vice President Volvo Financial Services
Born 1962. Bachelor of Sci-ence, Master of Business Administration. Head of
Volvo Financial Services since 2010. President of Volvo Financial Services the Americas 2005–2010. Member of the Group Executive Team 2010–2011 and since 2013. With Volvo since 2005. Holdings in Volvo, own and related parties: 14,675 Series B shares.
Eva PerssonExecutive Vice President Corporate Legal & Com-pliance and General Counsel
Born 1953. Master of Laws. Responsible within the Group for legal matters and General Counsel of the Volvo Group since 1997. Vice President, Head of Corporate Legal of AB Volvo 1993–1997. Member of the Group Executive Team since 1997. With Volvo since 1988. Secretary to the Volvo Board since 1997. Board member: Handelsbanken Region Väst and norsk Hydro ASA. Holdings in Volvo, own and related parties: 64,468 shares, including 62,909 Series B shares.
Jan-Eric SundgrenExecutive Vice President Public & Environmental Affairs
Born 1951. M. Sc. Engineer-ing, PhD in solid state Phys-
ics, Professor in materials science. Responsible within the Volvo Group for public & environmen-tal affairs since 2006. Member of the Group Executive Team since 2006. With Volvo since 2006. Chairman: SP Technical Research Insti-tute of Sweden. Board member: Hogia AB. Member of the Royal Swedish Academy of Engi-neering Sciences. Holdings in Volvo, own and related parties: 32,872 shares, including 32,729 Series B shares.
Patrick OlneyExecutive Vice President Volvo Construction Equipment
Born 1968. B. Sc. Business Administration. Head of
Volvo Construction Equipment since 2011. Prior to that he has held various senior posi-tions at Volvo Construction Equipment, most recently as Vice President and Head of Opera-tions. Member of the Group Executive Team since 2011. With Volvo since 1997. Holdings in Volvo, own and related parties: 13,795 Series B shares.

the Group Executive Team were entitled to vari-
able salary according to a program for variable
remuneration determined by the Board. The per-
formance targets defined in the program were
primarily related to operating margin and opera-
ting rolling cash flow.
The purpose of the program for variable remu-
neration is to create an incentive for the executives
to strive for the Volvo Group developing in such a
manner that the defined performance targets are
achieved, thereby constituting a management
tool. Accordingly, the performance targets set by
the Board for variable remuneration inter alia
relate to the Group’s financial targets for improved
operating margin.
The Remuneration Committee conducts an
annual evaluation of the remuneration policy and
Volvo’s system for variable remuneration to execu-
tives and the Board prepares a special report of
this evaluation and the conclusions. The report on
the evaluation for 2012 will be available on Volvo’s
website not later than two weeks prior to the
Annual General Meeting 2013, www.volvogroup.
com. For more information about remuneration to
the Group Executive Team and an account of out-
standing share and share-price related incentive
programs to the management, refer to note 27 in
the Group’s notes in the Annual Report.
Changes to the Group Executive Team
On July 1, 2012, Per Löjdquist retired and the-
reby resigned from the Group Executive
Team and from his position as Executive Vice
President Corporate Communication. Mårten
Wikforss assumed the position on the same date.
On September 30, 2012, Pär Östberg resig-
ned from the Group Executive Team and from
his position as Executive Vice President Truck
Joint Ventures. In conjunction with Pär
Östberg’s departure from the Volvo Group,
Truck Joint Ventures organizationally became
part of Group Trucks Sales & Marketing and
JVs APAC, headed by Joachim Rosenberg.
On January 1, 2013, the Head of Volvo
Financial Services, Martin Weissburg, joined the
Group Executive Team. On January 1, 2013, Martin
Weissburg thereby assumed the position as Exe-
cutive Vice President Volvo Financial Services.
On April 1, 2013, Eva Persson will retire and
resign from the Group Executive Team and from
her position as General Counsel and Executive
Vice President Corporate Legal & Compliance.
Sofia Frändberg will assume this position on the
same date.
86
CORPORATE GOVERnAnCE REPORT 2012 CorporaTe GoVernanCe

internal control over financial reporting
Control environment
Fundamental to Volvo’s control environment is
the business culture that is established within
the Group and in which managers and employ-
ees operate. Volvo works actively on communi-
cations and training regarding the company’s
basic values as described in The Volvo Way, an
internal document concerning Volvo’s business
culture, and the Group’s Code of Conduct, to
ensure that good morals, ethics and integrity
permeate the organization.
The foundation of the internal control process
relating to the financial reporting is based on the
Group’s directives, policies and instructions, as
well as the responsibility and authority structure
that has been adapted to the Group’s organiza-
tion to create and maintain a satisfactory control
environment. The principles for internal controls
and directives and policies for the financial
reporting are contained in Volvo Financial Poli-
cies & Procedures (FPP), an internal document
comprising all important instructions, rules and
principles.
Risk assessment
Risks relating to financial reporting are evalua-
ted and monitored by the Board through the
Audit Committee inter alia through identifying
what types of risks that typically could be consi-
dered as material and where they would typically
occur. The annual evaluation of internal control
activities conducted by the Internal Control and
Corporate Audit functions, is based on a risk-
based model. The evaluation of the risk that
errors will appear in the financial reporting is
based on a number of criteria. Complex accoun-
ting principles can, for example, mean the finan-
cial reporting risks being inaccurate for those
posts that are covered by such principles. Valua-
tion of a particular asset or liability according to
various evaluation criteria can also constitute a
risk. The same is true for complex and/or chan-
ging business circumstances.
Control activities
In addition to the Board of AB Volvo and its
Audit Committee, the management groups and
other decision-making bodies in the business
areas, Group Functions and Group companies
constitute overall supervisory bodies.
Several control activities are applied in the
ongoing business processes to ensure that
potential errors or deviations in the financial
reporting are prevented, discovered and correc-
ted. Control activities range from review of out-
come results in management group meetings
to specific reconciliation of accounts and analy-
ses of the ongoing processes for financial
reporting.
Responsibility for ensuring that control activi-
ties in the financial processes are appropriate
and in accordance with the Group’s policies and
instructions are compiled in the Group’s financial
reporting function. The Group’s shared service
center is responsible for the performance of
control acitvities including the responsibility for
ensuring that authority structures are designed
in accordance with good internal control so that
one person cannot perform an activity and then
perform the control of the same activity. Control
activities within IT security and maintenance
are a key part of Volvo’s internal control over
financial reporting.
Information and communication
Policies and instructions relating to the financial
reporting are updated and communicated on a
regular basis from management to all affected
employees. The Group’s financial reporting fun-
ction has direct operating responsibility for the
daily financial reporting and works to ensure a uni-
form application of the Group’s policies, principles
and instructions for the financial reporting and to
The Board is responsible for the internal con-
trols according to the Swedish Companies Act
and the Code. The purpose of this report is to
provide shareholders and other interested par-
ties with an understanding of how internal con-
trol is organized at Volvo with regard to financial
reporting. The description has been designed in
accordance with the Swedish Annual Accounts
Act and is thus limited to internal control over
financial reporting.
Introduction
Volvo primarily applies internal control princip-
les introduced by the Committee of Sponsoring
Organizations of the Treadway Commission
(COSO). The COSO principles consist of five
interrelated components. These are: control
environment, risk assessment, control activities,
information and communication and follow-up.
Volvo has a specific function for internal con-
trol. The objective of the Internal Control function
is to provide support for management groups
within business areas and Group Functions,
allow ing them to continuously provide solid and
improved internal controls relating to financial
reporting. Work that is conducted through this
function is primarily based on a methodology that
aims to ensure compliance with directives and
policies, and to create effective conditions for
specific control activities in key processes related
to financial reporting. The Audit Committee is
informed of the results of the work performed by
the Internal Control function within Volvo with
regard to risks, control activities and follow-up on
the financial reporting.
Volvo also has an Corporate Audit function
with the primary task of independently monitoring
that companies in the Group follow the principles
and rules that are stated in the Group’s directives,
policies and instructions for financial reporting.
The head of the Corporate Audit function reports
directly to the CEO, and to the Group’s General
Counsel and the Board’s Audit Committee.
87

identify and communicate shortcomings and
areas of improvement in the processes for
financial reporting.
Follow-up
Ongoing responsibility for follow-up rests with
the Group’s financial reporting function. In addi-
tion, the Corporate Audit and the Internal Con-
trol functions conduct review and follow-up
activities in accordance with what is described
in the introduction of this report. More specifi-
cally, the Internal Control function runs and
coordinates evaluation activities through the
“Volvo Group Internal Control Programme,” with
the purpose of systematically evaluating the
quality of the internal control over financial
reporting on an annual basis. An annual evalua-
tion plan is established and presented to the
Audit Committee. This evaluation program com-
prises three main areas:
1. Group-wide controls: Self-assessment pro-
cedure carried out by management teams
at business area, Group Function and com-
pany levels. The main areas evaluated are
compliance with the Group’s financial direc-
tives and policies found in FPP, The Volvo
Way and the Group’s Code of Conduct.
2. Process controls at transaction level: Pro-
cesses related to the financial reporting
are evaluated by testing procedures/con-
trols based on a framework for internal
control over financial reporting, Volvo
Internal Control Standards (VICS). The
framework focuses on the financial
reporting areas deemed to have a relatively
higher risk for potential errors due to factors
such as complex accounting principles,
complex or changed business operations.
3. General IT controls: Processes for mainte-
nance, development and access manage-
ment of financial applications are evaluated
by testing procedures and controls.
The results of the evaluation activities are reported
to Group management and the Audit Committee.
Gothenburg, February 21, 2013
Volvo (publ)
The Board of Directors
To the annual meeting of the shareholders in AB
Volvo, corporate identity number 556012-5790
It is the Board of Directors who is responsible for
the Corporate Governance Report for the year
2012 on pages 74–88 and that it has been prepa-
red in accordance with the Annual Accounts Act.
We have read the corporate governance report
and based on that reading and our knowledge of
the company and the group we believe that we
have a sufficient basis for our opinions. This
means that our statutory examination of the
Corporate Governance Report is different and
substantially less in scope than an audit con-
ducted in accordance with International Stan-
dards on Auditing and generally accepted audi-
ting standards in Sweden.
In our opinion, the Corporate Governance
Report has been prepared and its statutory
content is consistent with the annual accounts
and the consolidated accounts.
Gothenburg, February 21, 2013
PricewaterhouseCoopers AB
Peter Clemedtson Authorized Public
AccountantLead Partner
Johan RippeAuthorized Public
AccountantPartner
auditors report on the Corpo-rate Governance report
88
CORPORATE GOVERnAnCE REPORT 2012 CorporaTe GoVernanCe

ConTenTFinancial Information 2012
page
Financial performance 90
Financial position 94
Cash-flow statement 96
Changes in consolidated Shareholders’ equity
98
Notes to financial statements
99
Parent Company AB Volvo 160
Proposed remuneration policy
172
Proposed disposition of unappropriated earnings
173
Audit report for AB Volvo 174
Eleven-year summary 175
Note The Volvo Group page
1 Accounting principles 99
2 Key sources of estimation uncertainty 101
3 Acquisitions and divestments of shares in subsidiaries
102
4 Goals and policies in financial risk management
104
5 Investments in associated companies and other shares and participations
109
6 Segment reporting 112
7 Income 114
8 Other operating income and expenses 115
9 Other financial income and expenses 115
10 Income taxes 116
11 Minority interests 117
12 Intangible assets 118
13 Tangible assets 120
14 Leasing 122
15 Customer-financing receivables 123
16 Receivables 124
17 Inventories 125
18 Marketable securities and liquid funds 126
19 Equity and number of shares 126
20 Provisions for post-employment benefits
127
21 Other provisions 131
22 Liabilities 133
23 Assets pledged 134
24 Contingent liabilities 134
25 Transactions with related parties 135
26 Government grants 136
27 Personnel 136
28 Fees to the auditors 139
29 Cash-flow 139
30 Financial instruments 140
31 Changes in Volvo Group financial reporting 2013
144
32 Changes in Volvo Group financial reporting 2012
158
Note Parent Company page
1 Accounting principles 164
2 Intra-Group transactions 164
3 Administrative expenses 164
4 Other operating income and expenses
165
5 Income from investments in Group companies
165
6 Income from investments in associated companies
165
7 Income from other investments 165
8 Interest income and expenses 165
9 Other financial income and expenses
165
10 Allocations 165
11 Income taxes 166
12 Intangible and tangible assets 166
13 Investments in shares and participations
167
14 Other receivables 167
15 untaxed reserves 167
16 Provisions for post- employment benefits
168
17 Other provisions 168
18 non-current liabilities 168
19 Other liabilities 168
20 Contingent liabilities 168
21 Cash-flow 168
Amounts in SEK M unless otherwise specified. The amounts within parentheses refer to the preceding year, 2011.
89

For the Volvo Group, 2012 was characterized by a strong first half of the year and a weaker second half, which resulted in lower sales and declining operating income compared to 2011. However, net sales for the year were above SEK 300 billion and operating income amounted to SEK 17.6 billion.
finanCial performanCeLower earnings
inCome sTaTemenTs VolVo GroupIndustrial operations Customer Finance Eliminations Volvo Group
SEK M 2012 2011 2012 2011 2012 2011 2012 2011
Net sales note 6,7 296,031 303,589 9,783 8,883 (2,167) (2,104) 303,647 310,367
Cost of sales (231,216) (233,097) (6,036) (5,693) 2,167 2,104 (235,085) (236,685)Gross income 64,815 70,492 3.747 3,190 0 0 68,562 73,682
Research and development expenses note 6 (14,794) (13,276) 0 0 0 0 (14,794) (13,276)Selling expenses (26,582) (25,181) (1,666) (1,618) 0 0 (28,248) (26,799)Administrative expenses (5,639) (4,753) (30) 0 0 0 (5,669) (4,753)Other operating income and expenses note 8 (1,600) (1,045) (559) (603) 0 0 (2,160) (1,649)Income from investments in associated companies note 5,6 (23) (82) 0 0 0 0 (23) (81)Income from other investments note 5 (46) (225) 0 0 0 0 (47) (225)Operating income 16,130 25,930 1,492 969 0 0 17,622 26,899
Interest income and similar credits 510 644 0 0 0 (37) 510 608Interest expenses and similar charges (2,476) (2,912) 0 0 0 37 (2,476) (2,875)Other financial income and expenses note 9 (301) 297 0 0 0 0 (301) 297Income after financial items 13,863 23,959 1,492 969 0 0 15,355 24,929
Income taxes note 10 (3,663) (6,490) (434) (323) 0 0 (4,097) (6,814)Income for the period* 10,200 17,496 1,058 646 0 0 11,258 18,115
* Attributable to: Equity holders of the parent company 11,039 17,751Minority interests note 11 219 364
11,258 18,115
Basic earnings per share, SEK note 19 5.44 8.76Diluted earnings per share, SEK note 19 5.44 8.75
oTher ComprehensiVe inComeSEK M 2012 2011
Income for the period 11,258 18,115
Translation differences on foreign operations (3,916) (980)
Translation differences on hedge instruments of net investment in foreign operations 0 (3)
Accumulated translation difference reversed to income (118) (30)
Available-for-sale investments (4) 39Change in cash flow hedge reserve note 19 8 (144)Other comprehensive income, net of income taxes (4,030) (1,118)
Total comprehensive income for the period 7,228 16,997
Attributable to:
Equity holders of the Parent Company 7,092 16,681
Minority interests 136 316
7,228 16,997
90
FInAnCIAL InFORMATIOn 2012
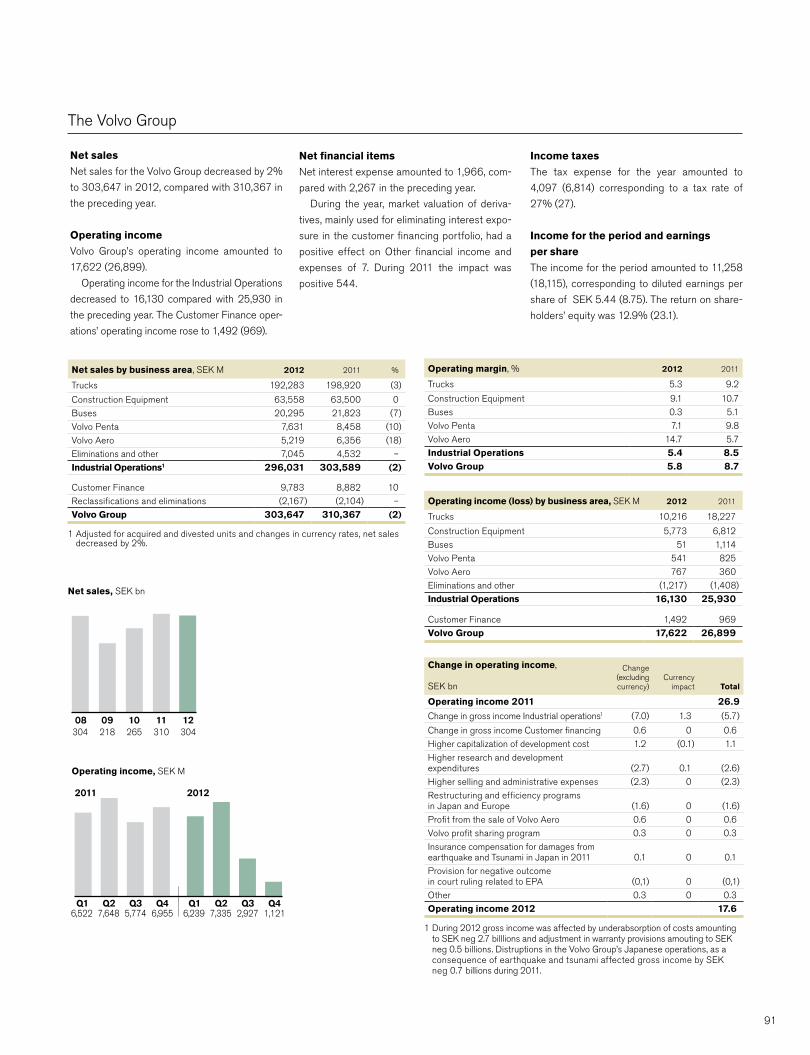
Net sales
net sales for the Volvo Group decreased by 2%
to 303,647 in 2012, compared with 310,367 in
the preceding year.
Operating income
Volvo Group’s operating income amounted to
17,622 (26,899).
Operating income for the Industrial Operations
decreased to 16,130 compared with 25,930 in
the preceding year. The Customer Finance oper-
ations’ operating income rose to 1,492 (969).
Net financial items
net interest expense amounted to 1,966, com-
pared with 2,267 in the preceding year.
During the year, market valuation of deriva-
tives, mainly used for eliminating interest expo-
sure in the customer financing portfolio, had a
positive effect on Other financial income and
expenses of 7. During 2011 the impact was
positive 544.
Income taxes
The tax expense for the year amounted to
4,097 (6,814) corresponding to a tax rate of
27% (27).
Income for the period and earnings
per share
The income for the period amounted to 11,258
(18,115), corresponding to diluted earnings per
share of SEK 5.44 (8.75). The return on share-
holders’ equity was 12.9% (23.1).
The Volvo Group
Net sales by business area, SEK M 2012 2011 %
Trucks 192,283 198,920 (3)
Construction Equipment 63,558 63,500 0Buses 20,295 21,823 (7)Volvo Penta 7,631 8,458 (10)Volvo Aero 5,219 6,356 (18)Eliminations and other 7,045 4,532 –Industrial Operations1 296,031 303,589 (2)
Customer Finance 9,783 8,882 10Reclassifications and eliminations (2,167) (2,104) –Volvo Group 303,647 310,367 (2)
1 Adjusted for acquired and divested units and changes in currency rates, net sales decreased by 2%.
Change in operating income,
SEK bn
Change (excluding currency)
Currency impact Total
Operating income 2011 26.9
Change in gross income Industrial operations1 (7.0) 1.3 (5.7)
Change in gross income Customer financing 0.6 0 0.6Higher capitalization of development cost 1.2 (0.1) 1.1Higher research and development expenditures (2.7) 0.1 (2.6)Higher selling and administrative expenses (2.3) 0 (2.3)Restructuring and efficiency programs in Japan and Europe (1.6) 0 (1.6)Profit from the sale of Volvo Aero 0.6 0 0.6Volvo profit sharing program 0.3 0 0.3Insurance compensation for damages from earthquake and Tsunami in Japan in 2011 0.1 0 0.1Provision for negative outcome in court ruling related to EPA (0,1) 0 (0,1)Other 0.3 0 0.3Operating income 2012 17.6
1 During 2012 gross income was affected by underabsorption of costs amounting to SEK neg 2.7 billlions and adjustment in warranty provisions amouting to SEK neg 0.5 billions. Distruptions in the Volvo Group’s Japanese operations, as a consequence of earthquake and tsunami affected gross income by SEK neg 0.7 billions during 2011.
Operating income (loss) by business area, SEK M 2012 2011
Trucks 10,216 18,227
Construction Equipment 5,773 6,812Buses 51 1,114Volvo Penta 541 825Volvo Aero 767 360Eliminations and other (1,217) (1,408)Industrial Operations 16,130 25,930
Customer Finance 1,492 969Volvo Group 17,622 26,899
Operating margin, % 2012 2011
Trucks 5.3 9.2
Construction Equipment 9.1 10.7Buses 0.3 5.1Volvo Penta 7.1 9.8Volvo Aero 14.7 5.7Industrial Operations 5.4 8.5Volvo Group 5.8 8.7
Net sales, SEK bn
12111009310265218304
08304
Operating income, SEK M
2011
Q46,955
Q35,774
Q27,648
Q16,522
2012
Q41,121
Q32,927
Q27,335
Q16,239
91

In 2012, net sales for the Volvo Group’s Indus-
trial Operations decreased by 2% to 296,031
(303,589).
Compared with 2011, sales increased in
north America, Eastern Europe and in some
smaller markets, however sales decreased in
Western Europe, South America and Asia.
Lower earnings
In 2012, operating income for the Volvo Group’s
Industrial Operations amounted to 16,130 com-
pared to 25,930 in the preceding year. The
operating margin for the Industrial Operations
amounted to 5.4% (8.5).
The lower profitability was the result of
decreased sales, low capacity utilization in the
industrial system and restructuring charges
during the second half of the year. Income was
impacted by restructuring measures amounting
to 1,524 mainly refering to Trucks and to Buses.
In addition, increased warranty reserves in
Trucks amounted to 500. The divestment of
Volvo Aero had a positive impact of 568.
In 2012, research and development expenses
amounted to 14,794 (13,276). The continued
high cost level is a consequence a large number
of projects related to the introduction of new
products in the next few years.
Selling expenses increased by 6%. Costs
associated with the launch of new products
increased the expenses.
Impact of exchange rates on
operating income
The combined effect of changed exchange
rates had a positive effect on operating income
of approximately to SEK 1.3 billion in 2012, com-
pared with 2011. This is mainly attributable to
that the uSD was strong during most of 2012.
Income Statement Industrial Operations, SEK M 2012 2011
net sales 296,031 303,589
Cost of sales (231,216) (233,097)Gross income 64,815 70,492
Gross margin, % 21.9 23.2
Research and development expenses (14,794) (13,276)Selling expenses (26,582) (25,181)Administrative expenses (5,639) (4,753)Other operating income and expenses (1,600) (1,045)Income from investments in associated companies (23) (82)Income from other investments (46) (225)Operating income (loss) Industrial Operations 16,130 25,930
Operating margin, % 5.4 8.5
Impact of exchange rates on operating incomeCompared with preceding year, SEK M
net sales1 1,904
Cost of sales (610)Research and development expenses (15)Selling and administrative expenses 25Total effect of changes in exchange rates on operating income 1,304
1 The Volvo Group sales are reported at monthly spot rates and the effects of currency hedges are reported among Cost of sales.
Operating net flow per currency Local currency, million 2012 2011
uSD 4,421 3,970
EuR (158) 57GBP 472 555CAD 600 397JPy (x100) (181) (218)
Net sales by market area, SEK M 2012 2011 %
Western Europe 88,325 97,925 (10)
Eastern Europe 20,751 20,298 2north America 68,297 58,253 17South America 27,970 34,013 (18)Asia 68,500 73,017 (6)Other markets 22,188 20,083 10Total Industrial Operations 296,031 303,589 (2)
Research and development costs
121110090813.313.013.214.34.4
14.85.05.06.34.9
Research and development costs, SEK bn
Research and development costs,% of IndustrialOperations' net sales
Industrial Operations
92
FInAnCIAL InFORMATIOn 2012

Total new financing volume in 2012 amounted to
SEK 46.6 billion (44.8). Adjusted for changes in
exchange rates, new business volume increased
by 5.3% compared to 2011 as a result of increased
penetration levels. In total, 50,994 new vehicles
and machines (49,757) from the Volvo Group were
financed during the year. In the markets where
financing is offered, the average penetration rate
was 27% (25).
As of December 31, 2012, the net credit port-
folio amounted to 99,690 (94,275). The funding
of the credit portfolio is matched in terms of
maturity, interest rates and currencies in accord-
ance with Volvo Group policy. Read more in
Note 15.
The operating income for the year amounted to
1,492 compared to 969 in the previous year.
Return on shareholders’ equity amounted to
12.5% (7.3). The equity ratio at the end of the year
amounted to 8.1% (9.1). The improvement in prof-
itability is driven mainly by higher earning assets
and good margins. During the year, credit provision
expenses amounted to 640 (682) while write-offs
of 577 (804) were recognized. The write-off ratio
for 2012 amounted to 0.58% (0.93). At the end of
December 31, 2012, credit reserves amounted to
1.23% (1.33) of the credit portfolio.
Income Statement Customer Finance, SEK M 2012 2011
Finance and lease income 9,783 8,883
Finance and lease expenses (6,036) (5,693)Gross income 3,747 3,190
Selling and administrative expenses (1,696) (1,618)Credit provision expenses (640) (682)Other operating income and expenses 81 78Operating income (loss) 1,492 969
Income taxes (434) (323)Income (loss) for the period 1,058 646
Return on Equity 12.5 7.3
Key ratios, Customer Finance1 2012 2011
Credit portfolio net, SEK M 99,690 94,275Operating income, SEK M 1,492 969Return on shareholders' equity, % 12.5 7.3
Total penetration rate, % 27 25
Penetration by business area1, %
Volvo CE 37 35
Volvo Trucks 30 27
Renault Trucks 23 19
Mack Trucks 19 20
Buses 21 15uD Trucks 13 14
1 Share of unit sales financed by Volvo Financial Services in relation to the total num-ber units sold by the Volvo Group in markets where financial services are offered.
Customer Finance Operations
93

The Volvo Group’s cash, cash equivalents and
marketable securities combined, amounted to
SEK 28.9 billion at December 31, 2012 which
includes SEK 0.2 billion not available for use by
the Volvo Group and SEK 9.4 billion where other
limitations exist, mainly liquid funds in countries
where exchange controls or other legal restric-
tions apply. In addition to this, granted but not uti-
lized credit facilities amounted to SEK 33.1 billion.
Total assets in the Volvo Group amounted to
SEK 338.7 billion as of December 31, 2012, a
decrease of SEK 14.5 billion compared to year-
end 2011. The decrease is mainly a result of
changes in currency rates and the divestment
of Volvo Aero which is offset by increased cus-
tomer financing receivables due to portfolio
growth in the Customer Finance Operations
Net debt in the Volvo Group’s Industrial Operations amounted to SEK 23.0 billion at December 31, 2012, equal to 29.3% of shareholders’ equity. Excluding provisions for post-employment benefits the Industrial Operation’s net debt amounted to SEK 19.0 billion, which was equal to 24.3% of shareholders’ equity.
finanCial posiTionContinued strong financial position
BalanCe sheeTs VolVo Group – asseTsIndustrial Operations Customer Finance Eliminations Volvo Group
SEK MDec 31
2012Dec 31
2011Dec 31
2012Dec 31
2011Dec 31
2012Dec 31
2011Dec 31
2012Dec 31
2011
Assets
Non-current assets Intangible assets note 12 40,267 39,385 106 122 – – 40,373 39,507Tangible assets note 13
Property, plant and equipment 54,145 53,563 105 94 – – 54,250 53,657Investment property 754 883 – – – – 754 883Assets under operating leases 21,263 16,749 12,543 11,525 (4,784) (4,352) 29,022 23,922
Financial assets Investments in associated companies note 5 2,045 684 – – – – 2,045 684Other shares and participations note 5 839 1,187 6 3 – – 845 1,190non-current customer-financing receivables note 15 600 579 47,329 44,651 (6,773) (4,612) 41,156 40,618Deferred tax assets note 10 10,406 12,480 760 358 – – 11,166 12,838Prepaid pensions note 20 2,708 2,263 16 14 – – 2,724 2,277non-current interest-bearing receivables note 16 653 757 – – (316) (63) 337 694Other non-current receivables note 16 3,565 4,500 127 50 (373) (235) 3,319 4,315
Total non-current assets 137,245 133,030 60,992 56,817 (12,246) (9,262) 185,991 180,585
Current assets Inventories note 17 40,057 43,828 352 771 – – 40,409 44,599Current receivables
Customer-financing receivables note 15 797 1,123 39,946 38,050 (910) (1,092) 39,833 38,081Tax assets 1,173 1,152 35 48 – – 1,208 1,200Interest-bearing receivables note 16 3,038 1,461 – 226 (464) (1,020) 2,574 667
Internal funding1 4,612 2,253 – – (4,612) (2,253) – –Accounts receivable note 16 27,228 27,492 121 207 – – 27,349 27,699Other receivables note 16 11,952 13,438 2,651 1,411 (2,114) (1,024) 12,489 13,825
non interest-bearing assets held for sale note 3 – 9,344 – – – – – 9,344Interest-bearing assets held for sale note 3 – 4 – – – – – 4Marketable securities note 18 3,129 6,838 1 24 – – 3,130 6,862Cash and cash equivalents note 18 24,017 29,113 2,116 1,593 (374) (327) 25,759 30,379Total current assets 116,003 136,046 45,222 42,330 (8,474) (5,717) 152,751 172,659Total assets 253,248 269,076 106,214 99,147 (20,720) (14,979) 338,742 353,244
1 Internal funding is internal lending from Industrial Operations to Customer Finance.
and an increase in assets under operating lease
mainly related to the construction equipment
rental operation.
The Volvo Group’s intangible assets amounted
to SEK 40.4 billion as of December 31, 2012.
Investments in research and development
amounted to SEK 5.4 billion in 2012, resulting
in a net value of capitalized development costs
of SEK 13.4 billion at the end of the year. The
Volvo Group’s total goodwill amounted to SEK
23.3 billion as of December 31, 2012, an
decrease by SEK 0.6 billion compared to year-
end 2011 as a result of translation differences.
The tangible assets increased by SEK 5.6 bil-
lion during 2012, mainly related to the expansion
in the construction equipment rental operation.
The value of the inventories decreased by
SEK 4.2 billion during 2012. The decrease is
mainly related to finished products within trucks
and construction equipment.
The net value of assets and liabilities related to
pensions and similar obligations amounted to
SEK 4.0 billion as of December 31, 2012, a
decrease of SEK 0.4 billion compared to year-end
2011. Post-employment benefits valued at SEK
13.9 billion were reported outside the Volvo
Group’s balance sheet. For further information
see note 20.
At year-end, the equity ratio in the Industrial
Operations was 30.9% and in the Volvo Group
25.7%. Equity in the Volvo Group amounted to
SEK 86.9 billion at December 31, 2012.
94
FInAnCIAL InFORMATIOn 2012

Net financial position, SEK M Industrial Operations Volvo Group
Dec 312012
Dec 312011
Dec 312012
Dec 312011
non-current interest-bearing assets non-current customer-financing receivables – – 41,156 40,618
non-current interest-bearing receivables 653 757 337 694
Current interest-bearing assets
Customer-financing receivables – – 39,833 38,081
Interest-bearing receivables 3,038 1,461 2,574 667Internal funding 4,612 2,253 – –
Interest-bearing assets held for sale – 4 – 4Marketable securities 3,129 6,838 3,130 6,862Cash and bank 24,017 29,113 25,759 30,379Total financial assets 35,449 40,426 112,789 117,305
non-current interest-bearing liabilities Bond loans (43,092) (38,192) (43,092) (38,192)Other loans (33,356) (38,848) (38,433) (47,765)Internal funding 33,990 35,453 – –
Current interest-bearing liabilities Loans (45,760) (38,644) (50,317) (44,522)Internal funding 33,746 24,837 – –
Interest-bearing liabilities held for sale – (6) – (6)Total financial liabilities (54,472) (55,400) (131,842) (130,485)Net financial position excl. post employment benefits (19,023) (14,974) (19,053) (13,180)
Provision for post employment benefits, net (3,955) (4,372) (3,973) (4,388)Net financial position incl. post employment benefits (22,978) (19,346) (23,026) (17,568)
Net debt, Industrial Operations, SEK bn
2011 2012
Q4(23.0)
Q3(34.9)
Q2(27.5)
Q1(21.8)
Q4(19.3)
Q3(29.6)
Q2(28.3)
Q1(27.3)
BalanCe sheeTs VolVo Group – shareholders’ eQuiTy and liaBiliTiesIndustrial Operations Customer Finance Eliminations Volvo Group
SEK MDec 31
2012Dec 31
2011Dec 31
2012Dec 31
2011Dec 31
2012Dec 31
2011Dec 31
2012Dec 31
2011
Equity and liabilities Equity attributable to the equity holder of the Parent Company note 19 77,055 75,582 8,593 8,999 – – 85,648 84,581Minority interests note 11 1,266 1,100 – – – – 1,266 1,100Total equity 78,321 76,682 8,593 8,999 0 – 86,914 85,681
Non-current provisions Provisions for post-employment benefits note 20 6,663 6,635 34 30 – – 6,697 6,665Provisions for deferred taxes note 10 3,149 4,171 1,879 1,465 – – 5,028 5,636Other provisions note 21 5,588 5,492 187 154 8 2 5,783 5,648
Total non-current provisions 15,400 16,298 2,100 1,649 8 2 17,508 17,949Non-current liabilities note 22
Bond loans 43,092 38,192 – – – – 43,092 38,192Other loans 33,356 38,848 11,630 8,974 (6,553) (57) 38,433 47,765Internal funding1 (33,990) (35,453) 34,298 33,459 (308) 1,994 – –Other liabilities 13,828 12,902 742 740 (3,856) (3,195) 10,714 10,447
Total non-current liabilities 56,286 54,489 46,670 43,173 (10,717) (1,258) 92,239 96,404Current provisions Note 21 10,916 9,438 50 92 10 1 10,976 9,531Current liabilities note 22
Loans 45,760 38,644 6,393 6,741 (1,836) (863) 50,317 44,522Internal funding1 (33,746) (24,837) 38,600 35,373 (4,854) (10,536) – –non interest-bearing liabilities held for sale note 3 – 4,710 – – – – – 4,710Interest-bearing liabilities held for sale note 3 – 6 – – – – – 6Trade payables 47,205 56,546 159 242 – – 47,364 56,788Tax liabilities 807 2,220 (154) 171 – – 653 2,391
Other liabilities note 22 32,299 34,880 3,803 2,707 (3,331) (2,325) 32,771 35,262
Total current liabilities 92,325 112,169 48,801 45,234 (10,021) (13,724) 131,105 143,679Total equity and liabilities 253,248 269,076 106,214 99,147 (20,720) (14,979) 338,742 353,244
1 Internal funding is internal lending from Industrial Operations to Customer Finance.
Change in net financial position, Industrial Operations, SEK bn 2012 2011
Net financial position at the beginning of period (19.3) (24.7)
Cash flow from operating activities 12.4 26.9Investments in fixed assets (to)/from (18.2) (14.0)Disposals 0.9 1.2
Operating cash-flow (4.9) 14.1
Investments and divestments of shares (1.2) (0.1)Acquired and divested operations, net 3.7 (3.0)Capital injections (to)/from Customer Finance Operations 0.9 (0.1)Currency effect 3.6 (1.9)Dividend paid to AB Volvo shareholders (6.1) (5.1)Dividend paid to minority shareholders 0.0 0.0Other 0.3 1.5Total change (3.7) 5.4Net financial position at end of period (23.0) (19.3)
95

During 2012, operating cash flow in the Industrial Operations amounted to a negative SEK 4.8 billion (positive 14.1).
Cash-flow sTaTemenTnegative operating cash-flow
ConsolidaTed Cash-flow sTaTemenTsIndustrial operations Customer Finance Eliminations Volvo Group Total
SEK M 2012 2011 2012 2011 2012 2011 2012 2011
Operating activities
Operating income 16,130 25,957 1,492 942 0 0 17,622 26,899Depreciation tangible assets note 13 5,928 6,109 20 15 0 0 5,948 6,124Amortization intangible assets note 12 3,168 3,227 23 20 0 0 3,191 3,247Depreciation leasing vehicles note 13 2,890 2,083 2,726 2,537 0 1 5,616 4,621Other non-cash items note 29 796 622 565 614 69 26 1,430 1,262Total change in working capital whereof (9,184) (4,180) (14,574) (13,831) 1,818 2,926 (21,940) (15,085)
Change in accounts receivable (1,227) (3,094) 79 (101) 0 0 (1,148) (3,195)Change in customer financing receivables 228 (240) (14,812) (14,202) 1,883 3,007 (12,701) (11,435)Change in inventories 627 (7,099) 258 (155) 0 0 885 (7,254)Change in trade payables (7,552) 9,871 (81) 107 0 0 (7,633) 9,978Other changes in working capital (1,260) (3,618) (18) 520 (65) (81) (1,343) (3,179)
Interest and similar items received 527 720 0 – 6 (42) 533 678Interest and similar items paid (2,825) (3,391) 0 – (75) 12 (2,900) (3,379)Other financial items (319) (184) 0 – 0 0 (319) (184)Income taxes paid (4,668) (4,129) (697) (384) (1) 0 (5,366) (4,513)Cash flow from operating activities 12,443 26,834 (10,445) (10,087) 1,817 2,923 3,815 19,670
Investing activities Investments in tangible assets (9,308) (8,267) (29) (50) (1) 27 (9,338) (8,290)Investments in intangible assets (5,281) (4,293) (19) (20) 0 0 (5,300) (4,313)Investment in leasing vehicles (3,566) (1,422) (6,496) (6,044) 76 53 (9,986) (7,413)Disposals of fixed assets and leasing vehicles 911 1,233 2,205 2,099 (6) 0 3,110 3,332Operating cash flow (4,801) 14,085 (14,784) (14,102) 1,886 3,003 (17,699) 2,986
Investments and divestments of shares, net note 5,29 (1,186) (119)Acquired and divested operations, net note 3,29 3,390 (1,590)Interest-bearing receivables incl marketable securities 3,678 2,665Cash-flow after net investments (11,817) 3,942
Financing activities Change in loans, net note 29 14,075 8,734Dividend to AB Volvo shareholders (6,083) (5,069)Dividend to minority shareholders 0 (2)Other 2 (30)Change in cash and cash equivalents excl. translation differences (3,823) 7,575
Translation difference on cash and cash equivalents (797) (162)Change in cash and cash equivalents (4,620) 7,413
Cash and cash equivalents, beginning of year note 18 30,379 22,966Cash and cash equivalents, end of year note 18 25,759 30,379
96
FInAnCIAL InFORMATIOn 2012
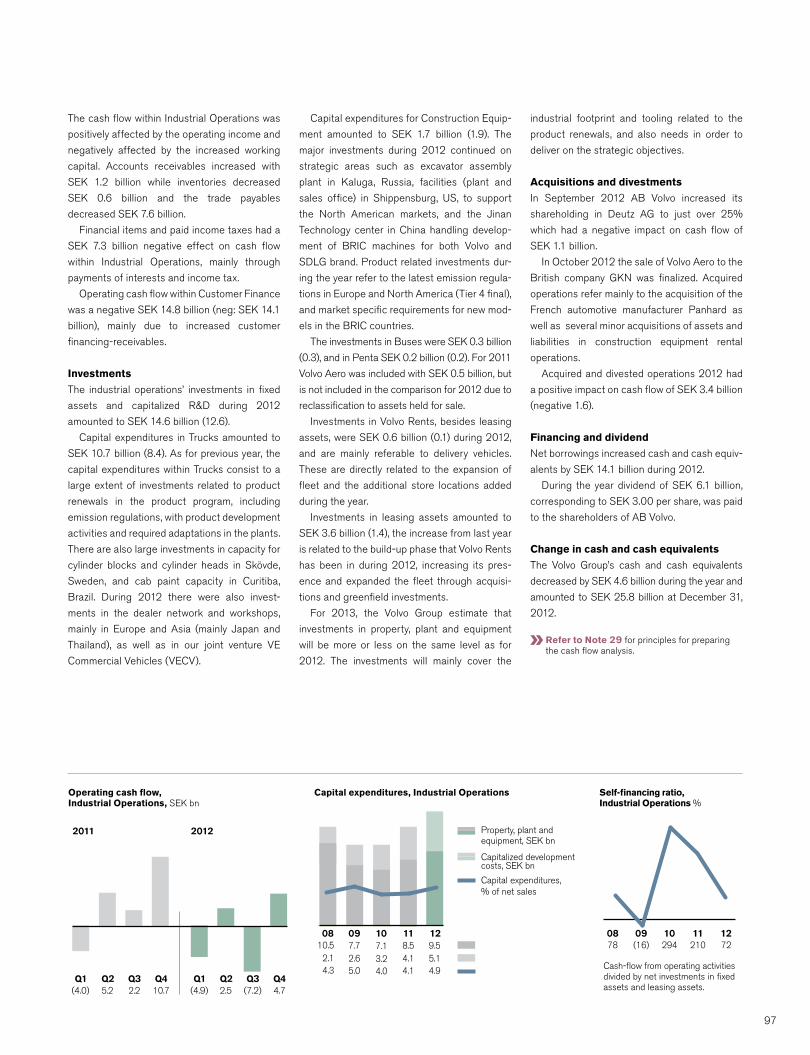
The cash flow within Industrial Operations was
positively affected by the operating income and
negatively affected by the increased working
capital. Accounts receivables increased with
SEK 1.2 billion while inventories decreased
SEK 0.6 billion and the trade payables
decreased SEK 7.6 billion.
Financial items and paid income taxes had a
SEK 7.3 billion negative effect on cash flow
within Industrial Operations, mainly through
payments of interests and income tax.
Operating cash flow within Customer Finance
was a negative SEK 14.8 billion (neg: SEK 14.1
billion), mainly due to increased customer
financing-receivables.
Investments
The industrial operations’ investments in fixed
assets and capitalized R&D during 2012
amounted to SEK 14.6 billion (12.6).
Capital expenditures in Trucks amounted to
SEK 10.7 billion (8.4). As for previous year, the
capital expenditures within Trucks consist to a
large extent of investments related to product
renewals in the product program, including
emission regulations, with product development
activities and required adaptations in the plants.
There are also large investments in capacity for
cylinder blocks and cylinder heads in Skövde,
Sweden, and cab paint capacity in Curitiba,
Brazil. During 2012 there were also invest-
ments in the dealer network and workshops,
mainly in Europe and Asia (mainly Japan and
Thailand), as well as in our joint venture VE
Commercial Vehicles (VECV).
Capital expenditures, Industrial Operations
12111009
3.24.0
7.12.65.0
7.72.14.3
10.5
Capitalized development costs, SEK bn
Capital expenditures, % of net sales
Property, plant and equipment, SEK bn
08
4.14.1
8.55.14.9
9.5
Self-financing ratio, Industrial Operations %
Cash-flow from operating activities divided by net investments in fixed assets and leasing assets.
121110090872210294(16)78
Operating cash flow, Industrial Operations, SEK bn
2012
Q44.7
Q3(7.2)
Q22.5
Q1(4.9)
2011
Q410.7
Q32.2
Q25.2
Q1(4.0)
Capital expenditures for Construction Equip-
ment amounted to SEK 1.7 billion (1.9). The
major investments during 2012 continued on
strategic areas such as excavator assembly
plant in Kaluga, Russia, facilities (plant and
sales office) in Shippensburg, uS, to support
the north American markets, and the Jinan
Technology center in China handling develop-
ment of BRIC machines for both Volvo and
SDLG brand. Product related investments dur-
ing the year refer to the latest emission regula-
tions in Europe and north America (Tier 4 final),
and market specific requirements for new mod-
els in the BRIC countries.
The investments in Buses were SEK 0.3 billion
(0.3), and in Penta SEK 0.2 billion (0.2). For 2011
Volvo Aero was included with SEK 0.5 billion, but
is not included in the comparison for 2012 due to
reclassification to assets held for sale.
Investments in Volvo Rents, besides leasing
assets, were SEK 0.6 billion (0.1) during 2012,
and are mainly referable to delivery vehicles.
These are directly related to the expansion of
fleet and the additional store locations added
during the year.
Investments in leasing assets amounted to
SEK 3.6 billion (1.4), the increase from last year
is related to the build-up phase that Volvo Rents
has been in during 2012, increasing its pres-
ence and expanded the fleet through acquisi-
tions and greenfield investments.
For 2013, the Volvo Group estimate that
investments in property, plant and equipment
will be more or less on the same level as for
2012. The investments will mainly cover the
industrial footprint and tooling related to the
product renewals, and also needs in order to
deliver on the strategic objectives.
Acquisitions and divestments
In September 2012 AB Volvo increased its
shareholding in Deutz AG to just over 25%
which had a negative impact on cash flow of
SEK 1.1 billion.
In October 2012 the sale of Volvo Aero to the
British company GKn was finalized. Acquired
operations refer mainly to the acquisition of the
French automotive manufacturer Panhard as
well as several minor acquisitions of assets and
liabilities in construction equipment rental
operations.
Acquired and divested operations 2012 had
a positive impact on cash flow of SEK 3.4 billion
(negative 1.6).
Financing and dividend
net borrowings increased cash and cash equiv-
alents by SEK 14.1 billion during 2012.
During the year dividend of SEK 6.1 billion,
corresponding to SEK 3.00 per share, was paid
to the shareholders of AB Volvo.
Change in cash and cash equivalents
The Volvo Group’s cash and cash equivalents
decreased by SEK 4.6 billion during the year and
amounted to SEK 25.8 billion at December 31,
2012.
Refer to Note 29 for principles for preparing the cash flow analysis.
97

ChanGes in ConsolidaTed shareholders’ eQuiTyShareholders’ equity attributable to equity holders of
the Parent Company
SEK MShare
capitalOther
reserves1Translation
reserveRetainedearnings Total
Minorityinterests
Totalequity
Balance at December 31, 2010 2,554 115 2,271 68,170 73,110 1,011 74,121
Income for the period – – – 17,751 17,751 364 18,115
Other comprehensive income
Translation differences on foreign operations – – (1,062) – (1,062) 82 (980)Translation differences on hedge instruments of net investments in foreign operations – – (3) – (3) – (3)Accumulated translation differences reversed to income – – (30) – (30) – (30)Available-for-sale investments: note 5, 19
Gains/losses at valuation to fair value – 39 – – 39 – 39Change in cash flow hedge reserve note 19 – (144) – – (144) – (144)Other comprehensive income for the period – (105) (1,095) – (1,200) 82 (1,118)
Total income for the period – (105) (1,095) 17,751 16,551 446 16,997
Transactions with shareholders Dividends to shareholders – – – (5,069) (5,069) (2) (5,071)Transactions with minority interests – – – (67) (67) – (67)Share based payments note 27 – – – 57 57 – 57Changes in minority interests – – – – – (356) (356)Other changes – – – (1) (1) 1 (0)Transactions with shareholders – – – (5,080) (5,080) (357) (5,437)
Balance at December 31, 2011 2,554 10 1,176 80,841 84,581 1,100 85,681
Income for the period – – – 11,039 11,039 219 11,258
Other comprehensive income
Translation differences on foreign operations – – (3,859) – (3,859) (57) (3,916)Translation differences on hedge instruments of net investments in foreign operations – – – – – – –Accumulated translation differences reversed to income – – (118) – (118) – (118)Available-for-sale investments: note 5,19
Gains/losses at valuation to fair value – (4) – – (4) – (4)Change in cash flow hedge reserve note 19 – 8 – – 8 – 8Other comprehensive income for the period – 4 (3,977) – (3,973) (57) (4,030)
Total income for the period – 4 (3,977) 11,039 7,066 162 7,228
Transactions with shareholders
Dividends to shareholders – – – (6,083) (6,083) – (6,083)Transactions with minority interests – – – – – – –Share based payments note 27 – – – 90 90 – 90Changes in minority interests – – – – – – –Other changes – – – (6) (6) 4 (2)Transactions with shareholders – – – (5,999) (5,999) 4 (5,995)
Balance at December 31, 2012 2,554 14 (2,801) 85,881 85,648 1,266 86,914
1 For specification of other reserves, see note 19.
FInAnCIAL InFORMATIOn 2012
98

notes to Financial Statements
Amounts in SEK M unless otherwise specified. The amounts within parentheses refer to the preceding year, 2011.
The consolidated financial statements for AB Volvo and its subsidiaries have been prepared in accordance with International Financial Reporting Stand-ards (IFRS) issued by the International Accounting Standards Board (IASB), as adopted by the Eu. The portions of IFRS not adopted by the Eu have no material impact on this report. This Annual Report is prepared in accordance with IAS 1 Presentation of Financial Statements and with the Swedish Com-panies Act. In addition, RFR 1 Supplementary Rules for Groups, has been applied, which is issued by the Swedish Financial Reporting Board. As of 2005, Volvo has applied International Financial Reporting Standards (IFRS) in its financial statements. In accordance with the IFRS transitions rules in IFRS 1, Volvo applies retrospective application from the IFRS transition date at January 1, 2004.
How should the Volvo Group’s accounting policies be read?Volvo describes the accounting policies in conjunction with each note in the aim of providing enhanced understanding of each accounting area. The Volvo Group focuses on describing the accounting choices has been made within the framework of the prevailing IFRS policy and avoids repeating the actual text of the standard, unless the Volvo Group consid-ers it particularly important to the understanding of the note’s content. The following symbols I/S and B/S shows which amounts in the notes that can be found in the income statement or balance sheet. Refer to the table below to see the note in which each accounting policy is listed and for the relevant and material IFRS standard.
Accounting principle Note IFRS-standard
non-current assets held for sale and discontinued operations
3, Acquisitions and divestments of shares in subsidiaries IFRS 5
Joint ventures 5, Shares and participations IAS 3131, Changes in Volvo Group Financial Reporting 2013 IFRS11, IAS28
Investments in associates5, Investment in associated companies and other shares and participations IAS 28
Operating segments 6, Segment reporting IFRS 8Revenue 7, Income IAS 17, IAS 18Shares and participations 5, Investment in associated companies and other
shares and participationsIAS 28, IAS 32, IAS 36, IAS 39
Financial income and expenses 9, Other financial income and expenses IAS 39Income taxes 10, Income taxes IAS 12Minority interests 11, Minority interests IAS 27Research and development expenditure 12, Intangible assets IAS 38Intangible assets 12, Intangible assets IAS 36, IAS 38Tangible assets 13, Tangible assets IAS 16, IAS 36, IAS 40Leasing 14, Leasing IAS 17Customer-financing receivables 15, Customer-financing receivables IAS 17, IAS 18, IAS 39, IFRS 7Inventories 17, Inventories IAS 2Earnings per share 19, Equity and numer of shares IAS 33Pensions and similar obligations 20, Provisions for post-employment benefits IAS 19
31, Changes in Volvo Group Financial Reporting 2013 Amendments to IAS19Provisions for residual value risks 21, Other provisions IAS 17, IAS 18, IAS 37Warranty expenses 21, Other provisions IAS 37Restructuring costs 21, Other provisions IAS 37Liabilities 22, Liabilities IAS 37, IAS 39, IFRS 7Contingent liabilities 24, Contingent liabilities IAS 37Transactions with related parties 25, Transactions with related parties IAS 24Government grants 26, Government grants IAS 20Share-based payments 27, Personnel IFRS 2Cash-flow statement 29, Cash flow IAS 7Financial instruments 4, Goals and policies in financial risk management IAS 32, IAS 39, IFRS 7 16, Receivables 18, Marketable securities and liquid funds 30, Financial instruments
noTe 1 ACCOunTInG PRInCIPLES
99
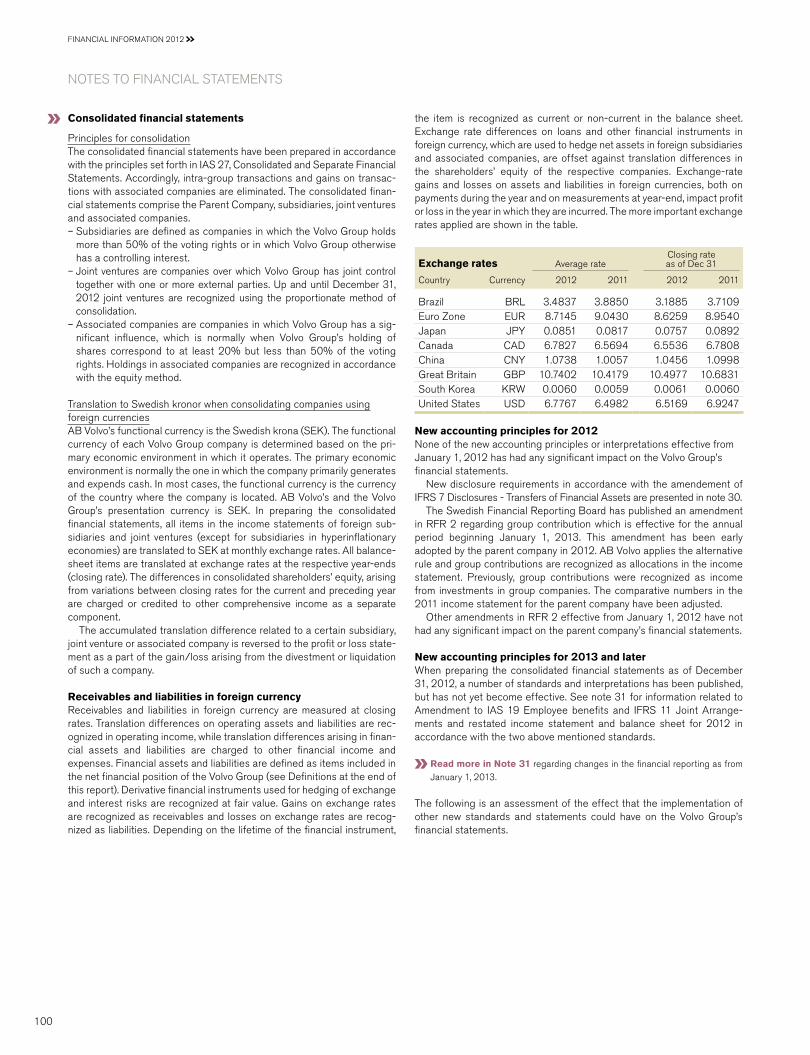
Consolidated financial statements
Principles for consolidationThe consolidated financial statements have been prepared in accordance with the principles set forth in IAS 27, Consolidated and Separate Financial Statements. Accordingly, intra-group transactions and gains on transac-tions with associated companies are eliminated. The consolidated finan-cial statements comprise the Parent Company, subsidiaries, joint ventures and associated companies. – Subsidiaries are defined as companies in which the Volvo Group holds
more than 50% of the voting rights or in which Volvo Group otherwise has a controlling interest.
– Joint ventures are companies over which Volvo Group has joint control together with one or more external parties. up and until December 31, 2012 joint ventures are recognized using the proportionate method of consolidation.
– Associated companies are companies in which Volvo Group has a sig-nificant influence, which is normally when Volvo Group’s holding of shares correspond to at least 20% but less than 50% of the voting rights. Holdings in associated companies are recognized in accordance with the equity method.
Translation to Swedish kronor when consolidating companies using foreign currenciesAB Volvo’s functional currency is the Swedish krona (SEK). The functional currency of each Volvo Group company is determined based on the pri-mary economic environment in which it operates. The primary economic environment is normally the one in which the company primarily generates and expends cash. In most cases, the functional currency is the currency of the country where the company is located. AB Volvo’s and the Volvo Group’s presentation currency is SEK. In preparing the consolidated financial statements, all items in the income statements of foreign sub-sidiaries and joint ventures (except for subsidiaries in hyperinflationary economies) are translated to SEK at monthly exchange rates. All balance-sheet items are translated at exchange rates at the respective year-ends (closing rate). The differences in consolidated shareholders’ equity, arising from variations between closing rates for the current and preceding year are charged or credited to other comprehensive income as a separate component.
The accumulated translation difference related to a certain subsidiary, joint venture or associated company is reversed to the profit or loss state-ment as a part of the gain/loss arising from the divestment or liquidation of such a company.
Receivables and liabilities in foreign currencyReceivables and liabilities in foreign currency are measured at closing rates. Translation differences on operating assets and liabilities are rec-ognized in operating income, while translation differences arising in finan-cial assets and liabilities are charged to other financial income and expenses. Financial assets and liabilities are defined as items included in the net financial position of the Volvo Group (see Definitions at the end of this report). Derivative financial instruments used for hedging of exchange and interest risks are recognized at fair value. Gains on exchange rates are recognized as receivables and losses on exchange rates are recog-nized as liabilities. Depending on the lifetime of the financial instrument,
the item is recognized as current or non-current in the balance sheet. Exchange rate differences on loans and other financial instruments in foreign currency, which are used to hedge net assets in foreign subsidiaries and associated companies, are offset against translation differences in the shareholders’ equity of the respective companies. Exchange-rate gains and losses on assets and liabilities in foreign currencies, both on payments during the year and on measurements at year-end, impact profit or loss in the year in which they are incurred. The more important exchange rates applied are shown in the table.
Exchange rates Average rateClosing rate as of Dec 31
Country Currency 2012 2011 2012 2011
Brazil BRL 3.4837 3.8850 3.1885 3.7109Euro Zone EuR 8.7145 9.0430 8.6259 8.9540Japan JPy 0.0851 0.0817 0.0757 0.0892Canada CAD 6.7827 6.5694 6.5536 6.7808China Cny 1.0738 1.0057 1.0456 1.0998Great Britain GBP 10.7402 10.4179 10.4977 10.6831South Korea KRW 0.0060 0.0059 0.0061 0.0060united States uSD 6.7767 6.4982 6.5169 6.9247
New accounting principles for 2012none of the new accounting principles or interpretations effective from January 1, 2012 has had any significant impact on the Volvo Group’s financial statements.
new disclosure requirements in accordance with the amendement of IFRS 7 Disclosures - Transfers of Financial Assets are presented in note 30.
The Swedish Financial Reporting Board has published an amendment in RFR 2 regarding group contribution which is effective for the annual period beginning January 1, 2013. This amendment has been early adopted by the parent company in 2012. AB Volvo applies the alternative rule and group contributions are recognized as allocations in the income statement. Previously, group contributions were recognized as income from investments in group companies. The comparative numbers in the 2011 income statement for the parent company have been adjusted.
Other amendments in RFR 2 effective from January 1, 2012 have not had any significant impact on the parent company’s financial statements.
New accounting principles for 2013 and later When preparing the consolidated financial statements as of December 31, 2012, a number of standards and interpretations has been published, but has not yet become effective. See note 31 for information related to Amendment to IAS 19 Employee benefits and IFRS 11 Joint Arrange-ments and restated income statement and balance sheet for 2012 in accordance with the two above mentioned standards.
Read more in Note 31 regarding changes in the financial reporting as from January 1, 2013.
The following is an assessment of the effect that the implementation of other new standards and statements could have on the Volvo Group’s financial statements.
Notes to fiNaNcial statemeNts
FInAnCIAL InFORMATIOn 2012
100

IFRS 10 Consolidated Financial Statements, IFRS 11 Joint Arrangements and IFRS 12 Disclosures of Interests in Other EntitiesVolvo Group will apply IFRS 10 Consolidated Financial Statement, IFRS 11 Joint Arrangements and IFRS 12 Disclosures of Interests in Other entities in advance as from January 1, 2013. Comparative periods 2012 are restated.
IFRS 10 replaces the consolidation instructions in IAS 27 Consolidated and Separate Financial Statements and SIC -12 Consolidation – Special Purpose Entities and introduce one basis for consolidation, that is control. If the follow-ing three criterias are fulfilled control is obtained (i) power of the investee (ii) exposure, or rights, to variable returns from its involvement with the investee, and (iii) the ability to use power over the investee to affect the amount of the return. IFRS 10 is not considered to have any significant impact on the con-solidation of other companies of which the Volvo Group has ownership or is involved.
Refer to note 31 for further information related to IFRS 11 Joint Arrangements.
IFRS 12 Disclosure of Interests in Other EntitiesDisclosure of Interests in Other Entities requires more detailed disclosures on subsidiaries, joint arrangements, associates and any unconsolidated struc-tured entities in which the company is involved. The disclosures in the annual report will to some extent increase due to IFRS 12.
IAS 27 Separate Financial Statements (revised 2011)IAS 27 has been amended for the issuance of IFRS 10, but retains the current guidance for separate financial statements. The amendments in IAS 27 are effective from January 1, 2013, but are not considered to have any material effect on the Volvo Group.
IAS 28 Investments in Associates and Joint Ventures (revised 2011)In connection with the issuance of IFRS 10 and IFRS 11, consequential amendments have been made in IAS 28. The amendments in IAS 28 are effective from January 1, 2013. According to IFRS 11, joint ventures are recognized according to the equity method in IAS 28.
Read more in note 31 regarding recognition of Joint Ventures as from January 1, 2013.
IFRS 13 Fair Value MeasurementIFRS 13 establishes a single source of guidance for fair value measure-ment and disclosures of fair value measurements. IFRS 13 does not change the requirement regarding which items should be measured or disclosed at fair value. The standard is to be applied prospectively and comparative disclosures is not required. IFRS 13 requires us to take into account factors that are specific to the transations and to the asset or lia-bility. In many cases, the transaction price will equal the fair value.
The scope of IFRS 13 applies to all transactions and balances (financial or non-financial) for which IFRSs require or permit fair value measurements, except for share-based payment transactions and leasing transactions. IFRS 13 is effective from January 1, 2013. The standard is not considered to have a material effect on Volvo Group.
IFRS 9 Financial instruments*IFRS 9 is published in three parts: Classification and Measurement, Impair-ment and Hedge Accounting, which will replace the current IAS 39 with application not earlier than January 1, 2015. Prior application is voluntary, subject to Eu approval. Volvo Group is currently conducting a review of how the implementation of IFRS 9 will impact the Volvo Group. A joint position will be taken in conjunction with the final version of all three components of the project being published.
Other new standards and amendments are not considered to have a material impact on the Volvo Group’s financial statements.
* This standard has not been adopted by the Eu when this Annual Report was published. The date listed for application may thus be subject to change due to decisions made during the Eu approval process.
Volvo Group’s most significant accounting policies are primarily described together with the applicable note. Refer to note 1, Accounting Policies for a specification. The preparation of AB Volvo’s Consolidated Financial State-ments requires the use of estimates, judgements and assumptions that affect the recognized amounts of assets, liabilities and provisions at the date of the financial statements and the recognized amounts of sales and expenses dur-ing the periods presented. In preparing these financial statements, Volvo Group’s management has made its best estimates and judgements of certain amounts included in the financial statements, giving due consideration to materiality. Since future results are an unknown quantity, actual results could differ from these estimates due to the application of these assumptions. In accordance with IAS 1, the company is required to provide additional disclo-sure of accounting policies in which estimates, judgments and assumptions are particularly sensitive and which, if actual results differ, may have a material impact on the financial statements.
! The sources of uncertainty which has been identified by the Volvo
Group and which fulfill those criterias are presented in connection to the items considered to be affected. The adjacent table shows where to find those presentations.
Source of estimation uncertainty note
Buy-back agreements and residual value guarantees 7, IncomeDeferred taxes 10, Income taxesImpairment of goodwill and other intan-gible assets 12, Intangible assetsImpairment of tangible assets 13, Tangible assetsCredit loss reserves 15,
16,
Customer-financing receivablesReceivables
Inventory obsolescence 17, InventoriesAssumptions when calculating pensions and other post-employment benefits
20, Provisions for post- employment benefits
Product warranty costs 21, Other provisionsLegal proceedings 21, Other provisionsResidual value risks 21, Other provisions
noTe 2 KEy SOuRCES OF ESTIMATIOn unCERTAInTy
101

aCCounTinG poliCy
Recognition of business combinationsThe Volvo Group applies IFRS 3, Business Combinations, for acquisitions. All business combinations are recognized for in accordance with the pur-chase method. Volvo Group measures acquired identifiable assets, tangi-ble and intangible, and liabilities at fair value. Any surplus amount from the purchase price, possible non-controlling interests and fair value of previ-ously held equity interests at the acquisition date compared to the Volvo Group’s share of acquired net assets is reported as goodwill. Any deficit amount, known as negative goodwill, is recognized in profit and loss.
In step acquisitions, a business combination occurs only on the date control is achieved, which is also the time when goodwill is calculated. Transactions with the minority are recognized as equity as long as control of the subsidiary is retained. For each business combination, the Volvo Group decides whether the non-controlling interest should be valued at fair value or at the non-controlling interest’s proportionate share of the net assets of the acquiree. All acquisition-related costs are expensed. Compa-nies acquired during the year are consolidated as of the date of acquisition. Companies that have been divested are included in the consolidated finan-cial statements up to and including the date of divestment.
Non-current assets held for sale and discontinued operationsThe Volvo Group applies IFRS 5, non-current Assets Held for Sale and Discontinued Operations. The standard also includes the treatment of cur-rent assets. In a global group like the Volvo Group, processes are continu-ously ongoing regarding the sale of assets or groups of assets at minor values. When the criteria for being classified as a non-current asset held for sale are fulfilled and the asset or group of assets are of significant value, the asset or group of assets and the related liabilities are recognized on a separate line in the balance sheet. The asset or group of assets are tested for impairment and, if impaired, measured at fair value after deduc-tions for selling expenses. The balance sheet items and the income effect resulting from the revaluation to fair value less selling expenses are nor-mally recognized in the segment Group headquarter functions and other, until the sale is completed and the result distributed to each segment.
AB Volvo’s holding of shares in subsidiaries as of December 31, 2012 is disclosed after the notes of the Parent Company in AB Volvo’s hold-ing of shares. Significant acquisitions, formations and divestments within the Group are listed below.
Business combinations during the periodIn the fourth quarter 2012, the Volvo Group finalized the acquisition of the French automotive manufacturer Panhard. Panhard was a private owned company specialized in manufacturing of light transport vehicles adapted for defense operations. Panhard is included in the Volvo Group’s govern-mental sales business area. The purchase price amounted to 538 and the goodwill to 326. The acquisition is not expected to have a significant impact on the Volvo Group’s earnings and financial position. In addition to that the Volvo Group has not made any acquisitions during 2012 and 2011, which solely or jointly have had a significant impact on the Volvo Group’s financial statements. For acquisitions in 2012 and 2011, the fair-value adjustments to the acquisition balance sheets have not had a significant impact on the Volvo Group.
The impact on the Volvo Group’s balance sheet and cash-flow state-ment in connection with the acquisition of subsidiaries and other business units are specified in the following table:
Acquisitions 2012 2011
Intangible assets 190 1Property, plant and equipment 176 132Assets under operating lease 475 1,503Inventories 503 38Current receivables 257 236Cash and cash equivalents 21 39Other assets 14 1Minority interests – 387Provisions (87) (36)Loans (225) (1,510)Current liabilities (622) (191)Acquired net assets 702 600
Goodwill 888 967negative goodwill (42) –Total 1,548 1,567
Cash and cash equivalents paid (1,548) (1,567)Cash and cash equivalents according to acquisition analysis 21 39Effect on Group cash and cash equivalents (1,527) (1,528)Effect on Group net financial position (1,714) (2,248)
noTe 3 ACQuISITIOnS AnD DIVESTMEnTS OF SHARES In SuBSIDIARIES
Notes to fiNaNcial statemeNts
FInAnCIAL InFORMATIOn 2012
102

DivestmentsIn the fourth quarter 2012, AB Volvo finalized the sale of Volvo Aero to the global engineering company, GKn, for the equivalent of SEK 6.9 billion on a debt-free basis. The total capital gain amount to 568. The adjusted purchase price is expected to be paid during 2013. In addition to that the Volvo Group has not made any divestments during 2012 or 2011, which solely or jointly have had a significant impact on the Volvo Group’s finan-cial statements.
The impact on the Volvo Group’s balance sheet and cash-flow statement in connection with the divestment of subsidiaries and other business units are specified in the following table:
Divestments 2012 2011
Intangible assets (3,220) (5)Property, plant and equipment (1,786) (4)Assets under operating lease (244) 0Shares and participations (17) 0Inventories (2,505) (45)Other receivables (1,395) (130)Cash and cash equivalents (323) (21)Other provisions 1,108 17Other liabilities 3,385 143Divested net assets (4,997) (45)
Goodwill (300) 0Total (5,297) (45)Additional purchase price 653 –
Cash and cash equivalents received 5,240 (41)Cash and cash equivalents, divested companies (323) (21)Effect on Group cash and cash equivalents 4,917 (62)Effect on Group net financial position 5,594 (62)
Acquisitions and divestments after the end of the periodThe Volvo Group has not made any acquisitions or divestments after the end of the period that have had any significant impact on the Volvo Group.
Assets and liabilities held for saleAs of December 31, 2012 there were no assets or liabilities classified as held for sale. For the comparison year 2011, the Volvo Group recognized assets amounting to 9,348 and liabilities amounting to 4,716 as assets and liabilities held for sale. Translation differences on foreign operations of 3 was included in other comprehensive income. This referred to the divestment of Volvo Aero.
Assets and liabilities held for saleDec 31,
2012Dec 31,
2011
Intangible assets – 3,316Tangible assets – 1,984Inventories – 2,216Accounts receivable – 566Other current receivables – 982Other assets – 284B/S Total assets – 9,348
Trade payables – 1,025Other current liabilities – 3,691B/S Total liabilities – 4,716
103

USD 8.2
BRL 7.5
The Volvo Group’s global operations expose the company to financial risks in the form of interest rate risks, currency risks, credit risks and liquidity risks. Work on financial risks comprises an integrated element of the Volvo Group’s business. Volvo Group strives to minimize these risks by optimizing the Group’s capital costs by utilizing economies of scale, mini-mize negative effects on income as a result of changes in currency or interest rates and to optimize risk exposure. All risks are managed pursu-ant to the Volvo Group’s established policies in these areas.
The Volvo Group’s risk management related to specific balance sheet items are thus also described in other areas of the Annual Report, see refer-ences in the notes.
Read more about accounting principles for financial instruments in Note 30, Financial Instruments.
FINANCIAL RISKS
CASH-FLOW RISKS
PRICE RISKS FInAnCIAL CuRREnCy ExPOSuRE
CuRREnCy ExPOSuRE OF EQuITy
COMMERCIAL CuRREnCy ExPOSuRE
COMMERCIAL CREDIT RISK
FInAnCIAL CREDIT RISK
FInAnCIAL COunTERPARTy RISK
inTeresT-raTe risKs a
Interest-rate risk refers to the risk that changed interest-rate levels will affect consolidated earnings and cash flow (cash-flow risks) or the fair value of financial assets and liabilities (price risks).
poliCy
Matching the interest-fixing terms of financial assets and liabilities reduces the exposure. Interest-rate swaps are used to change/influence the interest-fixing term the Volvo Group’s financial assets and liabilities. Currency interest-rate swaps enable borrowing in foreign currencies from different markets without introducing currency risk. The Volvo Group also has standardized interest-rate forward contracts (futures) and FRAs (forward-rate agreements). Most of these contracts are used to hedge interest-rate levels for short-term borrowing or investments.
Cash-flow risksThe effect of changed interest rate levels on future currency and interest-rate flows primarily pertains to the Volvo Group’s customer financing operations and net financial items. Customer finance operations measure
the degree of matching interest rate fixing on borrowing and lending. The calculation of the matching degree excludes equity, which amounted to between 8 and 10% in the customer finance operations. At year-end 2012, the degree of such matching was 99% (97), which was in line with the Volvo Group’s policy. At year-end 2012, in addition to the assets in its customer-financing operations, the Volvo Group’s interest-bearing assets consisted primarily of cash, cash equivalents and liquid assets invested in short-term interest-bearing securities. The objective is to achieve an interest-fixing term of three months for the liquid assets in the Volvo Group’s industrial operations through the use of derivatives. On Decem-ber 31, 2012, after taking derivatives into account, the average interest on these assets was 1.1% (1.9). After taking derivatives into account, out-standing loans had interest terms corresponding to an interest-rate fixing term of three months and the average interest at year-end amounted to 3.2% (4.1), including the Volvo Group’s credit costs.
Price risks C
Exposure to price risks as result of changed interest-rate levels refers to financial assets and liabilities with a longer interest-rate fixing term (fixed interest).
The following table* d shows the effect on income before taxes in Industrial Operations financial net position , including pensions and similar net obligations, if interest rates were to increase by 1 percentage point, (100 basis points) assuming an average interest-rate fixed term of three months.
* The note’s sensitivity analysis on interest rate risks is based on simplified assumptions. It is not unreasonable for market interest rates to change by 1 per-centage point (100 basis points) on an annual basis. However, in reality, these rates often rise or decline at different points in time. The sensitivity analysis also
assumes a parallel deferment of the return curve, and that the interest rates on assets and liabilities will be equally impacted by changes in market interest rates. Accordingly, the impact of real interest-rate changes may differ from the analysis presented above. d
INTEREST-RATE RISKS CURRENCy RISKS CREDIT RISKS LIQUIDITy RISKS
INTEREST-RATE RISKS
noTe 4 GOALS AnD POLICIES In FInAnCIAL RISK MAnAGEMEnT
Notes to fiNaNcial statemeNts
FInAnCIAL InFORMATIOn 2012
104

SEK 15.9
GBP 2.5
CNy 8.0
INR 3.3
EUR 21.3 JPy 2.0
KRW 4.0
OTHER12.9
CurrenciesOther
currencies Market value
Millions uSD SGD net SEK
Due date 2013 509 (41) 8Due date 2014 6 (41) –Due date 2015 – (13) –Total local currency 515 (95) 8
Average contract rate 6.76 5.33 Market value of outstanding forward contracts, SEK M 112 31 (2) 141
The Volvo Group’s outstanding forward contracts and options contracts for hedging of commercial currency risks
CurrenCy risKs B
The content in the balance sheet may be affected by changes in different exchange rates. Currency risks in the Volvo Group’s operations are related to changes in the value of contracted and expected future payment flows (commercial currency exposure), changes in the value of loans and invest-ments (financial currency exposure) and changes in the value of assets and liabilities in foreign subsidiaries (currency exposure of equity).
poliCy
The aim of the Volvo Group’s currency risk management is to secure cash flow from firm flows through currency hedges pursuant to the established
CURRENCy RISKS
d
Currency net financial position incl.
pensions
Impact on earnings before tax if interest rate
rises 1%a (Interest-rate risks)
Impact on net financial position if SEK
rises 10%B (Currency risks)
SEK M
JPy (19,954) (150) 1,995uSD (8,902) (67) 890BRL 1,027 8 (103)Cny 3,165 24 (317)EuR 3,199 24 (320)Other (1,513) (11) 39Total C (22,978) (172) 2,184
Read more about the Volvo Group’s net financial position on page 95.
f
cont. >>
currency policy, and to minimize the exposure of financial items in Volvo Group’s balance sheet. Below is a presentation on how this work is con-ducted for commercial and financial currency exposure, and for currency exposure of equity.
Commercial currency exposureTransaction exposure from commercial flowsVolvo Group uses forward contracts and currency options to hedge the value of future payment flows in foreign currencies. Volvo Group only hedges firm flows, most of which are realized within six months. The hedged amount of firm flows for all periods fall within the framework of Volvo Group’s currency policy.
The Volvo Group’s net assets in different currencies (SEK bn) =
105

The table f shows outstanding forward and option contracts for the hedging of commercial currency risks. The table Operating net flow per currency on page 92 shows commercial net flows per currency (transac-tional flows net).
Translation exposure during the consolidation of operating income in foreign subsidiariesIn conjunction with the translation of operating income in foreign subsidiaries, the Volvo Group’s earnings are impacted if currency rates change. The Volvo Group does not hedge this risk. For more information on currency hedging of equity see below.
Sensitivity analysis – currencies* The tables below show the impact on sales and operating income for the Volvo Group if key currencies fluctuate. The sensitivity analysis include the transaction impact from commercial flows and the translation impact dur-ing the consolidation of foreign subsidiaries.
Financial currency exposureLoans and investments in the Volvo Group’s subsidiaries are performed mainly through Volvo Treasury in local currencies, which minimizes indi-vidual companies’ financial currency exposure. Volvo Treasury uses vari-ous derivatives to facilitate lending and borrowing in different currencies without increasing the company’s risk. The financial net position of the
Volvo Group is affected by exchange-rate fluctuations since financial assets and liabilities are distributed among the Volvo Group companies that conduct their operations using different currencies.
The Impact on net financial position table d disloses the impact on earnings before tax of Industrial operations financial net position, includ-ing pensions and similar net obligations, if the SEK were to strengthen by 10%.
Currency exposure of equityThe consolidated carrying amounts of assets and liabilities in foreign sub-sidiaries is affected by current exchange rates in conjunction with the trans-lation of assets and liabilities to Swedish kronor. To minimize currency expo-sure of equity, the size of equity in foreign subsidiaries is continuously optimized with respect to commercial and legal conditions. Currency hedging of equity may occur in cases where a foreign subsidiary is consid-ered overcapitalized. net assets in foreign subsidiaries and associated companies amounted at year-end 2012 to SEK 69.8 billion (67.8). The remaining loans used as hedging instruments have expired in 2011. For more information on hedging of net investments in foreign operations rec-ognized in equity refer to note 30 Financial Instruments. The need to under-take currency hedging relating to investments in associated companies and other companies is assessed on a case-by-case basis.
5,000
Changes in currency exchange rates compared to 2011 (Total SEK pos 1.9 bn)
Strengthen in value of SEK by 10% (Total SEK neg 31.2 bn)
3,0001,000
(1,000)(3,000)(5,000)(7,000)(9,000)
CNYBRL EUR GBP JPY RUB SGD USD ZAR OtherINR
G
Sensitivity analysisCurrency effect on net sales from inflows in foreign currency and translation effect when consolidating net sales in foreign subsidiaries.
2
Changes in currency exchange rates compared to 2011 (Total SEK pos 1,5 bn)
Strengthen in value of SEK by 10% (Total SEK neg 6.2)
1
0
(1)
(2)
(3)
BRLAUD CNY EUR KRW RUB USD ZAR OtherGBP
h
Sensitivity analysisCurrency effect on operating income from net flows in foreign currency and translation effect when consolidating operating income in foreign subsidiaries.
Currency impact on operating income, SEK billion 2012 2011 Change
net flows in foreign currency 1.6Realized gains and losses on hedging contracts 0.0 0.2 (0.2)unrealized gains and losses on hedging contracts 0.3 (0.3) 0.6unrealized gains and losses on receivables and liabilities in foreign currency (0.2) 0.3 (0.6)Translation effect on operating income in foreign subsidiaries (0.1)Total currency impact on operating income 1.3
Currency impact on net flows in foreign currency and Translation effect on operating income in foreign subsidiaries are detailed in table h in key currencies.
The Volvo Group’s currency review When the Volvo Group communicates the currency impact on operating income for Industrial operations, the following factors are included:
i
* The note’s sensitivity analysis on currency rate risks is based on simplified assumptions. It is not unreasonable for the value in SEK to strengthen by 10% in relation to other currencies. In reality, currencies usually do not change in the
same direction at any given time, so the actual effect of exchange-rate changes may differ from the sensitivity analysis. Please refer to table d G h
Goals and policies in financial risk management (cont.)
Notes to fiNaNcial statemeNts
FInAnCIAL InFORMATIOn 2012
106
CrediT risKs
Credit risks are defined as the risk that Volvo Group’s does not receive payment for recognized accounts receivable and customer-financing receivables (commercial credit risk), that Volvo Group’s investments are unable to be realized (financial credit risk) and that potential profit is not realized due to the counterparty not fulfilling its part of the contract when using derivative instruments (financial counterparty risk).
poliCy
The objective of the Volvo Group Credit Policy is to define and measure the credit exposure and control the risk of losses deriving from credits to customers, credits to suppliers, counter party risks and Customer Dealer Financing activities.
Commercial credit riskVolvo Group’s credit granting is steered by Group-wide policies and cus-tomer-classification rules. The credit portfolio should contain a distribu-tion among different customer categories and industries. The credit risks are managed through active credit monitoring, follow-up routines and, where applicable, product repossession. Moreover, regular monitoring ensures that the necessary allowances are made for incurred losses on doubtful receivables. In notes 15 and 16, ageing analyses are presented of customer finance receivables overdue and accounts receivables over-due in relation to the reserves made.
The customer-financing receivables in the Volvo Group’s customer-financing operations amounted at December 31, 2012, to approximately net SEK 81 billion (79). The credit risk of this portfolio is distributed over a large number of retail customers and dealers. Collaterals are provided in the form of the financed products. In the credit granting the Volvo Group strives for a balance between risk exposure and expected return.
Read more about Volvo’s credit risk in the customer-financing operation in Note 15.
The Volvo Group’s accounts receivables amounted as of December 31, 2012 to approximately net SEK 27 billion (28).
Financial credit riskThe Volvo Group’s financial assets are largely managed by Volvo Treasury and invested in the money and capital markets. All investments must meet the requirements of low credit risk and high liquidity. According to Volvo Group’s credit policy, counterparties for investments and derivative trans-actions should have a rating of A or better from one of the well- established credit rating institutions.
Liquid funds and marketable securites amounted as of December 31, 2012 to approximately SEK 29 billion (37).
Read more about Volvo Group’s Marketable securities and liquid funds in Note 18.
Financial counterparty riskThe use of derivatives involves a counterparty risk, in that a potential gain will not be realized if the counterparty fails to fulfill its part of the contract. To reduce the exposure, master netting agreements are signed, wherever possible, with the counterparty in question. Counterparty risk exposure for futures contracts is limited through daily or monthly cash transfers cor-responding to the value change of open contracts. The estimated gross exposure to counterparty risk relating to futures, interest-rate swaps and interest-rate forward contracts, options and commodities derivatives amounted as of December 31, 2012, to 1,144 (281), 2,507 (2,757), 10 (284) and 23 (68).
CREDIT RISKS
107
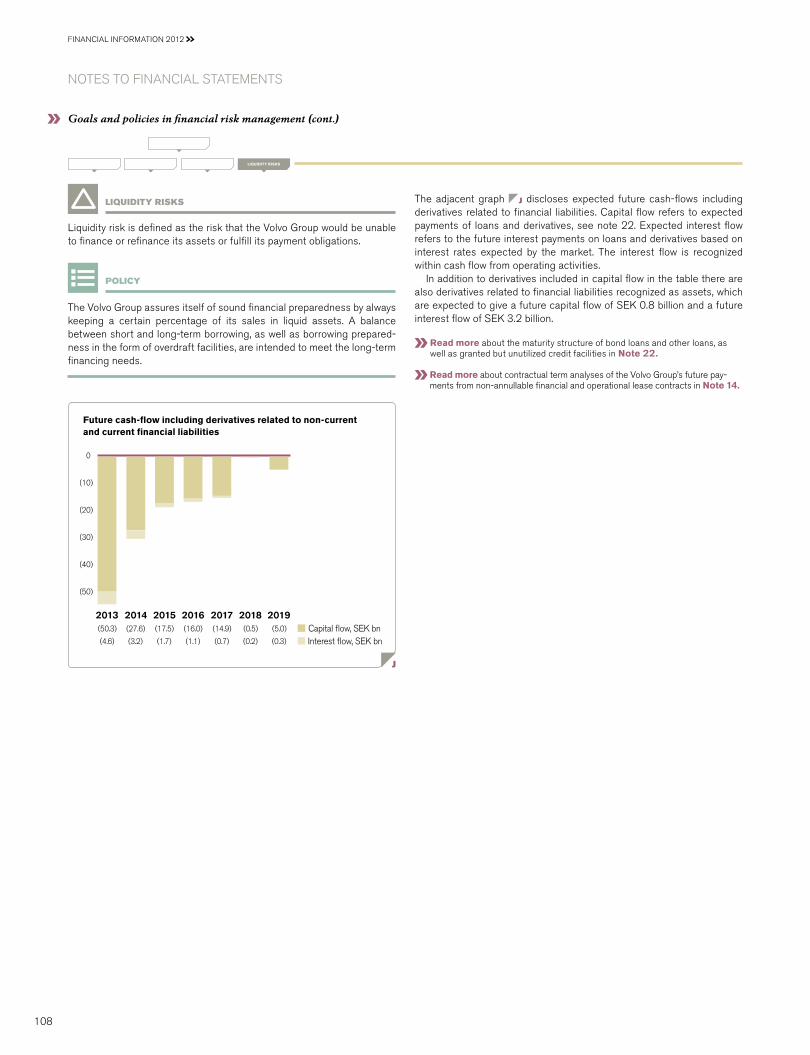
liQuidiTy risKs
Liquidity risk is defined as the risk that the Volvo Group would be unable to finance or refinance its assets or fulfill its payment obligations.
poliCy
The Volvo Group assures itself of sound financial preparedness by always keeping a certain percentage of its sales in liquid assets. A balance between short and long-term borrowing, as well as borrowing prepared-ness in the form of overdraft facilities, are intended to meet the long-term financing needs.
LIQUIDITy RISKS
The adjacent graph j discloses expected future cash-flows including derivatives related to financial liabilities. Capital flow refers to expected payments of loans and derivatives, see note 22. Expected interest flow refers to the future interest payments on loans and derivatives based on interest rates expected by the market. The interest flow is recognized within cash flow from operating activities.
In addition to derivatives included in capital flow in the table there are also derivatives related to financial liabilities recognized as assets, which are expected to give a future capital flow of SEK 0.8 billion and a future interest flow of SEK 3.2 billion.
Read more about the maturity structure of bond loans and other loans, as well as granted but unutilized credit facilities in Note 22.
Read more about contractual term analyses of the Volvo Group’s future pay-ments from non-annullable financial and operational lease contracts in Note 14.
Future cash-flow including derivatives related to non-current and current financial liabilities
Capital flow, SEK bnInterest flow, SEK bn
2019(5.0)
(0.3)
2016(16.0)
(1.1)
2017(14.9)
(0.7)
2018(0.5)
(0.2)
2015(17.5)
(1.7)
2014(27.6)
(3.2)
2013(50.3)
(4.6)
(50)
0
(40)
(30)
(20)
(10)
j
Goals and policies in financial risk management (cont.)
Notes to fiNaNcial statemeNts
FInAnCIAL InFORMATIOn 2012
108
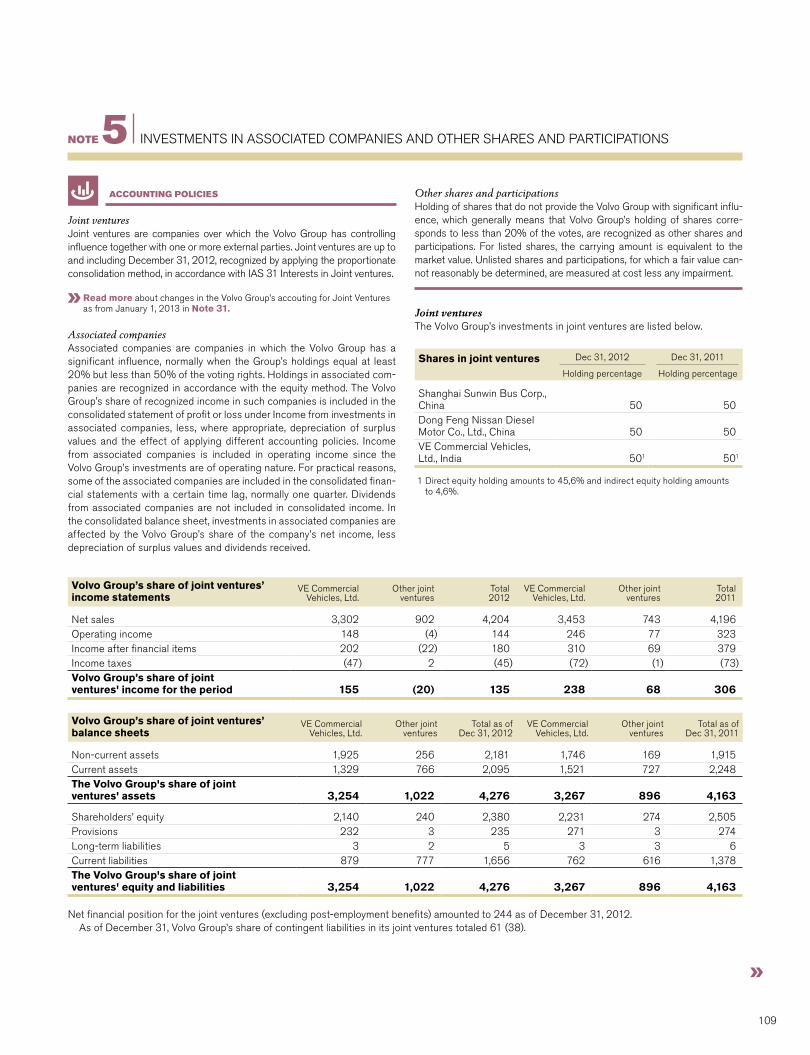
Joint venturesJoint ventures are companies over which the Volvo Group has controlling influence together with one or more external parties. Joint ventures are up to and including December 31, 2012, recognized by applying the proportionate consolidation method, in accordance with IAS 31 Interests in Joint ventures.
Read more about changes in the Volvo Group’s accouting for Joint Ventures as from January 1, 2013 in Note 31.
Associated companies Associated companies are companies in which the Volvo Group has a significant influence, normally when the Group’s holdings equal at least 20% but less than 50% of the voting rights. Holdings in associated com-panies are recognized in accordance with the equity method. The Volvo Group’s share of recognized income in such companies is included in the consolidated statement of profit or loss under Income from investments in associated companies, less, where appropriate, depreciation of surplus values and the effect of applying different accounting policies. Income from associated companies is included in operating income since the Volvo Group’s investments are of operating nature. For practical reasons, some of the associated companies are included in the consolidated finan-cial statements with a certain time lag, normally one quarter. Dividends from associated companies are not included in consolidated income. In the consolidated balance sheet, investments in associated companies are affected by the Volvo Group’s share of the company’s net income, less depreciation of surplus values and dividends received.
Other shares and participationsHolding of shares that do not provide the Volvo Group with significant influ-ence, which generally means that Volvo Group’s holding of shares corre-sponds to less than 20% of the votes, are recognized as other shares and participations. For listed shares, the carrying amount is equivalent to the market value. unlisted shares and participations, for which a fair value can-not reasonably be determined, are measured at cost less any impairment.
Joint ventures The Volvo Group’s investments in joint ventures are listed below.
Shares in joint ventures Dec 31, 2012 Dec 31, 2011
Holding percentage Holding percentage
Shanghai Sunwin Bus Corp., China 50 50Dong Feng nissan Diesel Motor Co., Ltd., China 50 50VE Commercial Vehicles, Ltd., India 501 501
1 Direct equity holding amounts to 45,6% and indirect equity holding amounts to 4,6%.
aCCounTinG poliCies
noTe 5 InVESTMEnTS In ASSOCIATED COMPAnIES AnD OTHER SHARES AnD PARTICIPATIOnS
Volvo Group’s share of joint ventures’ income statements
VE Commercial Vehicles, Ltd.
Other joint ventures
Total2012
VE Commercial Vehicles, Ltd.
Other joint ventures
Total2011
net sales 3,302 902 4,204 3,453 743 4,196Operating income 148 (4) 144 246 77 323Income after financial items 202 (22) 180 310 69 379Income taxes (47) 2 (45) (72) (1) (73)Volvo Group’s share of joint ventures' income for the period 155 (20) 135 238 68 306
Volvo Group’s share of joint ventures’ balance sheets
VE Commercial Vehicles, Ltd.
Other joint ventures
Total as ofDec 31, 2012
VE Commercial Vehicles, Ltd.
Other joint ventures
Total as ofDec 31, 2011
non-current assets 1,925 256 2,181 1,746 169 1,915Current assets 1,329 766 2,095 1,521 727 2,248The Volvo Group's share of joint ventures' assets 3,254 1,022 4,276 3,267 896 4,163
Shareholders’ equity 2,140 240 2,380 2,231 274 2,505Provisions 232 3 235 271 3 274Long-term liabilities 3 2 5 3 3 6Current liabilities 879 777 1,656 762 616 1,378The Volvo Group's share of joint ventures' equity and liabilities 3,254 1,022 4,276 3,267 896 4,163
net financial position for the joint ventures (excluding post-employment benefits) amounted to 244 as of December 31, 2012.As of December 31, Volvo Group’s share of contingent liabilities in its joint ventures totaled 61 (38).
109

Joint Ventures (cont.)
Volvo Group’s share of total number of employees 2012 2011
number of employees
of whichwomen, %
number of employees
of whichwomen, %
Shanghai Sunwin Bus Corp. 577 14 453 16Dong Feng nissan Diesel Motor Co., Ltd. 158 15 152 13VE Commercial Vehicles, Ltd. 4,880 1 3,600 1Volvo Group's share of total number of employees 5,615 3 4,205 3
Balance sheetDeutz
AG
Other associated companies
TotalDec 31,
2012
TotalDec 31,
2011
non-current assets 5,612 1,979 7,591 2,094Current assets 3,644 1,654 5,297 1,485Total assets 9,256 3,633 12,889 3,579
Shareholders' equity 4,090 1,603 5,693 1,605Provisions 1,502 43 1,545 53non-current liabilities 1,333 624 1,957 621Current liabilities 2,331 1,363 3,694 1,300Total equity and liabilities 9,256 3,633 12,889 3,579
The following table presents summarized financial information for the Volvo Group’s associated companies. The income statement and balance sheet below reflect the total associated companies, not only the Volvo Group’s investment.
Income statementDeutz
AG1
Other associated companies
Total2012
Total2011
net sales 8,448 3,208 11,656 2,543Cost of sales (8,242) (3,144) (11,386) (2,491)Financial income and expense (87) (33) (120) (29)Income before taxes 119 31 150 23
Income taxes (21) (120) (141) (23)Income of the period 98 (89) 9 0
1 For 2012, income statement and balance sheet are presented from January until September since Deutz AG is recognized in the Volvo Group with a time lag of one quarter. During 2011 Deutz AG was recognized as other shares and participations, as the Volvo Group’s investment was below 20%.
Associated companies
Investments in associated companiesRegistration
numberPercentage
holdingDec 31, 2012
Carrying valueDec 31, 2011
Carrying value
Deutz AG, Germany1 – 25 1,359 –Blue Chip Jet II HB, Sweden 969717–2105 50 386 405uD Trucks Doto Corporation, Japan – 38 90 103uD Trucks niigata Corporation, Japan – 34 59 69Shanghai Green Bus Drive Systems Co.,Ltd, China – 40 43 –JV Fonderie Venissieux, France 49 36 35Merkavim Metal Works Ltd, Israel – 27 20 17Powercell Sweden AB, Sweden 556759–8353 32 10 17Blue Chip Jet HB, Sweden 969639–1011 50 9 8Quingdao Sunwin Bus Corp, China – 43 9 9Arabian Vehicle & Truck Industry Ltd, Saudi Arabia – 25 9 9Other holdings – – 15 12B/S Total shares and participations in associated companies 2,045 684
1 In 2012 an additional 18% of the shares in Deutz AG was acquired and thereby the company is recognized as an associated company. In 2011 the holding in Deutz AG was 7% and recognized as other shares and participations. The fair value of investments in Deutz AG amounted to 924 as of December 31, 2012.
Notes to fiNaNcial statemeNts
FInAnCIAL InFORMATIOn 2012
110

Income from investments in associated companies
Income/loss 2012 2011
uD Trucks niigata Co 8 5JV Fonderie Venissieux 2 4Merkavim Metal Works Ltd 9 17Blue Chip Jet I & II HB 1 (46)Holdings of Volvo Group Venture Capital (13) (6)Other companies 3 2Subtotal 10 (24)
Revaluation and write-down of shares Blue Chip Jet I & II HB (19) –Holdings of Volvo Group Venture Capital (1) (48)Other companies (12) (4)Subtotal (32) (52)
Gains (losses) on divestment of shares in associated companies Holdings of Volvo Group Venture Capital – (5)Subtotal – (5)
I/S Total income (loss) from investments in associated companies (23) (81)
Changes in Volvo Group’s investments in associated companies 2012 2011
Investments in associated companies as of December 31, preceding year 684 684Acquisitions and divestments 1,102 111Write-downs – (52)Capital contribution 7 15Share of income in associated companies 10 (24)Revaluation of shares to fair value (32) –Translation differences (27) 1Dividends (8) (35)Reclassifications 308 (16)Other 1 –B/S Investments in associated companies
as of December 31 2,045 684
Other shares and participationsThe carrying amount of the Volvo Group’s holding of shares and participations in other companies as of December 31, 2012, is disclosed in the table below.
Holding of sharesin listed companies
Dec 31, 2012
Percentage holding
Dec 31, 2012
Carrying value
Dec 31, 2011
Carrying value
Deutz AG, Germany1 – – 299nippon Express Co.,Ltd., Japan 0.4 116 93TBK Co.,Ltd., Japan 6.7 69 61Sankyu Inc., Japan 0.5 42 44Senko Co.,Ltd., Japan 0.9 35 32yamato Holdings Co.,Ltd., Japan 0.1 23 25Tonami Transportation Co.,Ltd., Japan 1.1 15 15Fukuyama Transporting Co.,Ltd., Japan 0.2 14 16Holdings in other listed companies – 33 50Holding of shares in listed companies 347 635
Holding of shares in non-listed companies2 498 555B/S Other shares and participations 845 1,190
1 In 2012 an additional 18% of the shares in Deutz AG was acquired and thereby the company is recognized as an associated company.
2 unlisted shares and participations, for which a fair value cannot reasonably be determined, are measured at cost less any impairment losses.
Income from other shares and participations
Dividends received 2012 2011
Deutz AG – 2Holdings in Japanese companies 16 13Other 4 6Subtotal 20 21
Write-downs of shares Holdings of Volvo Group Venture Capital (75) (43)Holdings in Japanese companies (14) (226)Other – (1)Subtotal1 (89) (270)
Gain on divestment of shares Holdings of Volvo Group Venture Capital 12 11Holdings in Japanese companies (1) 5Other 11 8Subtotal 22 24
I/S Income from other investments (47) (225)
1 Write-downs of shares refer mainly to financial assets available for sale for which a reliable market value can be calculated.
Changes in Volvo Group’s holding of other shares and participations 2012 2011
Holding of other shares and participations as of December 31, preceding year 1,190 1,414Change in Group structure – (19)Acquisitions and divestments 93 (19)Write-downs – (43)Capital contribution 6 8Revaluation of shares to fair value (89) (203)Translation differences (87) 32Reclassifications (308) 16Other 40 4B/S Holding of other shares and participa-
tions as of December 31 845 1,190 111

noTe 6 SEGMEnT REPORTInG
New organizationAs of January 1, 2012, the Volvo Group introduced a new functional organization which better utilizes the global potential of the Group’s brands and products and a new financial framework to reflect the changes in the organization. The re-organization and the new framework impacts to some extent how revenues and expenses are reported in the income statement and between the different reportable segments.
In the new organization from January 1, 2012, the Trucks operations have been structured according to a functional approach, whereby the entire Trucks business is managed as one single business area consisting of five different functional organizations: Group Trucks Sales & Marketing EMEA (Europe, Middle East, Africa), Group Trucks Sales & Marketing Americas, Group Trucks Sales & Marketing APAC (Asia Pacific), Group Trucks Operations and Group Trucks Technology. In addition, a separate unit for Truck Joint Ventures is included in business area Trucks. Business areas Buses, Construction Equipment, Volvo Penta and Customer Finance remain as separate business areas. Governmental Sales and Volvo Rents are treated as separate business areas in the new organiza-tion. The Volvo Group is thereby organized in seven business areas after
the divestment of Volvo Aero in October 2012. As from October 1, 2012 the separate unit Truck Joint Ventures is included in Group Truck Sales & Marketing APAC. As a result of this change, Group Truck Sales & Market-ing APAC is renamed Group Trucks Sales & Marketing and JV’s APAC.
Former business units Volvo Powertrain, Volvo 3P, Volvo Logistics and Volvo Parts are included in business area Trucks from 2012. The costs of these operations are shared between the different business based on utilization according to the principles of the new financial framework. As from January 1, 2012 Volvo IT, Group Business Services and Volvo Real Estate are treated as business support functions and costs of operations are shared by the business areas based on utilization according to the principles of the financial framework. As from January 1, 2013, Volvo Real Estate is included in Group Business Services.
The segment information for 2011 have been restated due to the new organization.
Read more about the impact on segment reporting 2011 due to the new organization in Note 32.
2012 Trucks
Con-struction
Equipment BusesVolvo Penta Volvo Aero
Group functions and other incl. elimi-
nationsIndustrial
OperationsCustomer
FinanceElimina-
tionsVolvo
Group
net sales, external customers 190,247 62,449 19,646 7,470 5,219 9,485 294,516 9,131 – 303,647net sales, internal 2,036 1,109 649 161 – (2,440) 1,515 652 (2,167) 0
I/S Net sales 192,283 63,558 20,295 7,631 5,219 7,045 296,031 9,783 (2,167) 303,647
Expenses (182,079) (57,785) (20,253) (7,090) (4,452) (8,220) (279,878) (8,291) 2,167 (286,002)I/S Income from invest-
ments in associated companies 12 – 9 – – (43) (23) – – (23)
I/S Operating income 10,216 5,773 51 541 767 (1,218) 16,130 1,492 0 17,622
I/S Interest income and similar credits 510 – – 510
I/S Interest expense and simliar charges (2,476) – – (2,476)
I/S Other financial income and expense (301) – – (301)
I/S Income after financial items 13,863 1,492 0 15,355
Other segment informationDepreciation and amortization (8,359) (1,751) (354) (309) – (1,214) (11,987) (2,768) – (14,755)Restructuring costs (1,343) (13) (107) (17) – (29) (1,509) (15) – (1,524)Gains/losses from divestments – 28 – – – 568 596 – – 596
Capital expenditure 11,228 1,712 315 171 0 5,232 18,658 6,544 (76) 25,126B/S Investments in
associated companies (the equity method) 209 – 71 – – 1,765 – – – 2,045
Notes to fiNaNcial statemeNts
FInAnCIAL InFORMATIOn 2012
112

2011 Trucks
Con-struction
Equipment BusesVolvo Penta Volvo Aero
Group functions and other incl. elimi-
nationsIndustrial
OperationsCustomer
FinanceElimina-
tionsVolvo
Group
net sales, external customers 196,999 62,894 21,297 8,318 6,356 5,958 301,822 8,545 – 310,367net sales, internal 1,921 606 526 140 0 (1,426) 1,767 337 (2,104) 0
I/S Net sales 198,920 63,500 21,823 8,458 6,356 4,532 303,589 8,882 (2,104) 310,367
Expenses (180,703) (56,688) (20,722) (7,633) (5,996) (5,835) (277,577) (7,913) 2,104 (283,386)I/S Income from
investments in associ-ated companies 10 – 13 – 0 (105) (82) 0 0 (82)Operating income 18,227 6,812 1,114 825 360 (1,408) 25,930 969 0 26,899
I/S Interest income and similar credits 644 – (37) 608
I/S Interest expense and simliar charges (2,912) – 37 (2,875)
I/S Other financial income and expense 297 – – 297
I/S Income after financial items 23,959 969 0 24,929
Other segment infor-mationDepreciation and amortization (8,531) (1,903) (472) (474) (504) 464 (11,419) (2,572) (13,992)Restructuring costs (22) (10) (5) (2) 0 (49) (88) (6) 0 (94)Gains/losses from divestments – – – – – (19) (19) – – (19)
Capital expenditure 9,138 2,231 367 332 797 1,293 14,159 6,112 (52) 20,220B/S Investments in
associated companies (the equity method) 228 – 23 – 1 432 – 0 – 684B/S Assets held for sale
(total assets) 9,348 9,348 9,348B/S Assets held for sale
(total liabilities) – – – – – (4,716) (4,716) – – (4,716)
Internal sales between segments are generally made at standard cost of sales, including calculated interest and product improvement expenses. Internal sales from service companies are generally made at market price.
Reporting by market Net sales Non-current assets 1
2012 2011 2012 2011
Europe 111,606 120,828 71,350 65,522 of which Sweden 12,133 14,108 28,245 26,315 of which France 24,273 27,061 17,207 15,214north America 71,101 60,560 23,908 19,999 of which USA 56,441 46,984 19,923 16,288South America 29,164 35,142 1,872 1,447 of which Brazil 18,662 26,056 1,515 1,166Asia 69,278 73,586 26,271 30,018 of which China 19,990 22,952 2,265 2,194 of which Japan 18,987 17,865 17,992 22,472Other markets 22,498 20,251 998 982
I/S B/S Total 303,647 310,367 124,399 117,968
1 non-current assets include intangible and tangible assets.The reporting of net sales by market is based on where the customers are located.
113

The Volvo Group’s recognized net sales pertain mainly to revenues from sales of goods and services. net sales are, if the occasion arises, reduced by the value of discounts granted and by returns.
Revenue from the sale of goods is recognized when significant risks and rewards of ownership have been transferred to external parties, normally when the goods are delivered to the customer. However, if the sale of goods is combined with a buy-back agreement or a residual value guarantee, the transaction is recognized as an operating lease transaction if significant risks in regard to the goods are retained in Volvo Group. Revenue is then recognized over the period of the residual value commitment. If the residual value risk commitment is not significant or the sale was made to an inde-pendent party before Volvo Group is committed to the residual value risk the revenue is recognized at the time of sale and a provision is made to reflect the estimated residual value risk (refer to note 21 Other provisions). If sale is in combination with a commitment from the customer to buy a new Volvo product in connection to a buy-back option, revenue is recognized at the time of the sale.
Revenue from the sale of workshop services is recognized when the service is provided. Interest income in conjunction with finance leasing or instalment contracts are recognized during the underlying contract period. Revenue for maintenance contracts are recognized in line with the allocation of associated costs over the contract period.
Interest income is recognized on a continuous basis and dividend income when the right to receive dividend is obtained.
aCCounTinG poliCy sourCes of esTimaTion unCerTainTy!Buy-back agreements and residual value guarantees In certain cases, Volvo Group enters into a buy-back agreement or residual value guarantee after Volvo Group has sold the product to an independent party or in combination with an undertaking from the customer to purchase a new product the event of a buy-back. In such cases, there may be a ques-tion of judgement regarding whether or not significant risks and rewards of ownership have been transferred to the customer. If it is determined that such an assessment was incorrect, the Volvo Group’s recognized revenue and income for the period will decline and instead be distributed over several reporting periods.
Refer to note 21, Other provisions, for a description of residual value risks.
Hard and soft productsThe Volvo Group’s product range is divided into hard and soft products. The sale of new vehicles, machinery and engines comprise hard products. As from January 1, 2012 hard products also include sale of used vehicles and machines, trailers, superstructures and special vehicles. As from January 1, 2012 Soft products include services and aftermarket products.
Refer to page 28 for more information about the Volvo Group’s services.
Refer to Note 6 for information regarding net sales by product and market.
noTe 7 InCOME
Notes to fiNaNcial statemeNts
FInAnCIAL InFORMATIOn 2012
114

Changes in provisions for doubtful accounts receivable and customer-financing receivables are recognized in Other operating income and expenses, which during the period impacted the Volvo Group within an amount of 745 (770).
Other operating income and expense 2012 2011
Gains/losses on divestment of Group companies1 596 (19)Write down of assets held for sale – (54)Reversal of write down of assets held for sale – 60Change in allowances and write-offs for doubtful receivables, customer financing (640) (682)Change in allowances and write-offs for doubtful receivables, other (105) (88)Damages and litigations (175) (227)Restructuring costs2 (1,524) (94)Volvo profit sharing program (200) (523)Other income and expenses (112) (22)
I/S Total (2,160) (1,649)
1 Gains/losses on divestment of Group companies include capital gain from the sale of Volvo Aero of 568. 2 Restructuring costs are mainly related to restructuring and efficiency programs in Europe and Japan.
Read more regarding the company’s management of credit risk and credit reserves in Note 4.
noTe 8 OTHER OPERATInG InCOME AnD ExPEnSES
The market values of derivatives utilized to eliminate interest-rate exposure in the customer-financing portfolio are reported in Other financial income and expenses. During the year, these had a positive impact in the Income Statement of 8 (544).
Other financial income and expense 2012 2011
Financial instruments at fair value through profit or loss 8 544Exchange rate gains and losses on financial assets and liabilities (9) 25Financial income and expenses related to taxes (34) 18Costs for Treasury function, credit facilities, etc (266) (290)
I/S Total1 (301) 297
1 Other financial income and expenses attributable to financial amounted to neg 1 (pos 569).
Refer to Note 30 for Information regarding Financial Instruments.
noTe 9 OTHER FInAnCIAL InCOME AnD ExPEnSES
115

The Volvo Group recognizes valuation allowances for deferred tax assets where management does not expect such assets to be realized based upon current forecasts. In the event that actual results differ from these estimates or adjustments are made to future periods in these estimates, changes in the valuation allowance may be required, which could materi-ally impact the financial position and the income for the period. As of December 31, 2012, the valuation allowance amounted to 191 (263) of the value of deferred tax assets. Most of the reserve consists of unused loss carryforwards. net of this valuation allowance, deferred tax assets of 18,386 (18,552) were recognized in the Volvo Group’s balance sheet.
The Volvo Group has significant tax-loss carryforwards that are related to countries with long or indefinite periods of utilization, mainly Sweden, Japan and France. The Volvo Group considers it to be most certain that sufficient income will be generated in the coming years for the tax-loss carryforwards to be utilized.
Income tax for the period includes current and deferred taxes. Current taxes are calculated on the basis of the tax regulations prevailing in the countries in which the Parent Company and subsidiaries are active and generate taxable income.
Deferred taxes are recognized on differences that arise between the taxable value and recognized value of assets and liabilities as well as on tax-loss carryforwards. However, with regard to the measurement of deferred tax assets, that is, the value of future tax reductions, these items are recognized provided that it is probable that the amounts can be uti-lized against future taxable income.
Deferred taxes on temporary differences on participations in subsidiar-ies and associated companies are only recognized when it is probable that the difference will be recovered in the near future.
Tax laws in Sweden and certain other countries allow companies to defer payment of taxes through allocations to untaxed reserves. These items are treated as temporary differences in the consolidated balance sheet, meaning that deferred tax liability and equity capital are separated. In the consolidated income statement an allocation to, or withdrawal from, untaxed reserves is divided between deferred taxes and net income for the year.
Income taxes were distributed as follows:
2012 2011
Current taxes relating to the period (3,566) (5,331)Adjustment of current taxes for prior periods (144) 76Deferred taxes originated or reversed during the period (568) (1,584)Remeasurements of deferred tax assets 180 25
I/S Total income taxes (4,097) (6,814)
Provisions have been made for estimated tax charges that may arise as a result of prior tax audits. Tax processes are evaluated on a regular basis and provisions are made for possible outcome when it is probable that the Volvo Group will have to pay more taxes and when it is possible to make a reasonably assessment of the possible outcome. Tax claims for which no provision was deemed necessary were recognized as contin-gent liabilities.
Deferred taxes amounting to 0 (1) have been recognized in other com-prehensive income, attributable to fair value of derivative instruments.
At year-end 2012, the Volvo Group’s unused tax-loss carryforwards amounted to 18,396 (22,462). These loss carryforwards expire according to the table below:
Due date Dec 31,
2012Dec 31,
2011
after 1 year 76 40after 2 years 148 77after 3 years 267 180after 4 years 950 434after 5 years 466 2,302after 6 years or more 16,489 19,429Total 18,396 22,462
The Swedish corporate income tax rate amounted 26.3% in 2012. The table below discloses the principal reasons for the difference between this rate and the Volvo Group’s tax rate, based on income after financial items.
2012, %
2011, %
Swedish corporate income tax rate 26 26Difference in tax rate in various countries 3 3Other non-taxable income (3) (3)Other non-deductible expenses 1 1Current taxes attributable to prior years 1 0Remeasurement of deferred tax assets (1) 0Income tax rate for the Group 27 27
From 2013 the Swedish corporate income tax rate is 22% as of Decem-ber 31, 2012. Deferred tax assets and tax liabilities in the Swedish com-panies have been valued at the new tax rate which has affected income taxes in the income statement positively by 213.
aCCounTinG poliCy
sourCes of esTimaTion unCerTainTy!
noTe 10 InCOME TAxES
Notes to fiNaNcial statemeNts
FInAnCIAL InFORMATIOn 2012
116

Specification of deferred tax assets and tax liabilities
Dec 31,2012
Dec 31,2011
Deferred tax assets: unused tax-loss carryforwards 5,232 6,907Other unused tax credits 171 141Intercompany profit in inventories 1,026 780Allowance for inventory obsolescence 443 368Valuation allowance for doubtful receivables 568 482Provisions for warranties 2,257 2,067Provisions for residual value risks 302 288Provisions for post-employment benefits2 1,850 1,188Provisions for restructuring measures 219 42Adjustment to fair value during corpo-rate acquisitions 1 0Market value of derivative instruments 33 28Land 1,872 2,204Other deductible temporary differences 4,602 4,320
Deferred tax assets before deduction for valuation allowance 18,577 18,815
Valuation allowance (191) (263)Deferred tax assets after deduction for valuation allowance 18,386 18,552
netting of deferred tax assets/liabilities (7,220) (5,714)B/S Deferred tax assets, net 11,166 12,838
Deferred tax liabilities: Accelerated depreciation on property, plant and equipment 3,176 3,811Accelerated depreciation on leasing assets 2,064 1,959LIFO valuation of inventories 362 270Capitalized product and software development 3,393 3,721Adjustment to fair value at company acquisitions 0 31untaxed reserves 92 92Market value of derivative instruments 0 1Provisions for post-employment benefits2 686 –Other taxable temporary differences 2,476 1,464
Deferred tax liabilities 12,248 11,349
netting of deferred tax assets/liabilities (7,220) (5,714)B/S Deferred tax liabilities, net 5,028 5,636
Deferred tax assets/liabilities, net1 6,138 7,203
1 The deferred tax assets and liabilities above are partially recognized in the balance sheet on a net basis after taking into account offsetting possibilities. Deferred tax assets and liabilities have been measured at the tax rates that are expected to apply during the period when the asset is realized or the liability is settled, according to the tax rates and tax regulations that have been resolved or announced at the balance-sheet date.
2 From 2012 provisions for post-employment benefits are accounted gross. For 2011 the gross amounts were 1,773 (deferred tax assets) and 585 (deferred tax liabilities).
The total deferred tax assets attributable to unused tax-loss carry-forwards amounted to 5,232 (6,907) of which 1,815 (2,914) pertains to Sweden, with an indefinite period of utilization, 1,409 (2,128) to Japan and 1,278 (1,174) to France.
The cumulative amount of undistributed earnings in foreign subsidiaries, which the Volvo Group currently intends to indefinitely reinvest outside of Sweden and upon which deferred income taxes have not been provided is SEK 60 billion (62) at year end. The main part of the undistributed earn-ings is pertaining to countries where the dividends are not taxable
Refer to Note 4 for information on how the Volvo Group handles equity cur-rency risk.
Minority interests are interest attributable to non-controlling shareholders. Minority interests are presented in the equity, separately from the equity of the owners of the parent. At business combinations minority interests should be valued either at fair value or at the minority’s proportionate share of the acquiree’s net assets. Minority interests are assigned the minority shareholder’s portion of the equity of the subsidiary. Changes in a parent’s ownership interest in a subsidiary that do not result in a loss of control are accounted for as equity transactions.
Minority interests in income for the period and in equity consisted mainly of the minority interests in Shandong Lingong Construction Machinery Co, Ltd (30%).
aCCounTinG poliCy
noTe 11 MInORITy InTERESTS
117

Intangible assetsThe Volvo Group applies the cost method for recognition of intangible assets. Borrowing costs are included in the cost of assets that necessarily take more than 12 months to prepare for their intended use or sale, known as qualifying assets.
When participating in industrial projects in partnership with other compa-nies the Volvo Group in certain cases pays an entrance fee to participate. These entrance fees are capitalized as intangible assets.
Research and development expensesThe Volvo Group applies IAS 38, Intangible Assets, for the recognition of research and development expenses. Pursuant to this standard, expendi-tures for the development of new products, production systems and soft-ware are recognized as intangible assets if such expenditures, with a high degree of certainty, will result in future financial benefits for the company. The cost for such intangible assets is amortized over the estimated useful life of the assets.
The rules require stringent criteria to be met for these development expenditures to be recognized as assets. For example, it must be possible to prove the technical functionality of a new product or software prior to its development being recognized as an asset. In normal cases, this means that expenditures are capitalized only during the industrialization phase of a product development project. Other research and development expenses are recognized in the Income Statement as incurred.
The Volvo Group has developed a process for conducting product development projects named the Global Development Process (GDP). The GDP has six phases focused on separate parts of the project. Every phase starts and ends with a reconciliation point, known as a gate, the criteria for which must be met for the project’s decision-making commit-tee to open the gate and allow the project to progress to the next phase. During the industrialization phase, the industrial system is prepared for series production and the product is launched.
GoodwillGoodwill is recognized as an intangible asset with indefinite useful life. For non-depreciable assets such as goodwill, impairment tests are performed annually, as well as if there are indications of impairments during the year, by calculating the asset’s recovery value. If the calculated recovery value is less than the carrying value, the asset’s recovery value is impaired.
The Volvo Group’s measurement model is based on a discounted cash-flow model, with a forecast period of four to six years. Cash-generating units, identified as business areas, are measured. The Trucks segment is considered one single cash-generating unit under the new organization. Goodwill related to the area Trucks is therefore evaluated based on the cash generation capacity of the overall Trucks segment from 2012.
Goodwill assets are allocated to these cash-generating units on the basis of anticipated future utility. Measurements are based on management’s best estimation of the operations’ development. The basis for this estimation is long-term forecasts of the market’s growth of 2% (2), in relation to the per-formance of the Volvo Group’s operations. In the model, the Volvo Group is expected to maintain stable capital efficiency over time. Other parameters considered in the calculation are gross margin, product mix, expenses and capital needs. Measurements are based on nominal values and utilize a gen-eral rate of inflation in line with the European target. The Volvo Group uses a discounting factor calculated to 12% (12) before tax for 2012.
In 2012, the value of Volvo’s operations exceeded the carrying amount of goodwill for all business areas, which is why no impairment was recognized. Volvo has also tested whether a surplus value would still exist after being
subjected to reasonable potential changes to the assumptions, negatively adjusted by one percentage point on an individual basis, whereof no adjust-ment would have sufficient impact to require impairment for any business area except Volvo Rents. For Volvo Rents the recovery value, calculated based on discounted cash flows, exceeded the carrying amount of 8,643 with 1,088. A reduction of the dollar utilization rate with 0.9 percentage points or an increase of the discounting factor to 13% would eliminate the surplus value.
Since the surplus values differ between the business areas, they are to a varying degree sensitive to changes in the assumptions described above. Therefore, the Volvo Group continuously follows the performance of the business areas whose overvalue is dependent on the fulfillment of the Volvo Group’s assessments. Instability in the recovery of the market and volatility in interest and currency rates may lead to indications of a need for impairment. The most important factors for the future operations of the Volvo Group are described in the Volvo Group business area sec-tion, as well as in the Risk management section.
Amortization and impairmentAmortization is made on a straight-line basis based on the cost of the assets, adjusted in appropriate cases by impairments, and estimated useful lives. Amortization is recognized in the respective function to which it belongs. Impairment tests for amortizable assets are performed if there are indications of impairment at the balance sheet date.
Amortization periods
Trademarks 20 yearsDistribution networks 10 yearsProduct and software development 3 to 8 years
aCCounTinG poliCies
Impairment of goodwill and other intangible assetsIntangible assets other than goodwill are amortized and depreciated over their useful lives. useful lives are based on estimates of the period in which the assets will generate revenue. If, at the date of the financial statements, any indication exists that an intangible non-current asset has been impaired, the recoverable amount of the asset is calculated. The recoverable amount is the higher of the asset’s net selling price and its value in use, estimated with reference to management’s projections of future cash flows. If the recoverable amount of the asset is less than the carrying amount, an impair-ment loss is recognized and the carrying amount of the asset is reduced to the recoverable amount. Determination of the recoverable amount is based upon management’s projections of future cash flows, which are generally based on internal business plans or forecasts. While management believes that estimates of future cash flows are reasonable, different assumptions regarding such cash flows could materially affect valuations. The need for impairment of goodwill and certain other intangible assets with indefinite useful lives is determined on an annual basis, or more frequently if required through calculation of the value of the asset. Such an impairment review will require management to determine the fair value of the Volvo Group’s cash generating units, on the basis of projected cash flows and internal business plans and forecasts. Surplus values differ between the business areas and they are, to a varying degree, sensitive to changes in assumptions and the business environment. Volvo Group has performed similar impair-ment reviews since 2002. no need for impairment losses was required for the period 2002 until 2012.
sourCes of esTimaTion unCerTainTy!
noTe 12 InTAnGIBLE ASSETS
Notes to fiNaNcial statemeNts
FInAnCIAL InFORMATIOn 2012
118

Intangible assets, acquisition costsEntrance fees,
industrial programs
Capitalized product and software development
Other intangible assets2
Total intangible assets Goodwill1
Acquisition cost as of Dec 31, 2010 22,936 3,800 27,851 6,889 61,476Capital expenditures3 – 109 4,238 122 4,469Sales/scrapping – (484) (657) (323) (1,464)Acquired and divested operations 967 0 (4) 0 963Translation differences 272 1 431 (32) 672Reclassified to assets held for sale (274) (3,199) (1,963) (60) (5,496)Reclassifications and others (2) (3) 6 54 55Acquisition cost as of Dec 31, 2011 23,899 224 29,902 6,650 60,675
Capital expenditures3 – 93 5,385 101 5,579Sales/scrapping – (14) (1,738) (12) (1,764)Acquired and divested operations 588 (3,182) (2,109) 52 (4,651)Translation differences (1,446) (11) (1,479) (592) (3,528)Reclassified from assets held for sale 297 3,198 1,958 60 5,513Reclassifications and other 0 (19) (23) (55) (97)Acquisition cost as of Dec 31, 2012 23,338 289 31,896 6,204 61,727
Accumulated amortization and impairment Entrance fees,
industrial programs
Capitalized product and software development
Other intangible assets2
Total intangible assets Goodwill1
Accumulated amortization and impairment as of Dec 31, 2010 – 1,820 16,271 2,671 20,762Amortization and impairment5 – 76 2,788 383 3,247Sales/scrapping – (265) (406) (322) (993)Acquired and divested operations – 0 0 0 0Translation differences – 0 312 33 345Reclassified to assets held for sale – (1,596) (570) (24) (2,190)Reclassifications and other – (2) 1 (2) (3)Accumulated amortization and impairment as of Dec 31, 2011 – 33 18,396 2,739 21,168
Amortization and impairment5 – 55 2,749 387 3,191Sales/scrapping – 0 (1,734) (12) (1,746)Acquired and divested operations – (1,633) (547) (29) (2,209)Translation differences – (1) (942) (188) (1,131)Reclassified from assets held for sale – 1,602 572 24 2,198Reclassifications and other – (6) (38) (73) (117)Accumulated amortization and impairment as of Dec 31, 2012 – 50 18,456 2,848 21,354
B/S Net value in balance sheet as of December 31, 20114 23,899 191 11,506 3,911 39,507B/S Net value in balance sheet
as of December 31, 20124 23,338 239 13,440 3,356 40,373
1 Includes on the date of IFRS adoption, costs of 14,184 and accumulated amortization of 3,863.2 Other intangible assets mainly consist of trademarks and distribution networks.3 Includes capitalized borrowing costs of 295 (112).4 Costs less accumulated, amortization and impairments.5 Of which impairments 83 (74).
Goodwill per Business AreaDec 31,
2012Dec 31,
2011
Trucks 12,759 13,828Construction Equipment 7,462 7,764Buses 1,145 1,169Volvo Rents 1,469 990Other business areas 503 148Total goodwill value 23,338 23,899
119

Tangible assetsThe Volvo Group applies the cost method for measurement of tangible assets. Borrowing costs are included in the acquisition value of assets that necessarily take more than 12 months to get ready for their intended use or sale, so called qualifying assets.
Investment properties are properties owned for the purpose of obtaining rental income and/or appreciation in value. Investment properties are recog-nized at cost. Information regarding the estimated fair value of investment properties is based on discounted cash flow projections The required return is based on current property market conditions for comparable properties in comparable locations.
Depreciation and impairmentProperty, plant and equipment are depreciated over their useful lives. useful lives are based on estimates of the period over which the assets will generate revenue.
Depreciation is recognized on a straight-line basis based on the cost of the assets, adjusted in appropriate cases by impairments, and estimated useful lives. Depreciation is recognized in the respective function to which it belongs. Impairment tests for depreciable non-current assets are performed if there are indications of impairment at the balance-sheet date.
Depreciation periods
Type-specific tools 2 to 8 yearsAssets under operating leases 3 to 5 yearsMachinery 5 to 20 yearsBuildings and investment properties 25 to 50 yearsLand improvements 20 years
Tangible assets, Acquisition cost
Buildings
Land and land
improve-ments
Machinery and equip-
ment3
Construction in progress, including advance payments
Total investment property, property,
plant and equipment
Assets under
operating leases
Total tangible
assets
Acquisition costs as of Dec 31, 2010 31,558 12,567 70,514 5,709 120,348 29,095 149,443
Capital expenditures1 548 266 3,947 3,455 8,216 7,414 15,630Sales/scrapping (299) (88) (1,969) 0 (2,356) (4,786) (7,142)Acquired and divested operations 36 10 64 0 110 1,503 1,613Translation differences 373 411 889 (33) 1,640 122 1,762Reclassified to assets held for sale (706) (49) (4,586) (57) (5,398) (131) (5,529)Reclassifications and other 619 141 1,897 (2,622) 35 (652) (617)Acquisition costs as of Dec 31, 2011 32,129 13,258 70,756 6,452 122,595 32,565 155,160
Capital expenditures1 848 348 3,296 5,031 9,523 9,986 19,509Sales/scrapping (234) (32) (2,121) (13) (2,400) (5,229) (7,629)Acquired and divested operations (661) (9) (4,244) (92) (5,006) 69 (4,937)Translation differences (1,775) (1,276) (3,875) (179) (7,105) (1,438) (8,543)Reclassified from assets held for sale 706 49 4,584 57 5,396 219 5,615Reclassifications and other 1,211 260 1,855 (3,592) (266) 2,196 1,930Acquisition costs as of Dec 31, 2012 32,224 12,598 70,251 7,664 122,737 38,368 161,105
aCCounTinG poliCies
sourCes of esTimaTion unCerTainTy!Impairment of tangible assets If, at the balance-sheet date, there is any indication that a tangible asset has been impaired, the recoverable amount of the asset should be esti-mated. The recoverable amount is the higher of the asset’s net selling price and its value in use, estimated with reference to management’s pro-jections of future cash flows. If the recoverable amount of the asset is less than the carrying amount, an impairment loss is recognized and the carry-ing amount of the asset is reduced to the recoverable amount. Determina-tion of the recoverable amount is based upon management’s projections of future cash flows, which are generally made by use of internal business plans or forecasts. While management believes that estimates of future cash flows are reasonable, different assumptions regarding such cash flows could materially affect valuations.
noTe 13 TAnGIBLE ASSETS
Notes to fiNaNcial statemeNts
FInAnCIAL InFORMATIOn 2012
120
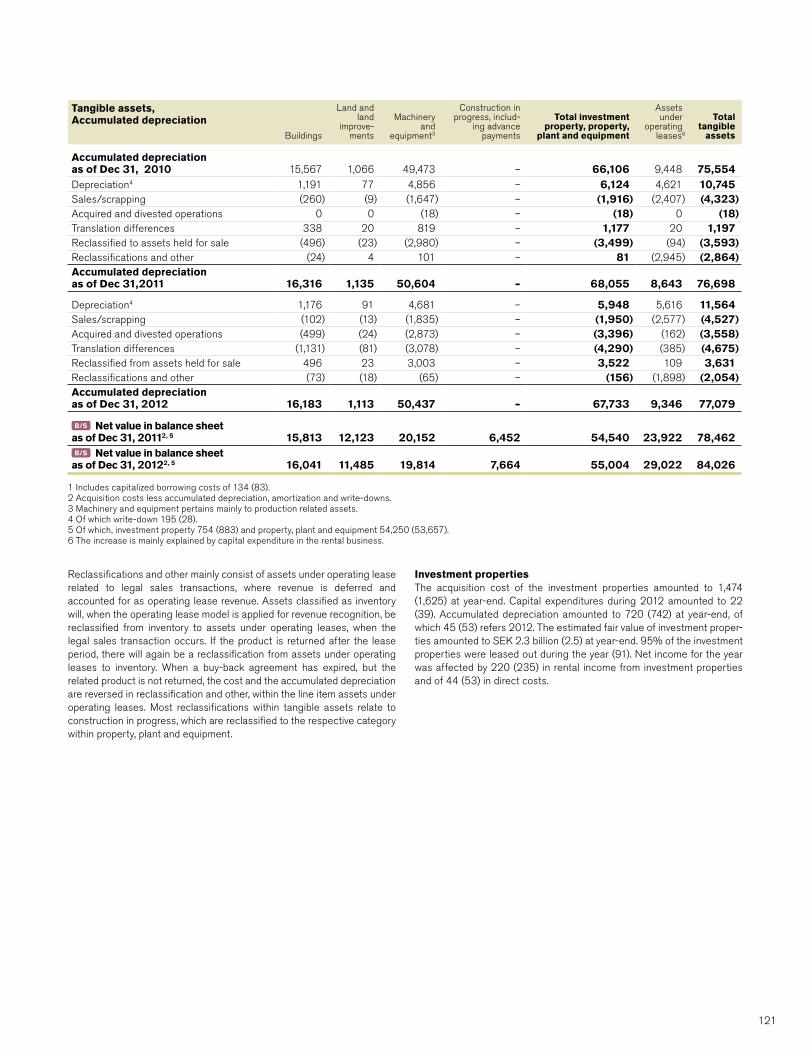
Reclassifications and other mainly consist of assets under operating lease related to legal sales transactions, where revenue is deferred and accounted for as operating lease revenue. Assets classified as inventory will, when the operating lease model is applied for revenue recognition, be reclassified from inventory to assets under operating leases, when the legal sales transaction occurs. If the product is returned after the lease period, there will again be a reclassification from assets under operating leases to inventory. When a buy-back agreement has expired, but the related product is not returned, the cost and the accumulated depreciation are reversed in reclassification and other, within the line item assets under operating leases. Most reclassifications within tangible assets relate to construction in progress, which are reclassified to the respective category within property, plant and equipment.
Investment propertiesThe acquisition cost of the investment properties amounted to 1,474 (1,625) at year-end. Capital expenditures during 2012 amounted to 22 (39). Accumulated depreciation amounted to 720 (742) at year-end, of which 45 (53) refers 2012. The estimated fair value of investment proper-ties amounted to SEK 2.3 billion (2.5) at year-end. 95% of the investment properties were leased out during the year (91). net income for the year was affected by 220 (235) in rental income from investment properties and of 44 (53) in direct costs.
Tangible assets, Accumulated depreciation
Buildings
Land and land
improve-ments
Machinery and
equipment3
Construction in progress, includ-
ing advance payments
Total investment property, property,
plant and equipment
Assetsunder
operatingleases6
Total tangible
assets
Accumulated depreciation as of Dec 31, 2010 15,567 1,066 49,473 – 66,106 9,448 75,554Depreciation4 1,191 77 4,856 – 6,124 4,621 10,745Sales/scrapping (260) (9) (1,647) – (1,916) (2,407) (4,323)Acquired and divested operations 0 0 (18) – (18) 0 (18)Translation differences 338 20 819 – 1,177 20 1,197Reclassified to assets held for sale (496) (23) (2,980) – (3,499) (94) (3,593)Reclassifications and other (24) 4 101 – 81 (2,945) (2,864)Accumulated depreciation as of Dec 31,2011 16,316 1,135 50,604 – 68,055 8,643 76,698
Depreciation4 1,176 91 4,681 – 5,948 5,616 11,564Sales/scrapping (102) (13) (1,835) – (1,950) (2,577) (4,527)Acquired and divested operations (499) (24) (2,873) – (3,396) (162) (3,558)Translation differences (1,131) (81) (3,078) – (4,290) (385) (4,675)Reclassified from assets held for sale 496 23 3,003 – 3,522 109 3,631Reclassifications and other (73) (18) (65) – (156) (1,898) (2,054)Accumulated depreciation as of Dec 31, 2012 16,183 1,113 50,437 – 67,733 9,346 77,079
B/S Net value in balance sheet as of Dec 31, 20112, 5 15,813 12,123 20,152 6,452 54,540 23,922 78,462B/S Net value in balance sheet
as of Dec 31, 20122, 5 16,041 11,485 19,814 7,664 55,004 29,022 84,026
1 Includes capitalized borrowing costs of 134 (83).2 Acquisition costs less accumulated depreciation, amortization and write-downs.3 Machinery and equipment pertains mainly to production related assets.4 Of which write-down 195 (28).5 Of which, investment property 754 (883) and property, plant and equipment 54,250 (53,657).6 The increase is mainly explained by capital expenditure in the rental business.
121

Volvo Group as the lessorLeasing contracts are defined in two categories, operational and financial leases, depending on the contract’s financial implications. Operational leasing contracts are recognized as non-current assets in Assets under operational leases. Income from operational leasing is recognized equally distributed over the leasing period. Straight-line depreciation is applied to these assets in accordance with the terms of the undertaking and the deprecation amount is adjusted to correspond to the estimated realizable value when the undertaking expires. Assessed impairments are charged to the income statement. The product’s assessed realizable value at expir-ation of the undertaking is reviewed continuously on an individual basis.
Financial leasing agreements are recognized as either non-current or current receivables in the customer finance operations. Payments from financial leasing contracts are distributed between interest income and amortization of the receivable in the customer finance operations.
Volvo Group as the lesseeVolvo evaluates leasing contracts in accordance with IAS 17, Leases. In those cases in which risks and rewards that are related to ownership are substantially held by the Volvo Group, so-called financial leases, Volvo Group recognizes the asset and related obligation in the balance sheet at the lower of the leased asset’s fair value or the present value of minimum lease payments. Future leasing fee commitments are recognized as obli-gations. The lease asset is depreciated in accordance with the Volvo Group’s policy for the respective non-current asset. The lease payments when made are allocated between amortization and interest expenses. If the leasing contract is considered to be a so-called operational lease, lease payments are charged to profit or loss over the lease contract period.
Volvo Group as the lessorAs of December 31, 2012, future rental income from non-cancellable financial and operational leases (minimum leasing fees) amounted to 52,322 (50,704). Future rental income is distributed as follows:
Finance leases
Operating leases
2013 14,844 4,5112014–2017 22,576 9,1212018 or later 726 544Total 38,146 14,176Allowance for uncollectible future rental income (436) unearned rental income (2,847) Present value of future rental income related to non-cancellable leases 34,863
Volvo Group as a lesseeAs of December 31, 2012, future rental payments (minimum leasing fees) related to non-cancellable leases amounted to 3,817 (3,799).
Future rental payments are distributed as follows:
Finance leases
Operating leases
2013 124 9502014–2017 224 1,8752018 or later 139 505Total 487 3,330
Rental expenses amounted to:
2012 2011
Finance leases: Contingent rents (10) (12)
Operating leases: Contingent rents (36) (20)Rental payments (1,113) (1,035)Sublease payments 7 5
Total (1,152) (1,062)
Carrying amount of assets subject to financial leases:
Dec 31, 2012
Dec 31, 2011
Costs: Buildings 226 92Land and land improvements 41 53Machinery and equipment 627 1,901Assets under operating lease1 57 194Total 951 2,240
Accumulated depreciation: Buildings (58) (30)Land and land improvements (1) –Machinery and equipment (288) (1,231)Assets under operating lease1 (14) (68)Total (361) (1,329)
Carrying amount in the balance sheet: Buildings 168 62Land and land improvements 40 53Machinery and equipment 339 670Assets under operating lease1 43 126Total 590 911
1 Refer to assets leased by the Volvo Group as financial lease which are later leased to customers as operating lease.
aCCounTinG poliCies
noTe 14 LEASInG
Notes to fiNaNcial statemeNts
FInAnCIAL InFORMATIOn 2012
122
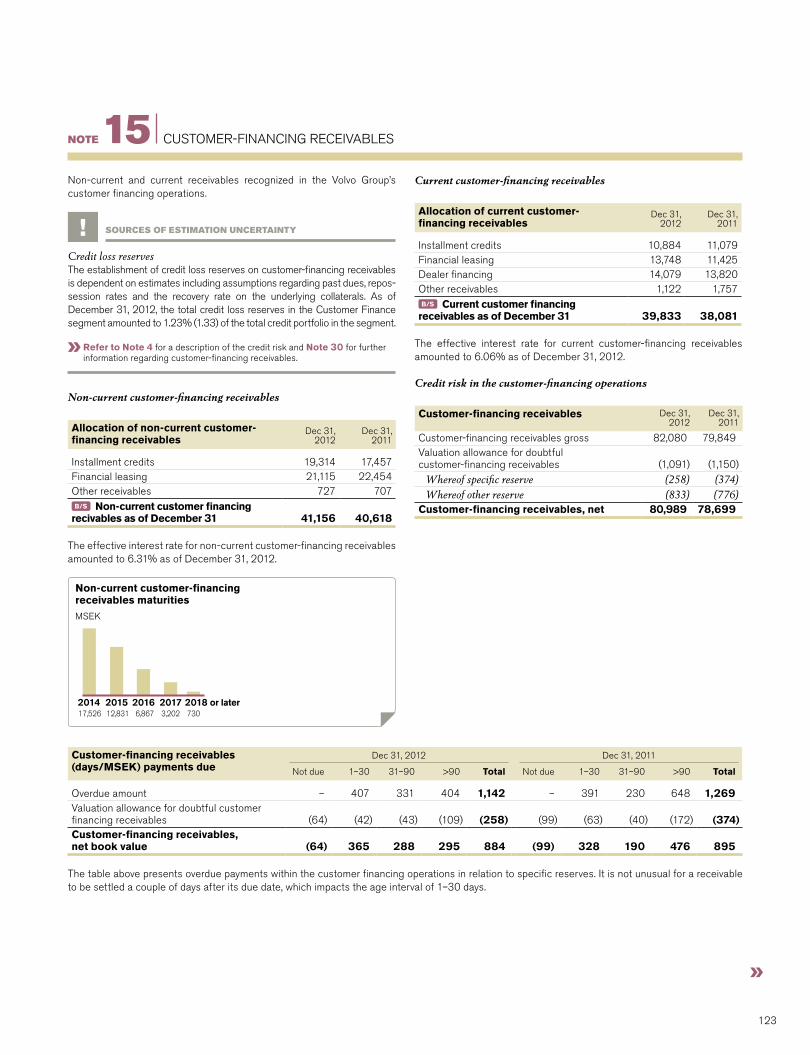
Credit loss reservesThe establishment of credit loss reserves on customer-financing receivables is dependent on estimates including assumptions regarding past dues, repos-session rates and the recovery rate on the underlying collaterals. As of December 31, 2012, the total credit loss reserves in the Customer Finance segment amounted to 1.23% (1.33) of the total credit portfolio in the segment.
Refer to Note 4 for a description of the credit risk and Note 30 for further information regarding customer-financing receivables.
Non-current customer-financing receivables
Allocation of non-current customer-financing receivables
Dec 31, 2012
Dec 31, 2011
Installment credits 19,314 17,457Financial leasing 21,115 22,454Other receivables 727 707B/S Non-current customer financing
recivables as of December 31 41,156 40,618
The effective interest rate for non-current customer-financing receivables amounted to 6.31% as of December 31, 2012.
Current customer-financing receivables
Allocation of current customer- financing receivables
Dec 31, 2012
Dec 31, 2011
Installment credits 10,884 11,079Financial leasing 13,748 11,425Dealer financing 14,079 13,820Other receivables 1,122 1,757B/S Current customer financing
receivables as of December 31 39,833 38,081
The effective interest rate for current customer-financing receivables amounted to 6.06% as of December 31, 2012.
Credit risk in the customer-financing operations
Customer-financing receivables Dec 31, 2012
Dec 31, 2011
Customer-financing receivables gross 82,080 79,849Valuation allowance for doubtful customer-financing receivables (1,091) (1,150)
Whereof specific reserve (258) (374)Whereof other reserve (833) (776)
Customer-financing receivables, net 80,989 78,699
Customer-financing receivables (days/MSEK) payments due
Dec 31, 2012 Dec 31, 2011
Not due 1–30 31–90 >90 Total Not due 1–30 31–90 >90 Total
Overdue amount – 407 331 404 1,142 – 391 230 648 1,269Valuation allowance for doubtful customer financing receivables (64) (42) (43) (109) (258) (99) (63) (40) (172) (374)Customer-financing receivables, net book value (64) 365 288 295 884 (99) 328 190 476 895
The table above presents overdue payments within the customer financing operations in relation to specific reserves. It is not unusual for a receivable to be settled a couple of days after its due date, which impacts the age interval of 1–30 days.
SourceS of eStimation uncertainty!
Non-current and current receivables recognized in the Volvo Group’s customer financing operations.
note 15 CusTOmer-FINANCING reCeIVAbles
20173,202
2018 or later730
20166,867
201512,831
201417,526
Non-current customer-financing receivables maturitiesmseK
123

Credit loss reservesThe establishment of credit loss provisions for account receivables is recog-nized as soon as it is probable that a credit loss has incurred. A credit loss has incurrent when there has been an event that has triggered the customer’s inability to pay. As of December 31, 2012, the total credit loss reserves for account receivables amounted to 2.41% (2.57) of total account receivables.
Refer to Note 4 regarding credit risk.
Non-current receivables Dec 31, 2012
Dec 31, 2011
Other interest-bearing loans to external parties 76 98Other interest-bearing financial receivables 261 596Other financial receivables 767 2,131Other receivables 2,552 2,184Non-current receivables as of December 311 3,656 5,009
1 Of non-current receivables 1,190 (2,822) pertains to financial instruments.
sourCes of esTimaTion unCerTainTy!
noTe 16 RECEIVABLES
Customer financing receivables total exposure
Dec 31, 2012 Dec 31, 2011
not due 1–30 31–90 >90 Total not due 1–30 31–90 >90 Total
Customer financing receivables 72,068 7,221 2,161 630 82,080 70,085 6,828 1,971 965 79,849
Concentration of credit risk
Customer concentration The ten largest customers in Customer Finance account for 6.2 % (5.6) of the total asset portfolio. The rest of the portfolio is pertinent to a large number of customers. This way the credit risk is spread across many markets and among many customers.
Concentration by geographical marketThe adjacent table discloses the concentration of the customer-financing portfolio divided into geographical markets.
Read more about the Volvo Group’s overall description credit risks in Note 4, Financial-risk management.
Read more about Volvo Financial Services’ trend during the year on page 66.
Geographic market, percentage of customer-financing portfolio (%).
Europe, 43.0%
North America, 29.5%
Asia, 12.8%
South America, 14.6%
Other markets, 0.1%
Change of valuation allowance for doubtful customer-financing receivables 2012 2011
Valuation allowance for doubtful customer-financing receivables as of December 31, preceding year 1,150 1,325new valuation allowance charged to income 835 910Reversal of valuation allowance charged to income (252) (250)utilization of valuation allowance related to actual losses (575) (821)Translation differences (67) (14)Valuation allowance for doubtful customer-financing receivables as of December 31 1,091 1,150
The total contractual amount to which the overdue payments pertain are presented in the table below. In order to provide for occurred but not yet identified customer-financing receivables overdue, there are additional reserves of 833 (776). The remaining exposure is secured by liens on the purchased equipment and, in certain circumstances, other credit enhance-ments such as personal guarantees, credit insurance, liens on other property owned by the borrower etc.
Collaterals taken in possession that meet the recognition criteria amounted to 200 (412) as of December 31, 2012.
Customer-financing receivables (cont.)
Notes to fiNaNcial statemeNts
FInAnCIAL InFORMATIOn 2012
124

Current receivables Dec 31, 2012
Dec 31, 2011
Loans to external parties – 1Other interest-bearing financial receivables 2,574 666Accounts receivable 27,349 27,699Prepaid expenses and accrued income 2,392 2,761VAT receivables 3,573 3,387Other financial receivables 1,220 1,746Other receivables 5,304 5,932Current receivables, after deduction of valuation allowances for doubtful accounts receivable1 42,412 42,191
1 Of current receivables, 31,143 (30,133) pertains to financial instruments.
Credit risks in accounts receivable
Change of valuation allowance for doubtful accounts receivable
Dec 31, 2012
Dec 31, 2011
Valuation allowance for doubtful accounts recivables as of December 31, preceding year 731 721new valuation allowance charged to income 219 175
Reversal of valuation allowance charged to income (147) (126)utilization of valuation allowance related to actual losses (88) (100)Acquired and divested operations 8 33Translation differences (40) 5Reclassifications, etc. (8) 24Valuation allowance for doubtful accounts receivables as of December 31 675 731
Refer to Note 4 for more information regarding the Volvo Group’s financial risks.
Refer to Note 15 for more information regarding credit risk in customer financing receivables.
Refer to Note 30 for information regarding goals and policies for financial instruments.
Age analysis of portfolio value – Accounts receivable
Dec 31, 2012 Dec 31, 2011
not Due 1–30 31–90 >90 Total not Due 1–30 31–90 >90 Total
Accounts receivable gross 25,327 1,246 533 918 28,024 26,152 1,102 465 711 28,430Provision for doubtful accounts receivable (156) (3) (25) (491) (675) (155) (30) (57) (490) (731)Accounts receivable net 25,171 1,243 508 427 27,349 25,997 1,073 408 221 27,699
Inventories Inventories are recognized at the lower of cost and net realizable value. The cost is established using the first-in, first-out method (FIFO) and is based on the standard cost method, including costs for all direct manu-facturing expenses and the attributable share of capacity and other manufacturing-related costs. The standard costs are tested regularly and adjustments are made based on current conditions. Costs for research and development, selling, administration and financial expenses are not included. net realizable value is calculated as the selling price less costs attributable to the sale.
Inventory Dec 31, 2012
Dec 31,2011
Finished products 26,013 28,985Production materials, etc. 14,396 15,614B/S Inventory as of December 31 40,409 44,599
Inventories recognized as cost of sold products during the period amounted to SEK 212,469 (219,946) billion.
Increase (decrease) in allowance for inventory obsolescence 2012 2011
Allowance for inventory obsolescence as of December 31, preceding year 2,624 3,382Increase in allowance for inventory obsolescence charged to income 456 (213)Scrapping (390) (264)Translation differences (92) (23)Reclassifications, etc. 13 (258)Allowance for inventory obsolescence as of December 31 2,611 2,624
aCCounTinG poliCy
Inventory obsolescenceIf the net realizable value is lower than cost, a valuation allowance is estab-lished for inventory obsolescence. The total inventory value, net of inventory obsolescence allowance, was 40,409 (44,599) as of December 31, 2012.
sourCes of esTimaTion unCerTainTy !
noTe 17 InVEnTORIES
125

Cash and cash equivalents include high liquid interest-bearing securities that are considered easily convertible to cash. Interest-bearing securities that fail to meet this definition are recognized as marketable securities.
Marketable securitiesMarketable securities comprise mainly interest-bearing securities, distributed as shown below:
Dec 31,2012
Dec 31,2011
Government securities 131 136Banks and financial institutions 494 521Real estate financial institutions 2,505 6,205B/S Marketable securities
as of December 31 3,130 6,862
Cash and cash equivalents
Dec 31,2012
Dec 31,2011
Cash in banks 22,712 21,206Bank certificates1 1,019 1,492Time deposits in banks 2,028 7,681B/S Cash and cash equivalents as of
December 31 25,759 30,379
1 Bank certificates which matures within three months of the date of acquisition.
Cash and cash equivalents as of December 31, 2012, include SEK 0.2 billion (0.7) that is not available for use by the Volvo Group and SEK 9.4 billion (9.3) where other limitations exist, mainly liquid funds in countries where exchange controls or other legal restrictions apply. With that it is not possible to immediately use the liquid funds in other parts of the Volvo Group, however normally there is no limitation for use for the Volvo Group’s operation in the respective country.
aCCounTinG poliCy
noTe 18 MARKETABLE SECuRITIES AnD LIQuID FunDS
Earnings per share is calculated as income for the period, attributable to the Parent Company’s shareholders, divided by the Parent Company’s average number of shares outstanding for the fiscal year. Diluted earnings per share is calculated as income for the period attributable to the Parent Company’s shareholders divided by the average number of shares out-standing plus the average number of shares that would be issued as an effect of ongoing share-based incentive programs. If during the year there were potential shares redeemed or expired during the period, these are also included in the average number of shares used to calculate the earn-ings per share after dilution.
The share capital of the Parent Company is divided into two series of shares, A and B. Both series carry the same rights, except that each Series A share carries the right to one vote and each Series B share carries the right to one tenth of a vote. The shares quota value is SEK 1.20.
Cash dividend decided by the Annual General Meeting 2012 was SEK 3.00 (2.50) per share or total of SEK 6,082.3 million (5,068.6).
During 2012 AB Volvo transferred, free of consideration, 250,922 treas-ury B-shares, with a total quota value of 301,106.40 SEK, to participants of Volvo Group’s long-term, share-based incentive program for Group and senior
executives executives in the Volvo Group, as accelerated allotment. The transferred treasury shares represent an insignificant portion of the share capital of AB Volvo.
unrestricted equity in the Parent Company as of December 31, 2012 amounted to SEK 31,346 million (32,268).
Information regarding number of shares
Dec 31,2012
Dec 31,2011
Own Series A shares 20,728,135 20,728,135Own Series B shares 80,013,209 80,264,131Total own shares 100,741,344 100,992,266
Own shares in % of total registered shares 4.73 4.74
Outstanding Series A shares 525,816,240 642,766,887Outstanding Series B shares 1,501,862,636 1,384,661,067Total outstanding shares 2,027,678,876 2,027,427,954
Total registered Series A shares 546,544,375 663,495,022Total registered Series B shares 1,581,875,845 1,464,925,198Total registered shares 2,128,420,220 2,128,420,220
Average number of outstanding shares 2,027,521,257 2,027,427,172
aCCounTinG poliCy
noTe 19 EQuITy AnD nuMBER OF SHARES
Notes to fiNaNcial statemeNts
FInAnCIAL InFORMATIOn 2012
126

Earnings per shareThe long-term share-based incentive programs decided by the Annual General Meeting 2011 create a dilution effect.
No other transactions have occurred that affected, or will have an effect on, the compilation of the reported number of shares.
Information regarding shares (other) 2012 2011
Number of shares, December 31, in millions 2,028 2,027Average number of shares before dilution in millions 2,028 2,027Average number of shares after dilution in millions 2,030 2,028Average share price, SEK 88.44 94.84
Net income attributable to Parent Company shareholders 11,039 17,751Basic earnings per share, SEK 5.44 8.76Diluted earnings per share, SEK 5.44 8.75
Change in other reserves Hedge reserve
Available-for-sale reserve Total
Balance as of January 1, 2012 (57) 67 10Change in fair value of commodity contracts 4 – 4Other changes 4 – 4Reclassification of shares in Deutz1 – (35) (35)Fair value adjustments regarding holdings in Japanese companies – 32 32Fair value adjustments regarding other holdings – (1) (1)Balance as of December 31, 2012 (49) 63 14
1 In 2012 an additional 18% of the shares in Deutz AG was acquired and thereby the company is recognized as an associated company.
The Volvo Group’s acumulative amount of exchange difference deferred to equity relating to assets held for sale amount to SEK 0 million (33).
Read more about investments in associated companies in Note 5.
Volvo Group’s post-employment benefits, such as pensions, healthcare and other benefits are mainly settled by means of regular payments to independent authorities or bodies that assume pension obligations and administer pensions through defined-contribution plans.
The remaining post-employment benefits are defined-benefit plans; that is, the obligations remain within the Volvo Group or are secured by proprietary pension foundations. The Volvo Group’s defined-benefit plans relate mainly to subsidiaries in the U.S. and comprise both pensions and other benefits, such as healthcare. Other large-scale defined-benefit plans apply to salaried employees in Sweden (mainly through the Swedish ITP pension plan) and employees in France and Great Britain.
present value of obligations at year-end, less fair value of plan assets, unrecognized actuarial gains or losses and unrecognized unvested past service costs.
As a supplement to IAS 19, Volvo Group applies UFR 4*, in accordance with the recommendation from the Swedish Financial Reporting Board, in calculating the Swedish pension liabilities.
For defined contribution plans, premiums are recognized as incurred in profit and loss according to function.
IAS 19 will be amended as of January 1, 2013.
Read more about new accounting principles 2012 and later in Note 1 and changes in Volvo Group financial reporting in Note 31.
* UFR 4 states how Swedish special payroll tax and Swedish yield tax should be accounted for regarding the part of the net pension liability that is attributable to Swedish entities. Swedish special payroll tax is shown as a receivable/liability on the difference compared to the legal pension liability. Swedish yield tax is con-sidered when estimating expected return on plan asset.
SourceS of eStimation uncertainty!Assumptions when calculating pensions and other post-employment benefits Provisions and costs for post-employment benefits, mainly pensions and health-care benefits, are dependent on assumptions used by actuaries in calculating such amounts. The appropriate assumptions and actuarial cal-culations are made separately for the respective countries of the Volvo Group’s operations which result in obligations for postemployment benefits.
accounting policy
The Volvo Group applies IAS 19, Employee Benefits, for post-employment benefits. In accordance with IAS 19, actuarial calculations should be made for all defined-benefit plans in order to determine the present value of obligations for benefits vested by its current and former employees. The actuarial calculations are prepared annually and are based upon actuarial assumptions that are determined close to the balance-sheet date each year. Changes in the present value of obligations due to revised actuarial assumptions and experience adjustments constitute actuarial gains or losses. These are expensed according to function over the employees’ average remaining service period to the extent they exceed the corridor value for each plan.
Deviations between the expected return on plan assets and the actual return are also treated as actuarial gains or losses. Provisions for post-employment benefits in the Volvo Group’s balance sheet correspond to the
note 20 PROVISIONS FOR POST-EMPlOyMENT BENEFITS
127
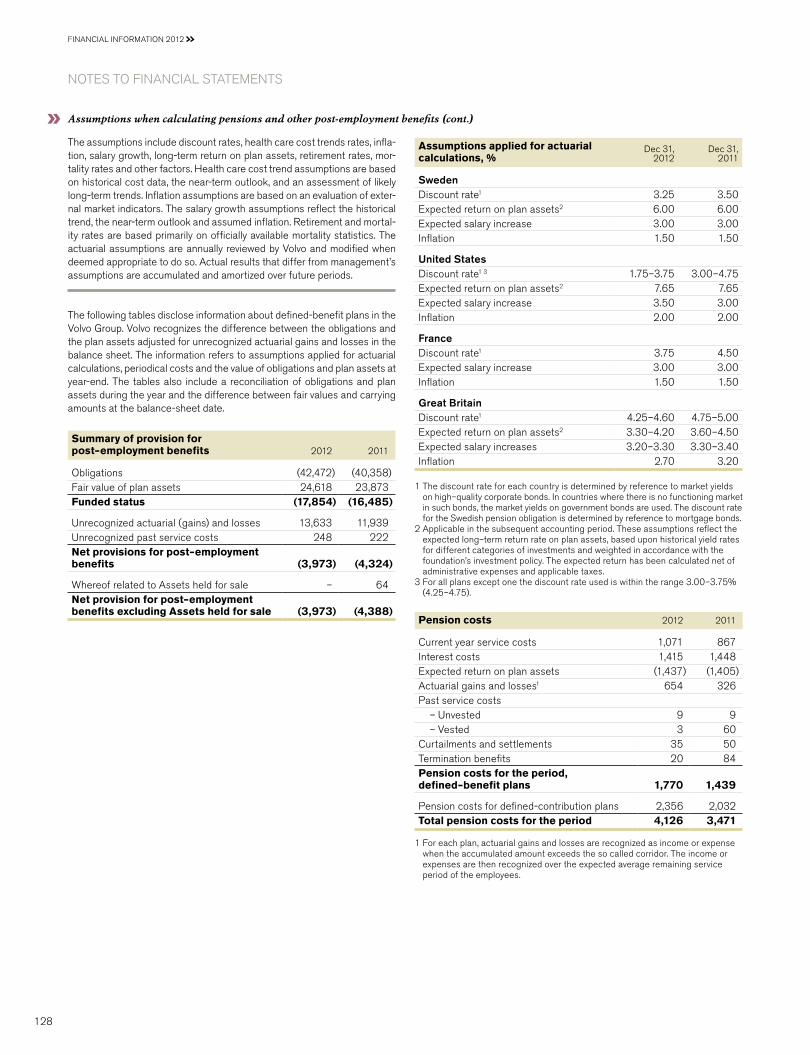
Assumptions applied for actuarial calculations, %
Dec 31,2012
Dec 31,2011
Sweden Discount rate1 3.25 3.50Expected return on plan assets2 6.00 6.00Expected salary increase 3.00 3.00Inflation 1.50 1.50
United States Discount rate1 3 1.75–3.75 3.00–4.75Expected return on plan assets2 7.65 7.65Expected salary increase 3.50 3.00Inflation 2.00 2.00
France Discount rate1 3.75 4.50Expected salary increase 3.00 3.00Inflation 1.50 1.50
Great Britain Discount rate1 4.25–4.60 4.75–5.00Expected return on plan assets2 3.30–4.20 3.60–4.50Expected salary increases 3.20–3.30 3.30–3.40Inflation 2.70 3.20
1 The discount rate for each country is determined by reference to market yields on high–quality corporate bonds. In countries where there is no functioning market in such bonds, the market yields on government bonds are used. The discount rate for the Swedish pension obligation is determined by reference to mortgage bonds.
2 Applicable in the subsequent accounting period. These assumptions reflect the expected long–term return rate on plan assets, based upon historical yield rates for different categories of investments and weighted in accordance with the foundation’s investment policy. The expected return has been calculated net of administrative expenses and applicable taxes.
3 For all plans except one the discount rate used is within the range 3.00–3.75% (4.25–4.75).
Pension costs 2012 2011
Current year service costs 1,071 867Interest costs 1,415 1,448Expected return on plan assets (1,437) (1,405)Actuarial gains and losses1 654 326Past service costs
– unvested 9 9– Vested 3 60
Curtailments and settlements 35 50Termination benefits 20 84Pension costs for the period, defined–benefit plans 1,770 1,439
Pension costs for defined-contribution plans 2,356 2,032Total pension costs for the period 4,126 3,471
1 For each plan, actuarial gains and losses are recognized as income or expense when the accumulated amount exceeds the so called corridor. The income or expenses are then recognized over the expected average remaining service period of the employees.
The assumptions include discount rates, health care cost trends rates, infla-tion, salary growth, long-term return on plan assets, retirement rates, mor-tality rates and other factors. Health care cost trend assumptions are based on historical cost data, the near-term outlook, and an assessment of likely long-term trends. Inflation assumptions are based on an evaluation of exter-nal market indicators. The salary growth assumptions reflect the historical trend, the near-term outlook and assumed inflation. Retirement and mortal-ity rates are based primarily on officially available mortality statistics. The actuarial assumptions are annually reviewed by Volvo and modified when deemed appropriate to do so. Actual results that differ from management’s assumptions are accumulated and amortized over future periods.
The following tables disclose information about defined-benefit plans in the Volvo Group. Volvo recognizes the difference between the obligations and the plan assets adjusted for unrecognized actuarial gains and losses in the balance sheet. The information refers to assumptions applied for actuarial calculations, periodical costs and the value of obligations and plan assets at year-end. The tables also include a reconciliation of obligations and plan assets during the year and the difference between fair values and carrying amounts at the balance-sheet date.
Summary of provision for post–employment benefits 2012 2011
Obligations (42,472) (40,358)Fair value of plan assets 24,618 23,873Funded status (17,854) (16,485)
unrecognized actuarial (gains) and losses 13,633 11,939unrecognized past service costs 248 222Net provisions for post–employment benefits (3,973) (4,324)
Whereof related to Assets held for sale – 64Net provision for post–employment benefits excluding Assets held for sale (3,973) (4,388)
Assumptions when calculating pensions and other post-employment benefits (cont.)
Notes to fiNaNcial statemeNts
FInAnCIAL InFORMATIOn 2012
128

Obligations in defined-benefit plansSweden
PensionsuS
PensionsFrance
Pensions
GreatBritain
Pensions
uS Other
benefitsOtherplans Total
Obligations at January 1, 2011 9,144 12,998 1,605 4,226 3,441 4,707 36,121Acquisitions, divestments and other changes (1) (2) 1 (2) (59) (3) (66)Current year service costs 246 295 52 31 74 255 953Interest costs 435 582 70 226 144 145 1,602Past service costs
– unvested – 4 – – 9 1 14– Vested – 40 – – – 18 58
Termination benefits 77 – (1) – – 26 102Curtailments and settlements (8) (1) – (69) (44) (7) (129)Employee contributions – – – 12 – 4 16Actuarial (gains) and losses 2,434 925 136 52 115 39 3,701Exchange rate translation – 301 (12) 54 66 58 467Benefits paid (315) (782) (86) (161) (169) (968) (2,481)Obligations as of December 31, 2011 12,012 14,360 1,765 4,369 3,577 4,275 40,358
of which Funded defined-benefit plans 11,624 13,925 – 4,369 – 1,817 31,735
Acquisitions, divestments and other changes (1,362) (9) 84 0 (3) (45) (1,335)Current year service costs 442 299 59 22 131 259 1,212Interest costs 419 576 78 215 138 131 1,557Past service costs – – – – – – –
– unvested – – 1 – – (1) 0– Vested – – – – 1 – 1
Termination benefits 21 – – – – 11 32Curtailments and settlements (7) (1) – – 2 (122) (128)Employee contributions – – 1 10 – 3 14Actuarial (gains) and losses 1,315 1,546 169 390 312 382 4,114Exchange rate translation – (879) (67) (81) (237) (298) (1,562)Benefits paid (330) (763) (88) (185) (184) (241) (1,791)Obligations as of December 31, 2012 12,510 15,129 2,002 4,740 3,737 4,354 42,472
of whichFunded defined-benefit plans 10,934 14,645 6 4,740 – 2,675 33,000
Costs for the period, post–employment benefits other than pensions 2012 2011
Current year service costs 141 85Interest costs 142 148Expected return on plan assets (2) –Actuarial gains and losses1 19 9Past service costs
– unvested 4 5– Vested 1 –
Curtailments and settlements 6 (35)Termination benefits 6 25Total costs for the period, post–employ-ment benefits other than pensions 317 237
1 For each plan, actuarial gains and losses are reported as income or expense when the accumulated amount exceed the so called corridor. The income or expenses are then recognized over the expected average remaining service period of the employees.
An increase of one percentage point per year in healthcare costs would increase the accumulated post–employment benefit obligation as of December 31, 2012 by approximately 166, and the post–employment benefit expense for the period by approximately 8. A decrease of one percentage point would decrease the accumulated value of obligations by approximately 141 and reduce costs for the period by approximately 6. Calculations made as of December 31, 2012 show an annual increase of 8% in the weighted average per capita costs of covered health care bene-fits. It is assumed that the percentage will decline gradually to 4.5% until 2029 and subsequently remain at that level.
129

Fair value of plan assets in funded plansSweden
PensionsuS
PensionsFrance
Pensions
GreatBritain
PensionsuS Otherbenefits
Otherplans Total
Plan assets at January 1, 2011 7,078 9,535 – 4,393 24 1,924 22,954Acquisitions, divestments and other changes 3 8 – – – 6 17Expected return on plan assets 426 683 – 204 – 92 1,405Actuarial gains and (losses) (681) (628) – 81 – (96) (1,324)Employer contributions 756 829 – 91 – 410 2,086Employee contributions – – – 12 – 7 19Exchange rate translation – 178 – 60 – (18) 220Benefits paid (2) (763) – (161) – (578) (1,504)Plan assets as of December 31, 2011 7,580 9,842 – 4,680 24 1,747 23,873
Acquisitions, divestments and other changes (938) 1 6 – – (25) (956)
Expected return on plan assets 440 733 – 188 – 78 1,439Actuarial gains and (losses) 133 391 – 147 – 27 698Employer contributions 25 1,022 – 87 139 209 1,482Employee contributions – – – 10 – 18 28Exchange rate translation – (624) – (86) (1) (39) (750)Benefits paid (1) (773) – (189) (139) (94) (1,196)Plan assets as of December 31, 2012 7,239 10,592 6 4,837 23 1,921 24,618
Net provisions for post-employment benefitsSweden
PensionsuS
PensionsFrance
Pensions
GreatBritain
Pensions
uS Other
benefitsOtherplans Total
Funded status at December 31, 2011 (4,432) (4,518) (1,765) 311 (3,553) (2,528) (16,485)unrecognized actuarial (gains) and losses 4,569 5,509 333 341 434 753 11,939unrecognized past service costs – (54) 276 – – – 222Net provisions for post-employment benefits as of December 31, 2011 137 937 (1,156) 652 (3,119) (1,775) (4,324)
Whereof related to Assets held for sale1 77 – – – – (13) 64Net provision for post-employment benefits excluding Assets held for sale 60 937 (1,156) 652 (3,119) (1,762) (4,388)
of which reported asPrepaid pensions 60 1,381 – 652 102 82 2,277Provisions for post-employment benefits – (444) (1,156) – (3,221) (1,844) (6,665)
Funded status as of December 31, 2012 (5,271) (4,537) (1,996) 97 (3,714) (2,433) (17,854)unrecognized actuarial (gains) and losses 5,049 5,984 478 572 638 912 13,633 unrecognized past service costs – (44) 257 (5) (2) 42 248 Net provisions for post-employment benefits as of December 31, 2012 (222) 1,403 (1,261) 664 (3,078) (1,479) (3,973)
of which reported asB/S Prepaid pensions 57 1,818 – 670 89 90 2,724 B/S Provisions for post-employment benefits (279) (415) (1,261) (6) (3,167) (1,569) (6,697)
1 As of December 31, 2011 pension obligation amounted to 1,394, plan assets amounted to 926 and unrecognized actuarial losses amounted to 532 in regards to Assets held for sale.
Notes to fiNaNcial statemeNts
FInAnCIAL InFORMATIOn 2012
130

Actual return on plan assets amounted to 2,124 (81).
Actuarial gains and losses 2012 2011
Experience-based adjustments in obligations (412) (3,492)Experience-based adjustments in plan assets 698 (1,324)Effects of changes in actuarial assumptions (3,702) (209)Actuarial gains and (losses), net (3,416) (5,025)
The Volvo Group’s pension foundation in Sweden was formed in 1996 to secure obligations relating to retirement pensions for salaried employees in Sweden in accordance with the ITP plan (a Swedish individual pension plan). Plan assets amounting to 2,456 were contributed to the foundation
at its formation, corresponding to the value of the pension obligations at that time. Since its formation, net contributions of 2,253, whereof 25 during 2012, have been made to the foundation. The plan assets in the Volvo Group’s Swedish pension foundation are invested in Swedish and foreign stocks and mutual funds, and in interest-bearing securities, in accordance with a distribution that is determined by the foundation’s Board of Directors. As of December 31, 2012, the fair value of the foundation’s plan assets amounted to 7,217 (7,554), of which 31% (31) was invested in shares or mutual funds. At the same date, retirement pension obligations attributable to the ITP plan amounted to 12,140 (11,624).
Swedish companies can secure new pension obligations through balance-sheet provisions or pension-fund contributions. Furthermore, a credit insurance policy must be taken out for the value of the obligations. In addition to benefits relating to retirement pensions, the ITP plan also includes, for example, a collective family pension, which the Volvo Group finances through an insurance policy with the Alecta insurance company. According to an interpretation from the Swedish Financial Reporting Board, this is a multi-employer defined-benefit plan. For fiscal year 2012, the Volvo Group did not have access to information from Alecta that would have enabled this plan to be reported as a defined-benefit plan. Accord-ingly, the plan has been recognized as a defined-contribution plan. Alec-ta’s funding ratio is 129% (113).
The Volvo Group’s subsidiaries in the united States mainly secure their pension obligations through transfer of funds to pension plans. At the end of 2012, the total value of pension obligations secured by pension plans of this type amounted to 14,645 (13,925). At the same point in time, the total value of the plan assets in these plans amounted to 10,592 (9,842), of which 54% (54) was invested in shares or mutual funds. The regula-tions for securing pension obligations stipulate certain minimum levels concerning the ratio between the value of the plan assets and the value of the obligations. During 2012, Volvo Group contributed 1,022 (829) to the American pension plans.
During 2012, the Volvo Group has made extra contributions to the pension plans in Great Britain in the amount of 87 (91).
In 2013, the Volvo Group estimates to transfer an amount of about SEK 1 billion to pension plans.
Plan assets by category 2011
Shares and participation, Volvo 403 (2%)
Shares and participations, other, 11,494 (50%)
Bonds and interest-bearing securities, 9,100 (40%)
Property, 440 (2%)
Other, 1,517 (6%)
Shares and participations, Volvo, 246 (1%)
Shares and participations, other, 9,565 (40%)
Bonds and interest-bearing securities, 12,460 (52%)
Property, 644 (3%)
Other, 958 (4%)
Shares and participations, Volvo, 333 (1%)
Shares and participations, other, 10,041 (41%)
Bonds and interest-bearingsecurities, 11,750 (48%)
Property, 766 (3%)
Other, 1,728 (7%)
Shares and participations, Volvo, 333 (1%)
Shares and participations,other, 10,041 (41%)
Bonds and interest-bearing securities, 11,750 (48%)
Property, 766 (3%)
Other, 1,728 (7%)
Plan assets by category 2012
ProvisionsProvisions are recognized when a legal or constructive obligation exists as a result of a past event and it is probable that an outflow of resources will be required to settle the obligation and the amount can be reliably estimated.
Provisions for residual value risks Residual value risks are attributable to operating lease contracts or sales transactions combined with buy-back agreements or residual value guaran-tees. Residual value risks are the risks that the Volvo Group in the future would have to dispose used products at a loss if the price development of these products is worse than what was expected when the contracts were entered. Provisions for residual value risks are made on a continuing basis based upon estimations of the used products’ future net realizable values. The estimations of future net realizable values are made with consideration to current prices, expected future price development, expected inventory turnover period and expected direct and indirect selling expenses. If the residual value risks pertain to products that are reported as tangible assets in the Volvo Group’s balance sheet, these risks are reflected by depreciation
or write-down of the carrying value of these assets. If the residual value risks pertain to products, which are not reported as assets in the Volvo Group’s balance sheet, these risks are reflected under the line item current provisions.
Refer to Note 7 for more information regarding Income.
Provision for product warranty Estimated provision for product warranties are reported when the products are sold. The provision includes both contractual warranty and so called goodwill warranty and is determined based on historical statistics consider-ing known quality improvements, costs for remedy of defaults e.t.c. Provision for campaigns in connection with specific quality problems are reported when the campaign is decided.
Provision for Restructuring costs A provision for decided restructuring measures is reported when a detailed plan for the implementation of the measures is complete and when this plan is communicated to those who are affected. Restructuring costs are reported as a separate line item in the income statement if they relate to a considerable change of the Group structure. Other restructuring costs are included in Other operating income and expenses.
aCCounTinG poliCy
noTe 21 OTHER PROVISIOnS
131

Carryingvalueas of
Dec 31, 2011 Provisions Reversals utilizations
Acquired and
divested companies
Translation differ-ences
Other reclassi-fications
Carryingvalueas of
Dec 31, 2012
Of which due within 12 months
Of which due after
12 months
Warranties 8,652 7,687 (738) (6,036) (3) (326) (347) 8,889 5,530 3,359Provisions in insurance operations 488 160 (17) (232) 0 (22) 0 377 377 0Restructuring measures 199 1,300 (60) (305) 0 (38) 10 1,106 718 388Provisions for residual value risks 741 220 (67) (157) 0 (19) 14 732 308 424Provisions for service contracts 380 321 (64) (217) 0 (9) (22) 389 213 176Dealer bonus 2,033 3,359 (105) (2,893) 0 (63) (60) 2,271 2,189 82Other provisions 2,686 3,400 (733) (2,609) 97 (166) 320 2,995 1,641 1,354B/S Total 15,179 16,447 (1,784) (12,449) 94 (643) (85) 16,759 10,976 5,783
Long-term provisions as above is expected to be settled within 2 to 3 years.
Read more in Note 8 regarding restructuring.
sourCes of esTimaTion unCerTainTy!Provision for product warrantyWarranty provisions are estimated with consideration of historical claims statistics, the warranty period, the average time-lag between faults occurr ing and claims to the company and anticipated changes in quality indexes. Estimated costs for product warranties recognized as cost of sales when the products are sold. Estimated warranty costs include contractual warranty and goodwill warranty (warranty cover in excess of contractual warranty or campaigns which is accepted as a matter of policy or normal practice in order to maintain a good business relation with the customer). Differences between actual warranty claims and the estimated claims generally affect the recognized expense and provisions in future periods. Refunds from suppliers, that decrease Volvo Group’s warranty costs, are recognized to the extent these are considered to be certain. As of December 31, 2012 warranty cost provisions amounted to 8,889 (8,652).
Legal proceedingsThe Volvo Group recognizes obligations as provisions or other liabilities only in cases where Volvo Group has a present obligation from a past event, where a financial responsibility is probable and Volvo Group can make a reliable estimate of the size of the amount. When these criteria are not met, a contingent liability may be recognized.
The Volvo Group regularly reviews the development of significant out-standing legal disputes in which the Volvo Group companies are parties, both civil law and tax disputes, in order to assess the need for provisions and contingent liabilities in the financial statements. Among the factors that Volvo Group considers in making decisions on provisions and contingent liabilities are the nature of the dispute, the amount claimed, the progress of the case, the opinions or views of legal counsels and other advisers, experience in similar cases, and any decision of Volvo Group’s management as to how the Volvo Group intends to handle the dispute. The actual outcome of a legal dispute may deviate from the expected outcome of the dispute. The differ-ence between actual and expected outcome of a dispute might materially affect future financial statements, with an adverse impact upon the Volvo Group’s results of operation, financial position and liquidity.
Read more about the Volvo Group’s gross exposure for contingent liabilities in Note 24.
Residual value risksIn the course of its operations, the Volvo Group is exposed to residual value risks through operating lease agreements and sales combined with repur-chase agreements. Residual value commitments amount to 15,906 (14,349) at December 31, 2012. Residual value risks are reflected in different ways in the the Volvo Group consolidated financial statements depending on the extent to which the risk remains with the Volvo Group.
In cases where significant risks pertaining to the product remain with the Volvo Group, the products, primarily trucks, are generally recognized in the balance sheet as assets under operating leases. Depreciation for these products are recognized on a straight-line basis over the term of the commit-ment and the depreciable amount is adjusted to agree with estimated net realizable value at the end of the commitment. The estimated net realizable value of the products at the end of the commitments is monitored individually on a continuing basis. A decline in prices for used trucks and construction equipment may negatively affect the Volvo Group’s operating income. High inventories in the truck industry and the construction equipment industry and low demand may have a negative impact on the prices of new and used trucks and construction equipment. In monitoring estimated net realizable value of each product under a residual value commitment, management makes consideration of current price-level of the used product model, value of options, mileage, condition, future price deterioration due to expected change of market conditions, alternative distribution channels, inventory lead-time, repair and reconditioning costs, handling costs and overhead costs in the used product division are more. Additional depreciations and estimated impairment losses are immediately recognized in the Income Statement.
The total risk exposure for assets under operating lease is regognized as current and non-current residual value liabilities.
Read more about residual value risks for liabilities in Note 22.
If the residual value risk commitment is not significant, independent from the sale transaction or in combination with a commitment from the customer to buy a new product in connection to a buy-back option, the asset is not recog-nized on the balance-sheet. Instead, the risk exposure is reported as a residual value provision equivalent to the estimated residual value risk.
To the extent the residual value exposure does not meet the definition of a provision, the remaining residual value risk exposure is reported as a contingent liability.
Read more about contingent liabilities in Note 24.
Notes to fiNaNcial statemeNts
FInAnCIAL InFORMATIOn 2012
132

Bond loans Actual interest rate Dec 31, 2012, % Effective interest rate Dec 31, 2012, %Dec 31,
2012Dec 31,
2011
EuR 2007–2012/2014–2024 0.74–9.89 0.74–9.89 20,725 16,591SEK 2007–2012/2014–2017 1.90–5.71 1.91–5.71 15,131 15,904uSD 2009/2015 5.98 5.98 4,861 5,165GBP 2009/2014 6.04 6.18 523 532Cny 2012/2015 3.80–5.93 3.80–6.06 1,852 –B/S Bond loans as of December 311 43,092 38,192
1 Of which loans raised to finance the credit portfolio of the customer financing operations totalled 29,044 (24,501).
Other loansActual interest rate
Dec 31, 2012, % Effective interest rate
Dec 31, 2012, %Dec 31,
2012Dec 31,
2011
uSD 2008–2012/2015–2018 0.56–7.50 0.56–7.76 7,902 8,883EuR 2005–2012/2014–2027 1.49–6.50 1.50–6.50 2,127 2,409GBP 2011/2014 1.98 1.99 902 925SEK 2007–2011/2015–2017 1.52–3.22 1.53–3.22 4,270 5,457CAD 2012/2015 3.06 3.10 675 1,439Mxn 2009–2012/2014–2016 5.74–8.99 5.89–9.37 1,673 1,470JPy 2007–2012/2014–2017 0.60–1.40 0.60–1.41 7,837 13,132CHF 2011/2013 1.07 1.07 – 736BRL 2007/2020 4.15 4.28 5,807 5,081AuD 2012/2015 4.81 6.05 690 1,054Other loans 4,617 5,509Revaluation of outstanding derivatives to SEK 1,933 1,670B/S Other loans as of December 311 38,433 47,765
Bond loans and other loans as of December 31 81,525 85,957Deferred leasing income 2,247 2,000Residual value liabilities 4,439 3,608Accrued expenses service contracts 2,548 1,996Other non–current financial liabilities 609 701Other non–current liabilities 871 2,142B/S Other liabilities as of December 31 10,714 10,447
Non-current liabilities as of December 31 92,239 96,404
1 Of which loans raised to finance the credit portfolio of the customer financing operations 16,874 (24,517). Volvo Treasury employs cross–currency interest swaps to be able to offer lending and borrowing in various currencies without increasing Volvo Group’s risk. The table on page 95 presents Industrial operations financial net position, including pensions, listed by currency. Of non–current liabilities, 82,153 (87,923) pertains to financial instruments. Refer also to Note 30 Financial instruments.
Of the above loans, 3.723 (516) was secured.
Refer to Note 23 for an explanation of changes to assets pledged.
non-current loans mature as follows:
2014 27,6172015 17,5182016 16,0712017 14,8562018 4502019 or later 5,013Total 81,525
Refer to Note 15 for maturities of non-current customer financing receivables.
The major part of other non-current liabilities will mature within five years.At year-end 2012, credit facilities granted but not utilized and which
can be used without restrictions amounted to approximately SEK 33,1 billion (33.6). These facilities consisted of stand-by facilities for loans with varying maturities through 2013 to 2017. A fee is normally charged for the unused portion of credit facilities and is recognized in profit or loss under other financial income and expenses.
Non-current liabilitiesThe tables below disclose the Volvo Group’s non-current liabilities in which the largest loans are listed by currency. The main part are issued by Volvo Treasury AB. Information regarding loan terms refer to December 31, 2012. The Volvo Group hedges foreign-exchange and interest-rate risks using derivative instruments.
Refer to Note 4 Goals and policies in financial risk management and Note 30 Financial Instruments for more information.
noTe 22 LIABILITIES
133

Current liabilities
Current liabilities Dec 31,2012
Dec 31,2011
Bank loans 9,172 12,639Other loans 41,145 31,883B/S Current liabilities as of December 311 50,317 44,522
1 Of which loans raised to finance the credit portfolio of the customer financing operations amount to 39,259 (31,844) and financial derivatives at fair value 43 (1,362).
Bank loans include current maturities of non-current loans 2,586 (5,803). Other loans include current maturities of non-current loans, 22,173 (17,681), and commercial paper, 13,535 (8,393). non-interest-bearing current liabilities accounted for 80,788 (99,152), or 62% (69) of the Volvo Group’s total current liabilities.
Other current liabilities Dec 31,2012
Dec 31,2011
Advances from customers 3,959 3,642Wages, salaries and withholding taxes 7,901 8,041VAT liabilities 1,785 2,099Accrued expenses and prepaid income 10,925 12,528Deferred leasing income 1,793 1,683Residual value liability 1,705 1,783Other financial liabilities 254 367Other liabilities 4,449 5,120B/S Other current liabilities
as of December 31 32,771 35,263
Current liabilities also include trade payables of 47,364 (56,788), current tax liabilities of 653 (2,391) and non interest-bearing and interest-bearing liabilities held for sale, as disclosed in note 3. Secured bank loans at year-end 2012 totalled 113 (127). The corresponding amount for other current liabilities amounted to 1,581 (584). Of current liabilities including trade payables, 97,992 (102,331) pertains to financial instruments.
Refer to Note 23 for an explanation of changes to assets pledged.
Dec 31,2012
Dec 31,2011
Property, plant and equipment – mortgages 97 128Assets under operating leases 150 265Receivables 3,781 1,333Cash, loans and marketable securities 32 78Other assets pledged 39 28Total 4,099 1,832
At year-end, liabilities for which the above assets were pledged totalled 3,722 (1,227).
In 2012 an asset-backed securitization was completed. under the terms of the transaction, 4,361 of securities were issued tied to uS-based loans, secured by Customer Finance receivables recognized on the balance-sheet with trucks and construction equipment assets as collaterals.
noTe 23 ASSETS PLEDGED
Contingent liabilities A contingent liability is recognized for a possible obligation, for which it is not yet confirmed that a present obligation exists that could lead to an outflow of resources; or for a present obligation that does not meet the definitions of a provision or a liability as it is not probable that an outflow of resources will be required to settle the obligation or when a sufficiently reliable estimate of the amount cannot be made.
Contingent liabilities Dec 31,2012
Dec 31,2011
Credit guarantees issued for customers and others 9,540 8,970Tax claims 861 521Residual value guarantees 3,317 2,969Other contingent liabilities 4,045 4,694Contingent liabilities as of December 31 17,763 17,154
Tax claims amounting to 861 (521) pertain to charges against the Volvo Group for which provisions are not considered necessary.
Other contingent liabilities include for example bid and performance clauses and legal proceedings.
The recognized amounts for contingent liabilities reflect the Volvo Group’s risk exposure on a gross basis. The recognized amounts have thus not been reduced because of counter guarantees received or other collaterals in cases where a legal offsetting right does not exist. As of December 31, 2012, the estimated value of counter guarantees received and other collaterals, for example the estimated net selling price of used products, amounted to 4,216 (3,726) and mainly pertains to credit guar-antees and residual value guarantees.
For more information regarding residual value guarantees, see note 21.
Legal proceedings In July 1999, Volvo Truck Corporation (VTC) and Volvo Construction Equip-ment (VCE) entered into a Consent Decree with the u.S. Environmental Protection Agency (EPA). The Consent Decree stipulated, among other provisions, that new stricter emission requirements for certain engines that would come into effect on January 1, 2006, should be applied by VTC and
aCCounTinG poliCy
noTe 24 COnTInGEnT LIABILITIES
Notes to fiNaNcial statemeNts
FInAnCIAL InFORMATIOn 2012
134

VCE from January 1, 2005. The Consent Decree was later transferred from VTC and VCE to Volvo Powertrain Corporation. During 2008, the EPA demanded stipulated penalties from Volvo Powertrain Corporation in the amount, including interest, of uSD 72 M, alleging that the stricter standards under the Consent Decree should have been applied to engines manufac-tured by Volvo Penta during 2005. Volvo Powertrain disagrees with EPA’s interpretation and is defending the case vigorously based on, among other grounds, the fact that the Volvo Penta engines were not subject to the Consent Decree. The dispute was referred to a u.S. court. On April 13, 2012, The united District Court of the District of Colombia handed down a decision in favor of EPA, and ordered Volvo Powertrain to pay penalties and interest of approximatley uSD 72 M. Volvo Powertrain has appealed the decision. As of December 31, 2012, an amount of SEK 65 M has been set as a provision and SEK 404 M has been retained as a contingent liability.
Volvo Group is subject to investigations by competition authorities. Volvo Group is cooperating fully with the respective authority.
In September 2010, Volvo Trucks’ and Renault Trucks’ uK subsidiaries have, together with a number of other international truck companies, become the subject of an investigation initiated by the Office of Fair Trad-ing (OFT), the British competition authority. In June 2012, OFT decided to close its investigation on the grounds that it considers the European Commission to be best placed to act in the matter. The OFT has reserved its right to reopen the investigation.
In January 2011, the Volvo Group and a number of other companies in the truck industry became part of an investigation by the European Com-mission regarding a possible violation of Eu antitrust rules.
In April 2011, the Volvo Group’s truck business in Korea and a number of other truck companies became the subject of an investigation by the Korean Fair Trade Commission.
Given the nature of the ongoing investigations initiated by competition authorities, the Volvo Group cannot exclude that they may affect the Group’s result and cash flow with an amount that may be material. However, as regards the investigation initiated in Europe, it is too early to assess whether and when such effect may occur and hence if and when it could be accounted for. The Volvo Group has therefore not reported any contingent liability or any provision for the investigation initiated in Europe. Concerning the investiga-tion initiated in Korea, a contingent liability has however been recongnized.
In May 2011 Volvo Penta became part of an investigation by the European Commission regarding a possible violation of Eu antitrust rules. In June 2012, the European Commission closed the investigation without further actions.
Global companies such as the Volvo Group are occasionally involved in tax processes of varying scope and in various stages. Volvo Group regularly assesses these tax processes. When it is probable that additional taxes must be paid and the outcome can be reasonably estimated, the required provision is made.
Volvo Group is also involved in a number of other legal proceedings. Volvo Group does not believe that any liabilities related to such proceed-ings are likely to entail any risk, in the aggregate, of having a material effect on the financial position of the Volvo Group.
Transactions between AB Volvo and its subsidiaries and joint ventures, which are related parties to AB Volvo, have been eliminated in the group and are not disclosed in this note.
The Volvo Group engages in transactions with some of its associated companies. The transactions consist mainly of sales of vehicles to dealers and purchases of engines.
2012 2011
Sales to associated companies 1,670 1,296Purchase from associated companies 702 60Receivables from associated companies, Dec 31 242 186Liabilities to associated companies, Dec 31 632 129
The increase in purchases and liabilities is explained by Deutz AG, which is an associated company from September 2012. Commercial terms and mar-ket prices apply for the supply of goods and services to/from associated companies.
until December 2012 Renault s.a.s was a related party to the Volvo Group due to its holding in AB Volvo. In December 2012 Renault s.a.s sold their Volvo shares. Sales to and purchases from Renault s.a.s. and its subsidiaries amounted to 29 (53) and 1,719 (2,321). Receivables from and liabilities to Renault s.a.s. is not included for 2012 and totalled 11 and 372, respectively, as of December 31, 2011. Sales were mainly from Renault Trucks to Renault s.a.s. and comprised components and spare parts. Purchases were mainly made by Renault Trucks from Renault s.a.s. and primarily comprised light trucks. Renault Trucks has a license from Renault s.a.s. for the use of the trademark Renault.
During the year AB Volvo divested an apartment to a former member of Group management to market value for 10.
Refer to Note 5 regarding the Volvo Group’s share in associated companies.
noTe 25 TRAnSACTIOnS WITH RELATED PARTIES
135
In 2012, government grants of 675 (783) were received, and 525 (775) was recognized in income statement. The amount includes tax credits of 348 (545) related to product development, which were primarily received
in France and India. Other grants were mainly received from the Swedish government and the European Commission.
noTe 26 GOVERnMEnT GRAnTS
Share-based payments
The Volvo Group applies IFRS2, Share-based payments for share-based incentive programs. IFRS 2 distinguishes between “cash-settled” and “equity-settled” payments. The Volvo Group program includes both a cash-settled and an equity-settled part. The fair value of the equity-settled payments is determined at the grant date, recognized as an expense during the vesting period and off-set in equity. The fair value is based on the share price reduced by dividends connected with the share during the vesting period.
Additional social costs are reported as a liability, revalued at each bal-ance sheet date in accordance with uFR 7, issued by the Swedish Financial Reporting Board. The cash-settled payment is revalued at each balance sheet date and is reported as an expense during the vesting period and as a short term liability. An assessment whether the terms for allotment will be fulfilled is made continuously. Based on such assessment, expense might be adjusted.
Remuneration policy decided at the Annual General Meeting in in 2012The Annual General Meeting of 2012 decided upon a policy on remuneration and other employment terms for the members of the Volvo Group Executive Team. The decided principles can be summarized as follows:
The guiding principle is that remuneration and other employment terms for the Group Executives, shall be competitive to ensure that the Volvo Group can attract and retain skilled persons to the Group Executive Team. The fixed salary shall be competitive and shall reflect the individual’s area of responsibility and performance. In addition to the fixed salary a variable salary may be paid. The variable salary may for the CEO amount to a maximum of 75% of the fixed salary and for the other members of the Group Executive Team, a maximum of 60% of the fixed salary.
The variable salary shall be based on the fulfillment of improvement targets or certain financial targets for the Volvo Group and/or the organizational unit where the member of Group Executive Team is employed. These targets are decided by the Board of AB Volvo and can be related, for example, to operat-ing income, operating margin and/or cash flow. The Board may under certain conditions decide to reclaim variable salary already paid or to cancel or limit variable salary to be paid to the senior executives.
The Annual General Meeting can also decide on a share, or share-based, incentive program. At the Annual General Meeting 2011, as proposed by the Board of AB Volvo, it was decided to implement a long-term share-based incentive program for Group Executives and senior executives in the Volvo Group consisting of three annual programs covering each of the financial years 2011, 2012 and 2013.
In addition to fixed and variable salary, normally other customary benefits, such as company car and company healthcare are provided. In individual cases, accommodation benefits and other benefits may be provided.
In addition to pension benefits provided by law and collective bargain agreements, members of the Group Executive Team domiciled in Sweden
can be offered two different defined-contribution plans with annual premi-ums whereby the amount of the individual’s pensions comprises the pre-mium paid and any return, without any guaranteed level of pension. no defined retirement date is set in the two plans but premiums will be paid for the employee until his or her 65th birthday. Members of the Group Executive Team resident outside Sweden, or resident in Sweden but having a material connection to or having been resident in a country other than Sweden, can be offered pension solutions that are competitive in the country where the members are, or have been, resident or to which the members have a mate-rial connection, however primarily defined-contribution pension solutions.
With regard to notice of termination of employment for Group Executives domiciled in Sweden, the notification period is 12 months if the company terminates the employment and six months if the individual terminates the employment. In addition, the employee is entitled to a severance pay of 12 months’ salary if the employment is terminated by the company. Group Exec-utives resident outside Sweden or resident in Sweden but having a material connection to or having been resident in a country other than Sweden can be offered notice periods for termination and severance payments that are com-petitive in the country where the Group Executives are or have been resident or to which the member of Group Executives have a material connection, however primarily arrangements that are simi lar to what is valid for members domiciled in Sweden.
The Board of AB Volvo may deviate from the remuneration policy if there are specific reasons to do so in an individual case.
Fee paid to the Board of DirectorsAccording to a resolution adopted at the Annual General Meeting 2012, the fee to the Board of Directors appointed at the Annual General Meeting for the period until the close of the Annual General Meeting 2013 shall be paid as follows: The Chairman of the Board should be awarded SEK 2,100,000 and each of the other members SEK 700,000 with exception of the President and Chief Executive Officer of AB Volvo. In addition, SEK 300,000 should be awarded to the chairman of the audit committee and SEK 150,000 to each of the other members of the audit committee, and SEK 125,000 to the chairman of the remuneration committee and SEK 100,000 to each of the members of the remuneration committee.
Terms of employment and remuneration to the CEOThe President and CEO is entitled to a remuneration consisting of a fixed annual salary and a variable salary. The variable salary is based on operating margin and six months moving cash flow. The variable salary amounts to a maximum of 75% of the fixed annual salary. For the financial year 2012, Olof Persson received a fixed salary of SEK 11,520,000 and a variable salary of SEK 1,728,000. The variable salary corresponded to 15% of the fixed salary. Other benefits, mainly pertaining to car and housing, amounted to SEK 803,238 in 2012.
Olof Persson is covered both by pension benefits provided under collec-tive bargain agreements and by the Volvo Management Pension (VMP) and Volvo Executive Pension (VEP) plans. The retirement benefit under the Volvo executive pension plans is a defined-contribution plan with refund protection. The disability pension is a defined-benefit plan. The pension-able salary consists of the annual salary and a calculated variable salary
aCCounTinG poliCy
noTe 27 PERSOnnEL
Notes to fiNaNcial statemeNts
FInAnCIAL InFORMATIOn 2012
136

component. The premium for the VMP is SEK 30,000 plus 20% of the pensionable salary over 30 income base amounts and the premium for VEP is 10% of pensionable salary. There are no commitments other than the payment of the premiums. The disability pension for Olof Persson amounts to 50% of pensionable salary. The right to disability pension is conditional to employment and will cease upon termination of duty.
The President and CEO of AB Volvo is also covered by Volvo Företagspen-sion, a defined contribution plan for additional retirement benefit. The pre-mium is negotiated each year. For 2012 the premium amounted to SEK 536 a month. Pension premiums 2012 for Olof Persson amounted to SEK 4,970,422. Olof Persson is also participating in the long-term share-based incentive program decided by the Annual General Meeting 2011. Based on ROE for 2012, Olof Persson will receive 62,230 shares during 2015/2016 related to 2012 if all program conditions are met (see further information under Long-term incentive program below). The amount of taxable benefit related to these shares is determined at the time of allotment. Olof Persson has a six-month notice of termination on his own initiative and twelve months’ notice of termination from AB Volvo. If terminated by the company within three years from entering the position as President and CEO, Olof Persson is entitled to a severance payment equivalent to twelve months’ salary. Thereafter, he is not entitled to severance payments.
Remuneration to Group Executives
Fixed and variable salariesMembers of Group Executive Team receive variable salaries in addition to fixed salaries. Variable salaries are in most cases based on the fulfillment of certain improvement targets or financial targets. The targets are decided by the Board of Directors in AB Volvo and can, for example, relate to operating income, operating margin and/or cash flow for a six month rolling period. During 2012, a variable salary, for Group Executives excluding CEO, could amount to a maximum of 60% of the fixed annual salary.
For the financial year 2012, fixed salaries amounted to SEK 56,619,640 and variable salaries amounted to SEK 5,787,136 for Group Executives excluding the CEO. Group Executives comprised, in addition to the CEO, 15 members at the beginning of the year and 14 members at the end of the year. Other benefits, mainly pertaining to car and housing, amounted to SEK 6,127,427 in 2012. Group Executives, excluding the CEO, also participate in the long-term incentive program which was approved by the Annual General Meeting held in 2011 and is based on ROE outcome. For 2012, they will during 2015/2016 receive 257,942 shares related to 2012 if all program conditions are met (see further information under Long-term incentive program below).
Severance paymentsThe employment contracts for Group Executives contain rules governing severance payments when the company terminates the employment. For members domiciled in Sweden, the rules provide that, when the company terminates the employment, an employee is entitled to severance payment equivalent to twelve months’ salary. In certain older contracts, the payment could equal 24 months’ salary depending on age at date of severance. In the event the employee gains employment during the severance period, severance pay is reduced with an amount equal to 75% of the income from the new employment. In agreements concluded after the spring of 2004, severance pay is reduced by the full income from the new employment.
Members having a material connection to a country other than Sweden can be offered notice periods for termination and severance payments that are competitive in the country to which the members have a material con-nection, preferably solutions corresponding to what is present for in Sweden.
PensionsPrevious pension agreements for certain Group Executives stipulated that early retirement could be obtained from the age of 60. Agreements for retirement at age 60 are no longer signed, and are instead replaced by a defined-contribution plan with pension premium payments at the long-est to the age of 65 years. The premium constitutes 10% of the pension-
able salary. Earlier defined-benefit pension plans, which entitled the employee to 50% of the pensionable salary after normal retirement age, have in Sweden been replaced by a defined-contribution plan. The pen-sion plan includes employees born before 1979 and is a complement to the collective agreement regarding occupational pension. The premium constitutes of SEK 30,000 plus 20% of the pensionable salary over 30 income base amounts. The pensionable salary consists of the twelve times the current monthly salary and the average of the variable salary for the previous five years. Pension premiums for Group Executives excluding CEO amounted to SEK 28,018,216 in 2012
Group Executives are offered pensions that are competitive in the country in which the person is or have been domiciled or in the country to which the person is essentially connected.
Volvo Group’s total costs for remuneration and benefits to Group Executives Costs for total remuneration and benefits to Group Executives in 2012 are pertaining to the following: fixed salary SEK 87 million (110); variable salary SEK 10 million (43); other benefits SEK 10 million (12) and pensions SEK 38 million (46). The cost related to the long-term share-based incentive pro-gram is reflected over the vesting period and amounted to SEK 27 million (26) for 2012. Total costs for Group Executives include social fees on salaries and benefits, special pension tax and additional costs for other benefits. The remuneration model of the Volvo Group is to a main part designed to follow changes in the profitability of the Group.
Long-term incentive programThe Annual General Meeting held in 2011 approved a long-term share-based incentive program for up to 300 Group and senior executives and comprising the years 2011 to 2013. The program consists of three annual programs for which the measurement periods are each of the respective financial years. A prerequisite for participation in the program is that the participants invest a portion of their salary in Volvo shares and retain these shares and continue to be employed by the Volvo Group for at least three years after the investment has been made. under special circumstances, it is possible to make exceptions to the requirement of continued employment (so called “good leaver” situations). The AB Volvo Board is, in the event of exceptional conditions, entitled to limit or omit allotment of performance shares. In addition, if the Annual General meeting of AB Volvo resolves that no dividend shall be paid to the shareholders for a specific financial year, no matching shares are allotted for the year in question.
Shares are granted under the program during the respective financial year. At the end of the vesting period, the main rule is that the participants will be allotted one matching share per invested share and, assuming that the Volvo Group’s ROE (return on equity) for the particular financial year amounts to at least 10%, a number of performance shares. Maximum allotment of perfor-mance shares corresponds to seven shares for the CEO, six shares for other members of Group Executives and five shares for other participants in the program for each invested share, subject to ROE reaching 25%. ROE for 2012 was 12.9% (23.1), which means that number of performance shares reached about 35% (90) of the maximum grant. Allotment of shares will be made through Volvo owned, earlier re-purchased, Volvo shares. Participants in certain countries will be offered a cash-based version of the incentive pro-gram. For participants in these countries, no investment is required by the participant and the program does not comprise an element of matching shares. Allotment of shares in this version is replaced by a cash allotment at the end of the vesting period. Other program conditions are similar between the programs.
137

Long term incentive program (share settled plan version)
Shares granted conditional under the plan but not yet alloted (in thousand shares)
Vesting yearBeginning of
the year Granted 2012Cancelled/
forfeited 2012Allotments
during 2012 End of the yearCost 2012
(SEK M)1
year 2011 incentive program 2014/2015 2,476 1 (18) (251) 2,208 87.5
year 2012 incentive program 2015/2016 0 1,324 (4) 0 1,320 37.5
1 The fair value of the payments is determined based on the share price at the grant date reduced by the discounted value of expected dividends connected with the share during the vesting period. The cost for the program is recognized over the vesting period. The cost includes social security cost.
Wages, salaries and other remunerations 2012 2011
SEK MBoard and
Presidents1
of which variable salaries
Otheremployees
Board and Presidents1
of which variable salaries
Otheremployees
AB Volvo 24.6 5.1 270.2 31.5 9.9 199.2Subsidiaries 745.3 109.2 38,406.3 770.9 175.5 36,036.9Group total 769.9 114.3 38,676.5 802.4 185.4 36,236.1
Wages, salaries and other remunerations and socialcosts 2012 2011
SEK MWages, salaries
remun Social costsPension
costsWages, salaries
remun Social costs Pension costs
AB Volvo2 294.8 90.2 83.9 230.7 68.1 34.0Subsidiaries 39,151.6 9,590.0 4,041.9 36,807.8 8,583.5 3,437.0Group total3 39,446.4 9,680.2 4,125.8 37,038.5 8,651.6 3,471.0
1 Including current and former Board members, Presidents and Executive Vice Presidents.
2 The Parent Company’s pension costs, pertaining to Board members and Presidents are disclosed in note 3 in the Parent Company.
3 Of the Volvo Group’s pension costs, 92,4 (96.8) pertain to Board members and Presidents, including current and former Board members, Presidents and Exec-utive Vice Presidents. The Volvo Group’s outstanding pension obligations to these individuals amount to 368.4 (337.7).
2012 2011
Average numberof employees
number ofemployees
of whichwomen, %
number ofemployees
of whichwomen, %
AB VolvoSweden 236 44 171 49
Subsidiaries Sweden 23,028 20 24,793 20Western Europe (excl. Sweden) 22,116 18 24,241 17Eastern Europe 6,603 21 6,220 21north America 16,481 18 15,380 18South America 6,150 14 6,080 14Asia 24,798 10 22,915 11
Other countries 2,670 17 2,448 17Group total 102,082 17 102,248 18
2012 2011
Board members1 and other senior executives
number at year-
end
of whichwomen,
%
number at year-
end
of whichwomen,
%
AB Volvo Board members1 12 17 14 14CEO and other senior executives 16 19 17 6
Volvo Group Board members1 691 14 898 13Presidents and other senior executives 893 19 1,034 17
1 Excluding deputy Board members.
The cost for the cash-based version of the incentive program amounted to 12 (4) including social security cost during 2012, and the total liability amouned to 16 (4) as of Decmber 31, 2012.
A number of program participants that are leaving the company have been determined to be “good leavers” and are therefore entitled to accumulated allotment of shares. During 2012, including both the share settled plan and and the cash-settled plan, a total of 250,922 shares (929) have been allotted
to participants, and an additional 246,917 shares (203,520) will be allotted to participants when the employees leave the company. For the cash-settled plan, a total of 1 (0) has been allotted during 2012.
The total cost for the 2012 incentive program over the period 2012 to 2015 is estimated to 148 including social security cost. Actual cost will be impacted by changes in the share price.
The cost for non-monetary benefits in the Volvo Group amounted to 2,100.0 (1,876.8) of which 66.1 (68.8) to Board members and Presidents.
The cost for non-monetary benefits in the Parent Company amounted to 12.8 (9.6) of which 1.7 (1.9) to Board members and Presidents.
Notes to fiNaNcial statemeNts
FInAnCIAL InFORMATIOn 2012
138

Cash-flow analysis The cash-flow statement is prepared in accordance with IAS 7, Cash flow statement, indirect method. The cash-flow statements of foreign Group companies are translated at the average rate. Changes in Group struc-ture, acquisitions and divestments, are recognized net, excluding cash and cash equivalents, in the item Acquisition and divestment of subsidiar-ies and other business units and are included in cash flow from Investing activities.
Cash and cash equivalents include cash, bank balances and parts of marketable securities, with date of maturity within three months at the time for investment. Marketable securities comprise interest-bearing securities, the majority of which with terms exceeding three months. How-ever, these securities have high liquidity and can easily be converted to cash. In accordance with IAS 7, certain investment in marketable securi-ties are excluded from the definition of cash and cash equivalents in the cash-flow statement if the date of maturity of such instruments is later than three months after the investment was made.
Other items not affecting cash amounted to: 2012 2011
Risk provisions and losses related to doubtful accounts receivable/customer-financing receivables 764 801Capital gains/losses on the sale of subsidiaries and other business units (596) 19unrealized exchange rate gains/losses on accounts receivable and payable 224 (249)Provision for global profit sharing program 200 550Fair value commercial derivatives (316) 276R&D tax credit – (283)Write-down of assets held for sale – 54Reversal of write-down of assets held for sale – (60)Provision for restructuring reserves 914 –Other non-cash items 240 154Total Other items not affecting cash flow 1,430 1,262
Acquired and divested shares and participations, net 2012 2011
new issue of shares (6) (9)Capital contribution (6) (15)Acquisitions (1,212) (165)Divestments 39 69Other (1) 1Total cash flow from acquired and divested shares and participations, net (1,186) (119)
During 2012 AB Volvo acquired additional shares in Deutz AG, which had a negativ impact on cash-flow of SEK 1.1 billion.
Acquired and divested subsidiaries and other business units: 2012 2011
Acquired subsidiaries and other business units (1,527) (1,528)Divested subsidiaries and other business units 4,917 (62)Total cash flow from acquired and divested subsidiaries and other business units 3,390 (1,590)
Important increase/decrease in bond loans and other loansIn 2012, the Volvo Group increased its borrowings as a consequence of a negative operational cash flow and higher demands of funding from the Customer Finance Operations.
aCCounTinG poliCy
noTe 29 CASH-FLOW
Fees to the auditors 2012 2011
PricewaterhouseCoopers AB – Audit fees 102 97– Audit-related fees 6 4– Tax advisory services 17 18– Other fees 31 8Total 156 127
Audit fees to others 2 1Volvo Group Total 158 128
Audit involves examination of the Annual report, financial accounting and the administration by the Board and the President. Audit-related assign-ments mean quality assurance services required by enactment, articles of association, regulations or agreement. The amount includes the fee for the half-year review. Tax services include both tax consultancy and tax compliance services. All other tasks are defined as other.
noTe 28 FEES TO THE AuDITORS
139

Recognition of financial assets and liabilitiesPurchases and sales of financial assets and liabilities are recognized on the transaction date. A financial asset is derecognized in the balance sheet when all significant risks and benefits linked to the asset have been transferred to a third party.
The fair value of assets is determined based on valid market prices, when available. If market prices are unavailable, the fair value is determined for each asset using various measurement techniques. Transaction expenses are included in the asset’s fair value, except in cases in which the change in value is recognized in profit and loss. The transaction costs that arise in conjunction with the assumption of financial liabilities are amortized over the term of the loan as a financial cost.
Financial assets at fair value through profit and lossAll of the Volvo Group’s financial assets that are recognized at fair value through profit and loss are classified as held for trading. This includes deriv-atives to which Volvo Group has decided not to apply hedge accounting as well as derivates that are not part of an evidently effective hedge accounting policy pursuant to IAS 39. Gains and losses on these assets are recognized in profit and loss. Short-term investments that are recognized at fair value mainly comprise interest-bearing financial instruments and these are dis-closed in note 18. Derivatives used for hedging interest rate exposure in the customer financing portfolio are included in this category. unrealized gains and losses from fluctuations in the fair values of the financial instruments are recognized in net financial items, since it is not practically possible to apply hedge accounting in accordance with IAS 39 due to the large number of contracts that the customer financing portfolio comprises. In applicable cases, when the requirements for hedge accounting are considered to be fulfilled, the Volvo Group will hereafter consider the application of hedge accounting for these kinds of instruments. The Volvo Group intends to hold these derivatives to maturity, which is why, over time, the market valuation will be offset as a consequence of the interest-rate fixing on borrowing and lending for the customer-finance operations, and thus not affect operating income or cash flow.
Refer to note 9 regarding derivatives used for hedging interest rate exposure in the customer financing portfolio recongniced in net financial items.
Financial instruments used for hedging currency risks arising from future firm commercial cash flows are also recognized under this category. unreal-ized gains and losses from fluctuations in the fair values of the financial instruments related to a receivable or payable will be recognized in the oper-ating income of the respective segments. All other unrealized gains and losses from fluctuations in the fair values of the financial instruments are reported in the operating income of the segment Group functions and other. When the financial instruments have been realized the income effect is reported within the respective segments. As from January 1, 2013 there will be a change in the presentation of the income statement regarding financial instruments used for hedging currency risks arising from future commercial cashflows, from operating income to other financial income and expenses.
Refer to note 31 Changes in Volvo Group Financial reporting.
Loan receivables and other receivablesLoans and receivables are non-derivative financial assets with fixed or determinable payments that are not quoted in an active market. Accounts receivables are recognized initially at fair value, which normally corre-sponds to the nominal value. In the event that the payment terms exceed one year, the receivable is recognized at the discounted present value.
After initial recognition, loans and receivables are measured at amortized cost in accordance with the effective interest method. Gains and losses are recognized in profit and loss when the loans or receivables are divested or impaired, as well as in pace with recognition of accrued interest.
Assessment of impairment requirement – loan receivables and other receivablesVolvo Group performs routine controls to ensure that the carrying amount of assets valued at amortized cost has not decreased, which would result in recognition of an impairment loss in profit and loss. Provisions for doubtful receivables are recognized on an ongoing basis following assessments of a possible change in the ability of customers to pay.
Impairment comprises the difference between the carrying amount and the current value of the estimated future payment flow attributable to the specific asset with consideration to the fair value of any collateral. Dis-counting of future cash flow is based on the effective interest rate used initially. Initially, the impairment requirement is evaluated for each respec-tive asset. If, based on objective grounds, it cannot be determined that one or more assets are subject to an impairment loss, the assets are grouped in units based, for example, on similar credit risks to evaluate the impairment loss requirement collectively. Individually impaired assets or assets impaired during previous periods are not included when grouping assets for collective assessment. If the conditions that gave rise to the recognition of an impairment loss later prove to no longer be valid the impairment loss is reversed in profit and loss as long as the carrying amount does not exceed the amortized cost at the time of the reversal.
Refer to Notes 15 and 16 for more information regarding Volvo Group’s loan receivables and accounts receivables.
Assets available for saleThis category includes assets available for sale and assets that have not been classified in any of the other categories. These assets are initially measured at fair value including transaction costs. Any change in value is recognized directly in other comprehensive income. The cumulative gain or loss recognized in other comprehensive income is reversed in profit and loss on the sale of the asset. unrealized declines in value are recognized in other comprehensive income, unless the decline is significant or pro-longed. Then the impairment is recognized in profit and loss. If the event that caused the impairment no longer exists, impairment can be reversed in profit and loss if it does not involve an equity instrument.
Earned or paid interest attributable to these assets is recognized in profit and loss as part of net financial items in accordance with the effec-tive interest method. Dividends received attributable to these assets are recognized in profit and loss as Income from other investments.
Volvo Group recognizes shares and participations in listed companies at market value on the balance-sheet date, with the exception of investments classified as associated companies and joint ventures. Holdings in unlisted companies for which a market value is unavailable are recognized at acquisition cost. Volvo Group classifies these types of investments as assets available for sale.
Assessment of impairment – assets available for saleIf assets available for sale are impaired, the impaired amount is the difference between the asset’s cost (adjusted for any accrued interest if applicable) and its fair value. However, if equity instruments, such as shares, are involved, a completed impairment is not reversed in profit and loss. On the other hand, impairments performed on debt instruments (interest-bearing instruments) are wholly or partly reversible in profit and loss, in those instances where an event, proven to have occurred after the impairment was performed, is identified and impacts the valuation of that asset.
Refer to Note 5 for Volvo Group’s holdings of shares and participations in listed companies.
aCCounTinG poliCy
noTe 30 FInAnCIAL InSTRuMEnTS
Notes to fiNaNcial statemeNts
FInAnCIAL InFORMATIOn 2012
140

Hedge accountingIn accordance with IAS 39, derivatives used for the hedging of forecast electricity consumption have been recognized at fair value in the balance sheet. During 2012, Volvo applied hedge accounting for these financial instruments. unrealized gains and losses from fluctuations in the fair value are debited or credited to a separate component in other comprehensive income to the extent the requirements for cash-flow hedge accounting are fulfilled. Accumulated changes in the value of the hedging instruments are recognized in profit and loss at the same time as the underlying hedged transaction affects the Group’s earnings. The table Changes in other reserves in note 19, Equity and number of shares disclose how the electric-ity consumption reserve has changed during the year. When cash-flow hedge accounting is applied for previously entered financial instruments utilized to hedge electricity consumption, Volvo tests for effectiveness. Hedging is considered to be effective when the forecast factors that impact the electricity price agree with forecasts of future electricity consumption and the designated hedging instruments. The hedging relationship is regu-larly tested up until its maturity date. If the identified relationships are no longer deemed effective, the price fluctuations on the hedging instrument from the last period the instrument was considered effective are recognized in the Volvo Group’s operating income.
During 2012, Volvo Group has applied hedge accounting for financial instruments used to hedge interest and currency risks on loans only for cases when hedge accounting requirements are fulfilled. The changes in the fair value of the hedge instruments outstanding and the changes in the carrying amount of the loan are recognized in profit and loss. For cases where hedge accounting is not considered to be fulfilled, unrealized gains and losses up until the maturity date of the financial instrument will be recognized in net financial items in profit and loss.
In previous years, Volvo Group has applied hedge accounting for certain net investments in foreign operations. The ongoing result of such hedges is recognized as a separate item in other comprehensive income. In the event of a divestment, the accumulated result from the hedge is recognized in profit and loss.
Refer to page 143 for supplementary information on hedge accounting and to Note 4 for information regarding Goals and policies in financial risk management.
Information regarding carrying amounts and fair valuesIn the table below, carrying amounts are compared with fair values for all of the Volvo Group’s financial instruments.
Dec 31, 2012 Dec 31, 2011
SEK MCarrying
valueFair
valueCarrying
valueFair
value
AssetsFinancial assets at fair value through profit and loss1 The Volvo Group's outstanding currency risk derivatives - commercial exposure note 16 146 146 107 107The Volvo Group's outstanding raw materials derivatives note 16 23 23 68 68The Volvo Group's outstanding interest and currency risk derivatives – financial exposure note 16 3,525 3,525 3,215 3,215B/S Marketable securities note 18 3,130 3,130 6,862 6,862
6,824 6,824 10,252 10,252
Loans receivable and other receivablesB/S Accounts receivable note 16 27,349 – 27,699 –
Customer financing receivables2 note 15 80,989 – 78,699 –Other interest-bearing receivables note 16 1,291 – 564 –
109,629 – 106,962 –
Financial assets available for sale1
Holding of shares in listed companies note 5 347 347 635 635Holding of shares in non-listed companies note 5 498 – 555 –
845 347 1,190 635
B/S Cash and cash equivalents note 18 25,759 25,759 30,379 30,379
Liabilities note 22Financial liabilities at fair value through profit and loss1
The Volvo Group's commodity derivatives - commercial exposure 5 5 279 279The Volvo Group's outstanding raw materials derivatives 84 84 134 134The Volvo Group's outstanding interest and currency risk derivatives – financial exposure3 2,827 2,827 4,341 4,323
2,916 2,916 4,754 4,736
Financial liabilities valued at amortized costLong term bond loans and other loans 79,592 85,060 84,286 90,174Short term bank loans and other loans 50,274 49,455 43,159 41,884
129,866 134,515 127,445 132,058
B/S Trade Payables 47,364 – 56,788 –
1 IFRS 7 classifies financial instruments based on the degree that market values have been utilized when measuring fair value. All financial instruments measured at fair value held by Volvo are classified as level 2 with the exception of shares and participations, which are classified as level 1 for listed instruments and level 3 for unlisted instruments. Refer to note 5 for more information regarding valuation principles. none of these individual shareholdings is of significant value for Volvo.
2 Volvo does not estimate the risk premium for the customer financing receivables and chooses therefore not to disclose fair value for this category.
3 Includes a fair value of a loan related to hedge accounting neg 1,495 (neg 1,285), netted against the derivative used to hedge the risk pos 1,477 (1,267). For further information on hedging of currency and interest rate risks on loans see page 143.
141

Reported in operating income1 2012 2011
SEK MGains/losses
Interest income
Interest expenses
Gains/losses
Interest income
Interest expenses
Financial assets and liabilities at fair value through profit and loss2
Currency risk contracts-commercial exposure3 272 – – (91) – –Loans receivable and other receivables Accounts receivables / trade payables (125) – – 65 – –Customer financing receivables VFS 23 5,037 – 68 4,862 –Financial assets available for sale Shares and participations for which a market value can be calculated 15 – – 20 – –Shares and participations for which a market value cannot be calculated 27 – – 25 – –Financial liabilities valued at amortized cost4 – – (2,373) – – (2,456)Effect on operating income 212 5,037 (2,373) 87 4,862 (2,456)
Reported in net financial items5
Financial assets and liabilities at fair value through profit and lossMarketable securities 154 – – 224 – –Interest and currency rate risk contracts- financial exposure6 294 – – (409) – –Loans receivable and other receivables – 3 – – 3 –Cash and Cash equivalents – 390 – – 545 –Financial liabilities valued at amortized cost6 (227) – (2,464) 771 – (2,642)Effect on net financial items 221 393 (2,464) 586 548 (2,642)
1 Information is provided regarding changes in provisions for doubtful receivables and customer financing in notes 15 and 16, Accounts receivable and customer financing receivables, as well as in note 8, Other financial income and expenses.
2 Accrued and realized interest is included in gains and losses related to Financial assets and liabilities at fair value through profit and loss.
3 Volvo uses forward contracts and currency options to hedge the value of future payment flows in foreign currency. Both unrealized and realized result on currency risk contracts are included in the table. Refer to note 4, Goals and policies in financial risk management.
4 Interest expenses attributable to financial liabilities valued at amortized cost rec-ognized in operating income include interest expenses for financing operational leasing activities, not classified as financial instruments.
5 In gains, losses, income and expenses related to financial instruments recog-nized in net financial items, neg 1 (569) was recognized under other financial income and expenses. Refer to note 9, Other financial income and expenses for further information. Interest expenses attributable to pensions, 117 (191) are not included in this table.
6 Gains and losses related to changes in foreign currency rates on currency rate risk contracts for financial exposure is 218 (neg 746) and neg 227 (771) for financial liabilities valued at amortized cost. Refer to note 9, Other financial income and expenses for further information.
Derecognition of financial assetsVolvo Group is involved in cash enhancement activities such as factoring and discounting. Financial assets that have been transferred are included in full or in part in the reported assets of the Volvo Group dependent on the risk and rewards related to the asset have been transferred to the recipient. In accordance with IAS 39, Financial Instruments, Recognition and Measure-ment, an evaluation is performed to establish whether, substantially, all the risks and rewards have been transferred to an external party. Where the Volvo Group concludes this is not the case, the portion of the financial assets corresponding to the Volvo Group’s continuous involvement is recognized. When all the risk and rewards are not considered to be transferred the amount is kept on the balance sheet. Transferred financial asset that does not fulfill the requirements for derecognition amount to SEK 0.3 billion (0.6).
Transferred financial assets for which substantially all risks and rewards have been transferred are derecognized. Continuing involvements in these assets are reflected in the Volvo Group’s balance sheet. External
credit guarantees relating to these financial assets are recognized to fair value as provisions in the balance sheet and amount to 118.
Volvo Group’s maximum exposure to loss is considered being the total recourse relating to the transferred assets, i.e. the total amount Volvo Group would have to pay in case of default of the customers. This risk exposure is considered not to be material for the Volvo Group as it does not exceed SEK 0.3 billion. This is the total exposure for the Volvo Group but the likelihood for all customers being in default at the same time is considered to be immaterial.
See note 24 Contingent Liabilities for information regarding contingent liabilities for credit guarantees.
Gains, losses, interest income and expenses related to financial instrumentsThe table below shows how gains and losses as well as interest income and expenses have affected income after financial items in the Volvo Group divided on the different categories of financial instruments.
Notes to fiNaNcial statemeNts
FInAnCIAL InFORMATIOn 2012
142
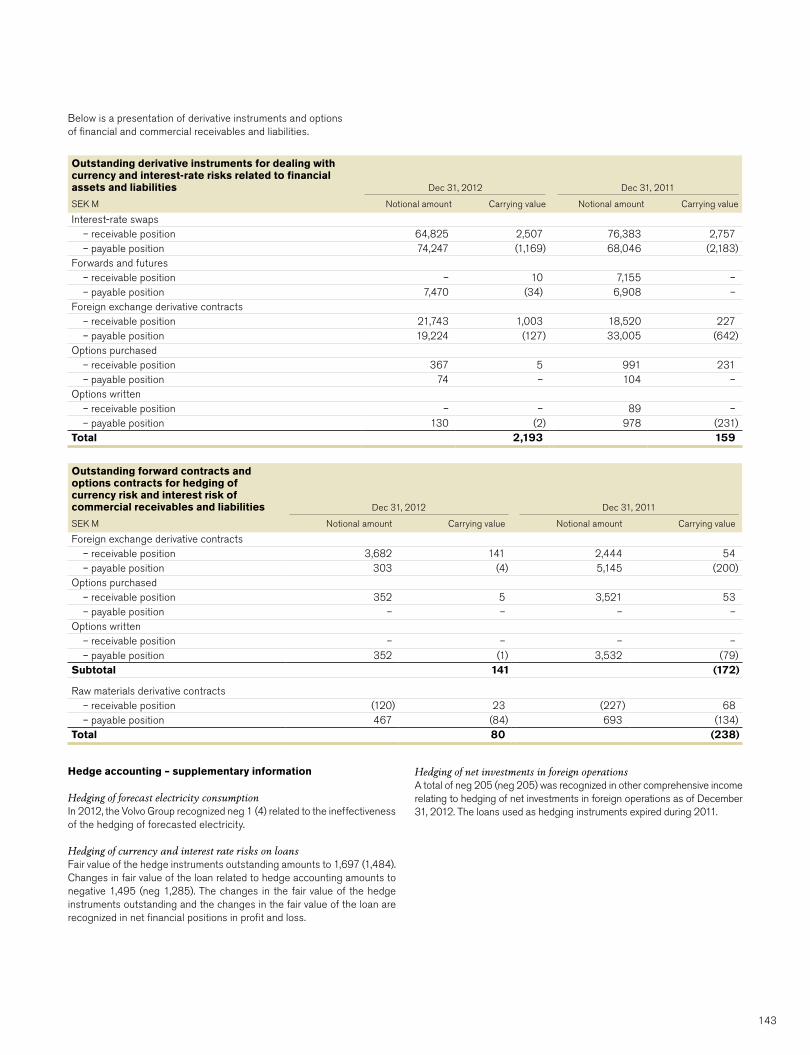
Below is a presentation of derivative instruments and options of financial and commercial receivables and liabilities.
Outstanding derivative instruments for dealing with currency and interest-rate risks related to financial assets and liabilities Dec 31, 2012 Dec 31, 2011
SEK M notional amount Carrying value notional amount Carrying value
Interest-rate swaps– receivable position 64,825 2,507 76,383 2,757– payable position 74,247 (1,169) 68,046 (2,183)
Forwards and futures – receivable position – 10 7,155 –– payable position 7,470 (34) 6,908 –
Foreign exchange derivative contracts – receivable position 21,743 1,003 18,520 227– payable position 19,224 (127) 33,005 (642)
Options purchased – receivable position 367 5 991 231– payable position 74 – 104 –
Options written – receivable position – – 89 –– payable position 130 (2) 978 (231)
Total 2,193 159
Outstanding forward contracts and options contracts for hedging of currency risk and interest risk of commercial receivables and liabilities Dec 31, 2012 Dec 31, 2011
SEK M notional amount Carrying value notional amount Carrying value
Foreign exchange derivative contracts– receivable position 3,682 141 2,444 54– payable position 303 (4) 5,145 (200)
Options purchased – receivable position 352 5 3,521 53– payable position – – – –
Options written – receivable position – – – –– payable position 352 (1) 3,532 (79)
Subtotal 141 (172)
Raw materials derivative contracts – receivable position (120) 23 (227) 68– payable position 467 (84) 693 (134)
Total 80 (238)
Hedge accounting – supplementary information
Hedging of forecast electricity consumptionIn 2012, the Volvo Group recognized neg 1 (4) related to the ineffectiveness of the hedging of forecasted electricity.
Hedging of currency and interest rate risks on loans Fair value of the hedge instruments outstanding amounts to 1,697 (1,484). Changes in fair value of the loan related to hedge accounting amounts to negative 1,495 (neg 1,285). The changes in the fair value of the hedge instruments outstanding and the changes in the fair value of the loan are recognized in net financial positions in profit and loss.
Hedging of net investments in foreign operationsA total of neg 205 (neg 205) was recognized in other comprehensive income relating to hedging of net investments in foreign operations as of December 31, 2012. The loans used as hedging instruments expired during 2011.
143

NOTe 31 Changes in VolVo group finanCial reporting 2013
as from January 1, 2013 Volvo applies the following accounting stand-ards, ifrs 10 Consolidated financial statements, ifrs 11 Joint arrange-ments, ifrs 12 Disclosures of interest in other entities amendments in ias 27 separate financial statements, amendments in ias 28 invest-ments in associates and Joint Ventures and the amendment in ias 19 employee Benefits. these standards are applied retrospectively and hence the income statement and balance sheet for 2012 are adjusted to reflect the changes in these new and amended accounting standards. ifrs 10 Consolidated financial statements, ifrs 12 Disclosures of inter-est in other entities and the amendments in ias 27 separate financial statements, see note 1, will not have a material effect on the Volvo group and are not included in the restated numbers for 2012.
Restatement Joint venturesifrs 11 replaces ias 31 interests in Joint Ventures. under ifrs 11, joint arrangements are classified as joint operations or joint ventures. a joint operation is a joint arrangement whereby the parties to the arrangement have rights to the assets, and obligations for the liabilities. a joint venture is a joint arrangement whereby the parties to the arrangement have rights to the net assets of the arrangement. Volvo group’s joint arrangements are classified as joint ventures. Volvo group has previously accounted for joint ventures using the proportional method and consolidated the assignable part item by item in the income statement and balance sheet.
under ifrs 11, the option of proportional consolidation of joint ventures included in ias 31 has been removed, and joint ventures shall be accounted for using the equity method in accordance with ias 28. investments in associates and Joint Ventures (revised 2011). assets and liabilities relating to the joint ventures are derecognized and a carrying amount correspond-ing to the net assets derecognized and including goodwill is recognized in the balance sheet, impairment test has been performed in accordance with the transition rules in ifrs 11. in accordance with the equity method, Volvo group’s share of the joint venture’s profit or loss will be recognized as a one line item in the income statement, i.e. ”income from investments in joint ventures and associates”. the corresponding amount will be recognized in the balance sheet as “investment in joint ventures and associates”.
Read more about Volvo group’s Joint Ventures in Note 5.
Restatement Employee benefitsas from January 1, 2013 the amendment to ias 19 employee benefits is effective. the revised standard is applied retrospectively, and hence the opening balance for 2012 is adjusted in accordance with the revised ias 19, and the reported numbers for 2012 is restated accordingly for com-parison purposes.
the amended standard removes the option to use the corridor method which is used by the Volvo group up to and including the financial year 2012. according to the revised ias 19, discount rate is used when calculating the net interest income or expense on the net defined benefit liability (asset), hence the expected return is no longer used. all changes in the net defined liability or asset is recognized when they occur. service cost and net interest is recognized in profit and loss, while remeasurements such as actuarial gains and losses is recognized in other comprehensive income. special payroll tax is recognized as pension liability, special payroll tax is applicable for sweden and Belgium. amortization of actuarial gains and losses will cease with the removal of the corridor method.
Read more about provision for post-employment benefit in Note 20.
Restatement hedging of firm flowsas from January 1, 2013 there will be a change of the presentation in the income statement of financial instruments related to hedging of commercial flows, from operating income to other financial income and expenses. finan-cial instruments related to hedging of commercial flows will be presented in other financial income and expenses to be able to enhance the possibility to net all internal flows before entering into external hedging contracts.
Read more about hedging of firm flows Note 30.
Below you will find the effect from the restatements on net sales, operating income and operating margin divíded by segment and quarter. further is a presentation on the opening balance sheet, income statement and balance sheet per quarter, full year income statement and net financial position at December 31, 2012.
Notes to fiNaNcial statemeNts
finanCial information 2012
144

Net sales Quarter 1/2012 Quarter 2/2012 Quarter 3/2012 Quarter 4/2012 Year 2012
seK m
previ-ously
reportedrestate-
ment
After restate-
ment
previ-ously
reportedrestate-
ment
After restate-
ment
previ-ously
reportedrestate-
ment
After restate-
ment
previ-ously
reportedrestate-
ment
After restate-
ment
previ-ously
reportedrestate-
ment
After restate-
ment
trucks 48,911 (897) 48,014 51,331 (813) 50,518 44,309 (675) 43,634 47,732 (742) 46,990 192,283 (3,127) 189,156Construction equipment 17,999 – 17,999 19,715 – 19,715 13,272 – 13,272 12,572 – 12,572 63,558 – 63,558Buses 5,224 (138) 5,086 5,189 (149) 5,040 4,256 (180) 4,076 5,626 (242) 5,384 20,295 (705) 19,590Volvo penta 1,933 – 1,933 2,224 – 2,224 1,720 – 1,720 1,754 – 1,754 7,631 – 7,631Volvo aero 1,682 – 1,682 1,945 – 1,945 1,592 – 1,592 – – – 5,219 – 5,219group func-tions and other including eliminations 1,284 1 1,285 1,535 1 1,536 1,994 1 1,995 2,232 1 2,233 7,045 3 7,048Industrial operations 77,034 (1,035) 75,999 81,938 (961) 80,977 67,143 (854) 66,289 69,916 (982) 68,934 296,031 (3,832) 292,199
Customer finance 2,367 – 2,367 2,487 – 2,487 2,422 – 2,422 2,507 – 2,507 9,783 – 9,783eliminations (563) – (563) (522) – (522) (452) – (452) (630) – (630) (2,167) – (2,167)Volvo Group 78,838 (1,035) 77,803 83,904 (961) 82,943 69,111 (854) 68,256 71,793 (982) 70,811 303,647 (3,832) 299,814
Operating income Quarter 1/2012 Quarter 2/2012 Quarter 3/2012 Quarter 4/2012 Year 2012
seK m
previ-ously
reportedrestate-
ment
After restate-
ment
previ-ously
reportedrestate-
ment
After restate-
ment
previ-ously
reportedrestate-
ment
After restate-
ment
previ-ously
reportedrestate-
ment
After restate-
ment
previ-ously
reportedrestate-
ment
After restate-
ment
trucks 3,521 156 3,677 4,120 164 4,284 1,695 120 1,815 880 122 1,002 10,216 563 10,779Construction equipment 2,131 (42) 2,089 2,629 113 2,742 650 (48) 602 363 (128) 235 5,773 (106) 5,667Buses 62 (16) 46 176 12 188 (58) (6) (64) (129) (3) (132) 51 (14) 37Volvo penta 112 2 114 268 11 279 147 (3) 144 14 (1) 13 541 8 549Volvo aero 235 (2) 233 305 10 315 227 1 228 – – – 767 8 775group functions and other (157) (98) (255) (549) 63 (486) (116) (70) (186) (396) 89 (307) (1,217) (17) (1,235)Industrial operations 5,906 0 5,906 6,949 373 7,322 2,544 (8) 2,536 731 78 809 16,130 443 16,573
Customer finance 333 1 334 386 1 387 383 1 384 390 1 391 1,492 4 1,496Volvo Group 6,239 1 6,240 7,335 374 7,709 2,927 (7) 2,920 1,121 79 1,200 17,622 447 18,069
Segment reporting
145

Operating margin Quarter 1/2012 Quarter 2/2012 Quarter 3/2012 Quarter 4/2012 Year 2012
%previously
reported
After restate-
mentpreviously
reported
After restate-
mentpreviously
reported
After restate-
mentpreviously
reported
After restate-
mentpreviously
reported
After restate-
ment
trucks 7.2 7.7 8.0 8.5 3.8 4.2 1.8 2.1 5.3 5.7Construction equipment 11.8 11.6 13.3 13.9 4.9 4.5 2.9 1.9 9.1 8.9Buses 1.2 0.9 3.4 3.7 (1.4) (1.6) (2.3) (2.5) 0.3 0.2Volvo penta 5.8 5.9 12.1 12.5 8.5 8.4 0.8 0.7 7.1 7.2Volvo aero 14.0 13.9 15.7 16.2 14.3 14.3 – – 14.7 14.9Industrial Operations 7.7 7.8 8.5 9.0 3.8 3.8 1.0 1.2 5.4 5.7Volvo Group 7.9 8.0 8.7 9.3 4.2 4.3 1.6 1.7 5.8 6.0
Notes to fiNaNcial statemeNts
finanCial information 2012
146

Balance sheetsVolvo group
seK m
Previously reported
as ofJan 1, 2012
restatement Joint Ventures
After restatement Joint
Ventures
restatement post-employment
benefits
After post- employment
benefit restatement
AssetsNon-current assetsintangible assets 39,507 (1,729) 37,778 – 37,778
Tangible assets
property, plant and equipment 54,540 (636) 53,904 – 53,904
assets under operating leases 23,922 – 23,922 – 23,922
Financial assets
investments in Joint Venturs and associated companies 684 2,612 3,296 – 3,296
other shares and participations 1,190 419 1,609 – 1,609
non-current customer-financing receivables 40,618 – 40,618 – 40,618
Deferred tax assets 12,838 (19) 12,819 3,980 16,799
prepaid pensions 2,277 – 2,277 (2,277) 0
non-current interest-bearing receivables 694 (51) 643 – 643
other non-current receivables 4,315 (11) 4,304 – 4,304
Total non-current assets 180,585 585 181,170 1,703 182,873
Current assets
inventories 44,599 (363) 44,236 – 44,236
Current receivables
Customer-financing receivables 38,081 – 38,081 – 38,081
tax assets 1,200 (180) 1,020 – 1,020
interest-bearing receivables 667 – 667 – 667
internal funding 0 – 0 – 0
accounts receivable 27,699 (768) 26,931 – 26,931
other receivables 13,825 (114) 13,711 – 13,711
non interest-bearing assets held for sale 9,344 – 9,344 117 9,461
interest-bearing assets held for sale 4 – 4 – 4
marketable securities 6,862 – 6,862 – 6,862
Cash and cash equivalents 30,379 (822) 29,557 – 29,557
Total current assets 172,659 (2,248) 170,411 117 170,528
Total assets 353,244 (1,663) 351,581 1,820 353,401
Shareholders’ equity and liabilities
equity attributable to the equity holders of the parent company 84,581 (5) 84,576 (8,821) 75,755
minority interests 1,100 – 1,100 – 1,100
Total shareholders’ equity 85,681 (5) 85,676 (8,821) 76,855
Non-current provisions
provisions for post-employment benefits 6,665 (10) 6,655 10,078 16,733
provisions for deferred taxes 5,636 (175) 5,461 – 5,461
other provisions 5,648 (89) 5,559 – 5,559
Non-current liabilities
Bond loans 38,192 – 38,192 – 38,192
other loans 47,765 (5) 47,760 – 47,760
other liabilities 10,447 (1) 10,446 – 10,446
Current provisions 9,531 – 9,531 – 9,531
Current liabilities
loans 44,522 (236) 44,286 – 44,286
non interest-bearing liabilities held for sale 4,710 – 4,710 – 4,710
interest-bearing liabilities held for sale 6 – 6 532 538
trade payables 56,788 (688) 56,100 – 56,100
tax liabilities 2,391 – 2,391 – 2,391
other liabilities 35,262 (453) 34,809 31 34,840
Total shareholders’ equity and liabilities 353,244 (1,663) 351,581 1,820 353,401
Balance sheets, January 1, 2012
147

Income statement Quarter 1, 2012 Volvo group
seK m
Previouslyreported
2012restatement
Joint ventures
After Joint venture
restatement
restatementpost-
employment benefits
After post-employment
benefit restatement
restatement hedging of firm flows
Afterrestatements
Net sales 78,838 (1,035) 77,803 – 77,803 – 77,803
Cost of sales (60,335) 860 (59,475) 103 (59,372) (156) (59,528)Gross income 18,503 (175) 18,328 103 18,431 (156) 18,275
research and development expenses (3,708) 18 (3,690) 20 (3,670) – (3,670)selling expenses (6,899) 39 (6,860) 44 (6,816) – (6,816)administrative expenses (1,241) 25 (1,216) 4 (1,212) – (1,212)other operating income and expenses (423) 18 (405) 1 (404) – (404)income from investments in Joint Ventures and associated companies 8 54 62 – 62 – 62income from other investments 0 6 6 – 6 – 6Operating income 6,239 (15) 6,224 172 6,396 (156) 6,240
interest income and similar credits 142 (17) 125 – 125 – 125interest expenses and similar charges (695) 3 (692) (123) (815) – (815)other financial income and expenses (84) 0 (84) – (84) 156 72Income after financial items 5,602 (29) 5,573 49 5,622 0 5,622
income taxes (1,510) 29 (1,481) (16) (1,497) – (1,497)Income for the period 4,092 0 4,092 33 4,125 0 4,125
Consolidated other comprehensive income
Income for the period 4,092 0 4,092 33 4,125 0 4,125exchange differences on translation of foreign operations (1,373) 15 (1,358) 111 (1,247) – (1,247)share of oCi related to Joint Ventures and associated companies – (15) (15) – (15) – (15)exchange differences on hedge instruments of net investment in foreign operations 0 – 0 – 0 – 0accumulated translation difference reversed to income (66) – (66) – (66) – (66)available for sale investments 91 149 240 – 240 – 240Cash flow hedges (7) – (7) – (7) – (7)remeasurements of defined benefit plan – – – 1,070 1,070 – 1,070Other comprehensive income, net of income taxes (1,355) 149 (1,206) 1,181 (25) – (25)Total comprehensive income for the period* 2,737 149 2,885 1,214 4,099 – 4,099
* attributable toequity holders of the parent company 2,702 – – – – – 4,064minority interests 35 – – – – – 35
2,737 – – – – – 4,099
Quarter 1, 2012
Notes to fiNaNcial statemeNts
finanCial information 2012
148

Balance sheets march 31, 2012 Volvo group
seK m
Previouslyreported
2012restatement
Joint ventures
After Joint venture
restatement
restatementpost-
employment benefits
After post-employment
benefit restatement
restatement hedging of firm flows
Afterrestatements
Assets
Non-current assetsintangible assets 38,768 (1,755) 37,013 – 37,013 – 37,013Tangible assets
property, plant and equipment 53,160 (655) 52,505 – 52,505 – 52,505assets under operating leases 24,175 – 24,175 – 24,175 – 24,175
Financial assets investments in Joint Ventures 688 2,603 3,291 – 3,291 – 3,291other shares and participations 1,266 577 1,843 – 1,843 – 1,843non-current customer-financing receivables 41,482 – 41,482 – 41,482 – 41,482Deferred tax assets 12,509 – 12,509 3,492 16,001 – 16,001prepaid pensions 2,196 – 2,196 (2,196) 0 – 0non-current interest-bearing receivables 620 – 620 – 620 – 620other non-current receivables 4,469 (175) 4,294 – 4,294 – 4,294
Total non-current assets 179,333 595 179,928 1,296 181,224 – 181,224
Current assetsinventories 47,129 (392) 46,737 – 46,737 – 46,737Current receivables
Customer-financing receivables 38,474 – 38,474 – 38,474 – 38,474tax assets 1,488 (182) 1,306 – 1,306 – 1,306interest-bearing receivables 1,469 – 1,469 – 1,469 – 1,469internal funding 0 – 0 – 0 – 0accounts receivable 30,623 (755) 29,868 – 29,868 – 29,868other receivables 14,793 (92) 14,701 – 14,701 – 14,701
non interest-bearing assets held for sale 9,124 – 9,124 117 9,241 – 9,241interest-bearing assets held for sale 8 – 8 – 8 – 8marketable securities 9,140 – 9,140 – 9,140 – 9,140Cash and cash equivalents 27,971 (830) 27,141 – 27,141 – 27,141Total current assets 180,219 (2,251) 177,968 117 178,085 – 178,085Total assets 359,552 (1,656) 357,896 1,413 359,309 – 359,309
Shareholders’ equity and liabilitiesequity attributable to the equity holder of the parent Company 87,295 143 87,438 (7,607) 79,831 – 79,831minority interests 1,135 – 1,135 – 1,135 – 1,135Total shareholders’ equity 88,430 143 88,573 (7,607) 80,966 – 80,966
Non-current provisions
provisions for post-employment benefits 6,580 (10) 6,570 8,457 15,027 – 15,027provisions for deferred taxes 5,491 (173) 5,318 – 5,318 – 5,318other provisions 5,592 (81) 5,511 – 5,511 – 5,511
Non-current liabilitiesBond loans 37,695 – 37,695 – 37,695 – 37,695other loans 49,577 (4) 49,573 – 49,573 – 49,573other liabilities 10,734 (1) 10,733 – 10,733 – 10,733
Current provisions 9,783 0 9,783 – 9,783 – 9,783Current liabilities
loans 48,286 – 48,286 – 48,286 – 48,286non interest-bearing liabilities held for sale 4,246 – 4,246 – 4,246 – 4,246interest-bearing liabilities held for sale 3 – 3 532 535 – 535trade payables 56,496 (815) 55,681 – 55,681 – 55,681tax liabilities 2,184 0 2,184 – 2,184 – 2,184other liabilities 34,455 (714) 33,741 31 33,772 – 33,772
Total shareholders’ equity and liabilities 359,552 (1,656) 357,896 1,413 359,309 – 359,309
149

Income statement Quarter 2, 2012 Volvo group
seK m
Previouslyreported
2012restatementjoint ventures
After joint venture
restatement
restatementpost-
employment benefits
After post-employment
benefit restatement
restatement hedging of firm flows
Afterrestatements
Net sales 83,904 (961) 82,943 – 82,943 – 82,943
Cost of sales (63,566) 831 (62,735) 103 (62,632) 207 (62,425)Gross income 20,338 (130) 20,208 103 20,311 207 20,518
research and development expenses (3,923) 21 (3,902) 20 (3,882) – (3,882)selling expenses (7,283) 44 (7,239) 44 (7,195) – (7,195)administrative expenses (1,518) 19 (1,499) 4 (1,495) – (1,495)other operating income and expenses (248) 16 (232) 1 (231) – (231)income from investments in Joint Ventures and associated companies (7) 24 17 – 17 – 17income from other investments (26) 1 (25) – (25) – (25)Operating income 7,335 (5) 7,330 172 7,502 207 7,709
interest income and similar credits 51 (16) 35 – 35 – 35interest expenses and similar charges (586) 6 (580) (123) (703) – (703)other financial income and expenses (36) (1) (37) – (37) (207) (244)Income after financial items 6,764 (17) 6,747 49 6,796 0 6,796
income taxes (1,820) 13 (1,807) (16) (1,823) – (1,823)Income for the period 4,943 (4) 4,939 33 4,972 0 4,972
Consolidated other comprehensive income
Income for the period 4,943 (4) 4.939 33 4,972 0 4,972exchange differences on translation of foreign operations 159 97 256 (13) 243 – 243share of oCi related to Joint Ventures and associated companies - (87) (87) – (87) (87)exchange differences on hedge instruments of net investment in foreign operations 0 – 0 – 0 – 0accumulated translation difference reversed to income 0 – 0 – 0 – 0available for sale investments (90) (36) (126) – (126) – (126)Cash flow hedges 8 – 8 – 8 – 8remeasurements of defined benefit plan – – – (1,682) (1,682) – (1,682)Other comprehensive income, net of income taxes 77 (27) 50 (1,695) (1,645) – (1,645)Total comprehensive income for the period* 5,020 (30) 4,990 (1,662) 3,328 – 3,328
* attributable toequity holders of the parent company 4,894 – – – – – 3,202minority interests 126 – – – – – 126 5,020 – – – – – 3,328
Quarter 2, 2012
Notes to fiNaNcial statemeNts
finanCial information 2012
150

Balance sheets June 30, 2012 Volvo group
seK m
Previouslyreported
2012restatementjoint ventures
After joint venture
restatement
restatementpost-
employment benefits
After post-employment
benefit restatement
restatement hedging of firm flows
Afterrestatements
Assets
Non-current assetsintangible assets 40,440 (1,677) 38,763 – 38,763 – 38,763Tangible assets
property, plant and equipment 54,851 (736) 54,115 – 54,115 – 54,115assets under operating leases 26,354 – 26,354 – 26,354 – 26,354
Financial assetsinvestments in Joint Ventures and associated companies 679 2,531 3,210 – 3,210 – 3,210other shares and participations 1,173 540 1,713 – 1,713 – 1,713non-current customer-financing receivables 39,348 – 39,348 – 39,348 – 39,348Deferred tax assets 13,672 – 13,672 4,246 17,918 – 17,918prepaid pensions 2,699 – 2,699 (2,699) 0 – 0non-current interest-bearing receivables 584 – 584 – 584 – 584other non-current receivables 4,654 (180) 4,474 – 4,474 – 4,474
Total non-current assets 184,454 478 184,932 1,547 186,479 – 186,479
Current assetsinventories 47,941 (467) 47,474 – 47,474 – 47,474Current receivables
Customer-financing receivables 43,843 – 43,843 – 43,843 – 43,843tax assets 1,187 (175) 1,012 – 1,012 – 1,012interest-bearing receivables 1,404 – 1,404 – 1,404 – 1,404internal funding 0 – 0 – 0 – 0accounts receivable 31,257 (785) 30,472 – 30,472 – 30,472other receivables 15,515 (115) 15,400 – 15,400 – 15,400
non interest-bearing assets held for sale 9,468 – 9,468 117 9,585 – 9,585interest-bearing assets held for sale 2 – 2 – 2 – 2marketable securities 5,023 – 5,023 – 5,023 – 5,023Cash and cash equivalents 26,068 (585) 25,483 – 25,483 – 25,483Total current assets 181,708 (2,127) 179,581 117 179,698 – 179,698Total assets 366,162 (1,650) 364,512 1,664 366,176 – 366,176
Shareholders’ equity and liabilitiesequity attributable to the equity holder of the parent Company 86,120 104 86,224 (9,269) 76,955 – 76,955minority interests 1,262 – 1,262 – 1,262 – 1,262Total shareholders’ equity 87,382 104 87,486 (9,269) 78,217 – 78,217
Non-current provisions
provisions for post-employment benefits 7,012 (13) 6,999 10,370 17,369 – 17,369provisions for deferred taxes 6,515 (162) 6,353 – 6,353 – 6,353other provisions 5,598 (71) 5,527 – 5,527 – 5,527
Non-current liabilitiesBond loans 37,089 – 37,089 – 37,089 – 37,089other loans 47,710 (4) 47,706 – 47,706 – 47,706other liabilities 11,182 – 11,182 – 11,182 – 11,182
Current provisions 10,556 – 10,556 – 10,556 – 10,556Current liabilities
loans 54,076 – 54,076 – 54,076 – 54,076non interest-bearing liabilities held for sale 4,466 – 4,466 – 4,466 – 4,466interest-bearing liabilities held for sale 39 – 39 532 571 – 571trade payables 56,092 (698) 55,394 – 55,394 – 55,394tax liabilities 2,115 (179) 1,936 – 1,936 – 1,936other liabilities 36,330 (625) 35,705 31 35,736 – 35,736
Total shareholders’ equity and liabilities 366,162 (1,650) 364,512 1,664 366,176 – 366,176
151

Income statement Quarter 3, 2012 Volvo group
seK m
Previouslyreported
2012restatementjoint ventures
After joint venture
restatement
restatementpost-
employment benefits
After post-employment
benefit restatement
restatement hedging of firm flows
Afterrestatements
Net sales 69,111 (855) 68,256 – 68,256 – 68,256
Cost of sales (54,136) 743 (53,393) 103 (53,290) (178) (53,468)Gross income 14,975 (112) 14,863 103 14,966 (178) 14,788
research and development expenses (3,316) 19 (3,297) 19 (3,278) – (3,278)selling expenses (6,608) 46 (6,562) 43 (6,519) – (6,519)administrative expenses (1,336) 21 (1,315) 5 (1,310) – (1,310)other operating income and expenses (803) 15 (788) 1 (787) – (787)income from investments in Joint Ventures and associated companies (7) 12 5 – 5 – 5income from other investments 23 (2) 21 – 21 – 21Operating income 2,927 0 2,927 171 3,098 (178) 2,920
interest income and similar credits 22 (13) 9 – 9 – 9interest expenses and similar charges (487) 5 (482) (123) (605) – (605)other financial income and expenses (133) 0 (133) – (133) 178 45Income after financial items 2,329 (7) 2,322 48 2,370 0 2,370
income taxes (947) 5 (942) (16) (958) – (958)Income for the period 1,382 (2) 1,380 32 1,412 0 1,412
Consolidated other comprehensive income
Income for the period 1,382 (2) 1,380 32 1,412 0 1,412exchange differences on translation of foreign operations (2,774) 4 (2,778) 221 (2,549) – (2,549)share of oCi related to Joint Ventrues and associated companies – (5) (5) – (5) – (5)exchange differences on hedge instruments of net investment in foreign operations 0 – 0 – 0 – 0accumulated translation difference reversed to income 0 – 0 – 0 – 0available for sale investments (37) 101 64 – 64 – 64remeasurements of defined benefit plan (3) – (3) – (3) – (3)Cash flow hedges – – – (2,418) (2,418) – (2,418)Other comprehensive income, net of income taxes (2,814) 100 (2,714) (2,197) (4,911) 0 (4,911)Total comprehensive income for the period* (1,432) 98 (1,334) (2,165) (3,499) 0 (3,499)
* attributable toequity holders of the parent company (1,410) – – – – – (3,477)minority interests (22) – – – – – (22)
(1,432) – – – – – (3,499)
Quarter 3, 2012
Notes to fiNaNcial statemeNts
finanCial information 2012
152
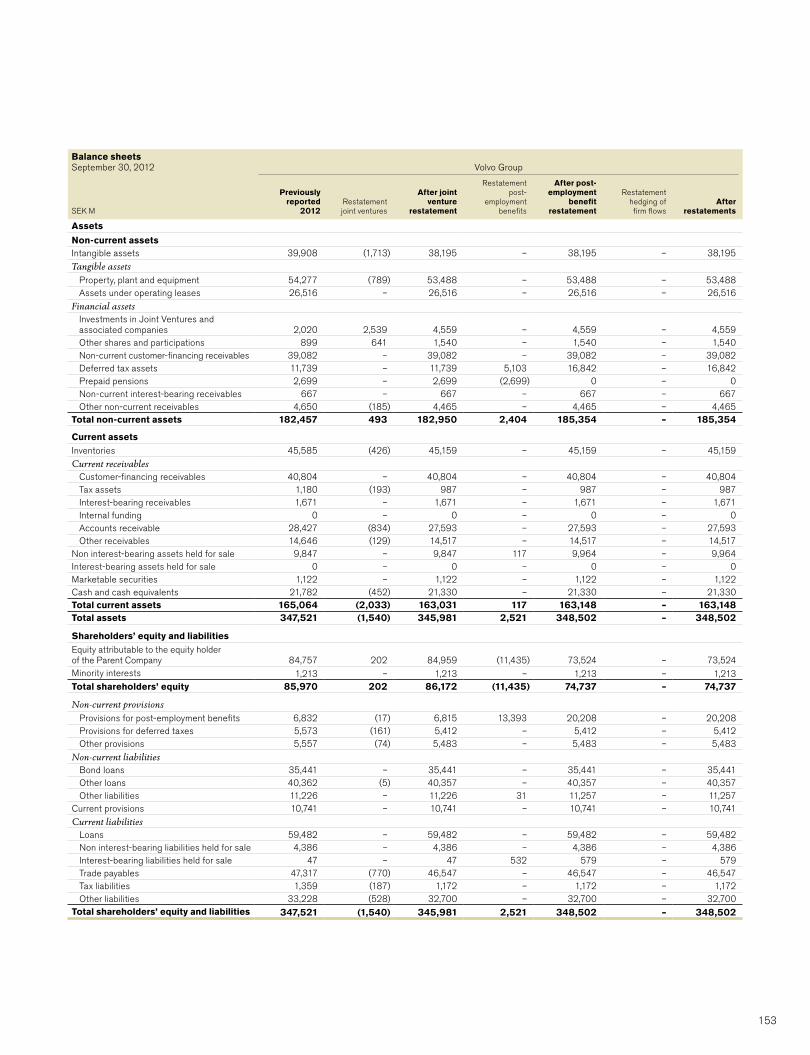
Balance sheets september 30, 2012 Volvo group
seK m
Previouslyreported
2012restatementjoint ventures
After joint venture
restatement
restatementpost-
employment benefits
After post-employment
benefit restatement
restatement hedging of firm flows
Afterrestatements
Assets
Non-current assetsintangible assets 39,908 (1,713) 38,195 – 38,195 – 38,195Tangible assets
property, plant and equipment 54,277 (789) 53,488 – 53,488 – 53,488assets under operating leases 26,516 – 26,516 – 26,516 – 26,516
Financial assetsinvestments in Joint Ventures and associated companies 2,020 2,539 4,559 – 4,559 – 4,559other shares and participations 899 641 1,540 – 1,540 – 1,540non-current customer-financing receivables 39,082 – 39,082 – 39,082 – 39,082Deferred tax assets 11,739 – 11,739 5,103 16,842 – 16,842prepaid pensions 2,699 – 2,699 (2,699) 0 – 0non-current interest-bearing receivables 667 – 667 – 667 – 667other non-current receivables 4,650 (185) 4,465 – 4,465 – 4,465
Total non-current assets 182,457 493 182,950 2,404 185,354 – 185,354
Current assetsinventories 45,585 (426) 45,159 – 45,159 – 45,159Current receivables
Customer-financing receivables 40,804 – 40,804 – 40,804 – 40,804tax assets 1,180 (193) 987 – 987 – 987interest-bearing receivables 1,671 – 1,671 – 1,671 – 1,671internal funding 0 – 0 – 0 – 0accounts receivable 28,427 (834) 27,593 – 27,593 – 27,593other receivables 14,646 (129) 14,517 – 14,517 – 14,517
non interest-bearing assets held for sale 9,847 – 9,847 117 9,964 – 9,964interest-bearing assets held for sale 0 – 0 – 0 – 0marketable securities 1,122 – 1,122 – 1,122 – 1,122Cash and cash equivalents 21,782 (452) 21,330 – 21,330 – 21,330Total current assets 165,064 (2,033) 163,031 117 163,148 – 163,148Total assets 347,521 (1,540) 345,981 2,521 348,502 – 348,502
Shareholders’ equity and liabilitiesequity attributable to the equity holder of the parent Company 84,757 202 84,959 (11,435) 73,524 – 73,524minority interests 1,213 – 1,213 – 1,213 – 1,213Total shareholders’ equity 85,970 202 86,172 (11,435) 74,737 – 74,737
Non-current provisions
provisions for post-employment benefits 6,832 (17) 6,815 13,393 20,208 – 20,208provisions for deferred taxes 5,573 (161) 5,412 – 5,412 – 5,412other provisions 5,557 (74) 5,483 – 5,483 – 5,483
Non-current liabilitiesBond loans 35,441 – 35,441 – 35,441 – 35,441other loans 40,362 (5) 40,357 – 40,357 – 40,357other liabilities 11,226 – 11,226 31 11,257 – 11,257
Current provisions 10,741 – 10,741 – 10,741 – 10,741Current liabilities
loans 59,482 – 59,482 – 59,482 – 59,482non interest-bearing liabilities held for sale 4,386 – 4,386 – 4,386 – 4,386interest-bearing liabilities held for sale 47 – 47 532 579 – 579trade payables 47,317 (770) 46,547 – 46,547 – 46,547tax liabilities 1,359 (187) 1,172 – 1,172 – 1,172other liabilities 33,228 (528) 32,700 – 32,700 – 32,700
Total shareholders’ equity and liabilities 347,521 (1,540) 345,981 2,521 348,502 – 348,502
153

Income statement Quarter 4, 2012 Volvo group
seK m
Previouslyreported
2012restatementjoint ventures
After joint venture
restatement
restatementpost-
employment benefits
After post-employment
benefit restatement
restatement hedging of firm flows
Afterrestatements
Net sales 71,793 (982) 70.811 – 70,811 – 70,811
Cost of sales (57,046) 847 (56.199) 103 (56,096) (96) (56,192)Gross income 14,746 (135) 14,611 103 14,714 (96) 14,618
research and development expenses (3,847) 23 (3,824) 19 (3,805) – (3,805)selling expenses (7,458) 50 (7,408) 43 (7,365) – (7,365)administrative expenses (1,574) 22 (1,552) 5 (1,547) – (1,547)other operating income and expenses (686) 11 (675) 1 (674) – (674)income from investments in Joint Ventures and associated companies (17) 32 15 – 15 – 15income from other investments (44) 0 (44) – (44) – (44)Operating income 1,121 4 1,124 171 1,295 (96) 1,199
interest income and similar credits 295 (11) 284 – 284 – 284interest expenses and similar charges (708) 6 (702) (124) (826) – (826)other financial income and expenses (48) 1 (47) – (47) 96 49Income after financial items 660 (1) 659 47 706 0 706
income taxes 181 (2) 179 (16) 163 – 163Income for the period 841 (3) 838 31 869 0 869
Consolidated other comprehensive income
Income for the period 841 (3) 838 31 869 0 869exchange differences on translation of foreign operations 72 92 164 (6) 158 – 158share of oCi related Joint Ventures and associated companies – (84) (84) – (84) – (84)exchange differences on hedge instruments of net investment in foreign operations 0 – 0 – 0 – 0accumulated translation difference reversed to income (52) – (52) – (52) – (52)available for sale investments 32 134 166 – 166 – 166Cash flow hedges 10 – 10 – 10 – 10remeasurements of defined benefit plan – – – 796 796 – 796Other comprehensive income, net of income taxes 62 142 204 790 994 0 994Total comprehensive income for the period* 903 139 1,042 821 1,863 0 1,863
* attributable toequity holders of the parent company 906 – – – – – 1,866minority interests (3) – – – – – (3)
903 – – – – – 1,863
Quarter 4, 2012
Notes to fiNaNcial statemeNts
finanCial information 2012
154

Balance sheets December 31, 2012 Volvo group
seK m
Previouslyreported
2012restatementjoint ventures
After joint venture
restatement
restatementpost-
employment benefits
After post-employment
benefit restatement
restatement hedging of firm flows
Afterrestatements
Assets
Non-current assetsintangible assets 40,373 (1,675) 38,698 – 38,698 – 38,698Tangible assets
property, plant and equipment 55,004 (815) 54,189 – 54,189 – 54,189assets under operating leases 29,022 – 29,022 – 29,022 – 29,022
Financial assetsinvestments in Joint Ventures and associated companies 2,045 2,478 4,523 – 4,523 – 4,523other shares and participations 845 775 1,620 – 1,620 – 1,620non-current customer-financing receivables 41,156 – 41,156 – 41,156 – 41,156Deferred tax assets 11,166 – 11,166 4,710 15,876 – 15,876prepaid pensions 2,724 – 2,724 (2,724) 0 – 0non-current interest-bearing receivables 337 – 337 – 337 – 337other non-current receivables 3,319 (231) 3,088 – 3,088 – 3,088
Total non-current assets 185,991 533 186,524 1,986 188,510 – 188,510
Current assetsinventories 40,409 (316) 40,093 – 40,093 – 40,093Current receivables
Customer-financing receivables 39,833 – 39,833 – 39,833 – 39,833tax assets 1,208 (195) 1,013 – 1,013 – 1,013interest-bearing receivables 2,574 – 2,574 – 2,574 – 2,574internal funding 0 – 0 – 0 – 0accounts receivable 27,349 (833) 26,516 – 26,516 – 26,516other receivables 12,489 (199) 12,290 – 12,290 – 12,290
non interest-bearing assets held for sale 0 – 0 – 0 – 0interest-bearing assets held for sale 0 – 0 – 0 – 0marketable securities 3,130 – 3,130 – 3,130 – 3,130Cash and cash equivalents 25,759 (552) 25,207 – 25,207 – 25,207Total current assets 152,751 (2,095) 150,656 – 150,656 – 150,656Total assets 338,742 (1,562) 337,180 1,986 339,166 – 339,166
Shareholders’ equity and liabilitiesequity attributable to the equity holder of the parent Company 85,648 334 85,982 (10,197) 75,785 – 75,785minority interests 1,266 0 1,266 – 1,266 – 1,266Total shareholders’ equity 86,914 334 87,248 (10,197) 77,051 – 77,051
Non-current provisions
provisions for post-employment benefits 6,697 (14) 6,683 12,152 18,835 – 18,835provisions for deferred taxes 5,028 (178) 4,850 – 4,850 – 4,850other provisions 5,783 (43) 5,740 – 5,740 – 5,740
Non-current liabilitiesBond loans 43,092 – 43,092 – 43,092 – 43,092other loans 38,433 (5) 38,428 – 38,428 – 38,428other liabilities 10,714 – 10,714 – 10,714 – 10,714
Current provisions 10,976 – 10,976 – 10,976 – 10,976Current liabilities –
loans 50,317 (304) 50,013 – 50,013 – 50,013non interest-bearing liabilities held for sale 0 – 0 – 0 – 0interest-bearing liabilities held for sale 0 – 0 – 0 – 0trade payables 47,364 (892) 46,472 – 46,472 – 46,472tax liabilities 653 (193) 460 – 460 – 460other liabilities 32,771 (267) 32,504 31 32,535 – 32,535
Total shareholders’ equity and liabilities 338,742 (1,562) 337,180 1,986 339,166 – 339,166
155

Income statement full year, 2012 Volvo group
seK m
Previouslyreported
2012restatementjoint ventures
After joint venture
restatement
restatementpost-
employment benefits
After post-employment
benefit restatement
restatement hedging of firm flows
Afterrestatements
Net sales 303,647 (3,833) 299,814 – 299,814 – 299,814
Cost of sales (235,085) 3,281 (231,804) 412 (231,392) (223) (231,615)Gross income 68,562 (552) 68,010 412 68,422 (223) 68,199
research and development expenses (14,794) 81 (14,713) 78 (14,635) – (14,635)selling expenses (28,248) 180 (28,068) 174 (27,894) – (27,894)administrative expenses (5,669) 88 (5,581) 18 (5,563) – (5,563)other operating income and expenses (2,160) 60 (2,100) 4 (2,096) – (2,096)income from investments in Joint Ventures and associated companies (23) 122 99 – 99 – 99income from other investments (47) 5 (42) – (42) – (42)Operating income 17,622 (17) 17,604 686 18,290 (223) 18,067
interest income and similar credits 510 (57) 453 – 453 – 453interest expenses and similar charges (2,476) 20 (2,456) (493) (2,949) – (2,949)other financial income and expenses (301) 0 (301) – (301) 223 (78)Income after financial items 15,355 (54) 15,301 193 15,494 0 15,494
income taxes (4,097) 45 (4,052) (64) (4,116) – (4,116)Income for the period 11,258 (9) 11,249 129 11,378 0 11,378
Consolidated other comprehensive income
Income for the period 11,258 (9) 11,249 129 11,378 0 11,378exchange differences on translation of foreign operations (3,916) 208 (3,708) 313 (3,395) – (3,395)share of oCi related to Joint Ventures and associated companies – (191) (191) – (191) – (191)exchange differences on hedge instruments of net investment in foreign operations 0 – 0 – 0 – 0accumulated translation difference reversed to income (118) – (118) – (118) – (118)available for sale investments (4) 347 343 – 343 – 343Cash flow hedges 8 – 8 – 8 – 8remeasurements of defined benefit plan – – – (2,234) (2,234) – (2,234)Other comprehensive income, net of income taxes (4,030) 364 (3,666) (1,921) (5,587) 0 (5,587)Total comprehensive income for the period* 7,228 355 7,583 (1,792) 5,791 0 5,791
* attributable to
equity holders of the parent company 7,092 – – – – – 5,655minority interests 136 – – – – – 136 7,228 – – – – – 5,791
Full year, 2012
Notes to fiNaNcial statemeNts
finanCial information 2012
156
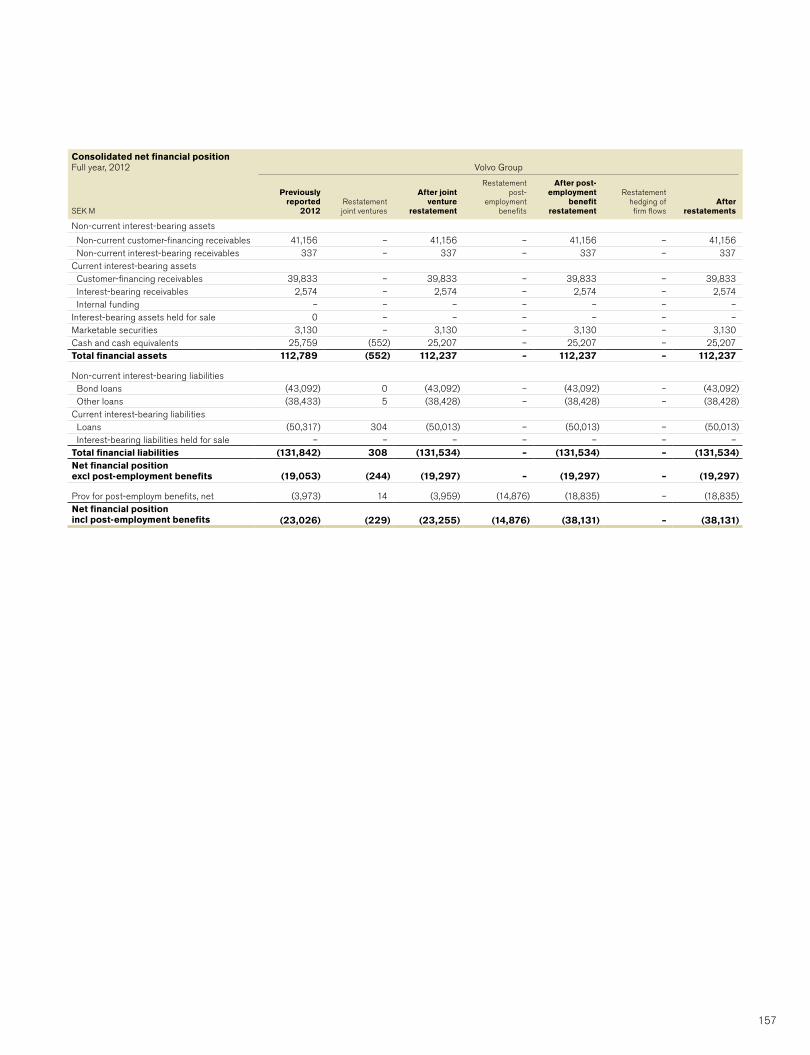
Consolidated net financial position full year, 2012 Volvo group
seK m
Previouslyreported
2012restatementjoint ventures
After joint venture
restatement
restatementpost-
employment benefits
After post-employment
benefit restatement
restatement hedging of firm flows
Afterrestatements
non-current interest-bearing assets
non-current customer-financing receivables 41,156 – 41,156 – 41,156 – 41,156 non-current interest-bearing receivables 337 – 337 – 337 – 337Current interest-bearing assets Customer-financing receivables 39,833 – 39,833 – 39,833 – 39,833 interest-bearing receivables 2,574 – 2,574 – 2,574 – 2,574 internal funding – – – – – – –interest-bearing assets held for sale 0 – – – – – –marketable securities 3,130 – 3,130 – 3,130 – 3,130Cash and cash equivalents 25,759 (552) 25,207 – 25,207 – 25,207Total financial assets 112,789 (552) 112,237 – 112,237 – 112,237
non-current interest-bearing liabilities Bond loans (43,092) 0 (43,092) – (43,092) – (43,092) other loans (38,433) 5 (38,428) – (38,428) – (38,428)Current interest-bearing liabilities loans (50,317) 304 (50,013) – (50,013) – (50,013) interest-bearing liabilities held for sale – – – – – – –Total financial liabilities (131,842) 308 (131,534) – (131,534) – (131,534)Net financial position excl post-employment benefits (19,053) (244) (19,297) – (19,297) – (19,297)
prov for post-employm benefits, net (3,973) 14 (3,959) (14,876) (18,835) – (18,835)Net financial position incl post-employment benefits (23,026) (229) (23,255) (14,876) (38,131) – (38,131)
157
noTe 32 CHAnGES In VOLVO GROuP FInAnCIAL REPORTInG 2012
New organisationAs of January 1, 2012, the Volvo Group introduced a new functional organization.
Read more about the Volvo Group’s new organization as from January 1, 2012 in Note 6.
Impact on segment reportingunder the prior organization, the Trucks operations were organized in four business areas, which were aggregated to one reportable segment for Trucks. under the new organization, the consolidation of the four truck areas into one Trucks business area is further emphasizing the utilization of resources between the different brands to optimize the overall global potential for the Trucks business. Therefore, the overall Truck business is considered one single operating segment under the new organization. The Volvo Group will thus continue to be reported in the six segments Trucks, Construction Equipment, Buses, Volvo Penta, Customer Finance and Group functions and other. The reported segment information is based on the information used internally by the chief operating decision maker, i.e. the Volvo Group CEO.
The heading Group functions and other contains the cost of corporate functions, external business related to the business support functions and the operations within business areas Volvo Rents and Governmental Sales.
Impact on goodwill impairment testingThe Trucks segment is considered one single cash generating unit (CGu) under the new organization. Goodwill related to the area Trucks are therefore from 2012 evaluated based on the cash generation capacity of the overall Trucks segment.
Restatement of financial reporting for 2011The implementation of the functional organization has resulted in a realloca-tion of responsibilities within the Group. As a consequence, certain cost items have been redefined from a functional perspective, causing a shift between the lines in the income statement of the Volvo Group as well as the income statement of the Industrial Operations. In addition, as a result of the reorganization as well as the financial framework, certain sales and cost items are reported differently from a segment reporting perspective from 2012. To facilitate comparability between the years, 2011 income statement and segment reporting data has been restated.
The impact of the restatement of the income statement for 2011 and the segment reporting for 2011 due to the new organization are disclosed on page 159.
Notes to fiNaNcial statemeNts
FInAnCIAL InFORMATIOn 2012
158
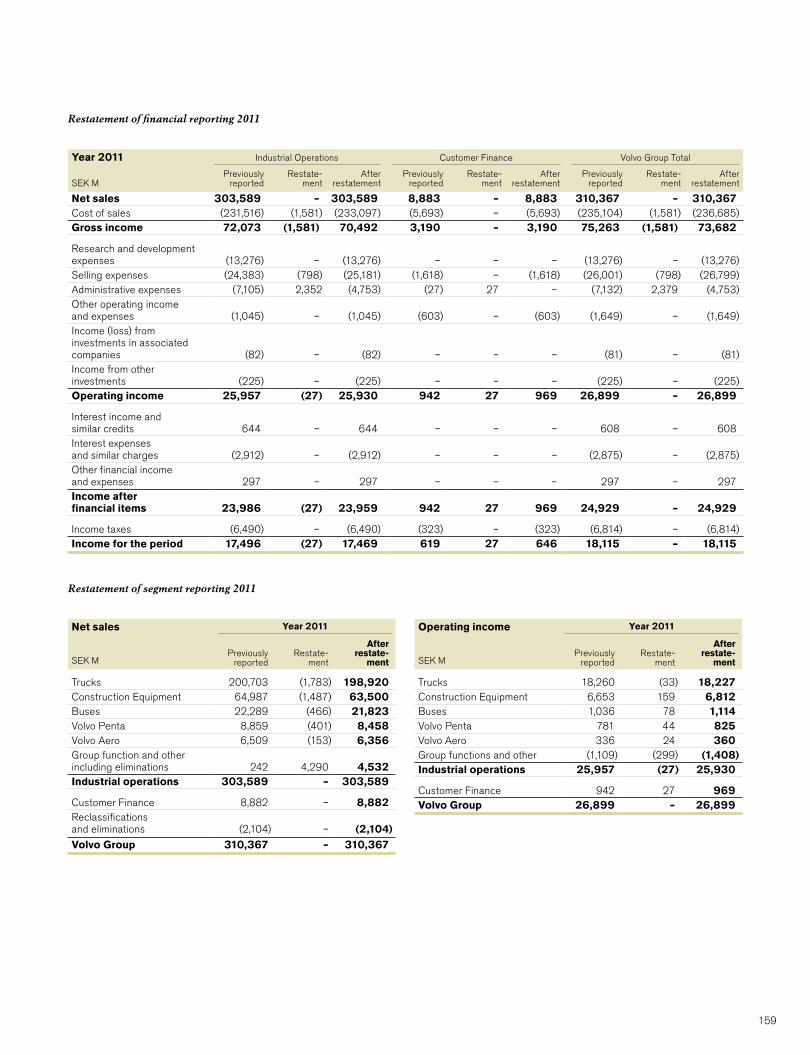
year 2011 Industrial Operations Customer Finance Volvo Group Total
SEK MPreviously
reportedRestate-
mentAfter
restatementPreviously
reportedRestate-
mentAfter
restatementPreviously
reportedRestate-
mentAfter
restatement
Net sales 303,589 – 303,589 8,883 – 8,883 310,367 – 310,367Cost of sales (231,516) (1,581) (233,097) (5,693) – (5,693) (235,104) (1,581) (236,685)Gross income 72,073 (1,581) 70,492 3,190 – 3,190 75,263 (1,581) 73,682
Research and development expenses (13,276) – (13,276) – – – (13,276) – (13,276)Selling expenses (24,383) (798) (25,181) (1,618) – (1,618) (26,001) (798) (26,799)Administrative expenses (7,105) 2,352 (4,753) (27) 27 – (7,132) 2,379 (4,753)Other operating income and expenses (1,045) – (1,045) (603) – (603) (1,649) – (1,649)Income (loss) from investments in associated companies (82) – (82) – – – (81) – (81)Income from other investments (225) – (225) – – – (225) – (225)Operating income 25,957 (27) 25,930 942 27 969 26,899 – 26,899
Interest income and similar credits 644 – 644 – – – 608 – 608Interest expenses and similar charges (2,912) – (2,912) – – – (2,875) – (2,875)Other financial income and expenses 297 – 297 – – – 297 – 297Income after financial items 23,986 (27) 23,959 942 27 969 24,929 – 24,929
Income taxes (6,490) – (6,490) (323) – (323) (6,814) – (6,814)Income for the period 17,496 (27) 17,469 619 27 646 18,115 – 18,115
Restatement of financial reporting 2011
Operating income
SEK M
year 2011
Previously reported
Restate-ment
After restate-
ment
Trucks 18,260 (33) 18,227Construction Equipment 6,653 159 6,812Buses 1,036 78 1,114Volvo Penta 781 44 825Volvo Aero 336 24 360Group functions and other (1,109) (299) (1,408)Industrial operations 25,957 (27) 25,930
Customer Finance 942 27 969Volvo Group 26,899 – 26,899
Net sales
SEK M
year 2011
Previously reported
Restate-ment
After restate-
ment
Trucks 200,703 (1,783) 198,920Construction Equipment 64,987 (1,487) 63,500Buses 22,289 (466) 21,823Volvo Penta 8,859 (401) 8,458Volvo Aero 6,509 (153) 6,356Group function and other including eliminations 242 4,290 4,532Industrial operations 303,589 – 303,589
Customer Finance 8,882 – 8,882Reclassifications and eliminations (2,104) – (2,104)Volvo Group 310,367 – 310,367
Restatement of segment reporting 2011
159

Parent Company AB Volvo Corporate registration number 556012-5790.Amounts in SEK M unless otherwise specified. The amounts within parentheses refer to the preceding year, 2011.
Board of Directors’ reportAB Volvo is the Parent Company of the Volvo Group and its operations comprise of the Group’s head office with staff together with some corpo-rate functions.
Income from investments in Group companies includes 2,865 from gain on sales of shares in Volvo Aero AB. Income includes dividends amounting to 920 (2,719) and transfer price adjustments and royalties amounting to an expense of 524 (1,000). Dividend received from Volvo Aero AB amounted to 572 and dividend received from Volvo Construction Equipment nV amounted to 258.
The carrying value of shares and participations in Group companies amounted to 56,832 (59,460), of which 55,940 (58,934) pertained to
shares in wholly owned subsidiaries. The corresponding shareholders’ equity in the subsidiaries (including equity in untaxed reserves but excluding minor-ity interests) amounted to 100,326 (99,139).
Investments in associated companies included 1,752 (413) in associated companies that are reported in accordance with the equity method in the consolidated accounts. The portion of shareholders’ equity in associated companies pertaining to AB Volvo amounted to 1,419 (413). During 2012 AB Volvo aquired additional shares in the listed company Deutz AG amounting to 1,107. Total holding as of December 31, 2012 amounts to 25%.
Financial net debt amounted to 27,042 (30,665). AB Volvo’s risk capital (shareholders’ equity plus untaxed reserves)
amounted to 41,241 (42,163) corresponding to 54% (55) of total assets.
inCome sTaTemenTSEK M 2012 2011
Net sales note 2 670 721Cost of sales note 2 (670) (721)Gross income 0 0
Administrative expenses note 2, 3 (1,026) (880)Other operating income and expenses note 4 48 (146)Income from investments in Group companies note 5 3,151 1,658Income from investments in associated companies note 6 4 130Income from other investments note 7 9 4Operating income 2,186 766
Interest income and similar credits note 8 0 0Interest expenses and similar charges note 8 (1,509) (1,677)Other financial income and expenses note 9 (112) (96)Income after financial items 565 (1,007)
Allocations note 10 5,628 7,085Income taxes note 11 (1,092) (597)Income for the period 5,101 5,481
oTher ComprehensiVe inComeIncome for the period 5,101 5,481Available-for-sale investments (34) (159)Other comprehensive income, net of income taxes (34) (159)Total comprehensive income for the period 5,067 5,322
FInAnCIAL InFORMATIOn 2012
160
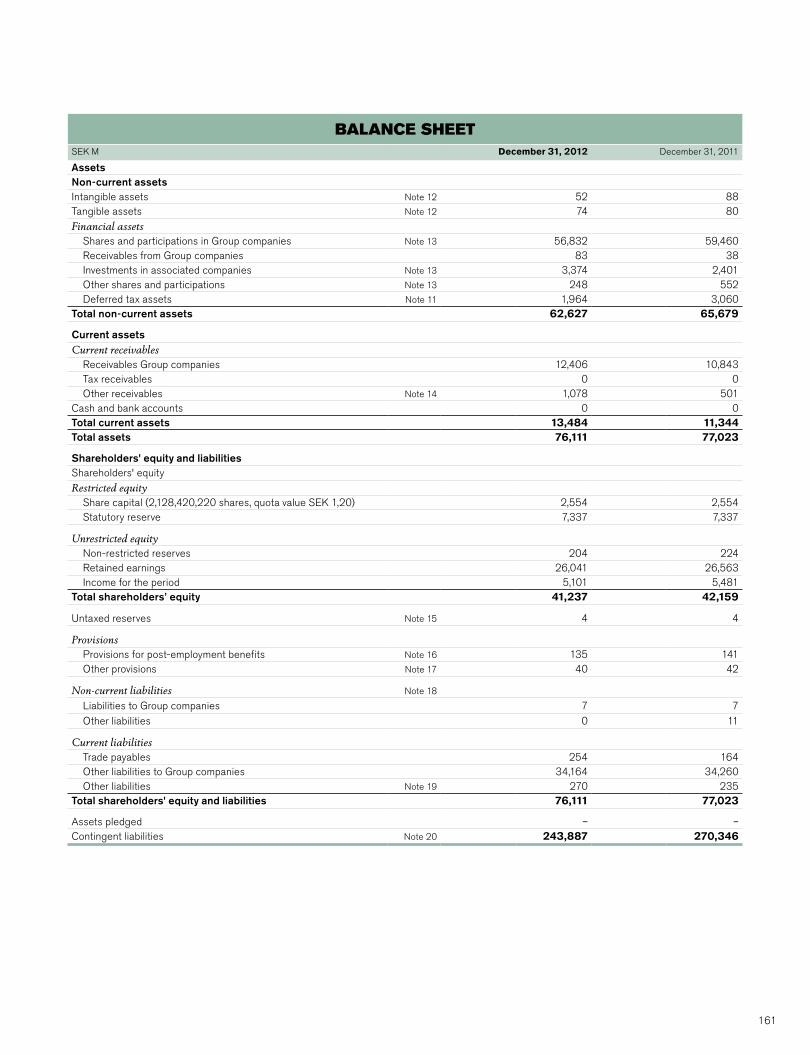
BalanCe sheeTSEK M December 31, 2012 December 31, 2011
AssetsNon-current assetsIntangible assets note 12 52 88Tangible assets note 12 74 80Financial assets
Shares and participations in Group companies note 13 56,832 59,460Receivables from Group companies 83 38Investments in associated companies note 13 3,374 2,401Other shares and participations note 13 248 552Deferred tax assets note 11 1,964 3,060
Total non-current assets 62,627 65,679
Current assetsCurrent receivables
Receivables Group companies 12,406 10,843Tax receivables 0 0Other receivables note 14 1,078 501
Cash and bank accounts 0 0Total current assets 13,484 11,344Total assets 76,111 77,023
Shareholders' equity and liabilitiesShareholders' equityRestricted equity
Share capital (2,128,420,220 shares, quota value SEK 1,20) 2,554 2,554Statutory reserve 7,337 7,337
Unrestricted equity non-restricted reserves 204 224Retained earnings 26,041 26,563Income for the period 5,101 5,481
Total shareholders’ equity 41,237 42,159
untaxed reserves note 15 4 4
ProvisionsProvisions for post-employment benefits note 16 135 141Other provisions note 17 40 42
Non-current liabilities note 18
Liabilities to Group companies 7 7Other liabilities 0 11
Current liabilitiesTrade payables 254 164Other liabilities to Group companies 34,164 34,260Other liabilities note 19 270 235
Total shareholders' equity and liabilities 76,111 77,023
Assets pledged – –Contingent liabilities note 20 243,887 270,346
161

Cash-flow sTaTemenTSEK M 2012 2011
Operating activitiesOperating income 2,186 766Depreciation and amortization 16 16Other non-cash items note 21 (2,788) 67Total change in working capital whereof 127 (185)
Change in accounts receivable 134 (171)Change in trade payables (61) 188Other changes in working capital 54 (202)
Interest and similar items received 0 0Interest and similar items paid (1,504) (1,672)Other financial items (105) (152)Group contributions received/paid, net note 21 7,085 6,614Income taxes (received) 5 –Cash-flow from operating activities 5,022 5,454
Investing activitiesInvestments in fixed assets (74) (65)Disposals of fixed assets 100 –Shares and participations in Group companies, net note 21 5,097 (93)Shares and participations in non-Group companies, net note 21 (1,098) (508)Cash-flow after net investments 9,047 4,788
Financing activitiesChange in loans, net note 21 (2,964) 281Dividend to AB Volvo's shareholders (6,083) (5,069)Change in liquid funds 0 0
Liquid funds, Beginning of year 0 0
Liquid funds, End of year 0 0
Liquid fundsLiquid funds include cash and bank balances.
FInAnCIAL InFORMATIOn 2012
162

ChanGes in shareholders’ eQuiTyRestricted equity unrestricted equity
SEK MShare
capitalStatutory
reserve
Share premium reserve
Fair value reserve
Retained earnings Total
Total shareholders’
equity
Balance at December 31, 2010 2,554 7,337 190 193 31,579 31,962 41,853
Income for the period – – – – 5,481 5,481 5,481
Other comprehensive incomeAvailable-for-sale investments:
Gain/(loss) at valuation to fair value – – – (159) – (159) (159)Other comprehensive income – – – (159) – (159) (159)
Total income for the period – – – (159) 5,481 5,322 5,322
Transactions with shareholdersDividend to AB Volvo's shareholders – – – – (5,069) (5,069) (5,069)Share-based payments – – 0 – 53 53 53Transactions with shareholders – – 0 – (5,016) (5,016) (5,016)
Balance at December 31, 2011 2,554 7,337 190 34 32,044 32,268 42,159
Income for the period – – – – 5,101 5,101 5,101
Other comprehensive incomeAvailable-for-sale investments:
Gain/(loss) at valuation to fair value – – – (34) – (34) (34)Other comprehensive income – – – (34) – (34) (34)
Total income for the period – – – (34) – 5,067 5,067
Transactions with shareholdersDividend to AB Volvo's shareholders – – – – (6,083) (6,083) (6,083)Share-based payments – – 14 – 80 94 94Transactions with shareholders – – 14 – (6,003) (5,989) (5,989)
Balance at December 31, 2012 2,554 7,337 204 – 31,142 31,346 41,237
Further information regarding the share capital of the Parent Company is shown in note 19 to the consolidated financial statements.
163

Amounts in SEK M unless otherwise specified. The amounts within parentheses refer to the preceding year, 2011.
The Parent Company has prepared its financial statements in accordance with the Swedish Annual Accounts Act (1995:1554) and RFR2, Account-ing for Legal entities. According to RFR2, the Parent Company shall apply all the International Financial Reporting Standards endorsed by the Eu as far as this is possible within the framework of the Swedish Annual Accounts Act.
The accounting principles applied by the Volvo Group are described in note 1 Accounting principles to the consolidated financial statements. The main deviations between the accounting principles applied by the Volvo Group and the Parent Company are described below.
Shares and participations in Group companies are recognized at cost in the Parent Company and test for impairment is performed annually. Divi-dends is recognized in the income statement.
Investments in associated companies are recognized at cost in the Par-ent Company and test for impairment is performed annually. Dividends is recognized in the income statement.
The Parent Company applies the exception in the application of IAS 39 which concerns accounting and measurement of financial contracts of
guarantee in favour of subsidiaries and associated companies. The Parent Company recognizes the financial contracts of guarantee as contingent liabilities.
The Volvo Group applies IAS 19 Employee Benefits in the consolidated financial statements. The Parent Company is applying the principles of FAR's Recommendation RedR4 “Accounting of pension liabilities and pension costs”. Consequently there are differences between the Volvo Group and the Parent Company in the accounting of defined benefit pen-sion plans as well as in the measurement of plan assets invested in the Volvo Pension Foundation.
The Parent Company recognizes the difference between depreciation according to plan and tax depreciation as accumulated additional depre-ciation, included in untaxed reserves.
Reporting of Group contributions is recognized in accordance with the alternative rule in RFR 2. Group contributions are reported as Allocations. Previous year, Group contributions were recognized as Income from investments in Group companies. Comparative figures for 2011 have been adjusted.
ACCOunTInG PRInCIPLESnoTe 1
The Parent Company's net sales amounted to 670 (721), of which 559 (620) pertained to Group companies. Purchases from Group companies amounted to 353 (602).
InTRA-GROuP TRAnSACTIOnSnoTe 2
DepreciationAdministrative expenses include depreciation of 16 (16) of which 1 (0) pertains to machinery and equipment, 1 (1) to buildings and 14 (15) to other intangible assets.
Fees to the auditors 2012 2011
PricewaterhouseCoopers AB– Audit fees 23 17– Audit-related fees 2 1– Tax advisory services 3 0– Other fees 23 –Total 51 18
See Note 28 for the Group for a description of the different categories of fees to the auditors.
PersonnelWages, salaries and other remunerations amounted to 295 (231), social costs to 90 (68) and pension costs to 90 (69). Pension cost of 6 (7) per-tained to Board members and the President. The Parent Company has outstanding pension obligations of 0 (0) to these individuals.
The number of employees at year-end was 258 (181). Information on the average number of employees, wages, salaries and other remunerations including incentive program as well as Board members and senior execu-tives by gender is shown in note 27 to the consolidated financial statements.
ADMInISTRATIVE ExPEnSESnoTe 3
FInAnCIAL InFORMATIOn 2012
164
nOTES TO FInAnCIAL STATEMEnTS

Other operating income and expenses include profit-sharing payments to employees in the amount of 1 (3).
OTHER OPERATInG InCOME AnD ExPEnSESnoTe 4
Income from other investments includes a dividend of 5 (4) from Eicher Motors Ltd,.
InCOME FROM OTHER InVESTMEnTSnoTe 7
Interest income and similar credits amounting to 0 (0) included interest in the amount of 0 (0) from subsidiaries. Interest expenses and similar charges totalling 1,509 (1,677) included interest of 1,504 (1,672) to subsidiaries.
InTEREST InCOME AnD ExPEnSESnoTe 8
Other financial income and expenses include guarantee commissions from subsidiaries, cost for credit facilities, costs for credit rating, financial costs pertaining to changed taxable income previous years and costs for regis-tration of AB Volvos shares.
OTHER FInAnCIAL InCOME AnD ExPEnSESnoTe 9
Group contributions amounted to a net of 5,628 (7,085). Allocation to additional depreciation has been made during the year with 0 (0).
ALLOCATIOnSnoTe 10 Dividend of 35 (24) was received from Volvo Eicher Commercial Vehicles Ltd. Income include write-down of participation in Blue Chip Jet II HB with 19. In 2011 the participations in Blue Chip Jet I HB and Blue Chip Jet II HB affected the income with 5 and 101 respectively.
InCOME FROM InVESTMEnTS In ASSOCIATED COMPAnIESnoTe 6
Income include 2,865 from gain on sale of shares in Volvo Aero AB. Dividends from Group companies amounted to 920 (2,719). Of the dividends, 572 (–) pertain to dividend from Volvo Aero AB, 258 (2,500) from Volvo Construction Equipment nV, 55 (–) from Volvo China Investment Co Ltd, 32 (63) from Volvo norge AS and – (156) from Volvo East Asia Ltd. The shares in Volvo Italia SpA were written down by 110 (60).
Transfer price adjustments and royalties amount to an expense of 524 (1,000).
InCOME FROM InVESTMEnTS In GROuP COMPAnIESnoTe 5
165
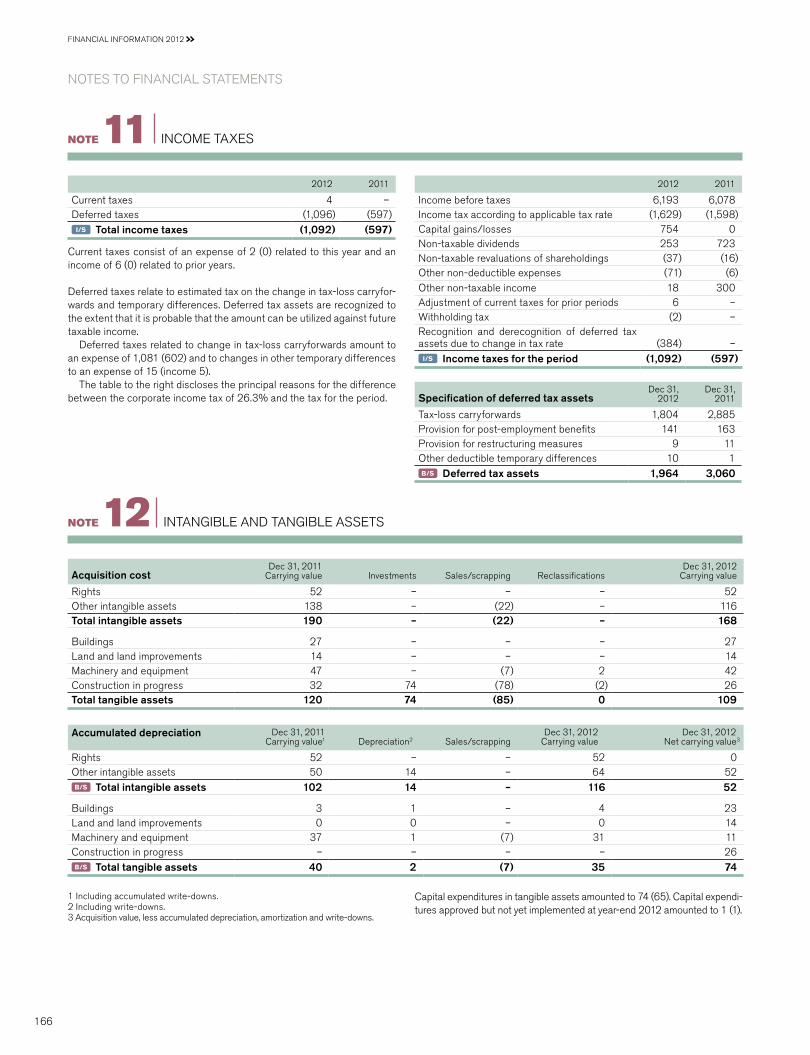
2012 2011
Current taxes 4 –Deferred taxes (1,096) (597)
I/S Total income taxes (1,092) (597)
Current taxes consist of an expense of 2 (0) related to this year and an income of 6 (0) related to prior years.
Deferred taxes relate to estimated tax on the change in tax-loss carryfor-wards and temporary differences. Deferred tax assets are recognized to the extent that it is probable that the amount can be utilized against future taxable income.
Deferred taxes related to change in tax-loss carryforwards amount to an expense of 1,081 (602) and to changes in other temporary differences to an expense of 15 (income 5).
The table to the right discloses the principal reasons for the difference between the corporate income tax of 26.3% and the tax for the period.
2012 2011
Income before taxes 6,193 6,078Income tax according to applicable tax rate (1,629) (1,598)Capital gains/losses 754 0non-taxable dividends 253 723non-taxable revaluations of shareholdings (37) (16)Other non-deductible expenses (71) (6)Other non-taxable income 18 300Adjustment of current taxes for prior periods 6 –Withholding tax (2) –Recognition and derecognition of deferred tax assets due to change in tax rate (384) –
I/S Income taxes for the period (1,092) (597)
Specification of deferred tax assetsDec 31,
2012Dec 31,
2011
Tax-loss carryforwards 1,804 2,885Provision for post-employment benefits 141 163Provision for restructuring measures 9 11Other deductible temporary differences 10 1B/S Deferred tax assets 1,964 3,060
InCOME TAxESnoTe 11
Acquisition costDec 31, 2011
Carrying value Investments Sales/scrapping ReclassificationsDec 31, 2012
Carrying value
Rights 52 – – – 52Other intangible assets 138 – (22) – 116Total intangible assets 190 – (22) – 168
Buildings 27 – – – 27Land and land improvements 14 – – – 14Machinery and equipment 47 – (7) 2 42Construction in progress 32 74 (78) (2) 26Total tangible assets 120 74 (85) 0 109
Accumulated depreciation Dec 31, 2011Carrying value1 Depreciation2 Sales/scrapping
Dec 31, 2012Carrying value
Dec 31, 2012net carrying value3
Rights 52 – – 52 0Other intangible assets 50 14 – 64 52B/S Total intangible assets 102 14 – 116 52
Buildings 3 1 – 4 23Land and land improvements 0 0 – 0 14Machinery and equipment 37 1 (7) 31 11Construction in progress – – – – 26B/S Total tangible assets 40 2 (7) 35 74
1 Including accumulated write-downs.2 Including write-downs.3 Acquisition value, less accumulated depreciation, amortization and write-downs.
Capital expenditures in tangible assets amounted to 74 (65). Capital expendi-tures approved but not yet implemented at year-end 2012 amounted to 1 (1).
InTAnGIBLE AnD TAnGIBLE ASSETSnoTe 12
FInAnCIAL InFORMATIOn 2012
166
nOTES TO FInAnCIAL STATEMEnTS

Holdings of shares and participations are specified in AB Volvo’s holding of shares. Changes in holdings of shares and participations are disclosed below.
Group companies Associated companies non-Group companies
2012 2011 2012 2011 2012 2011
Balance sheet. December 31, previous year 59,460 59,429 2,401 1,790 552 708Acquisitions/new issue of shares – 94 1,107 505 – 3Divestments (2,885) (3) – – (6) –Write-downs/participations in partnerships (110) (60) (31) 106 – –Revaluation of shares in listed companies – – – – (34) (159)Reclassifications 367 – (103) – (264) –B/S Balance sheet, December 31 56,832 59,460 3,374 2,401 248 552
InVESTMEnTS In SHARES AnD PARTICIPATIOnSnoTe 13
Shares and participations in Group companiesDuring 2012 AB Volvo divested the total shares in Volvo Aero AB with a carrying value of 2,885.
At year end the holding of shares in Volvo Italia SpA was written down by 110 (60).
During 2011 AB Volvo acquired the total shares in VFS Latvia SIA of 9. Shares were also acquired in Volvo Lastvagnar AB, Volvo Bussar AB and AB Volvo Penta amounting to a total of 85 from Volvo Italia SpA. AB Volvo now owns the companies by 100%.
Investment in associated companiesDuring 2012 AB Volvo acquired additional shares in the listed company Deutz AG amounting to 1,107. The previous holding is reclassified to investments in associated companies. Total holding as of December 31, 2012 amounts to 25%. Write-down of the participation in Blue Chip Jet II HB was recognized by 19.
During 2011 AB Volvo acquired 49% of the holding in CPAC Systems AB from Volvo Group Venture Capital AB (previously Volvo Technology
Transfer AB) by 367. In 2012 the holding was reclassified to shares in Group companies. During 2011 AB Volvo paid a capital contribution of 137 to Blue Chip Jet II HB. The carrying value of the participations in the part-nerships Blue Chip Jet I HB and Blue Chip Jet II HB increased during the year by a net of 106.
Shares and participations in non-Group companiesIn connection with reclassification of the holding in Deutz AG to associated company, the previously recognized revaluations were reversed by 34, rec-ognized in other comprehensive income (previous year a decrease by 159).
Investment in associated companies and other shares and participations include the direct and indirect holdings of Volvo Eicher Commercial Vehicles Ltd. (VECV) amounting to 1,848. In the consolidated accounts of the Volvo group, VECV is reported as a joint venture and consolidated according to the proportionate method. The indirect ownership is an effect of the acqui-sition of 8.1% of Eicher Motors Ltd., which is the other venturer of VECV. These shares are not separately measured as they form a part of the in direct ownership in VECV.
Dec 31, 2012
Dec 31, 2011
Accounts receivable 45 46Prepaid expenses and accrued income 339 268Other receivables 694 187B/S Total 1,078 501
The valuation allowance for doubtful receivables amounted to 3 (3) at the end of the year.
OTHER RECEIVABLESnoTe 14
Dec 31, 2012 Dec 31, 2011
Accumulated additional depreciationLand 3 3Machinery and equipment 1 1
B/S Total 4 4
unTAxED RESERVESnoTe 15
167
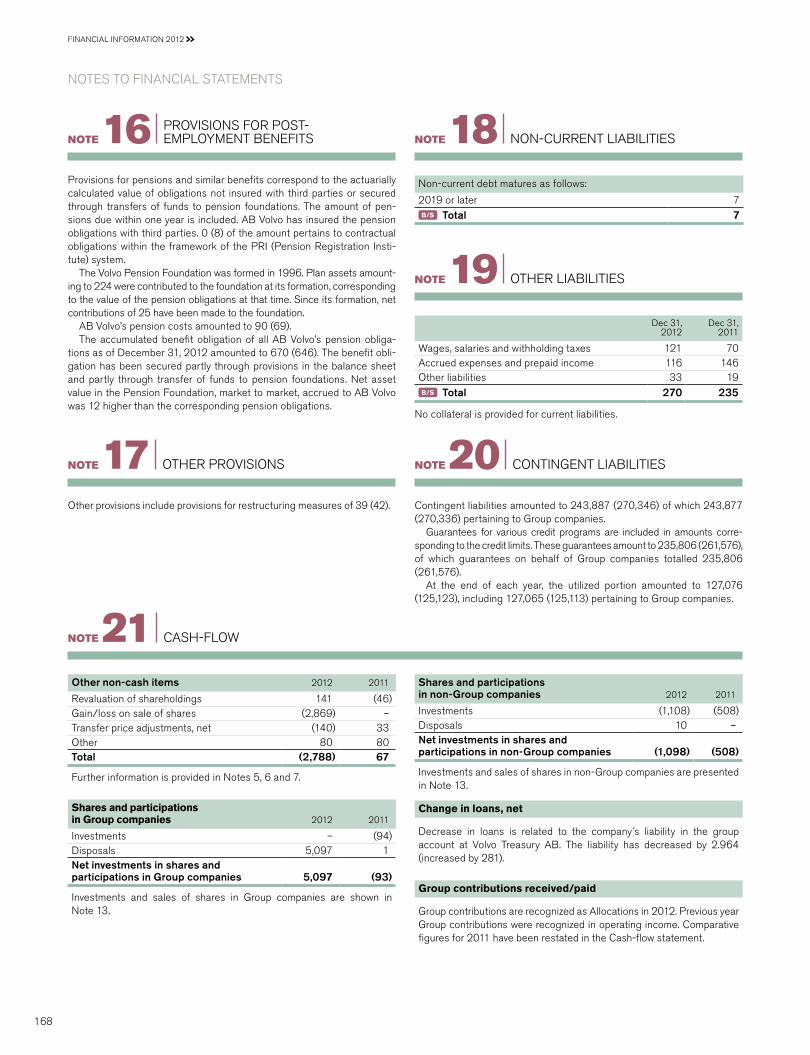
Provisions for pensions and similar benefits correspond to the actuarially calculated value of obligations not insured with third parties or secured through transfers of funds to pension foundations. The amount of pen-sions due within one year is included. AB Volvo has insured the pension obligations with third parties. 0 (8) of the amount pertains to contractual obligations within the framework of the PRI (Pension Registration Insti-tute) system.
The Volvo Pension Foundation was formed in 1996. Plan assets amount-ing to 224 were contributed to the foundation at its formation, corresponding to the value of the pension obligations at that time. Since its formation, net contributions of 25 have been made to the foundation.
AB Volvo’s pension costs amounted to 90 (69).The accumulated benefit obligation of all AB Volvo’s pension obliga-
tions as of December 31, 2012 amounted to 670 (646). The benefit obli-gation has been secured partly through provisions in the balance sheet and partly through transfer of funds to pension foundations. net asset value in the Pension Foundation, market to market, accrued to AB Volvo was 12 higher than the corresponding pension obligations.
PROVISIOnS FOR POST- EMPLOyMEnT BEnEFITSnoTe 16
non-current debt matures as follows:
2019 or later 7B/S Total 7
nOn-CuRREnT LIABILITIESnoTe 18
Dec 31, 2012
Dec 31, 2011
Wages, salaries and withholding taxes 121 70Accrued expenses and prepaid income 116 146Other liabilities 33 19B/S Total 270 235
no collateral is provided for current liabilities.
OTHER LIABILITIESnoTe 19
Contingent liabilities amounted to 243,887 (270,346) of which 243,877 (270,336) pertaining to Group companies.
Guarantees for various credit programs are included in amounts corre-sponding to the credit limits. These guarantees amount to 235,806 (261,576), of which guarantees on behalf of Group companies totalled 235,806 (261,576).
At the end of each year, the utilized portion amounted to 127,076 (125,123), including 127,065 (125,113) pertaining to Group companies.
COnTInGEnT LIABILITIESnoTe 20 Other provisions include provisions for restructuring measures of 39 (42).
OTHER PROVISIOnSnoTe 17
Other non-cash items 2012 2011
Revaluation of shareholdings 141 (46)Gain/loss on sale of shares (2,869) –Transfer price adjustments, net (140) 33Other 80 80Total (2,788) 67
Further information is provided in notes 5, 6 and 7.
Shares and participations in non-Group companies 2012 2011
Investments (1,108) (508)Disposals 10 –Net investments in shares and participations in non-Group companies (1,098) (508)
Investments and sales of shares in non-Group companies are presented in note 13.
Change in loans, net
Decrease in loans is related to the company´s liability in the group account at Volvo Treasury AB. The liability has decreased by 2.964 (increased by 281).
Group contributions received/paid
Group contributions are recognized as Allocations in 2012. Previous year Group contributions were recognized in operating income. Comparative figures for 2011 have been restated in the Cash-flow statement.
Shares and participations in Group companies 2012 2011
Investments – (94)Disposals 5,097 1Net investments in shares and participations in Group companies 5,097 (93)
Investments and sales of shares in Group companies are shown in note 13.
CASH-FLOWnoTe 21
FInAnCIAL InFORMATIOn 2012
168
nOTES TO FInAnCIAL STATEMEnTS

AB Volvo’s Holding of Shares
AB Volvo’s holding of sharesin non-Group companies1
Dec 31, 2012 Dec 31, 2012 Dec 31, 2011
Registrationnumber
Percentage holding2
Carrying value Carrying value
Deutz AG, Germany – 25 1,359 299Blue Chip Jet II HB, Sweden 969717–2105 50 386 405Blue Chip Jet HB, Sweden 969639–1011 50 8 8Other investments – 21 25Total carrying value, non-Group companies 1,774 737
1 AB Volvo's Volvo's investments in associated companies and other shares and participations include the direct and indirect holdings of VE Commercial Vehicles (VECV). AB Volvo's direct equity holding is 45.6% and indirect equity holding is 4.6% in VECV amount to 1,848 (1,848). In the consolidated accounts of the Volvo Group, VECV is reported as a joint venture, consolidated according to the proportionate method, and accordingly included in the table for group companies below.
2 Percentage figures refer to share capital as well as voting rights.
AB Volvo’s holding of shares in major subsidiaries
Dec 31, 2012 Dec 31, 2012 Dec 31, 2011
Registrationnumber
Percentageholding1
Carrying value2 Carrying value
Volvo Lastvagnar AB, Sweden 556013-9700 100 8,711 8,711Volvo Truck Center Sweden AB, Sweden 556072-7777 100 – –Volvo Finland AB, Finland – 100 – –Volvo Group Belgium nV, Belgium – 100 – –Volvo Group uKLtd, Great Britain – 100 – –Volvo India Ltd, India – 100 – –
Volvo Holding Sverige AB, Sweden 556539-9853 100 7,634 7,634BRS Ltd, Great Britain – 100 – –Volvo Construction Equipment north America, Canada – 100 – –Volvo Polska Sp. O.O., Poland – 100 – –Volvo (Southern Africa) Pty Ltd, South Africa – 100 – –Volvo do Brasil Veiculos Ltda, Brazil – 100 – –Banco Volvo (Brasil) SA, Brazil – 100 – –Volvo Group Canada Inc., Canada – 100 – –Prévost Car Inc, Canada – 100 – –Volvo Group Australia Pty Ltd, Australia – 100 – –Volvo Group Automotive Ticaret, Ltd, Sirketi, Turkey3 – 100 – –
Volvo Holding France SA, France – 100 – –Volvo Trucks France s.a.s., France – 100 – –Volvo Compact Equipment s.a.s., France – 100 – –Volvo CE Europe s.a.s., France – 100 – –VFS Finance France s.a.s., France – 100 – –VFS Location France s.a.s., France – 100 – –
169
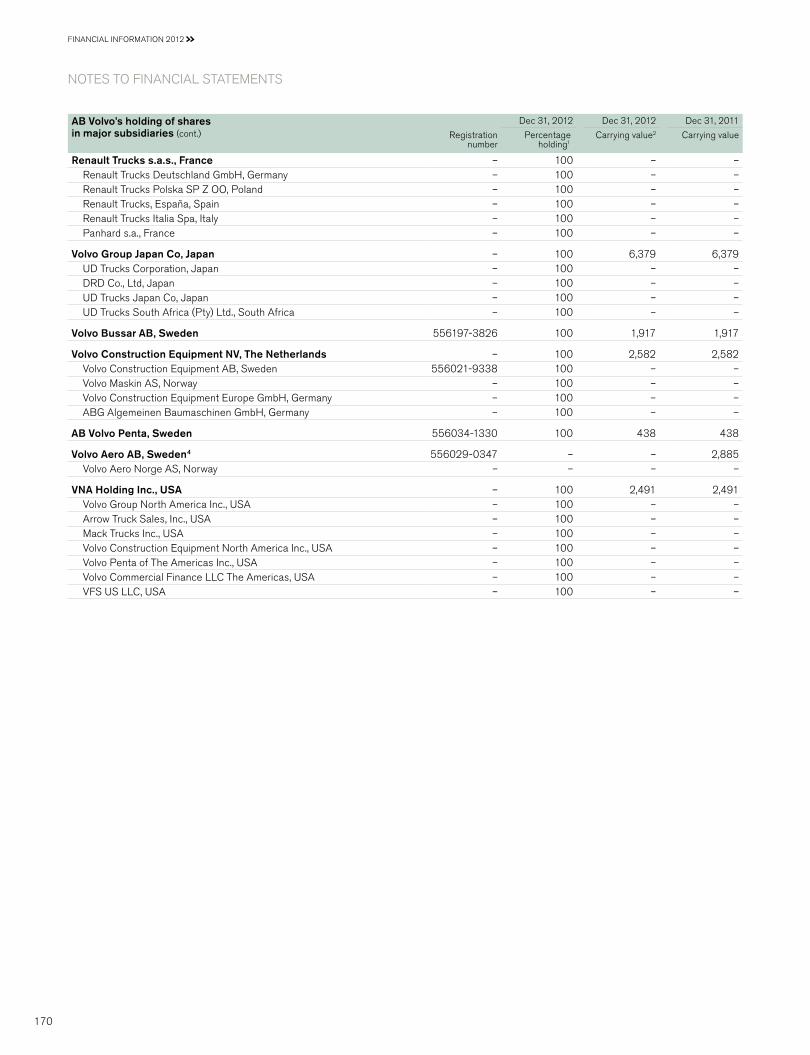
AB Volvo’s holding of shares in major subsidiaries (cont.)
Dec 31, 2012 Dec 31, 2012 Dec 31, 2011
Registrationnumber
Percentageholding1
Carrying value2 Carrying value
Renault Trucks s.a.s., France – 100 – –Renault Trucks Deutschland GmbH, Germany – 100 – –Renault Trucks Polska SP Z OO, Poland – 100 – –Renault Trucks, España, Spain – 100 – –Renault Trucks Italia Spa, Italy – 100 – –Panhard s.a., France – 100 – –
Volvo Group Japan Co, Japan – 100 6,379 6,379uD Trucks Corporation, Japan – 100 – –DRD Co., Ltd, Japan – 100 – –uD Trucks Japan Co, Japan – 100 – –uD Trucks South Africa (Pty) Ltd., South Africa – 100 – –
Volvo Bussar AB, Sweden 556197-3826 100 1,917 1,917
Volvo Construction Equipment NV, The Netherlands – 100 2,582 2,582Volvo Construction Equipment AB, Sweden 556021-9338 100 – –Volvo Maskin AS, norway – 100 – –Volvo Construction Equipment Europe GmbH, Germany – 100 – –ABG Algemeinen Baumaschinen GmbH, Germany – 100 – –
AB Volvo Penta, Sweden 556034-1330 100 438 438
Volvo Aero AB, Sweden4 556029-0347 – – 2,885Volvo Aero norge AS, norway – – – –
VNA Holding Inc., USA – 100 2,491 2,491Volvo Group north America Inc., uSA – 100 – –Arrow Truck Sales, Inc., uSA – 100 – –Mack Trucks Inc., uSA – 100 – –Volvo Construction Equipment north America Inc., uSA – 100 – –Volvo Penta of The Americas Inc., uSA – 100 – –Volvo Commercial Finance LLC The Americas, uSA – 100 – –VFS uS LLC, uSA – 100 – –
FInAnCIAL InFORMATIOn 2012
170
nOTES TO FInAnCIAL STATEMEnTS

AB Volvo’s holding of shares in major subsidiaries (cont.)
Dec 31, 2012 Dec 31, 2012 Dec 31, 2011
Registrationnumber
Percentageholding1
Carrying value2 Carrying value
Volvo Financial Services AB, Sweden 556000-5406 100 1,945 1,945VFS International AB, Sweden 556316-6064 100 – –VFS nordic AB, Sweden 556579-1778 100 – –VFS Financial Services BV, The netherlands – 100 – –VFS Financial Services Belgium nV, Belgium – 100 – –VFS Financial Services (uK) Ltd, Great Britain – 100 – –VFS Deutschland GmbH, Germany – 100 – –VFS Financial Services Spain EFC, SA, Spain – 100 – –Volvo Finance (Suisse) SA, Switzerland – 100 – –VFS Vostok, Russia – 100 – –VFS Romania, Romania – 100 – –VFS Canada Inc, Canada – 100 – –
VE Commercial Vehicles, Ltd, India5, 6 – 50 – –Volvo Treasury AB, Sweden 556135-4449 100 13,044 13,044Sotrof AB, Sweden 556519-4494 100 1,388 1,388
Volvo Group Real Estate AB, Sweden 556006-8313 100 – –Volvo Korea Holding AB, Sweden 556531-8572 100 2,655 2,655
Volvo Group Korea Co Ltd, South Korea – 100 – –Volvo China Investment Co Ltd, China – 100 1,096 1,096
Shanghai Sunwin Bus Co, China 5 – 50 – –Shandong Lingong Construction Machinery, China – 70 – –
Volvo Automotive Finance (China) Ltd, China – 100 491 491Volvo Group uK Ltd, Great Britain7 – 100 413 413Volvo Holding Mexico, Mexico – 100 531 531Volvo Group Venture Capital AB, Sweden 556542-4370 100 361 361Volvo Powertrain AB, Sweden 556000-0753 100 498 498Volvo Information Technology AB, Sweden 556103-2698 100 663 663Volvo Parts AB, Sweden 556365-9746 100 200 200Volvo Group Insurance Försäkrings AB, Sweden 516401-8037 100 182 182Volvo Business Services AB, Sweden 556029-5197 100 107 107Volvo Danmark Holding AS, Denmark – 100 104 104VFS Servizi Financiari Spa, Italy8 – 100 79 79Kommersiella Fordon Europa AB, Sweden 556049-3388 100 1,890 1,890Volvo norge AS, norway – 100 56 56Volvo Malaysia Sdn, Malaysia – 100 48 48ZAO Volvo Vostok, Russia9 – 100 34 34Volvo Italia Spa, Italy – 100 386 496CPAC Systems AB, Sweden10 556566-2870 100 367 –Volvo Logistics AB, Sweden 556197-9732 100 85 85Rossareds Fastighets AB, Sweden 556009-1190 100 26 26Alviva AB, Sweden 556622-8820 100 5 5Volvo East Asia (Pte) Ltd, Singapore – 100 9 9Volvo Information Technology GB Ltd, Great Britain – 100 3 3VFS Latvia SIA, Latvia – 100 9 9Other holdings – 100 5 5B/S Total carrying value Group companies11 56,832 59,460
1 Total percentage holding in the Volvo Group.2 Carrying value of the percentage holding in the Parent company.3 Total holding by Volvo Holding Sverige and Volvo Lastvagnar is 100%. 4 Volvo Aero AB was divested during October 2012.5 Joint venture, reported in accordance with the proportionate consolidation method in Volvo's consolidated accounts. 6 AB Volvo's investments in associated companies and other shares and participations include the direct and indirect holdings of VE Commercial Vehicles
(VECV). AB Volvo's direct equity holding is 45,6% and indirect equity holding is 4,6% in VECV amount to 1,848 (1,848). In the consolidated accounts of the Volvo Group, VECV is reported as a joint venture, consolidated according to the proportionate method, and accordingly included in the table for group companies above.
7 Total holding by Volvo Lastvagnar AB and AB Volvo is 100%.8 Total holding by Volvo Italia and AB Volvo is 100%.9 Total holding by AB Volvo and Volvo Trucks Region Central Europe is 100%.10 The total holding of AB Volvo and AB Volvo Penta is 100%. The company was reclassified to group company in 2012.11 AB Volvo’s share of shareholders’ equity in subsidiaries (including equity in untaxed reserves) was 100,326 (99.139). 171
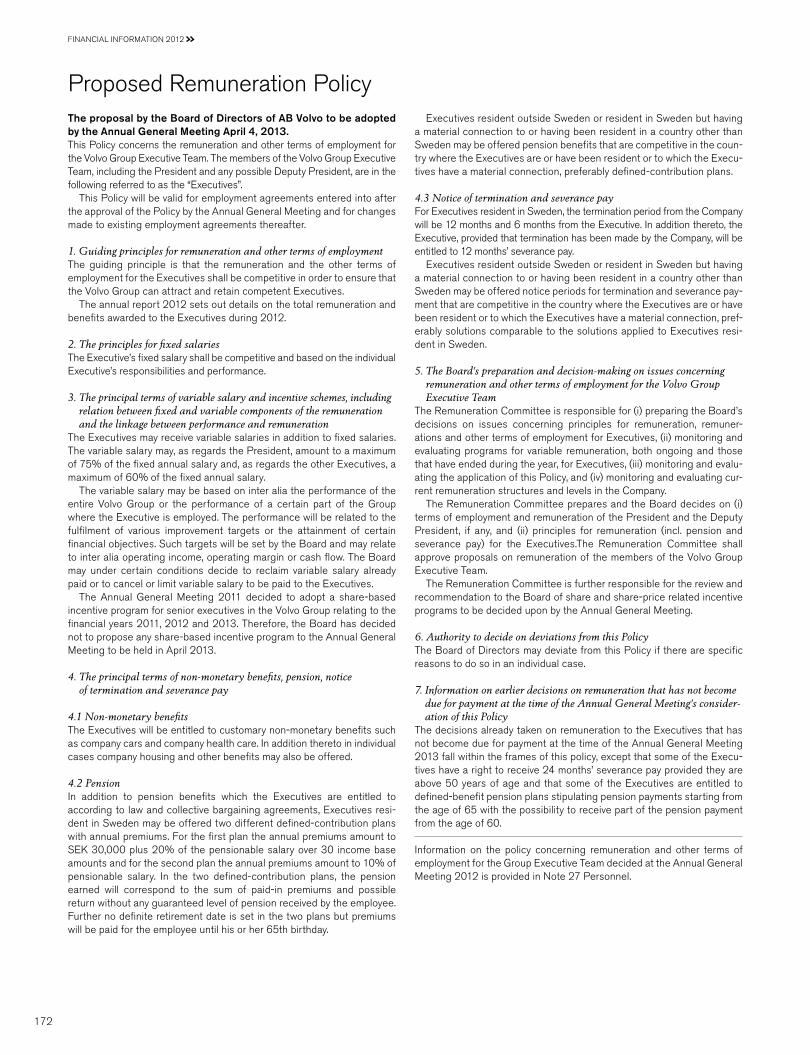
The proposal by the Board of Directors of AB Volvo to be adopted by the Annual General Meeting April 4, 2013. This Policy concerns the remuneration and other terms of employment for the Volvo Group Executive Team. The members of the Volvo Group Executive Team, including the President and any possible Deputy President, are in the following referred to as the “Executives”.
This Policy will be valid for employment agreements entered into after the approval of the Policy by the Annual General Meeting and for changes made to existing employment agreements thereafter.
1. Guiding principles for remuneration and other terms of employmentThe guiding principle is that the remuneration and the other terms of employment for the Executives shall be competitive in order to ensure that the Volvo Group can attract and retain competent Executives.
The annual report 2012 sets out details on the total remuneration and benefits awarded to the Executives during 2012.
2. The principles for fixed salariesThe Executive’s fixed salary shall be competitive and based on the individual Executive’s responsibilities and performance.
3. The principal terms of variable salary and incentive schemes, including relation between fixed and variable components of the remuneration and the linkage between performance and remuneration
The Executives may receive variable salaries in addition to fixed salaries. The variable salary may, as regards the President, amount to a maximum of 75% of the fixed annual salary and, as regards the other Executives, a maximum of 60% of the fixed annual salary.
The variable salary may be based on inter alia the performance of the entire Volvo Group or the performance of a certain part of the Group where the Executive is employed. The performance will be related to the fulfilment of various improvement targets or the attainment of certain financial objectives. Such targets will be set by the Board and may relate to inter alia operating income, operating margin or cash flow. The Board may under certain conditions decide to reclaim variable salary already paid or to cancel or limit variable salary to be paid to the Executives.
The Annual General Meeting 2011 decided to adopt a share-based incentive program for senior executives in the Volvo Group relating to the financial years 2011, 2012 and 2013. Therefore, the Board has decided not to propose any share-based incentive program to the Annual General Meeting to be held in April 2013.
4. The principal terms of non-monetary benefits, pension, notice of termination and severance pay
4.1 Non-monetary benefitsThe Executives will be entitled to customary non-monetary benefits such as company cars and company health care. In addition thereto in individual cases company housing and other benefits may also be offered.
4.2 PensionIn addition to pension benefits which the Executives are entitled to according to law and collective bargaining agreements, Executives resi-dent in Sweden may be offered two different defined-contribution plans with annual premiums. For the first plan the annual premiums amount to SEK 30,000 plus 20% of the pensionable salary over 30 income base amounts and for the second plan the annual premiums amount to 10% of pensionable salary. In the two defined-contribution plans, the pension earned will correspond to the sum of paid-in premiums and possible return without any guaranteed level of pension received by the employee. Further no definite retirement date is set in the two plans but premiums will be paid for the employee until his or her 65th birthday.
Executives resident outside Sweden or resident in Sweden but having a material connection to or having been resident in a country other than Sweden may be offered pension benefits that are competitive in the coun-try where the Executives are or have been resident or to which the Execu-tives have a material connection, preferably defined-contribution plans.
4.3 Notice of termination and severance payFor Executives resident in Sweden, the termination period from the Company will be 12 months and 6 months from the Executive. In addition thereto, the Executive, provided that termination has been made by the Company, will be entitled to 12 months’ severance pay.
Executives resident outside Sweden or resident in Sweden but having a material connection to or having been resident in a country other than Sweden may be offered notice periods for termination and severance pay-ment that are competitive in the country where the Executives are or have been resident or to which the Executives have a material connection, pref-erably solutions comparable to the solutions applied to Executives resi-dent in Sweden.
5. The Board’s preparation and decision-making on issues concerning remuneration and other terms of employment for the Volvo Group Executive Team
The Remuneration Committee is responsible for (i) preparing the Board’s decisions on issues concerning principles for remuneration, remuner-ations and other terms of employment for Executives, (ii) monitoring and evaluating programs for variable remuneration, both ongoing and those that have ended during the year, for Executives, (iii) monitoring and evalu-ating the application of this Policy, and (iv) monitoring and evaluating cur-rent remuneration structures and levels in the Company.
The Remuneration Committee prepares and the Board decides on (i) terms of employment and remuneration of the President and the Deputy President, if any, and (ii) principles for remuneration (incl. pension and severance pay) for the Executives.The Remuneration Committee shall approve proposals on remuneration of the members of the Volvo Group Executive Team.
The Remuneration Committee is further responsible for the review and recommendation to the Board of share and share-price related incentive programs to be decided upon by the Annual General Meeting.
6. Authority to decide on deviations from this PolicyThe Board of Directors may deviate from this Policy if there are specific reasons to do so in an individual case.
7. Information on earlier decisions on remuneration that has not become due for payment at the time of the Annual General Meeting’s consider-ation of this Policy
The decisions already taken on remuneration to the Executives that has not become due for payment at the time of the Annual General Meeting 2013 fall within the frames of this policy, except that some of the Execu-tives have a right to receive 24 months’ severance pay provided they are above 50 years of age and that some of the Executives are entitled to defined-benefit pension plans stipulating pension payments starting from the age of 65 with the possibility to receive part of the pension payment from the age of 60.
Information on the policy concerning remuneration and other terms of employment for the Group Executive Team decided at the Annual General Meeting 2012 is provided in note 27 Personnel.
Proposed Remuneration Policy
FInAnCIAL InFORMATIOn 2012
172
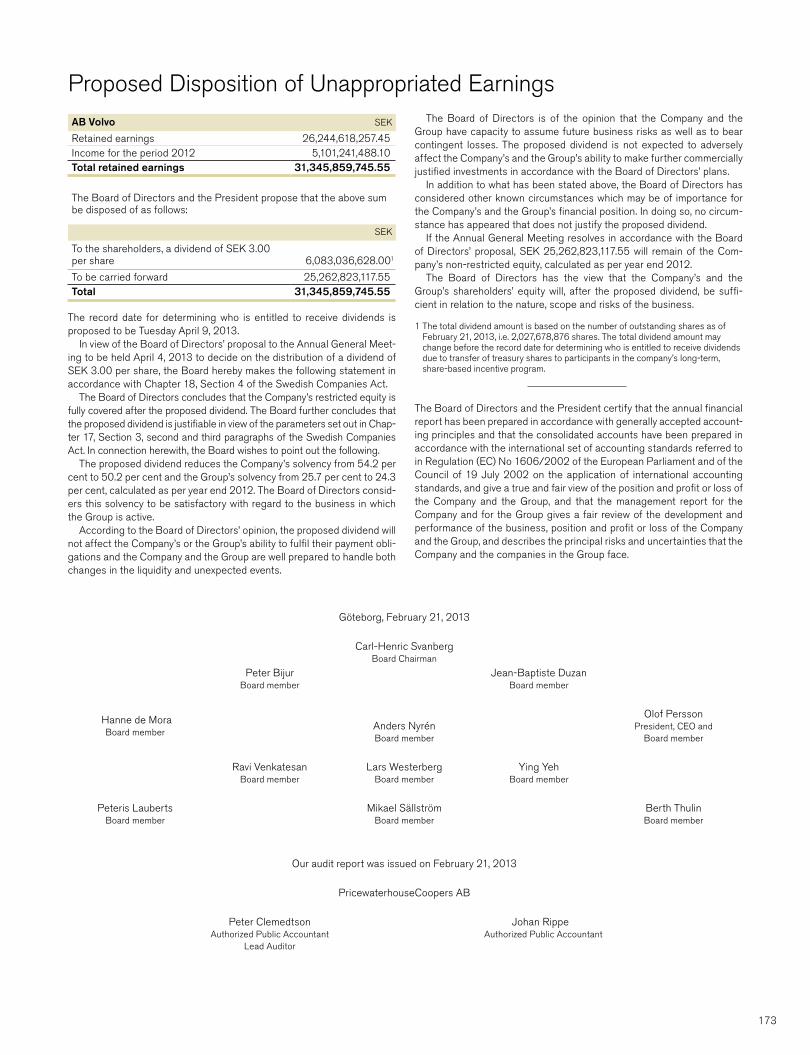
AB Volvo SEK
Retained earnings 26,244,618,257.45Income for the period 2012 5,101,241,488.10Total retained earnings 31,345,859,745.55
The Board of Directors and the President propose that the above sum be disposed of as follows:
SEK
To the shareholders, a dividend of SEK 3.00 per share 6,083,036,628.001
To be carried forward 25,262,823,117.55Total 31,345,859,745.55
Proposed Disposition of unappropriated EarningsThe Board of Directors is of the opinion that the Company and the
Group have capacity to assume future business risks as well as to bear contingent losses. The proposed dividend is not expected to adversely affect the Company’s and the Group’s ability to make further commercially justified investments in accordance with the Board of Directors’ plans.
In addition to what has been stated above, the Board of Directors has considered other known circumstances which may be of importance for the Company’s and the Group’s financial position. In doing so, no circum-stance has appeared that does not justify the proposed dividend.
If the Annual General Meeting resolves in accordance with the Board of Directors’ proposal, SEK 25,262,823,117.55 will remain of the Com-pany’s non-restricted equity, calculated as per year end 2012.
The Board of Directors has the view that the Company’s and the Group’s shareholders’ equity will, after the proposed dividend, be suffi-cient in relation to the nature, scope and risks of the business.
1 The total dividend amount is based on the number of outstanding shares as of February 21, 2013, i.e. 2,027,678,876 shares. The total dividend amount may change before the record date for determining who is entitled to receive dividends due to transfer of treasury shares to participants in the company’s long-term, share-based incentive program.
The Board of Directors and the President certify that the annual financial report has been prepared in accordance with generally accepted account-ing principles and that the consolidated accounts have been prepared in accordance with the international set of accounting standards referred to in Regulation (EC) no 1606/2002 of the European Parliament and of the Council of 19 July 2002 on the application of international accounting standards, and give a true and fair view of the position and profit or loss of the Company and the Group, and that the management report for the Company and for the Group gives a fair review of the development and performance of the business, position and profit or loss of the Company and the Group, and describes the principal risks and uncertainties that the Company and the companies in the Group face.
Göteborg, February 21, 2013
Carl-Henric SvanbergBoard Chairman
Peter BijurBoard member
Jean-Baptiste DuzanBoard member
Hanne de MoraBoard member
Anders nyrénBoard member
Olof PerssonPresident, CEO and
Board member
Ravi VenkatesanBoard member
Lars Westerberg Board member
ying yehBoard member
Peteris LaubertsBoard member
Mikael SällströmBoard member
Berth ThulinBoard member
Our audit report was issued on February 21, 2013
PricewaterhouseCoopers AB
Peter ClemedtsonAuthorized Public Accountant
Lead Auditor
Johan RippeAuthorized Public Accountant
The record date for determining who is entitled to receive dividends is proposed to be Tuesday April 9, 2013.
In view of the Board of Directors’ proposal to the Annual General Meet-ing to be held April 4, 2013 to decide on the distribution of a dividend of SEK 3.00 per share, the Board hereby makes the following statement in accordance with Chapter 18, Section 4 of the Swedish Companies Act.
The Board of Directors concludes that the Company’s restricted equity is fully covered after the proposed dividend. The Board further concludes that the proposed dividend is justifiable in view of the parameters set out in Chap-ter 17, Section 3, second and third paragraphs of the Swedish Companies Act. In connection herewith, the Board wishes to point out the following.
The proposed dividend reduces the Company’s solvency from 54.2 per cent to 50.2 per cent and the Group’s solvency from 25.7 per cent to 24.3 per cent, calculated as per year end 2012. The Board of Directors consid-ers this solvency to be satisfactory with regard to the business in which the Group is active.
According to the Board of Directors’ opinion, the proposed dividend will not affect the Company’s or the Group’s ability to fulfil their payment obli-gations and the Company and the Group are well prepared to handle both changes in the liquidity and unexpected events.
173

Audit Report for AB VolvoTo the annual meeting of the shareholders of AB Volvo, corporate identity number 556012-5790
Report on the annual accounts and consolidated accountsWe have audited the annual accounts and consolidated accounts of AB Volvo for the year 2012. The annual accounts and consolidated accounts of the company are included in the printed version of this document on pages 56-73 and 89-173.
Responsibilities of the Board of Directors and the President for the annual accounts and consolidated accounts The Board of Directors and the President are responsible for the preparation and fair presentation of these annual accounts and consolidated accounts in accordance with IFRS, as adopted by the Eu, and the Annual Accounts Act, and for such internal control as the Board of Directors and the President determine is necessary to enable the preparation of annual accounts and consolidated accounts that are free from material misstatement, whether due to fraud or error.
Auditor’s responsibility Our responsibility is to express an opinion on these annual accounts and consolidated accounts based on our audit. We conducted our audit in accordance with International Standards on Auditing and generally accepted auditing standards in Sweden. Those standards require that we comply with ethical requirements and plan and perform the audit to obtain reasonable assurance about whether the annual accounts and consolidated accounts are free from material misstatement.
An audit involves performing procedures to obtain audit evidence about the amounts and disclosures in the annual accounts and consolidated accounts. The procedures selected depend on the auditor’s judgement, including the assessment of the risks of material misstatement of the annual accounts and consolidated accounts, whether due to fraud or error. In mak-ing those risk assessments, the auditor considers internal control relevant to the company’s preparation and fair presentation of the annual accounts and consolidated accounts in order to design audit procedures that are appropri-ate in the circumstances, but not for the purpose of expressing an opinion on the effectiveness of the company’s internal control. An audit also includes evaluating the appropriateness of accounting policies used and the reason-ableness of accounting estimates made by the Board of Directors and the President, as well as evaluating the overall presentation of the annual accounts and consolidated accounts.
We believe that the audit evidence we have obtained is sufficient and appropriate to provide a basis for our audit opinion.
OpinionsIn our opinion, the annual accounts have been prepared in accordance with the Annual Accounts Act and present fairly, in all material respects, the financial position of the parent company as of 31 December 2012 and of
its financial performance and its cash flows for the year then ended in accordance with the Annual Accounts Act. The consolidated accounts have been prepared in accordance with the Annual Accounts Act and pre-sent fairly, in all material respects, the financial position of the group as of 31 December 2012 and of their financial performance and cash flows for the year then ended in accordance with IFRS, as adopted by the Eu, and the Annual Accounts Act. The statutory administration report is consistent with the other parts of the annual accounts and consolidated accounts.
We therefore recommend that the annual meeting of shareholders adopt the income statement and balance sheet for the parent company and the group.
Report on other legal and regulatory requirements In addition to our audit of the annual accounts and consolidated accounts, we have also audited the proposed appropriations of the company’s profit or loss and the administration of the Board of Directors and the President of AB Volvo for the year 2012.
Responsibilities of the Board of Directors and the President The Board of Directors is responsible for the proposal for appropriations of the company’s profit or loss, and the Board of Directors and the President are responsible for administration under the Companies Act.
Auditor’s responsibility Our responsibility is to express an opinion with reasonable assurance on the proposed appropriations of the company’s profit or loss and on the administration based on our audit. We conducted the audit in accordance with generally accepted auditing standards in Sweden.
As a basis for our opinion on the Board of Directors’ proposed appropria-tions of the company’s profit or loss, we examined the Board of Directors’ reasoned statement and a selection of supporting evidence in order to be able to assess whether the proposal is in accordance with the Companies Act.
As a basis for our opinion concerning discharge from liability, in addition to our audit of the annual accounts and consolidated accounts, we examined significant decisions, actions taken and circumstances of the company in order to determine whether any member of the Board of Directors or the President is liable to the company. We also examined whether any member of the Board of Directors or the President has, in any other way, acted in contravention of the Companies Act, the Annual Accounts Act or the Articles of Association.
We believe that the audit evidence we have obtained is sufficient and appropriate to provide a basis for our opinions.
OpinionsWe recommend to the annual meeting of shareholders that the profit be appropriated in accordance with the proposal in the statutory administration report and that the members of the Board of Directors and the President be discharged from liability for the financial year.
Göteborg February 21, 2013
PricewaterhouseCoopers AB
Peter ClemedtsonAuthorized Public Accountant
Lead Partner
Johan RippeAuthorized Public Accountant
Partner
FInAnCIAL InFORMATIOn 2012
174

Eleven-year Summary
The eleven-year summary presents each year in accordance with the Generally Accepted Accounting Practice (GAAP) for that year. Earlier years are not restated when new accounting standards are applied. The years 2001–2003 are accounted for in accordance with Swedish GAAP for the respective year. As from 2004 the reporting is based on IFRS. The transition to IFRS is described in note 3 in the 2005 and 2006 Annual
Reports. As from January 1, 2007, the benefits from the synergies created in the business units are transferred back to the product areas. Also, as from January 1, 2007, the responsibility for the Group’s treasury operations and real estate has been transferred from Volvo Financial Services, which, as from January 1, 2007, only are consolidated in accordance with the purchase method. Comparison figures for 2006 have been recalculated.
Consolidated income statements
SEK M 2012 2011 2010 2009 2008 2007 2006 2005 2004 2003 2002
Net sales 303,647 310,367 264,749 218,361 303,667 285,405 258,835 240,559 211,076 183,291 186,198Cost of sales (235,085) (235,104) (201,797) (186,167) (237,578) (219,600) (199,054) (186,662) (164,170) (146,879) (151,569)
Gross income 68,562 75,263 62,952 32,194 66,089 65,805 59,781 53,897 46,906 36,412 34,629
Research and development expenses (14,794) (13,276) (12,970) (13,193) (14,348) (11,059) (8,354) (7,557) (7,614) (6,829) (5,869)
Selling expenses (28,248) (26,001) (24,149) (25,334) (27,129) (26,068) (21,213) (20,778) (19,369) (16,866) (16,604)
Administrative expenses (5,669) (7,132) (5,666) (5,863) (6,940) (7,133) (6,551) (6,301) (5,483) (5,467) (5,658)
Other operating income and expenses (2,160) (1,649) (2,023) (4,798) (1,915) 163 (3,466) (588) (618) (1,367) (4,152)
Income from investments in associated companies (23) (81) (86) (14) 25 430 61 (557) 27 200 182
Income from other investments (47) (225) (58) (6) 69 93 141 37 830 (3,579) 309
Operating income 17,622 26,899 18,000 (17,013) 15,851 22,231 20,399 18,153 14,679 2,504 2,837
Interest income and similar credits 510 608 442 390 1,171 952 666 654 821 1,096 1,217
Interest expenses and similar charges (2,476) (2,875) (3,142) (3,559) (1,935) (1,122) (585) (972) (1,254) (1,888) (1,840)
Other financial income and expenses (301) 297 213 (392) (1,077) (504) (181) 181 (1,210) (55) (201)
Income after financial items 15,355 24,929 15,514 (20,573) 14,010 21,557 20,299 18,016 13,036 1,657 2,013
Income taxes (4,097) (6,814) (4,302) 5,889 (3,994) (6,529) (3,981) (4,908) (3,129) (1,334) (590)
Income for the period 11,258 18,115 11,212 (14,685) 10,016 15,028 16,318 13,108 9,907 323 1,423
Attributable to:
Equity holders of the Parent Company 11,039 17,751 10,866 (14,718) 9,942 14,932 16,268 13,054 9,867 298 1,393
Minority interest 219 364 346 33 74 96 50 54 40 25 30
11,258 18,115 11,212 (14,685) 10,016 15,028 16,318 13,108 9,907 323 1,423
Consolidated income statements Industrial Operations
SEK M 2012 2011 2010 2009 2008 2007 2006 2005 2004 2003 2002
Net sales 296,031 303,589 257,375 208,487 294,932 276,795 249,020 231,191 202,171 174,768 177,080Cost of sales (231,216) (233,097) (197,480) (179,578) (232,247) (214,160) (192,400) (180,823) (158,453) (141,256) (145,453)
Gross income 64,815 70,492 59,895 28,909 62,685 62,635 56,620 50,368 43,718 33,512 31,627
Research and development expenses (14,794) (13,276) (12,970) (13,193) (14,348) (11,059) (8,354) (7,557) (7,614) (6,829) (5,869)
Selling expenses (26,582) (25,181) (22,649) (23,752) (25,597) (24,671) (19,999) (19,616) (18,317) (15,891) (15,393)
Administrative expenses (5,639) (4,753) (5,640) (5,838) (6,921) (7,092) (6,481) (6,147) (5,310) (5,259) (5,464)
Other operating income and expenses (1,600) (1,045) (659) (2,432) (1,457) 249 (3,275) (397) 7 (540) (2,989)
Income from Volvo Financial Services – – – – – – – 2,033 1,365 926 490
Income from investments in associated companies (23) (82) (86) (15) 23 428 61 (568) 2 166 126
Income from other investments (46) (225) (57) (13) 69 93 141 37 828 (3,581) 309
Operating income 16,130 25,930 17,834 (16,333) 14,454 20,583 18,713 18,153 14,679 2,504 2,837
175
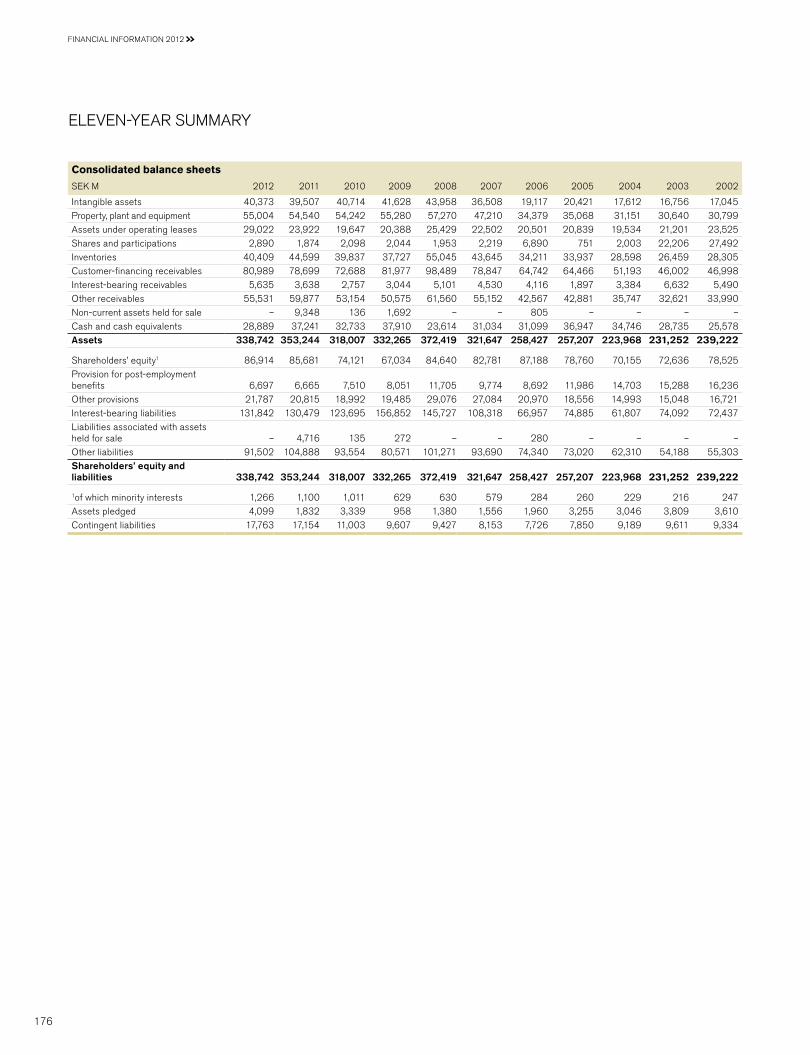
ELEVEn-yEAR SuMMARy
Consolidated balance sheets
SEK M 2012 2011 2010 2009 2008 2007 2006 2005 2004 2003 2002
Intangible assets 40,373 39,507 40,714 41,628 43,958 36,508 19,117 20,421 17,612 16,756 17,045Property, plant and equipment 55,004 54,540 54,242 55,280 57,270 47,210 34,379 35,068 31,151 30,640 30,799Assets under operating leases 29,022 23,922 19,647 20,388 25,429 22,502 20,501 20,839 19,534 21,201 23,525Shares and participations 2,890 1,874 2,098 2,044 1,953 2,219 6,890 751 2,003 22,206 27,492Inventories 40,409 44,599 39,837 37,727 55,045 43,645 34,211 33,937 28,598 26,459 28,305Customer-financing receivables 80,989 78,699 72,688 81,977 98,489 78,847 64,742 64,466 51,193 46,002 46,998Interest-bearing receivables 5,635 3,638 2,757 3,044 5,101 4,530 4,116 1,897 3,384 6,632 5,490Other receivables 55,531 59,877 53,154 50,575 61,560 55,152 42,567 42,881 35,747 32,621 33,990non-current assets held for sale – 9,348 136 1,692 – – 805 – – – –Cash and cash equivalents 28,889 37,241 32,733 37,910 23,614 31,034 31,099 36,947 34,746 28,735 25,578Assets 338,742 353,244 318,007 332,265 372,419 321,647 258,427 257,207 223,968 231,252 239,222
Shareholders’ equity1 86,914 85,681 74,121 67,034 84,640 82,781 87,188 78,760 70,155 72,636 78,525Provision for post-employment benefits 6,697 6,665 7,510 8,051 11,705 9,774 8,692 11,986 14,703 15,288 16,236Other provisions 21,787 20,815 18,992 19,485 29,076 27,084 20,970 18,556 14,993 15,048 16,721Interest-bearing liabilities 131,842 130,479 123,695 156,852 145,727 108,318 66,957 74,885 61,807 74,092 72,437Liabilities associated with assets held for sale – 4,716 135 272 – – 280 – – – –Other liabilities 91,502 104,888 93,554 80,571 101,271 93,690 74,340 73,020 62,310 54,188 55,303Shareholders’ equity and liabilities 338,742 353,244 318,007 332,265 372,419 321,647 258,427 257,207 223,968 231,252 239,222
1of which minority interests 1,266 1,100 1,011 629 630 579 284 260 229 216 247Assets pledged 4,099 1,832 3,339 958 1,380 1,556 1,960 3,255 3,046 3,809 3,610Contingent liabilities 17,763 17,154 11,003 9,607 9,427 8,153 7,726 7,850 9,189 9,611 9,334
FInAnCIAL InFORMATIOn 2012
176
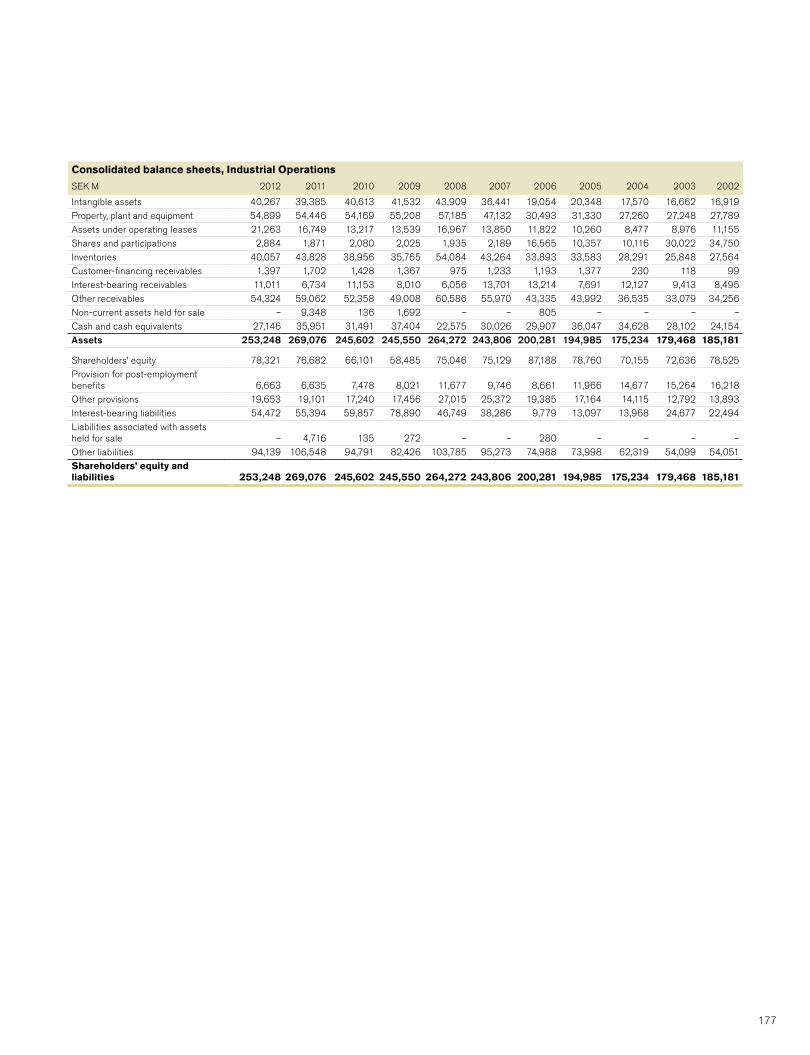
Consolidated balance sheets, Industrial Operations
SEK M 2012 2011 2010 2009 2008 2007 2006 2005 2004 2003 2002
Intangible assets 40,267 39,385 40,613 41,532 43,909 36,441 19,054 20,348 17,570 16,662 16,919Property, plant and equipment 54,899 54,446 54,169 55,208 57,185 47,132 30,493 31,330 27,260 27,248 27,789Assets under operating leases 21,263 16,749 13,217 13,539 16,967 13,850 11,822 10,260 8,477 8,976 11,155Shares and participations 2,884 1,871 2,080 2,025 1,935 2,189 16,565 10,357 10,116 30,022 34,750Inventories 40,057 43,828 38,956 35,765 54,084 43,264 33,893 33,583 28,291 25,848 27,564Customer-financing receivables 1,397 1,702 1,428 1,367 975 1,233 1,193 1,377 230 118 99Interest-bearing receivables 11,011 6,734 11,153 8,010 6,056 13,701 13,214 7,691 12,127 9,413 8,495Other receivables 54,324 59,062 52,358 49,008 60,586 55,970 43,335 43,992 36,535 33,079 34,256non-current assets held for sale – 9,348 136 1,692 – – 805 – – – –Cash and cash equivalents 27,146 35,951 31,491 37,404 22,575 30,026 29,907 36,047 34,628 28,102 24,154Assets 253,248 269,076 245,602 245,550 264,272 243,806 200,281 194,985 175,234 179,468 185,181
Shareholders’ equity 78,321 76,682 66,101 58,485 75,046 75,129 87,188 78,760 70,155 72,636 78,525Provision for post-employment benefits 6,663 6,635 7,478 8,021 11,677 9,746 8,661 11,966 14,677 15,264 16,218Other provisions 19,653 19,101 17,240 17,456 27,015 25,372 19,385 17,164 14,115 12,792 13,893Interest-bearing liabilities 54,472 55,394 59,857 78,890 46,749 38,286 9,779 13,097 13,968 24,677 22,494Liabilities associated with assets held for sale – 4,716 135 272 – – 280 – – – –Other liabilities 94,139 106,548 94,791 82,426 103,785 95,273 74,988 73,998 62,319 54,099 54,051Shareholders’ equity and liabilities 253,248 269,076 245,602 245,550 264,272 243,806 200,281 194,985 175,234 179,468 185,181
177

ELEVEn-yEAR SuMMARy
Consolidated cash-flow statements
SEK bn 2012 2011 2010 2009 2008 2007 2006 2005 2004 2003 2002
Operating income (loss) 17.6 26.9 18.0 (17.0) 15.9 22.2 20.4 18.2 14.7 2.5 2.8Depreciation and amortization 14.7 13.9 13.8 15.2 13.5 12.5 12.4 9.9 10.0 10.2 10.8Other non-cash items 1.4 1.3 1.6 4.4 (0.2) (0.5) 0.7 0.4 (0.1) 4.9 2.0Change in working capital (21.9) (15.1) 4.8 16.9 (23.3) (9.9) (7.7) (4.7) (1.4) 0.4 1.0Customer financing receivables, net – – – – – – – (7.8) (7.4) (4.3) (5.7)Financial items and income tax (8.0) (7.3) (5.5) (4.6) (5.2) (5.9) (4.3) (2.0) (0.5) (0.9) (1.3)Cash-flow from operating activities 3.8 19.7 32.7 14.9 0.7 18.4 21.5 14.0 15.3 12.8 9.6
Investments in fixed assets (14.6) (12.6) (10.4) (10.5) (12.7) (10.1) (10.0) (10.3) (7.4) (6.0) (6.7)Investments in leasing assets (10.0) (7.4) (4.8) (4.2) (5.4) (4.8) (4.6) (4.5) (4.4) (5.3) (5.2)Disposals of fixed assets and leasing assets 3.1 3.3 3.1 3.8 2.9 2.9 3.2 2.6 2.4 2.9 3.2Shares and participations, net (1.2) (0.1) (0.1) 0.0 0.0 0.4 (5.8) 0.3 15.1 (0.1) (0.1)Acquired and divested subsidiaries and other business units, net 3.4 (1.6) 0.6 0.2 (1.3) (15.0) 0.5 0.7 (0.1) 0.0 (0.2)Interest-bearing receivables including marketable securities 3.7 2.6 6.8 (8.9) 10.9 3.6 7.7 (1.3) (6.4) (2.0) (1.5)Cash-flow after net investments (11.8) 3.9 27.9 (4.7) (4.9) (4.6) 12.5 1.5 14.5 2.3 (0.9)
Change in loans, net 14.1 8.7 (25.7) 12.6 18.2 28.7 (2.6) 3.6 (8.8) 1.9 (0.1)Repurchase of own shares – – – 0.0 – – – (1.8) (2.5) – –Dividend to AB Volvo’s shareholders (6.1) (5.1) 0.0 (4.1) (11.1) (20.3) (6.8) (5.1) (3.4) (3.4) (3.4)
Cash payment to minority 0.0 0.0 (0.1) – – – – – – – –Other 0.0 0.0 0.0 (0.1) 0.0 0.0 0.0 0.0 0.0 0.1 0.1Change in cash and cash equivalents excluding translation differences (3.8) 7.5 2.1 3.7 2.2 3.8 3.1 (1.8) (0.2) 0.9 (4.3)
Translation differences on cash and cash equivalents (0.8) (0.1) (0.4) (0.2) 1.0 0.0 (0.5) 1.1 (0.2) (0.6) (0.7)Change in cash and cash equivalents (4.6) 7.4 1.7 3.5 3.2 3.8 2.6 (0.7) (0.4) 0.3 (5.0)
Operating cash-flow Industrial Operations
SEK bn 2012 2011 2010 2009 2008 2007 2006 2005 2004 2003 2002
Operating income 16.1 26.0 17.8 (16.3) 14.5 20.6 18.7 16.1 13.3 1.6 2.3Depreciation and amortization 12.0 11.4 11.4 12.4 11.8 10.3 9.8 7.3 7.1 7.2 7.8Other items not affecting cash 0.8 0.6 0.1 2.3 (0.7) (0.4) 0.2 0.2 (0.6) 4.1 1.0Change in working capital (9.2) (4.2) 4.6 4.7 (10.9) (0.1) (3.1) (5.6) (1.4) 0.7 0.4Financial items and income taxes (7.3) (6.9) (5.1) (4.7) (5.0) (6.0) (3.7) (1.9) (0.2) (0.7) (1.1)Cash-flow from operating activities 12.4 26.9 28.8 (1.6) 9.7 24.4 21.9 16.1 18.2 12.9 10.4
Investments in fixed assets (14.6) (12.6) (10.3) (10.3) (12.6) (10.1) (9.7) (9.9) (7.2) (5.8) (6.3)Investments in leasing assets (3.6) (1.4) (0.3) (0.2) (0.4) (0.2) (0.5) (0.3) (0.3) (0.1) (0.1)Disposals of fixed assets and leasing assets 0.9 1.2 0.8 0.7 0.6 1.1 0.9 0.9 0.7 0.6 1.1Operating cash-flow (4.9) 14.1 19.0 (11.4) (2.7) 15.2 12.6 6.8 11.4 7.6 5.1
FInAnCIAL InFORMATIOn 2012
178

Key ratios
2012 2011 2010 2009 2008 2007 2006 2005 2004 2003 2002
Gross margin, %1 21.9 23.7 23.3 13.9 21.3 22.6 22.7 21.8 21.6 19.2 17.9Research and development expenses as percentage of net sales1 5.0 4.4 5.0 6.3 4.9 4.0 3.4 3.3 3.8 3.9 3.3Selling expenses as percentage of net sales1 9.0 8.0 8.8 11.4 8.7 8.9 8.0 8.5 9.1 9.1 8.7Administration expenses as percentage of net sales1 1.9 2.3 2.2 2.8 2.3 2.6 2.6 2.7 2.6 3.0 3.1Return on shareholders' equity, % 12.9 23.1 16.0 (19.7) 12.1 18.1 19.6 17.8 13.9 0.4 1.7Interest coverage, times1 6.7 9.6 5.9 (4.7) 8.8 20.7 26.1 16.7 11.0 1.9 2.2Self-financing ratio, % 18 118 270 137 5 153 189 116 163 152 110Self-financing ratio Industrial Operations, % 72 210 294 (16) 78 265 235 173 268 243 196Financial position, Industrial Operations, SEK M (22,978) (19,346) (24,691) (41,489) (29,795) (4,305) 23,076 18,675 18,110 (2,426) (6,063)net financial position as percentage of shareholders' equity, Industrial Operations (29.3) (25.2) (37.4) (70.9) (39.7) (5.7) 29.2 23.7 25.8 (3.3) (7.7)Shareholders’ equity as percentage of total assets 25.7 24.3 23.3 20.2 22.7 25.7 33.7 30.6 31.3 31.4 32.8Shareholders’ equity as percentage of total assets, Industrial Operations 30.9 28.5 26.9 23.8 28.4 30.8 40.6 40.4 40.0 40.5 42.4Shareholders’ equity excluding minority interest as percentage of total assets 25.2 23.9 23.0 20.0 22.6 25.6 33.6 30.5 31.2 31.3 32.7
1 Pertains to the Industrial Operations. For periods up to and including 2006, Volvo Financial Services is included and consolidated according to the equity method.
Exports from Sweden
SEK M 2012 2011 2010 2009 2008 2007 2006 2005 2004 2003 2002
Volvo Group, total 84,314 91,065 72,688 41,829 96,571 88,606 80,517 71,133 62,653 49,300 52,730
179
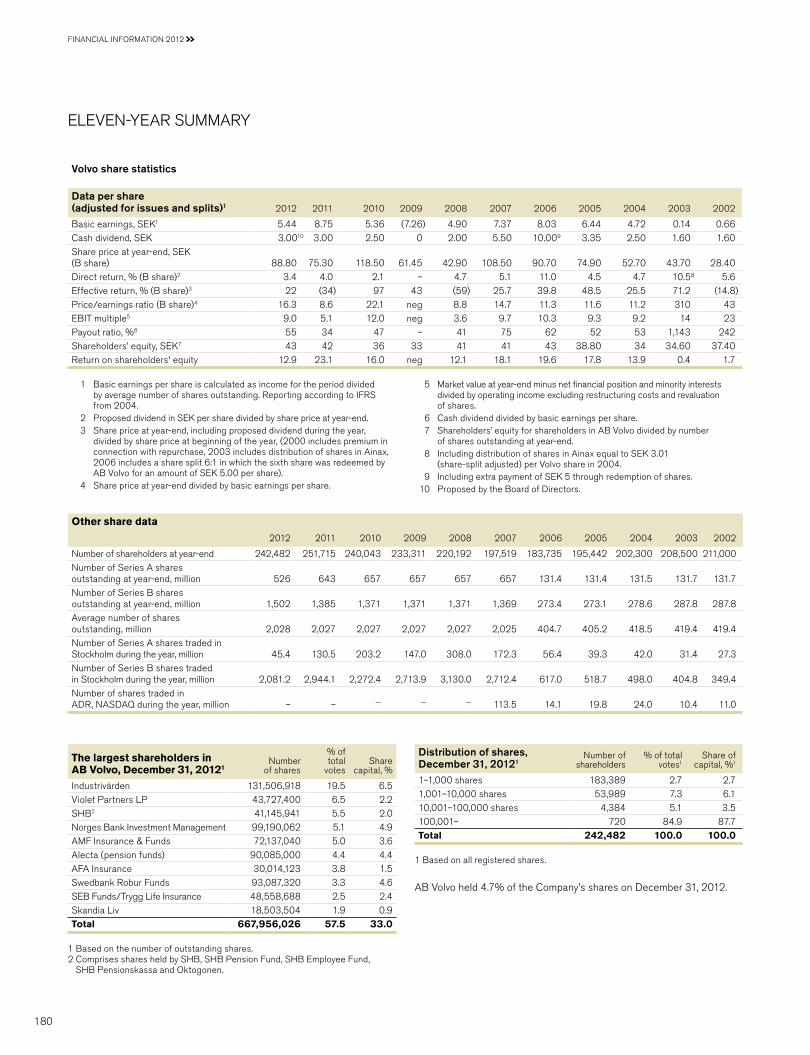
ELEVEn-yEAR SuMMARy
Volvo share statistics
Data per share (adjusted for issues and splits)1 2012 2011 2010 2009 2008 2007 2006 2005 2004 2003 2002
Basic earnings, SEK1 5.44 8.75 5.36 (7.26) 4.90 7.37 8.03 6.44 4.72 0.14 0.66Cash dividend, SEK 3.0010 3.00 2.50 0 2.00 5.50 10.009 3.35 2.50 1.60 1.60Share price at year-end, SEK (B share) 88.80 75.30 118.50 61.45 42.90 108.50 90.70 74.90 52.70 43.70 28.40Direct return, % (B share)2 3.4 4.0 2.1 – 4.7 5.1 11.0 4.5 4.7 10.58 5.6Effective return, % (B share)3 22 (34) 97 43 (59) 25.7 39.8 48.5 25.5 71.2 (14.8)Price/earnings ratio (B share)4 16.3 8.6 22.1 neg 8.8 14.7 11.3 11.6 11.2 310 43EBIT multiple5 9.0 5.1 12.0 neg 3.6 9.7 10.3 9.3 9.2 14 23Payout ratio, %6 55 34 47 – 41 75 62 52 53 1,143 242Shareholders’ equity, SEK7 43 42 36 33 41 41 43 38.80 34 34.60 37.40Return on shareholders' equity 12.9 23.1 16.0 neg 12.1 18.1 19.6 17.8 13.9 0.4 1.7
Other share data
2012 2011 2010 2009 2008 2007 2006 2005 2004 2003 2002
number of shareholders at year-end 242,482 251,715 240,043 233,311 220,192 197,519 183,735 195,442 202,300 208,500 211,000number of Series A shares outstanding at year-end, million 526 643 657 657 657 657 131.4 131.4 131.5 131.7 131.7number of Series B shares outstanding at year-end, million 1,502 1,385 1,371 1,371 1,371 1,369 273.4 273.1 278.6 287.8 287.8Average number of shares outstanding, million 2,028 2,027 2,027 2,027 2,027 2,025 404.7 405.2 418.5 419.4 419.4number of Series A shares traded in Stockholm during the year, million 45.4 130.5 203.2 147.0 308.0 172.3 56.4 39.3 42.0 31.4 27.3number of Series B shares traded in Stockholm during the year, million 2,081.2 2,944.1 2,272.4 2,713.9 3,130.0 2,712.4 617.0 518.7 498.0 404.8 349.4number of shares traded in ADR, nASDAQ during the year, million – – — — — 113.5 14.1 19.8 24.0 10.4 11.0
1 Basic earnings per share is calculated as income for the period divided by average number of shares outstanding. Reporting according to IFRS from 2004.
2 Proposed dividend in SEK per share divided by share price at year-end.3 Share price at year-end, including proposed dividend during the year,
divided by share price at beginning of the year, (2000 includes premium in connection with repurchase, 2003 includes distribution of shares in Ainax, 2006 includes a share split 6:1 in which the sixth share was redeemed by AB Volvo for an amount of SEK 5.00 per share).
4 Share price at year-end divided by basic earnings per share.
5 Market value at year-end minus net financial position and minority interests divided by operating income excluding restructuring costs and revaluation of shares.
6 Cash dividend divided by basic earnings per share. 7 Shareholders’ equity for shareholders in AB Volvo divided by number
of shares outstanding at year-end. 8 Including distribution of shares in Ainax equal to SEK 3.01
(share-split adjusted) per Volvo share in 2004.9 Including extra payment of SEK 5 through redemption of shares.
10 Proposed by the Board of Directors.
The largest shareholders in AB Volvo, December 31, 20121
number of shares
% of total
votesShare
capital, %
Industrivärden 131,506,918 19.5 6.5Violet Partners LP 43,727,400 6.5 2.2SHB2 41,145,941 5.5 2.0norges Bank Investment Management 99,190,062 5.1 4.9AMF Insurance & Funds 72,137,040 5.0 3.6Alecta (pension funds) 90,085,000 4.4 4.4AFA Insurance 30,014,123 3.8 1.5Swedbank Robur Funds 93,087,320 3.3 4.6SEB Funds/Trygg Life Insurance 48,558,688 2.5 2.4Skandia Liv 18,503,504 1.9 0.9Total 667,956,026 57.5 33.0
Distribution of shares, December 31, 20121
number of shareholders
% of total votes1
Share of capital, %1
1–1,000 shares 183,389 2.7 2.71,001–10,000 shares 53,989 7.3 6.110,001–100,000 shares 4,384 5.1 3.5100,001– 720 84.9 87.7Total 242,482 100.0 100.0
1 Based on the number of outstanding shares.2 Comprises shares held by SHB, SHB Pension Fund, SHB Employee Fund,
SHB Pensionskassa and Oktogonen.
1 Based on all registered shares.
AB Volvo held 4.7% of the Company’s shares on December 31, 2012.
FInAnCIAL InFORMATIOn 2012
180

Business area statistics
Net sales1
SEK M 2012 2011 2010 2009 2008 2007 2006 2005 2004 2003 2002
Trucks Europe 76,365 83,451 69,606 65,874 109,914 108,651 93,282 79,706 77,431 70,101 67,830
north America 42,650 37,042 26,901 21,563 26,588 27,255 50,605 46,129 35,154 28,151 33,721
South America 21,172 26,847 21,680 12,490 14,680 11,483 9,213 7,657 5,223 3,464 3,277
Asia 36,531 37,840 35,231 26,943 37,515 26,593 8,975 13,551 12,378 9,206 5,919
Other markets 15,565 13,741 13,887 12,069 14,538 13,910 9,190 8,353 6,693 6,047 8,005
Total 192,283 198,920 167,305 138,940 203,235 187,892 171,265 155,396 136,879 116,969 118,752
Buses Europe 6,200 6,631 6,242 7,707 7,321 7,767 7,924 7,142 6,948 6,534 7,104
north America 6,675 7,532 7,200 5,673 5,355 4,630 4,910 4,247 2,960 2,984 3,838
South America 2,794 2,715 1,737 1,235 1,571 1,623 1,537 2,641 521 329 366
Asia 2,853 2,953 3,299 2,749 2,094 1,802 2,003 1,612 1,632 1,447 2,022
Other markets 1,774 1,992 2,038 1,101 971 786 897 947 661 684 705
Total 20,295 21,823 20,516 18,465 17,312 16,608 17,271 16,589 12,722 11,978 14,035
Construction Europe 16,518 17,765 16,138 12,987 25,192 25,294 20,326 15,524 13,453 12,348 10,837Equipment north America 12,027 7,829 6,267 5,475 10,159 11,170 11,280 10,337 8,601 5,428 5,667
South America 3,788 4,163 4,130 2,578 2,913 2,155 1,358 1,238 922 636 709
Asia 27,033 29,999 24,352 12,957 13,738 12,179 6,903 5,717 4,961 3,707 3,048
Other markets 4,192 3,745 2,923 1,661 4,077 2,835 2,264 2,000 1,423 1,035 751
Total 63,558 63,500 53,810 35,658 56,079 53,633 42,131 34,816 29,360 23,154 21,012
Volvo Penta Europe 3,620 4,274 4,507 4,390 6,554 6,798 6,111 5,102 4,907 4,189 3,945 north America 1,486 1,379 1,500 1,100 1,947 2,674 2,815 2,832 2,500 2,109 2,261 South America 306 335 335 284 364 274 221 208 142 146 127 Asia 1,867 2,130 2,008 2,054 2,082 1,624 1,359 1,427 1,324 947 1,141 Other markets 352 341 366 331 486 349 268 207 184 205 195 Total 7,631 8,458 8,716 8,159 11,433 11,719 10,774 9,776 9,057 7,596 7,669
Volvo Aero Europe 2,404 2,893 3,768 3,942 3,497 3,462 3,798 3,406 3,179 4,000 3,450
north America 2,657 3,300 3,599 3,508 3,534 3,723 3,815 3,612 3,127 3,301 4,573
South America 0 7 27 34 58 127 173 168 138 152 177
Asia 109 104 233 205 234 234 356 284 400 428 497
Other markets 49 52 81 114 125 100 91 68 81 149 140
Total 5,219 6,356 7,708 7,803 7,448 7,646 8,233 7,538 6,925 8,030 8,837
Other and eliminations 7,044 4,532 (680) (538) (575) (703) (654) 7,076 7,228 7,041 6,775
Net sales Industrial Operations 296,031 303,589 257,375 208,487 294,932 276,795 249,020 231,191 202,171 174,768 177,080
Customer Europe 4,703 4,663 4,733 7,127 7,099 4,484 4,388 4,797 6,613 6,078 5,997Finance north America 2,833 2,326 2,605 3,004 369 2,467 2,569 2,036 2,432 2,542 3,344
South America 1,195 1,131 1,156 1,070 791 620 608 570 396 358 403
Asia 795 571 435 435 158 87 45 101 90 65 49
Other markets 257 192 101 75 68 47 38 45 67 110 132
Total 9,783 8,883 9,031 11,711 8,485 7,705 7,648 7,549 9,598 9,153 9,925 Eliminations (2,167) (2,104) (1,658) (1,836) 250 905 2,167 1,819 (693) (630) (807)
Volvo Group total 303,647 310,367 264,749 218,361 303,667 285,405 258,835 240,559 211,076 183,291 186,198
1 As of January 1, 2007, the results from the synergies created in the business units are transferred back to the various business areas. Comparison figures for 2006 have been restated. Volvo Aero was divested in October 1, 2012.
181

ELEVEn-yEAR SuMMARy
Operating income
SEK M 20124 2011 2010 2009 2008 2007 20061 2005 20042 20033 2002
Trucks 10,216 18,227 10,112 (10,805) 12,167 15,193 13,116 11,717 8,992 3,951 1,189Buses 51 1,114 780 (350) (76) 231 745 470 158 (790) (94)Construction Equipment 5,773 6,812 6,180 (4,005) 1,808 4,218 4,072 2,752 1,898 908 406Volvo Penta 541 825 578 (230) 928 1,173 1,105 943 940 695 647Volvo Aero 767 360 286 50 359 529 359 836 403 (44) 5Customer Finance 1,492 969 167 (680) 1,397 1,649 1,686 2,033 1,365 926 490Other (1,217) (1,408) (102) (994) (731) (762) (684) (598) 923 (3,142) 194Operating income (loss) Volvo Group 17,622 26,899 18,000 (17,013) 15,851 22,231 20,399 18,153 14,679 2,504 2,837
Operating margin
% 2012 2011 2010 2009 2008 2007 2006 2005 2004 2003 2002
Trucks 5.3 9.2 6.0 (7.8) 6.0 8.1 7.7 7.5 6.6 3.4 1.0Construction Equipment 9.1 10.7 11.5 (11.2) 3.2 7.9 9.7 7.9 6.5 3.9 1.9Buses 0.3 5.1 3.8 (1.9) (0.4) 1.4 4.3 2.8 1.2 (6.6) (0.7)Volvo Penta 7.1 9.8 6.6 (2.8) 8.1 10.0 10.3 9.6 10.4 9.1 8.4Volvo Aero 14.7 5.7 3.7 0.6 4.8 6.9 4.4 11.1 5.8 (0.5) 0.1Volvo Group Industrial Operations 5.4 8.5 6.9 (7.8) 5.2 7.8 7.9 7.9 7.3 1.4 1.6
As of January 1, 2007, the benefits from the synergies created in the business units are transferred back to the various business areas. Comparison figures for 2006 have been restated.1 Operating income in 2006 includes adjustment of goodwill of neg 1,712,
reported in Trucks.2 Operating income in 2004 included reversal of write-down of shares in Scania
AB of 915, reported in Other, and write-down of shares in Henlys Group Plc of 95, reported in Buses.
3 Operating income in 2003 included write-down of shares in Scania AB and Henlys Group Plc amounting to 4,030, of which 429 was reported in Buses (Henlys Group) and 3,601 was reported in Other (Scania AB).
4 Volvo Aero was divested October 1, 2012.
Number of employees at year-end
number1, 2, 3 2012 2011 2010 2009 2008 2007 2006 2005 2004 2003 2002
Trucks 61,256 62,315 57,796 56,505 64,280 64,390 49,900 50,240 49,450 46,900 43,470Buses 7,514 8,529 8,685 9,541 8,930 9,290 7,760 7,710 7,700 6,680 6,660Construction Equipment 14,788 18,422 16,648 16,126 19,810 19,710 11,050 10,290 9,930 9,280 8,410Volvo Penta 1,361 2,549 2,353 2,928 2,940 3,000 1,650 1,560 1,580 1,440 1,410Volvo Aero – 3,179 3,120 3,278 3,510 3,550 3,510 3,460 3,350 3,440 3,660Financial Services 1,362 1,323 1,235 1,234 1,290 1,150 1,010 1,070 1,100 1,060 1,060Other 12,436 1,845 572 596 620 610 8,310 7,530 7,970 6,940 6,490Volvo Group, total 98,717 98,162 90,409 90,208 101,380 101,700 83,190 81,860 81,080 75,740 71,160
1 As of 2007, employees in business units are allocated to the business areas.2 As of 2009 regular employees are shown, previously temporary employees were also included. 3 As of 2012, employees in business units are not allocated to the business areas.
Environmental performance of Volvo production plants, Industrial operations
Absolute values related to net sales 2012 2011 2010 2009 2008 20071 2006 2005 2004 2003 2002
Energy consumption (GWh; MWh/SEK M) 2,518; 8.5 2,471; 8.1 2,315; 9.0 1,888; 9.1 2,530; 8.6 2,426; 9.6 2,612; 10.5 2,683; 11.6 2,695; 13.3 2,607; 14.9 2,564; 14.5
CO2 emissions (1,000 tons; tons/SEK M) 235; 0.8 255; 0.8 279; 1.1 213; 1.0 291; 1.0 242; 1.0 282; 11.4 292; 1.3 293; 1.5 298; 1.7 307; 1.7Water consumption (1,000 m3; m3/SEK M) 7,372; 24.9 7,970; 26.2 7,519; 29.2 6,637; 31.8 8,205; 27.8 7,067; 27.9 7,596; 30.6 7,419; 32.1 8,495; 42.2 8,687; 49.1 9,202; 52.0nOx emissions (tons; kilos/SEK M) 413; 1.4 474; 1.6 719; 2.8 322; 1.5 800; 2.7 542; 2.1 606; 2.4 672; 2.9 645; 3.2 570; 3.3 726; 4.1Solvent emissions (tons; kilos/SEK M) 2,358; 8.0 2,554; 8.4 2,294; 8.9 1,435; 6.9 1,945; 6.6 1,979; 7.8 2,048; 8.3 1,960; 8.5 2,085; 10.3 1,965; 11.2 1,896; 10.7Sulphur dioxide emissions (tons; kilos/SEK M) 26; 0.1 34; 0.1 33; 0.1 38; 0.2 64; 0.2 58; 0.2 69; 0.3 209; 0.9 184; 0.9 200; 1.1 173; 1.0Hazardous waste (tons; kg/SEK M) 32,547; 109.9 25,943; 85.5 22,730; 88 17,558; 84 27,675; 94 27,120; 107 26,987; 108.8 23,590; 102 24,675; 122.1 21,613; 124 20,531, 116net sales, SEK bn 296.0 303.6 257.4 208.5 294.9 253.2 248.1 231.2 202.1 174.8 177.1
1 Excluding uD Trucks and Ingersoll Rand Road Development.
FInAnCIAL InFORMATIOn 2012
182

Employees
number1 2012 2011 2010 2009 2008 2007 2006 2005 2004 2003 2002
Sweden 23,052 24,663 23,073 22,763 28,190 28,660 27,830 27,070 28,530 26,380 25,420Europe, excluding Sweden 30,382 30,458 29,239 29,793 32,940 32,780 30,070 29,650 28,930 29,120 27,130north America 16,569 15,427 12,844 12,640 14,200 15,750 14,820 15,140 14,620 12,270 12,440South America 5,977 5,234 4,322 4,257 4,380 4,640 3,890 3,690 3,110 2,640 2,020Asia 20,222 19,924 18,535 18,416 19,090 17,150 4,420 4,210 4,130 3,710 2,590Other markets 2,515 2,456 2,396 2,339 2,580 2,720 2,160 2,100 1,760 1,620 1,560
Volvo Group total 98,717 98,162 90,409 90,208 101,380 101,700 83,190 81,860 81,080 75,740 71,160 1 As of 2009 regular employees are shown, previously temporary employees were also included.
Delivered units
number 2012 2011 2010 2009 2008 2007 2006 2005 2004 2003 2002
Heavy-duty trucks (>16 tons) 172,798 179,779 123,522 82,675 179,962 172,322 179,089 172,242 152,300 120,920 120,200Medium-duty trucks (7–15.9 tons) 32,935 34,631 30,657 21,653 30,817 27,933 14,695 18,643 18,800 15,870 16,220Light trucks (<7 tons) 18,284 23,982 25,811 23,354 40,372 36,101 26,147 23,494 22,120 19,200 20,710Total trucks 224,017 238,391 179,989 127,681 251,151 236,356 219,931 214,379 193,220 155,990 157,130
number 2012 2011 2010 2009 2008 2007 2006 2005 2004 2003 2002
Trucks Total Europe 84,355 95,113 65,503 49,145 121,847 128,070 114,417 103,622 102,670 92,080 96,290 Western Europe 63,730 75,728 56,215 43,919 95,969 100,106 97,074 91,087 90,750 82,670 87,490 Eastern Europe 20,625 19,385 9,288 5,226 25,878 27,964 17,343 12,535 11,920 9,410 8,800 north America 47,806 42,613 24,282 17,574 30,146 33,280 70,499 64,974 49,270 34,760 36,510 South America 23,443 29,274 21,483 12,587 18,092 15,264 11,646 11,248 9,190 5,980 5,360 Asia 51,514 56,165 53,833 34,800 60,725 39,916 12,817 25,706 24,880 16,290 9,140 Other markets 16,899 15,226 14,888 13,575 20,341 19,826 10,552 8,829 7,210 6,880 9,830 Total 224,017 238,391 179,989 127,681 251,151 236,356 219,931 214,379 193,220 155,990 157,130
Buses Total Europe 2,491 2,695 2,395 3,164 3,313 3,748 3,570 3,723 3,417 3,087 3,413 Western Europe 2,427 2,601 2,336 2,896 3,140 3,377 3,081 3,385 3,073 2,782 3,076 Eastern Europe 64 94 59 268 173 371 489 338 344 305 337 north America 1,826 3,014 2,092 1,539 1,884 1,547 1,741 1,546 1,388 1,553 1,945 South America 2,560 2,620 1,174 690 995 1,318 1,236 2,297 624 369 495 Asia 2,945 3,417 3,477 3,839 3,033 2,757 3,349 2,554 2,341 2,227 2,639 Other markets 856 1,040 1,091 625 712 546 464 555 462 581 567 Total 10,678 12,786 10,229 9,857 9,937 9,916 10,360 10,675 8,232 7,817 9,059
2008 20071 2006 2005 2004 2003 2002
2,530; 8.6 2,426; 9.6 2,612; 10.5 2,683; 11.6 2,695; 13.3 2,607; 14.9 2,564; 14.5
291; 1.0 242; 1.0 282; 11.4 292; 1.3 293; 1.5 298; 1.7 307; 1.78,205; 27.8 7,067; 27.9 7,596; 30.6 7,419; 32.1 8,495; 42.2 8,687; 49.1 9,202; 52.0
800; 2.7 542; 2.1 606; 2.4 672; 2.9 645; 3.2 570; 3.3 726; 4.11,945; 6.6 1,979; 7.8 2,048; 8.3 1,960; 8.5 2,085; 10.3 1,965; 11.2 1,896; 10.7
64; 0.2 58; 0.2 69; 0.3 209; 0.9 184; 0.9 200; 1.1 173; 1.027,675; 94 27,120; 107 26,987; 108.8 23,590; 102 24,675; 122.1 21,613; 124 20,531, 116
294.9 253.2 248.1 231.2 202.1 174.8 177.1

definiTions
Basic earnings per share Income for the period attributable to shareholders of the Parent Company divided by the weighted average number of shares out-standing during the period.
Capital expenditures Capital expenditures include investments in property, plant and equipment, intangible assets and assets under operating leases. Investments in fixed assets included in the Group’s cash-flow statement include only capital expenditures that have reduced the Group’s liquid funds during the year.
Cash-flowCombined changes in the Group’s liquid funds during the fiscal year. Changes in liquid funds are specified with reference to changes in operations, operating activities, changes depending on investments in equipment, fixed assets etc. and financing activities such as changes in loans and investments.
Diluted earnings per shareDiluted earnings per share is calculated as income for the period attributable to the Parent Company’s shareholders divided by the average number of shares outstanding plus the average number of shares that would be issued as an effect of ongoing share-based incentive programs and employee stock option programs.
EBITDAEBITDA is the operating income before depreciation and amortiza-tion of tangible and intangible assets. This key figure is calculated by adding back depreciation and amortization on the operating income of the Industrial operations.
Equity ratioShareholders’ equity divided by total assets.
Financial targetsInformation on how the comparison with competitors is made is available under the heading Investors on www.volvogroup.com.
Interest coverage Operating income plus interest income and similar credits divided by interest expense and similar charges.
Joint venturesCompanies over which the Company has joint control together with one or more external parties.
Net financial position Cash and cash equivalents, marketable securities and inter-est-bearing short- and long-term receivables reduced by short- and long-term interest-bearing liabilities and provisions for post-em-ployment benefits.
Operating margin Operating income divided by net sales.
Penetration rateShare of unit sales financed by Volvo Financial Services in relation to total number units sold by the Volvo Group in markets where financial services are offered.
Return on shareholders’ equity Income for the period divided by average shareholders’ equity.
Self-financing ratio Cash-flow from operating activities (see Cash-flow statement) divided by net investments in fixed assets and leasing assets as defined in the cash-flow statement.
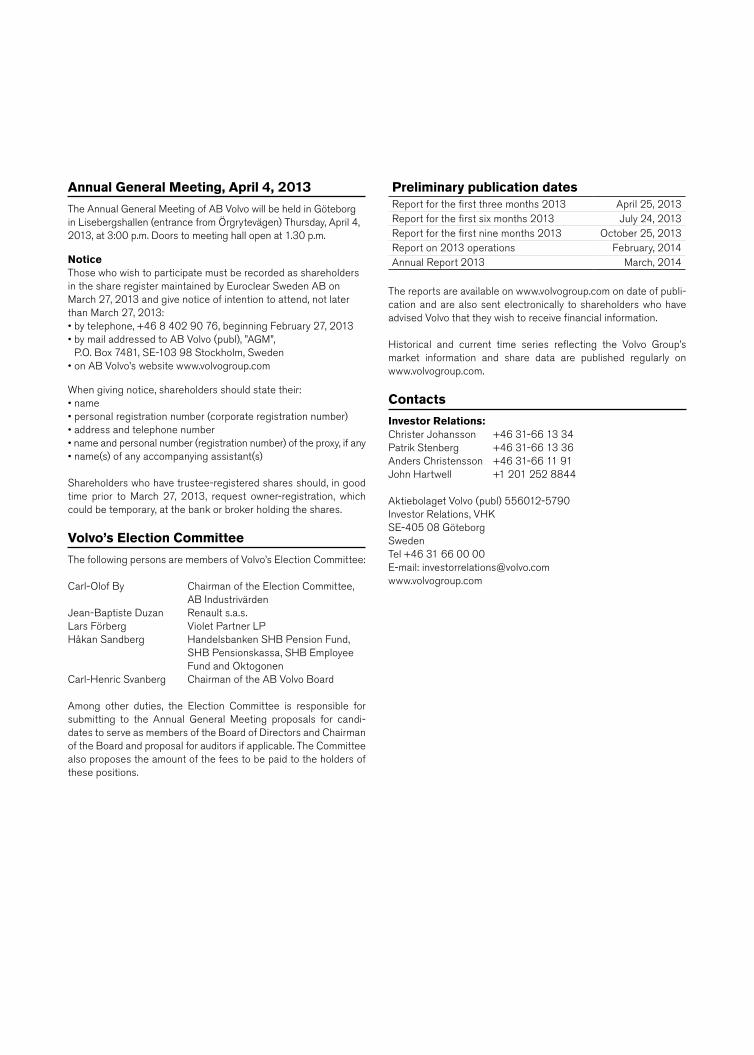
Annual General Meeting, April 4, 2013
The Annual General Meeting of AB Volvo will be held in Göteborg in Lisebergshallen (entrance from Örgrytevägen) Thursday, April 4, 2013, at 3:00 p.m. Doors to meeting hall open at 1.30 p.m.
NoticeThose who wish to participate must be recorded as shareholders in the share register maintained by Euroclear Sweden AB on March 27, 2013 and give notice of intention to attend, not later than March 27, 2013: • by telephone, +46 8 402 90 76, beginning February 27, 2013• by mail addressed to AB Volvo (publ), ”AGM”,
P.O. Box 7481, SE-103 98 Stockholm, Sweden • on AB Volvo’s website www.volvogroup.com
When giving notice, shareholders should state their: • name • personal registration number (corporate registration number) • address and telephone number• name and personal number (registration number) of the proxy, if any• name(s) of any accompanying assistant(s)
Shareholders who have trustee-registered shares should, in good time prior to March 27, 2013, request owner-registration, which could be temporary, at the bank or broker holding the shares.
Volvo’s Election Committee
The following persons are members of Volvo’s Election Committee:
Carl-Olof By Chairman of the Election Committee, AB IndustrivärdenJean-Baptiste Duzan Renault s.a.s.Lars Förberg Violet Partner LPHåkan Sandberg Handelsbanken SHB Pension Fund, SHB Pensionskassa, SHB Employee Fund and OktogonenCarl-Henric Svanberg Chairman of the AB Volvo Board
Among other duties, the Election Committee is responsible for submitting to the Annual General Meeting proposals for candi-dates to serve as members of the Board of Directors and Chairman of the Board and proposal for auditors if applicable. The Committee also proposes the amount of the fees to be paid to the holders of these positions.
Preliminary publication datesReport for the first three months 2013 April 25, 2013Report for the first six months 2013 July 24, 2013Report for the first nine months 2013 October 25, 2013Report on 2013 operations February, 2014Annual Report 2013 March, 2014
The reports are available on www.volvogroup.com on date of publi-cation and are also sent electronically to shareholders who have advised Volvo that they wish to receive financial information.
Historical and current time series reflecting the Volvo Group’s market information and share data are published regularly on www.volvogroup.com.
Contacts
Investor Relations: Christer Johansson +46 31-66 13 34 Patrik Stenberg +46 31-66 13 36 Anders Christensson +46 31-66 11 91 John Hartwell +1 201 252 8844
Aktiebolaget Volvo (publ) 556012-5790 Investor Relations, VHK SE-405 08 Göteborg Sweden Tel +46 31 66 00 00 E-mail: [email protected] www.volvogroup.com

ww
w.volvogroup.com
The V
olvo
Gro
up 2
012
AB
Vol
vo, I
nves
tor R
elat
ions
and
Cor
pora
te R
epor
ting
TransporTersDownloaded 1.5 million timesHave you played it yet?