Test Automation Process Assessment - Theseus
80
Metropolia University of Applied Sciences Master of Engineering Information Technology Master’s Thesis 12 November 2020 Zihan Bian Test Automation Process Assessment
-
Upload
khangminh22 -
Category
Documents
-
view
3 -
download
0
Transcript of Test Automation Process Assessment - Theseus

Metropolia University of Applied Sciences
Master of Engineering
Information Technology
Master’s Thesis
12 November 2020
Zihan Bian
Test Automation Process Assessment

PREFACE I have been in the software testing business for nearly 10 years. My enthusiasm for software testing has inspired this thesis project. I am keen to improve the testing pro-cess, and I aim to optimize it by combining my working experience and knowledge. During the past 3 months, I have read some excellent material that strengthened my software testing knowledge. I especially liked the book “Improving the Test Process” by Erik Van Veenendaal and Graham Bath. Through this book, I gained abundant and de-tailed information on improving the testing process. All aspects of the project proceeded smoothly. I received tremendous support at work while conducting the survey and interviews. My boss, Tomi Juslin, and Janne Lind (Head of IT) put much trust in me and allowed me sufficient time to complete the pro-ject. Writing was not my forte. Fortunately, by listening to classical music while I was writing, I could concentrate and keep my ideas flowing. Finally, I want to thank my instructor, Ville Jääskeläinen, for giving me insightful com-ments and patiently guiding me through the project. Espoo, Finland, 11th November 2020 Zihan Bian

Abstract
Author Title Number of Pages Date
Zihan Bian Test Automation Process Assessment 65 pages + 1 appendices 12 November 2020
Degree Master of Engineering
Degree Programme Information Technology
Instructor(s)
Tomi Juslin, QA Lead Ville Jääskeläinen, Principal Lecture
Test automation (TA) is an important software testing method and is pivotal in software de-velopment cycles, especially in agile development. The TA process can directly affect the efficiency and coverage of the testing and the accuracy of the testing results; thus, it can affect the software product quality. By assessing the TA process and identifying the improve-ment steps, companies can promote high-quality software products. This thesis concerns TA process assessment at the case company, a Finnish bank that recently established TA to support its digital service transformation. This thesis project aimed to help the case company understand their TA process status and outline the focus areas for improving it. The project outcomes included analysis of the assessment results, improve-ment suggestions based on assessment results, and planned follow-up checkpoints. This project initially investigated the overall implementation of TA at the case company and studied the software testing and TA background. Based on the studies, the test automation improvement model (TAIM) [25] was selected as the assessment model for this project. An assessment matrix was defined similarly to the TPI model [23]. A survey and targeted inter-views were conducted as the main assessment methods. The survey data was collated to provide insights into providing improvement suggestions and a follow-up plan. Suggestions and follow-up checkpoints were then presented in achievable small steps. Finally, a long-term vision was formed to clarify the direction of continuous improvement. The assessment found that, at the case company, the maturity levels of key areas (KAs) such as the TA strategy, test tool use, test design, test execution, the overall process, and the verdict are at the initial level, indicating the activities are mostly ad hoc. Thus, a signifi-cant team effort is required to improve them. However, KAs such as the test organization, test tool selection, and the software under test have reached a controlled level, indicating the test process activities are performed correctly. The KA of the test environment has reached an efficient level, indicating the test process activities are conducted efficiently. This thesis project clarified that a clear and solid strategic plan efficiently combining person-nel, technologies, and process is key to successful TA.
Keywords Software quality, Test automation, Testing process, Assess-ment, Maturity level
Contents
Preface
Abstract
List of Figures
List of Tables
List of Abbreviations
1 Introduction 1
2 Software Testing 3
2.1 Software Quality 3
2.2 Software Quality Attributes 4
2.3 Software Quality Assurance 5
2.4 Software Testing 6
2.5 Software Testing Life Cycle 8
2.6 Testing Process Improvement 9
2.6.1 The Deming Cycle 9
2.6.2 Test Maturity Models 11
3 Test Automation 19
3.1 Definition and Usage of Test Automation 19
3.2 The Significance of Test Automation 20
3.3 Test Automation Strategy 21
3.3.1 The Tests Should be Automated 21
3.3.2 Test Automation Pyramid 22
3.4 Test Automation Tools and Selection 23
3.5 Test Automation Framework 25
3.6 Test Automation Organization 25
3.7 Test Automation Process 26
4 Implementation of Assessment 28
4.1 Assessment Model 28
4.2 Assessment Key Areas 29
4.3 Assessment Matrix 32
4.4 Assessment Survey 34
4.5 Assessment Survey Raw Data Mapping 36

5 Analysis of Assessment Results 39
5.1 Test Automation Strategy 39
5.2 Resources 40
5.3 Test Organization and Knowledge Transfer 41
5.4 Test Tool Selection and Use 42
5.5 Test Environment 43
5.6 Test Requirements and Test Design 45
5.7 Test Execution and Verdicts 46
5.8 Test Automation Process 48
5.9 Software Under Test 49
5.10 Measurements 49
5.11 Quality Attributes 51
6 Recommendations and Conclusion 53
6.1 Improvement Suggestions 54
6.2 Potential Threats to Validity 61
6.3 Long-term Vision 62
6.4 Conclusion 64
References
Appendices
Appendix 1: Assessment Results

List of Figures
Figure 1. The Deming cycle [23] 10
Figure 2. TMMi model [24 pp. 9] 15
Figure 3. Testing quadrants [15 pp. 98] 22
Figure 4. Test automation pyramid [17] 23
Figure 5. Defined KA priorities 33
Figure 6. Example of a KA assessment priority matrix 33
Figure 7. Example of assessment matrix mapping 34
Figure 8. Sample of raw data 36
Figure 9. Sample of transformed data 37
Figure 10. Sample of aggregate data 37
Figure 11. Sample of classification based on aggregate data 38
Figure 12. Results distribution for KA1 39
Figure 13. Results distribution for KA2 40
Figure 14. Results distribution for KA3 41
Figure 15. Results distribution for KA4 42
Figure 16. Results distribution for KA5 and KA6 43
Figure 17. Results distribution for KA7 44
Figure 18. Results distribution for KA8 and KA9 45
Figure 19. Results distribution for KA10 and KA11 46
Figure 20. Results distribution for KA12 48
Figure 21. Results distribution for KA13 49
Figure 22. Results distribution for KA14 50
Figure 23. Results distribution for KA15 51
Figure 24. Improvements based on priority 54
Figure 25. Proposal for TA process 62

List of Tables
Table 1. Summary of STLC phases and activities [11], [3 pp. 8-15]. 8
Table 2. TPI NEXT model [23]. 11
Table 3. Summary of PAs and SGs for TMMi model levels 2–5 [23 pp. 24-199]. 15
Table 4. Summary of phases and activities of TA process [20]. 26
Table 5. Summary of TAIM KAs [26 pp. 149-151]. 30
Table 6. Improvement suggestions and follow-up for test automation strategy 55
Table 7. Improvement suggestions and follow-up for test tool use 56
Table 8. Improvement suggestions and follow-up for verdicts 57
Table 9. Improvement suggestions and follow-up for resources 57
Table 10. Improvement suggestions and follow-up for knowledge transfer 58
Table 11. Improvement suggestions and follow-up for test requirements 59
Table 12. Improvement suggestions and follow-up for test design 60
Table 13. Improvement suggestions and follow-up for test execution 60

List of Abbreviations
ANSI American National Standards Institute
ART Agile release train
CD Continuous deployment
CI Continuous integration
CMM Capability maturity model
CTP Critical testing process
DM Defect management
GUI Graphical user interface
IEC International Electrotechnical Commission
IEEE Institute of Electrical and Electronics Engineers
ISO International Organization for Standardization
ISTQB International Software Testing Qualifications Board
KA Key area
PDCA Plan-do-check-act
PDS Plan-do-see
PTMM Personal test maturity matrix
QA Quality assurance
SAFe Scaled Agile Framework
SDLC Software development life cycle
SQA Software quality assurance
STEP Systematic test and evaluation process
STLC Software testing life cycle
SUT System under test or software under test
TA Test automation
TAF Test automation framework
TAIM Test automation improvement model
TMMi Test maturity model integration
TO Test organization
TPI NEXT Test process improvement NEXT

1
1 Introduction
Today, many companies have reached almost full test automation (TA) to promote in-
creased test coverage, test efficiency, and effectiveness, and to support DevOps perfor-
mance. Test automation is indispensable in software testing, software quality, and soft-
ware development costs. Therefore, continuous improvement of the TA testing process
through assessment and follow-ups is imperative and recommended by the testing in-
dustry. This thesis focuses on assessing the TA maturity level at the case company.
The case company is a Finnish bank listed on Nasdaq Helsinki. Its strategic focus is to
serve individual and corporate customers with asset management services through dig-
ital and in-person channels. Digital services represent a general trend leading to in-
creased customer demands for security, quality, and performance in digital banking ser-
vices. To meet such needs, the IT department continuously improves and optimizes its
product development and testing processes, establishing TA to increase the software
testing efficiency and coverage. The company has adopted the Scaled Agile Framework
(SAFe) [28] software development method, where thirteen agile teams belong to the ag-
ile release train (ART) [28]. Among these, eight teams are developing application sys-
tems, while one team develops no applications but conducts TA tasks. The preliminary
investigation showed that one team is equipped with end-to-end TA capabilities, one or
two teams have established some TA, although its completeness is unknown, and the
remaining teams mainly use manual testing. To understand the current state in more
detail and focus on optimizing testing processes, the IT department required a self-as-
sessment of TA across the SAFe teams, which is the purpose of this thesis project.
This project should enable the IT department to measure the current effectiveness of TA
and analyze its fundamental capabilities. It aims to help all IT employees to establish a
thorough understanding of the integral status of TA and the impact of the discovered
problems on TA, productivity, and software quality. The outcome of this project provides
the IT department with a list of improvement suggestions to clarify the direction of con-
tinuous improvement activities, gives relevant staff appropriate instructions to take ac-
tion, and presents suggestions on how the progress can be pursued. It is essential that
all staff understand the necessity of active tracking through communication, and that the
purpose of tracking is to complete the plan and achieve goals. If the project is properly
implemented, establishing a TA maturity assessment can encourage all staff to escape

2
the constraints of their roles and examine the key points of changes and improvements
in TA.
This thesis project was initiated by investigating the overall implementation of TA at the
case company, the agile teams that could be selected for evaluation, and the relevant
team members who could participate in the survey. This investigation was completed
together with the QA lead. The second step was to conduct theoretical studies of soft-
ware testing and TA and discuss the important role of TA in software testing and the key
factors in achieving effective TA. The third step was implementing the assessment pro-
ject, which included selecting an appropriate assessment model, establishing the as-
sessment matrix, conducting the survey and further interviews, and collating survey data
to provide a basis for result analysis. The next step was to analyze the assessment re-
sults for each key area (KA) and determine the issues as a basis for improvement sug-
gestions. The final step was to provide first-step improvement suggestions and follow-up
plans for high-priority areas based on analysis of the assessment results. The thesis
project was concluded at this point.

3
2 Software Testing
This chapter explains the concepts and methodologies of software testing. It provides an
underlying understanding of software quality and testing.
2.1 Software Quality
Software quality as defined in the International Organization for Standardization (ISO)
and the International Electrotechnical Commission (IEC) standard [1] is the
degree to which a software product satisfies stated and implied needs when used under specified conditions.
This definition highlights two aspects: the “explicit need” and the “implied need”. Software
quality refers to the degree to which its functions and performance are consistent with
the documented requirements and standards, and the indirectly stated functions [1]. Note
that quality has distinct meanings for various stakeholders. Quality should likewise reflect
stakeholders’ needs. Users’ needs are the basis of software quality evaluation. Software
that does not match users’ needs cannot be delivered to customers. The prescribed
standards and specifications are common guidelines for software development. If soft-
ware fails to meet these standards and specifications, this might lead to a poor-quality
product. A quality software product should meet specified requirements and comply with
regulations and policies.
Quality management is divided into quality assurance (QA) and quality control [8]. Quality
control focuses on fulfilling quality requirements, while QA focuses on building confi-
dence in quality [8]. Quality control ensures that each product meets its requirements. A
series of reviews and testing is conducted throughout the development cycle to guaran-
tee that the product complies with its specifications. Quality assurance provides man-
agement with the required data to determine whether the product quality meets the pre-
determined goals. If the provided data identifies an issue, management solves it and
assigns the required resources. Quality assurance aims to ensure the development of a
satisfactory quality product because it focuses on the quality process, quality manage-
ment system, and consistency audits. It is a management tool that employs plans, sys-
tematic activities, and documents to prevent quality-related problems. More details of
software QA are explained in Section 2.3.

4
2.2 Software Quality Attributes
A few existing standards and frameworks describe a taxonomy of software quality char-
acteristics. Here, the discussion is based on the definitions in international standard
ISO/IEC 9126-1, which states the six primary characteristics and their sub-characteris-
tics [6]:
- Functionality comprises suitability, accuracy, interoperability, functionality com-
pliance, and security. It refers to the software’s capabilities to perform tasks ac-
cording to requirements.
- Reliability includes fault tolerance, recoverability, maturity, and reliability compli-
ance. It indicates that a software system will not fail in an environment within a
given time.
- Usability comprises understandability, learnability, operability, attractiveness,
and usability compliance [6]. It refers to the software’s ease of use.
- Efficiency includes time behavior, computing resource utilization, and efficiency
compliance. It refers to the speed of the software and its efficient use of re-
sources.
- Maintainability includes testability, analyzability, changeability, modifiability, and
maintainability compliance. This indicates that the software product can be
changed and improved according to requirements and specifications when
needed.
- Portability encompasses adaptability, installability, coexistence and replaceabil-
ity, and portability compliance. It refers to the requirement for software to run with
different hardware or environments.
These characteristics refer to the software product quality. They form the external and
internal quality models that can be tested with sets of measures. The internal quality
concerns the software source code, and the external quality concerns the quality in use
[7 pp. 119]. Quality in use is highly contextual: the quality attributes apply to a user’s
viewpoint when the software product is executed in a specific environment for specific
use [7 pp. 119]. It cannot be measured directly.
The ISO’s stated characteristics do not include process quality aspects. However, pro-
cess quality applies to product quality. When a software development process is defined,
if the QA personnel find that the work process and results do not meet the established

5
specifications, it is concluded that the product has defects. Conversely, if the process
meets the specifications, it is concluded that the product qualifies.
2.3 Software Quality Assurance
Software has integrated to people’s life, from consumer products to business applica-
tions. When software does not work as expected, people’s life and business operations
can be compromised, that lead to accidents, cost of time and money, damage of reputa-
tion, and even loss of lives. To avoid these risks from happening, software quality assur-
ance (SQA) is used to offer thorough sequential activities for assuring the quality of soft-
ware.
According to the Institute of Electrical and Electronics Engineers (IEEE) Standard for
Software Quality Assurance Processes (IEEE Std 730-2014), the definition of SQA is
a set of activities that define and assess the adequacy of software processes to provide evidence that establishes confidence that the software processes are ap-propriate for and produce software products of suitable quality for their intended purposes. A key attribute of SQA is the objectivity of the SQA function with respect to the project. The SQA function may also be organizationally independent of the project; that is, free from technical, managerial, and financial pressures from the project.
This definition shows that the function of SQA is to supply management with correct
visual information to assist process improvement and ensure that the product satisfies
the specification. Software quality assurance provides supportive guidance for software
testing, including quality standards, testing processes, review methods, tracking, and
auditing to discover problems in the software testing and improve testing or the entire
development process [2 pp. 16-17]. Hence, the testing work can be inspected, while the
testing process can be improved.
The key aim of SQA is to verify and ensure compliance between software products and
functional requirements, standards, and time and budget requirements, focusing on de-
fect prevention and decreasing the cost of quality [10]. Software quality assurance per-
sonnel notify SQA activities and results to affected groups and individuals promptly [10].

6
Each member of the development organization is responsible for quality assurance.
However, a quality assurance team is often in charge of SQA work. Some pre-require-
ments must be attained to ensure effective SQA: first, the SQA team should be an inde-
pendent unit in the organization [7 pp. 130]. The SQA team works as a third party to
inspect the execution of software development. It provides developers and management
with information on product and process quality based on whether the software project
follows defined plans, standards, and procedures, improving project transparency and
achieving high-quality software products. Second, top management must understand the
importance of software quality and support SQA work [7 pp. 129]. Third, it is important
to build an SQA organization with competence in software quality management and tech-
nical skills [7 pp. 130].
Software quality assurance methods can be categorized into two types: the technical
method and the management method. The technical method is a post-event control that
includes debugging, testing, and technical review, with the aim of identifying quality de-
fects [9]. Software testing is one of the most used technical methods and is discussed in
Section 2.4. The management method involves prevention that aims to control quality
defects through standardization and process management, such as the capability ma-
turity model (CMM) and ISO [9]. Solving problems by technical methods has certain lim-
itations, and standards can only advise what is required and not how to achieve it. Com-
pared to “post-event activities,” prevention is more important in quality assurance. A qual-
ity assurance system should also focus on user satisfaction and future problem preven-
tion.
2.4 Software Testing
The evolution of software testing has followed the same path as software development.
During early software development, in the 1950s–1970s, although the software was less
complex, the software development process was disorganized. Testing was limited. De-
velopers equated testing with “debugging” to correct the software and completed this
part of the work themselves [4 pp. 3-5]. The investment in testing was minor, and the
testing was often involved too late after the product was completed.
After the 1980s, the software and IT industries made huge strides. Software became
more complex, and quality became more important in software development. During this

7
period, numerous software development processes and frameworks were created and
transformed into structured methods of analysis, design, review, and testing [2]. The
concept of “quality” was introduced. Software testing became the prime function of SQA
[2].
As stated in the American National Standards Institute (ANSI)/IEEE 1059 standard, the
definition of software testing is as follows:
Testing is the process of analyzing a software item to detect the differences be-tween existing and required conditions (that is defects/errors/bugs) and to evaluate the features of the software item.
This definition states that the purpose of software testing is to verify whether the software
meets the requirements. It reflects the primary functions of SQA.
Software testing is not a onetime activity during the late stage of development but is
integrated with the entire development life cycle, wherein testing is a continuous process
to improve the software quality. It involves a series of managed activities, including test
planning, test monitoring and control, test analysis, test design, test implementation, test
execution, exit criteria evaluation, reporting, and test closure activities [3 pp. 9]. The soft-
ware testing life cycle (STLC; Section 2.5) is explained in the following text.
Two methods of conducting software testing exist: manual and automated. The auto-
mated method involves two aspects: the execution of tests using automation and auto-
matic procedures for managing tests and tracking results [12]. Test automation, contin-
uous integration (CI), and continuous delivery (CD) are becoming increasingly important
as the core practices of the agile software development method. More details of TA are
explained in Chapter 3.
Different classifications of software testing levels exist [5 pp.30-38]. According to Inter-
national Software Testing Qualifications Board (ISTQB) foundation syllabus, test levels
include component testing, integration testing, system testing, and acceptance testing [5
pp.30-38]. Each level incorporates a group of test activities with its own testing process
embedded in the software development life cycle (SDLC). Software test types [5 pp. 39-
42] include functional testing, non-functional testing, white box testing, and change-re-
lated tests (e.g., confirmation testing and regression testing) [5 pp. 39-42]. Every test

8
type can be performed at any test level. It is important to choose suitable test types for
different test levels.
2.5 Software Testing Life Cycle
A software testing life cycle refers to a series of specific phases being executed in a
defined order to ensure that the product quality meets the requirements [3 pp. 8-15].
Each phase involves different entry criteria, activities, and deliverables. During the pro-
cess, each phase is completed in order. The phases in the STLC usually comprise the
phases shown in Table 1.
Table 1. Summary of STLC phases and activities [11], [3 pp. 8-15].
Phases Activities
Requirements • Prepare a list of requirements and inquiries and obtain solutions from technical managers/responsible persons, system architects, business analysts, and customers.
• List the test types to be performed (performance, functional, and secu-rity).
• List the test environment details, which should include all the tools.
Planning • Define the test strategy.
• Define goals, metrics, and the software testing scope.
• Identify test environments, tools, and resources.
• Define the test schedule, monitoring, and control procedures.
• Determine roles and responsibilities.
• List the test deliverables.
• Identify risks (if any) and determine mitigations.
Analysis • Specify the test conditions based on requirements and risks.
• Specify the exit criteria.
Design • List the detailed test conditions and sub-conditions.
• Identify test cases and prepare test data.
• Set up test environments.
• Create traceable metrics.
Implementation • Create test cases and prioritize them based on the analysis.
• Review test cases and sign off.
• Ensure test environments and test data are ready.
• Define the test execution schedule for manual and automated test runs.
Execution • Execute test cases according to priority.
• Track test results, including metrics.
• Report and log defects.

9
• Start the control procedure if necessary.
Conclusion • Review exit criteria.
• Report to different stakeholders.
• Ensure the risks are mitigated according to plan.
Closure • Review software completion criteria based on test coverage, quality, time consumption, cost, and key business objectives.
• Deliver artifacts.
• Conduct lesson-learned sessions.
The eight STLC phases are interconnected and mutually reinforced. Each phase is in-
dispensable. The testing process can vary according to the context. As mentioned ear-
lier, software testing connects to software development. Thus, the SDLC can affect the
testing process. Other contextual factors, such as test levels, test types and test re-
sources defined by the test strategy, product risks, business domains, operational con-
straints, and required standards, affect how the testing process is defined [3 pp. 17].
2.6 Testing Process Improvement
Several methods can improve the testing process, including using the Deming cycle or
using a test maturity model to assess the testing capability and maturity level. The fol-
lowing sections introduce the two methods.
2.6.1 The Deming Cycle
The Deming cycle, shown in Figure 1, known as plan-do-check-act (PDCA) cycle, origi-
nated from the Shewhart cycle created by Walter A. Shewhart, the father of statistical
quality control [21]. Shewhart introduced the prototype of plan-do-see (PDS) [22]. Later,
William E. Deming further perfected Shewhart’s PDS cycle and developed it into PDCA
[22]. This model is used for continuous quality improvement.

10
Figure 1. The Deming cycle [23]
As shown in Figure 1, the Deming cycle is iterative and comprises a four-step process
[23]:
- P (Plan)—Through collective discussion or individual thinking to analyze the cur-
rent situation, pinpoint the problems, decide a series of actions as “control points”,
and establish objectives for improvement.
- D (Do)—Take actions according to the plan and collect data for checking.
- C (Check)—Check or study the data collected from execution; for example, com-
pare the actual results to the objectives. Check the control point during the exe-
cution of the plan, analyze how the plan was implemented and whether it met
expectations, and identify any issues.
- A (Action)—The result of the inspection is processed, approved, or denied. Suc-
cessful actions should be affirmed or standardized; failed lessons should be sum-
marized to avoid their recurrence. The unresolved problems of the current itera-
tion should be moved to the next PDCA cycle.
Implementing improvements should be monitored. The metrics should be analyzed to
confirm the effectiveness of the Deming cycle.

11
2.6.2 Test Maturity Models
A model-based approach is used to assess and improve the testing process. Two cate-
gories of test process improvement models exist: process reference models and con-
tent reference models [23]. Process reference models include the test maturity model
integration (TMMi) model as staged representation and the test process improvement
(TPI) NEXT model as continuous representation [23]. Content reference models include
the critical testing process (CTP) model and systematic test and evaluation process
(STEP) model [23]. These models provide a basis for evaluating the maturity level of the
software development organization and further improvements. They promote the im-
provement of the overall software testing process, software quality management, and
product quality. In the following sections, the two most common models are introduced.
The TPI NEXT Model
The TPI NEXT model includes 16 predefined KAs, four maturity levels, and 157 check-
points [23]. Table 2 shows a high-level summary of the TPI NEXT model and the mean-
ing of each maturity level. The four levels from low to high are initial, controlled, efficient,
and optimizing. The initial level indicates no process, and all activities are ad hoc. The
controlled level indicates that test process activities are performed correctly. The efficient
level indicates that the test process is implemented efficiently. The optimizing level indi-
cates continuous adaptation. All KAs include several checkpoints classified with four ma-
turity levels that form a path of maturity levels for improvements. The checkpoints assess
KAs via a scale (i.e., scales 1–5 indicate controlled, 6–10 indicate efficient, and 11–13
indicate optimizing) [23]. A maturity matrix is formed based on assessment results, which
visualizes and summarizes the maturity level of each KA.
Table 2. TPI NEXT model [23].
Group Level Controlled Efficient Optimizing
Stake-holder relations
Stakeholder commitment
• identity of principle stakeholder
• budget availability
• stakeholder relia-bility
• product risk analy-sis
• identity of all other stakeholders
• level of stake-holder involve-ment
• line management commitment
• stakeholder adapt-ability

12
Degree of in-volvement (of testing)
• test assignments
• involvement in project planning and risk analysis.
• involvement in de-fect analysis, change requests, and improving test basis.
• standing of the test team within the organization
• involvement in les-sons learned.
Test strategy
• agreements with principal stake-holder
• relationship of test strategy to risks
• retest and regres-sion test strate-gies.
• agreement with all stakeholders
• coverage of test levels and test types
• adequacy of test design techniques used.
• process of test strategy creation
• effectiveness of test strategy based on produc-tion defect met-rics.
Test organiza-tion (TO)
• people, tasks, and responsibilities
• structure of ac-countability of TO
• TO services and products.
• coordination and delivery of testing activities and ser-vices
• TO in the overall organization
• compliance with test policy.
• optimization of TO services and prod-ucts
• accountability of TO for suc-cess/failure of test assignment
• benchmarking of TO.
Communication
• awareness and traceability of de-cisions, actions, and status
• interaction of test team and stake-holders in ex-changing infor-mation and deci-sion-making.
• specific infor-mation flows
• meeting participa-tion
• adequate means of communication.
• continuous im-provement of communications.
Reporting
• basic information in written reports
• frequency and suitability of re-porting for stake-holder needs.
• balance of needs and costs
• trends and recom-mendations.
• used for continu-ous test process improvement
• used for continu-ous software pro-cess improvement in organization.
Test manage-ment
Test process management
• test plan and con-tents
• agreement be-tween principal stakeholder and other stakeholders
• monitoring and controlling.
• handling of test plan deviations
• adjustment of test plan and resource reallocation.
• continuous im-provement of test process manage-ment.
Estimating and planning
• estimating tech-niques used
• planning infor-mation created
• agreement with principal stake-holder.
• accuracy of esti-mating and plan-ning for all test ac-tivities
• testability of test basis.
• reuse of testware for improved test planning
• estimating tech-niques, principles, and metrics at or-ganization level.

13
Metrics
• metrics for esti-mating and con-trolling project
• systematic record-ing and storage
• accuracy of met-rics.
• balance of needs and costs
• impact of collec-tion on test pro-cess
• test process effi-ciency metrics
• interpreting and acting on metrics.
• contribution made by metrics to test process improve-ment.
Defect manage-ment (DM)
• defect lifecycle and responsibili-ties
• basic defect items recorded
• accessibility of DM tool.
• DM tool support for DM life cycle
• further defect items recorded
• commonality of DM tool
• reporting capabil-ity of DM tool
• use of defect trends.
• availability of DM guidelines for pro-jects
• organizational support for DM
• root cause analy-sis and defect pre-vention.
Testware man-agement
• identifying by name and version
• test case relation-ship to test basis
• accessibility
• procedures used.
• referencing by name and version
• traceability of test cases to require-ments
• storage, roles, and responsibilities.
• conservation of testware for reuse.
Test pro-fession
Methodology practice
• documented test method used
• applicability to project context
• usefulness of test method.
• recorded infor-mation
• conditional, op-tional, and manda-tory aspects
• use of templates.
• continuous im-provement of test method.
Tester profes-sionalism
• training and expe-rience of testing staff
• familiarity with test method
• availability of all expertise needed
• evaluation of test-ing staff skills.
• available certifica-tions
• justification of cho-sen techniques
• performance of tasks
• job satisfaction of testing staff.
• participation in skill development activities
• career paths for testers
• accountability and responsibility for own work
• continuous im-provement of own work process.
Test case de-sign
• level at which test cases are rec-orded
• type of test case information.
• understandability of test cases by peers
• coverage of test basis
• techniques used
• use of checklists.
• improvement of test case design using defect anal-ysis
• test case validity and maintainability
• future use of tech-niques.
Test tools
• availability, use, and benefits gained
• knowledge levels present.
• selection criteria and creation of business case
• integration into the test process.
• consistency of tools policy and test policy

14
• reuse of expertise and tools best practices
• achievement of business case.
Test environ-ment
• requirements
• supplier agree-ments
• availability change procedures.
• design and ac-ceptance of test environment
• service-level agreements.
• ownership
• contractual agree-ments
• services provided.
Based on the maturity matrix, a test improvement plan is written. The improvement plan
focuses on two objectives: the unachieved checkpoints and the suggestions on the ac-
tions to be taken to achieve better maturity levels [23]. The relevant organization should
then set priorities for improvements.
The TMMi model
The TMMi model was developed by the Illinois Institute of Technology and is now man-
aged by the TMMi Foundation [24 pp. 6]. The primary aim of this model is to optimize
the testing process. As shown in Figure 2, the model comprises five staged maturity
levels: initial, managed, defined, measured, and optimization [24 pp. 9]:
- Level 1—Initial indicates that no defined test process exists. The software testing
is exploratory or ad hoc.
- Level 2—Managed indicates that test strategies and policy, test plans, test cases,
and test environments are formed according to the software-building require-
ments. The entire test objective is based on risk management. The primary pur-
pose of this level is to develop the product according to the requirements and
achieve the creation and compliance of test cases and test plan documents [24
pp. 10].
- Level 3—Defined indicates that the testing process is integrated with the SDLC
and standardized across the organization. Testing is conducted independently by
a separate organization with monitoring and control. Periodic reviews are con-
ducted. This level’s primary aim is to build a clearer image for the organization,
helping them achieve the desired quality [24 pp. 10-11].
- Level 4—Measured indicates that the testing process is measurable across the
organization. The product quality is tested throughout its lifecycle. Reviews and
inspections are integrated with the testing process [24 pp. 11].

15
- Level 5—Optimization indicates that the organization focuses on defect preven-
tion. Test assets are re-used. The testing process is continuously improved and
characterized by quality measurements [24 pp. 11-12].
Figure 2. TMMi model [24 pp. 9]
Each level encompasses predefined process areas (PAs) with specific practices (SPs)
under specific goals (SGs) and generic practices (GPs) under generic goals (GGs) [23
pp. 14]. Table 3 summarizes PAs and SGs from TMMi level 2 to level 5. Level 1 is an
initial level; thus, it has no PAs and SGs.
Table 3. Summary of PAs and SGs for TMMi model levels 2–5 [23 pp. 24-199].
Process Area Special Goals
Level 2—Managed
2.1 Test Policy and Strategy • Test policy is established, agreed by stakeholders, and aligned with business.
• Organizational test strategy is established.
• Test process is measured by test performance indicators.

16
2.2 Testing Planning • Critical areas of testing are identified by product risk assess-ment.
• A test approach is established based on product risks.
• Test work estimation is structured and maintained for plan-ning testing activities.
• A test plan is created for managing testing activities and communicating with stakeholders.
• Test plan is reviewed and achieved commitments.
2.3 Test Monitoring and Control • Testing progress and performance is monitored against de-fined values.
• Product quality is monitored against defined measurements.
• Deviations are managed with corrective actions to closure.
2.4 Test Design and Execution • Test design techniques are used in test conditions and test cases during analysis and design.
• Test data is created, execution schedule is defined, and pro-cedures are created.
• Test cases are executed based on procedures and schedule, defects are reported, and logs are saved.
• Defects or incidents are resolved to closure.
2.5 Test Environment • Test environment requirements are created based on needs, constraints, and expectations.
• Test environments are implemented according to require-ments and are usable during test execution.
• Test environments are managed and resilient to interrup-tions.
Level 3—Defined
3.1 Test Organization • A test organization supports testing practices.
• Test specialist is assigned to test functions according to job descriptions.
• Testers career paths are constructed.
• Test process is periodically reviewed, and changes are planned and implemented.
• Organizational test process is deployed across the organiza-tion and incorporate lessons learned.
3.2 Test Training Program • An organizational test training capability is built and main-tained to support test roles.
• Testers and others involved in testing are supplied with suffi-cient trainings.
3.3 Test Lifecycle and Integration • Organizational test process assets are set and maintained.
• Test lifecycle is integrated with development lifecycles, early testing is ensured.
• A master test plan is defined, including test approach, test levels and test plan.
3.4 Non-functional Testing • Critical areas for non-functional testing is identified according to product risk analysis.
• Test approach is created and agreed based on non-func-tional product risks.
• Non-functional test conditions and test cases are based on test analysis and design.
• Non-functional test data is created, and procedures are de-fined.
• Non-functional tests are executed based on procedures and schedule, incidents are reported, and logs are saved.

17
3.5 Peer Reviews • Peer-review approach is defined and agreed.
• Peer review is conducted on work products.
Level 4—Measured
4.1 Test Measurement • Test measurements are aligned with needs and objectives.
• Test measurement results are supplied and reviewed against needs and objectives.
4.2 Product Quality Evaluation • Project goal for product quality is measurable and is estab-lished and maintained.
• Product quality goals are monitored, quantified, and man-aged with corrective actions.
4.3 Advanced Reviews • Peer-review approach is aligned with dynamic testing.
• Product quality is measured by peer reviews early in the lifecycle.
• Test approach is adjusted based on early peer-review re-sults.
Level 5—Optimization
5.1 Defect Prevention • Common and root causes of defects are determined.
• Common and root causes of defects are prioritized and sys-tematically eliminated.
5.2 Quality Control • Test process is controlled, and performance is as expected based on quantitative objectives.
• Statistical methods are used in test design and executions.
5.3 Test Process Optimization • Test process improvements support quality and process per-formance.
• New testing technologies are identified and tested to deter-mine their value to the testing process.
• Test improvements are supported by new testing technolo-gies and deployed across the organization. The benefits are measurable and shared with the organization.
• High-quality test process components and testware are re-used across the organization.
The assessment is conducted based on the “TMMi Assessment Method Application Re-
quirements” (TAMAR) [23]. Rules and requirements must be followed to gain con-
sistency. A sufficient quantity and depth of assessment evidence must be available to
conclude the maturity level. Each piece of evidence must prove that a goal (SG or GG)
of a PA is achieved. A PA is scored by a four-level scale: N (not achieved), P (partially
achieved), L (largely achieved), and F (fully achieved) [23]. Here, N indicates that 0%–
15% of the goals are fulfilled; P that 15%–50% are fulfilled; L that 50%–85% are fulfilled;
and F that over 85% are fulfilled. The maturity level is then determined according to the
lowest classified PA [23]. Future improvements are referenced from the TMMi’s frame-
work.

18
Besides the above two most used models, other models such as the test management
approach (TMap) and personal test maturity matrix (PTMM) are also used for assess-
ment. It is noteworthy that these models do not focus on the TA process.

19
3 Test Automation
This chapter describes the purpose of TA, its value, and the key factors for achieving
successful TA.
3.1 Definition and Usage of Test Automation
No authoritative definition of TA exists. Based on the author’s experience, TA is the au-
tomation of software testing. It replaces test scripts with codes, manual test steps with
code execution, and manual result comparison with automatic predefined assertions. It
is an automated process involving compilation, deployment, execution, and report gen-
eration. It covers unit testing, functional testing, performance testing, graphical user in-
terface (GUI) testing, security testing, and database testing.
Although TA has become the dominant software testing method, it can never completely
replace manual testing because it cannot achieve the manual testing coverage. Not
every test case is suitable for automation [18 pp.13]. For example, if a test engineer
needs to advise whether a page layout is correct, they can find more defects within a
brief time with manual testing than by using TA.
Test automation is more suitable for situations [18 pp.12] when the software develop-
ment period is long, the software version is constantly updated, and the requirements
are not often changed. When repeated testing is required, such as reliability testing and
regression testing, this may require frequent executions, such as daily or even hourly or
when new changes are committed to the source code. If the software version is unstable,
the functionalities may be changed often, and TA is unsuitable. When the TA plan,
measures, or most objects are unrecognizable and test script maintenance is frequent
or difficult, TA implementation fails.
Although companies value the reusability of automated testing, this attribute can be
sometimes seen as a disadvantage. When the repeated test execution cannot detect
errors that exceed its framework, manual testing is a better choice. This ambiguity indi-
cates that the decision to implement TA should be made according to the product re-
quirements and particularities of the project.

20
3.2 The Significance of Test Automation
An example is the quality inspection in a manufacturing plant. Quality assurance staff
check the quality of the product manually. As the production scale expands and the pro-
duction becomes faster, the manual quality inspection becomes the bottleneck of effi-
ciency because the production speed far exceeds the speed of manual quality inspection
and testing. The rate of human error increases because of the increased workload, re-
sulting in personnel fatigue or inertial thinking. Increasing the number of quality inspec-
tion staff to maintain efficiency increases the labor cost. Automated quality inspection
solves the above three key problems. When the workload increases, the labor force can-
not always rotate; thus, it is necessary to increase the labor force to work in three shifts.
However, the automation system can run continuously.
As in the above example, TA addresses the same problems in SQA. In the context of
agile development, where software development is fast-paced, time-to-market pressure
is high. The execution efficiency of the TA system far exceeds the manual efficiency. It
provides rapid feedback to the development team. It does not make mistakes because
of continuous operation or become fatigued or lazy. With the characteristics of repeata-
bility, the automated test scripts can be fully reused in multiple environments. Test auto-
mation can run cumbersome tests efficiently and run tests that are impossible for manual
testing to achieve.
The value of TA is not limited to the technical level; it also balances the software devel-
opment costs in the long term. When a feature is added to existing software, it increases
its complexity. Over time, especially under the pressure of rapid delivery, it becomes
more difficult for developers and testers to maintain the quality of software. Whether it is
inherent or accidental [13 pp. 6], increased complexity accompanies added features.
This inevitably increases the total software development costs because of the extended
effort and time developers and testers spend on testing and fixing bugs. Test automation
makes running regression test suites more convenient, reliable, and cost-effective. Be-
sides TA, regular refactoring can control the complexity to stabilize the cost [13 pp. 9-
10].
Test automation not only relates to software quality and software development produc-
tivity but also interconnects many aspects of software development, such as architecture,
business structure, working practices, business culture, and documentation [13 pp. 10-

21
11]. These aspects impact TA, which can reflect the associated problems; thus, the or-
ganization can address these problems.
When implementing TA, many important factors need to be considered in advance. The
key factors of achieving successful TA are discussed in the following sections.
3.3 Test Automation Strategy
Although TA can improve test efficiency, it requires substantial investment, including
maintaining the test environment and test cases and developing test scripts. Therefore,
a good TA strategy should be established before implementation. This strategic decision
should consider the following aspects.
3.3.1 The Tests Should be Automated
The tests can be divided into prefunctional and cross-functional tests [14 pp. 50]. The
former verify different output data corresponding to specific input data of an operation,
including customer tests on the business level, component tests, and unit tests, which
can be fully automated [14 pp. 51-52]. The latter verify various aspects of the software
system characteristics, including exploratory testing, usability tests, and property testing,
which are mainly manual testing [14 pp. 52-53].

22
Figure 3. Testing quadrants [15 pp. 98]
The testing quadrants adopted from Brian Marick and Lisa Crispin (shown in Figure 3)
suggest considering testing types from a broader perspective.
- Quadrant 1 (Q1) [15 pp. 99] lists technology-facing tests that support the
team and are associated with TA. The primary goal is to use development
practices enabling continuous development; Q1 comprises unit and compo-
nent tests.
- Quadrant 2 (Q2) [15 pp. 99] lists business-facing tests that support the team
and are associated with automated and manual testing. The primary goal is
to ensure that testing is aligned with the business needs and enables itera-
tive development; Q2 comprises functional, system, and regression tests.
- Quadrant 3 (Q3) [15 pp. 101-102] lists business-facing tests that critique the
product and are associated with manual testing. The key goal is to evaluate
the solution to be delivered and its use from the user’s perspective; Q3 com-
prises functional acceptance tests and solution acceptance test support.
- Quadrant 4 (Q4) [15 pp. 102-103] lists technology-facing tests that critique
the product and are associated with automated tools. The primary aim is to
cover integration and non-functional testing, such as performance, monitor-
ing, and security; Q4 comprises equipment and interface integration tests,
data migration tests (if any), and non-functional tests.
3.3.2 Test Automation Pyramid
Testing must be layered. A TA pyramid can help define how each level of tests can be
automated. The TA pyramid was first introduced by Mike Cohn in 2009. When it was first
proposed, it was a three-tiered pyramid, with user interface (UI), service, and unit tests
from top to bottom [17]. Lisa Crispin later added the manual test to the pyramid [15
pp.277] in her book “Agile Testing.” The test pyramid shifts from focusing on the number
of tests to focusing on the quality of tests. It recommends increasing the bottom-level
test investment.
23
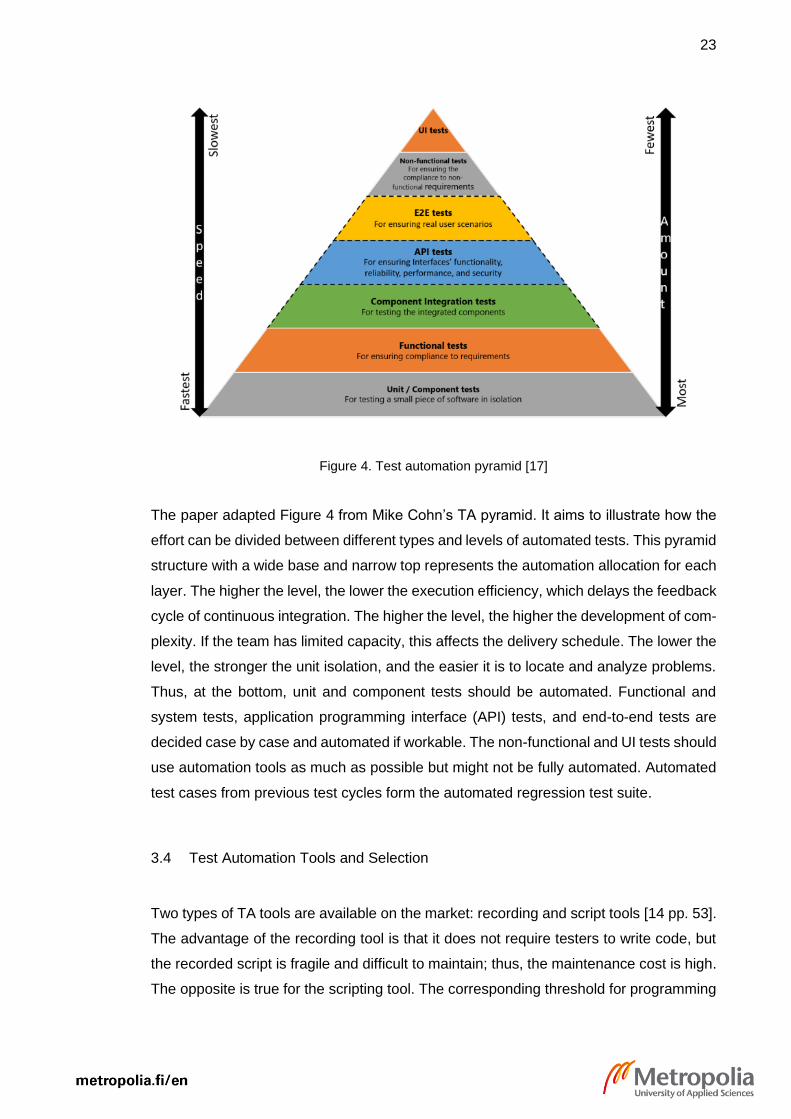
Figure 4. Test automation pyramid [17]
The paper adapted Figure 4 from Mike Cohn’s TA pyramid. It aims to illustrate how the
effort can be divided between different types and levels of automated tests. This pyramid
structure with a wide base and narrow top represents the automation allocation for each
layer. The higher the level, the lower the execution efficiency, which delays the feedback
cycle of continuous integration. The higher the level, the higher the development of com-
plexity. If the team has limited capacity, this affects the delivery schedule. The lower the
level, the stronger the unit isolation, and the easier it is to locate and analyze problems.
Thus, at the bottom, unit and component tests should be automated. Functional and
system tests, application programming interface (API) tests, and end-to-end tests are
decided case by case and automated if workable. The non-functional and UI tests should
use automation tools as much as possible but might not be fully automated. Automated
test cases from previous test cycles form the automated regression test suite.
3.4 Test Automation Tools and Selection
Two types of TA tools are available on the market: recording and script tools [14 pp. 53].
The advantage of the recording tool is that it does not require testers to write code, but
the recorded script is fragile and difficult to maintain; thus, the maintenance cost is high.
The opposite is true for the scripting tool. The corresponding threshold for programming

24
skill is high, while the maintenance cost is relatively low. However, this does not indicate
that only one tool can be used; this depends on the test level and test types defined in
the test strategy, from which the requirements for the tool can be identified.
Many automation tools support free software frameworks, such as Selenium and Appi-
um. Framework integration reduces the testing workload and increases collaboration be-
tween teams.
Most of the automated testing tools offer flexible scripting options. This allows the test
team to write test scripts in the preferred language. Good TA tools improve the reusability
of test components and provide flexible scripts that can be reused between projects.
Integration of the tools can form an ecosystem of collaborative efforts that can assist
object identification, support for CI and CD tools such as Jenkins, error logging, test case
management, report sharing, and shared repositories. These attributes [16] are usually
considered before choosing a tool.
The testing team should adopt the tools easily. The ease of adoption can be measured
based on the skills and learning curve required to use the tool. Tutorial resources are an
advantage. Additionally, community support should be checked. An active user forum is
an advantage of understanding the complexity of the tool.
When investing in TA, the cost of tools is a key point. Test automation tools can be costly.
In the long-term, TA can be cost-effective, especially in regression testing. Test automa-
tion reduces the effort associated with manual testing; however, development and
maintenance of automated scripts and review of test results require manual participation.
Open-source tools are recommended; however, not every open-source automation tool
has every feature that might be required. A commercially licensed tool can provide addi-
tional value; for example, some companies offer real-time support and training for pre-
mium programs. Besides the cost of tools and their infrastructures, labor costs should be
considered, including guidance on using and maintaining the tools.
25
3.5 Test Automation Framework
The TA framework (TAF) plays an important role in TA. It sets the guidelines for TA that
help test engineers to maintain tests consistently, improve the test structure, standardize
the code style, reduce code maintenance, increase reusability, involve non-technical
testers in participating in coding activities, reduce the training time for using the tool, and
use data reasonably [19]. The TAF should be established to be user-friendly, compre-
hensive, and maintainable [18 pp.14]. The following considerations can help to build such
a TAF. The more aspects are ensured, the better the outcome of TA [18 pp. 14]:
- Detailed statistical information about quality should be facilitated.
- Besides logging, easy access for troubleshooting failed tests should be enabled.
- Dedicated test environments should be configured according to requirements
and used only for TA.
- Each step in the test script should be traceable.
- The test script should be constructed for easy scalability and maintenance.
- The test script should be regularly updated and amended.
- The test script should be easily omitted when needed.
- The system under test (SUT) should be monitored and recovered when fatal er-
rors occur.
- Test scripts that are subject to interface and data change, or where the input data
depends on other tests’ output, should be avoided.
- The test environment should avoid being dependent on context.
3.6 Test Automation Organization
A new era of software development methods, such as agile and DevOps, has replaced
the old waterfall model, and the demand for software testing continues to grow in the
industry. Testing organizations are now working together with development organiza-
tions. As TA has gradually replaced manual testing, the TA organization is of fundamen-
tal importance to TA success.
Test automation testers must not only understand the basic testing theory and have basic
testing ability [3 pp. 71]; they must also have software programming capabilities because
automated test scripts are often written in code. When the script is executed, the source

26
code generates output based on the assertions in it. Some TA tools allow test engineers
to write scripts with keywords rather than code. Soft skills are important besides technical
skills (e.g., communication, learning, observation ability, concentration, and test thinking)
in supporting the team’s communications [3 pp. 73].
The team must comprise skilled TA testers, have efficient communications with all stake-
holders, and have problem-solving abilities. Team members should be motivated to per-
form automation tasks [3 pp. 75].
3.7 Test Automation Process
Test automation, as part of software testing, incorporates similar phases to the STLC.
Its phases and activities are shown in Table 4.
Table 4. Summary of phases and activities of TA process [20].
Phases Activities
Requirements • Analyze the test requirements and testability of the SUT.
• Design the test requirement tree according to the test plan, require-ments, and specification.
Planning
• Define the test strategy for TA.
• Clarify the TA objects.
• Define the TA scope, including the content, test method, test schedule, and test environment.
• Ensure that the workforce, hardware, test data, and other resources re-quired for the test are fully prepared.
• Select the TA tools.
• Define the deliverables.
Design
• Design the TA framework.
• Design the TA test cases that can cover all the required points.
• Define the test data.
Implementation
• Set up a test environment.
• Generate test data.
• Write the test scripts.
• Comply with management standards for unified test management and maintenance.
27
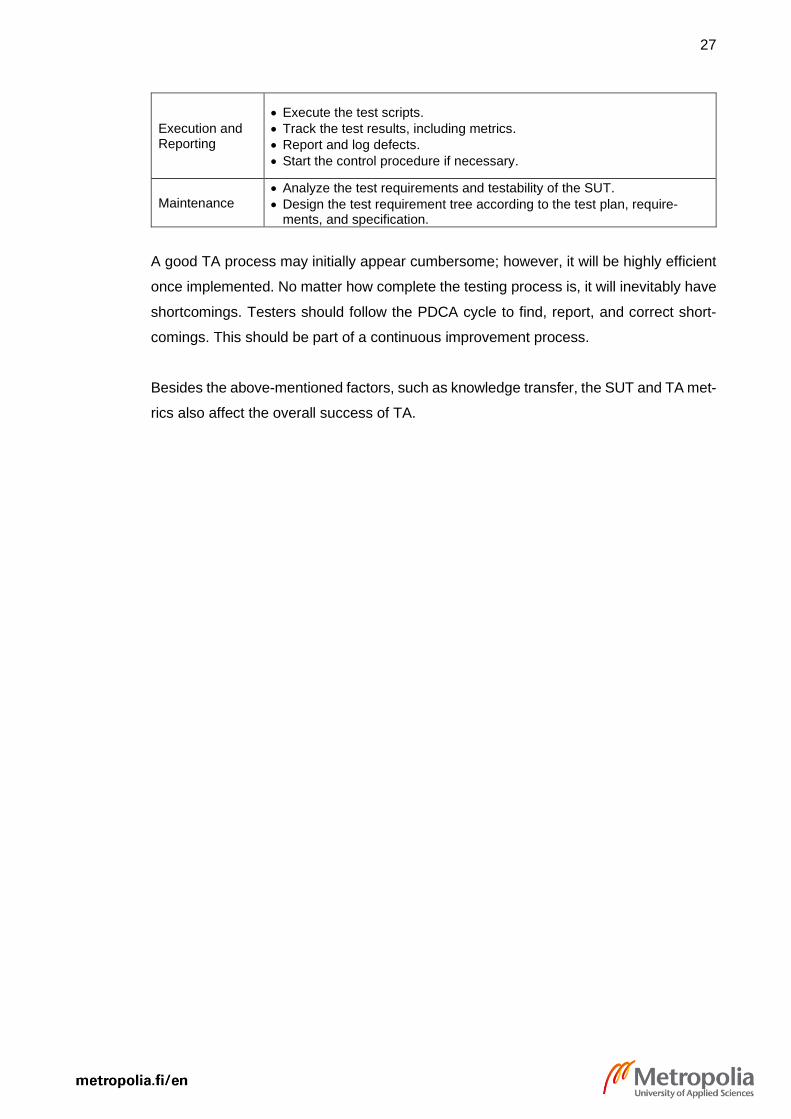
Execution and Reporting
• Execute the test scripts.
• Track the test results, including metrics.
• Report and log defects.
• Start the control procedure if necessary.
Maintenance • Analyze the test requirements and testability of the SUT.
• Design the test requirement tree according to the test plan, require-ments, and specification.
A good TA process may initially appear cumbersome; however, it will be highly efficient
once implemented. No matter how complete the testing process is, it will inevitably have
shortcomings. Testers should follow the PDCA cycle to find, report, and correct short-
comings. This should be part of a continuous improvement process.
Besides the above-mentioned factors, such as knowledge transfer, the SUT and TA met-
rics also affect the overall success of TA.

28
4 Implementation of Assessment
This chapter reports the implementation of the assessment including the utilization of TA
assessment model, the construction of the survey questionnaire, the aggregation of sur-
vey answers, and the analysis of the assessment results.
4.1 Assessment Model
This study examined the requirements for assessment model from the following aspects
[23]:
- The model content should be easy to use, well-researched, give sufficient details
and support improvement suggestion process. For this assessment project, the
model must support in-depth evaluation of TA.
- The model design should support end-to-end self-assessment, suggest improve-
ment in small and manageable manner, assist improvement prioritization and
flexible adoption to various projects or organizations.
Other formal considerations include conditions [23], such as
- The model is publicly recognized and supported.
- The integrity and quality of the model is accepted by software testing industry.
- The model is not biased.
- It may issue an organization formal certificate of its assessed level.
Based on the research in the background part of the study, TPI NEXT model and TMMi
model have good content and design, but they concentrate only on general testing pro-
cess assessment and improvement. Although they are used by testing industry, they do
not supply sufficient descriptions of needed improvements for TA.
In 2014, a group of experts developed a maturity model for TA assessment — Test Au-
tomation Improvement Model (TAIM) [25]. It is by far the finest model for test automation
improvement that covers end-to-end view of test automation testing process with holistic
approach. The work was published in 2014 that introduced one general area and ten

29
Key Improvement Areas (KIA) in TAIM: test management, test requirements, test speci-
fications, test code, test automation process, test execution, test verdicts, measurement,
test environment, and test tools [25]. A recent study [26] has developed 15 KAs into TAIM
after further revisions. All KAs correspond to several assessment practice items. Alt-
hough this model is still under research, and the maturity levels have yet published, its
overall design and composition provide complete details for TA assessment. With its
existing content, one can still find deficiencies in TA process by utilizing TAIM as the
assessment model.
4.2 Assessment Key Areas
There are 15 KAs included in the assessment [26]:
- Test automation strategy (see Section 3.3).
- Resources refer to TA workforce, time, and budget.
- Test organization (TO) (see Section 3.6).
- Knowledge transfer refers to the relevant information and knowledge is shared
and maintained within a company.
- Test tool selection (see Section 3.4)
- Test tool use refers to the use of tool.
- Test environment refers to the setups including hardware, software, data (see
Section 3.5).
- Test requirement (see Section 3.7)
- Test design (see Section 3.7)
- Test execution (see Section 3.7)
- Verdicts refers to the collected result of test executions on which test report shall
be based.
- Test automation process (see Section 3.7)
- Software under test (SUT) refers to testability and maturity of the software to be
tested by TA.
- Measurements refer to the quantified measures to determine the quality and per-
formance of TA.
- Quality attributes (see Section 2.2) refer to the testware’s quality attributes.

30
Several practices are defined for each KA. Table 5 summarizes each KA and its included
practices, highlighting the aspects that must be considered in the assessment.
Table 5. Summary of TAIM KAs [26 pp. 149-151].
Key Area Practices
1. Test Automation Strategy
• The TA strategy is created.
• The TA goals are set.
• A cost-effectiveness analysis of TA is conducted.
• Risk analysis is established.
• The test scope and degree of TA are defined.
• Overlaps between automated and manual testing are ex-amined.
• The gaps and overlap between test types and levels are examined.
• Resources to perform TA tasks are identified.
• Roles and responsibilities for TA tasks are identified.
• The effort estimation for TA tasks is calculated.
• Stakeholders’ feedback on changing the TA strategy is collected.
2. Resources • Enough skilled staff are assembled to perform TA tasks.
• The budget suffices to fund TA.
• Sufficient time is available for TA tasks.
• Enough test tools are available to support testing activi-ties.
• All required software, hardware, and test data are availa-ble in the test environment.
3. Test Organization • Members of the TO are motivated.
• The TO members have defined roles and responsibilities.
• The TO has an effective communication and problem-solving mechanism.
• Organizational and management support for TA is availa-ble.
• The TO has sufficient professional knowledge and tech-nical skills to perform TA tasks.
• The TO can maintain test tools in use.
4. Knowledge Transfer • The expertise, good practices, and good test tools are re-tained.
• Time for training and the learning curve is supported.
5. Test Tool Selection • The required features of the test tools are described.
• The attributes of the test tools are listed.
• Constraints are analyzed.
6. Test Tool Use • Preconditions to tool use are clarified.
• Business cases are set to analyze the return on invest-ment of each tool.
• New test tools are formally introduced to the organization.
• New test tools are experimentalized in pilot projects.

31
• Regular evaluations of test tools are conducted based on the goals.
• The rules and principles for using test tools are defined.
7. Test Environment • The requirements of the test environment are thoroughly understood.
• The configuration of the test environment is managed.
• The test environment and test data are tested before use.
• Support for the test environment is supplied.
• Test environment failure or dependencies are identified.
• Test data is used in compliance with regulations and leg-islation.
• Test data is managed correctly.
• The test environment matches the production environ-ment.
8. Test Requirements • TA requirements are collected in a defined manner.
• A controlled change process applies to TA requirements.
9. Test Design • Test design techniques are used.
• The test design patterns are recorded and reused.
• Test suites are structured for different purposes.
• Test design guidelines are defined.
• The test code is examined by static and dynamic meas-urements.
10. Test Execution • TA is used for prioritized test cases to meet the schedule.
• Automatic pre-processing tasks are executed before test execution.
• Automatic post-processing tasks are executed after test execution.
• Parallel executions for complex system.
• Critical failures of test execution are alerted.
11. Verdicts • The test oracles used to determine whether the system passes or fails the test are reliable and certain.
• The test result can be understood by monitoring the test status and progress.
• The test results summary is integrated from different sources.
• Test result insights are received by relevant stakeholders.
• Every stakeholder can see useful information from the dashboard.
12. Test Automation Process
• As part of the testing process, the TA process is struc-tured and stable.
• The TA and development cycle are conducted in parallel.
• The TA process supports other processes.
• TA development has fast feedback cycles.
13. Software Under Test
• The SUT has sufficient maturity to perform TA.
• The SUT has sufficient testability to perform TA.
• The SUT has sufficient speed to execute TA.
14. Measurements • TA is measured by appropriate metrics.
• Important attributes of TA are defined.

32
• Areas of improvement are recognized by using measure-ments.
• Regular feedback is given on each TO member’s perfor-mance.
• Measurements are visible in the test report and dash-board.
15. Quality Attributes • Portability
• Maintainability
• Efficiency
• Reliability
• (Re)usability
• Functionality
As classified in the above table, 76 practice items are the basis for assessment surveys.
4.3 Assessment Matrix
An assessment matrix was applied to illustrate the current maturity level of each practice
item in each KA. This study adopted a similar representation of the TPI NEXT model to
construct the scales and matrix.
The priority for each KA was agreed by both stakeholders and the QA organization, as
illustrated in Figure 5. The KA’s priority influenced the improvement priority. The improve-
ment should draw further attention to the higher priority areas, such as the TA strategy,
TO, test tool selection, test tool use, and the verdicts.

33
Figure 5. Defined KA priorities
As shown in Figure 6, L is low priority, H is high priority, and N is neutral priority. This
example explains the relationship between improvement priorities and maturity levels.
Here, KA1 and KA2 are marked as level B–Controlled; however, since the KA1 TA strat-
egy (H–high priority) has higher priority than KA2 resources (N–neutral priority), improve-
ment should first be focused on KA1.
Figure 6. Example of a KA assessment priority matrix
Each practice item was scored by survey respondents using a progressive scale from
low to high, including seven items: totally disagree, disagree, slightly disagree, neutral,
slightly agree, agree, and totally agree. These levels were mapped onto a numeric scale
(0–6) from low to high.
Key Area L N H
Test Automation Strategy x
Resources x
Test Organization x
Knowledge Transfer x
Test Tool Selection x
Test Tool Use x
Test Environment x
Test Requirements x
Test Design x
Test Execution x
Verdicts x +
Test Automation Process x
Software Under Test x
Measurements x
Quality Attributes x
Prioriry
Key Area L N H Initial Controlled Efficient Optimizing
Test Automation Strategy x X
Resources x X
Prioriry Level

34
Figure 7. Example of assessment matrix mapping
As an example, in Figure 7, the maturity level scale is divided into four categories from
low to high:
- Scale 0–1 marked with red is categorized as A: Initial.
- Scales 2–3 marked with yellow are categorized as B: Controlled.
- Scales 4–5 marked with green are categorized as C: Efficient.
- Scale 6 marked with blue is categorized as D: Optimizing.
The color marks provide a visual aid to locate the KA deficiencies and determine which
items require further improvement.
A practice item’s maturity level is determined according to the category with the most
frequent score. For example, in Figure 7, 10 occurrences of scale 1 for P1 fall into cate-
gory A, which is the most recurrent compared to other categories. Thus, the level of P1
is recorded as Initial.
If multiple categories have the same number of occurrences, the lower level is chosen.
For example (in Figure 7), for P3, categories A (scale 0), B (scale 2), and C (scale 4) all
contain 5 occurrences; thus, the level of P3 is marked as Initial.
4.4 Assessment Survey
A survey and interviews were the primary methods of assessment.
Level Optimizing
Category D
Scale 0 1 2 3 4 5 6
ID KA1. Test Automation Strategy
P1 The TA strategy is created. 10 1 1 1 1 1 1
P2 The TA goals are set. 0 1 1 0 14 0 0
P3 A cost-effectiveness analysis of TA is conducted. 5 1 5 0 5 0 0
P4 Risk analysis is established. 1 1 10 1 1 1 1
P5 The test scope and degree of TA are defined. 0 0 0 15 1 0 0
P6 Overlaps between automated and manual testing are examined. 0 1 10 2 3 0 0
P7 The gaps and overlap between test types and levels are examined. 1 10 1 1 1 1 1
P8 Resources to perform TA tasks are identified. 1 0 0 0 0 15 0
P9 Roles and responsibilities for TA tasks are identified. 0 0 0 0 0 0 16
P10 The effort estimation for TA tasks is calculated. 0 1 9 2 4 0 0
P11 Stakeholders’ feedback on changing the TA strategy is collected. 1 0 7 7 0 0 1
ScaleTotally
DisagreeDisagree
Slightly
DisagreeNeutral
Controlled
B
Initial
A
Totally
Agree
Efficient
C
Slightly
AgreeAgree

35
A survey questionnaire was constructed with closed-ended questions. The closed-ended
questions [31] required respondents to select the answers from a list of responses to
determine their degree of approving the statement.
A total of 80 questions covering 15 KAs (including 76 practice items) were asked. This
study used original questions from TAIM 77 instruments [27] as much as possible to
ensure the authenticity of each instrument. The original instruments were well con-
structed and concise. They have been revised many times by experts. Only a few ques-
tions were improved by this study to enhance the comprehensibility, for example, by
adding further examples and explanations of professional terms. To prepare for the data
entry and analysis, the numerical order of the questions corresponded to each practice
item, and the answers corresponded to the defined scale number specified in the as-
sessment matrix (see Section 4.3). The average completion time for the survey was 50
minutes.
This study chose respondents based on their job responsibilities and business relevance,
to reach a good effective rate. The survey was conducted among the nine SAFe teams.
At least one member of each team who was directly involved in the development or test-
ing process was invited to complete the survey. Twenty respondents were selected and
completed the survey, of which 20% were TA specialists, 50% were software developers
and technical specialists, 10% were testers, and 20% were business-relevant staff, such
as product owners and scrum masters.
Microsoft Forms were used for online survey. The online survey method overcame time
and location limitations and was convenient for conducting quantitative research on sur-
vey results. However, it was troublesome to conduct in-depth investigations. For self-
completed questionnaires, it was challenging to determine whether the respondents
completed them carefully and objectively, and whether they understood the questions
and the answering method.
To mitigate the negative impact on the survey result, individuals or groups of respondents
were asked further questions via web meetings or chats (e.g., using Microsoft Teams
and Flowdock) that required respondents to provide a further description of the subject
and consider a more precise condition of it, such as the SUT, product risks, team com-
position, and job descriptions. Further questions were asked based on survey responses,
for example, when respondents assigned a practice item a better or worse score than
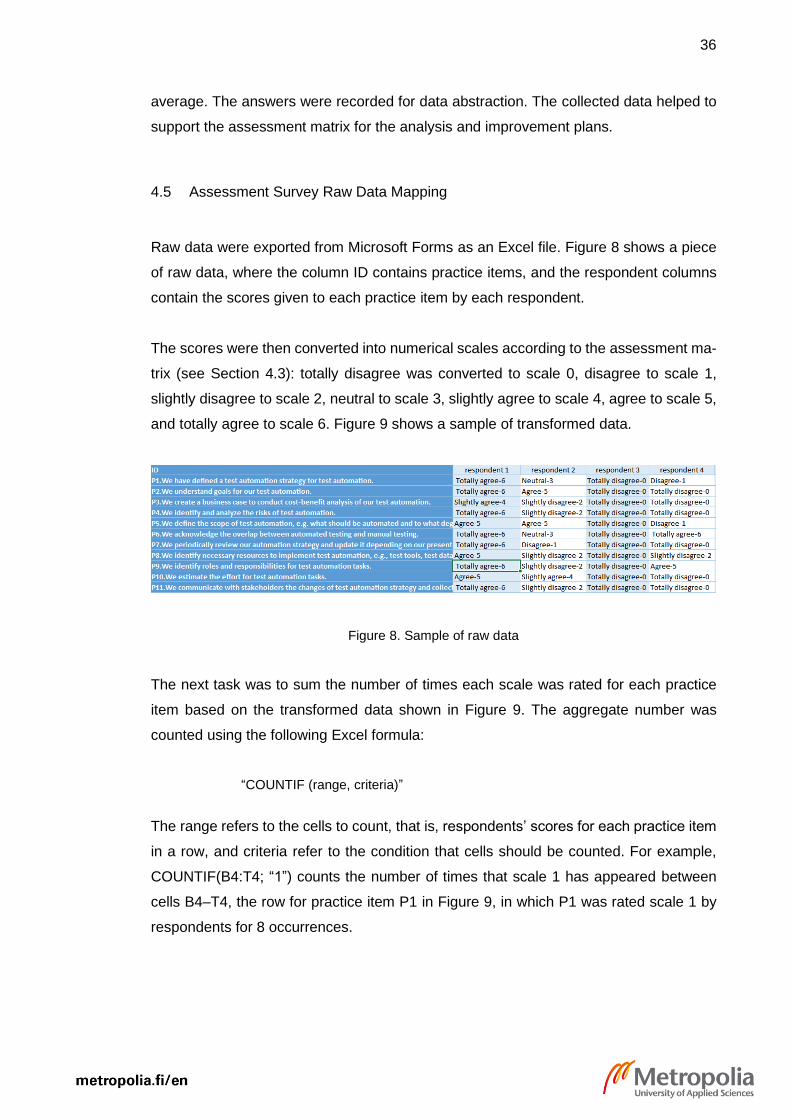
36
average. The answers were recorded for data abstraction. The collected data helped to
support the assessment matrix for the analysis and improvement plans.
4.5 Assessment Survey Raw Data Mapping
Raw data were exported from Microsoft Forms as an Excel file. Figure 8 shows a piece
of raw data, where the column ID contains practice items, and the respondent columns
contain the scores given to each practice item by each respondent.
The scores were then converted into numerical scales according to the assessment ma-
trix (see Section 4.3): totally disagree was converted to scale 0, disagree to scale 1,
slightly disagree to scale 2, neutral to scale 3, slightly agree to scale 4, agree to scale 5,
and totally agree to scale 6. Figure 9 shows a sample of transformed data.
Figure 8. Sample of raw data
The next task was to sum the number of times each scale was rated for each practice
item based on the transformed data shown in Figure 9. The aggregate number was
counted using the following Excel formula:
“COUNTIF (range, criteria)”
The range refers to the cells to count, that is, respondents’ scores for each practice item
in a row, and criteria refer to the condition that cells should be counted. For example,
COUNTIF(B4:T4; “1”) counts the number of times that scale 1 has appeared between
cells B4–T4, the row for practice item P1 in Figure 9, in which P1 was rated scale 1 by
respondents for 8 occurrences.

37
Figure 9. Sample of transformed data
As shown in Figure 10, the numbers listed in each scale column are the aggregate
counts.
Figure 10. Sample of aggregate data
Base on the occurrences of each scale in each category, the level of each practice item
was determined by that with the greatest number of occurrences. However, after the data
were aggregated, the occurrences of several practice items appeared to be the same in
various categories. Here, it was agreed (see Section 4.3) that the lower category would
determine the level. For example, as highlighted in Figure 10, the same numbers ap-
peared in categories A (4 times scale 1), C (4 times scale 4) and D (4 times scale 6) for
item P6; since category A was the lowest level, P6 was classified as level Initial.
ID R1 R2 R3 R4 R5 R6 R7 R8 R9 R10 R11 R12 R13 R14 R15 R16 R17 R18 R19 R20
P1.We have defined a test automation strategy for test automation.6 3 0 1 2 1 5 1 4 1 1 5 1 2 0 1 1 4 2 5
P2.We understand goals for our test automation.6 5 0 0 2 5 5 4 5 1 1 5 1 3 0 1 4 5 5 6
P3.We create a business case to conduct cost-benefit analysis of our test automation. 4 2 0 0 1 1 3 1 3 1 1 4 1 0 0 1 0 3 1 3
P4.We identify and analyze the risks of test automation.6 2 0 0 2 1 4 1 4 1 1 4 1 1 0 1 0 1 1 3
P5.We define the scope of test automation, e.g. what should be automated and to what degree. 5 5 0 1 3 5 5 5 5 1 1 5 1 1 0 1 2 2 5 6
P6.We acknowledge the overlap between automated testing and manual testing.6 3 0 6 4 6 6 5 5 3 1 4 1 1 0 1 4 4 3 5
P7.We periodically review our automation strategy and update it depending on our present needs.6 1 0 0 1 2 5 0 3 1 1 5 1 0 0 1 2 2 1 5
P8.We identify necessary resources to implement test automation, e.g., test tools, test data, test environment, skilled people, etc.5 2 0 2 2 3 5 4 5 1 1 5 3 4 0 1 4 4 2 6
P9.We identify roles and responsibilities for test automation tasks. 6 2 0 5 1 3 5 5 5 1 1 5 1 1 0 1 4 4 1 6
P10.We estimate the effort for test automation tasks.5 4 0 0 1 5 5 5 5 1 1 4 1 1 0 1 3 4 1 6
P11.We communicate with stakeholders the changes of test automation strategy and collect feedbacks.6 2 0 0 1 3 4 1 3 2 1 5 1 0 0 1 1 3 1 3
Level Optimizing
Category D
Practice Item Scale 0 1 2 3 4 5 6
P1.We have defined a test automation strategy for test automation. 2 8 3 1 2 3 1
P2.We understand goals for our test automation. 3 4 1 1 2 7 2
P3.We create a business case to conduct cost-benefit analysis of our test automation. 5 8 1 4 2 0 0
P4.We identify and analyze the risks of test automation. 4 9 2 1 3 0 1
P5.We define the scope of test automation, e.g. what should be automated and to what degree. 2 6 2 1 0 8 1
P6.We acknowledge the overlap between automated testing and manual testing.2 4 0 3 4 3 4
P7.We periodically review our automation strategy and update it depending on our present needs.5 7 3 1 0 3 1
Efficient
C
Controlled
B
Initial
A

38
Figure 11. Sample of classification based on aggregate data
Figure 11 shows the sample classification results for each practice item. Here, the data
mapping was complete, and the results are shown in Appendix 1. The next step was
analysis of results.
Key Areas ID Practice Items Category Level
P1 The TA strategy is created. A Initial
P2 The TA goals are set. C Efficient
P3 A cost-effectiveness analysis of TA is conducted. A Initial
P4 Risk analysis is established. A Initial
P5 The test scope and degree of TA are defined. C Efficient
P6 Overlaps between automated and manual testing are examined. A Initial
P7 The gaps and overlap between test types and levels are examined. A Initial
P8 Resources to perform TA tasks are identified. B Controlled
P9 Roles and responsibilities for TA tasks are identified. A Initial
P10 The effort estimation for TA tasks is calculated. A Initial
P11 Stakeholders’ feedback on changing the TA strategy is collected. A Initial
KA1. Test Automation
Strategy
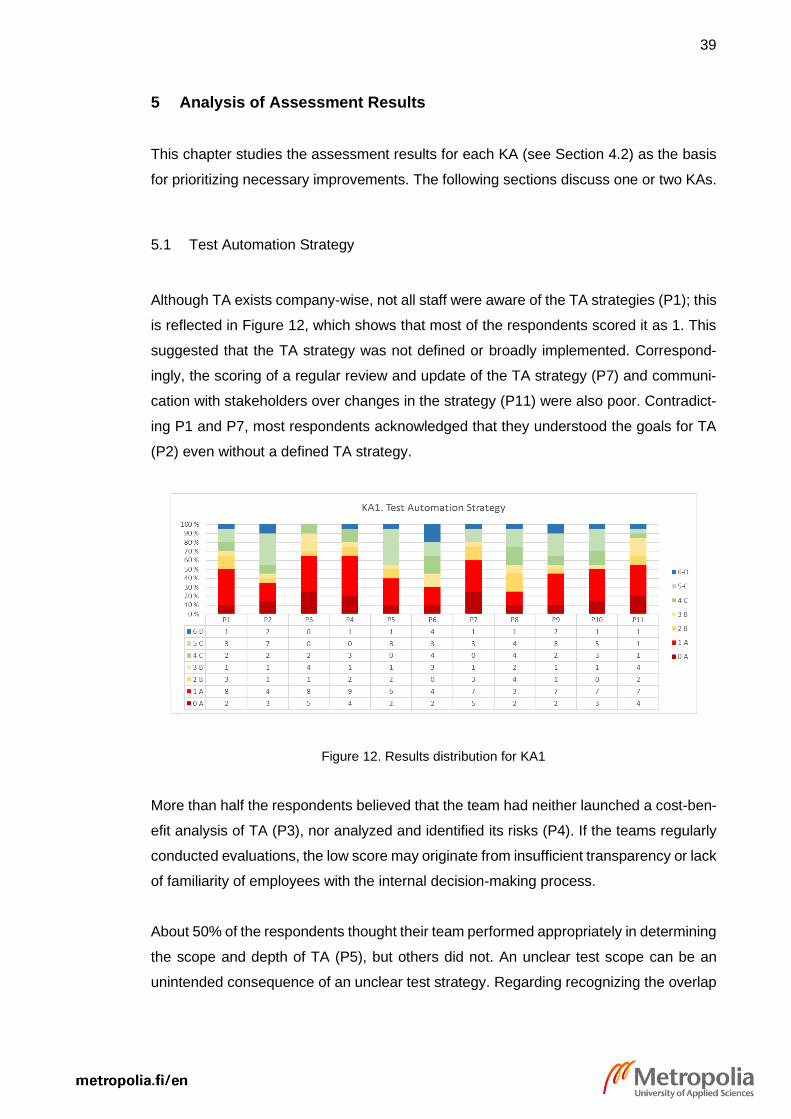
39
5 Analysis of Assessment Results
This chapter studies the assessment results for each KA (see Section 4.2) as the basis
for prioritizing necessary improvements. The following sections discuss one or two KAs.
5.1 Test Automation Strategy
Although TA exists company-wise, not all staff were aware of the TA strategies (P1); this
is reflected in Figure 12, which shows that most of the respondents scored it as 1. This
suggested that the TA strategy was not defined or broadly implemented. Correspond-
ingly, the scoring of a regular review and update of the TA strategy (P7) and communi-
cation with stakeholders over changes in the strategy (P11) were also poor. Contradict-
ing P1 and P7, most respondents acknowledged that they understood the goals for TA
(P2) even without a defined TA strategy.
Figure 12. Results distribution for KA1
More than half the respondents believed that the team had neither launched a cost-ben-
efit analysis of TA (P3), nor analyzed and identified its risks (P4). If the teams regularly
conducted evaluations, the low score may originate from insufficient transparency or lack
of familiarity of employees with the internal decision-making process.
About 50% of the respondents thought their team performed appropriately in determining
the scope and depth of TA (P5), but others did not. An unclear test scope can be an
unintended consequence of an unclear test strategy. Regarding recognizing the overlap
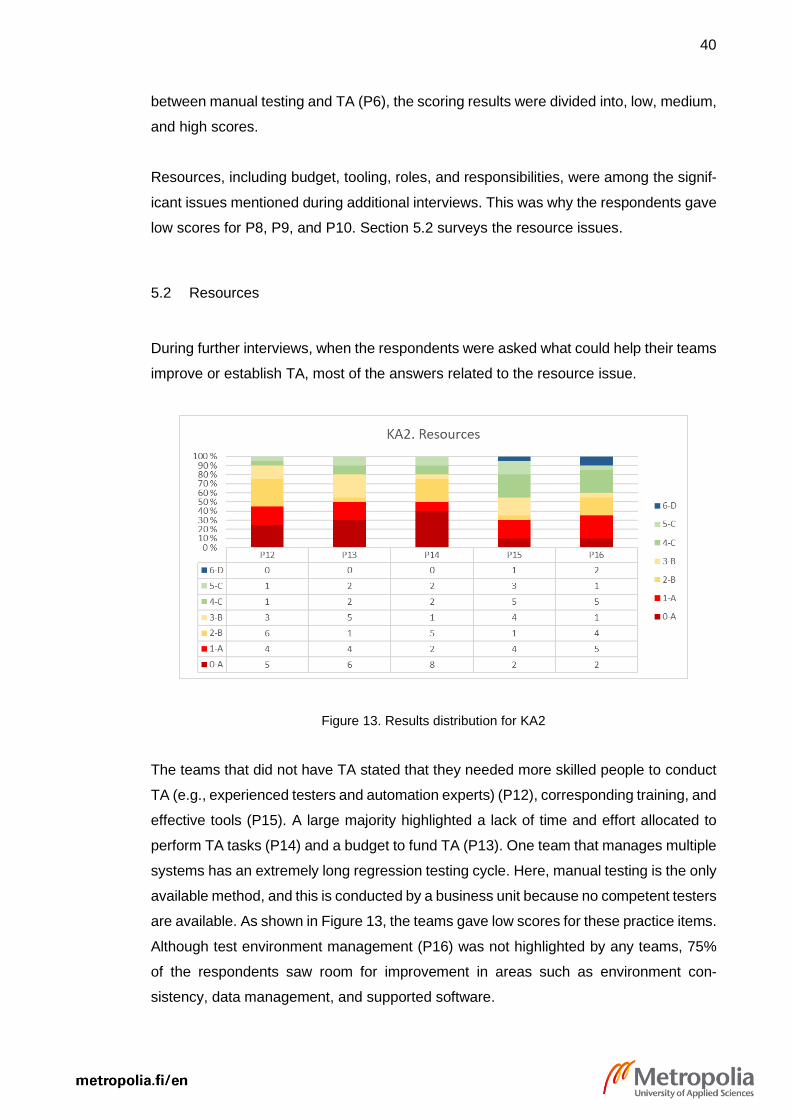
40
between manual testing and TA (P6), the scoring results were divided into, low, medium,
and high scores.
Resources, including budget, tooling, roles, and responsibilities, were among the signif-
icant issues mentioned during additional interviews. This was why the respondents gave
low scores for P8, P9, and P10. Section 5.2 surveys the resource issues.
5.2 Resources
During further interviews, when the respondents were asked what could help their teams
improve or establish TA, most of the answers related to the resource issue.
Figure 13. Results distribution for KA2
The teams that did not have TA stated that they needed more skilled people to conduct
TA (e.g., experienced testers and automation experts) (P12), corresponding training, and
effective tools (P15). A large majority highlighted a lack of time and effort allocated to
perform TA tasks (P14) and a budget to fund TA (P13). One team that manages multiple
systems has an extremely long regression testing cycle. Here, manual testing is the only
available method, and this is conducted by a business unit because no competent testers
are available. As shown in Figure 13, the teams gave low scores for these practice items.
Although test environment management (P16) was not highlighted by any teams, 75%
of the respondents saw room for improvement in areas such as environment con-
sistency, data management, and supported software.

41
5.3 Test Organization and Knowledge Transfer
The case company has a QA unit, and its testers are assigned to SAFe teams. This
assessment was for the testing groups in each SAFe team. It is noteworthy that some
development teams do not have testers, and developers have assumed the role of test-
ing.
Figure 14. Results distribution for KA3
Two major groups of opinions existed on the motivation (P17) of testers, as shown in
Figure 14. While 30% of the respondents believed that the testers were motivated, 20%
believed they were not. Interestingly, these negative answers originated from those be-
longing to the development team without TA testers, where developers or other team
members often assume the role of testers. Under such circumstances, while employees
are saturated with work, their enthusiasm for undertaking lengthy testing tasks is inevi-
tably affected. The results for defining the roles and responsibilities of test organization
(P18) and organizational support and management support for TA (P20) were scored
extremely low. Many respondents expressed their frustration that management did not
provide timely support (e.g., labor force and tools) to help them complete their tasks more
effectively. Some respondents suggested that because the realization of TA often re-
quired significant investment in the early stages, the team leaders believed that the return
on the investment was insignificant.

42
In assessing TO’s abilities, such as effective communication and problem-solving mech-
anisms (P19), expertise and technical skills (P21), and ability to maintain testing tools
(P22), relatively more positive comments were offered, as shown by the corresponding
scores.
Figure 15. Results distribution for KA4
Knowledge transfer is an important measure to enhance the competence and capability
of the TO. Regarding the evaluation of this KA, the opinions were again extremely scat-
tered, with mixed reviews. However, most of the opinions on sharing knowledge, prac-
tices, and good test tools (P23) were concentrated in the middle and lower scores, as
shown in Figure 15. This may be due to the lack of a sharing platform or atmosphere in
some teams.
Although over 25% of the respondents indicate that they would value time for training
and the learning curve (P24), 50% gave low scores for this aspect. As with the previous
item, the operational style and atmosphere of each team can directly affect how team
members learn or master new skills during their work.
5.4 Test Tool Selection and Use
The feedback on test tool selection was good for identifying the required features (P25),
attributes (P26), and constraints (P27), as shown in Figure 16.

43
Figure 16. Results distribution for KA5 and KA6
Contrary to tool selection, the tool use scores leaned toward low scores, as shown in
Figure 16. The general opinions were that no formal process of introducing new tools
(P30) existed within the group. Thus, regarding elaboration of the preconditions for the
tool (P28), many negative reviews were offered on gaining management commitment,
understanding the test tools, and maintaining the documents. This may imply that the
entire department has not yet sufficiently promoted unified standard test tools for different
purposes, resulting in the majority being confused about the new tools while dissatisfied
with the tools in use.
For whether ROI analysis of test tools was conducted (P29), the grouped scores were
medium and low. It could be argued that teams have overlooked the financial perspective
of using TA tools. Some teams have used some new test tools in pilot projects (P31) and
announced the piloting results to the remainder of the organization. However, the goals
of using test tools (P32) were not widespread and lacked periodic reviews. Some teams
have written guidelines for the use of test tools (P33); however, since many teams have
no TA, it was difficult to judge the establishment of guidelines.
5.5 Test Environment
A good software testing environment enables testers to do their jobs. The suitability of
the test environment seriously affects the authenticity and correctness of the test results.
The assessment results for this KA were good, as shown in Figure 17.

44
During the stage of designing the test environment, teams believed that they designed
the environment according to the requirements (P34). The test environments were also
close to the production environments (P41), where defects were found earlier than in
production. However, due to various resource limitations, they could only perform the
tests in an approximate simulation environment. Most of the respondents considered that
teams performed well in managing the configuration of test environments (P35) and iden-
tifying faults or dependencies (P38).
Figure 17. Results distribution for KA7
Conversely, the inadequacy of the test environment support (P37) and ineffectiveness
of verifying the environment and data before use (P36) were reported by the respondents.
A few respondents believed that stable test environments not only rely on configuration
personnel but also require all staff to cooperate to minimize negative environmental fac-
tors in the testing.
The test data should be as realistic as possible for software testing. For banking systems,
customer and test data are highly sensitive. Of the respondents, 90% agreed that they
used the test data in compliance with regulations and legislation (P39). However, most
respondents did not consider that they managed test data correctly (P40) regarding cre-
ation, reuse, maintenance, and destruction.

45
5.6 Test Requirements and Test Design
Test requirements are the foundation of the test process and determine the test objects,
scope, test coverage, roles, scheduling, and test design. They must be observable and
evaluable. A defined method of deriving TA requirements (P42) is thus crucial. As shown
in Figure 18, 85% of the respondents disapproved of the current method of obtaining test
requirements, including the required clarity, details, and coverage. Only 35% of the re-
spondents thought the effects of the changing TA requirements (P43) were under control.
The most mentioned issue was unmanaged requirement changes during a later stage of
TA development.
Figure 18. Results distribution for KA8 and KA9
Testing techniques, such as boundary value analysis, equivalence partitioning, decision
tables, state transitions, and structure-based techniques [5 pp. 55-61], involve special-
ized logical thinking ability that requires testers to understand a certain technique and
apply it during test design. The scores for using specific test design techniques (P44)
were low to medium. This implies potential problems: either the testers were unfamiliar
with the testing techniques, or they ignored their application. Both alarming reasons can
lead to imperfect test capability. However, unexpectedly, half of the respondents claimed
that their teams captured and reused the patterns in using test design techniques (P45)
while they were troubled by applying techniques.

46
Teams appeared to perform better on grouping test cases into test suites for different
purposes (P46). They achieved this by setting up the test executions in the Jenkins CI
environment. Excellent test codes and test cases are inseparable from the code standard
and guidelines. The scores showed that more standardized guidelines are needed on
designing test cases (P47) across the organization together with broader static and dy-
namic measurements on test codes (P48).
5.7 Test Execution and Verdicts
The test execution involves deciding how to execute the tests and what tests to use.
From the recorded test execution, the execution results can be obtained, the test steps
can be examined, and defects for the test execution can be created (or linked). As shown
in Figure 19, 95% of the respondents thought they did not sufficiently prioritize the auto-
mated test cases to meet the test execution schedule (P49). Poor test execution man-
agement could cause this. Test execution management should be defined in the test
plan and test strategy, where the scope, purpose, method, resources, and risks of the
test execution are described.
Figure 19. Results distribution for KA10 and KA11
Automatic preprocessing (P50) before the test execution and automatic post-processing
tasks (P51) are part of the TA execution process. Most respondents gave low scores on

47
these two items. They further highlighted the issues, such as a lack of routes to automat-
ically create testing data in certain systems, missing scheduled test executions against
CI, and Jenkins pipelines still being triggered manually.
Based on the score distribution shown in Figure 19, many teams did not implement par-
allel test executions for complex systems (P52). This may be because the test environ-
ments do not support multiple simultaneous executions, or the teams did not thoroughly
consider the possibilities and advantages of their implementation. Parallel executions
must be designed from the level of TA architecture and TAF. If the framework or archi-
tecture is immature or not created, minimal opportunities exist for parallel executions.
Test execution must involve a conclusion for each tested item, that is, whether the test
passes. A mechanism should exist to alert relevant people when critical failures occur,
such as a crash caused by the program, a deadlock in the database, or a data commu-
nication error (P53). The evaluation result implied that such an alert mechanism has not
been used or was used at a minimum level.
A verdict should be given based on the reliable facts of a situation, for example, whether
a SUT behaves as expected based on testing results. Test oracles must reliably con-
clude whether a system behaves correctly when it passes or fails a test (P54). The as-
sessment result shown in Figure 19 implied that several teams had no confidence in their
test oracles. Some reported that while defects in the test object did not cause incon-
sistency or failures of test results, but errors in the test environment, test oracles, and
test framework did. According to the comments, most of the teams agreed that they
monitored the status and progress of testing regarding test results (P55).
However, the teams were not optimistic regarding test reporting, especially on presenting
comprehensive test reports with test results collected from original sources (P56), shar-
ing useful results with relevant stakeholders (P57), and using dashboards with stake-
holders (P58). The content, format, depth, and details of the reports were not targeted to
different stakeholders. Two key issues may require resolution: first, whether the teams
have identified the targeted contents and shared them with different stakeholders. The-
oretical learning and communicating with stakeholders can help teams create useful re-
ports. Second, a common platform may be required to display dashboards to stakehold-
ers.
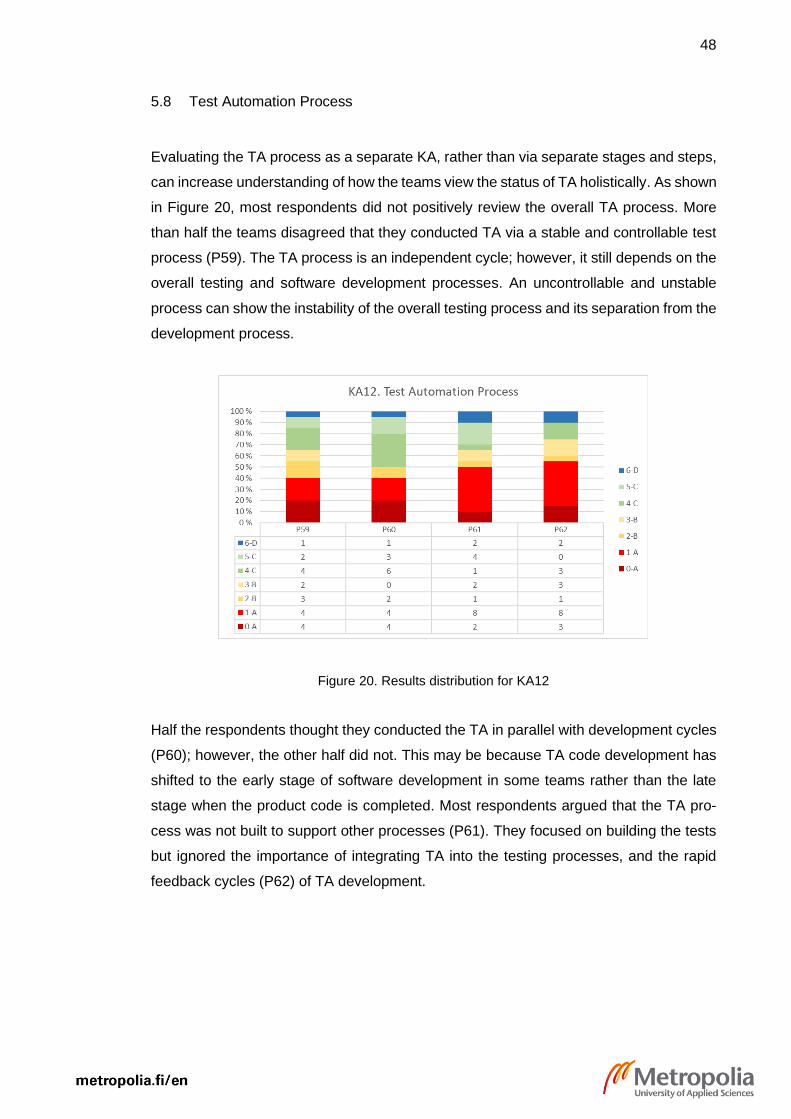
48
5.8 Test Automation Process
Evaluating the TA process as a separate KA, rather than via separate stages and steps,
can increase understanding of how the teams view the status of TA holistically. As shown
in Figure 20, most respondents did not positively review the overall TA process. More
than half the teams disagreed that they conducted TA via a stable and controllable test
process (P59). The TA process is an independent cycle; however, it still depends on the
overall testing and software development processes. An uncontrollable and unstable
process can show the instability of the overall testing process and its separation from the
development process.
Figure 20. Results distribution for KA12
Half the respondents thought they conducted the TA in parallel with development cycles
(P60); however, the other half did not. This may be because TA code development has
shifted to the early stage of software development in some teams rather than the late
stage when the product code is completed. Most respondents argued that the TA pro-
cess was not built to support other processes (P61). They focused on building the tests
but ignored the importance of integrating TA into the testing processes, and the rapid
feedback cycles (P62) of TA development.

49
5.9 Software Under Test
The software under test mentioned here refers not only to the software but also the sys-
tem context. This includes all stakeholders, development cycles, related documents (pro-
cess documents, technical documents), deployment, related technologies, business
knowledge, and legal affairs.
Figure 21. Results distribution for KA13
Based on Figure 21, approximately half the respondents gave positive feedback on the
SUT; however, the testability (P64) of the SUT by TA was a major concern because
some technology stacks do not support TA. The maturity (P63) of the SUT also affected
the realization of TA. This created a situation where end-to-end testing is challenging to
achieve as part of system testing. The execution speed of the SUT (P65) can affect the
execution speed of automated test cases. Delays sometimes made the test results un-
predictable because the SUT execution speed was unduly slow.
5.10 Measurements
As many organizations use certain measurements to judge effectiveness, the effective-
ness of TA must also be measured. Unlike the usual measurements, TA development is
also code development; thus, additional measurements are required, such as the false

50
alarm rate, coverage rate, code maintainability, automation process rate, and cost-effi-
ciency.
As shown in Figure 22, the assessment results for this KA were poor. Almost 90% of the
respondents disagreed that TA was measured by appropriate metrics (P66). Most of
them stated that they had never weighed the crucial attributes of TA (P67) as measure-
ments. As no appropriate measurements existed, it was difficult for the team to identify
improvement areas through measurements (P68). However, some respondents men-
tioned that they found problems through code reviews, which improved their TA code
quality. Regarding whether the TO members received feedback about their performance
(P69) regularly, most responses revealed that the feedback circuits were insufficiently
engaged, particularly the communication between developers and testers.
Figure 22. Results distribution for KA14
Reporting measurements appeared to be a significant problem for each team, particu-
larly the measurement of TA. Teams admitted that the appropriate measurements were
missing and were not visible in any format, neither test reports nor dashboards (P70).
Software testing activities must be monitored through measurements and metrics that
provide insight into teams’ testing progress, productivity, and performance and the qual-
ity of the software under test.

51
5.11 Quality Attributes
This section considers the quality attributes, including portability, maintainability, effi-
ciency, reliability, usability, and functionality. The details of each attribute are given in
Section 2.2.
Regarding portability (P71), 40% of the respondents thought that their automated tests
could be implemented in new environments easily, despite potential differences in the
hardware and software environments and the configurations.
Figure 23. Results distribution for KA15
Three aspects were included in the maintainability (P72): the testware, test environment,
and automated tests. Of the respondents, 70% suggested that the TA testware, such as
test data, test cases, and test reports, were not organized in convenient architecture, as
shown in Figure 23. Most of the teams considered that they managed the setups and
configuration of the test environment effectively. Only half the respondents thought the
test environments were complex to maintain and update in terms of deployment and
development. More than half the teams said that as the number of automated test cases
increased, the workload of the testers increased, and it was difficult to maintain auto-
mated tests to keep them operational. Developers paid minimal attention to whether new
codes would break existing tests, and the testers did not communicate with developers
regarding code changes. For the traditional waterfall model, the quality team maintains
test scripts, and the development team is not involved. However, the agile framework

52
blurs the boundaries between the responsibilities of the two units. The agile method in-
cludes cross-functional development teams and agile testers. Thus, both units should
maintain the TA.
Efficiency (P73) implies quality and speed. The results showed that half the respondents
had little confidence in their automated tests to produce reliable and fast results (P75).
This could imply instability of current automated test cases, causing test results to oscil-
late and creating excessive maintenance work.
Reliability (P74) covers two aspects: automated tests and the test environment. Most of
the opinions further proved that the automated tests were not resistant to inconsequential
changes, such as SUT and requirement changes and unexpected test execution events.
However, more than half the respondents thought the test environments had high acces-
sibility when automated tests were running but required appropriate restoration and a
recovery mechanism to revert to the preceding status.
Almost all teams agreed that the usability (P75) of their automated tests was poor and
not useful to other users except for testers. Some teams have been using a keyword-
driven TA framework to write automated test cases; however, the test case construction
was complex and thus difficult even for testers to understand.
Most of the opinions confirmed that TA met the given test purposes and fulfilled the func-
tionality (P76) attribute in terms of increased defect detection efficiency and test cover-
age, shortened test cycles, and better product quality.

53
6 Recommendations and Conclusion
This chapter establishes a general practice method, defines the areas for improvement
based on pre-defined priorities, proposes the initial steps for changes, sets the initial
objectives for the follow-up, and outlines a long-term vision.
To achieve effective improvements, the general practice should be goal-oriented to avoid
aimless actions; a consensus should be reached, and building management commitment
ensured. The TA process improvements must be led and promoted through an effective
TA process improvement task force. This task force shall clarify periodic goals of im-
provements, including setting step-by-step action points, conducting regular reassess-
ments, organizing regular follow-up meetings, and promoting continuous improvement.
Achieving consensus on the issues and optimization schemes by all participants during
the entire process is the basis for implementing subsequent actions.
The improvement procedures involve three stages; each one is further refined based on
the consensus of the previous ones. Key milestones should be set separately to control
the progress.
- The first stage involves summarizing the current state of the TA process, clarify-
ing organizational level responsibilities, including the role of the management
sponsorship, defining high-level goals. A consensus must be formed between the
stakeholders and task force.
- The second stage involves setting achievable short-term goals on a team level
based on the operational reality and stakeholders’ acceptance. A consensus
must be formed among the relevant teams.
- The third stage involves entering the specific improvement cycle, where the Dem-
ing cycle should be adopted in each team.
During the entire improvement process, periodic follow-up meetings should be held.
Every meeting must achieve an effective outcome, including the following points:
- Resolutions to the issues must be addressed, such as the responsibilities, block-
ers, and alternative plans for the next step

54
- A consensus of all relevant parties, such as stakeholders and team leaders, must
be achieved. A decision-maker can determine the eventual plan if multiple parties
cannot agree.
- Meetings must be guided to avoid deviation from the theme. Meeting minutes
must be recorded.
6.1 Improvement Suggestions
As shown in Figure 24, the KAs are ranked top-down based on, firstly, their pre-defined
priority and, secondly, their assessed maturity levels. The KAs with the higher priority
and lower maturity level must be addressed first: the IT department should prioritize im-
proving the TA strategy, test tool use, verdicts, resources, knowledge transfer, test re-
quirements, test design, and test execution.
Figure 24. Improvements based on priority
The following suggestions and follow-up checks focus on the above KAs. The follow-up
period may be 3–6 months after the first-step improvement is started.
Key Area L N H Initial Controlled Efficient Optimizing
Test Automation Strategy
Test Tool Use
Test Organization
Test Tool Selection
Verdicts
Resources
Knowledge Transfer
Test Requirements
Test Design
Test Execution
Test Automation Process
Software Under Test
Quality Attributes
Measurements
Test Environment
Prioriry Level

55
Test Automation Strategy
The major finding for the TA strategy was the lack of high-level and low-level strategic
plans. The recommended initial steps for improving the TA strategy are described in
Table 6.
Table 6. Improvement suggestions and follow-up for test automation strategy
Level First-step Follow-up Checkpoints
IT depart-
ment
➢ QA leadership creates a high-level TA
strategy that supports an organization’s
business goals and aligns with the ar-
chitectural model. They review the con-
tent with teams:
- general guidance on testing meth-
odologies (e.g., keyword-driven,
data-driven), TA tools, testing lev-
els, testing coverage, checklist of
requirement analysis
➢ The strategic plan must be reviewed
regularly. It can be reviewed yearly.
✓ A high-level TA strategy is cre-
ated and reviewed with the
teams.
✓ The TA strategy is aligned
with business goals and the
architectural model.
Teams ➢ Each team adopts the high-level strat-
egy and creates a team-level TA strat-
egy that should be agreed with the team
and stakeholders without contradicting
the team’s goals.
- The team-level strategy should de-
fine the test levels according to the
TA pyramid while considering the
application’s characteristics and re-
sources.
- The strategy should also clarify the
test types to be automated and the
estimated effort for the TA task.
✓ A team-level TA strategy is
created and agreed by the
team and stakeholders.
✓ The TA strategy adopts the
high-level plan, clarifying all
the necessary aspects.
✓ Teams and stakeholders have
agreed on the strategy and
approach to managing
changes.

56
- It is recommended that the risks
and mitigating methods are identi-
fied in the strategic plan.
➢ Teams communicate with relevant
stakeholders to agree on the strategic
approach and future changes.
Test Tool Use
Regarding the tool use, the major issue was the lack of a tool-specific ROI analysis busi-
ness case. Other major issues include inadequate new tool introduction and unified test
tool guidelines. Minor issues were found, such as unclear preconditions for tool use and
a lack of periodic reviews of the tools. The actions addressing the major issues are listed
in Table 7.
Table 7. Improvement suggestions and follow-up for test tool use
Level First-step Follow-up Checkpoints
IT depart-
ment
➢ QA team defines and manages guide-
lines for using the TA tools and intro-
ducing the goals and purposes of the
tools to teams
➢ IT management builds business cases
to analyze cost-effectiveness of tools.
✓ Guidelines are defined and in-
troduced to teams.
✓ Cost-effectiveness analysis is
conducted for at least one ex-
isting tool.
Teams ➢ teams acquire knowledge and precondi-
tions of using tools from QA team
➢ teams follow the guidance and use the
tools independently.
✓ Teams adopted the tools and
used them according to guide-
lines.
Verdicts
For the verdicts, three major findings were identified: the test oracle was overlooked, the
test results were not integrated, and the test results were not effective for stakeholders.
The required changes and checkpoints for improvement are specified in Table 8.
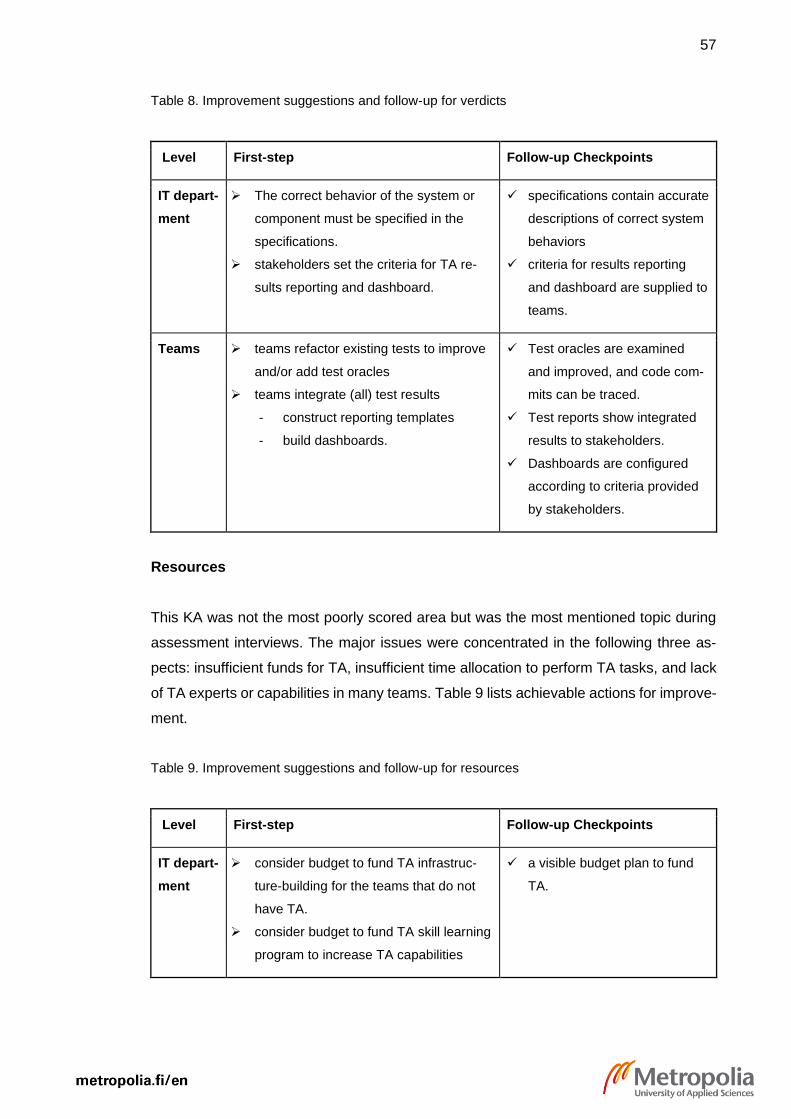
57
Table 8. Improvement suggestions and follow-up for verdicts
Level First-step Follow-up Checkpoints
IT depart-
ment
➢ The correct behavior of the system or
component must be specified in the
specifications.
➢ stakeholders set the criteria for TA re-
sults reporting and dashboard.
✓ specifications contain accurate
descriptions of correct system
behaviors
✓ criteria for results reporting
and dashboard are supplied to
teams.
Teams ➢ teams refactor existing tests to improve
and/or add test oracles
➢ teams integrate (all) test results
- construct reporting templates
- build dashboards.
✓ Test oracles are examined
and improved, and code com-
mits can be traced.
✓ Test reports show integrated
results to stakeholders.
✓ Dashboards are configured
according to criteria provided
by stakeholders.
Resources
This KA was not the most poorly scored area but was the most mentioned topic during
assessment interviews. The major issues were concentrated in the following three as-
pects: insufficient funds for TA, insufficient time allocation to perform TA tasks, and lack
of TA experts or capabilities in many teams. Table 9 lists achievable actions for improve-
ment.
Table 9. Improvement suggestions and follow-up for resources
Level First-step Follow-up Checkpoints
IT depart-
ment
➢ consider budget to fund TA infrastruc-
ture-building for the teams that do not
have TA.
➢ consider budget to fund TA skill learning
program to increase TA capabilities
✓ a visible budget plan to fund
TA.

58
➢ consider budget to hire more TA experts
for the teams that do not have TA test-
ers.
Teams ➢ Include TA tasks as part of the feature
story; estimate the effort as part of the
story points during sprint planning.
➢ Proactively gain TA skills through indi-
vidual learning.
✓ traceable record of TA task
estimation in stories, visible on
teams’ scrum boards.
Knowledge Transfer
The existence of knowledge sources, such as expertise and good TA practices, is a
necessary condition for the realization of knowledge transfer. Extensively mining internal
and external knowledge sources, stimulating the willingness of internal knowledge
sources to share knowledge, and improving their ability to interpret and express
knowledge help enterprises to sustain good knowledge transfer results. The assessment
results showed that TA knowledge was not properly collected, maintained, and shared.
Table 10 provides suggestions on how knowledge transfer can be improved.
Table 10. Improvement suggestions and follow-up for knowledge transfer
Level First-step Follow-up Checkpoints
IT depart-
ment
➢ Use enterprise knowledge management
(EKM) models and methods [29] to pro-
mote knowledge transfer.
✓ a rational plan for managing
TA-related knowledge.
Teams ➢ Aim to capture all forms of knowledge
and information about TA.
➢ Aim to manage this knowledge and in-
formation in concrete sustainable for-
mats.
➢ Share the managed TA knowledge and
information within the team or organiza-
tion.
✓ visible contents of TA
knowledge sharing and trans-
ferring.

59
➢ Aim to search for more TA knowledge
and information from internal and exter-
nal sources.
Test Requirements
The test requirements determine what must be tested, describe the conditions, and cover
business rules, functionalities, and non-functional requirements. The test design and ex-
ecution depend on the test requirement. The assessment results indicated that no de-
fined methods of obtaining TA requirements existed. Table 11 indicates actions for min-
imizing the issues mentioned.
Table 11. Improvement suggestions and follow-up for test requirements
Level First-step Follow-up Checkpoints
IT depart-
ment
➢ Stakeholders define use cases, busi-
ness rules, functionalities, and non-
functional requirements.
✓ Use cases, business rules,
functionalities, and non-func-
tional requirements are visible,
at least at Epic [32] or feature
level.
Teams ➢ Test manager or QA personnel writes
TA test requirements based on the in-
formation collected from stakeholders
and risk analysis.
✓ TA test requirements are de-
fined and visible in the test
management system.
Test Design
Test design is an essential and practical step in the testing process. A lack of test design
techniques and test case design guidelines was the main finding for this KA. Table 12
proposes improvement steps for these two aspects.

60
Table 12. Improvement suggestions and follow-up for test design
Level First-step Follow-up Checkpoints
IT depart-
ment
➢ The QA team creates TA test case de-
sign guidelines:
- The reliability, reusability, and
maintainability of the script should
be the top priority.
- rigorous code standards.
✓ TA Test case design guide-
lines are visible to teams.
Teams ➢ TA test case design guidelines and
code standards are adopted as part of
the code review.
➢ Test case design must be conducted
before implementation.
- Test requirements are matched.
- Design techniques are applied.
✓ Guidelines and code stand-
ards are used in the pull re-
quest code review process.
Test Execution
Regarding test execution, three key issues were found: prioritization, fault alarm, and
automated pre- and post-processing tasks. As listed in Table 13, this study suggests
improving the first two aspects.
Table 13. Improvement suggestions and follow-up for test execution
Level First-step Follow-up Checkpoints
Teams ➢ Clarify and prioritize TA test executions
based on specific needs:
- Scheduled execution: Monitor the
quality of the code version.
- Automatic trigger: The smoke test
execution time is controlled within 10
minutes and is automatically trig-
gered when the submitted codes are
merged into the master branch. The
✓ Test executions are priori-
tized and configured accord-
ing to needs in CI/CD pipe-
lines.
✓ An alert mechanism is set for
critical failures.
✓ The alert mechanism in-
volves the team and relevant
stakeholders.
61
corresponding personnel are notified
by email if a problem occurs.
- Manually trigger regression testing.
For example, a full execution is trig-
gered twice in a cycle (a week or a
sprint); it must be triggered manually
in the actual situation.
➢ Set the alert mechanism for critical fail-
ures of test executions.
The above suggestions are for improvement in high-priority areas. The given executable
first-steps are intended for a short-term period; they are not planned for a completed
long-term period. These suggestions still require management support. The QA organi-
zation and SAFe teams must determine the most suitable methods via further discus-
sions.
6.2 Potential Threats to Validity
The TAIM study paper [26] specifies two potential threats to the internal validity [30] re-
lated to this project. The first is criterion validity: the study states that the instruments
they built were the first independent instruments that assess the maturity level of TA [26
pp. 150]. Thus, the effectiveness must be checked after further inspections with more
pilots. The second is construct validity, which the study indicates must be further studied
and tested with the support of other validity evidence.
Based on the assessment results of this thesis project, two factors may affect the validity
of the results: the first is the motivational factor. Answering the survey is time-consuming
and requires additional effort outside working hours; participants may lose their motiva-
tion and thorough judgment during the process, affecting the scores they give. The sec-
ond is the generalization factor. Despite a few teams having good TA, most of the as-
sessed SAFe teams do not have TA ready; their scores may significantly affect the out-
come.
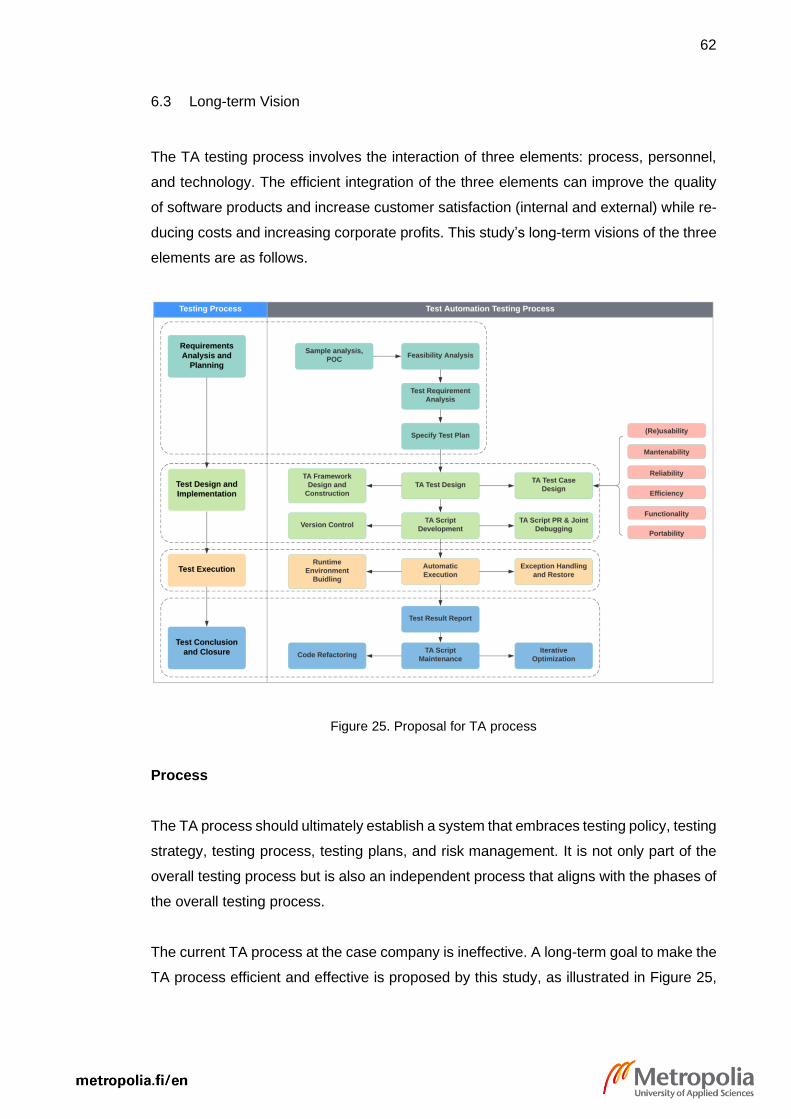
62
6.3 Long-term Vision
The TA testing process involves the interaction of three elements: process, personnel,
and technology. The efficient integration of the three elements can improve the quality
of software products and increase customer satisfaction (internal and external) while re-
ducing costs and increasing corporate profits. This study’s long-term visions of the three
elements are as follows.
Figure 25. Proposal for TA process
Process
The TA process should ultimately establish a system that embraces testing policy, testing
strategy, testing process, testing plans, and risk management. It is not only part of the
overall testing process but is also an independent process that aligns with the phases of
the overall testing process.
The current TA process at the case company is ineffective. A long-term goal to make the
TA process efficient and effective is proposed by this study, as illustrated in Figure 25,

63
which shows a concise model based on combining the theoretical study and analysis of
the assessment results. The SAFe teams should follow the process model during each
program increment (PI). Improvement suggestions for each TA process phase include
the following:
- In the first phase of the testing process, requirement analysis and planning, the
feasibility of TA should be analyzed accordingly by using the proof of concept
(POC) method, and the test plan should then be written according to the obtained
testing requirements by the testers or test managers.
- During the second phase of the testing process, test design and implementation,
the TA is designed according to the test plan. The test design includes the design
of the TA infrastructure, runtime environment, and TA test cases. When design-
ing the runtime environment, the team or TA specialist must consult DevOps per-
sonnel and stakeholders to gain precise information on CI, monitoring, and re-
porting. When designing the TA test case, the TA test case design guidelines
should be followed, and the quality attributes, including portability, maintainability,
efficiency, reliability, (re)usability, and functionality, must be considered. Regard-
ing implementation, the TA script development must combine two aspects: the
version control of the scripts and the code review based on the TA code standard
defined by the QA team and debugging.
- In the third phase of the testing process, test execution, TA test executions should
be triggered automatically. This step also includes two important parts. One is
the construction of the runtime environment. If all necessary factors are consid-
ered during the test design stage, setting up the environment should be simple.
The other part is handling exceptions and errors. Besides providing timely alerts
and generating necessary logs, the entire operation must automatically restore
and resume unfinished executions.
- In the final phase of the testing process, test conclusion and test closure activities,
the results report should be generated automatically after the test execution. A
more optimal solution is to automatically integrate the generated reports into the
test management system so that the results can be further converted into useful
data for reporting to stakeholders. After a testing cycle is completed, the scripts
enter the maintenance phase, where code refactoring and iterative improvements
must be conducted.

64
This is only a preliminary proposal for improving the TA process; it aims to provide an
implementable process framework.
Personnel
To stabilize the QA team (testing organization), team members require room for growth.
The TO members should be divided into roles based on responsibilities, such as test
engineers, senior QA engineers, and test managers. Regarding skills, these can be di-
vided into functional test engineers, TA specialists, and security test specialists. The TO
recruitment plan should match business needs. Regular training must be provided to
build TO skills, such as testing foundation training (e.g., test case design methods), in-
dustry knowledge training (e.g., banking, bonds, and loans), and testing skills training
(TA, performance testing, and security testing). Career plans should be provided for TO
members: for example, a senior manual tester becomes a business analyst or a test
manager, and a TA engineer becomes a test architect.
Technology
Technology includes TA testing tools, TA infrastructure, and CI and CD tools. The tech-
nologies ultimately aim to support efficient testing cycles and accurate testing results. A
choice of testing tools must be available, as a single tool or TA framework may not apply
to all testing levels and test types. The QA team should continue to use the infrastructure
as code (IaC) method, container technology, and a deployment tool to build a TA infra-
structure that supports fully automatic pre- and post-processing and test execution and
is fully integrated with CI and CD pipelines.
6.4 Conclusion
The assessment found that, at the case company, the maturity levels of KAs such as TA
strategy, test tool use, test design, test execution, TA process, and the verdict are at the
initial level, indicating the activities are mostly ad hoc. Thus, a significant team effort is
required to improve them if the improvement suggestions are accepted and imple-
mented. However, KAs such as the test organization, test tool selection, and the software
under test have reached a controlled level, indicating the test process activities are per-
formed correctly. The KA of the test environment has reached an efficient level, indicating

65
the test process activities are conducted efficiently. The case company should continue
to maintain its operational efficiency for these KAs. Additionally, it should conscientiously
refine the current TA strategic plan to efficiently combine personnel, technologies, and
process with solid and clear goals to achieve successful TA.

References
1 ISO/IEC 25010:2011 Systems and software engineering — Systems and soft-ware Quality Requirements and Evaluation (SQuaRE) — System and software quality models, 4.3.13. < https://www.iso.org/obp/ui/#iso:std:iso-iec:25010:ed-1:v1:en>. Accessed 17 June 2020.
2 Lewis W., Software Testing and Continuous Quality Improvement, 3rd Edition. Auerbach Publications. 2017.
3 ISTQB, Advanced Level Syllabus — Test Manager. <https://www.istqb.org/down-loads/send/7-advanced-level-documents/54-advanced-level-syllabus-2012-test-manager.html>. Accessed 14 June 2020.
4 Jorgensen P., Software Testing [e-book], 4th Edition. Auerbach Publications. 2013. <https://learning.oreilly.com/library/view/software-testing-4th/9781466560680/ch01.html>. Accessed 15 June 2020.
5 ISTQB, Foundation Level Syllabus. < https://www.istqb.org/downloads/send/2-foundation-level-documents/281-istqb-ctfl-syllabus-2018-v3-1.html>. Accessed 14 June 2020.
6 ISO/IEC 9126-1 Software engineering — Product quality — Part 1: Quality model., ISO/IEC 9126-1:2001(E), pp.7-11, 2001.
7 Vliet H, Software Engineering: Principles and Practice, 3rd Edition. Wiley. 2007
8 ISO 9000:2015(en): Quality management systems — Fundamentals and vocabu-lary, 3.3. <https://www.iso.org/obp/ui/#iso:std:iso:9000:ed-4:v1:en>. Accessed 19 June 2020.
9 SoftwareTestingHelp, Defect Prevention Methods and Techniques, <https://www.softwaretestinghelp.com/defect-prevention-methods/>. Accessed 21 June 2020.
10 Galin D., Software Quality [e-book]. Wiley-IEEE Computer Society Press. 2018. <https://learning.oreilly.com/library/view/software-qual-ity/9781119134497/c01.xhtml#start>. Accessed 21 June 2020.
11 SoftwareTestingHelp, What Is Software Testing Life Cycle (STLC), < https://www.softwaretestinghelp.com/what-is-software-testing-life-cycle-stlc/>. Ac-cessed 30 June 2020.
12 Tricentis, Two Types of Automation in Testing, <https://www.tricen-tis.com/blog/test-automation-vs-automated-testing-the-difference-matters/>. Ac-cessed 5 July 2020.
13 Axelrod A., Complete Guide to Test Automation: Techniques, Practices, and Pat-terns for Building and Maintaining Effective Software Projects. Apress. 2018.
14 Meszaros G., xUnit Test Patterns: Refactoring Test Code. Addison-Wesley Pro-fessional. 2007.

15 Crispin L., Gregory J., Agile Testing: A Practical Guide for Testers and Agile Teams. Addison-Wesley Professional. 2008
16 SoftwareTestingHelp, How to Choose The Best Automation Testing Tool (A Com-plete Guide), <https://www.softwaretestinghelp.com/automation-testing-tutorial-4/>. Accessed 20 July 2020.
17 Vocke H., The Practical Test Pyramid, <https://martinfowler.com/articles/practi-cal-test-pyramid.html#TheTestPyramid>. Accessed 20 July 2020.
18 ISTQB, Advanced Level Syllabus — Test Automation Engineer. <https://www.istqb.org/downloads/send/48-advanced-level-test-automation-engi-neer-documents/201-advanced-test-automation-engineer-syllabus-ga-2016.html>. Accessed 20 July 2020.
19 Guru99, <https://www.guru99.com/automation-testing.html#4>. Accessed 20 July 2020.
20 Tishchenko D., Test automation process overview. <https://www.a1qa.com/blog/test-automation-process-overview/>. Accessed 20 July 2020.
21 ASQ., Walter A. Shewhart, <https://asq.org/about-asq/honorary-mem-bers/shewhart>. Accessed 22 July 2020.
22 Henshall A., How to Use The Deming Cycle for Continuous Quality Improvement. <https://www.process.st/deming-cycle/>. Accessed 22 July 2020.
23 Veenendaal Van E., Graham B., Improving the Test Process [e-book], 2.4.1 The Deming Cycle, 3.3 Test Process Improvement Models. <https://learn-ing.oreilly.com/library/view/improving-the-test/9781492001300/ >. Rocky Nook. 2013.
24 TMMi Foundation, Veenendaal Van E., Test Maturity Model integration Guide-lines for Test Process Improvement, Release 1.2, 2018, <https://tmmi.org/tm6/wp-content/uploads/2018/11/TMMi-Framework-R1-2.pdf>. Accessed 27 July 2020.
25 Eldh S., Andersson K., Ermedahl A. and Wiklund K., Towards a Test Automation Improvement Model (TAIM). Software Testing, Verification and Validation Work-shops (ICSTW), 2014 IEEE Seventh International Conference on, pp. 337-342. 2014.
26 Wang Y., Mäntylä M., Eldh S., Markkula J., Wiklund K., Kairi T., Raulamo-Jurvanen P. and Haukinen A., A Self-assessment Instrument for Assessing Test Automation Maturity. Evaluation and Assessment in Software Engineering (EASE ’19), April 15–17, pp. 145-154. 2019.
27 Wang Y., Mäntylä M., Eldh S., Markkula J., Wiklund K., Kairi T., Raulamo-Jurvanen P. and Haukinen A., The initial 77-assessment-item instrument. < https://figshare.com/s/20aeb06772f0136e627b>. Accessed 17 August 2020.
28 SCALED AGILE, INC, SAFe Glossary, <https://www.scaledagileframe-work.com/glossary/>. Accessed 31 August 2020.

29 Wahl Z., What is Knowledge Management and Why Is It Important. < https://en-terprise-knowledge.com/what-is-knowledge-management-and-why-is-it-im-portant/ >. Accessed 27 October 2020.
30 Cuncic A., Understanding Internal and External Validity. <https://www.verywellmind.com/internal-and-external-validity-4584479>. Ac-cessed 30 October 2020.
31 QuestionPro, Close Ended Questions. <https://www.questionpro.com/close-ended-questions.html>. Accessed 30 October 2020.
32 Rehkopf M., Agile epics: definition, examples, and templates. <https://www.atlas-sian.com/agile/project-management/epics#:~:text=What%20is%20an%20Ag-ile%20Epic,over%20a%20set%20of%20sprints>. Accessed 30 October 2020.
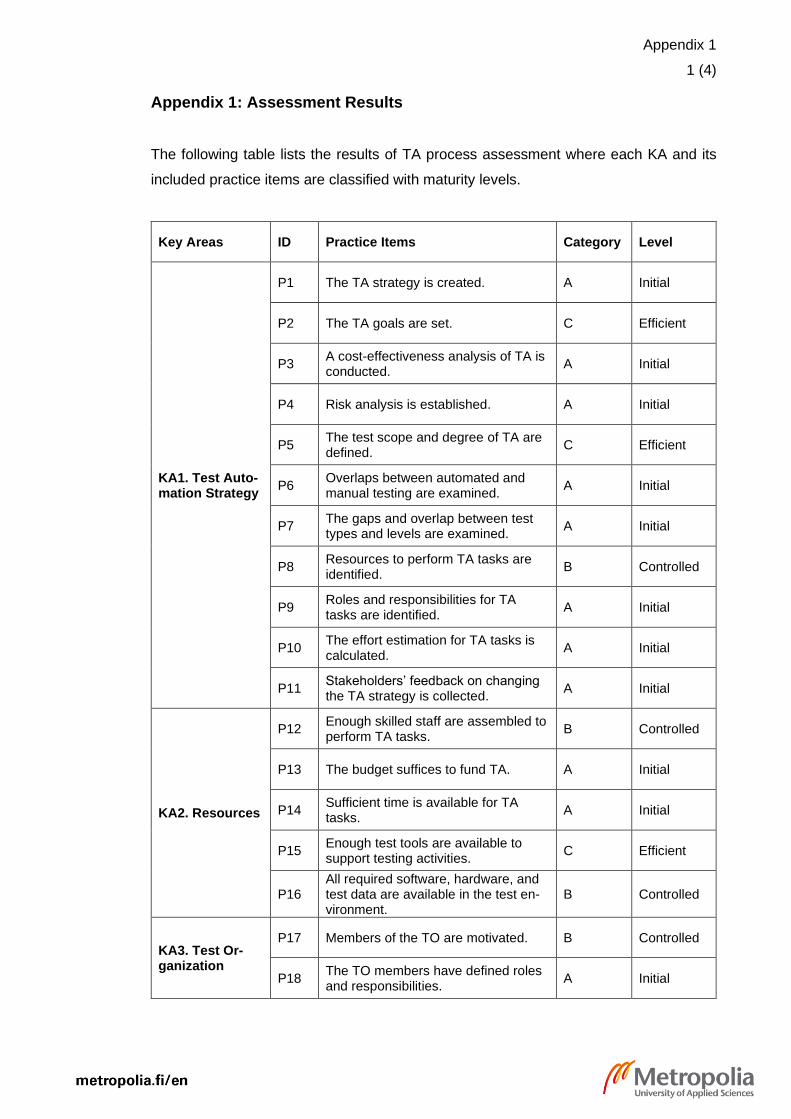
Appendix 1
1 (4)
Appendix 1: Assessment Results
The following table lists the results of TA process assessment where each KA and its
included practice items are classified with maturity levels.
Key Areas ID Practice Items Category Level
KA1. Test Auto-mation Strategy
P1 The TA strategy is created. A Initial
P2 The TA goals are set. C Efficient
P3 A cost-effectiveness analysis of TA is conducted.
A Initial
P4 Risk analysis is established. A Initial
P5 The test scope and degree of TA are defined.
C Efficient
P6 Overlaps between automated and manual testing are examined.
A Initial
P7 The gaps and overlap between test types and levels are examined.
A Initial
P8 Resources to perform TA tasks are identified.
B Controlled
P9 Roles and responsibilities for TA tasks are identified.
A Initial
P10 The effort estimation for TA tasks is calculated.
A Initial
P11 Stakeholders’ feedback on changing the TA strategy is collected.
A Initial
KA2. Resources
P12 Enough skilled staff are assembled to perform TA tasks.
B Controlled
P13 The budget suffices to fund TA. A Initial
P14 Sufficient time is available for TA tasks.
A Initial
P15 Enough test tools are available to support testing activities.
C Efficient
P16 All required software, hardware, and test data are available in the test en-vironment.
B Controlled
KA3. Test Or-ganization
P17 Members of the TO are motivated. B Controlled
P18 The TO members have defined roles and responsibilities.
A Initial

Appendix 1
2 (4)
P19 The TO has an effective communica-tion and problem-solving mechanism.
B Controlled
P20 Organizational and management sup-port for TA is available.
A Initial
P21 The TO has sufficient professional knowledge and technical skills to per-form TA tasks.
B Controlled
P22 The TO can maintain test tools in use.
B Controlled
KA4. Knowledge Transfer
P23 The expertise, good practices, and good test tools are retained.
A Initial
P24 Time for training and the learning curve is supported.
C Efficient
KA5. Test Tool Selection
P25 The required features of the test tools are described.
B Controlled
P26 The attributes of the test tools are listed.
B Controlled
P27 Constraints are analyzed. B Controlled
KA6. Test Tool Use
P28 Preconditions to tool use are clarified. A Initial
P29 Business cases are set to analyze the return on investment of each tool.
A Initial
P30 New test tools are formally introduced to the organization.
A Initial
P31 New test tools are experimentalized in pilot projects.
A Initial
P32 Regular evaluations of test tools are conducted based on the goals.
A Initial
P33 The rules and principles for using test tools are defined.
A Initial
KA7. Test Envi-ronment
P34 The requirements of the test environ-ment are thoroughly understood.
C Efficient
P35 The configuration of the test environ-ment is managed.
C Efficient
P36 The test environment and test data are tested before use.
B Controlled
P37 Support for the test environment is supplied.
C Efficient
P38 Test environment failure or depend-encies are identified.
C Efficient
P39 Test data is used in compliance with regulations and legislation.
C Efficient
P40 Test data is managed correctly. C Efficient

Appendix 1
3 (4)
P41 The test environment matches the production environment.
C Efficient
KA8. Test Re-quirements
P42 TA requirements are collected in a defined manner.
A Initial
P43 A controlled change process applies to TA requirements.
B Controlled
KA9. Test De-sign
P44 Test design techniques are used. A Initial
P45 The test design patterns are recorded and reused.
C Efficient
P46 Test suites are structured for different purposes.
C Efficient
P47 Test design guidelines are defined. A Initial
P48 The test code is examined by static and dynamic measurements.
B Controlled
KA10. Test Exe-cution
P49 TA is used for prioritized test cases to meet the schedule.
A Initial
P50 Automatic pre-processing tasks are executed before test execution.
A Initial
P51 Automatic post-processing tasks are executed after test execution.
A Initial
P52 Parallel executions for complex sys-tem.
A Initial
P53 Critical failures of test execution are alerted.
A Initial
KA11. Verdicts
P54 The test oracles used to determine whether the system passes or fails the test are reliable and certain.
A Initial
P55 The test result can be understood by monitoring the test status and pro-gress.
C Efficient
P56 The test results summary is inte-grated from different sources.
A Initial
P57 Test result insights are received by relevant stakeholders.
A Initial
P58 Every stakeholder can see useful in-formation from the dashboard.
A Initial
KA12. Test Au-tomation Pro-cess
P59 As part of the testing process, the TA process is structured and stable.
A Initial
P60 The TA and development cycle are conducted in parallel.
C Efficient
P61 The TA process supports other pro-cesses.
A Initial
P62 TA development has fast feedback cycles.
A Initial

Appendix 1
4 (4)
KA13. Software Under Test
P63 The SUT has sufficient maturity to perform TA.
B Controlled
P64 The SUT has sufficient testability to perform TA.
C Efficient
P65 The SUT has sufficient speed to exe-cute TA.
B Controlled
KA14. Measure-ments
P66 TA is measured by appropriate met-rics.
A Initial
P67 Important attributes of TA are de-fined.
A Initial
P68 Areas of improvement are recognized by using measurements.
A Initial
P69 Regular feedback is given on each TO member’s performance.
A Initial
P70 Measurements are visible in the test report and dashboard.
A Initial
KA15. Quality Attributes
P71 Portability B Controlled
P72 Maintainability A Initial
P73 Efficiency B Controlled
P74 Reliability B Controlled
P75 (Re)usability A Initial
P76 Functionality C Efficient