Temporal dimension and equilibrium exchange rate: A FEER / BEER comparison
21
TEMPORAL DIMENSION AND EQUILIBRIUM EXCHANGE RATE: A FEER / BEER COMPARISON 1 Antonia Lòpez-Villavicencio * , Jacques Mazier ** , Jamel Saadaoui †2 Abstract We analyze, in a unified theoretical framework, the two main models for equilibrium exchange rate, namely, the BEER and the FEER approaches. In order to understand the interactions between them, we study in detail the temporal links between these two measures. Our results show that, in average, the BEER and the FEER are closely related. Yet, important differences can be observed for some countries and/or some periods of time. Therefore, we analyze some of the factors that may explain this disconnection, identifying several aspects which are able to alter the relation between the current account and the real effective exchange rate, and so, between the FEER and the BEER. Our analysis puts forward the structural changes in matter of competitiveness, the dynamics of foreign asset positions and valuation effects as explanations for the divergence. Classification JEL: F31, F32, C23 Key words: Equilibrium Exchange Rate, BEER, FEER, Cointegration, Global Imbalances 1 We thank Damien Besancenot, Julien Vauday and Francisco Serranito, as well as the participants at the CEPN seminar, for useful comments. 2 † Corresponding author: Jamel Saadaoui, University of Paris North, CEPN-CNRS, 99 avenue Jean Baptiste Clément 93430 Villetaneuse, France, Phone: +33 1 49 40 33 18, Fax: + 33 1 49 40 33 34, ([email protected] ) * Antonia Lòpez-Villavicencio, University of Paris North, CEPN-CNRS ([email protected] ) ** Jacques Mazier, University of Paris North, CEPN-CNRS, ([email protected] ) N°2010-14 halshs-00535907, version 1 - 14 Nov 2010 Author manuscript, published in "Emerging Markets Review 13, Issue 1 (2012) 58-77"
Transcript of Temporal dimension and equilibrium exchange rate: A FEER / BEER comparison
TEMPORAL DIMENSION AND EQUILIBRIUM EXCHANGE RATE:
A FEER / BEER COMPARISON1
Antonia Lòpez-Villavicencio*, Jacques Mazier
**, Jamel Saadaoui
†2
Abstract
We analyze, in a unified theoretical framework, the two main models for
equilibrium exchange rate, namely, the BEER and the FEER approaches. In
order to understand the interactions between them, we study in detail the
temporal links between these two measures. Our results show that, in
average, the BEER and the FEER are closely related. Yet, important
differences can be observed for some countries and/or some periods of time.
Therefore, we analyze some of the factors that may explain this
disconnection, identifying several aspects which are able to alter the relation
between the current account and the real effective exchange rate, and so,
between the FEER and the BEER. Our analysis puts forward the structural
changes in matter of competitiveness, the dynamics of foreign asset
positions and valuation effects as explanations for the divergence.
Classification JEL: F31, F32, C23
Key words: Equilibrium Exchange Rate, BEER, FEER, Cointegration,
Global Imbalances
1 We thank Damien Besancenot, Julien Vauday and Francisco Serranito, as well as the participants at the CEPN
seminar, for useful comments. 2 † Corresponding author: Jamel Saadaoui, University of Paris North, CEPN-CNRS, 99 avenue Jean Baptiste
Clément 93430 Villetaneuse, France, Phone: +33 1 49 40 33 18, Fax: + 33 1 49 40 33 34,
* Antonia Lòpez-Villavicencio, University of Paris North, CEPN-CNRS ([email protected])
** Jacques Mazier, University of Paris North, CEPN-CNRS, ([email protected])
N°2010-14
hals
hs-0
0535
907,
ver
sion
1 -
14 N
ov 2
010
Author manuscript, published in "Emerging Markets Review 13, Issue 1 (2012) 58-77"
1
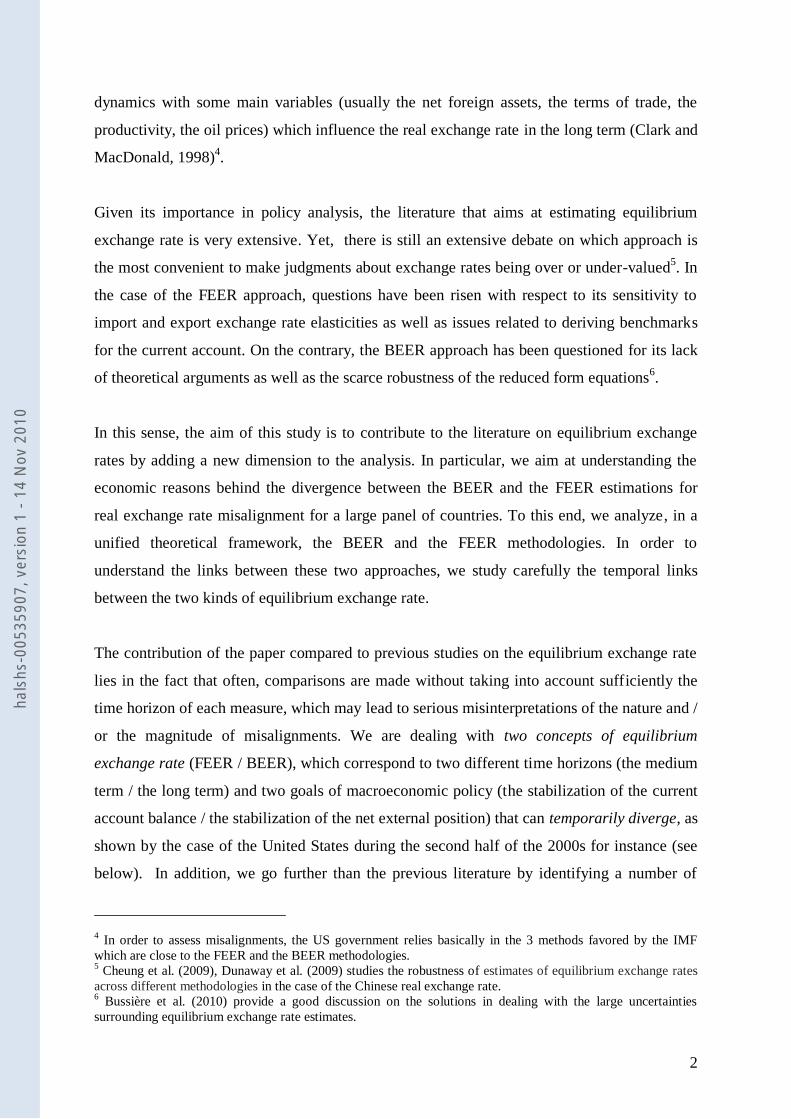
1. Introduction
Since the mid-1990s, we observe an important increase in global imbalances, implying, on the
one side, sustained deficits in the current account of some major economies (particularly the
United States) and, on the other, important surplus in emerging economies as China. In
addition, even though the euro zone as a whole keeps an equilibrated position vis-à-vis the
rest of the world, important differences are observed among its member countries. Indeed,
whereas Germany is a creditor country with important surpluses, several countries of the zone
present sustained deficits in their current account and negative external foreign assets
positions as percentage of their GDP. These imbalances are a threat to the world economy
because they reflect mainly inequalities in terms of growth, savings and investments and
exchange rates misalignments (ERM) in the main economic areas.
In recent times, the “currency war” is causing international tensions and bringing the subject
of currency misalignments, once again, at the heart of the economic policy discussions.
Indeed, with countries as China jockeying to devalue their currencies in order to boost
exports, several politics and economics are proposing to treat undervalued currencies as an
illegal export subsidy and, therefore, to set tariffs to counterbalance the gain obtained by
keeping an undervalued currency. An important question that arises at this point is then how
to calculate real exchange rate misalignments.
By definition, ERM is defined as the gap, in percentage, between observed exchange rates and
equilibrium exchange rates. However, even though the literature that deals with this subject is
extensive, there is still no consensus about the reference point at which real exchange rates
should be compared to and, therefore, there is not a unique, single measure of misalignment.
Indeed, several methodologies can be used to estimate equilibrium exchange rates3.
In particular, ERM have been studied in detail in the literature using two main approaches: the
Behavioral Equilibrium Exchange Rate (BEER) and the Fundamental Equilibrium Exchange
Rate (FEER). Briefly, the FEER is defined as the level of exchange rate which allows the
economy to reach simultaneously the internal and external equilibriums in the medium term
(Williamson, 1994). On the contrary, the BEER approach explains the exchange rate
3 See Driver and Westaway (2004) for a survey.
hals
hs-0
0535
907,
ver
sion
1 -
14 N
ov 2
010
2
dynamics with some main variables (usually the net foreign assets, the terms of trade, the
productivity, the oil prices) which influence the real exchange rate in the long term (Clark and
MacDonald, 1998)4.
Given its importance in policy analysis, the literature that aims at estimating equilibrium
exchange rate is very extensive. Yet, there is still an extensive debate on which approach is
the most convenient to make judgments about exchange rates being over or under-valued5. In
the case of the FEER approach, questions have been risen with respect to its sensitivity to
import and export exchange rate elasticities as well as issues related to deriving benchmarks
for the current account. On the contrary, the BEER approach has been questioned for its lack
of theoretical arguments as well as the scarce robustness of the reduced form equations6.
In this sense, the aim of this study is to contribute to the literature on equilibrium exchange
rates by adding a new dimension to the analysis. In particular, we aim at understanding the
economic reasons behind the divergence between the BEER and the FEER estimations for
real exchange rate misalignment for a large panel of countries. To this end, we analyze, in a
unified theoretical framework, the BEER and the FEER methodologies. In order to
understand the links between these two approaches, we study carefully the temporal links
between the two kinds of equilibrium exchange rate.
The contribution of the paper compared to previous studies on the equilibrium exchange rate
lies in the fact that often, comparisons are made without taking into account sufficiently the
time horizon of each measure, which may lead to serious misinterpretations of the nature and /
or the magnitude of misalignments. We are dealing with two concepts of equilibrium
exchange rate (FEER / BEER), which correspond to two different time horizons (the medium
term / the long term) and two goals of macroeconomic policy (the stabilization of the current
account balance / the stabilization of the net external position) that can temporarily diverge, as
shown by the case of the United States during the second half of the 2000s for instance (see
below). In addition, we go further than the previous literature by identifying a number of
4 In order to assess misalignments, the US government relies basically in the 3 methods favored by the IMF
which are close to the FEER and the BEER methodologies. 5 Cheung et al. (2009), Dunaway et al. (2009) studies the robustness of estimates of equilibrium exchange rates
across different methodologies in the case of the Chinese real exchange rate. 6 Bussière et al. (2010) provide a good discussion on the solutions in dealing with the large uncertainties
surrounding equilibrium exchange rate estimates.
hals
hs-0
0535
907,
ver
sion
1 -
14 N
ov 2
010
3
reasons that lie behind the divergence of the two approaches, a fact previously neglected.
This paper is organized as follow. Section 2 summarizes the theoretical and methodological
background. Section 3 tests empirically the temporal links between FEERs and BEERs.
Section 4 studies the differences between these two approaches and theirs implications in
terms of economic policies. Section 5 concludes.
2. The temporal dimension in the BEER and the FEER approaches
Some authors have compared the BEER and FEER approaches in the same theoretical
framework (see e.g. Driver and Westaway, 2004, Rubaszek and Rawdanowicz, 2009,
Benassy-Quéré et al., 2009). One important conclusion of these previous studies is that,
despite of conceptual differences, the two approaches can be seen as complements rather than
substitutes. This kind of comparison seems to be misleading because it neglects the temporal
dimension. Certainly, as mentioned before, the FEER is a medium run concept in which the
current account reaches a sustainable level at medium term. Therefore, it can be seen as a
flow equilibrium which is relevant precisely at medium term. Instead, the BEER is a long run
concept associated with a stock-flow equilibrium in which the current account is equal to zero
and the growth rate of the net foreign assets is equal to zero in percentage of GDP (Driver and
Westaway, 2004).
More in detail, the procedure to derive BEER series is quite standard (see, for instance Béreau
et al. (2010)). It consists on the estimation of a reduced form relationship between the real
exchange rate and a set of economic fundamentals with econometric techniques. This
estimation provides an equilibrium level for the real exchange rate which then compared to
the observed level of exchange rate.
On the other side, the FEER is defined as the exchange rate prevailing when the economy
simultaneously reaches the external equilibrium and the internal equilibrium for all the trading
partners. This measure was derived from a standard world trade model in which all the
variables are endogenous except the external equilibrium (sustainable current account
determined by structural parameters) and the internal equilibrium (full utilization of the
productive potential). The external equilibrium is estimated with panel regression techniques.
hals
hs-0
0535
907,
ver
sion
1 -
14 N
ov 2
010
4
The internal equilibrium is linked to the output gap7.
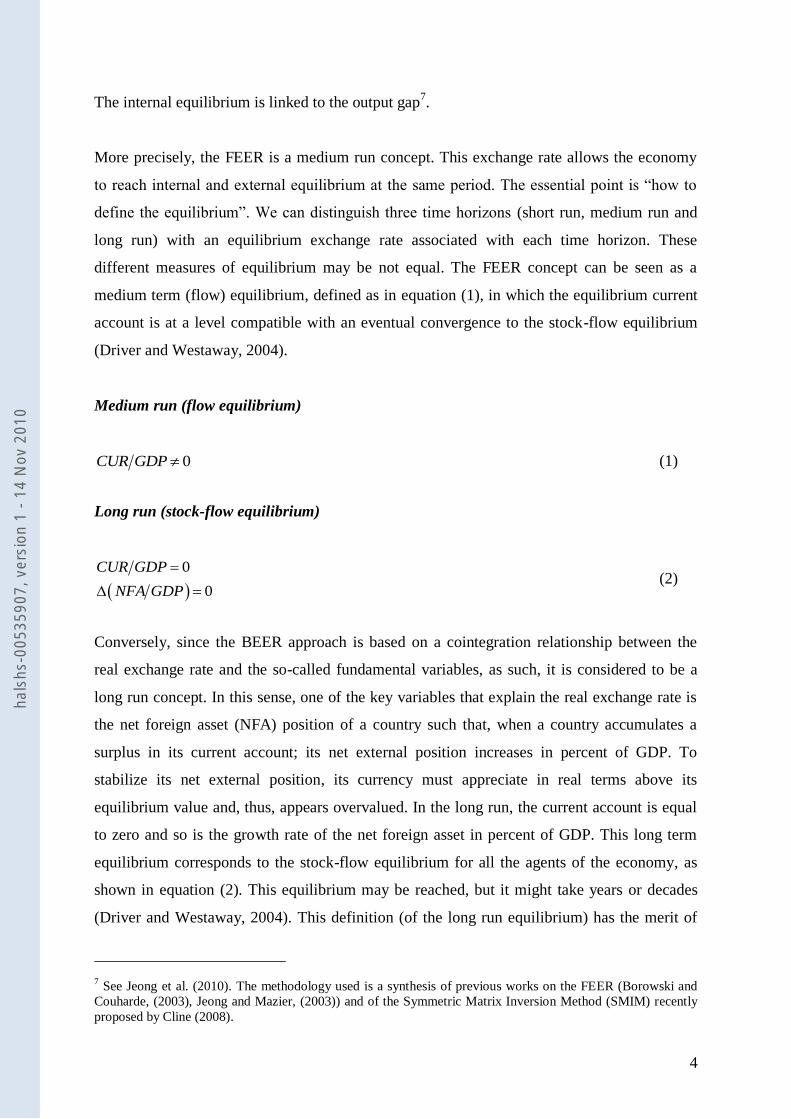
More precisely, the FEER is a medium run concept. This exchange rate allows the economy
to reach internal and external equilibrium at the same period. The essential point is “how to
define the equilibrium”. We can distinguish three time horizons (short run, medium run and
long run) with an equilibrium exchange rate associated with each time horizon. These
different measures of equilibrium may be not equal. The FEER concept can be seen as a
medium term (flow) equilibrium, defined as in equation (1), in which the equilibrium current
account is at a level compatible with an eventual convergence to the stock-flow equilibrium
(Driver and Westaway, 2004).
Medium run (flow equilibrium)
0CUR GDP (1)
Long run (stock-flow equilibrium)
0
0
CUR GDP
NFA GDP
(2)
Conversely, since the BEER approach is based on a cointegration relationship between the
real exchange rate and the so-called fundamental variables, as such, it is considered to be a
long run concept. In this sense, one of the key variables that explain the real exchange rate is
the net foreign asset (NFA) position of a country such that, when a country accumulates a
surplus in its current account; its net external position increases in percent of GDP. To
stabilize its net external position, its currency must appreciate in real terms above its
equilibrium value and, thus, appears overvalued. In the long run, the current account is equal
to zero and so is the growth rate of the net foreign asset in percent of GDP. This long term
equilibrium corresponds to the stock-flow equilibrium for all the agents of the economy, as
shown in equation (2). This equilibrium may be reached, but it might take years or decades
(Driver and Westaway, 2004). This definition (of the long run equilibrium) has the merit of
7 See Jeong et al. (2010). The methodology used is a synthesis of previous works on the FEER (Borowski and
Couharde, (2003), Jeong and Mazier, (2003)) and of the Symmetric Matrix Inversion Method (SMIM) recently
proposed by Cline (2008).
hals
hs-0
0535
907,
ver
sion
1 -
14 N
ov 2
010
5
precluding Ponzi strategies (Cline and Williamson, 2010).
3. Temporal links between FEER and BEER
As it was mentioned before, the aim of this paper is three folded. First, we compare real
exchange rate misalignments obtained from the FEER and the BEER approaches8. In order to
do so, we study a group of seventeen economies among which five industrialized and twelve
emerging countries (the United States (USA), the United-Kingdom (UK), the Euro area (EU),
Japan (JPN), Korea (KOR), China (CHN), Brazil (BRA), India (IND), Mexico (MEX),
Argentina (ARG), Chile (CHL), Colombia (COL), Indonesia (INS), Malaysia (MYS),
Philippines (PHL), Thailand (THA) and Uruguay (URU))9. Second, we detect periods of
divergence between the two of them. Finally, we identify the reasons that lie behind the
divergence of the two approaches.
In this sense, our BEER measure of misalignment was obtained as the difference between the
observed and the equilibrium real exchange rate, which corresponds to the estimated value
from a panel cointegration relationship between the (log) real effective exchange rate and the
net foreign asset position as percentage of GDP (NFA), the (log) relative productivity and the
(log) terms of trade10
. The series from the FEER correspond to the level of exchange rate that
reaches the target of the current account in the world trade model, assuming that domestic and
foreign output gaps are closed, with its econometrically estimated target level.
Some authors have compared the FEER and the BEER approaches by using a current account
balance that would stabilize the NFAs as a proportion of GDP at an appropriate level (see e.g.
Benassy-Quéré et al., 2009). This kind of comparison seems to be misleading because it
neglects the temporal dimension. Indeed, as mentioned, the FEER is a medium run concept in
which the current account reaches a sustainable level at medium term. Therefore, it can be
seen as a flow equilibrium which is relevant precisely at medium term. Instead, the BEER is a
long run concept associated with a stock-flow equilibrium in which the current account is
equal to zero and the growth rate of the NFAs is equal to zero in percentage of GDP (Driver
8 Notice that the real effective exchange rate corresponds to a CPI effective rate.
9 We use annual data from 1982 to 2007.
10 In order to save space, we avoid these details. Notice, however, that given that all the variables were found to
be integrated and cointegrated in a panel setting, we estimated the cointegration relationship relying on the Fully
Modified OLS (FMOLS). Details are available upon request to the authors.
hals
hs-0
0535
907,
ver
sion
1 -
14 N
ov 2
010
6
& Westaway, 2004). Once the two series for each country in the panel has been estimated, we
proceed to the comparison between them. In addition to the correlation between the current
account and the real exchange rate (see next section), another relevant comparison consists
into analyzing if there is a long run relationship between these two measures of equilibrium
exchange rate. In other words, if there is a long run relationship (or a stationary linear
combination) consistent with an eventual convergence from flow equilibrium (FEER) to
stock-flow equilibrium (BEER).
In a previous study (Barisone et al., 2006), it has been shown that FEERs are cointegrated
with real exchange rates. The implication of this is that the FEER approach represents an
improvement over PPP in explaining medium- to long term trends in the real exchange rate of
the major industrialized countries. In addition, BEERs are cointegrated with REERs since the
BEER aims to explain long run behavior of the REERs (Clark and MacDonald, 1998).
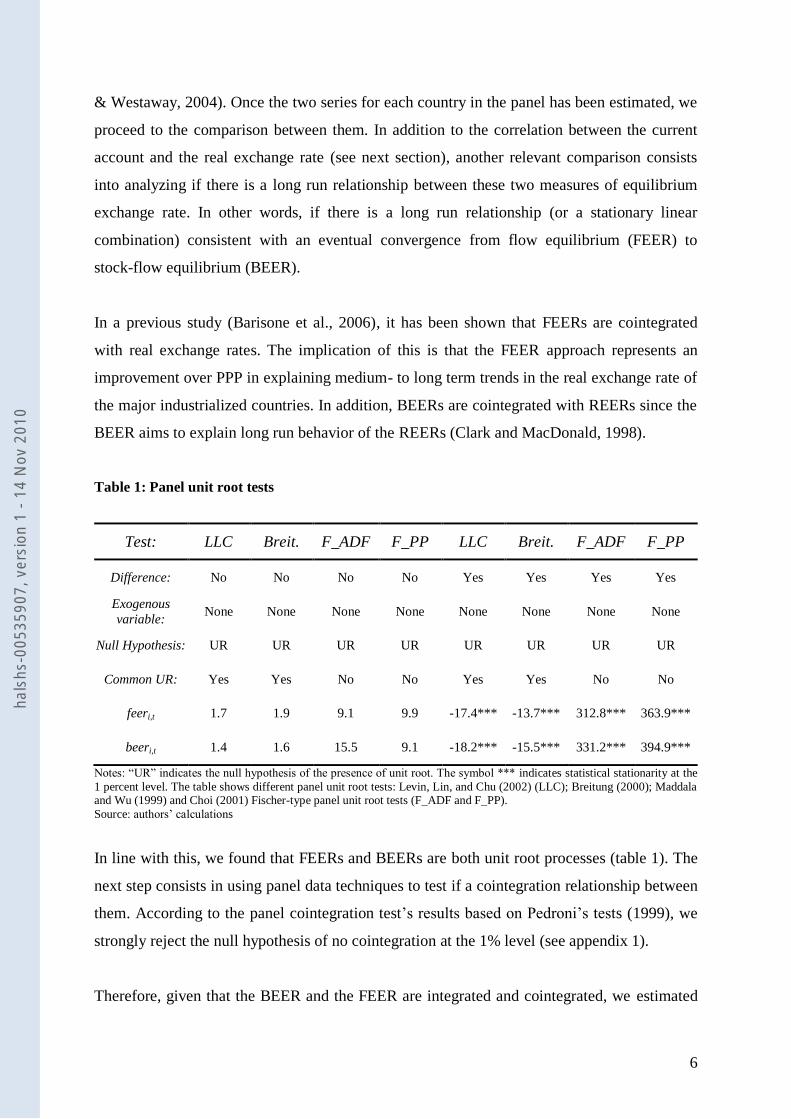
Table 1: Panel unit root tests
Test: LLC Breit. F_ADF F_PP LLC Breit. F_ADF F_PP
Difference: No No No No Yes Yes Yes Yes
Exogenous
variable: None None None None None None None None
Null Hypothesis: UR UR UR UR UR UR UR UR
Common UR: Yes Yes No No Yes Yes No No
feeri,t 1.7 1.9 9.1 9.9 -17.4*** -13.7*** 312.8*** 363.9***
beeri,t 1.4 1.6 15.5 9.1 -18.2*** -15.5*** 331.2*** 394.9***
Notes: “UR” indicates the null hypothesis of the presence of unit root. The symbol *** indicates statistical stationarity at the
1 percent level. The table shows different panel unit root tests: Levin, Lin, and Chu (2002) (LLC); Breitung (2000); Maddala and Wu (1999) and Choi (2001) Fischer-type panel unit root tests (F_ADF and F_PP).
Source: authors‟ calculations
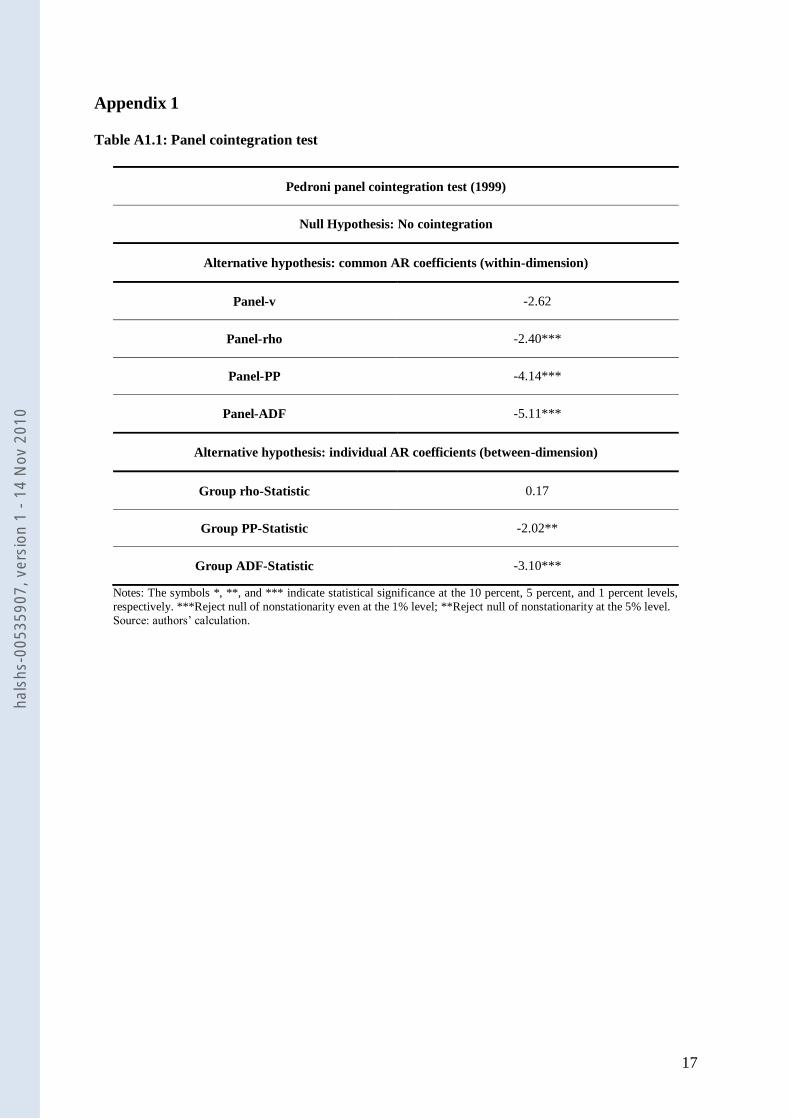
In line with this, we found that FEERs and BEERs are both unit root processes (table 1). The
next step consists in using panel data techniques to test if a cointegration relationship between
them. According to the panel cointegration test‟s results based on Pedroni‟s tests (1999), we
strongly reject the null hypothesis of no cointegration at the 1% level (see appendix 1).
Therefore, given that the BEER and the FEER are integrated and cointegrated, we estimated
hals
hs-0
0535
907,
ver
sion
1 -
14 N
ov 2
010
7
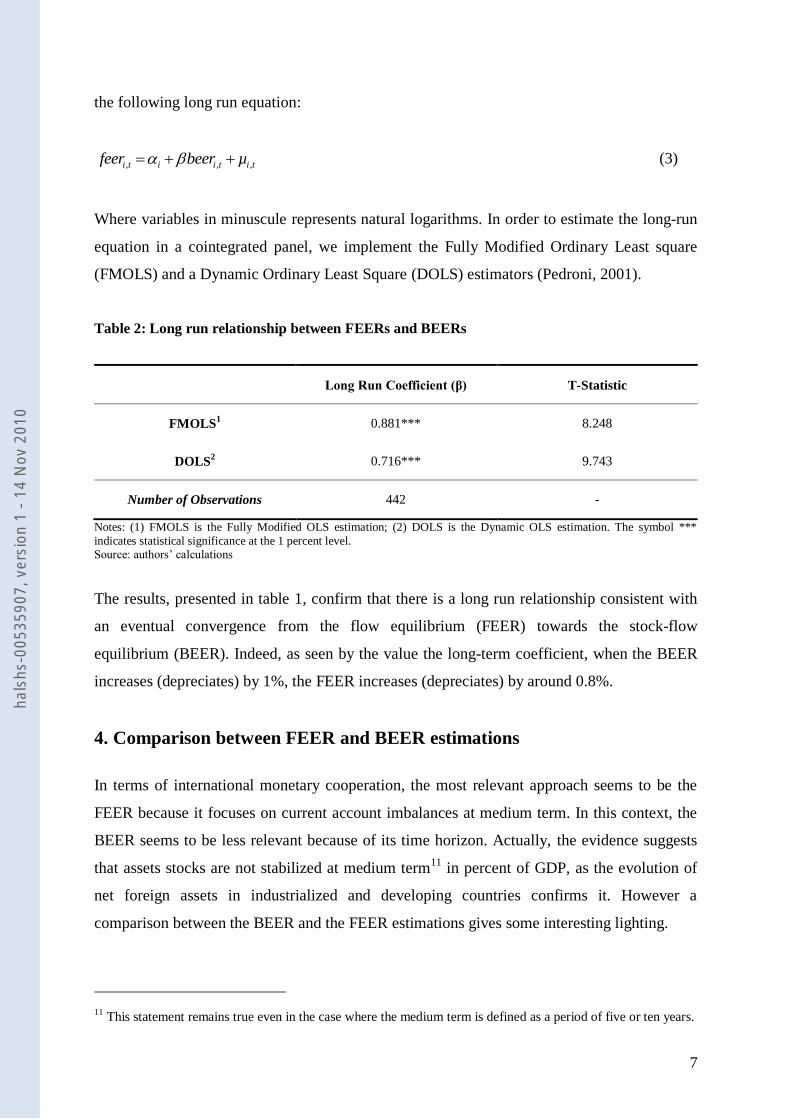
the following long run equation:
, , ,i t i i t i tfeer beer µ (3)
Where variables in minuscule represents natural logarithms. In order to estimate the long-run
equation in a cointegrated panel, we implement the Fully Modified Ordinary Least square
(FMOLS) and a Dynamic Ordinary Least Square (DOLS) estimators (Pedroni, 2001).
Table 2: Long run relationship between FEERs and BEERs
Long Run Coefficient (β) T-Statistic
FMOLS1 0.881*** 8.248
DOLS2 0.716*** 9.743
Number of Observations 442 -
Notes: (1) FMOLS is the Fully Modified OLS estimation; (2) DOLS is the Dynamic OLS estimation. The symbol ***
indicates statistical significance at the 1 percent level. Source: authors‟ calculations
The results, presented in table 1, confirm that there is a long run relationship consistent with
an eventual convergence from the flow equilibrium (FEER) towards the stock-flow
equilibrium (BEER). Indeed, as seen by the value the long-term coefficient, when the BEER
increases (depreciates) by 1%, the FEER increases (depreciates) by around 0.8%.
4. Comparison between FEER and BEER estimations
In terms of international monetary cooperation, the most relevant approach seems to be the
FEER because it focuses on current account imbalances at medium term. In this context, the
BEER seems to be less relevant because of its time horizon. Actually, the evidence suggests
that assets stocks are not stabilized at medium term11
in percent of GDP, as the evolution of
net foreign assets in industrialized and developing countries confirms it. However a
comparison between the BEER and the FEER estimations gives some interesting lighting.
11 This statement remains true even in the case where the medium term is defined as a period of five or ten years.
hals
hs-0
0535
907,
ver
sion
1 -
14 N
ov 2
010
8
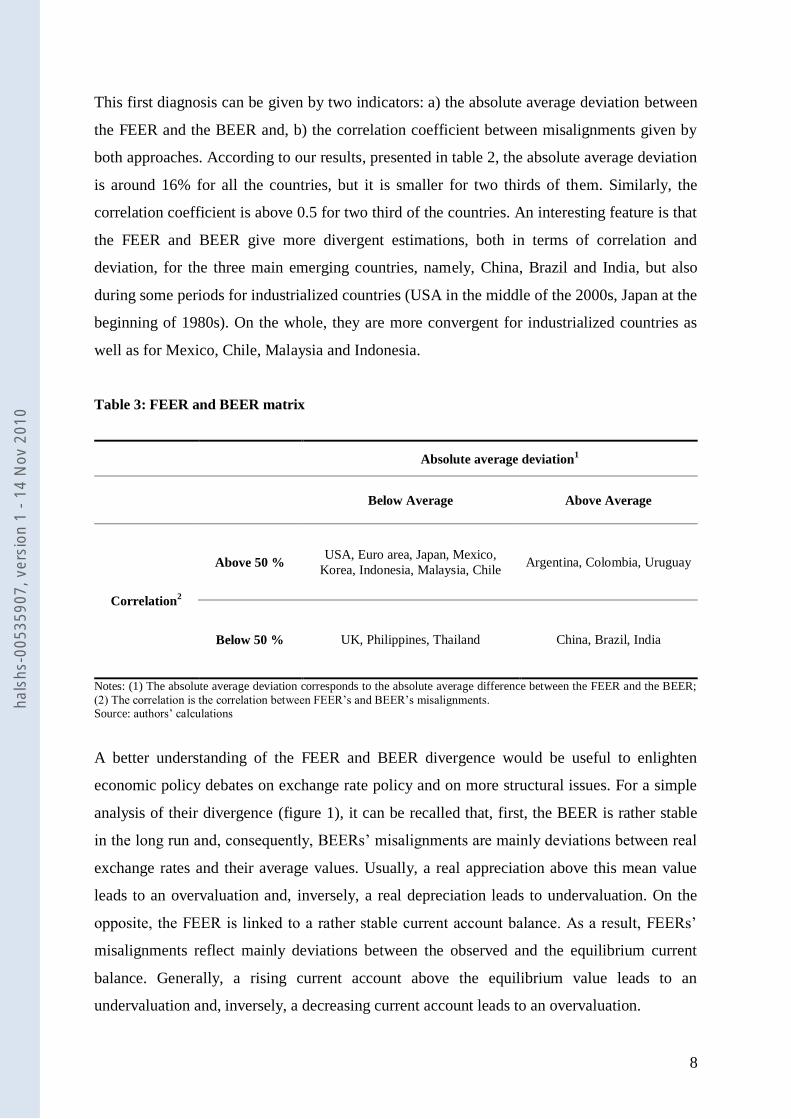
This first diagnosis can be given by two indicators: a) the absolute average deviation between
the FEER and the BEER and, b) the correlation coefficient between misalignments given by
both approaches. According to our results, presented in table 2, the absolute average deviation
is around 16% for all the countries, but it is smaller for two thirds of them. Similarly, the
correlation coefficient is above 0.5 for two third of the countries. An interesting feature is that
the FEER and BEER give more divergent estimations, both in terms of correlation and
deviation, for the three main emerging countries, namely, China, Brazil and India, but also
during some periods for industrialized countries (USA in the middle of the 2000s, Japan at the
beginning of 1980s). On the whole, they are more convergent for industrialized countries as
well as for Mexico, Chile, Malaysia and Indonesia.
Table 3: FEER and BEER matrix
Absolute average deviation1
Below Average Above Average
Correlation2
Above 50 % USA, Euro area, Japan, Mexico,
Korea, Indonesia, Malaysia, Chile Argentina, Colombia, Uruguay
Below 50 % UK, Philippines, Thailand China, Brazil, India
Notes: (1) The absolute average deviation corresponds to the absolute average difference between the FEER and the BEER;
(2) The correlation is the correlation between FEER‟s and BEER‟s misalignments. Source: authors‟ calculations
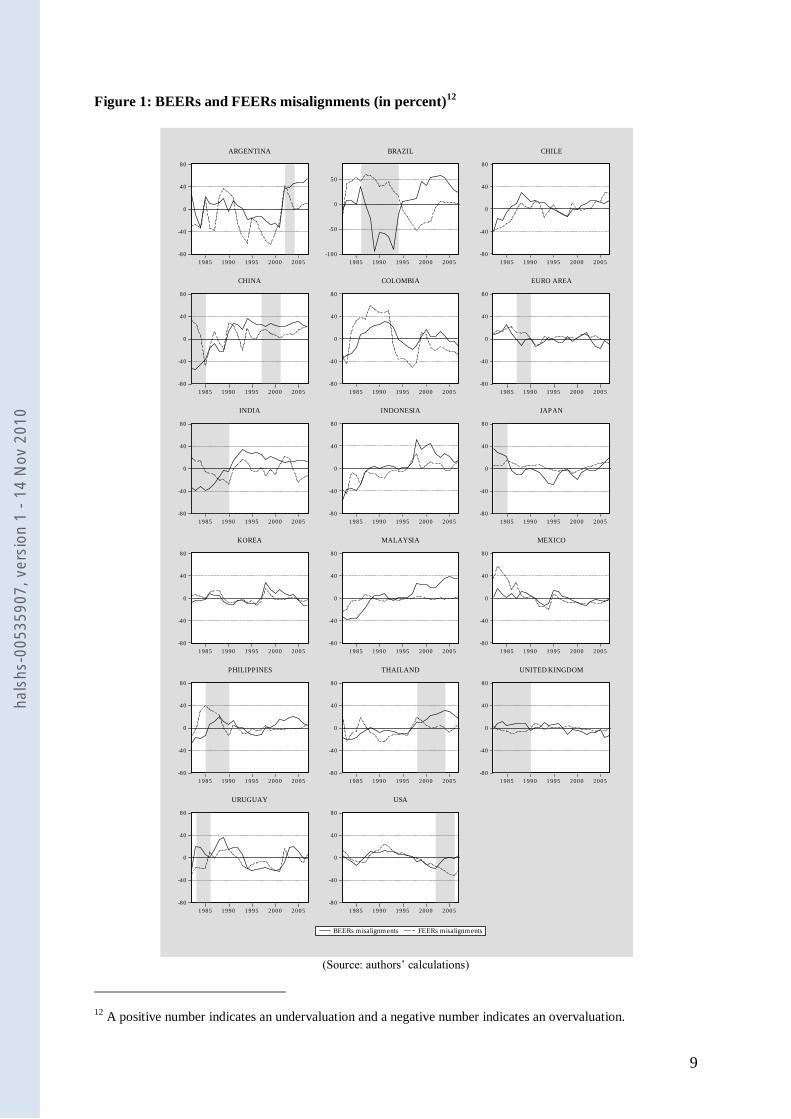
A better understanding of the FEER and BEER divergence would be useful to enlighten
economic policy debates on exchange rate policy and on more structural issues. For a simple
analysis of their divergence (figure 1), it can be recalled that, first, the BEER is rather stable
in the long run and, consequently, BEERs‟ misalignments are mainly deviations between real
exchange rates and their average values. Usually, a real appreciation above this mean value
leads to an overvaluation and, inversely, a real depreciation leads to undervaluation. On the
opposite, the FEER is linked to a rather stable current account balance. As a result, FEERs‟
misalignments reflect mainly deviations between the observed and the equilibrium current
balance. Generally, a rising current account above the equilibrium value leads to an
undervaluation and, inversely, a decreasing current account leads to an overvaluation.
hals
hs-0
0535
907,
ver
sion
1 -
14 N
ov 2
010
9
Figure 1: BEERs and FEERs misalignments (in percent)12
(Source: authors‟ calculations)
12 A positive number indicates an undervaluation and a negative number indicates an overvaluation.
-80
-40
0
40
80
1985 1990 1995 2000 2005
ARGENTINA
-100
-50
0
50
1985 1990 1995 2000 2005
BRAZIL
-80
-40
0
40
80
1985 1990 1995 2000 2005
CHILE
-80
-40
0
40
80
1985 1990 1995 2000 2005
CHINA
-80
-40
0
40
80
1985 1990 1995 2000 2005
COLOMBIA
-80
-40
0
40
80
1985 1990 1995 2000 2005
EURO AREA
-80
-40
0
40
80
1985 1990 1995 2000 2005
INDIA
-80
-40
0
40
80
1985 1990 1995 2000 2005
INDONESIA
-80
-40
0
40
80
1985 1990 1995 2000 2005
JAPAN
-80
-40
0
40
80
1985 1990 1995 2000 2005
KOREA
-80
-40
0
40
80
1985 1990 1995 2000 2005
MALAYSIA
-80
-40
0
40
80
1985 1990 1995 2000 2005
MEXICO
-80
-40
0
40
80
1985 1990 1995 2000 2005
PHILIPPINES
-80
-40
0
40
80
1985 1990 1995 2000 2005
THAILAND
-80
-40
0
40
80
1985 1990 1995 2000 2005
UNITED KINGDOM
-80
-40
0
40
80
1985 1990 1995 2000 2005
URUGUAY
-80
-40
0
40
80
1985 1990 1995 2000 2005
BEERs misalignments FEERs misalignments
USA
hals
hs-0
0535
907,
ver
sion
1 -
14 N
ov 2
010
10
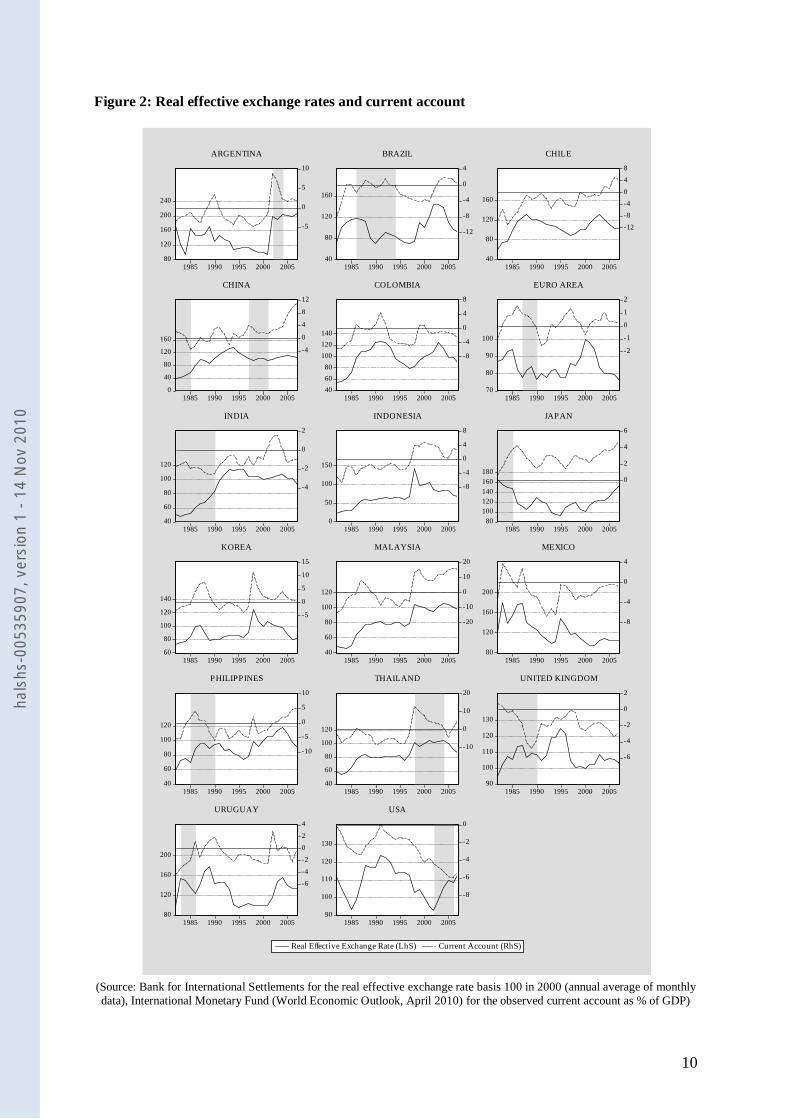
Figure 2: Real effective exchange rates and current account
(Source: Bank for International Settlements for the real effective exchange rate basis 100 in 2000 (annual average of monthly
data), International Monetary Fund (World Economic Outlook, April 2010) for the observed current account as % of GDP)
80
120
160
200
240
-5
0
5
10
1985 1990 1995 2000 2005
ARGENTINA
40
80
120
160
-12
-8
-4
0
4
1985 1990 1995 2000 2005
BRAZIL
40
80
120
160
-12
-8
-4
0
4
8
1985 1990 1995 2000 2005
CHILE
0
40
80
120
160
-4
0
4
8
12
1985 1990 1995 2000 2005
CHINA
40
60
80
100
120
140
-8
-4
0
4
8
1985 1990 1995 2000 2005
COLOMBIA
70
80
90
100
-2
-1
0
1
2
1985 1990 1995 2000 2005
EURO AREA
40
60
80
100
120
-4
-2
0
2
1985 1990 1995 2000 2005
INDIA
0
50
100
150
-8
-4
0
4
8
1985 1990 1995 2000 2005
INDONESIA
80
100
120
140
160
1800
2
4
6
1985 1990 1995 2000 2005
JAPAN
60
80
100
120
140
-5
0
5
10
15
1985 1990 1995 2000 2005
KOREA
40
60
80
100
120
-20
-10
0
10
20
1985 1990 1995 2000 2005
MALAYSIA
80
120
160
200
-8
-4
0
4
1985 1990 1995 2000 2005
MEXICO
40
60
80
100
120
-10
-5
0
5
10
1985 1990 1995 2000 2005
PHILIPPINES
40
60
80
100
120
-10
0
10
20
1985 1990 1995 2000 2005
THAILAND
90
100
110
120
130
-6
-4
-2
0
2
1985 1990 1995 2000 2005
UNITED KINGDOM
80
120
160
200
-6
-4
-2
0
2
4
1985 1990 1995 2000 2005
URUGUAY
90
100
110
120
130
-8
-6
-4
-2
0
1985 1990 1995 2000 2005
Real Effective Exchange Rate (LhS) Current Account (RhS)
USA
hals
hs-0
0535
907,
ver
sion
1 -
14 N
ov 2
010
11
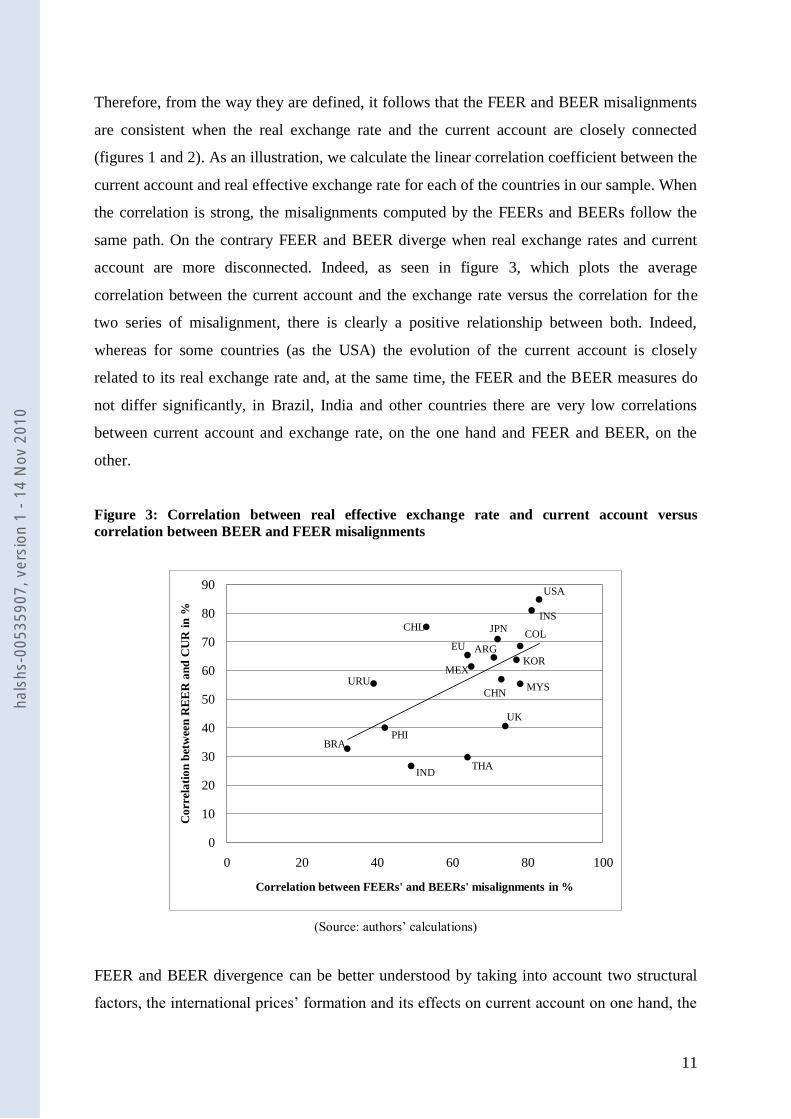
Therefore, from the way they are defined, it follows that the FEER and BEER misalignments
are consistent when the real exchange rate and the current account are closely connected
(figures 1 and 2). As an illustration, we calculate the linear correlation coefficient between the
current account and real effective exchange rate for each of the countries in our sample. When
the correlation is strong, the misalignments computed by the FEERs and BEERs follow the
same path. On the contrary FEER and BEER diverge when real exchange rates and current
account are more disconnected. Indeed, as seen in figure 3, which plots the average
correlation between the current account and the exchange rate versus the correlation for the
two series of misalignment, there is clearly a positive relationship between both. Indeed,
whereas for some countries (as the USA) the evolution of the current account is closely
related to its real exchange rate and, at the same time, the FEER and the BEER measures do
not differ significantly, in Brazil, India and other countries there are very low correlations
between current account and exchange rate, on the one hand and FEER and BEER, on the
other.
Figure 3: Correlation between real effective exchange rate and current account versus
correlation between BEER and FEER misalignments
(Source: authors‟ calculations)
FEER and BEER divergence can be better understood by taking into account two structural
factors, the international prices‟ formation and its effects on current account on one hand, the
0
10
20
30
40
50
60
70
80
90
0 20 40 60 80 100
Co
rrel
ati
on
bet
wee
n R
EE
R a
nd
CU
R i
n %
Correlation between FEERs' and BEERs' misalignments in %
USA
BRA
IND
JPN
EU
INS
COL
KOR
MYSCHN
ARG
MEX
CHL
UK
URU
THA
PHI
hals
hs-0
0535
907,
ver
sion
1 -
14 N
ov 2
010
12
valuation effect and its impact on net foreign assets on the other hand. These points will be
illustrated successively by case studies.
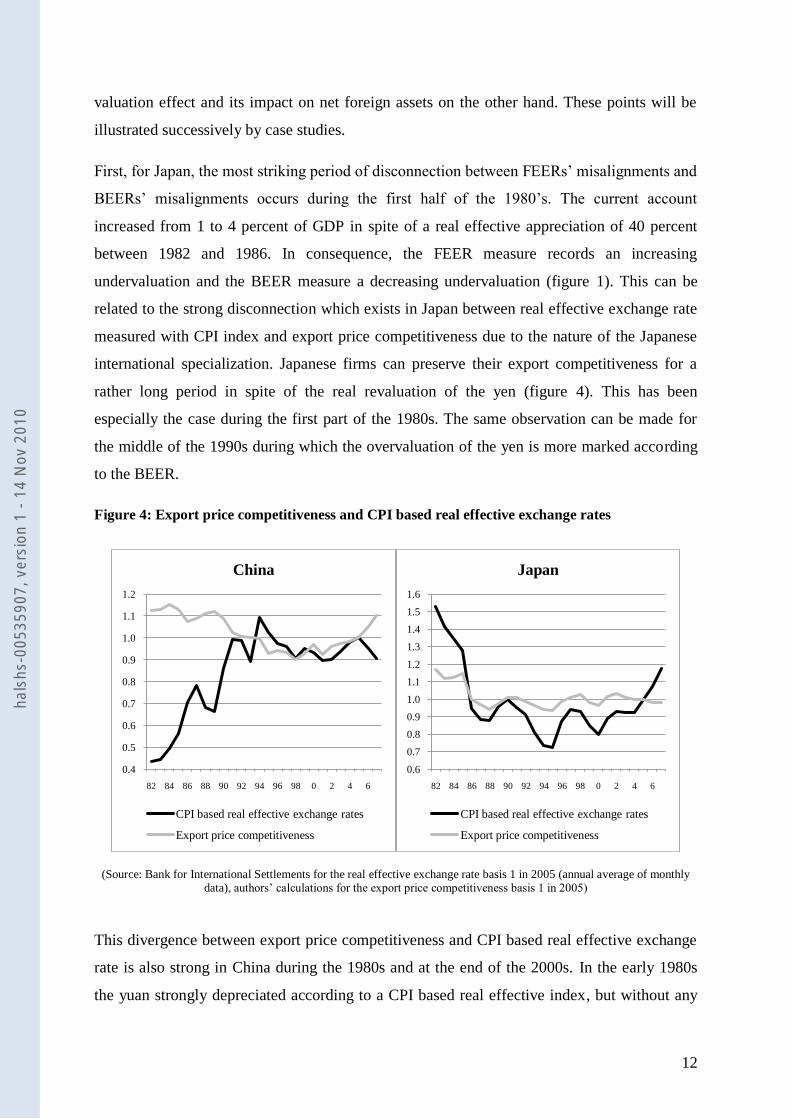
First, for Japan, the most striking period of disconnection between FEERs‟ misalignments and
BEERs‟ misalignments occurs during the first half of the 1980‟s. The current account
increased from 1 to 4 percent of GDP in spite of a real effective appreciation of 40 percent
between 1982 and 1986. In consequence, the FEER measure records an increasing
undervaluation and the BEER measure a decreasing undervaluation (figure 1). This can be
related to the strong disconnection which exists in Japan between real effective exchange rate
measured with CPI index and export price competitiveness due to the nature of the Japanese
international specialization. Japanese firms can preserve their export competitiveness for a
rather long period in spite of the real revaluation of the yen (figure 4). This has been
especially the case during the first part of the 1980s. The same observation can be made for
the middle of the 1990s during which the overvaluation of the yen is more marked according
to the BEER.
Figure 4: Export price competitiveness and CPI based real effective exchange rates
(Source: Bank for International Settlements for the real effective exchange rate basis 1 in 2005 (annual average of monthly data), authors‟ calculations for the export price competitiveness basis 1 in 2005)
This divergence between export price competitiveness and CPI based real effective exchange
rate is also strong in China during the 1980s and at the end of the 2000s. In the early 1980s
the yuan strongly depreciated according to a CPI based real effective index, but without any
0.4
0.5
0.6
0.7
0.8
0.9
1.0
1.1
1.2
82 84 86 88 90 92 94 96 98 0 2 4 6
China
CPI based real effective exchange rates
Export price competitiveness
0.6
0.7
0.8
0.9
1.0
1.1
1.2
1.3
1.4
1.5
1.6
82 84 86 88 90 92 94 96 98 0 2 4 6
Japan
CPI based real effective exchange rates
Export price competitiveness
hals
hs-0
0535
907,
ver
sion
1 -
14 N
ov 2
010
13
improvement of export price competitiveness (figure 4). This could be explained by the poor
quality of the Chinese international specialization at that time. With the beginning of trade
openness, current surplus was replaced by deficit, which explains the evolution of FEERs‟
misalignments in sharp contrast with the BEERs‟ one. In a different economic context a
disconnection can also be noticed at the end of the 2000s. The CPI real effective exchange
rate appreciates moderately while export price competitiveness improves. Furthermore
Chinese non price competitiveness improves also a lot, thanks to changes in the nature and the
quality of export products, which explains the growing undervaluation of the yuan in the
FEER approach.
Second, if the BEER is stable, it is influenced in the long run by structural factors, among
which the NFA and also the relative productivity trends play a central role. In this sense, the
NFAs are mainly determined by the cumulated current accounts but, at the same time, may be
also strongly influenced by valuation effects. These mechanisms (valuation effects,
productivity gains) could be taken into account in complementing the previous analysis which
was only focused on real exchange rate and current account. This could improve the
understanding of FEER and BEER divergence.
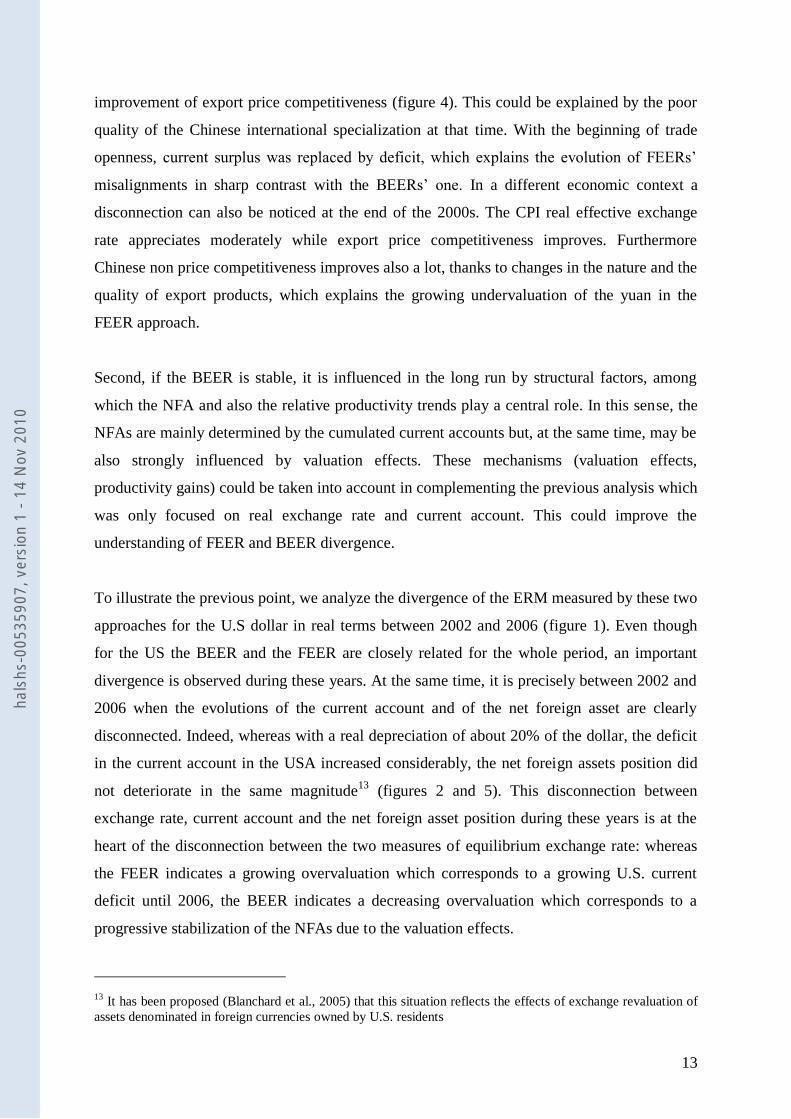
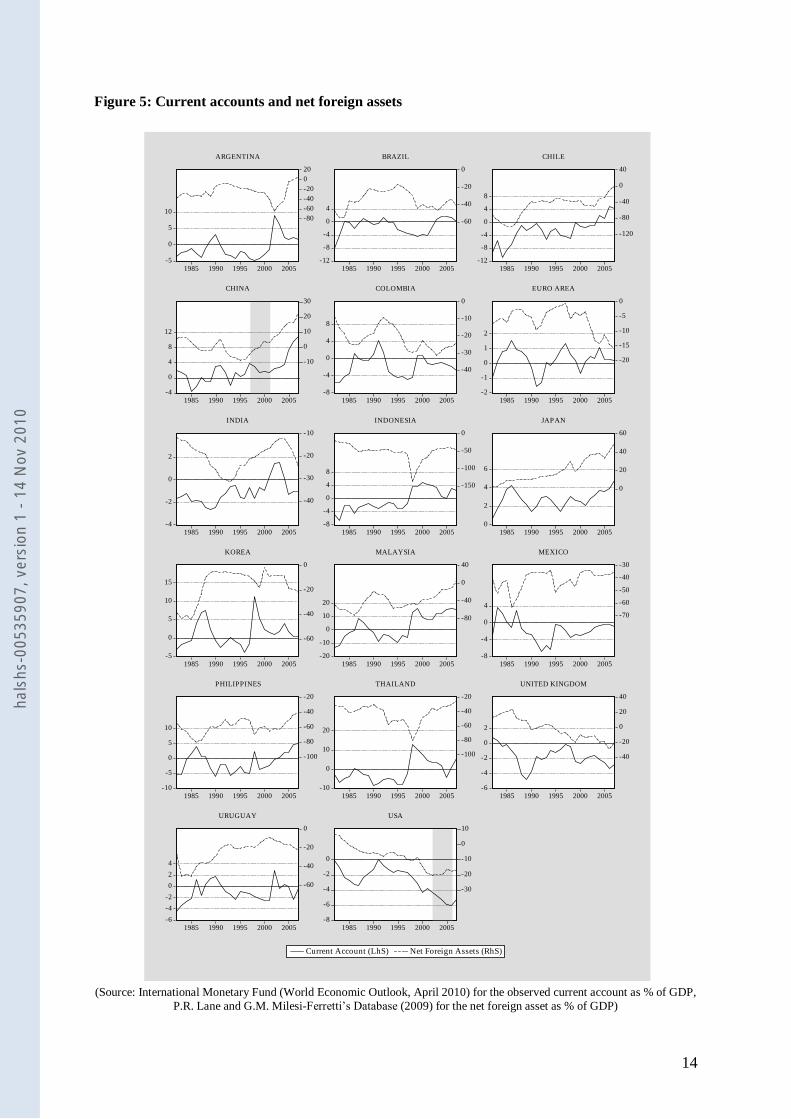
To illustrate the previous point, we analyze the divergence of the ERM measured by these two
approaches for the U.S dollar in real terms between 2002 and 2006 (figure 1). Even though
for the US the BEER and the FEER are closely related for the whole period, an important
divergence is observed during these years. At the same time, it is precisely between 2002 and
2006 when the evolutions of the current account and of the net foreign asset are clearly
disconnected. Indeed, whereas with a real depreciation of about 20% of the dollar, the deficit
in the current account in the USA increased considerably, the net foreign assets position did
not deteriorate in the same magnitude13
(figures 2 and 5). This disconnection between
exchange rate, current account and the net foreign asset position during these years is at the
heart of the disconnection between the two measures of equilibrium exchange rate: whereas
the FEER indicates a growing overvaluation which corresponds to a growing U.S. current
deficit until 2006, the BEER indicates a decreasing overvaluation which corresponds to a
progressive stabilization of the NFAs due to the valuation effects.
13 It has been proposed (Blanchard et al., 2005) that this situation reflects the effects of exchange revaluation of
assets denominated in foreign currencies owned by U.S. residents
hals
hs-0
0535
907,
ver
sion
1 -
14 N
ov 2
010
14
Figure 5: Current accounts and net foreign assets
(Source: International Monetary Fund (World Economic Outlook, April 2010) for the observed current account as % of GDP,
P.R. Lane and G.M. Milesi-Ferretti‟s Database (2009) for the net foreign asset as % of GDP)
-5
0
5
10-80
-60
-40
-20
0
20
1985 1990 1995 2000 2005
ARGENTINA
-12
-8
-4
0
4
-60
-40
-20
0
1985 1990 1995 2000 2005
BRAZIL
-12
-8
-4
0
4
8
-120
-80
-40
0
40
1985 1990 1995 2000 2005
CHILE
-4
0
4
8
12
-10
0
10
20
30
1985 1990 1995 2000 2005
CHINA
-8
-4
0
4
8
-40
-30
-20
-10
0
1985 1990 1995 2000 2005
COLOMBIA
-2
-1
0
1
2
-20
-15
-10
-5
0
1985 1990 1995 2000 2005
EURO AREA
-4
-2
0
2
-40
-30
-20
-10
1985 1990 1995 2000 2005
INDIA
-8
-4
0
4
8
-150
-100
-50
0
1985 1990 1995 2000 2005
INDONESIA
0
2
4
6
0
20
40
60
1985 1990 1995 2000 2005
JAPAN
-5
0
5
10
15
-60
-40
-20
0
1985 1990 1995 2000 2005
KOREA
-20
-10
0
10
20
-80
-40
0
40
1985 1990 1995 2000 2005
MALAYSIA
-8
-4
0
4
-70
-60
-50
-40
-30
1985 1990 1995 2000 2005
MEXICO
-10
-5
0
5
10
-100
-80
-60
-40
-20
1985 1990 1995 2000 2005
PHILIPPINES
-10
0
10
20
-100
-80
-60
-40
-20
1985 1990 1995 2000 2005
THAILAND
-6
-4
-2
0
2
-40
-20
0
20
40
1985 1990 1995 2000 2005
UNITED KINGDOM
-6
-4
-2
0
2
4
-60
-40
-20
0
1985 1990 1995 2000 2005
URUGUAY
-8
-6
-4
-2
0
-30
-20
-10
0
10
1985 1990 1995 2000 2005
Current Account (LhS) Net Foreign Assets (RhS)
USA
hals
hs-0
0535
907,
ver
sion
1 -
14 N
ov 2
010
15
Another interesting episode is the case of the Chinese yuan after the Asian crisis of 1997-98.
Between 1997 and 1999, we observe a halving of the Chinese current surplus due to regional
economic slowdown and currency devaluations in its major trading partners. The FEER
measure indicates a sharp decrease of the yuan real undervaluation which corresponds to the
current account decrease. On the contrary, the BEER indicates a rather stable undervaluation
on this period (around 25 %) which corresponds to a net external position above its structural
value and to a rather stable real effective exchange rate (figures 2 and 5).
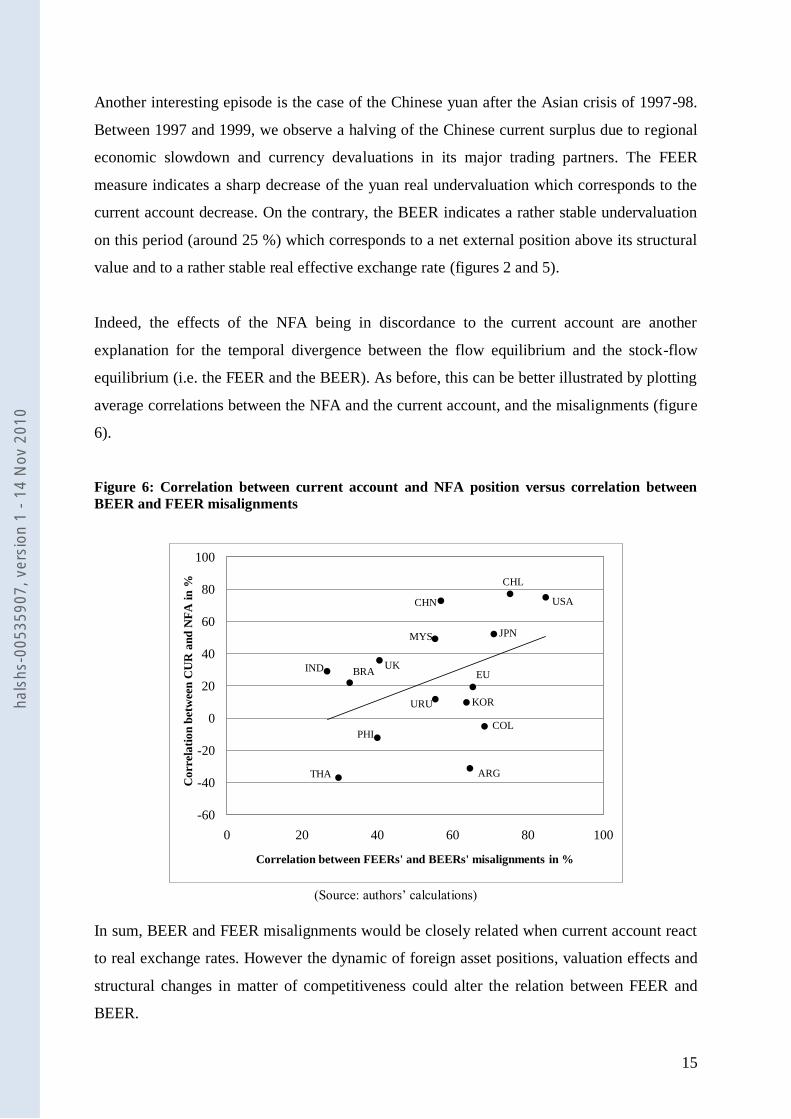
Indeed, the effects of the NFA being in discordance to the current account are another
explanation for the temporal divergence between the flow equilibrium and the stock-flow
equilibrium (i.e. the FEER and the BEER). As before, this can be better illustrated by plotting
average correlations between the NFA and the current account, and the misalignments (figure
6).
Figure 6: Correlation between current account and NFA position versus correlation between
BEER and FEER misalignments
(Source: authors‟ calculations)
In sum, BEER and FEER misalignments would be closely related when current account react
to real exchange rates. However the dynamic of foreign asset positions, valuation effects and
structural changes in matter of competitiveness could alter the relation between FEER and
BEER.
-60
-40
-20
0
20
40
60
80
100
0 20 40 60 80 100
Co
rrel
ati
on
bet
wee
n C
UR
an
d N
FA
in
%
Correlation between FEERs' and BEERs' misalignments in %
USA
BRAIND
JPN
EU
CHL
THA
PHI
UK
CHN
ARG
COL
MYS
URU KORhals
hs-0
0535
907,
ver
sion
1 -
14 N
ov 2
010
16
5. Conclusion
The objective of this study was to understand the temporal links between the two main
measures of equilibrium exchange rate, namely the BEER and the FEER approaches. In order
to do so, we analyzed carefully the temporal dimension and we test empirically a unified
theoretical framework, inspired from Driver and Westaway (2004), which posits a positive
and significant long run relationship between the flow equilibrium (the FEER) and the stock-
flow equilibrium (the BEER).
To avoid serious misinterpretations, it is important to underline that we are dealing with two
concepts of equilibrium exchange rate (FEER / BEER), which correspond to two different
time horizons (the medium term / the long term) and two goals of macroeconomic policy (the
stabilization of the current account balance / the stabilization of the net external position) that
can temporarily diverge.
Our results show that, in average, the two measures are closely related. Yet, important
differences can be observed for some countries and/or some periods of time. Therefore, we
identified several factors which are able to alter the relation between the FEER and the BEER,
This factors are mainly temporal disconnections between the current account and the real
effective exchange rate, which probably are the result of structural changes in matter of
competitiveness, as it is the case in Japan in the first half of the 80s, the dynamic of foreign
asset positions, and valuation effects, as in the USA between 2002-2006.
Finally, as mentioned before, our conclusions point to the fact that there are, sometimes,
temporary divergences between the BEER and the FEER measures of misalignment. Yet, the
fact that they may diverge reflects structural factors such as the international prices‟ formation
and its effects on current account or/and the valuation effect and its impact on net foreign
assets. This is important if the two approaches for assessing misalignments are used for policy
decisions as, for example, setting tariffs in order to cope with the “currency war”.
hals
hs-0
0535
907,
ver
sion
1 -
14 N
ov 2
010
17
Appendix 1 Table A1.1: Panel cointegration test
Pedroni panel cointegration test (1999)
Null Hypothesis: No cointegration
Alternative hypothesis: common AR coefficients (within-dimension)
Panel-v -2.62
Panel-rho -2.40***
Panel-PP -4.14***
Panel-ADF -5.11***
Alternative hypothesis: individual AR coefficients (between-dimension)
Group rho-Statistic 0.17
Group PP-Statistic -2.02**
Group ADF-Statistic -3.10***
Notes: The symbols *, **, and *** indicate statistical significance at the 10 percent, 5 percent, and 1 percent levels,
respectively. ***Reject null of nonstationarity even at the 1% level; **Reject null of nonstationarity at the 5% level.
Source: authors‟ calculation.
hals
hs-0
0535
907,
ver
sion
1 -
14 N
ov 2
010
18
References
Aflouk, N., S-E. Jeong, J. Mazier and J. Saadaoui (2010) „Exchange Rate Misalignments and
World Imbalances: A FEER Approach for Emerging Countries‟, Working Paper No.
12-2010, University of Paris North.
Barisone, G., R. L. Driver and S. Wren-Lewis (2006) „Are our FEERs justified?‟, Journal of
International Money and Finance 25, 741-759.
Bénassy-Quéré, A., S. Béreau and V. Mignon (2009) „Taux de change d'équilibre : Une
question d'horizon‟, Revue économique 60, 657-666.
Béreau, S., A. Lòpez-Villavicencio and V. Mignon (2010) „Nonlinear adjustment of the real
exchange rate towards its equilibrium value: A panel smooth transition error correction
modelling‟, Economic Modelling 27, 404-416.
Blanchard, O., F. Giavazzi and F. Sa (2005) „International Investors, the U.S. Current
Account, and the Dollar‟, Brookings Papers on Economic Activity 36, 1-66.
Borowski, D. and C. Couharde (2003) „The Exchange Rate Macroeconomic Balance
Approach: New Methodology and Results for the Euro, the Dollar, the Yen and the
Pound Sterling‟, Open Economies Review 14, 169-190.
Breitung, J. (2000) „The local power of some unit root tests for panel data‟, In B.H. Baltagi
(Ed.), (Advances in econometrics) Nonstationary panels, panel cointegration, and
dynamic panels 15, Amsterdam: JAI Press.
Bussière, M., M. Ca‟ Zorzi, A. Chudík and A. Dieppe (2010) „Methodological advances in the
assessment of equilibrium exchange rates‟, Working Paper No. 1151, European Central
Bank.
Cheung, Y-W., M. Chinn and E. Fujii (2009) „Pitfalls in Measuring Exchange Rate
Misalignment‟, Open Economies Review 20, 183-206.
Choi, I. (2001) „Unit root tests for panel data‟, Journal of International Money and Finance
hals
hs-0
0535
907,
ver
sion
1 -
14 N
ov 2
010
19
20, 249–272.
Clark, P.B., and R. MacDonald (1998) „Exchange Rates and Economics Fundamentals - A
Methodological Comparison of BEERs and FEERs‟, IMF Working Paper No. 98/67,
International Monetary Fund.
Cline, W.R. (2008) „Estimating Consistent Fundamental Equilibrium Exchange Rates‟,
Working Paper No. WP08-6, Peterson Institute for International Economics.
Cline, W.R. and J. Williamson (2010) „Estimates of Fundamental Equilibrium Exchange
Rates, May 2010‟, Policy Brief No. 10-15, Peterson Institute for International
Economics.
Driver, R.L. and P.F. Westaway (2004) „Concepts of equilibrium exchange rates‟, Bank of
England Working Papers No. 248, Bank of England.
Dunaway, S., L. Leigh and X. Li (2009) „How robust are estimates of equilibrium real
exchange rates: The case of China‟, Pacific Economic Review 14, 361-375.
Jeong, S-E. and J. Mazier (2003) „Exchange Rate Regimes and Equilibrium Exchange Rates
in East Asia‟, Revue économique 54, 1161-1182.
Jeong, S-E., J. Mazier and J. Saadaoui (2010) „Exchange Rate Misalignments at World and
European Level: A FEER Approach‟, Économie Internationale / International
Economics 121, 25-58.
Levin, A., Lin, C. -F. and C. -S. J. Chu (2002) „Unit root tests in panel data: Asymptotic and
finite sample properties‟, Journal of Econometrics 108, 1–22.
Maddala, G. and S. Wu (1999) „A comparative study of unit root tests with panel data and a
simple new test‟, Oxford Bulletin of Economics and Statistics 61, 631–652.
Pedroni, P. (2001) „Purchasing Power Parity Tests in Cointegrated Panels‟, The Review of
Economics and Statistics 83, 727–731.
Rubaszek, M. and L. Rawdanowicz (2009) „Economic convergence and the fundamental
hals
hs-0
0535
907,
ver
sion
1 -
14 N
ov 2
010
20
equilibrium exchange rate in central and eastern Europe‟, International Review of
Financial Analysis 18, 277-284.
Williamson, J. (1994) „Estimating Equilibrium Exchange Rates‟, Washington D.C.: Institute
for International Economics.
hals
hs-0
0535
907,
ver
sion
1 -
14 N
ov 2
010