TELEDIAGNOSTIC - BIOMEDICAL IMAGE MATCHING AND RETRIEVAL IN A MULTI‐DISTRIBUTED TELECOMMUNICATIONS...
23
[1] TELEDIAGNOSTIC BIOMEDICAL IMAGE MATCHING AND RETRIEVAL IN A MULTI‐DISTRIBUTED TELECOMMUNICATIONS ENVIRONMENT FOR AUTOMATIC MEDICAL DIAGNOSIS Amuomo Nixon O. School of Computing and Informatics. University of Nairobi, Kenya E‐mail: [email protected] Peter Waiganjo Wagacha School of Computing and Informatics. University of Nairobi, Kenya E‐mail: [email protected] ABSTRACT Effective management of medical cases can be costly and requires reliable patient diagnosis performed by a trained physician to interpret the data in order to give the correct guided treatment. In many developing countries, the doctor‐patient ratio is poor and bridging these gap is a major challenge. The objective of the project that we report about here was to develop a prototype biomedical image pattern matching tool that could efficiently retrieve biomedical visual images from digital sources (mobile phone fabricated into a light microscope or USB microscope as input devices). Using multimodal database technology, the captured images of a patient specimen such as blood samples, or skin images, could be uploaded into an online database via a web interface or sent via a Multimedia Message Service (MMS) short code for evaluation with bench marked known image using algorithms such as nearest neighbour euclidean distance with threshold such as attributes, color, texture, and shape metrics to compute similarity. Then the score indicating similarity matching level would be sent via Short Message Service (SMS) to the sender (a health worker) or accessed online. This allows a health worker to access a medical expertise who can provide the diagnosis support from a distance.
Transcript of TELEDIAGNOSTIC - BIOMEDICAL IMAGE MATCHING AND RETRIEVAL IN A MULTI‐DISTRIBUTED TELECOMMUNICATIONS...
[1]
TELEDIAGNOSTIC
BIOMEDICAL IMAGE MATCHING AND RETRIEVAL IN A MULTI‐DISTRIBUTED TELECOMMUNICATIONS
ENVIRONMENT FOR AUTOMATIC MEDICAL DIAGNOSIS
Amuomo Nixon O.
School of Computing and Informatics. University of Nairobi, Kenya E‐mail: [email protected]
Peter Waiganjo Wagacha School of Computing and Informatics.
University of Nairobi, Kenya E‐mail: [email protected]
ABSTRACT
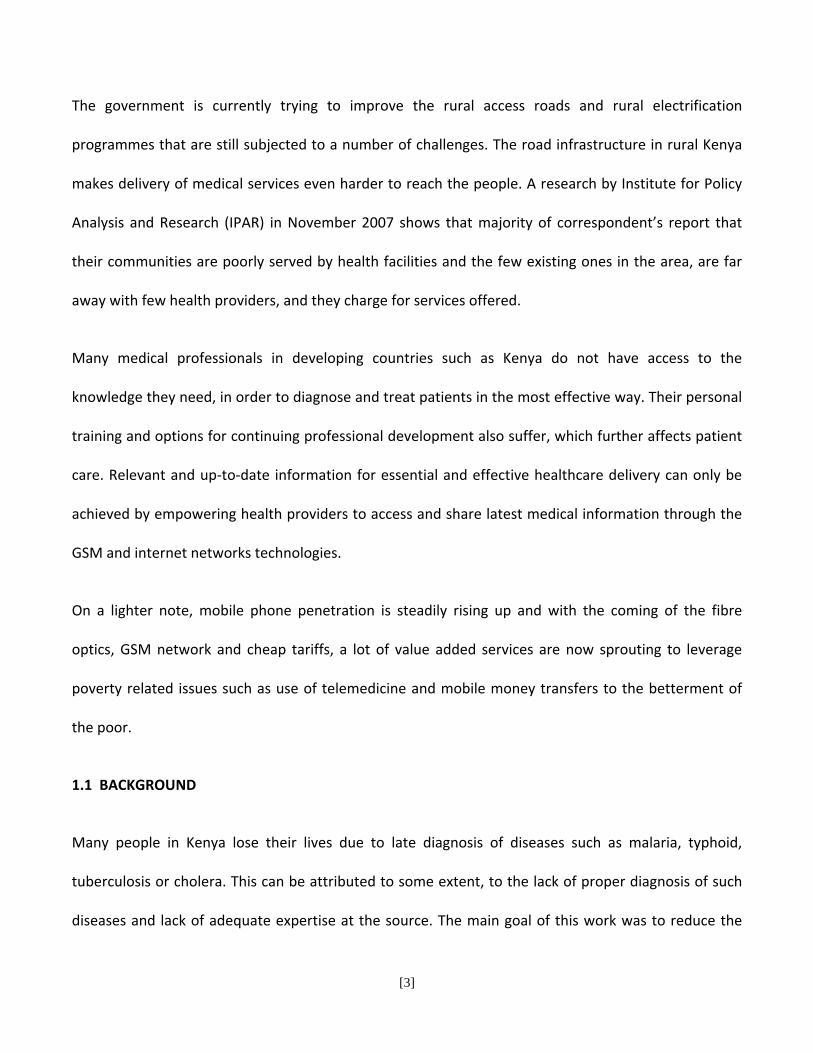
Effective management of medical cases can be costly and requires reliable patient diagnosis performed
by a trained physician to interpret the data in order to give the correct guided treatment. In many
developing countries, the doctor‐patient ratio is poor and bridging these gap is a major challenge.
The objective of the project that we report about here was to develop a prototype biomedical image
pattern matching tool that could efficiently retrieve biomedical visual images from digital sources
(mobile phone fabricated into a light microscope or USB microscope as input devices). Using
multimodal database technology, the captured images of a patient specimen such as blood samples, or
skin images, could be uploaded into an online database via a web interface or sent via a Multimedia
Message Service (MMS) short code for evaluation with bench marked known image using algorithms
such as nearest neighbour euclidean distance with threshold such as attributes, color, texture, and
shape metrics to compute similarity. Then the score indicating similarity matching level would be sent
via Short Message Service (SMS) to the sender (a health worker) or accessed online. This allows a
health worker to access a medical expertise who can provide the diagnosis support from a distance.

[2]
1. INTRODUCTION
The challenge of addressing healthcare and poverty in the rural areas has remained virtually in all
Kenya’s development strategies since independence. According to a research done by Institute for
Policy Analysis and Research (IPAR) in November 2007, it indicates that, despite the efforts by the
government to address the problem over the years, over 46 percent of the Kenyan population is
absolutely poor.
The poor attribute their poverty to a number of factors, including, unemployment, lack of assets, and
lack of credit, inaccessible markets, corruption, poor health, illiteracy, insecurity and economic shocks.
Poverty is a multi‐dimensional phenomenon that goes beyond lack of incomes. This multi‐
dimensionality makes the poor vulnerable to multiple factors arising from the interactions of
economic, political and social processes (World Bank, 2000a).
It is a known fact, that for one to access any medical care, they have to pay a subsidy amount. With the
poverty index getting worse due to the HIV/AID’s prevalence, it becomes even harder as resources
compete for basic needs. It therefore leaves a sizeable population segment out of access to cheap and
reliable medical services.
Not so well equipped medical centers that operate seldom have the expected medical practitioners
that can run them. It therefore becomes quite obvious that whenever an outbreak of diseases occurs,
doctors normally get flown to the affected parts of the county to assist. It is also notable that there are
quite very few referral hospitals across the county with a concentration in urban centers. This implies
that rural areas have lesser number of good doctors.
[3]
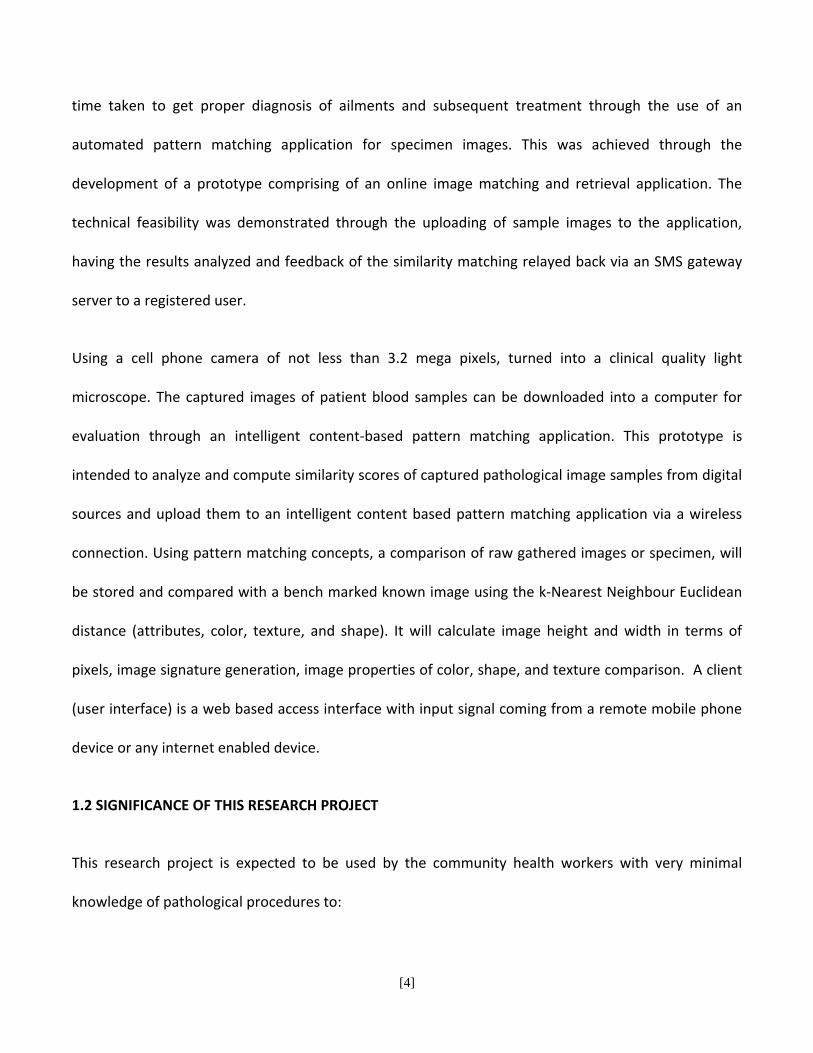
The government is currently trying to improve the rural access roads and rural electrification
programmes that are still subjected to a number of challenges. The road infrastructure in rural Kenya
makes delivery of medical services even harder to reach the people. A research by Institute for Policy
Analysis and Research (IPAR) in November 2007 shows that majority of correspondent’s report that
their communities are poorly served by health facilities and the few existing ones in the area, are far
away with few health providers, and they charge for services offered.
Many medical professionals in developing countries such as Kenya do not have access to the
knowledge they need, in order to diagnose and treat patients in the most effective way. Their personal
training and options for continuing professional development also suffer, which further affects patient
care. Relevant and up‐to‐date information for essential and effective healthcare delivery can only be
achieved by empowering health providers to access and share latest medical information through the
GSM and internet networks technologies.
On a lighter note, mobile phone penetration is steadily rising up and with the coming of the fibre
optics, GSM network and cheap tariffs, a lot of value added services are now sprouting to leverage
poverty related issues such as use of telemedicine and mobile money transfers to the betterment of
the poor.
1.1 BACKGROUND
Many people in Kenya lose their lives due to late diagnosis of diseases such as malaria, typhoid,
tuberculosis or cholera. This can be attributed to some extent, to the lack of proper diagnosis of such
diseases and lack of adequate expertise at the source. The main goal of this work was to reduce the
[4]
time taken to get proper diagnosis of ailments and subsequent treatment through the use of an
automated pattern matching application for specimen images. This was achieved through the
development of a prototype comprising of an online image matching and retrieval application. The
technical feasibility was demonstrated through the uploading of sample images to the application,
having the results analyzed and feedback of the similarity matching relayed back via an SMS gateway
server to a registered user.
Using a cell phone camera of not less than 3.2 mega pixels, turned into a clinical quality light
microscope. The captured images of patient blood samples can be downloaded into a computer for
evaluation through an intelligent content‐based pattern matching application. This prototype is
intended to analyze and compute similarity scores of captured pathological image samples from digital
sources and upload them to an intelligent content based pattern matching application via a wireless
connection. Using pattern matching concepts, a comparison of raw gathered images or specimen, will
be stored and compared with a bench marked known image using the k‐Nearest Neighbour Euclidean
distance (attributes, color, texture, and shape). It will calculate image height and width in terms of
pixels, image signature generation, image properties of color, shape, and texture comparison. A client
(user interface) is a web based access interface with input signal coming from a remote mobile phone
device or any internet enabled device.
1.2 SIGNIFICANCE OF THIS RESEARCH PROJECT
This research project is expected to be used by the community health workers with very minimal
knowledge of pathological procedures to:

[5]
1. Deliver a low‐cost healthcare diagnostic application for the diagnosis of diseases in areas where
medical personnel are unavailable.
2. Utilize the existing technologies such as GSM network and internet to deliver efficient and
effectiveness of content based image retrieval (CBIR) system that can be used to provide online
medical diagnosis. The basic CBIR techniques to be investigated being feature‐based image
retrieval concepts.
3. Evaluate the various image compression methods and the effects on image quality.
While meeting the objectives above, this project is intended to aid in faster diagnosis of ailments such
as malaria, skin diseases, cholera, Tuberculosis, and others. It can be used for patients who do not have
access to advance laboratory tools nor expert physicians. It will enable them get proper disease
diagnostic check up (Laboratory facilities) by using a pattern matching application. This will go a long
way in averting any disaster from happening through early preliminary diagnosis or monitoring
diseases trends for medical administration.
2. LITERATURE REVIEW
Since inception, mobile phones have become indispensable in people’s daily life for ease of
communication needs. Various phone manufacturers’ offers attractive features on various phone
models in order to position themselves in the competitive market. Nowadays mobile phones mean
much more than just simple voice communication devices, they are used for data exchange and as data
capture tools. With all the offered user‐friendly features the “Smartphone” term is used more
frequently to imply the robust functionalities of the mobile phones. Providing multimedia capabilities
has been one of the biggest improvements in this field with various camera phones providing
[6]
multimedia capturing, browsing, editing, and sharing (e.g. via MMS multimedia messages) features in
the market.
The coming of third generation (3G) phones and fibre optics networks have also been engineered for
allowing faster and more reliable internet access, sharing of multimedia as well as video telephony.
Camera phones have been widely adopted by people, and thus accelerated digital multimedia
generation and sharing with increasing computer, digital camera, and Internet usage. Presently there is
a huge amount of distributed digital multimedia available for personal and commercial use in the
market. An average camera phone user may even possess a large memory card.
We intend to tap on such technology to ease the burdens on humanity, thus telediagnostics coupled
with image content retrieval techniques has became an area of research and invention. Such
inventions could be used to provide speedy information to gather statistics on diseases and knowledge
sharing. Computer scientists have a duty to champion the domain knowledge by collaborating with
various domain experts such medicine, agriculture, and biology. Early and accurate diagnosis of the
nature of parasites has always been made with a microscope, which is essential and crucial for
appropriate choice of remedial drugs. Many patients risk either false negative or false positive
diagnosis of diseases due to lack of professionals in the rural areas. Microscopic diagnosis examination
of a well‐stained blood smear still remains the gold standard for most diseases. However, the expertise
and meticulousness needed for such microscopic diagnosis is not widely available, particularly in
remote areas and rural areas. Telediagnostic of diseases from such places is a challenge to the medical
world.

[7]
A team at the University of California, Berkely, led by Dan Fletcher, developed a mobile telephone with
an in‐built microscope, and a notch to place the slide of blood smear of a patient with a suspected
diagnosis of malaria. The device is a sophisticated mobile microscope with an advanced digital camera
to capture microphotographs of the blood smear. It is the intention of this project to tap from this
domain and transmit the digitized image to a pattern matching application for diagnosis as opposed to
sending the image to a doctor for the same diagnosis.
From the mobile phone microscope described above, a normal blood smear stained with Field’s Stain is
to be observed under oil immersion lens of a microscope. A photograph is then taken with a high
resolution camera of Nokia phone or any other mobile phone. This will produce an image such as the
one shown in the figure below.
Figure 1.1 Mobile phone microphotography: From a normal blood smear (Normal blood smear under
oil emersion: (Source:http://www.jkscience.org/archive/volume103/new%20horizons/TELEPHONE.pdf
[8]
The initial specimen or image such as in figure 1.1, can be taken by a camera on the eyepiece of a
microscope, and then uploaded to a pattern matching application online via phone. On confirmation
by a pathologist, the image then becomes the original true image depicting the infection. This then
becomes the base specimen or image.
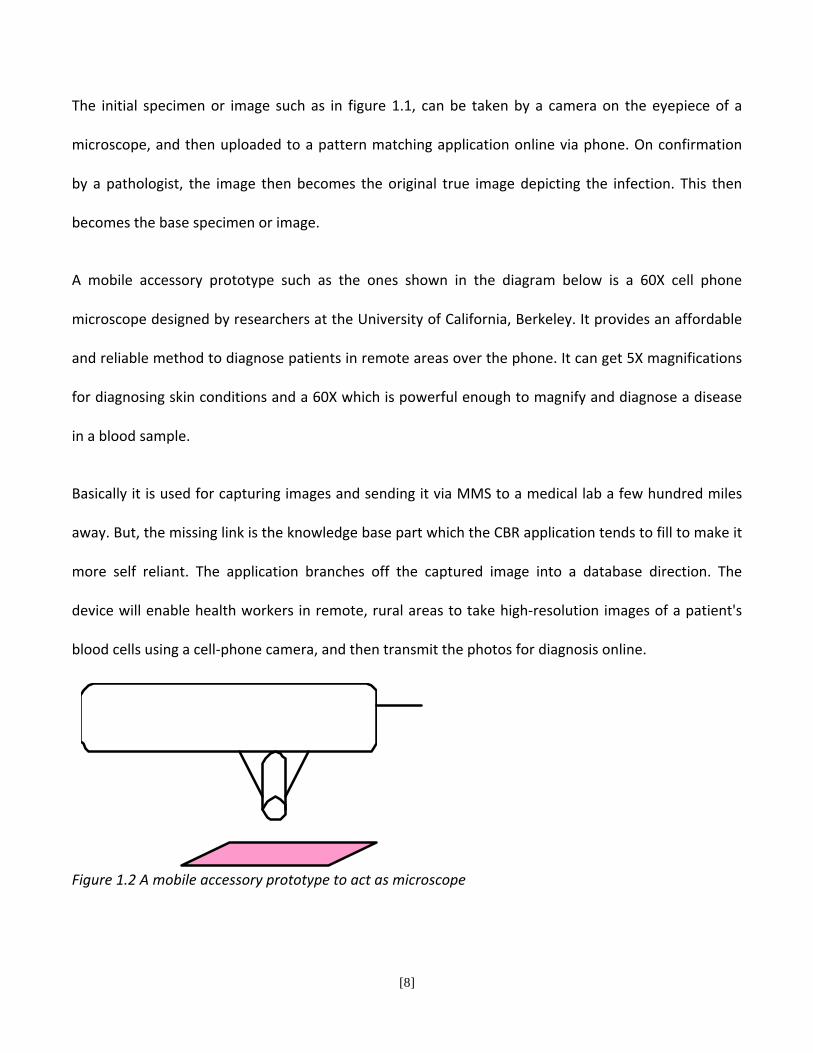
A mobile accessory prototype such as the ones shown in the diagram below is a 60X cell phone
microscope designed by researchers at the University of California, Berkeley. It provides an affordable
and reliable method to diagnose patients in remote areas over the phone. It can get 5X magnifications
for diagnosing skin conditions and a 60X which is powerful enough to magnify and diagnose a disease
in a blood sample.
Basically it is used for capturing images and sending it via MMS to a medical lab a few hundred miles
away. But, the missing link is the knowledge base part which the CBR application tends to fill to make it
more self reliant. The application branches off the captured image into a database direction. The
device will enable health workers in remote, rural areas to take high‐resolution images of a patient's
blood cells using a cell‐phone camera, and then transmit the photos for diagnosis online.
Figure 1.2 A mobile accessory prototype to act as microscope

[9]
The content‐based retrieval system processes the information contained in the image data and creates
an abstraction of its content in terms of visual attributes. Any query performed is therefore dealt with
solely as an abstraction rather than with the image itself. Any image inserted into the database is
analyzed and a compact representation of its content is stored in a feature vector or signature.
The signature of the image in is extracted by segmenting the image into regions based on color. Each
region is associated with its color, texture, and shape information. The signature has a region‐based
information along with global color, texture, and shape information to represent the attributes for the
entire image. The images will be matched based on color, texture, and shape attributes. The positions
of these visual attributes of the image are represented by a location.
Color ‐ Color is one of the primary components of image analysis used for the purpose of content‐
based image retrieval.
Effects of light on pictures ‐ The eye has three classes of color‐sensitive light receptors called cones,
which respond roughly to red, blue and green light (around 650, 530 and 460 nm, respectively). A
range of colors can be reproduced by one of two complimentary approaches:
Additive color: Combine light sources, starting with darkness (black). The additive primary colors are
red (R), green (G), and blue (B). Adding R and G light makes yellow (Y). Similarly, G + B = cyan (C) and R
+ B = magenta (M). Combining all three additive primaries makes white.
Subtractive color: Illuminate objects that contain dyes or pigments that remove portions of the visible
spectrum. The objects may either transmit light (transparencies) or reflect light. The subtractive
[10]
primaries are C, M and Y. Cyan absorbs red; hence C is sometimes called "minus red" (‐R). Similarly, M
is ‐G and Y is ‐B.
It is not practical to use RGB or CMY (K) to adjust brightness or color saturation because each of the
three color channels would have to be changed, and changing them by the same amount to adjust
brightness would usually shift the color (hue). HSV and HSL are practical for editing because the
software only needs to change V, L, or S. Most of the image editing typically transforms RGB data into
one of these representations, performs the adjustment, then transforms the data back to RGB.
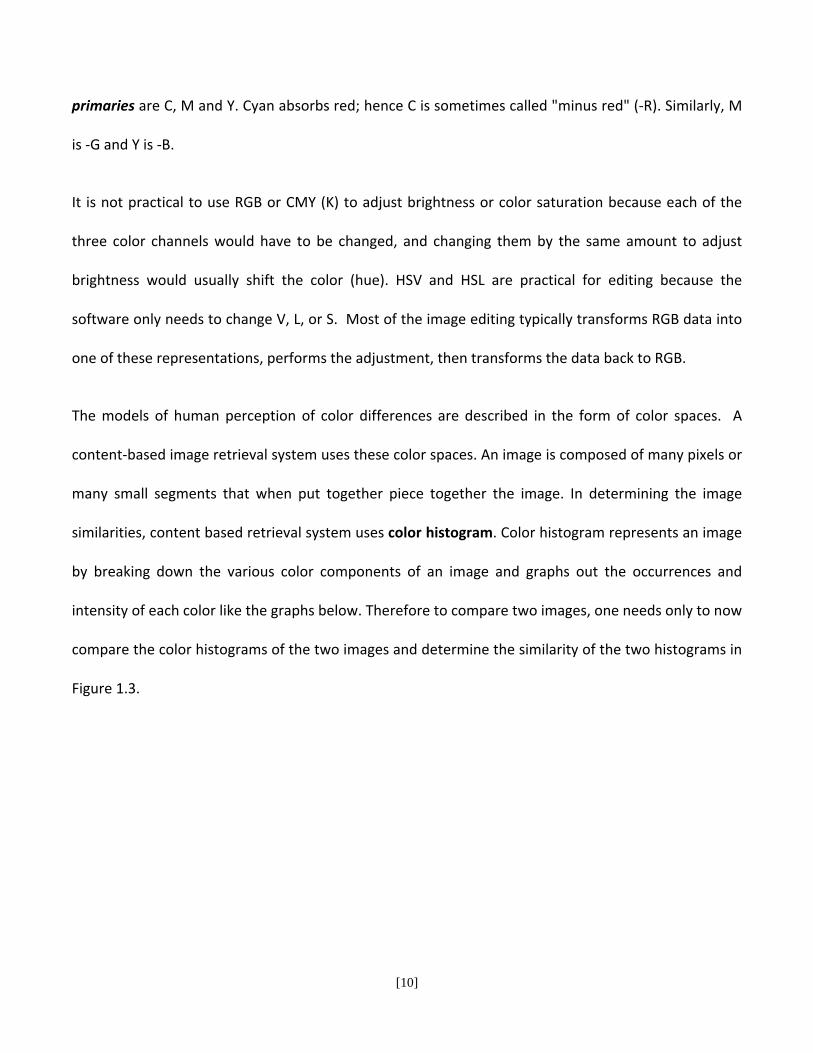
The models of human perception of color differences are described in the form of color spaces. A
content‐based image retrieval system uses these color spaces. An image is composed of many pixels or
many small segments that when put together piece together the image. In determining the image
similarities, content based retrieval system uses color histogram. Color histogram represents an image
by breaking down the various color components of an image and graphs out the occurrences and
intensity of each color like the graphs below. Therefore to compare two images, one needs only to now
compare the color histograms of the two images and determine the similarity of the two histograms in
Figure 1.3.
[11]
Figure 1.3 Histogram (Source: Gonzalez, Woods. Digital image processing. Pearson education. Second
edition.)
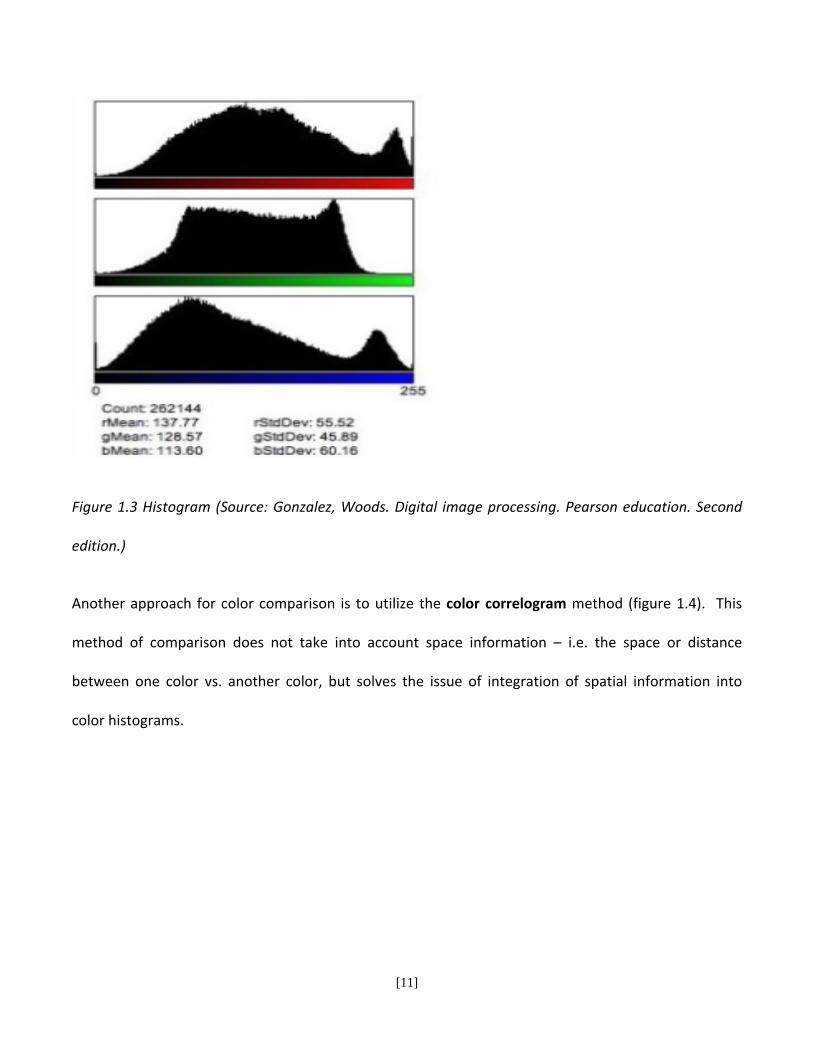
Another approach for color comparison is to utilize the color correlogram method (figure 1.4). This
method of comparison does not take into account space information – i.e. the space or distance
between one color vs. another color, but solves the issue of integration of spatial information into
color histograms.

[12]
Figure 1.4 Representation of a color correlogram. (Source: www.normankoren.com/light_color.html)
Also known as scatter plots, correlograms (figure 1.4) will create a visual representation of the image
as above. While the histogram will note the number of colors and their intensities, a correlogram will
be able to note space information indicating the distance between the different colors. Therefore,
when comparing two different images, it is not only the color components that are being compared,
but also the distance they are from each other.
Texture ‐ Texture is another key component of an image. It is the perception of smoothness or
coarseness of an object. Similar to the color histogram, many of the current techniques for image
texture analysis lack the spatial information allowing one to compare the location of a coarse object
within an image vs. a smooth object. Methodologies such as Gabor filters discussed below can be
used.
[13]
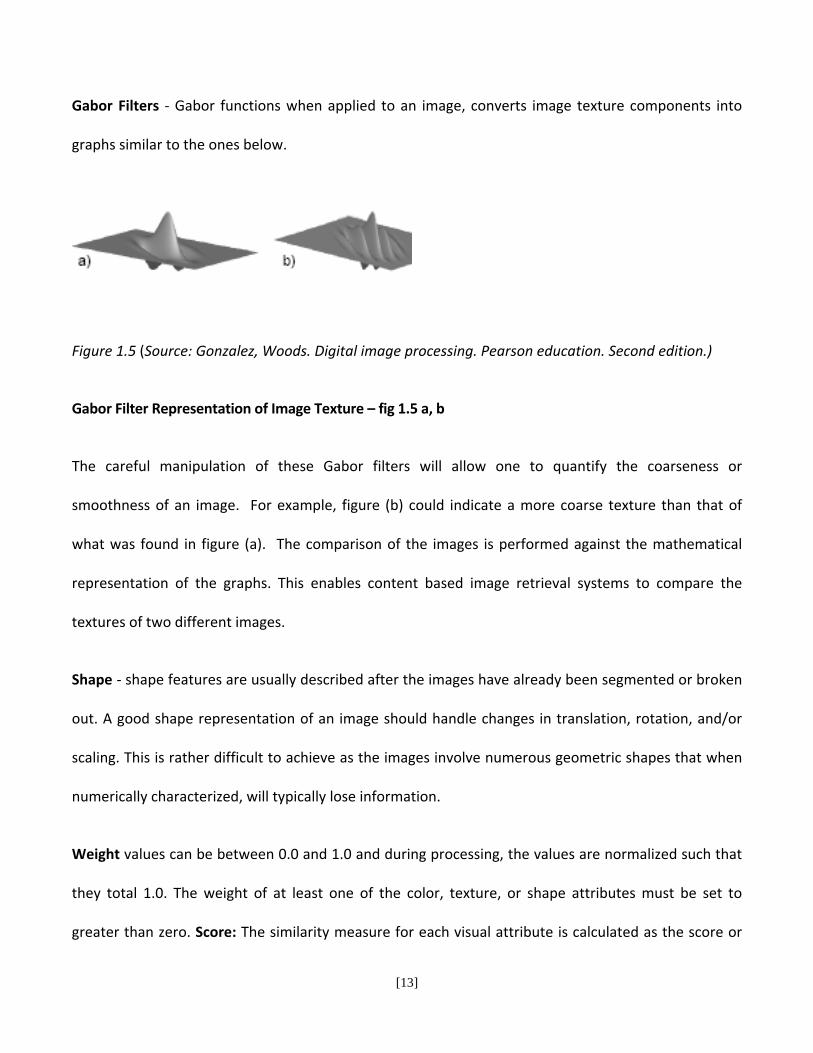
Gabor Filters ‐ Gabor functions when applied to an image, converts image texture components into
graphs similar to the ones below.
Figure 1.5 (Source: Gonzalez, Woods. Digital image processing. Pearson education. Second edition.)
Gabor Filter Representation of Image Texture – fig 1.5 a, b
The careful manipulation of these Gabor filters will allow one to quantify the coarseness or
smoothness of an image. For example, figure (b) could indicate a more coarse texture than that of
what was found in figure (a). The comparison of the images is performed against the mathematical
representation of the graphs. This enables content based image retrieval systems to compare the
textures of two different images.
Shape ‐ shape features are usually described after the images have already been segmented or broken
out. A good shape representation of an image should handle changes in translation, rotation, and/or
scaling. This is rather difficult to achieve as the images involve numerous geometric shapes that when
numerically characterized, will typically lose information.
Weight values can be between 0.0 and 1.0 and during processing, the values are normalized such that
they total 1.0. The weight of at least one of the color, texture, or shape attributes must be set to
greater than zero. Score: The similarity measure for each visual attribute is calculated as the score or
[14]
distance between the two images with respect to that attribute. The score can range from 0.00 (no
difference) to 100.0 (maximum possible difference). Thus, the more similar the two images are with
respect to a visual attribute, the smaller the score will be for that attribute.
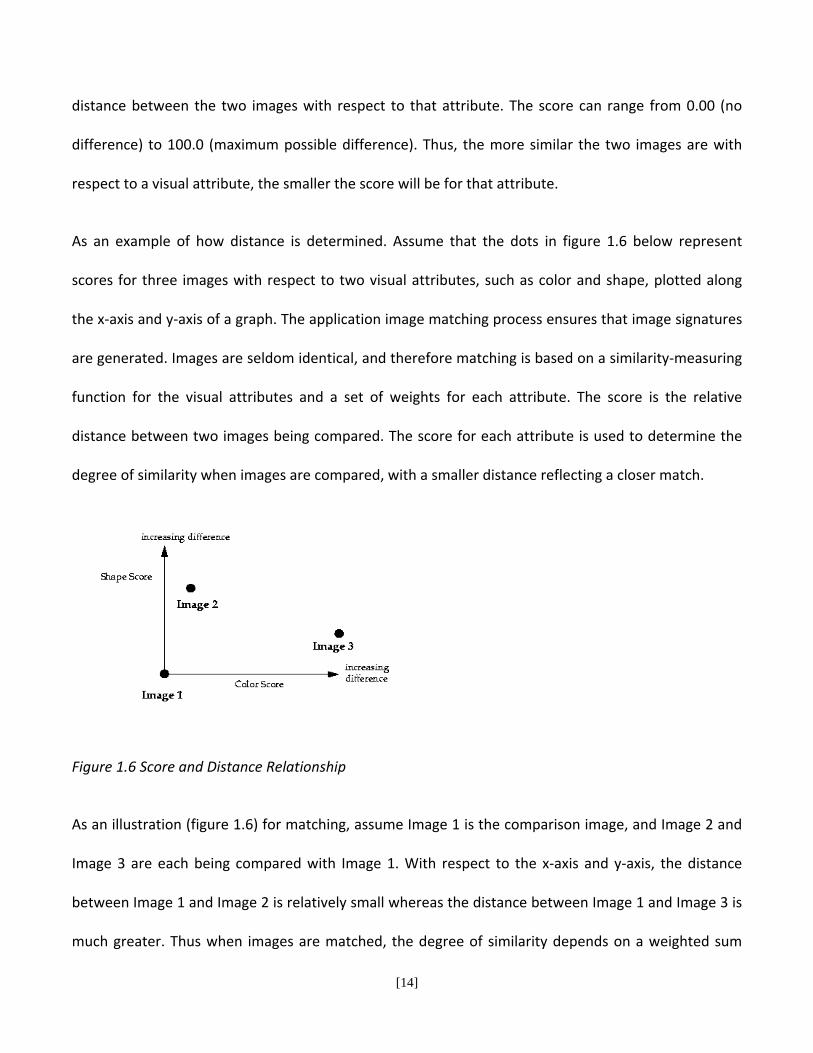
As an example of how distance is determined. Assume that the dots in figure 1.6 below represent
scores for three images with respect to two visual attributes, such as color and shape, plotted along
the x‐axis and y‐axis of a graph. The application image matching process ensures that image signatures
are generated. Images are seldom identical, and therefore matching is based on a similarity‐measuring
function for the visual attributes and a set of weights for each attribute. The score is the relative
distance between two images being compared. The score for each attribute is used to determine the
degree of similarity when images are compared, with a smaller distance reflecting a closer match.
Figure 1.6 Score and Distance Relationship
As an illustration (figure 1.6) for matching, assume Image 1 is the comparison image, and Image 2 and
Image 3 are each being compared with Image 1. With respect to the x‐axis and y‐axis, the distance
between Image 1 and Image 2 is relatively small whereas the distance between Image 1 and Image 3 is
much greater. Thus when images are matched, the degree of similarity depends on a weighted sum
[15]
reflecting the weight and distance of all three of the visual attributes in conjunction with location of
the comparison image and the test image. Again whether or not the two images are considered
matching depends on the threshold value. If the weighted sum is less than or equal to the threshold,
the images match. If the weighted sum is greater than the threshold, the images do not match.
Multimedia Content Storage ‐ The application captures images and stores them in the form of Binary
large objects (BLOBs) which is stored locally in a database transaction control. They can contain audio,
image or video data. The media data can also be stored outside the database, without transaction
control. In this case, a pointer is stored in the database under transaction control, and the media data
is stored in:
File‐based large object (BFILE)
An HTTP server‐based URL
A user‐defined source on a specialized media data server, or other server
Image Compression Methods (Trade‐offs and comparisons)
Compression algorithms are: lossy and lossless. Lossy means that the decompressed image losses
some of the information, but only information that is judged to be insignificant is left. While lossless
means they preserve all the original information.
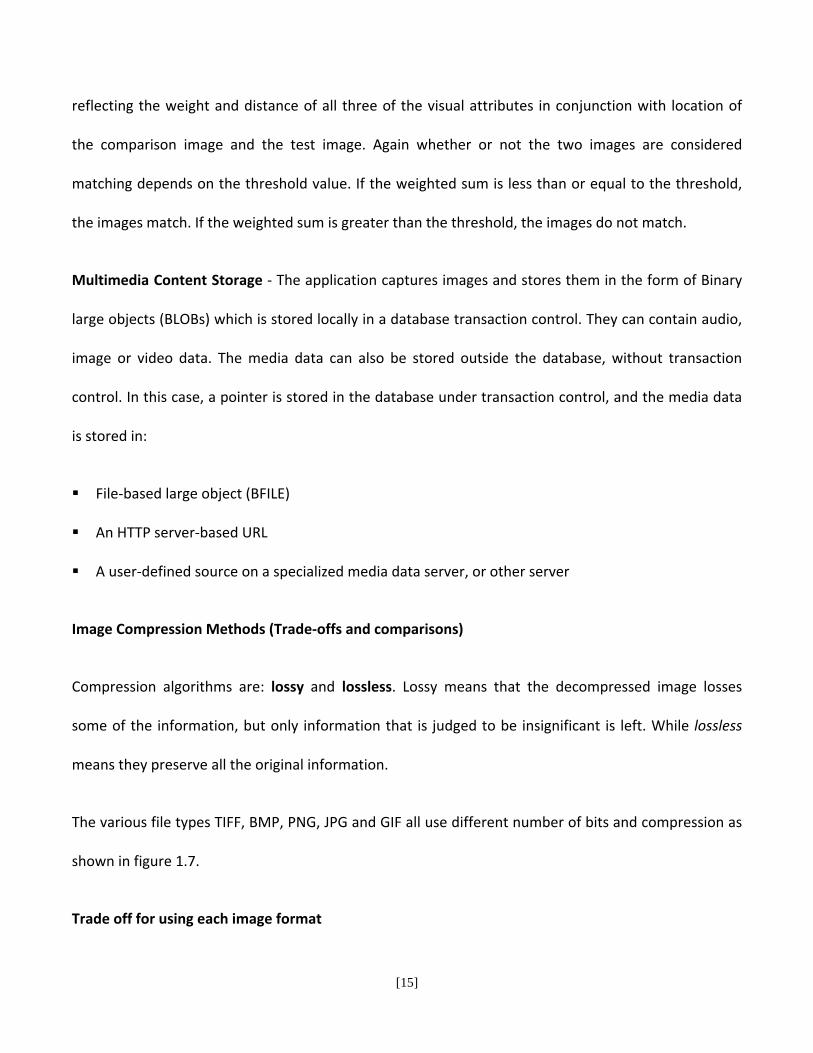
The various file types TIFF, BMP, PNG, JPG and GIF all use different number of bits and compression as
shown in figure 1.7.
Trade off for using each image format
[16]
Figure 1.7 Compression comparison table
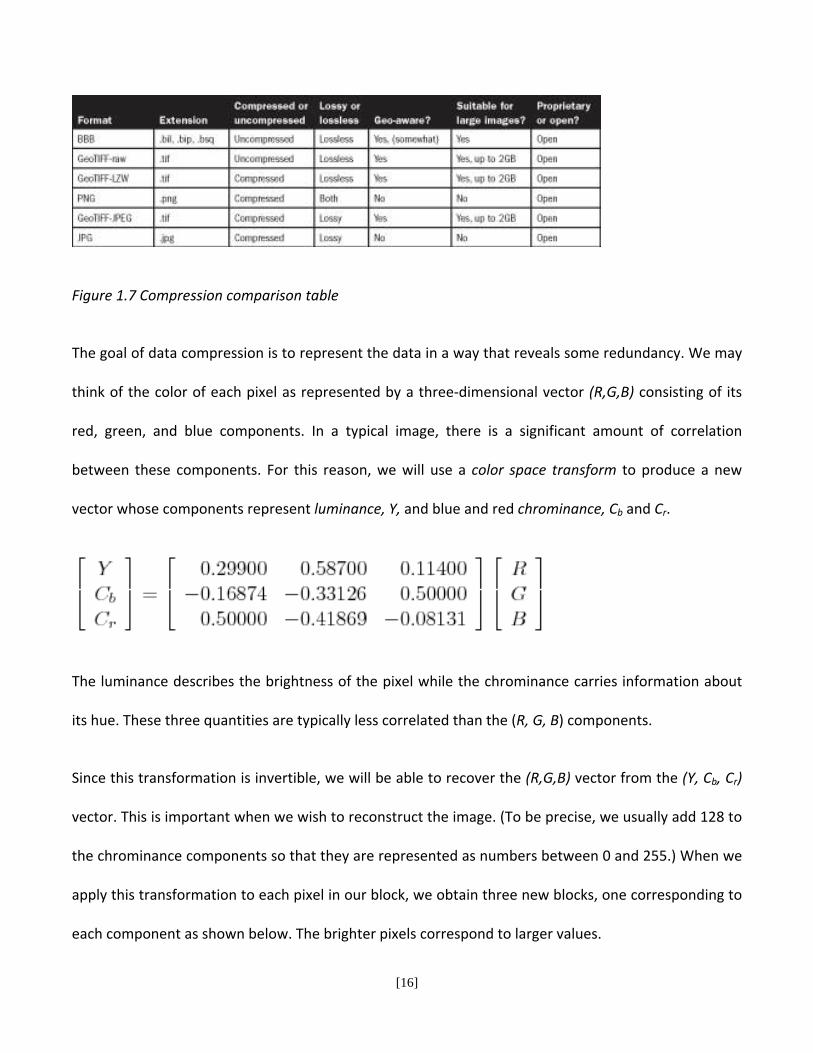
The goal of data compression is to represent the data in a way that reveals some redundancy. We may
think of the color of each pixel as represented by a three‐dimensional vector (R,G,B) consisting of its
red, green, and blue components. In a typical image, there is a significant amount of correlation
between these components. For this reason, we will use a color space transform to produce a new
vector whose components represent luminance, Y, and blue and red chrominance, Cb and Cr.
The luminance describes the brightness of the pixel while the chrominance carries information about
its hue. These three quantities are typically less correlated than the (R, G, B) components.
Since this transformation is invertible, we will be able to recover the (R,G,B) vector from the (Y, Cb, Cr)
vector. This is important when we wish to reconstruct the image. (To be precise, we usually add 128 to
the chrominance components so that they are represented as numbers between 0 and 255.) When we
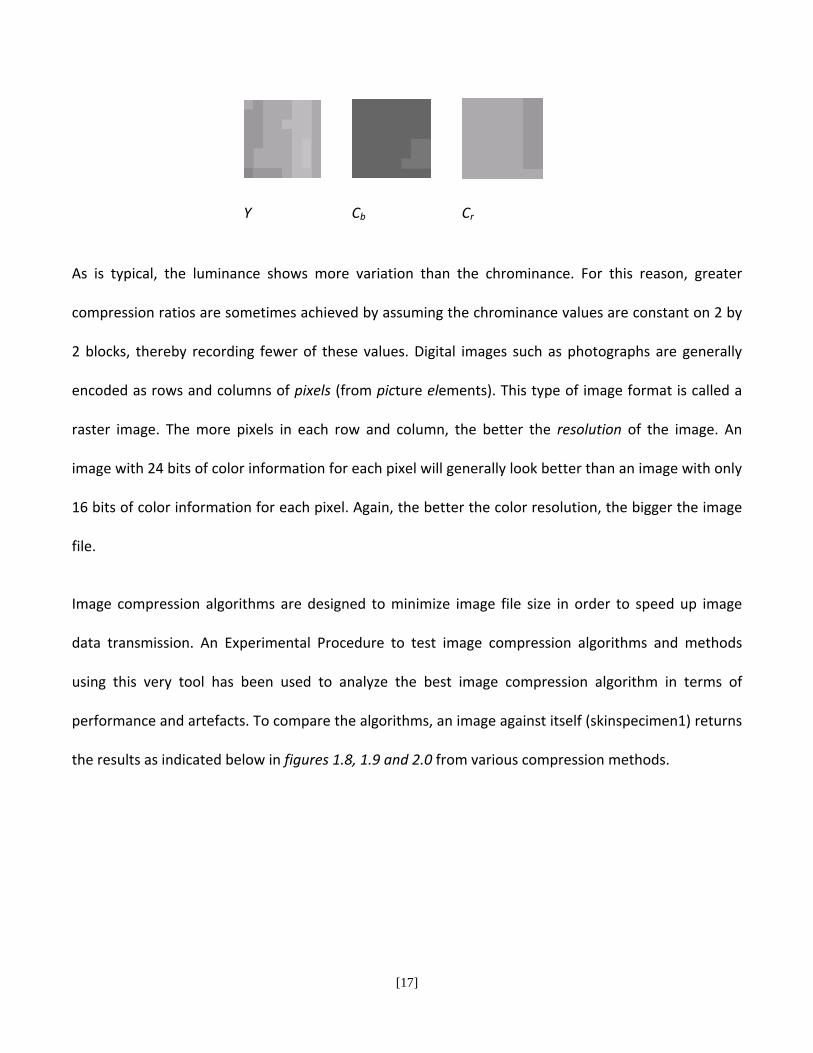
apply this transformation to each pixel in our block, we obtain three new blocks, one corresponding to
each component as shown below. The brighter pixels correspond to larger values.
[17]
Y Cb Cr
As is typical, the luminance shows more variation than the chrominance. For this reason, greater
compression ratios are sometimes achieved by assuming the chrominance values are constant on 2 by
2 blocks, thereby recording fewer of these values. Digital images such as photographs are generally
encoded as rows and columns of pixels (from picture elements). This type of image format is called a
raster image. The more pixels in each row and column, the better the resolution of the image. An
image with 24 bits of color information for each pixel will generally look better than an image with only
16 bits of color information for each pixel. Again, the better the color resolution, the bigger the image
file.
Image compression algorithms are designed to minimize image file size in order to speed up image
data transmission. An Experimental Procedure to test image compression algorithms and methods
using this very tool has been used to analyze the best image compression algorithm in terms of
performance and artefacts. To compare the algorithms, an image against itself (skinspecimen1) returns
the results as indicated below in figures 1.8, 1.9 and 2.0 from various compression methods.

[18]
Figure 1.8 Uploading specimens page
Specimen Name Width (pixels) Width (pixels) Width (bytes) Score (k‐NN)
Compress‐png.png 748 504 436164 0
Compress‐bmp.bmp 748 504 1131030 0
Compress‐jpeg.jpg 748 504 26553 0
Compress‐tiff.tif 748 504 701788 0.012
Compress‐gif.gif 748 504 61326 3.26228
Figure 1.9 Image comparison in bytes and score of similarity for distortion.

[19]
File format File size
Bmp 1,105Kb
Tiff 686Kb
Png 426Kb
Gif 60Kb
Jpeg 26Kb
Figure 2.0 Image compression and storage (Size)
3. RESEARCH PROJECT RESULTS
The application design overview ‐ Figure 2.1
Figure 2.1 Application design architecture
The application is accessible online once hosted. It has a provision for adminsitration tasks. After a
health worker or user logs in, they will be able to select which disease they need to diagnosis on as per
screen in figure 2.2.

[20]
Figure 2.2 Menus for disease selection
Browse to select the directory or path where the raw specimen is on your mobile phone or laptop.
Ensure you correctly label the specimen with the patient name or id. Then select the specimen and
click on upload.
Figure 2.3 Sample specimen images uploaded
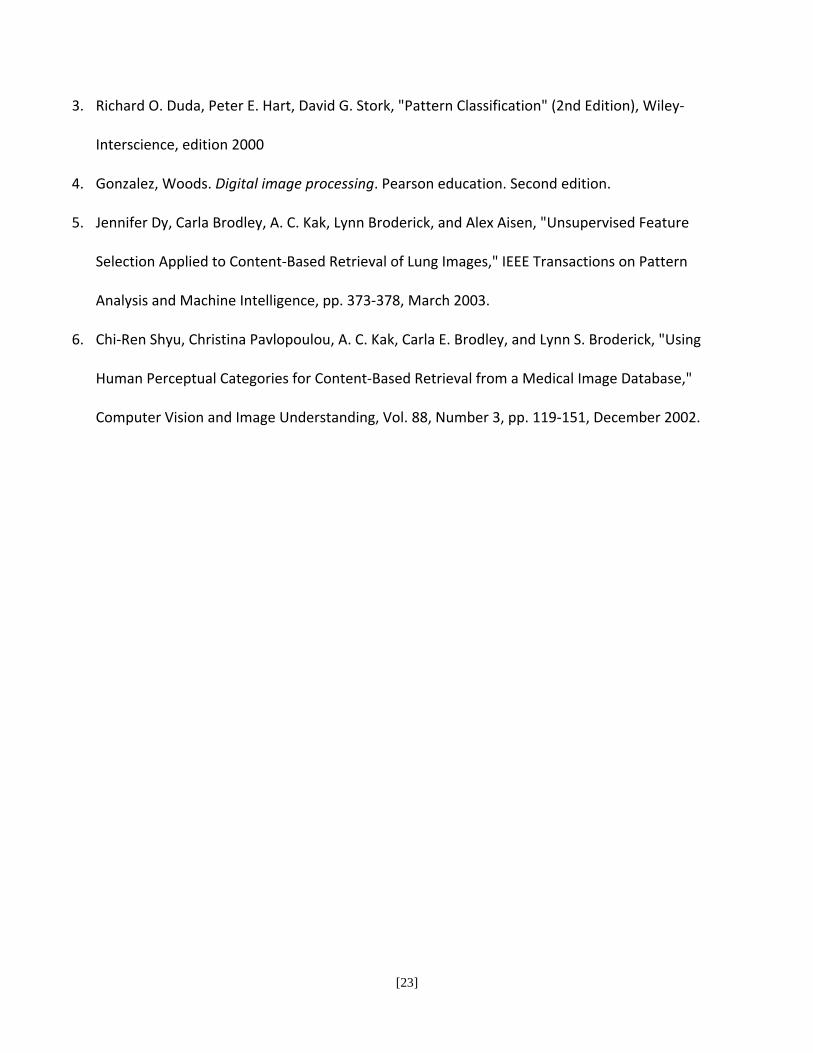
Once upload is done, an SMS report will be delivered only to the registered health worker or user as
shown in figure 2.4. Alternatively, the results can be accessed online from the web page. Figure 2.5
[21]
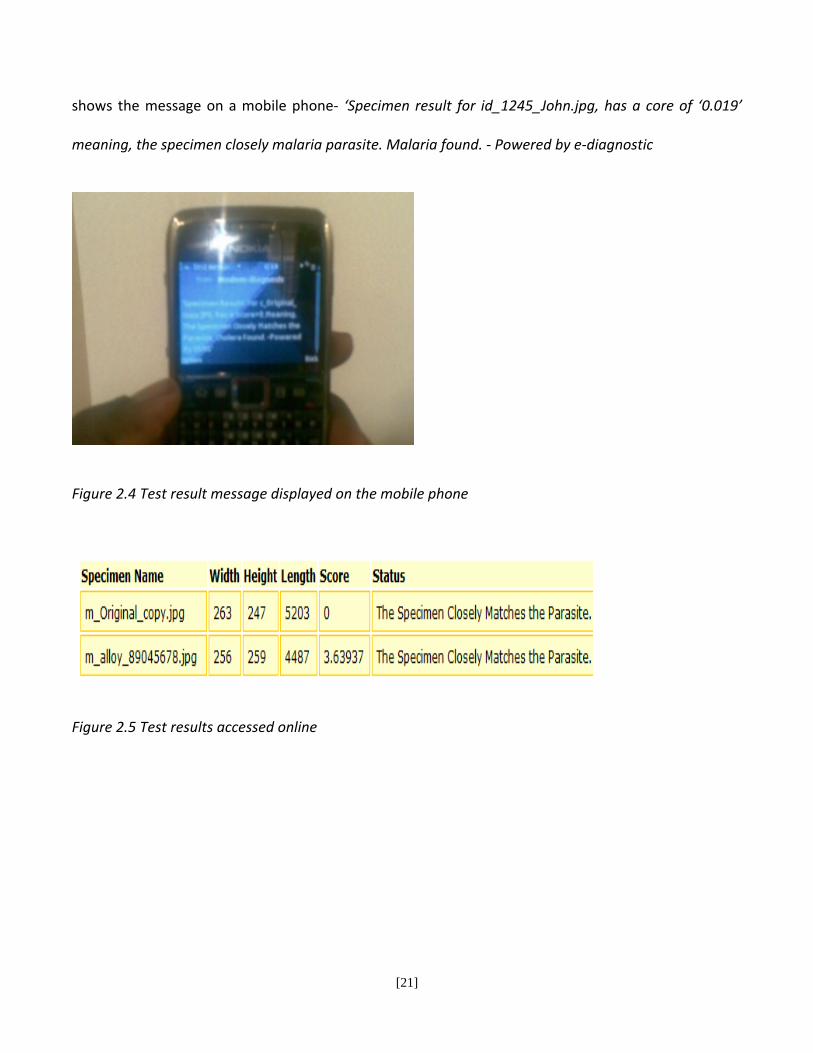
shows the message on a mobile phone‐ ‘Specimen result for id_1245_John.jpg, has a core of ‘0.019’
meaning, the specimen closely malaria parasite. Malaria found. ‐ Powered by e‐diagnostic
Figure 2.4 Test result message displayed on the mobile phone
Figure 2.5 Test results accessed online

[22]
4. CONCLUSION AND RECOMMENDATION
The telediagnostics system is viable as has been shown by our prototype test results. This system has
the potential to save lives in areas where health experts are unavailable and leverage on available
telecommunication technology and allow a health worker in a remote location, with the aid of a mobile
phone, to treat a patient.
With faster internet access and mobile telephony, we intend to microscopy portable and available at
the source. Mobile phone fabrication to act as a microscope or the use of USB Microscope still has
potential avenues for exploration. This solution is cost effective as mobile phones with the above
capability continue to cost less with falling prices. The phone can also be charged using solar energy.
The time taken to reach healthcare will be shortened, laboratory fees, and the transport cost saved can
be used on other basic needs by the poor. This technology has also been developed using readily
available tools and open source software such as the gateway server and apache server, to further
reduce cost of the technology.
5. REFERENCES
1. Telemicroscopy for diseases diagnosis [Online]. (Accessed on 11th Nov. 2008).
http://fletchlab.berkeley.edu/research_cellscope.htm.
2. CS Godse, S Patkar, NS Nabar , AJ Amonkar, RA Vaidya, AA Raut, AB Vaidya. Mobile Camera
Microphotography: A Simple But Elegant Technique For Telediagnosis of Malaria. [Online].
(Accessed on 30th Nov. 2008):
http://www.jkscience.org/current/new%20horizons/TELEPHONE.pdf.
[23]
3. Richard O. Duda, Peter E. Hart, David G. Stork, "Pattern Classification" (2nd Edition), Wiley‐
Interscience, edition 2000
4. Gonzalez, Woods. Digital image processing. Pearson education. Second edition.
5. Jennifer Dy, Carla Brodley, A. C. Kak, Lynn Broderick, and Alex Aisen, "Unsupervised Feature
Selection Applied to Content‐Based Retrieval of Lung Images," IEEE Transactions on Pattern
Analysis and Machine Intelligence, pp. 373‐378, March 2003.
6. Chi‐Ren Shyu, Christina Pavlopoulou, A. C. Kak, Carla E. Brodley, and Lynn S. Broderick, "Using
Human Perceptual Categories for Content‐Based Retrieval from a Medical Image Database,"
Computer Vision and Image Understanding, Vol. 88, Number 3, pp. 119‐151, December 2002.