Telecommunications infrastructure and economic development: A simultaneous approach
22
WISSENSCHAFTSZENTRUM BERLIN FÜR SOZIALFORSCHUNG discussion papers SOCIAL SCIENCE RESEARCH CENTER BERLIN FS IV 96 - 16 Telecommunications Infrastructure and Economic Development: A Simultaneous Approach Lars-Hendrik Röller* Leonard Waverman** * Wissenschaftszentrum Berlin für Sozialforschung ** University of Toronto July 1996 ISSN Nr. 0722 - 6748 Forschungsschwerpunkt Marktprozeß und Unter- nehmensentwicklung Research Area Market Processes and Corporate Development
-
Upload
independent -
Category
Documents
-
view
5 -
download
0
Transcript of Telecommunications infrastructure and economic development: A simultaneous approach

WISSENSCHAFTSZENTRUM BERLINFÜR SOZIALFORSCHUNG
discussion papersSOCIAL SCIENCE RESEARCHCENTER BERLIN
FS IV 96 - 16
Telecommunications Infrastructure andEconomic Development: A SimultaneousApproach
Lars-Hendrik Röller*Leonard Waverman**
* Wissenschaftszentrum Berlin für Sozialforschung
** University of Toronto
July 1996
ISSN Nr. 0722 - 6748
ForschungsschwerpunktMarktprozeß und Unter-nehmensentwicklung
Research AreaMarket Processes andCorporate Development

Zitierweise/Citation:
Lars-Hendrik Röller, Leonard Waverman, TelecommunicationsInfrastructure and Economic Development: A SimultaneousApproach, Discussion Paper FS IV 96 - 16, WissenschaftszentrumBerlin, 1996.
Wissenschaftszentrum Berlin für Sozialforschung gGmbH,Reichpietschufer 50, 10785 Berlin, Tel. (030) 2 54 91 - 0

ABSTRACT
Telecommunications Infrastructure and Economic Development: A SimultaneousApproach*
In this paper we investigate how telecommunications infrastructure affects economicgrowth. This issue is important and has received considerable attention in the popularpress concerning the creation of the "information superhighway" and its potential impactson the economy. We use evidence from 21 OECD countries over the past twenty yearsto examine the impacts that telecommunications developments may have had. We esti-mate a structural model which endogenizes telecommunication investment by specifyinga micro-model of supply and demand for telecommunication investments. The micro-model is then jointly estimated with the macro-growth equation. After controlling forcountry-specific fixed effects, we find evidence of a positive causal link, provided that acritical mass of telecommunication infrastructure is present.
ZUSAMMENFASSUNG
Telekommunikations-Infrastruktur und Wirtschaftsentwicklung: Ein simultanesModell
In diesem Beitrag wird untersucht, welchen Einfluß die Telekommunikations-Infrastruk-tur auf die wirtschaftliche Entwicklung ausübt. Diese wichtige Frage hat im Zusammen-hang mit der Diskussion um "Informationsautobahnen" Aktualität erlangt. In der vorlie-genden Studie wird der Einfluß der Telekommunikations-Infrastruktur für 21 OECD-Länder für die vergangenen 20 Jahre analysiert. Es wird ein Strukturgleichungsmodellgeschätzt, in dem Investitionen in die Telekommunikations-Infrastruktur als endogeneVariable erfaßt werden und in einem Mikromodell Angebot und Nachfrage nach Tele-kommunikations-Investitionen spezifiziert werden. Das Mikromodell wird dann zusam-men mit der Makro-Wachstumsgleichung geschätzt. Als Ergebnis stellen die Autorendann eine positive Kausalbeziehung zwischen Telekommunikations-Investitionen undwirtschaftlicher Entwicklung fest, wenn eine kritische Masse an Telekommunikations-Infrastruktur existiert.
* The authors would like to thank Dimitri Ypsalanti and Paul Wijdicks for their support and
Andreas Stephan for excellent research assistance. An earlier version of this paper has beenpresented at the International Conference on the Economics of Mobile Communications, June 23-24, 1994, CREST, Paris, France, and at the OECD conference on the Economics of theInformation Society, June 27-28, 1995, Toronto, Canada. Financial support from the OECD andINSEAD are gratefully acknowledged. All remaining errors are theirs.
I. Introduction
Explaining the sources of economic growth has ranked amongst the most significant issuesthat economists have examined. Romer's 1986 work began a set of theoretical and empiricalanalyses focusing on the endogeneity of the growth process as compared to Solow (1956)type neoclassical growth models which use an aggregate production function approach andexogenous technical changes. Numerous papers since then have attempted to disentanglethose elements of a national economy which create growth. Many of these papers haveexamined empirically whether economic growth is converging relative to the USA and whatthe forces are that may lead to convergence [see for example Barro and Sala-i-Martin (1992);Mankiw, Romer and Weil (1992); De Long and Summers (1991, 1993)]. Grossman andHelpman (1994) survey the recent literature on the determinants of economic growth anddivide these works into three types: one set considers the accumulation of 'broad' capital,including human capital and different types of physical capital. A second set of papers utilizespillovers or external economies, and finally a third set "cast industrial innovation as theengine of growth1.
This paper investigates how telecommunications infrastructure affects economic growth. Thisissue is important and has received considerable attention in the popular press concerning thecreation of the "information superhighway" and its potential impacts on the economy. We useevidence from 21 OECD countries over the past twenty years to examine the impacts thattelecommunications developments may have had.
Telecommunications infrastructure investment can lead to economic growth in several ways.Most obviously, investing in telecommunications infrastructure does itself lead to growthbecause its products - cable, switches, etc. - lead to increases in the demand for the goods andservices used in their production. In addition, the economic returns to telecommunicationsinfrastructure investment are much greater than the returns just on the telecommunicationinvestment itself. Where the state of the telephone system is rudimentary, communicationsbetween firms is limited. The transactions costs of ordering, gathering information, searchingfor services are high. As the telephone system improves, the costs of doing business fall, andoutput will increase for individual firms in individual sectors of the economy. “If the telephonedoes have an impact on a nation’s economy, it will be through the improvement of thecapabilities of managers to communicate with each other rapidly over increased distances”[Hardy (1980), p. 279]. Thus, telecommunications infrastructure investment and the derivedservices provide significant benefits; their presence allows productive units to produce better.The ability to communicate at will increases the ability of firms to engage in new productiveactivities2. Moreover, the importance of this effect increases as the information intensity of the
1 See also Quah (1993a, 1993b) who criticizes the entire set of empirical studies which examine whether
long term growth is converging for a number of countries.
2 Leff (1984) argues that telecommunications lowers the fixed and variable costs of information acquisition.An expansion of the telecommunications network generates cost savings externalities to other markets.These externalities involve lower costs of search, an increased ability to arbitrage, and increasedinformation on the distribution of prices and services, all leading to lower transactions costs and more

3
production process increases. Thus, telecommunication investments might lead to benefits inother sectors. In suggesting that a country’s telecommunications infrastructure has strongeffects on economic growth, it has been argued that telecommunications investments haveimportant spillovers and create externalities3.
These arguments are in fact reminiscent of the public infrastructure debate of recent years.Public infrastructure refers to more general "traditional infrastructures" such as transportation,sewer systems, water, electricity etc. Early studies show (see for example Aschauer 1989)tremendous returns to public infrastructure investment4. As has been pointed out by agrowing number of papers, these results are subject to a severe simultaneity bias and spuriouscorrelation. Once these two problems have been econometrically controlled for, returns toinfrastructure are much reduced. Clearly, the same problems of reverse causality and spuriouscorrelation do potentially exist for telecommunication infrastructure.
Reverse causality implies that one needs to distinguish two effects: (i) the increase ineconomic growth which is attributable to increases in telecommunications infrastructure andservices development and (ii) the increase in the demand for telecommunication serviceswhich is attributable to increases in economic growth (i.e. the income elasticity oftelecommunication demand). The causation is clearly two-way and unlesstelecommunications infrastructure investment is modeled, the measured effect ontelecommunications infrastructure on growth will be biased. In this paper we attempt toestimate a simultaneous model for telecommunication investments and economic growth. Wespecify a structural model which endogenizes telecommunication investment byspecifying a micro-model of supply and demand for telecommunication investments. Themicro-model is then jointly estimated with the macro-growth equation. In this way, weendogenize telecommunication investment controlling for the simultaneity discussedabove. The second problem of spurious correlation may arise because regional specificinfrastructure investments might be correlated with other growth promoting measureslike R&D investments, investment in human capital, taxes, etc. In order to control forthese correlations we will allow for country-specific fixed effects.
This paper concentrates on telecommunication infrastructure. The reason for this is thatwe believe that telecommunication infrastructure is intrinsically different from other typesof infrastructure: information highways are different from transportation highways. One
efficient operation of the telecommunications - using markets. Leff shows that firms can have morephysically dispersed activities as telecommunications increases, and adds that X-inefficiency will be lower.
3 It is a common conception that a modern communications system is essential to development. Studies bythe United Nations Economic Commission for Europe, 1987, The Telecommunication Industry: Growthand Structural Change; by the International Telecommunications Union, Geneva, 1980, Information,Telecommunications and Development; and by R.J. Saunders, J.J. Warford and B. Wellenius, 1983, for theWorld Bank and the Brundland Commission, Telecommunications and Economic Development all attestto the need to have a modern efficient telecommunications sector as part of a nation's basic infrastructureand as a precursor to economic growth.
4 Aschauer found that the return to infrastructure could be as high as 70% per year. This would implythat a $1 million invested over 30 years would result in a return of almost $5 trillion.

4
seemingly important characteristic of telecommunication technologies, which is notpresent in other types of infrastructure, are network externalities: the more users, themore value is derived by those users. Given that these network externalities are not equallypresent in public infrastructure in general, one might expect that telecommunicationinfrastructure investments lead to higher growth effects than what has been found for theother types of infrastructures5. Given the importance for public policy in this area, it will beinteresting to compare the public infrastructure results to those obtained fortelecommunication infrastructure.
Another implication of network externalities is that the impact of telecommunicationinfrastructure on growth might not be linear, as the growth impact might be larger whenevera significant network size is achieved. This would imply that positive growth effects might besubject to having achieved a critical mass in a given countries communications infrastructure.A relevant question to ask is then whether such nonlinearities in telecommunications do exist,and if so, what the critical mass is. Our empirical analysis below will attempt to answer suchquestions.
The paper is organized as follows. Section II briefly summarizes other related studies. Thedata and some simple correlations are discussed in Section III, Section IV specifies theeconometric model with the results and interpretations in Section V. Section VI concludes.
II. Previous Related Studies
In order to address the impact of infrastructure investments on economic performance itis necessary to differentiate between various types of infrastructure. It is clear that theeffect of telecommunication and information technology infrastructure on productivityand economic growth are potentially very different from other types of infrastructures.Given the importance for public policy in this area, it will be interesting to compare the publicinfrastructure results to those obtained for telecommunication infrastructure. In what followswe first discuss the available evidence for general infrastructure investment and thensurvey several studies that investigate the impact of telecommunication and informationtechnology on economic performance.
There are several studies that address the returns to public infrastructure investments. Aninfluential study by Aschauer (1989), estimates a production function on time series dataand finds a very large contribution of infrastructure to output. Aschauer suggested thatthe stock of public infrastructure capital is indeed a significant determinant of totalfactor productivity growth. He also found a striking relationship between the US pro-ductivity growth slowdown and the decline in the rate of growth of the public capital
5 For instance in transportation infrastructures no such (positive) network externality exist. In fact,
there might be significant negative network externalities present in transportation due to congestion.

5
stock. These early estimates did have an important impact on the public policy debate inthe U.S., as infrastructure is often cited as an answer to the employment problem.
Unfortunately, these early empirical results appear to collapse once more sophisticatedeconometric procedures are used6. The Aschauer model constitutes a classical produc-tion function approach and can be criticized as not accounting for the appropriate cau-salities and correlations. For example the work by Holtz-Eakin (1993, 1994) and Garcia-Mila and McGuire (1992) demonstrates that the introduction of state-level fixed effectsreduces the returns dramatically. Similar results are obtained by Kelejian and Robinson(1994) and Pereira and Frutos (1995) which use other econometric corrections. Using acost function model, Nadiri and Mamuneas (1996) show that the returns to public infra-structure are comparable to those of private investments. Hulten and Schwab [(1984),see also. their (1991) study] estimate a production function for the manufacturing sectoron state-level data. They found that most of the cross-state variation in value-addedgrowth was explained by variations in the rate of private and capital accumulation, lead-ing them to suggest that public infrastructure capital was irrelevant in explainingdifferences in productivity growth. Recently, Balmaseda (1994,1996) argues that theresults found by Aschauer can be explained by simultaneity and aggregation biases. Heshows that the large positive effects of public investment on growth can be reduced tozero, if causality and aggregation biases are accounted for. Hulten (1994) offers severalexplanations for this empirical finding of zero return on public infrastructure.
Thus, the available evidence regarding the returns from public infrastructure appears tobe that the original high returns do not hold up once a number of econometric measuresare employed. We now turn to studies that focus directly on the effect of telecommuni-cation infrastructures on economic output (for evidence on the positive growth effects ofinformation technology investments see for example Lichtenberg (1995)).
Despite the obvious policy relevance, there are far fewer studies that concentrate on thespecific role of telecommunication investment on economic growth and development. Asin the research discussed above even fewer studies address the causality between tele-communication investments and growth. As expected, telecommunications infrastructureinvestments (or stocks) are correlated with economic growth (see also Röller andWaverman (1996)). This evidence, however, does not imply that there is causal relation-ship. As a consequence, policy suggestions going in the direction of increased infrastruc-ture investments based on this kind of evidence are without merit.
Hardy (1980) is one of the first studies we are aware of that investigates the potential impactof telecommunication on growth. Using data for over 15 developed and 45 developingnations from 1960 to 1973, Hardy regresses GDP per capita on lagged GDP per capita,lagged telephones per capita and the number of (lagged) radios. He concludes that telephonesper capita does have a significant impact on GDP, whereas the spread of radio does not.
6 For a survey see also Munell (1992).

6
However, when the regression is attempted for developed and developing economies sepa-rately, no significant effects occur. One explanation of this might be that there are importantfixed effects. Neither fixed effects nor the problem of reverse causality was addressed byHardy.
A more complete analysis of the telecommunication economic growth relationship is providedby Norton (1992). Using data from 47 countries for the period of 1957-1977, he estimatesthe effect of the average stock of telephones between 1957 and 1977 on the mean annualgrowth rate, controlling for the stock of telephones in 1957 and a number of macroeconomicvariables. Norton finds that the telecommunication variable is positive and significant andconcludes that the existence of telecommunications infrastructure reduces transactionscosts since output rises “when the infrastructure is present.” Since the beginning periodtelephone stock is significantly related to subsequent growth, Norton argues that therelationship “is clearly not due to reverse causality.”7 Norton also estimates the highergrowth rates that Burma, Honduras, Sri Lanka and Bolivia would have had given theestimated coefficients and either Mexico’s or Canada’s telephone penetration rates. Hefinds extremely high impacts and states it is “implausible that Burma could or would haveincreased its investment- income rate by 55.5% and its growth rate by roughly the sameamount simply by increasing its stock of telephones to a level comparable with Mexico’sstock“. One explanation is that many growth effects are being captured by the telecom-munication variables, including the growth of all the industries that telecommunicationsencourages. This is similar to the state-level fixed effects in the public infrastructure lit-erature.
Finally, there is a recent study by Greenstein and Spiller (1995) who investigate theimpact of telecommunication infrastructure (as measured by the amount of fiber-opticcable employed) on economic growth in the U.S. They find that a positive and significanteffect exists (output increases some 10% from doubling the amount of fiber-optic cable)in one industry, whereas in manufacturing sectors less of a telecommunications growtheffect exists.
In sum, the above studies provide some evidence that telecommunications investment haspositive effects on output. However, most of these studies use single equation models. Incontrast to the above papers, we estimate a more structural model which endogenizes tele-communication investment by specifying a micro-model of supply and demand for tele-communication investments. The micro-model is then jointly estimated with the macro-growth equation. This is important because infrastructure investment affects many othersectors which makes a macro-level growth analysis necessary. Moreover, as has beendemonstrated by the studies around the public infrastructure debate, fixed effects mightbe important. In light of the public infrastructure experience, it would be important for
7 Norton also estimates a simpler equation for 78 countries for the 1970-80 and 1960-80 periods. Only
four right-hand-side variables are included - initial year income per capita, the standard deviation ofreal output, TELPOP and a dummy variable for centrally planned economies. Again the coefficienton TELPOP is positive and significant. “... consistent with the view that the stock oftelecommunications lowers transaction costs and stimulates economic growth.”

7
public policy to investigate whether the positive growth effects of telecommunicationinvestments hold up. Our empirical analysis below will attempt to shed some light on thisissue.
III. Data and Correlations
In this section we investigate simple correlations between telecommunications infrastruc-ture investment and aggregate output. Similar to other studies, we utilize data for 35countries over a twenty year period 1970 to 1990. The 35 countries consist of 21 OECDcountries and 14 developing or newly industrialized economics.8 The 35 countries arelisted in Table 1. Generally, data were more prevalent for developed OECD economiesthan for the other economies.
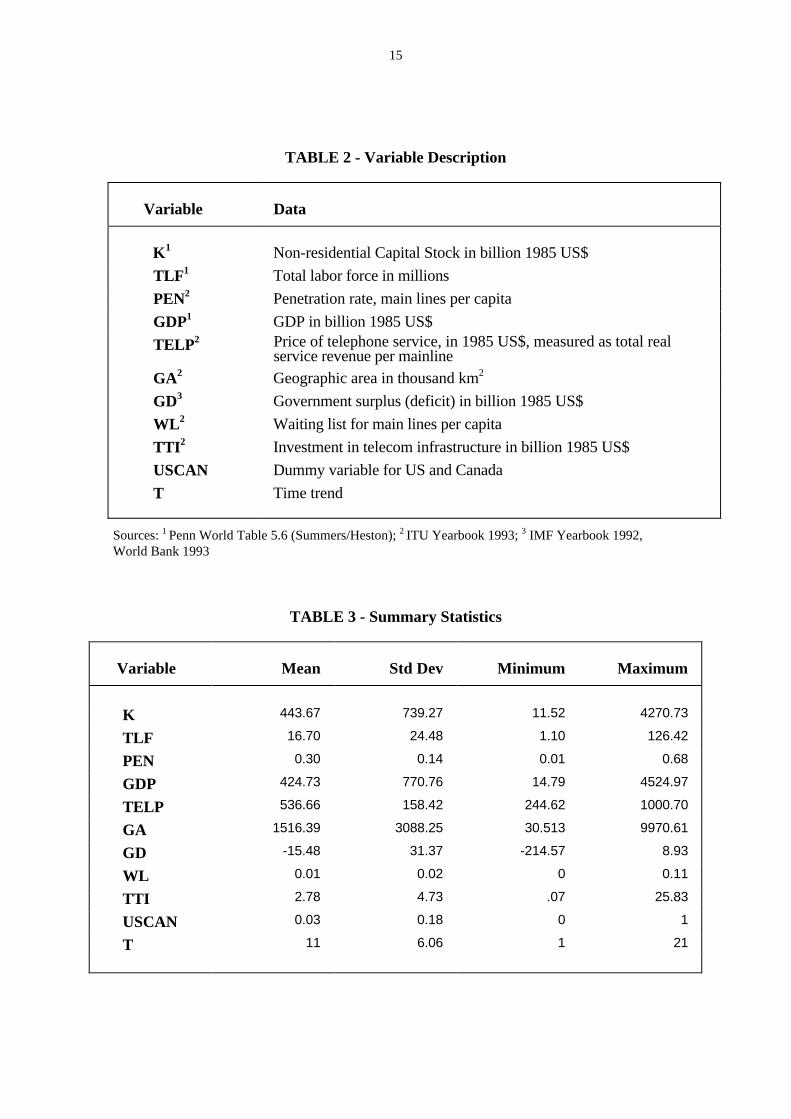
The data gathered consist of data on general economic variables and country character-istics - GDP, GDP deflator, population, CPI, gross domestic investment, gross domesticsavings, government deficit (or surplus), geographic area, population density, laborforce, unemployment rate, percentage of school age children in primary, and in secon-dary school. Most of this data is from the Summers and Heston (1991) data base. Alsogathered are data on a number of characteristics of telecommunication developments9 -mainlines, residential mainlines, waiting list for mainlines, national and international trunktraffic, income from telephone services, national and international telex traffic, incomefrom telex services, the number of data terminals, circuit ends connected to automaticswitching exchanges, machines equipped for direct dialing and investment in telecom-munication. Much of these data (e.g. number of data terminals) are available for only afew years and for only a few countries. Table 2 defines the variables used in this study.Summary statistics are provided in Table 3.
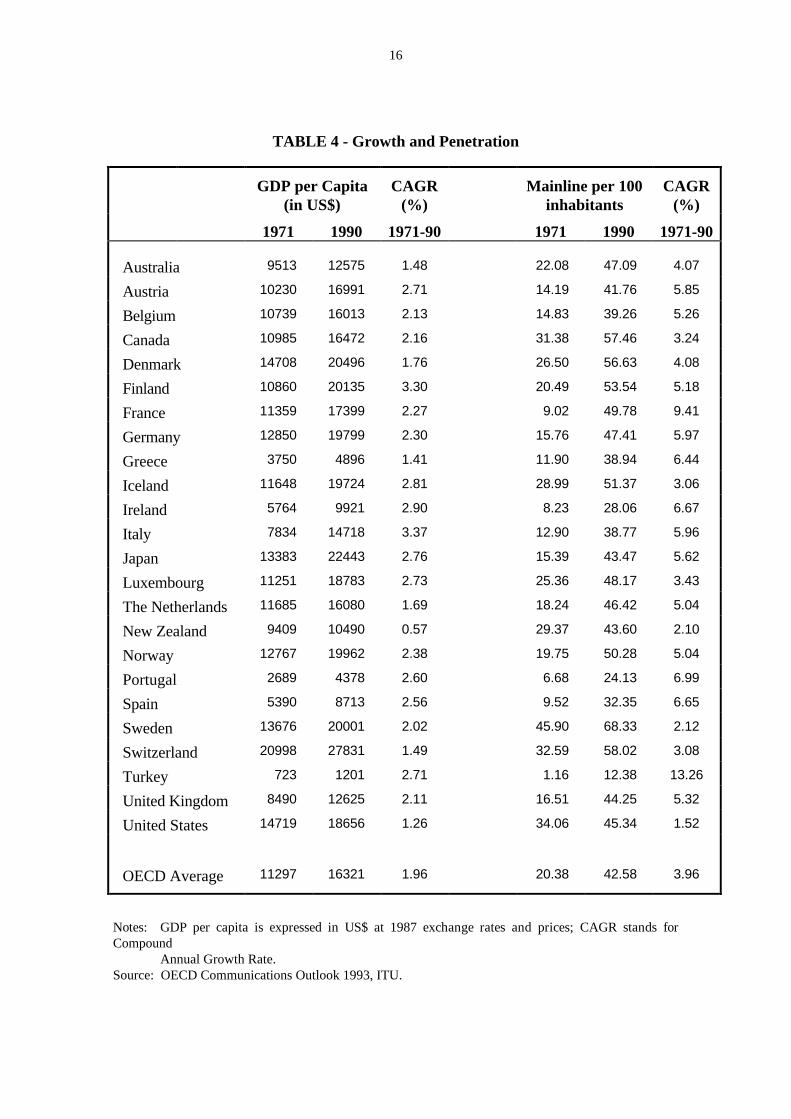
Before turning to our model, we present some broad averages and examine simple corre-lations. Table 4 provides estimates for OECD countries of the average growth rates ofreal GDP per capita and main lines per 100 inhabitants, over the 1971–1990 period. TheOECD average growth rate for GDP per capita was 1.96% and for mainlines 3.96%.Overall, real GDP is very strongly positively associated with the number of mainlines(correlation is .99).10 Given the near total correlation (.94) between the number of main-lines and real GDP across the OECD, it is not surprising that regressions of GDP onmainlines finds substantial effects. Figure 1 shows the relationship for the OECD coun-tries for one year, 1990, between mainlines per 100 inhabitants and real GDP per capita.
8 Several of the OECD countries are developing or newly industrializing over part or all of the 1970-
1990 period - Greece, Portugal, Spain and Turkey.9 We are indebted to Paul Wijdicks (OECD) who was able to acquire much of the data needed in our
study.10 There is, however, less of a relationship between real GDP per capita and the number of mainlines
(.42). Thus the correlation between GDP and mainlines may partially be an artifact of country size.Another explanation is the different degree of development across the OECD.
8
A univariate linear cross-country regression of mainlines explains about 65% of the vari-ance in GDP.
IV. An Econometric Model of Telecommunication Investment and Growth
In this section we employ a more structural model, a hybrid production function frame-work, which endogenizes telecommunications investment. In order to endogenize thetelecommunications sector into the aggregate economy a micro-model of supply anddemand is specified and jointly estimated with the macro-growth equation. In this way,we endogenize telecommunications investment and control for the causal effects dis-cussed above. In addition we will allow for fixed effects.
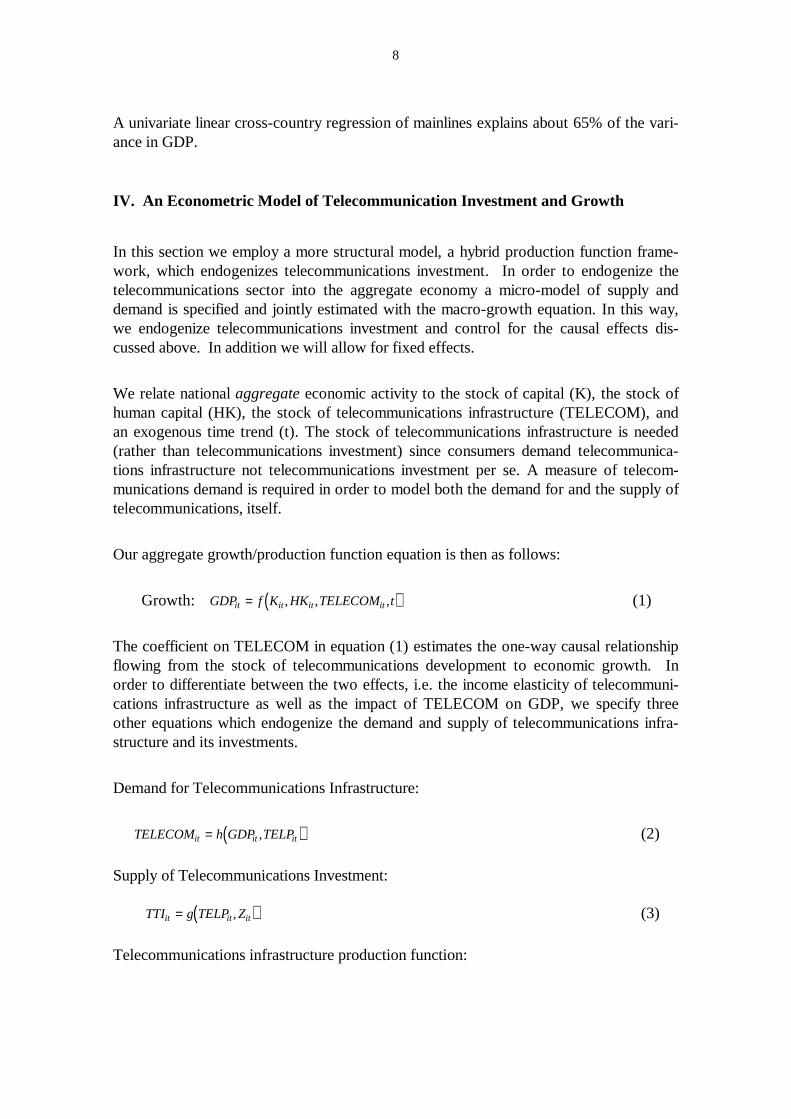
We relate national aggregate economic activity to the stock of capital (K), the stock ofhuman capital (HK), the stock of telecommunications infrastructure (TELECOM), andan exogenous time trend (t). The stock of telecommunications infrastructure is needed(rather than telecommunications investment) since consumers demand telecommunica-tions infrastructure not telecommunications investment per se. A measure of telecom-munications demand is required in order to model both the demand for and the supply oftelecommunications, itself.
Our aggregate growth/production function equation is then as follows:
Growth: ( )GDP f K HK TELECOM tit it it it= , , , (1)
The coefficient on TELECOM in equation (1) estimates the one-way causal relationshipflowing from the stock of telecommunications development to economic growth. Inorder to differentiate between the two effects, i.e. the income elasticity of telecommuni-cations infrastructure as well as the impact of TELECOM on GDP, we specify threeother equations which endogenize the demand and supply of telecommunications infra-structure and its investments.
Demand for Telecommunications Infrastructure:
( )TELECOM h GDP TELPit it it= , (2)
Supply of Telecommunications Investment:
( )TTI g TELP Zit it it= , (3)
Telecommunications infrastructure production function:
9
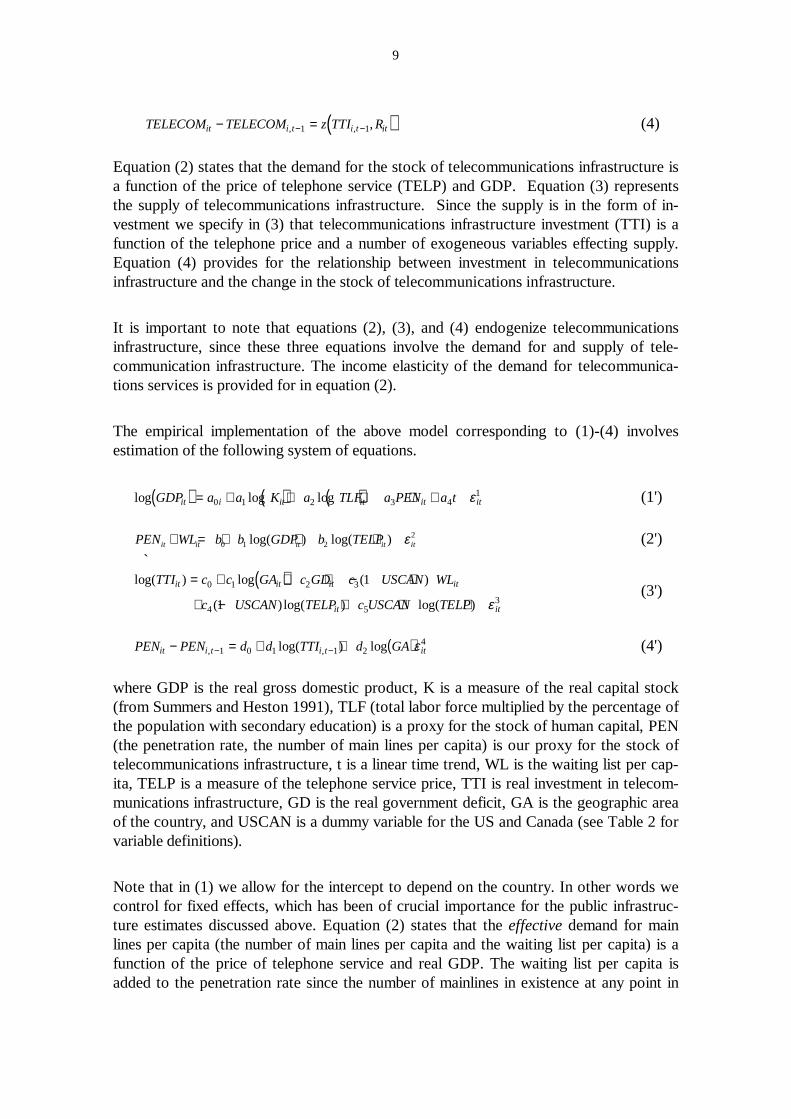
( )TELECOM TELECOM z TTI Rit i t i t it− =− −, , ,1 1 (4)
Equation (2) states that the demand for the stock of telecommunications infrastructure isa function of the price of telephone service (TELP) and GDP. Equation (3) representsthe supply of telecommunications infrastructure. Since the supply is in the form of in-vestment we specify in (3) that telecommunications infrastructure investment (TTI) is afunction of the telephone price and a number of exogeneous variables effecting supply.Equation (4) provides for the relationship between investment in telecommunicationsinfrastructure and the change in the stock of telecommunications infrastructure.
It is important to note that equations (2), (3), and (4) endogenize telecommunicationsinfrastructure, since these three equations involve the demand for and supply of tele-communication infrastructure. The income elasticity of the demand for telecommunica-tions services is provided for in equation (2).
The empirical implementation of the above model corresponding to (1)-(4) involvesestimation of the following system of equations.
( ) ( ) ( )log log logGDP a a K a TLF a PEN a tit i it it it it= + + + + +0 1 2 3 41ε (1')
PEN WL b b GDP b TELPit it it it it+ = + + +0 1 22log( ) log( ) ε (2')
`( )log( ) log ( )
( ) log( ) log( )
TTI c c GA c GD c USCAN WL
c USCAN TELP c USCAN TELP
it it it it
it it
= + + + − ⋅
+ − + ⋅ +0 1 2 3
4 53
1
1 ε(3')
( )PEN PEN d d TTI d GAit i t i t it− = + +− −, ,log( ) log1 0 1 1 24ε (4')
where GDP is the real gross domestic product, K is a measure of the real capital stock(from Summers and Heston 1991), TLF (total labor force multiplied by the percentage ofthe population with secondary education) is a proxy for the stock of human capital, PEN(the penetration rate, the number of main lines per capita) is our proxy for the stock oftelecommunications infrastructure, t is a linear time trend, WL is the waiting list per cap-ita, TELP is a measure of the telephone service price, TTI is real investment in telecom-munications infrastructure, GD is the real government deficit, GA is the geographic areaof the country, and USCAN is a dummy variable for the US and Canada (see Table 2 forvariable definitions).
Note that in (1) we allow for the intercept to depend on the country. In other words wecontrol for fixed effects, which has been of crucial importance for the public infrastruc-ture estimates discussed above. Equation (2) states that the effective demand for mainlines per capita (the number of main lines per capita and the waiting list per capita) is afunction of the price of telephone service and real GDP. The waiting list per capita isadded to the penetration rate since the number of mainlines in existence at any point in
10
time can not be explained by the telephone price. There would be excess demand in somecountries at that price. Unfortunately, there is no measure of the price of telephoneservice e.g. local service, domestic trunk or international calling available across thisbroad spectrum of countries. Instead, we use telephone revenue per mainline as a proxy.Equation (3) states that investment in telecommunications infrastructure is a function ofthe government deficit, the waiting list per capita, the telephone price and the geographicarea. The US and Canada are dummied out as the private market driven telecommunica-tions suppliers in the USA and Canada would not respond to government deficits orsurpluses.
The model was estimated by nonlinear three stage least squares for the OECD coun-
tries11. Table 5 reports the parameter estimates for various specifications of model (1')-(4').
V. Results and Interpretation
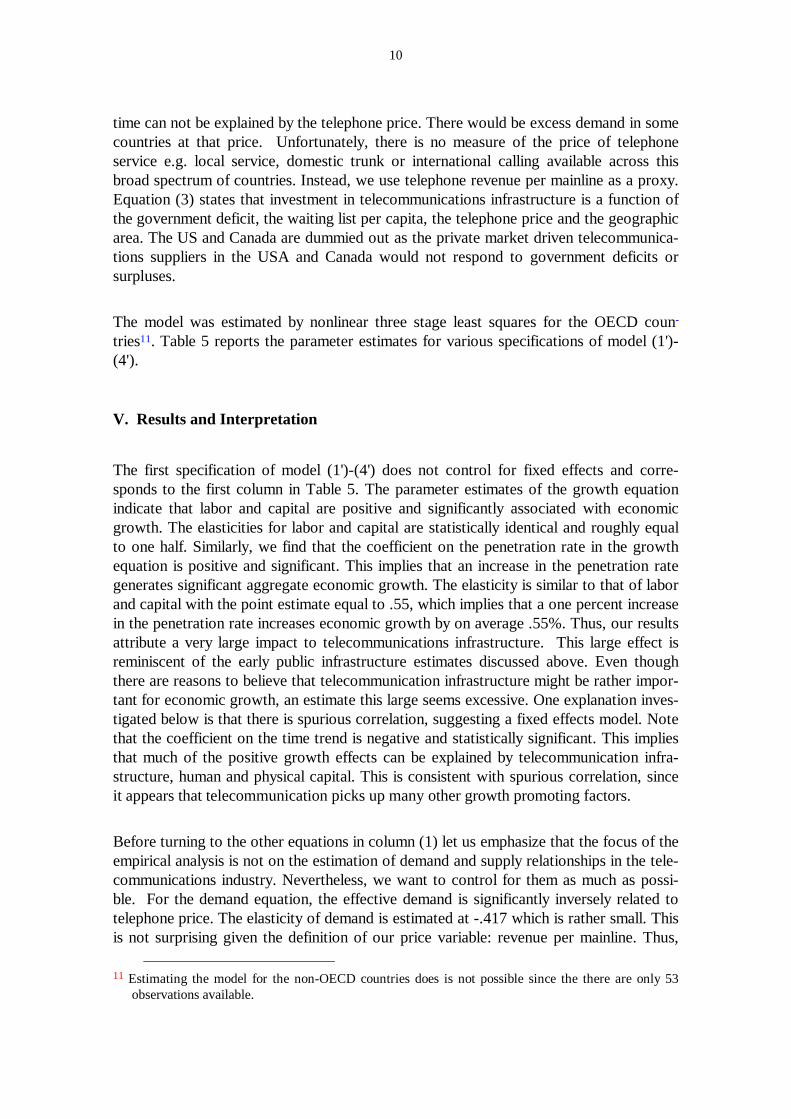
The first specification of model (1')-(4') does not control for fixed effects and corre-sponds to the first column in Table 5. The parameter estimates of the growth equationindicate that labor and capital are positive and significantly associated with economicgrowth. The elasticities for labor and capital are statistically identical and roughly equalto one half. Similarly, we find that the coefficient on the penetration rate in the growthequation is positive and significant. This implies that an increase in the penetration rategenerates significant aggregate economic growth. The elasticity is similar to that of laborand capital with the point estimate equal to .55, which implies that a one percent increasein the penetration rate increases economic growth by on average .55%. Thus, our resultsattribute a very large impact to telecommunications infrastructure. This large effect isreminiscent of the early public infrastructure estimates discussed above. Even thoughthere are reasons to believe that telecommunication infrastructure might be rather impor-tant for economic growth, an estimate this large seems excessive. One explanation inves-tigated below is that there is spurious correlation, suggesting a fixed effects model. Notethat the coefficient on the time trend is negative and statistically significant. This impliesthat much of the positive growth effects can be explained by telecommunication infra-structure, human and physical capital. This is consistent with spurious correlation, sinceit appears that telecommunication picks up many other growth promoting factors.
Before turning to the other equations in column (1) let us emphasize that the focus of theempirical analysis is not on the estimation of demand and supply relationships in the tele-communications industry. Nevertheless, we want to control for them as much as possi-ble. For the demand equation, the effective demand is significantly inversely related totelephone price. The elasticity of demand is estimated at -.417 which is rather small. Thisis not surprising given the definition of our price variable: revenue per mainline. Thus,
11 Estimating the model for the non-OECD countries does is not possible since the there are only 53
observations available.
11
what we estimate here is closer to a revenue elasticity. Regarding the income effect, wefind the demand for telecommunications infrastructure is indeed significantly positivelyrelated to real GDP, even though the income elasticity is rather small. Nevertheless, thisconfirms our earlier argument that the causal relationship between telecommunicationsinfrastructure and economic growth runs both ways.
For the supply function we find that the geographic area is very significant in explainingtelecommunications investments, i.e. larger countries do invest more in telecommunica-tions. The level of government deficit is also significantly related to telecommunicationsinvestment across the OECD. One might have felt that telecommunications infrastructureinvestment would be positively affected by a government surplus in the OECD since theexistence of a surplus would loosen the constraints on investment by the PTT. However,we find a negative relationship, indicating that PTT investment is associated with a defi-cit. One possible explanation for this is that telecommunications infrastructure invest-ment is associated with other spending programs which jointly cause larger governmentdeficits, i.e., the existence of a deficit is not an impediment to investment in telecommu-nications infrastructure. The waiting list for mainlines per capita is negatively and signifi-cantly related to the supply of telecommunications infrastructure. This suggests thatthose countries with a large waiting list invest less. Finally, the price of telecommunica-tions services does not determine supply. This is not surprising since all OECD countries(accept the U.S. and Canada for some years) are subject to regulation during our sampleperiod and less driven by market forces.
The last equation reported column (1) in Table 5 is the production function relatinginvestment to the penetration rate. As expected, lagged telecommunications investmentis positive and significant. The elasticity is about .002, indicating that a 10% increase inthe last years investment would result in a .2% increase in the penetration rate. Again wefind that the geographic area is a significant determinant of the penetration rate: thelarger the country the more investment is needed to accomplish a given telecommunica-tions infrastructure.
As discussed above in the context of public infrastructure, much of the impact on eco-nomic growth disappears once one controls for fixed effects. In order to test whether thisis so for telecommunications infrastructure we next re-estimate our model, allowing for acountry-specific intercept in equation (1'). The results are tabulated in column (2) ofTable 5. As can be seen, most of the parameter estimates and the statistical significancechange only slightly. Besides the growth equation, most other parameter estimates arefairly robust. Given the reduced degrees of freedom due to the fixed effects, the level ofsignificance in the growth equation is as expected somewhat lower. We also observe thatthe parameter estimate on capital is now substantially larger than that on labor. Interest-ingly, the effect of the penetration rate is halved by incorporating country-specific fac-tors. The point estimate of the elasticity is now .26 implying growth effects that are muchmore reasonable than before: one percent increase in the penetration rate increases eco-nomic growth by about a quarter percentage point. Note, also that the impact is statisti-cally not significantly larger than zero.
12
These results are indeed very similar to the earlier literature on the returns of publicinfrastructure capital. It appears that little impact is found, once simultaneities and fixedeffects are controlled for. However, as we noted above, there is one possibly importantdifference: network externalities. A priori there is no reason to believe that the growthimpact from telecommunications infrastructure should not be substantially larger thanother types of infrastructure that are not subject to network externalities. An implicationof network externalities is that the impact of telecommunications infrastructure on growthmight not be linear, as the growth impact might be larger whenever a significant network sizeis achieved. This would imply that positive growth effects might be subject to having achieveda critical mass in a given countries communications infrastructure.
In order to test whether such nonlinearities in telecommunications do exist, and if so, what thecritical mass is we respecify (1') as,
( ) ( ) ( )log log logGDPD a a K a TLF a PEN PEN a tit i it it it it it= + + + + + +0 1 2 3 42
51α ε (1''),
where we again allow for fixed country effects. If a4 is positive, and a3 negative thenwe have support for a "diminishing returns" hypothesis. If, however, the signs arereversed (i.e. a4 0> and a3 0< ), then we have evidence in support of a “critical mass“theory, as the impact might be insignificant for low penetration rates.
The estimation results of the system (1''), (2')-(4') are given in column (3) of Table 5.Note that the impact of an increase in the penetration rate on economic growth isincreasing in the penetration rate, since a4 is positive and significant. This is consistentwith the belief that telecommunications infrastructure creates network externalities whichare an increasing function of the number of participants. Using the estimates in Table 5we can compute the penetration rate elasticity on output as
( ) ( )η ∂∂
PENGDP
PENa a PEN= = +
log� �3 42 . For the average OECD penetration rate of 30% we
obtain an elasticity of .28, indicating a 2.8% growth effect from a 10% increase in thepenetration rate. For the average U.S. penetration rate of 40%, the elasticity is as high as.78, whereas for Germany with an average penetration rate of 32% the elasticity is esti-mated at .37. Moreover, if Germany would have the telecommunication infrastructure ofthe U.S. (an increase of some 8%), economic output would be increased by 6.36%(some $ 4.4 billion).
Since the first-order effect of the penetration rate is negative, we find that telecommuni-cations infrastructure investments are growth generating only after a certain point. Ourresults suggest that there might be a critical mass phenomenon in infrastructure invest-ments. Given our estimates in Table 5 we calculate this critical mass,
defined by ( )η PEN* = 0 , at a penetration rate of approximately 24%. This is important in
13
light of the fact that the non-OECD countries have a mean penetration rate of only 4%,which is well below the critical level, suggesting that marginal improvements might notgenerate the desired aggregate growth effects. Therefore, for non-OECD countriesgrowth effects can only be realized if a significant improvement in the telecommunica-tions infrastructure is achieved.
In sum, we find evidence of a critical mass phenomenon which is potentially a crucialdifference between public infrastructure and telecommunications (or information tech-nology) infrastructures.
VI. Conclusion
In this paper we have attempted to investigate the relationship between telecommunica-tions infrastructure investments and economic performance. We estimate a model whichendogenizes telecommunications investment by specifying a micro-model of supply anddemand for telecommunications investments. In order to pick-up economy-wide effects,the micro-model is then jointly estimated with the macro-growth equation. Afteraccounting for simultaneity and country-specific fixed effects, we find that the impactbetween telecommunications infrastructure and aggregate output is much reduced andstatistically insignificant. This empirical finding is consistent with the earlier results on theeffect of public infrastructure on output.
One important characteristic of IT technologies, which is not present in other types ofinfrastructures, are network externalities. An implication of network externalities is that theimpact of telecommunications infrastructure on growth might not be linear. Allowing for non-linear effects we find evidence of a positive and significant link, provided that a criticalmass in a countries telecommunication infrastructure has been achieved. This suggeststhat increases in telecommunications infrastructure could create higher growth effects inOECD countries than in the less-developed non-OECD countries.
An important question not addressed in this paper, and one that would naturally build onthe existence of growth effects, is: what market structure might be suited best to appro-priate these returns? This includes the specific role of government, if any, in providing anefficient infrastructure to foster growth and competitiveness. A related issue of consider-able interest is the relationship between telecommunications infrastructure investmentsand job creation.

TABLE 1 - List of Countries
O E C D C o u n t r i e s N o n – O E C D C o u n t r i e s
Austria Algeria
Australia Argentina
Belgium Brazil
Canada Chile
Denmark Costa Rica
Finland Egypt
France India
Germany Indonesia
Greece Korea
Ireland Malaysia
Italy Mauritius
Japan Mexico
Netherlands Morocco
New Zealand Tunisia
Norway
Portugal
Spain
Sweden
Turkey
United Kingdom
United States
15
TABLE 2 - Variable Description
Variable Data
K 1 Non-residential Capital Stock in billion 1985 US$
TLF 1 Total labor force in millions
PEN2 Penetration rate, main lines per capita
GDP1 GDP in billion 1985 US$
TELP2 Price of telephone service, in 1985 US$, measured as total realservice revenue per mainline
GA2 Geographic area in thousand km2
GD3 Government surplus (deficit) in billion 1985 US$
WL 2 Waiting list for main lines per capita
TTI 2 Investment in telecom infrastructure in billion 1985 US$
USCAN Dummy variable for US and Canada
T Time trend
Sources: 1 Penn World Table 5.6 (Summers/Heston); 2 ITU Yearbook 1993; 3 IMF Yearbook 1992,World Bank 1993
TABLE 3 - Summary Statistics
Variable Mean Std Dev Minimum Maximum
K 443.67 739.27 11.52 4270.73
TLF 16.70 24.48 1.10 126.42
PEN 0.30 0.14 0.01 0.68
GDP 424.73 770.76 14.79 4524.97
TELP 536.66 158.42 244.62 1000.70
GA 1516.39 3088.25 30.513 9970.61
GD -15.48 31.37 -214.57 8.93
WL 0.01 0.02 0 0.11
TTI 2.78 4.73 .07 25.83
USCAN 0.03 0.18 0 1
T 11 6.06 1 21
16
TABLE 4 - Growth and Penetration
GDP per Capita(in US$)
CAGR(%)
Mainline per 100inhabitants
CAGR(%)
1971 1990 1971-90 1971 1990 1971-90
Australia 9513 12575 1.48 22.08 47.09 4.07
Austria 10230 16991 2.71 14.19 41.76 5.85
Belgium 10739 16013 2.13 14.83 39.26 5.26
Canada 10985 16472 2.16 31.38 57.46 3.24
Denmark 14708 20496 1.76 26.50 56.63 4.08
Finland 10860 20135 3.30 20.49 53.54 5.18
France 11359 17399 2.27 9.02 49.78 9.41
Germany 12850 19799 2.30 15.76 47.41 5.97
Greece 3750 4896 1.41 11.90 38.94 6.44
Iceland 11648 19724 2.81 28.99 51.37 3.06
Ireland 5764 9921 2.90 8.23 28.06 6.67
Italy 7834 14718 3.37 12.90 38.77 5.96
Japan 13383 22443 2.76 15.39 43.47 5.62
Luxembourg 11251 18783 2.73 25.36 48.17 3.43
The Netherlands 11685 16080 1.69 18.24 46.42 5.04
New Zealand 9409 10490 0.57 29.37 43.60 2.10
Norway 12767 19962 2.38 19.75 50.28 5.04
Portugal 2689 4378 2.60 6.68 24.13 6.99
Spain 5390 8713 2.56 9.52 32.35 6.65
Sweden 13676 20001 2.02 45.90 68.33 2.12
Switzerland 20998 27831 1.49 32.59 58.02 3.08
Turkey 723 1201 2.71 1.16 12.38 13.26
United Kingdom 8490 12625 2.11 16.51 44.25 5.32
United States 14719 18656 1.26 34.06 45.34 1.52
OECD Average 11297 16321 1.96 20.38 42.58 3.96
Notes: GDP per capita is expressed in US$ at 1987 exchange rates and prices; CAGR stands forCompound
Annual Growth Rate.Source: OECD Communications Outlook 1993, ITU.
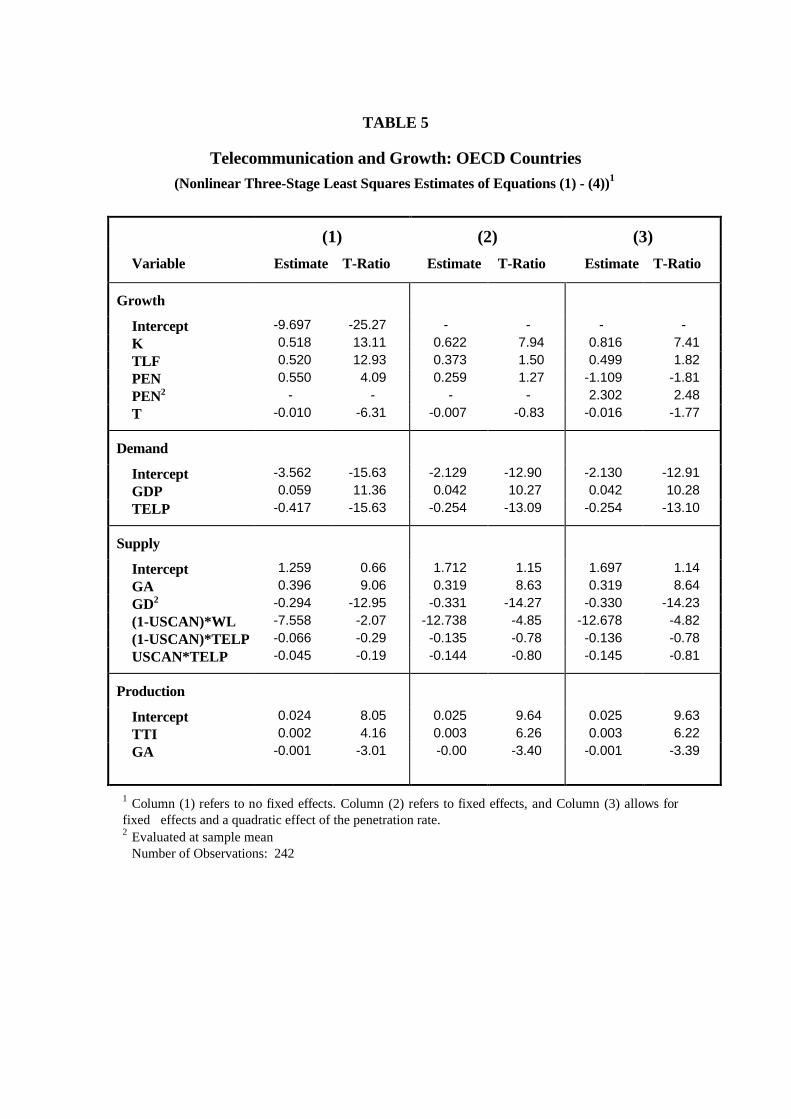
TABLE 5
Telecommunication and Growth: OECD Countries(Nonlinear Three-Stage Least Squares Estimates of Equations (1) - (4))1
(1) (2) (3)
Variable Estimate T-Ratio Estimate T-Ratio Estimate T-Ratio
Growth
Intercept -9.697 -25.27 - - - -K 0.518 13.11 0.622 7.94 0.816 7.41TLF 0.520 12.93 0.373 1.50 0.499 1.82PEN 0.550 4.09 0.259 1.27 -1.109 -1.81PEN2 - - - - 2.302 2.48T -0.010 -6.31 -0.007 -0.83 -0.016 -1.77
Demand
Intercept -3.562 -15.63 -2.129 -12.90 -2.130 -12.91GDP 0.059 11.36 0.042 10.27 0.042 10.28TELP -0.417 -15.63 -0.254 -13.09 -0.254 -13.10
Supply
Intercept 1.259 0.66 1.712 1.15 1.697 1.14GA 0.396 9.06 0.319 8.63 0.319 8.64GD2 -0.294 -12.95 -0.331 -14.27 -0.330 -14.23(1-USCAN)*WL -7.558 -2.07 -12.738 -4.85 -12.678 -4.82(1-USCAN)*TELP -0.066 -0.29 -0.135 -0.78 -0.136 -0.78USCAN*TELP -0.045 -0.19 -0.144 -0.80 -0.145 -0.81
Production
Intercept 0.024 8.05 0.025 9.64 0.025 9.63TTI 0.002 4.16 0.003 6.26 0.003 6.22GA -0.001 -3.01 -0.00 -3.40 -0.001 -3.39
1 Column (1) refers to no fixed effects. Column (2) refers to fixed effects, and Column (3) allows forfixed effects and a quadratic effect of the penetration rate.2 Evaluated at sample mean
Number of Observations: 242

Figure 1

BIBLIOGRAPHY
Aschauer, David Alan, 1989, "Is Public Expenditure Productive?" Journal of MonetaryEconomics, 23: 177-200.
Balmaseda, Manuel, 1994, "Simultaneity Bias and the rate of Return on Public Capi-tal," working paper, Northwestern University, October.
Balmaseda, Manuel, 1996, "Production Function Estimates of the Rate of Return onPublic Infrastructure," paper presented at the CEPR/WZB Conference, April.
Barro, Robert J. and Xavier Sala-i-Martin, 1992, "Convergence," Journal of Politi-cal Economy, 100: 223-251.
De Long, J. Bradford and Lawrence H. Summers, 1991, "Equipment Investmentsand Economic Growth," Quarterly Journal of Economics, 105: 445-502.
De Long, J. Bradford and Lawrence H. Summers, 1993, "How Strongly DoDeveloping Countries Benefit from Equipment Investment?" Journal of MonetaryEconomics, 32 (3): 395-415.
Garcia-Mila, T. and T. J. McGuire, 1992, "The Contribution of Publicly ProvidedInputs to States' Economies," Regional Science and Urban Economics, 22: 229-241.
Greenstein, S. and Pablo T. Spiller, 1995, "Modern Telecommunications Infrastruc-ture and Economic Activity: An Empirical Investigation," working paper, April.
Kelejian, Harry H. and Dennis P. Robinson, 1994, "Infrastructure Productivity Esti-mation and its Underlying Econometric Specifications: A Sensitivity Analysis,"University of Maryland (forthcoming in Papers in Regional Science).
Hardy , A., 1980, "The Role of the Telephone in Economic Development," Telecommu-nications Policy, 4: 278-286.
Holtz-Eakin, Douglas, 1993, "State-specific estimates of state and local governmentcapital," Regional Science and Urban Economics, 23: 185-209.
Holtz-Eakin, Douglas, 1994, "Public-Sector Capital and the Productivity Puzzle," TheReview of Economics and Statistics, 76: 12-21.
Hulten, Charles R. and Robert M. Schwab, 1984, "Regional Productivity Growth inU.S. Manufacturing, 1951-1978," American Economic Review, 74: 152-162.
Hulten, Charles R. and Robert M. Schwab, 1991, "Is There Too Little Public Capital?Infrastructure and Economic Growth," Paper presented at the AEI Conference,February.
Hulten, Charles R., 1994, "Optimal Growth with Infrastructure Capital: Implicationsfor Empirical Modelling," University of Maryland.
Leff , Nathaniel H., 1984, "Externalities, Information Costs, and Social Benefit-CostAnalysis for Economic Development: An Example from Telecommunications,"Economic Development and Cultural Change, 32: 255-276.

20
Lichtenberg, Frank., 1995, "The Output Contributions of Computer Equipment andPersonnel: A Firm Level Analysis," Economics of Innovation and New Technol-ogy, 201-207.
Mankiw, N.G., D. Romer, and D. N. Weil, 1992, "A Contribution to the Empirics ofEconomic Growth," Quarterly Journal of Economics, 107: 407-437.
Munnell, Alicia H. , 1992, "Policy Watch: Infrastructure Investment and EconomicGrowth," Journal of Economic Perspectives, 6: 189-198.
Nadiri, M. Ishaq and Theofanis P. Mamuneas, 1996, "Contribution of Highway Capi-tal to Industry and National Productivity Growth," unpublished working paper,March.
Norton, S. W., 1992, "Transaction Costs, Telecommunications, and the Microeconom-ics of Macroeconomic Growth," Economic Development and Cultural Change,40: 175-196.
Pereira, Alfredo M. and Rafael Flores de Frutos, 1995, "Public Capital Accumulationand Private Sector Performance in the U.S.," unpublished working paper, August.
Quah, Danny, 1993a, "Empirical Cross-Section Dynamics in Economic Growth,"European Economic Review, 37: 426-434.
Quah, Danny, 1993b, "Galton's Fallacy and Tests of the Convergence Hypothesis,"Scandinavian Journal of Economics, 95: 427-443.
Röller, Lars-Hendrik and Len Waverman, 1996, "The Impact of TelecommunicationsInfrastructure on Economic Growth and Development: A first Look at the Data,"in The Implications of Knowledge-Based Growth for Micro-Economic Policies,The University of Calgory Press.
Summers, R. and A. Heston, 1991, "The Penn World Table (Mark 5): An ExpandedSet of International Comparisons, 1950-1988," Quarterly Journal of Economics,106: 327-368.