
TECHPACIFIC CAPITAL LIMITED - HKEXnews
66
annual report TECHPACIFIC CAPITAL LIMITE D
-
Upload
khangminh22 -
Category
Documents
-
view
0 -
download
0
Transcript of TECHPACIFIC CAPITAL LIMITED - HKEXnews

a n n ua l r e p o rtT E C H PA C I F I C C A P I TA L L I M I T E D
Characteristics of The Growth Enterprise Market (“GEM”) of The Stock Exchange of Hong Kong Limited (the “Exchange”)
GEM has been established as a market designed to accommodate companies to which a high
investment risk may be attached. In particular, companies may list on GEM with neither a
track record of profitability nor any obligation to forecast future profitability. Furthermore,
there may be risks arising out of the emerging nature of companies listed on GEM and the
business sectors or countries in which the companies operate. Prospective investors should
be aware of the potential risks of investing in such companies and should make the decision
to invest only after due and careful consideration. The greater risk profile and other
characteristics of GEM mean that it is a market more suited to professional and other
sophisticated investors.
Given the emerging nature of companies listed on GEM, there is a risk that securities traded
on GEM may be more susceptible to high market volatility than securities traded on the
main Board and no assurance is given that there will be a liquid market in the securities
traded on GEM.
The principal means of information dissemination on GEM is publication on the Internet
website operated by the Exchange. Listed companies are not generally required to issue paid
announcements in gazetted newspapers. Accordingly, prospective investors should note that
they need to have access to the GEM website in order to obtain up-to-date information on
GEM-listed issuers.
This document, for which the directors of Techpacific Capital Limited collectively and individually accept
responsibility, includes particulars given in compliance with the Rules Governing the Listing of Securities on the
Growth Enterprise Market of the Stock Exchange for the purpose of giving information with regard to Techpacific
Capital Limited. The directors, having made all reasonable enquiries, confirm that, to the best of their knowledge
and belief:- (1) the information contained in this announcement is accurate and complete in all material respects
and not misleading; (2) there are no other matters the omission of which would make any statement in this
announcement misleading; and (3) all opinions expressed in this announcement have been arrived at after due and
careful consideration and are founded on bases and assumptions that are fair and reasonable.

T a b l e o f C o n t e n t s P.
T a b l e o f C o n t e n t s
Group Divisional Structure . . . . . . . . . . . . . . . . . . . . . . . . . . . . . . . . . . . . . . . . . . . .
About Techpacific Capital Limited . . . . . . . . . . . . . . . . . . . . . . . . . . . . . . . . . . .
Chairman’s Report . . . . . . . . . . . . . . . . . . . . . . . . . . . . . . . . . . . . . . . . . . . . . . . . . . . . . .
CEO’s Report & Business Review . . . . . . . . . . . . . . . . . . . . . . . . . . . . . . . . . . .
Operational & Financial Review . . . . . . . . . . . . . . . . . . . . . . . . . . . . . . . . . . . . .
Progress Against Business Objectives . . . . . . . . . . . . . . . . . . . . . . . . . . . . . . . .
Profiles of Senior Management
Board of Directors . . . . . . . . . . . . . . . . . . . . . . . . . . . . . . . . . . . . . . . . . . . . . . . . . . . .
Senior Management . . . . . . . . . . . . . . . . . . . . . . . . . . . . . . . . . . . . . . . . . . . . . . . . . .
Directors’ Report . . . . . . . . . . . . . . . . . . . . . . . . . . . . . . . . . . . . . . . . . . . . . . . . . . . . . . . .
Auditors’ Report . . . . . . . . . . . . . . . . . . . . . . . . . . . . . . . . . . . . . . . . . . . . . . . . . . . . . . . . .
Consolidated Income Statement . . . . . . . . . . . . . . . . . . . . . . . . . . . . . . . . . . . . .
Consolidated Balance Sheet . . . . . . . . . . . . . . . . . . . . . . . . . . . . . . . . . . . . . . . . . . .
Balance Sheet . . . . . . . . . . . . . . . . . . . . . . . . . . . . . . . . . . . . . . . . . . . . . . . . . . . . . . . . . . . . .
Consolidated Statement of Changes in Equity . . . . . . . . . . . . . . . . . . . .
Consolidated Cash Flow Statement . . . . . . . . . . . . . . . . . . . . . . . . . . . . . . . . . .
Notes to the Financial Statements . . . . . . . . . . . . . . . . . . . . . . . . . . . . . . . . . . . .
The Chinese version of this annual report is provided for reference only.
In the event of any inconsistency between the Chinese and English versions,
the English version shall prevail.

P. g r o u p d i v i s i o n a l s t r u c t u r e
Asset Management
CORO Voltin FundUS$350 million
Nirvana FundUS$66 million
Applied Research FundHK$250 million
Spike Digital ServicesDiscontinued July 2002
T e c h p a c i f i c C a p i t a l L i m i t e d
groupdivisionalstructure
Investment Banking
Hong Kong
Mainland China
Singapore
Indonesia
United Kingdom
Korea
Philippines
a b o u t t e c h p a c i f i c c a p i t a l l i m i t e d P.
ABOUT TECHPACIFIC CAPITAL LIMITED
Techpacific Capital Limited (“Techpacific” or the “Company” and, together with its subsidiaries,
the “Group”) is a Hong Kong-based investment banking and asset management group listed on
the Hong Kong Stock Exchange’s GEM board (HK GEM 8088), with representation in China,
Korea, Singapore, Indonesia, the Philippines, the United Kingdom (covering the Middle East) and
other parts of Asia.
The Group operates the following complementary lines of business :
Crosby Limited (“Crosby”) is Techpacific’s investment banking arm. Crosby raises equity and debt
capital for issuers and borrowers in Asia and elsewhere from a network of corporate and
institutional investors. In addition, Crosby acts as a strategic advisor providing mergers and
acquisitions, restructuring, structured finance and corporate finance advisory services for
companies doing business in Asia.
The Group’s asset management arm acts as portfolio manager of three funds :
(i) The US$66 million (HK$515 million) Nirvana Fund, targeted mainly at early stage
technology ventures in Asia;
(ii) The US$32 million (HK$250 million) Hong Kong Government’s Applied Research
Fund (which is managed via Softech Investment Management Company Limited
(“Softech”), a joint venture between Techpacific and Softbank China Venture
Investments Limited); and
(iii) The US$350 million (HK$2.7 billion) CORO Voltin Fund. More detail on this
fund is set out in the CEO’s Report and Business Review.

P. c h a i r m a n ’ S R E P O R T
Techpacific Capital Limited
is... a considerably smaller
but financially healthier
Group, engaged in a
different and more focused
range of activities

c h a i r m a n ’ S R E P O R T P.
c h a i r m a n ’ s R e p o r t
was another difficult
year for Techpacific
Capital Limited (“Techpacific” or the “Company”
and, together with its subsidiaries, the “Group”).
An overall loss of US$13,371,724 was recorded on
total revenue of US$7,132,305.
A substantial proportion of the losses is attributable
to the failure of Spike Limited (“Spike”), the
Group’s majority-owned digital services subsidiary.
The most painful event of 2002 was, in fact, the
decision in July to place Spike into liquidation.
Techpacific had invested over US$10 million into
Spike since February 2001. However, despite
considerable success in winning business from
top-tier clients in its major markets of Australia and
Japan, Spike was unable to achieve profitability. Its
closure was precipitated by the failure of a third
party investor to complete a contracted investment.
This investment would have provided Spike with
sufficient capital to execute a revised business plan
which envisaged breakeven before the end of 2002.
The board of directors (“Board”) of Techpacific
decided, however, that a further substantial
commitment to Spike could not be justified.
One positive consequence of Spike’s demise was that
the Group’s senior management has been able to
focus its undivided attention on its core businesses of
investment banking, carried out through its
subsidiary Crosby Limited (“Crosby”), and asset
management, carried out through its subsidiary,
Techpacific Venture Capital Limited.
Investment BankingDespite the persistence of unfavourable market
conditions throughout 2002 for investment banks
world-wide, Crosby was able to build up its

P. c h a i r m a n ’ S R E P O R T
franchise. It obtained corporate finance advisory
mandates from a growing number of high quality
clients in Asia, as well as mandates to arrange
private placements. Bringing these transactions to a
close proved to be a more protracted and frustrating
task than would have been the case in less depressed
market conditions. However, one substantial
structured financing for Philippines Long Distance
Telephone Company was completed in December
and several further major transactions are in
progress of execution. Corporate finance revenues
in the fourth quarter showed a significant increase
for the first time since early 2001.
Crosby entered 2003 with a healthy “pipeline” of
mandated transactions around the Asian region, a
significantly reduced cost base and a well-motivated
team of investment banking professionals, including
a recently-hired team that is focused on the Greater
China market and a senior investment banker to
cover the important Korean market. Our pipeline
of mandated Mainland Chinese investment banking
deals is particularly encouraging and supports our
hope that the corner has at last been turned, and
that we can start to deliver some positive returns for
our shareholders.
Asset ManagementThe asset management division continued to make
a modest profit in 2002 managing the Nirvana
Fund and the Hong Kong Government’s Applied
Research Fund.
A decision was taken mid-year not to draw further
on the commitments of investors in the Nirvana
Fund, of which 42% (out of the US$66 million
total) had been drawn. This decision resulted from
the sharp decline in value of the fund’s previous
investments in early stage technology companies
and the limited prospect of achieving exits from
new investments in such companies within the
remaining lifetime of the fund.
The relatively small proportion of the Hong Kong
Government’s Applied Research Fund which was
invested by Softech during the technology “bubble”
period protected this fund to a large extent from the
fate of other investors in this field. In recent
months, an encouraging flow of higher-quality
investment proposals has been seen.
The Group’s asset management operations were
significantly expanded in November 2002 by
their appointment as portfolio manager of the
US$350 million CORO Voltin Fund. This fund
has a 5-year life and is sponsored by the Small
Business Corporation of Korea. It invests in
the foundations have
been laid for a
business which is capable
of achieving
sustained profitability
c h a i r m a n ’ S R E P O R T P.
bonds and warrants issued by Korean small- and
medium-sized enterprises.
OutlookIn the course of 2002, the Group significantly cut its
staff numbers and cost base. The related redundancy
costs have been fully absorbed in these financial
statements. The carrying value of earlier investments
by the Group in technology ventures has also been
fully written down in these financial statements.
Entering 2003, Techpacific Capital Limited is the
holding company of a considerably smaller but
financially healthier Group, engaged in a different
and more focused range of activities from those
being undertaken at the time of its listing in April
2000. The core management team has endured
some painful and chastening experiences but has
remained intact. It is now engaged single-mindedly
in building an independent investment banking and
asset management firm with a pan-Asian franchise,
utilising the proven investment banking skills of its
senior executive management.
While the investment banking industry as a whole
continues to pass through difficult times, and these
are likely to persist for some while, it is becoming
increasingly evident that there are profitable niches
for small and flexible firms with a modest cost base,
independent and free of the conflicts inherent in
large financial services groups. Retrenchment by the
major international investment banks in Asia has
also opened up business opportunities. Crosby is
benefiting from these trends, and also from its focus
on small- and medium-sized companies, which are
currently tending to generate more corporate
finance activity than large corporations,
particularly in Mainland China.
After the disappointments of the past, it would be
rash to predict a sharp increase in revenues in the
short term. I believe, however, that the
foundations have been laid for a business which is
capable of achieving sustained profitability and
restoring some of the shareholder value which has
been lost over the past two years.
I am delighted to report that Daniel Yen joined the
Board in December 2002 as an independent
non-executive director in place of Max Chapman,
whose ability to travel to Asia from his home in the
USA became more constrained. Daniel comes
from an accounting and business background, as
well as having extensive experience of working in
Indonesia and Singapore, both key markets for the
Group. I would like to thank Max Chapman most
warmly for his extremely valuable contribution
during the last 2 1/2 years.
Robert John Richard OwenChairman
20 March 2003

P. c e o ' s r e p o r t a n d b u s i n e s s r e v i e w
Techpacific Capital Limited
changed from a technology-
oriented investment
holding company... to a
company focused on investment
banking and asset management
activities in the Asian region

c e o ' s r e p o r t a n d b u s i n e s s r e v i e w P.
C E O ’ s R e p o r t &
b u s i n e s s r e v i e w
A s Robert Owen, our Chairman, has
noted, 2002 was another extremely
difficult year for the Group. It was also a year in
which your Company took decisive action to alter
its business direction. Techpacific Capital Limited
changed from a technology-oriented investment
holding company with a diverse range of operations
and a reliance on asset value increases in order to
generate value for shareholders, to a company
focused on investment banking and asset
management activities in the Asian region. It now
generates revenues principally in the form of fees
and commissions.
This fundamental shift in strategy was formally
approved by shareholders in March 2002 and
utilises more effectively the core skills and expertise
of your Company’s senior management team.
B u s i n e s s R e v i e w
Investment Banking and Corporate Finance
2002 marked the first year of operation of the
Group’s investment banking business under Crosby
Limited. With a global economic downturn and a
substantial decrease in capital-raising and mergers
and acquisitions (“M&A”) activity in the region, it
has been a very challenging year for all in the
investment banking industry. Despite such market
conditions Crosby has made substantial progress in
establishing a cross-border, independent investment
banking business with its own niche in Asia.
As a result of acquiring Crosby, the Group has
diversified its investment banking business beyond
the technology sector. Our investment banking

P. c e o ' s r e p o r t a n d b u s i n e s s r e v i e w
Our mid-market China
focus and our
ability to place specialized
financing products to
Middle Eastern investors
are two important
product specializations
team now comprises senior members of the
Techpacific corporate finance team, augmented by
professionals who arrived with the Crosby
acquisition and a small number of select new hires.
Since June 2002, when the investment banking
business truly started its integrated operations,
Crosby has gained notable traction in several
industry sectors including telecommunications,
natural resources, industrial manufacturing,
logistics, media and infrastructure.
At the time of this report, Crosby has established a
cross-border regional corporate finance business,
with investment bankers based in Hong Kong and
Mainland China, Singapore, the Philippines,
Indonesia, the United Kingdom and Korea. Our
mid-market China focus and our ability to place
specialized financing products to Middle Eastern
investors are two important product specializations,
alongside the sector focus mentioned above.
Core Product AreasStructured Finance : Operating out of Singapore, the Structured
Finance division was the most active within
Crosby in 2002. It offers structured finance
solutions to corporate clients throughout the
region, with a particular focus on the
Philippines, Indonesia and South Korea. It will
extend its reach to China in 2003. A London-
based team distributes these products to
institutional investors in the Middle East, which
has a fast-growing appetite for investment
opportunities in Asia. A core strength of this
distribution team is its unique placement
capability to Islamic investors.
The highlight of 2002 was the successful closing of
a US$50 million receivables purchase transaction
for Philippines Long Distance Telephone Company
(“PLDT”) in December. The transaction, the
first of its kind in the Philippines, involved the
sale by PLDT of receivables from certain
telecommunications companies to a special
purpose vehicle funded by a group of purchasers
arranged by Crosby. An important aspect of the
transaction was the participation of a number of
Islamic investors from the Middle East and Asia
who also provided a facility to PLDT, known as an
“Ijara”. The Ijara is jointly managed by ABC
Islamic Bank and Shamil Bank, both based out
of Bahrain.

c e o ' s r e p o r t a n d b u s i n e s s r e v i e w P.
Mergers and Acquisitions (“M&A”) Advisory : Crosby has a particular interest in representing
corporate purchasers in more developed markets
(such as North America, Europe, Australia, Hong
Kong and Singapore) who seek assets in emerging
markets such as China, Korea, the Philippines,
Thailand and Indonesia. In addition, Crosby
advises clients in joint ventures, corporate
restructurings, privatizations and spin-offs. For
example, during 2002, Crosby assisted a logistics
company based in Singapore in its negotiation to
set up a joint venture with a manufacturing
company in China. Crosby was also engaged by a
Korean technology company to act as its advisor in
a proposed takeover of a regional Internet company.
Financial Sponsors Group : The Financial Sponsors Group (“FSG”) caters to
the needs of private equity and buyout funds
seeking investment opportunities in the Asian
region. Throughout 2002 the FSG has presented
opportunities to these buy-side clients and has
recently entered into an agreement to advise an
international private equity fund to explore a
potential buyout transaction in Hong Kong. As
competition for deals in the Asian private equity
market continues to be fierce, the FSG expects its
marketing activity to continue to increase in 2003,
with a particular focus on opportunities in Hong
Kong, Singapore, China and Korea. The lead time
for closing deals in this product area is typically
long, and it is not uncommon for successful
transactions to take 2 to 3 months to originate and
a further 4 to 6 months to close.
Private Placements : Through the FSG’s strong relationships with
venture capital and private equity firms, Crosby
continues to act as advisor and placing agent in
private placements for unlisted companies. Target
fund-raising clients include Asia-based ventures
and late-stage companies, overseas-based
companies expanding into Asia, and overseas-
based companies seeking Asian capital.
For example, Crosby has been retained by a
leading fast-moving consumer goods
manufacturer in Indonesia to raise capital from
regional private equity firms. The client has
received indicative financing offers and the
transaction is expected to close in the first half of
2003. This area is expected to be increasingly
active during 2003 with the recent hiring of a
specialist team led by DC Lee, a highly respected
investment banker, to originate private placement
transactions from the Mainland Chinese market.
This team started operations at the end of the first
quarter of 2003.
Financial Advisory : In addition to M&A advisory services, Crosby
also provides general corporate finance advice to
listed companies. In 2002 we advised a leading
Hong Kong-listed media company on several of
its acquisitions of print-media and outdoor
advertising assets in China with respect to
compliance with the listing rules of the Stock
Exchange of Hong Kong. Crosby also provides
independent financial advisory services to listed
companies carrying out connected party
P. c e o ' s r e p o r t a n d b u s i n e s s r e v i e w
The Asset Management
business... has maintained
its profitability despite
difficult market conditions
and has managed to
expand considerably its
funds under management
transactions and advises clients on matters related to
the Takeover Code. Crosby is currently retained on
Financial Advisory mandates by a number of clients
in Hong Kong and Singapore.
B u s i n e s s R e v i e w
Asset Management
The Asset Management business continues to be
carried out through Techpacific Venture Capital
Limited (“Techpacific VC”). This business has
maintained its profitability despite difficult market
conditions and has managed to expand considerably
its funds under management. Techpacific VC now
manages three funds, following the appointment of
a fellow subsidiary as portfolio manager of the
CORO Voltin Fund. We address each of these
funds in more detail below.
It is our intention to build upon our existing
franchise as a trusted intermediary for governmental
institutions intending to contract out the
management of funds to professional fund
managers. We also expect to widen the scope of
assets under management to include bonds and, at a
later stage, listed equities.
Nirvana Capital Limited (“Nirvana Fund”) – US$66 millionGiven the very challenging environment for
investing in early stage technology companies and
the write-downs experienced on the existing
investments, we proposed and completed a
restructuring of the Nirvana Fund in November
2002 which effectively returned 58% of its capital to
investors (through cash returned and a cancellation of
outstanding commitments). We sincerely regret the
losses sustained by Nirvana Fund investors (which
included Techpacific Capital) from investments in
early stage technology companies (mostly in 2000),
which were the focus of this fund.
Additionally, we shortened the life of this fund to
September 2003 and significantly reduced its
management fees from the originally contracted
level. We further reduced operating costs to conserve
investors’ cash and will continue to manage the
work-out of the remaining portfolio companies,
seeking to maximise the cash to be extracted for the
fund’s investors before closure of the fund.
This restructuring proposal was approved by 99% of
the fund’s shareholders, many of which are
c e o ' s r e p o r t a n d b u s i n e s s r e v i e w P.
government-related entities, endowment funds,
corporations, institutions which specialize in managing
funds of funds and high net worth individuals.
The HK Government Applied Research Fund (“ARF”) – HK$250 millionTechpacific VC was appointed in April 2000 to
manage part of the ARF on behalf of the Hong
Kong Government Innovation and Technology
Commission’s Applied Research Council. The ARF
is managed through Softech Investment
Management Company Limited, a joint venture
with Softbank China Venture Investments Limited.
Less than 25% of the HK$250 million entrusted to
us has been invested to date. Since the fund remains
one of a very small number of venture capital funds
focused on investing in early stage ventures in Hong
Kong, it is now seeing a growing level of high
quality deals. The number of proposals that the
fund’s investment committee will consider is likely
to increase during 2003.
The ARF has recently committed to invest in three
Hong Kong-based enterprises: a company creating
Linux-based software for embedded devices, a
diagnostic company using plasma for screening and a
fabless integrated circuit design company.
The CORO Voltin Fund – US$350 millionIn November 2002 the Company’s asset management
arm was appointed portfolio manager of the CORO
Voltin Fund. This US$350 million fund is sponsored
by the Small Business Corporation of Korea, a
government organization. The Fund has a 5-year life
and invests in bonds and warrants issued by over
100 small- to medium-sized enterprises in Korea,
some of which are KOSDAQ-listed while others are
private companies.
Concluding RemarksI would like to take this opportunity to thank my
colleagues at Techpacific Capital and the principal
operating subsidiaries, Crosby and Techpacific
Venture Capital, for the continuing hard work,
dedication and focus that they have shown
throughout the past year. I count myself very lucky to
be able to work with such a talented and loyal team.
I would also like to take this opportunity to express
my appreciation and gratitude to our shareholders
and to our growing number of clients. They are
equally important to the long term success of the
investment banking business we are building.
Ilyas Tariq KhanIlyas Tariq KhanCEO
20 March 2003

P. o p e r a t i o n a l a n d f i n a n c i a l r e v i e w
operationaL & financial review
The cessation of business of Spike Limited in July 2002 has a
material impact on the financial statements for the year ended
31 December 2002. Spike had a significantly higher revenue
and cost base than the remainder of the Group’s businesses
which makes meaningful year-on-year comparison difficult.
In this section’s commentary we have sought to separate out
the impact of Spike from the comparatives to provide a
clearer picture of the improvements in our underlying
businesses of investment banking and asset management.
Readers of this report and accounts may also find it helpful to
refer to the segmental analysis provided in Note 3 to the
financial statements.
o p e r a t i o n a l a n d f i n a n c i a l r e v i e w P.
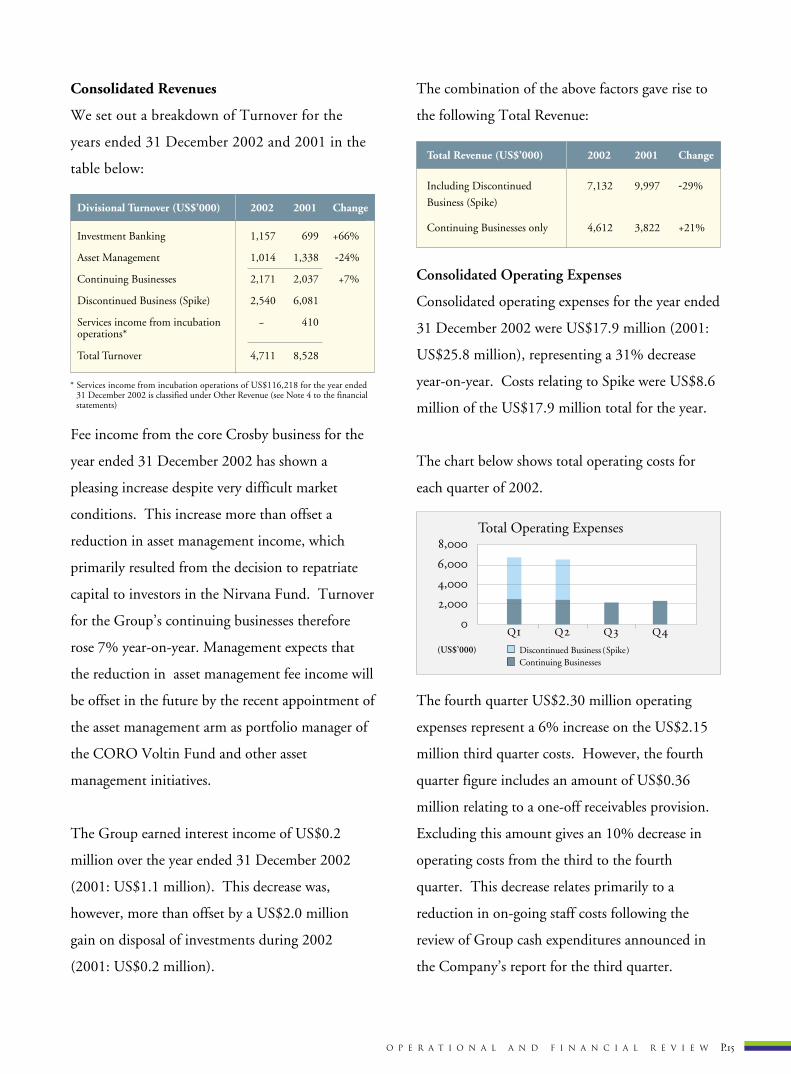
Consolidated Revenues
We set out a breakdown of Turnover for the
years ended 31 December 2002 and 2001 in the
table below:
Fee income from the core Crosby business for the
year ended 31 December 2002 has shown a
pleasing increase despite very difficult market
conditions. This increase more than offset a
reduction in asset management income, which
primarily resulted from the decision to repatriate
capital to investors in the Nirvana Fund. Turnover
for the Group’s continuing businesses therefore
rose 7% year-on-year. Management expects that
the reduction in asset management fee income will
be offset in the future by the recent appointment of
the asset management arm as portfolio manager of
the CORO Voltin Fund and other asset
management initiatives.
The Group earned interest income of US$0.2
million over the year ended 31 December 2002
(2001: US$1.1 million). This decrease was,
however, more than offset by a US$2.0 million
gain on disposal of investments during 2002
(2001: US$0.2 million).
The combination of the above factors gave rise to
the following Total Revenue:
Consolidated Operating Expenses
Consolidated operating expenses for the year ended
31 December 2002 were US$17.9 million (2001:
US$25.8 million), representing a 31% decrease
year-on-year. Costs relating to Spike were US$8.6
million of the US$17.9 million total for the year.
The chart below shows total operating costs for
each quarter of 2002.
The fourth quarter US$2.30 million operating
expenses represent a 6% increase on the US$2.15
million third quarter costs. However, the fourth
quarter figure includes an amount of US$0.36
million relating to a one-off receivables provision.
Excluding this amount gives an 10% decrease in
operating costs from the third to the fourth
quarter. This decrease relates primarily to a
reduction in on-going staff costs following the
review of Group cash expenditures announced in
the Company’s report for the third quarter.
Divisional Turnover (US$’000) 2002 2001 Change
Investment Banking 1,157 699 +66%
Asset Management 1,014 1,338 -24%
Continuing Businesses 2,171 2,037 +7%
Discontinued Business (Spike) 2,540 6,081
Services income from incubation - 410 operations*
Total Turnover 4,711 8,528
Total Revenue (US$’000) 2002 2001 Change
Including Discontinued 7,132 9,997 -29%
Business (Spike)
Continuing Businesses only 4,612 3,822 +21%
,
,
,
,
Q Q Q Q
Total Operating Expenses
Discontinued Business (Spike)Continuing Businesses
(US$’000)
* Services income from incubation operations of US$116,218 for the year ended 31 December 2002 is classified under Other Revenue (see Note 4 to the financial statements)

P. o p e r a t i o n a l a n d f i n a n c i a l r e v i e w
Consolidated Operating Loss
The total consolidated loss from operations for
2002 of US$10.8 million is a 32% improvement
on 2001. Moreover, the combination of the
factors discussed above has meant an operating loss
that has consistently narrowed for each succeeding
quarter of 2002.
Non-Operating Items
Total non-operating items contributed a further
US$2.5 million to the loss attributable to
shareholders for 2002 (2001: US$26.6 million).
The great majority of the non-operating loss items
was a further provision for impairment of
investments. The significant reduction in the
non-operating items this year reflects the efforts
made during 2001 to increase the clarity of the
balance sheet and remove legacy items.
Balance Sheet Commentary
Consolidated net assets as at 31 December 2002
were US$12.9 million, down from US$25.7
million at the previous year-end.
The Group continued to have no borrowings or
charged assets as at 31 December 2002 and
financed its operations and investing activities with
internally generated cashflows and the balance of
proceeds from the IPO. As at 31 December 2002,
the Group had cash and bank balances of US$11.8
million (2001: US$19.8 million) representing just
over 90% of consolidated net assets (2001: 77%).
The Board believes the scope for further asset
write-downs or provisions for impairment against
past investments is very limited.
Conclusion
Assessment of the financial position of the
Company’s continuing businesses is complicated
by the impact of Spike on the financial statements
for the year under review. We trust the above
commentary, coupled with the segmental analysis,
goes some way to making this assessment easier.
In summary, the Company’s consolidated balance
sheet is now free of the IPO legacy, and reflects
the Company’s current lines of business as they
enter 2003.
The income statement for the year shows a
US$13.4 million loss attributable to shareholders
but the operating loss has consistently narrowed for
each succeeding quarter of 2002.
Most importantly, the Company’s cash outflow has
reduced steadily each quarter over 2002. This
culminated in a fourth quarter where there was a
net cash inflow of US$0.3 million, raising cash and
balances at banks to US$11.8 million.
- ,
-,
- ,
-,
- ,Q Q Q QQQ
Consolidated Operating Loss
Discontinued Business (Spike)Continuing Businesses
(US$’000)

o p e r a t i o n a l a n d f i n a n c i a l r e v i e w P.
progress againstbusiness objectives
On 11 March 2002 the Company
issued a circular (the “Circular”) to
shareholders seeking, inter alia,
approval for a proposed expansion
and diversification of business
activities. This approval was
granted by shareholders on
27 March 2002. Included in the
Circular was a table of revised
business objectives in line with the
expanded and diversified activities.
The following is a comparison of
actual business progress in the
twelve months ended 31 December
2002 (“Review Period”) and the
business objectives for the Review
Period as set out in the Circular.
Expanded business objectives during the Review Periodas set out in the Circular
Actual business progress during theReview Period
Established a wholly-owned foreignenterprise (WOFE) in Shanghai
In the early part of 2003, hired a specialist team to originate privateplacement transactions from theMainland China market
In the early part of 2003, hired a senior investment banker to developthe Korean market
Signed several corporate financeadvisory mandates in Singaporeduring the Review Period and inMainland China during early 2003
The Crosby business has signedseveral significant, non-technology corporate finance advisory mandates
The range of corporate financeservices will be expanded with thenew, specialist Mainland China team
The asset management business wasappointed portfolio manager of theCORO Voltin fund, increasing assetsunder management by US$350 million
As a result of the failure by a third party investor to complete an investment intoSpike, the Spike Group was placed intoprovisional liquidation in July 2002.The Company no longer operates any digital services businesses
The Company invested selectively inthe development of the Techpacificand Crosby technology platform tofacilitate its businesses
There has been a significantmarketing effort throughout theregion to promote the Crosby brand.This has resulted in signed, fee-paying mandates
The Company has advertised theCrosby brand in the financial pressand made press releases for significantevents
.
.
.
.
.
.
.
.
.
.
.
.
.
.
.
.
.
Expand business in key marketsincluding Greater China, Singaporeand Korea
Expand the range of corporate financeand corporate advisory services tonon-technology sectors, including, butnot limited to, the media, logistics andfood sectors
Increase the level of funds undermanagement by launching new fundswithin and beyond the technology sector, such as the special situationsfund
Continue to support the developmentof Spike as a leading communicationsand digital services business in Asia and Australia, with particular focus on strengthening its Australian andJapanese client base
Invest in additional technology inpromoting Techpacific and Spike
Enhance the brand awareness of the expanded corporate finance and new asset management activities under thenew Crosby brand name

P. P r o f i l e s o f S e n i o r M a n a g e m e n t
Profiles of Senior ManagementBoard of DirectorsBoard of Directors
Executive DirectorsNon-executive DirectorsIndependent Non-executive Directors
Robert John Richard Owen
ChairmanAs the Chairman of the Techpacific Group, Robert Owen is responsible for overall supervision of the Group’s management and maintaining relationships with key strategic partners of the Group, its investors and regulators. Robert has over 30 years of experience in the financial services industry. Since 1992, he has held senior positions in the Asian operations of the Nomura Group, as well as being a director of Sunday Communications Limited, the International Securities Consultancy Limited, European Capital Co. Limited and various other enterprises. From 1993 to 1996 he was a council member of Lloyds of London. In 1988, Robert was recruited by the Hong Kong Government as Advisor on Securities Markets to implement extensive reforms to the Hong Kong regulatory system, which included the establishment of the Securities and Futures Commission (SFC). In 1989, he became the first Chairman of the SFC, where he served to 1992. He is currently a member of the Regulatory Council of the Dubai International Finance Centre.
Johnny Chan Kok Chung
Vice ChairmanJohnny Chan co-founded Techpacific with Ilyas Khan. As Vice-Chairman, he heads the origination team of Crosby in addition to directing the strategic development of the Group and overseeing the Venture Capital business. With 19 years of experience in leading global financial institutions, Johnny is a veteran in corporate finance and investment banking. In 1999, he was a Managing Director of Bear Stearns Asia Limited, in Hong Kong. Prior to that, he was an Executive Director at Union Bank of Switzerland. Johnny is an assessor in the Hong Kong Government’s Small Entrepreneur Research and Assistance Program under the Innovation Technology Fund. Johnny is also a Director of Softech, a joint venture between Techpacific and Softbank, which acts as a manager of the Hong Kong Applied Research Fund.
Ilyas Tariq Khan
Chief Executive Officer Ilyas is the co-founder, together with Johnny Chan, of Techpacific. Prior to founding Techpacific in Hong Kong in December 1998, Ilyas was a senior member of the management team and a Managing Director of Nomura, based in Hong Kong, responsible for a regional (non-Japan Asian) investment banking and fixed income business.
Ilyas has more than 16 years’ corporate finance and investment banking experience with financial institutions such as Citicorp, UBS and Schroders. During that period, he has built a track record that includes the origination and execution of a large number of deals, including many that were voted as “deals of the year” at the time they were executed. At Citicorp and UBS, Ilyas initiated, built, and then managed regional corporate finance and capital market businesses in Asia.

P r o f i l e s o f S e n i o r M a n a g e m e n t P.
Francis Yuen Tin Fan
Francis Yuen is Deputy Chairman of the Pacific Century Group and Chairman of Pacific Century Insurance Holdings Limited. He was in former years Managing Director of Citicorp Scrimgeour Vickers, Hong Kong. In 1988, Francis was appointed Chief Executive of the Stock Exchange of Hong Kong and served in that post until 1991. From 1992 to 1994 he served as a member of the International Markets Advisory Board of NASDAQ.
Daniel Yen Tzu Chen
Daniel Yen currently serves on the Board of Hudson Holding Pte Ltd., a property and investment holding company based in Singapore. He is also Managing Director and Founder of P.T. Universal Sejati, an Indonesian trading company that deals in commodity metals, chemicals, machinery and mining products.
Daniel joins our Board from an accounting and business background and has over 20 years of experience throughout the Southeast Asian region, particularly in Indonesia and Singapore, both key markets for the Company.
Alec Tsui Yiu Wa
Alec Tsui is a founder of WAG Financial Services Group, a Hong Kong-based provider of financial management consulting services. He is also Advisor and Council Member of the Shenzhen Stock Exchange. From August 2000 to February 2001, he was Chief Executive of the iRegent Group Limited, a Hong Kong listed investment company. Prior to this, he was Chief Executive of The Stock Exchange of Hong Kong Limited, which he joined in 1994 as Executive Director of the Finance and Operations Services Division. Following the merger of the Stock and Futures Exchanges in 2000, Alec was the Chief Operating Officer of the Hong Kong Exchanges and Clearing Limited. Prior to joining the Exchange, he was an Assistant Director of the Securities and Futures Commission of Hong Kong from 1989 to 1993. Alec has also been a member of numerous public bodies and community service organizations, including the Supervisory Committee of Tracker Fund of Hong Kong, the Standing Committee on Company Law Reform, the Hong Kong Trade Development Council Financial Services Advisory Committee and ICAC’s Professional Ethics Programme for the financial services sector.
Ahmad S. Al-Khaled
Ahmad S. Al-Khaled is the Chief Operating Officer of Tekbanc Limited, a global Venture Capital firm that invests in private and publicly held companies in high growth sectors. Ahmad is also the Assistant Deputy Director and Head of the Investment Funds Division at the Kuwait Fund for Arab Economic Development which he joined in 1995. His responsibility is to lead a team of investment professionals in strategizing, analyzing, investing, and monitoring a portfolio of investment funds that include hedge funds, long-only equity, fixed income, private equity and real estate funds.

P. p r o f i l e s o f s e n i o r m a n a g e m e n t
Profiles of Senior ManagementSenior ManagementRobert Owen Chairman
Johnny Chan Vice Chairman
Ilyas Khan CEO
Stephen SmithChief Financial OfficerCompany Secretary
Stephen is a member of the Company’s Executive Committee and responsible for the Company’s financial reporting. He also oversees compliance with Techpacific’s regulatory obligations.
Stephen has held a number of senior positions at the Company since joining at its 1999 inception. He joined from an accounting and finance background, having previously worked for Ernst & Young where he trained as a Chartered Accountant. He then worked for European Capital, a London-based financial advisory firm specialising in corporate and project finance.
He has structured and executed financings across the spectrum, from venture capital to highly structured debt.
Stephen is a member of the Institute of Chartered Accountants in England and Wales. He has worked in the financial services sector since 1991.
Ahmad SalamManaging Director(UK & Middle East)
Ahmad is Managing Director based in London and is responsible for spearheading Crosby’s initiatives in the UK and Arab countries. Ahmad is the point man for shareholder relationships in the Gulf and the development of the Islamic Finance initiative. He is also a member of the Structured Finance Group within Crosby. In addition, Ahmad is responsible for Project Finance, again with specific focus on the Gulf states.
Ahmad is a career investment banker with considerable experience in debt capital markets and structured products, in addition to experience and depth in treasury functions. He began his career with NM Rothschild in 1983 and has worked for Chase
Investment Bank, Paribas and CS First Boston. Most recently, Ahmad was the Managing Director of Arab European Capital in London.
Ian GibbsManaging Director(Singapore)
Ian is a Managing Director of Crosby and is based in Singapore. Ian joined the Crosby Group as a Director in 1997 and became the majority shareholder of the Crosby Group in Asia following a management buy-out. He successfully negotiated a merger of the Crosby Group with Techpacific and currently leads the merged group’s South East Asian operations.
Prior to joining the Crosby Group, Ian was responsible for the Asian operations of Enskilda Securities, based in their Singapore office. He joined Enskilda Securities (London) in 1990 and worked on a range of corporate finance transactions, including major debt restructuring assignments. Prior to that, Ian was with Arthur Andersen (London) for four years. Ian has worked for a client base that includes both western and Asian multinationals, assisting them in making acquisitions and divestments.
Joey BorromeoManaging Director(Philippines)
Joey oversees Crosby in the Philippines. He joined Techpacific after serving as President of Credit Lyonnais Securities (Philippines) in 1998 where he was in charge of originating and delivering corporate finance services. Before Credit Lyonnais, Joey was Deputy General Manager and Head of Commercial Banking and Structured Finance for ABN-AMRO Philippines where he successfully originated and completed debt capital markets issues, syndicated loans and project financings.
Joey spent his longest time with
Citibank, as a eurodollar and gold trader, a Vice President in Investment Banking and as a Senior Manager of corporate banking. Citibank then reassigned Joey to Citicorp International Limited in Hong Kong as a Director of Corporate Finance.
Joey also worked for Union Bank of Switzerland in Hong Kong as a Director in their Equity Capital Markets team.
D. C. LeeManaging Director(Greater China Region)
DC joined Crosby in 2003 as a Managing Director (Greater China). DC has 13 years of capital market experience in the Greater China Region advising on capital market strategic planning, initial public offerings, mergers and acquisitions, financial advisory services and private equity investments.
Prior to joining Crosby, DC was Managing Director of Shanghai Land Holdings Limited. Prior to that, DC was Head of Investment Banking of Core Pacific - Yamaichi where he executed 31 IPOs for small- to medium-sized enterprises in the Greater China Region and provided financial advice to listed companies. Under DC’s management, Core Pacific - Yamaichi became one of the leading investment banks focusing on Greater China and the leading sponsor for the Growth Enterprise Market of The Stock Exchange of Hong Kong Limited. Core Pacific - Yamaichi was elected as the “Best Small Cap IPO House” by Finance Asia in 2002.
Shahzad AshfaqExecutive Director
Shahzad is an Executive Director based out of Singapore and is responsible for spearheading Crosby’s Structured Finance Unit.
He oversees execution for Structured Finance and Islamic Financing
transactions. In addition, Shahzad is responsible for assisting in the execution of non Structured Finance deals for the South East Asian region.
Prior to moving to Singapore in 2001, Shahzad was based in Hong Kong with Techpacific.
Prior to joining the Techpacific Group, Shahzad held senior investment banking positions with Nomura International plc, UBS Warburg and Citicorp. He was based in London with Nomura prior to moving back to Asia.
His background is primarily Capital Markets, an area he has been involved in since 1991.
Patrick YeungExecutive Director
Patrick is based in Hong Kong focusing on cross-border mergers and acquisitions in the Greater China market. He is also responsible for execution of private placement and buyout transactions involving strategic and financial investors. Prior to becoming an Executive Director of Crosby, Patrick also served in various positions of the Group in the business development and venture capital divisions, and was instrumental in the raising of the venture capital funds managed by the Group.
Prior to joining the Group, Patrick worked with the power and infrastructure team of the investment banking department of Salomon Smith Barney (Hong Kong). Prior to that, he was with the investment banking department of Bear Stearns Asia Limited, focusing on cross-border capital markets transactions for Greater China and South East Asian issuers in the power, infrastructure and telecom sectors.
P.
DirECtors ’ Report
A u d i tor s ’ R e p ort
Financial Statements
D I R E C T O R S ’ R E P O R T
P. D I R E C T O R S ’ R E P O R T
The directors present their report and the audited financial statements of the Company and the Group for the year ended31 December 2002.
PRINCIPAL ACTIVITIES
The principal activity of the Company is to act as the holding company of the Group. The principal activities of theCompany’s subsidiaries are set out in note 9 to the financial statements.
SEGMENTAL INFORMATION
A segmental analysis of the Group is set out in note 3 to the financial statements.
RESULTS AND APPROPRIATIONS
The results of the Group for the year ended 31 December 2002 and the state of affairs of the Group and the Company atthat date are set out in the financial statements on pages 31 to 64.
The directors do not recommend the payment of a dividend for the year.
PROPERTY, PLANT AND EQUIPMENT
Details of movements in the property, plant and equipment of the Group during the year are set out in note 10 to thefinancial statements.
SHARE OPTION SCHEME
Details of the share option scheme of the Company are set out in note 24 to the financial statements.
RESERVES
Details of movements in the reserves of the Group during the year are set out in the consolidated statement of changes inequity on page 34.
SUBSIDIARIES AND ASSOCIATES
Particulars of the principal subsidiaries and associates as at 31 December 2002 are set out in notes 9 and 11 to thefinancial statements respectively.
MAJOR CLIENTS AND SUPPLIERS
The percentages of the Group’s revenue attributable to the largest client and the five largest clients for the year (excludingthe revenue attributable to the Spike Group) are as follows:
– the largest client 27%– five largest clients 83%
The Group is mainly a provider of financial and advisory services and a fund manager. In the opinion of the directors, it istherefore of no value to disclose details of the Group’s suppliers.
P.D I R E C T O R S ’ R E P O R T
D I R E C T O R S ’ R E P O R T
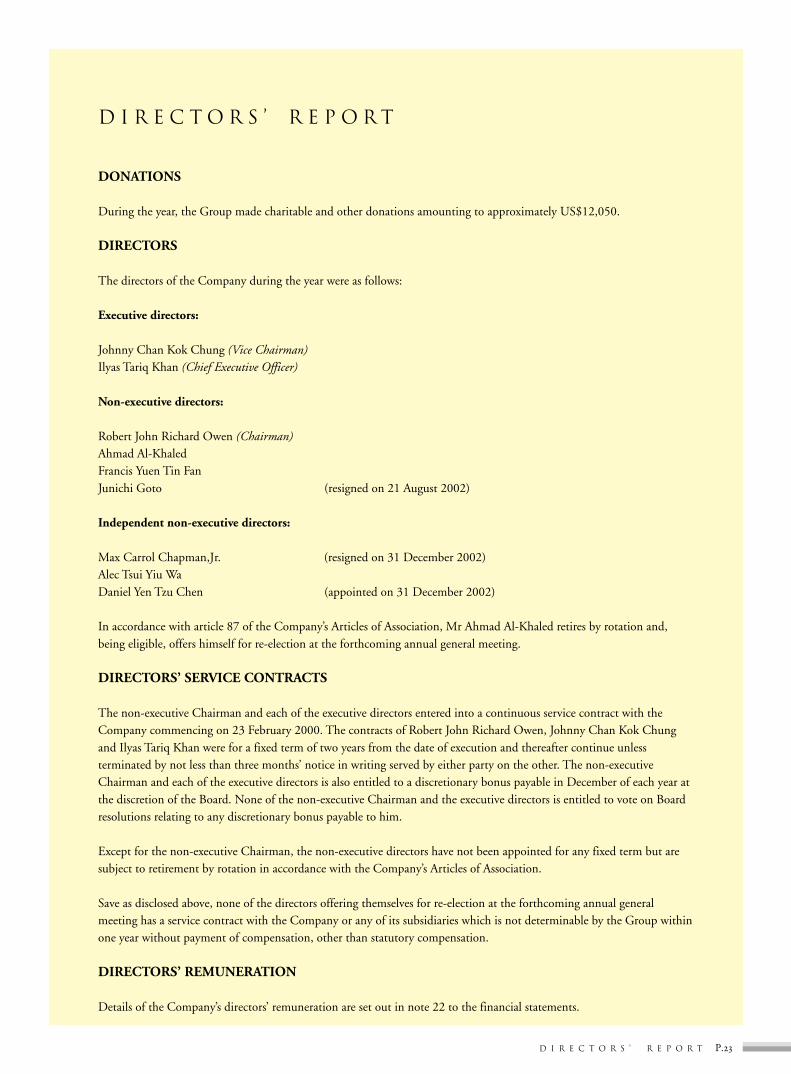
DONATIONS
During the year, the Group made charitable and other donations amounting to approximately US$12,050.
DIRECTORS
The directors of the Company during the year were as follows:
Executive directors:
Johnny Chan Kok Chung (Vice Chairman)Ilyas Tariq Khan (Chief Executive Officer)
Non-executive directors:
Robert John Richard Owen (Chairman)Ahmad Al-KhaledFrancis Yuen Tin FanJunichi Goto (resigned on 21 August 2002)
Independent non-executive directors:
Max Carrol Chapman,Jr. (resigned on 31 December 2002)Alec Tsui Yiu WaDaniel Yen Tzu Chen (appointed on 31 December 2002)
In accordance with article 87 of the Company’s Articles of Association, Mr Ahmad Al-Khaled retires by rotation and,being eligible, offers himself for re-election at the forthcoming annual general meeting.
DIRECTORS’ SERVICE CONTRACTS
The non-executive Chairman and each of the executive directors entered into a continuous service contract with theCompany commencing on 23 February 2000. The contracts of Robert John Richard Owen, Johnny Chan Kok Chungand Ilyas Tariq Khan were for a fixed term of two years from the date of execution and thereafter continue unlessterminated by not less than three months’ notice in writing served by either party on the other. The non-executiveChairman and each of the executive directors is also entitled to a discretionary bonus payable in December of each year atthe discretion of the Board. None of the non-executive Chairman and the executive directors is entitled to vote on Boardresolutions relating to any discretionary bonus payable to him.
Except for the non-executive Chairman, the non-executive directors have not been appointed for any fixed term but aresubject to retirement by rotation in accordance with the Company’s Articles of Association.
Save as disclosed above, none of the directors offering themselves for re-election at the forthcoming annual generalmeeting has a service contract with the Company or any of its subsidiaries which is not determinable by the Group withinone year without payment of compensation, other than statutory compensation.
DIRECTORS’ REMUNERATION
Details of the Company’s directors’ remuneration are set out in note 22 to the financial statements.

D I R E C T O R S ’ R E P O R T
P. D I R E C T O R S ’ R E P O R T
DIRECTORS’ INTERESTS IN SECURITIES
(i) Equity interest in the Company
As at 31 December 2002, the interests of the directors of the Company in the shares of the Company (“theShares”) and in the share capital of any of its associated corporations (within the meaning of the Securities(Disclosure of Interests) Ordinance (“SDI Ordinance”)) which were required to be notified to the Company andThe Stock Exchange of Hong Kong Limited (“the Exchange”) pursuant to section 28 of the SDI Ordinance(including interests which they were taken or deemed to have under section 31 of, or Part 1 of the Schedule to,the SDI Ordinance) or which were required, pursuant to section 29 of the SDI Ordinance, to be entered in theregister required to be kept therein, or which were required pursuant to Rules 5.40 to 5.52 of the Rules Governingthe Listing of Securities on the GEM of the Exchange (the “GEM Listing Rules”) relating to securities transactionsby the directors to be notified to the Company and the Exchange were as follows:
Personal Family Corporate OtherName of director interest interest interest interest
Robert John Richard Owen 107,957,606 – – –
Ilyas Tariq Khan (Notes 1 & 2) 79,994,076 – 513,498,147 –
Johnny Chan Kok Chung (Note 3) 207,805,852 16,097,387 – –
Francis Yuen Tin Fan (Note 4) – – 929,400 –
Note 1: TW Indus Limited held 188,208,147 Shares. Ilyas Tariq Khan beneficially wholly owns TW Indus Limited.
Note 2: ECK & Partners Limited held 325,290,000 Shares. ECK & Partners Limited was beneficially owned as to 61.43%by Ilyas Tariq Khan, as to 20% by Robert John Richard Owen, and as to 18.57% by Johnny Chan Kok Chung.Ilyas Tariq Khan is deemed to have interests in 325,290,000 Shares under the SDI Ordinance since he is entitledto exercise more than one third of the voting power at a general meeting of ECK & Partners Limited.
Note 3: Yuda Udomritthiruj held 16,097,387 Shares. Yuda Udomritthiruj, an employee of a subsidiary of the Company, isthe wife of Johnny Chan Kok Chung and, accordingly, for the purposes of the SDI Ordinance, her shares areincluded in the shareholdings of Johnny Chan Kok Chung.
Note 4: Latlink Investments Limited held 929,400 Shares. Latlink Investments Limited was beneficially owned as to 50%by Francis Yuen Tin Fan and as to the remaining 50% by his wife.

P.D I R E C T O R S ’ R E P O R T
D I R E C T O R S ’ R E P O R T
DIRECTORS’ INTERESTS IN SECURITIES (continued)
(ii) Share options
At the extraordinary general meeting held on 27 March 2002, the Company resolved to terminate its old shareoption schemes and to adopt a new share option scheme. All options granted under the old share option schemeswere cancelled. No director of the Company received any options under the new share option scheme, except asfollows:
Name Effective date Option shares Subscription price
Johnny Chan Kok Chung (Note 1) 27 March 2002 2,500,000 HK$0.0704
Note 1: The holding is comprised of 2,500,000 options in which Yuda Udomritthiruj, an employee of a subsidiary of theCompany, was interested. Yuda Udomritthiruj is the wife of Johnny Chan Kok Chung and, accordingly, for thepurpose of the SDI Ordinance, her options are included in the options held by Johnny Chan Kok Chung.
Details of the share option schemes are set out in note 24 to the financial statements.
(iii) Shares in Crosby Limited, a subsidiary of the Company
Personal Family Corporate OtherName of director interest interest interest interest
Robert John Richard Owen 3,000 – – –
Ilyas Tariq Khan (Note 1) 1 – 110,001 –
Johnny Chan Kok Chung 30,000 – – –
Note 1: TW Indus Limited held 110,001 shares in Crosby Limited. TW Indus Limited was beneficially wholly-owned byIlyas Tariq Khan.
Save as disclosed above, none of the directors or their respective associates had any interests (including personal,family, corporate and other interests) in the share capital of the Company or any of its associated corporations asdefined in the SDI Ordinance and any right to subscribe for equity or debt securities of the Company granted toany of them, and any exercise of such rights, which are required to be recorded in the register under Section 29 ofthe SDI Ordinance or as otherwise required to be notified to the Company and the Exchange pursuant to theGEM Listing Rules.
DIRECTORS’ INTERESTS IN CONTRACTS
No contract of significance to which the Company or any of its subsidiaries was a party and in which a director of theCompany had a material interest, whether directly or indirectly, subsisted at the end of the year or at any time during theyear.

D I R E C T O R S ’ R E P O R T
P. D I R E C T O R S ’ R E P O R T
SUBSTANTIAL SHAREHOLDERS
As far as the directors are aware, as at 31 December 2002, the holders of 10% or more of the issued share capital of theCompany as recorded in the register required to be kept under Section 16(1) of the SDI Ordinance were as follows:
Approximatepercentage
Number or or approximateapproximate attributableattributable percentage holding
Name number of shares of shares in issue
Ilyas Tariq Khan (Notes 1 & 4) 593,492,223 23.72%ECK & Partners Limited (Notes 2 & 4) 325,290,000 13.00%tekbanc.com Limited (Notes 3 & 4) 302,055,000 12.07%
Note 1: The interest of Ilyas Tariq Khan included 188,208,147 shares held by TW Indus Limited, which was beneficially wholly-owned by him and 325,290,000 shares held by ECK & Partners Limited which was beneficially owned as to 61.43% byhim.
Note 2: ECK & Partners Limited held a direct interest in 325,290,000 shares. Ilyas Tariq Khan was beneficially interested in61.43% of the share capital of ECK & Partners Limited and, therefore, Ilyas Tariq Khan was also interested in these325,290,000 shares which are duplicated within the 593,492,223 shares in which Ilyas Tariq Khan was interested.
Note 3: tekbanc.com Limited is a company wholly-owned by the Kuwait Fund for Arab Economic Development, a developmentfinance agency owned by the government of Kuwait.
Note 4: The total number of shares outstanding as at 31 December 2002 was 2,502,577,245.
Save as disclosed above, the directors are not aware of any other persons who were, as at 31 December 2002, interested in10% or more of the shares of the Company.
CONNECTED TRANSACTIONS
During the year, the Group had no transactions with any of its connected parties.
SPONSOR’S INTEREST
As notified by the Company’s sponsor, BNP Paribas Peregrine Capital Limited (the “Sponsor”), as at 31December 2002, Yi Hua Assets Limited , an associate of the Sponsor (as defined in the GEM Listing Rules)held 16,380,675 shares in the Company.
Save as disclosed above, neither the Sponsor nor its directors or employees or associates (as referred to in Note 3of Rule 6.35 of the GEM Listing Rules) had any interests in the securities of the Company, including optionsor rights to subscribe for such securities.
Pursuant to the agreement entered into between the Company and the Sponsor, the Sponsor received a fee foracting as the Company’s retained sponsor for the period from 17 April 2000 to 31 December 2002. Theagreement with the Sponsor was terminated as at 31 December 2002.

P.D I R E C T O R S ’ R E P O R T
D I R E C T O R S ’ R E P O R T
COMPETING INTERESTS
The directors are not aware of any business or interest, as of 31 December 2002, of the directors, initial managementshareholders of the Company or their respective associates which was required to be disclosed pursuant to Rule 11.04 ofthe GEM Listing Rules.
PURCHASE, SALE OR REDEMPTION OF SHARES OF THE COMPANY
Neither the Company nor any of its subsidiaries has purchased, redeemed or sold any of the Company’s shares during theyear.
LIQUIDITY AND FINANCIAL RESOURCES
The Group financed its operating and investing activities with internally generated cashflows and the balance of proceedsfrom the initial public offering.
As at 31 December 2002, the Group had cash and bank balances of US$11.8 million (2001: US$19.8 million). Duringthe year, the Group utilised US$8.0 million (2001: US$10.2 million) to finance its operating and investing activities.
FOREIGN CURRENCY EXCHANGE EXPOSURE
The Group’s exposure to foreign currencies is limited to its investments in foreign subsidiaries, which are financedinternally.
EMPLOYEE INFORMATION
As at 31 December 2002, the Group had 37 full-time employees (2001: 189). Employee remuneration totalled US$9.4million (2001: US$12.8 million). The salary and benefit levels of the Group’s employees are kept at a competitive leveland employees are rewarded on a performance-related basis within the general framework of the Group’s salary and bonussystem, which is reviewed annually.
The Group also operates employee share option scheme, as detailed in note 24 to the financial statements.
BOARD PRACTICES AND PROCEDURES
The Company has complied with the Board Practices and Procedures as set out in Rules 5.28 to 5.39 of the GEM ListingRules throughout the year.

D I R E C T O R S ’ R E P O R T
P. D I R E C T O R S ’ R E P O R T
AUDIT COMMITTEE
As required by Rule 5.23 of the GEM Listing Rules, the Company established an audit committee on 31 March 2000with written terms of reference in compliance with Rules 5.20 and 5.25 of the GEM Listing Rules which deal clearly withits authority and duties. As at 31 December 2002, the audit committee members comprised Alec Tsui Yiu Wa, Daniel YenTzu Chen and Robert John Richard Owen. The committee’s principal duties are to review and supervise the Company’sfinancial reporting process and internal control systems. Four meetings were held by the committee during the year.
FULL NAME AND QUALIFICATIONS OF COMPANY SECRETARY, QUALIFIED ACCOUNTANTAND THE COMPLIANCE OFFICER
The Company Secretary of the Company is Stephen Christopher Smith. He holds a Joint Honours degree in Economicsand Mathematics from the University of Bristol in the United Kingdom, and is a member of the Institute of CharteredAccountants in England and Wales.
The Qualified Accountant of the Company is Winnie Sin Wing Hung. She is a Fellow of the Association of CharteredCertified Accountants and is also an Associate of the Hong Kong Society of Accountants.
The Compliance Officer of the Company is Johnny Chan Kok Chung. He holds a post-graduate diploma from theSecurities Institute of Australia and is an Associate of the Securities Institute of Australia (ASIA). He also has an MBA inInternational Business and a BA degree in Economics.
PENSION SCHEME
Commencing from 1 December 2000, all Hong Kong employees have to participate in the Mandatory Provident Fund(“MPF”) Scheme. Under such scheme, both the employee and employer have to contribute at least 5% of the employee’smonthly salary to the MPF scheme (limited to HK$1,000 per contribution if no special agreement is made between theemployees and employer).
All employees have participated in the Hong Kong and Shanghai Banking Corporation (“HSBC”) MPF Scheme exceptfor those who are exempted from this requirement. Under the HSBC MPF Scheme, both the Group and employeescontribute 5% of salary (limited to HK$1,000) to the scheme each month. There is no voluntary contribution from theGroup nor the employees.
The Group’s contribution to the HSBC MPF Scheme amounted to US$57,208 for the year.
PRE-EMPTIVE RIGHTS
There is no provision for pre-emptive rights under the Company’s Articles of Association, or the laws of the CaymanIslands, which would oblige the Company to offer new shares on a pro-rata basis to existing shareholders.
CHANGE OF COMPANY NAME
Pursuant to a special resolution dated 30 April 2002, the company changed its name from “techpacific.com Limited” to“Techpacific Capital Limited” with effect from 6 June 2002.

P.D I R E C T O R S ’ R E P O R T
D I R E C T O R S ’ R E P O R T
AUDITORS
The financial statements have been audited by Messrs. Grant Thornton who will retire from office and, being eligible,offer themselves for re-appointment at the forthcoming annual general meeting.
For and on behalf of the Board
Ilyas Tariq KhanDirector
20 March 2003

A U D I T O R S ’ R E P O R T
P. A U D I T O R S ’ R E P O R T
均富會計師行
To the members of Techpacific Capital Limited(Formerly known as techpacific.com Limited)(Incorporated in the Cayman Islands with limited liability)
We have audited the financial statements on pages 31 to 64 which have been prepared in accordance with InternationalAccounting Standards as promulgated by the International Accounting Standards Board.
Respective responsibilities of directors and auditors
The Company’s directors are responsible for the preparation of financial statements which give a true and fair view. Inpreparing financial statements which give a true and fair view it is fundamental that appropriate accounting policies areselected and applied consistently.
It is our responsibility to form an independent opinion, based on our audit, on those statements and to report ouropinion to you.
Basis of opinion
We conducted our audit in accordance with Statements of Auditing Standards issued by the Hong Kong Society ofAccountants. An audit includes examination, on a test basis, of evidence relevant to the amounts and disclosures in thefinancial statements. It also includes an assessment of the significant estimates and judgements made by the directors inthe preparation of the financial statements, and of whether the accounting policies are appropriate to the Company’s andthe Group’s circumstances, consistently applied and adequately disclosed.
We planned and performed our audit so as to obtain all the information and explanations which we considered necessaryin order to provide us with sufficient evidence to give reasonable assurance as to whether the financial statements are freefrom material misstatement. In forming our opinion we also evaluated the overall adequacy of the presentation ofinformation in the financial statements. We believe that our audit provides a reasonable basis for our opinion.
Opinion
In our opinion the financial statements give a true and fair view of the state of affairs of the Company and of the Group asat 31 December 2002 and of the Group’s loss and cash flows for the year then ended and have been properly prepared inaccordance with the disclosure requirements of the Hong Kong Companies Ordinance.
Grant ThorntonCertified Public AccountantsHong Kong
20 March 2003
For the year ended 31 December 2002
P.C O N S O L I D A T E D I N C O M E S T A T E M E N T
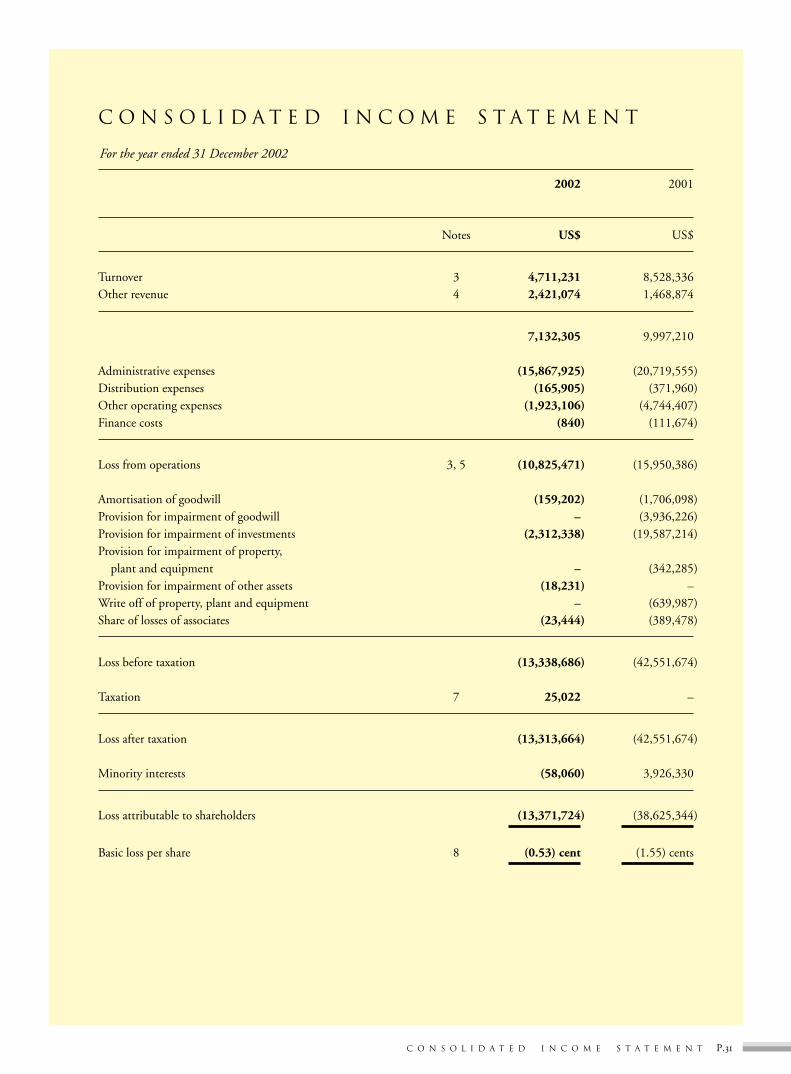
C O N S O L I D A T E D I N C O M E S T A T E M E N T
2002 2001
Notes US$ US$
Turnover 3 4,711,231 8,528,336Other revenue 4 2,421,074 1,468,874
7,132,305 9,997,210
Administrative expenses (15,867,925) (20,719,555)Distribution expenses (165,905) (371,960)Other operating expenses (1,923,106) (4,744,407)Finance costs (840) (111,674)
Loss from operations 3, 5 (10,825,471) (15,950,386)
Amortisation of goodwill (159,202) (1,706,098)Provision for impairment of goodwill – (3,936,226)Provision for impairment of investments (2,312,338) (19,587,214)Provision for impairment of property,
plant and equipment – (342,285)Provision for impairment of other assets (18,231) –Write off of property, plant and equipment – (639,987)Share of losses of associates (23,444) (389,478)
Loss before taxation (13,338,686) (42,551,674)
Taxation 7 25,022 –
Loss after taxation (13,313,664) (42,551,674)
Minority interests (58,060) 3,926,330
Loss attributable to shareholders (13,371,724) (38,625,344)
Basic loss per share 8 (0.53) cent (1.55) cents
C O N S O L I D A T E D B A L A N C E S H E E T
As at 31 December 2002
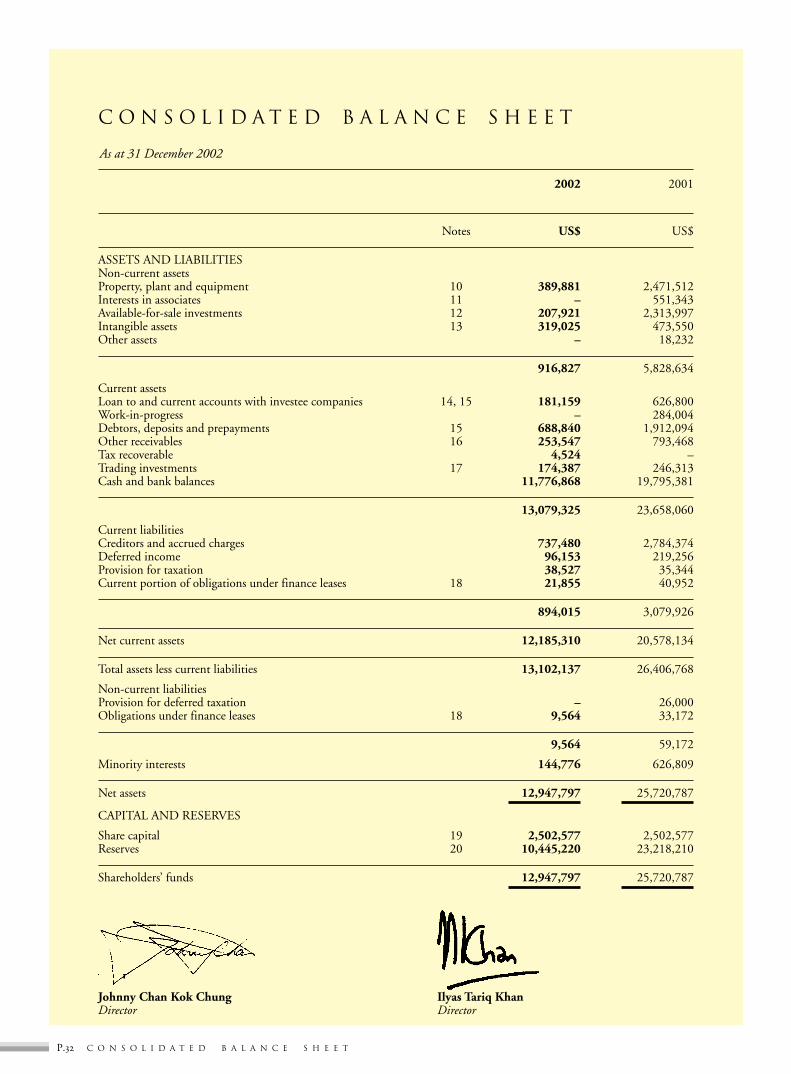
P. C O N S O L I D A T E D B A L A N C E S H E E T
2002 2001
Notes US$ US$
ASSETS AND LIABILITIESNon-current assetsProperty, plant and equipment 10 389,881 2,471,512Interests in associates 11 – 551,343Available-for-sale investments 12 207,921 2,313,997Intangible assets 13 319,025 473,550Other assets – 18,232
916,827 5,828,634
Current assetsLoan to and current accounts with investee companies 14, 15 181,159 626,800Work-in-progress – 284,004Debtors, deposits and prepayments 15 688,840 1,912,094Other receivables 16 253,547 793,468Tax recoverable 4,524 –Trading investments 17 174,387 246,313Cash and bank balances 11,776,868 19,795,381
13,079,325 23,658,060
Current liabilitiesCreditors and accrued charges 737,480 2,784,374Deferred income 96,153 219,256Provision for taxation 38,527 35,344Current portion of obligations under finance leases 18 21,855 40,952
894,015 3,079,926
Net current assets 12,185,310 20,578,134
Total assets less current liabilities 13,102,137 26,406,768
Non-current liabilitiesProvision for deferred taxation – 26,000Obligations under finance leases 18 9,564 33,172
9,564 59,172
Minority interests 144,776 626,809
Net assets 12,947,797 25,720,787
CAPITAL AND RESERVES
Share capital 19 2,502,577 2,502,577Reserves 20 10,445,220 23,218,210
Shareholders’ funds 12,947,797 25,720,787
Johnny Chan Kok Chung Ilyas Tariq KhanDirector Director

As at 31 December 2002
P.B A L A N C E S H E E T
B A L A N C E S H E E T
2002 2001
Notes US$ US$
ASSETS AND LIABILITIES
Non-current assetsInterests in subsidiaries 9 12,163,665 24,776,374
Current assetsAmount due from a related company 14 7,406 33,159Debtors, deposits and prepayments 212,408 368,180Bank balances 4,265,002 12,925,419
4,484,816 13,326,758
Current liabilitiesCreditors and accrued charges 135,680 150,289Amount due to an associate 18,077 –
153,757 150,289
Net current assets 4,331,059 13,176,469
Net assets 16,494,724 37,952,843
CAPITAL AND RESERVES
Share capital 19 2,502,577 2,502,577Reserves 20 13,992,147 35,450,266
Shareholders’ funds 16,494,724 37,952,843
Johnny Chan Kok Chung Ilyas Tariq KhanDirector Director

CONSOLIDATED STATEMENT OF CHANGES IN EQUITY
For the year ended 31 December 2002
P. C O N S O L I D A T E D S T A T E M E N T O F C H A N G E S I N E Q U I T Y
RetainedCapital Investment Foreign profits/
Share Share Capital redemption revaluation exchange (Accumulatedcapital premium reserve reserve reserve reserve losses) Total
US$ US$ US$ US$ US$ US$ US$ US$
At 1 January 2001 2,399,677 52,444,245 4,589,275 – (185,854) (178,605) 988,937 60,057,675
Issue of new sharesfor the acquisition ofa subsidiary, net – – 4,638,918 – – – – 4,638,918
Repurchase of own shares (11,270) (234,801) – 11,270 – – (11,270) (246,071)Surplus on revaluation – – – – 72,654 – – 72,654Exchange difference on
consolidation – – – – – (291,215) – (291,215)Issue of new shares 114,170 – – – – – – 114,170Loss attributable to
shareholders – – – – – – (38,625,344) (38,625,344)
At 31 December 2001 and1 January 2002 2,502,577 52,209,444 9,228,193 11,270 (113,200) (469,820) (37,647,677) 25,720,787
Disposal of subsidiaries – – (68) – – 796,691 – 796,623Surplus on revaluation – – – – 827,710 – – 827,710Disposal of listed investments – – – – (589,819) – – (589,819)Exchange difference on
consolidation – – – – – (435,780) – (435,780)Loss attributable to shareholders – – – – – – (13,371,724) (13,371,724)
At 31 December 2002 2,502,577 52,209,444 9,228,125 11,270 124,691 (108,909) (51,019,401) 12,947,797

For the year ended 31 December 2002
P.C O N S O L I D A T E D C A S H F L O W S T A T E M E N T
C O N S O L I D A T E D C A S H F L O W S T A T E M E N T
2002 2001
Notes US$ US$
Net cash outflow from operating activities 21(a) (9,066,937) (13,470,724)
Investing activitiesInterest received 231,217 1,172,330Interest paid (840) (111,674)Purchases of property, plant and equipment (145,861) (701,501)Proceeds from sale of property, plant and equipment 25,591 107,784Acquisition of investments (492,625) (914,126)Proceeds from sale of investments 2,158,711 170,569Acquisition of associates – (75,266)Proceeds from sale of an associate – 10,018Acquisition of subsidiaries, net of cash acquired – 286,026Acquisition of additional interest in a subsidiary (596,510) –Disposal of subsidiaries 21(b) (237,523) –Payment of expenses for acquisition of a subsidiary – (1,101,784)Net repayment from investee companies 144,508 4,683,310Net advance to other debtors – (114,591)Net advance to associates – (222,098)
Net cash inflow from investing activities 1,086,668 3,188,997
Financing activitiesNet repayment to other creditors – (14,803)Net repayment to an investee company – (100,000)Repayment of finance lease obligations (17,148) (7,482)Repurchase of own shares – (272,454)Payment of share issuing expenses for acquisition of a subsidiary – (28,002)Capital injection from minority shareholders – 464,599
Net cash (outflow)/inflow from financing activities (17,148) 41,858
Net decrease in cash and cash equivalents (7,997,417) (10,239,869)Cash and cash equivalents as at 1 January 19,795,381 29,964,587Effect of exchange rate fluctuations (21,096) 70,663
Cash and cash equivalents as at 31 December 11,776,868 19,795,381

N O T E S T O T H E F I N A N C I A L S T A T E M E N T S
For the year ended 31 December 2002
P. N O T E S T O T H E F I N A N C I A L S T A T E M E N T S
1. GENERAL INFORMATION
The Company was incorporated in the Cayman Islands as an exempted company with limited liability on 21February 2000 under the Companies Law (Revised) of the Cayman Islands.
The shares of the Company were listed on the Growth Enterprise Market (“GEM”) of The Stock Exchange ofHong Kong Limited with effect from 17 April 2000.
The Company acts as the holding company of the Group. Details of the principal activities of the Company’ssubsidiaries are set out in note 9.
2. PRINCIPAL ACCOUNTING POLICIES
The principal accounting policies adopted by the Group are as follows:
(a) Basis of preparation
The financial statements have been prepared in accordance with International Accounting Standardspromulgated by the International Accounting Standards Board, and Interpretations promulgated by theInternational Financial Reporting Interpretations Committee of the IASC. The financial statements areprepared on the historical cost basis except for certain financial instruments.
(b) Basis of consolidation
The consolidated financial statements incorporate the financial statements of the Company and itssubsidiaries made up to 31 December each year.
The consolidated financial statements also include the Group’s share of post-acquisition results andreserves of its associates.
Material intra-group balances and transactions, and any unrealised gains/losses arising from intra-grouptransactions, are eliminated in preparing the consolidated financial statements.
(c) Subsidiary
A subsidiary is a company over which the Company has the power, directly or indirectly, to control itsfinancial and operating decisions so as to derive economic benefits. The results of subsidiaries are includedin the consolidated financial statements from the date that control effectively commences until the datethat control effectively ceases.
(d) Associate
An associate is a company in which the Group has significant influence, but not control, over the financialand operating policies. The consolidated financial statements include the Group’s share of the totalrecognized gains and losses of the associates on an equity accounting basis, from the date that significantinfluence effectively commences until the date that significant influence effectively ceases. For associatesthat are acquired and held exclusively with a view to dispose of in the near future, the Group’s interests arestated at cost, as reduced by any impairment losses recognized.

For the year ended 31 December 2002
P.N O T E S T O T H E F I N A N C I A L S T A T E M E N T S
N O T E S T O T H E F I N A N C I A L S T A T E M E N T S
2. PRINCIPAL ACCOUNTING POLICIES (continued)
(d) Associate (continued)
Unrealised gains arising from transactions with associates are eliminated to the extent of the Group’sinterests in the associates. Unrealised losses are eliminated in the same way as unrealised gains, but only tothe extent that there is no evidence of impairment.
(e) Investments
Investments consist primarily of debt and equity securities. They are stated at fair value based on quotedmarket prices, when available. For unquoted investments, management considers all available factors indetermining fair value, which may include cost, the type of investment, subsequent purchases of the sameor similar investments, and the current financial position and operating results of the company invested in.Any investment that does not have a quoted market price in an active market and where fair value cannotbe reliably measured is stated at cost.
Investment securities intended to be held on a continuing basis for an identified long term purpose areclassified as available-for-sale investments. Changes in fair value in these securities are recognized in arevaluation reserve when these changes arise. In the case of impairment the deficit is recognized in theincome statement. When these securities are disposed of, the related revaluation surplus or deficit isrecognized as income or an expense.
Investment securities acquired principally for the purpose of generating a profit from short-termfluctuations in price are classified as trading investments. Changes in fair value in these securities arerecognized in the income statement as they arise.
(f) Impairment
The carrying amounts of the Group’s assets, other than deferred tax assets (refer note 2(m)) , are reviewedat each balance sheet date to determine whether there is any indication of impairment. If any suchindication exists, the asset’s recoverable amount is estimated. An impairment loss is recognized wheneverthe carrying amount of an asset or its cash-generating unit exceeds its recoverable amount. All impairmentlosses are recognized in the income statement.
Where an impairment loss subsequently reverses, the carrying amount of the asset is increased to therevised estimate of its recoverable amount, but so that the increased carrying amount does not exceed thecarrying amount that would have been determined had no impairment loss been recognized for the assetin prior years. A reversal of an impairment loss is recognized as income immediately, unless the relevantasset is carried at a revalued amount, in which case the reversal of the impairment loss is treated as arevaluation increase.

N O T E S T O T H E F I N A N C I A L S T A T E M E N T S
For the year ended 31 December 2002
P. N O T E S T O T H E F I N A N C I A L S T A T E M E N T S
2. PRINCIPAL ACCOUNTING POLICIES (continued)
(f) Impairment (continued)
Calculation of recoverable amount
The recoverable amount of the Group’s receivables is calculated as the present value of expected future cashflows, discounted at the original effective interest rate inherent in the asset. Receivables with a shortduration are not discounted.
The recoverable amount of other assets is the greater of their net selling price and value in use. In assessingvalue in use, the estimated future cash flows are discounted to their present value using a pre-tax discountrate that reflects current market situations.
(g) Intangible assets
(i) Goodwill
Goodwill arising on an acquisition represents the excess of the cost of the acquisition over the fairvalue of the identifiable assets and liabilities acquired. Goodwill is amortised using the straight linemethod over a period of 3 years. Goodwill is stated at cost less any accumulated amortisation andimpairment.
Negative goodwill arising on acquisition represents the excess of the fair value of the identifiableassets and liabilities acquired over the cost of acquisition.
To the extent that negative goodwill relates to an expectation of future losses and expenses that areidentified in the plan of acquisition and can be measured reliably, but which have not yet beenrecognized, it is recognized in the income statement when the future losses and expenses arerecognized. Any remaining negative goodwill, but not exceeding the fair value of the non-monetary assets acquired, is recognized as income on a systematic basis over the remainingweighted average useful life of those acquired depreciable/amortisable assets. Negative goodwill inexcess of the fair value of the non-monetary assets acquired is recognized immediately in theincome statement.
(ii) Intellectual properties
Intellectual properties represent computer software development costs that are directly associatedwith identifiable and unique software products controlled by the Group and have probableeconomic benefits exceeding the cost beyond one year. Intellectual properties recognized as assetsare amortised using the straight line method over their useful lives, ranging from 1 to 3 years.

For the year ended 31 December 2002
P.N O T E S T O T H E F I N A N C I A L S T A T E M E N T S
N O T E S T O T H E F I N A N C I A L S T A T E M E N T S
2. PRINCIPAL ACCOUNTING POLICIES (continued)
(h) Property, plant and equipment
(i) Measurement bases
Items of property, plant and equipment are stated at cost less accumulated depreciation andimpairment loss. The cost of an asset comprises its purchase price and any directly attributablecosts of bringing the asset to the working condition and location for its intended use.
Where an item of property, plant and equipment comprises major components having differentuseful lives, they are accounted for as separate items of property, plant and equipment.
Expenditure incurred to replace a component of an item of property, plant and equipment that isaccounted for separately, is capitalised with the carrying amount of the component being writtenoff. Other subsequent expenditure relating to these assets is added to the carrying amount of theassets if it can be demonstrated that such expenditure has resulted in an increase in the futureeconomic benefits expected to be obtained from the use of the assets.
(ii) Depreciation
Depreciation is provided to write off the cost of property, plant and equipment over theirestimated useful lives, using the straight line method, at the following rates per annum:
Computer hardware and software 25%-50%Furniture and fixtures 20%-25%Leasehold improvements 20% or over the terms of the leasesMotor vehicles 25%Office equipment 20%-33 1/3%
Assets held under finance leases are depreciated over their estimated useful lives or where shorterthe term of the lease using the same method as owned assets in the same category.
(i) Operating leases
Leases where substantially all the risks and rewards of ownership of assets remain with the lessor areaccounted for as operating leases. Annual rentals applicable to such operating leases are charged to theincome statement on a straight line basis over the lease terms.
(j) Finance leases
Leases are classified as finance leases whenever the terms of the leases transfer substantially all the risks andrewards of ownership of the asset to the Group. Assets acquired by way of finance lease are stated at anamount equal to the lower of the fair value and the present value of the minimum lease payments atinception of the lease. The corresponding liabilities net of finance charges, are recorded as obligationsunder finance leases. Finance charges implicit in the lease payments are charged to the income statementover the period of the leases so as to produce a constant periodic rate of interest on the remaining balanceof the obligations for each accounting period.

N O T E S T O T H E F I N A N C I A L S T A T E M E N T S
For the year ended 31 December 2002
P. N O T E S T O T H E F I N A N C I A L S T A T E M E N T S
2. PRINCIPAL ACCOUNTING POLICIES (continued)
(k) Financial instruments
Financial instruments of the Group include various investments, loans and receivables, cash and bankbalances, creditors and other payables. The accounting policies for various types of investments of theGroup are set out in the individual accounting policies associated with these investments. Other financialinstruments are stated at cost.
(l) Foreign currencies
The financial statements are prepared in United States dollars. Transactions in other currencies aretranslated into United States dollars at the rates of exchange ruling at the dates of the transactions.Monetary assets and liabilities denominated in other currencies at the balance sheet date are translated intoUnited States dollars at the rates of exchange ruling at that date. Gains and losses arising on exchange aredealt with in the income statement. Non-monetary assets and liabilities denominated in other currencies,which are stated at historical cost, are translated into United States dollars at the rates of exchange ruling atthe dates of the transactions.
The assets and liabilities of subsidiaries and associates which are not denominated in United States dollarsare translated into United States dollars at foreign exchange rates ruling at the balance sheet date. Theirrevenues and expenses are translated into United States dollars at rates approximating the foreign exchangerates ruling at the dates of the transactions. Foreign exchange differences arising on translation arerecognized directly in equity.
(m) Taxation
Income tax on the profit and loss for the period comprises current and deferred tax. Income tax isrecognized in the income statement except to the extent that it relates to items recognized directly inequity, in which case it is recognized in equity.
Current tax is the expected tax payable on the taxable income for the period, using tax rates enacted orsubstantially enacted at the balance sheet date, and any adjustment to tax payable in respect of previousyears.
Deferred tax is provided using the balance sheet liability method providing for temporary differencesbetween the carrying amounts of assets and liabilities for financial reporting purposes and the amountsused for taxation purposes. The amount of deferred tax provided is based on the expected manner ofrealisation or settlement of the carrying amount of assets and liabilities, using tax rates enacted orsubstantially enacted at the balance sheet date.
A deferred tax asset is recognized only to the extent that it is probable that future taxable profits will beavailable against which the unused tax losses and credits can be utilised. A deferred tax asset is reduced tothe extent that it is no longer probable that the related tax benefit will be realised.

For the year ended 31 December 2002
P.N O T E S T O T H E F I N A N C I A L S T A T E M E N T S
N O T E S T O T H E F I N A N C I A L S T A T E M E N T S
2. PRINCIPAL ACCOUNTING POLICIES (continued)
(n) Revenue
Revenue is recognized when it is probable that the economic benefits will flow to the Group and when therevenue can be measured reliably, on the following bases:
– Fees from corporate finance and other advisory services are recognized when the services have beenrendered.
– Fees from the placement of shares or loan arrangements for a client are recognized when the shareshave been allotted or the loan has been arranged and proceeds received by the client.
– Interest income is recognized as it accrues, taking into account the effective yield on the asset.
– Service income from incubation operations is recognized as it accrues.
– Fund management fees are recognized in accordance with the substance of the relevant agreements.
– e-Services income is recognized when the services have been rendered.
– Equipment rental income is recognized on a straight line basis over the term of the lease.
– Consultancy fee income is recognized in accordance with the substance of the relevant agreements.
(o) Equity-related compensation
The Group’s share option scheme allows directors and employees to acquire shares of the Company. Whenthe option is exercised, equity is increased by the amount of the proceeds received and consequently nocompensation cost is recognized.
(p) Segmental reporting
A segment is a distinguishable component of the Group that is engaged either in a particular business(business segment), or conducting business in a particular geographical area (geographical segment), whichis subject to risks and rewards that are different from those of other segments.
(q) Cash and cash equivalents
For the purposes of the cash flow statement, cash and cash equivalents comprise cash in hand and amountsrepayable on demand with banks and short-term highly liquid investments which are readily convertibleinto known amounts of cash without notice and which were within three months of maturity whenacquired, less advances from banks repayable within three months from the date of the advance.

N O T E S T O T H E F I N A N C I A L S T A T E M E N T S
For the year ended 31 December 2002
P. N O T E S T O T H E F I N A N C I A L S T A T E M E N T S
3. SEGMENTAL INFORMATION
(a) By business segment (primary segment):
(Discontinued)Investment banking Digital services Incubation service Unallocated Total
Note (a)(i) Note (a)(ii) Note (a)(iii)
2002 2001 2002 2001 2002 2001 2002 2001 2002 2001
US$ US$ US$ US$ US$ US$ US$ US$ US$ US$
Turnover 2,171,238 2,036,593 2,539,993 6,081,645 – 410,098 – – 4,711,231 8,528,336
Segment results 163,680 (889,514 ) (6,223,617 ) (9,626,735 ) – (692,158 ) (6,059,937 ) (11,208,407 )
Unallocated loss fromoperations (4,765,534 ) (4,741,979 ) (4,765,534 ) (4,741,979 )
Loss from operations (10,825,471 ) (15,950,386 )
Amortisation of goodwill (159,202 ) (1,706,098 ) (159,202 ) (1,706,098 )Provision for impairment
of goodwill – (3,936,226 ) – (3,936,226 )Provision for impairment
of investments – – – (2,156,705 ) – – (2,312,338 ) (17,430,509 ) (2,312,338 ) (19,587,214 )Provision for impairment
loss of property, plantand equipment – – – (342,285 ) – – – – – (342,285 )
Provision for impairmentof other assets (18,231 ) – – – – – – – (18,231 ) –
Write off of property,plant and equipment – – – (386,267 ) – (153,097 ) – (100,623 ) – (639,987 )
Share of lossesof associates (23,444 ) (389,478 ) (23,444 ) (389,478 )
Loss before taxation (13,338,686 ) (42,551,674 )
Taxation 25,022 –
Loss after taxation (13,313,664 ) (42,551,674 )
Minority interests (58,060 ) 3,926,330
Loss attributable toshareholders (13,371,724 ) (38,625,344 )
Segment assets 899,994 3,960,392 – 4,137,180 – 1,183,417 38,622,727 97,640,933 39,522,721 106,921,922
Elimination (25,526,569 ) (77,435,228 )
Total assets 13,996,152 29,486,694
Segment liabilities 6,289,679 5,841,128 – 11,473,049 – 2,497,294 54,444,955 44,544,837 60,734,634 64,356,308
Elimination (59,831,055 ) (61,217,210 )
Total liabilities 903,579 3,139,098
Capital expenditure 36,956 80,883 42,589 405,854 – 112,130 66,316 173,185 145,861 772,052Depreciation 32,912 24,742 661,375 1,570,623 – 177,308 428,574 341,272 1,122,861 2,113,945Provision/(write back)
for doubtful debts 125,831 683,944 – (1,522 ) – 109,419 783,985 953,176 909,816 1,745,017

For the year ended 31 December 2002
P.N O T E S T O T H E F I N A N C I A L S T A T E M E N T S
N O T E S T O T H E F I N A N C I A L S T A T E M E N T S
3. SEGMENTAL INFORMATION (continued)
(a) By business segment (primary segment): (continued)
(i) Investment banking operations comprise the provision of corporate finance and other advisoryservices, placement of shares or loan arrangements, fund management services and consultancyservices.
(ii) Digital services operations comprise the provision of e-Services and equipment rental by mainlythe Spike Group, which ceased operations during the year (note 6).
(iii) Unallocated items mainly consist of the corporate management office, incubation services for theyear (classified as other revenue for the year) and any items that cannot be reasonably allocated tospecific business segments.
(b) By geographical segment (secondary segment):
Asia Australia Elimination Total
2002 2001 2002 2001 2002 2001 2002 2001
US$ US$ US$ US$ US$ US$ US$ US$
Turnover from principal
place of operation 3,228,721 5,583,305 1,482,510 2,945,031 – – 4,711,231 8,528,336
Segment assets 39,522,721 103,553,686 – 3,368,236 (25,526,569) (77,435,228) 13,996,152 29,486,694
Capital expenditure 103,272 670,243 42,589 101,809 – – 145,861 772,052
4. OTHER REVENUE
2002 2001
US$ US$
Bad debt recovery 53,887 –Bank interest income 201,425 919,357Other interest income 15,373 222,816Incubation service fee income 116,218 –Profit on disposal of subsidiaries 762,841 163,810Profit on disposal of investments 1,163,970 30,399Profit on disposal of associates 75,950 –Others 31,410 132,492
2,421,074 1,468,874

N O T E S T O T H E F I N A N C I A L S T A T E M E N T S
For the year ended 31 December 2002
P. N O T E S T O T H E F I N A N C I A L S T A T E M E N T S
5. LOSS FROM OPERATIONS
2002 2001
US$ US$
Loss from operations is arrived at after charging:
Amortisation of intellectual properties 11,989 21,917Auditors’ remuneration 98,578 247,590Fair value adjustment on trading investments 114,782 83,503Depreciation:– owned assets 1,116,209 2,103,299– assets under finance leases 6,652 10,646Interest expenses 840 111,674Loss on disposal of a subsidiary 1,201 –Loss on disposal of associates and investments 16,239 34,803Loss on disposal of property, plant and equipment 52,280 269,818Operating leases in respect of rented premises 1,107,461 1,578,608Provident fund contribution 57,208 54,000Provision for doubtful debts 909,816 1,745,017Staff costs (excluding directors’ remuneration) 9,444,196 12,844,369
6. DISPOSAL OF SUBSIDIARIES AND DISCONTINUING OPERATIONS
During the year, the board of directors of one of the Company’s subsidiaries, Spike Limited was put intoliquidation. Spike Limited’s subsidiaries included Spike (Australia) Pty Limited, Spike (Hong Kong) Limited,Spike (Singapore) Pte Limited and Spike (Japan) Limited (the “Spike Group”). The directors consider that theGroup’s control over the Spike Group effectively ceased on 30 June 2002. The disposal constituted adiscontinuance of provision of digital services.
The results of the Spike Group for the period from 1 January 2002 to the date of disposal of 30 June 2002, whichhave been included in the consolidated income statement, were as follows:
1 January 2002to Year ended
30 June 2002 31 December 2001
US$ US$
Revenue 2,520,027 6,176,019Operating expenses (8,743,644) (16,539,083)
Loss before tax (6,223,617) (10,363,064)Taxation – –
Net loss (6,223,617) (10,363,064)

For the year ended 31 December 2002
P.N O T E S T O T H E F I N A N C I A L S T A T E M E N T S
N O T E S T O T H E F I N A N C I A L S T A T E M E N T S
6. DISPOSAL OF SUBSIDIARIES AND DISCONTINUING OPERATIONS (continued)
The assets and liabilities of the Spike Group as at the date of disposal of 30 June 2002 are as follows:
30 June 2002 31 December 2001
US$ US$
Non-current assets 1,216,375 1,691,982Current assets 1,560,559 2,063,440Current liabilities (3,780,667) (1,648,049)Non-current liabilities (12,518,959) (8,721,916)
Net liabilities (13,522,692) (6,614,543)
The profit on disposal of the Spike Group is as follows:
US$
Net liabilities of the Spike Group upon disposal 13,522,692Minority interests (232,690)Closure costs (391,663)Write-off of loan to the Spike Group (11,338,976)Exchange reserve (796,522)
Profit on disposal of the Spike Group 762,841
7. TAXATION
2002 2001
US$ US$
Current taxOverseas tax (978) –
Deferred taxHong Kong profits tax – overprovision in prior years written back 26,000 –
25,022 –
No Hong Kong profits tax has been provided in the financial statements as the Group did not make any assessableprofit for the year. Taxation for other jurisdictions is calculated at the rates prevailing in the respectivejurisdictions.
No recognition of potential deferred tax assets relating to tax losses of the Group has been made as therecoverability of the potential tax assets is uncertain.
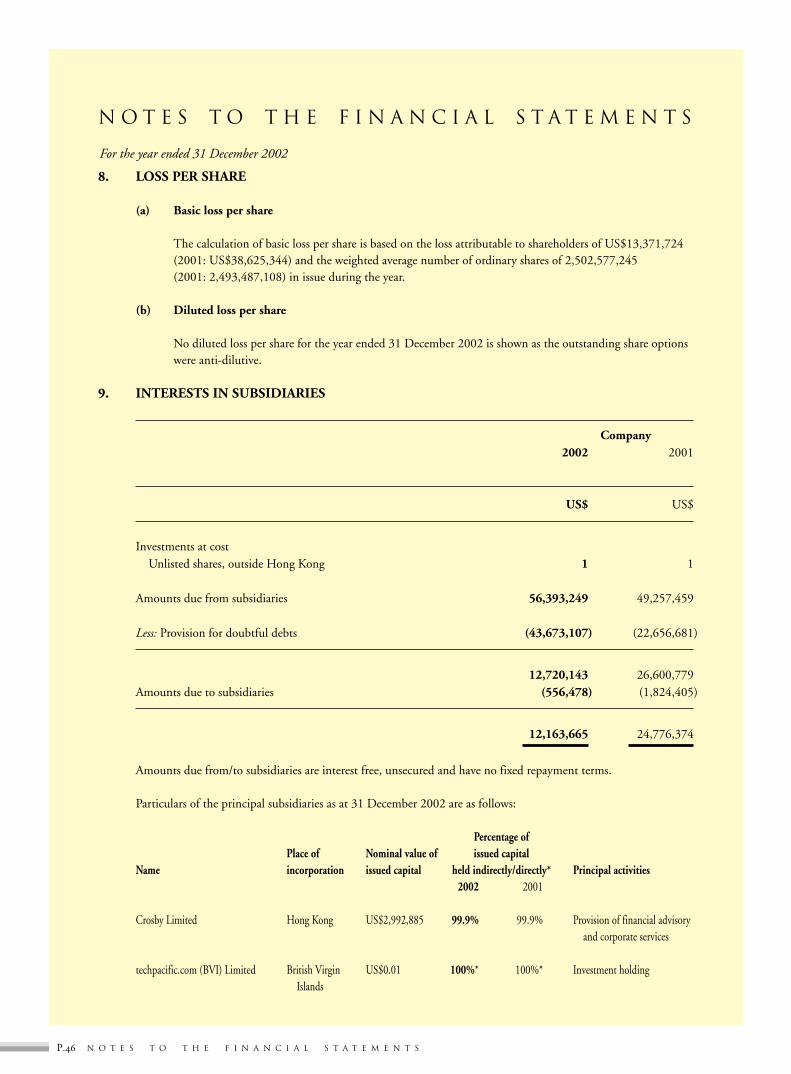
N O T E S T O T H E F I N A N C I A L S T A T E M E N T S
For the year ended 31 December 2002
P. N O T E S T O T H E F I N A N C I A L S T A T E M E N T S
8. LOSS PER SHARE
(a) Basic loss per share
The calculation of basic loss per share is based on the loss attributable to shareholders of US$13,371,724(2001: US$38,625,344) and the weighted average number of ordinary shares of 2,502,577,245(2001: 2,493,487,108) in issue during the year.
(b) Diluted loss per share
No diluted loss per share for the year ended 31 December 2002 is shown as the outstanding share optionswere anti-dilutive.
9. INTERESTS IN SUBSIDIARIES
Company2002 2001
US$ US$
Investments at costUnlisted shares, outside Hong Kong 1 1
Amounts due from subsidiaries 56,393,249 49,257,459
Less: Provision for doubtful debts (43,673,107) (22,656,681)
12,720,143 26,600,779Amounts due to subsidiaries (556,478) (1,824,405)
12,163,665 24,776,374
Amounts due from/to subsidiaries are interest free, unsecured and have no fixed repayment terms.
Particulars of the principal subsidiaries as at 31 December 2002 are as follows:
Percentage ofPlace of Nominal value of issued capital
Name incorporation issued capital held indirectly/directly* Principal activities2002 2001
Crosby Limited Hong Kong US$2,992,885 99.9% 99.9% Provision of financial advisoryand corporate services
techpacific.com (BVI) Limited British Virgin US$0.01 100%* 100%* Investment holdingIslands
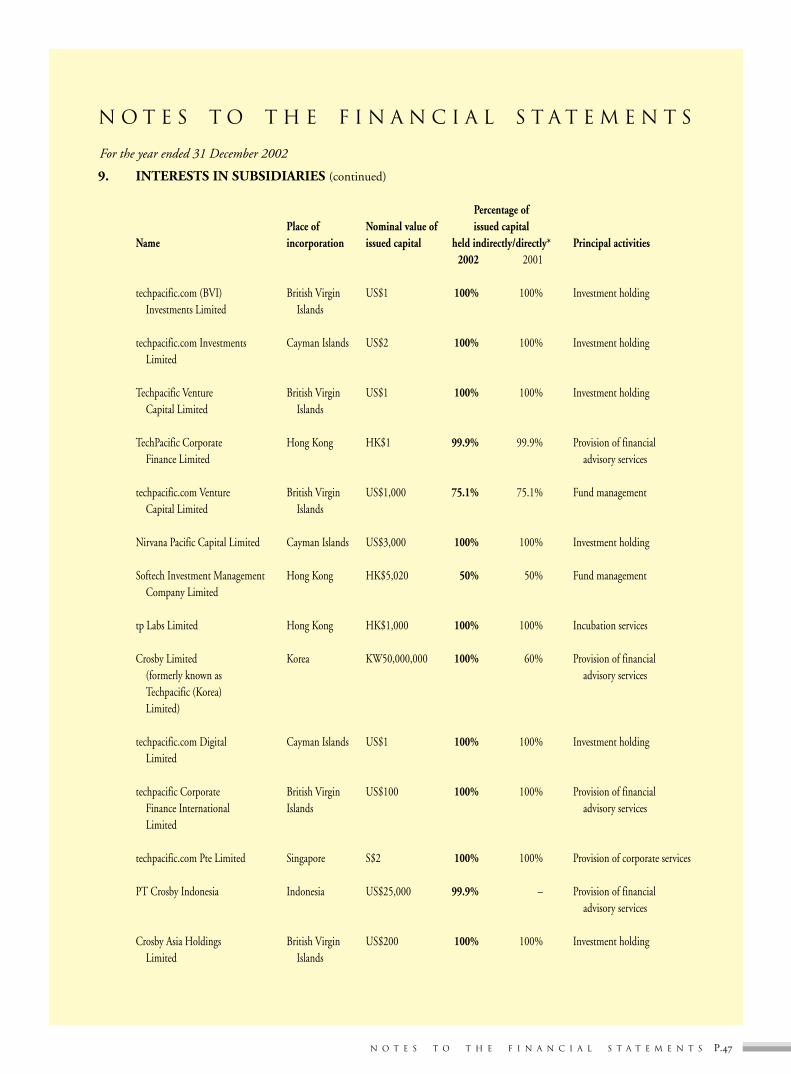
For the year ended 31 December 2002
P.N O T E S T O T H E F I N A N C I A L S T A T E M E N T S
N O T E S T O T H E F I N A N C I A L S T A T E M E N T S
9. INTERESTS IN SUBSIDIARIES (continued)
Percentage ofPlace of Nominal value of issued capital
Name incorporation issued capital held indirectly/directly* Principal activities2002 2001
techpacific.com (BVI) British Virgin US$1 100% 100% Investment holdingInvestments Limited Islands
techpacific.com Investments Cayman Islands US$2 100% 100% Investment holdingLimited
Techpacific Venture British Virgin US$1 100% 100% Investment holdingCapital Limited Islands
TechPacific Corporate Hong Kong HK$1 99.9% 99.9% Provision of financialFinance Limited advisory services
techpacific.com Venture British Virgin US$1,000 75.1% 75.1% Fund managementCapital Limited Islands
Nirvana Pacific Capital Limited Cayman Islands US$3,000 100% 100% Investment holding
Softech Investment Management Hong Kong HK$5,020 50% 50% Fund managementCompany Limited
tp Labs Limited Hong Kong HK$1,000 100% 100% Incubation services
Crosby Limited Korea KW50,000,000 100% 60% Provision of financial(formerly known as advisory servicesTechpacific (Korea)Limited)
techpacific.com Digital Cayman Islands US$1 100% 100% Investment holdingLimited
techpacific Corporate British Virgin US$100 100% 100% Provision of financialFinance International Islands advisory servicesLimited
techpacific.com Pte Limited Singapore S$2 100% 100% Provision of corporate services
PT Crosby Indonesia Indonesia US$25,000 99.9% – Provision of financialadvisory services
Crosby Asia Holdings British Virgin US$200 100% 100% Investment holdingLimited Islands

N O T E S T O T H E F I N A N C I A L S T A T E M E N T S
For the year ended 31 December 2002
P. N O T E S T O T H E F I N A N C I A L S T A T E M E N T S
9. INTERESTS IN SUBSIDIARIES (continued)
Percentage ofPlace of Nominal value of issued capital
Name incorporation issued capital held indirectly/directly* Principal activities2002 2001
Crosby Asset Management Hong Kong HK$1,002 100% 100% Provision of investment(Hong Kong) Limited advisory and fund
administration services
Crosby Advisory (Singapore) Singapore S$12,560,000 95% 95% Provision of financialPte Limited advisory services
10. PROPERTY, PLANT AND EQUIPMENT
Group
Computerhardware Furniture Leasehold Motor Office
and software and fixtures improvements vehicles equipment Total
US$ US$ US$ US$ US$ US$
CostAt 1 January 2002 3,497,574 596,515 1,431,596 131,846 310,105 5,967,636Additions 41,057 21,224 27,454 45,236 10,890 145,861Disposals (390,479) (10,289) (70,748) (8,244) (18,057) (497,817)Disposal of subsidiaries (3,241,048) (377,255) (1,030,068) (67,728) (133,116) (4,849,215)Exchange adjustments 271,572 36,123 101,908 7,049 13,720 430,372
At 31 December 2002 178,676 266,318 460,142 108,159 183,542 1,196,837
Accumulated depreciationand impairmentAt 1 January 2002 2,784,381 193,831 355,047 42,252 120,613 3,496,124Charge for the year 571,141 84,812 366,592 27,674 72,642 1,122,861Disposals (362,338) (2,687) (17,601) – (5,885) (388,511)Disposal of subsidiaries (3,065,214) (169,572) (372,460) (15,802) (58,337) (3,681,385)Exchange adjustments 211,153 12,826 28,625 976 4,287 257,867
At 31 December 2002 139,123 119,210 360,203 55,100 133,320 806,956
Net book valueAt 31 December 2002 39,553 147,108 99,939 53,059 50,222 389,881
At 31 December 2001 713,193 402,684 1,076,549 89,594 189,492 2,471,512
Included in motor vehicles above is a motor vehicle with a net book value of US$38,584 (2001: US$59,387) heldunder a finance lease.

For the year ended 31 December 2002
P.N O T E S T O T H E F I N A N C I A L S T A T E M E N T S
N O T E S T O T H E F I N A N C I A L S T A T E M E N T S
11. INTERESTS IN ASSOCIATES
Group2002 2001
Notes US$ US$
Share of net liabilities other than goodwill (164,153) (174,919)Premium on acquisition 559,498 569,123
395,345 394,204Less: Provision for impairment (377,657) (311,400)
(a) 17,688 82,804Investments at cost less provision for impairment (b) – 392,138
17,688 474,942Amounts due from associates (Note 15) 13,292 76,401Amount due to an associate (30,980) –
– 551,343
(a) Particulars of those associates that are accounted for under the equity method, at 31 December 2002, areas follows:
Percentage ofPlace of issued capital
Name incorporation held indirectly Principal activities2002 2001
Henderson Baillieu Limited Cayman Islands 40% 40% Executive search(Formerly known asTechpursuit.comHoldings Limited)
Upstream Asia Limited British Virgin Islands 27.05% 32.48% Technologymarketingand promotion

N O T E S T O T H E F I N A N C I A L S T A T E M E N T S
For the year ended 31 December 2002
P. N O T E S T O T H E F I N A N C I A L S T A T E M E N T S
11. INTERESTS IN ASSOCIATES (continued)
(b) Investments in those associates that are acquired and held exclusively with a view to their disposal in thenear future are accounted for at cost, as reduced by any impairment losses recognized. The particulars ofsuch associates as at 31 December 2002 are as follows:
Percentage ofPlace of issued capital
Name incorporation held indirectly Principal activities2002 2001
Asset Publishing and British Virgin Islands 34.6% 34.6% Research andResearch Asia Limited magazine
publishing
OpenIBN Technology British Virgin Islands 30% 30% Provision ofHoldings Limited corporate fund
raising services
12. AVAILABLE-FOR-SALE INVESTMENTS
Group2002 2001
US$ US$
Unlisted investmentsConvertible bonds and loans 93,939 657,573Convertible preference shares 2,277,661 2,229,608Debenture 71,795 –Ordinary shares, at cost 7,724,291 8,930,342
10,167,686 11,817,523Less: Provision for impairment (10,095,848) (9,796,740)
71,838 2,020,783
Listed investmentsOrdinary shares, at fair value 136,083 293,214
207,921 2,313,997

For the year ended 31 December 2002
P.N O T E S T O T H E F I N A N C I A L S T A T E M E N T S
N O T E S T O T H E F I N A N C I A L S T A T E M E N T S
13. INTANGIBLE ASSETS
Group
IntellectualGoodwill properties Total
US$ US$ US$
CostAt 1 January 2002 6,056,064 183,042 6,239,106Acquisition of additional interest in a subsidiary 64,487 – 64,487Disposal of subsidiaries (5,626,824) (183,042) (5,809,866)
At 31 December 2002 493,727 – 493,727
Accumulated amortisation and impairmentAt 1 January 2002 5,642,324 123,232 5,765,556Amortisation for the year 159,202 11,989 171,191Disposal of subsidiaries (5,626,824) (135,221) (5,762,045)
At 31 December 2002 174,702 – 174,702
Net book valueAt 31 December 2002 319,025 – 319,025
At 31 December 2001 413,740 59,810 473,550
14. LOAN TO AND CURRENT ACCOUNTS WITH INVESTEE COMPANIES/AMOUNT DUEFROM A RELATED COMPANY
Included in the balances in the consolidated balance sheet and the Company balance sheet are US$178,956(2001: US$588,513) and US$7,406 (2001: US$33,159) respectively due from Nirvana Capital Limitedwhich is a fund managed by the Group and in which the Group has an investment of US$0.6 million(2001:US$1 million). The unsecured amount due from Nirvana Capital Limited have no fixed terms ofrepayment and are interest free.
The remaining balances represent advances to other investee companies which are interest free, unsecured andhave no fixed terms of repayment.
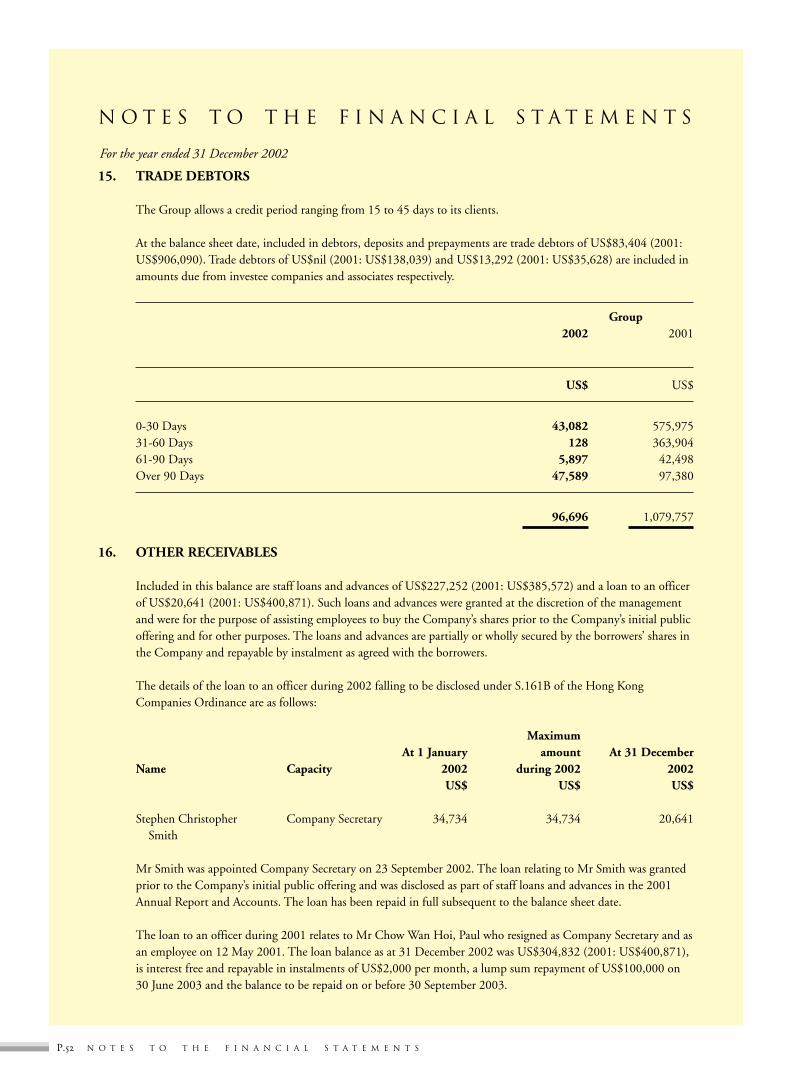
N O T E S T O T H E F I N A N C I A L S T A T E M E N T S
For the year ended 31 December 2002
P. N O T E S T O T H E F I N A N C I A L S T A T E M E N T S
15. TRADE DEBTORS
The Group allows a credit period ranging from 15 to 45 days to its clients.
At the balance sheet date, included in debtors, deposits and prepayments are trade debtors of US$83,404 (2001:US$906,090). Trade debtors of US$nil (2001: US$138,039) and US$13,292 (2001: US$35,628) are included inamounts due from investee companies and associates respectively.
Group2002 2001
US$ US$
0-30 Days 43,082 575,97531-60 Days 128 363,90461-90 Days 5,897 42,498Over 90 Days 47,589 97,380
96,696 1,079,757
16. OTHER RECEIVABLES
Included in this balance are staff loans and advances of US$227,252 (2001: US$385,572) and a loan to an officerof US$20,641 (2001: US$400,871). Such loans and advances were granted at the discretion of the managementand were for the purpose of assisting employees to buy the Company’s shares prior to the Company’s initial publicoffering and for other purposes. The loans and advances are partially or wholly secured by the borrowers’ shares inthe Company and repayable by instalment as agreed with the borrowers.
The details of the loan to an officer during 2002 falling to be disclosed under S.161B of the Hong KongCompanies Ordinance are as follows:
MaximumAt 1 January amount At 31 December
Name Capacity 2002 during 2002 2002US$ US$ US$
Stephen Christopher Company Secretary 34,734 34,734 20,641Smith
Mr Smith was appointed Company Secretary on 23 September 2002. The loan relating to Mr Smith was grantedprior to the Company’s initial public offering and was disclosed as part of staff loans and advances in the 2001Annual Report and Accounts. The loan has been repaid in full subsequent to the balance sheet date.
The loan to an officer during 2001 relates to Mr Chow Wan Hoi, Paul who resigned as Company Secretary and asan employee on 12 May 2001. The loan balance as at 31 December 2002 was US$304,832 (2001: US$400,871),is interest free and repayable in instalments of US$2,000 per month, a lump sum repayment of US$100,000 on30 June 2003 and the balance to be repaid on or before 30 September 2003.

For the year ended 31 December 2002
P.N O T E S T O T H E F I N A N C I A L S T A T E M E N T S
N O T E S T O T H E F I N A N C I A L S T A T E M E N T S
16. OTHER RECEIVABLES (continued)
In addition to several of the monthly instalments due in 2002 not being made, a US$100,000 repaymentscheduled for 30 September 2002 was not received until after the balance sheet date. The loan is therefore viewedas impaired and a US$202,588 provision has been made to reduce the net carrying value of Mr Chow’s loan to theamount the Company is highly assured to recover. The Company holds 500,000 of Mr Chow’s shares in theCompany as security. An amount of US$102,244 is included in other receivables as at 31 December 2002.
17. TRADING INVESTMENTS
Group2002 2001
US$ US$
Listed investmentsOrdinary shares, at fair value
Hong Kong 174,387 –Overseas – 246,313
174,387 246,313
18. OBLIGATIONS UNDER FINANCE LEASES
(a) Finance lease liabilities - minimum lease payments:
Group2002 2001
US$ US$
Due within one year 23,340 45,102Due in the second to fifth years 9,725 35,012
33,065 80,114Future finance charges on finance leases (1,646) (5,990)
Present value of finance lease liabilities 31,419 74,124

N O T E S T O T H E F I N A N C I A L S T A T E M E N T S
For the year ended 31 December 2002
P. N O T E S T O T H E F I N A N C I A L S T A T E M E N T S
18. OBLIGATIONS UNDER FINANCE LEASES (continued)
(b) The present value of finance lease liabilities is as follows:
Group2002 2001
US$ US$
Due within one year 21,855 40,952Due in the second to fifth years 9,564 33,172
31,419 74,124
19. SHARE CAPITAL
Company
Number ofconvertible
Number of redeemableordinary shares preference shares Value
US$
Authorized (par value of US$0.001 each) 20,000,000,000 1,000,000 20,001,000
Issued and fully paid (par value of US$0.001 each)
At 31 December 2001 and31 December 2002 2,502,577,245 – 2,502,577
There was no change in the authorised share capital during the two years ended 31 December 2001 and 2002.
20. RESERVES
Group2002 2001
US$ US$
Share premium 52,209,444 52,209,444Capital reserve 9,228,125 9,228,193Capital redemption reserve 11,270 11,270Investment revaluation reserve 124,691 (113,200)Foreign exchange reserve (108,909) (469,820)Accumulated losses (51,019,401) (37,647,677)
10,445,220 23,218,210

For the year ended 31 December 2002
P.N O T E S T O T H E F I N A N C I A L S T A T E M E N T S
N O T E S T O T H E F I N A N C I A L S T A T E M E N T S
20. RESERVES (continued)
Company
RetainedCapital profits/
Share redemption Capital (Accumulatedpremium reserve reserve losses) Total
US$ US$ US$ US$ US$
At 1 January 2001 52,444,245 – – 1,175,597 53,619,842
Issue of new shares for the acquisitionof a subsidiary, net – – 4,639,099 – 4,639,099
Repurchase of own shares (234,801) 11,270 – (11,270) (234,801)Loss for the year – – – (22,573,874) (22,573,874)
At 31 December 2001 and1 January 2002 52,209,444 11,270 4,639,099 (21,409,547) 35,450,266
Loss for the year – – – (21,458,119) (21,458,119)
At 31 December 2002 52,209,444 11,270 4,639,099 (42,867,666) 13,992,147
In the opinion of the Company’s directors, the Company’s reserves available for distribution to shareholders wereas follows:
2002 2001
US$ US$
Accumulated losses (42,867,666) (21,409,547)Capital reserve 4,639,099 4,639,099Share premium 52,209,444 52,209,444
13,980,877 35,438,996

N O T E S T O T H E F I N A N C I A L S T A T E M E N T S
For the year ended 31 December 2002
P. N O T E S T O T H E F I N A N C I A L S T A T E M E N T S
21. NOTES TO THE CONSOLIDATED CASH FLOW STATEMENT
(a) Reconciliation of loss before taxation to net cash outflow from operating activities:
2002 2001
US$ US$
Cash flows from operating activitiesLoss before taxation and minority interests (13,338,686) (42,551,674)Share of losses of associates 23,444 389,478Interest income (216,798) (1,142,173)Interest expenses 840 111,674Tax paid (1,151) –Depreciation of property, plant and equipment 1,122,861 2,113,945Amortisation of intellectual properties 11,989 21,917Loss on disposal of property, plant and equipment 52,280 269,818Write off of property, plant and equipment – 639,987Provision for impairment of property, plant and equipment – 342,285Provision for impairment of other assets 18,231 –Profit on disposal of associates and investments (1,239,920) (30,399)Loss on disposal of a subsidiary, associates and investments 17,440 34,803Profit on disposal of subsidiaries (762,841) (163,810)Fair value adjustment in trading investments 114,782 83,503Provision for impairment of investments 2,312,338 19,587,214Provision for impairment of goodwill – 3,936,226Amortisation of goodwill 159,202 1,706,098Bad debts recovery (53,887) –Provision for doubtful debts 909,816 1,745,017Decrease in other receivables 180,909 228,353Decrease in amount due from an associate 63,109 –Decrease/(Increase) in work-in-progress 43,661 (482,590)Increase in debtors, deposits and prepayments (212,352) (151,515)Increase in tax recoverable (5,470) –Increase in creditors and accrued charges 1,363,073 799,039Increase/(Decrease) in deferred income 401,402 (953,047)Increase in amount due to an associate 30,980 –Decrease in amount due to minority shareholder (62,189) (4,873)
Net cash outflow from operating activities (9,066,937) (13,470,724)
(b) Disposal of subsidiaries
US$
Net cash outflow arising on disposal:
Cash consideration 2,109Cash and bank balances disposed of (239,632)
(237,523)
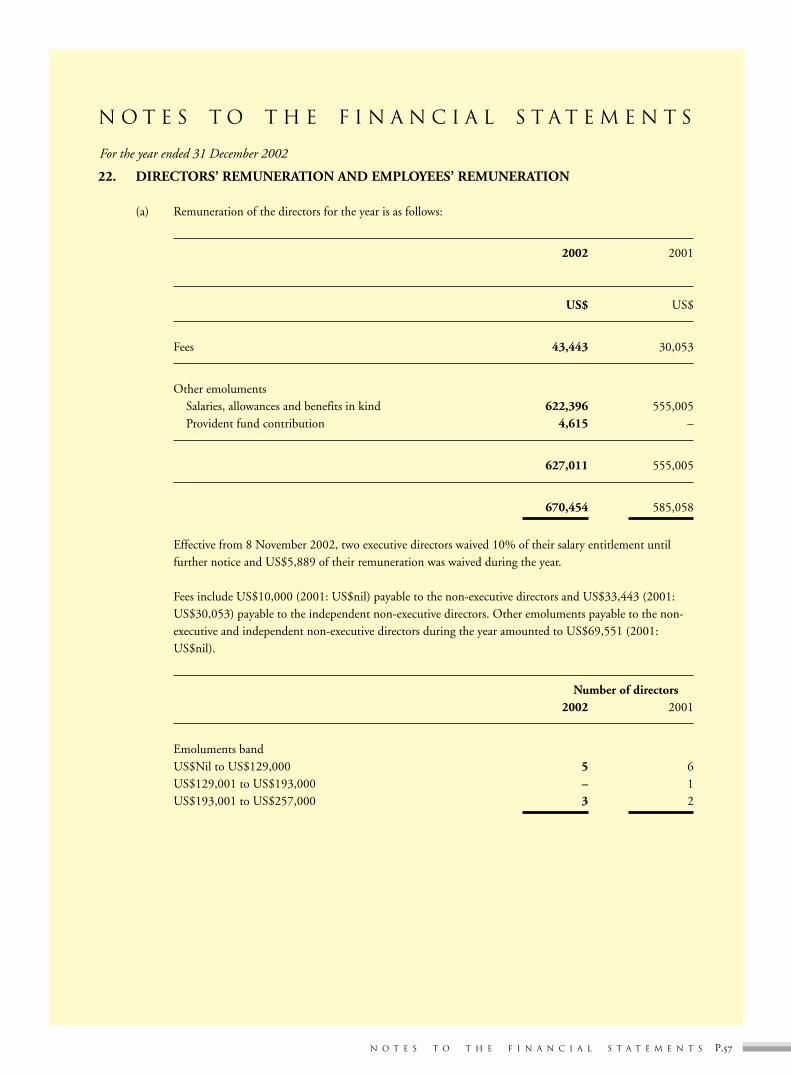
For the year ended 31 December 2002
P.N O T E S T O T H E F I N A N C I A L S T A T E M E N T S
N O T E S T O T H E F I N A N C I A L S T A T E M E N T S
22. DIRECTORS’ REMUNERATION AND EMPLOYEES’ REMUNERATION
(a) Remuneration of the directors for the year is as follows:
2002 2001
US$ US$
Fees 43,443 30,053
Other emolumentsSalaries, allowances and benefits in kind 622,396 555,005Provident fund contribution 4,615 –
627,011 555,005
670,454 585,058
Effective from 8 November 2002, two executive directors waived 10% of their salary entitlement untilfurther notice and US$5,889 of their remuneration was waived during the year.
Fees include US$10,000 (2001: US$nil) payable to the non-executive directors and US$33,443 (2001:US$30,053) payable to the independent non-executive directors. Other emoluments payable to the non-executive and independent non-executive directors during the year amounted to US$69,551 (2001:US$nil).
Number of directors2002 2001
Emoluments bandUS$Nil to US$129,000 5 6US$129,001 to US$193,000 – 1US$193,001 to US$257,000 3 2

N O T E S T O T H E F I N A N C I A L S T A T E M E N T S
For the year ended 31 December 2002
P. N O T E S T O T H E F I N A N C I A L S T A T E M E N T S
22. DIRECTORS’ REMUNERATION AND EMPLOYEES’ REMUNERATION (continued)
(b) Details of emoluments paid to the five highest paid individuals are as follows:
2002 2001
US$ US$
Salaries, allowances and benefits in kind 814,198 883,404Bonus paid and payable 450,000 375,000Provident fund contribution 3,975 –Compensation paid and payable 83,333 –
1,351,506 1,258,404
Number of directors 1 1Number of employees 4 4
Number of individuals2002 2001
Emoluments bandUS$193,001 to US$257,000 2 4US$257,001 to US$321,000 3 –US$321,001 to US$385,000 – 1

For the year ended 31 December 2002
P.N O T E S T O T H E F I N A N C I A L S T A T E M E N T S
N O T E S T O T H E F I N A N C I A L S T A T E M E N T S
23. FINANCIAL INSTRUMENTS
Financial instruments of the Group include various investments, loans and receivables, cash and bank balances,creditors and other payables.
(a) Credit risks
Cash and bank balances
The Group’s bank balances were mainly with leading banks in Hong Kong.
Loans and other receivables
The Group does not have a significant exposure to any individual client or counterparty. The majorconcentration of credit risk arises from exposure to a number of debtors operating in various regions inAsia.
(b) Fair values
The fair values of the Group’s financial assets and liabilities are not materially different from their carryingamounts.
24. EQUITY COMPENSATION BENEFITS
On 27 March 2002, the Pre-IPO Share Option Plan (as approved by the shareholders of Crosby Limited on2 July 1999 and novated to the Company on 28 March 2000) and the Old Share Option Plan (adopted by theCompany on 3 April 2000) were terminated, all options granted under those schemes were cancelled and a NewShare Option Scheme was adopted.
As at 31 December 2002, options to subscribe for an aggregate of 167,200,000 ordinary shares of US$0.001 eachin the Company were outstanding pursuant to the New Share Option Scheme. The options were granted inexchange for the options cancelled under the old schemes and no further consideration was paid by the employeeson acceptance of the grant of the new options.
Pursuant to the Company’s New Share Option Scheme, a duly authorised committee of the board of directors ofthe Company may, at its discretion, grant options to eligible employees, including executive directors, of theCompany or any of its subsidiaries to subscribe for shares in the Company at a price not less than the closing priceof the shares of the Company on the Exchange on the date of grant of the particular option or the average of theclosing prices of the shares of the Company for the five trading days immediately preceding the date of grant ofthe options or the nominal value of the shares, whichever is the higher.
In accordance with Note 2 of Rule 23.03(3) of the GEM Listing Rules, the number of shares in respect of whichoptions may be granted under the New Share Option Scheme shall not exceed 30% of the shares of the Companyin issue from time to time.

N O T E S T O T H E F I N A N C I A L S T A T E M E N T S
For the year ended 31 December 2002
P. N O T E S T O T H E F I N A N C I A L S T A T E M E N T S
24. EQUITY COMPENSATION BENEFITS (continued)
The total number of shares available for issue under options granted pursuant to the New Share Option Schememust not in aggregate exceed 10 percent of the total number of shares in issue as at the date of approval of theNew Share Option Scheme (the “Scheme Mandate Limit”), unless shareholders’ approval has been obtained.Options lapsed in accordance with the terms of the New Share Option Scheme shall not be counted for thepurpose of calculating the Scheme Mandate Limit.
The total number of the shares issued and to be issued upon exercise of options granted (whether or not cancelled)and to be granted under the New Share Option Scheme to any eligible person (including both exercised andoutstanding options) in any 12-month period up to the date of grant to such eligible person shall not exceed 1percent of the issued shares from time to time (the “1 percent Limit”). Any grant of options in excess of the 1percent Limit is subject to shareholders’ approval with that eligible person and his Associates (as defined in theGEM Listing Rules) abstaining from voting.
An option may be exercised in accordance with the terms of the New Share Option Scheme at any time during aperiod (which shall not be less than one year and not more than ten years) as notified to each grantee. Optionsgranted under the New Share Option Scheme are exercisable as follows:
(a) the first thirty percent of the options commencing on the first anniversary of the date of grant;
(b) the next thirty percent of the options commencing on the second anniversary of the date of grant; and
(c) the remaining options commencing on the third anniversary of the date of grant.
Movements of the share options granted under the Pre-IPO Share Option Plan and the Old Share Option Planduring the year were as follows:
Exercise priceOptions outstanding HK$0.19 HK$0.20 HK$0.47 HK$1.05
At 1 January 2002 138,304,014 94,006,330 187,157,925 68,148,255Lapsed during the period to
27 March 2002 (138,304,014) (94,006,330) (187,157,925) (68,148,255)
At 31 December 2002 – – – –

For the year ended 31 December 2002
P.N O T E S T O T H E F I N A N C I A L S T A T E M E N T S
N O T E S T O T H E F I N A N C I A L S T A T E M E N T S
24. EQUITY COMPENSATION BENEFITS (continued)
Movements of the share options granted under the New Share Option Scheme during the year are as follows:
Exercise priceOptions outstanding HK$0.0704
Options granted during March 2002 248,244,700Lapsed during the year (81,044,700)
At 31 December 2002 167,200,000
25. COMMITMENTS
(a) At 31 December 2002, the total future minimum lease payments of the Group and the Company undernon-cancellable operating leases are payable as follows:
Group Group2002 2001
Properties Others Properties Others
US$ US$ US$ US$
Within one year 355,134 – 1,237,196 304,003In the second to fifth years 18,241 – 1,696,089 207,383
373,375 – 2,933,285 511,386
The Group leases a number of properties under operating leases in Hong Kong and overseas. The majorityof the leases will expire within one year of the balance sheet date. None of the leases includes contingentrentals.
The Company had no commitments under non-cancellable operating leases.

N O T E S T O T H E F I N A N C I A L S T A T E M E N T S
For the year ended 31 December 2002
P. N O T E S T O T H E F I N A N C I A L S T A T E M E N T S
25. COMMITMENTS (continued)
(b) At 31 December 2002, details of the Group’s capital commitments are as follows:
Group2002 2001
US$ US$
Contracted but not provided for 119,000 –
The Company had no capital commitment as at 31 December 2002.
26. RELATED PARTY TRANSACTIONS
Identity of related parties:
The Group has a related party relationship with its directors and executive officers, and with certain investeecompanies.
During the year, the Group had the following related party transactions:
2002 2001
US$ US$
Advertising and marketing expenses to an associate (38,230) (44,525)Corporate finance and other advisory fees from investee companies 170,000 130,947Consultancy and technical support fees paid to shareholder of
a subsidiary (81,251) (128,000)Fund management fee income from an investee company 420,098 531,169Incubation services income from an associate 53,865 139,263Investments made by an investee company on behalf of the Group
(held in the name of the investee company) (182,876) (495,461)Sales proceeds of investment received by an investee company
on behalf of the Group 93,721 –

For the year ended 31 December 2002
P.N O T E S T O T H E F I N A N C I A L S T A T E M E N T S
N O T E S T O T H E F I N A N C I A L S T A T E M E N T S
27. CONTINGENCIES
The Group and the Company had no material contingent liabilities at the balance sheet date.
28. COMPARATIVE FIGURES
Certain comparative figures have been reclassified to conform with the current year’s presentation.
29. APPROVAL OF THE FINANCIAL STATEMENTS
The financial statements were approved by the Board of Directors on 20 March 2003.
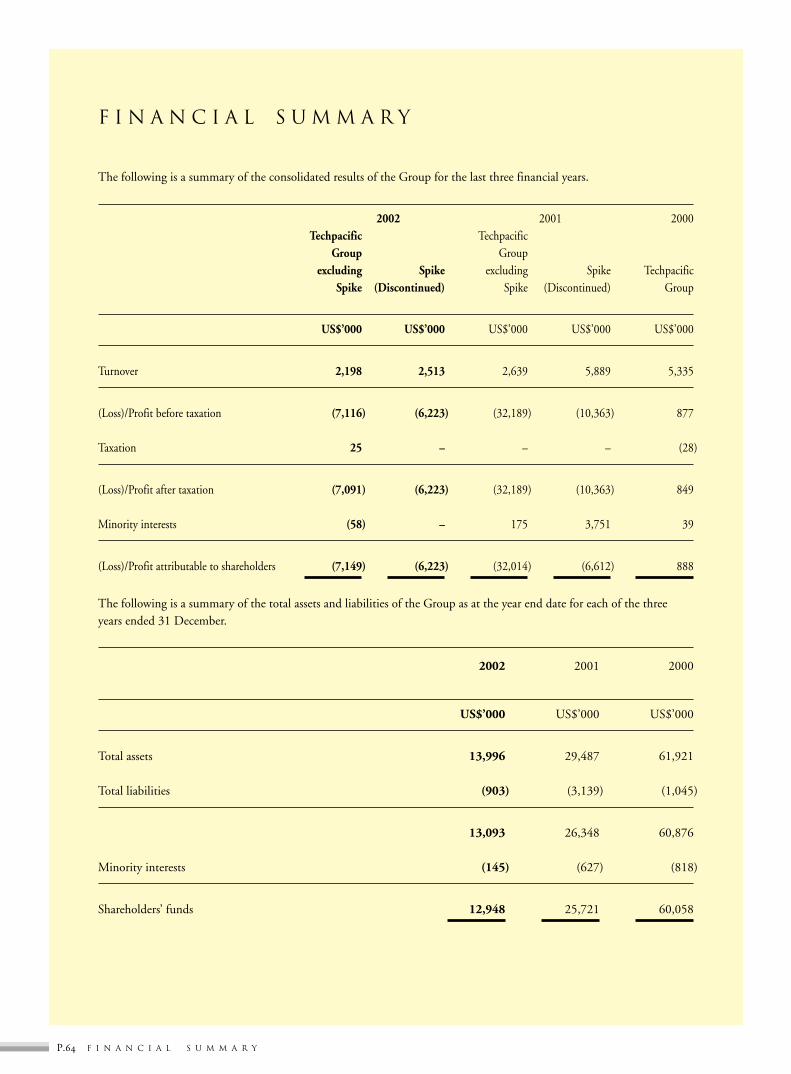
F I N A N C I A L S U M M A R Y
P. F I N A N C I A L S U M M A R Y
The following is a summary of the consolidated results of the Group for the last three financial years.
2002 2001 2000Techpacific Techpacific
Group Groupexcluding Spike excluding Spike Techpacific
Spike (Discontinued) Spike (Discontinued) Group
US$’000 US$’000 US$’000 US$’000 US$’000
Turnover 2,198 2,513 2,639 5,889 5,335
(Loss)/Profit before taxation (7,116) (6,223) (32,189) (10,363) 877
Taxation 25 – – – (28)
(Loss)/Profit after taxation (7,091) (6,223) (32,189) (10,363) 849
Minority interests (58) – 175 3,751 39
(Loss)/Profit attributable to shareholders (7,149) (6,223) (32,014) (6,612) 888
The following is a summary of the total assets and liabilities of the Group as at the year end date for each of the threeyears ended 31 December.
2002 2001 2000
US$’000 US$’000 US$’000
Total assets 13,996 29,487 61,921
Total liabilities (903) (3,139) (1,045)
13,093 26,348 60,876
Minority interests (145) (627) (818)
Shareholders’ funds 12,948 25,721 60,058