
TECHNICAL BASIS FOR THE ITER FINAL DESIGN REPORT ...
664
XA9948987 ITER EDA DOCUMENTATION SERIES No. 16 TECHNICAL BASIS FOR THE ITER FINAL DESIGN REPORT, COST REVIEW AND SAFETY ANALYSIS (FDR) 30-04 INTERNATIONAL ATOMIC ENERGY AGENCY, VIENNA, 1998
-
Upload
khangminh22 -
Category
Documents
-
view
2 -
download
0
Transcript of TECHNICAL BASIS FOR THE ITER FINAL DESIGN REPORT ...

XA9948987 ITER EDA DOCUMENTATION SERIES No. 16
TECHNICAL BASIS FOR THEITER FINAL DESIGN REPORT,COST REVIEW AND SAFETY ANALYSIS(FDR)
30 -04
INTERNATIONAL ATOMIC ENERGY AGENCY, VIENNA, 1998

ITER

ITER EDA DOCUMENTATION SERIES No. 16
International Thermonuclear Experimental Reactor(ITER)
Engineering Design Activities(EDA)
TECHNICAL BASIS FOR THEITER FINAL DESIGN REPORT,
COST REVIEW AND SAFETY ANALYSIS(FDR)
INTERNATIONAL ATOMIC ENERGY AGENCY, VIENNA, 1998

TECHNICAL BASIS FOR THEITER FINAL DESIGN REPORT,
COST REVIEW AND SAFETY ANALYSIS(FDR)
IAEA, VIENNA, 1998IAEA/ITER EDA/DS/16
Printed by the IAEA in ViennaDecember 1998

FOREWORD
Development of nuclear fusion as a practical energy source couldprovide great benefits. This fact has been widely recognized and fusion research hasenjoyed a high level of international co-operation. Since early in its history, theInternational Atomic Energy Agency has actively promoted the internationalexchange of fusion information.
In this context, the IAEA responded in 1986 to calls at summit level forexpansion of international co-operation in fusion energy development. At the invita-tion of the Director General there was a series of meetings in Vienna during 1987, atwhich representatives of the world's four major fusion programmes developed adetailed proposal for co-operation on the International Thermonuclear ExperimentalReactor (ITER) Conceptual Design Activities (CDA). The Director General theninvited each interested Party to co-operate in the CDA in accordance with the Termsof Reference that had been worked out. All four Parties accepted this invitation.
The ITER CDA, under the auspices of the IAEA, began in April 1988and were successfully completed in December 1990. The information producedwithin the CDA has been made available for the ITER Parties and IAEA MemberStates to use either in their own programmes or as part of an international collabora-tion.
After completing the CDA, the ITER Parties entered into a series ofconsultations on how ITER should proceed further, resulting in the signing of theITER EDA (Engineering Design Activities) Agreement and Protocol 1 on July 21,1992 in Washington by representatives of the four Parties. The Agreement enteredinto force upon signature of the Parties, with the EDA conducted under the auspicesof the IAEA. Protocol 1 expired on March 21, 1994. On this very day representativesof the ITER Parties signed in Vienna Protocol 2, which entered into force upon signa-ture. This Protocol covers the remaining part of the EDA.
As part of its support of ITER, the IAEA is pleased to publish the docu-ments summarizing the results of the Engineering Design Activities.

INTERNATIONAL THERMONUCLEAR EXPERIMENTAL REACTOR
Wai
TECHNICAL BASISFOR THE
ITER FINAL DESIGN REPORT, COSTREVIEW AND SAFETY ANALYSIS
(FDR)
13 July 1998

TECHNICAL BASISFOR THE
ITER FINAL DESIGN REPORT, COST REVIEWAND SAFETY ANALYSIS (FDR)
CHAPTER I:
CHAPTER II:
CHAPTER III:
CHAPTER IV:
INTRODUCTION1.0 Introduction
ITER PLANT DESIGN DESCRIPTION (IPDD)1.02.03.04.0
5.06.07.0
IntroductionITER Plant Control & OperationITER Plant Layout and BuildingsSummary of System Design4.1 Vacuum Vessel and In-Vessel Components4.2 Magnet System4.3 Cryogenic System4.4 Fuel Cycle4.5 Cryostat and Thermal Shields4.6 Water Cooling System4.7 Plasma Diagnostic System4.8 Heating and Current Drive (H&Cd)Iter Plant ServicesTokamak - Initial AssemblyTokamak Maintenance
PLASMA PERFORMANCE ASSESSMENTS1.02.03.04.05.06.07.08.0
IntroductionPlasma Operation OverviewPhysics Basis Issues (Performance)Projection of ITER Plasma PerformancePlasma Operation and DisruptionsIter Operation Plan and Physics ProgramPlasma Measurements and DiagnosticsConclusions
FDR SAFETY ASSESSMENT1.02.03.04.05.0
Introduction and ConclusionsEnvironmental Impacts from Normal OperationImpact from AccidentsOccupational SafetyReferences

CHAPTER V: ITER PROJECT COST ESTIMATE
IntroductionPART 1. Resources required for ITER construction andcommissioning
1.1 Cost estimating approach for ITER construction1.2 Basic data - procurement packages for cost
estimation1.3 Evaluation of cost estimates1.4 Conclusions on the approach to the IER
construction cost1.5 Cost estimates summary1.6 Construction management, engineering support
of construction, and integrated commissioningcosts
PART 2. Operation costs2.1 Project manpower and overhead costs2.2 Energy costs2.3 Fuel costs2.4 Capital improvements, spare parts, maintenance costs2.5 Waste disposal costsPART 2. Operation costs Decommissioning costsSummary Estimate Tables
CHAPTER VI: ITER CONSTRUCTION, COMMISSIONING, OPERATION ANDDECOMMISSIONING PLAN
PART I: ITER CONSTRUCTION AND COMMISSIONING SCHEDULE1.0 Introduction2.0 Initial and Background Conditions3.0 Overall Construction Summary Schedule4.0 Construction Activities: Procurements and Manufacturing5.0 Construction Activities: Installation and Tokamak
Assembly6.0 Commissioning Schedule7.0 Critical Path
PART II: ITER OPERATION PLAN1.0 Introduction2.0 ITER Plant Operation and Constraints3.0 BPP Phase4.0 Transient Phase from BPP to EPP5.0 Enhanced Performance Phase (EPP)
PART III: ITER DECOMMISSIONING PLAN1.0 Introduction2.0 Description of Decommissioning Plan3.0 Decommissioning Schedule

INTERNATIONAL THERMONUCLEAR EXPERIMENTAL REACTOR
&
TECHNICAL BASISFOR THE
ITER FINAL DESIGN REPORT, COSTREVIEW AND SAFETY ANALYSIS
(FDR)
Chapter I
INTRODUCTION
13 July 1998

CHAPTER IINTRODUCTION
TABLE OF CONTENTS
1.0 INTRODUCTION

1.0 INTRODUCTION
The Final Design Report, Cost Review and Safety Analysis ("FDR") is the fourthmajor milestone report presenting the progress made in the ITER EngineeringDesign Activities.
An Outline Design Report was presented in January 1994 to ITER Council andprovided a basis on which the Parties concluded Protocol 2 of the ITER EDAAgreement. Further development and enhancements of the design were presentedin the ITER Interim Design Report, Cost Review and Safety Analysis ("IDR") which,with companion documents, was presented and accepted by ITER Council inJuly 1995. Following domestic reviews by the ITER Parties, the "Interim DesignReport Package" [ITER EDA Documentation Series No. 9] was approved by ITERCouncil at its meeting in December 1995. The supporting Technical Basis for the IDRwas subsequently published as ITER EDA Documentation Series No 7. Results ofthe technical work to late 1996 were embodied in the Detailed Design Report, CostReview and Safety Analysis ("DDR") which was presented to the ITER Council inDecember 1996 and approved, following domestic reviews in the Parties, inJuly 1997. The supporting Technical Basis for the DDR has been published in theITER EDA Documentation Series [ITER EDA Documentation Series No. 13].
Following the approval of the DDR package, the design work was concentrated onthe requirements of operation, with only relatively minor changes to design conceptsof major components. The design of supporting systems and plant received fullattention. The validating technology R&D, now entering its concluding stages, wasfocused on key issues arising from the developing system designs, in particularthrough the establishment of Large Projects of integrated R&D involving thebuilding of large/full scale models and prototype components of the ITER basictokamak.
The FDR was presented to and accepted by ITER Council in February 1998 and,following domestics reviews in the Parties, was approved by the ITER Council inJune 1998.
This document presents the Technical Basis for the FDR. It covers the full scope ofactivities foreseen in Article 2 (a) - (d) of the ITER EDA Agreement, i.e.,:
2 a) to establish the engineering design of ITER including
(i) a complete description of the device and its auxiliary systems andfacilities,
(ii) detailed designs with specification, calculations and drawings ofthe components of ITER with specific regard to their interfaces,
(iii) a planning schedule for the various stages of supply, construction,assembly, tests and commissioning of ITER together with acorresponding plan for human and financial resourcesrequirements, and
FDR-Introduction Chapter 1-Page 1

(iv) specifications allowing immediate calls for tender for the supplyof items needed for the start-up of the construction of 1TER if andwhen so decided.
(b) to establish the site requirements for ITER, and perform the necessarysafety, environmental and economic analyses.
(c) to establish both the proposed program and the cost, manpower andschedule estimates for the operation, exploitation anddecommissioning of ITER.
(d) to carry out validating research and development work required forperforming the activities described above, including development,manufacturing and testing of scalable models to ensure engineeringfeasibility."
Chapter II: IPDD and Chapter III: UER Plasma Performance Assessment coveritems a (i) and (ii), and (d). Item a (iii) is addressed in Chapter V: ITER Project CostEstimate and in Chapter VI: ITER Construction, Commissioning, Operation, andDecommissioning Plan. Item a (iv) was made available in draft as part of theprocurement packages used as the basis for the Parties' input to Chapter V. Items (b)and (c) are, respectively, addressed in Chapter IV: Safety Assessment, Chapter V:ITER Project Cost Estimate and Chapter VI: ITER Construction, Commissioning,Operation, and Decommissioning Plan.
This Technical Basis document is itself supported by detailed technicaldocumentation, referred to in the following chapters. These are listed in Table 1-1.These documents are known as "living" documents because their content is evolvingcontinuously with the design. The versions delivered at this time are therefore a"snapshot" of their current state.
The FDR is the culmination of almost six years' collaborative design and supportingtechnical work by the ITER Joint Central Team and Home Teams under the terms ofthe ITER EDA Agreement. This milestone report marks the achievement of the fulltechnical scope of activities indicated in the ITER EDA Agreement.
FDR-Introduction Chapter 1-Page 2

TABLE 1-1Supporting Technical Documentation
Reports
ITER Physics Basis
General Design RequirementDocument (GDRD)
NSSR-2
Contents
1. Overview2. Plasma Confinement and Transport3. MHD Stability, Disruptions and Operational Limits4. Power and Particle Control5. Physics of Energetic Particles6. Plasma Auxiliary Heating & Current Drive7. Measurements of Plasma Parameters8. Plasma Operation9. Opportunities for Reactor-scale Experimental Physics on
ITERApp.A Summary of Physics Design Guidelines &MethodologiesApp. B Steady State Scenarios1. Scope2. Performance Requirements3. Cost, Schedule and Project Management Requirements
and Guidelines4. Safety, Siting and Environmental Requirements5. Plant Systems/Buildings Design RequirementsApp.A General Safety and Environmental Design Criteria(GSEDC)I. Safety approach and functionsII. Safety designIII. Radiological and energy source termsIV. Effluents and emissionsV. Waste management and decommissioningVI. Occupational safetyVII. Analysis of reference eventsVIII. Ultimate safety marginsIX. External hazards assessmentX. Sequence Analysis
FDR-Introduction Chapter 1-Page 3

Construction/CommissioningSchedule and Operation/Decommissioning Plan
Detailed Cost ReportITER Management Plan andProcedure
Seven Large R&D Reports
I. Construction and Commissioning Plan1. Introduction2. Initial & Background Conditions3. Overall Construction Schedule Summary4. Construction Activities: Tokamak Assembly5.Construction Activities: Procurements & Manufacturing6. Construction Activities: Building & Plant Systems
Installation7. Commissioning Plan up to the Hydrogen First Plasma
Discharge8. Critical Path9. Other AspectApp. A Master Construction ScheduleApp. B List of Test & CommissioningApp. C Test & Commissioning of Vacuum Pumping &
FuellingApp. D Plan for Commissioning the Magnet SystemApp. E Vacuum Vessel Testing & Commissioning Plan
II. Operation Plan1. Introduction2. Performance and Operational Requirements3. ITER Plant Operation and Constraints4. BPP Phase5. Transient Phase from BPP to EPP6. EPP PhaseApp. A Example of Initial OperationApp. B Remote ExperimentsApp. C Comprehensive Numerical Model for ITERApp. D Canadian Tritium SuppliesApp. E Status of Plant at First Hydrogen Plasma
OperationIII. Decommissioning Plan
1. Introduction & Summary2. General Policy3. Assumption4. Decommissioning Scenario5. Overall Decommissioning ScheduleAnnex-A Detailed Technical Description of the
Decommissioning Plan
(Confidential)1. Introduction2. Program Objectives3. ITER Management Structure and Responsibilities4. Project Work Breakdown Structure (WBS) and
Organisational Breakdown Structure (OBS)5. Planning and Authorising Work6. Human Resources & Support Facilities management7. Management Information & Reporting
L-l CS Model Coil ProjectL-2 TF Model Coil ProjectL-3 Vacuum Vessel Sector ProjectL-4 Blanket ProjectL-5 Divertor Cassette ProjectL-6 Blanket Remote Handling ProjectL-7 Divertor Remote Handling Development
FDR-Introduction Chapter 1-Page 4

Final Reports of the TechnologyR&D and Design Task Agreements
ITER Plant System IntegrationReport
ITER Parameter Set
I. Technology R&D and Design Task Agreements Summary1. Introduction2. Task Agreements Summary3. Complete List of the Task Agreement4. Compilation of Task Assessments and Executive
SummariesII. Task Agreement Final Reports1. Introduction2. Plant Operational Sequences3. Plant Layout4. Plant System Modules
4.1 Plant System Control4.2 Magnets and Power Supply4.3 Water Cooling System4.4 Fuel Cycle4.5 Cryogenic Heat Removal System4.6 Steady State Electrical Power System4.7 Additional Heating Systems
5. Tokamak Integrated Structural System6. Configuration & Control of Grounding Circuits7. Machine Configuration Control: Gap Study
0. Project Parameters1. Tokamak Basic Machine Parameters2. Tokamak Ancillary Equipment & Cryostat Parameters3. Tokamak Fluids System Parameters4. Power Supplies & Command Control Parameters5. Port Interfacing System Parameters6. Site, Buildings & Support Systems7. Contact Persons
FDR-Introduction Chapter 1-Page 5

Design Description Documents(DDD)
1.11.31.51.6
1.71.8
1.92.12.22.32.42.62.73.1
3.2
3.43.5
4.14.2
4.3
4.54.64.75.15.25.35.4
Magnet SystemVacuum VesselBlanket SystemA. Shielding BlanketB. Breeding BlanketDivertorFuellingA. Pellet Injection SystemB. Gas Injection SystemC. Wall Conditioning SystemPlasmaLayout of Equipment around the CryostatMachine Assembly and ToolingRemote HandlingCryostatTokamak Cooling Water SystemThermal ShieldsVacuum Pumping and Leak Detection SystemsA. GeneralB. Vacuum Roughing SystemC. Torus Vacuum Pumping SystemD. Cryostat Vacuum Pumping SystemE. NB Auxiliary Vacuum Pumping SystemF. ICH&CD Vacuum Pumping SystemG. EC H&CD Vacuum Pumping SystemH. Guard and Services Vacuum Pumping SystemJ. Diagnostics Vacuum Pumping SystemK. Leak Detection SystemL. Miscellaneous Vacuum Pumping SystemTritium PlantA. Tokamak Exhaust ProcessingB. H, D, T Isotope SeparationC. Fuel Storage & DeliveryE. Water DetritiationF. Atmosphere Detritiation SystemsH. Tritium Plant Analytical FacilitiesJ. Instrumentation & Control SystemK. Tritium Extraction from ITER Blanket ModuleCryoplant and Cryodistributa'on SystemHeat Rejection SystemA. Circulating Water SystemB. Cooling Tower SystemCoil Power Supply and DistributionAdditional Heating Power SuppliesA&B. ICH&CD and ECH&CD Power SuppliesC. NB H&CD Power SuppliesElectrical Power NetworkA. Steady State Electrical Power SwitchyardB. Steady State Electrical Power System DistributionSupervisory Control SystemInterlocks SystemPoloidal Field ControlIon Cyclotron Heating & Current Drive SystemElectron Cyclotron Heating & Current Drive SystemNeutral Beam Heating & Current Drive SystemLower Hybrid Heating & Current Drive System
FDR-Introduction Chapter 1-Page 6

5.5 DiagnosticsA.Magnetic DiagnosticsB.Neutron DiagnosticsC. Optical/IR SystemsD. Bolometer SystemE. Spectroscopic and NPA SystemsF. Microwave DiagnosticsG. Plasma-facing components and operationaldiagnosticsH. Diagnostic Neutral BeamM. Radiation EffectsN. Diagnostic System Engineering
5.6 Test BlanketsA. ITER Breeding Blanket Test ModuleB. EU Helium Cooled Pebble Bed (HCPB) Test BlanketC. EU Water-cooled Pb-17Li Test Blanket ModuleD&E. JA Water-cooled and Helium Cooled Solid
Breeder Test Blanket ModuleF. RF Li/V self-cooled (LIV) Test BlanketG. RF Ceramic Helium Cooled (CHC) Test Blanket
ModuleH&I. US Li/V and Helium-Cooled Solid Breeder Test
Blanket Systems6.2 Buildings
A.Tokamak BuildingsB. Hot Cell BuildingD. Tokamak Services BuildingsE. Auxiliary BuildingsG. Radwaste and Personnel BuildingH. Laboratory Office BuildingJ. Cryoplant BuildingsK. Control BuildingL. Emergency Power Supply BuildingM. Site services BuildingP. Poloidal Field Coil Fabrication BuildingS. Utility Tunnels & Site Improvements
6.3 Hot Cell Processing and Waste treatmentA.Hot Cell Docking and StorageB. Hot Cell waste Processing and StorageC. Hot Cell Component Repair SystemD. Low Level Waste Processing SystemF. Non-Radioactive Waste Systems
6.4 Radiological protectionA. Radiological Shielding SystemB. Radiological Monitoring/Protection SystemC. Environmental Monitoring System
6.5 Liquid distribution (including water) SystemsA. Component Cooling Water SystemB. Chilled WaterC. Potable & Fire Protection WaterD. Sanitary and Industrial SewageE. Steam/Condensate/Demineralized Water System
6.6 Gas distribution and compressorsA.Compressed Air SystemB. Breathing Air SystemC. Nitrogen, helium, Etc.D. SF6 and Other Specialty Gases
6.8 Plant Sampling Systems
FDR-Introduction Chapter 1-Page 7

ITER Nuclear Analysis Report
Material Assessment Report
1.2.3.4.567.8.
9.10.1.1
1.21.3
1.42.12.22.33.13.23.33.43.54.14.24.34.44.5
IntroductionITER Nuclear Parameters and Radiation Design LimitsRadiation Transport Methods: Codes and Nuclear DataDesign and Initial Calculational DataNuclear Analysis of 1TER Reference DesignsStreaming Analysis of Assembly Gaps and HolesPort AnalysisNeutronics, Shielding and Activation Analyses for theDivertorBenchmark ExperimentsConclusionsSelection of Stainless Steel for the In-vesselComponentsSelection of Copper AlloysMaterials for the Blanket Module MechanicalAttachmentCryogenic MaterialsSelection of Beryllium gradeSelection of Tungsten gradeSelection of Carbon Fiber CompositesWelds and JointsSelection of SS/Cu technologiesSelection of the Armour/Heat Sink Joining TechnologyCoating TechnologiesRepair Technologies for First Wall ArmourErosion/RedepositionDisruption/ ErosionTritium RetentionTritium Removal from Codeposited layersDust
FDR-Introduction Chapter 1-Page 8

Handbooks, Manuals, Standards
Quality Manual
Standard Components and RemoteHandling Manual
Radiation Hardness Design Manual
Material Properties Handbook
Summary of ITER Structural DesignCriteria
Structural Design Criteria for In-vessel components
1. HER QID Quality Internal Documents2. HER QCD Quality Contractor Documents1.0 Summary2.0 Overview3.0 Standard ITER Components4.0 Standard Remote Handling Methods5.0 Standard Remote Handling Devices1. Radiation Hardness Application2. Radiation Hardness Devices, Materials, and Components
Engineering properties of materials used in ITER andmaterials studied in ITER EDA, including:
A MetalsAA Austenitic steelsAD Nickel Base AlloysAK Copper and copper alloysAE Titanium Base AlloysAF Vanadium AL BerylliumAM TungstenAR Liquid MetalsAppendix A Handbook Organization
Appendix B Property Codes and Definitions1. Introduction2. Summary of criteria
2.1 Superconducting coils and structure (SCCS)2.2 In-vessel & Plasma Facing Components2.3 Generic Codes & Standards for Ex-Vessel Components2.4 Vacuum Vessel2.5 Cryostat2.6 Buildings
Details of structural design criteria, presently written onlyfor in-vessel components, including effects of irradiation onmaterial, high temperature rules (TBD), and multi-layermaterials (TBD).A. GeneralB. In-vessel componentsC. Other components and classes, TBDAppendix A. Material design limit dataAppendix B. Guidelines for analysis, in-vessel componentsAppendix C. Justification of design rules, in-vesselcomponentsAppendix D. Guidelines for design by experiments, in-vessel components (TBD)..
FDR-Introduction Chapter 1-Page 9

Vacuum Design Handbook
ITER Computer Aided DesignReference Manual
1. Scope of handbook2. Applicable documents3. Vacuum requirements4. Design Guidelines5. Materials6. Manufacturing Processes7. Qeaning8. Marking9. Packaging10. Testing and inspection11. Documentation & QA requirements12. List of approved vacuum components13. Assembly and Installation14. Maintenance15. Decommissioning1. Design Control2. Model / Drawing Practi ce3. CAD Practice4. Related Standards5. CAD User Information for CATIA6. Setup for 2D CATIA and 2D Autocad to translate in both
directions7. External Organizations Mandatory Information for
CATIA use
FDR-Introduction Chapter 1-Page 10

INTERNATIONAL THERMONUCLEAR EXPERIMENTAL REACTOR
TECHNICAL BASISFOR THE
ITER FINAL DESIGN REPORT, COSTREVIEW AND SAFETY ANALYSIS
(FDR)
Chapter II
ITER PLANT DESIGN DESCRIPTION
13 July 1998

CHAPTER IIITER PLANT DESIGN DESCRIPTION
TABLE OF CONTENTS
SECTION 1.0:
1.0 INTRODUCTION 1.0-1
SECTION 2.0:
2.0 ITER PLANT CONTROL & OPERATION 2.0-12.1 Plant control system 2.0-12.2 ITER plant operation 2.0-32.3 Plant operational sequence 2.0-4
SECTION 3.0:
3.0 ITER PLANT LAYOUT AND BUILDINGS 3.0-13.1 General features of radiologically controlled buildings 3.0-43.2 Building configuration and equipment arrangement 3.0-73.3 Configuration of other buildings and structures 3.0-173.4 Assessment 3.0-20
SECTION 4.0:
4.0 SUMMARY OF SYSTEM DESIGN 4-1-14.1 Vacuum vessel and in-vessel components 4-1-14.2 Magnet system 4-2-14.3 Cryogenic system 4-3-14.4 Fuel cycle 4-4-14.5 Cryostat and thermal shields 4-5-14.6 Water cooling system 4-6-14.7 Plasma diagnostic system 4-7-14.8 Heating and current drive (H&CD) 4-8-1
SECTION 5.0:
5.0 ITER PLANT SERVICES 5.0-15.1 Steady state electrical power supply network 5.0-15.2 Component cooling water system 5.0-55.3 Chilled water system 5.0-85.4 Potable and fire water system 5.0-105.5 Sanitary and industrial sewage 5.0-105.6 Steam, condensate and demineralized water 5.0-115.7 Compressed air systems 5.0-125.8 Breathing air systems 5.0-135.9 Nitrogen, helium and specialty gas systems 5.0-135.10 Site tunnel layout 5.0-145.11 Analytical laboratory 5.0-15

SECTION 6.0:
6.0 TOKAMAK - INITIAL ASSEMBLY 6.0-16.1 Alignment strategy 6.0-16.2 Tolerance control 6.0-16.3 Outline assembly procedure 6.0-26.4 Assembly operations 6.0-36.5 Assembly schedule and resources 6.0-46.6 Assembly hall utilization 6.0-56.7 Tool fabrication 6.0-56.8 Site facilities 6.0-6
SECTION 7.0:
7.0 TOKAMAK MAINTENANCE 7.0-17.1 Basic approach and general criteria 7.0-17.2 In-vessel maintenance 7.0-57.3 Ex-vessel maintenance 7.0-177.4 In-hot-cell maintenance 7.0-247.5 Development plans 7.0-297.6 Assessment 7.0-30

INTERNATIONAL THERMONUCLEAR EXPERIMENTAL REACTOR
w*
TECHNICAL BASISFOR THE
ITER FINAL DESIGN REPORT, COSTREVIEW AND SAFETY ANALYSIS
(FDR)
Chapter IISection 1.0
ITER PLANT DESIGN DESCRIPTION
13 July 1998

CHAPTER IISECTION 1.0
INTRODUCTION
TABLE OF CONTENTS
1.1 Introduction ., 11.2 Changes since the Detailed Design Report 11.3 Design overview 21.3.1 Operation 21.3.2 Main parameters, classifications, and glossary 3

1.1 Introduction
At the time of the Interim Design Report, all the major structural elements of theITER machine were defined. With the Detailed Design Report, this definitionprogressed to the level of all components within the tokamak pit. The FDR hascontinued that definition process, and has developed the definition of plantfacilities and services so that the ITER design is now defined in all areas. Workundertaken since the DDR, in particular with related R&D, has confirmed thevalidity of the concepts and design approaches taken for the main components ofITER.
This ITER Plant Design Description (IPDD) presents a design which in generalterms is therefore identical with that of the Detailed Design Report (DDR) andwhich is described again here to make the document "self-contained". However,there are specific differences because since the DDR more attention has beengiven to the design of "active" systems (e.g., cryoplant, cooling water, powersupply, fuel cycle, and remote handling systems) to take more account of the wayITER will be operated and maintained. As a result of this greater attention tooperational issues, the study of integrated system operation has led to theproduction of the first version of the Plant Systems Integration Report (PSIR).The PSIR focuses on the overall plant operation and the functional interfacesbetween, and geometrical arrangement of, all design elements (i.e., componentsand subsystems).
Further design and operational details can be found in the appropriate DDDs.
1.2 Changes since the Detailed Design Report
The most significant changes of the design since the DDR are (not in order ofimportance):
1. the reference design of the central solenoid as a monolithic, layer-wound coil has been retained, but the number of poloidal field coilshas been increased from 7 to 9, to improve plasma shape control, addtriangularity (at the top at least), and to allow all poloidal field coils tobe made from NbTi superconductor;
2. ferromagnetic inserts have been made in the vacuum vessel to reducestill further the TF ripple in the plasma region, and careful attentionhas been paid to ensure that adequate plasma control can still beachieved;
3. the correction coils are designed to satisfy the requirements not only offield correction but also those of physical integration into the machinedesign and of the appropriateness for remote handling;
4. blanket module attachments to a double-walled backplate have beendeveloped which are able to withstand electromagnetic, thermal andmechanical loads, yet allow all maintenance and installation of
FDR-Introduction Chapter II-Section 1.0-Page 1

attachments and service connections to be carried out from the plasmaside;
5. the concept of a toroidal belt limiter has been replaced with a portlimiter at two or more equatorial ports, allowing better plasma controland simplifying limiter removal'for maintenance;
6. all systems (limiter, RF heating, diagnostics, test blankets) with plasmafacing hardware in the equatorial ports are now supported from thevacuum vessel port assemblies;
7. a breeding blanket concept for the Extended Performance Phase (EPP)has been selected for further detailed development;
8. the divertor wings have been removed to simplify the design and tosimplify the cleaning of codeposited tritium;
9. a continuous fuel pellet screw extruder has been incorporated into thepellet injector system, which now injects into the plasma from thehigh field side;
10. a design of a LH H&CD system for ITER has been developed, althoughit is not yet fully integrated in the design for all machine services (e.g.,power supplies and layout);
11. considerably more design work has been done to integrate diagnosticsinto the in-vessel components,
12. the design of the tokamak cooling water system and cryoplant havebeen improved to take into account the large, pulsed heat loads theyexperience;
13. the design for the cryostat has been modified (e.g., single wall) as aresult of detailed analyses of loading conditions;
14. the design of the vertical ports has been developed, with alternatingports being used for diagnostics and for access for blanket cooling pipes.
1.3 Design overview
For convenience, an overview of general information about the design issummarised in this chapter.
1.3.1 Operation
The Basic Performance Phase (BPP) and the Enhanced Performance Phase (EPP)are each planned to last about ten years. The BPP plan is shown in Figure 1.3-1-1.Plasma operation will be preceded by a year of integrated commissioning of the
FDR-Introduction Chapter II-Section 1.0-Page 2

sub-systems, followed by a few years of initial operation in hydrogen to gaininitial operating experience in a non-radioactive environment, followed by abrief DD phase before proceeding to operation with DT. Various operationalmodes are envisaged, including ohmic and additionally heated pulses, 1000 signited pulses, and longer pulses assisted by current drive. The operating planallows for maintenance, including an extended down time during the sixth andseventh year following the first full year of ignited operation. A detailedoperational plan for the EPP has not been developed because it will depend onthe plasma performance and operating experience obtained during the BPP.However, it is foreseen that there will be less emphasis on physics studies, andmore emphasis on optimisation of performance and reliable operation toproduce high neutron fluxes and fluences, using the most promising operationalmodes developed during the BPP.
DXVICICOHHSSEO
NINO
Year(-1)
ZKRO MXTVK7I0U PatSI I
PLASMA camissioanio 'I
Year! Year 2
HIGH ACTIVATION PIASIlOKITim, SUSTAINED BV8N and BLANKET TEST
Year 4 I Year 5 I Year 6 I Year 7 I Year 8 I Year 9
Sub-SysteiTesting.IntegrationandCommissi-oning
Initial FIJI Field.Ohmic Currentand andAuxiliary HeatingHeat ing PowerOperation Operation
Sub-IDD'proto- IgnJed
Ignition Sustained- — - Studies 1000sBum
I type Operation 200s,lgn»km
I Initial! D T
Initial Steady-State studies
Preliminary Test of Bar*:el
SustainedBum
1000 s
Steady-State Studies >
Blanket Modules Test >
Commissioning of ITfflSystems with Plasma
- 6000 Pulses
I I Operation
H I Maintenance
\/A Commissioning of ITrP Systems
FIGURE 1.3-1-1Tentative ITER Plasma Operation Plan for Basic Performance Phase
Ftev 9, 6/ 6/ 95
1.3.2 Main parameters, classifications, and glossary
ITER is a long pulse tokamak with an elongated plasma and a single nullpoloidal divertor (Figure 1.3.2-1). ITER is designed to produce a nominal fusionpower of 1.5 GW for a minimum ignited pulse length of 1000 s.
The major components of the tokamak (for further details see Section 4) are thesuperconducting toroidal and poloidal field coils which magnetically confine,shape and control the plasma inside a toroidal vacuum vessel. The magnetsystem comprises twenty toroidal field coils, a central solenoid, nine externalpoloidal field coils, and correction coils. The centering force on toroidal magnets
FDR-Introduction Chapter II-Section 1.0-Page 3

is reacted by the central solenoid. The TF coil cases are used to support theexternal PF coils. The vacuum vessel is a double-walled structure. The vacuumvessel is suspended from the toroidal field coil cases by twenty vacuum vesselvertical supports, and spaced from them by horizontal supports. The magnetsystem together with the vacuum vessel and internals are supported by gravitysupports, one beneath each sector and one beneath the central solenoid.
Inside the vacuum vessel the internal, removable components, includingblanket modules (mounted on a double walled permanent backplate attached tothe vessel), divertor cassettes, and port plugs such as the limiter, heatingantennae, test blanket modules, and diagnostics sensors, absorb most of theradiated heat from the plasma and protect the vessel and magnet coils fromexcessive nuclear radiation. The divertor exhausts the helium ash and limits theconcentration of impurities in the plasma. The other vessel internals are chosenso that they do not contribute unacceptably to the concentration of impurities inthe plasma. It is assumed that the initial shielding blanket of the BPP will bereplaced by a breeding blanket for the EPP.
The heat deposited in the internal components and the vessel is rejected to theenvironment via the tokamak cooling water system (comprising individual heattransfer systems) which is designed to preclude releases of tritium and activatedcorrosion products to the environment. Some parts of these heat transfersystems are also used to bake and hence clean the plasma facing surfaces insidethe vessel by releasing impurities. The tokamak is housed in a cryostat, withthermal shields between the hot parts and the magnets and support structureswhich are at cryogenic temperature.
The tokamak fuelling system is capable of gas and solid hydrogen pellet injection.Low-density gaseous fuel will be introduced into the vacuum vessel chamber bya gas injection system. The plasma will progress from electron-cyclotron-heatingassisted initiation in a circular configuration touching the limiter to an elongateddivertor configuration as the plasma current is ramped up. After the current flattop (21 MA) is reached, subsequent plasma fuelling (gas or pellet) together withadditional heating for ~ 100 s leads to an ignited DT burn at 1.5 GW. Withoutnon-inductive current drive from the heating systems, the burn duration will belimited to ~ 1000 s by the available magnetic flux swing (~ 80 Wb). Before this isused up, the burn is terminated by reducing the fuelling to rampdown the fusionpower, followed by current rampdown and plasma termination. The inductivelydriven pulse has a total duration of 1400 s, and the pulse repetition period may beas short as 2200 s.
Two barriers for tritium confinement are provided by the vacuum vessel and thecryostat. There will be 100 MW of additional heating and a complete set ofplasma diagnostics. Plasma control is provided by the poloidal field system, andthe pumping, fueling and heating systems.
An artist's view of the ITER site and buildings is shown in Figure 1.3.2-2.Further details of the overall site configuration and layout are given in Section 3.Basic assumptions of the site conditions used for design of the ITER plant can be
FDR-Introduction Chapter II-Section 1.0-Page 4

found in the ITER Site Requirements and ITER Site Design Assumptions [ITEREDA Documentation Series No. 9, IAEA].
The overall operation of the entire system is discussed in Section 2. The initialassembly procedure of the tokamak is discussed in Section 6 and tokamakmaintenance is described in Section 7. Section 5 describes the design of ancillaryservice systems.
All sections summarise the changes since the DDR and an assessment of thedesign, with respect to its fabricability and ability to stand up to operatingconditions, and an assessment of what remains to be done in order to give moreconfidence in the design.
An overview of representative design parameters and approaches are listed inTables 1.3.2-1 to 1.3.2-7. A glossary of terms and main classifications is given inTables 1.3.2-8 to 1.3.2-14.
FDR-Introduction Chapter H-Section 1.0-Page 5

TABLE 1.3.2-1ITER Major Design Parameters
Plasma Major Radius, R, (m)
Plasma Minor Radius, a, (m)
Plasma Configuration
Nominal Plasma Current, (MA)
MHD Safely Factor for nominal plasma current, q95
Toroidal Field at Major Radius, (T )
Reference pulse duration, (s):Inductive pulse flat-top under ignited conditionsNominal repetition time
Nominal Wall Loading, (MW/m2)
Nominal Fusion Power, (GW)Maximum excursion of the fusion power, (%)Maximum duration of the power excursion, (s)Total Neutron Fluence, (MWa/m2)
- during the Basic Performance Phase- total for the machine lifetime
Total numbers of pulses, including shorter, lower power pulsesand disruptions (not including short test pulses)
- during the BPP- during the EPP
Goals for the max. no. of plasma disruptions during the BPP- Category I*, at full current, full energy- Category I*, at full current, half energy- Category II*
Goal for the max. no. of plasma disruptions during the EPP- Category I*- Category II*
8.14
2.8Single-Null Divertor
21
-3.0
5.68
10002200
-1.0
1.52010
-0 .3>1.0
s 50,000s 15,000s 35,000
10001000200
1000200
* Category I: Normal event and loading condition -1 ms thermal quench + 100 ms current quench.Category II: Likely event, upset loading condition -1 ms thermal quench + 50 ms current quench.
FDR-Introduction Chapter II-Section 1.0-Page 6

TABLE 1.3.2-2Representative Plasma Parameters for 1.5 GW Ignited Operation
Volume-average temperature (To = 0.5* [TeO+Tio]) (keV)Volume-average density, neO (m"3'
Impurity fractions (fBe, fHe, fAR)ZeffRadiated power fraction, fradEnergy confinement time corrected for core radn. loss tE (s)
Triple product, <neoTi>tE (m~3keVs)Toroidal beta (total), PN =[P(%)/(I/aB)], normalised/%Poloidal beta, (JpOxPoloidal beta range, PpNominal plasma internal inductance, /j(3)Inductance range, (;(3)Plasma energies:Thermal, Wth (GJ)Magnetic, Wm a g (GJ)Plasma triangularity, 895Plasma elongation, K95, KX
12
1.0 xlO20
0.02, 0.09, 0.0021.8
0.405.8
7.0 xlO21
2.2/3.00.9
OsPpsl.20.9
0.7 s /i(3) s 1.1
1.11.1
-0.24-1.6,-1.75
FDR-Introduction Chapter II-Section 1.0-Page 7

TABLE 1.3.2-3Magnet System Parameters
1.1 Toroidal Field Coils (TFC) and Structural Supports:Number of coils
Basic design approach1.
Conductor
Materials:- Superconductor- Stabilizer-Conduit- Cases and radial plates
Maximum magnetic field at superconductor(T):
Conductor current dens, at max. field, ind. conduit (MA/m2)Inner leg overall current density, including insulation andstructure, (MA/m2)
Nominal voltage (for normal 15s discharge), (kV)- between terminals/terminal-to-ground
Peak TF insulator dose with 1 MWa/m2 at first wall, (Gy)Maximum toroidal field ripple at the separatrix, %Space allocation at room temperature in the bore of the TFcoil, for the current baseline, (m):
- for inner legs, Rmin- inner bore width, ARm a x
- inner bore height, AZmax
TF Coil mass (t)
Gravity Support Design approach
Vacuum Vessel Vertical Support Design approach
Vacuum Vessel Horizontal Support Design approach
20
Welded cases with enclosedgrooved radial plates,with eachconductor in a separate groove
Cable-in-conduit, force-flowcooled, drcular cross-section
Nb3SnCuAlloy 908Strengthened Austenitic Steel
12.83710
10/5
3X10⁶
< 2
3.999.40
14.82
695
Vertical column under each TF coilbetween PF6 and PF7 bolted to TFcoil and floor of cryostat. Columnsflex radially to allow thermalmovements of TF coils during cooldown/ warm up.
Assemblies, suspended frombrackets under each TF coilbetween PF7 and PF8, eachassembly supporting one pair ofW support legs. Each assemblyincludes a hanger that flexesradially to allow relativemovement between bottom of TFcoils and VV legs.
Pairs of tie-rod assemblies withdisk springs, linking TF coil case toa bracket on top of the VVequatorial ports on each side ofthe case. Each tie-rod allowsrelative movements between outerlegs of TF Coils and VV equatorialport.
FDR-Introduction Chapter II-Section 1.0-Page 8

TABLE 1.3.2-3Magnet System Parameters (cont'd)
1.2/3 Poloidal Field Coils (PFC) and Central Solenoid (CS)Total inductive flux swing, (Wb)
Nominal inductive flux swing for burn lor 21 MA, (Wb)Loop voltage for plasma initiation, (V)
Nominal plasma loop voltage during burn, (mV)
Maximum voltages between terminals, (kV)- C S- PF coils
Basic design approach:- C S
-PF1-PF9
Conductor design:
Materials:Superconductor
-forCS:-forPFl-9:
StabilizerConduit
-forCS-forPFl-9
Maximum Ampere turns(design capacity) (MAt):-CS-PF1-PF2-PF3-PF4-PF5-PF6-PF7-PF8-PF9
Maximum magnetic field at superconductor, (T):- at the CS- at PF1-PF8- at PF9
CS conductor current densities, including conduit (MA/m2):- for inner section (CS 1)- for middle section (CS 2)- for outer section (CS 3)
CS overall current density, including insulation,exdudinginner & outer cylinder (MA/irfi):
Coil mass: CS/PF1-PF9 (t)
530
>80
18
£80
1510
Layer winding, 14 layers, 4conductors in-handDouble pancakes, typically twoconductors in-hand
Cable-in-conduit, force-cooled,square cross-section
Nb3SnNbTiCu
Alloy 908Stainless Steel
1427.014.29.93.416.919.812.817.112.8
13.05.06.7
162020
14.41263/3988
FDR-Introduction Chapter II-Section 1.0-Page 9

TABLE 1.3.2-4Vessel/In-vessel System Parameters
1.5 Vacuum Vessel (W)Basic design approach:Limiting accident overpressure, absolute, restricted byan overpressure protection system, (MPa)VV material
- structural- primary vessel shielding- ferromagnetic inserts
Baking temperature, (°C)W coolant:
- t ype- maximum design pressure, (MPa)
W space allocation in the bore of the TF coil, at roomtemperature, for the current baseline, (m)
- minimum radial coordinate— maximum radial coordinate- total vertical dimension
Total toroidal resistance for the W combined with all in-vessel components, (|iQ)Approximate masses of vessel and internals (t)
Vessel and portsBlanket, backplate and supportsDivertorIn-port equipment
Total
Double-wall welded ribbed shell
0.5
316 L(N) IG SS30487 (with 2% boron) SS430 SS200
water2.75
4.1313.0914.41
-5
9665 (design value* 10109)4820 (design value* 5085)1742 (design value* 1808)2047 (design value* 2070)18274 (design value* -19000)
1.6 BlanketBasic design approach
Surface heat loads, (MW/m2)• primary wall, local peaks without power excursion• baffles, surface average without power excursion• baffles, average without power excursion• baffles, maximum without power excursion• port limiter, peak
Required design lifetime:- for primary modules
- for baffles
— for port limitersMaterials for the primary module/baffle first wall:
- plasma facing material- heat sink- structural base
Baking temperature, (°C)FW coolant:
- t ype- normal design pressure, (MPa)
Replaceable modules on double-walled backplate installed/maintained from plasma side
0.250.51.0 (upper), 1.5 (lower)2.0 (upper), 3.0 (lower)-8.0
full duration of each phase butwith possibility of the modulereplacement,at least 3000 standard plasmapulses plus 150 full powerdisruptions,greater than 1000 standard pulses
Be S65C/low pressure plasmasprayedDSCuA125 IG (BPP only)316L(N)-IG SS240water3.8
* values which have been used for seismic or dynamic analyses
FDR-Introduction Chapter II-Section 1.0-Page 10

TABLE 1.3.2-4Vessel/In-Vessel System Parameters (cont'd)
1.7 DivertorConfiguration
Basic design approach
Length of channels along the separatrix, inner and outer, (m)Surface heat loads including power excursions (MW)
- total for both channels- design value for the inner channel- design value for the outer channel
Total heat load including power excursion and volumetricneutron heat (MW)
Local thermal load at normal operation conditions, normal tosurface, (MW/m2):
— nominal value- local peaks for sub-pulses of 10 sec
Required design lifetime
Required replacement time, (months)- for entire divertor-for one cassette
Materials- plasma facing material- heat sink material- structural base material
Baking temperature, (°C)
Divertor coolant:-type- maximum design pressure, (MPa)- inlet temperature (°C)
Divertor toroidal resistance, (uQ)
Single null poloidal divertor withX-point at the bottom
Solid replaceable cassettes
1.8
^300sl50s200
s400
5.015.0More than 1000 standard pulsesplus200 full power disruptions
s6£2
W (except vertical target, CfC)CuCrZr316 L(NHG SS
240°C
water4.2140
s 100
1.8 Fuelling and 3.1/2 Vacuum Pumping and Tritium PlantMode of fueling:
Pellet injector design approach
Vessel base pressure: H isotopes/Impurity gases (Pa)
Design approach
Pumping Speed/Throughput (Pa m3 /s)
Fuelling rate for D or DT with up to 60 % T (Pa m3/s)
Fuelling rate for 90% tritium (Pa m /s)Tritium consumption for 1000 s full power burn, including burnconsumption and hold-up in tritium handling system (g)
Gas puffing and pellet injectionFast fusion power shutdown systemKiller pellet systemScrew extruder pellet generationand centrifuge injection from highfield side10-5/10-7
Sequentially regeneratingcryopumps
200
200
50
3.3
FDR-Introduction Chapter II-Section 1.0-Page 11

TABLE 1.3.2-5Cryostat, Ctyoplant and Cooling System Parameters
Z7 Thermal ShieldDesign approach - Vacuum Vessel
- Cryostat
MaterialAcceptable heat leaks through entire Thermal Shield, (kW)
Actively cooled shield usingwidely spaced cooling tubse withfin panels in between. Ag platedto reduce e.Space frame with coolant tubesand Ag-plated welded fins
Stainless Steel
7 to cold mass
2.4 CryosUtDesign approach
MaterialInternal design overpressure restricted byoverpressure protection system, absolute (MPa)
Maximum inner dimensions, (m):- radius- height
Toroidal resistance of the cylindrical portion, (uO)
Single-wall welded ribbed vessel304L Stainless Steel
0.2
18.231.5a 24
3.4 CryoplantTotal heat load on the LHe plant
-Magnet system- Torus cryopumps- Total (all users)
Design approach
kW kgZs77 0.190 (0.230 long pulse)7 0.055
94 0.270
Modular units to allow expansion
Z6/3.3/3.5 Heat Transport SystemHeat released in the tokamak for the nominal operationalregime, excluding power excursions (MW)
- neutron heating (ind. power multiplication xl.5)- alpha heating in plasma- auxiliary heating power in plasma- total
Design capacity of heat transport system including powerdisssipated due to pumping the cooling water, (MW):
- first wall/shield blanket including inboard baffles- first wall/shield blanket including outboard baffles- divertor including port Iimiter-vacuum vessel (normal/off normal per loop)- NB injectors- Diagnostics- total
Number of independent cooling loops:- first wall/shield blanket including inboard baffle- first wall/shield blanket including outboard baffle— divertor including port limiter- vacuum vessel- NB injectors
18003001002200
15005904204.5/3112~15-2642
104422
FDR-Introduction Chapter II-Section 1.0-Page 12

TABLE 1.3.2-6Port Systems Parameters
5.1/2/3/4 Auxiliary Heating and Current DriveTotal injected power, (MW)
Feedback control power rate, (MW/s)Start-up ECRF system
-two frequencies between, (GHz)-total power, (MW)
Candidate Additional Heating and Current Drive SystemsEC H&CD (electron cyclotron frequency) system
- number of ports- frequency, (GHz)- total power, (MW)
IC H&CD (ion cyclotron frequency) system-number of ports- frequency range, (MHz)- total power, (MW)
NB H&CD (neutral beam) Injection system- number of ports / injectors- beam energy (keV)- total power, (MW)
LH H&CD (lower hybrid frequency) system- number of ports- frequency, (GHz)- total power, (MW)
100 from at least two candidatesystems
60
90-1406 (2x3MW)
217050
440-7050
3400-100050(lMeV),5(400keV)
2550
5.5 Major Diagnostic Systems
Major Diagnostic Systems1. Magnetic2. Neutronic3. Optical/Infrared4. Bolometric5. Spectroscopic and NPA Systems6. Microwave7. Plasma facing component & operational systems8. Diagnostic neutral beam
Tentative number of subsystems697210861
5.6 Test Blanket ModuleDesign approach
Total Area available (four ports) (m2)
Neutron flux (MW/m2)
Self contained test moduleslocated standard frame inequatorial ports
17
-1.2
FDR-Introduction Chapter Il-Section 1.0-Page 13

TABLE 1.3.2-7Power Supply Parameters
4.1/2/3 Electric Power SupplyPulsed power supply:
Total active power from the grid, (MW)Total reactive power, (M var)Power derivative, (MW/s)Power step, (MW)
Steady state power supply: (maximum)Total active power from the grid, (MW)Total emergency power, (MW)
500-650400-50020060
17421
TABLE 1.3.2-8Remote Handling Classes
Remote Handling Class
RH Class 1
RH Class 2
RH Class 3
RH Class 4
Title
Components that require scheduled remote maintenance orreplacement.
Components that do not require scheduled remote maintenance butare likely to require unscheduled or very infrequent remotemaintenance.
Components not expected to require remote maintenance during thelifetime of ITER.
Components that do not require remote maintenance.
TABLE 1.3.2-9Steady State Power Classes
Class
Class I
Class IIClass III
Class IV
Title
Uninterruptible DC
Uninterruptible AC
Temporarily interruptible ACIndefinitely interruptible AC
TABLE 1.3.2-10Event Sequence Categorization
Class
Category I
Category II
Category IIICategory IV
Title
Events and plant conditions planned and required for ITER normaloperation, including some faults and events which can occur as aresult of the ITER experimental nature.
Event sequences not planned but likely to occur one or more timesduring the life of the plant but not including Category I events.Event sequences not likely to occur during the life of the plant.
Event sequences not likely to occur during the life of the plant witha very large margin.
FDR-Introduction Chapter II-Section 1.0-Page 14

TABLE 1.3.2-11Safety Importance Classification
SafetyImportanceClass (SIC)
1Rulel:
2Rulel:
Rule 2:
Rule 3:
3Rulel:
Rule 2:Rule 3:
Rule 4:
4
Classification Rules1
If the following rule applies:• The component implements a safety function [1] that is needed in normal operation or
after occurrence of Category II (Likely) events and the failure of that safety functionunder such conditions leads to a release that exceeds the Category IV (ExtremelyUnlikely) limits. [2]
(A design objective is to have no SIC-1 components in ITER.)If any oi the following three rules apply:• The component implements a safety function [1] that is needed after occurrence of
Category III (Unlikely) or Category IV (Extremely Unlikely) events and the failureof that safety function under such conditions leads to a release that exceeds theCategory IV (Extremely Unlikely) limits. [2]If the same safety function can be accomplished by another independent system,different from the one the component belongs to, then the component may bedeclassified to SIC-3.
• The component is needed to provide an elevated (stack) release point for releasesthat can exceed l/10th of the Category IV (Extremely Unlikely) limits. [3]
• The failure of the component would degrade a safety function of a SIC-1 component.[1][4]
If any of the following four rules apply:• The component implements a safety function [1] whose failure could lead to a release
that exceeds the Category II (Likely) limits [5] but is lower than the Category IV(Extremely Unlikely) limits.
• The failure of the component would degrade a safety function of a SIC-2 component.[1] [6]
• The component implements a safety function needed to protect the facility personnelfrom radiological hazards. [7]
• The component is needed for radiological monitoring of accidental releases to theenvironment when they exceed the Category II limits (accident monitoring).
Not safety classifiedNotes:[1] Auxiliary services that provide essential support to a component forming part of a system
important to safety shall be regarded as part of that system. Their reliability, redundancy,diversity, independence, and provision of features for isolation and for testing of functionalcapability shall be commensurate with the reliability of the system that is supported.
[2] Category IV (Extremely Unlikely) elevated release limits: 100 g-T (in oxide form) or 2000 g-dustor equivalent.
[3] Ground level releases of more than 10 g-T or 200g dust or equivalent would violate the CategoryIV (Extremely Unlikely) limits. Hence it is a safety function to provide an elevated releasepoint should releases above 10 g-T occur. This safety function is SIC-2.
[4] The failure of the component indirectly (e.g. time-wise or impact-wise) jeopardizes the abilityof a SIC-1 component to fulfil its safety function, or it provides support services to a SIC-1component.
[5] Category II limits: 1 g-T (in oxide form) or 0.5g dust or equivalent.[6] The failure of the component indirectly (e.g. time-wise or impact-wise) jeopardizes the ability
of a SIC-2 component to fulfil its safety function, or it provides support services to a SIC-2component
[7] The component implements either the Access Restriction System or Radiation Access Zone C .
FDR-Introduction Chapter II-Section 1.0-Page 15

TABLE 1.3.2-12Seismic Classification
SeismicClass
2A
2B
1
Design BasisSeismic Level
(IAEA)SL-2
SL-2
SL-1
Definition and Functional Requirements of Components
The SIC-2 or SIC-3 components which must satisfy the followingillustrative functional requirements in the event of the SL-2 earthquake:
The leak tightness to the degree assumed in safety analyses.No through-wall crack-Active safety functions.Displacement would not affect safety function of other SIC-2 or a groupof SIC-3 components.
The SIC-2 or SIC-3 components which must satisfy the followingillustrative functional requirements in the event of the SL-2 earthquake:
The fluid boundary maintains degraded but reasonable leak tightnessand flow passage.A crack should not propagate to cause dimensional instability.Active safety functions are not necessarily required.The support of the components remain functional.The absence of collapse, falling, or dislodgment of the components thatmay damage other SIC-2 or a group of SIC-3 components.
The SIC-3 components, not included in Seismic Class 2A or 2B.Note: A component may be classified from the point of view of investment protection rather than fromits safety importance.
FDR-Introduction Chapter II-Section 1.0-Page 16

TABLE 1.3.2-13General Acronyms
Acronym
ALARA
BPPCODAC
csDDD
DDR
ECEPP
FDR
FWGDRD
H&CD
HRS
HTSHV
HVAC
ICIDR
IPDD
LH
LOCA
LOFA
LOPALOVANB
PF
PFCPHTS
PSIR
RFRH
TCWS
TFVDEVVWBS
Definition
As Low As Reasonably Achievable
Basic Performance PhaseCommand Control & Data Acquisition, Communication
Central Solenoid
Design Description DocumentDetail Design Report
Electron CyclotronEnhanced Performance Phase
Final Design Report
First Wall
General Design Requirements Document
Heating and Current Drive
Heat Rejection System
Heat Transfer SystemHigh Voltage
Heating, Ventilation, and Air ConditioningIon Cyclotron
Interim Design Report
HER Plant Design Description
Lower Hybrid
Loss of Coolant Accident
Loss of Flow Accident
Loss of Site Power AccidentLoss of Vacuum AccidentNeutral Beam
Poloidal FieldPlasma Facing ComponentPrimary Heat Transfer System
Plant System Integration Report
Radio Frequency
Remote Handling
Tokamak Cooling Water SystemToroidal Field
Vertical Displacement EventVacuum VesselWork Breakdown Structure
FDR-Introduction Chapter H-Section 1.0-Page 17

J.t, •: r
Figure 1,3.2-1

Figure 1.3.2-2View of the ITER site

INTERNATIONAL THERMONUCLEAR EXPERIMENTAL REACTOR
TECHNICAL BASISFOR THE
ITER FINAL DESIGN REPORT, COSTREVIEW AND SAFETY ANALYSIS
(FDR)
Chapter IISection 2.0
ITER PLANT DESIGN DESCRIPTION
13 July 1998

CHAPTER IISECTION 2.0
ITER PLANT CONTROL & OPERATION
TABLE OF CONTENTS
2.0 ITER PLANT CONTROL & OPERATION 12.1 Plant control system 12.2 ITER plant operation 32.3 Plant operational sequence 4

2.0 ITER PLANT CONTROL & OPERATION
2.1 Plant control system
The integrated control and protection of the entire ITER plant will be achieved bythe command control and d_ata acquisition and communication (CODAC), theinterlock system, and the fusion power shutdown system (FPSS). A schematicdiagram of the entire plant control system is shown in Figure 2.1-1. Theinterlock system, independent of the CODAC system, ensures plant-widemachine protection, as well as personnel protection, in case of off-normal events.The FPSS is the safety class system independent from other plant control system.It is used in case of an off-normal event during plasma operation. The FPSS istriggered by detecting off-normal events occurring in the tokamak cooling watersystem (TCWS) and heat rejection system (HRS).
The CODAC system consists of a centrally-positioned supervisory control system(SCS) and subcontrol systems dedicated to each plant subsystem under thesupervision of the SCS.
Individual plant and diagnostic subsystems are directly controlled and monitoredby their own dedicated intelligent control system. The SCS controls thetransition of the entire ITER plant from one operation state to another, andprovides high level commands to plant subsystems, in order to achieveintegrated control of the entire plant. The SCS also monitors the operation stateof each plant subsystem to ensure it is operating within its proper operationalenvelope.
The interlock system monitors operational events of the plant, and performspreventive and protective actions to maintain the system components in a safeoperating condition. The ITER interlock system is also hierarchically structuredand has individual interlock subsystems which are dedicated to each plantsubsystem under the central supervisory interlock system.
FDR-ITER Plant Control and Operation Chapter II-Pagel

JO
3
a.
QIen
r?
s
Supervisory Control System
Operation Control SystemVVBS4.2
AdditionalHeatingPower
Supplies
Discharge Control System
WBS45CDiagnostic
Control
WBS45DData Management
SvsteftiWBS4.5GRemote
ExperimentSystem
SupervisorySynchronization System
WBS5.4LHH&CDSystem
WBS4.6AI I WBS4^CInterlock System I Access Control System Remote
andlinguipment
Fusion PowerShutdown Syste
(Safety System)
WBS6.8Plant Sampling
SysteihGa|DiStribufio6n> « WBS62«and Compressors

2.2 ITER plant operation
Operation of the ITER plant requires control, management, and coordination ofthe many large plant subsystems. The CODAC supervisory control systemcontrols and supervises operation of the entire plant system at the highest level.Local operation of each plant subsystem is executed by its own dedicated controland interlock systems. However, to ensure the operation of each plant subsystemis consistent with the operation of the entire plant, the supervisory controlsystem controls subsystem operation at the highest level, and supervises eachplant subsystem operation. It may intervene in the operation of each subsystemto take corrective measures when necessary.
To facilitate the proper management of the ITER plant operation, the concept ofITER plant operation states has been introduced. Permission and inhibition ofplant subsystem operations under each plant operation state can be defined. Allthe subsystems of the ITER plant are subject to the plant operation statemanagement control, and all the local operations of subsystems must beconsistent with the operation state of the entire plant. The CODAC supervisorycontrol system will set the subsystem operation states with appropriateoperational parameters. It will monitor, manage and check the operating statusof the ITER plant to ensure it is within the designated plant state envelope.
The supervisory control system also controls and monitors transitions betweenthe plant operation states. State transitions require careful coordination of theplant operation sequences to avoid accidents and damage to the plant system.For example, some plant subsystems can be brought into operation in parallel,while other subsystems must be sequentially started up.
A total of five plant operation states have been denned:
• Construction and Long-Term Maintenance State (LTM)
Most of the tokamak subsystems which require maintenance will beshut down. This state applies to the construction phase and to anymajor modifications of the ITER machine after initial construction, aswell as to long-term maintenance (> 30 days). Typical activities arelarge in-vessel and ex-vessel component replacement andmaintenance.
• Short-Term Maintenance State (STM)
This state is for maintenance activities which typically last for 1 to 30days. Relatively long time periods between plasma operation mayrequire that the plant be placed in this state with reduced or withouttoroidal field coil current. Decay heat removal will be taking place asappropriate. In this state, component maintenance and replacementwill be carried out mainly outside of the vessel which remains underhigh vacuum conditions.
FDR-ITER Plant Control and Operation Chapter II-Page3

Test and Conditioning State (TCS)
Wall conditioning operations such as baking, glow discharge cleaningand EC discharge cleaning, with or without baking, are major actionswhile the plant is in this operation state. TF and PF coil excitation testsmay be carried out. Additional heating system tests such as NB injectorion source conditioning, RF dummy load tests, and fueling system testsare allowed without any tokamak plasma.
During TCS no in-vessel or major ex-vessel maintenance may beinitiated. However, minor ex-vessel component maintenance andtrouble-shooting is allowed outside of the pit area.
Short-Term Standby State (STS)
This state implies that the final preparation of each subsystem iscompleted and that the plant is ready for plasma operation. Limitedtrouble shooting is allowed. Maintenance activity and conditioningoperations are not allowed in this operation state.
Plasma Operation State (POS)
The ITER plant subsystems which directly affect plasma operationreceive direct commands from the SCS during plasma operation. Nomaintenance activities are allowed in this operation state.
2.3 Plant operational sequence
Transitions of the ITER plant operation state can be represented by the followingschematic sequential function chart (SFC), Figure 2.2-1. SFC is a descriptionlanguage for sequential process with symbols and rules denned by IEC (1131-1). Ituses a graphic method to define sequence operation and provides multi-level ofdescription for the sequence. This SFC will be used in the project to describe thesequences of all the subsystem operations. Sequences described by SFC will beeasily translated into programming languages to be used for programmablecontrollers.
FDR-ITER Plant Control and Operation Chapter II-Page4

STM
SEQ8 p o s t 0STS
LTMConstruction &Long TermMaintenance
LIMIO
STM
5 T MShort Term
Maintenance
SEQ2 ^ SEQ5 STM toTCS
STSStand-by
n P 0 S
PlasmaOperations t a t e SEQ4
SEQ10?™'°
TCSTest&
ConditioningSEQ6
SEQ7
FIGURE 2.2-1ITER Plant State Transitions
Operation sequences of the state transitions are macroscopically represented byboxes labeled SEQn (n=l -10).
As an example, details of macroscopic sequence SEQl which is the transitionsequence from the long-term maintenance state to the short-term maintenancestate are shown in Figure 2.2-2, and Table 2.2-1. Details of other operationsequences of the transitions are found in PSIR.
FDR-ITER Plant Control and Operation Chapter II-Page5

SEQ.l: LTM to STM
S.S Power; Normal CODAQOperational Interlock,Operational
Check,O.K
V.V,Off -*POS(Low)Othere;Off-»DHR(Low)
FIGURE 2.2-2
LTM to STM Transition
A summary of changes in major plant subsystems before and after the transition
from LTM to STM are shown in the following table.
FDR-ITER Plant Control and Operation Chapter II-Page6

TABLE 2.2-1Plant Conditions (LTM to STM)
Plant Subsystem
Plant Control System
Magnet
Coil Power Supplies
Cryoplant
Fuelling
Vacuum PumpingTritium Plant
Primary HeatTransfer Systems(PHTSs)
Heat RejectionAdd. Heating
Add. Heating PSS
SS Electrical SS
Radiation monitoringWater distribution
Gas distribution
Cryostat
Before the Transition(LTM)
*Power: partially off
T = 300°K,p(cryostat) = lxlO5 PaAll coil current: off
All power: off
Stop (Power: off)Cryogen = 300°K
Torus valve: closed
stop, p = lxlO5 Pa*stop
V.V: Room Temperature(RT),pump:run/stop*stop or partial maintenance
*stop
stopOFF
Power on
Power: on, operational*stop
*stop= 1 x 10⁵ Pa, = 300°K
After the Transition(STM)
Power: on (operation)
T = 5°K,p(cryostat) = lxKT* PaAll coil current": off
TF: on (zero current)PF: off
Plant: Normal OperationThermal Shield = 80°KMagnet = 5°K
<—same
Run: normal,p = lxlCH Pa
ISS: 20°K, ADS:WDS:
V.V: ~100°Cothers: RT~120°C,Low flow mode
RUN: -25% FLOW
<— same (no change)
<— same (no change)
<— same (no change)<— same (no change)RUN: operational
RUN: operational
= lxlO"4 Pa, = R.T
Duration of theSequence
<30min
= 40 days
< 1 day
= 35 days
< 7 days
< 7 days
< 15 days
<7 days
< 1 day
< 1 day< 20 days
* : Depends on the maintenance schedule (requirement)
FDR-ITER Plant Control and Operation Chapter II-Page7

INTERNATIONAL THERMONUCLEAR EXPERIMENTAL REACTOR
TECHNICAL BASISFOR THE
ITER FINAL DESIGN REPORT, COSTREVIEW AND SAFETY ANALYSIS
(FDR)
Chapter IISection 3.0
ITER PLANT DESIGN DESCRIPTION
13 July 1998

CHAPTER I ISECTION 3.0
ITER PLANT LAYOUT AND BUILDINGS
TABLE OF CONTENTS
3.0 ITER PLANT LAYOUT AND BUILDINGS 13.1 General features of radiologically controlled buildings 43.1.1 General layout 43.1.2 Confinement strategy 53.1.3 Temperature, humidity and contamination control 63.1.4 Radiation and magnetic fields .63.2 Building configuration and equipment arrangement 73.2.1 Tokamak building configuration 73.2.2 Seismic isolation 93.2.3 Tokamak building equipment arrangement 103.2.3.1 Basemat level (-44 m) 123.2.3.2 Lower coil terminal level (-34.5 m) 123.2.3.3 Divertor level (-28.7 m) 133.2.3.4 Equatorial level (-22.45 m) 133.2.3.5 Upper coil terminal level (-13.7 m) 153.2.3.6 Upper TCWS vault level (-8.5 m) 153.2.4 Hot cell building 163.2.5 Radwaste building 173.3 Configuration of other buildings and structures 183.3.1 Cryoplant and PF coil magnet fabrication buildings 183.3.2 Magnet power conversion and plasma heating power supply
buildings 193.3.3 Ancillary buildings, structures and site improvements 203.4 Assessment 22

3.0 ITER PLANT LAYOUT AND BUILDINGS
A general policy has been to try to avoid crossing of different service types such aselectrical power, cooling water, and waste handling. Clearly, the extent to whichservices can be segregated decreases as they get closer to the tokamak. Followingthis policy, the tokamak is positioned in the center of the site, and electrical andcryogenic services enter from the west (compass directions are arbitrary), coolingand fueling services from the east, information-related interfaces from the south,and construction and waste handling interfaces from the north. Outside thetokamak building, systems which require a protected environment are located indedicated structures.
The overall ITER layout has been developed to minimize the connectiondistances and the complexity of system interfaces. The layout provides physicalspace for the buildings listed in Table 3-1 and the structures/areas listed inTable 3-2. The key number refers to the building designator shown in Figure 3-1.
Since the DDR, the following key plant layout changes have been made in theand size and location of buildings and structures:
• The Hot Cell and Radwaste Buildings have been reduced in size andfootprint area.
• The Personnel Building has been modified and relocated to allow theintroduction of two new access control structures.
• The Tokamak Access Control and Personnel Access Control Structureswere added to connect the Tokamak, Hot Cell, Tritium, Radwaste andPersonnel Buildings, creating a contiguous building envelope aroundall radiologically controlled zones. Both personnel and materials mustpass through these new buildings for access control and to receivedosimetry, protective clothes and equipment.
• The Emergency Power Supply Building has been increased toaccommodate 4 emergency diesel generators.
• The Magnet Power Supply Switching Network Building, and RFHeating Power Supply Buildings have been reduced in size, as allowedby changing client system requirements.
• The site infrastructure has been significantly advanced in design, andnow includes electrical distribution tunnels, below ground pipegalleries, and access control structures. The estimated cost of thisaccount has also increased significantly.
• All buildings and structures have been renumbered such that numbersreflect a group of buildings within a region on the site. The numberingsystem was also extended to provide unique numbers for each room orfunctional area in the buildings.
FDR-ITER Plant Layout and Buildings Chapter II-Section 3.0-Page 1
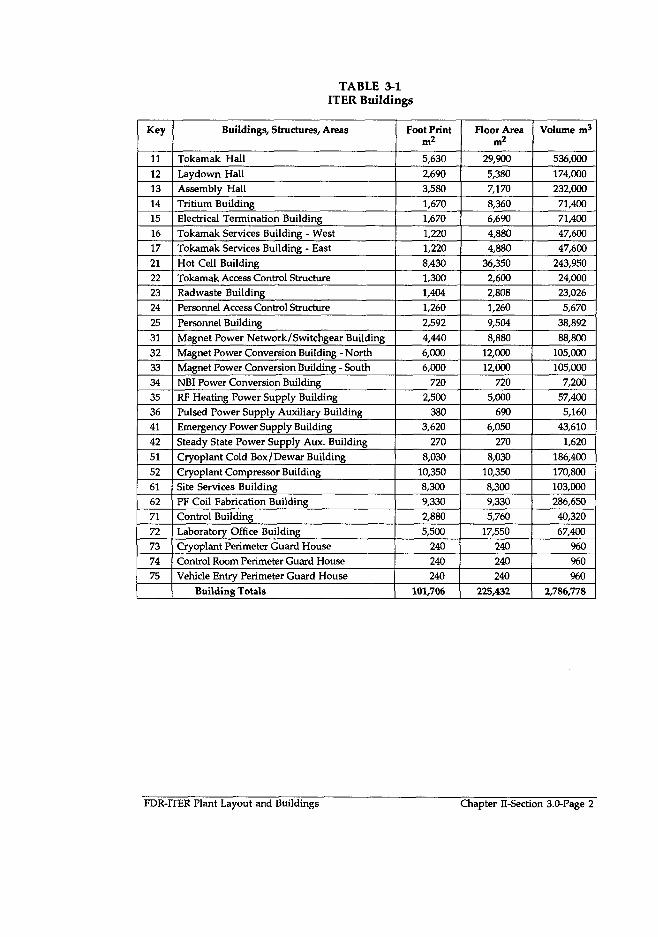
TABLE 3-1ITER Buildings
Key
11
12131415
1617
2122
23
24
25
3132
333435
3641
42
51
526162
71
7273
7475
Buildings, Structures/ Areas
Tokamak Hall
Laydown HallAssembly Hall
Tritium BuildingElectrical Termination Building
Tokamak Services Building - WestTokamak Services Building - East
Hot Cell BuildingTokamak Access Control Structure
Radwaste BuildingPersonnel Access Control Structure
Personnel Building
Magnet Power Network/Switchgear Building
Magnet Power Conversion Building - NorthMagnet Power Conversion Building - South
NBI Power Conversion BuildingRF Heating Power Supply BuildingPulsed Power Supply Auxiliary Building
Emergency Power Supply Building
Steady State Power Supply Aux. Building
Cryoplant Cold Box/Dewar Building
Cryoplant Compressor BuildingSite Services BuildingPF Coil Fabrication BuildingControl Building
Laboratory Office Building
Cryoplant Perimeter Guard House
Control Room Perimeter Guard HouseVehicle Entry Perimeter Guard House
Building Totals
Foot Printm 2
5,630
2,690
3,5801,670
1,6701,220
1,220
8,4301,300
1,404
1,260
2,592
4,4406,0006,000
7202,500
3803,620
270
8,030
10,350
8,3009,330
2,880
5,500240
240
240
101,706
Floor Area
29,900
5,380
7,170
8,3606,690
4,8804,880
36,3502,6002,808
1,260
9,504
8,88012,000
12,000720
5,000
6906,050
270
8,030
10,3508,300
9,3305,760
17,550
240240
240
225,432
Volume m3
536,000
174,000232,000
71,400
71,40047,600
47,600
243,95024,000
23,026
5,670
38,892
88,800
105,000105,000
7,20057,400
5,16043,610
1,620
186,400
170,800
103,000286,650
40,320
67,400960
960
960
2,786,778
FDR-ITER Plant Layout and Buildings Chapter II-Section 3.0-Page 2

TABLE 3-2ITER Structures and Areas
Key
37
4344
53
6364
Structures, Areas
Pulsed Power Switchyard
Diesel Fuel Storage TanksSteady State Switchyard
Gas Storage Yard
Cooling Towers and Basin
Plant Service Water Storage Basin and Tanks
Structure Total
Outdoor Storage /Expansion Areas
Parking Areas
Roadways
Area Total
Building Totals (from Table 3-1)
Grand Totals
Foot Print
70,000
2,500
22,000
9,00020,000
2,600126,100
30,000
50,000
130,000
210,000
101.706
437,806
In addition to the area required for buildings, structures and areas, the site layoutallows for access, roadways, separation, and similar requirements. Space must beallowed for passage of services such as electrical power, cooling water, andmovement of personnel and materials. Access must be available for all phases ofthe project, including construction, operation, maintenance, anddecommissioning. In total, the area enclosed in a fence to control public access isabout 70 ha, the same as required for the DDR design. The generic site continuesto assume availability outside the fence of approximately 60 ha of adjacentadditional space for construction-related facilities, temporary buildings, vendorwork spaces, cooling towers, and disposition of excavation spoils, even though itis possible that space requirements of this type could be satisfied by non-adjacentfacilities or areas.
ITER will be a regulated facility requiring the on-site use of controlled materialssuch as tritium. In anticipation of regulatory requirements, access to the ITERbuildings and facilities will be controlled in two stages. The site will have anouter perimeter, or site area boundary, which defines the zone where occupancyand land use are restricted. It will also have a second interior boundary whichencloses all radiologically controlled buildings. The area enclosed by the innerboundary is approximately 38 ha.
FDR-ITER Plant Layout and Buildings Chapter II-Section 3.0-Page 3

3.1 General features of radiologically controlled buildings
3.1.1 General layout
The radiologically controlled buildings include the tokamak hall and pit(described in more detail in Section 3.2), tritium building, laydown hall, hot cellbuilding, low level radwaste building, and personnel building. These buildingshave been designed to provide appropriate radiation shielding, ventilation,drainage, and access control. They are generally seismic class 2B, and designed toresist SL-2 earthquake criteria. Figure 3.1-1 shows the arrangement ofradiologically controlled buildings on the site. Other buildings are expected to befree of radioactive contamination, and access control will exist primarily forpurposes of accountability and industrial safety. Floor drainage fromradiologically controlled areas is collected in tanks where it can be monitoredand, if necessary, treated before it is released to the environment. Ventilationfrom the potentially contaminated radiologically controlled spaces in thesebuildings is routed to the plant gaseous exhaust stack, located on the roof of thetritium building.
Health physics and office amenities are located in the Personnel Building. Thisbuilding connects directly with the Personnel Access Control Structure whichcontains shower and change facilities, and provides the pathway for personnelentering the Hot Cell or Radwaste Buildings. The Personnel Access ControlStructure is contiguous with the Tokamak Access Control Structure. Belowgrade, this structure provides part of the shielded pathway for remote handlingvehicles and an electrical load center, and above grade it provides space forpersonnel access to the Tritium Building, the Laydown Hall basement, and theTokamak Pit. It also houses the radiological sample laboratory and a facility forintroducing large components to the Tokamak Pit without using the Hot CellBuilding.
When plasma-facing components are removed through the tokamak ports, theyare handled in sealed containers (casks) which move on a floor-supported air-bearing vehicle. To keep the weight of the casks below the maximum allowed bythe floor slab support capacity, the casks do not provide radiation shielding. Theshielding function is performed instead by the buildings and structures throughwhich the casks pass. The destination for all radioactive components andmaterials is the hot cell building. The air-bearing transportation system providesaccess for remote handling equipment at tokamak ports at the equatorial anddivertor levels. Objects will exit the tokamak pit via a lift shaft located in thegallery space and be delivered to the elevation of the Laydown Hall basement.
FDR-ITER Plant Layout and Buildings Chapter II-Section 3.0-Page 4

3.1.2 Confinement strategy
All the ITER buildings and spaces where tritium or tritium-bearing componentsand materials will be used are being designed to control radiation and radioactivecontamination. The ITER plasma will also produce large quantities of energetic(14 MeV) neutrons which will interact with ITER materials and coolant to createsome activated material. Buildings where activated material will be handled arealso being designed to appropriate requirements.
In particular, the ITER plant is being designed to limit releases of radioactivematerial to the environment, and radioactive exposure to workers and thepublic. Confinement for ITER is achieved by establishing one or more barriersaround the various radionuclide sources. Mobilizable inventories in excess of100 g of tritium (or equivalent activation products) require two highly reliable(failure rate less than 10"3per demand) confinement boundaries. Mobilizableinventories less than 1 g of tritium (or equivalent activation products) requiretwo boundaries of moderate reliability (failure rate less than 10"1 per demand).Inventories between these extremes require one highly reliable boundary andone boundary of moderate reliability. The main function of the secondconfinement barrier is to prevent spread of radioactive materials following afault of the first confinement barrier.
For the plasma and tokamak interior surface sources, the first confinementboundary is provided by the vacuum vessel. For the tokamak cooling water, thefirst confinement boundary is provided by the coolant system piping andequipment. The second confinement is more convoluted, and is formed by thefollowing structures:
• cryostat vessel with its ports;
• Tokamak Cooling Water System (TCWS) vaults and connecting ducts;
• heat transfer system guardpipes (top port) and port interspace(equatorial and divertor ports) that extend beyond the cryostat;
• enclosures or cells of ancillary equipment if their internal volumes arepart of the first barrier, e.g., neutral beam injector cells, fueling ductsand cask, and pumping ducts and casks;
• gloveboxes and enclosures in the tritium plant.
Figure 3.1-2 illustrates the basic configuration of both confinement barriers. Foreach penetration from the VV, the first confinement barrier is truncated byappropriate equipment, e.g., port plugs (top W port), shield plugs (equatorialand divertor ports), EC and IC systems windows and feedthrough insulators, NBinjector box, and isolation valves for fueling and pumping lines. The first barrieris always surrounded by an enclosed space (e.g., a guardpipe) that is part of thesecond confinement. Guardpipes and similar enclosures are generally designedto connect to an expansion volume, such as the TCWS vaults via rupture disks.
FDR-ITER Plant Layout and Buildings Chapter II-Section 3.0-Page 5

Outside of, and surrounding the second confinement barrier, building spaces areconfigured and equipped with HVAC systems to assure that the pressuregradient, and hence the air flow, is always in the direction which is toward areasof higher contamination, and exhaust flow is always directed to the elevatedplant stack.
3.1.3 Temperature, humidity and contamination control
For tokamak assembly it is necessary to maintain the temperature at 25 ± 1°C,from the bottom of the pit up to an elevation of 5 m and relative humidity< 70%. A dust loading goal of < 100,000 particles/m3 (0.3 micron) has been set inorder to assure quality in the assembly process. When tokamak assembly iscomplete and the cryostat and tokamak systems are closed, temperature and airquality maintenance requirements are less restrictive.
Systems are being designed to provide suitable air change rates and to removeheat rejected to air in the building. The heating, ventilation, and airconditioning (HVAC) systems also play an important role in maintainingacceptable levels of airborne radioactive contamination. Potentiallycontaminated air is treated by filters, detritiation systems, and directed to theplant stack. Dryers are included in the HVAC systems for the TCWS vaults tocapture water which may be tritiated due to chronic small leaks in the PHTSsystems. The air space between the cryostat and the bioshield is also treated witha dryer to remove moisture from this region and minimize the radiolyticformation of corrosive acids. The HVAC system is also designed to respond topotential accident events. HVAC for building spaces which are potentiallocations for loss of vacuum accident (LOVA) events are equipped with high-efficiency particulate filters. Areas where the release of elemental tritium ortritiated water is possible are equipped so that the exhaust flow can be passedthrough a vent detritiation system (VDS) which can remove atmospheric tritiumwhich is in the form of water.
3.1.4 Radiation and magnetic fields
When tokamak operations begin, magnetic and radiation fields will be generated.During pulsing operations, these fields will be sufficiently large to excludehuman access to the tokamak pit and gallery region. In addition, it is expectedthat there will be no need for personnel access in the below ground portions ofthe tokamak hall, electrical termination building, or tritium building. While themagnet and radiation fields in these areas are not expected to be high enough toexclude operators, industrial safety considerations will make it prudent to designthese areas for operation without the presence of plant staff. Magnetic fields arealso expected to be high enough to warrant exclusion of personnel from the topof the tokamak bioshield during operation.
FDR-ITER Plant Layout and Buildings Chapter II-Section 3.0-Page 6

The radiation fields which will exist during D-T pulsing have been estimated,and detailed calculations of radiation levels throughout the tokamak buildingare continuing. These fields will be important due to their effect on materialsand electronics in the tokamak pit and will prevent human access to some areas.The gamma ray fields from activated materials will be present at all times afterD-T operations have begun. These fields are the composite of emissions due to afew isotopes. The field strength decreases rapidly as short-lived isotopes decay,then remains fairly constant as longer lived isotopes dominate. To minimizeoperator exposure, entry into the tokamak pit for extended periods will notnormally be permitted without supervision within 24 hours of a 1000 s burn D-Tpulse.
The radiation fields experienced by operators performing maintenance orexperimental work in the tokamak pit will vary with the location in the pit andthe design of the radiation shielding. Detailed calculations to determine theexpected field strength in the pit as a function of the time after a D-T pulse arebeing performed. In addition, the radiation design will be consistent withALARA principles.
3.2 Building configuration and equipment arrangement
3.2.1 Tokamak building configuration
The tokamak building dimensions and layout have been revised slightly sincethe Detail Design Report (DDR). Structurally, the assembly hall and laydown hallremain independent of the tokamak hall, even though they form a continuouscrane bay. The tritium building and electrical termination buildings arestructurally connected to and support the superstructure of the tokamak hall.The overall dimensions of these buildings are the same, but for layout reasons,the number of floor slabs within the buildings are different. These differenceshave been factored into the analyses and no difficulties were detected.
The key changes made in the tokamak pit and gallery layout are the following:
1. relocation of the large 100 t lift to a position in the gallery opposite port3 (it had formerly been opposite port 4);
2. rails for the cask transportation system will no longer be requiredbecause vehicles using air bearings have been selected for casktransportation between the pit and the hot cell building;
3. elimination of the false floor at the divertor level and relocation of theslab to provide access directly off the slab to the divertor ports;
4. relocation of IVT cells to ports 3 and 13 from ports 8 and 18, inconjunction with the lift relocation;
FDR-ITER Plant Layout and Buildings Chapter II-Section 3.0-Page 7

5. relocation of component handling cells to ports 8 and 18 from ports 3and 13, in conjunction with the lift relocation.
The structural configuration of the tokamak building is depicted in Figures 3.2-1and 3.2-2.
The tokamak hall and pit are of reinforced concrete construction. The pitbasemat is circular, and 6 m thick with the top of the slab at elevation -44.0 m (allelevations are referenced to the tokamak building crane hall floor, at groundlevel or elevation 0.0 m). The tokamak building underground structure containsthree concentric cylindrical regions, defined by the 1.26 m thick bioshield whichhas an outside surface made of 20 flat facets which inscribe a circle 40 m indiameter, the pit wall, which has an inside diameter of 60 m, and the gallery wall,which has an inside diameter of 84 m. The pit and gallery regions are divided byhorizontal slabs to create the rooms and spaces which house the equipment andprovide access to the tokamak. The equipment arrangement at each level isdescribed in Section 3.2.3.
The cryostat space, inside the bioshield, extends from the top of the basemat at-44 m, to ground level. The cylindrical cryostat has flat top and bottom heads andis 36.48 m in diameter. It occupies the regions inside the bioshield between about-3 and -37 m. The weight of the cryostat and tokamak are supported on a ringpedestal which extends from the top of the basemat. A removable shielding slablocated at the top of the ring pedestal protects equipment located below thecryostat and creates a space which could be used to wind replacement coils for PFcoils 4, 5, 6, 7, 8 or 9. When tokamak assembly is completed, the cryostat top headwill be set in place. This part of the cryostat is constructed with a deep integraltruss system so that the flat top head can support atmospheric pressure and theweight of precast concrete shielding.
The tritium building, electrical termination building, and the upper, rectangularpart of the tokamak building, are supported on a common slab at -12.7 m. Thegallery wall stops at this level, however the cylindrical pit wall and bioshieldcontinue until they intersect the slab at ground level. Columns which form thesuperstructure of the building are aligned to be supported on the pit wall,resulting in a crane bay outside width of 64 m. Two columns on each side of thebuilding are truncated in order to prevent them from interfering with the galleryspace. To support the structural loads for these columns, the columns on eitherside of the truncated columns are increased in size. A heavy wall is placedbetween the increased columns and the truncated columns are supported on thiswall. Because the slabs at ground level and -12.7 m are interrupted by the cryostatspace, the above ground tokamak hall columns would not be adequately strong ifthey were unsupported in the east-west direction. To provide lateral stiffness,the frames of the tritium and electrical termination buildings are made heavierand are integrated with the tokamak hall columns above the galleries.
FDR-ITER Plant Layout and Buildings Chapter II-Section 3.0-Page 8

In the assembly hall and laydown hall, dimensions have been selected to create acontinuous building. The basemat slabs of both buildings have been set at-12.7 m, to facilitate construction and penetrations between the buildings. Theheight of the crane rail is determined by the assembly requirements, and is set at+30 m. To provide resistance to lateral loads, this elevation is also selected forthe top of the framing in the tritium and electrical termination buildings.Structural floors in these two buildings have been set according to the needs ofthe equipment to be located there. Currently, floors are provided at ground level,+10, and +20 m for the Electrical Termination Building and 0.0, +7.5 +15, and+22.5 m for the Tritium Building. Non-structural intermediate floors can also beprovided to facilitate equipment arrangements.
The below ground region in the assembly hall is dedicated to diagnostic andexperimental systems, and will provide space for ITER experimenters for signalacquisition, isolation, and conditioning. It is also expected that non-structuralintermediate floors can be introduced to better utilize this space. The belowground region in the laydown hall is dedicated to storage of remote handlingtransport casks, NBI power supply ducts and cooling systems, remote handlingand access control to the galleries and pit.
3.2.2 Seismic isolation
Seismic isolation, if required, will be achieved by introducing flexible bearings inthe load path between the earth and the structure to be isolated. Considerableexperience exists with the use of this concept in buildings, bridges, and powerstations. Many designs for isolation bearings have been developed, but the mostwidely used design consists of bonded, alternating layers of steel plate andsynthetic rubber. Bearings of this type are typically up to 1 m in diameter, andcan carry up to 15001. They are very stiff vertically, but allow large horizontalmovement. Their relative softness in the horizontal direction protects theisolated components from horizontal earthquake acceleration, but also leads tolarge relative displacements between the isolated and non-isolated portions ofthe building. A gap of about 10 to 20 cm is required to accommodate the relativemovement, however about 1 m is estimated to be needed in order to constructthe tall, vertical walls of the isolated and non-isolated portions adjacent to eachother. The systems and services which cross this gap must either be designed toaccommodate the relative motion by flexing or sliding, or their failure will bedesigned to be tolerable.
In the trade study (for the various potential seismic gap configurations) whichwas performed, a requirement was made that no torus vacuum extensions,cryostat vacuum extensions, primary coolant boundaries, or confinementboundaries be allowed to cross the seismic gap. It was also considered highlydesirable if the design could be implemented in a way to preventsuperconducting busbars from crossing the gap and to install the TF coils fastdischarge switches on the isolated portion. A range of potential locations for theseismic gap were evaluated.
FDR-ITER Plant Layout and Buildings Chapter II-Section 3.0-Page 9

The design selected for seismic isolation places the seismic gap at the tokamak pitwall, and creates an isolated "tokamak pit" with an outside diameter of 64 m.Figure 3.2-3 shows the tokamak building cross section for the seismic isolationdesign which could be implemented should the choice of site make it necessary.The following additional structural changes would be required:
1. An intermediate tokamak pit basemat. This structural element will besupported on the isolation bearings, which will in turn be supported onthe basemat of the unisolated building. Both of these slabs must bevery stiff, to accommodate the point loadings at the bearing locationsand to avoid secondary vibration modes in the tokamak pit. Thetokamak, bioshield wall, and tokamak pit wall are supported on theintermediate basemat.
2. A secondary pit wall. This outer wall is part of the non-isolatedstructure and connects the unisolated basemat with the gallery slabsand the unisolated building basemat at -12.7 m. This wall also carriesthe vertical loads of the building superstructure to the basemat.Because the secondary pit wall must be larger than the tokamak pit, thecrane bay becomes wider with seismic isolation.
The only system which would need to be designed to accommodate the seismicmotion without failure is the vacuum vessel cooling system, which has thesafety function for removal of decay heat. Other systems which contribute toaccident response, such as HVAC systems, can be designed to perform theirfunction even if they suffer some damage (e.g., partial collapse or distortion ofductwork). Most other systems can be designed to accommodate some seismicmotion. The cost of such design modifications must be balanced against the costof damage, including consequential damage to other components. Secondarycooling services and normal busbars may need to be designed with flexibility.Other systems such as neutral beam injection high voltage transmission ductsand remote handling connections, may have such a high cost to design forflexibility that it will be decided to expect and allow the component to fail in theevent of a severe earthquake. Decisions on the design features foraccommodation of seismic motion must be taken on a case-by-case basis.
3.2.3 Tokamak building equipment arrangement
The layout must satisfy many requirements from machine performance,assembly, maintenance and safety, while meeting component functionalrequirements and minimizing overall cost. Specifically, the equipmentarrangement and pipe routing must provide access for timely maintenance andinspection operations, using remote or hands-on methods as appropriate. Itmust be such that the time required to complete remote handling (RH) Class 1and 2 operations is acceptable (e.g. without interruption of cryostat vacuum), andRH Class 3 operations are feasible. Installation of hardware must be feasible andin accordance with the ITER assembly procedures and the construction plan. Thestructural integrity of building features, such as support columns and slabs, mustbe preserved. Safety requirements which must be considered include
FDR-ITER Plant Layout and Buildings Chapter II-Section 3.0-Page 10

suppression or mitigation of fire and cryogenic hazards, confinement ofradioactivity, preservation of personnel protection barriers, minimization ofinventories of hazardous materials and of hazardous waste, and provision ofpersonnel escape routes via stairs and lifts.
In addition, if seismic isolation is used, relative motion between the isolated andnon-isolated portions of the structure must be accommodated.
The equipment in the pit is separated into six levels, shown in Figure 3.2-4."Vaults", which provide secondary confinement, are located at the top and thebottom of the pit and house elements of the Tokamak Cooling Water System(TCWS). Locating these vaults next to the machine, in the tokamak pit,significantly decreases the number of pipes that must cross the seismic gap ifseismic isolation is used. This arrangement also minimizes the total length ofPHTS pipes. Two other vaults, providing secondary confinement are built at theequatorial level around the NB injectors and around the Test Blanket Modules.Two levels are provided for magnet components. All magnet busbars andcryolines are routed to these levels, where the coil terminal boxes (CTBs) arelocated. The use of separate areas dedicated to magnet components in the pitreduces the risk of damage due to arcing between components. In particular,separation of the busbars and cryolines from PHTS pipes is important and isaccomplished by separating the upper coil terminal level and upper TCWS vault.By locating the CTBs in the pit, normal rather than superconducting busbarswould cross the seismic gap if seismic isolation is used. The design featureswhich would be required to accommodate seismic motion in normal busbars aresimpler, cheaper, and more compact than those for superconducting busbars.
The equatorial and divertor levels accommodate the removal of componentsfrom the tokamak. Large casks on transfer vehicles must be able to enter theselevels and dock on divertor and equatorial ports for remote handling operations.The layout must provide a path for the transport of casks by remotely controlledair bearing vehicles from the tokamak to the hot cell.
Air bearing vehicles were selected over wheeled vehicles riding on a fixed railsystem primarily because they avoid the requirement for an embedded rail in thefloor structure and are able to execute more complex motion. Industryexperience with air bearing vehicles indicates that acceptable reliability can beobtained particularly if two diverse navigation systems are used and sufficientredundancy or overdesign of drive components are incorporated. The questionof radiation sensitivity of the air bearing system was addressed and there appearto be no problems that cannot be solved by modest local shielding (if required)and preventive maintenance.
FDR-ITER Plant Layout and Buildings Chapter II-Section 3.0-Page 11

3.2.3.1 Basemat level (-44 m)
The divertor and the limiter and outboard baffle (L/OBB) primary heat transfersystems (PHTS) pipes are routed to this vault through shafts, the "vault-to-vaultpipes shafts", which connect the upper and lower vaults as shown in Figure 3.2-5.The lower TCWS vault is located at the basemat level. The divertor and limiter(DIV/LIM), the primary first wall and outboard baffle (PFW/OBB) PHTS arelocated here (see Section 4.6); they share a chemical and volume control system(CVCS). The equipment layout leaves a 3 m wide path on the outer perimeter ofthe lower TCWS vault clear for transport of components to the lift.
The vacuum vessel pressure suppression tank, and the drain tanks for theDIV/LIM and PFW/OBB PHTS are located beneath the tokamak. Thesuppression tank is connected to the vacuum vessel at four positions via thedivertor RH ports. Pipes and cables from this equipment are routed from thelower TCWS vault to the lower coil terminal level gallery, then to grade alongthe outer walls of the galleries at four positions.
3.2.3.2 Lower coil terminal level (-34.5 m)
Coil terminal boxes (CTBs) and the associated U-bend boxes for PF coils 4, 5, 6, 7, 8and 9, the CS, and for the side and bottom correction coils are in the pit at thislevel. U-bend boxes are located in front of the penetrations in the verticalbioshield because neutron shielding is incorporated into the boxes. CTB toroidalpositions were selected to facilitate routing of the busbars and cryolines inside themachine and to minimize the length of the cryogen manifolds in the pit.Cryolines, busbars and quench manifolds circle the bioshield, and are above andconnected to the CTBs. Locating these manifolds in the pit also minimizes thenumber of pipes that must cross the seismic gap if seismic isolation is used.Additional headers, which service the divertor ports, are located between themagnet-related headers and the bottom of the divertor slab.
Normal busbars from each of the CTBs exit the pit, and are routed around thegallery to shafts on the west side of the machine for vertical routing out of thepit. The position and dimensions of the shafts, and the space available forvertical routing of pipes, are defined by penetration restrictions in the slabs andthe path of casks in the galleries at the equatorial and divertor levels. The maincryolines from the manifolds in the pit are routed together with the busbars tothe basement of the electrical termination building, where the auxiliary coldboxes for the cryodistribution system are located.
Additional equipment which is located in the pit at this level includes: valveboxes for cryogenically cooling the support structure and thermal shields, the Hepumping system for the cryostat, and grounding equipment. Space for remotehandling access is also provided at four symmetric positions. Additionalequipment located in the gallery includes: motor control centers for the powerdistribution system and PHTS dryout systems which service the lower TCWSvault.
FDR-ITER Plant Layout and Buildings Chapter II-Section 3.0-Page 12

3.2.3.3 Divertor level f-28.7 m)
Figure 3.2-6 shows a plan view of this level. Four symmetrically located divertorports are used for the installation and removal of divertor cassettes. Shield wallswhich run from the divertor slab to the underside of the slab above are locatedon both sides of these ports in the pit, to facilitate the RH Class 1 operations.These walls are aligned with similar walls at the equatorial level for structuralreasons. Diagnostics will be integrated into these ports, and will require routingof pipes and services.
The remaining 16 ports at this level house the cryopumps for the torus. A cask,containing the pellet injection system, will be "parked" in front of port #19. Thiscask will be moved when maintenance of the cryopump in port #19 is needed.Cryogen pipes exit the cryopump ports on one side and are routed into cryogenvalve boxes which are attached to the bioshield plug. These valve boxes arelocated as close as possible to the machine in order to minimize cryopumpcooldown time and cryogen consumption. From the boxes, the pipes are routeddown to headers which circle the bioshield beneath the divertor slab.
Additional service pipes (i.e., guard vacuum, leak detection, etc.) are routed fromall 20 ports down to additional headers located beneath the divertor floor.Divertor PHTS pipes exit the top of each of the 16 cryopump ports and sides ofthe 4 RH ports so that interference during the removal of divertor cassettes orcryopumps is minimized. Valve boxes for the fuel injection system are locatednear five divertor level ports.
3.2.3.4 Equatorial level (-22.45 m)
The allocation of ports and arrangement of large equipment at the equatoriallevel is given in Figure 3.2-7. With the exception of the remote handling (RH)and neutral beam (NB) injector cells, transfer casks will be docked at the ports forthe removal of components from the tokamak and the ports.
The allocation of ports allows for the creation of a single cell for the threeadditional heating NB injectors and the diagnostic NB injector. Since theinjectors represent an extension of the torus vacuum outside the cryostat andbioshield, this cell performs both confinement and shielding functions. Limitedhands-on maintenance will be done in the cell.
Four ports, symmetrically located, are dedicated for in-vessel RH operations atthe equatorial level. At two of these ports (#3 and #13), sealed cells providingshielding and containment, are used for storage and deployment of the in-vesseltransporter (IVT). Transfer casks may be docked to the side of these cells, formovement of hardware to and from the cells. At the blanket module transferRH ports, #8 and #18, shield walls in the pit run from the equatorial slab to theunderside of the slab above, and shield doors isolate the cells from the gallery, inorder to facilitate parallel maintenance operations at other ports. Casks aredocked directly to the cryostat flange for in-vessel remote operations at theseports. Because of the symmetry requirement, the ports allocated to remote
FDR-ITER Plant Layout and Buildings Chapter II-Section 3.0-Page 13

handling are determined by the ports selected for the grouped neutral beaminjectors. The ports selected minimize interference of the RH and injector cellswith the building columns.
Five ports are allocated for the IC, the LH, the EC, and the EC start-up plasmaheating systems. These RF systems are assigned to ports which are not in linewith the neutral beam injectors, which could potentially damage them if thebeam is not completely stopped by the plasma. Ports on the west side of themachine have been allocated to the IC system, where the distance to the tuningunits, located in the electrical termination building, is minimized. If LH is used,this system will have to share with IC the number of dedicated ports. Thegenerator supplies for this system will be installed in the Tokamak ServicesBuilding. Ports on the southwest side of the machine have been allocated to theEC system. Here, the distance to their power supplies is minimized. For each ofthe RF systems, a bundle of waveguides is routed from the port to the powersupplies (via the tuning units for the IC) by a route to minimize the length andnumber of bends. The layout of equipment and services presented hererepresents an enveloping case for heating and current drive systems, with all ofthe space needed for the largest combination of them, since the decision onwhich heating and current drive systems will be deployed has yet to be made.
Four ports are allocated to the test blanket modules enclosed by a vault which hasshielding and containment functions. In general, ports on the east side of themachine are used, as additional space in the tritium building is used to housesome of the test blanket tritium recovery systems. A 4 m wide space directly infront of the ports is left for access by transfer casks. The space on either side ofthis corridor, within an 18 degree sector for each port, is allocated for test blanketmodule auxiliary equipment, such as the cooling systems. Locating test blanketmodules in adjacent ports allows "sharing" of the space between ports. Dumptanks (for the coolant of some of the test blanket modules) are located at thedivertor level, so that passive draining of the module coolant is possible.
Diagnostics will share several equatorial ports with other systems. Additionally,four ports (7, 9, 16, and 17) are dedicated to diagnostics. This choice for thediagnostic ports give the most effective installation of the control and protectiondiagnostics, and particularly the coverage for the plasma/first wall viewingsystems, within the constraint of the number of ports available for diagnostics.At three of these ports, similar to those for test blanket modules, the space oneither side of the transfer cask corridor will be used for "permanent" diagnosticequipment, such as electronics cubicles.
Torus and cryostat roughing pump pipes exit the machine at the equatorial levelin order to minimize the length to the tritium building. Service manifolds, arelocated above the ports to supply pumping, leak detection, pneumatic gases, etc.to the equatorial ports. PFW/OBB PHTS pipes exit the bottom of each of the 20equatorial ports. These pipes are routed in guard pipes to the pipe shafts next tothe bioshield, which connect to the lower TCWS vault.
FDR-ITER Plant Layout and Buildings Chapter II-Section 3.0-Page 14

Space has been allocated for electronics cubicles to service the systems in theequatorial ports along the outer gallery wall between pipe shafts, at the positionsshown in Figure 3.2-7. Groups of cubicles are enclosed by shielding to protect theelectronics from radiation emitted by passing casks. Motor control centers whichare part of the power distribution system are located along the outer wall of thegallery as well. For the IC, EC, and the dedicated diagnostics ports, 9, 16, and 17,cubicles will be located in the pit.
3.2.3.5 Upper coil terminal level (-13.7 m)
Generally, the rationale for the arrangement of magnet equipment at the lowercoil terminal level applies to this level as well. The coil terminal boxes for PFcoils 1, 2, 3 and 4 as well as for the top correction coils and TF coils are locatedhere. TF switch components are located on either side of the TF CTBs. Locatingthe TF CTBs and switches in the pit greatly reduces total busbar length (andhence, cost), because TF components are interconnected inside the pit. It alsoreduces the number of busbars that must cross any seismic gap. Similar to thelower coil terminal level, cryoheaders and pressure relief headers are routedabove the CTBs. Additionally, the busbars interconnecting the TF magnetcomponents are routed in this area. The layout of magnet equipment androuting of the busbars and manifolds in the pit is such as to leave space at theouter perimeter of the pit for personnel and component movement.
Busbars and cryolines exit the pit and are routed to the west side of the machine.The busbars join those from the lower level to penetrate the ground level slab inthe electrical termination (ET) building, taking into consideration structuralrestrictions regarding the location of the penetrations. The cryolines are routed,together with those from the lower coil terminal level, to the auxiliary cold boxesfor the cryodistribution system located in the basement of the ET building. Thelocation of the cold boxes at the -12.7 m level and the toroidal positions wherethe cryogen lines exit the pit (at both the upper and lower coil terminal levels)were determined together so as to minimize the length of the cryogen lines.
The high voltage decks for the Neutral Beam (NB) injectors are located north ofthe machine at this level. Locating the decks close to the NB injectors shortensthe length of the transmission lines, which has cost and performanceimplications. Diagnostic enclosures, servicing diagnostics in equatorial port 7 arealso located in this area. Figure 3.2-7 also shows space north of the lift which iskept clear for the transport of casks to the hot cell.
3.2.3.6 Upper TCWS vault level (-8.5 m)
The PFW/IBB PHTS systems are located in the upper TCWS vault. Two CVCSunits, servicing five loops each, are included. A 1.5 m wide corridor, around theouter edge of the pit, is maintained for personnel movement and the transport ofsmall components.
FDR-ITER Plant Layout and Buildings Chapter II-Section 3.0-Page 15

A ring header which supplies gasses to the gas injection system is located in theupper TCWS vault. Branch pipes from this header are routed through five ofthe upper vault to lower vault pipe shafts to valve boxes located at the divertorlevel. Additionally, branch pipes are routed to five valve boxes located in theupper TCWS vault. The main supply line for the gas injection system is routedfrom the tritium building to the header through the upper vault.
The cryostat high vacuum pumping system is located in the top of the cryostatbelow the bioshield. Service headers (like those at the divertor and equatoriallevels) which supply pumping, guard vacuum, leak detection, etc. to the upperports, are located above the bioshield. Valve boxes and cryopumps which arepart of the pumping system are connected to these headers.
Diagnostics will be routed through the ten vertical upper ports. Pipes and cablesfrom these systems will be routed from the ten port positions toroidally throughthe trusswork of the cryostat top head to discrete locations where "bundles" willbe routed away from the machine. Pipe and cable bundles will be routed easttowards the tritium building, south towards the diagnostics hall, and westtowards the cryoplant. The bundles will generally be routed through trenches inthe non-structural shield above the TCWS vault.
3.2.4 Hot cell building
The hot cell and radwaste requirements and assumptions, which form the basisfor the current design, are still under consideration, so the details given belowshould be considered preliminary.
The hot cell building will be constructed using cast-in-place reinforced concrete.Docking ports in the below-ground area allow the remote handling system totransfer objects into shielded cells where they can be inspected anddecontaminated. The airlock cells used for this process will also connect tostorage cells which provide temporary storage until the component can berepaired or processed as waste. Overhead manipulators serving the storage cellsare used to lift objects and place them in storage locations. Other spaces in thebelow-ground portion of the building are used to clean, store, prepare, and testthe remote handling equipment. Casks are stored in the Laydown Hall basementwhen not in use. An access shaft will allow non-radioactive objects to enter thetransportation corridor and utilize the pathway to transfer material into or out ofthe tokamak pit.
The interior of the above-ground portion is divided into a number of thick-walled cells. The cells are used for repair of components such as divertorcassettes and diagnostics. Components which are not repairable are transferred tocells that process them into a stable, shipable waste form. Each of the primaryprocessing cells is equipped with a maintenance cell, where new parts andmachines can be introduced, or failed machines can be repaired. All cells areconstructed with walls and slabs thick enough to allow routine operator access tothe outside surface, typically about 1.35 m thick. The cells are arranged so thatoperators will be able to operate process controls from exterior locations near to
FDR-ITER Plant Layout and Buildings Chapter II-Section 3.0-Page 16

the process machinery, and to obtain visual feedback on the process via shieldedwindows in many locations. The building exterior will enclose all the cells, andprovide space for HVAC equipment and services. Waste which is generated inthe hot cell building and other radioactive material which is removed from thetokamak pit is sealed in containers for off-site disposal by the host country. It isintended that the ITER facility will be able to package materials so that they donot require any further processing prior to disposal by the host. The hot cellbuilding also contains a storage area designed to hold the average amount ofwaste which is generated over a six month period.
3.2.5 Radwaste building
The low-level radwaste building provides space for systems which process mildlycontaminated water. Floor drainage from radiologically controlled buildings,laboratory and primary heat transfer systems equipment drains, and shower andlaundry drains, are treated here. Paper, plastic, and other dry solid material arecollected and stored in the hot cell building for appropriate packaging. The low-level radwaste building is configured to facilitate the handling of loaded filterand demineralizer beds from both CVCS systems and liquid waste treatmentsystems. The low-level radwaste building will be constructed using cast-in-placereinforced concrete.
Highly radioactive, metallic objects will generally be subjected to in-situdetritiation in the tokamak prior to any maintenance campaign. After they areremoved to the hot cell building, they will be further de-contaminated usingmechanical cleaning processes, reduced in size to satisfy host country wastedisposal requirements, and packaged for transport and disposal. Some metallicradwaste objects will also be processed to mechanically separate beryllium fromother materials. Recovered beryllium will be detritiated using a hot vacuumbakeout process, so that waste beryllium can be treated as a hazardous non-radioactive material, minimizing the need to treat it as mixed (both hazardousand radioactive) waste.
Primary coolant will be continuously cleaned by chemical and volume controlsubsystems (CVCS) to remove particulate and ionic material, some of which mayhave become activated. When the CVCS filters and demineralizer beds reachtheir end of service life, the filter medium or demineralizer resin bed will bereplaced. The spent filters and demineralizer beds may be treated as wet solidradioactive waste and packaged for disposal. Alternatively, ITER may havefeatures which would allow backwashing of filters or regeneration of CVCSdemineralizer beds thereby reducing the waste volume.
Whenever primary coolant is intentionally removed from the system, it will becollected in drain tanks. Normally, primary coolant systems will be refilled fromthese tanks to resume operation. Occasionally, it will be necessary to removeprimary coolant to the waste systems. Water which is known to have a hightritium content including primary coolant, water which is spilled onto the floorand collected in drains within the radiologically controlled areas, fluid fromlaboratory drains, and decontamination fluid, will be collected in tanks in the
FDR-ITER Plant Layout and Buildings Chapter II-Section 3.0-Page 17

radwaste building and treated in a dedicated, tritiated waste process stream. Fluidwill be sampled before and after processing. This process stream will include oilseparators, filters, and demineralizers. If the product water meets thespecifications for primary coolant, but exceeds the allowable tritium content forrelease to the environment (the usual case) it will be sent to the waterdetritiation system where tritium will be extracted and detritiated water can bedischarged. If the water does not meet primary coolant specifications, it must berecycled until additional particulate and ionic activity have been removed. Thefilter beds and demineralizer resins from this stream will also be treated as wasteand handled in a manner similar to the primary coolant CVCS filters anddemineralizers.
3.3 Configuration of other buildings and structures
In addition to the radiologically controlled buildings, the remaining buildingsand structures can be divided into three groups, according to major function.(1) cryoplant and PF coil fabrication buildings, (2) magnet power conversion andplasma heating power supply buildings, and (3) other buildings and siteimprovements. Design of these buildings and structures is quite straightforwardand does not present any problems. The main effort in these areas has beenfocused on refinement of requirements for these structures and equipmentlayout.
3.3.1 Cryoplant and PF coil magnet fabrication buildings
This group of buildings provides space for on-site manufacture of large poloidalfield coils and for the process equipment which makes up the ITER cryoplant.These buildings are steel framed on concrete slabs at ground level. The PF coilfabrication building is needed early in the ITER construction program, for themanufacture of large poloidal field coils which will be located below the vesseland toroidal field coils and therefore need to be put in position early in theassembly.
The poloidal field coil fabrication building is approximately 176 m by 53 m, by30 m high. It is clear of interior obstructions, and equipped with a 3001 nominalcapacity bridge crane. Space is provided for a winding station where two-layer"pancakes" will be made. Pancakes are stacked to form modules (see Section 4.2),and modules are stacked and bonded together to form the finished coils. Thecrane capacity is determined by the heaviest module. The services in thisbuilding will be appropriate to support the requirements of the coil windingprocess, including temperature control and air quality, lighting, and offices.
FDR-ITER Plant Layout and Buildings Chapter II-Section 3.0-Page 18

The cryoplant is housed in two separate buildings. The compressors are noisyand do not require clean conditions. Their maintenance requirements are alsorelatively modest, therefore one building is dedicated to them. The CryoplantCompressor Building is 115 m x 90 m and about 16 m high. The building isdivided in to two bays and each bay is equipped with a lightweight overheadbridge crane for maintenance of the compressors and drivers. Piping is collectedto the space between the bays.
The cold box portion of the cryoplant is housed in the other cryoplant building.The Cryoplant Cold Box/Dewar Building is 115m x 61m and the annex ofCryoplant Cold Box/Dewar Building is 72 m x 14 m. Elevations for the buildingvary from grade to +33 m.
Both of the buildings are industrial grade buildings designed as steel frames seton grade-level concrete slab foundations.
3.3.2 Magnet power conversion and plasma heating power supplybuildings
The equipment and systems used to provide power to the tokamak magnets andplasma heating systems are located in the four buildings in this group, all ofwhich are constructed using steel framing on concrete slabs at ground level. Thetwo structurally identical power conversion buildings are used to house themagnet power rectifier systems. These systems consist of a number of powerconversion modules, each consisting of a transformer, phase-controllablerectifier modules, and related power conditioning equipment. Power conversionmodules are connected in series and parallel to generate the current and voltagewaveforms needed to operate the tokamak magnets. The space required for thepower conversion modules, and the selection of outdoor locations of thetransformers, result in long narrow buildings. The power modules are locatedalong each side of these buildings. Overhead AC power is fed to thetransformers, and output DC power flows in busbars running the length of thebuildings in an upper level.
Busbars from the power conversion building carry DC power to the magnetpower supply switching network building. This building is sized to housemagnet-related switchgear, capacitors, dump resistors, and related electricalapparatus. No special constraints on this building are anticipated, and it is ofconventional industrial construction. Handling of equipment busbar segments,and other heavy objects will generally be performed using floor supportedportable lifting equipment (e.g., forklift trucks). The size of the magnet powersupply switching network building is 60 by 74 by 20 m high.
The neutral beam power supplies will consist of mainly outdoor equipment,located on support foundations north of the magnet power conversion buildings.It is expected that three beamline power supplies, each consisting of five 200 kVmodules connected in series, will be utilized. The Neutral Beam Power Suppliesare described in Section 4.8.7.4.
FDR-ITER Plant Layout and Buildings Chapter H-Section 3.0-Page 19

The ion-cyclotron (IC) system is located in the Electrical Termination Building.A separate building (RF Heating Power Supply Building) is dedicated to the highfrequency power generators used to provide power for the electron-cyclotron (EC)plasma heating and current drive systems. Generally, the power supplyequipment for these systems consist of transformers, switchgear, rectifier unitsand control apparatus. The system is arranged with transformers and switchgearat the ground level and high frequency generators on a second level, withappropriate space between generators and structural members. The output fromthe IC high frequency generators is carried in co-axial conductors about 300 mmin diameter. The output from the EC system is carried in 60 mm diameterevacuated waveguides.
3.3.3 Ancillary buildings, structures and site improvements
The ITER control building will be used to house the online Supervisory ControlSystem (SCS) computers and work stations used by plant operators andexperimenters. The control building is located inside the inner boundary, butclose to the laboratory office building, to ease access. The control building will beconstructed of cast-in-place reinforced concrete, and will be designed to resistexternal hazards so that plant operators will be able to maintain their interfacewith the SCS system under all conditions. Space will be provided for an incidentresponse facility (if required by the host country), an electronic archive system,and a visitor's gallery. A tunnel will connect the control building with thebasement of the assembly hall, which can be used to route instrumentation linksand for pedestrian access during inclement weather.
The Personnel Access Control Structure will be used to provide controlled accessto the potentially contaminated regions below ground in the tokamak hall andpit, laydown hall, hot cell and radwaste buildings. Health physics for ITER willbe based in this building, which will also provide space for, first aid, changerooms, showers, and laundry facilities. The Tokamak Access Control Structurewill provide a shielded pathway between the laydown hall and the Hot CellBuilding, and also provides space for electrical power distribution equipment,and analytical laboratory facilities. The Personnel Building will provide officespace for 200 or more staff members, and will include meeting rooms and eatingfacilities. The personnel building will be of steel frame construction on a slab atground level.
The laboratory office building will be located outside the inner boundary. It willprovide office space for 750 scientists, engineers, and administrative staff. It willalso house an off-line data processing center, library, and meeting rooms. Thisstructure will be built using conventional steel frame office construction.
The inner boundary will comply with host country requirements for regulatedinstallations. This is expected to require a double fence with appropriateinstrumentation and other features to manage the risks associated withunauthorized entry. Site workers will not normally bring private vehicles insidethe inner boundary, and all vehicles entering the inner boundary will berequired to pass through an inspection facility. Pedestrians entering the inner
FDR-ITER Plant Layout and Buildings Chapter II-Section 3.0-Page 20

boundary will do so at a number of control points where authorization andaccess control procedures can be administered. The outer boundary will also bedesigned to respond to the requirements of the host authorities, and is expectedto have vehicle and pedestrian gates where site workers can gain access byshowing a badge. Roadways within the site will be designed to provide access forconstruction and maintenance equipment, and to permit security forces tomaintain surveillance over the site boundaries. Outdoor lighting will beprovided in the plant and at both boundaries.
During construction and the initial assembly of ITER, additional temporaryfacilities will be required. Extensive facilities are expected for laydown andwarehousing of delivered materials and equipment. In addition, shop facilitiesfor the support of construction, and badging, changing, training andadministrative facilities, will be required to support the very large constructionwork force. Until the actual site is known and the space available for facilitiescan be determined, the arrangement of temporary facilities must be consideredgenerically. Historically, temporary site facilities require an area which is aboutas large as the finished facility. On that basis, temporary facilities will require anarea of about 60 hectares. For the purposes of the EDA, generic layouts oftemporary facilities have been prepared, using the area north and east of thetokamak complex.
FDR-ITER Plant Layout and Buildings Chapter H-Section 3.0-Page 21

3.4 Assessment
The ITER Plant layout has progressed to a point where significant further workshould await identification of candidate sites, such that site-specific adaptationsmay be made. But the basic concepts and design solutions are not expected tochange.
The HVAC and tritium management systems have been developed to anadequate level of detail to proceed to site-specific, detailed design with little or notechnical risk. Adjustment of the current designs may be required due toregulatory or environmental conditions at candidate sites, but the changes aremore a question of capacity rather than alternative concepts. This is animportant conclusion, because HVAC requires significant space within congestedareas such as the tokamak pit and galleries.
Hot cell and radwaste plans and procedures are not developed in great detail atthis time. However, within the assumptions of anticipated repair types andfrequencies, facilities have been designed to manage the waste that results fromthese activities. Waste volume reduction has been adequately addressed asevidenced by processes developed to repair divertor cassettes and other highfailure frequency components. Significant further development in this arearequires more detailed component design and host country regulations forradioactive waste disposal.
The general subject of maintenance for the tokamak and attached equipment hasbeen addressed in sufficient detail to draw the following conclusions. First, accessspace appears adequate for efficient hands-on maintenance activities in all areasof the tokamak buildings. Equipment hatches, lifts and stair towers have beenestablished for all major equipment areas. The lower HTS vault is the leastaccessible and some delays could be experienced if major equipment failures,such as heat exchangers or pump motors, occur. The addition of a fourth galleryadjacent to this vault could alleviate, but not totally eliminate, these potentialdelays.
Other buildings and structures have not been developed to the same level ofdetail as the Tokamak Buildings, but they have progressed to the preliminarydesign phase where equipment layout is complete and external interface conflictshave been resolved. Generally, detailed equipment models do not exist, butgeometric solids which envelope the equipment have been developed as placeholders until such detailed information is available. Building services such asHVAC and fire protection, have been designed as appropriate for the equipmentin most of these buildings. The cost and construction schedules for thesebuildings are at a reasonable confidence level.
FDR-ITER Plant Layout and Buildings Chapter II-Section 3.0-Page 22

oooooooooooo
71 i1,.,.,,-ao,,,, ,,,,,„. ,,,|
72
I IndustrialStructure
: IndustrialBuilding
75ji Compulsory—i AreaBoundar)
(70 Hectare) '
Electrical LoadCenters
Figure 3-1The ITER Plant General Lyout
71. ITER Control Building72. ITER Laboratory Office Building73. Cryoplant Perimeter Gatehouse
Key to Tokamak Buildings __ll.TokamakHall&Pit12. Laydown Hall13. Assembly Hall14. Tritium Building15. Electrical Termination Building16. West Tokamak Services Building17. East Tokamak Services Building21. Hot Cell Building22. Tokamak Access Control Structure
31. Magnet Power Supply Switching Network Building32. North Magnet Power Conversion Building33. South Magnet Power Conversion Building34. NBI Power Supply Switchgear Building35. RF Power Supply Building36. Pulsed Power Switchyard Switchgear Building41. Emergency Power Supply Building42. Steady State Switchyard Switchgear Building51. Cryoplant Coldbox / Dewar Building
23. Personnel Access Control Structure 52. Cryoplant Compressor Building74. Control Room Perimeter Gatehouse 24. Personnel Access Control Structure 61. Site Services Building75. Vehicle Entry Perimeter Gatehouse 25- Personnel Building 62. PF Coil Fabrication Building

FIGURE 3.1-1radiologically controlled buildings

? . { . , . , . I . - ; . I . , . , . , , ' < • "
Figure 3.1-2Confinement Barriers
MAJOR CONFINEMENT BARRIERS
= ?"<* Sorrier (Atmospheric} - V0[!it & CoFUNCTIONAL BARRIERS

E/T Building"
\N\N\l/l/l/W
Tokamak Hall
Tritium Building
B . M .
EL Km
EL 7.5 m
50011 10500 I 11500 I 13750 I 12000 I 11500 I 12000 I 13750 I 11500 I 10500 ll 500
(12) U3) V4) US) (r«) (T7)
Figure 3.2-1East-West Cross Section View of Tokamak Building

Figure 3.2-2Plan View of Tokamak BUilding (EL: 0 m)

I m* I „*. I
SECTION VIEW EAST-WEST (COLUMN L INE TF)
FIGURE 3.2-3
Cross Section of Tokamak Building: Seismic Isolation Option

VacuumPumping
Suppression/Tank
\prainTgnk
* » Jt J» «t J#
I , i • • ! i , i , 1 , . i . I , , . , I n , , l i 1 1 . 1 , , . 1 1 . 1 , 1 1 , , • , 1 , , , i l
Figure 3.2-4Elevation View of the Equipment Layout

North
Figure 3.2-5 I JVault to Vault Pipe Shafts

Diagnostic Waveguide*
Diagnortic Enclosures
Motor jjaPiilrol CCTtcrw * 6 places
NoteA pellet injector cask not shown,will be parked in front of port 19o u i pAU other casks are not present
je positKgiSf dockedto oryostst are shown.
Widl to be updated port FDR
Radial zone forandcabU* 16^
Toroidal zone forpipes and cables
PortlS
RH shield wilb SpUca
Pipea not shown in pipe shafts
"iVPHTSpiM-MagnetT-PHTSpiw.
JetoiMbMl
Figure 3.2-6Divertoi level Plant view
(EL-28.70 m)
-g system tapesF - Fueling syitem pipesC- CablesD-diagno*ncsE-ECHttCDI -ICHiCD

Radial zone pipes & cables
To be designed in detail post FDR
RH Cubicles-4 places
Cell shape to tatdesignedih detaiTpbst FDR B
Figure 3.2-7Equatorial level plan view (EL -22.45 m)
Notea TBM cask not shown will beparded in front of port 19during operation.ALJ other casks are not presentduring operation.Maintenance positions, with caskdocked to ciyostat are shown.
Toroidal zone for pipes and cablesin the gallery omitted for clarity
TBM module types assumedfor layout purposes
Diagnostics assumed in ports8 & 18 for layout purposes
Pipes not shown in pipe shaftsPrimary users:
T - P H T S pipesM-Magnet busbarsP = Pumping system pipesF • Fueling system pipesC - CablesD - DiagnosticsE ECH&CDE ECH&CDI - ICH & CD

INTERNATIONAL THERMONUCLEAR EXPERIMENTAL REACTOR
«
TECHNICAL BASISFOR THE
ITER FINAL DESIGN REPORT, COSTREVIEW AND SAFETY ANALYSIS
(FDR)
Chapter IISection 4.1
ITER PLANT DESIGN DESCRIPTION
13 July 1998

CHAPTER IISECTION 4.1
SUMMARY OF SYSTEM DESIGN
TABLE OF CONTENTS
4.0 SUMMARY OF SYSTEM DESIGN 14.1 Vacuum vessel and in-vessel components ...14.1.1 Vacuum vessel 34.1.1.1 Vacuum vessel function and main components 34.1.1.2 Vacuum vessel overall arrangement 44.1.1.3 Vacuum vessel fabrication 64.1.1.4 Vacuum vessel port arrangement 74.1.1.5 Blanket support 84.1.1.6 Vacuum vessel coolant path 94.1.1.7 Vacuum vessel pressure suppression system 94.1.1.8 Assessment of VV manufacturing feasibility and cost 124.1.1.9 Vacuum vessel overall assessment 134.1.2 Blanket 134.1.2.1 Blanket function and main components 134.1.2.2 Blanket back plate and assembly 154.1.2.3 Shielding blanket module arrangement 164.1.2.4 Shielding blanket plasma facing and heat sink materials 174.1.2.5 Blanket attachment scheme 194.1.2.6 Port limiters 214.1.2.7 Blanket breeder modules 234.1.2.8 Test blanket modules 254.1.2.9 Blanket cooling 264.1.2.10 Assessment of blanket manufacturing feasibility and cost 294.1.2.11 Blanket overall assessment 304.1.3 Divertor 304.1.3.1 Divertor function and main components 304.1.3.2 Divertor cassette body & cooling 324.1.3.3 Divertor plasma facing components (PFCs) 334.1.3.4 Scheme of PFC attachment to divertor cassette body 354.1.3.5 Divertor support pads 354.1.3.6 Divertor electrical links and gas seal 364.1.3.7 Diagnostic cassettes 364.1.3.8 Dust and codeposition issues 374.1.3.9 Assessment of divertor manufacturing feasibility and cost 384.1.3.10 Divertor overall assessment 38

4.0 SUMMARY OF SYSTEM DESIGN
4.1 Vacuum vessel and in-vessel components
The vacuum vessel, blanket and divertor are the main components whichsurround the plasma. The in-vessel components are modular to allowreplacement through the equatorial and divertor ports. This has the advantagesof making the components to be remotely handled relatively light, and quitespecific to any damage or failure, which in turn minimizes any waste arising. Arail system is provided for divertor replacement through the divertor port (seebelow and Section 7), and an in-vessel vehicle system for blanket maintenance(see Section 7).
An isometric view of the vessel, blanket and divertor is shown in Figure 4.1-1.The vacuum vessel support legs, which are at the bottom of the vessel, areconnected to rods suspended from the TF coils. These rods allow flexibility in thehorizontal plane while preventing vertical movement. There are also toroidalsupports above the equatorial ports to resist net horizontal forces acting on thevessel and to retain the toroidal spacing between the TF coil and vessel duringplasma disruptions and seismic events. The blanket modules are attached to atoroidally continuous back plate which is attached to the vessel along its lowerinboard and outboard edges. For centred disruptions, this avoids transmittingthe loads to the primary containment boundary and, because of the flexibility andthermal insulating effect of the attachment, it allows the blanket to operate at ahigher temperature than the vessel. The divertor modules ("cassettes") areattached to rails located on the vessel floor.
All these components form an integral part of their corresponding primarycooling circuit (see Section 4.6). A major safety feature is the ability of the vesselto provide passive removal of decay heat during an in-vessel LOFA. Thispassive cooling is a result of natural convection in the vacuum vessel coolingcircuit. The coolant lines of the inboard and outboard blanket modules exit thevessel through the vertical port, except for the modules below the outboardequator, which exit through the equatorial port. The divertor module coolinglines exit through the divertor ports.
The above design features are unchanged from those described in the InterimDesign Report (IDR). However, since the IDR and the Detailed Design Report(DDR) important changes in a number of features have been made:
• The vessel cooling path has been modified to ensure a more efficientnatural convection cooling;
• The vessel has been thickened in its lower regions to give a higher loadtolerance to VDEs and toroidal field coil quench, and facing has beenremoved on the inner cylindrical surface;
• Ferromagnetic inserts have been added in the vessel to reduce toroidalfield ripple at the plasma edge;
FDR-ITER Plant Design Description Chapter II-Section 4.1-Page 1

FIGURE 4.1-1Isometric View of Vessel, Blanket & Divertor
FDR-ITER Plant Design Description Chapter Il-Section 4.1-Page 2

• A flexible plate design for the back plate support has been developedand simplified;
• The back plate has become double-walled to strengthen it and toaccommodate backplate and module coolant channels;
• Alternate vertical ports are now used for cooling pipe access to twoblanket sectors, with the intermediate ports being used for diagnosticsaccess;
• An attachment scheme for the blanket modules tolerant to the twistingforces occurring during plasma disruptions and based on plasma-sideaccess for all installation and maintenance has been developed;
• A port limiter is now adopted instead of a belt limiter composed ofspecial blanket modules;
• Port modules (for heating, diagnostics, test blankets, etc.) aremechanically attached to the vacuum vessel port assembly, passingthrough a hole in the blanket;
• The divertor dome has been enlarged to improve neutral particlebaffling;
• The divertor high heat flux components attachment scheme based onnon-integral keys has been developed to ease remote replacement andalignment;
• A divertor system without "wings" has become the reference option forfurther design.
A summary of the current status of the design is described below. Further detailscan be found in DDDs 1.5,1.6 and 1.7.
4.1.1 Vacuum vessel
4.1.1.1 Vacuum vessel function and main components
The primary function of the vacuum vessel is to provide a high quality vacuumfor the plasma, as well as the first confinement barrier of radioactive materialsand a second barrier for the separation of air from potential in-vessel hydrogengeneration.
The vessel cooling system also provides decay heat removal even when othercooling loops are not functioning. The vessel supports the blanket and divertorcomponents, and resists the forces of plasma disruptions and verticaldisplacement events. Along with other in-vessel components, it providesradiation shielding in particular for the magnets.
FDR-UER Plant Design Description Chapter II-Section 4.1-Page 3

The main components of the vacuum vessel are:
• The main vessel, designed to withstand internal overpressures of0.5 MPa and external overpressures of 0.2 MPa and to provide anultra-high vacuum for plasma operation;
• Port assemblies, providing access to the plasma for diagnostics, plasmaheating, fueling, pumping, limiter, in-vessel maintenance and blankettest modules;
• Mechanical links and supports.
Due to its safety function, the vessel will be designed and constructed accordingto an accepted structural design code. The vessel is a permanent machinecomponent (RH Class 3). It has Safety Importance Class 2, and Seismic Class 2A.
4.1.1.2 Vacuum vessel overall arrangement
The main vessel (Figure 4.1.1.2-1) is a large double wall structure made from SS316L(N)-IG (ITER Grade - 0.06 to 0.08% nitrogen). The outside diameter andheight of the torus are 26.2 m and 14.4 m respectively. The inner and outershells are made from 40 to 60 mm plate with stiffening ribs between them to givethe vessel the required mechanical strength (Table 4.1.1.2-1). The total thicknessof this structure is between 0.38 - 0.78 m. One of the major functions of thevacuum vessel is neutron shielding. The space between the shells will be filledwith plates made of a grade of SS 304 with 2% boron (American Society forTesting and Materials (ASTM) designation SS 30467). The addition of boron wasrecently adopted to improve neutron shielding efficiency. These plate "inserts"will fill ~ 60% of the volume between the vessel shells. A ferromagneticmaterial, SS 430, is used as the shielding material under the TF coils in theoutboard area (12 o'clock to 3 o'clock) instead of SS 30467. These plates fill ~ 80%of the area between the shells and are estimated to reduce toroidal field ripple bya factor of 2.3 times (from 1.6% to 0.7%). The toroidal resistance of the VV is8.4 nQ, while the total resistance of the W plus Blanket is 5 fiQ.
The ribs also form the flow passages for the forced water cooling (and for baking)to remove the nuclear heat deposition during a burning plasma pulse. Thecooling water in the VV is routed to a manifold structure at the bottom of thesector and from here flows up both sides of the sector to the top and out. Thisbasic arrangement of the W , combined with the cooling system piping and thelocation of the heat exchanger, was selected to provide a system with maximumnatural convection cooling to remove decay heat during a loss of power or pumpfailure.
Increases in estimates of the peak loads imposed on the vacuum vessel due toasymmetric VDEs and the toroidal field coil quench have resulted in increases inthe W shell thickness to 60 mm in the inboard and lower areas of the vessel.For the case of an asymmetric VDE, the W must support very high vertical andtoroidal loads imposed by the blanket and divertor. Current estimates indicate
FDR-ITER Plant Design Description Chapter II-Section 4.1-Page 4

that the total vertical load due to a VDE may be as high as 150 MN (~ 12 MNmaximum on an individual sector) and horizontal loads may be as high as50 MN (7.6 MN maximum on an individual sector ). These loads correspond toUhalo/Ip)*TPF=0-58/ where Ihalcv Ip/ TPF are the halo current, plasma current andtoroidal peaking factor respectively. The toroidal field coil quench is expected toproduce a pressure on the inner shell of ~ 2.2 MPa. With a 60 mm shellthickness in these areas, VV stresses are within the allowable levels.
VERTICAL PORT
VERTICALSUPPORT LEG
EQUATORIAL PORT
STIFFENINGRIBS
DIVER TOR PORT
FIGURE 4.1.1.2-1Vacuum Vessel Sector
FDR-ITER Plant Design Description Chapter II-Section 4.1-Page 5

TABLE 4.1.1.2-1Vacuum Vessel Parameters
SizeTorus OD
Torus Height
Double Wall ThicknessToroidal Extent of Sector
Shell Thickness
Rib Thickness
Weight
Vessel and Port Structures (exd. Shielding)
ShieldingCooling
Coolant FluidTotal Flow Rate (normal op. - 2 loops)
Total Flow Rate
(fully developed natural convection - 2 loops)
MaterialsMain Vessel
Primary Vessel Shielding
Ferromagnetic Shielding
26.2 m
14.4 m0.38-0.78 m
18°
40-60 mm
30-60 mm
-5800t
-4000t
Water80kg/s
~130kg/s
SS 316 L(N)-1G
SS 30467(with 2% boron)
SS430
4.1.1.3 Vacuum vessel fabrication
Typical specifications for the factory fabrication tolerances of the vessel poloidaland toroidal perimeter are ± 20 mm on vessel height and width, and ± 5 mm onvessel sector thickness. The fabrication of the inner shell is completed first toensure its best possible quality because it will form the first boundary on theplasma side. The weld joints for the inner shell can be accessed from both sidesminimizing deformations and making inspection easier. Access is also verygood when welding the ribs to the inner shell. Welding on both sides of the ribsis planned to help keep the ribs straight and in alignment. For the weld jointbetween the outer shell and the ribs, several techniques are being considered andinvestigated in R&D. The design of this joint is particularly important becauseweld access will only be from one side of the joint making inspection moredifficult than with two sided access.
The vacuum vessel is built in the factory as 20 right hand and 20 left handsegments, each spanning 9° in the toroidal direction from one port midplane tothe center of the TF coil. After being received at the site, the vessel half sectorsare leak tested and inspected before being mated with the TF coils and thermalshield segments. Vessel/coil mating involves moving the two vessel half sectorsinto the TF coil, already fitted with the vacuum vessel thermal shield(Section 4.5), and aligning the weld joint between them. This joint will be on thecentre of the TF coil and will trap the coil between the vessel ports. Aftersuccessful joining, leak testing of the between-shell volume, and dimensional
FDR-ITER Plant Design Description Chapter II-Section 4.1-Page 6

inspection, the vessel sector, the thermal shield and the TF coil are ready forassembly (see Section 6). As adjacent sectors are installed, vessel field jointssplice plates are installed, welded, and leak checked.
During on-site assembly the splice plates used to connect adjacent sectors are 100and 120 mm wide, on the outer and inner shells respectively, and willaccommodate misalignment of the sector edges. The splice plate gaps betweensectors also allow access to thermal shield field joints from the inside of thevessel. The splice plates are welded and inspected from one side by the narrowgap-gas tungsten arc welding (NG-GTAW) process. This is a multipass processthat produces a very high quality and controllable weld. Utilizing a narrow gapgroove, weld deformations are acceptably small. Access to the field joint welds isonly from the inside of the vessel so direct inspection of the back side of the weldis not possible. One-sided inspection techniques such as ultrasonic testing (UT)are being developed for these joints and are expected to satisfy code requirements.
One of the most critical issues for the VV is the magnitude of weldingdistortions, dimensional accuracy and achievable tolerances. A single sectorweighs ~ 220 t (without shielding) and may have as much as 13 t of weldmaterial. How this amount of weld material would affect these parameters isbeing addressed by a full scale sector model which is the centerpiece of the WR&D program (Large Project L-3). This model is being built as two 9° half sectorsthat are welded together to form the full sector. The fabrication of these halfsectors has been completed and a preliminary assessment of distortions andtolerances is consistent with expectations. Target tolerance values are ± 5 mm forthe sector height and +6 mm for sector width. Hydraulic issues are beingaddressed by a 1/6 scale partial model of the W cooling passages. These modelsare providing key information required to finalize the W design.
4.1.1.4 Vacuum vessel port arrangement
The vessel has 20 vertical, 20 equatorial (17 regular and 3 NB), and 20 divertorport structures used for equipment installation and maintenance, utilityfeedthroughs, and vacuum pumping (port arrangement is indicated inSection 3). The vertical ports of the vacuum vessel are used as feedthroughpoints for the blanket cooling pipes (ten ports) and for viewing systems anddiagnostics (ten ports). Both types of vertical ports (~ 0.27 m - 1.18 m over alength of ~ 2.9 m) are of double wall construction 130 mm thick with stiffeningribs between the walls. The blanket cooling pipes pass through the walls of thevertical ports and are routed to the blanket. The overall height of this portstructure (~ 6 m) and the routing and design of the pipes enhance their flexibilityand allow them to absorb the differential thermal expansion between the blanketand the VV, eliminating the need for bellows and increasing system reliability.Ten vertical ports used for diagnostics are shorter (~ 3 m) and are used to mountmany diagnostics including a neutron camera, Thomson scattering diagnostic,and bolometry systems (see Section 4.9).
The equatorial and divertor ports are also covered by closure plates which formpart of the vessel primary safety boundary. Each divertor maintenance port
FDR-ITER Plant Design Description Chapter II-Section 4.1-Page 7

includes a connection to the pressure suppression system, housed below thecryostat (see Section 4.1.1.7). Both the equatorial (1.8 m by ~ 3.3 m) and divertorports (~ 0.97 m -1.76 m over a length of ~ 2.5 m) are of double wall construction200 mm thick with stiffening ribs between the walls.
Shielding is required between the walls of the equatorial port stubs (but not thedivertor or vertical port stubs) and the divertor and cryopump port extensions.The shielding material is SS 30467 (with 2% boron). The shield blocks includethree steel plates, 20 mm (two plates) and 30 mm (one plate) thick, which areseparated by 10 mm. The steel volumetric content is ~ 60%. The blocks areintroduced between the ribs and welded to the walls from the ends after thedouble wall is completely welded.
4.1.1.5 Blanket support
The blanket is supported inside the vacuum vessel (VV) by 20 compressivesupports located in the middle of the inboard and outboard region of eachblanket backplate sector. The supports are formed by leaf plate assembliesproviding flexibility in the radial direction and having a large stiffness both inthe vertical and in the toroidal directions. The design has been improved fromthat in the IDR, to provide more toroidal stiffness for the inboard supports and toreduce from 80 to 20 the number of outboard supports.
The base material for the supports is SS 316 L(N) IG (ITER Grade), which is alsothe base material for the vacuum vessel and for the blanket back plate andmodules. The choice of a common material helps avoid thermal expansionproblems in the flanges connecting the vessel and support. The allowablestresses for the flexible SS plates are not exceeded while the material is kept below200°C by active cooling as part of the vessel cooling circuit and the temperaturedifference between the vessel and the blanket is kept below 150°C (this is abovethe difference achieved in normal operation). The supports are electricallyinsulated from the blanket back plate at the end attached to the backplate to avoidcurrent loops.
R&D is being conducted on the blanket flexible supports in two main steps. Theoverall performance of a support depends not only on how the flexible platesperform together but also on the manufacturing technology used and how thecooling passages are incorporated into the plates. Prototypical plates are thereforebeing subjected to large nonlinear deformations in the three axial directions. Inthe second step a full scale model of a support, currently being fabricated, is to betested to determine the load distribution among the plates, and to verify theglobal safety margin against vertical and lateral buckling.
Information on the vacuum vessel support is given in Section 4.2.
FDR-ITER Plant Design Description Chapter II-Section 4.1-Page 8

4.1.1.6 Vacuum vessel coolant path
The coolant flow within the vessel has been changed significantly since the IDRto ensure the availability under loss of flow accident conditions of naturalconvection cooling of the maximum afterheat envisaged for all in-vesselcomponents after plasma shutdown. Compared to the IDR solution of supplyand return through the divertor ports, with ten sectors in series, the presentdesign has supply through the divertor port and return through the upper port,with alternate sectors in parallel. This requires smaller supply and return pipes(10 cm ID vs. 16 cm ID) and maintains a similar temperature profile in all sectors.The maximum temperature of the vessel structure during baking is 200°C.
During a vessel LOFA (loss of flow accident, e.g., a multiple cooling pump trip),the fully developed flow rate resulting from natural convection is expected to beabout 150% of the normal flow. With this flow, the maximum vesseltemperature will be maintained well below 250°C while removing the expectedheat load. This heat load would result from a LOFA (or loss of coolant) in allin-vessel systems. Detailed calculations of natural convection cooling conditionsin the vessel shell, e.g., characterizing the transition to fully developed naturalconvective flow, are still in progress.
A concern is flow instability (i.e., uneven flow distribution among parallelchannels) due to the low flow speed during both normal operation (< 0.001 m/s)and during natural convection. With the current configuration, flow throughthe sector is always maintained in an upward direction so that naturalconvection flows are always in the normal flow direction. This will help preventhot spots due to stagnant areas in the cooling channels even during normaloperation, and help insure flow stability.
All 6 scale model of a 9° toroidal section of the vacuum vessel (part of the L-3Large Project) is being used for flow distribution and pressure drop testing.Important measurements include total flow rate, flow distribution, instabilityand stagnation, and total pressure drop. Preliminary experimental resultsindicate a large variation in the mass flow distribution from channel to channel(about a factor of 5 from the slowest to the fastest) with the smallest flow throughthe circuits that flow around the ports. This was expected and is consistent withanalytical results.
The main conditions of the vessel water cooling are summarised in Section 4.6.
4.1.1.7 Vacuum vessel pressure suppression system
The function of the vacuum vessel pressure suppression system (WPS) is tolimit the maximum pressure of water/steam in the vessel under worst faultconditions of pipe break inside the vacuum vessel. This is motivated by thedesire not to rely on in-vessel components to ensure safe operation.
The WPS is located under the cryostat, as shown in the Figure 4.1.1.7-1. Thetoroidal suppression tank holds enough water, initially at room temperature, tocondense the steam arising from the spillage of all water inside the vessel. The
FDR-ITER Plant Design Description Chapter II-Section 4.1-Page 9

tank volume is 1755 m3, initially 44% full of room temperature water, and finally75% full of water at 80°C (assuming all water is dumped). Four relief pipesconnect the tank with the vacuum vessel divertor maintenance ports. The reliefpipes have rupture discs to separate the vessel high vacuum environment fromthe tank under normal operating conditions. Two rupture discs are installed atthe top of each relief pipe and have controlled interspaces for leak monitoringand differential pumping. The discs are maintained through the ports. Thereare 150 mm diameter bleed lines in parallel to each vacuum vessel pressuresuppression system duct, connecting the vacuum vessel to the suppression tankvia double all-metal ultra-high vacuum isolation valves. In the event of a smallwater ingress into the vacuum vessel, wherein the pressure rises above 0.1 MPaabsolute, but below 0.2 MPa absolute, the isolation valves are opened to suppressthe pressure. The double rupture disks are designed to open at a pressure of0.2 MPa absolute.
FDR-FTER Plant Design Description Chapter II-Section 4.1-Page 10

DIVffiTOR PCRT
DISTRIBUTOR
EL-35720
EL-38470
EL-40434 *-
EL-44000
FIGURE 4.1.1.7-1Vacuum Vessel Pressure Suppression System
Inside the suppression tank are a central plenum and distributor pipes to separatethe incoming steam and water and direct the steam into the suppression waterwhere it condenses. Some details of the suppression tank and internals areshown in Figure 4.1.1.7-1. The suppression tank will have pipe connections fromthe water and gas spaces to the tritium plant and the radioactive waste gasprocessing system, so that tritiated water and non-condensable gases can berouted there for treatment.
FDR-ITER Plant Design Description Chapter II-Section 4.1-Page 11

4.1.1.8 Assessment of W manufacturing feasibility and cost
Vacuum vessel materials and proposed construction methods and techniques areconventional and should not present exceptional difficulties to any qualifiedmanufacturer of large pressure vessels. The largest manufacturing uncertainty isthe magnitude of achievable tolerances. This uncertainly is primarily due to thelarge size of a sector and its toroidal subdivision (1 or 2), and the amount of shopand field welding that must be done. This is being addressed by the "Full ScaleSector Model" (Large R&D Project L-3). To date, the two half sectors for themodel have been fabricated within the tolerances required, and welding of themain sections of the half sectors have been completed. The required toleranceshave been maintained during assembly. This project has addressed questionsconcerning the mechanical behavior of the double wall structure, flowcharacteristics of the cooling channels, the full remotization of the weldingprocess, and the inspectability of proposed weld joint configurations. Thecompletion of this full scale full size sector model has resolved all majorfeasibility questions.
A difference between the full scale model and the ITER vessel is the poloidalsegmentation. The plan for the ITER vessel is for the inner shell to becontinuous and utilize two-sided weld joints. The ribs are welded to this innershell, and the outer shell to the ribs, and the half sector is completely fabricatedand tested in the manufacturer's shop. The sector model was fabricated inpoloidal sections which could be fabricated in parallel. As a result of thisprocedure, the global fabrication tolerances of the model are expected to besomewhat greater than that of the ITER vessel.
The experience gained in the Large Project L-3 has shown the importance ofwelding and inspection time, as well as the choice of technique, in determiningoverall costs. The cost estimates prepared by the Parties for the FDR have beeninstrumental in identifying the details of the manufacturing process that will bemost cost-effective, and allow the vessel to be "designed to cost". For example,removing the shop weld under the TF coil, and instead welding on the port stubsto the vessel after the TF coil has been mated with the sector, is currently beingstudied for initial fabrication to save welding time and costs.
The fabrication of port structures is also being addressed by the L-3 project, part ofwhich involves the design, fabrication, and testing of the full scale equatorialport extension. As with the sector model, the most critical issues are thedetermination of the magnitude of welding distortions, dimensional accuracy,and achievable tolerances. A preliminary assessment of distortions andtolerances for the extension is consistent with expectations. Target tolerancevalues are ± 4 mm for the extension height and width and ± 1 mm for the wallthickness.
FDR-ITER Plant Design Description Chapter II-Section 4.1-Page 12

4.1.1.9 Vacuum vessel overall assessment
At the time of the IDR, the conclusion was that the design stresses were veryclose to allowable limits during both disruption and fault conditions, and it wasthought that it might be necessary to resort to Inconel 625 to recover sufficientdesign margin. Since that time, the reinforcement of the bottom half of thevessel along with the changes in vessel and blanket supports, indicated above,now provide a robust design with austenin'c steel. Stress levels in the mainvessel are below allowable levels and problems completing the design from astructural standpoint are not anticipated. However, design details such asreinforcement near support structures and the ports are still being assessed,taking account of the decision to mount limiters, diagnostics, heating systems,etc, on the vessel ports.
The main emphasis of the continued design development up to theprocurement will be to refine the procurement specification used for the costestimation in the detail necessary for procurement tendering to be launched atthe very start of the construction phase. This will include the development ofany necessary technical justification to allow the design to be licensed in any ofthe potential ITER Host Countries.
4.1.2 Blanket
4.1.2.1 Blanket function and main components
The blanket system, acting as a shield, removes the surface heat flux from theplasma and from bulk heating by the neutrons, reduces the activity in thevacuum vessel structural material to the level allowable to ensure vesselreweldability for the ITER fluence goal and, in combination with the vacuumvessel, protects the superconducting coils and other ex-vessel components fromexcessive nuclear heating and radiation damage. The system is designed to offerthe possibility of replacing the shield by a breeding blanket, within the samedimensional, maintenance, and coolant constraints, to provide the tritium tomeet the technical objectives of the Enhanced Performance Phase (EPP). It is alsodesigned so that tritium breeding blanket modules for reactors and for the EPPmay be tested in equatorial ports. The design work for these test blanket modulesis being conducted in the Parties, according to boundary conditions established bythe ITER project.
The blanket system contributes with its eddy currents to the passive stabilizationof the plasma motion. It includes a baffle that maintains a neutral particledensity differential of a factor of 104 between the divertor and the main plasmachamber, and is structurally self-supporting to minimize the electromagneticloads, due to plasma disruption and VDEs, transmitted to the vacuum vesselthrough the blanket back plate supports described in Section 4.1.1.5.
The safety importance of the blanket system components (Safety ImportanceClass 3) derives from the fact that they contain the coolant pressure and thatcoolant pipe breaches have a potential to challenge the radioactivity confinementprovided by the vacuum vessel. The Seismic Class is 2B.
FDR-ITER Plant Design Description Chapter II-Section 4.1-Page 13

DIAGNOSTICPORT
COOL INGPIPES
EQUATORIAL PORTREINFORCEMENT
BLANKETMODULES
FIGURE 4.1.2.1-1Blanket System
FDR-ITER Plant Design Description Chapter Il-Section 4.1-Page 14
The main components of the blanket system, which has been revisedconsiderably since the DDR, are as follows (see Figure 4.1.2.1-1):
• A structural toroidal double walled shell, Remote Handling Class 3,called a back plate, with integral cooling in the interspace;
• Blanket modules, Remote Handling Class 2, mechanically,hydraulically and electrically attached to the backplate from the plasmaside;
• Limiters, and other port modules (for heating and diagnostics), RemoteHandling Class 1, mounted on the vessel equatorial port butpenetrating through the back plate.
4.1.2.2 Blanket back plate and assembly
The BP is a toroidally continuous 316L(N)-IG stainless steel structure with a"horse-shoe" poloidal shape. It consists of two separated shells with an overallthickness of 160 mm (a 50 mm inner shell and a 70 mm outer shell). The 40 mminter-space is used to channel the coolant water to the attached modules whilecooling the BP itself. Pipe headers, permanently attached to the BP, are routedthrough ten vertical and 20 equatorial W ports. The water is supplied at 3.8 MPaand 140°C, with a temperature rise of ~ 50°C during normal operating conditions.The double wall structure was chosen to obtain higher mechanical strength withsmaller distortion and better thermal response. The BP is sized to react loads onthe blanket during disruptions and VDEs while transmitting the net vertical andhorizontal loads to the VV. The maximum local electromagnetic pressure onthe BP is ~ 2.8 MPa due to halo currents.
The BP contains 20 x 1.6 m x 2.6 m holes and 10 x (0.15-0.25) m x 1.7 m holescorresponding to the machine equatorial and vertical diagnostic portsrespectively. (The equatorial ports are filled during operation by heatingantennae and optics, diagnostic blocks, test blankets, or shield plugs.) The totalweight of the back plate is ~ 13001. The back plate is a permanent component(RH Class 3).
During the machine assembly (see also Section 6), the back plate sectors will bewelded into a toroidally continuous shell. Various alternative welding schemeshave been considered. Narrow gap (NG-) TIG (Tungsten inert gas) welding isexpected to be used for joining of the back plate segments. This is an establishedmultipass process, and is also used for the vacuum vessel, which allows acommon approach to process development and tooling. Although, whereverpossible, two-sided access is preferred for welding, the last field joints in initialassembly can only be made from the plasma side. The target value of thebackplate radial position tolerance is ± 10 mm. The ability to achieve therequired fabrication tolerance is being investigated as part of the Large R&DProject L-4. NG-TIG is usually used with a semi-automatic control system, andefforts to fully remotize the process are part of the R&D program (T301).
FDR-ITER Plant Design Description Chapter Il-Section 4.1-Page 15

The plan for module installation on the back plate is being developed inconjunction with the overall assembly plan considering requirements onschedule and handling equipment. The need to maintain assembly tolerances,and the handling of Be armored components, favours the installation of all themodules onto the back plate after it has been assembled and the atmosphere inthe vacuum vessel can be controlled.
4.1.2.3 Shielding blanket module arrangement
The FW and in-vessel shielding will be provided by FW/shield modules andfiller shields mounted on the back plate and blanket shield plugs insertedthrough the ports (Figure 4.1.2.3-1). The segmentation of the shield modules isdictated by the weight limit of 4.31 per module imposed by the remotemaintenance equipment, the dimensions of the equatorial port opening, and thedesire to minimize the number of modules. The module toroidal length variesfrom 1.5 to 2 m relative to 0.8 to 1.1 m for the poloidal length. The FW/shieldmodules are installed in 26 poloidal positions with a toroidal segmentation of18° (20 modules) on the inboard, 12° (30 modules) in the upper region and 9°(40 modules) outboard. This segmentation would result in a total of730 modules, not including port mounted systems. However, a total of739 modules are required to accommodate the tangential access path of the threeneutral beams.
Three types of shielding modules are distinguished by the requirements of theirfirst wall. The primary modules have a first wall designed to tolerate0.5 MW/m2, and are in direct contact with the plasma only during off-normalevents. The modules located opposite the X-point are referred to as bafflemodules. They are not normally in contact with the plasma, but are subject tomoderate heat loads caused by MARFEs and the charge exchange flux arisingfrom neutral-plasma interactions near the entrance to the divertor channel, andare designed to accommodate heat loads up to 3 MW/m2. The third module typeis a filler shield, which is shaded from the plasma by the other modules.
Primary and baffle module installation and replacement are performed from theplasma side. Each module has at least eight front access holes of 30 mm diametereach, four for the flexible supports, two for the coolant connections, and two forelectrically conducting straps (see below). The filler shields are welded to the backplate during assembly, and plumbed into the back plate cooling at that time.
Equatorial holes in the back plate are used for the introduction of maintenanceequipment into the plasma chamber, port limiters, test blanket modules, heatingand diagnostic systems, or must be closed by port plugs during machineoperation. All these plugs are supported by the vessel. Their basic design mimicsa primary wall module as closely as possible (see respective sections on thesesystems for further details).
FDR-ITER Plant Design Description Chapter II-Section 4.1-Page 16

BLANKETSUPPORT V
DIVER TORCASSETTE
UPPERBAFELE
MODULES
LOWERBAFFLE
MODULES
FILLERSHIELDS
VA CUUMVESSEL
BLANKETSUPPORT
SHIELDINGPLATE
4.1.2.4
FIGURE 4.1.2.3-1Vertical Cross-Section of Blanket System
Shielding blanket plasma facing and heat sink materials
Beryllium (S65C) is used as the plasma facing armour material at the primaryFW, the limiter, and in the upper regions of the baffle, because of its plasmacompatible low atomic number, and its ability to protect the underlying first wallstructures from the off-normal thermal loads. It also offers the possibility oflower tritium permeability due to surface effects, and the prospect of repair byplasma spray. W is used in the lower baffle near the divertor because or theelevated particle flux which would cause excessive erosion rates on Be. The useof W also results in a low tritium inventory. The specified Be thickness of
FDR-ITER Plant Design Description Chapter H-Section 4.1-Page 17

5-10 mm is a compromise between maintaining reasonable maximum stressduring normal operation and accommodating off-normal transient energydeposition (60 MJ/m2 as maximum). A particular concern is that the availabledata shows that Be starts to lose ductility after low temperature irradiation(< 230°C) at a low dose (~ 2 dpa). Increasing the irradiation temperatureimproves the ductility of irradiated Be, but at irradiation temperatures greaterthan ~ 600°C the He embrittlement leads to a rapid decrease of both strength andductility. The behavior of the brittle armour material is being studied.
FW CoolingChannels
ShieldBlockCoolingChannels
Penetration forRH Access
FIGURE 4.1.2.4-1FW and Shield Cooling Layout
The primary FW heat sink (Figure 4.1.2.4-1) is made of a poloidally flowing arrayof 10 mm diameter by 1 mm wall thick 316 L(N)-IG stainless steel tubes. Thetubes are embedded in copper alloy heat sink material - Cu-A125-IG being thefirst choice, with CuCrZr-IG as the back-up. Due to the higher heat fluxes, thebaffle FW uses copper alloy tubes instead of tubes of stainless steel. A stainlesssteel liner, ~ 0.5 mm thick, will be used inside the copper tube to avoid corrosionproblems. The shield section of the modules contains a coolant circuit in anarrangement of sets of parallel toroidal flow channels connected in series to theexit of the FW tubes.
FDR-ITER Plant Design Description Chapter II-Section 4.1-Page 18

4.1.2.5 Blanket attachment scheme
The hydraulic, electrical and mechanical attachment system (Figure 4.1.2.5-1) forthe blanket modules to the BP is designed to transfer normal loads in themodule to the BP while allowing small relative movement due to the differentstructural rigidities and thermal responses of the modules and the BP. A centrepin establishes the module's position on the BP and reacts the net toroidal andpoloidal loads. Two keys are attached to alternating modules and extend intokeyways on both toroidally adjacent modules. The keys react the opposing forcesin the side walls of adjacent modules. They do so by restraining relativedisplacement between the sides of the modules and hence rotation about thecentre pin. The keys slide in the keyways as the distance between the centre pinson adjacent modules changes when the pins move with the toroidal expansionof the back plate. Where the modules are adjacent to a port, the keys are attachedto the back plate.
Each module also contains four radial supports shown in Figure 4.1.2.5-2 that aredesigned to be flexible in the toroidal and poloidal direction. The flexiblesupports are made from Ti-alloy (Ti-6A1-4V) due to its high strength and lowYoung's modulus. The supports are connected to the BP with Inconel718 (ASTM B637) bolts. The bolt preload (650 kN) is maintained under nuclearheating, and the stress cycle is within the fatigue limits. Radial adjustments ofthe flexible attachments allow accurate radial positioning of the first wall againstthe tolerances of the back plate.
Field Joint
Center Pin
Backplote (Double Wall)
Access Holes forHandling and Mounting
Electrical StrapsCooling Supply Branch PipeCool ing Return Branch Pipe
FIGURE 4.1.2.5-1Blanket Module Attachment
FDR-ITER Plant Design Description Chapter II-Section 4.1-Page 19

Long, flexible, branch pipes provide the connection between the cooling circuitsin the modules and those in the BP while upper and lower centrally locatedstraps provide a poloidal electrical path for halo currents. The branch pipes andelectrical straps are shown in Figure 4.1.2.5-1. The branch pipe's end fittings willbe from 316L(N) IG stainless steel and the pipe section from Inconel 625. Theelectrical strap will be fabricated from CuCrZr alloy because of its low electricalresistance and relatively high strength at high temperatures. Although low,CuCrZr alloy also has a higher ductility than DSCu at high temperature. Thecentre pin and flexible support connections include an electrical insulating break,and the key way is electrically insulated from the remainder of the module sothat adjacent modules are insulated, avoiding toroidal currents. The branchpipes are not electrically insulated since the amount of current induced bydisruptions and VDEs in them is acceptably small.
Assembly of modules on the backplate proceeds by measuring the backplateprofile to determine variances at the module attachment points, custommachining, aligning and mounting the centre pin bushings (a sleeve whichallows the pin to be precisely located), flexible support cups, branch pipecompensation flanges, and electrical strap compensation plates, and leak testingthe compensation flange weld joints. The keyed modules are then mounted onthe backplate with partial bolt torques and no welds. Using the key profiles ofthese modules, the insulating pads are adjusted to fit the neighbouring keywaymodules, which are then attached to the backplate with partial bolt torques andno welds. After a final inspection of module positions, tine modules arepermanently attached by final torquing and seal welding.
FDR-ITER Plant Design Description Chapter II-Section 4.1-Page 20
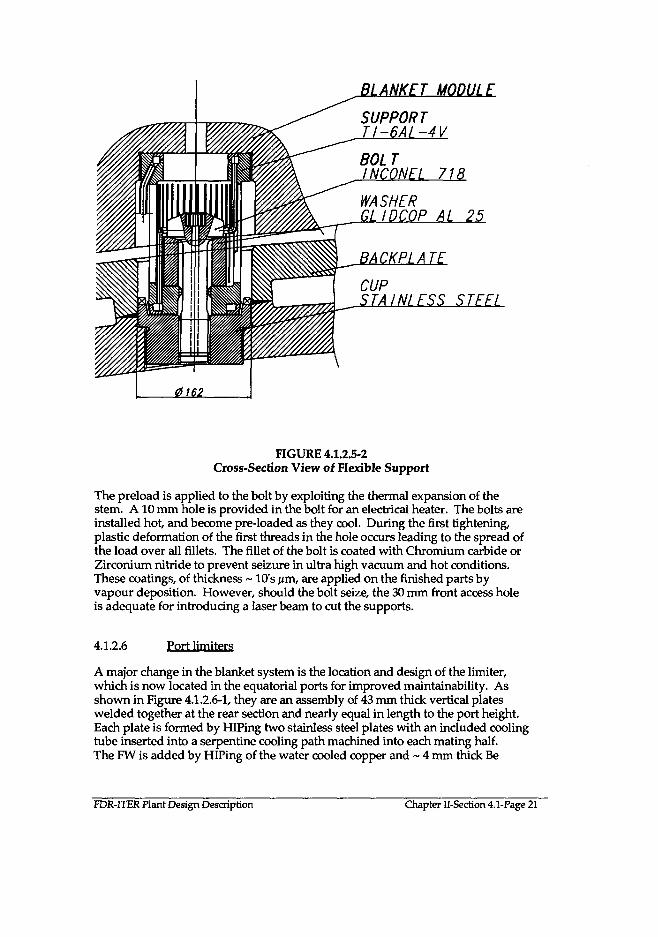
BLANKET MODULE
SUPPORTTI-6AL-4VBOLTINCONEL 718
WASHERGLIDCOP AL 25
BACKPLATE
CUPSTAINLESS STEEL
FIGURE 4.1.2.5-2Cross-Section View of Flexible Support
The preload is applied to the bolt by exploiting the thermal expansion of thestem. A 10 mm hole is provided in the bolt for an electrical heater. The bolts areinstalled hot, and become pre-loaded as they cool. During the first tightening,plastic deformation of the first threads in the hole occurs leading to the spread ofthe load over all fillets. The fillet of the bolt is coated with Chromium carbide orZirconium nitride to prevent seizure in ultra high vacuum and hot conditions.These coatings, of thickness ~ 10's \ira, are applied on the finished parts byvapour deposition. However, should the bolt seize, the 30 mm front access holeis adequate for introducing a laser beam to cut the supports.
4.1.2.6 Port limiters
A major change in the blanket system is the location and design of the limiter,which is now located in the equatorial ports for improved maintainability. Asshown in Figure 4.1.2.6-1, they are an assembly of 43 mm thick vertical plateswelded together at the rear section and nearly equal in length to the port height.Each plate is formed by HIPing two stainless steel plates with an included coolingtube inserted into a serpentine cooling path machined into each mating half.The FW is added by HIPing of the water cooled copper and ~ 4 mm thick Be
FDR-ITER Plant Design Description Chapter Il-Section 4.1-Page 21

layers to the formed assembly. The EB welded rear section forms a strongcontinuous backing and the ~ 1 mm gap between plates is insulated withalumina to prevent arcing. The vertical slots significantly reduce the poloidalshear loads on the side walls arising from changes in the poloidal field during acentered disruption. The ability of the plates to independently expand alsoreduces the thermal stresses. Swirl tapes are used in the FW cooling tubes toenhance the Critical Heat Flux and allow for a reasonable margin. Limitercooling is supplied from the divertor heat transport system.
BERYLLIUMTILES $15
COPPERMONOBLOCK
, DETAIL Y(LIMITER FW)
SWIRL TAPE /M?3\?1
LIMITER FW
SEAMLESS COPPERFIRST WALL TUBE
OUTLETMANIFOLD
FIGURE 4.1.2.6-1Equatorial Fort Limiter
BACKSURFACE OFLIMITER
SUPPORTPAD
INLETMANIFOLD
FDR-ITER Plant Design Description Chapter II-Section 4.1-Page 22
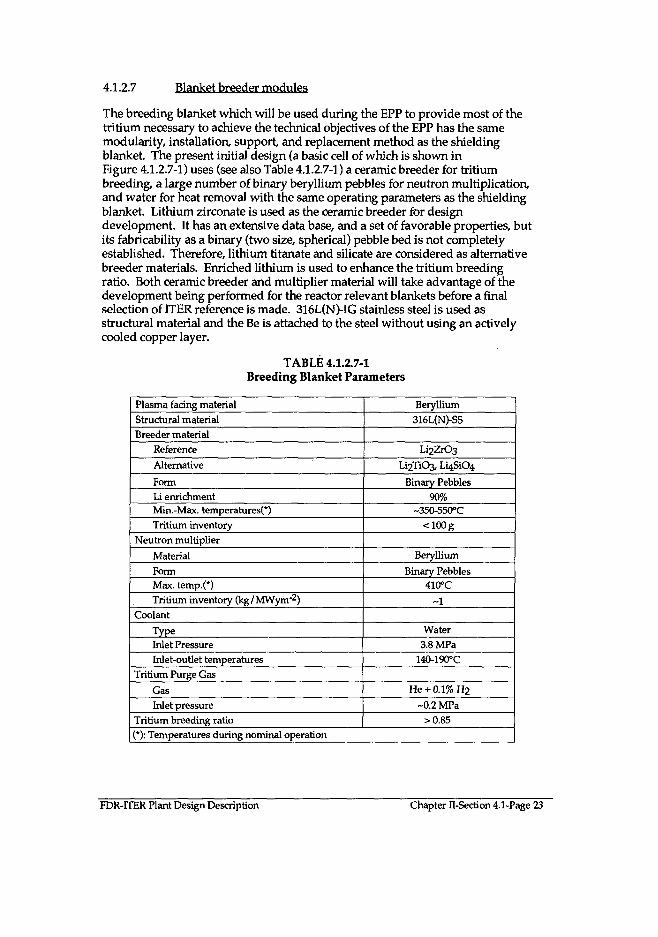
4.1.2.7 Blanket-breeder modules
The breeding blanket which will be used during the EPP to provide most of thetritium necessary to achieve the technical objectives of the EPP has the samemodularity, installation, support, and replacement method as the shieldingblanket. The present initial design (a basic cell of which is shown inFigure 4.1.2.7-1) uses (see also Table 4.1.2.7-1) a ceramic breeder for tritiumbreeding, a large number of binary beryllium pebbles for neutron multiplication,and water for heat removal with the same operating parameters as the shieldingblanket. Lithium zirconate is used as the ceramic breeder for designdevelopment. It has an extensive data base, and a set of favorable properties, butits fabricability as a binary (two size, spherical) pebble bed is not completelyestablished. Therefore, lithium titanate and silicate are considered as alternativebreeder materials. Enriched lithium is used to enhance the tritium breedingratio. Both ceramic breeder and multiplier material will take advantage of thedevelopment being performed for the reactor relevant blankets before a finalselection of ITER reference is made. 316L(N)-IG stainless steel is used asstructural material and the Be is attached to the steel without using an activelycooled copper layer.
TABLE 4.1.2.7-1Breeding Blanket Parameters
Plasma facing material
Structural materialBreeder material
Reference
Alternative
FormLi enrichmentMin.-Max. temperatures(*)
Tritium inventory
Neutron multiplier
Material
FormMax. temp.(*)Tritium inventory (kg/MVVym"^)
Coolant
TypeInlet Pressure
Inlet-outlet temperatures
Tritium Purge Gas
GasInlet pressure
Tritium breeding ratio
Beryllium
316L(N)-SS
Li2ZrO3
Li2TiO3, Li4SiO4
Binary Pebbles
90%~350-550°C
<100g
Beryllium
Binary Pebbles41(TC
~1
Water
3.8 MPa
140-190°C
He + 0.1%H2
-0.2 MPa>0.85
(*): Temperatures during nominal operation
FDR-ITER Plant Design Description Chapter II-Section 4.1-Page 23

The FW has a poloidal flow pattern with one coolant flow path to accommodatethe toroidal surface heat flux during plasma disruption. Also, the breedingsection has a poloidal coolant flow. The FW consists of 13 mm thick 316L(N)-IGaustenitic steel plate with built-in rectangular coolant channels 4x10 mmseparated by ~ 5 mm thick walls. • A 5 mm thick Be tile is used to protect the FWfrom the plasma.
The breeder zone uses flat radial-poloidal coolant panels. These panels are alsoused to reinforce the blanket module structure in addition to the coolingfunction. A poloidal bundle of breeder rods is located between each pair ofadjacent coolant panels Each breeder rod consists of a steel tube with the breederpebbles inside. Beryllium pebbles are used to fill the space between the breederrods and the coolant panels and the module structure. The breeder andmultiplier pebbles are purged with helium for on-line tritium recovery. Thebreeder rod bundle has two supporting tube plates at the poloidal end sectionsand a central spacing grid. These supporting tube plates supply and collect thehelium purge gas. The use of beryllium in the form of pebbles is reactor relevantand the operational experience from the ITER breeding blanket shouldcomplement the results obtained from the reactor relevant test modules for theceramic breeder blanket concepts.
FDR-ITER Plant Design Description Chapter II-Section 4.1-Page 24

A quarter of a blanket module
Shield Plate
Breeder Rods
Detail of a basic cell (pebbles omitted for clarity)
FIGURE 4.1.2.7-1Basic Cell of Breeder Blanket
4.1.2.8 Test blanket modules
The need to test design concepts of tritium breeding blankets relevant to a reactorhas led to the provision on ITER of four equatorial ports for their testing duringthe BPP. Each port has more than 4 m2 first wall surface area and will receive aneutron wall loading on 1.26 MW/m2. Four types of breeding blanket are understudy (some by more than one Party, and using more than one concept):Li-ceramic breeder with Be-multiplier, with either water or He coolant, lithiumlead breeder-multiplier, water cooled, and self cooled liquid lithium, The ITERbreeder blanket for the EPP (see above) will also be tested in these ports. The testblanket program has the objectives to demonstrate tritium breeding performanceand verify on-line tritium recovery and control systems, demonstrate (except EPPblanket) high grade heat extraction and (for at least one of the designs) electricitygeneration, validate and calibrate the design database and tools includingneutronics, electromagnetics, and thermal-hydraulics, demonstrate integrated
FDR-rTER Plant Design Description Chapter H-Section 4.1-Page 25

performance of the blanket system under different loading conditions, andobserve possible irradiation effects on performance.
The test modules are "self-contained", and appear thermally to the plasma andsurrounding systems as a primary module at the same location. This is assuredby using an isolation frame, about 0.2 m thick, to provide temperature controland standard interfaces, and an additional safety barrier to protect ITER from anytest module failure, as well as to provide additional shielding. This frame iscooled with the ITER tokamak cooling water system, except in the case of theself-cooled Li blanket, where He coolant is used as an extra safety measure. Aseparate primary cooling system and a separate tritium removal system isprovided for each test module, before linking to site services, except in the case ofthe EPP blanket, which is designed to use existing ITER service connections.Most ancillary equipment can be located behind the test port to minimise thesystem response time for operational control and data collection. Two modulescan be tested per port.
Test modules are expected to be replaced frequently, and within six weeks. Toallow this and to ease access, horizontal port plumbing is routed throughvacuum-tight feedthroughs in the cryostat and bioshield, either side of a vaultestablished between the vacuum vessel closure plate, remote maintenance cellson either side, and the pit/gallery wall. This improves access to the vacuumvessel port extension closure plate, the primary vacuum boundary, andminimises replacement operations.
4.1.2.9 Blanket cooling
The blanket cooling system consists of a number of loops fed through the verticalports or equatorial ports, each loop being further subdivided into a number ofindependent subcircuits to help in the draining and drying procedures (seeFigure 4.1.2.9-1):
• Ten loops each feed two sectors (i.e., 49 modules and two horizontal in-port components except for the ports with limiter modules which areconnected to the divertor cooling system, and three ports for the NBsystem which are connected to the NB cooling system) through thevertical port and feed the inboard baffle modules 1 and 2 and primaryfirst wall modules 3-20;
• Four loops each feed five sectors (60 modules) through the equatorialport and feed modules 21-24, and the outboard baffle modules 25 and26.
In each loop, the coolant is routed through the double-walled back plate whichacts as a manifold feeding the different modules in parallel. The return leg of thecoolant utilizes the maximum back plate flow area to maximize the coolantresidence time before leaving the vessel in order to mitigate the coilgamma-heating and neutron-activation problems associated with the shorthalf-life 16N (7.1 s) and 17N (4.1 s) decay reactions respectively.
FDR-ITER Plant Design Description Chapter II-Section 4.1-Page 26

Coolant Flow Diagram for Primary First Wall and Baffle Modules
cfpper HTS Vault Distributor forPFW/Inboard Baffle
Coolant Loop
n i i[Access through Vertical Port |
PFW/Inboard Baffle jLoop (1 of 10)
(correspondingto 2 sectors)
Upper HTS Vault Collector forPFW/Inboard Baffle
Coolant Loop
T t t t t t[Access through Vertical Port |
Subcircuit 1, Inboard AModules 1-12,2x13,2x14
Subcircuit 2, Inboard BModules 1-11,2x12,13,14
Subcircuit 3, Outboard Lateral AModules 2x15,16,17
Subcircuit 4, Outboard Lateral B IModules 2x15,16,17 f
Subcircuit 5, Outboard Centre AModules 16-20 D-
Subcircuit 6, Outboard Centre BModules 16-20
Subcircuit 7, In-Port ComponentsAccess through Equatorial Port
Lower HTS VaultCollector for
PFW/Outboard BaffleCoolant Loop
Lower HTS VaultDistributor for
PFW/Outboard BaffleCoolant Loop
PFW/Outboard Baffle Loop (1 of 4)(corresponding to 5 sectors):
10 identical lower outboard subcircuits per loop,each feeding a set of Modules 21-26
FIGURE 4.1.2.9-1Schematic Arrangement of Blanket Coolant Loops
The coolant parameters are summarized in Table 4.1.2.9-1. The coolant inletpressure of 3.8 MPa is set as a compromise between minimizing primary coolantstresses in the modules, providing a good saturation margin during operationand allowing wall conditioning at temperatures up to 240°C using heated waterinstead of steam. Thus, drainage, wet/dry cycles and corrosion problemsassociated with steam or dry gas conditioning are avoided.
The 140°C inlet coolant temperature is selected to mitigate the Cu embrittlementfrom low temperature irradiation and to reduce the size and cost of the heat
FDR-ITER Plant Design Description Chapter H-Section 4.1-Page 27

transfer system. The coolant flow rates and the corresponding temperature riseof ~ 50°C are set to maintain acceptable critical heat flux (particularly for thebaffle) and saturation margins, reasonable global thermal stresses, and reasonableheat exchanger temperature gradients.
The port limiters see a much higher heat flux than the blanket modules, possiblyup to -10 MW/m2 during start-up and shutdown, and are designed to provide anacceptable critical heat flux (CHF) margin during operation. The limiter coolantis integrated with the divertor cooling system, with the objective of connectingthose components with copper internal cooling channels, with their potentialcorrosion problems in a predominantly stainless steel circuit, as well asconnecting the highest and most uncertain heat fluxes, which do not coincide intime during a burn pulse, to a single cooling system. As shown inFigure 4.1.2.6-1, coolant is fed to the inlet collector at the back of each plate. Itflows in series through the first wall and then through a number of passes in theshield section at the back before exiting via the outlet collector.
TABLE 4.1.2.9-1Summary of Module Cooling Parameters
Access
Modules FedNumber of loops
Number of modules per loopDesign Thermal Power (MW)"
Nominal Inlet Temperature (°C)Nominal Inlet Pressure (MPa)Mass Flow Rate (kg/s)"
TotalPer loop
Nominal Temperature Rise (°C)Pressure Drop (MPa)
Total Module Water Hold up (m3)(assuming 15% water in 0.4 m thick modules)
Vertical Port
No. 1-2010
49Hn-port components*-1460
140
3.8
-6540-654- 5 1
-0.6
-52
Equatorial Port
No. 21-264
60
-600
1403.8
-2680-670-52
-0.6-19
Except port limiters. In-port components coolant access is through the equatorial port.Based on the latest blanket design analysis. HTS design values are based on previousestimates and might be slightly different (by about a few %'s)
The overall cooling system of the blanket is described in Section 4.6.
Preliminary procedures for draining, drying and leak testing the blanket havebeen identified. The leaking loop will be identified, for example, through the useof coolant overpressure or of a characteristic signature from chemical additives tothe coolant. The following procedures are then performed sequentially throughthe subcircuits of the leaking loop: draining of blanket modules and back plateusing coolant displacement by gas pressure through draining lines, drying by acombination of raising the temperature of the other sectors using the bakingsystem and flowing hot gas through the subcircuit being dried, and leak testing bypressurizing the subcircuit with helium and using a high-sensitivity sniffer
FDR-ITER Plant Design Description Chapter Il-Section 4.1-Page 28

method (or, alternatively, by covering individual modules with a hoodpressurised with helium, and vacuum pumping the subcircuit to check forhelium). These procedures will be developed in more detail post-FDR.
4.1.2.10 Assessment of blanket manufacturing feasibility and cost
The R&D program has produced and characterized copper to stainless steel jointsin specimens by solid HIP, powder HIP, explosive bonding, and a combination ofcold isostatic pressing and HIP for a variety of copper alloys. Solid HIP wasselected as the reference technique. Be to Copper alloy joints for the primary firstwall modules have been successfully made by solid HIP techniques andsuccessfully tested under appropriate heat fluxes. Flat FW mock-ups with roundand rectangular tubes have been produced and successfully tested at short termfatigue enhanced heat loads.
The basic capability and facilities required to produce the components by casting,rolling and solid or powder HIPing, are established within the Home Teams.However, development is being conducted to characterize each manufacturingsteps and provide the records and parameters to be controlled duringmanufacture to guarantee the technical characteristics (material properties, sizeof imperfections, tolerances, etc.) of the final products. This activity will alsoidentify differences in the parameters for the different HIP techniques beingconsidered - solid versus powder stainless steel HIPing and simultaneous versusseparate HIPing of the copper onto the stainless steel. Existing ultrasonic testtechniques have demonstrated the ability to detect minimum flaws sizes of 1 to2 mm. If the results of ongoing analysis define a reason for decreasing theminimum allowable size to below this value, additional R&D to improve theexisting techniques or develop others will be required.
Full scale prototypes, produced as part of Large R&D Project L-4, are required tocharacterize the manufacturing issues, and the resulting cost impacts, associatedwith the combination of high quality, large size, and close tolerances required bythe components. Current activity is concentrating on producing full scalemock-ups to demonstrate the module assembly and the mechanical attachmentsystem. The demonstration of manufacturing techniques on such prototypes ofthe FW/ shield module and the BP is planned to be completed by 1999. Oneprototype primary FW/shield module is expected to be fabricated by mid-1998.The required cost of handling and workshop practices associated with themanufacturing of the large pieces will be better known after the prototypes havebeen produced.
Despite the significant modifications in the design since the IDR, designsimplification in several areas is helping to maintain the design to cost. Forexample the current design simplifies assembly and welding, reducing time andcosts for those activities.
FDR-UER Plant Design Description Chapter II-Section 4.1-Page 29

4.1.2.11 Blanket overall assessment
In conclusion, the modular blanket design has been developed to a higher levelof confidence than previously, with the introduction of a new attachmentscheme. The manufacturing process for the modules themselves remains to beoptimized and developed further post FDR with regard to inspection techniques,and to maximize series production advantages, as well as ensuring that special Behandling techniques are needed as late as possible in the manufacturing process.The whole system needs to be demonstrated through the successful conclusion ofthe L-4 Large Project.
4.1.3 Divertor
4.1.3.1 Divertor function and main components
The main function of the divertor system is to exhaust the major part of thealpha particle power as well as He and impurity particles from the plasma. Asthe main interface component under normal operation between the plasma andmaterial surfaces, it must tolerate high heat loads while at the same timeproviding shielding for the vacuum vessel and magnet coils in the vicinity ofthe divertor.
The safety importance of the divertor components (Safety Importance Class 3)derives from the fact that they contain the coolant pressure and that coolant pipebreaches have a potential to challenge the first confinement barrier provided bythe vacuum vessel. The divertor has Seismic Class 2B.
The divertor is RH Class 1. The divertor assembly consists of 60 divertor cassettesmounted on toroidal rails. Each cassette is 5 m long, ~ 2 m high and 0.5 -1.0 mwide, and weighs ~ 25 t. The cassettes provide the shielding required for vacuumvessel and coils. Divertor remote maintenance is considered in Section 7.
The main components of the divertor system are (see Figure 4.1.3.1-1):
• A reusable divertor cassette body which provides a mechanical supportfor different possible arrangements of plasma interfaces;
• Inner and outer vertical targets, which are the high heat fluxcomponents interacting directly with the SOL plasma;
• Dump target/ liner assemblies which are designed at the lower dumptarget end to intercept the SOL and at the upper end have asemi-transparent liner to both protect the SS cassette body fromradiated heat flux and to provide a path through which the He ash isexhausted;
• The dome, located below the separatrix X-point, seeing mainlyradiation and CX neutrals, and baffling neutrals which are pumpedthrough the semi-transparent liner beneath the dome;
FDR-ITER Plant Design Description Chapter II-Section 4.1-Page 30

Support pads mounted at the bottom of the cassette to provide lockingand alignment of the divertor cassettes;
Earth straps connecting the cassettes with the baffles to prevent arcingand provide a defined poloidal current path;
Divertor to W gas seals, to prevent backstreaming of gas from thedivertor into the main plasma chamber;
Cooling pipe interface connecting the divertor cassettes to the radialcooling pipes at each divertor port.
FIGURE 4.1.3.1-1Cross-Section Through Divertor
Of the 60 cassettes, four are designated diagnostic cassettes and accommodatewave guides and optical diagnostics for studying the plasma. Each of these arelocated immediately in front of the four divertor handling ports. Either side ofthese diagnostic cassettes, so-called "second cassettes" carry diagnostics, such asthermocouples, requiring only minor adaptation of the cassette body and PFCs.
The plasma facing components (PFCs - four vertical targets, four dumptarget/liner assemblies and two domes) are mounted on the cassette body andmay be replaced in the hot cell by special semi- automatic tools. These PFCs are:
FDR-ITER Plant Design Description Chapter II-Section 4.1-Page 31

• 1.5 m long vertical target outboard of the separatrix with a water-cooled> 100 mm thick stainless steel body and a water-cooled copper heat sinkclad with W in the upper part and C in the lower part;
• Target/liner assembly clad with C on the dump target and with W cladof broadly similar construction to the vertical targets;
• W clad water-cooled copper dome.
The above are reference material choices, and are unchanged since the DDR. CFCis used in the lower region of the vertical target (VT) and the short dump target,and W is used in other regions where the heat flux does not exceed 5 MW/m2.The required lifetime of the divertor plasma facing components is at least 1000with a goal of 3000 full power discharges.
A number of design changes have been made in the divertor system since theDDR: the design has been adapted to eliminate the wings, the dome body designhas been modified to the modular plate structure similar to the VT, the domehas been enlarged to optimize neutral baffling, the heat load capability of theshort dump target has been increased up to <- 20 MW/m2, and the attachmentdesign of high heat flux components has been modified to ease remotemaintainability.
4.1.3.2 Divertor cassette body & cooling
The cassette body is a robust stainless steel structure cooled by water. Thedivertor cooling parameters are 140°C inlet temperature, 0.63 m3/s flow rate ineach of four separate circuits feeding 15 cassettes in parallel, 4.2 MPa inletpressure, and 1.5 MPa pressure drop in-vessel.
The cassette body has internal cooling channels which are optimized to reducedifferential temperature and thermal stress due to nuclear heating. Contrary tothe PFCs, the cassette body is expected to be used for the whole reactor life.UnHIPed cast SS 316L(N)-IG has been selected as the material for the cassettebody. This choice is based on the evidence provided by the manufacture of a full-scale cassette body mock-up within the frame of the L-5 Large Project.
The cassette body provides attachment locations for the PFCs, water pipeconnections for them, pumping holes connecting the private flux region to thepumping ports, attachment points for the support pads and earth straps, as wellas gripping points for the RH machines.
FDR-ITER Plant Design Description Chapter II-Section 4.1-Page 32

4.1.3.3 Divertor plasma facing components fPFCs)
The design has been adjusted recently to remove the wings (Figure 4.1.3.1-1).This change should be able to reduce the tritium codeposition and allowseffective removal of the codeposited tritium. In this new design, surfaces in theprivate region can be kept at high temperature (450°C<T<1200°C) to reduce thecodeposition rate. The liner is clad with W set in a cast pure copper matrix,which is subsequently EB welded to a CuCrZr heat sink (Figure 4.1.3.3-1). Gas isexhausted through chevron shaped W armour blocks on stalks in the liner.Smooth surfaces allow local ECH discharges with oxygen gas, which is one of themost promising methods to remove codeposited tritium.
II Brazti {AMC)1c pare cast copper
in CfC Mount lock
Putt Cu Castlayer
CFC Monoblock
AMC and £9we I dad toMATS! NX
Chevron ShapedW Armour
Macro-Brush
FIGURE 4.1.3.3-1Divertor Plasma Facing Components
The divertor is designed to exhaust 300 MW of surface heat load from the plasmaplus approximately 100 MW of neutron bulk heating. The lower part of the VThas to accept almost all the power conducted in the SOL when the formation of agas target fails or is delayed. The maximum heat flux reaches 20 MW/m2
typically for ten seconds, and it is anticipated to occur in up to 1000 events for theBPP. The heat loads during disruptions are ~100 MJ/m2 in 0.1-3 ms and thoseduring giant ELMs are -10 M J/m2. In these off-normal conditions somematerial will be lost from the CFC plasma facing surface.
FDR-ITER Plant Design Description Chapter II-Section 4.1-Page 33

Vertical targets must be aligned accurately between adjacent cassettes in order toshield the leading edges from direct incidence of particles. The surface of thetarget plates is faceted, otherwise the peak heat flux at the edges becomesunacceptably high. A maximum step between adjacent targets of 4 mm providespeaking factors of 1.4.
A CFC monoblock (Figure 4.1.3.3-2) on a Cu tube will be used for the lower part ofthe VT and short dump targets. The primary bonding method between CFC andCu is active metal casting. R&D fabrication and heat load tests of this designshows satisfactory results (see below). CFC blocks and Cu heat sinks are attachedto stainless steel plates with a thickness of ~ 100 mm. Thirteen plates inboardand nineteen plates outboard are mechanically assembled with long pins(Figure 4.1.1.3-3). Swirl tubes with twist ratio ~ 2 are used to enhance the heattransfer coefficient and to realize higher CHF (Critical Heat Flux).
W Macro-brush
CoolantManifolds
Stainless SteelSupport Structure
Swirltape Insert
FIGURE 4.1.3.3-2Vertical Target of Divertor
FDR-ITER Plant Design Description Chapter Il-Section 4.1-Page 34

4x4 mm x 10 mm thick W armour tiles ("macro-brush") on Cu heat sinks areused for the upper part of the VT. The dome has also W armour tiles, and theheat sink Cu is bonded to stainless steel plates which are mounted on the cassettebody. The primary W-Cu bonding method is active metal casting.
The main electromagnetic load in the cassette body is due to halo currents duringdownward VDEs. The maximum halo current is ~ 0.2 MA/cassette, and thedownward force is ~ 4.5 MN/ cassette. The maximum EM load on the plasmafacing components is due to eddy currents and is ~ 4 MPa.
In R&D, fabrication and tests of PFC mock-ups have been done by the HomeTeams. CFC monoblock mock-ups survived more than 1000 cycles of20-24 MW/m2. W mock-ups fabricated by active metal casting survived~ 1000 cycles of ~ 16 MW/m2. CHF tests have been done on swirl tubes andhypervapotron. CHF ~27 MW/m2 was achieved in ITER-like conditions andheat flux profiles. Fabrication and tests of full scale mock-ups of the VT are nowunderway.
4.1.3.4 Scheme of PFC attachment to divertor cassette body
Considerable effort since the preparation of the IDR has gone into developing theattachment scheme for PFCs to make them readily replaceable in the hot cell.The current proposal is to install all PFCs and to maintain them in positionagainst the halo and eddy-current induced loads using separate keys. Tightpositioning and alignment is achieved using dose tolerances for the interfaceholes for the keys in both the PFCs and the cassette body. In the worst cases ofdistortion after operation, milling is foreseen to remove a PFC from the cassettebody.
Coolant pipe connections between the PFCs and the cassette body are locatedwithin the body of the cassette to avoid regions subject to high neutronstreaming so as to remain reweldable.
4.1.3.5 Divertor support pads
The support pads consist of stainless steel structures with trapezoidal cut-outs tosuit the shape of the toroidal rail. This aligns the cassette in the verticaldirection. The pads also include the locking mechanism for the cassettes. Theinboard support pads provide (through contact pressure) the electrical connectionbetween the cassette and the W at the bottom of the divertor. The outboardsupport allows movement in the radial direction, and insulates the cassette fromthe rail.
FDR-ITER Plant Design Description Chapter H-Section 4.1-Page 35

4.1.3.6 Divertor electrical links and gas seal
Electrical links (also known as "earth straps") are needed between each cassetteand the inner and outer baffle. Their function is to provide a defined currentpath in order to localize halo current forces and to avoid arcing. Designs for thelinks have been developed and will be tested in the R&D program.
The divertor to main chamber gas "seals" are located between the divertor andoutboard/inboard structures cantilevered from the vacuum vessel wall and isintegrated with the electrical link between the divertor and baffle. The outboardseal is designed to meet a leak tightness of < 5 Pam3/s for a 104 pressure ratiobetween the divertor and main chamber at a pressure of 1 Pa in the divertor area.
4.1.3.7 Diagnostic cassettes
Two types of diagnostic cassettes and a diagnostic block are foreseen, located ingroups of three in front of the four remote handling ports:
8 Eight standard (second) cassettes instrumented with sensors such asmagnetic pickup coils, pressure gauges, bolometers and Langmuirprobes located at both sides of each divertor RH port. Most of thesesensors are integrated into water-cooled sensor panels provided on theside walls of these cassettes;
8 Four special diagnostic (central) cassettes with viewing slots installed inthe central cassette of each RH port providing access for opticaldiagnostics such as visible spectroscopy, and IR/visible imaging systems(Figure 4.1.3.7-1 and Figure 4.1.3.7-2).
FIGURE 41.3.7-1Optical Diagnostics Installed at the Toroidal
Mid-Plane of the Central Cassette
FDR-ITER Plant Design Description Chapter Il-Section 4.1-Page 36

Wave guides Wave guide panel S u p p o r t
Microwave converter
4.1.3.8
FIGURE 4.1.3.7-2Microwave Diagnostics Installed on the Edge the Central Cassette
Dust and codeposition issues
Plasma wall interactions in ITER with materials such as Be, W, and CfCs isexpected to generate substantial amounts of "dust", much of which will end upin the divertor region. This dust may be tritiated, radioactive, chemicallyreactive and/or toxic. Its high surface area may promote reactions with steamduring a water leak (Be-dust) producing sizeable quantities of hydrogen, or giverise to the possibility of explosion during sudden air leaks (carbon dust).Therefore, methods are required to measure the quantity of dust inside the ITERmachine and to remove it during maintenance periods (see Section 6.2.7).
The total amount of allowable dust for each material on safety grounds dependson various factors such as the type of hypothetical accident scenario, the size ofthe dust particles, the location of dust at the moment of the accident, thetemperature of the surface on which it lays, the fraction of dust which is oxidized(Be), etc. At present the maximum dust inventory is assumed to be 200 kg-C,100 kg-Be (both from chemical reactivity considerations), and 100 kg-W (fromradiological confinement considerations). Dust production is not at presentthought to be a major driver in the choice of plasma facing materials.
The formation of a codeposited layer of carbon or beryllium, particularly on thecool surface of the divertor PFC's, is a concern from the tritium retentionviewpoint. Even if flaking of these layers would occur above a certain thickness,tritium would remain trapped. Although the physical behavior of these layers inITER is still under investigation, there seems to be a strong need to developreliable and efficient in-situ cleaning methods that would periodically removetritium from the codeposited layers or remove the layers themselves. Varioustechniques are being investigated (e.g., baking in O2, high frequency He/Odischarges).
FDR-ITER Plant Design Description Chapter II-Section 4.1-Page 37

4.1.3.9 Assessment of divertor manufacturing feasibility and cost
To the extent possible, all aspects of divertor manufacture are covered in theframe of the Large R&D Project L-5. This project will enter its integrated testingand assembly program in late 1998.
Several design changes have increased the overall cost of the divertor. Theseinclude the use of CFC and W as opposed to Be as in the original design, and theuse of two PFC materials on the same component. However, a betterunderstanding and optimization of industrial processes involved has let to partlycompensating savings. Nevertheless, although several companies have thecapability and a number of solutions appear satisfactory, the large number ofdelicate but sufficiently defect-free joints between different materials remains achallenge.
4.1.3.10 Divertor overall assessment
In conclusion, the above divertor design provides an engineering solutioncompatible with today's plasma physics expectations. Its feasibility is beingthoroughly investigated through the Large Projects L-5 and L-7. The design isresilient to the uncertainties in the plasma physics extrapolation, andcorresponding component durability, providing a system for rapid replacementand refurbishment. The present design provides an accurate mechanicalsupport, and flexibility to change the divertor geometry (PFC geometry) as well asthe plasma facing materials on the PFCs.
The design has developed since the IDR, but there are no fundamental changesfrom the design put forward then. Effort post FDR will concentrate on furtheroptimization of the manufacturing processes and on incorporating the results oftesting as rapidly as possible into the design.
FDR-ITER Plant Design Description Chapter Il-Section 4.1-Page 38

INTERNATIONAL THERMONUCLEAR EXPERIMENTAL REACTOR
«
TECHNICAL BASISFOR THE
ITER FINAL DESIGN REPORT, COSTREVIEW AND SAFETY ANALYSIS
(FDR)
Chapter IISection 4.2
ITER PLANT DESIGN DESCRIPTION
13 July 1998

CHAPTER IISECTION 4.2
MAGNET SYSTEMS
TABLE OF CONTENTS
4.2 Magnet system 14.2.0 General 14.2.0.1 Coil features and layout 34.2.0.2 Structural design 44.2.0.3 Conductor design and development 84.2.0.4 Interface with power supplies and cryoplant 104.2.1 TF coil system 124.2.1.1 TF coil data .124.2.1.2 Assessment of the TF coil system 144.2.2 PF coil system 154.2.2.1 PF coil data 154.2.2.2 Correction coils 174.2.2.3 Assessment of the PF coil system 184.2.3 Central solenoid system 184.2.3.1 Assessment of the CS coil system 204.2.4 Gravity and vacuum vessel supports 204.2.5 Magnet testing 214.2.5.1 Conductor tests 214.2.5.2 Insulation and conduit flow properties 224.2.5.3 Joints 224.2.5.4 Cold testing coils or coil sections 224.2.6 Poloidal field control 234.2.7 Coil power supply 274.2.7.1 High voltage (HV) substation and AC power distribution 274.2.7.2 TF coils power supply system 284.2.7.3 PF coils power supply systems 284.2.7.4 CS power supply system 294.2.7.5 Coil grounding 304.2.7.6 Switching networks and discharge circuits 304.2.8 Overall design assessment 32

4.2 Magnet system
4.2.0 General
The overall design philosophy has been to produce a system which usestechnology at industrial scale which is either well established or proven throughthe Model Coil programme. The structural design is robust and relies on thestrength and rigidity of the massive TF coil cases. Flexibility in operation is animportant aspect which has been achieved with a versatile configuration of thePF coil system. Reliability and availability of the system are also key factorswhich have influenced the design of components and the magnet insulation.The magnet system uses fault resistant insulation and redundant elementswhenever possible. For all components, repair or replacement schemes havebeen developed.
The magnet systems of ITER have a large bearing on the design of all ITERsystems, and are a major factor in the overall cost and schedule. This can clearlybe seen from the magnet material requirements which are shown in theTable 4.2-1.
TABLE 4.2-1Summary of ITER Magnet Material Requirements
Conductor:
- Nb3Sn Wire
- NbTi Wire
- Copper Wire
— Stainless Steel Conduit
- Alloy 908 ConduitSteel Structures:
-- TF Coil Radial Plates
- TF Coil Cases-Crowns- CS Preload Structure
— CS Inner and Outer Cylinders
- PF Coil Supports— Gravity and W Supports
10411 (238,000 km)
8651 (194,000 km)
6051 (157,000 km)
24111 (173 km)8841 (230 km)
27001
9000t11131
7321400t
26411
24741
The main development since the DDR is the increase in the number of PF coilsfrom 7 to 9 which has been achieved essentially by splitting the two smalldiameter PF coils, which were made with Nb3Sn superconductor in the DDRdesign. The result is a configuration with plasma shape and position controlsomewhat improved over the DDR design and with the significant advantage(for both initial cost and replacement if required) that all PF coils now use NbTisuperconductor. In addition, the layer-wound monolith central solenoid (CS)design has been retained as the reference approach after alternative segmented
FDR-ITER Plant Design Description Chapter II-Section 4.2-Page 1

CS designs and different poloidal field (PF) coil configurations were studied indetail.
Since the DDR there has been significant progress in:
Analysis
• Remodelling of the complete TF and CS systems for stress analysis.
• Refining conductor and structures AC loss calculations based on thenew reference scenario and others defined for operational flexibility.Calculation of AC losses for new plasma control specifications.
• Specification of the various heat loads and definition of the heat budgetfor the coils and structures, in particular, redefinition of conductornuclear heat loads.
• Simulation of the complete cooling loop including the coils andstructures and the cryosystem to identify and analyze the means tosmooth the heat load fluctuations to the cryoplant during and betweenpulses.
• Further analyses of safety related events.
Design
• Detailed design of the structural components including in particular,the design details for the TF coil cases and the outer intercoil structures,the crowns, the PF coil supports and the gravity supports.
• Redesign of all PF coils for the new configuration.
• Specifying locations and sizes for all the coil terminal boxes (CTBs)which interface with the power supplies and cryoplant, as well asrouting for the feeders for the power and helium to the coils.
• Defining the requirements for and integrating correction coils (CCs)into the design to allow error field compensation.
• Layout of structure cooling pipes in the magnet structures.
R&D.
• Completion of conductor production for the Model Coil programs.
• Demonstration of many of the Model Coil fabrication processes: heattreatment, winding, turn insulation, radial plate machining (TF only).
• Successful test of prototype joint.
FDR-1TER Plant Design Description Chapter H-Section 4.2-Page 2

The following provides an overview of the design status and the changes sincethe DDR, together with an assessment.
4.2.0.1 Coil features and layout
The cutaway view in Figure 4.2.0.1-1 shows two TF coils, sections of a PF coil andthe CS, and selected parts of the magnet structures.
The magnet systems include 20 toroidal field (TF) coils, 9 PF coils, 16 CCs, the CSand the magnet structures. The TF coils provide a constant magnetic field tostabilize the plasma. They operate at a maximum total field up to 12.8 T with astored energy of 103 GJ. The CS provides about half of the magnetic flux changeneeded to initiate the plasma, induce the plasma current, and maintain theplasma current during burn. Maximum field at the conductor of the CS reaches13 T with a stored energy of 10.8 GJ. The PF coils provide the magnetic field,which changes over time to control the plasma position and shape. At thesurface of the PF coils the magnetic fields are <; 5.0 T except for PF9 where thefield reaches 6.5 T. Relatively small cross section CCs are used to compensate forfield errors caused by variations from ideal axisymmetry in coil fabrication andinstallation. All magnet systems are designed to withstand up to 50000 full-power tokamak pulses.
The magnet structures (shown in Figure 4.2.0.1-1) integrate all coils (TF coils, PFcoils, correction coils and CS) and the vacuum vessel and internals into onemechanical system for electromagnetic, gravity and seismic load equilibration.The structures maintain also the spacing between vessel and magnet systems.
The magnet systems are located within the cryostat (as illustrated inFigure 4.2.0.1-2) which provides the thermal insulation for the 4.5 K super-conducting coils from the ambient heat load. This is done by a vacuum withinthe cryostat to eliminate the heat transfer by conduction and convection, and bythe use of intermediate temperature shields to intercept the bulk of the thermalradiation from the cryostat and the vacuum vessel.
The coils are energized, controlled and protected by the power supply systemsand cooled by the cryoplant. Cryogen services, buswork and instrumentationpenetrate the cryostat using coil terminal boxes (CTBs) and cryostat feedthroughs(CFs) then reach the connections at the coils through feeders. The interface withthe cryoplant and power supplies is at the CTBs where the buswork makes atransition from room temperature to the superconducting temperature of thecoils.
Since the DDR, the preliminary design of the CTBs, CFs and feeders has evolvedand their integration into the system has been developed further. There are 29CTBs located on two pit levels to service the coils. Three structure cooling valveboxes (SCVBs) are similar in function and are used to provide the interfacebetween the magnet structures cooling loops and the cryoplant. There are alsotwo instrumentation feedthrough boxes (IFBs) connecting the magnet system
FDR-ITER Plant Design Description Chapter II-Section 4.2-Page 3

sensors inside the cryostat to the local instrumentation panels in the pit.Superconducting buswork and cryogen supply and return lines have been sizedto allow for component distribution and maintenance within the cryostat.Locating the CTBs in the pit has simplified TF coil connections and limited thesuperconducting busbar length. It also avoids crossing any seismic gap withsuperconducting buswork. Furthermore, for the TF coils, the protection switchesare also located in the pit, therefore a single pair of room temperature busbars(large cross section bus for the connection with the TF converters) would have tocross the seismic gap if seismic isolation were required. The connections betweendischarge resistors and counterpulse capacitors involve 20 groups of coaxialcables which do not pose special problems at the seismic gap.
4.2.0.2 Structural design
The structural concept is based on mutual support between the variousindividual coils to produce a radially compact machine build. The reactionmechanisms for the various loads can be qualitatively described as follows.
The centripetal force of the TF coils due to in-plane electromagnetic loads isreacted by the outer cylinder (OC), the central solenoid (CS) and the innercylinder (IC), which are all part of one central solenoid subassembly. There isalso a small contribution of the outer intercoil structures (OISs) along theoutboard of the TF coil cases to react this load.
The out-of-plane forces acting on the TF coils are supported by the TF coil cases,the outer intercoil structures (OIS) which are integral parts of the TF coil cases onthe outboard legs and the two crowns at the upper and lower inboard curvedregions of the TF coils.
The PF coils carry their radial loads individually and have supports to transmitvertical loads to the thick cases of the TF coils. A preload structure verticallycompresses the CS at assembly and during cool-down of the machine.
The following explains in some detail how loads are reacted and the functions ofthe main structural components.
Gravity supports
Each TF coil has a gravity support placed under the lower outer intercoilstructure. The supports withstand the deadweight and seismic loads in thevertical and toroidal (horizontal) directions while allowing the relative thermalmotion of the magnet system during cooldown. The vacuum vessel is supportedthrough the TF coil case via hangers placed between PF7 and PF8 which providethe necessary radial and toroidal flexibility but hold the vacuum vessel vertically.This arrangement ensures that electromagnetic forces due to disruptions arereacted within the TF coil-vacuum vessel system, not through the TF coil gravitysupports.
FDR-ITER Plant Design Description Chapter II-Section 4.2-Page 4

Lateral positioning of the vessel is provided by toroidal links to each TF coil atthe sides of the main horizontal ports. These supports impose a toroidal rotationof the vacuum vessel as the TF coils flex in the out-of-plane direction duringplasma pulses, but due to the toroidal flexibility of the lower support, they do notcarry significant loads in normal operation. They provide important stiffeningwhich reduces relative TF coil-vacuum vessel system movement underearthquake loads or asymmetric vertical displacement events. A more detaileddescription of gravity supports is given in Section 4.2.4.
The CS winding, together with the outer/inner cylinders and pre-load structurerests on a central CS support. Gross vertical motion is prevented by friction atthe TF coil / CS / Outer Cylinder interfaces but a set of latches provides a positivestop in case of ratcheting of the CS assembly. The whole CS assembly is registeredin the toroidal direction and centered by the toroidal latches located betweenflanges of the pre-load structure and crowns. These latches can also act as verticalstops for large displacements or ratcheting.
TF in-plane magnetic forces
TF in-plane loads are shown on Figure 4.2.0.2-1. The resultant centering force ofeach TF coil is reacted by the CS winding and the outer and inner cylinders. TheOC is toroidally segmented but under the action of the TF coil forces, thesegments wedge together and support some of the TF coil loads.
The TF coil hoop force is reacted by the radial plates and the case; the coil hasnearly a bending free shape.
The Outer Intercoil Structures (OIS), particularly the upper and lower portions, ispulled into compression by the inward movement of the TF coils as the gap (15mm at room temperature) left at assembly between the nose of the TF coils andthe OC is closed by the magnetic force. This compression is maintained inoperation. Some of the TF coil vertical expansion is transmitted through frictionto the CS as the TF coils are energized. Vertical tension in the CS is prevented bythe vertical compression of the CS produced by the pre-load structure.
TF out-of-plane forces
The TF out-of-plane forces are shown in Figure 4.2.0.2-2. They are reacted aroundthe 20 TF coils through the crowns and OIS structures. The stiffness of the TF coilcase to out-of-plane bending also contributes in the inboard leg region andbetween the three toroidal rings of the OIS. The coil can be separated into threeseparate regions for the out-of-plane support concept:
• The inner leg
There is relatively low stiffness in the out-of-plane direction. Bothouter cylinder and CS twist about their vertical axis because of themovement of the TF coils in the out-of-plane direction. Torsion isapplied to the surface of the OC some of which is transmitted by frictionto the CS.
FDR-ITER Plant Design Description Chapter II-Section 4.2-Page 5

• The crowns
The crowns approximate to two continuous shear rings above andbelow the TF coils. Shear is transferred from the TF coil case to thecrown through rails (monorail) which are an integral part of the casesand engage corresponding radial slots machined in the crown. Eachmonorail must be in contact (at different radial positions) with oppositesides of the crown slot. Typically the monorail contacts one side of theslot on the inner radius of the crown and the other side at the outerradius.
• The OIS
Each OIS ring is a box-type structure that reacts a moment about themachine vertical and radial axis through shear. The effectiveness of thethree OIS sections is increased by extra reinforcement to the TF coil caseside walls in the outer leg which increases the stiffness to out-of-planebending.
CS magnetic forces
The CS radial bursting forces are reacted by the centering forces of the TF coils.The TF coil inward radial pressure at the equatorial plane is larger than the CSoutward radial pressure, and the CS hoop stress remains compressive. At theends of the solenoid (which extends beyond the TF coil straight leg) the CS radialforces are reacted by hoop tension in the conductor jackets and by shear throughthe turn insulation to the central part of the coil. The vertical forces broadlycancel each other along the length of the solenoid (through the winding and byfriction also through the outer cylinder). Any net force is carried by friction at theOC-TF coil interface to the TF coils, but as described above, vertical ratcheting orgross slip would be restrained by latches mounted on the pre-load structureflanges.
PF magnetic forces
The PF radial forces (mainly outwards except for PF7) are reacted by the conductorjackets. The supports onto the TF coils react the vertical forces but are flexible inthe radial direction to allow free radial expansion of the PF coils. The stray fieldcomponent from the TF coils produces a sinusoidal radial and vertical forcecomponent between each support point on the TF coils, resulting in some coiland support bending.
Mechanical assessment
Structural analyses have been extended to cover a wide range of operatingconditions, including seismic and off-normal events. The results show that themagnet system fulfills the requirements with safety margins on maximum stressand fatigue life according to design criteria, but that there are three areas wherestresses are close to the allowed limits: (1) the lower inboard curved regions of
FDR-ITER Plant Design Description Chapter II-Section 4.2-Page 6
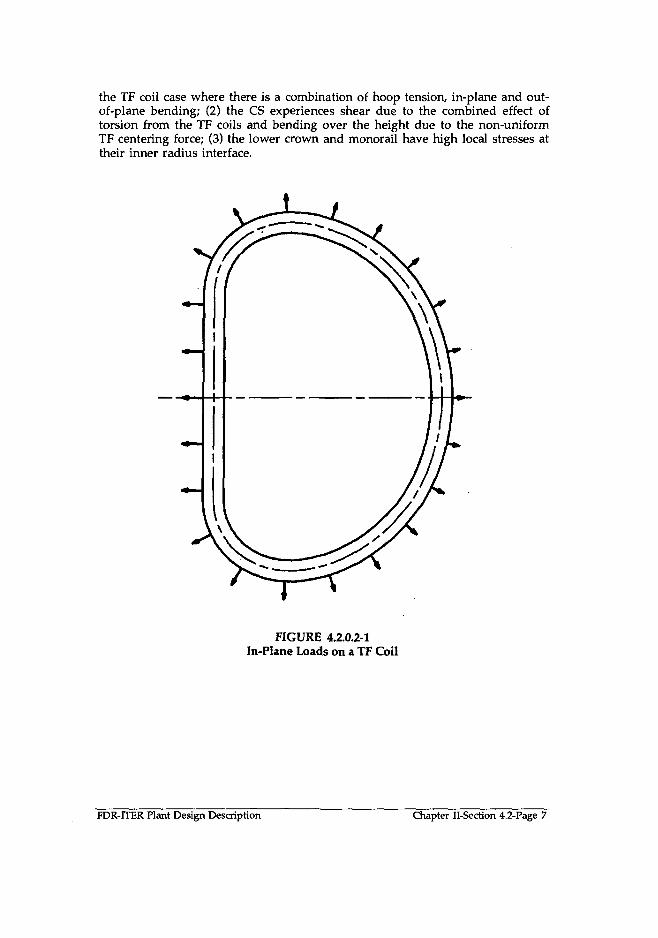
the TF coil case where there is a combination of hoop tension, in-plane and out-of-plane bending; (2) the CS experiences shear due to the combined effect oftorsion from the TF coils and bending over the height due to the non-uniformTF centering force; (3) the lower crown and monorail have high local stresses attheir inner radius interface.
FIGURE 4.2.0.2-1In-Plane Loads on a TF Coil
FDR-ITER Plant Design Description Chapter II-Section 4.2-Page 7

N 11 GR 294 97-12-03 W 0.2 EOB
SOB
SOF
XPF
FIGURE 4.2.0.2-2Out-of-Plane Force Distribution
4.2.0.3 Conductor design and development
The superconductor is composed of superconducting strands that are cabled in amulti-stage arrangement around a central cooling tube formed from a perforatedtube or spiral as shown in Figure 4.2.0.3-1. Copper strands are incorporated intothe cabling layout to provide the necessary quench protection. To reduce inducedcurrent losses, all superconductor and copper strands are chrome coated (forNbaSn conductors) or Ni plated (for NbTi conductors) with a 2 micron thick layerand selected cable substages are wrapped with a steel strip.
The superconducting material NbsSn is brittle and the conductor must thereforebe wound before the reaction treatment (~ 650°C during 200 h) during which theNbsSn compound is formed. The fabrication sequence for the NbsSn coils (TFcoils and CS) is (1) wind the conductor, (2) react, (3) insulate and (4) transfer theconductor to the coil composition station.
Suppliers for NbaSn strand, cabling, jacket material and jacketing havedemonstrated their production ability as part of the ITER R&D program. Thesupporting R&D effort has included a successful benchmarking activityinvolving all Home Teams to standardize the measurement of NbsSn strandcritical properties. Strand samples reacted with the CS Model Coil layers haveachieved their expected current limits.
FDR-ITER Plant Design Description Chapter II-Section 4.2-Page 8

Conductor joint fabrication has been done in parallel with the model coil designand full scale joints continue to be tested. They have shown acceptableperformance for the CS Model Coil and the TF Model Coil joint is also expectedto perform satisfactorily. This is, however, an area where changes for possibleperformance improvement and/or cost reduction for full scale coil manufactureare possible and where a strong R&D effort is expected after EDA.
The TF coils use NbaSn conductor and the conduit or jacket for the TF cable isconstructed of Alloy 908 with a 2 mm wall thickness. The conductors in the TFcoils are not primary load-carrying elements because they are enclosed in heavysteel radial plates and coil cases. Strand and conductor fabricaton for the TFModel Coil is complete and coil fabrication is in progress. An achievement inrelation to demonstrating full scale manufacturing feasibility has been thesuccessful jacketing of a 800 m long TF conductor.
The CS uses three different NbaSn conductors depending on the field level inorder to reduce the quantity of strand required. They are each in the form of acable-in-conduit with a heavy-walled, Alloy 908, square outer cross section jacketand a circular cable. The jackets for the CS conductor are primary load-carryingelements.
The Alloy 908 jacket is necessary since the use of a steel jacket would result in areduction of the maximum field to about 11.5 T, thus limiting the CS fluxcapability to an unacceptable level. Iron-nickel base superAlloys (including Alloy908) may, however, show stress accelerated grain boundary oxidation (SAGBO).An extensive program was successfully carried out to understand the basicrequirements and provide a proper specification for the heat treatment portionof the coil manufacturing process to avoid SAGBO. The main requirement is tocontrol the reaction furnace atmosphere to maintain low oxygen above 500°C.The specified process has been successfully demonstrated for all 18 layers of th CSModel Coil by two Home Teams.
Since the DDR, the CS model coil conductor has been completed (strandfabrication, cabling and jacketing). Winding, heat treatment and turn insulationapplication are complete for all 18 layers and the assembly of each of the twomodules for the CSMC is underway. Three insert coils (2 of Nb3 Sn and 1 ofNbsAl) are at various stages of fabrication and will demonstrate conductorperformance for CS and TF conductors under ITER relevant conditions whentested within the CS model coil.
The conductors for all PF coils and CCs use cables of NbTi superconductingstrands which do not require reaction as part of the fabrication process and can bewound as a conventional copper conductor because NbTi is a ductile material.The cable for the PF coils is similar to that used for the TF and CS coils.However, the conduit for the cable is a heavy-walled, stainless steel jacket with asquare outer section. The CC conductor is considerably smaller in that it uses onesixth of a PF cable with a thin walled stainless steel jacket. The PF coils and CCs
FDR-ITER Plant Design Description Chapter II-Seetion 4.2-Page 9

will be manufactured on-site because their large size makes transportation onland, over long distances, unreasonable.4.2.0.4 Interface with power supplies and cryoplant
Figure 4.2.0.4-1 is a schematic showing a typical superconducting coil interface inmore detail. Within the cryostat, near the coil, the winding has twoterminations connected to busbars and multiple cooling lines to supply andreturn helium.
The cooling lines at the coil are typically connected to joints within the windingand operate at the local voltage of the coil. Each of the cooling lines, therefore,has an electrical insulation break, located near the coil in a break box, so that itcan be attached to either a He supply or return manifold operated at groundpotential.
Two superconducting busbars, together with the helium supply and return lines,are surrounded by a vacuum-tight conduit and form an in-cryostat feeder. Thelatter can be quite long and connects to a cryostat feedthrough that penetrates thecryostat wall and connects to the CTB. The cryostat feedthrough typicallycontains U-shaped bends to allow for thermal contraction differences, nuclearradiation shielding, and a vacuum barrier to isolate the vacuum in the CTB fromthe coil and cryostat vacuum. Since the DDR, the feeder design and paths in thecryostat have been considered in more detail to provide for easier installation.
Each CTB contains heat exchanger current leads that connect thesuperconducting busbars to the room temperature bus terminals outside the box.The CTB also contains valves to control the helium supplied for variousfunctions and has fittings on the exterior of the CTB to form the interface withthe various lines from the cryoplant. Since the DDR, the flowpaths, particularlyamong magnet structures, have been considered in more detail to allow furtheranalyses and to determine the interface requirements with the cryoplant.
Each superconducting coil or module has a helium supply and return from amanifold near the coil. The interface to the cryoplant for this supply and returnis at the CTBs. Figure 4.2.0.4-2 illustrates the helium distribution system for allmagnet systems except for the current leads which are cooled directly from thecryoplant and are not in the secondary cooling loops shown. Coils are groupedinto sets which have individual cooling loops with a pump and heat exchangerin an auxiliary cold box supplied with helium from the heliumliquefier/refrigerator. For example, distribution from two secondary loops of thecryoplant to the 20 TF coils occurs in the 10 CTBs dedicated to these coils andlocated at the upper coil terminal level of the pit.
In the event of a quench in one or more coils, the helium liquefier/refrigeratorcannot cope with the return of the coil inventory of helium on a short time scale.A cold recovery tank is, therefore, provided to serve as a storage for the helium.Each pair of supply and return lines from the cryodistribution system has apressure relief system within each CTB that allows the large volume of heliumassociated with a quench to vent into a separate header located in the upper orlower coil terminal level. The headers then route the helium to a recovery tank
FDR-ITER Plant Design Description Chapter II-Section 4.2-Page 10

(see schematic in Figure 4.2.0.4-1). The recovery tank and the piping have beensized to accommodate the extreme condition of a simultaneous quench in allcoils.
Figure 4.2.0.4-2 also illustrates the helium distribution system for the CS, PF coilsand CCs. The distribution from the secondary loops to the CS sections occurs inthe two CTBs dedicated to the CS and located at the lower coil terminal level.The CTBs for the PF1-4 coils and the top CC are located at the upper coil terminallevel. The CTBs for the PF5-9 coils and the side and bottom CCs are located at thelower coil terminal level. This layout and the associated space requirement havebeen developed since the DDR.
The distribution from the secondary loops to the PF coils and the CCs occurs inthe sixteen CTBs dedicated to the PF1-8 coils and the CCs. A separate loop isprovided for the PF9 coil which operates at a lower temperature (3.3 K inlet) thanthe other coils, because of the limited space, field level and use of NbTi for thiscoil.
Twenty cooling loops are used for the TF structures and the PF structuralinterface with the TF coils. An additional twenty loops are used on the plasmaside of the TF cases because of the nuclear heat load concentration in this area.Ten cooling loops are used for the CS preload structure. The lower section ofFigure 4.2.0.4-2 shows three structure cooling valve boxes (SCVBs) and theirsupply from a heat exchanger box that is part of the cryoplant. The SCVBs aresimilar to the CTBs but without busbars. They are located at the lower coilterminal level of the pit.
All the heat, transferred or generated in the magnet system, is removed byhelium flow from the components to the refrigeration system. The heat to thecoil windings is removed as a first priority, with little delay, to enable thesuperconductors to operate within their proper temperature range. The heatinduced or transferred to the structures is removed as a second priority on acycle-averaging basis, by using the periods of time when the load on therefrigerator is lower to reduce the peak refrigeration power required. A completeoperating cycle of the magnet and structures cooling circuits includes cooldown,stand-by-cold, ready-for-pulse, normal-operation, upset-conditions occurringduring normal operation such as plasma disruption or quench, return tostandby-cold, and warmup. Helium flow, inventory and temperature for themagnet system are supplied and controlled by the cryoplant, while the magnetsystem provides for adjustment of the helium flow in each component coolingloop.
Each TF coil has two superconducting busbars from the coil to the CTB, and twocurrent leads at the terminal pair connected to the TF coil power supply system.Servicing two TF coils per CTB accommodates the limited space in the pit andallows a modular design that is easier to install and maintain. Each PF coil has atleast two superconducting busbars per coil depending on the terminal voltragelimit, and two current leads connected to the power supplies for each pair ofbusbars. The CCs each have two superconducting busbars per coil (or pair of coils
FDR-ITER Plant Design Description Chapter II-Section 4.2-Page 11

for the side CCs) to the CTB, and two current leads at each terminal pairconnected to the power supplies. There are two superconducting busbars fromeach CS section to a CTB and two current leads to the power supplies. The powersupplies are covered in more detail in Section 4.2.7.
Coil protection by the power supplies includes fast discharge in the event of arapid transition from superconducting to normal conducting state (a "quench")in one or more coils. The primary quench detection system relies on measuringand comparing the voltages across similar conductors to exclude inductivevoltages and determining the resistive voltage associated with the start of aquench. There is a backup system that acts on a longer n'mescale and uses as asignal the flow changes generated in the cryogen by a quench. The combinationof the two provides a quench detection system that is reliable and robust.
4.2.1 TF coil system
4.2.1.1 TF coil data
Each TF coil has a welded case that contains a winding pack of seven radial steelplates with machined grooves holding circular conductors in a pancakeconfiguration. These radial plates transfer the forces acting on each conductordirectly to the cases without accumulation of forces on the conductor and itsinsulation. The case and the plates protect the insulation during assembly andincrease the structural stiffness of the TF coils. In addition, the case supports thePF coils and vacuum vessel as described in Section 4.2.0.2. The case-radial plateconfiguration provides, therefore, a local structural arrangement that reducesinsulation stresses and improves reliability of the TF coils and is also an efficientoverall structural scheme for the tokamak. This concept has not changed sincethe DDR, however, design optimization has been carried out.
A significant change has been the modification of the double pancake windingconfiguration from two single pancakes with an intermediate joint to a doublepancake with a single conductor length. This change, which complicatessomewhat the transfer of the conductor onto the radial plate, was made toeliminate the inaccessible joints on the plasma side of the winding pack to reducethe number of joints in each coil, and to provide more space for the breedingblanket. Other changes have occurred to accommodate changes in port sizes andlocation and changes in the configuration of the PF supports, and to reduce theweight somewhat.
Tables 4.2.1-1 and 4.2.1-2 show the main parameters for the TF coils system. TheTF coils are essentially identical to those in the DDR from the standpoint ofelectromagnetic characteristics except for the discharge voltages which have beenreduced due to more detailed analysis including the coupling effect of all passivestructure. From the geometric standpoint, there have been some minor changesto accommodate the changes mentioned above.
FDR-ITER Plant Design Description Chapter II-Section 4.2-Page 12

TABLE 4.2.1-1TF Coil - Geometrical Data
Parameter
Overall Height/Width (m)
Approximate Weights: (t)Cable
Conduit
Insulation
Radial PlatesCoil Case
Total per Coil
Average Turn Length (m)
Value
18.7/ 12.0
64197
145450
685
44
TABLE 4.2.1-2TF Coil - Electromechanical Data
Parameter
Number of Coils
Number of Turns per Coil
Total Current per Coil (MA)Current per Conductor (kA)
Self Inductance of a Single Coil (H)Total Inductance (H)
Total Stored Energy (GJ)
Max. Toroidal Field at Conductor (T)
Maximum Total Field (T)Centering Force per Coil (MN)Vertical Tensile Force per Half Coil (MN)Applied Voltage per Coil (kV)Voltage to Ground (kV)
Fast Discharge Time Constant (s)
Value
20192
11.5
60.2
0.92
56.9
103
12.712.8
7263716.1
±3.1
15
In case of quench in one of the TF coils, the required time constant for thedischarge is 15 s following a 2 s delay allowed for quench detection and dischargeinitiation. The voltage to ground in every coil section is ± 3.1 kV in normalconditions. If a quench is detected in a TF coil, the CS and PF coils must also bedischarged. The coil power supply, protection and discharge system have beendesigned to this requirement and are described in Section 4.2.7.2.
FDR-ITER Plant Design Description Chapter II-Section 4.2-Page 13

4.2.1.2 Assessment of the TF coil system
Design
The design of the TF coils has been adjusted to account for interface requirementssuch as the spatial requirements of the vacuum vessel and ports and the gravitysupports for those systems. The mechanical design has been advanced to a moredetailed level. Details of the joint and lead regions have been developed. Designmodifications for weight and potential cost reduction have been implemented.Significant strides have been made in the layout of the CTBs in the pit area andin providing sufficient space for the power and cryogen services for the coils.This is the case for all the magnet systems and has been done to facilitatemaintenance.
The result is a system described at an engineering level such that detailedmanufacturing and cost studies have become possible and have been carried outby the industries of the four ITER Parties.
Analysis
Conductor analyses have been refined to cover the new operating scenario andnow include more accurate algorithms for AC loss calculations. The analysisincludes also preliminary simulations of the complete loop formed by the coilsand the cryosystem.
Structural analysis have been extended to cover a wide range of operatingconditions, including seismic and off-normal events.
R&D
The backbone of the TF coils R&D effort is the TF model coil for which industrialcontracts are in place, the design is complete and fabrication has begun.
Conductor fabrication is complete. In order to maintain a rapid schedule, themodel uses a stainless steel rather than Alloy 908 jacket for the conductor. Adouble pancake will be manufactured with an Alloy 908 jacketed conductor toaddress the unique problems associated with the use of Alloy 908. This work isin progress.
Manufacture of the Model Coil radial plates and case has begun. The forging ofall radial plates has been done and their machining is in progress. The modeluses radial plates, each made from a single steel plate, and a case configurationwith some welds relocated to simplify assembly of winding pack and case asopposed to simulation of a full scale case. Coil winding, heat treatment, turninsulation, transfer to the radial plates, and laser welding of covers over theconductor grooves has started and has demonstrated the applicability of theseprocesses to the full scale coil.
The insulation to be used for the TF coils involves multiple wraps of pre-impregnated glass interleaved with a polyimide film around turns, pancakes and
FDR-ITER Plant Design Description Chapter H-Section 4.2-Page 14

winding packs so as to provide a reliable, fault-resistant barrier. Mechanical andelectrical performance tests have been carried out on samples with and withoutexposure to radiation. More work is necessary in this area, including thedetermination of the impact on insulation properties of gas evolution in theinsulation under irradiation.
Certain activities are in progress and R&D has been started to demonstratefabrication techniques and to confirm material properties in full scale case andradial plate sections. This work includes the manufacture of a half section of afull scale radial plate from multiple plates and the fabrication of two full scalecase sections.
The R&D status for superconducting strand, cable and joints is discussed inSection 4.2.5
4.2.2 PF coil system
4.2.2.1 PF coil data
The main development since the DDR is the increase in the number of PF coilsfrom 7 to 9. This has been achieved essentially by splitting the two smalldiameter PF coils, which were made with NbsSn superconductor in the DDR.The result is a configuration with plasma shape and position control somewhatimproved over the DDR design and with the significant advantage (for bothinitial cost and replacement if required) that all PF coils now use NbTisuper cond u ct or.
Since the DDR there have also been minor changes in the MAt requirements,and a resizing of cable and jacket cross sections to account for the expected rangeof operating conditions for current, AC losses and loads. The net result is anincrease in the weight of NbTi required but a decrease in cost because of theelimination of a significant amount Nb3Sn conductor and the more complexmanufacturing requirements for two Nb3Sn PF coils.
The PF coils are built with thick-walled, stainless steel, square conductors indouble pancake configuration. The conductors use an insulation incorporating agrounded screen which allows monitoring and detection of an impending turnto turn short circuit. They are vertically supported by clamps linked to the TFcases through flexible members, which allow free radial expansion of the PF coils.All the PF coils are difficult to replace in the event of failure, especially those"trapped" beneath the machine, so redundancy has been built in, with each coilhaving four distinct modules. For PF1-8, all four modules will normally beoperated at 3/4 of the maximum operating current. In the event of a failure in amodule, the faulty module would be isolated electrically and the remaining threemodules would be operated at maximum operating current with a reducedtemperature of 3.8 K, thus still achieving the required MAt. The MAtrequirement for PF9 is sufficiently high that using NbTi at the fields anticipatedat this location requires that all four modules normally operate at maximumcurrent and at a Helium coolant inlet temperature of 3.3 K.
FDR-UER Plant Design Description Chapter II-Section 4.2-Page 15

Replacement of the PFl-8 coils would be necessary only after failure of twomodules in the same coil. In case of failure of PF9 the loss of MAt will becompensated with an increase in current of PF8, which can be operataed at highercurrent provided it is operated with helium at reduced temperature. For theDDR PF coil configuration, the replacement of the lower PF coil which usedNbsSn superconductor by winding a new coil under the machine wasproblematic. With NbTi now used for all PF coils, it is now considered feasible.The sizes of the cross sections of the PF coils and the location of the center of eachof the PF coil cross sections are given in Table 4.2.2-1, together with the numbersof turns, maximum current, and weight.
TABLE 4.2.2-1PF Coil Sizes at Operating Temperature, MAt Capacities, and Weights
PF CoilNo.
PF-1
PF-2
PF-3PF-4
PF-5
PF-6
PF-7PF-8PF-9
Position of CoilCenter
Rc(m)3.8835.991
12.98815.370
15.444
13.194
9.6315.8643.883
Zc (m)*9.767
9.8877.321
4.220
-2.265
-8.089
-9.157-9.808
-10.152
Coil Size with GroundInsulation
DR(m)0.686
1.3230.878
0.636
0.785
1.041
1.226
1.6030.908
DZ(m)1.1471.147
1.081
0.593
2.131
2.430
1.1761.1611.849
NumberofTums
156
316
22076
376
440
284380284
MaximumCurrent
(MAt)7.0
14.29.93.4
16.9
19.8
12.817.1
12.8
Weightof Winding
<t)97
296
381173
828
1170
458359226
* Note: Zc is measured from the TF coil midplane
Every PF coil is wound in double pancakes. The PF 2-8 coils are wound with twoconductors-in-hand due to conductor unit length limitations. The smaller PF1and 9 coils are wound with one conductor-in-hand. Each coil comprises fourmodules connected electrically in series.
In all but the larger coils, PF5 and 6, there are less than four terminal pairs atroom temperature because the coil voltages are such that more than one modulecan be operated in series without exceeding terminal voltage limiting criteria.Fewer terminal transitions from superconducting bus to room temperaturereduces the cryoplant heat load, but, in these cases, the failure of a module willrequire a reconfiguration of the connections within the coil terminal box or, insome cases, near the coil.
FDR-ITER Plant Design Description Chapter II-Section 4.2-Page 16

Each PF coil has its own power system, which operates independently from theothers, except for the coordination of the protective actions. In case a quench isdetected in one PF coil, the CS and all PF coils and CCs are dischargedsimultaneously (fast discharge). This avoids unacceptable out-of-plane loaddistributions on the TF coils. The required time constants of the discharge andthe maximum allowed voltage in each coil section (module) are given inTable 4.2.2-2. The PF coil protection and discharge system, described inSection 4.2.7, is similar to the system used for the TF coils.
TABLE 4.2.2-2PF Coils Electromagnetic Data
Coil
ParameterNumber of Section in Series
Rated Current(normal/backup'1)) [kA]Maximum Stored Energy [Gfl
Voltage to Ground [kV]
Fast Discharge Time Const,(normal/backup^2') [s]
PF1 PF2 PF3 PF4 PF5 | PF6 PF7 PF8 PF9
Value145/600.9+/-2.5
20/15
245/603.2+/-4.0
20/15
245/603.4+/-3.0
20/15
145/601.2+/-3.0
20/15
445/609.1+/-4.0
20/15
445/609.8+/-4.0
20/15
1 245/603.0+/-4.0
20/15
245/60
3.8+/-4.0
20/15
1
45/-
2.0+/-4.0
20/-
(1) Current (33% over nominal value) that will be supplied to the remaining modules in adamaged coil after one faulted module is separated.
(2) Time constant for the discharge of energy of the remaining three modules in a damaged coilafter the faulted module is disconnected.
4.2.2.2 Correction coils
The perturbation of the axisymmetry of the magnetic field is called the "errorfield". To avoid plasma "locked-modes" (and associated disruptions), theamplitude of the non-axisymmetrical error field normal to the q=2 surface(particularly the m=2, n=l mode, where m and n are the poloidal and toroidalmode numbers respectively) should be limited to approximately 1O5 relative tothe toroidal magnetic field (5.7 T).
Error field can arise due to misalignment of PF and TF coils, errors in the shapesof the coils, busbars, nonaxisymmetrical modes of eddy currents, other non-axisymmetrical currents, ferromagnetic elements, the shields of the neutral beaminjectors, etc. The expected value of the error field is about 10~4.
Since the DDR, 16 CCs capable of compensating the anticipated error field levelshave been added. There are 4 CCs at the top and bottom and 8 CCs on the side ofthe TF coils. The CC conductor uses a cable similar to one of the six sub-cables ofa PF coil conductor inside a thin square jacket. Each CC has multi-turns inside astructural steel case.
FDR-ITER Plant Design Description Chapter II-Section 4.2-Page 17
The performance of the CCs to correct error field is briefly described inSection 4.2.6.
4.2.2.3 Assessment of the PF coil system
The PF coil design and analysis for conductor performance and structures hasfollowed the evolution of the requirements for the range of scenarios needed foroperational flexibility and control. Adjustments to the PF coils have been madesince the DDR for better consistency with physics requirements and withinterface restrictions from the power supplies and cryoplant. CTBs have beenrealistically sized, and improvements in the interface of the current and coolingpipe connections near the coils have been made. Fabricability of the PF coils onsite has been assessed and space has been allocated on this basis.
4.2.3 Central solenoid system
Since the DDR, alternative CS designs have been studied to evaluate potentialadvantages in better operational flexibility from the physics standpoint andpossible cost reduction. One option considered was the so-called "hybrid" designwhere the CS was segmented into three modules along the vertical axis. Thisoption offered plasma shaping advantages but could not be retained because ofhigher stress in the TF coil case and torsional shear in the CS. As indicated inSection 4.2.0.2, stress in these areas is close to the allowable limit. Themonolithic, layer-wound solenoid design was therefore retained as the reference.This CS design has been assessed and is considered satisfactory for the ITERmission.
The CS is layer-wound with heavy-walled, Alloy 908, square conductors along itsentire height. Each layer is wound with four conductors in hand to reducecooling channel lengths. Layers are alternately wound from bottom to top andtop to bottom, to allow series connections of each set of four conductors. Thefour conductors are thus electrically in parallel to reduce turn-to-turn voltageswithin the layers. Electrical terminals are located at the bottom, about 1.5 mbelow the winding pack, and interlayer series connections are at the top andbottom, about 1.5 m above and below the ends of the windings. With thisarrangement all the joints are located in low field regions. Tables 4.2.3-1 and4.2.3-2 show the CS parameters.
The CS winding geometry is essentially the same as in the DDR and there are nochanges in the electromechanical data.
FDR-ITER Plant Design Description Chapter II-Section 4.2-Page 18

TABLE 4.2.3-1Central Solenoid — Geometrical Data
Parameter
Height of Winding (m)
Inner Radius of Winding (m)Outer Radius of Winding (m)
Maximum Conductor Length, High Grade (m)
Maximum Conductor Length, Medium Grade (m)
Maximum Conductor Length, Low Grade (m)
CS Component Approximate Weights (t)
Cable
Conduit
Insulation
Buffer zone, etc.
Outer and Inner cylinders
TotalPreload Structure Weight (t)
Value
12.172
1.899
2.710
758
916
1040
264
464
53
82400
1263732
TABLE 4.2.3-2Central Solenoid — Electromechanical Data
Parameter
Number of Turns
Maximum Field at Conductor (T)Total Current(MA)Current per Conductor (kA)Total Vert. Comp. Force at Mid-Plane (GN)
Self Inductance (H)
Stored Energy (GJ)
Maximum Applied Voltage (kV)
Maximum Voltage to Ground (kV)
Value
3372
13.0* / 12.5**127.7* / 141**
38* / 42**1005
0.94
10.8* / 13.3"
12.6
+/-6.4
* Initial Magnetization** End of Burn
The CS is independently powered. In the event of a quench, the CS, all PF coilsand CCs are discharged simultaneously. The CS power system is discussed inSection 4.2.7.4.
FDR-ITER Plant Design Description Chapter II-Section 4.2-Page 19
4.2.3.1 Assessment of the CS coil system
The CS model coil program has demonstrated the ability to produce the specifiedstrand and cabling by all ITER Parties. All 25 tonnes of NbaSn strand have beencompleted. All of the heavy-walled Alloy 908 jacket for the conductor has alsobeen completed. A 300 m jacketing line has been set up and used to produce allthe lengths of jacketed conductor for the model coil, based on the method for fullscale production. The design of the CS model coil is complete and all majoritems of tooling have been procured. Winding and heat treatment of all 18 layersare complete. Assembly of the inner and outer modules are underway in twoHome Teams and is scheduled for completion in 1998. The system will then beassembled with the structures in the test facility and testing will begin in 1999.
The CS model coil uses a conductor with a heavy-walled Alloy 908 jacket asrequired by the full scale CS. The use of a steel jacket in the full scale coil wouldreduce the maximum field to about 11.5 T, thus limiting the flux capability to anunacceptable level. As indicated in Section 4.2.0.3, Iron-nickel base superAlloys(including Alloy 908) may show stress accelerated grain boundary oxidation(SAGBO). An extensive program was successfully carried out to define theprocedures required to avoid SAGBO. The specified process has been successfullydemonstrated on the layers for the CS Model Coil by two Home Teams.
Conductor joint fabrication has been done in parallel with the model coil designand full scale joints continue to be tested. They have shown acceptableperformance for the CS Model Coil, nevertheless, several design changes arebeing developed for possible performance improvement and /or cost reductionfor full scale coil manufacture. This issue will require additional R&D effort toestablish the manufacturing techniques able to provide fully reliable andpredictable joint performance.
4.2.4 Gravity and vacuum vessel supports
The gravity support, which carries the all the coils and vacuum vessel, isillustrated in Figure 4.2.4-1. It consists of 20 vertical columns, one under each TFcoil between the PF6 and PF7 coils. This design allows space for PF coilreplacement under the machine, if necessary. The top of each column is boltedto an extension of the lower intercoil structure for the TF coils. The columns reston and are bolted to a stiff ring integrated in the floor of the cryostat. Theytransfer their loads through the cryostat to the circular support pedestal of thetokamak. The columns consist of metallic plates bolted together. This providesthe flexibility necessary to allow thermal movements of the coils in the radialdirection. The columns are stiff in the vertical and toroidal directions to resistdeadweight and seismic loads and to minimize tokamak movements duringearthquakes. A load-bearing heat sink at 80 K is placed on top of eachgravitational support column to reduce heat transfer from the room temperaturecryostat to the TF coils. Since the DDR, minor changes have been incorporated toaccommodate changes in weight and location of adjacent components, but thebasic concept is identical.
FDR-ITER Plant Design Description Chapter II-Section 4.2-Page 20

The vacuum vessel (VV) vertical and horizontal supports are attached to the TFcoil cases. They equilibrate the gravity load as well as the vertical and horizontalseismic and electromagnetic loads on the W .
Every pair of VV support legs straddles a TF coil and is supported by a singleassembly as illustrated in Figure 4.2.4-2. The assembly is composed of two shortradial beams, suspended by hangers from brackets on the sides of the TF coil caseabove, and braced together by a toroidal beam. The vertical support reacts the netforces on the VV, always downward, while allowing horizontal movements,including differential thermal movements between VV and TF coils. A load-bearing heat sink at 80 K under each VV leg reduces heat transfer from the warmW to the TF coils.
The W horizontal support consists of 20 pairs of adjustable toroidal tie rods thatlink the top of each equatorial W port to the TF coil cases on both sides asshown in Figure 4.2.4-3. The rods locate the W horizontally with respect to themagnets and are normally under minimal tension. These supports impose atoroidal rotation of the vacuum vessel as the TF coils flex in the out-of-planedirection during plasma pulses, but due to the toroidal flexibility of the lowersupport, they do not carry significant loads in normal operation. During off-normal events such as VDEs and earthquakes, they carry loads up to 50 MN. Athermal shield and a heat sink, both at 80 K, are placed on each rod to reduce heattransfer from the warm W to the TF coil cases.
The design of the VV supports and their interfaces with the VV has beendeveloped in more detail since the DDR.
4.2.5 Magnet testing
A reference approach has been selected for the level of testing required for theITER coil systems before commissioning.
4.2.5.1 Conductor tests
During conductor fabrication, strand samples from each lot of material will betested to assure acceptable critical properties for the base material. The conductorjacket welds will be individually leak tested before cable insertion. Theconductor will also be leak tested at several stages of the manufacturing cycle, forexample, when welds associated with terminations are done. For Nb3Snconductor, strain will be controlled within specified limits throughout the coilmanufacturing process.
FDR-ITER Plant Design Description Chapter II-Section 4.2-Page 21

4.2.5.2 Tnsulation and conduit flow properties
The coils will be subjected to quality assurance and acceptance tests at roomtemperature at various stages of manufacture. These tests, with properprototypical development, will be sufficient to establish the acceptability of theinsulation and flow rate versus pressure drop characteristics of the coils and theirflow paths. The most sensitive elements from the performance standpoint arethe joints.
4.2.5.3 Toints
For the NbTi coils, there is a significant history of success in coil fabrication andmaking joints because of the inherent flexibility of this Alloy throughout the coilmanufacturing process and no need for heat treatment. As a result, it is expectedthat sufficient information about joint performance can be developed onprototypes to allow manufacturing processes to be specified adequately so thatcold testing of the NbTi coils (PF coils and CCs) is unnecessary.
The NbsSn conductors which are used in the TF coils and CS are much moresensitive in the fabrication process because of the heat treatment required and thebrittle nature of the strand after heat treatment. This requires strain controlduring coil fabrication. As indicated earlier, the QA program will test criticalproperties on the strand and this will confirm the properties of the base material.The program will also archive conductor after jacketing, as well as before andafter heat treatment. Non-conformance, for example to the heat treatment, willbe able to be duplicated on a piece of archived conductor to assure that results areacceptable. The most sensitive element remaining is, then, the joints.
The joint R&D program will develop an acceptable joint configuration from theperformance standpoint. The manufacturing qualification program must allowfor a significant number of joints to be tested to assure repeatability ofperformance.
4.2.5.4 Cold testing coils or coil sections
The joints are considered the sensitive points in the fabrication of the coils usingNb3§n conductors. This was the main motivation to eliminate interpancakejoints in the TF coil double pancakes. During manufacture, the joints should bechecked after they are finished and when the added work to be done in thevicinity of the joints after the test is limited. An important factor in consideringthe test program is the availability of a refrigerator /liquefier of sufficient size toallow testing on a reasonable time scale.
Estimates indicate that a testing program compatible with the TF coil deliveryschedule can be achieved with a refrigerator system in the 800-2000 W range. Asexplained below, this refrigerator should have the ability to deliver helium inthe 4.5 to 15 K range. A power supply of 100 kW together with a coil dischargecircuit will be provided by ITER to the TF coil manufacturer. The first article
FDR-ITER Plant Design Description Chapter II-Section 4.2-Page 22

double pancakes (DPs) from each production line will be tested to qualify themanufacturing process. There are 5 different types of DPs in a TF coil, so firstarticle testing amounts to 5 tests per production line. In addition, each TF coilwinding pack (WP) will be tested after the joints between DPs are made and turnand DP insulation are complete. Testing at this stage determines anydiscrepancies after the critical process of making joints is completed, but beforethe full impregnation of the WP, the installation of the WP in the case and theclosure of the case.
A mechanical support structure is required to test a complete TF WP in order tolimit the longitudinal strain on the conductor to +/- 0.2%. A simple structureconcept has been developed which allows testing of the DPs and WPs to the fullcurrent of 60 kA while keeping the operating strains within the specified limits.The DC peak field in the joint region for a WP is about 2 T and is representativeof operating conditions in the machine. The most critical components infabrication can, therefore, be qualified before the full impregnation of the WP.
The maximum field for the conductor in the test of a single TF coil WP is about6 T which is substantially lower than the 12.8 T field in the machine. However,to compensate, the single WP tests can be performed at higher than ITERtemperatures (up to about 15 K) to check conductor current sharing and quenchcharacteristics. Therefore, measurements on conductor performance in themodel coil program are required to provide the data base needed to relate the testmeasurements on the single WP to the expected performance in the machine.
Cold testing for the CS was evaluated for possible testing of each of the threemodules individually or of the completed CS. It was found that the joints couldnot be tested at full current and full field in either case without the major cost ofa structure to substitute for the support provided in ITER by the TF coils. Sincethe most critical components, the joints, could not be effectively tested beforeinstallation in the machine, the reference approach is for the CS to be tested inITER during commissioning. Substantial experience in joint fabrication andperformance will be generated in the model coil program and separate testing ofsample joints made by the CS manufacturer can be carried out.
Acceptance testing for coils at the site will be limited to room temperature testingto assure coil insulation as with large scale electrical equipment. Therefore, nolarge scale magnet cold test facility is planned for the ITER site.
4.2.6 Poloidal field control
There have been significant changes and progress in the poloidal field controlsystem since the DDR. In particular:
(1) The FDR PF system includes 9 PF coils. Analysis was carried out tooptimize the location and size of the coils for the nominal 21 MA scenariotaking into account the range of plasma pressure and current profilespecified in the GDRD.
FDR-ITER Plant Design Description Chapter II-Section 4.2-Page 23

(2) The plasma equilibrium database of the nominal 21 MA scenario wascreated and the deviations of the separatrix during controlled plasmadisturbances were identified for reshaping the limiter, the first wall andthe divertor.
(3) The plasma initiation was analysed with the new FDR limiter located inthe equatorial port, using a more self-consistent model for simulation ofthe plasma equilibrium at this phase of the scenario.
(4) The analysis of capability of the FDR PF system to support the nominal 21MA scenario was provided. It includes the PF system performance in caseof:
• the response to large scale plasma disturbances at different phases of thescenario (both limiter and divertor);
• the saturation of the current in one or two PF coils during the largescale plasma disturbances.
(5) Analysis of flexibility of the FDR PF system to support other scenarios wasalso done. It includes the study of:
• heating during plasma current ramp-up in the 21 MA scenario;
• different ramp-up rates in the 21 MA scenario;
• accelerated plasma termination (150 s) in the 21 MA scenario;
• 24 MA and 17 MA scenarios with inductive current drive;
• 12 MA steady state scenario with reversed shear.
(6) The expected level of error fields was evaluated using a statistical approachfor the TF and PF coils misalignments. The FDR error field correctionsystem consists of three sets of saddle coils with six power supplies. Thesystem capability to correct the most dangerous for the plasma error fieldmodes: (1,1), (2,1) and (3,1) to the acceptable level was assessed.
(7) The effect of the ferromagnetic inserts in the vacuum vessel on the PFcontrol was analyzed. The analysis includes effects on: plasma initiation;plasma equilibrium; plasma current position and shape control; plasmaboundary magnetic reconstruction; error fields.
Control of the plasma current, position and shape is provided by varying thecurrents in all PF coils. The voltage in each coil is the sum of the pre-programmed voltage needed for a chosen plasma scenario (feedforward) and thatrequired for control (feedback). During the experiment, the waveforms offeedforward voltages will be calculated in numerical simulations of the plasmascenario, using also experimental results obtained from previous shots. Thefeedback voltages are required for stabilization of vertical displacement of
FDR-TTER Plant Design Description Chapter Il-Section 4.2-Page 24

elongated plasmas (which are vertically unstable) and for precise control of theplasma current, position and shape to:
• correct errors in the predicted waveforms of the feedforward voltages;
• control recoverable plasma disturbances (e.g., minor disruptions, ELMs,sawteeth, etc.);
• control disturbances due to other systems (e.g., PF power supplies, burncontrol system, etc.);
The control system is designed to recover the plasma shape after plasmadisturbances with lA(Jpl^0.2 and/or lAljl^O.1. Plasma disturbances with largermagnitudes ("giant" sawteeth, "giant" ELMs, H-to-L mode transition during theburn, major disruptions) are also expected, but maintenance of shape controlfollowing such events is not considered mandatory.
Plasma shape and position control requirements are considered particularlyimportant when the power input exceeds 20 MW. The requirements for quasi-static (with time scale longer than about 10 s) control of the plasma equilibriumat these phases are:
• maintain a minimum nominal clearance gap of 100 mm between thefirst wall and the magnetic flux surface that passes through a point50 mm outside the separatrix at the outside midplane;
• control of separatrix to within ± 100 mm in the divertor region andnear the baffle;
• control of the position of the separatrix relative to the outboard firstwall in the vicinity of an ICH&CD antenna to within about ± 50 mm.
A dynamic control system minimizes the recovery time for restoration ofdeviation from the quasi-static equilibrium.
Two layers are foreseen in the control system. The first control layer eliminatesdeviations of the controlled parameters (e.g., gaps and plasma current) relative totheir reference values. The second control layer chooses the reference values ofthe controlled parameters and the control algorithm for the first layer. Forexample, when current in a PF coil reaches its maximum value, the controlalgorithm of the first layer will be changed. All state parameters of the plant (e.g.,current in PF coils, total power exchanged with the grid, plasma parameters: lj,
pp, etc.), as well as the plasma equilibrium database, are used by the controlalgorithm of the second layer. This control layer also provides the interface withthe machine protection systems (e.g., coil protection system) and other controlsystems (e.g., density control) in case of off-normal events.
The feedback control of the plasma current, position and shape is based onmeasurements of poloidal magnetic field and flux around the plasma. Twoarrays of magnetic probes and flux loops are used for the measurements. The
FDR-ITER Plant Design Description Chapter II-Section 4.2-Page 25

first array is located in the blanket and divertor structures as close as possible tothe plasma. The second array is more distant from the plasma and is located onthe inner surface of the vacuum vessel. Other measurements are also used inthe reconstruction of the plasma shape: the measurement of currents in the PFcoils, in some elements of passive structure, the measurement of the plasmadiamagnetism, etc. The values of six gaps between the separatrix and the firstwall/divertor are output parameters of the diagnostic block during the divertorphases of the operating scenario.
The feedback controller provides the value of the voltage required by the CS andnine PF coils for feedback control of the plasma current, position and shape. Theinput to the controller is the deviation of the controlled parameters (e.g., plasmacurrent and six gaps) from their reference values. The control algorithms will beoptimized during ITER construction and operation.
The power supply system receives control voltage demands from the controller,as well as the value of pre-programmed voltage, and produces voltages at the PFcoil terminals. The maximum voltages available from the converters are givenfor each coil in Tables 4.2.7.6-1. The controller is being designed to minimizesteps, derivatives and peaks of the total power exchanged with the grid. Forcontrol purposes, the following values have been considered as typical limits forthe power supply:
• power steps IAPI<60MW;
• power derivatives ldP/dtl<200MW/s;
• power peaks:
- ± 250 MW at plasma current flattop;
- ±150 MW at plasma current ramp up/down.
Numerical codes used for ITER control algorithms and for the simulation ofcontrol actions are being validated against experiments. The control algorithmsand their ability to be optimised is being validated experimentally as far aspossible on existing tokamaks.
Error field correction coils are also part of the PF system. To avoid locked-modes(and associated disruptions), the amplitude of the non-axisymmetrical error fieldnormal to the q=2 surface (particularly the m=2, n=l mode, where m and n arethe poloidal and toroidal mode numbers respectively) should be limited toapproximately 105 relative to the toroidal magnetic field (5.7 T). The expectedvalue of the error field is about 1(H. Active correction coils are beingimplemented to reduce the error field to the acceptable level. To provide themode control flexibility needed to meet presently foreseen requirements, thecorrection system consists of three sets of the coils. Each set has two powersupplies. The system is able to reduce simultaneously the three most dangerouserror field modes for the plasma (2,1), (3,1) and (1,1), without increasing the mode(4,1). With the present current capacity of the coils and depending on the phase
FDR-ITER Plant Design Description Chapter II-Section 4.2-Page 26

(sources) of the error field, the correction system is able to correct error fieldsbetween 0.8xlO4 to 2x10-* to better than 1O5.
Further analysis is required in the area of error field diagnostics and controlalgorithms.
4.2.7 Coil power supply
The coil power supply system consists of the high voltage (HV) substation, ACpower distribution system and the individual subsystems supplying power to theTF, CS, PF and Correction coils. The major functions of these subsystems are toprovide controlled DC current in the coils and to protect the coils by fastdischarge in case of quench. The technology for the main components for thesesystems is available on the world market, except for the switches for which alimited R&D is in progress.
The concepts and basic design features have not changed since the DDR. The coilpower supply system had to be adapted to the evolution of the design: thenumber of coils, and therefore of PF circuits, has been increased from 7 to 9;moreover correction coils, and therefore correction coil power supplies, havebeen introduced. Progress has been made mainly in detailing the design of thecomponents and in some design optimization as, for example, for the reactivepower compensation system.
4.2.7.1 High voltage (HV) substation and AC power distribution
AC power is received from the supply grid via a HV substation and istransformed to an intermediate level (72 kV highest system voltage) via fourstep-down transformers, each rated at 300 MVA continuous power. This poweris distributed to the AC/DC conversion systems for the TF coils, CS, PF coils andCCs, and heating and current drive systems. All the loads are equally subdividedamong the four 72 kV busbars. A 150 Mvar Reactive Power Compensationsystem, including Harmonic Filters, is connected to each busbar to compensateexcessive reactive power and minimize disturbances to HV grid voltage causedby the AC/DC converters. Each system consists of one 150 Mvar thyristorcontrolled reactor and five LC filters.
The total peak pulse power demand will be limited to 650 MW active power and500 Mvar reactive power. This includes power required by the operatingscenario, the plasma shape control and the heating and current drive systems.The active power demand will be limited in derivative to 200MW/s, withmaximum step changes of 60 MW in normal operation.
An alternative design has been developed of a power supply system (PSS) fedfrom a HV grid with a more limited capability (400 MW, 300 Mvar). In thisdesign a local energy storage will supply power required to provide plasmaposition and shape control and stabilize plasma disturbances. Several optionswere considered, but the preference is for AC excited flywheel motor-generators
FDR-ITER Plant Design Description Chapter II-Section 4.2-Page 27

with controlled output voltage frequency, that allows them to be synchronizedwith the HV grid. Therefore, the common 72 kV busbars for AC powerdistribution can be used, and no changes are needed for the AC/DC conversionsystem.
4.2.7.2 TF coils power supply system
All TF coil sections are connected in series and are powered by two thyristorconverters connected in series, as is shown in Figure 4.2.7-1. The first is a lowvoltage (LV) converter (no-load voltage 200 V), the second a HV converter (no-load voltage 3000 V). Both will supply power to the TF system during currentrise. When the TF system is charged and the current has reached the requestedconstant value, the LV converter will compensate the resistive voltage drop onthe busbars and the HV converter will be bypassed to limit reactive powerconsumption from the grid. The HV converter can be activated again todischarge the energy from the coils in around 1500 s, enabling a controllableplasma termination during the decay of the toroidal field (e.g., in case of a fault inthe cryogenic system).
In case of quench, 20 fast discharge units (FDUs) interleaved in series with eachcoil are activated to rapidly discharge the stored energy. These units consist ofcircuit-breakers and discharge resistors which are rated to absorb the 103 G] ofenergy stored in the TF coil system at full current, and provide the discharge withan equivalent current time constant of 15 s.
Two circuit-breakers are included and connected in series in each of the FDUs.The first, called the current commutation unit (CCU), is designed for multipleoperation and will open when a quench is detected. In case of failure in oneCCU, the second circuit-breaker (pyrobreaker), not suitable for repetitiveoperation but very reliable, will interrupt the current. Both these DC switchesrequire R&D.
The discharge resistors and the counterpulse capacitor banks used to create a briefcurrent zero in the CCU, are located in the electrical termination building and areconnected with the switches (located near the CTBs, in the pit) by coaxial cables.
4.2.7.3 PF coils power supply systems
The loop voltage required for breakdown and plasma initiation is obtained byconnecting resistors in series with the CS, PF1, PF2, PF8 and PF9 coils, where animpressive amount of power (about 3 GW) is to be extracted. These circuits,called switching networks, use circuit-breakers, make switches and resistors.AC/DC converters, called booster converters, are used with the same aim in thePF3, PF5, PF6 and PF7 systems, where the power to be extracted is about 300 MW.Switching network units (SNUs) and the booster converters are interleaved withthe coil sections to provide uniform voltage distribution among the sections.
FDR-ITER Plant Design Description Chapter H-Section 4.2-Page 28

After the plasma initiation the power required to control the plasma current,shape and position is provided by the main AC/DC converters included in serieswith the coils. The booster converters are switched into freewheeling mode andbypassed. In all PF systems, with the exception of PF4, the main AC/DCconverter is formed by four units connected in series. These units are suppliedfrom different 72 kV busbars: in case of a fault in one busbar the system is able tooperate at reduced performance.
The FDUs for coil energy discharge are identical with those used for TF coilprotection. In addition to the circuit breakers involved in the quench protection,R&D is being carried out for the DC current commutating devices used in theswitching networks for plasma breakdown.
The Correction Coils (CCs) and their power supplies form six circuits. All sixpower supplies are identical: an AC/DC converter supplies DC power to the coil.Acting in inversion mode it also provides fast discharge of the coil energy in caseof a quench.
4.2.7.4 CS power supply system
Electromagnetic data for the CS power system are given in Table 4.2.7.4-1. Thepower supply system circuit diagram of the CS is shown in Figure 4.2.7-2. Theequivalent circuit of the load consists of 4 parallel sections, each with 14 layersconnected in series. These sections must be supplied with a total current ofapproximately 170 kA.
TABLE 4.2.7.4-1CS Power System Electromagnetic Data
Parameter
Number of Sections in ParallelRated Current per Section (kA)Total Current (maximum) (kA)
Maximum Stored Energy (GJ)
Power at Breakdown (GW)Maximum Voltage per Coil (at breakdown) (kV)
Maximum Regulated Voltage D (kV)
Fast Discharge Time Constant (s)
Value
442168
13.3
2.012.63.020
1) no-load voltage provided by AC/DC converters
Four low voltage AC/DC converters (200 V, 45 kA) are connected in series to eachCS section, to provide equal currents in the four sections during all phases of thepulse. The main AC /DC converter is formed by two sets of converter units,serially connected, each set consisting of four units in parallel.
FDR-ITER Plant Design Description Chapter II-Section 4.2-Page 29

The CCUs used in the switching network and in the fast discharge circuit, and thepyrobreakers, are rated at 170 kA. Each CCU contains four parallel branches withmechanical bypass switches and vacuum or thyristor circuit-breakers rated at60 kA. Due to the use of four bypass switches in parallel instead of three,necessary to operate with 170 kA total current, a significant current imbalancemay be accepted for both continuous and transient operation. Nevertheless,design issues remain, and R&D tasks for testing different types of switches inparallel operation are planned to demonstrate the feasibility of this approach.Moreover, the design and investigation of a 170 kA rated pyrobreaker has beeninitiated.
4.2.7.5 Coil grounding
A soft grounding via high impedance resistors is provided for all the coils. Toillustrate the common approach to the coil grounding, the grounding scheme isshown in Figure 4.2.7-1 for the TF PSS.
The TF system is grounded through a set of identical resistors connected inparallel to each coil. Their midpoint is connected to the TF neutral, which is acommon busbar connected to the ITER machine ground through one resistor(GR1). The resistance of the terminal resistors TRn will be approximately 100 Q,to maintain the voltages on the TF coil sections below an acceptable value duringthe initial phase of the fast discharge and non-simultaneous opening of thecircuit breakers, or in the event of their failure (pyrobreaker operation). Theresistance of GR1 will be about 1 k£2 to limit the fault current to ground and therelated arc energy in case of a single failure in the ground insulation of the TFsystem. The leakage current to ground will be measured and used for groundfault detection. A similar concept is used for the CS and the PF coils.
4.2.7.6 Switching networks and discharge circuits
More than 200 switching devices of different types, each rated at 60 kA, 20 kV, areused together with discharge resistors as listed in Table 4.2.7.6-1.
The key components are the CCUs for repetitive operation used in both theswitching networks and discharge circuits. A scheme consisting of a mechanicalbypass switch and a pulsed circuit breaker connected in parallel is foreseen. Acounterpulse system is used to create an artificial current zero for the circuitbreaker and to transfer the current to discharge resistors.
The development of the switches is necessary. In particular, R&D is required forthe mechanical bypass switches, vacuum circuit breakers, pyrobreakers andprotective make switches used to bypass the AC/DC converters and the switchingnetworks in case of their malfunction.
R&D to test 40 kA prototypes of the mechanical bypass switch for the SNU, thepyrobreaker and the make switch has been carried out. The results haveconfirmed the feasibility of the designs and full-scale prototypes have been
FDR-ITER Plant Design Description Chapter II-Section 4.2-Page 30

developed. Tests of the bypass switch and the vacuum circuit breaker for theFDU (nominal current 60 kA) have been completed successfully including theinvestigation of their operation in parallel.
TABLE 4.2.7.6-1Switching Networks and Discharge Circuits
Components Number of 60 kA Switches/Resistor Energy
TF cs« PF1-PF9 Total
Switching networks££!£Bypass switchThyristor circuit breakerMake switchDischarge resistor (GJ)
0000
446
29
661811
10102440
Discharge circuitsCCU:Bypass switchVacuum circuit breakerPyrobreakerDischarge resistor (GJ)
20202082
882
14
22222237
505044133
Power supply protectionMake switch 1 10 15 26
*) The CS switching networks and discharge circuits are assumed to use 60 kAswitches connected in parallel (except for the pyrobreakers).
FDR-ITER Plant Design Description Chapter II-Section 4.2-Page 31

4.2.8 Overall design assessment
The conductors and structures in the ITER magnet systems have been designedto use material efficiently without compromising the ability to achieveperformance requirements. The design criteria, material properties andperformance of selected components are being verified in an extensive R&Deffort. The focal points for this effort are the model coil projects for the CS coiland the TF coil. These will demonstrate conductor performance under theexpected operating conditions, and develop manufacturing techniques directlyapplicable to the needs of the full scale coils. Testing will occur after the end ofEDA and will provide information on operational margins.
The model coil programs also drive the development of conductor fabricationcapability and QA development. ITER-specified superconducting NbaSn strandhas been made in all Parties. Preliminary enquiries indicate that qualified ITERvendors would have the capacity to produce strand for construction within theITER construction schedule. The strand produced for Model Coils has beencombined into full size cables for insertion in full size conduits of the two typesrequired for the ITER coils. The Alloy 908 jacket material has been produced forthe model coils. Significant effort has been expended to develop the coilfabrication processes based on a wind, react, insulate and transfer technology,which provides the best properties of the NbsSn conductor and, in turn, reducedcost and size.
The design and R&D efforts have been coordinated, and will proceed in parallelto verify the crucial features of the design and manufacture of the coils.In the power supplies, the reference layer wound central solenoid requiresdevices able to interrupt 170 kA. Four 60 kA devices connected in parallel areforeseen. The design and the R&D on such components has made good progress:prototypes have been tested successfully with currents in the range 40-60 kA; theanalysis performed so far has shown that the design is conservative.
FDR-ITER Plant Design Description Chapter II-Section 4.2-Page 32

Pre-Loading
Figure A2.0.I-1
Cutaway view of magnets

N i l GR 425 97-12-08 W 0.1Electrical Termination Normal BusBuilding / . ,.
/ Cryolme/ / CryostatFeedthrough Coil Termjnal Box
/
Upper Coilerminal Level
Lower CoilTerminal Level
FIGURE 4.2.0.1-2Schematic of Typical Coil Terminal Boxes, Normal Bus and Cryolines in
the Reactor Hall and Electrical Termination Building

N 11 GR 237 97-11-21 W0.1
Thin Walled Circular JacketCab It Wrapping
Sub-Cable Wr goo ingSuper conduct ing t
Pur* Capper StrandsSpiral Tube
(o) TF Coil Conductor
Thick Walled Jockel
Cable WrappingSvb-Cable Wrapping
Superconducting £Purt Cooper Strands
(b) CS, PF1-5 * PF7+8 ond Top CC Rep I. Coil Conductors
Thick Walled JacketCircular Conduit
Coble WrappingSub-Cable Wrapping
Superconducting APure Copper Strands
Spiral Tube
(c) PF6 ond PF9 Coil Conductors
Thin Walled Jacket
Cable WrappingSuperconducting tt
Pure Copper Strands
(d) Correction Coil Conductor
Typical Conductor Configurat ions
Figure 4.2.0.3-1Conductors for the Magnet Field Coils

N 11 GR 24 97-08-28 F 1
Current Lead CoomgUneInsulation Break
ValvesManifold
Coil Terminal Box '
ryostat Feedthrough
nterface with Cryoplant
Figure 4.2.0.4-1Schematic of Coil Terminal Box Interface with the Power Supply, Cryoplant and a
Superconducting Coil

control Valve Co i , T e r m i n a | B o x N 11 GR 7 97-08-28 F 2
CS-1 CS-2 CS CS"3 C s - 4
PF1 PF4 PF2 PF3
Structures
FIGURE 4.2.0.4-2

nwfaca »ltfi Cvcatat
Figure 4.2.4-1Two of the Gravity Support Columns

20mSHIM
MATERIAL 3ISLH
20mELECTRICAL
BREAK
40mm THERMALAHCHOR (80K)
eOnrnSHIM
MATERIAL 3ISLH
TOP PLATCBOMO TO TF
WITH US4X4 FASWItR
(On 32 STAMARO)(orr 2 TO at FITTED )
UATCRIAL JI6LH
W LEG WITHTHERMAL SHIELO
22* X 025m RODSISeSmm FREE
8CN0UK ICHCTHMATERIAL IHCOtOr lit
W SUPPORT BEAMMATERIAL 3ISLH
BOTTOM PLATE
MATERIAL 31SLH
Figure 4.2.4-2Vacuum Vessel Vertical Support Assembly

Figure 4.2.4-3Vacuum Vessel Horizontal Support Attachment

ZZkV AC Distribution System.FDV- Fast Discharge Unit
FDU20
FIGURE 427-1TF Coil Power Supply System

72kV AC Distribution System
Main AC/DC Converters2x [170kA,15kV]
Low Voltage Convereters46kA,0.2kV
FDU1
FDU2
SNU-Switching Network Unit(170kA)
FDU- Fast Discharge Unit(170kA)
FIGURE 4.2.7-2CS Coil Power Supply System

INTERNATIONAL THERMONUCLEAR EXPERIMENTAL REACTOR
TECHNICAL BASISFOR THE
ITER FINAL DESIGN REPORT, COSTREVIEW AND SAFETY ANALYSIS
(FDR)
Chapter IISection 4.3
ITER PLANT DESIGN DESCRIPTION
13 July 1998

CHAPTER IISECTION 4.3
CRYOGENIC SYSTEM
TABLE OF CONTENTS
4.3 Cryogenic system 14.3.1 Cryoplant and cryodistribution system 14.3.1.1 Total cooling capacity of the LHe plant at 4.5 K 24.3.2 Heat loads 24.3.2.1 Static heat loads on the magnet system 34.3.2.2 Pulsed heat loads due to operation of the magnet system 44.3.2.3 Heat loads of magnet system SHe pumps and cold compressors 54.3.2.4 Current leads .74.3.2.5 Heat loads due to operation of cryopumps .74.3.3 Cryoplant design 84.3.3.1 LHe plant 84.3.3.2 Helium inventory storage 94.3.3.3 Cooling system of the thermal shields 94.3.4 Cryodistribution 104.3.4.2 Auxiliary cold boxes operated at 4.3 K 114.3.4.3 Auxiliary cold boxes ACB-3 and ACB-4 to cool the cryopumps 124.3.4.4 SHe pumps and cold compressors 134.3.4.5 Cryolines and manifolds 144.3.5 Liquid nitrogen system..... 154.3.6 Assessment 15

4.3 Cryogenic system
4.3.1 Cryoplant and cryodistribution system
The cryoplant and cryodistribution system must satisfy the requirements of themagnet system which includes the TF and PF coils, the CS, the magnet supportstructures and the current leads. The magnet system together with the W andcryostat thermal shields constitute the main user group of the cryoplant andcryodistribution system and this user group is characterized by large, variableheat loads with a very small temperature range.
Another significant user group includes the cryopumps of the divertor, of thecryostat and of the NB injectors. Contrary to the magnet system, these cryopumpsoperate at variable temperatures.
A third group of small users include pellet fueling, gyrotrons and diagnostics.
The liquid helium cryoplant and the cryodistribution system must, therefore,accommodate the different requirements of the user groups in terms of heat load,temperature and mass flow rate. For each user group, these requirements dependalso on the different operating conditions under the different plasma pulsescenarios.
The design of the 1TER cryogenic system is driven by two fundamental operationrequirements:
(1) the pulsed nature of the large heat loads deposited in the magnetsystem due to AC and eddy current losses and by nuclear heating.These pulsed loads have to be made compatible with the cryoplantwhich is essentially a steady state device. The cryoplant operation canbecome uncontrollable above a certain small level of heat imbalance;
(2) the large mass flow rate of supercritical helium flow which is requiredfor forced flow cooling of the magnet system and torus cryopumps.This mass flow is much larger than the mass flow rate of the cryoplantprocess itself.
As a consequence of the first requirement, the cryogenic system design mustprovide appropriate heat load smoothing to allow reliable operation.
The second requirement leads to the necessity of cold circulation pumps, withtheir additional heat load impacts on the cryoplant. An additional heat load isalso generated by cold He vapor compressors which provide cooling below 4.5 Kas required.
FDR-ITER Plant Design Description Chapter H-Section 4.3-Page 1

The ITER cryogenic system includes two types of equipment:
• Cryoplant: LHe production plant, 80 K He gas and LN2 refrigerationsubsystem;
• Cryodistribution: auxiliary cold boxes (ACBs) containing coldcirculating pumps and cold compressors, and cryolines and manifoldsto distribute supercritical or liquid helium and 80 K helium gas to thedifferent components of the ITER machine.
4.3.1.1 Total cooling capacity of the LHe plant at 4.5 K
The maximum cooling demand on the cryoplant occurs during operation at100% availability with the nominal ITER power pulses with a pulse cycle time of2200 s and burn time of 1000 s. To the refrigeration power demand, a mass flowof helium at 4.5 K is added which will return to the cycle process at roomtemperature (magnet current leads). The total heat load requirements on theLHe plant averaged over 2200 s are summarized in Table 4.3.1.1-1. The total heatload on the LHe plant is expected to be slightly lower during steady-state plasmaoperation and long pulse plasma operation.
TABLE 4.3.1.1-1Total Maximum Cooling Requirement to the LHe Plant at 4.5 K
Subtotal for the magnet system
Subtotal for all the cryopumps
Subtotal for other users (pelletfueling and ECH&CD gyrotrons)
Total
86kW + 0.19kg/s
7.3 kW +0.064 kg/s0.7 kW
94 kW +0.254 kg/s
4.3.2 Heat loads
The fundamental requirement of the cryogenic system is to remove heat loadsfrom components operating at cryogenic temperatures. The determination ofthese loads requires considerable iteration between the cryoplant performanceand the user requirements under all expected scenarios (when pulses of variablefrequency are considered).
To meet the magnet system cooling requirements, the LHe plant is operated in acombined refrigerating/liquefaction cryogenic cycle. Excluding cool-down fromroom temperature (described in DDD 3.4), different categories of heat loads on themagnet system shall be considered, in order to optimize the cryoplant design. Atthe operational temperature, they are:
i) Static refrigeration load (permanent and steady) as a result ofconduction and radiation from warm components, and load dueto permanent and steady operation of certain components (TFcoils and steady component of pump work).
FDR-ITER Plant Design Description Chapter Il-Section 4.3-Page 2

ii) Pulsed refrigeration load (variable component of the heat load)due to pulsed characteristics of the ITER operation (AC losses,eddy current losses, nuclear heating, friction losses, etc.)
iii) Variable refrigeration heat loads due to circulation pumpsand cold compressors. This heat load is variable due to controlledadjustment of pumping speed.
iv) Liquefaction loads due to current leads which require 4.5 Khelium feed and return to the cryoplant at 300 K. These loads canbe static (TF current leads) or variable (current leads in which themass flow is adjusted according to the need; cool-down ofcryopump).
The-temperature of the two phase helium produced by the LHe plant is 4.5 K. Tocool the coils and structures, excepting the PF-9 coil, the temperature in LHebaths is further reduced to 4.3 K by the use of cold compressors. The PF-9 coiloperates at 3.3 K and thus is considered separately.
4.3.2.1 Static heat loads on the magnet system
TABLE 4.3.2.1-1Static Heat Loads (kW at 4.3 K) on the Magnet System
and Cryodistribution, Excluding PF-9
Thermal Radiation [1]Thermal Conduction [2]SC bus bars & He feedersLong cryolinesTotal:
TFCoils
Conductors
CS PF&CorrCoils
2.2
2.C
3.3
Structures
TFCase
2.90.3
14.8 kW
OtherStructures
1.82.3
Total
6.92.6
2.0
3.3
[1] The thermal radiation heat load is the sum of thermal radiation through thecryostat and vacuum vessel thermal shields.
[2] The thermal conduction heat load is the sum of heat conduction through the magnetsystem and vacuum vessel supports.
Static heat load on the PF-9 and its long cryoline is 0.3 kW at 3.3 K.
FDR-ITER Plant Design Description Chapter II-Section 4.3-Page 3

4.3.2.2 Pulsed heat loads due to operation of the magnet system
TABLE 4.3.2.2-1Heat Deposition (MJ) in the Magnet System (except PF-9)
Scenario LossesTF conductorPF conductorCS conductor
Control LossesTF conductorPF conductorCS conductor
Joint LossesTF conductorPF conductorCS conductor
Eddy CurrentLosses (scenario)
TFcaseTF structuresCS structures
Eddy CurrentLosses (control)
TFcaseTF structuresCS structures
Friction LossesTFcase
CS conductorOuter cylinder
Nuclear HeatingTFcase
Tf structuresPF coils
Ramp-up(0-150 s)
1.931.654.8
0.030.030.03
0.230.150.04
8.888.48
3
0.110.05
0
0.050.30.26
000
Flat Top(150-1200 s)
0.510.250.18
0.612.790.69
1.581.220.29
1.151.170.1
5.843.790.1
0.641.91.9
7.696.450.21
Ramp-down(1200-2200 s)
2.411.871.76
0.070.1
0.11
1.510.860.27
2.071.320.5
0.20.13
0
0.310.530.53
000
Total heat deposition (MJ)
Rate of heat deposition (kW) averaged over 2200 s pulse
Total
4.853.776.74
0.712.920.83
3.322.230.6
12.110.973.6
6.153.970.1
12.732.69
7.696.450.21
84
38
Disruption
1.191.680.96
28.16.30.7
39
Heat deposition averaged over 2200 s plasma cycle for PF-9 is 0.5 kW
FDR-ITER Plant Design Description Chapter II-Section 4.3-Page 4

[1] The heat load on the correction coil conductor is included in the heat load onthe PF conductor.
[2] Scenario heat losses are illustrated in this table for three plasma scenariophases: ramp-up + flat-top + ramp-down. Ramp-up includes plasma initiation of6 s and plasma current ramp-up of 145 s. Flat-top includes plasma heating of 50 sand plasma burn of 1000 s. Ramp-down includes plasma ramp-down (1200 s to1500 s, PF coil ramp down (1500 to 1700 s), dwell time of 50 s andpre-magnetization (1750 to 2200 s).
[3] Control heat losses are calculated for the following three types of controlactions against plasma events: minor disruptions, compound ELM and ELMType 1. Three minor disruptions are assumed to occur during plasma burn. Thecompound events occur once every 50 s during flat-top. ELM Type 1 events aregenerated with 1 Hz frequency.
[4] Heat loads in the electrical joints of the poloidal field coils are pulsed heatloads and vary according to the current scenario for each PF coil. Heat loads inthe electrical joints of the TF coils are steady-state heat loads.
[5] Nuclear heat is deposited mainly in the TF cases and outer intercoil structures(OIS). The total heat load during the 1000 s burn phase is 13.4 kW. (Nuclearheating in the TF conductor, crowns, and CS structures is negligible.)
Large pulsed heat loads will also be generated in the coils and magnet structuresby plasma disruptions. The total cooling capacity of the cryoplant is determinedonly by the normal recurring operation heat loads. Therefore, an additional timeinterval will be required to restore the magnet system and LHe plant beforeresuming the normal plasma pulsing.
4.3.2.3 Heat loads of magnet system SHe pumps and cold compressors
The heat load due to work of the SHe pumps is proportional to the mass flowrate of supercritical helium (SHe) and total pressure drop in each cooling loop ofthe magnet system. Five separate cooling loops are anticipated to cool themagnet system. The fluid-hydraulic requirements on each separate cooling loopare summarized in Table 4.3.2.3-1. The cold compressors are needed to adjust thetemperature levels required by the magnet coils lower than that of the nominaloperating temperature of the LHe plant of 4.5 K.
FDR-ITER Plant Design Description Chapter II-Section 4.3-Page 5

TABLE 4.3.2.3-1Requirements on the SHe Pumps
Mass flow rate of SHe (kg/s)Pressure drop in cryolines & headers& SHe flow heat exchangers of ACBs(MPa)Pressure drop in cooling channels ofmagnet system, including feeders andtotally opened valves (MPa)Total pressure drop in cooling loop(MPa)Heat load of SHe pumps at nominalmass flow rate (kW)
TFCoils
3.1
0.02
0.155
0.175
5.7
CS
1.6
0.02
0.255
0.275
4.7
PFandCorrection
Coils
6.40.02
0.08
0.1
6.8
PF-9at3K
0.36
0.02
0.08
0.1
0.4
TF Cases& OtherStructures
7
0.015
0.025
0.04
3.0
Total heat load of SHe pumps is 20.6 kW.
TABLE 4.3.2.3-2Requirements on the Cold Compressors to Cool the Magnets
Operating temperature (K)He vapor mass flow rate at cold compressorinlet (kg/s)Heat load due to work of cold compressor atnominal mass flow rate (kW)
Auxiliary ColdBoxes of Coils &
Structures
4.34.2
10.8
AuxiliaryCold Box of PF-9
Coil
3.0
0.04
1.0
FDR-ITER Plant Design Description Chapter II-Section 4.3-Page 6

4.3.2.4 Current leads
The liquefaction capacity of the LHe plant to cool the 53 pairs of current leads ofthe magnet system is 0.19 kg/s.
TABLE 4.3.2.4-1Required Liquefaction Capacity for the Current Leads
TF coils (kg/s)
PF, corr. coils & CS (kg/s)Total (kg/s)
At Zero Current
0.08640.0O7
0.0934
TF Coils at FullCurrent & Other
Coils at ZeroCurrent
0.1440.026
0.17
Operation [1] at2200 s
PlasmaRepetition Rate
0.1440.046
0.19
[1] The current and heat loads on the current leads of the PF and correction coils and CSvary with the current scenario for each coil. The SHe mass flow rates averaged overthe 2200 s plasma repetition time are given in the Table.
4.3.2.5 Heat loads due to operation of crvopumps
A design option of the torus cryopumps, in which the liquefaction for fastcool-down is minimized is under study. The following table specifies therequirements prior to this design improvement. Expected heat loadrequirements associated with operation of the NB cryopumps are as follows:0.3 kW plus 0.004 kg/s.
TABLE 4.3.2.5-1Heat Loads at 4.5 K Related to Cryopumps (Normal Operation)
Torus pumping(12 cryopumps operate in parallel)SHe supply for rapidcool-down of 1 cryopumpOperation of SHe circulating pump [1]
Operation of cold compressorTotal
Refrigeration3.8 kW
Liquefaction0.05 kg/sRefrigeration 2.7 kW0.5 kW7kW +0.06 kg/s
[1] The heat load associated with operation of the SHe pumps is evaluatedfor the total mass flow rate of 4.8 kg/s and total pressure drop in this coolingloop of 0.055 MPa.
FDR-ITER Plant Design Description Chapter II-Section 4.3-Page 7

4.3.3 Cryoplant design
The reference cryoplant consists of a LHe plant operated in a combinedrefrigeration/liquefaction mode, an 80 K He gas cooling loop and a LN2refrigeration subsystem, including:
• Eight LHe refrigeration/liquefaction modules of 11.75 kW + 0.034 kg/scapacity each (6 modules are installed initially);
• Two 80 K He gas cold boxes (5 kg/ s of the mass flow);
• Helium and nitrogen gas-compression stations and He purificationunit;
• Warm and 80 K medium pressure tanks for storing the gaseoushelium;
• LN2 re-liquefaction/refrigeration subsystem (500 kW of cryogenicpower at 80 K).
4.3.3.1 LHe plant
Eight LHe plant modules of 11.75 kW plus 0.034 kg/s each operate in parallel (fullcryoplant) to satisfy the nominal ITER plasma pulses with the maximum dutycycle (the maximum cooling demand as illustrated in Table 4.3.1.2-1). The initialinstalled cryoplant with six LHe plant modules is sufficient to satisfy the plasmarequirements during the plasma operational plan for several years until longburn operation is established.
The module size of 11.75 kW plus 0.034 kg/s is proposed in order to be similar tothe already designed (presently under procurement) refrigerators of CERN tosupply the superconducting ring of the Large Hadron Collider. The refrigerationvs liquefaction load curve of the refrigerator allows operation at the requestedmodule capacity of 11.75 kW plus 0.034 kg/s for the full LHe plant, and also meetsthe heat load requirements specified for initially installed cryoplant.
In these helium refrigerators, the reference design is based on using the coldhelium turbines to precool helium flow from 300 K down to 80 K. Each of theprocess boxes includes six turbines, using three pressure levels (1.9/0.4/0.1 MPa),with four turbines (expanders) connected from high to medium pressure forprecooling He flow from 300 K to 25/20 K, and two turbines connected in seriesfor the final He flow cooling to 4.5 K with pressure reduction in these turbinesfrom 1.8 to 0.35 MPa.
A modified design version can also be considered, where the auxiliary LN2system (removing the thermal shields heat loads) is increased in size to precoolthe He flow in the LHe plant from 300 K to 80 K. Although this option is notretained as the reference design; the possibility of using LN2 as a booster for theHe refrigerator plant during special operations (for example the cooling down of
FDR-ITER Plant Design Description Chapter II-Section 4.3-Page 8

the whole magnet from room temperature) offers some flexibility specially withthe initial installation of the LHe plant. This option is therefore being consideredin a future study.
One example of this modified version of the cryoplant is the JA HT proposal ofthe LHe plant in which LN2 is used for precooling of He flow from 300 K to 80 K.LN2 is also used for precooling He flow circulated in the cooling loop of thethermal shields of the ITER machine. With this arrangement, LN2 cooling of thethermal shields can be easily boostered during baking of the vacuum vessel. TheJA HT proposal is to use five modules for the full LHe cryoplant, whereas threemodules would be installed initially. The capacity per module in the JA HTproposal is considerably larger than any existing operational plant module.
4.3.3.2 Helium inventory storage
The ITER cryoplant will be kept cold, at least in stand-by condition, for extendedperiods of time. Full warm up to 300 K will only occur under exceptionalcircumstances. Therefore the following strategy is favored, making use of dualinventory storage, warm (300 K) and cold (< 80 K).
Warm storage at 300 K is provided for the helium inventory of about 12 tonnes/
excluding the magnet system inventory and the main He dewar inventory. Incase of full warm up of the magnets to 300 K, the inventory of 27 tonnes ofhelium will have to be removed and reliquefied. To avoid increase of dewarstorage capacity over and above the 50 m3, the LHe will be sold on the market.In case of a general magnet quench, and/or a fast discharge, the He magnetinventory will be expelled at 40-60 K into an 80 K storage container. This willonly be a temporary storage as it cannot maintain a temperature of 80 K for anindefinite time.
4.3.3.3 Cooling system of the thermal shields
80 K compressed helium gas flow (about = 5 Kg/s) will be used for cooling thevacuum vessel, cryostat and cryopump thermal shields, and all shields aroundthe cryodistribution system. The heat load requirements on the 80 K heliumsubsystem are summarized in Table 4.3.3.3-1.
FDR-ITER Plant Design Description Chapter II-Section 4.3-Page 9

TABLE 4.3.3.3-1Heat Loads from Thermal Shields on the 80 K He Gas Subsystem
Vacuum vessel thermal shieldCryostat thermal shieldTransition thermal shieldsGravity supports and anchorsThermal shielding of cryodistributionThermal housing of cryopumpsTotal
StandbyOperation
(kW)5080503030120360
NormalOperation
(kW)150
80903030120
500
Two stand-alone helium gas 80 K cold boxes are incorporated in the cryoplant.These 80 K He gas boxes contain a counterflow He heat exchanger (seeFigure 4.3.3-1), and LN2 is used to precool the He flow to 80 K. The temperaturedifference between supply and return He flows in the thermal shields is about20 K during normal operation, the pressure drop is 0.1 MPa, and the inletpressure 1.8 MPa. In the case of baking of the vacuum vessel, the heat loads to itsthermal shield will increase. This extra power loads occurs at times when themagnets and cryopumps require only standby cooling. Again, coupling the LN2and He refrigerators would provides the required flexibility. This option willtherefore be pursued in a future design update.
4.3.4 Cryodistribution
Through auxiliary cold boxes and then equipment (circulating pump and coldcompressors), the cryodistribution system provides the large helium mass flowrate required for forced flow cooling of some ITER components, and an operatingtemperature lower than the nominal LHe plant temperature of 4.5 K as requiredfor some components.
The cryodistribution system is essential for averaging rapidly variable heat loads,thus allowing the coupling of these loads to a steady state cooling powerrefrigerator.
The auxiliary cold boxes are located in the electrical termination building. Theyare connected with the individual user cooling loops through a system of longcryogenic lines and manifolds. The magnet system is supplied with cryogens byway of coil termination boxes (CTBs) which contain current leads,superconducting bus bars and cold valves. The CTBs of the magnet system arelocated close to the ITER machine, just outside the bioshield at two levels. The16 cold valve boxes of the torus cryopumps are located around the ITER machineat the divertor level.
FDR-ITER Plant Design Description Chapter II-Section 4.3-Page 10
4.3.4.1 Component diagram of the cryodistribution system
The component diagram of the cryodistribution system (together with thecryoplant) is shown in Figure 4.3.3-1. The cryodistribution system includesseveral auxiliary cold boxes (ACBs).
Five auxiliary cold boxes (ACB-1 and ACB-2a to ACB-2-d) are used to supply allthe coils and structures except coil PF-9. The operating temperature in the LHebath of these boxes is 4.3 K. A separate box (ACB-2e) is used to cool the PF.-9 coiland is operated at 3 K.
Two other auxiliary boxes are to remove heat and provide fast cool-down afterregeneration of the cryopumps of the torus primary pumping system (ACB-4)and cryopumps of neutral beam injector beamlines (ACB-3).
4.3.4.2 Auxiliary cold boxes operated at 4.3 K
The ACB-1 includes four cold compressors operated in parallel which allow areduction of pressure in the LHe bathes of the ACB-2s of the magnet systemfrom 0.13 MPa to 0.11 MPa. This pressure reduction results in an operatingtemperature decrease from 4.5 K to 4.3 K. The ACB-1 also incorporates a LHebath operated at 4.5 K and a SHe flow heat exchanger which is immersed in thisbath. Due to this heat exchanger, the He flow coming from the LHe plant at 5-6 Kis cooled down to 4.6 K before going to the current leads and other ACBs asillustrated in Figure 4.3.3-1.
Each of the four ACB-2s of the magnet system (ACB-2a for cooling the CS, ACB-2b for cooling the 20 TF coils, the ACB-2c for cooling TF cases and other structuresand ACB-2d for cooling the PF and correction coils) includes two SHe circulatingpumps (see section 4.3.4.6) and SHe flow heat exchangers immersed in the LHebath (it should be noted that Figure 4.3.3-1 shows only one pump per loop forclarity of the schematic). All these ACB-2s, excepting ACB-2e of the PF-9 areoperated at 4.3 K. Note that the ACB-2d is designed in a way to allow theinstallation of additional cold compressors for operation of the PF coils at 3.5 K ina back up operation mode.
The specified He mass flow rates, pressure drop for each the coil groups and heatloads associated with operation of these pumps are summarized inTable 4.3.2.4-1.
The cooling loops of the magnet system components which have similarhydraulic characteristics are grouped together.
The boiling temperature of helium in the bathes is kept at 4.3 K so that thetemperatures at the inlet of the coils and structures is lower than the specifiedmaximum inlet temperature of 4.6-4.7 K for coils and 4.8-5 K for structures.
In order to mitigate the peak heat load on the LHe bath, bypass valves areincorporated in each separate cooling loop in order to allow returning the SHeflows back to the coils or structures without passing through the heat exchanger
FDR-ITER Plant Design Description Chapter II-Section 4.3-Page 11

when necessary. Priority in the control procedure based on periodic opening andclosing of the bypass valves is given to the coil cooling loops to maintain the coilinlet temperature below the maximum allowed value.
Several automatically controlled valves (regulators) are included in the ACBs ofthe magnet system to keep the heat load on the LHe plant constant in spite of thepulsed heat load generated in the magnet system (see Figure 4.3.4.2-1 showing asimplified control schematic where all the SHe flow heat exchangers of thedifferent cooling loops are shown to be immersed in one common LHe bath).The main functions of these regulators are: i) to keep a constant level of LHe inthis LHe bath, ii) to adjust the revolution rate and mass flow capacity of the coldcompressor, iii) to keep constant the pressure on the cold compressor inlet inorder to maintain a constant return mass flow rate. The last regulator isinterconnected with an electrical heater to keep the heat load on the LHe bathconstant when the heat load on the LHe bath due to the magnet system suddenlybecomes lower than the heat load specified for this plasma pulsing period.
Thus, the LHe bath together with controlled bypass valves provides anintegration function of pulsed loads towards a slowly adjustable cooling power,through the mass flow capacity of the cold compressor. When this cooling poweris larger than the cryoplant nominal capacity, the liquid in the storage dewar canbe used temporarily; when it is smaller, the cryoplant will liquefy He increasingthe dewar level.
When the LHe dewar is full with liquid helium, the operating pressure of thewarm compressors can be reduced to keep level in the LHe dewar constant. TheLHe plant has been designed to operate along its working characteristic:liquefaction vs refrigeration. Details of the operation of the cryoplant along itsworking characteristic are described in DDD 3.4.
In the coil termination boxes, horizontally oriented current leads forced-flowcooled are installed for the magnet system. The SHe flow at 4.6 K and 0.4 MPafrom the LHe plant will be used to supply the current leads.
The helium supply of the forced-flow cooling current leads will be interrupted ifthe compressors of the cryoplant are suddenly stopped. To continue the coolingof the current leads during slow (30-minutes) power discharge, an additional coldSHe (3-4 m3) vessel at 0.4 MPa is incorporated in the cryoplant and an electricalheater is used to maintain the pressure of 0.4 MPa in the cold SHe vessel in orderto supply the current leads with SHe at constant mass flow rate.
4.3.4.3 Auxiliary cold boxes ACB-3 and ACB-4 to cool the cryopumps
These two cold boxes provide cooling for the NB and torus cryopumps, whichrequire different levels of temperature, and the capacity to be rapidly heated andrecooled when they are regenerated. The cryogenic design of these two cold boxesfollows the generic concept described for the ACBs to cool the magnet system,with some variations, detailed in the relevant DDD.
FDR-ITER Plant Design Description Chapter II-Section 4.3-Page 12

4.3.4.4 SHe pumps and cold compressors
Each separate cooling loop of the magnet system contains as a minimum twoidentical SHe circulating pumps. The only exception is the TF coil cooling loopwhich contains 3 SHe pumps. The pumps are connected in parallel and eitherpump (or two out of three) can provide full flow under nominal conditions.However, each pump is designed to operate at maximum efficiency for half ofthe total mass flow rate. This design allows to stop one of the parallel pumpswhen operating in standby mode and to still retain full nominal flow, also in thenormal operation mode, when one pump fails, thereby providing fullredundancy.
The SHe pumps with variable motor speed are incorporated in thecryodistribution. Two designs of large capacity pumps, as well as one design ofsmaller capacity pump, are used. The design points for the first and second classof the large pumps are 1.6 kg/s and 0.3 MPa (head), and 6 kg/s and 0.1 MPa (head),respectively (see Table 4.3.4.4-1). Two smaller capacity pumps of 0.8 kg/s are usedto cool PF-9. The parameters of the smaller capacity pump have not been fullydefined yet.
Since the motor speed is variable, the pumps can be adjusted in accordance withthe particular cooling requirements of any of the components of the magnetsystem or to minimize the pump heat load when the plasma experiments allowreduced pump parameters.
TABLE 4.3.4.4-1Main Parameters of the Large Capacity SHe Pumps
Inlet pressure (MPa)Inlet temperature (K)Pressure rise (head) (MPa)
SHe mass flow rate (kg/s)
Impeller diameter (mm)Type of bearing
Design efficiency (%)
Overall diameter of flangeto attach to ACBs (m)
Overall length (warm motor pluscold pump (m)
Class 1.6 kg/s
0.4-0.64.6
0.31.6941.5
Dynamic gas80
0.4
0.46
Class 6 kg/s
0.4-0.64.6
0.16.14
94.6Magnetic
80
0.6
0.64
The ITER cryodistribution system requires 5 SHe pumps of the 1.6 kg/s class, andfive pumps of the 6 kg/s class, to cool the magnet system and torus cryopumps, aswell as two pumps of the 0.8 kg/s class to cool the PF-9 coil.
The ITER cryodistribution system comprises seven cold compressors. Four largecold compressors with variable speed and nominal capacity of 1.5 kg/s each havebeen included to operate at 4.3 K. Furthermore, three cold compressors with
FDR-ITER Plant Design Description Chapter H-Section 4.3-Page 13
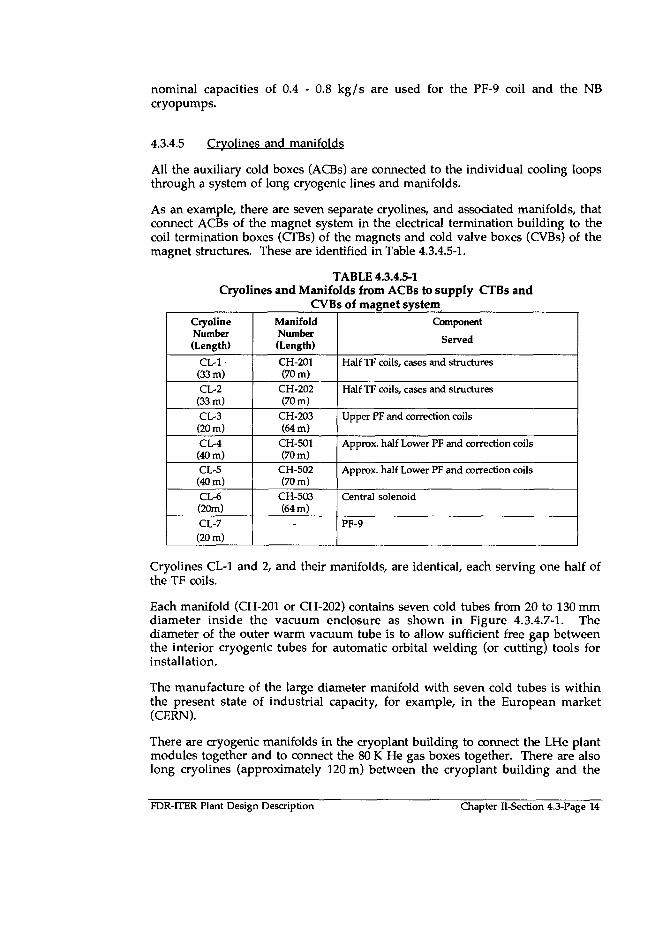
nominal capacities of 0.4 - 0.8 kg/s are used for the PF-9 coil and the NBcryopumps.
4.3.4.5 Cryolines and manifolds
All the auxiliary cold boxes (ACBs) are connected to the individual cooling loopsthrough a system of long cryogenic lines and manifolds.
As an example, there are seven separate cryolines, and associated manifolds, thatconnect ACBs of the magnet system in the electrical termination building to thecoil termination boxes (CTBs) of the magnets and cold valve boxes (CVBs) of themagnet structures. These are identified in Table 4.3.4.5-1.
TABLE 4.3.4.5-1Cryolines and Manifolds from ACBs to supply CTBs and
CVBs of magnet systemCryolineNumber(Length)
CL-1(33 m)CL-2(33 m)CL-3(20 m)CL-4(40 m)CL-5(40 m)CL-6(20m)
CL-7(20 m)
ManifoldNumber(Length)
CH-201(70 m)
CH-202(70 m)
CH-203(64 m)
CH-501(70 m)
CH-502(70 m)
CH-503(64 m)
-
Component
Served
Half TF coils, cases and structures
Half TF coils, cases and structures
Upper PF and correction coils
Approx. half Lower PF and correction coils
Approx. half Lower PF and correction coils
Central solenoid
PF-9
Cryolines CL-1 and 2, and their manifolds, are identical, each serving one half ofthe TF coils.
Each manifold (CH-201 or CH-202) contains seven cold tubes from 20 to 130 mmdiameter inside the vacuum enclosure as shown in Figure 4.3.4.7-1. Thediameter of the outer warm vacuum tube is to allow sufficient free gap betweenthe interior cryogenic tubes for automatic orbital welding (or cutting) tools forinstallation.
The manufacture of the large diameter manifold with seven cold tubes is withinthe present state of industrial capacity, for example, in the European market(CERN).
There are cryogenic manifolds in the cryoplant building to connect the LHe plantmodules together and to connect the 80 K He gas boxes together. There are alsolong cryolines (approximately 120 m) between the cryoplant building and the
FDR-ITER Plant Design Description Chapter II-Section 4.3-Page 14
electrical termination building, and a 70 m long manifold to distribute thehelium to the ACBs.
LN2 cryolines are also incorporated in the cryodistribution system to supply the80 K He gas boxes and LHe plant modules for their normal operation.
The total length of all the cryolines is about 1.7 km. The total heat input on theliquid helium lines and headers is estimated to be 3.3 kW. The heat input to thethermal shields of the cryolines and ACBs is 25 kW at 80 K.
4.3.5 Liquid nitrogen system
The LN2 subsystem provides precooling of the 80 K He gas flow used to cool thecryostat and vacuum vessel thermal shields and cryopump thermal shields,supplies external He purification units and its coupling with the He refrigerators,provides additional cooling for machine cool-down and vacuum vessel baking.
The required cooling capacity to cool all thermal shields at normal operation is55 kW.
The main nitrogen refrigerator is based on a cooling cycle which is used forcommon air separation plant. Additional LN2to boost the cooling capacity at80 K by 200-300 kW may be used for both initial cooldown and baking as well asfor redundancy purposes should the nitrogen refrigerator not be available due toservice or repair.
4.3.6 Assessment
The cryoplant design has made substantial progress since the DDR along with theuser heat loads and cooling requirements being better defined. The design statuscorresponds to a good conceptual one. There appear to be no major principleproblems and detailed design work can be effectively launched.
For the magnet system, attention has focused on smoothing the large pulsed heatloads deposited within the magnet system at normal operation and plasmadisruption. More detailed supporting numerical thermal-flow analysis is neededto demonstrate pressure and temperature variations and peaks in the coolingchannels of the coils and structures and at the inlet of the SHe pumps.
Additional interface information related to the pulsed heat loads is necessary torefine design requirements for the auxiliary cold box of the PF-9 coil which iscooled separately from the other coils and for the small cryogenic users includingthe pellet injectors and gyrotrons.
An upgraded design of the cryopumps, which would avoid the large liquefactioncapacity of the cryoplant required for fast cool-down is being detailed.
The following aspects of the cryoplant and cryodistribution design requireadditional study:
FDR-ITER Plant Design Description Chapter H-Section 4.3-Page 15

(1) Stability and controllability of several LHe plant modules whichoperate in a parallel He flow configuration, including several auxiliarycold boxes with different cooling requirements.
(2) Analysis and experimental study to investigate the effective operationof the SHe circulating pumps and heat exchangers, SHe mass flow rateand temperature large variations which occur in the SHe forced flowdue to large pulsed heat loads as well as the controllability of thecryoplant by using the upgraded control algorithm which is based onperiodic opening/closing the bypass valves of the coil cooling loops.
In conclusion, the specifications for the cryoplant have been correctly defined andthe design of the system can be optimized to provide the required flexibility inaccordance to all expected plasma pulse operational scenarios, and at the sametime to size the cryoplant power capacity to an appropriate minimum level.
FDR-ITER Plant Design Description Chapter II-Section 4.3-Page 16

80 K He gas loop to cool thermal shields of magnet system and other ITER components
Figure 4.3.3-1 Principal schematic of ITER cryoplant and cryodistribution (option,which Is based on using He turbines Instead of LN2 supply to precool He gas down to SO K In LHe plant)

T 6 UiLi. _;..;_ _ J ; _
Regulators (N5)to keep mass (lowrates minimum
Modules ofLHe plant
Regulator (N2) ofmotor revolutionrate to adjustmass flow rate ofcold compressor
Regulator (N4)to keep pressureat cold compressor
Regulator(N1)to keeplevel InLHe bathconstant
Regulator(NS)to protect LHebath agahstvery lowpressure
Powerregulator(N3) to keeptemperature(pressure)n LHe bathconstant
Electr icalheater withvariablepower
Expectedheat loadsfor nextplasmapulsing
Levelin LHeDewar(L2)
Figure 4.3.4.2-1Auxiliary cold box (ACB-1) to cool the structures and colls

W/////////////////////^^^^
300 outer vacuum tube(bore 0 604)
Manifold to supply SHe flow(4.5 K) to Current Leads
(bore e20)
80 K thermal shield(bore0 495.4)
2 manifolds to supply &return SHe (4.5K) from TF coils
(bore 08O)
outer vacuum tube ofvertical connector to CTB
(bore 0 396.4)
(bore 0 26.5)
2 Manifolds to supply &Return SHe (4.5K) from
TF cases & structures (bore a 130)
~ ~ ^ ^ Sleeve
80 KTheramal Shield ofvertical connector to CTB
(Bore 0 314.9)
Multi-Layer Insulation(15 mm thick)
(bore 012.6)
Section B-B
Figure 4.3.4.7-1Cross section of manifold for TF coils, their cases fr structures

INTERNATIONAL THERMONUCLEAR EXPERIMENTAL REACTOR
«
V
TECHNICAL BASISFOR THE
ITER FINAL DESIGN REPORT, COSTREVIEW AND SAFETY ANALYSIS
(FDR)
Chapter IISection 4.4
ITER PLANT DESIGN DESCRIPTION
13 July 1998

CHAPTER IISECTION 4.4FUEL CYCLE
TABLE OF CONTENTS
4.4 Fuel cycle 14.4.1 Fuel cycle - changes since the DDR 14.4.2 Fuelling 14.4.2.1 Introduction 14.4.2.2 Gas fuelling 14.4.2.3 Pellet injection fuelling 34.4.2.4 Wall conditioning 54.4.3 Vacuum pumping systems 74.4.3.1 Introduction 74.4.3.2 Roughing system 84.4.3.3 Torus vacuum pumping system 94.4.3.4 Cryostat pumping system 104.4.3.5 Heating and current drive vacuum pumping systems 104.4.3.6 Guard and service vacuum pumping 124.4.3.7 Diagnostic pumping systems 144.4.3.8 Leak detection systems 144.4.4 Tritium plant 184.4.4.1 Summary description 184.4.4.2 Front-end permeator 184.4.4.3 Impurity detritiation 194.4.4.4 Glow discharge cleaning exhaust processing , 204.4.4.5 H, D, T isotope separation system (ISS) 204.4.4.6 Water detritiation system (WDS) 214.4.4.7 Atmosphere detritiation systems (ADSs) 234.4.4.8 Fuel storage and distribution 254.4.5 Tritium accountability 264.4.6 Fuel cycle dynamic modelling code 264.4.7 Assessment 27

4.4 Fuel cycle
4.4.1 Fuel cycle - changes since the DDR
A basic flowsheet of the overall fuel cycle is shown in Figure 4.4.1-1. The designwas frozen before the DDR, and only minor changes have occurred since. Theyare:
• the implementation of a fast impurity gas injection system for rapidand precise control of impurity injection, which provides a responserate of 100 ms at an injection flow rate of 1 Pa m3/s;
• the replacement as reference of multiple piston extruders of the steadystate pellet injection system by a single screw extruder, which providesa continuous pellet feed system as opposed to the batch feed system ofthe piston extruders;
• the combination of the roughing pumps of all major vacuum systemsinto a single integrated system providing greater flexibility andoperational redundancy;
• a reduction of the throughput of the Water Detritiation System from120 down to 40 kg/hour due to a reduction of the expected tritiumpermeation into HTS water;
• a revised scheme for Air Detritiation Systems and the decision to deferthe installation of such systems for the TCWS vaults and the hot cell;
• the design of the system for the extraction of tritium from the ITERbreeder module.
4.4.2 Fuelling
4.4.2.1 Introduction
The fuelling system comprises a gas fuelling system (including a fusion powershutdown system), a steady state pellet injection system, a killer pellet injectorsystem for disruption mitigation, and a wall conditioning system. All the gasesinjected through the various fuelling systems into the torus will be supplied bythe tritium plant. An overall sketch is shown in Figure 4.4.2.1-1.
4.4.2.2 Gas fuelling
Functionally, the gas fuelling system comprises two independent sub-systems,the first being the gas injection system (GIS) to supply gases for normal operation(to the vacuum vessel, pellet injection system and to the Neutral Beam (NB)injectors and the Diagnostic Neutral Beam (DNB) injector), and the second beingthe fusion power shutdown system.
FDR-ITER Plant Design Description Chapter H-Section 4.4-Page 1

During plasma operations the GIS will be required to provide initial gas fillingprior to plasma initiation, gas supply during plasma density ramp-up, steady-state DT burn, controlled fusion power and density ramp-down, gas to supportinduced flow in the scrape-off layer (impurity sweeping), and to provide divertorheat flux control by radiative cooling (seed impurities).
To provide flexibility for physics operation (e.g., between minimum neutraldensity in the main chamber and strong plasma flows in the scrape-off layer(SOL)), gas injection will be provided at two poloidal elevations, the top of theplasma chamber (upper port injection system) and in the divertor chamber(divertor injection system). To minimise first wall erosion by charge exchange(CX) sputtering, the gas injected will be distributed toroidally to five discretelocations at each of the two elevations. To promote poloidal distribution of theinjected gas (~ 1 to 2 m from each pipe), reducing CX sputtering erosion, theinjection pipes at the top of the machine will end at the front of the back plateinside the 2 cm gap between blanket modules (i.e., ~ 50 cm from the plasma) andin the private (i.e., not connected to the main plasma chamber) flux region underthe dome into the divertor channels.
The GIS will consist of ten gas valve boxes, one per injection location as shownin Figure 4.4.2.1-1. The system will allow the injection of up to six gasessimultaneously, but typically will be used for three hydrogenic species and threeimpurity gases (e.g., D, T, DT, Ar, Ne, and He). If wall conditioning with reactivegases is adopted (still under consideration) one of the impurity lines will be usedfor the delivery of this gas.
The total tritium inventory of the gas injection system, at a pressure of 0.1 MPawith a 50/50 DT mixture supplied by a 16.5 mm line and T2 by a 7 mm line, willbe ~ 10 g.
All gas supplies are provided by a common distribution ring manifold, which isrouted along the biological shield in the upper TCWS vault and subsequentlyrouted to the tritium plant. The fuelling lines are sized to provide 500Pam3 /sthroughput for D and DT gas and 100Pam3/s for all other gases at a deliverypressure of 0.1 MPa. The one T line and three impurity lines provided are 7 mmdiameter and the other two lines are 16.5 mm. A 50 mm line is provided forpumping/flushing of the fuelling lines. The primary gas delivery lines and thesecondary containment line and valve boxes can withstand 0.5 MPa.
The upper port gas injection system consists of five valve boxes spread evenlyaround the biological shield inside the upper TCWS vault. The valve box,nominally 0.51 m diameter x 0.66 m high, will be shielded against the magneticfield of ~ 0.1 T present in the upper TCWS vault. The valve arrangement insideeach valve box (see above) allows independent injection of six fuelling gaseswhile using a common 10 mm discharge manifold connected to the plasmachamber. This common manifold is, in addition, connected through a valve tothe pumping flushing line and thus allows each gas injection line to be pumpedand flushed prior to changeover to a different gas. It also permits puffing tests foreach gas species during commissioning, without using the plasma chamber
FDR-ITER Plant Design Description Chapter II-Section 4.4-Page 2

(isolation valve to torus closed, isolation valve to pumping line open). Two0.5 MPa isolation valves can isolate the fuelling system from the torus in case ofa pressure excursion, or allow shutdown of the fusion power within ~ 10 s (slowfusion power shutdown). Two puffing valves bypass the flow controllers of twoof the impurity injection lines. This allows an even faster fusion powershutdown (~ 3 s) induced by strong impurity gas puffing (~ 500 Pa m3/s).
The gas discharge manifold is routed from the valve box through the guard pipetogether with the upper blanket cooling pipes to the upper port. The length ofthe discharge line from the valve box to the blanket back plate is ~ 25 mproviding a response time of ~ 500 ms.
With the exception of the fast fusion power shutdown feature and the routing ofthe delivery and injection lines from valve boxes are at the divertor pit level, thedivertor gas injection system is identical to that of the main chamber gasinjection system.
An additional system is under consideration to provide precise control ofinjected impurities to limit divertor heat loads to acceptable levels by controllingplasma radiation. The system provides an injection rate of impurities of 1 - 3 Pam 3 / s with a response time of 100 ms and supplements the main gas injectionsystem which is unable to achieve the required response rate needed for precisecontrol.
4.4.2.3 Pellet injection fuelling
4.4.2.3.1 System
The pellet fuelling system will consist of a steady-state pellet injector capable ofinjecting hydrogenic species for fuelling as well as impurity pellets for physicsexperiments. In addition, a stand-alone, "killer pellet" system will be providedfor rapid discharge termination as a part of the disruption mitigation system.
4.4.2.3.2 Steady state pellet injection
The pellet injection system will provide a fuelling rate of 50Pam 3 / s with pure90/10 T2/D2 pellets and 100 Pa m3/s for other hydrogenic species in the form ofpellets in the range of 3-10 mm diameter, thereby limiting density excursions andresulting fusion power excursions to < 10%. Required repetition rates varybetween 1 Hz for 10 mm pellets and 4 Hz for 3 mm pellets, for a duration of upto 10000 s. Speeds of up to 0.5 km / s are considered necessary to permit pelletpenetration beyond the ELM-affected zone (~ 15% of minor radius) from thehigh field side.
The steady state pellet injection system will consist of:
• two centrifuge pellet injector drivers;
FDR-ITER Plant Design Description Chapter II-Section 4.4-Page 3

• one screw extruder per injector;
• a feed manifold for the gas supply (six gas lines and a pumping/flushing line);
• a continuous regenerating cryopump for each injector;
• a pellet injector cask housing the two injector assemblies (6 m L x4mHx3mW);
• a single flight tube connected through a divertor port to the plasmachamber;
• a diagnostic, control and data acquisition system for each injector.
The pellet injector cask is similar to the remote handling casks, and will bemounted on air cushions to allow transportation to and from the hot cell formaintenance. The cask will provide secondary containment for all theequipment located inside and be rated at 0.2 MPa.
Gas supply, cryogenic, service vacuum, and electrical connections will be locatedto allow connection to the rear of the cask and will be designed for hands-oninstallation.
The pellet injector cask will be installed at a cryopump port (divertor level). Theshared 5 cm diameter flight tube exits into the plasma chamber in the gapbetween two blanket modules on the high field side, after following the contourof the vacuum vessel below the divertor cassette rails. Outside the cryostat theflight tube is doubly-contained, ending in a 0.5 MPa rated valve box whichhouses two 0.5 MPa rated isolation valves.
Each of the injectors has a screw extruder for continuous pellet production. Theextruder will also be used for pumping the exhaust of the continuouslyregenerating cryopumps during operation. This approach reduces the coolingand gas delivery requirements of the pellet injection system by recovering the20-30% loss occurring during formation and acceleration of the pellet. The twocontinuously regenerating cryopumps, are mounted onto the injector and keepthe injectors and the flight tubes under high vacuum. The guard vacuum of theinjector is pumped by the guard vacuum system of the vacuum pumping system.
Only one of the two injectors is active during plasma operations; the secondinjector being on standby and available for immediate operation, if required.This standby injector will also be available for physics programs where impuritypellet injection is required (e.g., Ne, Ar, etc.) by adjusting the extrudertemperature.
FDR-ITER Plant Design Description Chapter H-Section 4.4-Page 4

4.4.2.3.3 Killer pellet injection system
A number of options are currently being considered for the killer pelletdisruption mitigation system which include solid impurity pellets, deuterium icepellets and deuterium liquid jets.
A simple mechanical pellet injection system will be installed on an equatorialport. The injector will be controlled by the disruption mitigation system. Therequirement to provide a reliable and quick impurity pellet(s)-based dischargetermination, leads to the choice of solid state pellets and a simple injectionsystem (e.g., a pneumatic gun with a 60 shot revolver pellet cartridge). Impuritypellets made out of Li, Be, B or C are currently being considered.
To ablate the pellets well inside the plasma, a speed of > 500 m/s with a relativelylarge pellet mass equivalent to a pellet > 10 mm is envisaged. Due to thepossibility of encountering only low density plasma during the injection, and thepotential damage that could then occur, a single pellet is unacceptable. As aresult, a shotgun approach is being considered in which the pellet fragments intoabout 50 filaments 1-2 mm in diameter.
4.4.2.3.4 Maintenance
Any substantial maintenance of the pellet injector will be generally done outsidethe pit in the hot cell area. To this end the cask will be decoupled from the flighttube and service connections.
During operation, the cask is filled with an inert gas and monitored for tritium,water, and air leaks. The jacket around the torus valves will be maintained at alow pressure for rapid tritium leak detection. The centrifuge injector housingswill be designed to contain the largest credible fragment from a rotor failure atthe rated speed.
The maximum tritium working inventory in the pellet injection system is 45 g(extruder: 25 g, continuous cryopump, gas lines/manifold etc.: 20 g).
The killer pellet system will be in a double-contained housing rated at 0.5 MPaoutside the cryostat flange but inside the bioshield. Maintenance will involveremoval of the unit from the machine and will be done hands-on.
4.4.2.4 Wall conditioning
4.4,2.4.1 Introduction
Wall conditioning will be used prior to plasma operation to remove water,oxygen and other impurities from the plasma facing walls, to clean secondarysurfaces not directly interacting with the plasma but potential sources of plasmaimpurities, to reduce hydrogenic gas recycling from the walls (desorption) during
FDR-ITER Plant Design Description Chapter H-Section 4.4-Page 5

plasma start-up, and to minimize the in-vessel tritium inventory by the removalof co-deposited layers.
The reference process assumed for wall conditioning involves baking of all thein-vessel components to 240°C, GDC without toroidal field using D2 and He, andECR-DC with toroidal field using D2 and He. (Reactive gas purging and the useof thin film coating are also being studied.) The present concept for the removalof co-deposited tritium layers involves applying a glow discharge using ECR andICR while fuelling with a mixture of D2 and O2.
4.4.2.4.2 Baking
Baking will be undertaken following a vent of the machine to atmosphericpressure. The vacuum vessel will be heated to 200°C and the shield blanket,divertor, and other in-vessel components will be heated to 240°C by the heattransfer systems (cooling water circulated through an electric heater withsecondary heat exchanger off). The bake-out will be undertaken for a period of~ 100 h until the impurity partial pressures drop to < 10-3 Pa. At the completionof the bake-out cycle, the in-vessel components will be cooled to an operatingtemperature of ~ 150°C, at which time the partial pressures for impurities will be< 10"7 Pa and < 10"5 Pa for hydrogen isotopes.
4.4.2.4.3 Glow discharge cleaning system
Based on experience from present tokamaks, a current density of ~ 0.15 A/m2
over an accessible surface area of ~ 1300 m2 will require a GDC current of ~ 200 A.To satisfy this requirement and also to provide the spatial distribution necessaryto achieve toroidal uniformity of the GDC current, seven electrodes have beenselected each operating at ~ 25 to 30 A.
The electrode assembly will be installed in the diagnostic blocks of seven of theupper diagnostic ports. The assembly comprises a fixed body, nominally 0.24 min diameter by 4.8 m long, with a water-cooled extendible electrode which duringGDC operation is inserted into the vacuum vessel protruding about 1.25 m fromthe first wall surface. When not in operation the electrodes are retracted and thehole in the blanket is closed with the tip of the electrode. The tip is slightlyrecessed behind the first wall to minimise erosion and the body of the assembly isused to fill the void created by the installation in the blanket and W , to providethe necessary nuclear shielding. The electrodes will be supplied from a constantcurrent steady state ~ 1000 V DC power supply located in the vacuum pumproom. The working pressure during GDC is ~ 0.1 Pa and the discharge gases willbe H2 and D2 for impurity removal, and He for degassing of hydrogenic gasesabsorbed in plasma facing components.
FDR-1TER Plant Design Description Chapter Il-Section 4.4-Page 6

4.4.2.4.4 Electron cyclotron resonance discharge cleaning system
On ITER, two start-up electron cyclotron resonance heating (ECRH) systems (90to 140 GHz) and one heating & current drive ECRH system (170 GHz) areavailable for ECR-DC. The required ECH power for wall conditioning isestimated to be about 1 MW. In combination with successive discharges as thetoroidal field is set at different values between 4 and 5.7 T, this allows the ECresonance to be swept across the plasma chamber. The working pressure duringthe ECR-DC is in a range of 0.01 Pa to 0.1 Pa and the working gases used will beD2, He or O2 similar to GDC. In ITER operation, ECR-DC could be used betweendischarges as an option.
4.4.2.4.5 Ion cyclotron resonance discharge cleaning system
For ICR-DQ the ICH&CD system, with tetrodes tunable in the range 40 to70 MHz, can be used and will require a power of about 1 MW. The workingpressure for ICR-DC is about ~0.01 Pa to 0.1 Pa and the working gases are heliumor deuterium. The use of ICR-DC with helium gas is a potential candidate forwall conditioning between shots to remove weakly bonded hydrogen species onplasma facing component in order to provide a stable plasma startup for the nextdischarge.
ICR-DC has also been proposed as a conditioning technique in high magneticfield. High energy helium neutral atoms with 300 eV to 400 eV energies will becreated. In this energy range, the desorption yield of implanted hydrogen speciesin plasma facing components is large, and higher than that provided by GDC.However, this mechanism is probably insufficient for the removal of the co-deposited tritium in ITER.
4.4.3 Vacuum pumping systems
4.4.3.1 Introduction
The vacuum pumping system comprises the major systems listed below.
• roughing system;
• torus pumping system;
• cryostat vacuum pumping system;
• NB injectors pumping system;
• IC H&CD vacuum pumping system;
• EC H&CD vacuum pumping system;
• guard and service vacuum pumping system;
FDR-ITER Plant Design Description Chapter II-Section 4.4-Page 7

• diagnostic vacuum pumping system;
• leak detection systems;
4.4.3.2 Roughing system
The roughing system consists of a single integrated system which provides allmajor roughing functions. The roughing system comprises the followingelements:
• Four identical roughing pump sets;
• The roughing pump change over valve box (RPVB);
• The piping from the RPVB to the tritium plant.
The roughing system is used to evacuate equipment before crossing-over to ahigh vacuum pumping system, and for regeneration of cryopumps. Theroughing system evacuates equipment from an initial pressure of 105 Pa to a basepressure of ~ 10 Pa. The primary functions of the roughing system are as follows:
• rough the cryostat prior to cross-over to the cryostat high vacuumpumping system;
• rough the torus prior to cross-over to the torus primary pumpingsystem and evacuate each of the 16 torus cryopumps duringregeneration;
• evacuate the NB/DNB injectors during regeneration;
• evacuate port interspaces and other miscellaneous volumes;
• regenerate guard vacuum and service leak detection cryopumps, andregenerate cryopumps for the cryostat high vacuum and cryostathelium pumping systems.
Each roughing set consists of a single inlet Roots blower backed by two parallelsecond stage Roots blowers, each backed by a 4-stage piston pump. The pumpsand their associated valves and piping are housed in a glove box to providesecondary confinement.
The RPVB consists of a glove box which contains valves, piping, andinstrumentation to allow the roughing pump sets to be used in variousoperating modes. This arrangement provides the ability to independently pumpup to four different user systems at once, or to use up to three roughing pumpsets simultaneously to pump a single user system. It also provides redundancyby allowing continued operation if any one roughing pump set fails during anyoperating state. All roughing lines from pumped equipment are routed to the
FDR-ITER Plant Design Description Chapter II-Section 4.4-Page 8

RPVB. Doubly contained piping connects the roughing pump set inlets to theRPVB. Both the roughing sets and the RPVB are located in the vacuum pumproom.
4.4.3.3 Torus varuum pumping system
The torus vacuum pumping system comprises:
• the torus roughing line;
• the torus high vacuum pumping system;
• the torus maintenance detritiation system (MDS) gas re-circulationconnections.
The roughing line connects to the torus via equatorial port 7 which is sharedwith one of the diagnostics. Installed in this line are two high pressure safetyisolation valves, the second providing redundancy, to isolate the roughingsystem in the event of a 0.5 MPa pressure excursion in the torus.
The torus high vacuum pumping system is used during plasma operations topump the torus exhaust consisting primarily of hydrogen isotopes together withhelium and impurity gases. It also provides high vacuum pumping during allother phases of machine operation, including evacuation during dwell periodsbetween plasma discharges, wall conditioning, bake-out and leak testing.
The design for the torus high vacuum pumping system is based on 16 batchregenerating cryogenic pumps. These pumps are independently controlled toallow individual pumps to be regenerated, shut down in the event of failure, orto regulate the pumping speed at the torus. The pumps are installed in thedivertor level ports. The pump inlet valve and valve drive mechanism will bean integral part of the vacuum vessel service plug to facilitate remotemaintenance.
The pumps are operated using supercritical helium flow at three nominaltemperature levels: 4.5 K for the cryopanel surfaces, 80 K for the radiation shieldsand inlet baffle, and 300 K to maintain the cryopump inlet valve below thevacuum vessel port temperature. The 80 K radiation shield and inlet baffleprovide an optically tight thermal radiation shield to limit heat transfer to the4.5 K panel. The 80 K inlet baffle also serves to cool the incoming gas before itreaches the 4.5 K cryopanel surfaces thereby reducing the heat load to the 4.5 Ksurfaces.
A valve, mounted on the inlet to the pump, is provided to allow regulation ofpumping speed and also to allow regeneration of the pump.
A ring header, located at the lower magnet interface level, is used to connect theregeneration line of each cryopump and to the roughing pumps. It incorporates
FDR-ITER Plant Design Description Chapter H-Section 4.4-Page 9

safety isolation valves that perform a similar function to those installed in theroughing line.
The total tritium inventory stored in the cryopumps is directly proportional tothe period between successive regenerations. Therefore the pumps will beregenerated sequentially during the plasma discharge. At any moment duringplasma operation, 12 of the pumps are pumping the plasma chamber exhaustand the other 4 pumps are in various stages of regeneration. Cold gas stored inthe first pump is being exhausted for recovery by the cryoplant, the second pumpis undergoing rapid warm-up followed by gas desorption, the third pump is beingroughed out, and the fourth pump is undergoing rapid cool down. Using thisscheme and a 1200 second cycle, (900 seconds pumping and 300 secondsregeneration) the maximum tritium inventory of the pumps at a 50/50 DTfuelling rate of 200 Pa-m3/s is 168 g.
The torus is vented to atmospheric pressure through the torus roughing line bythe torus venting system. This system will provide a variable venting rate anduse nitrogen as the vent gas.
The maintenance detritiation system (MDS) piping is used to circulate nitrogengas from the MDS (in the tritium plant) through the torus and back to the MDSin order to remove mobile tritium desorped from the walls of the torus duringmaintenance activities. Four equally spaced lines connected from the cryopumpregeneration ring header to the divertor ports are used to carry the recirculatinggas from the tritium plant to the torus. The torus roughing line provides the gasreturn path.
4.4.3.4 Cryostat pumping system
The cryostat is pumped from the cross-over pressure to high vacuum using thecryostat high vacuum pumping system. This system consists of two cryopumpslocated inside the cryostat suspended underneath the cryostat lid. As all theother cryopumps, these pumps are cooled with single phase helium suppliedfrom the cryoplant. Regeneration of the high vacuum cryopumps isaccomplished using the service roughing manifolds. These cryopumps arerequired only prior to and during cooldown of the magnets. Subsequentpumping of condensables is provided by the fully-cooled magnets.
However, a helium pumping system is used after the magnets are cooled topump helium which may be present due to small leaks in the cryogen linesinside the cryostat.
4.4.3.5 Heating and current drive vacuum pumping systems
4.4.3.5.1 NB injector and diagnostic neutral beam (DNB) pumping system
Each NB injector module is connected to the torus via a shutter valve whichdoes not provide an absolute leak tight isolation from the torus. For initial
FDR-ITER Plant Design Description Chapter II-Section 4.4-Page 10

evacuation, the shutter valves are opened and the injectors are roughed downtogether using the torus roughing system. Upon reaching crossover pressure ofthe torus high vacuum system, the shutter valves are closed and the NBcryopumps are cooled down. During their regeneration the shutter valve isclosed and the beamline cryopanel is warmed up while being pumped by theroughing system.
The NB injectors/DNB injector are vented to atmospheric pressure through thetorus vent system with the shutter valves open.
4.4.3.5.2 IC H&CD pumping system
The IC H&CD system includes coaxial vacuum transmission lines (VTLs) whichare open at one end to the torus vacuum and closed ~5 m away by double sets of0.5 MPa vacuum windows. The annular space in the VTL on the vacuum side ofthe windows and the annular space between the windows must be maintainedbelow 1CH Pa to avoid arcing. The VTLs are grouped in sets of eight and arelocated inside the equatorial ports.
Each VTL annular vacuum space will be pumped by a pair of vacuum pumps.The pumps are non-evaporable getters which will reside in the secondaryvolume between the vacuum vessel closure flange and the cryostat secondaryclosure plate. Each VTL has two pumps so that if one fails it can be abandonedwhile the second pump is activated. The failed pump can then be replaced whena suitable maintenance opportunity arises. These pumps have been used on JETfor the same purpose and have the advantage that they are simple, small, andcan be regenerated back into the tokamak for convenient handling of tritium.No roughing or foreline will be required.
The vacuum window interspaces will each be pumped by a pair of non-evaporable getters residing in the secondary volume between the vacuum vesselclosure flange and the cryostat secondary closure plate. The window interspaceswill be connected to the service vacuum system for initial pumpdown prior tocross-over to the high vacuum getter pumps. The pumps can be regenerated intothe service vacuum manifold if required.
4.4.3.5.3 EC H&CD pumping system
The EC H&CD system consists of corrugated waveguides which are routed fromthe gyrotrons to two of the torus equatorial ports. The waveguides are open tothe torus vacuum at one end. Two vacuum windows are located at positionscorresponding to the W closure plate and the cryostat secondary closure plate.On the torus side of the vacuum windows, the waveguides are pumped into thetorus. The space between the windows is pumped by the port interspacepumping system via a series of holes through the waveguide walls.
The waveguide runs between the torus isolation windows and the gyrotronwindows at the other end must be maintained at < 10~3 Pa to avoid arcing. The
FDR-ITER Plant Design Description Chapter II-Section 4.4-Page 11

waveguide pumping system consists of pumped plenums which are penetratedby group of 7-8 waveguides. The waveguides are "perforated" with many smallholes in the plenum region to provide a conductance path from the interior ofthe waveguides into the pumping plenums. Plenums are placed every 35 malong the length of the waveguide run and 15 m from each end. Each group ofwaveguides contains 5 pumping plenums. One plenum is located in the RFbuilding, four plenums are located between the Tokamak building and RFbuilding. Careful cleaning is expected to preclude the need for baking thewaveguide based on operational experience with a similar system at DIII-D.
Each of the pumping plenums and each of the RF gyrotron-conditioning unitswill be pumped by a commercially available sputter ion pumps. These pumpsare chosen for their simplicity and ease of operation.
4.4.3.5.4 LHH&CD pumping system
A dedicated pumping system is not foreseen for the LH H&CD system. Theneutral gas pressure in the waveguides of the LH launcher has to be in a lowrange in order to maintain a good high RF power handling capability. Adequatepumping at the mouth of the launcher is provided 'naturally7 by the vessel.
The volumes between the primary and secondary windows are pumped by theexisting port interspace pumping system through a conductance provided by4 mm diameter holes drilled in the wall of the waveguides.
4.4.3.6 Guard and service vacuum pumping
4.4.3.6.1 Service roughing system
The service roughing system is used for rough down of various volumes prior tocross over to their respective steady state pumping systems and for cryopumpregeneration.
Unlike the guard vacuum system in which the pressure will be stable, the servicevacuum system pressure varies as various pumps are regenerated and volumesevacuated.
The service roughing system consists of three toroidal ring headers whichcompletely encircle the bioshield at the divertor port level, the equatorial portlevel and atop the cryostat lid. The ring headers are pumped by the mainroughing system located in the vacuum pump room. The ring headers can bepumped by independent roughing pump sets during maintenance periods.During plasma operations, all three ring headers are pumped by a singleroughing set.
4.4.3.6.2 Guard vacuum system
The guard vacuum system is used to provide pumping at locations where asemi-permanent vacuum is required and is designed to provide a pressure of
FDR-ITER Plant Design Description Chapter II-Section 4.4-Page 12

10"2 Pa. Examples of guard vacuum applications include pumping cryostatdouble seal interspaces and pumping of diagnostics which require vacuum butare not connected directly to the torus. The guard vacuum is also used to allowcontinued tokamak or cryostat operations by differential pumping the doubleseal interspaces of otherwise detrimental leaks. The guard vacuum system is notused for pumping transient gas loads (i.e., rough down of chambers and piping)because the pressure in the guard vacuum system must remain relativelyconstant.
The guard vacuum pumping systems consists of circular ring headers located ateach of three levels: the divertor port level, the equatorial port level and atopthe cryostat lid. Piping and valves branch off from the ring headers to thevolumes requiring guard vacuum pumping. The ring headers are each pumpedby a set of five closed cycle cooled cryopumps which are installed directly on thering headers. The ring headers are initially roughed down by the serviceroughing system. The cryopumps are regenerated periodically using the serviceroughing system for pump out of the desorbed gas.
4.4.3.6.3 Port interspace vacuum system
The port interspaces (i.e., the port volume between the vacuum vessel flange andthe cryostat flange) are maintained at =s 1O2 Pa by a dedicated cryopump for eachport.
The use of a dedicated cryopump on each port is dictated by cross-contaminationconsiderations. Cross-contamination could occur if a leak developed in theprimary vacuum boundary or a divertor cooling line. With the selectedconfiguration, each port interspace is completely separated from the othersduring operations since the cryopump foreline valves remain closed.
A manifold assembly located outside of each vacuum vessel port is used toprovide vacuum in the port interspaces. The manifolds join the port interspacesto the service roughing and service leak detection ring headers which are locatedadjacent to one another. A closed cycle cryopump is mounted on the manifold toprovide medium vacuum after the port interspaces have been roughed out.
4.4.3.6.4 Service leak detection system
The service leak detection system (SLDS) is used to provide a permanent leakdetection connection point at locations requiring routine leak checking.Examples of SLDS connections include the cryostat double seals, port interspacevolumes, the guard and service vacuum manifolds, and the cryogenic valveboxes. Almost every volume requiring hook-up to the guard and servicevacuum systems will also include a connection to the SLDS.
The SLDS piping and pumping configuration is almost identical to the guardvacuum system. The SLDS consists again of three independent toroidal ring
FDR-ITER Plant Design Description Chapter H-Section 4.4-Page 13

headers at the same locations. The ring headers are initially roughed down bythe service roughing system.
Five cryopumps are evenly distributed around the SLDS ring headers at eachlevel to provide high vacuum pumping. The cryopumps are commerciallyavailable closed cycle cooled Gifford-McMahon units with room temperaturecompressed helium being supplied by a central compressor located in thevacuum pump room. The pumps do not contain charcoal so that helium willnot be pumped during leak detection.
4.4.3.7 Diagnostic pumping systems
The diagnostic pumping systems will be designed on a case by case basis as thediagnostic designs are further developed. However, a common design strategyhas been developed.
The diagnostics can generally be divided into two types from a vacuum systemdesign standpoint. The non-throughput diagnostics (Type 1) are separated fromthe torus by a window, whereas throughput systems (Type 2) are connecteddirectly to the torus vacuum. The Type 1 diagnostics which require vacuum willbe pumped by the guard vacuum system. Closed cycle cryopumps regeneratinginto the torus cryopump regeneration manifold will be used to pump the Type 2diagnostics.
4.4.3.8 Leak detection systems
4.4.3.8.1 General approaches
Leak detection of the primary and cryostat vacuum systems will be based onusing both residual gas analysis (RGA) and mass spectrometer leak detector(MSLD) techniques. A combination of both vacuum and overpressure methodswill be used to test the various systems and components. These methods areoutlined below:
Vacuum Methods
• Pressure Rise Testing: The component to be tested is evacuated and therate of rise of pressure measured;
• Evacuation Testing: The component to be tested is evacuated andmaintained under vacuum while the exterior is probed with a tracergas or covered with a hood which is filled with tracer gas. The vacuumexhaust line from the component is monitored by an MSLD.
• Accumulation Testing: The change in global mass spectrum of asample from the monitored vacuum space is compared over time. Thesample is collected by an accumulation pump, e.g., cryopump, and themass spectrum analysed on regeneration by an RGA.
FDR-UER Plant Design Description Chapter II-Section 4.4-Page 14
Overpressure Methods
• Vacuum Hood Testing: The component to be tested is internallypressurised with tracer gas while in a vacuum, and the vacuum ismonitored by either an RGA or MSLD.
• Spiking: Trace amounts of water soluble additives are combined withthe water in each cooling loop, replacing the tracer gas, to produce aunique cracking pattern when measured by the RGA.
• Sniffer Testing: The component to be tested is pressurised with tracergas and the exterior probed with a high sensitivity sniffer probe.
• Pressure Drop Testing: The component to be tested is pressurised andthe pressure decay time measured. This method is limited to non-critical components or to supplement other test methods.
Testing will be undertaken using either global or local test methods. Globalsystems will be provided for the torus, cryostat, and service vacuum leakdetection system. Testing will be automated, where necessary, to expedite leakidentification and allow remote testing of components to mitigate potentialproblems associated with human access due to activation.
In general, the equipment selected is commercially available although someadaptation and re-configuration will be needed for ITER use. The equipmentidentified for the various leak detection tasks will, in combination, provide thewide operating pressure ranges that will be needed. This selection will permitgross leak testing, performed in the roughing regime at high pressures, and fineleak testing performed under high vacuum conditions. In the fine leak testingrange the sensitivities and response rates specified will be achievable: for thetorus, individual leaks of > lxlO8 Pa m3/s are detectable within 2 minutes, andleaks of > lxl(h10 Pa m3/s are detectable within 15 minutes.
4.4.3.8.2 Testing of major components and systems
The test methods to be used on some of the major systems and components aredetailed below:
Vacuum Vessel
Initial leak testing will be conducted before the introduction of water bypressurising the cooling circuits with tracer gas and using the vacuum hoodtechnique. Both the torus and cryostat global leak detection systems will be usedfor monitoring. Testing will be conducted on each sector of the vacuum vessel(20 sectors). For leak localisation, the torus will be vented and remotelypositioned sniffer probes will be used to sweep the accessible surface.
FDR-ITER Plant Design Description Chapter II-Section 4.4-Page 15

After the introduction of water, each water cooling circuit will be spiked to allowisolation of a leak to a specific cooling circuit. This cooling circuit will besubsequently isolated and dried to allow further localisation of the leak usingremotely positioned sniffer probes. This procedure will require the machine tobe vented and accessed.
Back Plate Assembly
Leak testing of the back plate assembly will be conducted in a similar manner tothat used for the primary vacuum vessel. As noted above, the water coolingcircuits will be spiked to allow isolation at the circuit level prior to draining anddrying.
Blanket
Initial leak testing will be conducted before the introduction of water bypressurising the blanket cooling circuits with tracer gas and using the vacuumhood technique. The torus global leak detection system will be used formonitoring. Testing will be conducted on each cooling circuit of the blanket toisolate the leak. Once the leak has been isolated at the circuit level, the followingmethods will be available for leak localisation:
• Sniffer Testing: The suspect water cooling circuit will be pressurisedwith 4He and remotely positioned sniffer probes used to locate the leak.This procedure will require the machine to be vented and accessed.
• Probe Testing: An intermediate flow of nitrogen will be circulatedthrough the water loop of the module and the portable MSLD used inthe counterflow mode for detection. The outside of the module will beprobed with 4He and the leakage 4He will be detected by the MSLD.
After filling, the water cooling circuits will be spiked to allow isolation of anyleak to a specific cooling circuit. This cooling circuit will be subsequently drainedand dried to allow further localisation using the methods outlined above.
Divertor
Initial leak testing will be conducted before the introduction of water bypressurising the divertor cooling circuits with tracer gas and using the vacuumhood technique. The torus global leak detection systems will be used formonitoring. The following methods will be used for leak location from outsidethe bio-shield in a hands-on assisted mode:
• The water cooling supply and return manifold are connected to thetracer gas supply and pressurised. With the torus under vacuum, thetorus global leak detection system will be used to monitor for leaks anddetermine the overall leak rate. This method allows location at thecooling circuit level (15 cassettes).
FDR-ITER Plant Design Description Chapter II-Section 4.4-Page 16

• Either the water cooling supply or return manifold will be connected tothe service leak detection manifold and the other connection blanked.With the machine vented, the venting gas (nitrogen) will be used forconfirming the integrity of the cassette. This method allows leaklocation at the individual cassette level.
• Either the water cooling supply or return manifold will be connected tothe service leak detection manifold and the other connection blanked.The outside of the cassette will be probed with 4He using a remotely-positioned probe. This procedure will require the machine to bevented and accessed. This method allows leak localisation providedthat the leak is in an area which is accessible for probing.
After filling, the water cooling circuits will be spiked to allow isolation of anyleak to a specific cooling circuit. This cooling circuit will be subsequently drainedand dried to allow further localisation using the methods outlined above.
Primary Closure Plate
Leakage through the feedthroughs that penetrate the primary closure plate willbe monitored by the torus global leak detection system after introducing 4He intothe interspace volume.
Leak testing of the lip seals of the primary closure plate after welding the sealswill be done using an improved sniffer method while the port and torus arevented to atmosphere during maintenance. The inner lip seal interspace will befilled with a 4He tracer gas and a sniffer probe will be scanned along the outboardside of the lip seal joint. An effusing nitrogen gas will cover the probing area tosuppress the background 4He into the sniffer probe.
Cryostat
The cryostat is a static structure and the propagation of cracks in the welds ofcryostat single vessel walls is not expected during operations. As a result, noroutine leak testing is planned following the site assembly phases. However,components such as flange seals and port bellows may leak, so these parts will beprovided with remote leak testing connections as outlined in the followingexamples:
• Bellows: The cryostat penetration bellows are two ply and theinterspace is evacuated by the guard vacuum system. A protectivecover over the outer bellows will be equipped with an 4He effusingnozzle to spray tracer gas on the outside of the bellows. The 4Heleakage into the interspace will be detected by the MSLD connected tothe service leak detection manifold. For leak checking of the innerbellows, 4He will be supplied to the interspace and the 4He leakage willbe monitored by the cryostat MSLD.
FDR-ITER Plant Design Description Chapter II-Section 4.4-Page 17

• Double Seal Interspaces: Leak detection is similar to the procedure forbellows except that the outer seal is tested for air leaks using the RGA ofthe service vacuum leak detection system rather than a 4He effusingnozzle.
• Cryogenic Lines: These components are equipped with a dedicatedvacuum pumping system. The cryostat MSLD will monitor 4He leaksfrom the cryogenic lines.
4.4.4 Tritium plant
4.4.4.1 Summary description
The ITER tritium plant contains a variety of process systems including:
• front-end permeator — separate hydrogen isotopes from all impurities;
• isotope separation — remove protium from tokamak exhaust, andchange D-T composition to match fuelling requirements;
• fuel storage — provide proper fuel mixtures to match fuellingrequirements, and store process tritium and deuterium during non-operating periods;
• impurity detritiation — recover tritium from tritiated impurities in thetokamak exhaust, to permit release to the atmosphere;
• tritium recovery from heat transfer system cooling water, waste water,secondary confinement and building atmospheres to maintain tritiumreleases at acceptable levels. The water detritiation is carried out by thewater detritiation system (WDS) and the atmosphere detritiation iscarried out by several atmosphere detritiation system (ADS) andassociated systems.
4.4.4.2 Front-end permeator
Hydrogen isotopes are separated from tokamak exhaust impurities bypermeation through a palladium/silver alloy membrane, operating at 400°C, thatis uniquely permeable to hydrogen. The first stage permeator will be made up offive parallel units, each with the equivalent of 0.6 m2 of 0.08 mm thick alloy. Atthe design permeator operating conditions of 250 kPa in the high pressure tubing,200 Pa m 3 / s of an equimolar DT mixture will diffuse into the < 50 kPa pureproduct side evacuated by Metal Bellows pumps to achieve hydrogen recoveryabove 95%.
If desired for process reasons, a second permeator stage may be operated withhydrogen product pressures maintained below 2 kPa by two independentNormetex pumps discharging to the stage 1 Metal Bellows pumps to achieve
FDR-HER Plant Design Description Chapter II-Section 4.4-Page 18

overall hydrogen recovery exceeding 99%, thereby reducing the requirements forthe impurity detritiation system.
The permeator feed system consists of Metal Bellows pumps for interface withthe vacuum pumping system discharge at 0.1 MPa. Normetex pumps providethe low pressures required for evacuation of any tritium plant process systemwhen required.
Two 200 / surge tanks are provided between the feed pumping system and thepermeator to relieve feed streams when the exhaust rate exceeds the capacity ofthe permeators and product pumping systems. Two additional 1.0 m3 tanks areprovided for emergency relief of HDT from the Torus cryopumps or thecryogenic molecular sieve bed in the glow discharge cleaning system.
4.4.4.3 Impurity detritiation
The four candidate processes for detritiation of the impurity stream from thefront -end permeator are: CAPRICE, oxidation/electrolysis, HITEX and acombined permeator membrane reactor (PMR). Process development activitieswill continue beyond the end of EDA in July 98. Selection of the impuritydetritiation process for ITER will be deferred pending completion of the hometeam development activities.
The CAPER process, improved from CAPRICE by the addition of PERMCAT as afinal clean-up segment is used as the basis for cost estimates. The PERMCAT is asingle unit composed of a permeator and a catalytic reactor. This extracts tritiumfrom residual tritiated impurities bled from the CAPRICE process by means ofthe hydrogen isotopic exchange reaction. The overall decontamination factor ofthe CAPER process has been proven to be at least 108.
The non-hydrogen stream from the front-end permeator, containing elementalhydrogen, helium, tritiated hydrocarbons, and tritiated water is collected in oneof two 300/ tanks. The combined impurity stream is circulated continuously, firstthrough a nickel catalyst where hydrocarbons are decomposed into elements, andthen through a water gas shift catalyst, where carbon monoxide reacts with waterto form hydrogen and carbon dioxide. The carbon dioxide reacts with elementalcarbon on the first catalyst bed to give carbon monoxide.
Hydrogen generated from the decomposition of the hydrocarbons and fromconversion of water vapor is continuously removed from the impurityprocessing loop by permeation through another palladium/silver membrane.The recovered hydrogen is transferred to isotope separation for enrichment, orhydrogen storage until required. The detritiated impurity stream is transferred tothe vent detritiation system for release to the atmosphere.
FDR-ITER Plant Design Description Chapter II-Section 4.4-Page 19

4.4.4.4 Clow discharge cleaning exhaust processing
Glow discharge cleaning (GDC) exhaust may consist of either helium or protiumand deuterium with impurities. Protium and deuterium exhaust will beprocessed through the front-end permeator and impurity detritiation systemsexactly like the normal Tokamak plasma exhaust with impurities. Whenhelium is used for the GDC operation, the exhaust will be processed through aliquid nitrogen cooled molecular sieve (80 K) bed to remove the impurities, withhelium recycled directly back to the Tokamak. The molecular sieve beds will beregenerated periodically by warming to room temperature and recirculatinghelium and impurities to the impurity detritiation system.
4.4.4.5 H. D. T isotope separation system (ISS)
The purpose of the isotope separation system (ISS) is to separate hydrogenisotopes from the plasma exhaust flow to allow changes in composition of re-injected fuel, and to extract tritium from the water detritiation system (WDS).Cryogenic distillation of hydrogen is the only process available at the ITER-relevant scale. The system (see layout in Figure 4.4.4.5-1 and diagram inFigure 4.4.4.5-2) has five distillation columns and eleven equilibrators. Theseparation relies on the slight differences in boiling points in the 20-25 K range atatmospheric pressure for the six combinations of H, D and T isotopes. These arein ascending order of boiling points: H i HD, HT, D2, DT and T2. The differencesin volatility permit separation of isotopes with tritium concentrating at thebottom and H2 at the top of the distillation cascade. Table 4.4.4.5-1 give asummary of equipment parameters.
The purpose of the first column (CD10) is to remove tritium frompredominantly hydrogen-rich streams from water detritiation and to produce ahighly detritiated hydrogen stream as the overhead product, and D2, DT richstream as the bottom product for further processing in columns CD20, CD30, andCD50. Appropriate product recycle lines are provided to permit temporaryoperation in a closed system with a concentration and flow profile ready toservice resumed plasma operation. Feeds to the ISS are, as a result of designoptimization, divided into two streams:
• the tritium "lean" ISS feed stream containing a mixture of two streams:
- the NB injector source gas — 40 Pa m3/s, (99% D, 1% T);
- the return stream from water detritiation — 980 Pa m3/s.
• the tritium rich plasma exhaust flow — 208 Pa m3 /s containing: 5% H,23-50% T and balance D, is fed into the opposite end of the distillationcascade, namely distillation column CD50.
The ISS products are:
• 90% T, 10% D up to 50 Pa m3/ s;
FDR-1TER Plant Design Description Chapter Il-Section 4.4-Page 20

detritiated H2 reject stream containing less than 1O8% T;
a by-product 50% T, 50% D;
balance deuterium with maximum 0.5% H.
If there is no plasma operation then only CD 10, 20 and 40 operate. If there isplasma operation then CD 10, 20, 30 and 50 operate. The CD10 feed, which was inthe WDS in contact with water, is conventionally dehumidified andsubsequently, as for the CD50 feed, further polished in a cryo-adsorber. This is toremove all traces of impurities which, at the ISS operating temperature, wouldfreeze and accumulate. The columns, cryo-adsorbers, overhead condensers, heatrecovery exchangers, and reboilers are all located inside the cryogenic cold box.This box provides both vacuum insulation and hard shell type secondaryconfinement. The remaining components, such as pumps, valves andequilibrators, all operating at ambient temperatures, are located in an inertatmosphere filled secondary confinements. One, for CD10-40 is a glove box atatmospheric pressure, the other for CD50 is a pressure vessel (0.25 MPa) withglove box-like maintenance capability.
TABLE 4.4.4.5-1Summary of Equipment Design Parameters for ITER ISS
Parameter
# of stagespressure
column dia.
Location
top/bottomtop/bottom
packed heighttritium invent,over oper. rangerefrigeration load
Dimension
IkPa]
[mm]
[m]
fe]
[W]
CD10
125110/115
158
6.5
0.1 - 6
1200
CD20
100110/115
116
50.1 - 20
900
CD30
100
110/115
109
30.5 - 2
800
CD40
50140/150
16
1.256
20
CD50
70140/150
120/50
3.1130 -200
1000
The entire ISS, with the exception of four infrequently operated valves, has nomoving part operating at cryogenic temperatures and/or located in the difficultto access cold box environment. This is one of the most important design aspectsin achieving a virtually maintenance-free cold box. Because the ISS is inherentlyunsuitable for later upgrading, it will be built to full ITER requirements from thebeginning.
4.4.4.6 Water detritiation system (WDS)
The purpose of the water detritiation system is to remove tritium from coolingwater and from waste water. The quantities of water fed into the system is 40
FDR-ITER Plant Design Description Chapter II-Section 4.4-Page 21

kg/h and the tritium concentration is from 0.3 Ci/kg (0.03 g/m3) to 1 Ci/kg(0.1 g/m3).
A well-proven distillation of water under vacuum (at 50°C) has been chosen forITER. This unit produces a detritiated reject stream < 0.001 Ci/kg and aconcentrated bottom product 30 Ci/kg. Tritium from the WDS is transferred intoa tritium lean hydrogen stream by way of catalysis-aided exchange in a vaporphase catalytic exchange (VPCE) process. The tritium enriched hydrogen (1600mol-H2/h) from VPCE carries tritium into the ISS.
If the water detritiation need to be improved in terms of tritium detritiationlevel, the distillation unit can be upgraded by adding more detritiation modules.The system cannot be economically upgraded in terms of mass throughputhowever.
The ITER WDS system (see Figure 4.4.4.6-1 for layout and Table 4.4.4.6-1 for data)will have a concentration profile ranging from 0.001 Ci/kg at the low end wherewater is rejected to the environment, to 30 Ci/kg. Where intermittently hightritium recovery tasks occur, such as if tritium released into buildings isrecovered in dryers, water will be detritiated through the VPCE directly. In suchinstances highly contaminated water will be directly recirculated through theVPCE until its concentration is lowered to a level compatible with the WDSbottom product, and then the water can be partially mixed with the VPCE feedfrom distillation for once-through treatment before subsequent rejection.Figure 4.4.4.5-2 indicates the logic link between the WDS, VPCE and ISS systems.
TABLE 4.4.4.6-1Summary of Design Parameters for the Water Detritiation System
Parameter
number of stagespressure
temperature
column diameter
packed height
column #1 lengthcolumn #2 lengthcolumn #3 length
Location
top/bottom.
top
bottom
top/bottom.
mass transf.mass transf.
mass transf.
Dimension
[kPa]
[K][K][on][m]
m total
m totalm total
WD10, 20,30
45611/15
320
338
63/6355 (total)
23
2326
VPCE
2110/120
473
340
10
The distillation columns consist of 3 m long modules. Each section has theseparation power equivalent to 24 theoretical stages and is self-contained with itsown liquid collection and redistribution system. There will be two columns with6 and one column with 7 sections. Individual sections are connected with eachother through bolted but seal-welded flanges. Mass transfer and isotopicexchange is facilitated through intimate liquid to vapor contact on a copper-
FDR-ITER Plant Design Description Chapter II-Section 4.4-Page 22

bronze, structured packing which has been chemically pre-treated - oxidized forwetability.
The VPCE unit has two stages, each containing one module with combinedevaporator-superheater and one module combining the catalyst bed and thecondenser-gas /liquid separator. These, with pumps, associated piping, valvesand controls, will be located in a secondary confinement filled with nitrogen atatmospheric pressure.
Although the VPCE removes only approximately 2/3 of the tritium from the10 kg/h feed, it is an essential step for transferring tritium from water tohydrogen making subsequent extraction in the more powerful ISS possible. Thetransfer of tritium from water into hydrogen takes place by way of isotopicequilibration between the tritium rich water and tritium lean hydrogen in thepresence of catalyst at 200°C.
All electric heaters can be replaced with minimum tritium exposure tomaintenance personnel. The operating pressure and temperature in the VPCEunit are 110-120 kPa (a) and 320-473 K, respectively.
4.4.4.7 Atmosphere detritiation systems (ADSs)
The atmosphere detritiation system must process all atmospheres in the plantwhere the tritium is at risk of release exceeding the permissible levels, in order tocontrol releases to acceptable levels for chronic and acute releases. Aconventional process based on catalytic oxidation of hydrogen followed bymolecular sieve adsorption of the humidity has been selected. Areas which needADS are:
• Tritium building - rooms where more than lg of tritium is at risk ofrelease from process systems or secondary confinement;
• Vacuum pumping room in T-plant basement;
• Tokamak/pit areas/rooms;
• Neutral Beam Injector cell.
The hypothetical largest release is 230 g of tritium into a 1500 m3 room (ISScontents into ISS room). The slowest cleanup task is the release of 17 g of tritiumfrom a failed fuelling line into one of the large rooms in the pit (upper and lowerTCWS vault; total volume = 24,000 m3 ).
The specific ADS units will provide the following services:
• Glovebox ADS (GDS^ 50m3/hr;
FDR-ITER Plant Design Description Chapter H-Section 4.4-Page 23
remove tritium leaked/permeated from tritium process equipment;
maintain inert gas purity by removing any air in-leakage from adjacentareas, or other impurities;
maintain oxygen level in glove box below 50% of the minimumconcentration for combustion with hydrogen (< 24,000 ppm).
Vent Detritiation Systems (VDS)
Vent Detritiation Systems (VDS) are designed to discharge process effluent gas,secondary confinement inert gas, and building air to maintain sub-atmosphericpressure in order to reduce tritium outwards migration. The following capacitiesare provided:
• Normal VDS 500m3/h
• Standby VDS 1,200
HVAC ducts for each room, or group of rooms, will be equipped with leak-tightisolation valves for reduction of cross-contamination at a tritium contaminationevent. Independent supply and return headers, complete with distributionpiping feeding to and returning from each room in the potential risk zones, willbe provided for the Standby VDS.
Standby VDS
When a tritium monitor detects any tritium spill in a room/area, it willimmediately set off the local alarm, automatically isolate the ventilation systemfrom the room, and alert the control center for operator-initiated action or willstart the ADS automatically.
Contaminated air from the affected room will first pass through a filter assemblyto remove any loose particles, then it is pre-heated to 150°C for catalyticconversion of elemental H, D, T to its oxide form. Moisture generated in therecombiner is partially condensed and removed in a condenser and chiller cooledwith chilled water. Remaining moisture is adsorbed in the molecular sieve-filled drier bed.
When a drier bed is saturated with moisture, it is replaced with a regeneratedunit and placed into the regeneration mode. Regeneration takes place throughthe following steps: heating, drying, and cooling.
Heating takes place by circulating gas in a closed loop, pre-heating the gas to 300°Cin an electric heater. Then it will pass onto the bed to release and pick-up themoisture trapped in the molecular sieve. The hot gas laden with vapor from theregenerating bed will release its moisture content first in the condenser.
FDR-ITER Plant Design Description Chapter H-Section 4.4-Page 24

Tokamak Cooling Water System Vaults Dryer System (CVD)
Tritium operation will be gradually implemented and, approximately five yearslater, permeation into the coolant may start. Then a conventional air dryer maybe required to continuously remove tritiated water vapor leaked into the vaultfrom the cooling loops. Its size will be determined by the desired tritiumconcentration in the vault and the expected yearly leaks of water from thecooling systems. Both of these parameters will be known before the drier isprocured. In the meantime, the reference design includes two 1500 m3 /h unitsone in the upper and one in the lower vault.
Tokamak Maintenance ADS (MDS)
To provide Tokamak vacuum vessel cover gas during maintenance inert gasdetritiation system MDS is required. The maintenance servicing loop may haveto carry out additional function such as dust and oxygen removal. The first wall,if sufficient baking was not done prior to maintenance, could release significanttritium in the early stage of maintenance. Simultaneously the amount ofhumidity released from the first wall and the very small amount of humidityassociated with removing it could result in very high tritium concentration inthe drying bed. In order to increase the removal efficiency some moisture orhydrogen addition will be provided. This system is essentially same as thenormal VDS (recombiner temperature 500C is selected to process tritiatedhydrocarbons) except it is 7 times larger and may contains oxygen scavengingbeds for oxygen free atmosphere in the vacuum vessel during maintenance ifrequired.
4.4.4.8 Fuel storage and distribution
This system is integrated with the fuelling system as shown in Figure 4.4.4.8-1.provides for storage and distribution of the DT working inventory duringprocessing and when operations and systems are shut down, and for theunloading, storage, and transfer of all tritium received from offsite when neededfor fuelling.
The system consists of twelve zirconium-cobalt hydride beds, each provided withindependent headers to permit flexibility for simultaneously receiving hydrogenfrom the front-end permeator and isotope separation, and for transferring toTorus fuelling (3 streams) or to a hydride bed for storage.
The T-plant provides T2, D2, DT, H2 and other gases by independent pipe lines.T2, DT, D2, (and H2 ) are manifolded into the top port GIS, the divertor port GIS,the pellet injector GIS, and NB/DNB GIS. The interface pipe lines between theT-plant and these manifolds/ring headers comprise 8 independent gas lines (T2,DT, D2, H2, Ar, N2, H2, He) and one common purge/evacuation line. Three 200 Itanks are provided for makeup of specific gas mixtures and for a surge volume topermit control of supply pressure to the torus fuelling system. The tanks andfuelling headers are provided with a mass spectrometer to permit accurateanalysis of the feed mixture. An ion chamber and mass flow meter are provided
FDR-ITER Plant Design Description Chapter II-Section 4.4-Page 25

on each fuelling line from the tritium plant to provide an estimate of the fuel gasand tritium fed to the Torus and pellet injection system.
The zirconium-cobalt hydride bed pressure during hydrogen receipt/transfer iscontrolled by maintaining bed temperatures in the range of 30-200°C (< 10 kPa)during receipt and 300-400°C (60-90 kPa) during transfers from the bed. Each ofthe hydride beds is surrounded by an evacuated jacket to collect any hydrogenthat permeates through the walls of the heated bed. The jacket may be evacuatedto the front-end permeator as required to maintain the low pressures required toreduce conduction heat losses during operation.
Pressure gauges at the hydride beds were eliminated to provide a simple vesselfor containment of high pressures under accident conditions. Sensors formeasurement of temperature have been retained and are representative ofpressure for a given gas mixture.
4.4.5 Tritium accountability
The tritium inventory and material balance area summaries are shown inFigure 4.4.5-1.
It is expected that not all the sub-inventories would be allowed to peak at thesame time so that the total could be kept below 4 kg on-site. The quantity in theTorus, and quantities transferred to the hot cell and waste treatment, haveconsiderable uncertainty. Thus, for tritium accounting purposes, theseinventories are combined. However, the tritium in other parts of the system canbe measured with high accuracy. As a result, to maintain a working estimate oftritium in the Torus, hot cell and waste treatment, it will be necessary todetermine the amount received on site and subtract the amount of tritium in theprocess part of the system.
4.4.6 Fuel cycle dynamic modelling code
The fuel cycle dynamic modelling code (CFTSIM) provides a single integratedpackage which simulates the integration of all major elements of the fuel cycleboth passive, e.g. first wall, and active e.g. fuelling. Each of these subsystems aremodelled within modules which are linked together and integrated to simulatethe complete operational cycle. Initial inventories can be specified by the user.
Two different types of fuelling methods are included; deep plasma and edgefuelling. The cryopanels of the NB/DNB injectors are modelled as retaining afraction of the inventory during NB injection. The torus module currentlymodels the saturation layer, bulk inventory, codeposition, dust, plasmainventory, and plasma exhaust. The number of cryopumps, the number ofpumps in regeneration at steady state, the regeneration pump out time for eachpump, the pump speed of the roughing pumps, and the cryopump volume areused to calculate the time-dependent inventories and flows within thissubsystem. Gas is withdrawn from the fuel cleanup buffer tank at a rate specified
FDR-ITER Plant Design Description Chapter II-Section 4.4-Page 26

by the user. Permeators are modelled as flow separators with an efficiency factorcharacterising them. Another buffer tank is included downstream from thesepermeators. Two models can be used for the ISS simulation. The first is asimplified module which uses a proportional rate constant to calculate theoutflow from time-dependent feed rates. The second is a rigorous model thatuses the ITER reference distillation cascade design with appropriate controlmechanisms. However, due to the realistic detail and increase in the number ofcalculations using the rigorous model, a shorter time step during the simulationis required. Buffer tanks are used as models for storage of H2, D2, and T2.Fuelling requirements as given by the user in the fuelling module drive thewithdrawal of fuel from these buffer tanks. Dynamic feed from the ISS refillsthese volumes during the simulation. An infinite external supply of D2 and T2is included when the storage inventory for these two gases dips down below acertain minimum threshold value. When the DT inventory in this subsystem istoo low, the model mixes D2 and T2 from this external gas supply which is addedas needed.
A typical output from the simulation code, at a fuelling rate of 200 Pa m3/s forfive consecutive pulses of 1,000 second burn and 1,200 seconds dwell is shown inFigure 4.4.6.5-1.
4.4.7 Assessment
During the gas fuelling design no major problems have been identified. Theexisting technology base for centrifuge pellet injectors, together with the ongoingR&D effort focusing on increased pellet velocities and the acceleration of largepellets, will provide a solid foundation for the extension of this technology toITER parameters. The adoption of the screw extruder, since the DDR, has apositive impact on the overall reliability of the pellet injection system. Highfield launch has also the potential for significant improvement in fuellingefficiency which would result in reductions in in-vessel inventories and tritiumprocessing requirements.
Wall conditioning techniques will achieve a suitable environment for plasmaoperations. However, the key issue for ITER is the development of effective wallconditioning methods to remove tritium from co-deposited layers. The rate atwhich these layers build up is still uncertain: existing tokamaks and test facilitieswill continue to be needed for experimental results as well as more realisticmodeling of the co-deposition process.
The design of the vacuum pumping system is progressing well, though thefollowing two areas need attention:
i) The torus cryopumps meet the ITER performance requirements.However, while considerable progress has been made since the DDR inreducing cryogenic helium demands, which result from the need forfast regeneration (to minimise tritium inventory and minimisepotential deflagration pressures), further work is still required throughongoing R&D and design investigations.
FDR-ITER Plant Design Description Chapter II-Section 4.4-Page 27

ii) Considerable progress has been made in developing the design of theleak detection system, which uses a balance between the complexity ofremotely-operated systems with the use of hands-on techniques inaccessible areas, but much work remains to be done. The conceptualschemes which have been developed for major components need to befurther advanced and strategies and schedules developed for leakidentification and localisation for specific components.
With the exception of impurity detritiation, the torus exhaust processes andequipment design are based on proven technologies that have been used intritium facilities for many years. The impurity detritiation process selection willbe delayed until completion of ongoing R&D programs on alternative processes.
The ISS cryogenic load will be provided by a standard commercial refrigeratorwhich will be located outside the secondary confinement. The technologyapplied, namely cryogenic distillation, is based on experience with industrialunits in successful operation for the past 30 years. A multi-column ISS cascadedesigned for demonstration of fusion fuel processing has been developed atseveral research facilities (TSTA/LANL, TPL/JAERI, JET, and TFTR) fordemonstration of fusion fuel processing (HDT separation, operation control,inventory control, safety handling, etc.).
There are several WDS units of the required kind in service. In terms ofdetritiation performance, ITER uses parameters proven in practice but notroutinely used in the industry, but no R&D is required.
The development of the fuel cycle simulation code is progressing. However,further revisions of the code will be needed as more detailed characteristics of thevarious fuel cycle components become available. Future work needs to addressfurther optimisation of the fuel cycle and minimisation of tritium inventory,assess the impact of fuel cycle component failures, and establish fuel supplyrequirements.
FDR-ITER Plant Design Description Chapter II-Section 4.4-Page 28

ITER TRITIUM
BASIC FLOWSHEET
I FVE(.SrORAO£>V3TtU J
Figure 111-1

CAS INJECTION LINE5 TOROIDAL LOCATIONS
6 LINES(3 HYDROGENIC GASES. 3 IMPURITY GASES)
FUELL ING (H. HD, D2.DT, T2)AND IMPURITY GAS DELIVERY
JWall Condi HoningISystem\(GDC.ECRDC. I CROC)
NBI andDiognostic NBI
~\Gos Injection'System (Vet t .Por i}
IFusion Po*.SafetyI Shutdown System
Gas Injection"1 System (Div.Port)
GAS INJECTION LINE. 5 TOROIDAL LOCATIONS
RoughingPump
6 L INES(J HYDROGENIC GASES,3 IMPURITY GASES)
Figure 4..4.2.1-1ITER Fnling System

Figure 4.4.4.5-1
ITER Isotope Separation SystemLayout

N32 GR3 96-08-06 W1.1 rev. 13, August. 1997
ITER Water Detritiation and H,D,T Isotope Separation Systems diagram.
coolanttotal recyclenow*
Figure 4.4.4.5-290%T product
90%T product

Figure 4.4.4.6-1 ITER Water detritiation System Layout
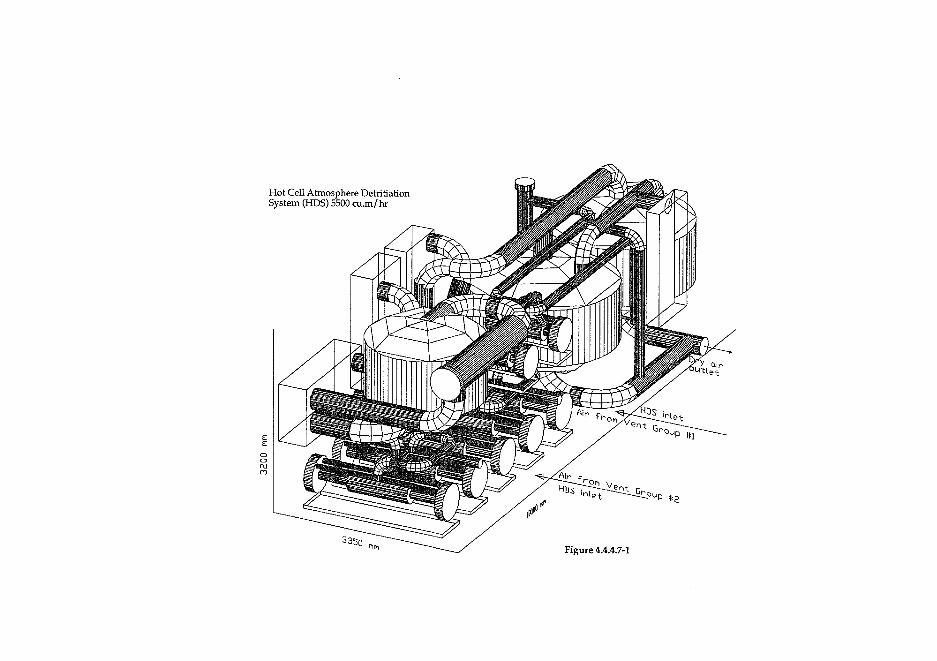
Hot Cell Atmosphere DetritiationSystem (HDS) 5500 cu.m/hr
#5
33SQFigure 4.4.4.7-1

DT ISSFeed
(Bed, Tank)
TOImpurityDetrite
60 kPa
IS-Pertaea^or
Vs.
Legend
Mix r~~iH/D CZ3D/T CZ3T2 C 3Non-HDT
Torus
H/D
•lOO kPa
l ing Volume
D/TStorage
(Bed, Tank)60 kPa
Exhaust
TritiumStorage
(Bed, Tank)L&J
80
PelletInjectionSystem
Tritium Plant Fueling/Vacuum Pumping Systems
Figure 4.4.4.8 - 1
Tritium Systems Interface with Torus Systems

Long term storage:GDRD limit 1,000 g-T
Torus, hot cell,waste storage:
Off-siteIShipments
GaseousEffluents
Hot Celland WasteTreatment
IsotopeSeparation
230
VacuumPumpingSystem 10
Front-EndTermeafbr'
70
ImpurityProcessing
15
Pumping, fueling, and tritium plant:GDRD limit 1,000 g-T
Figure 4.4.5-1 ITER Baseline Tritium Inventories (not all can peak simultaneously)

350
300
2000 4000 6000 8000 10000
Time (s)
Figure 4.4.6.5-1 Dynamic Tritium Inventories in the Fuel Cycle
CryoPumps
Fueling/NBI
Torus
FCU

INTERNATIONAL THERMONUCLEAR EXPERIMENTAL REACTOR
TECHNICAL BASISFOR THE
ITER FINAL DESIGN REPORT, COSTREVIEW AND SAFETY ANALYSIS
(FDR)
Chapter IISection 4.5
ITER PLANT DESIGN DESCRIPTION
13 July 1998
SECTION 4.5

CRYOSTAT AND THERMAL SHIELDSSECTION 4.5
TABLE OF CONTENTS
4.5 Cryostat and thermal shields 14.5.1 The cryostat system 14.5.1.1 Cryostat vessel and ports 24.5.1.2 Bellows and penetrations .34.5.1.3 Structural supports 54.5.1.4 Assembly and installation of the cryostat 54.5.2 Thermal shields 64.5.3 Assessment of the design 9

4.5 Cryostat and thermal shields
4.5.1 The cryostat system
The cryostat provides the vacuum to limit the residual gas conduction andconvection heat loads to the cryogenic magnet structure. With its extensions, itforms part of the tokamak second confinement barrier. The cryostat can alsoprovide decay heat removal when all vacuum vessel and in-vessel coolingsystems have failed by heat conduction if helium is introduced into it.
The cryostat has a flat lower head to give space for replacing the lower PF coilswithout increasing the pit depth. A flat upper head is desirable to increase theheight of the cylindrical section, such that all the main equipment penetratingthe cryostat wall should do so through the cylinder, thereby minimising thedisturbance caused when removing the complete cryostat upper head. Thisupper head is integrated with the top biological shield supports which consist ofsteel truss structures; this newly designed arrangement provides appropriateaccess to the 10 vertical ports dedicated to diagnostics.
The cryostat provides ports, access openings and penetrations with bellows, to thevacuum vessel. The gravity support ring pedestal provided at the cryostat lowerhead is connected to the tokamak gravity supports by bolts, and supports theentire tokamak basic machine loads. There is also an inner pedestal to supportthe CS system.
The main changes and progress since the DDR are:
i) design modifications to simplify manufacture (e.g., single-walledstructure, both for the cylinder and top and bottom heads);
ii) better use of the vertical space by integrating the upper head and thebioshield support. (This leads to a reduction in the building cost andmakes more space available for diagnostics above the machine);
iii) a full structural analysis, including buckling and seismic analysis;
iv) further engineering design including access ports for in-cryostatmaintenance, a central opening in the top head for the removal of theCS and the PF1 and PF2 coils, annular structures in the bottom head forthe replacement scheme of lower PF coils and studies ofmanufacturing;
v) more detailed safety analysis.
FDR-HER Plant Design Description Chapter II-Section 4.5-Page 1

4.5.1.1 Cryostat vessel and ports
The cryostat vessel has been designed to a maximum absolute pressure underfault conditions of 200 kPa internal and 100 kPa external. Also, it is designed tosurvive, without damage, the accidental loss of magnet helium coolant into thecryostat. Figure 4.5.1.1-1 shows a cross section of the cryostat and the maindimensions.
The upper head is a circular flat plate, normally 40 mm thick, with radialstiffening ribs spaced every 9°. These ribs provide the attachments for the carbonsteel truss structure above. The wall thickness of the lower and upper cylinder is40 mm. The mid cylinder wall is 50 mm thick, as this region needsreinforcement for the large openings of the divertor and equatorial ports. All ofthese cylindrical portions are stiffened for external pressure by equally-spaced,circumferential stiffening rings and 20 equally-spaced vertical ribs are added onthe mid cylinder. The lower head is formed by two annular flat plate structures.One is the outer portion which extends from the cryostat support skirt to thegravity support ring pedestal, and the other is the inner portion which extendsfrom the gravity support ring pedestal to the central solenoid (CS) support ringpedestal. The plate of the outer portion is 50 mm thick and stiffened with radialribs spaced every 4.5°. The inner portion is also 50 mm thick with radial ribsspaced every 9°. The outermost and innermost parts of these annular bottomheads are welded to the 20 mm thick cylinders attached to the cryostat supportskirt, the gravity support ring pedestal and the CS support ring pedestal. Parts ofthese cylinders will be cut and rewelded in the event of a poloidal field coil (PF5through PF9) replacement.
The cryostat mass is 4,4001 including ribs, reinforcement, upper portion of thering pedestals and cryostat support skirts. The upper head mass is 1,3401including the truss structures. The cryostat internal volume is 32,700 m3. With12,800 m3 taken up by the machine, main bellows, and cooling pipe shrouds, thecryostat free volume is 19,900 m3. The overall toroidal resistance is 24 juQ.
There are many access ports to the cryostat interior. In the upper head, there isone 2.5 m diameter port on axis for hands-on maintenance access to the area nearthe upper part of the CS, and there are twenty 1.8 m diameter remote handlingports for vertical remote handling access and four 0.8 m diameter access ports forhands-on maintenance, man access to the inside of the cryostat.
On the lower half of the cylinder, there are four remote handling ports, of 2.25 mdiameter, for access to the lower machine area, outboard of the gravity supports.On the lower head, there are four 1.6 m diameter remote handling ports foraccess to the lower machine area, inboard of the gravity supports.
Double sealing of the access port flanges can be provided by an outer welded lipseal and an inner flexible seal ring. The interspace between the seals ispumpable. The list of the cryostat penetrations is shown in Table 4.5.1.1-1.
FDR-ITER Plant Design Description Chapter II-Section 4.5-Page 2

4.5.1.2 Bellows and penetrations
The crypstat must provide feed-through penetrations for all the connectingelements of systems outside the cryostat to the corresponding elements inside thecryostat. All penetrations through the cryostat make allowances for mutualdisplacements between the vacuum vessel and the cryostat, and between thecryostat and the biological shield wall, primarily with bellows. In addition to thebellows mentioned in Table 4.5.1.1-1, others are installed between the cryostatand the vault boundaries as appropriate (TCWS vaults and NB cells, inparticular).
The list of the cryostat penetrations is shown in Table 4.5.1.1-1.
FDR-ITER Plant Design Description Chapter II-Section 4.5-Page 3

TABLE 4.5.1.1-1Access Port and Penetration list
Port/Penetration Name
Access PottsUpper Head Central Port
Upper Head Remote HandlingPortsUpper Head Outer Ports
Cylinder Remote Handling Ports
Lower Head Remote HandlingPorts
PenetrationsDivertor Port Penetrations
Equatorial Port Penetrations
NBI Port Penetrations
NBI Diagnostic Port Penetration
Upper PHTS Port Penetrations(Large)Upper PHTS Port Penetrations(Small)Mid PHTS Port Penetrations
Upper Magnet Feedthroughs
Lower Magnet Feedthroughs
Diagnostic Port Penetrations
IWS Port Penetrations
Cryostat Roughing LineFeedthroughCryostat Helium Pumping LineFeedthroughCryostat RGA Feedthroughs
Thermal Shield FeedthroughsTotal
Number
1
20
4
4
4
20
16
3
1
10
10
4
34
28
10
10
1
1
1
178
Size(mm)
2500 ID
1800 ID
800 ID
2250 ID
1600 ID
4502 ID
4502 ID
2142 ID
2142 ID
1600 OD
700 OD
860 ID
700 OD
700 OD
2015x1200(Trapezoid)
712 ID
323.9 OD
660 OD
168.3 OD
Location
UpperHeadUpperHeadUpperHeadLower
CylinderLowerHead
MidCylinder
MidCylinder
MidCylinder
MidCylinder
UpperCylinder
UpperCylinder
MidCylinder
UpperCylinder
LowerCylinder
UpperHeadUpperHeadUpper
CylinderLower
CylinderUpper
Cylinder(TBD)
Bellows
No
No
No
No
No
Yes
Yes
Yes
Yes
Yes
Yes
Yes
Yes
Yes
Yes
Yes
Yes
Yes
No
FDR-ITER Plant Design Description Chapter II-Section 4.5-Page 4

Bellows have been sized for the flexible connections between the vacuum vessel,cryostat, and building, including the PHTSs guard pipes, equatorial and divertorports, magnet feedthroughs, and pressure suppression system pipes. Bellowswith a cryostat vacuum outside during normal operation have to be designed for0.2 MPa differential pressure. The internal design pressure depends on thenature of the system. The bellows connecting the vacuum vessel equatorial anddivertor ports and the cryostat penetrations form a closed volume with PHTSspipes, which could fail and cause a spill of coolant. These closed volumes will befitted with pressure relief devices that open below 0.26 MPa differential into theupper and lower TCWS vaults. Similarly, the outer envelopes of the magnetfeed lines will be provided with pressure relief devices discharging magnetcoolant (helium) to the quench gas discharge manifolds.
Because of their high cost, the bellows connecting the vacuum vessel (VV) portswith the cryostat penetrations at the equatorial and divertor port locations aredesigned to survive, without damage all expected off-normal conditions.Nevertheless, are designed as replaceable elements, with access for replacementfrom outside the bioshield (see Figure 4.5.1.2-1).
4.5.1.3 Structural supports
The main gravity support of the cryostat is at the outside diameter of the lowerhead, in the form of a continuous skirt connected to the cryostat at its upper endand at its lower end to a circumferentially continuous corbel-type steel structurebase plate which is fixed by anchor bolts to the vertical bioshield. The tokamakgravity support legs bolt onto locally machined abutments in a circumferentiallycontinuous thick structural annulus. This annulus surmounts the ring pedestalwhich comprises two concentric shells 40 mm thick 670 mm apart, joined by ribs.The annulus and the two 40 mm shell portions above the interface are part of thecryostat lower head and will be prefabricated with it, being joined with the lowerportion of the ring pedestal by butt-welding in the field preparation area to forma complete ring pedestal. The ring pedestal is then lowered into the pit andbolted to the anchor bolts already embedded in the concrete basemat. Theinnermost CS support ring pedestal is similar to the gravity support ring pedestalbut of lighter design on account of the lower loads.
4.5.1.4 Assembly and installation of the cryostat
To minimize the total cost of procurement and installation, as much shopfabrication as feasible will be done, of segments of maximum size while stillconforming to the transport requirements.
There are eight, pie-shaped outer lower head segments of 30° and four, pie-shaped inner lower head segments of 90° and one, on-axis, circular inner lowerhead subassembly including the CS support ring pedestal. The outer and innerlower head floor sectors are joined together in the field preparation area to formthe annular sub-assemblies which are then lowered into the pit. The outer sub-
FDR-ITER Plant Design Description Chapter II-Section 4.5-Page 5

assembly is welded there to the gravity support ring pedestal. The inner sub-assembly is welded to the gravity support ring pedestal and CS support ringpedestal already installed.
The cryostat cylinder is pre-fabricated in ten circumferential segments of 36° each.Also, each 36° element is segmented vertically into three pieces, with joints at11.255 m from the cylinder top and 6.715 m from the bottom. These upper, midand lower cylinder segments are joined together in the field preparation area toform a cylindrical sub-assembly which is then lowered into the pit and welded tothe previously installed segment.
The upper head will be segmented into five, pie-shaped segments of 72°containing peripheral access ports, and one circular inner upper headsubassembly. These segments are joined together in the field preparation area toform a circular sub-assembly which is then lowered into the pit to close thecryostat.
4.5.2 Thermal shields
The vacuum vessel, cryostat, transition and support thermal shields all interceptthermal radiation from components that are at temperatures well abovecryogenic, and therefore emit substantial radiation. The thermal shields breakthe line-of-sight of this radiation, which would go to components at 4 K, and theradiation to 4 K by the shields themselves at a temperature of 80 K is over twoorders of magnitude less. Figure 4.5.2-1 shows the locations of the shields.
The mechanical design of the thermal shields has remained unaltered since theDDR, but some electrical and thermal features have changed. The design hasprogressed from conceptual to the engineering level and thermal, hydraulic andstructural analyses have progressed significantly. An outline assembly procedurehas been developed. The main changes since the DDR are:
i) the toroidal electrical segmentation of the WTS has been increasedfrom 40 to 60 breaks, thereby eliminating a risk of a short circuitbetween adjacent TF coil cases;
ii) the thermal design has been simplified by eliminating the passive foilstack (on the hot side) and replacing it by silver plating on both sides.
Vacuum vessel thermal shield (VVTS) The WTS is located in the narrow spacebetween the vacuum vessel and the toroidal field coils. It includes the shieldsover the vacuum vessel ports and W support legs. It is supported from thetoroidal field coil cases near the equator both inboard and outboard. Thermalcontraction from cooling closely follows that of the toroidal field coils, allowingclearances between the two systems to be very small.
The shield is made up of extruded profiles used as joints between sectors of theshield and plate panel connectors that act as heat transfer fins. The joints contain
FDR-UER Plant Design Description Chapter Il-Section 4.5-Page 6

bolts, electrical insulation, bumpers, and cooling tubes. Two parallel fins connectadjacent joints. The panel on the hot side is thicker than the other because itmust conduct heat laterally to the cooling tubes. The panel on the cold sideblocks residual radiation from the hot side panel. Figure 4.5.2-2 show a crosssection.
The surfaces of the WTS are coated with a low emissivity layer of silver toreduce absorption of heat from the vacuum vessel and radiation to the coils.Most of the coated area is electrodeposited in special tanks. Some of the surfaces,however, may be brush-plated.
There are 80 toroidal joints total, and 60 of them are electrically-insulated, evenlyspaced every six degrees. The other 20 are field joints at the vacuum vessel spliceplate. There are also poloidal electrical breaks at top and bottom. All joints arebolted. Once all the joints have been fastened, the shield is very stiff withdeflection due to gravity in the range of 1.0 mm or less.
The electrical breaks are made with nonmetallic shims, bolt spacers and washersof glass-filled polyimide. This material has enough radiation resistance to lastthe life of ITER. Spring washers retain the bolting force even with the somewhatgreater thermal contraction of this material compared to stainless steel.
Pressurized helium gas is used as the coolant because it is possible to detect leaksusing the existing cryosorption pump. The helium flows in tubes welded intoslots in the joint extrusions. The heat fluxes at the tube walls are a few hundredW / m2 and the heat transfer coefficient provided by low speed helium is morethan adequate.
Cryostat thermal shield (CTS) The CTS is dose to the inner wall of the cryostatexcept for the outer section of the upper cryostat head. This section lies below thetokamak cooling water system (TCWS) pipes that emerge from the vacuumvessel top ports. Doing this eliminates the need for a thermal shield around eachTCWS shroud (guard pipe). The innermost section of the upper head CTS can beremoved with the inner section of the cryostat head.
Figure 4.5.2-3 shows the arrangement of the CTS. It is fabricated in subassemblieswhich are lowered into the pit for final bolting. This shield is made up of acombination of space frames and panels covering the open areas between framemembers. The space frame is a permanent structure and is built up of weldedrectangular stainless steel bars. Cooling tubes are welded to the space frame, oneset of tubes per 18° toroidal sector. The space frame is silver-plated. Therectangular spaces between the frames are covered with stainless steel panels.The panels are attached by thin welds to ensure thermal continuity. They can inprinciple be removed to access the other side by cutting the welds. For panelsthat may be frequently removed, bolting is preferred, combined with springwashers and dip-on flexible copper gaskets for thermal contact. The panels aresilver-plated and also have copper dadding to increase thermal conduction.
FDR-ITER Plant Design Description Chapter II-Section 4.5-Page 7

Because the cladding also increases electrical conductivity, the shield has toroidalelectrical breaks. Twenty breaks are provided to also assure that electromagneticloads are very low. The division of the top, cylinder, and bottom shields intoseparate subassemblies provides the poloidal breaks.
The inner section of the upper CTS is hung from the cryostat upper head. Itcomes out with that part of the head. The outer section of the upper CTS isattached to the TCWS pipe shrouds. This allows complete cryostat head removalwithout disturbing most of the thermal shield.
The cylindrical CTS is hung from the cryostat inner wall with long stainless steelstraps near the top of the equatorial ports. Spacers on the outside of theframework position the space frame during fabrication a set distance from thewall. Once the space frame is toroidally linked, the spacers are not needed, butare retained for added rigidity. When the CTS cools down (the cryostat stays atroom temperature), it moves inward about 50 mm, separating the spacers fromthe cryostat. The lower edge also moves upward 48 mm. This contractionprecludes the direct use of supports at more than one level, without splitting thecylinder heights.
The entire lower CTS rests on the lower cryostat head when at roomtemperature. G-10 blocks provide enough thermal insulation so that conductionlosses during initial cooldown are acceptable. Since the lower CTS is alsosupported at the thermal anchors of the machine gravity supports and CSsupport, it lifts off the lower cryostat head during operation everywhere exceptthe outer edge, which always rests on the head because of its flexibility.
Transition thermal shields (TTS) The TTS bridge the gaps between the VVTSand the CTS. The shields are all similar to the CTS in that they are made up ofspace frames containing the cooling tubes with panels in between. They aresilver-plated with copper cladding as required in the panels to allow wider tubespacing. Figure 4.5.2-3 shows the transition shields.
There are expansion and vacuum pumping gaps between the WTS, CTS, andTTS, as well as between the upper, cylindrical, and lower CTS. The gaps aredesigned so that thermal radiation does not escape into the cold region. In thesegaps, blackened surfaces are used; they are baffled so as not to have a line-of-sightto the cold region. This baffling has large enough openings to pump the spaceon the other side of the shield from the cryopump.
Support thermal shields (STS) The support thermal shields cover the warmparts of the machine main gravity supports and provide the 80 K thermal anchorthat captures heat conduction and prevents it from going to the coils.Figure 4.5.2-3 also shows the support thermal shields with the thermal anchor.
Total masses and heat loads Table 4.5.2-1 shows total thermal shield masses andheat loads for two modes: (1) normal operation with the vacuum vessel outersurface at 100°C, and (2) baking mode with the vacuum vessel at 200°C. Note thatthe baking mode nearly doubles the heat loads to both 80 K and 4.5 K.
FDR-ITER Plant Design Description Chapter H-Section 4.5-Page 8

TABLE 4.5.2-1Thermal Shield Total Masses and Heat Loads
VVTS
CTS
TTS
STS
Totals:
Mass(tonne)
580
336
284
33
1233
Heat Loads (kW)
T08OKOpn
150
80
90
30350
Baking
320
80
160
30
590
To 4.5 K
Opn
1.10.8
0.7
0.12.7
Baking
2.5
0.8
0.9
0.14.3
4.5.3
Cryostat
Assessment of the design
The shape and the main dimensions of the cryostat have been fixed,allocation of the cryostat access ports and penetrations has been specified.
The
Much detailed structural analysis has been performed, including seismic loadingand, as a result, the main components of the cryostat, the chamber shell,penetration shrouds, cryostat supports and bellows provided for the penetrationshave been confirmed to be sound in their design and in accordance to the criteriaunder all envisaged major loading conditions.
The sequence planning of the fabrication at shop, pre-assembling at the fieldassembly area and installation in the pit has been confirmed with the suitablesegmentations of the cryostat at each stage.
Further activity is desirable in the following areas :
(1) penetration local stress analyses (e.g., NB injector ports);
(2) analyses under some remote maintenance conditions (e.g., port plughandling operation);
(3) detail component design suitable for the remote maintenanceoperations;
(4) design of the in-cryostat ice detector system.
Thermal shield
Long-term emissivity data for silver plating already exists, and has been used inthe design. Tests are now underway and the results so far show that theemissivity estimates used in the analyses are appropriate. Further tests to studythe effect of a vacuum vessel water leak are recommended.
FDR-ITER Plant Design Description Chapter II-Section 4.5-Page 9

Structural analysis under most loading conditions and thermal analysis havebeen performed. The following analyses has not yet been completed as of thiswriting:
(1) frequency analysis of all thermal shields;
(2) Buckling analysis under electromagnetic loads of all thermal shieldsexcept the upper and lower CTS;
(3) deflection analysis of the redesigned WTS gravity supports;
(4) VVTS EM load analysis, including Asymmetric VDE analysis with 60electrical breaks;
(5) heat leak analysis for joint gaps, plating flaws, scratches, dust, and ventholes.
FDR-1TER Plant Design Description Chapter 11-Section 4.5-Page 10

FIGURE 4.5.1.1-1Cryostat General Arrangement

18545
FIGURE 4.5.1.2-1Bellows and Cryostat Penetrations (Divertor Cryopump Port)

INNER HEAD
CS SUPPORT
Fig. 4.5.2-1. Location of thermal shields.

X
HERMAL SHLD OUTER WALL
THERMAL SHLD INNEFTWATt-
Fig. 4.5.2-2. Vacuum vessel thermal shield inboard cross section.

limit AND OUTER UPPER
\
LOWED HEAD TS
Fig. 4.5.2-3. Cryostat, transition, and support thermal shields.

INTERNATIONAL THERMONUCLEAR EXPERIMENTAL REACTOR
W4n
TECHNICAL BASISFOR THE
ITER FINAL DESIGN REPORT, COSTREVIEW AND SAFETY ANALYSIS
(FDR)
Chapter IISection 4.6
ITER PLANT DESIGN DESCRIPTION
13 July 1998

CHAPTER IISECTION 4.6
WATER COOLING SYSTEMTABLE OF CONTENTS
4.6 Water cooling system 14.6.1 Function 24.6.2 System configuration 34.6.2.1 Primary heat transfer systems 34.6.2.2 Secondary heat transfer systems .44.6.2.3 Heat rejection system 44.6.2.4 Auxiliary systems 54.6.3 Detailed design description 54.6.3.1 Primary heat transfer systems 54.6.3.2 Heat rejection system (HRS) .114.6.3.3 Auxiliary systems .164.6.4 System performance summary 184.6.4.1 Chemical and volume control systems 184.6.4.2 Decay heat removal 194.6.4.3 TCWS component maintenance 194.6.4.4 In-vessel component bakeout 204.6.4.5 Measures against transients 204.6.4.6 Measures against off-normal events 214.6.5 Assessment of the design 22

4.6 Water cooling system
The UER water cooling system consists of the Tokamak Cooling Water System(TCWS), which itself consists of Primary Heat Transfer Systems (PHTSs) and, ifnecessary, Secondary Heat Transfer Systems (SHTSs), the Heat Rejection System(HRS) and Auxiliary Systems.
The main changes in the system TCWS since the DDR are: (1) the elimination ofthe dedicated backplate primary heat transfer system, (2) the elimination of thesecondary heat transfer system for the divertor cassettes, (3) the reduction in thediameter of main pipe in PHTS loops from 500 A to 450 A, (4) the adoption of anebullience type loop for the vacuum vessel primary heat transfer system (VVPHTS), (5) the redistribution of thermal load considering the port limiter design,and (6) the integration of the chemical and volume control systems (CVCSs) toreduce the number of system components.
The numbers of loops are as in the DDR except for the backplate PHTS andCVCSs. The numbers of loops follow from the limitation of loop inventory toavoid excessive over-pressure in case of leaks either in the vacuum vessel or inthe TCWS vaults. This has allowed a high degree of standardization ofcomponents and pipework in the various systems because similar capacitycomponents can be used.
The main loop components of the PHTSs and CVCSs, except for the VV PHTSand the NB Injector PHTSs, are sited in the annular vaults at the upper andlower pit levels. These two vaults are interconnected by ducts such that theircombined volume is available for expansion of steam during an ex-vessel LOCA.The present design is therefore based on "closed confinement", therebyeliminating any environmental impact in case of an ex-vessel LOCA.
The components for VV PHTS and NB injector PHTSs for the low and highvoltage loops are sited in the reactor hall and the laydown hall, respectively.
Tritium permeation into coolant loops is not expected to be measurable beforethe end of the BPP. When the tritium concentration in the coolant begins tobuild up it will be kept very low by processing in a water detritiation system(Section 4.4). Even if the permeation should turn out to be larger than estimated,this can be efficiently counteracted by increasing, at modest additional cost, theprocessing capacity of the water detritiation system. Latest test data and computercalculations have given enhanced confidence that, in combination with anefficient coolant chemistry control and purification system, the concentration ofactivated corrosion products (ACPs) will be continuously kept at very low levels.It has therefore been decided that the secondary heat transfer system (SHTS) forthe divertor cassettes should be eliminated. The SHTSs for test blanket modulesmay be kept for a variety of reasons including the incompatibility between waterand the primary coolant (in the case of liquid metal), and enhanced tritiumpermeation through a heat exchanger due to relatively high primary coolanttemperatures.
FDR-ITER Plant Design Description Chapter H-Section 4.6-Page 1

In the present design, the coolant inlet temperature for all in-vessel componentsduring the tokamak pulse and dwell period is 140°C. This brings the inlettemperature in line with that of the divertor cassettes and has been selected toavoid excessive neutron-induced loss of ductility in copper and copper alloys,which occurs when the material is irradiated below 140°C. On the other hand,the inlet temperature during short term standby and short term maintenanceperiods shall be kept above 120°C to prevent re-absorption of impurity gases bythe first wall.
A complete preliminary thermohydraulic redesign for the primary heat transfersystems, as well as dimensioning the main components and performing thelayout of the systems in the upper and lower vaults and surrounding areas hasbeen carried out since the DDR.
The heat rejection system was re-configured to reduce the total number of mainpipe headers and main circulating pumps. In the revised design, five PFW/IBBPHTS loops transfer heat to the circulating water from one main header with twomain pumps (50% x 2) instead of two-to-one configuration previously. TwoPFW/OBB loops plus DIV/LIM PHTS loops transfer heat to one main headerwith two main pumps (50% x 2). This configuration conveniently divides into asymmetric east-west arrangement with two east headers and two west headers.This arrangement reduces cost, increases reliability and reduces operatingcomplexity. Another cost-saving modification from the DDR design is the use ofcirculating pump motors with pole change capability to enable the main pumpsto change to low pump speeds during low flow operation (including the case ofloss of the site power). This enables elimination of separate low flow pumpswith associated piping and valves. The pumps will be installed in the east-westTokamak service building as the DDR design. It should be noted that in theevent of a single main pump trip, the remaining pump will supply sufficientflow to maintain the return temperature to less than 90°C and, thus, preventboiling.
4.6.1 Function
The water cooling system has the following functions:
• remove the heat deposited in the in-vessel components and vacuumvessel during a plasma pulse, and exhaust it to the environment;
• control the coolant temperature, flow rate and pressure for the in-vessel components and vacuum vessel during normal operation asrequired;
• remove decay heat from the in-vessel components and the vacuumvessel after plasma shutdown;
• provide the ability to bake the in-vessel components and the vacuumvessel;
FDR-UER Plant Design Description Chapter II-Section 4.6-Page 2

• provide safe confinement of the radioactive inventory of the coolant;
• confine radioactive materials from the torus following any failure ofin-vessel component boundaries;
• remove the heat from auxiliary components;
• measure heat removed from the in-vessel components and vacuumvessel to contribute to the determination of the overall fusion powerbalance.
4.6.2 System configuration
The water cooling system comprises all systems necessary to remove the heatfrom the ITER plant during plasma operation and dwell periods, as well as fromauxiliary components of the ITER plant, and exhaust it to the environment.Total heat to be removed is estimated to be approximately 2.6 GW during aplasma burning pulse (see Table 4.6.3.2-1), including heat from auxiliarycomponent cooling systems, site utilities, etc. This amount of power includesnot only plasma fusion power but also that generated by neutron multiplicationin the vessel systems, and pump power etc. As such, the water cooling systemcomprises a number of closed primary heat transfer systems (PHTSs), as well asthe heat rejection system (HRS), together with various auxiliary systems. Theoverall water cooling system is depicted in Figure 4.6.2-1. Due to the normalITER duty cycle, the average power to be exhausted to the environment is only1300 MW.
4.6.2.1 Primary heat transfer systems
Design and configuration of the loops for the PHTSs serving in-vesselcomponents are largely based on application of components developed fornuclear applications. There are, however, two factors that impose specialdifficulties on the design. The first is the desire to fit the loops inside the upperand lower vaults without having to increase the radial width of these areas. Thishas some negative impact on maintenance access, as shown in an initial study.The second is given by the fact that standard ITER operation will be in a pulsedmode. In the pulsed mode the coolant temperatures, pressures and flow rateshave to be controlled within certain ranges. These ranges are determined by anumber of limiting parameters including a minimum coolant inlet temperature(140°C) and establishment of coolant temperature, pressure and flow conditionsthat guarantee a safe margin from critical heat flux at any location inside thecomponents that are cooled, as well as avoiding excessive thermal stresses in thein-vessel and ex-vessel loop components.
Temperature control is achieved by controlled bypassing of the heat exchanger.During a plasma pulse, the coolant exit temperature follows the powerdeposition profiles of the in-vessel components, delayed by the thermal inertia ofthe components subject to transient temperature conditions. During burn time,
FDR-ITER Plant Design Description Chapter II-Section 4.6-Page 3

therefore, up to the full primary coolant flow may be routed through the heatexchanger, raising the temperature of this component. During dwell time, theinlet temperature to the in-vessel components has to be held at nominally 140°C.This requires full bypassing of the heat exchanger, except for any small heat loaddue to decay heat and pumping power. The heat exchanger will therefore becooled down to approximately 35°C, the temperature of the heat rejection watersystem. Temperature changes in the coolant lead to concomitant volumechanges which are accommodated by the pressurizer. The pressure change in thesteam type pressurizers corresponding to the water surge due to the volumechange is controlled by the use of spray and heaters in the pressurizer.
The VV PHTS has a safety role in that it provides the ultimate decay heatremoval for all in-vessel components should the other PHTSs not be available.For this reason, the VV PHTS is required to have a passive heat removalcapability, i.e., by means of natural convection. The ebullience type loop isadopted to enhance the natural convection capability. The coolant in theebullience pipe above the W exit flushes forming bubbles, and the steam formedin the ebullience pipe is separated in the steam separator which is located at thetop of the ebullience pipe. The separated steam is condensed in the air-cooledheat exchangers maintaining the steam separator pressure at 0.1 MPa duringpulse operation, and the separated water is recirculated with condensed water bythe motor driven pump. This pressure control results in temperature control atthe VV inlet at 100°C corresponding to the saturation temperature. Theformation of bubbles in the ebullience pipe causes a higher driving force for thenatural convection as the static head difference between flow and return pathsbecomes higher.
The PHTSs also provides the baking function of the in-vessel components(240°C) and the vacuum vessel (~ 200°C). Due to the build-up of ACPs andpermeation of tritium through the first wall into the coolant, the coolant in thePHTSs, especially the loops serving the first wall including baffles, as well as thedivertor and limiters, may gradually become radioactive. To keep the activity toacceptably low levels, the affected PHTSs may be connected to chemical andvolume control systems (see Section 4.6.3.3.1) as well as to a water detritiationplant (see Section 4.4.4 'Tritium Plant").
4.6.2.2 Secondary heat transfer systems
The SHTSs are planned to be used as intermediate loops between the PHTSs onlyfor some test blanket module and the HRS.
4.6.2.3 Heat rejection system
The HRS provides the final heat sink for ITER site heat loads, and is divided intotwo sub-systems, the circulating water system (CWS) and an ultimate heat sink,which is presently considered to be the cooling tower (CT). Water is provided ata maximum temperature of 35°C and returned at a maximum temperature of75°C. The CT system consists of a hot basin, cooling tower array and cold basin.
FDR-1TER Plant Design Description Chapter II-Section 4.6-Page 4

The hot basin has a volume equal to the integrated flow through one nominalpulse. The cooling tower array consists of three cooling towers with five cellseach. The cold basin volume is set by the makeup requirements for ten nominalpulses or about 41,000 m3.
The HRS has two operating modes, high-flow and low-flow, which establish thekey design features and parameters. The high-flow mode corresponds to theITER plant plasma operation state, when the HRS rejects fusion-generated heat,in addition to heat from the component cooling and chilled water systems. Thelow-flow mode corresponds to states when the HRS rejects tokamak decay heatin addition to component cooling and chilled water system heat.
4.6.2.4 Auxiliary systems
The heat transfer system includes various auxiliary systems such as the chemicaland volume control systems (CVCSs), draining and refilling systems, and dryingsystem.
The main functions of the CVCSs are the control of coolant chemistry and thepurification of coolant during operation. The main components of the CVCSunits are located adjacent to the loops they serve.
Draining and refilling systems for the PFW/IBB, PFW/OBB, DIV/LIM and NBinjector PHTSs include storage tanks having sufficient capacity to hold the totalcoolant charge. The drying system has been conceptually designed to allowcertain leak test and localization operations.
4.6.3 Detailed design description
4.6.3.1 Primary heat transfer systems
The design choice for the in-vessel component PHTSs was largely motivated bythe selection of large numbers of loops, and this allows standardization amongcomponents. The main design changes made since the DDR are steam typepressurizers connected to the cold leg, U-tube heat exchanger with the primaryfluid on the shell side, independent cage type glove valves as the control valves,and the reduction in the diameter of main pipe in PFW/IBB, PFW/OBB,DIV/LIM and NB injector (low voltage) PHTS loops from 500 A to 450 A. TheNB injector PHTSs for low and high voltage are similar to those for the in-vesselcomponents except the pressurizer type and its location. The gas (helium) typepressurizer is adopted for the NB injector PHTSs and connected to the hot leg.
The W PHTS is changed to an ebullience type configuration considering itsspecial role as ultimate heat sink. The ebullience in the pipe enhances naturalconvection in the off-normal condition.
FDR-ITER Plant Design Description Chapter II-Section 4.6-Page 5

4.6.3.1.1 Primary first wall and divertor PHTS
Each primary first wall and inboard baffle (PFW/IBB) PHTS loop serves themodules in two adjacent vacuum vessel sectors, leading to 10 loops in total.Routed between the upper vault and odd number vertical ports of the vacuumvessel are 18 feed and 18 return pipes to the in-vessel module manifolds and onefeed and one return pipe to the blanket shield plug. All pipes are containedwithin evacuated guard pipes of approximately 1.6 m diameter that terminate inthe vault and include a rupture disc to discharge, in case of a leak, any excesspressure into the vault. The guard pipes are being designed for internal pressureof 0.26 MPa and 0.2 MPa external pressure (commensurate with the maximumpressure as a result of pipe rupture). The guard pipes also contain the returncoolant lines from the vacuum vessel, the helium purge lines to be used in thebreeding blanket modules, and gas puffing lines. The two feed and two returnpipes to the in-port components are routed from the upper vault down throughpipe shafts, located between ports, to the equatorial ports.
TABLE 4.6.3.1.1-1Loop Parameters for PFW/IBB, PFW/OBB and DIV/LIM PHTSs
Thermal Power/ LoopCoolant Inlet Temp.Coolant Outlet Temp.Coolant Inlet PressureIn-Vessel Pressure DropIn-Vessel WaterHoldup/LoopNumber of LoopsFlow Rate/LoopLoop Pipe InnerDiameter[l]
Pressure Drop[2JTotal WaterHoldup /LoopPumping Power/LoopPump Size[3]
Heat Exchanger-HX Size
-Heat Transfer Surface-U-tube Number-Primary Water Holdup-Empty Weight[4]
Pressurizer Size
PFW/IBB PHTS
146 MW140 °C191 °C3.8 MPa0.64 MPa
11.5 m 3
10654 kg Is419.2 m
-1.3 MPa
-48 m 3
1.45 MW-3.0 m-D x -6.0m-H
2.2 m-D x6.2 m-H960 m 2 /Loop2375/ Loop9.4 m 3
39.6 tonnes1.9m-Dx5m-H
PFW/OBBPHTS
150 MW140 °C192°C3.8 MPa0.55 MPa
8.7 m 3
4670 k g / s419.2 m
-1.2 MPa
-55 m[3
1.4 MW~3.0 m-D x -6.0m-H
2.2 m-D x 6.2 m-H975 m 2 /Loop2372/Loop9.5 m 3
40.0 tonnes1.9m-Dx5m-H
DIV/LIM PHTSwithout port
Hmiter100 MW140 °C177 °C4.2 MPa1.7 MPa
11.5 m 3
2625 kg Is419.2 m
-2.4 MPa
-50 m 3
2.5 MW-3.0 m-D x -6.0m-H
2.1 m-D x5.4 m-H743 m2 /Loop2247/Loop7.7 m 3
33.1 tonnes1.9m-Dx5m-H
DIV/LIM PHTSwith portlimiter
110 MW140 °C177 °C4.2 MPa1.7 MPa
12.1 m 3
2705 kg /s419.2 m
-2.4 MPa
-51 m 3
3.0 MW-3.0 m-D x -6.0m-H
2.1 m-D x~5.7m-H803 m2 /Loop2247/Loop8.1m3
34.7 tonnes1.9m-D x 5 m-H
[1] Fluid velocity: v = approx. 5.4 m / s (PFW/IBB), 5.5m/s (PFW/OBB), 5.7m/s (DIV/LIM)[2] Total pressure drop including in-vessel components, heat exchanger and piping[3] Includes motor height{4] Weight does not include shielding
FDR-ITER Plant Design Description Chapter II-Section 4.6-Page 6

The main loop parameters of PFW/IBB PHTS, together with Primary FirstWall/Outboard Baffle (PFW/OBB) and Divertor/ Limiter (DIV/LIM) PHTSs, arelisted in Table 4.6.3.1.1-1 and the PFW/IBB PHTS flow diagram for the pulseoperation state is shown in Figure 4.6.3.1.1-1.
The loop layout allows either full or partial draining of the loops to allowmaintenance and repair, including replacement of specific components (seeSection 4.6.4.3). Drain tanks for the PFW/IBB PHTS are located inside the galleryarea — outside the pit. The tanks will be used not only for storage of loopinventory during maintenance, but also for storage of the loop expansion coolantwhen the loop is heated up to baking temperature.
During loss of off-site power or loss of flow in CAT II events, small pump unitsare automatically switched to Class III (emergency AC) power for removal ofdecay heat to preserve material properties. Furthermore, these pumps will beused for maintaining coolant circulation during non-operation periods. Theadoption of the port limiter results in almost identical loop parameters for thePFW/OBB PHTS and the PFW/IBB PHTS (see Table 4.6.3.1.1-1). The loopcomponents are located in the lower TCWS vault.
The port limiter modules are integrated with two loops (among four) of thedivertor cooling system because their thermal duty and material are similar tothe divertor. The loop components for the divertor loops are located in thelower TCWS vault together with the PFW/OBB loops.
4.6.3.1.2 Vacuum vessel (VV) PHTS
The W PHTS is divided in two loops, each connected to alternate sectors.Coolant to the VV closure plates at the divertor and equatorial levels isconnected in parallel with the W sectors, such that the closure plates of a sectorare connected to the manifold serving the same W sector. Each of the two loopsis designed to be able to remove the total heat load of the vacuum vessel.
The large height difference between the vacuum vessel and the heat sinktogether with the ebullience pipe in the hot leg side promotes naturalconvection.
Each loop is designed to remove the total decay heat load one day after the lastplasma pulse (3 MW) and to cool down the W to about 80°C within three daysby natural convection. In case of failure of a complete loop, the other loop cansatisfy the safety limits, providing 100% redundancy.
The W coolant feed pipes penetrate the cryostat inside the divertor ports, onefeed pipe per sector of approximately 90 mm diameter. The return pipes areconnected to the vertical ports and exit the cryostat inside the guard pipes of thePFW/IBB PHTS coolant lines. The pipes of each loop are manifolded, into ringheaders, inside the upper vault.
FDR-ITER Plant Design Description Chapter H-Section 4.6-Page 7

The main pipes from the manifolds are routed through the upper vault andreactor hall to the top of the tritium building and electrical termination building.The main loop components, including the pump, pressurizer/steam separatorcombined with ebullience pipe, and electrical heater, are located inside thereactor hall alongside the east and west walls. The steam-to-air heat exchangersare located on top of the buildings.
The main loop configuration is based on uninterrupted pipes leading from thereturn manifolds to the external heat exchanger and back again to the feedmanifold. The valves in the main loop of the steam-to-air heat exchanger arefail open. A non-return valve is provided in the bypass line for the maincirculating pump, so that natural convection is ensured in case of pump trip.This ensures that under loss of power events, the loop automatically switches tothe natural convection mode.
The temperature of neutral beam injector ducts liners should be the same as theW temperature, and therefore the NB injector duct liners are cooled throughthe W PHTS rather than through the NB injector PHTSs. A separate feed pipeis connected from the W PHTS lines upstream of each distributor to threebranched lines connected to the NB injector ducts. The return pipes are joinedagain to one return pipe. The return pipe is routed to the tokamak hall, where itis directly connected to the pressurizer.
During normal operation, forced circulation is used to maintain flow rate above40 kg/s for all operation modes. An air flow damper for the steam-to-air heatexchanger and a steam flow control valve located at the outlet side of the HX areused to maintain the pressure at 0.1 MPa under which no boiling in the vacuumvessel is foreseen. During off-normal conditions, each W PHTS loop has thecapability to remove a 3 MW maximum decay heat load and to cool down theW passively. During baking, the operating pressure setting at the pressurizer ischanged to 1.5 MPa, corresponding to the saturated pressure at the bakingtemperature of 200°C.
The VV walls will form the first barrier between the plasma and externalenvironment, and hence the pressure boundary of the VV PHTS (pipework etc.)will form the secondary barrier. Consequently, the W PHTS does not have tobe secondarily contained, so that the HXs and other loop components can bepositioned outside the TCWS vaults. The loops will, of course, be instrumentedto monitor the coolant activity.
The units for the W PHTS are located above the upper vault, alongside the wallof the tokamak hall.
The main loop parameter for the W PHTS are given in Table 4.6.3.1.2-1.
FDR-ITER Plant Design Description Chapter II-Section 4.6-Page 8

TABLE 4.6.3.1.2-1Loop Parameters for VV PHTS
Thermal Power/ LoopCoolant Inlet Temp.Coolant Outlet Temp, forVessel.
Coolant Outlet Temp, for NBducts linersCoolant Pressure (at pressurizer)In-Vessel Pressure Drop
In-Vessel Water Holdup/Loop
Number of LoopsFlow Rate/ LoopLoop Pipe Inner Diameter [1]Pressure Drop [2]Total Water Holdup/Loop [3]
Main Pumping Power/LoopDesign TemperatureDesign PressureCirculation Pump SizeHeat Exchanger [4]-Size-Heat Transfer Surface
HeaterPressurizer-Separator Size
Drain tank
NormalOperation2.25 MW [5]100 °C109 °C
103°C
0.1 MPa
3xlO-3 MPa/0.15MPa[6]
-250 m 3
2 Loops93.2 kg/s [7]0.200 m-0.6 MPa
-295 m 3
-110 kW
Off-NormalOperation3MW-100°C-111°C
-100°C
0.1 MPa7xlO-3 MPa
-250 m 3
2 Loops-65 kg/s [8]0.200 m0.1 MPa
~295m3
-
BakingOperation(2.6 MW) [9]-200°C-200°C
-200°C
1.5 MPa3xlO-3 MPa/0.15MPa [6]
-250 m 3
2 Loops93.2kg/s[7]0.200 m- 0.6MPa
~295m3
-110 kW205 °C2.75 MPa (maximum)1.03 m x Z7 m x 1.075 m-H
2.5 m-L x 7 m-W x 9.7m-H/sector x 12sectors11,160 m2 /Loop (12 sectors)0.95 m-Dx 4.4 m-L
3.3m-Dx6.5m-L(51m3)3 m-D x 7.5 m-L
[1] Fluid velocity : v = approx. 3.1 m/ sec for Normal Operation[2] Total pressure drop including in-vessel components, heat exchanger and piping[3] Assumed holdup water in pressurizer /steam separator: 38 m3 at STS[4] Air Cooled Type HX / Condenser[5] 1.5 MW for W and 0.75 MW for NB injector ducts[6] 0.003 MPa for W and 0.15 MPa for NB injector ducts[7] 40 kg/s for W a n d 53.2 kg/s for NB injector ducts[8] 65 kg/s for W = the flow rate of the bypass line of the circulation pump + the flow rate
of NB injector line (reverse Bow with natural circulation)[9] Heater Capacity
4.6.3.1.3 Neutral beam injector (NB injector) PHTSs
There are 2 PHTSs for the NB injectors: a "low voltage" PHTS serving the beamline components and a "high voltage" PHTS serving the NB injector source.
Three NB injectors are connected to the NB low voltage PHTS. This loopoperates at relatively low pressure and low temperature operating conditions.
FDR-ITER Plant Design Description Chapter H-Section 4.6-Page 9

The inlet pipe of the main coolant line is connected to a distributor, from whichbranch lines are connected to the separate cooling lines of the calorimeter andsub-distributor for each NB injector. The return collector is connected to the heatexchanger and pump, located in the laydown hall, through the gallery. A bypassline around the main pump, • and a stop valve with intermediate openingdownstream of this bypass line, are provided for trickle flow to reduce erosion ofthe Cu material in the NB injectors, during standby.
The NB (low voltage) PHTS data are summarized in Table 4.6.3.1.3-1.
TABLE 4.6.3.1.3-1Main Data for NB (Low Voltage) PHTS
Thermal PowerCoolant Inlet Temp.Coolant Outlet Temp.Coolant PressureNB injector Pressure DropNB injector Water HoldupNumber of LoopsFlow RateLoop Pipe Inner Diameter [1]Pressure Drop [2]Design TemperatureDesign PressureTotal Water HoldupPumping PowerPump Size (Horizontal type)Heat Exchanger-HX Size-Heat Transfer Surface-Tube Number-Primary Water Holdup-Empty WeightPressurizer -Type-Size-Water Holdup
100 MW (at Conditioning)80 °C109° C2.0 MPa1.0 MPa5.8 m31828 kg / s428.6 mm1.6 MPa135 °C2.5 MPa70 m32.1 MW3m-Dx 6m-L
2.6 m-D x 8.3 m-H2268 m21760 (U-tube)21,1 m395 tonnesPneumatic type1.6 m-D x 5.0 m-HIm3
[1] Fluid velocity : v = approx. 6.0 m/s[2] Total pressure drop including NB injectors (1.0 MPa), Heat exchanger and piping
The NB (high voltage) PHTS loop, uses relatively low temperature operatingconditions with low water hold-up (see Table 4.6.3.1.3-2). Its configuration issimilar to the "low voltage" loop with the main equipment located in thelaydown hall.
Temperature control is achieved by controlled bypassing of the heat exchangers.Furthermore, a minimum flow line with a small control valve is provideddown stream of the heat exchangers to keep the required tolerance window of theinlet temperature of the NB injector sources for expected partial heat load ofapproximately 10% of full heat load.
FDR-ITER Plant Design Description Chapter II-Section 4.6-Page 10

The CVCS system and the drain and refilling system are common for the two NBPHTSs.
TABLE 4.6.3.1.3-2Main Data for NB (High Voltage) PHTS
Thermal PowerCoolant Inlet Temp.Coolant Outlet Temp.Coolant PressureNB source Pressure DropNB source Water HoldupNumber of LoopsFlow RateLoop Pipe Inner Diameter [1]Pressure Drop [2]Design TemperatureDesign PressureTotal Water HoldupPumping PowerPump Size (Horizontal type)No. 1 Heat Exchanger-HX Size-Heat Transfer Surface-Tube Number-Empty WeightNo. 2 Heat Exchanger-HX Size-Heat Transfer Surface-Tube Number-Empty WeightPressurizer -Type-Size-Water Holdup
12 MW (*3)30 °C70° C2.0 MPa0.9 MPa1.5 m3172 kg /s [3]151mm1.4 MPa90 °C2.5 MPa11 m3110 kW1.0 mx 2.4 m xl.2mHShell & Tube (Straight tube)1.43 m-Dx 10.5 m-H1140 m2245737 tonnesShell & Tube (Straight tube)0.87m-Dx5.5 m-H137 m26746.2 tonnesPneumatic type0.9 m-D x 2.1 m-H0.2 m3
[1] Fluid velocity: v = approx. 4.1m/s[2] Total pressure drop including in-vessel components, heat exchanger and piping[3] According to latest interface conditions, thermal power of 12.3 MW and flow rate
of 75 kg/s are required by NB (HV). These latest requirements will be consideredin EDA extension.
4.6.3.2 Heat rejection system (HRS)
The heat rejection system provides the heat sink for ITER site heat loads.Figure 4.6.3.2-1 shows the overall system concept with supply lines to identifiedclient heat loads. The HRS is divided into two sub-systems, the circulating watersystem (CWS) and the cooling tower (CT).
The heat load list for the system design is given in Table 4.6.3.2-1.
FDR-ITER Plant Design Description Chapter II-Section 4.6-Page 11

TABLE 4.6.3.2-1Heat Load List
Heat Source
Total heat dissipated from plasma to in-vessel components
PFW/IBB (peak)PFW/OBB (peak)DIV/LIM (peak)
NB injectorsLow VoltageHigh Voltage [1]NB injector PHTS CVCS
Component cooling water system [2]East Tokamak ZoneWest Tokamak ZonePower Supply ZoneSite Service Zone
Chilled water systemEast Tokamak ChillerWest Tokamak ChillerPower Supply ChillerHot Cell ChillerSite Service ChillerSafety Related Chiller
MiscellaneousCryoplant CompressorCVCS
Total
Heat (MW)
2200 MW [3]
(1460 MW)(600 MW)(420 MW)
112.1 MW(100 MW)(9MW)
(3.1 MW)
187.8 MW(3.4 MW)(64.6 MW)
(117.8 MW)(2.0 MW)
49.8 MW(16.4 MW)(5.6 MW)(5.1 MW)(9.5 MW)(11.7 MW)(1.6 MW)66.3 MW
(53.9 MW)(12.4 MW)
2616.0 MW
Notes:[1] Total NB injector Heat Load is 12 MW. The other 3 MW is
included as the chilled water system load in the chillersystem for the East Tokamak zone.
[2] Including both ECH&CD and ICH&CD systems.[3] Including 100MW of additional heating input.
4.6.3.2.1 Circulating water system (CWS)
The CWS delivers feed water at a maximum of 35°C from the cold basin to theclient systems. The elevation drop from the cold basin to the -7.0 m level issufficient to allow gravity flow with adequate suction head at the supply pumps.Two "return" penstocks deliver the heated water from the east and west pipinggalleries to the hot basin. Individual cooling water circuits within the tokamakbuilding complex draw water from a feed penstock and deposit the heated waterin the return penstock with sufficient remaining head to overcome the elevationhead to the hot basin.
FDR-ITER Plant Design Description Chapter II-Section 4.6-Page 12

The circulating water loops which remove heat from the component cooling andchilled water systems serving the hot cell, radwaste and site service buildings arefed directly from the cold basin and return water directly to the hot basin.
Table 4.6.3.2.1-1 identifies the main CWS parameters.
TABLE 4.6.3.2.1-1CWS Supply Circuits
Circulating Water SystemSub-System(CWS SS)
PFW/IBB CWS SS- Main headers- Final Branches
PFW/OBB & DIV/LIMCWS SS
- Main headers- Final Branches
(PFW/OBB)(DIV/LIM)
Additional heating CWS SS- Main header- Final branches
(NB injector LV)(NB injector HV)(NBIPHTSCVCS)
Component cooling water CWSSS and Miscellaneous coolingsystem
East Tokamak BuildingWest Tokamak BuildingPower Supply ZoneHot Cell BuildingSite Services Building
Chilled water systemCWS SS
East Tokamak BuildingWest Tokamak Building
Power Supply ZoneHot Cell BuildingSite Services Building
Safety Related Chiller
Cryoplant compressor CWS SS
CVCS CWS SS
No. ofSupplyLines
210
2
4221
111
111
1
12
Line HowRatekg/s
4360875
3050
870600650
800
59021030
359101800
90
56019017532540055
2580
60
Pipe IDurn
1300600
1100
600500500
550
500250100
100700850
180
500250250350400150
1000
150
PumpPowerkWe
1165x2
815x2
250
10x2250x2410x2
35
170605510012217
500x230
The penstocks are prestressed concrete and the supply and return line pipe is cladsteel (2 mm stainless steel). Both have a maximum pressure rating of 1 MPa.
FDR-ITER Plant Design Description Chapter II-Section 4.6-Page 13

Flow during the high-flow mode is produced by the main pump. During thelow-flow mode, the pole number is changed such that one of two pumps operateat half speed and deliver approximately 25-30% flow for normal decay heatremoval.
The inlet and outlet pipes of the PFW/IBB, PFW/OBB, DIV/LIM PHTSs andCVCSs loops have isolation valves at the outside of the upper and lower HTSvault walls. These valves and the pipe stub to the wall penetration form anintegral part of the vault confinement boundary. A relief valve is located insidethe vault to relieve over-pressure to a blowdown tank in the vault.
4.6.3.2.2 Cooling tower (CT)
The CT rejects heat from the CWS to the atmosphere through forced draftcooling towers and returns cooled water to the CWS at a maximum temperatureof 35°C. An important factor for the design of cooling towers is the wetbulbtemperature. After review of meteorological data for cooling tower design, thedesign wet bulb temperature was set at 28°C. The value encompasses the 5%design condition (meaning that the 28°C condition on the average is exceededonly 5% of the time).
A process flow diagram is shown in Figure 4.6.3.2.2-1. The design parameters arederived from a succession of nominal pulses (see Table 4.6.3.2.2-1).
TABLE 4.6.3.2.2-1Cooling Tower System Design Parameters
Design Parameter
Inlet Temperature at Start ofPulse, °CInlet Temperature at Start ofDwell, °CInlet Temperature DuringShutdown, °C
Pulse Flow, kg/s
Dwell Flow, kg/s
Shutdown Flow, kg/s
Hot Basin
65
38
40
22,00022,000
7,500
CoolingTower
45
57
40
22,00022,000
7,500
Cold Basin
33
35
35
22,000
22,000
7,500
The hot basin is made of unlined reinforced concrete and is located below groundwith the water surface at ground level. The hot basin has LxWxD dimensions of80x60x10 m and a volume of 48,500 m3. The penstocks penetrate into the basin atthe -5 m level and discharge through distributors to promote mixing.
Four vertical transfer pumps deliver water from the hot basin to a manifolddistributing water. Each transfer pump is rated at 5.3 m3 /s . Individual lines
FDR-ITER Plant Design Description Chapter II-Section 4.6-Page 14

transfer the water from the manifold to the inlet point of each cooling tower cell.These points are located at 21.0 m level of the cooling towers.
The hot basin outflow must be equal to the inflow from the CWS in order tomaintain constant level. This is accomplished by three bypass lines from thedistribution manifold to the hot basin. The bypass valves are controlledsequentially to maintain a constant basin level.
Each of the five cells per cooling tower has a constant speed fan and inlet waterflow connection. Flow through a cell is separate from other cells. The towerstructure is constructed from prestressed concrete. Table 4.6.3.2.2-2 shows themain cooling tower design parameters:
TABLE 4.6.3.2.2-2Cooling Tower Design Parameters
Parameter
Wetbulb Temperature, °CInlet Temperature, °COutlet Temperature, °CNumber of TowersHeight to Top ol Fan Deck, mTower width (across flats), mCells per TowerFans per CellFan Radius, mFan Power, kWeFan Diffuser Height, m
Value
28
5335
321
46
5
1
10320
7
The towers are located above the reinforced concrete cold basin. The functions ofthe cold basin are:
• collect water from the cooling towers;
• provide water storage for losses during sustained pulse operation;
• provide a small amount of mixing to maintain a maximum CWStemperature of 35°C.
The cold basin is made of unlined reinforced concrete, with the water surface atgrade level. The LxWxD dimensions are 189x46x5.1 m and the volume is41,000 m3. The cold basin volume was set equal to the makeup requirements forten nominal pulses shown in Table 4.6.3.2.2-3.
FDR-ITER Plant Design Description Chapter II-Section 4.6-Page 15

TABLE 4.6.3.2.2-3Water Losses During One Day of Nominal Pulse Operation
DriftEvaporationBlowdownTotal
Average Rate(kg/s)
1.11,250
415
1,700 (design value)
Total for10 Pulses (t)
31
27,500
9,140
37,400
Evaporation losses result in concentration of dissolved solids in the coolingwater. The dissolved solids concentration is limited to 2000 ppm by a blowdownline which transfers water from the basin to the industrial sewage system. Thiswater should be monitored prior to discharge to the sewage system. Aconcentration factor of four was assumed. Makeup is supplied from the rawwater system.
A small degree of CWS and cooling tower water chemistry control will beaccomplished through addition of corrosion inhibitors and biocides to the coldbasin.
Taking sea water or cooling towers as the final heat sink depends on selected siteconditions. However, even if sea water is selected, a similar system design andoperation can be expected by the additional indirect cooling loops between PHTSsand sea water sink.
4.6.3.3 Auxiliary systems
The auxiliary systems that are integrated with the design of the heat transfersystems include the chemical and volume control systems (CVCSs) and draining,refilling and drying systems. Furthermore, gaseous and liquid waste will have tobe processed before environmental release.
4.6.3.3.1 Chemical and volume control systems (CVCSs)
The chemical and volume control systems comprise two separate unitsconsisting of pipework, valves, instrumentation, pumps, heat exchangers, tanks,filters and resin beds for all the primary heat transfer systems.
The main functions of the CVCSs are summarized as follows:
• control of the coolant chemistry during all modes of operation in orderto suppress radiolysis, inhibit corrosion, and decontaminate the wettedsurfaces;
• purification of coolant by removing activated corrosion products(ACPs);
FDR-ITER Plant Design Description Chapter II-Section 4.6-Page 16

• extract and return a side stream from the PHTSs loops for detritiationin the tritium plant;
• control of coolant inventory in excess of the volumes that can behandled by the pressurizers.
The processing capacities of the individual CVCS units are determined by themaximum allowable amount of corrosion products that could be released underaccidental conditions (assumed < 10 kg/loop) and the requirement to keep thedose received by maintenance workers as low as reasonably achievable (ALARA).Final determination of the processing requirement for the CVCS units can bemade only after more corrosion data become available from R&D programs thatare presently underway.
The main components of the CVCS units are located adjacent to the loops theyserve. The rationale for locating the units inside the vaults results from the factthat their radioactive inventory requires secondary confinement. Certaincomponents are also considered "high" maintenance items which may causesome release during maintenance preparatory work.
Two CVCSs in the upper vault serve five PFW/IBB PHTS loops, respectively,and also two CVCSs in the lower vault serve four loops of PFW/OBB andDIV/LIM PHTSs, respectively.
All other CVCSs units which do not need secondary confinement are sitedoutside the TCWS vaults. The one for the two neutral beam injector PHTSsloops is located inside the laydown hall, the units for the test blanket modulesPHTSs will be specified once the test blanket module design is fixed.
A simplified process flow diagram of a CVCS unit for PFW/IBB PHTSs is givenin Figure 4.6.3.3.1-1.
4.6.3.3.2 Volume control
The excess coolant resulting from the expansion of the volume during heatingfrom operation to baking temperature, is extracted by the associated CVCS unit tothe drain tanks to be pumped back when the temperature is decreased. During aplasma pulse, the expansion during ramp-up and contraction during ramp-down, is accommodated by the pressurizer.
4.6.3.3.3 Draining and refilling systems
Full capacity drain storage tanks are provided for those loops that may haveradioactive inventories too high for discharge. This includes all the loopsserving in-vessel components and NB injector (high and low voltage). For thevacuum vessel only partial drain storage capacity is available.
Draining will be started only after the coolant temperature has been decreased towell below 100°C and the loop pressure has been decreased to ambient. The drain
FDR-UER Plant Design Description Chapter II-Section 4.6-Page 17

storage tanks are not pressurized coolant containers but are designed for 0.5 MPato accommodate the static head.
For the PHTSs, storage segmentation is based on avoiding the mixing of coolantat different contamination levels. PHTSs storage tanks are located in thetokamak building, outside the vault, either in the gallery area or in the areaunderneath the cryostat, whereas the W drain tanks are located in the tokamakhall.
Refilling is performed with refilling pumps. The drained parts of the loop filledwith nitrogen gas will be evacuated using a water ring pump before refilling.This avoids to a large extent the creation of trapped gas pockets.
4.6.3.3.4 Drying system
The water remaining in the in-vessel components and the VV port must bedried out to perform leak testing of the in-vessel components after maintenance.A drying system commonly used for all components has been designed. Thedrying system has the capability to heat up and evaporate remaining water withnitrogen gas compressed to approximately 2.0 MPa, and to remove evaporatedsteam as drained water using a condenser up to ~0.001 MPa steam partialpressure at room temperature. Drained water is transferred to the drain tanks ofsegregated storage group or to the radioactive waste water processing system inthe tritium plant. Major components of the drying system include a hermetictype blower, electric gas heater, filter with bioshield, cooler, condenser with drainseparator and piping.
The drying system components are located in a dedicated area in the gallery, andconnected to the cooling lines of the in-vessel components, vacuum vessel andNB injectors through the distributors and the collectors of the PHTS loops.
4.6.4 System performance summary
4.6.4.1 Chemical and volume control systems
The CVCSs loops have the following functions:
4.6.4.1.1 Passivation of inner surfaces
This is used to form a protective oxide layer on the wetted surfaces afterinstallation or maintenance, prior to plasma operation, in order to reduce thesubsequent oxidation rate. Oxygen is added to the coolant to promote theformation of stable spinel rich (mixed chromium/iron/nickel oxides) films.
FDR-ITER Plant Design Description Chapter II-Section 4.6-Page 18

4.6.4.1.2 Suppression of radiolysis and inhibition of corrosion
During normal operation, the coolant chemistry will be controlled such that thefurther deposition of oxide layers on top of the stable spinel film is kept low.This is achieved by lowering the oxidation potential, by adding and dissolvinghydrogen in the coolant. Continued circulation will be maintained throughfilters and resin beds to remove suspended and dissolved compoundsrespectively to reduce the concentration of ACPs in the coolant and keep low theplate-out along the loop surfaces.
4.6.4.1.3 Pre-maintenance clean-up
To lower the dose burden to maintenance workers, it is envisaged to carry out anintensive campaign of removal of the deposits of ACPs. The flow rate usedthrough the CVCSs is increased to approximately twice the normal processingrate and the chemistry is changed to remove deposited ACPs by dissolvingoxygen and or hydrogen peroxide into the coolant.
4.6.4.2 Decay heat removal
There is no dedicated decay heat removal system. Instead, this function isperformed by the heat transfer loops, i.e., the complete "train" formed by thePHTSs and HRS, or directly to the environment (eg for the W PHTS). Since theamount of decay heat to be removed is only a small fraction of the nuclear heatload during a plasma pulse, most PHTSs loops employ a low flow pump ofapproximately 10% of full flow throughput, to remove decay heat from the in-vessel components. These pumps are connected to Class 3 power to protectinvestments in case of loss of site power or loss of flow in Cat-II category. Sincecoolant flow stoppage of the HRS leads to the loss of the heat sink, three units ofsmall pumps, also connected to Class 3 power, are included in the HRS design.The role of the W PHTS as the ultimate decay heat removal system, in case allother systems fail, has been described above. To fulfill this role, two fullyindependent loops are employed capable of removing, by natural convection, thetotal ITER decay heat and of cooling down the W to 80 °C within 3 days.
4.6.4.3 TCWS component maintenance
Maintenance for the main in-vessel PHTSs loops, requires entering the vaultsand opening the confinement. A pre-maintenance campaign for the removal ofACPs (see Section 4.6.4.1.3) will precede the opening of the confinement. Theactual maintenance times for the ITER TCWS layout is presently being studied.
During maintenance of the main in-vessel PHTSs loops, the serving CVCS orW PHTS loops can be used to remove decay heat. A thermal contact gas will beestablished inside the vacuum vessel in the form of a nitrogen purge stream.Maintenance of the VV PHTS will normally involve only the componentsinside the tokamak hall and on the tritium plant and electrical termination
FDR-ITER Plant Design Description Chapter II-Section 4.6-Page 19

buildings (because of the air -cooled HXs sited there). Operation of at least oneW PHTS loop should be maintained at any one time.
4.6.4.4 In-vessel component bakeout
The baking of the in-vessel components at 240°C and the VV at 200°C is one ofthe normal operations of the PHTSs loops except NB injector PHTSs. The rate oftemperature rise is limited by the need to keep differential temperatures withincertain limits and dominated by the large thermal capacity of the VV. For thesame reason, the cooldown temperature gradient is also controlled to maintaindifferential temperatures within the permissible range. The length of a bakingcampaign is, however, likely to be dominated by the duration at bakingtemperature, rather than the heating-up and cooling-down times.
Baking will be achieved by heating up the PHTSs coolant water by an electricalheater and a low flow pump while bypassing the heat exchanger.
4.6.4.5 Measures against transients
The heat load of ITER is expected to have a very wide range (i.e., zero to fullpower) and to change between zero power and full power in a short time (i.e.,about 50 s at fusion start up and less than a second at plasma disruption). Thisoperating condition is quite different from that for existing large heat transfersystems. Thermo-hydraulic transient analyses have been carried out confirmingthe validity and specific design of the process control configuration for ITERPHTSs for expected operation conditions.
4.6.4.5.1 Temperature control during ramp-up and power transients
The coolant inlet temperature of in-vessel components is controlled by changingthe flow rate through the heat exchanger and its bypass line by operation ofcontrol valves.
Transient analyses were performed for the operation conditions expected to bemost severe for keeping the required tolerances, such as (a) fusion start up, (b)fusion shut down, and (c) plasma disruption.
Transient analyses for the PFW/IBB PHTS and DW/LIM PHTS have been carriedout. For the PFW/IBB PHTS, the inlet temperature of the blanket is expected tobe controllable within the required tolerances such as 140 +5/-10 °C at burn flattop and 140 +15/-15 °C at ramp up/down by using a combination of fast responsesensors using thin thermowell type thermo detectors (response time of 5 s) withsome proper setpoints of proportional and integral controllers.
As for DrV/LIM PHTS, the results indicate basic feasibility of the control schemewith an orthodox feedback method, though the temperature fluctuations at thebeginning of flat top exceed a preferable range of +5/-10°C slightly in some cases.
FDR-1TER Plant Design Description Chapter II-Section 4.6-Page 20

It is also clear that the combination of feed-forward and feedback methods ispreferable for better temperature control using the information of the signal offusion start up.
4.6.4.5.2 Flow control during ramp-up and power transients
The total flow should remain constant or within an acceptable range during thePlasma Operation State. Deviation of flow rate caused by a change of flowresistance around the HX and its bypass line as a result of the operation of controlvalves is maintained within the allowable range by adoption of a proper controllogic for the independent, cage-type, control valves.
4.6.4.5.3 Pressure control during ramp-up and power transients
A steam type pressurizer with heater and spray is chosen as the reference designfor the PFW/IBB, PFW/OBB and DIV/LIM PHTSs from the view point of layoutspace, radioactive waste gas treatment and safety considerations.
The location of the pressurizer on the inlet side of the vessel is chosen as thereference design from the view point of pressure control, operability andreliability of the PHTSs.
To confirm the feasibility of the steam-type pressurizer, transient analyses for thepressure of the PFW/IBB PHTS have been carried out. Pressure control isperformed by changing the spray flow and heater power in the pressurizer.Controllability of pressure within the tolerance of +1-5% of the operatingpressure of about 4 MPa at the inlet of the blanket has been confirmed with asteam pressurizer volume of 11 m3, a heater of approximately 360 kW and aspray with maximum flow rate of 1 kg/s.
4.6.4.6 Measures against off-normal events
Transient analysis has been carried out in safety studies to confirm that theintegrity of the in-vessel components and ex-vessel loop components issafeguarded with only natural convection of the VV PHTS. Class 3 power isconnected to the low flow pump of in-vessel PHTSs and the circulation pump ofthe W PHTS for investment protection in CAT-II events.
An in-vessel LOCA will trigger a plasma disruption. Cooling will be continuedby the unaffected loops until the temperature is well below 100°C and the loopscan be depressurized. Cooling of the leaking loop will continue until a lowliquid level set point in the pressurizer triggers the pump of that loop to stop.
An ex-vessel LOCA will be detected first by pressure sensors in the vaults, whenthe ejected coolant flashes to steam. This indication will be used to trigger theplasma to shut down and the isolation valves in the associated CWS loop to beclosed to avoid any further contamination of the secondary coolant in case the
FDR-ITER Plant Design Description Chapter II-Section 4.6-Page 21

LOCA is due to a pipe rupture in the heat exchanger. In addition, the coolantactivity on the secondary side of the HXs is regularly measured so that smallleaks that do not lead to a drop in liquid level in the pressurizer, are discovered.It is also foreseen that the measurements of levels of floor drain tanks and /or theequipment drain sump tank and the flow rate of the vault cooler can detect aleakage > lOg/s within 24 h. The transient behaviour of the in-vessel and ex-vessel components has been analyzed under these conditions.
In case of loss of flow caused by a pump trip, plasma shutdown will be initiated assoon as the pump rotational speed has dropped by a certain nominal value. Thelow flow pumps will then be switched on to take over the coolant circulation.
4.6.5 Assessment of the design
The systems and their functions required to accomplish the ITER mission havebeen defined and basic system design has been completed.
The conceptual design of critical components has been established.
It has also been confirmed that the designed systems/components satisfy therequirements from both ITER experimental operation and safety points of view.
In addition to site-specific design, further activity is desirable in the followingareas to improve plant performance and to support a license application.
(1) demonstration and measuring supporting data of natural convectioncharacteristics of W PHTS;
(2) plant operation/control system design (including plant shutdownsequence after off-normal events);
(3) critical component design with loading conditions;
(4) optimization of layout considering installation/maintenance.
FDR-ITER Plant Design Description Chapter II-Section 4.6-Page 22

Mtad Ccolnjj
Load*(HVAC tic.)
e .KSCMMHCoofcnSy*««-2/6 loop*
Figure 4.6.2-1 Overall TCWS Plant

MdnPump
CmCULATIHQWATER lYfTEM
(HSS1 J.A)
-«—6--«—8-
( » * *« • I 4 V0tUM«Canbd SyaUM
PFWJIB8 PHIS (WBS 2.6 Jt)TOTAL HEAT EXCHANGE = USOUW
(146MW / LOOP X10 LOOPS)
Pulse Operatlan State (High Flow Sub-state : Flat Top)
Numtof
Pofrit
How Mm (kolt)lmmemnkm (C»PmsuraMPa)V«toettw (mftlPkM knar Ditfmml
1.6
Inbotrtlnl#l.ouO«t
32.8 / 32.8140 / 181
3.80 / 3.18S.5 ( S.«
&0.2 / SO 2
2 . 7
Outbewd latentIntel, outt«t
27.0 / 27.0140 / 1S1
3.00 / 3.164.« 1 4.B
90.2 / 90S
3. 8
Outboard otnttrinltt.outl«t
35.0 / 36.0140 / 191
3.80 / 3.18s.ft i e.a
90S 1 ftO.2
4.fi
In-port eomponantlnMt.outl«t
45.0 / 45.014O / 181
3.80 / 3.167.6 ( 8.0
90.2 / 90.2
5. 10
Bank* thMd pluglnt»t,oufl«t
-0 / -0140 / 191
3.80 / 3.18-0 1 -0
» . 2 / 90.2
11
Coteett*outtal
654(912.975.4
12
Hwt«xcNng*rkdHoutM (PHTS)
6OB,3 / 808.3181 / 136
2.90 / 2.815.0 / 4.7
14
HXbypuaIn*
45.71812.670.4
16
hUtopumpinl«t.outl«t
654.0 / 654.0140 1 140
2.65 / 3.845.1 / 5.1
17
HMt *xeh«f>fl#finUtouM (HRS)
873.0 / 873.036 / 75
<1.0 / ci.O6.1 / 6.1
428.6 / 428.8
Figure 4.6.3.1.1-1 PFW/IBB PHTS Proecess Flow Diagram for Pulse Operation State

i—X—I PFw/xepmsLoop-2 Y&4—>
I—X—| PFW/oeepHTSLoop-ti-tX—'
I 1 PfWKBBPHTS Loop-4 f—t
I 1 PfW/OeePHTSLoop-3 [—I
H ^ J — X — I PFW/IBBPHTSLoct j - > <
CL0)
Booa)3
5oCOtr
CO
CD
IO)

ReturnPenstocks
Circulating —Water System
t t t t t
i i i i i
T-a " »
Evaporation 1
9 1
D
* + + l M
t l ( 11!m
llUjjIiid
Evaporation
Makeup waterfrom rawwater supply
Spillway
Feed Penstocksto CirculatingWater SystemWBS 3.5.A
Drain Line toindustrial sewagesystem
O Corrosionu
Cdd
(jBiockte
Blowdown Line toindustrial sewagesystem (WBS 6.5.C
pH adjustment
Figure 4.6.3.2.2-1Process Flow Diagram for Cooling Tower System

p*'fVW6'B"pHT~"*E~
• ~ C N 0 1 {(SEAL WATER) I
I PFW/TBBPRE8SURIZER-A R«-injectlonPump
70 m3Jh x 2
I PHTS FUMP (SEAL WATER) I'
PFW71BB"PRESSURIZER-B
I—>T#rm 1j PRE»SU(KEB.C (
Automat ic feolat ion(Air actuated)
Automat tc taolat ion(Motor ized)
Manual control vatveAutomatic control valvw
(Air actuated)Automatic control vmtv»
(Motorfz«d)Saf«ty vatva
valva
S1-SS : Sampling Point*^ 3 : Intorfaclng Syste
Figure 4.6.3.3.1-1Typical CVCS Functional Flow Diagram
(2 CVCS for 10 PFW/IBB Loop)

INTERNATIONAL THERMONUCLEAR EXPERIMENTAL REACTOR
M
TECHNICAL BASISFOR THE
ITER FINAL DESIGN REPORT, COSTREVIEW AND SAFETY ANALYSIS
(FDR)
Chapter IISection 4.7
ITER PLANT DESIGN DESCRIPTION
13 July 1998

CHAPTER IISECTION 4.7
PLASMA DIAGNOSTIC SYSTEM
TABLE OF CONTENTS
4.7 Plasma diagnostic system 14.7.1 Function, and development rationale 14.7.2 Description of the system 24.7.2.1 Magnetic diagnostics 34.7.2.2 Neutron diagnostics 44.7.2.3 Optical/infra-red (IR) systems 54.7.2.4 Bolometers 64.7.2.6 Microwave diagnostics 74.7.2.7 Plasma facing component diagnostics and operational systems 84.7.3 Diagnostic neutral beam 94.7.4 Diagnostic start-up set 94.7.5 Diagnostic installation and remote maintenance 104.7.6 Conclusions - System design assessment and key issues 11

4.7 Plasma diagnostic system
4.7.1 Function, and development rationale
Measurement of plasma and key first wall parameters will have three main roleson ITER. Some of the measurements will be used in real-time feedback controlloops for basic plasma control and to prevent the onset of conditions which couldpotentially damage the first wall and other in-vessel components (machineprotection and basic plasma control); others will be used in the control of specifichigh performance scenarios (advanced control); while others will be used toevaluate the plasma performance and to provide information on keyphenomena which may limit ITER performance (physics studies). Themeasurements of some parameters may contribute to all three roles although therequirements on the measurements (accuracies, resolutions etc.) may be differentdepending on the role. The measurements will be made with an extensivecollection of individual measurement systems (diagnostics) which together formthe ITER Diagnostic System.
It is neither necessary nor desirable to design all aspects of the diagnostic systemsduring the EDA. It is necessary to establish the feasibility of the chosen diagnostictechniques, to develop the concepts to the point where any critical areas can beidentified and then resolved by dedicated design or by specific R&D. Theinterfaces with the major machine components must be designed, in particular,so that the necessary space and services for diagnostics are provided in themachine layout. The detailed design of the individual systems and theirinstallation can be left to the post-EDA phase. Plasma diagnostics is a rapidlydeveloping field and leaving the detailed design until post EDA has theadvantage of permitting the latest developments to be incorporated.
For the DDR, the feasibility of some key diagnostic systems was established andsome preliminary conceptual designs were made. During the last year, theconceptual designs of most of the systems required for machine protection andbasic plasma control have been completed and the designs of these systems hasadvanced to the engineering phase. Substantial progress has been made with theintegration of the diagnostics onto the tokamak: the interfaces between the in-vessel diagnostic components and the relevant machine components - vacuumvessel, backplate, blanket modules - have been defined; the accommodation ofdiagnostics into the available ports has been developed including theaccommodation of several diagnostics into single ports; the layout of diagnosticcomponents in the pit has been outlined and transmission lines to the remotediagnostic hardware have been developed. R&D on some key diagnosticcomponents, and on some new concept diagnostic techniques which promise tobe beneficial on ITER, has been initiated. The present status of the developmentof the design and R&D is summarized in this section.
FDR-ITER Plant Design Description Section 4.7-1

4.7.2 Description of the system
The diagnostic system comprises about 40 individual measurement systemswhich can be grouped into seven generic groups:
• magnetic diagnostics;
• neutron diagnostics;
• optical/infra-red (IR) systems;
• bolometric system;
• spectroscopic and neutral particle analyzer (NPA) systems;
• microwave diagnostics;• plasma facing components and operational diagnostics.
The provisional list of all diagnostic systems is shown in Table 4.7.2-1.
TABLE 4.7.2-1Provisional List of Diagnostic Systems
ITERWBS5.5.A5.5.A.015.5.A.025.5.A.035.5.A.045.5.A 055.5.A 065.5.B5.5.B.015.5.B.025.5.B.035.5.B.045.5.B.075.5.B.085.5.B.095.5.B.75.5.C5.5.C.015.5.C.025.5.C035.5.C.045.5.C.055.5.C.065.5.C.07
DIAGNOSTIC SYSTEMMagnetic Diagnostics
Vacuum Vessel Sensors*Back Plate Sensors*Divertor Coils*Rogowski Coils*Diamagnetic Loop*Halo Current Measurement*
Neutron DiagnosticsRadial Neutron Camera*Vertical Neutron Camera*Microfission Chambers (In-Vessel)* N /CNeutron Flux Monitors (Ex-Vessel)*Gamma-Ray SpectrometersActivation System*Lost Alpha Detectors* N /CKnock-on Tail Neutron Spectrometer N /C
Optical/IR SystemsThomson Scattering (Core)*Thomson Scattering (Edge)Thomson Scattering (X-Point)Thomson Scattering (Divertor)Toroidal Interferometric/Polarimetric System*Polarimetric System (Pol. Magnetic Field Meas.)Collective Scattering System N/C
FDR-ITER Plant Design Description Section 4.7-2

TABLE 4.7.2-1 (cont'd.)Provisional List of Diagnostic Systems
ITERWBS5.5.D5.5.D.015.5.D.02S.5.E5.5.E.015.5.E.025.5.E.035.5.E.045.5.E.055.5.E.065.5.E.075.5.E.085.5.E.095.5.E.75.5.F5.5.F.015.5.R025.5.F.035.5.F.045.5.F.055.5.F.065.5.F.075.5.F.085.5.G5.5.G.015.5.G.025.5.G.035.5.G.045.5.G.055.5.G.065.5.G.075.5.H
DIAGNOSTIC SYSTEMBolometric System
Bolometric Array For Main Plasma*Bolometric Array For Divertor*
Spectroscopic and NPA SystemsActive Spectroscopy (based on Diagnostic Neutral Beam))H Alpha Spectroscopy*Impurity Monitoring (Main Plasma)*Impurity Monitoring (Divertor)*tX-Ray Crystal Spectrometers*+Visible Continuum Array*Soft X-Ray ArrayNeutral Particle Analyzers*
Two Photon Lyman-Alpha Fluorescence N / CLaser Induced Fluorescence N /C
Microwave DiagnosticsECE Diagnostics for Main Plasma*tReflectometers for Main Plasma*tReflectometers for Plasma Position*+Reflectometers for Divertor PlasmaECA for Divertor PlasmaMicrowave Scattering (Main Plasma)Fast Wave Reflectometry N / CMicrowave Scattering (Divertor) N /C
Plasma-Facing Components and Operational DiagnosticsWide Angle Viewing IR/Visible*Thermocouples*Pressure Gauges*Residual Gas Analyzers*Hard X-Ray Monitor*IR Thermography Divertor*Langmuir Probes/Tile Shunts*
Diagnostic Neutral Beam* Start-Up diagnostic*+ Single channel or limited capability in Start-upN/C New Concept diagnostic
4.7.2.1 Magnetic diagnostics
The magnetic diagnostics will provide the plasma shape and position, plasmacurrent, loop voltage, plasma energy and the magnitude of the 'halo' currents insome key support structures. The system consists of several individual sub-systems:
• a set of pick-up coils, saddle loops and voltage loops mounted on theinner wall of the vacuum vessel;
• a set of coils and saddle loops mounted on the plasma side of the backplate in the gaps between the blanket shield modules;
FDR-ITER Plant Design Description Section 4.7-3

• four continuous poloidal (Rogowski) loops mounted on the outside ofthe vacuum vessel and four poloidal diamagnetic loops mountedinside the vessel;
• a set of coils mounted in the divertor diagnostic cassettes;
• Rogowski coils mounted around earth straps of the blanket/ shieldmodules for measuring the 'halo' currents.
The pick-up coils mounted on the inner wall of the vacuum vessel are coils ofmineral insulated (MI) cable wound on a stainless steel form with a protectivecover. They are cooled by conduction. The voltage loops are also MI cables witha bridge at every sector joint. They are repairable if it is necessary to exchange asector. The coils and saddle loops mounted on the back-plate and in the divertorcassettes will provide the plasma shape and position on a fast time-scale (~ 10 ms)and are not affected by axi-symmetric eddy currents. Special coils with highfrequency response mounted on the backplate near the poloidal gap betweenshield modules will give information on MHD modes up to ~ 200 kHz. Thesecoils are made from ceramic insulated wire wound on a ceramic former. Thecoils, the MI cable and other ceramics are all sufficiently shielded by the presenceof the blanket modules that their life time is comparable or longer than the lifetime of ITER.
4.7.2.2 Neutron diagnostics
The principal neutronic systems are a radial neutron camera, a vertical neutroncamera, neutron spectrometers, neutron flux monitors, and a neutron activationsystem.
The radial neutron camera consists of a fan-shaped array of flight tubes, viewingthe ITER plasma through slots in the blanket/shield, intersecting at a commonaperture defined by a specialized shielding plug in an equatorial port, andpenetrating the vacuum vessel, cryostat, and biological shield through thinstainless steel "windows". Each flight tube culminates in a set of detectors chosento provide the required range of sensitivity and temporal and spectral resolution.The detectors are housed in an auxiliary shielded enclosure outside the biologicalshield, and additional shielding along and between flight tubes provides thenecessary collimation. All electronics are situated outside the biological shield.The vertical neutron camera viewing from above has a similar configuration butis installed on a top port. The cameras provide the measurement of the totalneutron flux and emission profile from which the fusion power and powerdensity and the alpha particle source profile are derived.
Several types of neutron detectors and spectrometers are being considered. Theserange in size from compact natural diamond detectors to magnetic proton recoil(MPR) detectors and time of flight spectrometers. The present design of theradial neutron camera is sufficiently flexible to accommodate many possibleinstruments and this is the preferred arrangement for the installation of thespectrometers. From the measurements, the ion temperature would be
FDR-ITER Plant Design Description Section 4.7-4

determined and possibly the tritium-to-deuterium ion density ratio in the core,
The neutron flux monitors consists of a number of fission chambers containing235u o r other isotopes, situated at various locations around the tokamak insidethe biological shield. The system measures the global neutron source strengthfrom which the total fusion power is obtained.
The neutron activation system uses pneumatic transfer methods to place asample of material close to the plasma where it is irradiated by neutrons. Thesystem will provide a robust relative measure of fusion power and allows anabsolute calibration of fusion power production.
The most critical requirements are the wide access for the radial and verticalneutron cameras, and the heavy weight of the vertical shielding plugs. Thecameras need a wide angle view in order to be able to measure the neutrons fromthe full plasma cross-section and this has to be obtained simultaneously whilemaintaining high levels of radiation and thermal shielding of the tokamak.Modifications to the standard equatorial and vertical ports are studied; additionalshielding should be installed outside the biological shield and on the ceilingabove the tokamak.
4.7.2.3 Optical /infra-red (IR) systems
The principal optical systems are two multipulse Thomson scattering systemsand an equatorial plane interferometer. One of the Thomson scattering systemsis optimized for making measurements in the core region while the other isoptimized for making measurements in the edge region. The core systemoperates on the time-of-flight (LIDAR) principle. Light from a high power laseris transmitted to the plasma using a folded mirror system inside a shieldedlabyrinth located in an equatorial port. The plasma-facing mirror is an activelycooled metal mirror. The scattered radiation returns along the same labyrinth tospectrometers and detectors sited remotely. The system provides the spatialprofile of the electron density and temperature.
A LIDAR type system will not provide the spatial resolution necessary formeasurements in the edge region where high gradients are expected. Hence, thedesign of the edge system is being based on a conventional Thomson scatteringarrangement.
A vibration-compensated interferometer employing Faraday rotation techniqueswill be used to measure the line-integrated density for use in the feedback controlof the plasma density. The measurements will be made in the equatorial plane.The probing beams will have wavelengths of 10.6 jim and 3.39 jum. Theradiation will be transmitted to and from the plasma through shieldinglabyrinths in an equatorial port and small retroreflectors viewing the beamsthrough the horizontal gaps between blanket modules, and positioned at several
FDR-ITER Plant Design Description Section 4.7-5

toroidal locations, will return the radiation. The lasers and detectors will be sitedremotely.
Additional optical systems under investigation are Thomson scattering (LIDARtype) systems for the X-point and divertor regions, a polarimetric system, and acollective scattering system. The polarimetric system would providemeasurements of the current profile while the collective scattering system wouldprovide measurements of the confined alpha particle population.
The most critical design issue is the survivability of the first mirrors: these mustmaintain a good optical quality in the presence of the nuclear heating, plasmaradiation and neutral particle bombardment. For the Thomson scatteringsystems, the mirrors also have to handle the high level of laser power. Themirrors will be actively cooled, metallic, and possibly protected with shutters.Key tests on candidate mirror materials are being pursued in the diagnostic R&Dprogram.
4.7.2.4 Bolometers
The bolometric system aims to provide the spatial distribution of the radiatedpower in the main plasma and in the divertor region with spatial resolutions of20 cm and 5 cm respectively. The proposed method, as used on manycontemporary tokamaks, is sparse data tomography. The proposed total numberof lines of sight (LOS) is approximately 300.
The bolometer arrays will be installed in the equatorial and vertical ports, inselected locations on the back-plate viewing through the gaps between adjacentblanket /shield modules, and in the specially instrumented divertor diagnosticcassettes (viewing through the gap between cassettes). From each of theselocations, the plasma is observed along several arrays of LOS.
Designs of potentially suitable bolometers exist, but further development isrequired to ensure and validate that they are radiation hard.
4.7.2.5 Spectroscopic and neutral particle analysis systems
An extensive array of spectroscopic instrumentation will be installed on ITERcovering the X-ray to visible range: both passive and active measurementtechniques will be employed. The four main regions of the plasma - the core, theradiation mantle, the scrape off layer (SOL) and the divertor - will be probed.
The design of the specific instruments to be employed has not yet been finalized.However, for the X-ray region it is probable that there will be two spectrometersystems: a medium resolution survey instrument providing full coverage in thewavelength range 0.1-10 nm and a high resolution multi-channel instrumentwith narrow spectral coverage in the range between about 0.1 - 0.2 nm with atleast five radial sightlines. The spectrometers and detectors will have to bedirectly coupled to the tokamak vacuum because it is not possible to use
FDR-ITER Plant Design Description Section 4.7-6

windows. However, mirrors can be used at low angles of reflection and so it ispossible to shield the detectors from neutron and gamma radiation by usinglabyrinthine optical systems imbedded in shielding blocks. Passive spectralmeasurements in the visible wavelength range are of limited value for probingthe core because of the high plasma temperatures. However, activemeasurements employing charge exchange recombination spectroscopy withbeams of energetic neutrals are a rich source of information. For several of theimportant measurements, the optimum beam energy is ~ 100 keV/amu which issignificantly below the energy of the heating beams (1 MeV). This generates arequirement for a dedicated diagnostic neutral beam (below). The beams areviewed through labyrinthine optical systems imbedded in shielding blocks.Motional Stark Effect measurements of the current profile, however, benefitfrom the higher energy of the heating beams and so an optical system to viewone of these beams is also planned.
Measurements in the divertor region will be made through folded optical pathsin special divertor diagnostic cassette modules which will be located at each ofthe four divertor remote handling (RH) ports. The wavelength range ispresently limited to wavelengths > 200 nm due to absorption in the quartzwindows. The light will be transported with mirrors, lenses and optical fibres tothe spectrometers sited outside the biological shield. Mirror damage due to thedeposition of target plate material during a major disruption is a potentiallyserious problem which is presently being investigated. Measurements will alsobe made with instruments which view directly through the small gaps (~ 20 mm)between the cassettes.
The spectroscopic diagnostics will be supplemented by two neutral particleanalyzers, both viewing radially through an equatorial port along the same lineof sight. One will be used for monitoring the nx/nD ratio in the plasma edge(r/a > 0.7) and the other will provide the fast alpha particle and the hydrogenicion distribution functions in the energy range 0.5-4 MeV.
4.7.2.6 Microwave diagnostics
The principal microwave diagnostics will be a system to measure the electroncyclotron emission (ECE) from the main plasma, and three reflectometry systemsfor probing the main plasma, the divertor plasma, and for measuring the plasmaposition. Additional systems under study are an electron cyclotron absorptionsystem for use in the divertor region, a fast wave reflectometry system and twomicrowave scattering systems.
The ECE system consists of an array of antennas, a system for transportingthe radiation, and spectrometers and detectors for analyzing the emission. Theantennas are mounted in a radial port plug. The transmission system carries theradiation through the vacuum vessel, cryostat and shield and on to thespectrometers and detectors which are located remote from the tokamak in thediagnostic hall. Calibration of the ECE system is an important process and specialequipment and procedures are employed. The system will measure the electrontemperature with good spatial and temporal resolutions.
FDR-ITER Plant Design Description Section 4.7-7

The reflectometer for the main plasma has three sub-systems: (i) a systemwhich utilizes the upper cutoff (extraordinary mode) from the low-field side ofthe plasma to provide measurements of the density profile in the scrape-off layer(SOL); (ii) a system which utilizes the plasma frequency cutoff (ordinary mode)from both the low-field and high-field sides of the plasma to provide the inboardand outboard density profile in the gradient region; and (iii) a system whichutilizes the lower cutoff (extraordinary mode) launched from the high-field sideof the plasma to provide the core profile.
The plasma position reflectometer provides the location of particulardensity layers which occur in the vicinity of the separatrix. This system isintended as a stand-by reference to the plasma position and shape control systemfor very long 1TER pulses (> 3000 s), so reliability is of the highest priority.
The divertor reflectometer is intended to provide density profiles acrossthe divertor plasma. Multiple sightlines are employed across each of the divertorlegs, and the profile information is synthesized from several measurements dueto the extremely wide density range that needs to be covered.
For all systems, dog-leg structures in the transmission lines reduceneutron streaming outside the vacuum vessel and bioshield. Distinct vacuumwindows of fused quartz directly bonded to metal structures provide pressureboundaries. The windows are inclined at the Brewster angle for the appropriatepolarization wherever possible.
4.7.2.7 Plasma facing component diagnostics and operational systems
Diagnostics in this group will be installed to aid the protection and operation ofthe tokamak. Several will be dedicated to monitoring the condition of the highheat flux components in the main chamber and the divertor; other systemsinclude Langmuir probes, pressure gauges, residual gas analyzers, and runawaymonitors (hard X-ray detectors and tangential view IR systems).
The principal high heat flux protection system will be a wide-angle optical systemwhich will give views of the in-vessel components (including parts of thedivertor) in the infrared and visible. The design specification is for a 2 mmresolution at 10 m and the intention is to use several systems to achieve highcoverage (> 80%) of the area of the first wall. The design of the system is based onthe design of a similar system installed on JET. On JET the first elements in thesystem are lenses but on ITER because of the high level of neutron radiation thefirst components will be metal mirrors. The image is transmitted through a rigidlabyrinth using a series of plane mirrors to a catadioptric flattening arrayimmediately before the vacuum window. From here the image is transmitted bylenses to the cameras which will be mounted on the shielded side of thebiological shield. This system will view most of the toroidal extent of the innerand outer first wall and selected areas of the inner and outer divertor legs.
FDR-ITER Plant Design Description Section 4.7-8

Dedicated divertor diagnostics in this category include an IR thermographysystem for the power deposition profile on target plates, Langmuir probes forlocal measurements of plasma parameters and attachment/detachment, and fastpressure gauges, which will all be installed in special divertor cassettes. Thesehave special provisions for diagnostic sensors, and also provide access for opticaland microwave transmission lines. The IR thermography system exploits thisaccess path to provide surface temperature measurements of both divertor targetplates in a poloidal plane with good spatial and temporal resolution. Anunconventional collection optics for the diagnostic divertor cassette was designedwhich wavelength-multiplexes the collected thermal radiation from differentpoints on the target plates into a single beam. This is achieved by using a low-frequency grating close to the front mirror, but shielded from the divertorplasma. Thus the number of optical elements inside the vacuum vessel isdrastically reduced and only a small diameter optical window is needed.
4.7.3 Diagnostic neutral beam
The optimum beam energy for the diagnostic neutral beam is ~ 100 keV per amu.This is considerably below the energy of the heating beams (1 MeV) and so adedicated beam is required. To minimize the cost, a beam system is beingdesigned which as far as possible utilizes the same components and can bemaintained using the same tools and RH procedures that are being developed forthe heating beams. In order to achieve the required measurement performance,the beam would have to have a power of about 5 MW, a narrow beamdivergence, a small beam footprint and be capable of modulation at frequenciesof a few Hz. An alternative approach is to use a very short pulse (1 us), intense (5GW) beam which can be pulsed at a repetition rate of about 100 Hz. Such a beamwould have an average beam power requirement of about 500 kW, would besignificantly smaller than the conventional beam and would give an improvedmeasurement performance. However, it is at a much earlier state ofdevelopment and is a subject of on-going R&D.
4.7.4 Diagnostic start-up set
While it is not necessary to construct all of the diagnostics during the machineconstruction phase, it will be necessary to construct all the interfaces for all thediagnostics and to meet all the diagnostic requirements for space and servicesduring the machine construction phase in order to avoid expensive modificationcosts later. The combination of the construction of the subset of diagnostics forfirst machine operation, which is termed the 'Start-up Set', and the interface andservice work, constitutes the work that must be done during the constructionphase. The diagnostics in the 'Start-up Set1 are marked with an asterisk in Table4.7.2-1. The design of most of the systems is based on experience gained withsimilar systems on present-day tokamaks. However, for a few of the requiredmeasurements existing techniques are not applicable and new approaches areneeded. The systems involved are termed 'New Concept' diagnostics andmarked N/C in Table 4.7.2-1.
FDR-ITER Plant Design Description Section 4.7-9

4.7.5 Diagnostic installation and remote maintenance
Diagnostic components will be installed inside the vacuum vessel - for exampleon the backplate and in special divertor diagnostic cassettes - and in equatorialports, top ports and divertor ports. Outside the biological shield, they will beinstalled in the pit and in the remote diagnostic areas. They are required to havea long lifetime: in particular the components mounted in the vessel must havea lifetime at least as long as the component on which they are mounted so as notto necessitate additional in-vessel maintenance.
The majority of the diagnostic components mounted inside the vacuum vesselwill be mounted on the plasma facing side of the backplate. Standardizedcylindrical inserts, similar to the flexible attachments for the blanket shieldmodule, are being designed. The inserts will be located in the middle of thepoloidal gaps between blanket modules allowing access to the plasma (forexample for magnetic measurements) through the gap between modules(Figure 4.7.1). The diagnostic sensors are connected to cabling which is routedpoloidally on the plasma side of the backplate behind the blanket modules. Thecable looms penetrate the backplate below the equatorial ports and are thenrouted along the blanket supports to the cryo-pump ports. All cabling forin-vessel diagnostic sensors exit the vessel through the cryo-pump ports at thedivertor level and is terminated in cubicles situated in the pit at the divertorlevel.
At the equatorial level diagnostic components are installed in horizontal portsdedicated to diagnostics. The principal components of a typical installation areshown in Figure 4.7.2. Apertures through the blanket shield plug enable theplasma to be viewed: the number and size of the apertures is kept to a minimumand the sides of the apertures are cooled when the aperture is larger than about100 mm. Labyrinthine penetrations in the diagnostic block transmit thediagnostic beams at the same time as maintaining the required shielding. Thediagnostic block carries any specific diagnostic components - mirrors, sensors,shutters, in-vessel calibration equipment. The vacuum vessel seal plate formsthe main vacuum boundary and incorporates the main port seal, any diagnosticwindows and electrical and water feedthroughs. Neutronic calculations haveshown that it is possible to install several diagnostics into one port and maintainadequate shielding. Outside the biological shield both permanent and removablediagnostic equipment is installed.
The equatorial port plug, comprising the blanket shield plug, the diagnostic blockand the vacuum vessel seal plate, will be handled as one unit following thegeneric remote maintenance procedures for equatorial ports. It is removed in atransport cask which contains the contamination, docks to the cryostat flange,and to a complementary flange in the Hot Cell. It is dismantled and refurbishedin the Hot Cell, where the modular sub-assemblies can be replaced and tested.
Some diagnostics require direct coupling to the tokamak vacuum, for example,X-ray and VUV spectrometers. These will be installed on sector 7 adjacent to theNeutral Beam injectors where the NBI cell will provide the compulsoryconfinement boundary.
FDR-ITER Plant Design Description Section 4.7-10

An example of an equatorial port where many optical diagnostics are integratedis sector 16 with the Thomson Scattering LIDAR, Wide-angle Plasma andDivertor Viewing, and Ha spectroscopy (Figure 4.7.3).At the divertor level the central divertor cassette in front of each of the fourremote handling ports is specially adapted to provide diagnostic access. Accessfor optical and microwave diagnostics is provided. The cassettes on each side ofthe central cassette carry electrical diagnostic sensors such as magnetic pick-upcoils, bolometers and pressure gauges.
The divertor impurity monitor diagnostic (Figure 4.7.4) illustrates many of theaccess features of optical diagnostics. Here the divertor area is probed radially byintersecting arrays of viewing chords for each leg. Two direct view instrumentscollect light through the small gaps between adjacent cassettes. The majordifficulty with this instrument is the relative movement of the vacuum vesseland the cryostat. In addition, mirror assemblies are located under the dome andin the space under the cassette used by RH tools during maintenance and areviewed by a third instrument. Mirror damage due to the erosion and depositionof target plate material during a major disruption is the main concern in thisregion. The mirrors are protected as much as possible by collimating apertures inthe structure.
Access for diagnostics is available at ten of the vertical ports but these ports alsohave to accommodate the In-Vessel Viewing system and the retractable glowdischarge cleaning electrodes. The design of the access scheme for these ports isstill in progress.
4.7.6 Conclusions - System design assessment and key issues
The ability of the diagnostic system to meet the measurement requirementsdepends on several factors which are in general different for each generic groupof diagnostics.
1) For the magnetic diagnostics, the design and supporting R&D work hasshown that there should be no insurmountable problems with thesystems mounted on the inner wall of the vacuum vessel and in thedivertor cassettes. However, the systems mounted on the plasma sideof the back plate are subjected to radiation levels up to 0.1 of the firstwall. The coils and loops will survive for the life time of ITER, but theproblem of providing the cooling required to remove the nuclearheating while maintaining an acceptable operating temperature issubstantial and is under detailed study. The systems on the back-plateand in the divertor will provide all the measurements necessary for afull determination of the plasma equilibrium and current with a timeresolution >10 ms. The high frequency coils provide measurements ofmagnetic fluctuations with a bandwidth of 200 kHz and a measurementof plasma beta is provided by the diamagnetic loops on the vessel wall.The voltage loops on the vessel wall and on the back-plate providetoroidally averaged flux measurements and also the instantaneous
FDR-ITER Plant Design Description Section 4.7-11

voltage for the calculation of the axisymmetric currents. The firstreconstruction tests using this set of sensors indicate that the requiredperformance can be achieved.
2) The ability of the neutron diagnostics to meet the measurementrequirements depends critically on the access available to the radial andvertical neutron cameras. In order to be able to determine accuratelythe total fusion power and power density, it is essential to have a wide-angle view of the plasma in both these directions. Provision of specialequipment for calibrating the detectors in-situ is also an importantfactor. Progress with the design of the flux monitors is good, and it isexpected that the measurement requirements set for them will beachieved.
3) For all optical/IR, spectroscopic and microwave diagnostic systems, acritical issue is the access holes through the blanket shield plugs whichare mounted in the diagnostic ports. A promising design for thesemodules which should enable the apertures needed for diagnostics tobe achieved is under development.
4) For all the optical systems the lifetime of the first (plasma facing)mirror is the most critical issue. Thorough work on the design of theLIDAR Thomson scattering system has shown that this can be solvedby reducing the solid angle for CX neutral bombardment and by using acoating of a metal which has a low sputtering coefficient (rhodium) ona highly conducting and actively cooled metallic base (eg copper).Damage during disruptions due to deposition is potentially a seriousproblem especially for optical components in the divertor cassettes andfor the grazing incidence VUV front-end mirrors. Baffles and possiblyshutters can be used to alleviate this problem and their inclusion in theoptical systems is being investigated. The vibration compensatedinterferometer uses radiation at 10 vm and a remaining issue for thissystem is the provision of the vacuum window for this wavelengthwhich meets the ITER vacuum and tritium containment requirements.Significant progress has been made in the technology R&D programtowards the development of a mechanical seal which will make such awindow available.
5) The installation of the cylindrical inserts at different poloidal locationson the backplate gives the possibility for bolometric measurementsalong many different lines of sight from which a full tomographicreconstruction of the two dimensional radiation profile is possible inprinciple. However, the survivability of the presently availablebolometers is still an unresolved question and is the topic of plannedR&D.
6) The design of the direct coupled diagnostics systems (X-Ray crystal andVUV spectrometers, and NPA) has advanced substantially and it isnow probable that good performance from these instruments inmeasurements on the main plasma will be achieved. Possibilities exist
FDR-ITER Plant Design Description Section 4.7-12

for VUV measurements in the divertor region but more design work isrequired before it is clear whether a useful measurement capability canbe established.
7) For the ECE measurements and for the reflectometry measurementswhich probe the plasma through equatorial ports on the low-field side,there are no insurmountable problems foreseen. Solutions for thefront end have been developed which are capable of meeting themeasurement requirements, with the exception of edge temperatureresolution (by ECE) which is intrinsically limited to ~50 mm (relative tothe target resolution of 5 mm). For the reflectometry measurements onthe high-field side and at various locations in the poloidal cross-sectionfor the plasma position measurements, the installation of the necessaryantennas and waveguides between blanket in the vacuum vesselremain key design issues. Promising solutions have been proposed,but their microwave performance has yet to be assessed. Theinstallation of waveguides through the divertor ports and in thedivertor cassettes appears feasible but the development of the associateddiagnostics (electron cyclotron absorption (ECA) and divertorreflectometry) is still in an early stage and so the information that canbe reliably obtained from these measurements is not certain.
8) The design of the visible/IR viewing diagnostic has progressedsubstantially and it is now probable that a high performance will beachieved (resolution ~3 mm at 10 m). The critical component is thefront end wide angle endoscope system and promising design conceptshave been developed. In the present arrangement 80% coverage of thefirst wall including divertor will be possible, only limited by accessrestrictions.
9) Substantial progress has been made with the integration of thediagnostic neutral beam onto the tokamak but limited design resourceshave meant that only minor progress with the design of the injectorhas been possible. Nevertheless an injector suitable for the applicationappears to be feasible. Some relevant progress has been made on thedevelopment of the short pulse, relatively intense, neutral beam whichmay have significant advantages in this application.
FDR-ITER Plant Design Description Section 4.7-13

Figure 4.7.1. Magnetic pick-up coil near the junction of fourblanket modules. One blanket module removed to expose thecylindrical diagnostic insert containing the coil, and the wireconduit mounted on the backplate.

IntegratedPort Plug
SecondaryBoundary &Feedthroughs
InterspaceBlock
VacuumVesselSeal Plate
DiagnosticBlock
BlanketShielPlug
PermanentDiagnosticEquipment
RemovableDiagnosticEquipment
&Shielding
BackPlateVacuumVessel Cryostat
Figure 4.7.2 View of a typical equatorial diagnostic port, showing the majorcomponents.

LIDAR
H a spectroscopy
Divertor viewing
Plasma viewing
Figure 4.7.3: Cutaway view of equatorial port 16. The shadedarea indicates the path of the LIDAR beam in the labyrinth.

Figure 4.7.4. Optical relay out through the divertor remotehandling port. Three instruments are shown: two direct view,collecting visible light by viewing the plasma between the small(~20 mm) gaps between the cassettes, and an instrument whichviews indirectly using mirrors located within the centraldiagnostic cassette.

INTERNATIONAL THERMONUCLEAR EXPERIMENTAL REACTOR
TECHNICAL BASISFOR THE
ITER FINAL DESIGN REPORT, COSTREVIEW AND SAFETY ANALYSIS
(FDR)
Chapter IISection 4.8
ITER PLANT DESIGN DESCRIPTION
13 July 1998
CHAPTER IISECTION 4.8
HEATING AND CURRENT DRIVE
TABLE OF CONTENTS
4.8 Heating and current drive (H&CD) 14.8.1 Introduction 14.8.2 Main functions of H&CD systems 14.8.3 Neutral beam heating and current drive (NB H&CD) system 24.8.3.1 System performance 24.8.3.2 Major components 24.8.3.3 Confinement boundaries 24.8.3.4 NB injection system description 34.8.3.5 Maintenance 44.8.3.6 Design assessment and key issues 54.8.4 Ion cyclotron heating and current drive (IC H&CD) system 64.8.4.1 System performance .64.8.4.2 Major components 74.8.4.3 Confinement boundaries and cooling 84.8.4.4 Maintenance 84.8.4.5 Design assessment and key issues 94.8.5 Electron cyclotron heating and current drive, startup and wall
conditioning (EC H&CD) system 94.8.5.1 System performance 94.8.5.2 Major components 104.8.5.3 Confinement boundaries 114.8.5.4 System description 114.8.5.5 Maintenance 134.8.5.6 Design assessment and key issues 134.8.6 Lower hybrid heating and current drive (LH H&CD) system 154.8.6.1 System performance 154.8.6.2 Major components 154.8.6.3 Confinement boundaries 164.8.6.4 System description 164.8.6.5 Maintenance 174.8.6.6 Design assessment and key issues 174.8.7 Additional heating power supplies 184.8.7.1 Performance 184.8.7.2 IC H&CD power supply 184.8.7.3 EC H&CD power supply 194.8.7.4 NB H&CD power supply 204.8.7.5 LH H&CD power supply 214.8.7.6 Design assessment 22

4.8 Heating and current drive (H&CD)
4.8.1 Introduction
ITER shall provide 100 MW of heating and current drive power to the plasmawith the capability to increase this value significantly. This power will bedelivered to the plasma by a combination of a minimum of two differentsystems. During the EDA, design and R&D efforts have concentrated on threesystems: neutral beam, ion cyclotron, and electron cyclotron heating and currentdrive (NB H&CD, IC H&CD, and EC H&CD respectively). The design of a fourthoption using lower hybrid frequency waves is being developed. The designrequirements on each of the systems is to provide 50 MW plasma heating. Theintegration of its design into the ITER machine is proceeding.
With the present status of knowledge, it is premature to select the technologiesthat will be used. Consequently, system design and R&D, are proceeding inparallel for all the candidate technologies. Design of the tokamak systems,auxiliary systems, and plant facilities has been developed specifically to allow anyof the described methods to be implemented.
This approach has been applied in the continuing detailing of the design, whichhas emphasized incorporation of results from the ongoing R&D program,achievement of satisfactory confinement boundaries and maintainableconfigurations.
4.8.2 Main functions of H&CD systems
The main functions of the H&CD systems are in order of decreasing priority:
• provide the L-H mode (plasma confinement) transition;
• heat the ITER plasma to ignition;
• drive non-inductive current in the plasma;
• control the plasma equilibrium and burn state;
• stabilize MHD instabilities.
In addition, a separate, lower power electron cyclotron resonant frequency systemis provided for plasma start up and wall conditioning.
FDR-ITER Plant Design Description Chapter Il-Section 4.8-Page 1
4.8.3 Neutral beam heating and current drive (NB H&CD) system
4.8.3.1 System performance
The neutral beam (NB) heating and current drive system will deliver 50 MW of1 MeV D° beams to the plasma. The system consists of three injectors, eachdelivering 16.7 MW through separate equatorial ports. Operation in H° will alsobe possible with a beam energy of <; 0.8 MeV and a power of about 13 MW perinjector. The injection is quasi-tangential to the magnetic axis so that the beamswill generate current and inject momentum into the plasma to induce plasmarotation.
4.8.3.2 Major components
The major components of the NB system, see Figures 4.8.3-1 and 4.8.3-2, are the:
• injectors themselves (which are described in more detail below);
• NB power supplies (which are described in Section 4.8.7.4);
• auxiliary systems including the pumping system (which is described inSection 4.4.3); gas supply system; control and data acquisition system;
• cryosystem (which is covered by Section 4.3). The system will deliversupercritical helium at two temperature levels (about 4 K and about 80K) to the cryopumps.
• cooling water system (see also Section 4.6). The NB cooling systemconsists of:
- a specific subsystem for the main beamline components, which areall at or near ground potential (700 kg/s for all three injectors, withinlet and outlet temperatures of 80°C and 110°C, plus an additionalflow of £ 130 kg/s to the beamline calorimeter(s) when needed);
- a smaller subsystem for the ion source and accelerator (at variouspotentials between 0 and -1 MV) providing 70 kg/s per injector at30°C.
4.8.3.3 Confinement boundaries
The three injectors will be connected to adjacent tokamak ports and be locatedoutside the cryostat inside a common enclosure, the NB cell. The injectors areextensions of the first confinement barrier, and the NB cell will form the secondconfinement barrier. The injector vacuum vessel will be cylindrical anddesigned to withstand 0.5 MPa overpressure. The NB cell will be made ofreinforced concrete capable of withstanding 30 kPa (g). Bursting discs in pipesleading to the upper heat transfer vault prevent the pressure in the NB cell from
FDR-ITER Plant Design Description Chapter II-Section 4.8-Page 2

exceeding 30 kPa (g). A schematic showing the basic concept of the confinementbarriers of the NB system is shown as Figure 4.8.3-3.
The NB injectors cooling system safety isolation valves, located inside the TCWSvault, are the limit of the second confinement boundary.
4.8.3.4 NB injection system description
The main elements of an injector are shown in Figures 4.8.3-1 and 4.8.3-2.
Recent R&D results have quantified the radiation induced conductivity (RIC)effect on a number of pressurised gases considered for the insulation of the beamsource. This could lead to high dark currents in the gas insulated volume(> 0.4 A) and associated power losses. The feasibility of a beam source usingvacuum insulation has been studied and no conceptual design difficulty has beenfound. Such a design would largely utilise the present design and R&D resultsfor the ion source and accelerator. In terms of layout, the required designchanges can be accommodated within the volumes presently allocated to theNB H&CD system. Nevertheless, the details of a vacuum-insulated version ofthe beam source require additional analyses in terms of electrostatic modelingand some R&D to extend and validate the vacuum voltage holding criteria to beapplied.
The beam emerging from the accelerator is made up of 1300 "beamlets" from1300 apertures in each grid of the accelerator. The apertures are arranged suchthat the beam is made up of five "columnar beams", each rectangular in crosssection with the full height of the accelerator. The overall beam envelope at theexit of the accelerator is = 1.6 m x 0.6 m (height x width).
The 1 MeV D- beam is converted to 1 MeV neutrals with an efficiency of = 60%,by collisions with D2 gas in the neutraliser, subdivided into five verticalchannels, the gas being introduced midway.
The beam emerging from the neutraliser consists of approximately 60% neutrals,20% negative ions, 20% positive ions, all with an energy of 1 MeV. The chargedspecies in the beam are deflected by electric field onto the water-cooled panels ofthe residual ion dump (RID), built from six panels forming five channels in linewith those of the neutraliser. Alternate plates are held at a potential of -20 kVnot only to provide the deflection but also to prevent low energy electrons fromleaving the neutraliser. A total power of = 18 MW may be dissipated in the RID,and the power density on the RID plates will be s8MW/m 2 . In the presentdesign, the RID panels consist of arrays of rectangular cross section swirl tubeelements.
A calorimeter located downstream of the RID can be positioned either tointercept the beam or to allow the beam to continue to the tokamak. Thecalorimeter allows the injectors to be fully commissioned independently of FTER.The calorimeter consists of water-cooled panels capable of accepting the fullpower of the neutral beam (= 18 MW).
FDR-ITER Plant Design Description Chapter H-Section 4.8-Page 3
A large, cylindrical cryopump (pumping speed = 3xlO3 m3/s for D2) maintains alow pressure in the system outside the ion source and neutralises
A "fast" shutter is located at the exit of the injector vacuum vessel to preventtritium flowing from the torus to the injectors and to allow regeneration of theinjector cryopumps without significantly increasing the torus pressure. This isessentially a lightweight "door" which can be moved across the beam path to sealagainst a frame built into the exit of the NB injector vacuum vessel. A flexiblemetal seal on the frame ensures a low conductance between the injector and thetorus of =1(H m3 /s for D2.
All services to the injector enter the injector vacuum vessel through a shortsection of the vacuum vessel just downstream of the accelerator. Thisarrangement allows the installation and removal of all the components in theinjector vessel from the source end of the injector when the accelerator is not inposition.
The formation and transport of the negative ion beam prior to conversion toneutral atoms must take place in a region of low magnetic field so as not toreduce beam transmission. Additional important reasons include avoiding bothdistortion of the plasma density in the ion source, and enhanced probability ofbreakdown in the accelerator. The total line-integrated field from the acceleratorto the neutraliser exit should be smaller than 2xlO-4 Tm. However, in thisregion, the stray magnetic field from ITER is between 8xlO"2 T and 4x10"2 T. Thenecessary reduction is achieved by the combination of a 200 mm thick outer layerof mild steel around the injector, a 10 mm thick inner layer of mu-metal aroundthe beam path, and three active field compensation coils. This combination ofpassive and active magnetic shielding allows both the stray field in the injectorsand the error field on the plasma to be maintained to within the required limits.
4.8.3.5 Maintenance
The NB system will become activated by neutrons streaming directly into eachinjector and the system will need to be remotely maintained. The whole (remotehandling Class 3) system does not need maintenance in the lifetime of ITERexcept:
• The fast shutter requires maintenance for seal wear (Class 2).
• The filaments of the ion source (Class 1) have a finite life, estimated as> 200 h. They should be replaced twice a year (or less) through the endflange of the same enclosure.
• Caesium will flow from the ion source to the accelerator and mayeventually contaminate the insulators, which will then requirecleaning. Its frequency is expected to be less than once per year. If thiscleaning cannot be carried out in situ, the removal of the source will berequired (Class 1). This complex procedure has already been studied and
FDR-ITER Plant Design Description Chapter II-Section 4.8-Page 4

considered feasible. The removal of the ion source and accelerator isexplained in more detail in Section 7.
4.8.3.6 Design assessment and key issues
(1) Because the injectors necessarily provide a gap in the vacuum vesselshielding blanket, there is a problem of neutron streaming. In the design of theNB duct, the amount of shielding has been carefully assessed to ensure a level ofactivation inside the cryostat compatible with hand-on maintenance. Detailed2 - D and 3-D neutronic calculations have been performed showing dose ratesclose to 200 f/Sv/h (for the reference scenario).
(2) The fatigue lifetime of the beamline components, residual ion dump (RID),neutraliser and, less importantly, the calorimeter, is a critical issue since thecomponents are RH Class 3. The design fatigue life for the RID and neutraliserhigh heat flux components has been determined considering that:
- the injectors will be used at full power for 25000 pulses of 1000 s (50% ofthe total number of pulses of ITER);
- a design value of 20 breakdowns for each 1000 s pulse has been assumed:these breakdowns result in the interruption of power load for 180 msand in a total of 5x 10⁵ additional thermal cycles with smaller strainamplitude.
Thermal fatigue verifications performed according to the conservativemethodology of IISDC show that the FDR design fulfills the requirements. Thefatigue design curves utilized are based on fitting and extrapolations of existingthermal fatigue data for CuCrZr alloy, presently limited to below 105 cycles.Therefore it is important to extend (in terms of number of cycles) the database ofCuCrZr-IG and to optimize the beamline high heat flux components design.
(3) The main new feature of the ITER NB system is the use of a 1 MeV D- ionhigh current density beam. Whilst the JA Home Team pursues the multi-aperture, multi-gap accelerator (MAMuG) of the reference design, the EU HomeTeam is working on a simplified alternative concept using a single aperture,single gap accelerator (SINGAP). The main problems so far have been withvoltage holding of the epoxy insulators used at both test beds, before theavailability of a large alumina insulator.
FDR-ITER Plant Design Description Chapter II-Section 4.8-Page 5

The major R&D results from negative ion sources are:
• H' beams of 975 keV have been produced with about 50 mA acceleratedcurrent with the MAMuG test bed. Good beam optics have beenobtained from MAMuG at 500 keV and the beam optics from SINGAPare found to be very good up to > 900 keV.
• The plasma source development has reached the targets needed for theITER source, i.e. accelerated D" current density >20mA/cm2 at lowpressure (0.35 Pa), with < 1 electron extracted per I> ion accelerated.
• On JT-60U, the negative ion source, which is similar to that proposedfor ITER, has operated satisfactorily ie as of today -360 keV, with anaccelerated H~ beam of 18.5 A from one beam source.
(4) R&D for the manufacturing technology for the accelerator alumina insulators(inner diameter 2.7 m in ITER NB source design) has been performed during theEDA.
The technology for casting alumina insulators (ultramoulding) has provenunsuccessful when passing from small specimens to the manufacturing ofrelevant size (about 600 mm inner diameter) insulator mock-ups due to thepresence of cracks and voids. It is therefore necessary to re-direct the R&D effortfor large size insulators towards more conservative manufacturing technologies.Cold Isostatic Pressing for alumina insulators, or limited modifications ofexisting industrial processes for porcelain insulators, will be investigated in thefuture.
4.8.4 Ion cyclotron heating and current drive (IC H&CD) system
4.8.4.1 System performance
The IC H&CD system is designed to deliver to the ITER plasma a total power of50 MW in the frequency range of 40-70 MHz. This frequency range encompassesall ion and electron heating scenarios at nominal (Br = 5.7 T) and reduced (BT> 4.0 T) toroidal field. The system is composed of 32 modular subsystems. Eachsubsystem can generate an output power in excess of 2 MW. The total installedpower is therefore 64 MW, delivered by four antenna arrays, each located in oneequatorial port. All this power is delivered to the plasma chamber, allowing amargin of up to 14 MW for losses in coupling to the plasma.
FDR-ITER Plant Design Description Chapter II-Section 4.8-Page 6

4.8.4.2 Major components
The components of each modular subsystem are (see also Figure 4.8.4.2-1):
• one current strap: delivers RF power to the plasma - eight of them in aport in a 2x4 matrix constitute an array. The current strap is folded atboth ends into the port; the strap terminals are configured as variableshort circuit stubs (pre-tuning stubs) to maintain at the antenna feedpoint a VSWR < 2 over a large range of plasma loading; their lengthscan be adjusted to make the structure resonant. The total lengthbetween the shorted terminals is approximately one wavelength;
• one modular Faraday shield: of 25 tubular elements constructed ofcopper alloy (such as Cu-Cr-Zr) with a Be layer;
• shield and support structure: replacing the blanket and vessel shieldingand providing mechanical support of the array, windows andtransmission lines;
• one vacuum transmission line CVTL): consists of coaxial transmissionlines connected to the antenna and located in the primary vacuum. Ineach VTL, a double vacuum window assembly provides the vacuumand tritium boundary;
• one matching and decoupling system: matching is performed in part atthe antenna (pre-matching) and in part in the transmission system.The function of this system is to transform the (variable) loadimpedance to the (fixed) RF power source output impedance, therebyoptimizing the power transfer from the source to the load; theimpedance matching network in each line can compensate resistiveload variations (per unit antenna length) in the range 2 to 8 Q/m andkeep the voltage standing wave ratio (VSWR) in the MTL and at thesource < 1.5.
• one main transmission line (MTL): composed of rigid coaxialtransmission lines. There are two sections, one connecting the end ofthe VTL to the matching system (vacuum section), the other betweenthe matching system and the RF power source (pressurized section)filled by pressurized dry air. The basic characteristics of the MTL areshown in Table 4.8.4.4-1;
• one RF power source: a chain of RF power amplifiers in which a lowlevel RF signal is distributed to all subsystems and sent, throughamplitude and phase control units, to drive a four-stage amplifier(solid state wideband amplifier, pre-amplifier, driver and end stage).The RF power generation efficiency exceeds 70%; in the last threestages, power tetrodes are used. The RF source can be connected eitherto the antenna or to a resistive dummy load for power testing;
FDR-ITER Plant Design Description Chapter II-Section 4.8-Page 7

• one electrical power supply: provides DC and AC power to the RFpower source. The detail of the high voltage DC supply for the anodeof driver and end stage is described in Section 4.8.7;
• RF monitoring and controls: monitors and controls the IC H&CDsystem during operation, and provides internal and externalcommunications with CODAC;
• auxiliaries: vacuum, pumping, gas supply, and pressurization systemsas well as commissioning and testing equipment.
TABLE 4.8.4.4-1Main Transmission Line Characteristics
Nominal inner diameter of outer conductor
Nominal outer diameter of inner conductorCharacteristic impedance
Maximum working voltage with ceramic supportNominal VSWR
230 mm140 mm
30Q
80 kV
1.03
4.8.4.3 Confinement boundaries and cooling
The primary confinement boundary for the IC H&CD system is provided by theport flange and by the ceramic discs of the double vacuum window. The cryostatflange and a second ceramic barrier provide the secondary confinementboundary.
The components of the "antenna end" (Faraday shield, current strap, neutronshield, part of the support structure) are cooled by the PFW/IBB cooling loop.The closure plate and the components mechanically attached to it (windows, all-metal supports, short sections of VTL and supporting structure) are cooled by thevacuum vessel cooling system.
4.8.4.4 Maintenance
In one port, the antenna array and its associated VTLs form a single assemblywith the array support structure/shield, and the vacuum vessel closure plate.This can be fully tested before installation and removed as a single piece byremote handling through an equatorial port.
The vacuum windows are also designed to be individually replaced by RH eitherin place or in the hot cell. The sections of MTL in the pit and the bio-shield aredesigned to facilitate access and docking of the RH cask to the cryostat flange.
FDR-ITER Plant Design Description Chapter II-Section 4.8-Page 8

4.8.4.5 Design assessment and key issues
At this point of the design, the IC H&CD system appears capable of providing therequired services and of satisfying requirements. It is noted that off-axis currentproduction has not yet been demonstrated. The system design needs furtherdetailing and validation through R&D. Principally:
• the manufacturing feasibility of the Faraday shield needs to beconfirmed;
• for the variable prematching stub, the functionality of the use of slidingcontacts should be experimentally assessed, and remote actuationshould be proven;
• R&D on the all-metal support of the inner coaxial conductor of theVTL to avoid the use of insulator is continuing with the constructionand high power tests of the prototype;
• for the ceramic window, a prototype is being developed and evaluated
• a single tube RF source has been tested to 1.5 MW power in CW(continuous wave) conditions at VSWR ~1 and within the ratedfrequency range. ITER power performances can be comfortably metwith the use of two existing tubes in the last transmitter stage. Thissolution is being presently investigated. Simpler transmitter layoutsshould however be considered to minimize cost.
4.8.5 Electron cyclotron heating and current drive, startup and wallconditioning (EC H&CD) system
4.8.5.1 System performance
A total of 50 MW of 170 GHz power for H&CD is delivered to the plasma with anarray of 60 waveguides divided equally between two ports. Physics studies haveshown that non-inductive H&CD can be accomplished over a central magneticfield range spanning 4.2-5.7 T using fixed frequency EC sources if the injectionsystem is provided with a modest toroidal steering capability. A frequency of170 GHz has been chosen as a compromise between the physics requirements andpresent technological limits.
In addition to the main system, two start-up and wall conditioning systems areprovided, one per port and each supplying 3 MW of power at a single frequencyin the range 90-140 GHz.
FDR-ITER Plant Design Description Chapter H-Section 4.8-Page 9

4.8.5.2 Major components
The EC H&CD system is divided into the following major subsystems:
• in-vessel transmission and injection system (see Figure 4.8.5.2-1)composed of two components:
- port plug assembly:
an equatorial slotted shield-blanket module;
injection optics: fixed optic and steerable optics which inject theEC beams at a variable toroidal angle;
mirror shield block: supports injection optics and providesshielding;
waveguide run with dog-leg;
secondary shield block: shielding which in conjunction with thewaveguide dog-leg prevents streaming through the port;
- waveguide and window block assembly:
in-vessel waveguide runs: transmit power through the portinterspace between vacuum vessel and cryostat;
window block: assembly consisting of the maintenance valve,window (primary confinement boundary), and isolation valve(secondary confinement boundary).
• ex-vessel transmission system:
- conventional overmoded transmission components: corrugatedwaveguide runs, miter bends, DC breaks, in-line valves, pumpingsections, and expansion segments;
- radio frequency (RF) beam conditioning system: conditions RF beamexiting the gyrotron for long distance waveguide transmission.
• gyrotron and auxiliary systems:
- gyrotron sources for heating, current drive, start-up, and wallconditioning;
- superconducting and conventional magnets;
- fluid systems: liquid He, liquid N2, and component cooling water.
• power supply system (described in Section 4.8.7):
- main supply: 50 kV, 45 A, 5% (c.f. Table 4.8.7-2) regulation;
FDR-ITER Plant Design Description Chapter II-Section 4.8-Page 10
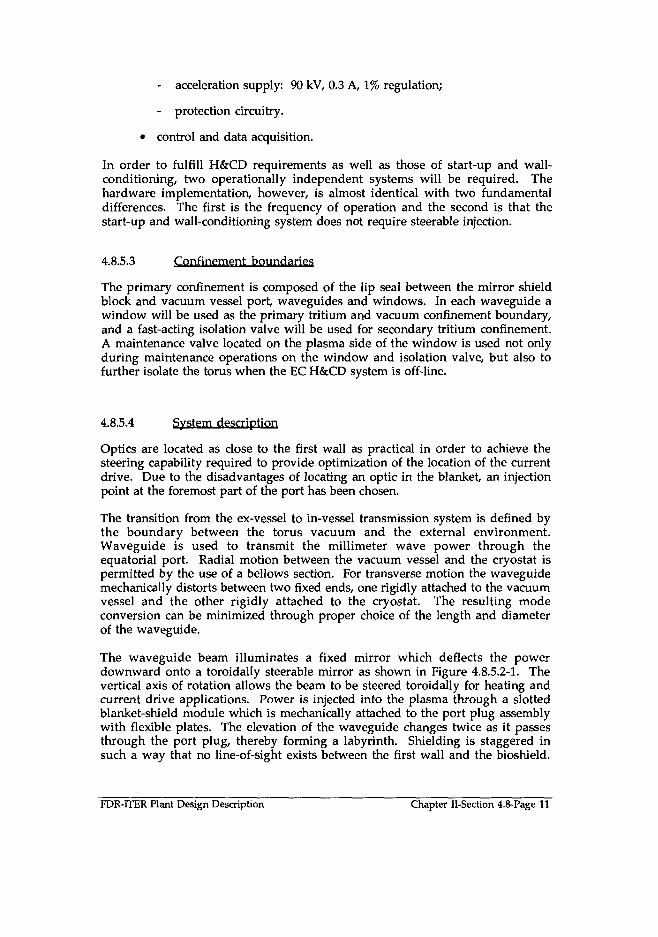
- acceleration supply: 90 kV, 0.3 A, 1% regulation;
- protection circuitry.
• control and data acquisition.
In order to fulfill H&CD requirements as well as those of start-up and wall-conditioning, two operationally independent systems will be required. Thehardware implementation, however, is almost identical with two fundamentaldifferences. The first is the frequency of operation and the second is that thestart-up and wall-conditioning system does not require steerable injection.
4.8.5.3 Confinement boundaries
The primary confinement is composed of the lip seal between the mirror shieldblock and vacuum vessel port, waveguides and windows. In each waveguide awindow will be used as the primary tritium and vacuum confinement boundary,and a fast-acting isolation valve will be used for secondary tritium confinement.A maintenance valve located on the plasma side of the window is used not onlyduring maintenance operations on the window and isolation valve, but also tofurther isolate the torus when the EC H&CD system is off-line.
4.8.5.4 System description
Optics are located as close to the first wall as practical in order to achieve thesteering capability required to provide optimization of the location of the currentdrive. Due to the disadvantages of locating an optic in the blanket, an injectionpoint at the foremost part of the port has been chosen.
The transition from the ex-vessel to in-vessel transmission system is defined bythe boundary between the torus vacuum and the external environment.Waveguide is used to transmit the millimeter wave power through theequatorial port. Radial motion between the vacuum vessel and the cryostat ispermitted by the use of a bellows section. For transverse motion the waveguidemechanically distorts between two fixed ends, one rigidly attached to the vacuumvessel and the other rigidly attached to the cryostat. The resulting modeconversion can be minimized through proper choice of the length and diameterof the waveguide.
The waveguide beam illuminates a fixed mirror which deflects the powerdownward onto a toroidally steerable mirror as shown in Figure 4.8.5.2-1. Thevertical axis of rotation allows the beam to be steered toroidally for heating andcurrent drive applications. Power is injected into the plasma through a slottedblanket-shield module which is mechanically attached to the port plug assemblywith flexible plates. The elevation of the waveguide changes twice as it passesthrough the port plug, thereby forming a labyrinth. Shielding is staggered insuch a way that no line-of-sight exists between the first wall and the bioshield.
FDR-ITER Plant Design Description Chapter II-Section 4.8-Page 11

This shielding configuration is sufficient to allow hands on maintenance at thelocation of the primary closure plate.
The steerable optic is plasma facing and, as a consequence of the added RF Ohmiclosses, the most mechanically and thermally stressed transmission element. Thecombination of the volumetric nuclear heat load, plasma radiative and particleheat fluxes, and RF Ohmic loss lead to an operating surface temperature in therange of 240°C. The peak Ohmic losses (2-3 MW/m2) dominate. The higher heatflux results if beryllium (used to cover most of the interior of the machine) isassumed to coat the surface of the optic.
A similar arrangement is used for the start-up and wall conditioning system.Studies show that a fixed toroidal injection angle of ~ 20° is preferable toperpendicular injection.
Power generated by a gyrotron passes through the tube output window and isoptically transmitted to the RF conditioning system which performs severalfunctions: it absorbs spurious power generated by the tube and its internal modeconverters, it adjusts the polarization of the beam by means of two corrugatedoptics, it converts the Gaussian-like mode to a true TEMoo mode by means of oneor more optics, it switches the beam between a dummy load for off-line testing ofthe gyrotron and the waveguide transmission system, and it shapes and injectsthe beam into the waveguide transmission system.
Once the power has been converted to the HEn mode, an evacuated corrugatedwaveguide (165 m long) is used to transmit the nominal 1 MW power to thetorus.
Gyrotrons, a type of high power millimeter wave electron tube, are used as thesources of the EC RF power. They have been selected for ITER due to theirdemonstrated ability to deliver high power for long pulses with high efficiencywhen operated with a depressed collector (a passive converter of kinetic energyin the spent electron beam into potential electric energy which reduces theamount of power dissipated as heat and increases the overall efficiency). Thephysics requirements, compounded with the unique engineering constraints ofITER, necessitate the development of advanced gyrotron sources. The R&D goalis to develop 1 MW, steady-state, > 50% efficient, 170 GHz gyrotrons.
To deliver the requisite power, 68 tubes, each generating 1 MW of power, will beneeded. These will be arrayed in 17 pods - a group of 4 gyrotrons having acommon power supply and control system. Tunable sources are anticipated forthe start up and wall conditioning (SU&WC) system. The ability to operate atmultiple frequencies with a single tube simplifies and reduces the cost of thissystem while at the same time maximizing the system capabilities.
FDR-ITER Plant Design Description Chapter II-Section 4.8-Page 12

4.8.5.5 Maintenance
In order to simplify the remote maintenance of the EC H&CD system and to testit before installation in the port, the in-vessel transmission component chainwill be assembled from two separate modules:
• port plug assembly;
• waveguide and window block assembly.
The port plug assembly, functions generically as all other equatorial modules.The waveguide and window block assembly spans the interspace between thecryostat and primary closure plate and is joined to the port plug with a lip sealweld. The window block sub-assembly is accessible from the pit and is designedfor complete hands-on maintenance.
4.8.5.6 Design assessment and key issues
(1) The feasibility of the EC H&CD system relies on the development of 170 GHz,1 MW, steady-state, high-efficiency sources and windows for use on the tubes andtorus. The development program has been very successful in this regard. Keygyrotron performance parameters have been demonstrated individually to dateand demonstration of a long-pulse high-power 170 GHz tube equipped with adiamond window is expected by the end of the EDA. Within the past four yearsof the EDA the following have been achieved:
• 3.6 MJ at 170 GHz in long pulse (8 s) operation;
• Demonstration of a depressed collector at 100,140, and 170 GHz;
• Demonstration of CW operation at 110 GHz;
• Demonstration of 1 MW output at up to 2 s and at 170 GHz.
Thus the major tube performance parameters have all been achieved, albeit notsimultaneously in a single tube. Table 4.8.5.6-1 lists ITER-relevant gyrotronresults.
(2) Windows are the second critical technology. A single disk, polycrystallinediamond, edge-cooled window is used for the reference design. In addition, thereare three alternative, megawatt window concepts: cryogenic windows, Au-doped(high-resistivity) silicon windows, and the distributed window (slotted grill-likestructure made of alternating thin sapphire bars brazed to metallic, micro-channel cooled, heat sinks). With several viable options, the required windowfor the tube will also be available for the ITER torus.
One of the major successes of the development program has been thedemonstration of the technology to manufacture large diameter diamond diskwindows, to bond the disks to metal tubes and to bake them out. A complete
FDR-ITER Plant Design Description Chapter II-Section 4.8-Page 13

window assembly has been fabricated and is currently being installed on a tube.The material quality has been improved to the point that 2 MW CW windowsare theoretically feasible.
(3) The steerable optic requires special attention. Although steerable optics areemployed on almost all EC systems in use today, a particularly robust designmust be developed in order to assure reliability in the ITER environment.Accessibility will be limited due to its location well within the port, and althoughit is located behind the first wall, the optic and actuation system are still subject tonuclear heat loads and disruption forces. Therefore, prototyping and testing ofthis component will be essential.
TABLE 4.8.5.6-1ITER-Relevant Gyrotron Results
Frequency(GHz)
170.0+
170.0+
170.0+
170.0+
170.0+
170.0+
170.0+
170.0+
170.0+
140.0
140.0
140.0
140.0
118.0
110.0
110.0
110.0
110.0
CavityMode
TE3i,8
TE25,10
TE25,10
TE25,10TE3i,8
TE3i,8
TE3i,8
TE3i,8
TE3i,8
TE22,6
TE22,6
TE22,6
TE22,6
TE22,6
TEi9,5TEi9 / 5
TE22,6
TE22,6
Power(MW)
0.450
1.00§
0.75
0.66
0.52
0.53
0.23
0.21
0.23
0.96§
0.55
0.80
0.15
0.48
0.35
0.95§
0.35
0.106
Efficiency(%)
18
31
32
32
19
32*
20
19
20
42
42
50*
44
30
35
40
32.
32
PulseLength
(s)
8.0+
1.0
1.8
1.6
0.6
0.6
2.2
4.0
2.2
1.2
3.0
1.0
10.0+
5.010.0+
2.010.0+
SS+
EnergyOutput
(MJ)3.60*
1.00
1.20*
1.19*
0.32
0.32
0.51
0.84
0.51
1.15*
1.65*
0.80
1.50*
2.40*
3.30*
1.90*
3.50*
-1000+
+170 GHz result§MW level long pulse*High Efficiency operation with single stage depressed collector*MJ or greater energy output+Steady-state or long-pulse result
FDR-ITER Plant Design Description Chapter II-Section 4.8-Page 14

4.8.6 Lower hybrid heating and current drive (LH H&CD) system
4.8.6.1 System performance
The LH H&CD system is designed to deliver to the ITER plasma a total power of50 MW at 5 GHz. The system is composed of 2 launcher plugs installed in twoequatorial ports. Each launcher plug is connected to 8 main transmission lines(MTL) fed by 8 LH generator units of 4 klystrons. The output power of eachklystron is 1 MW CW. The total installed power is therefore 64 MW, the loss inthe MTL and the launcher plug being of the order of 0.7 dB (15%).
4.8.6.2 Major components
The main system components are:
• one launcher plug per port, composed of an antenna plug inside thetorus primary vacuum, and of a secondary plug between the vessel andthe cryostat flanges;
• eight main transmission lines (MTL) per port composed of a splittingnetwork (SN), a circular transmission line (CTL) and a recombiningnetwork (RN);
• one LH power plant composed of RF power sources, an RF monitoringand control system and high voltage power supplies (HVDC).
Each antenna plug is composed of:
• four modules of Passive-Active Multifunction (PAM) waveguidearrays, (each with 28 active and 29 passive waveguide arrays), eachPAM module is fed by one hyperguide; the four PAMS are weldedtogether to constitute a rigid assembly facing the plasma;
• three rows of four columns of mode converters (MC) per module (48 intotal) terminated upstream by short sections of standard waveguidespenetrating through the primary vacuum door;
• twelve RF double ceramic disk windows per module, (48 in total) withleak detection capability in the interspace, situated at the rear of theprimary vacuum flange;
• Instrumentation (RF measurements, arc detectors, thermalmeasurements);
FDR-ITER Plant Design Description Chapter H-Section 4.8-Page 15

The secondary plug is composed of:
• sections of standard waveguides: the vacuum transmission line (VTL)(12 per module, 48 in total) penetrating through the secondary closureplate;
• twelve secondary RF vacuum windows per module, (48 in total),situated at the rear of the cryostat closure plate.
For the MTL:
• the splitting network (SN) section runs from the cryostat wall to thecircular transmission line. Each MTL feeds 6 vacuum transmissionlines (VTL) through its SN;
• the circular transmission line (CTL) section runs about 100 m from thesplitting network to near the LH klystrons;
• the recombining network (RN) section, collects the power from fourindividual klystrons to feed each CTL.
4.8.6.3 Confinement boundaries
The primary confinement boundary for the LH H&CD system is provided by theport flange and by the ceramic discs of a double RF window. The cryostat flangeand a single RF window provide the secondary confinement boundary.
4.8.6.4 System description
The LH power sources are high power CW klystrons. The klystrons operate at afixed frequency (5 GHz) with a narrow bandwidth (5 MHz). The efficiency isgreater than 60% and the gain 53 dB. Feedback loops are used to control theoutput power and phase of each klystron. The RF power of each klystron iscontrolled within ± 1%, and the RF phase within ± 2°. The klystron can supporta high reflection coefficient (< 2.8% at the klystron output) and does not requirethe addition of a high power circulator. The klystrons can be connected either tothe antenna or to a dummy load through a RF switch for power testing.
The CTL is a CIO standard, 215 mm diameter waveguide, of nominal power4 MW and transmitting the TEoi circular mode.
The layout of the launcher plug is shown in Figure 4.8.6.2-1.
The plasma facing component of the antenna is a new type of waveguide arraywhich couples a high power density to the plasma: the PAM grill, developed towithstand ITER first wall conditions. The PAM is derived from theconventional antenna, but with considerably enhanced robustness and activecooling close to the mouth. It presents a bulky front face, with relatively thick
FDR-ITER Plant Design Description Chapter II-Section 4.8-Page 16

walls and narrow waveguide apertures. The PAM assemblies constitute anefficient neutron and radiation shielding.
All other components of the launcher plug have been either used in high powerLH experiments (e.g., remote handling RF windows at JET), or are advancedcomponents simplifying the design and improving its reliability, such as modeconverters and hyperguides which have been already tested successfully.
4.8.6.5 Maintenance
The launcher plug is designed to be tested fully assembled before installation andto be removed by remote handling through an equatorial port.
The vacuum window replacement must also be done remotely. The sections ofMTL in the pit and the bioshield are designed to facilitate access and docking ofthe RH cask to the cryostat flange.
4.8.6.6 Design assessment and key issues
The design of the launcher plug is based on new concepts which need to be testedat full scale. An active voluntary R&D programme is underway in the EU todevelop and experimentally test in-plug components meeting ITERrequirements with the aims:
• to prove the robustness, availability, lifetime and maintainability of theplasma facing components (PAM modules);
• to develop a simple and reliable design of the in-plug power splittingand phasing network (a newly developed mode converter andhyperguide is under construction for Tore Supra);
All ex-vessel components of the LHH&CD System are based on technologicallymature building blocks which can meet ITER needs already or with limitedupgrades (this includes klystrons, transmission lines, vacuum windows, etc.).However, the system design needs further detailing and validation through R&Don the following items:
• development of a 5 GHz high power (1 MW), high efficiency (> 60%)CW klystron for ITER: klystron development was undertaken butdiscontinued in Japan (tests were conducted successfully in short pulsesof 15 ms, at the level of 0.85 MW, with an efficiency of 65%), and a4 MW, short pulse, 5.7 GHz klystron exists in the EU;
• development and test of the splitting and recombining network system.
FDR-ITER Plant Design Description Chapter Il-Section 4.8-Page 17

4.8.7 Additional heating power supplies
4.8.7.1 Performance
The additional heating power system (AHPS) receives power from the AC powerdistribution system, at medium voltage, and converts it into DC power neededfor feeding, for example:
• the anodes of the IC H&CD system driver stage and end stage tetrodes;
• the cathodes of the EC H&CD and startup system gyrotrons;
• the cathodes of the LH H&CD klystrons;
• the accelerators of the NBI injector sources.
The total power to be delivered to the plasma from the chosen combination ofheating systems is 100 MW. Assuming the overall efficiency of the heatingsystem is 33%, the total peak power demand on the pulsed AC power system willbe around 300 MW. This power is to be received from a supply grid. Differingrequirements have led to the use of separate power supply technologies for eachof the heating systems. These power systems are briefly described below.
4.8.7.2 IC H&CD power supply
The need to actively modulate the voltage applied to the IC H&CD generators hasled to the use of the pulse step modulator (PSM) technology for this powersupply. The PSM uses 52 separate voltage steps which can be electronicallyswitched in and out of the circuit. In this way the output voltage can be rapidlyvaried to meet the voltage requirements of the tetrode tube. Load protection isaccomplished by rapidly (< 10 /zs) switching off all voltage steps. A one linediagram showing the major features of this power supply is shown inFigure 4.8.7-1. A table listing the salient features of the main power supply isgiven in Table 4.8.7-1. The IC H&CD system includes other DC supplies, forinstance for the filament, screen, control grid and anode supplies of the lowpower tetrodes which are an integral part of the RF transmitter.
FDR-ITER Plant Design Description Chapter II-Section 4.8-Page 18

TABLE 4.8.7-1IC H&CD Power Supply Parameters
Number of power supply units for 32 tetrodes
Rated power (each unit)
Output voltage/current of main supply
Output voltage/current of driver stage
Voltage regulation
Power factor
Number of steps/Voltage per step
EfficiencyProtection time
32
3.0 MW
5-26 kV/0-110 A
3-18 kV/0-20 A
±1%0.92
52/700 V95%
< 1 0 J J S
4.8.7.3 EC H&CD power supply
The EC H&CD and startup system typically operates at a fixed voltage and onlyrequires the ability to adjust this voltage over a small range. Therefore, a moreconventional power supply design can be used. The power supply consists of a12 pulse transformer with a diode rectifier and a thyristor phase controlconverter placed in series. The phase control converter is used to compensate forline-induced voltage variations which can be up to +4%, -12% of the nominalvoltage. The power supply has a capacitor filter bank on the output and isprotected with an electronic Insulated Gate Bipolar Transistor (IGBT) turn-offswitch in series with the main power supply. An additional power supply, calledthe acceleration power supply, is required to provide a 90 kV bias to the tubebody. This power supply requires a smaller current (0.1 A) but better regulationthan the main power supply.
Because the power supply voltage is fixed during a pulse, the capability exists tooperate several gyrotron tubes in parallel from one power supply. Four gyrotrontubes are presently anticipated for operation under one power supply. A one linediagram showing the major features of this power supply is shown inFigure 4.8.7-2. A table listing the salient features of the power supply is given inTable 4.8.7-2.
FDR-ITER Plant Design Description Chapter II-Section 4.8-Page 19

TABLE 4.8.7-2EC H&CD and Startup Power Supply Parameters
Number of power supply units
Number of gyrotrons per power supply unit
Rated power (each power supply unit)Output voltage/current of main supplyOutput voltage/current of phase control supply
Output voltage/current of acceleration supply
Voltage regulation of main supply
Voltage regulation of acceleration supply
Power factor
EfficiencyProtection time
15 (H&CD) +2 (Startup)
4
9.0 MW
45-55 kV/0-180 A0-6.6 kV/0-180 A
45-90 kV/0-0.1 A
±5%±0.5%
0.8995%
<10ns
4.8.7.4 NB H&CD power supply
The NB injector power supply provides the accelerating voltage potentials to fiveseparate grids in the NB injector source. Supply voltages range from 0 to 1 MVin 200 kV increments. Each NB injector power supply is located in the NB HVarea and is supplied by its own AC/DC power supply with an installed power ofabout 65 MVA. The design to provide 1 MV is based on: AC/DC/AC frequencyand voltage conversion, oil insulated step-up transformers and SF6 gas-insulatedDC rectification system. The resultant output power is then transmitted to theNB injector source on a multi-axial, gas-insulated, HV transmission line. TheHV auxiliary NB injector power supplies consist of controllers and 1 MVinsulation transformers, located in the NB HV area, and transformers and dioderectifier, located in a high voltage deck attached to the transmission line near theNB injector source. A one line diagram showing the major features of thispower supply is shown in Figure 4.8.7-3. A table listing the salient features of thepower supply is given in Table 4.8.7-3.
FDR-ITER Plant Design Description Chapter II-Section 4.8-Page 20

TABLE 4.8.7-3NB Injection Power Supply Parameters
Number of power supply units
Rated power (each unit)Output voltage/ current of main supply
Output voltage/ current of grid 1 supply
Output voltage/current of grid 2 supply
Output voltage/current of grid 3 supply
Output voltage/current of grid 4 supply
Voltage regulation
HV Auxiliary power supplies
LV Auxiliary power supplies
Power factorEfficiency
Protection time
346 MW
1000kV/59A800kV/12A
600kV/4A
400kV/2A
200kV/lA
+ 5%
1.7 MW
5.2 MW
0.86
93%< 200 us
4.8.7.5 LH H&CD power supply
Regulated and variable high voltage DC power supply units are required to biasthe klystron cathodes. Four klystrons are supplied in parallel by one singleHVDC supply unit.
The HVDCPS will be installed in a remote location (typically 200 m from theklystrons ), while the protection crowbar systems are located near the klystrons.Preliminary power supply parameters for the LH H&CD system (pending furtherstudies of their integration into the ITER additional heating power supplies) aregiven in Table 4.8.7-4.
TABLE 4.8.7-4LH H&CD Power Supply Parameters
Number of power supply units
Number of klystrons per power supply unit
Rated power (each power supply unit)Output voltage of main supply
Output current of main supply
Voltage regulation of main supply
Power factorEfficiency
Protection time
16
48MW80 kV
0-100 A
+ 2%
0.95
95%<20us
FDR-ITER Plant Design Description Chapter H-Section 4.8-Page 21

4.8.7.6 Design assessment
The IC H&CD, EC H&CD, and LH H&CD power supplies have little design risk.The IC H&CD system power supply, while innovative, is being commerciallyproduced. The EC H&CD and LH H&CD system power supplies are based onconventional power supply technology.
The situation is different for the NB H&CD power supply. This power supply iswithout precedent. While the design concepts can be scaled from the similar NBpower supply system on JT-60U, R&D is necessary for design validation.
FDR-ITER Plant Design Description Chapter II-Section 4.8-Page 22

Low voltage,high current,power supplies
V
Ion source
/Insulating gas|^system )
HVdeck Transmission line 1
Magnetic fieldcompensation coil
\i
-600W-Mfflfl
I -20QkV
HV powersupply AC power
Beam steeringmechanism
Passive magnetic shield
Retractable calorimeter<(<18MW total)
Error fieldcorrection coil/
Neutraliser(<8MW directinterception)
Ion deflectorand collector(<17MW total!
Beam steeringpower supply
Ion deflectorpower supply
Correction coilpower supply
FIGURE 4.8.3-1 Sdiematic Overview of the Neutral Beam System

at tmf fBtmrl
PASSIVE UAGNETIC SHIELDSOFT IRON
RESIDUAL ION DUUP
J NFUTRAl ISER
V VACUUM VESSEL
PRESSURE vesselfas imuLMlnt teut iajttrt t
COMPENSATION COIISt
Fig. 4.8.3-2 Overall Assembly of the ITER NB H&CD systemN 53 GR 280 97-11-07 W 0.1

Primary Confinement
Secondary Confinement \
Figure 4.8.3-3 Schematic of the NB Injector (NBI) confinement barriers


Figure 4.85.2-1 EC H&CD Port Plug

Secondary Windows jS^
Secondary Vacuum door „
Cooling Pipes
Figure 4.8.6.2-1LH Launcher Plug

5-26 kV
3-18 kV
Fig 4.8.7-1 IC H&CD Power Supply One Line Diagram
(52 individually switched power supplies are represented)

Delta/ WyeTransformer
CircuitBreaker
VoltageTransformer Regulator Transformer
Filter
Rectifier
Filter
^ f Rectifier
ProtectionSwitch
To Kgh ^ ^ i-t-1Frequency^_(7y) b cInverter v o ^ CU
- • - 55 kV
AccelerationPower Supply
• - 90 kV
- • Ground
Fig # 4.8.7-2. One-line diagram of ECH&CD power supply

-1,000 kV
RectiHer AC/DCTransformer Converter
DC/AC HV TransformerInverters and Rectifier
Figure 4.8.7-3 NB H&CD Power Supply One Line Diagram
(Auxiliary power supplies are not shown)

INTERNATIONAL THERMONUCLEAR EXPERIMENTAL REACTOR
TECHNICAL BASISFOR THE
ITER FINAL DESIGN REPORT, COSTREVIEW AND SAFETY ANALYSIS
(FDR)
Chapter IISection 5.0
ITER PLANT DESIGN DESCRIPTION
13 July 1998

ITER PLANT DESIGN DESCRIPTIONCHAPTER IISECTION 5.0
TABLE OF CONTENTS
5.0 ITER PLANT SERVICES 1
5.1.1 Steady state electrical switchyard 25.1.2 Steady state electrical distribution system 55.2 Component cooling water system 75.3 Chilled water system 105.4 Potable and fire water system 135.5 Sanitary and industrial sewage 135.6 Steam, condensate and demineralized water 145.7 Compressed air systems 155.8 Breathing air systems 175.9 Nitrogen, helium and specialty gas systems 175.10 Site tunnel layout 185.11 Analytical laboratory 20

5.0 ITER PLANT SERVICES
Plant services includes essential steady state electric power, cooling water, potableand fire water, sewage, gases, steam and demineralized water, analyticallaboratories and others. For many of these systems the requirements andassumptions depend on any pre-existing installations on or near the site, and arecountry dependent. Therefore, the following sections give generic designinformation only.
The site services building will be used to provide space for many of these ITERservices and their operating support. It will house two boilers for process steamand building heating, demineralized water systems, potable water treatmentsystems, compressed and breathing air systems, and electrical power distribution.It will also provide space for waste handling (both normal garbage and toxic, non-radioactive waste), and provide limited space for warehousing of spare parts andmachine shops. It will be a steel framed building on a concrete slab at groundlevel.
The steady state electric power network (SSEPN) provides power to all ITER plantelectric loads except magnet and auxiliary heating loads, which are supplied bythe pulsed power supply. The SSEPN detailed design has been advancedsignificantly since the DDR but the general concept remains unchanged. Athorough listing of ITER plant steady state electrical loads was developed andcategorized by operating state, power class, safety class, voltage and location. Thisload list has been extended to include important interface information such asplant location of loads and assignment of load centers. Until such time that a siteis selected, IEC (International Electrical Commission) standard equipmentvoltages have been adopted and 11 kV (nominal) has been selected as the sitedistribution voltage because over 50% of the load is at that voltage.
The loads were segregated into fifteen areas, each serviced by load center. A cabletunnel system was likewise adopted for routing cables between the load centersand the switchyard. A complete conceptual system design, layout and list ofequipment/ cables has been achieved down to the 0.48 kV level. A short circuitanalysis has been completed, confirming that adequate protection is provided bythe breaker system. Cable layout and conductor sizing was completed to all loadcenters. Where appropriate cable layout was continued to a distribution panel ormotor control center dose to the equipment.
The emergency power supply was modified to include diesel generators ratherthan gas turbines for reasons of cost savings, reliability and availability. Thesystem reliability was improved at modest cost by using four one-third capacitydiesels (allows one diesel failure) and prioritizing the emergency loads. Theemergency power supply building was designed and equipment layout wascompleted.
The diagram illustrating the current system configuration and major interfaces isshown in Figure 5.1-1.
FDR-ITER Plant Design Description Chapter II-Section 5.0-Page 1

The SSEPN receives power from two independent transmission lines to preventgrid upsets in one system from affecting the other. Each of these two lines iscapable of supplying the entire plant maximum steady state load. Power fromthe grid is assumed to be received at 220 kV.
The plant power categories are classified as follows:
• Class I: Uninterruptable DC;
• Class II: Uninterruptable AC;
• Class III: Emergency AC power (Temporarily Interruptable > 30 s);
• Class IV: AC (grid) power - Indefinitely Interruptable.
Class I and II battery system power supplies are located throughout the ITERplant and are included in the systems that they supply. A breakdown of Class IIIand IV active power load by WBS for the pulse and dwell phases of the plantplasma operation state, and the plant shutdown operating state, is given inTable 5.1-1.
System capacity margin allows for a safety factor and provides space and cablerouting for future growth. The design power factor is 85%, althoughcompensation is added to increase the power factor to ~95%. Table 5.1-2 gives theSSEPN Class III and IV apparent power design loads.
The SSEPN is divided into two subsystems: the steady state switchyard and thesteady state distribution system.
5.1.1 Steady state electrical switchyard
The steady state electrical switchyard has three main functions:
• To provide Class IV AC power for distribution to ITER plant loads;
• To provide Class III emergency power for distribution to selected ITERplant loads;
• To provide monitoring, control and protection of electric powersources and distribution.
The switchgear enables cross connection of transmission lines to the main step-down transformers if one line fails. Each of the incoming 220 kV transmissionlines is connected to a transformer, rated at 140 MVA, to step down the voltage to11 kV for distribution to ITER load centers. Therefore, a total of two step-downtransformers supply Class IV power to four paired main distribution buses. Eachpaired bus has two normally isolated sections supplied by one of the 11 kV supplylines. In the event of their failure, the isolated sections are automaticallyconnected to maintain power to the bus.
FDR-ITER Plant Design Description Chapter II-Section 5.0-Page 2

TABLE 5.1-1SSEPN Class III and IV Loads by WBS
WBS
1.11.21 31.51.61.71.81.92.12.2
2.32.42.6
2.73.13.23.4
3.5
4.1
4.2
4.34.5
4.75.15.25.35.4
5.55.66.16.26.3
6.4
6.56.6
6.7
6.8
System
TF Coils SystemPF Coils SystemsCentral SolenoidVacuum VesselBlanket SystemDivertorFuellingPlasmaMachine LayoutMachine Assembly £cToolingRemote HandlingCryostatPrimary HeatTransfer SystemsThermal ShieldsVacuum PumpingTritium PlantCryoplant &CryodistribuSonHeat RejectionSystemsCoil Power Supply &DistributionAdditional HeatingPower SuppliesSSEPNSupervisory ControlSystemPoloidal Field ControlICRFECRHNBIOther Heating &Current DriveDiagnosticsTest BlanketsSiteBuildingsWaste Treatment &StorageRadiologicalProtectionLiquid DistributionGas Distribution andCompressorsGeneral Tes t ingEquipmentSampling SystemsTOTALS
No. ofPower-dEqpml.
961361632328
59000
46948
1,072
123,301575414
211
131
12
387650
00
1286464
0500240
17,137
440
355354
118
025
26,870
Class III Power
Plant State
POS(kW)
38546
13266
10000
021
140
14376
2,75862
410
1,250
330
405151
00
523232
0400
120
501
0
13143
0
00
7,273
STS(kW)
38546
13266
10000
02191
21315531
50
800
330
225151
00
523232
0400
1200
0
426
0
00
2,599
LTM(kW)
3854
613266
10000
5052191
21315531
50
800
330
225151
00
523232
0100
000
9
426
0
00
2,801
Class IV Power
Plant State
POS(kW)
38546
13266
395000
041
46,530
141,2103,811
47,786
18,339
2,850
390
555151
00
6,2923232
02,000
120
14,185
1,282
20214,381
2,160
023
162,818
TCS/SM(kW>
38546
13266
687000
89344
17,531
141,2103,812
18,271
6,480
2350
390
555151
00
523232
02,000
120
15,995
1,282
20215,386
2,160
023
90,208
STS(kW)
38546
13266
260000
044
3,852
141,2093,814
36,064
6,482
2^50
390
555151
00
533232
02,001
120
14,296
1,284
20213,042
2,160
023
88,968
LTM(kW)
3854
613266
260000
3,74767
4,653
141,0393,813
18,610
5,750
900
390
555151
000
3232
0500
00
20,083
1,476
20213,042
2,160
023
77,644
Cons-
rruction(kW)
0000000000
000
0790
7,528
160
35,000
0
580
00000
0000
15^95
0
00
0
00
58,720
FDR-ITER Plant Design Description Chapter II-Section 5.0-Page 3

TABLE 5.1-2SSEPN Design Loads
Electric Power and Load Characteristics
Total Active Power, MW
Safety Factor Allowance, MW
Design Active Power, MWPower Factor
Design Load, MVALoad Growth Allowance, MVA
Total Design Load, MVA
Class III
12.4
1.2
13.60.85
16.0
2.4
18.4
Class IV
165
25
1900.8522456
280
The SSEPN provides also Class III emergency power to selected loads in the eventof a loss of off-site power. The system uses two separate 11 kV distribution busesnormally supplied from Class IV power buses. The 18.4 MVA load is dividedbetween the two buses. Loads requiring redundancy utilize each bus.
Backup power is provided by two pairs of diesel generators with each pairsupplying one of two separate 11 kV Class III buses. Each generator is rated at6.1 MVA at 11 kV. The loads on each emergency bus are divided into twopriority levels, short-term and longer-term depending on the length of time theloads can tolerate loss of power. The short-term loads are allocated to specificClass III buses and have priority in load sequencing during startup of the dieselgenerators. Lower priority, longer-term loads can be manually cross connected tothe other Class III bus in the event of a single diesel generator failure. In thismanner, three of four diesel generators will sustain the total emergency load.
The diesel generators are located adjacent to the switchyard. Each prime moveris rated at 5200 kW at site conditions (38°C and 1,500 m altitude). The 50 Hz,air-cooled generators are directly coupled to the diesel and have a voltage ratingof 11 kV. The units are fitted with pre-lubrication systems to enable start andloading within 30 seconds. The units are pneumatically started. Sufficientcompressed air storage is provided in the emergency power supply building toenable five starting attempts per unit. The compressed air cylinders can berefilled from the site compressed air system for additional start attempts.
One "day tank" is provide for each pair of diesels. The tanks are sized for aminimum of 32 hour operation per generator at full load. Preservatives areadded to the fuel to prevent degradation.
A grounding grid is embedded within the perimeter of the switchyard,equipment is connected to the grounding grid.
All
FDR-ITER Plant Design Description Chapter II-Section 5.0-Page 4

5.1.2 Steady state electrical distribution system
The steady state electrical distribution system distributes AC electrical powerfrom the switchyard to ITER plant electrical equipment during all operatingmodes. The system includes:
• Site power distribution cabling;
• Load centers;
• Local power distribution cabling;
• Local building and equipment switchgear.
The site power distribution cabling distributes Class IV AC power at 11 kV fromthe eight main distribution buses in the switchyard to nine load centers atconvenient locations within the ITER site. An estimated 235 MVA is connectedwith spare cable routing space to accommodate 294 MVA. The site powerdistribution cabling also distributes Class III emergency AC power to the loadcenters via separate cabling from Class IV power.
All site power distribution cabling is routed underground in utility tunnels andcable conduits. Layout of these tunnels and conduit is shown on the FTER sitemap Figure 5.1.2-1. The tunnels have isolatable sections, each with ventilation,fire protection and drain systems.
The load centers are located within buildings or enclosed structures, as shown onthe ITER site map. The load centers contain step-down transformers for deliveryof Class IV power at 3.3 and 0.48 kV (nominal), in addition to 11 kV. Some large11 kV equipment is directly connected to the main distribution bus. Other 11 kVequipment is connected to 11 kV buses within the load centers.
Separate step-down transformers are provided for Class HI emergency power at3.3 and 0.48 kV as required. The load centers also contain local load managementand protective switchgear which is controlled from the control room.
Step-down single phase transformers to 240 and 120 V, and associateddistribution within the buildings, are not part of the distribution system but areincluded within the scope of the associated building.
FDR-UER Plant Design Description Chapter II-Section 5.0-Page 5

*******************************.
VAVAZ'A'A'A'A-.'.VAVA'AVA'A'A:W'A'A'A'A'A'A:
•,*. f4 '**, , 11 ft************************//******/**/*ft•*. ** / / */
111
FIGURE 5.1.2-1Site Map Showing 11 kV Routing in Tunnels and Location
of LCs, MCCs and BDPs
FDR-ITER Plant Design Description Chapter Il-Section 5.0-Page 6

5.2 Component cooling water system
The component cooling water system (CCWS) removes heat from large processcomponents, where this is not removed by the tokamak water cooling system(Section 4.6). The CCWS transports heat from the components to the heatrejection system (HRS), which is the ultimate heat sink. The system provideshigh quality cooling water where necessary for components with sensitive waterchemistry needs. The system is partitioned into five cooling zones. Thesecooling zones are, in-turn, subdivided into individual cooling loops, whichservice specific systems. Table 5.2-1 gives the heat loads for each zone andcooling loop.
Zones 1 and 2 provide cooling service to components in the tokamak buildings,the tokamak service buildings and other buildings. Zone 3 is dedicated to thepulsed power supply and high voltage plasma heating system and providescooling for AC /DC converters, DC inductors, busbars, switching network andECH system. Zone 4 provides cooling service to hot cell equipment and radwastebuilding. Zone 5 provides cooling to the site service building and cooling towersystem, which include large compressors and pump motors.
The CCWS has very complex cooling circuits. As a typical example, Figure 5.2-1shows the process flow schematic for the Power Supply Zone (Zone 3) withdetails for the EC gyrotron and transmission line cooling. Zone 3 has sevenseparate cooling loops, each of which interfaces with the Heat Rejection SystemLoop 5-C through heat exchangers as shown in Figure 5.2-l(a). One of thesecooling loops is dedicated to the EC gyrotrons and RF transmission lines. Figure5.2-1 (b) shows that this circuit is subdivided in 18 sub-circuits for cooling thegyrotron pods plus an additional sub-circuit for cooling the transmission line.Each gyrotron pod consists of four gyrotron units. Figure 5.2-1 (c) shows thecooling arrangement for each pod with separate parallel cooling connections tothe individual components within each gyrotron. The gyrotron cooling circuithas a unique feature in that the cavity cooling line pressure drop is very highsuch that separate booster pumps are required for each pod to achieve thenecessary flow rates for this portion of the system.
FDR-ITER Plant Design Description Chapter II-Section 5.0-Page 7

TABLE 5.2-1Component Cooling Water System — Cooling Zones, Loops and Heat Loads
CCWS Zone/Loop Loop Number
1 - East Tokamak Zone2 - West Tokamak Zone
ICRF Loop (Tetrodes etc.)ICRF Power Supply LoopNBI Power Supply Loop
CCW-2ACCW-2BCCW-2C
3 - Power SupplyAC/DC + Inductor Loop(N-MPCB)AC/DC+Inductor Loop(S-MPCB)Busbars LoopSW Network LoopTF Fast discharge switching unitsECH Gyrotron LoopECH Power Supply Loop
CCW-3ACCW-3BCCW-3CCCW-3DCCW-3ECCW-3GCCW-3H
4-HotCell Zone5 - Site Service Zone
Component LoopTotal
CCW-5A
Zone HeatLoad (MWt)
0*
53.3
97.56
0[l]2.00
153
Loop HeatLoad (MWt)
50.002.103.20
7.46.413.30.661.667
1.20
2.00153
NOTE: [1] Currently, no heat loads arespecified for these zones
As typical for all CCWS cooling circuits, the water quality must be controlled tolow impurity levels. In the case of the gyrotron cooling circuit the conductivitymust be maintained below 10 kQ-m. This is achieved with a partial-flowdemineralizer unit driven by the main pump pressure head as shown inFigure 5.2-l(b). Because of the high quality water, corrosion resistant materialsare used for pumps, piping and valves. In general, 3O4SS is used for pumps, pipeand valves above 8 cm and CPVC is used for pipe and valves below 8 cm. TheCPVC also provides electrical isolation of components.
FDR-ITER Plant Design Description Chapter II-Section 5.0-Page 8

FIGURE 5.2-l(a)Basic Configuration CCW Power Supply Zone
FIGURE 5.2-l(b)Gyrotron and Transmission Line Cooling Portion
of CCW Power Supply Zone
FDR-ITER Plant Design Description Chapter H-Section 5.0-Page 9

•P0D#-1 •
•O
—ca—-[ET
F F3-
IH
• * * •
^ • " •
5.3
FIGURE 5.2-l(c)ECH Gyrotron Pod Cooling Circuit Portion of CCw
Chilled water system
The chilled water system services components which require coolingtemperatures lower than can be provided by the CCWS and circulating watersystem. The chilled water system utilizes industrial chiller units to providecooling water at 6°C with a return temperature of 12°C. The heat from thechilled water system is rejected to the circulating water system. As in the case ofthe CCWS, the chilled water system concept is partitioned into five coolingzones. Each cooling zone, in-turn is composed of one or more cooling loops.Table 5.3-1 gives the heat loads for each zone and cooling loop.
FDR-ITER Plant Design Description Chapter II-Section 5.0-Page 10

TABLE 5.3-1Chilled Water System — Cooling Zones, Loops and Heat Loads
Zone
EastTokamak
WestTokamak
Power Supply
Hot Cell
Site Services
SafetyRelatedChilledWater
Total Heat
Sub-system(Chiller Unit)
1Loop-IA
Loop-IB
2Loop-2A
Loop-2B3
Loop-3A
Loop-3B
4(Loop-4)
5Loop-5A
Loop-5B6
(Loop-6)
Interface
- Tokamak Buildings HVAC/ East- East Tokamak Service Bldg. HVAC- NBI HV PHTS
- Tokamak Buildings HVAC/ West- West Tokamak Service Bldg. HVAC
- HTS Vault Cooler: normal
- MPSSNB HVAC- N. MPCB HVAC- S. MPCB HVAC- NBI PCB HVAC- RF PSB HVAC- Pulse Power Supply Switchgear- Cryoplant Compress. HVAC- Cryoplant cold box HVAC- Emergency PWR Building- Steady State Supply Switchgear- Hot Cell Building HVAC- Radwaste Building HVAC- Tokamak Access Building HVAC- Personnel Access Control BuildingHVAC
- Laboratory Office Building HVAC- Control Building HVAC- Site Service Building HVAC- PF coil fabrication Bldg HVAC- Personnel building inner/ outer
- HTS Vault Cooler:(PostLOCA cooling)
Heat LoadMW
(Loop Load)
13.12(10.12)
(3.0)
4.44
(3.14)
(1.30)4.08
(0.84)
(3.24)
7.57
9.32
(7.06)
(2.26)1.3
39.84
FDR-ITER Plant Design Description Chapter II-Section 5.0-Page 11

FIGURE 5.3-1Process Flow Diagram of Loop 3A
of the Power Supply Zone Chilled Water System
The main cooling loads are the HVAC systems. Zone 2 also includes the heattransfer system vault coolers and the NBI-HV chiller.
Figure 5.3-1 shows the process flow diagram of Loop 3A of the Power SupplyZone chilled water system. The system removes the HVAC heat load fromseven buildings. The chiller segment is composed of two 1.5 MWt chiller unitswhich reject 3.6 MWt to the Heat Rejection System through integral heatexchangers. The chilled water is pumped by two 50% pumps to seven parallelcooling circuits, which service the seven HVAC systems. The flows to eachcircuit can be adjusted with orifices (not shown). The material of pumps, pipingsand valves is 3O4SS.
FDR-ITER Plant Design Description Chapter II-Section 5.0-Page 12

5.4 Potable and fire water system
The potable water system supplies and distributes water for human needs (e.g.,kitchens, lavatories, drinking fountains, etc.) throughout the ITER site. Thesystem is sized to supply the needs of 1,500 people, or ~ 400 m3/day. Water issupplied from an off-site utility system, and the water quality meets biologicalstandards for safe drinking water. The water is initially delivered to an on-sitestorage tank, which accommodates fluctuations in usage and/or temporaryoutages of the off-site supply. A site distribution system delivers the water underpressure to interface connections at each building distribution system. Thesystem pressure is ~ 0.8 MPa.
The fire protection water system maintains a pressurized, plant-wide systemwhich can supply water on demand for fire fighting to installed hydrants andsprinkler mains connecting to each building. Figure 5.1.2-1 (site map withutilities) shows the site layout of the fire water distribution system. It is alsocapable of filling and delivering water through a separate backup piping networkwhich is normally dry. The system maintains an on-site inventory of firefighting water capable of 24 hours of continuous fire fighting operation. Themaximum flow rate is 0.4 m3 /s at a pressure of 1.3 MPa. These conditions can bemet at any ten delivery points (hydrants and sprinkling mains) at one time. Thesystem is capable of drawing water from other sources such as the cooling towerbasins after fire fighting water is exhausted. The fire protection water system ispart of the overall ITER fire protection design which includes fire detection, theITER Fire Department, local installed dry chemical or CO2 fire fighting systems,and portable fire extinguishers located throughout the plant.
5.5 Sanitary and industrial sewage
The sanitary and industrial sewage system collects, monitors, treats and releasessewage to an off-site utility sewage system. Figure 5.1.2-1 (site map with utilities)shows the site layout of the sewage system. Both systems consist of gravity flowsewer line networks which transport sewage from buildings to pretreatmentfacilities and holdup tanks located at the southeast corner of the ITER site.
The sanitary sewage system has a total capacity of 200 m3 /d and includes fluidsdrained from lavatories, drinking fountains, kitchens, showers, laundry facilitiesand floors in rooms where these services are located. The sanitary sewage systemis not connected to drains where the possibility of radioactive contaminationexists. Such drains are served by the radioactive liquid drain system.Nevertheless, sanitary sewage system has monitoring and holdup capabilities toprevent unpermitted contaminants from entering the offsite sewage system. Ifnecessary, the sanitary sewage system has enough storage capacity to receive andstore drainage for at least 15 days (3,000 m3 hold-up tank).
The ITER sanitary sewage will be discharged to an off-site receiver pipeline.Depending on the site selection, a range of sanitary sewage pretreatmentrequirements may be imposed by the off-site sewage system. For the EDA, it is
FDR-ITER Plant Design Description Chapter II-Section 5.0-Page 13

assumed that pretreatment will consist of primary filtration. The principalcomponents are: a screen filter, an aeration and equalizing tank, a hold-up tank,an equalizing tank and a transfer pump and line to the offsite sewage system.Macerating equipment could be substituted for the screens if they are notacceptable. To hold 15 days capacity of sanitary sewage, it is necessary to have anaeration unit with the hold up tank and in order to accept a steady flow duringthis period, an equalizing tank is also necessary.
The industrial sewage system has a capacity of 300 m3 /d and includes remainingnon-radioactive floor and equipment drainage where there is no expectation ofbiological waste. The industrial drainage also includes cooling tower blowdown.Activities within the ITER plant are designed to provide a high level ofassurance that sanitary drains are not contaminated with oils, chemicals, ormetals and that industrial drains are not contaminated with biological waste.The industrial waste system has monitoring and holdup capabilities withcapabilities to de-toxify and separate out contaminants prohibited by local utilitysewers. The hold-up capacity of the industrial sewage system is 3,000 m3.
As in the case of the sanitary sewage system, the ITER industrial sewage will bedischarged to an off-site receiver pipeline. Depending on the site selection, arange of pretreatment requirements may be imposed by the utility sewage system.For the EDA, it is assumed that pretreatment will consists of primary filtrationand oil removal. The principal components are: an industrial drain tank, oilseparation unit, a transfer pump and line to the offsite sewage system.
5.6 Steam, condensate and demineralized water
The steam, condensate system supplies and distributes steam to components andsystems (including HVAC) which require auxiliary heating. The system alsocollects and returns condensate to the steam boiler. Steam is generated by the oil(or gas) fired saturated boilers (with a rating of ~ 0.5 MPa) from high qualitycondensate return water. The total system capacity is 30,000 kg/h. Makeup waterto this system is supplied from the demineralized water system. Steam isdistributed to the client systems through a steam pipe network. This networkwill be designed to meet interfacing system requirements at the interfacelocation. To reduce the total flow, it is assumed that the HVAC systems havetheir own condensers. After distribution and use, hot condensed water is cooledto s 100°C and collected in collection tanks and/or the condensate storage tank.From there, condensate is fed to the boiler unit to generate steam.
The demineralized water system supplies and distributes demineralized waterfor process purposes and make-up to cooling systems. The system capacity is300 m3/day at a nominal pressure of 1 MPa. The system uses raw or potablewater as a feed and employs filtration, de-ionization and deaeration equipmentto achieve water quality of 1.0 n.Q-'/cm with dissolved oxygen and chlorineconcentrations less than 0.1 ppm.
FDR-ITER Plant Design Description Chapter II-Section 5.0-Page 14

5.7 Compressed air systems
The compressed air system has two sub-systems, the instrument air system andthe service air system. The instrument air system supplies clean, oil-free and dryair for control valve actuators, power operators and pneumatic controllers. Theservice air system supplies undried, unfiltered air to air-powered tools, air-blastcleaning equipment and aeration equipment. Both instrument air and serviceair are supplied at a nominal pressure 690 kPa(g). The pressure was selected onthe basis of supplying air to an pneumatic air cylinder designed for 552 kPa(g)plus suitable margin for compressor control and line losses.
Both instrument and service air are supplied by eleven compressed air stationslocated at convenient locations within the site with each station serving severalbuildings. The interface point is at the building connection. The buildingsthemselves have their own distribution network. The design capacities andprincipal buildings served by the eleven air stations are given in Table 5.7-1.Figure 5.7-1 shows the process flow arrangement of each compressed air station.
TABLE 5.7-1Compressed Air Station Capacities
Compressed AirSub-System
AS-1EAS-IWAS-2AS-3AS-4AS-5
AS-6E
AS-6W
AS-7
AS-8
AS-9
Location
West Tokamak Services BuildingEast Tokamak Services BuildingTritium BuildingHot Cell BuildingSite Service BuildingCryoplant Coldbox/DewarBuildingEmergency Power SupplyBuildingSteady State SwitchyardSwitchgear BuildingSouth Magnet Power ConversionBuildingMagnet Power Supply SwitchingNetwork BldgITER Control Building
InstrumentCapacitym'/min
60606055
30
5
5
3
12
5
ServiceCapacitym^/min
666
0.50.53
0.5
0.5
0.5(@690kPa)
1.5(@690kPa)
0.5
FDR-ITER Plant Design Description Chapter II-Section 5.0-Page 15

Instrument Air Flow Header Service AirHeader
Purge Air OutletHeallessDryers IDR
CP#2 CP#3 Compressors (3 x 33%)
FIGURE 5.7-1Compressed Air Station Process Flow Arrangement
Each air station employs three 100 percent capacity air compressors. Thecompressors are of the water-cooled, oil-free rotary screw type. The air from thecompressor feeds into three air receivers. Service air is delivered directly fromthe receivers. Instrument air from the receivers discharges into two 100 percentcapacity air dryers units prior to distribution.
FDR-ITER Plant Design Description Chapter II-Section 5.0-Page 16

Each station connects to a dedicated distribution system constructed of stainlesssteel pipe or tubing. Diaphragm isolating valves provided at various locationsfor maintenance. Pressure regulators for pressures lower than 690 kPa areprovided by the building distribution system or using system. Compressed airrequirements that must be supplied continuously for pressures greater thanabout 700 kPa are supplied by compressed air bottles with regulators set to thedesired pressure.
5.8 Breathing air systems
Breathing air is supplied to selected ITER plant locations at nominal pressure of520kPa(g) by a single, centralized system of compressors with a distributionsystem. The locations are those where radioactive and /or hazardous materialsare present. The centralized concept is justified on an economic basis because iteliminates duplication of breathing air system components, and controls areminimized.
Breathing air is used by personnel wearing plastic suits and respirators whenentering contaminated areas. With plastic suits about 80% of the air is used forsuit cooling while the other 20% is for breathing. The system is designed largeenough to accommodate leakage and other losses of up to 5-10%. The systemcapacity is designed to meet the maximum breathing air requirement of work inat least two ITER plant buildings (tokamak and tritium building) at the sametime. The total breathing air capacity is that for 70 persons in plastic suits at onetime and each suit needing 51STP m 3 /h air flow.
The breathing air system consists of three oil-free compressors, two non-cyclingrefrigerated dryers operating in parallel, and three air receivers.
5.9 Nitrogen, helium and specialty gas systems
The total site gas demands are given in Table 5.9-1. Nitrogen and helium aresupplied from storage tanks located just south of the Radwaste Building.Nitrogen is stored as a liquid and vaporized for distribution. Helium is stored inhigh pressure tanks. The storage capacity of each gas is equal to the maximummonthly consumption. The gases are distributed to the client systems via apiping distribution system.
Specialty gases include SF6 for high voltage electrical equipment such as theneutral beam injector, power feeds, and high voltage switchgear, SF6 systemsinclude recovery and purification equipment. The remaining gases have smalldemand rates and are supplied from outdoor bottle stations near the clientsystem equipment.
FDR-UER Plant Design Description Chapter H-Section 5.0-Page 17

TABLE 5.9-1Nitrogen, Helium and Specialty Gas Demands
Gas
Industrial Nitrogen
Industrial Helium
SF6
Ultra-Pure NitrogenUltra-Pure HeliumDeuteriumHydrogenArgonNeon
Supply Capacity203,000 Nm3/month (max.)83,000 Nm3/month(avg.)6,500 Nm3/month(max.)130 Nm3/month(avg.)11,000 kg initial fill;makeup at 110 kg/month5 Nm3/month5 Nm3/month5 Nm3/month25 Nm3/month10 Nm3/month10 Nm3/month
Purity Specification< 0.1% impurity
< 0.1% impurity
Industrial grade
Ultra-high purityUltra-high purityUltra-high purityLaboratory GradeLaboratory GradeLaboratory Grade
5.10 Site tunnel layout
The ITER site employs an underground tunnel /conduit system for distributionof high voltage (11 kV) power cable and signal cable. Figure 5.1.2-1 shows themajor electrical tunnel/conduit routing on the ITER site. Figure 5.10-1 is anillustration of the tunnel design.
FDR-ITER Plant Design Description Chapter II-Section 5.0-Page 18

Grade
TunnelCross- „„Section
Class III Cable(in Fire Enclosure)
Class IV Cable
Grade
VentTower
Overburden
gFire Enclosure for Class III Cable j g
Tunnel Elevation View
Tunnel Plan View
FIGURE 5.10-1Site Distribution Cable Tunnel
Tunnels will be constructed using precast reinforced concrete sections. They willbe engineered to include ventilation, drainage, and fire barriers. Most will beembedded below the surface with a minimum of 1 m overburden. Structuralloads engineered to allow roadways to cross above them.
Electrical tunnels and conduit are at the shallowest level followed by circulatingwater and component cooling water. Sewer lines are at the deepest level.Preference is given to locating the piping and tunnels underneath roadways andempty spaces as opposed to beneath or through building foundations. Thisfacilitates access for modification and repair. Piping and tunnel excavation/construction are expected to be among the first construction activities on the site.
FDR-ITER Plant Design Description Chapter II-Section 5.0-Page 19
5.11 Analytical laboratory
The Plant Sampling Laboratory is divided into two separate laboratory analysissub-systems, one dedicated to radio-chemical analysis of radioactive materialsand the other for non-radioactive materials. The first sub-system, hot laboratoryanalysis, will be capable of handling radioactive samples in solid, liquid orgaseous form. It contains alpha, beta and gamma counters and spectrographicinstrumentation as well as wet-chemistry facilities for separation and preparationof measurement samples. The second sub-system, cold laboratory analysis willhandle non-radioactive samples including potentially hazardous chemicals insolid, liquid or gaseous form. It contains analytic chemistry, water chemistry andsome metallographic facilities for analysis of material samples from throughoutthe site. Both facilities operate on a sample basis. There are no direct processconnections. The combination of both sub-systems enables characterization ofradioactive and/or hazardous waste prior to shipment off-site.
Both sub-systems are designed to be available on demand such that nomaintenance or operations activity will be delayed beyond the minimumpractical sample processing time. Routine samples that may be safely contractedto outside laboratories will be routed to the off-site laboratories only if suchaction is cost effective and does not interfere with priority samples. All sampleswill be discarded to either radwaste or hazardous waste systems unless theyqualify for unrestricted release.
The Plant Sampling Laboratory is located in the Tokamak Access ControlBuilding (Bldg. 22). Table 5.11-1 list the type of equipment and measurementsthat will be provided by the laboratory.
FDR-ITER Plant Design Description Chapter H-Section 5.0-Page 20

TABLE 5.11-1Plant Sampling System Equipment
Instrument
Gas ChromatographpH Auto. SamplerpH Manual SamplerConductivity Auto. SamplerConductivity Man. SamplerUltra CentrifugeIR SpectrometerMass SpectrometerGas ChromatographpH Auto. SamplerpH Manual SamplerConductivity Auto. SamplerConductivity Man. SamplerUltra CentrifugeIR SpectrometerMass SpectrometerGe(Li) SystemNal SystemNal SystemHiRes Alpha Spec.Liq. Scint. Auto.-T3
Liq. Scint. Act. ProdX-Ray Fluor. SystemLow BGD. Count. System
Qty
21
41
3
21
1
21
41
32
11
4
8
4
22
2
11
Subsystem
Cold AnalysisCold AnalysisCold AnalysisCold AnalysisCold AnalysisCold AnalysisCold AnalysisCold AnalysisHot AnalysisHot AnalysisHot AnalysisHot AnalysisHot AnalysisHot AnalysisHot AnalysisHot AnalysisHot AnalysisHot AnalysisHot AnalysisHot AnalysisHot AnalysisHot AnalysisHot AnalysisHot Analysis
Parameter Values
Chem. ID, cone.2<pH<122 < pH < 12~ 0.1 (jmho sensitivity~ 0.1 (imho sensitivity-10 (10 ml) samplesNot AvailableNot AvailableChem. ID, cone2<pH<122<pH<12~ 0.1 jimho sensitivity~ 0.1 f/mho sensitivity-10 (10 ml) samplesNot AvailableNot Available50 cm3, 2.0 keV(FWHM)7.6 cm x 7.6 cm cylinder.25 cm cyl. (1 cm well)Not AvailableNot AvailableNot AvailableNot AvailableNot Available
FDR-ITER Plant Design Description Chapter Il-Section 5.0-Page 21

PowerSource
llKVSiteDistribution
Load Center(lof9LCs)
LocalDistribution
Local LoadsControl (examples)
--1*80/2407120 V Building Loadail
Figure 5.1-1Steady State Electrical Distribution Concept

INTERNATIONAL THERMONUCLEAR EXPERIMENTAL REACTOR
«
V
TECHNICAL BASISFOR THE
ITER FINAL DESIGN REPORT, COSTREVIEW AND SAFETY ANALYSIS
(FDR)
Chapter IISection 6.0
ITER PLANT DESIGN DESCRIPTION
13 July 1998

CHAPTER IISECTION 6.0
TOKAMAK - INITIAL ASSEMBLY
TABLE OF CONTENTS
6.0 TOKAMAK - INITIAL ASSEMBLY : 16.1 Alignment strategy 16.2 Tolerance control 26.3 Outline assembly procedure 26.4 Assembly operations 36.4.1 Lower cryostat activities 36.4.2 Integrated T F / W and BP assembly 46.4.3 Ex-vessel activities 46.5 Assembly schedule and resources 56.6 Assembly hall utilization 56.7 Tool fabrication 66.8 Site facilities 6

6.0 TOKAMAK - INITIAL ASSEMBLY
The main issue for the assembly of ITER is the tight installation tolerancesrequired for the major components, considering the large size and weight of thecomponents, and process restrictions which degrade the efficacy of the assemblyprocedures. To facilitate achievement of the specified tolerances, the AssemblyPlan must integrate sequences and manufacturing processes which minimiseboth deviations and the residual stresses in the components, without the needfor subsequent corrective operations.
For the tokamak, therefore, specific assembly procedures and tooling must bedeveloped; this is not the case for other parts of the plant, where conventionalconstruction operations are foreseen. The overall Assembly Plan must also be asolution which minimises both the associated schedule and cost.
6.1 Alignment strategy
An essential feature of the basic alignment strategy is the application ofdimensional control at each major stage of the assembly process to mitigate theeffect of relatively large manufacturing tolerances, minimise the accumulation ofdeviations and facilitate the compensation of non-correctable deviations.
Component installation (illustrated in Figure 6.1-1) will be preceded by acomprehensive survey of the tokamak pit to define the assembly reference points("datum's); these datums include the "Tokamak Vertical Centreline" (seeFigure 6.1-1). Before completion of the TF magnet, the large components willeach be independently aligned with respect to these datums. In principle, thedatums will be fixed for the duration of this part of the assembly. In practice,however, the application of the Dynamic Datum Concept (see Section 6.2) tooptimize the assembly tolerances for the TF magnet, may result in slightvariations in these datums as the assembly proceeds.
On completion of the assembly of the TF magnet, a comprehensive survey of theTF coils will be combined with manufacturing dimensional control data toprovide a geometrical estimate of the magnetic axis of the machine; this isreferred to by the term 'Tokamak Magnetic Axis" in Figure 6.1-1. Subsequentalignment operations (primarily on the components which are tightlytoleranced) will be carried out relative to the tokamak magnetic axis.
Figure 6.1-1 also identifies the method of adjusting the component interfaces ateach assembly step.
FDR-ITER Plant Design Description Chapter II-Section 6.0-Page 1

6.2 Tolerance control
The basic alignment strategy integrates a number of concepts developed tooptimize the control of the assembly tolerances:
• Interactive Dimensional Control; a "best fitting" process, which uses asophisticated optical metrology system (OMS) linked to a CAD systemto develop and analyze complex, as-built 3D assembly models in nearreal time;
• Component Position Control, uses the interactive dimensional controlconcept to simplify, and expedite, the adjustment of the final positionof the major components;
• Dynamic Assembly Datum; uses the capabilities of interactivedimensional control to facilitate repetitive "best-fit" adjustment of theassembly datums to the toroidal magnet as assembly proceeds;
• Backplate Pre-Assembly; fabrication of large (up to 72°) sectors underhighly controlled conditions to improve global component tolerances;
• Weld Process Control; for backplate and vacuum vessel field joints,combines real time distortion measurements with the restraining loadsin the instrumented weld fixtures, to provide feedback to the weldingprocess;
• Closing Welds; toroidal closure of the backplate and vacuum vessel bywelding diametrically opposite field joints simultaneously to minimisecomponent residual stresses.
For further details on these concepts, refer to Design Description Document 2.2,Machine Assembly and Tooling.
6.3 Outline assembly procedure
A detailed procedure has been developed for the tokamak assembly as the basisfor determining the assembly schedule, manpower and tooling requirements andthe associated cost. A high level summary of this procedure is provided by thelogic diagrams, Figure 6.3-1 and Figure 6.3-2. For convenience, this procedure isdivided into the following seven main sections, each identified by WBS:
2.2.A.1 Lower cryostat activities: the sub-section includes the assemblyprocedures for the bottom of the cryostat, the lower PF coils, thelower crown and the gravity supports. This Section coversactivities from initial assembly in this area up to placement ofthe first TF/W;
FDR-ITER Plant Design Description Chapter II-Section 6.0-Page 2

2.2.A.2 TF/VV sub-assembly: includes installation of TF, VV andThermal Shield workstations, and the TF/VV sectorsub-assembly jig, in addition to the procedures to sub-assembleeach TF coil with two half-sectors of W ;
2.2.A.3 BP sub-assembly: which includes installation of the BPworkstations and the sub-assembly of the BP sectors;
2.2.A.4 Integrated T F / W &. BP assembly: includes the integration andsequencing of the T F / W and BP assembly in the cryostat;
2.2.A.5 Establish Magnetic Axis: this section includes the surveyprocedures by which the as-built axis of the toroidal magnet isestablished;
2.2.A.6 Ex-Vessel Activities: includes all assembly procedures for thecomponents and systems external to the W and ports, from theestablishment of the magnetic axis to the preparation forcommissioning. These activities occur in parallel with the in-vessel assembly procedures;
2.2.A.7 In-Vessel Activities: includes the final welding of the W andBP, and all assembly procedures specific to the VV and portinternals, up to the preparation for commissioning.
6.4 Assembly operations
An exhaustive description of the tokamak assembly procedure is outside thescope of this document. This Section illustrates the assembly procedure by aseries of discrete operations (figures and their associated descriptions) which aretypical of the overall assembly sequences.
6.4.1 Lower cryostat activities
Figure 6.4-1
After placing the cryostat ring pedestals and lower cylinder in the pit, theirinterface areas are surveyed, adjusted and the components are then secured tothe foundations. This sequence is followed by the installation of the vacuumvessel pressure suppression tank and drain tanks.
The floor sections of the cryostat lower head are brought to the pit using twooverhead cranes, four hooks and four lifting beams. The sections are aligned,welded to the ring pedestals and then surveyed.
Figure 6.4-2
After the lower crown temporary support, lower correction coils and lower PFand CS feeders have been stored in their temporary position on the cryostat
FDR-ITER Plant Design Description Chapter II-Section 6.0-Page 3

lower head, temporary supports for lower PF coils are brought to the pit,surveyed and shimmed.
The gravity supports are installed, surveyed and shimmed. Their upper flangesare connected with temporary links to form a rigid, laterally stable ring which isthe base for the TF coil installation.
Finally, the lower PF coils PF9 and PF8, PF7 and PF6 and their protective covers,and the lower crown are placed on the temporary supports.
6.4.2 Integrated TF/W and BP assembly
Figure 6.4-3
After positioning the T F / W sector on its gravity supports, a complete survey isperformed, and the adjustable guides on the gravity support and lower crown areadjusted to align the coil.
When the TF/VV assembly is accurately positioned and aligned, radial braces,which protrude from the bioshield, are attached to the coil to secure it inposition. In addition to the radial braces, the first T F / W assembly is also held bya tangential brace, which restrains the coil in the direction perpendicular to thesector.
Figure 6.4-4
After installation of the first ten T F / W sectors, and sequential fitting andtightening of the hardware of the intercoil structures, the permanent supportsare fitted to the vacuum vessel and the vacuum vessel internal braces areremoved. The backplate transfer rails are installed outside (on a supportstructure) and inside the vacuum vessel.
Large (up to 72°) pre-assembled backplate sectors are then positioned on the railsand rotated into the W . These large backplate sectors are welded together in awelding station located outside the vacuum vessel, close to its open end.
6.4.3 Ex-vessel activities
Figure 6.4-5
After completion of the assembly of the vacuum vessel, all radial braces areremoved from the TF coils.
The cryostat upper cylinder is then brought to the pit, aligned, and welded to thecryostat mid-cylinder, and the upper CC and PF coils installed and aligned.
These operations are followed by the CS installation and preload, and severalother ex-vessel activities which are performed in parallel: installation of thevacuum vessel port extensions; raising and installation of the lower PF coils in
FDR-ITER Plant Design Description Chapter II-Section 6.0-Page 4

their final position; and positioning and connection of the feeders and correctioncoils.
6.5 Assembly schedule and resources
A detailed assembly plan has been developed in accordance with the assemblyprocedure described in Section 6.3. This procedure presently identifies a total of17400 individual operations to assemble the tokamak.
In order to prepare a detailed assembly schedule and an accurate cost estimate,10500 of these operations have been individually evaluated to identify: thenumber of teams of workers working in parallel; the number of workers in eachteam; the duration of each operation; the requirements for common resources;and the fundamental links between individual operations.
The schedule to complete the assembly of the tokamak is ~ 3.5 years and theaverage number of workers required for this period is 210; the manpower peaksat 450 workers for limited periods.
A similar exercise has been carried out for the installation of the components inthe galleries which surround the pit. For this work a total of 8500 operationshave been identified and an average staffing level of 120 workers is required, inaddition to those employed for tokamak assembly.
6.6 Assembly hall utilization
Temporary cleaning areas will be established external to the north and southends of the assembly hall (see Figure 6.6-1) to facilitate entry of the largecomponents via either end of the building. The routing of the components intoand through the assembly hall will conform to the following basic plan:
Initial assembly phase:
• The ring pedestals, cryostat lower cylinder, vacuum vessel pressuresuppression tank and the lower poloidal field (PF) coils are cleaned andprepared in the north end of the assembly hall prior to installation inthe pit;
• The sub-assembly tooling and workstations for the VV and TF arecleaned, installed and tested in the south end of the assembly hall.
TF, VV, and in-vessel components:
• The BP sectors are cleaned, upended and sub-assembled into large unitsin the north end of the building prior to installation in the pit;
• The W half-sectors and TF coils are cleaned, prepared, sub-assembledand measured in the south end of the assembly hall.
FDR-ITER Plant Design Description Chapter II-Section 6.0-Page 5
6.7 Tool fabrication
To assure compliance with their specified requirements, and obviate possibleon-site modifications, all tools will be completely assembled and tested in themanufacturer's workshop before shipping. As the tokamak components will notbe available for these tests, test procedures using temporary structures, jacks, hardpoints or dummy components must be envisaged. In addition to functionaltesting, the tooling will be load-tested under the conditions required for on-sitecertification. During testing, data on tool deformations will be collected.
Following delivery, the tools will be stored in the outdoor storage areas untilrequired for assembling, testing and operation.
Appropriate selection of materials for tool construction will preventcontamination of the tokamak components with dust, rust, hydraulic oils orgreases, which are incompatible with the ultra-high vacuum (UHV)environment. Carbon steel parts will be protected against corrosion with anappropriate coating.
All surfaces which contact the tokamak components will in stainless steel orother compatible materials.
6.8 Site facilities
To support the assembly operations, the following temporary, or permanent,facilities will be established and maintained:
• Cleaning areas on both north and south ends of the assembly hall;
• Storage, treatment and disposal of liquid waste;
• Outdoor storage areas for tooling and components;
• Temporary heavy lifting equipment in storage areas;
• On-site, or local, machining capability for finish machining smallcomponents, e.g., VV splice plates, BP supports, etc., and toolingmodifications;
• Clean grinding and machining capability in the assembly hall for sub-assembled and assembled components, e.g., for the correction of weldpreparation on the large BP units;
• Metrology and metallurgical laboratories to perform the requiredquality control tests;
• Health physics and beryllium analysis laboratories to satisfy the siteoccupational health requirements.
FDR-ITER Plant Design Description Chapter II-Section 6.0-Page 6

COMPONENT [—- REFERENCE AXISFOR ALIGNMENT
CRYOSTAT LOWER HEAD
cs
1 shims
GRAVITY SUPPORTS
shims
TF COILS
shims &adjustablelinks
si
customisedsupports
customisedsupports
BACK PLATEat installation
A customisedsupports
PRIMARY BMat installation j
customisedsupports I final
I alignment I
iBAFFLES & LIMITERS
IS I
DIVERTOR RAILS !« }shims
DIVERTOR CASSETTES
PF COILS
LJNOTE: After installation and welding, the W and back platecan be independently aligned to the tokamak magnetic axis(if necessary to optimize overall system alignment).
FIGURE 6.1-1Tokamak Alignment Strategy
FDR-ITER Plant Design Description Chapter II-Section 6.0-Page 7

-J
FIGURE 6.3-1TF Coil/Vacuum Vessel/Backplate Assembly & Installation Sequence
FDR-ITER Plant Design Description Chapter Il-Section 6.0-Page 8

MAGNETIC AXISESTABLISHED
GEOMETRICALLY
HtEUMDVVCSAFfTT O U I M I . STOKES
I
INSTALL OITOCT AT msiAUm
• WTBOAKDMACB
^
,'coMrureitH " I ,
REMOVE INKER I f SUPKMT
IV**EM41SI« HAIL nWHl H* ™
tNSTALL
rtuos
L i J_..j i
• CCHEDEJ3
I fOTAU •
C0MMBS1ONINC ACTWinES
HGURE 6.3-2In-vessel/Ex-vessel Installation Sequences
FDR-UER Plant Design Description Chapter Il-Section 6.0-Page 9

7Cryostat LowerHead Ring Section
fCryostat RingPedestal
CryostatLower Cylinder
Figure 6.4-1Lower Cryostat Activities
Installation of Vacuum Vessel Pressure Suppression Tank,Drain Tanks and Cryostat Lower Head

Lower Crown(Support notshown for clarity)
Figure 6.4-2Lower Cryostat Activities
Installation of Lower PF Coils

TF/VV lifting tool
Figure 6.4-3Integrated TF/VV/BP Assembly
Installation and Adjustment ofTF/W Sub-Assembly on Gravity Supports

Back Plate Welding Station(not shown for clarity)
Back PlateTransfer Rails
Figure 6.4-4Integrated TF/W/BP Assembly
Installation and Rotation of BFLarge Sector into W

Figure 6.4-5Ex-Vessel Activities
Installation of Upper PF Coils

cleaning area(north)
Storage areas formajor lifting tools
Transport Path(not available for assembly)
Off load areav (not available\ for assembly)
eaning area (south)
Figure 6.6-1Layout of Equipment in Tokamak Building

INTERNATIONAL THERMONUCLEAR EXPERIMENTAL REACTOR
TECHNICAL BASISFOR THE
ITER FINAL DESIGN REPORT, COSTREVIEW AND SAFETY ANALYSIS
(FDR)
Chapter IISection 7.0
ITER PLANT DESIGN DESCRIPTION
13 July 1998

CHAPTER IISECTION 7.0
TOKAMAK MAINTENANCE
TABLE OF CONTENTS
7.0 TOKAMAK MAINTENANCE 17.1 Basic approach and general criteria 17.1.1 General policy of in-vessel components maintenance 27.1.1.1 Multi level approach 27.1.1.2 Modularity 37.1.1.3 Testability 37.1.1.4 Use of hands-on maintenance 37.1.1.5 Unified RH maintenance scenario 47.2 In-vessel maintenance 57.2.1 Maintenance of divertor 67.2.1.1 Cassette concept 67.2.1.2 Cassette handling 77.2.2 Maintenance of blanket module 97.2.3 In vessel transporter 107.2.4 Equatorial ports and cryopump handling equipment 127.2.4.1 Equatorial ports 127.2.4.2 Divertor ports 137.2.5 Neutral beam injector maintenance 137.2.6 Vertical port maintenance * 157.2.7 Viewing and metrology system 167.2.8 Dust handling 177.3 Ex-vessel components repair/ replacement 187.3.1 In-cryostat operations 197.3.2 Poloidal field coils repair/replacement .207.3.3 Toroidal field coils repair/replacement 237.3.4 Central solenoid repair/replacement 247.4 In-hot-cell maintenance 257.4.1 Hot cell facility and layout 257.4.2 Operations and equipment 277.5 Development plans 307.6 Assessment 31

7.0 TOKAMAK MAINTENANCE
7.1 Basic approach and general criteria
As concluded in the IDR, tokamak maintenance is a prerequisite to a successfulITER experiment. This essential capability relies simultaneously on the detaileddesign of the components to be maintained or repaired, on the actual procedureto follow during the maintenance process, and the development of simple,robust and efficient remote handling tools. Because parts of the tokamak willbecome activated, remote maintenance will be necessary. Initial calculationshave shown that personnel access inside the cryostat is possible until the end ofthe BPP, and possibly later. However, after start of D-T operations, such accesswill be time limited. All such hands-on assisted maintenance which involvessome exposure of personnel to ionizing radiation will be conducted inaccordance with the ALARA (As Low As Reasonably Achievable) principle.
It is essential to verify and demonstrate the feasibility of the developed methodsand tools or full-scale component mock-ups. The technology involved does notrequire important basic innovations. However, its implementation relies onrigorous experimental development and testing. This strategy has been firmlyfollowed since the IDR and will continue to guide future developments.
The design of in-vessel components which will become activated and requireremote maintenance has had a strong influence on the detailed definition of theappropriate remote procedures and tools, which are required to remove thecomponents from the vessel and transfer them to the hot cell for repair ordisposal.
Divertor and blanket maintenance are identified as the most important activities.Progress has been made in the design, and the two large R&D projects to procureprototype tools and demonstrate procedures are progressing well. These projectsshould give confidence that the divertor and the blanket can be maintainedwithout undue constraints on the machine availability.
The first focus of new work has been on the design and layout of the radial portsat the equatorial and divertor levels in order to define maintenance for all otherequipment which will go into the ports. The aim is that this maintenanceshould rely on standardized procedures and tools as far as practicable. All ports ateach level should be standard in their interfaces with the vessel and cryostat(eight RH ports and three NB injector ports and a port next to the NB injectorports (# 7) are presently the only exceptions among forty divertor and equatorialports). R&D on standard procedures and tools will need to continue beyond theEDA.
A second focus has been put on ex-vessel components repair/replacement of RHClass 3 components. Studies on conceptual procedures and tools are beingdeveloped, together with the design of components and structures in order to beconfident that in case of failure, a possibility exists for repair.
FDR-ITER Plant Design Description Chapter H-Section 7.0-Page 1

The remote handling classification scheme for components has been developedand it is shown in Table 7.1-1. Note that remote operations are often referred toby the (numerically) lowest RH classification of any component involved in theoperation.
TABLE 7.1-1RH Classifications
RHClass
1
2
3
4
Definition
Components that require scheduled remotemaintenance or replacement.Optimized to assure task completion within aminimum time.Shall not require opening the cryostat.All RH equipment must be designed in detailduring the EDA.Feasibility of tasks shall be verified during theEDAComponents that do not require scheduledremote maintenance but are likely to requireunscheduled or very infrequent remotemaintenance.Repair and replacement time is subordinate tocomponent performance and reliability.Shall avoid opening the cryostat wherepossible.All RH equipment must be designed during theEDA.Feasibility shall be verified during the EDAwhere deemed practical and necessary.Components not expected to require remotemaintenance or upgrading during the lifetime ofITER.The projected repair time in case of failure maybe long.Components must be designed to make repair andreplacement feasible, but component designemphasizes reliability and performance.The procedure for maintenance shall be definedduring the EDA.Components that do not require remotemaintenance or repair.
Examples
Divertor cassettesClosure plates and plugs in RH portsIn-vessel inspectionTest blanket modulesNB filament and cesium ovenreplacement, and accelerator gridcesium removalEquatorial RH port limiterEquatorial RH port diagnosticsBlanket modulesCryopumpsICH&CD systemECH&CD systemEquatorial port diagnosticsVertical port diagnostics
Coils (PF, TF, CS) and break boxesThermal shieldsW sectorBlanket back plateCryostat cryopumpW port extensionIn-port cooling pipesPort bellows
7.1.1 General policy of in-vessel components maintenance
7.1.1.1 Multi level approach
To minimize intervention time, reduce waste and lower the risk of the spread ofradioactive or hazardous material contamination, and radiation exposure topersonnel, maintenance strategies are based on a "multi-level" approachwhereby in-situ repair is considered before contemplating the exchange of
FDR-ITER Plant Design Description Chapter II-Section 7.0-Page 2

components. When a system or component cannot be maintained by in-siturepair, maintenance is accomplished by exchange of a sub-component or, failingthat, by exchange of the complete component. For in-vessel components,exchange is facilitated by subdividing the components into a number of moduleswhich can then be replaced individually.
7.1.1.2 Modularity
Where remote handling is required, modularity, standardization andsegmentation have been considered for the design to reduce maintenance costsand risks. In general, it is foreseen that all in-vessel maintenance will be carriedout by remote handling equipment.
Machine availability should not be unduly compromised by maintenanceoperations, especially by those that are regularly required. The ITER strategy is,therefore, to design those components that require regular remote maintenance(e.g., divertor cassettes) such that they can be maintained, including replacement,in a relatively short time. Design features facilitating remote handling arestandardized to minimize the number/variety of remote handling equipment/tools. Remote handling equipment is designed for ease of maintenance and easeof decontamination in order to allow hands-on reconditioning and repair.
7.1.1.3 Testability
In ITER, the (overriding) requirement is that the component must be designed inan optimized way to allow maximum testability prior to its installation in theport. This leads to the requirement that the component should be fitted andwithdrawn for maintenance as much as possible in one piece, avoidingaltogether, or minimizing, the cutting and rewelding of functional elements.This general design requirement and the use of temporary shielding to allowhands-on and hands-on assisted maintenance at the port interface have been thedrivers for the definition of the present in-port layouts.
7.1.1.4 Use of hands-on maintenance
Maintainability and repairability are fundamental requirements for ITER thatstrongly affect the layout and the general configuration of the machine. One ofthe goals for the design is to try to minimize remote maintenance, providing,wherever possible, enough shielding for access to carry out hands-on orhands-on assisted maintenance, i.e., hands-on assistance to remote handlingtools. Hands-on maintenance will be used at vessel ports in support of in-vesseloperations particularly for preparatory and finishing tasks.
Workers' exposure is subject to legal dose limits and to ALARA considerations.It is assumed that a 20 mSv/a regulatory dose limit will be imposed at ITER. Toensure that regulatory limits are not exceeded, more restrictive administrativelimits are set for individual exposure control. In addition, systems are reviewedto ensure that the expected occupational radiation exposure is reduced to levels
FDR-ITER Plant Design Description Chapter H-Section 7.0-Page 3

as low as reasonably achievable (ALARA). Therefore, hands-on maintenanceoperations are considered in areas where the dose rate exceeds 750 ^Sv/h (AccessZone D) only if there is strong justification, and such access must be for shortduration. Furthermore the dose received by any radiation worker in a single shiftshould not exceed 2 mSv and the total accumulated workers' dose for a taskshould be limited to 30 person mSv. If analysis of the work shows that theselimits cannot be met, the work should be planned to be executed partly or in fullby remote means. In any case, operations in radiation environments will besubject to stringent controls and authorized procedures that will include meansof providing appropriate protection to workers.
Implementing this strategy involves reducing dose rates (e.g., by providingshielding) and reducing exposure time (e.g., by simplification of design andtasks). Employing hands-on operations has led to changes in the port layout atthe equatorial and divertor levels.
The ITER strategy for maintenance is to employ hands-on maintenance to theextent practical, exploiting the reduced activation levels both inside and outsidethe cryostat, supplemented by remote means where necessary. On-goingradiation dose calculations show the potential for hands-on operation. Forexample, this will include brief access to strategic areas inside the cryostat, toallow hands-on inspection and repair for the magnet break boxes. The shieldingapplied around the vacuum vessel and ports is now not any more driven bynuclear heating of the coils and cold structures but rather by the requirement ofmaintaining the possibility of human access into the cryostat up to the end of theBPP.
To minimize the overall maintenance time, an effort has been made to optimizethe number of concurrent operations. The four dedicated RH ports at thedivertor level and at the equatorial level are enclosed by shielding walls to allowindependent maintenance operations inside the pit. This gives a high degree offlexibility to concurrent operations, requiring evacuation of some areas in the pitand gallery only during transfer of activated components to and from the hotcell. The same equipment and the same port design are used for each of the fourdivertor RH ports and for the two RH transfer ports at the equatorial level, exceptthat the casks at the divertor and equatorial levels are of different size.
7.1.1.5 Unified RH maintenance scenario
7.1.1.5.1 Access in the vessel
In-vessel interventions are normally carried out without warming up themagnets with the cryostat under vacuum. This is important for relatively shortinterventions since warm-up or cool-down of the superconducting TF coils andcold structures inside the cryostat will take approximately one month(interventions in the cryostat itself will require coil-warm up and cryostatventing).
FDR-ITER Plant Design Description Chapter II-Section 7.0-Page 4

The port interspace bellows (between W and cryostat) provides a vacuum-tightboundary from the vessel flange to the pit. This allows the opening and closingof the port, venting of the vessel, etc., without the need to break the cryostatvacuum and warm up the superconducting coils.
The equatorial ports (except the four used for blanket module maintenance) willbe opened only when a port-mounted component requires maintenance. Thesein-port components are classified as RH Class 2 or 3 with the exception of theport-mounted test blanket modules which are Class 1. For the Class 2 and 3systems, the total "expected number of interventions during the machine lifetimeis expected to be less than five.
Hands-on maintenance is foreseen for preparatory operations before remotelyremoving the W plug. Hands-on maintenance tasks typically include:
• Removal of the bioshield plug, including outboard components;
• Removal of the secondary closure plate;
• Removal of service lines and components in the port interspace (e.g.,port assembly cooling lines, waveguides, etc.).
7.1.1.5.2 Remote access
Apart from the remote replacement of divertor cassettes and blanket modules(described in the next section), remote maintenance of in-vessel components islimited to the (dis)assembly of the VV closure plate (unbolting/bolting andcutting/welding of the lip seal), and to the removal and insertion ofport-mounted components.
These operations are performed with RH equipment operating from inside atransfer cask that docks to the W port. For contamination control, a double-sealdoor system is used at the cask interface with the port. The RH equipmenttransfers components from inside the vessel to the cask. Transfer of the cask tothe hot cell is by air bearing system operating through the gallery and lift.Although the air bearing system has now been chosen as the reference design,many drawings and the DDD 2.3 (Remote Handling Equipment) still refer to theprevious design involving flanged wheel vehicles on rails let into the floor.When the cask contains radioactive components, radiation levels will not permitstaff to remain in the neighbourhood. At the Hot Cell, the cask docks to a dooridentical to the port door and again the transfer of components from the cask tothe Hot Cell is done through a double-seal door system.
7.2 In-vessel maintenance
Typical dimensions and weight of the main in-vessel components that requireremote handling are listed in Table 7.2-1.
FDR-ITER Plant Design Description Chapter H-Section 7.0-Page 5

7.2.1 Maintenance of divertor
The intervention time for divertor replacement is required to be no longer thaneight weeks for one cassette and six months for all 60 cassettes. The divertor isexpected to be replaced three times during the BPP. Replacement of the divertoris carried out through the four divertor level maintenance ports using transfercasks that dock via a double-seal door for contamination control. Eachmaintenance port serves 15 cassettes.
TABLE 7.2-1Major In-Vessel Components
Component
Components accessed at theEquatorial Port level
Shield Blanket Modules
Equatorial System Port Assemblies
Components accessed at the DivertorPort level
Divertor Cassettes
RH Port Primary Closure Plates
CryopumpsComponents accessed at the UpperVertical Ports
Upper vertical port inserts
Approx. Dimensions(meters, HxWxL)
1.3x2x0.52.8x1.8x4
2x1x63x1.6x0.31.8 (dia.) x 4
0.8 (dia.) x 5
Approx.Weight(tonne)
4.350 to 70
2668
10
No. ofUnits
730
ICH & CD- 3ECH & CD- 2
Diag.- 6TBM-4
Limiter - 2
60
4
16
30
The coolant pipework of the three cassettes of each of the 20 W sectors is routedthrough the sector divertor port. For removal of the cassettes, the pipework iscut by bore tools that are inserted from outside the bioshield in a hands-onassisted fashion.
Cassettes are mounted on two toroidal rails fixed to the bottom of the W . Therails are also used by the RH transporters for removing and installing thecassettes. The cassettes to be replaced are loaded in a transfer cask docked to thedivertor maintenance ports following the unified scenario previously described.The reverse procedure applies for re-installation of components.
7.2.1.1 Cassette concept
The cassette is a fundamental element of the divertor integration andmaintenance strategy. It offers the following advantages:
• The cassette concept provides short in-vessel RH intervention timeand high RH reliability;
FDR-ITER Plant Design Description Chapter II-Section 7.0-Page 6

• The cassette attachments, water pipes and electrical connectionsubassemblies are located in low neutron flux areas (low nucleardamage) that are shielded by the cassette body. Thus, these componentscan be re-welded;
• The use of toroidal rails inside the VV and the related cassettekinematics allow access from one side of the cassettes to attach them tothe W and to perform locking operations and electrical connections;
• The cassette concept permits changing the plasma facing componentsgeometry without changing the interfaces to the machine and/or theRH tools, and minimizes the volume of waste.
7.2.1.2 Cassette handling
The handling concept of the divertor cassettes is based on specialized handlingmachines (toroidal/radial movers), operating on cassette subassemblies (supportpads, earth straps, water feeds and gripping points) and on semi-permanentin-vessel subassemblies (toroidal and radial rails, W support pads, radial coolingpipes, connection points for earth straps, gas injection circuits, divertor to mainchamber gas seals, etc.).
FDR-ITER Plant Design Description Chapter II-Section 7.0-Page 7

The procedure for cassette removal is in Table 7.2.1.2-1.
TABLE 7.2.1.2-1Reference Removal Procedure
Step
1
2
3
4
56
7
891011
12
13
14-17
18-29
Step Description(one out of 4 RH potts and complete divertor removal
from a quadrant)
Remove diagnostics from front of divertormaintenance portsRemove bioshield plug
Remove secondary closure plate
Drain cassettes a week after shut-down starts
Cut pipes inside the handling portDock cask and remove primary closure plate
Dock cask and install radial rail segments
Dock cask and remove diagnostic blockDock cask, unlock and remove central cassette
Dock cask and unlock second cassetteDock cask and remove second cassetteDock cask and install Cassette Toroidal Mover (CTM)
Dock cask, unlock and remove cassette
Cut pipes inside the four adjacent cryoports (six pipesper port) - this operation to be carried out in parallelwith steps 6-13
Dock cask, unlock and remove cassettes (12 off)
Comments
Hands-on assistance
Hands-on assistance
Hands-on assistance
Divertor Heat Transfer System
Hands-on assistance and confinementRH Vacuum Plug Skid (VPS)
RH VPS Skid
Specific RH SkidRH Central Cassette CarrierRH Manipulator Arm
RH Second Cassette CarrierRH CTM and umbilical
RH CTM and Radial Cassette Carrier(RCC)
Hands-on assistance and confinement
RH CTM and RCCNotes:- The installation of the cassettes involves the reverse operations as above plus more specific
inspections to ensure that the RH tasks are properly performed (torque monitoring,non-destructive examination, etc.).
Before starting the removal of the divertor cassettes, the cooling pipes must becut and subsequently re-welded. This is achieved using bore tools remotelyoperated from inside the pipe. The cutting tool is based on a mechanical cuttingprocess and their present design allows complete collection of the swarf producedduring the cutting process. The welding tool uses TIG welding with filler wireand includes a mechanical feature to align the two adjacent pipe ends prior towelding. The inspection tool is driven by a separate carrier and is based on theultrasonic inspection technique. All tools will be intrinsically fail-safe so that, incase of power failure, they can be retrieved without damage to the pipe. The toolinsertion will be hands-on assisted from the end of the pipe, after removal of asealing pipe end plug. This operation is carried out concurrently with theopening of the port and the removal of the cassettes.
A handling system inside the pit permits the removal of the bioshield plug fromin front of the handling port, and its storage.
FDR-ITER Plant Design Description Chapter H-Section 7.0-Page 8

Assuming hands-on access to the cryostat one week after shut-down, thesecondary closure plate is removed by a hands-on assisted handling system, andstored outside the bioshield.
The docking of the transport casks to the handling port requires confinementcontrol and a double-seal door, including some shielding to allow parallelconcurrent maintenance inside the pit when the bioshield plug is removed. Thekinematics of the double-seal door is downward inside the bioshield wall (seeFigure 7.2.1.2-1).
The transport cask is a closable and unshielded container transported on an airbearing pads inside the buildings. It docks to the shielded double-seal door andcontains the RH equipment (movers, carriers and skids) needed to perform thein-vessel RH operations. It provides the radial tractor with electricity and signals(via an umbilical) and a radial rail which can align itself with the one inside theport.
A specific RH skid, the vacuum plug skid (VPS), cuts (and on replacement,welds) the lip seal of the W plug, unlocks the plug from the duct flange, andremoves it to the transport cask. A dedicated skid (diagnostics block skid)disassembles and removes the diagnostic block from the handling port.
The main RH equipment, directly involved in cassette replacement, includesradial and toroidal movers.
The radial mover system (tractor) acts inside the handling ports, from thetransport cask up to the W toroidal rails. It propels itself by a rack and piniondrive along the radial rail of the port. It propels essentially all equipmentincluding the carriers and skids. The carrier includes some specific features,depending on the type of cassette to be handled.
The cassette toroidal mover (CTM), as shown in Figure 7.2.1.2-2, acts only insidethe W . It accurately positions the cassette using a fork lifting system, locks itssupports onto the toroidal rails using a clamping system, and assembles the earthstraps and divertor to the main chamber gas seals. It is supported and guided bytwo toroidal rails and can move in the toroidal direction thanks to tworack-and-pinion systems. The CTM is supplied by an umbilical routed throughthe handling port and accommodating its toroidal motion inside the W .
7.2.2 Maintenance of blanket module
The blanket comprises several hundred modules and additional blanket shieldplugs at port openings. The blanket is segmented into modules for maintenancepurposes. The size of a module is determined by the payload capacity of the in-vessel transporter which must handle it. The segmented modules are attached tothe back plate through mechanical, electrical and hydraulic connections.
The blanket module is an RH Class 2 component which requires infrequentmaintenance. Shield blanket modules may require replacement a few timesduring the life time of ITER due to local or general erosion/defects.
FDR-ITER Plant Design Description Chapter II-Section 7.0-Page 9

Furthermore, all shield blanket modules will be replaced with breeding blanketmodules during the transition period between the BPP and EPP.
Again, the unified procedure is followed for in-vessel access and removal ofcomponents from the vessel to the hot cell for repair or replacement. As in thedivertor maintenance case, the procedure is optimized to take into account thenumber of times the RH ports are used.
There are male and female modules. A male module has two keys, one on eachtoroidal side of the module. A female module has two keyways. The modulesare mounted on the back plate, which is a double wall structural shell supportedby the vacuum vessel. Each module is supported on the back plate by four radialflexible supports. The flexible supports attach the module to the back platethrough four radial holes with a diameter of 30 mm. Each module is positionedboth toroidally and poloidally with a center pin on the back plate and the twokeys. The male and female modules are installed in turn along the toroidaldirection to position the adjacent modules poloidally. Two hydraulicconnections and two electrical strap connections are also achieved using the frontaccess holes of 30 mm diameter.
The main tool will be the in-vessel transporter (IVT), which travels on a raildeployed on the torus axis. The IVT is used as a general in-vessel maintenancedevice, thus various end-effectors are required according to task needs. Thestandard end-effector for blanket RH provides three degrees of freedom - roll,pitch, and yaw - to change its orientation. It has four fingers to grip a blanketmodule and wrench arms to fasten/release the module flexible supports. Thegripping fingers grip a module using gripping holes in the module surface.
Figure 7.2.2-1 shows the general procedure of blanket module replacement.
The two equatorial RH ports housing the in-vessel rail system are enclosed byshielded walls to allow concurrent operation on the same level when the rail isdeployed. Also, the two equatorial RH ports used to transfer blanket modules inand out of the vessel are shielded to allow concurrent operations. As at thedivertor RH ports, the transfer casks dock to a double-seal door at the bioshieldwhen transferring modules and RH equipment to and from the VV equatorialport.
The casks do not provide shielding and personnel must be evacuated from thecask traveling path during transfer to the hot cells. After loading the component,the casks undock and travel through the gallery to the lift and to the hot cells.
7.2.3 In vessel transporter
The in-vessel transporter (IVT) system is composed of an articulated rail(forming a semicircle when deployed inside the vacuum vessel), a vehicle(traveling along the rail), a rail-deploying device, a rail-winding device, atwo-step slide arm, and a vehicle-fixing arm (see Figure 7.2.3-1). The mainfeatures of the blanket handling equipment are:
FDR-ITER Plant Design Description Chapter Il-Section 7.0-Page 10

• Sufficient stiffness of rail during maintenance operation provided byfour supports from 90° ports;
• Simple rail structure without any actuators and sensors;
• Passive and sequential rail deployment using both the vehicle and thedeploying device;
• High mobility of the vehicle along the rail.
The articulated rail is composed of eight curved links connected by mechanicaljoints that have no sensors or actuators. The radius of the semicircular railformed inside the vacuum vessel is 8 m. The cross sectional size of each link is300 mm wide x 600 mm high with 20 mm wall thickness, and is made ofaluminum alloy. Prior to maintenance operations, the links are deployed toform the semicircular rail inside the vacuum vessel sequentially by thecombined operation of the deploying device and the vehicle. The semicircularrails are connected to form the complete rail circle, which is supported at four 90°equatorial ports in order to achieve the required stiffness. The vehicle has ahandling arm with an end-effector for in-vessel maintenance, a rack-and-piniontraveling mechanism for traveling along the rail and a locking mechanism forlocking the joints of the rail.
Figure 7.2.3-2 shows the deployment of the vehicle. The vehicle is guided alongthe rail by six units of roller bogies and travels on the rail. A rack gear is installedon the inner side wall of the rail. The vehicle travels on the rail by driving apinion gear installed in the vehicle. One unit of the roller bogies has four rollers.Each roller swings along the rail wall and is able to support load uniformly.
To access every module, the vehicle and manipulator have three degrees offreedom, a two-step telescopic movement, rotation around the rail, and swingingon the rail. The size of the arm with the vehicle and the end-effector is limitedby the internal dimension of the port plus a gap of 50 mm. During plasmaoperation, the respective units are stored in the maintenance cell on the oppositesides of the torus. The telescopic arm consists of two elements, an outer arm andan inner arm. Each arm is square in cross section. The outer arm movement isdriven by a rack-and-pinion mechanism. The rack gear is installed on the sidewall of the outer arm and the pinion gear is installed on the vehicle. The innerarm is driven by a ball screw. Each arm moves independently. The maximumstroke of the telescopic arm is 3,525 mm (1,800 mm for the outer arm plus1,725 mm for the inner arm). With this stroke, the IVT can reach all the blanketmodules. The load capacity of the arm excluding the end-effector weight(1.0 tonne) is 4.3 tonne.
Figure 7.2.3-3 shows the vehicle/manipulator configuration.
FDR-ITER Plant Design Description Chapter II-Section 7.0-Page 11
7.2.4 Equatorial ports and cryopump handling equipment
7.2.4.1 Equatorial ports
This section addresses the handling equipment for the equatorial level VV portmounted systems, including the RF H&CD systems, the test blanket modules,diagnostic systems and plasma limiters. These systems are configured in astandard integrated assembly that is attached to the VV. When a systemcomponent requires maintenance, the complete assembly is removed and istransferred to the hot cell for repair or replacement of the discrete components.A unified maintenance procedure is applied and the RH equipment isstandardized.
At equatorial level RH ports the double-seal door system is similar to thedivertor ports and is located and in the IVT cell wall at these locations. At all theother ports, the door system moves internal to the cask and interfaces directly tothe W port. Thus, a different cask is used for each of these two types of port.
Figure 7.2.4.1-1 shows the configuration of an equatorial port after the hands-onremoval of the cryostat closure plate and port assembly services (cooling pipes,waveguides, etc.). A cask docking and double seal door interface is located at theend of the port. A "seal cap door" covers the port assembly vacuum seal andattachment mechanisms and remains in place during machine operation. Itisolates contamination that cannot be avoided during port assembly replacementoperations and is used during maintenance to provide the port-side door. Theport interspace side of the cover remains clean of contamination by combiningand sealing it to the transfer cask door.
Figure 7.2.4.1-2 shows the transfer cask docked to the port with all thecomponents of the double seal door in place. To reach the port, the cask has anextended, unsupported end that passes through the port interspace. The caskmust fit, with clearance, inside the 4.1 m diameter port bellows since the bellowsdiameter cannot be increased due to a lack of clearance between adjacent ports.
The cask is aligned and clamped to the port during the docking operation and atthat time is supported by both the port and the building. The cask docking face isrigidly attached to the cask chassis. Therefore the cask supports to the buildingmust adjust in height to accommodate alignment of the cask to the port. Casktransport is provided by an independent air bearing vehicle that maneuversunderneath the cask.
Port assembly replacement requires radial motion through the equatorial port bya handling system that is supported from the cask chassis. The handling systemincludes a dexterous manipulator arm to deal with the port assemblyattachments, vacuum seal and related tools. The system performs the followingoperations during port assembly installation:
• Port assembly gripping and handling along the radial port path (weight~ 50 to 701);
FDR-ITER Plant Design Description Chapter II-Section 7.0-Page 12

• Port assembly positioning inside the port, in a cantilevered manner,with an accuracy and repeatability in the range of a few millimetersalong the radial, toroidal and vertical directions for lip seal alignmentat the docking flange;
• Preliminary locking of the port assembly (prior to lip seal welding)along the radial, toroidal and vertical directions;
• Vacuum lip seal welding and inspection (UHV leak testing andmechanical inspection);
• Final locking and inspection of the port assembly attachment.
Port assembly removal includes the opposite operations, with lip seal weldingand inspection being replaced by cutting. Steps to remove the port assembly areillustrated in Figure 7.2.4.1-3.
7.2.4.2 Divertor ports
The sixteen divertor level ports other than the RH ports are equipped withcryopumps. Similar to the equatorial ports, the pump, or pump isolation valvealone, is removed as a unit and is transferred to the hot cell for repair.Cryopumps require a specific transfer cask and RH equipment. For example, theRH transfer cask needs to have a unique profile in order to fit under the sixdivertor cooling pipes located in the upper port section. Otherwise, maintenanceequipment and procedures similar to the equatorial ports is applied
7.2.5 Neutral beam injector maintenance
Neutral beam (NB) injection requires non-standard ports, a separate NB cell anda specific maintenance procedure.
The NB injector cell is located in the north side of the pit at the equatorial level.Three neutral beam units are aimed to be tangential to the plasma at a radius of6.25 m. The NB injector cell has three independent doors which connect eachNB injector to the gallery. Each NB injector is divided into two main modules,the ion source/accelerator and the beamline. The neutralizer, residual iondump, calorimeter, cryopump, beam limiter and the fast shutter are placed insidethe beamline. A magnetic shield surrounds each NB injector and also providesradiation protection to the surroundings.
Only the ion source requires routine remote maintenance (RH Class 1). With theexception of the fast shutter, which is Class 2, all other components within thebeamline require maintenance only in case of failure and are classified as RHClass 3. Within the NB injector cell, with the magnetic shield in place, hands-onmaintenance is possible.
FDR-ITER Plant Design Description Chapter II-Section 7.0-Page 13

The ion source filaments should be replaced once a year and although strictly notnecessary, for convenience, the cesium oven will be replaced at the same time.The accelerator requires surface cleaning to remove deposits of cesium, but thisshould occur less often than filament replacement. Components requiringmaintenance are disconnected from the NB injector and transported in amaintenance transfer cask to the hot cell via the gallery.
The maintenance transfer cask docks directly to the back of the NB injector.Contamination is contained within the NB injector and the maintenancetransfer cask. Figure 7.2.5-1 illustrates the transfer cash docked to the NB duringmaintenance.
Before maintaining the ion source, the shield door and the rear magnetic shieldare removed and stored inside the gallery. The maintenance cask is transferred tothe NB injector cell and docked to the NB injector. The door on themaintenance cask and the dome of the NB injector form a double-seal door.After docking, the seals between the casks and the double-seal doors are checkedand the double-seal door opened. Both sets of doors are moved into themaintenance transfer cask and stored.
Having removed the dome of the NB injector, the ion source is accessible to themaintenance transfer cask manipulator. For example, the most frequent Class 1maintenance operation is to replace the ion source filaments. The filaments arereplaced by the manipulator using special purpose alignment and handling tools.
FDR-ITER Plant Design Description Chapter II-Section 7.0-Page 14

7.2.6 Vertical port maintenance
The ITER vessel is equipped with twenty (20) equally spaced vertical entry portsthat extend into the torus. One half of these ports (i.e., every other port) are"piping" ports used for coolant and service lines. These ports only extend intothe cryostat space. The other ten ports are the "diagnostic" ports and are used fora variety of diagnostic and In-Vessel Viewing (IW) devices. These ports extendinto the area bounded by the cryostat and bioshield structure.
Maintenance to the piping ports is not expected to be required. The diagnosticports are expected to require occasional maintenance, due to the complexity ofthe equipment located in those ports and, especially, due to the potential forrequirement changes through the life of ITER.
The diagnostic ports are assembled by placing the top port extension (TPE)housings through the cryostat boundary and extending to the top of the top ports.The TPE housings consist of three tubular sections for each diagnostic port. Asmaller (approximately 500 mm dia.) tube, for a I W system, is located towardsthe inward end of the top port, and two larger (approximately 800 mm dia.) tubes,for diagnostic systems. After the bioshield/cryostat assembly is in place, the TPEtubes are lowered through the cryostat/bioshield assembly and the bellows sealson each end are welded to that assembly. After installation, the tubes are free toswing in X and Y planes from the top and free to move in the Z plane from thebottom, to allow for relative motions. They are restrained from moving in otherdirections. None of these components are designed for routine maintenance.
All remote maintenance to the equipment installed in the TPEs is conductedfrom within the TPE by access from above. No remote access into the cryostatvacuum region is required to conduct maintenance of top port components.
The TPEs are attached to the top ports by bellows assemblies, at both the top andbottom, to seal against the cryostat vacuum while providing for the relativemovement between these components. All of the diagnostic systems (and theIVV systems) are installed inside of the tubular units and can be remotelyreplaced without removal of the bellows. This maintains the seal to the cryostatvacuum during their replacement.
The diagnostic equipment is installed in the upper portion of the TPE and viewsthe plasma usually through seal windows, although a few systems (GDC probes)must view the plasma directly. The components sealed through windows can bemaintained from above by access to the space between the cryostat and bioshield.The probes involve plasma facing components and are expected to becomeactivated; they will be remotely removed/replaced. The probes are simplifieddevices, so as to limit the need for maintenance.
FDR-ITER Plant Design Description Chapter II-Section 7.0-Page 15

7.2.7 Viewing and metrology system
In-vessel viewing equipment is essential for routine inspection of plasma facingcomponents in order to detect impending failure of components and to judge thenecessity of their repair or replacement. The viewing operation is required tosurvey the surface of the components as rapidly as possible under high vacuum,radiation, magnetic fields (TF coils), and temperature conditions just after plasmaoperation.
The metrology capability is required: (1) for initial alignment of plasma facingcomponents before plasma operations, (2) in preparation for and in support ofRH Class 1 and 2 maintenance tasks during maintenance campaigns, and (3)under the same conditions as the viewing operation (above).
In principle, there is no difference between equipment which can achieve any ofthe two goals; routine viewing or metrology except for the accuracy of inspectionand time for intervention.
Viewing and metrology equipment which should be inserted in the VV, needs tobe confined permanently inside two confinement boundaries, and is isolatedfrom the vessel vacuum by a seal valve. Additionally there is a radiationshielding device closed between the equipment and the plasma during plasmaoperation which can be easily opened for intervention.
In-vessel viewing equipment is an optical periscope contained in a tubular probeand inserted into the vacuum vessel with aradiation/high-temperature/magnetic field resistant video camera locatedoutside the vessel. A mirror is located at the bottom of the periscope, near theobjective lens, and can be tilted to scan poloidally. The probe can be rotated aboutits long axis to scan radially. The probe tube can also be lifted to variouselevations for viewing as well as being withdrawn completely during reactoroperations. A motorized "key lock shield plug," which is located in the vacuumvessel upper port (to block radiation during operation), allows for promptinsertion of the tubular probe end of the periscope into the vacuum vessel inpreparation for viewing operations.
In addition to the optical periscope, two viewing options are being studied: alinear array laser scanning and/or a fiber optic coherent laser radar, visible andinfra-red viewing systems developed as a diagnostic for First Wall during plasmaoperation.
The divertor viewing/metrology is the most difficult to be achieved, because ofthe limited access to the divertor throats and the recessed locality of the "verticaltargets", which leads to almost tangential lines of sight. The optimum locationof viewing probes should comply with obvious constraints, like the number ofdifferent items of equipment to be installed along the torus divertor, and theamplitude of vibrations for very long probe supports.
R&D of the critical components such as the lens array, lubricants, scanningdevice, linear array of optical fibers, and illumination, radiation effects, and
FDR-ITER Plant Design Description Chapter II-Section 7.0-Page 16

magnetic field effects, is being conducted in order to develop the detailed designof the in-vessel viewing/metrology equipment.
The IVV systems are maintained by vertical removal/replacement into sealed,unshielded, containers above the bioshield. Double door seals are provided tominimize contamination concerns. The IVV system (either the viewing ormetrology type) are removed as an integral unit, to minimize replacement timeand to maintain equipment setup and calibration. The IVV system can beremoved without disturbing the primary vacuum of the torus (or the cryostatvacuum); for this reason, a primary vacuum sealing contamination controlvalve is installed but is not removed with the I W system, being a separateintegral unit with the "Keylock" radiation shield device.
7.2.8 Dust handling
The amount of activated and tritiated dust contained within the vessel resultingfrom erosion of the FW and divertor target material by plasma interaction,should be limited. To keep below the limit, dust can be removed periodically orcontinuously (or using some combination of the two).
The physical characteristics of the dust will have a significant effect on the abilityto handle and remove it. Some important parameters include dust size, dustporosity, and adherence to surfaces. R&D is in progress to determine thesecharacteristics.
Dust removal methods identified (and a brief assessment) are:
• Vacuum cleaner probe manipulated by the in-vessel transporter - canbe used to clean only first wall surfaces and divertor top during areactor maintenance campaign;
• Vacuum cleaner manipulated from a divertor port - divertor portaccess can be used to clean under cassettes during a divertormaintenance campaign; access is better with the cassettes removed;
• Electrostatic removal - the only continuous (without reactor downtime) method proposed to date;
• Use some combination of the above concepts to mitigate problems andcover various operating scenarios.
The final method of dust removal has not been chosen as yet and will probablyuse several different methods.
FDR-UER Plant Design Description Chapter H-Section 7.0-Page 17

7.3 Ex-vessel components repair/replacement
All components inside the cryostat are RH Class 3, designed to last the lifetime ofITER without requiring inspection or repair/replacement. Initial calculationshave shown that personnel access inside the cryostat is possible until the end ofthe BPP, and possibly later.
Access inside the cryostat may be required for inspection and/or repair of thecomponents listed in Table 7.3-1. The possibility of intervention under vacuumand cryogenic temperature is extremely hypothetical. In order to avoid theseextreme conditions and to make intervention possible, all magnets will firsthave to be-warmed to room temperature, and re-cooled (cycle duration: abouttwo months).
TABLE 7.3-1In-Cryostat Components which may require Inspection/Repair
System orComponent
MachineStructures
Cryostat
Magnets
Others
Operation
1 - intercoil structures2 - upper and lower crowns3 - vacuum vessel vertical/horizontal supports4 - CS and gravity supports
1 - equatorial and divertor ports bellows2 - cryostat bottom lid (following the cutting, re-welding andrequired for the lower PF coils replacement operation)3 - cryostat lid flange (following its opening/dosing)4 - thermal shields (cryostat & vacuum vessel)5 - cryostat vacuum pumps replacement
1 - CS pre-load structure2 - CS/PF/CC/TF magnet break boxes3 - PF coil clamps
1 - machine instrumentation, pipes and cables
Until now, only the most demanding operations (remote replacement of theITER magnets) have been conceptually studied. All of them-will require a longduration and the more so as the machine becomes more activated after a longoperational life.
Other repair/replacement operations inside the cryostat will be analyzed infuture after more detailed design of all in-cryostat components-interfaces becomeavailable, with identification of their most probable faults. Ease of access will bethe controlling factor to make any hands-on in-cryostat operation possible. If theenvironmental conditions will require it, a transporter/manipulator system willbe needed inside the cryostat to enable the transport of maintenance tools; thepossibility to install crane/temporary supports of equipment from attachmentspermanently available at the cryostat walls has been considered. Visualinspection of the most critical in-cryostat components is envisaged.
FDR-ITER Plant Design Description Chapter II-Section 7.0-Page 18

7.3.1 In-cryostat operations
The primary scenario for in-cryostat repair/replacement operations assumeshands-on operations with human access into the cryostat. To achieve this, thevacuum vessel shielding must provide the same level of neutron attenuation asthe combination of blanket, back plate and vacuum vessel in areas where thereare no port penetrations. This being the case, initial calculations have shownthat restricted personnel access is likely to be an option to the end of the BPP andpossibly for sometime thereafter.
Hypothetical in-cryostat repair operations, postulated to develop an in-cryostatmaintenance strategy, include inspection and/or repair of:
• Magnet break boxes insulation breaks;
• Bolt tension on intercoil-structures;
• Vacuum or cryogenic leak checking/repair;
• Electrical or thermal shorts repair;
• Thermal shield inspection/repair;
• Others.
Less likely in-cryostat operations may involve extensive work, mainly related tothe replacement of large components, i.e. a poloidal field coil, a toroidal field coiland associated vacuum vessel sector, etc. (see Sections 7.3.2 to 7.3.4).
Proposed strategy
Based on this approach, the following guidelines have been followed toformulate a strategy for in-cryostat repair/replacement operations:
• Hands-on operation is the reference scenario, with remote operation asa back-up should detailed activation calculations turn out to precludehands-on access, or shielding cannot be designed to be as efficient asrequired;
• Permanent provisions should be available inside the cryostat for handson access. These include fixed platforms, walkways, lifting points andother features to simplify and reduce the duration of in-cryostatoperations;
• Back-up provisions for in-cryostat remote operations should beprovided and where practicable, the special features introduced forhands-on operations should be used.
FDR-ITER Plant Design Description Chapter II-Section 7.0-Page 19

Access into the cryostat
Requirements for access by workers are somewhat different from that required byremote equipment. However, the following common design solution is adopted:
Cryostat Access Points Position
cryostat lid
cryostat cylinder
cryostat bottom
R 14.250 m9° offset to vessel vertical portsR16.800m36°, 126°, 216", 306°Central position®- 32.5 m63°, 153°, 243°, 333°@ -35.72 m45°, 135°, 225°, 315°
Dimension1.8 m dia
0.8 m dia
1.4 m dia2.25 m dia
1.6 m dia
Number20
4
14
4
In-cryostat equipment
Permanent platforms and walkways to allow man access and operation
Platforms and walkways must provide the means of getting to the work site forhands-on operations and satisfy the following requirements:
(a) Permanent platforms are to be located beneath four upper accesshatches used to gain man entry to the cryostat;
(b) There should be a means to enter and to leave each platform;
(c) The system of permanent platforms and walkways must allow, to thegreatest practical extent, access to all in-cryostat components that couldrequire inspection or repair;
(d) The walkways should be sufficiently wide and have handrails inconformance with standard industrial work platform practice.(Walkways of this width can accommodate many available remoteroving vehicles.)
The structures, permanently installed inside the cryostat, must be compatiblewith vacuum, cryogenic and electrical isolation requirements to avoid eddycurrents.
7.3.2 Poloidal field coils repair/replacement
The PF coils can be repaired following a) helium leakage, b) electric short circuit,c) ground insulation fault. Owing to built in redundancy, in case one of theirfour modules fails, the PF coils can still be operated by electrically disconnectingthe failed module. The three electrical connections between the four modules ofthe PF5 and PF6 coils are located at the power supplies and directly accessible. Forthe PF3 and PF7 coils, one of the connections is at the power supplies and theother two are inside the CTBs where they are accessible for bridging through
FDR-ITER Plant Design Description Chapter II-Section 7.0-Page 20

hatches after isolating and bringing the CTB to ambient atmosphere. For the PF2and PF8 coils, one of the connections is at the power supplies and the other twoare inside the cryostat next to the windings, as are all three connections for thePF1, four and nine coils. In this case the connections are also accessible forbridging by hand or RH, after bringing the coils systems to room temperature andambient atmosphere, and entering the cryostat.
Complete coil replacement would be required in case the failure exceeds thecapability of the above built-in redundancy. Depending on which PF coil needsto be replaced, a certain number of machine components needs to be removedfirst. Replacement of the lower PF coils numbers 6, 7, 8, 9 requires that a new coilis fabricated in-situ.
Repair
Repair capability is being demonstrated by R&D testing for the case of heliumleakage from a cryogenic pipe electrical insulator. The proposed technique is forremote handling, but the same tools and procedures could be used for hands-on.The fault will most probably occur inside a coil break box, at the electricalinsulator position of the cooling system pipes. Following positioning ofpersonnel or manipulator near the work area, the repair procedure would consistof the following main steps (Table 7.3.2-1):
TABLE 7.3.2-1Cryogenic Pipe Electrical Insulator Replacement Summary
01
2
345
6
789
Determine which of the break boxes contains the leaking pipeopening of the break box and setting up tools and fixtureslocating of the pipe electrical insulator to be repairedpositioning of the tools support frame (remote case, but possibly also for hands-on)stripping of the electrical insulation & screenscutting of the pipe section containing the leaky insulatorwelding of a new pipe section containing a new insulatorleak testing and electrical insulation & screen applicationremoval of any tool and fixturesclosing of the break box
Coil repair by replacement of faulty winding module falls under the category offull coil replacement as it entails, after disconnection, the complete removal ofthe component from the cryostat.
Replacement
(a) Disconnection
Coil replacement requires that, as first and last stages of the operation, thein-cryostat feeders containing the superconducting busbars and the cryogeniccoolant pipes are disconnected and re-connected. Cutting and re-welding of thetwo cryogenic coolant pipes (feed and return) are performed using standard tools,possibly adapted for remote use. Disconnection and re-connection of the busbar
FDR-UER Plant Design Description Chapter II-Section 7.0-Page 21

joints is somewhat more complex, requiring the removal and re-application of aground insulation shroud over the joint. The electrical joint must eventually beopened by removing several screws and clamp shells. The most criticaloperation is the re-connection of the new joint; extensive R&D is required toensure good results. Each of the in-cryostat feeders must be disconnected at twoor more sections, depending on the length of the line inside the cryostat. Thedisconnection operation has been studied in some detail and design changesimplemented to allow, at least in principle, the operation to be performedremotely.
(b) Removal
Removal of a PF coil implies that the faulty coil is extracted from the machinethrough openings in the cryostat. The cryostat is designed so such openings canbe provided, at set locations of its top and bottom sections, by disconnection ofbolted /welded flanges. The design of such flanges is such that thedisconnection/re-connection operation can be repeated several times. Thecryostat openings allow the PF coils removal as follows:
• PF1, PF2 (and central solenoid, see relevant section below): from thetop, after removal of the cryostat lid central opening (R 6,973 mm);
• PF3, PF4, PF5 (if lifted through the top): from the top, after removal ofthe entire cryostat lid;
• PF6: from the bottom, after removal of the cryostat bottom outerannulus;
• PF7, PF8, PF9: from the bottom, after removal of the cryostat bottominner annulus.
After disconnection of the in-cryostat feeders, the PF coils removal path must becleared of any obstruction (coil feeders, TCWS pipes, etc.).
Re-winding of the lower PF coils
Special basemat room features and provisions required to allow and facilitatein-situ re-winding of the lower PF coils (including PF5, PF6, PF7, PF8, PF9) are:
• Removable cryostat bottom by means of welded flange and boltedconnection;
• Removable bioshield (basemat room ceiling)
• 6.630 mm headroom below upper concrete bioshield;
• Possibility to install thinner gamma shielding at the cryostat level-35,720 m, thus allowing increased headroom for the re-winding oftallest coil (PF6);
FDR-ITER Plant Design Description Chapter II-Section 7.0-Page 22

• Apertures in the gravity support ring pedestal and central solenoid ringpedestal to allow super conducting cable feeding during coil winding.
A study conducted by the EU, JA and US Home Teams has established thefeasibility of several methods for fabricating a replacement PF coil in-situ underthe machine with present technology.
7.3.3 Toroidal field coils repair/replacement
Each TF coil can be repaired following a cryogenic line electrical insulator heliumleakage.
Any other fault that can not be repaired by opening the TF coil break box requiresthat the coil is removed from the machine. The replacement operation must notaffect the CS coil. TF coil replacement entails the preliminary dismantling andremoval of a large number of the components inside the cryostat, includingportions of the in-vessel components (blanket modules, divertor cassettes,backplate). Depending on the vessel and TF coil activation levels at the time ofreplacement, some form of local gamma shielding may be required. It is arequirement that the vacuum vessel vertical ports outer diameter is such as toallow the re-positioning of the coil PF3. In this way, coil PF3 can be temporarilysuspended below the tokamak cooling water system guard pipes and laterallydisplaced to allow the passage of the TFC/W sector assembly. In this way,replacement of the TFC/W sector is possible by cutting only the cooling pipes ofthe T F / W sector to be removed.
Repair
The TF coil break boxes repair scenario is similar to that described for the PF coilbreak boxes.
Replacement
(a) Disconnection
The TF coil disconnection scenario is similar to that described for the PF coil.
(b) Removal
Removal of the TFC/VV sectors requires that some preliminary in-vesseloperations are carried out. These involve the removal of: a) relevant vertical,equatorial and divertor port inserts, b) approximately 2 of the 20 sectors of theblanket modules and divertor cassettes, c) approximately 2 of the 20 sectors of thebackplate. This would allow access to the field joints for the removal of thevacuum vessel sector associated to the TF coil to be removed. Details of thedismantling operations including gamma shielding requirements are given inAppendix N of the Remote Handling DDD 2.3. After disconnection of thein-cryostat feeders, the coil removal path must be cleared of any obstruction asindicated in the Table 7.3.3-1 below:
FDR-ITER Plant Design Description Chapter II-Section 7.0-Page 23

Once the upper biological shield, support structure and entire cryostat lid havebeen removed, and replaced by a thinner gamma shield with an appropriateopening, the TFC/W sector is removed following the outline procedure givenin Table 7.3.3-1:
TABLE 7.3.3-1TF Coil Removal - Summary
Step1
234
56
7
8
91011
DescriptionDisconnect electrical and cryogenic connectors of the PF1, PF2, PF3, relevant top correctioncoil(s) and of the failed TF coil. Remove current feedersDisconnect and remove PF1, PF2 and relevant top correction coil(s)Disconnect the TF coil from PF4-PF5 bracket, PF6, PF7, PF8, PF9 and lower correction coils.Disconnect and remove TCWS guard pipes (two) and vacuum vessel thermal shieldflow/return cryogenic pipesRig lifting equipment, disconnect PF3 clamps, lift and displace laterally PF3Cut and remove the (two) relevant vertical, equatorial and divertor ports.Retract port bellowsDeploy equipment for the disconnection of the upper, intermediate and lower intercoilstructures. Disconnect intercoil structures (assumes that access to the middle intercoilstructure is possible without removing PF5)Insert TFC/W sector lifting equipment through top gamma shield and rig up TFC/WsectorDisconnect relevant lower crown wedges and release TF coilDisengage assembly and lift out of the PitTransfer TFC/W assembly to shielded area
The new coil will be put in the place of the removed coil by reversing theremoval process.
7.3.4 Central solenoid repair/replacement
It is a requirement that the central solenoid (CS) can be repaired following acryogenic line electrical insulator helium leakage. Any other fault may requirethat the CS is removed from the machine. To remove it, only part of the cryostatlid and bioshield needs to be removed (central opening on top of cryostat R 6,973mm). No other adjacent coils need to be removed.
The basic CS removal procedure requires to remove first the preload structureand to cut the CS feeder lines before lifting the CS itself through the centralflange of the cryostat lid.
7.4 In-hot-cell maintenance
The hot cell provide space and facilities for storage, remote handling, repair ofradioactive or highly contaminated components and materials, including:
Divertors Divertor Diagnostic Blocks
FDR-ITER Plant Design Description Chapter II-Section 7.0-Page 24

Blanket modules Divertor Diagnostic TraysIC H&CD modules Detector arraysPellet Injectors NB Injector Ion SourcesCryopumps EC H&CD modulesEquatorial Diagnostics Top Port Diagnostic ModulesTest Blanket Modules Remote Handling Tools
Facilities are also provided for storage and maintenance of remote handlingtools, and for the volume reduction and encapsulation of radioactive waste priorto disposal by the ITER host.
The objects to be handled may be as large as 3 by 5 by 5 m, weigh up to 75 tonnes,and can be strong radiation sources (with surface dose rates up to 2500 Sv/h). It isimpractical to maintain these systems in-situ, and equally impractical totransport them from the tokamak to the hot cell building in shielded containers.Instead, the shielding function during transport operations has been assigned tothe ITER buildings. Radioactive objects normally originate at the divertor orequatorial port levels in the tokamak building. They are transported between thetokamak and the hot cell building using remotely controlled vehicles and sealedcontainers. Figure 7.4-1 shows the general arrangement of the tokamak building,hot cell building, and transfer pathway. The robotic tools which are used todisconnect and extract, or re-install tokamak internals operate from within thesecasks. Tractor vehicles and air bearing carriers are used to transport objects fromthe tokamak ports, around tokamak building galleries, and via the gallery lift, toelevation -12.7 m. At this level, the tokamak and hot cell buildings areconnected by a shielded pathway.
The hot cell building and hot cell processes are designed to minimize the cost ofITER operations by allowing the re-use of significant parts of divertor andport-mounted systems, and by minimizing the volume of radioactive wasterequiring disposal. The facility is required to provide shielded storage for plasmafacing components and remote handling tools, and space to conduct repair andwaste processing operations. Remote handling transfer casks and vehicles arestored separately in the tokamak building (laydown hall).
7.4.1 Hot cell facility and layout
The hot cell building is a rectangular building, approximately 76 m by 110 m,with two primary operating levels. Three primary storage cells running northand south are located on the lower level in the interior of the building and aretypically 16 m wide by 45 m long and 14 m high. These cells are separated byworker or utility spaces which are typically 5 m wide, and are constructed withintermediate floor slabs to provide several levels. Two of these cells are used forhighly radioactive components, and will probably never be entered once theyhave become contaminated. The third cell is used for storage and maintenanceof remote handling tools and equipment, and will be routinely accessed by ITERworkers. Two smaller storage cells are used for test blanket modules and top portmounted systems.
FDR-ITER Plant Design Description Chapter II-Section 7.0-Page 25

A transfer cell at the south edge of the hot cell building is used to provide accessto several docking points and to the pathway to the tokamak building. Thedocking points are located on transfer cells which can be inerted with nitrogen, sothat the atmosphere inside the casks will match the atmosphere in the tokamak.All the other cells in the building are filled with dry air. A second transfer cell atthe north end of the building is connected to the storage cells via smaller cellsused for examination and testing of components. The north transfer cell is usedto move components without casks, and communicates with the upper processlevel via a lift.
The upper level of the hot cell building is located at two elevations. The mainrepair and process cells located above the storage cells are at elevation + 3.3 m,while the minor waste processing and waste storage cells are located at elevation0 m. Heavy shield walls in the upper part of the building are aligned with thewalls in the lower part of the building for structural design, so the sizes of thestorage and processing cells on the lower and upper levels are the same, and thewidth of the intervening access and utility spaces is also the same. One processcell is dedicated to repair of divertor cassettes, while the second main process cellis equipped with more generalized workstations, and will be used to repair allother port-mounted systems, including diagnostics, cryopumps, heatingantennas, NB injector sources, etc. The third main cell will be used to processwaste for disposal by the ITER host. A cell is provided for on-site storage of theencapsulated waste expected to be produced over a six month period.
The walls and floor slabs of the hot cell building are required to attenuateradiation so that operators can safely observe and control robotic processmachinery. The thickness of shielding provided is equal to 1.35 m of ordinaryconcrete. The hot cell building also provides containment and control ofpotential airborne radioactive releases from hot cell processes. The cells aremaintained at negative pressure in four steps. The worker occupied areas arekept at -1 mbar, the tool storage cells and similar spaces used for machinerymaintenance are kept at -2 mbar, process and transfer cells are kept at -3 mbar,and storage cells are kept at -4 mbar. This design assures that leakage is generallytoward areas of increasing contamination. All contaminated spaces (amber andred zones) are provided with HEPA filters. Process and storage cells are alsoprovided with systems to continuously remove tritium from the cellatmosphere. The exhaust from all spaces in the hot cell building is exhausted tothe environment via the tall plant stack.
Workers are able to observe nearly all process and transfer locations. Normally,robotic repair machinery will be controlled from stations located near pointswhere the process can be physically observed. Transfer operations betweenstorage locations, process locations, and between the hot cell building and thetokamak building will be controlled from a telemeteric control room located inthe personnel building.
FDR-ITER Plant Design Description Chapter II-Section 7.0-Page 26

7.4.2 Operations and equipment
Hot cell operations include: docking and receiving, decontamination, storage,repair, waste processing and storage (see Figure 7.4-2). Each of these processes isdescribed in the following sections.
Docking and receiving
There are two nitrogen inerted receiving cells with docking ports forreceiving/dispatching casks with components transported from/to the tokamak.The first receiving cell, with two interchangeable docking ports, is dedicated tothe transfer of divertors, general tokamak components and urgent RH toolsstorage. The second receiving cell, with one docking port, is dedicated to thetransfer of RH tools storage and test blanket modules (TBMs). Another dockingport is provided for direct docking of an empty transfer cask to the RH toolstorage and repair cell in order to test/check/tune RH tools within the cask.
The docking ports, which have identical double-door systems to thecorresponding docking ports in the Tokamak Pit, provide hermetical connectionof the transfer casks to the hot cell receiving cells. When the transport cask isdocked and mated, the double-seal door is withdrawn laterally, and thecomponent is pushed (pulled) into (out of) the receiving cell by the transport caskmechanism. The receiving cells are purged with nitrogen to < 1% O2 duringtransfer cask docking. The transfer cask is separately purged with nitrogen to< 0.1% O2 before undocking.
The docking ports have exchangeable docking adapters which enable a port toreceive different types of tokamak components during a maintenance campaign.Therefore, a port failure does not cause a serious delay to tokamak maintenanceoperations because one of the other ports can be adapted to receive thecomponents which were being received at the failed port.
Dust and tritium decontamination
It is possible that the received component would contain significant amounts ofdust and mobilizable tritium. Therefore, both receiving chambers contain dustremoval and detritiation facilities.
Dust is removed under the nitrogen atmosphere with a robotic arm fitted withmechanical vacuum brush end-effector and is collected in a filter bag before beingdetriated and disposed of.
After dust is removed, a determination is made whether the residual level ofmobilizable tritium requires removal. If necessary, tritium is removed byexposing the surfaces to a localized flow of hot nitrogen or air containingmoisture. Tritium is removed from the chamber by an ADS type processingunit.
Storage
In order to support the process operations, six storage cells are provided.
FDR-ITER Plant Design Description Chapter II-Section 7.0-Page 27

1) Divertor Storage Cell - provides storage for both unrepaired (60 cassettes)and repaired/new (60 cassettes) plus spare cassettes.
2) General Purpose Storage Cell - provides storage for all other tokamakcomponents except top port diagnostics and test blanket modules.
3) Urgent Tool Storage Cell - provides for several (3 to 4) urgent RH toolswhich are immediately needed for exchanging without undocking the transfercask during a Tokamak maintenance campaign.
4 Remote Handling Tool Storage Cell - provides for storage and repair of allRH tools.
5) Test Blanket Module Storage Cell - provides for storage and repair of TestBlanket Modules due to their specific functions and requirements formaintenance / repair.
6) Low Level Storage Cell - provides for storage and repair low levelradioactive components such as top diagnostics. Due to their relatively lowcontamination level the storage and repair of such diagnostics can be carried outby "hands-on" activities.
Repair
The hot cell provides five dedicated repair facilities as described below.
1) Divertor Repair Facility - all operations are carried out by armed roboticequipment. The divertor is moved from station to station in assembly-linefashion where dedicated robots carry out repair tasks. Removed high heat fluxsurfaces and other discarded parts are transported to the waste processing line fordisposal. Each processing station is directly controlled from a local control stationwith direct visual access and/or indirect visual access through electronic visionsystems.
The repaired divertors are subject to a series of acceptance tests which includealignment and dimensional tolerances, leak and flow tests. In addition thediagnostic and optical divertors will be subject to specialized diagnostics testing.
2) Multi-Purpose Repair Facility - services blanket elements, cryopumps, NBinjector ion sources, EC H&CD modules, IC H&CD modules, equatorial portdiagnostic modules, pellet injectors and divertor diagnostic trays.
General purpose stations perform common operations on all components,although each component has dedicated stations for specialized repair.
3) Remote Handling Repair Facility - provides for both the storage and repairof the remote handling equipment. The design and operation of this facility hasnot been defined as yet.
FDR-TTER Plant Design Description Chapter Il-Section 7.0-Page 28

4) Test Blanket Module Repair Facility - provides for both storage and repairof test blanket module equipment. The design and operation of this facility hasnot been denned as yet.
5) Low Level Component Repair Facility - provides for both storage andrepair of low level radioactive components such as the top port diagnostics. Thisequipment is expected to receive mild neutron exposure so as to permit"hands-on" maintenance. The design and operation of this facility has not beendenned as yet.
Waste Processing and Storage
The hot cell waste processing and storage system is designed to process and storeall highly radioactive solid materials from the tokamak and store highlyradioactive filters and resins (option) from the TCWS CVCSs. The system iscomprised of the following processing stations and subsystem elements:
1) Beryllium Shaving Station - provides for removal of the beryllium armorfrom PFW and blanket elements. The beryllium is expected to retain significantquantities of tritium and, therefore, because beryllium itself is a toxic material,the beryllium armor constitutes a mixed waste. It is cost effective to remove theberyllium from the PFCs for separate disposal. The shaving station is located inan isolated, nitrogen-inerted enclosure in the Waste Processing Cell.
2) Tritiated Waste Encapsulation Station - provides for encapsulation andsealing of tritiated waste materials in stainless steel storage containers. The twomajor types of tritiated waste materials are the divertor HHFCs and berylliumshavings.
3) Tritium Recovery Station - provides for volumetric recovery of embeddedtritium from beryllium and carbon surface materials by a vacuum heatingprocess to 800°C for several hours.
4) Cutting and Packing Station - provides for cutting large objects intosmaller pieces for efficient packaging in the storage containers for high levelwaste. Because the cutting operation generates considerable debris, the machineis located in an isolation sub-cell to prevent spread of radioactive debris/ dust.
5) General Waste Encapsulation Station - provides for sealing of containers,decontamination of surfaces if necessary, and inspection of containers forleakage or damage.
6) High Level Radwaste Storage Facility - provides for storage of containerswith high or intermediate level radwaste and preparation of containers forshipping by the host country to an off-site repository. This facility is required tostore up to six months accumulated waste. This is estimated to be approximately75 storage containers, where each container is 1 m in diameter and two metershigh.
FDR-ITER Plant Design Description Chapter II-Section 7.0^Page 29

7.5 Development plans
The in-vessel RH procedures (described in the DDD 2.3) summarised in thisreport form the basis for the R&D tasks in the RH area. These include theso-called L6 and L7 tasks that aim at demonstrating, in one-to-one scale mock-uptests, the blanket module and divertor cassette replacement respectively.Associated with these demonstration tests is not only the in-vessel handlingequipment, but also pipe cutting and welding tools and the equipment used foropening and closing ports, double-seal doors, transfer cask, etc. Most of theequipment and tools have been fabricated and are now under preparation for theintegrated tests in the respective test platforms.
Remote replacement of the blanket modules and divertor cassettes is a firm ITERrequirement. Their proof-of-principle demonstration towards the end of EDAwill give a high level of confidence in the viability of the in-vessel maintenanceapproach. Further confidence will be gained by using, to as large an extent aspractical, the RH equipment for the initial ITER assembly. Even the firstinstallation of equipment in all ports will require the availability of the specificskids developed for the handling and connection of each component to beintroduced in ports. They will be operated hand-assisted, and their remotizationtested.
Development of the in-vessel inspection and metrology system, which areincluded in present R&D programs, will also benefit from use during the initialmachine installation and operation.
Ex-vessel RH equipment will generally be procured only when needed. Hence,this equipment will not benefit from the above-described step by stepdevelopment. The plan is, however, to select from the most critical and difficultremote repair operations, a few that can be developed in small scale bench testsbefore machine installation. This will include maintenance inside the breakboxes, development of tools for the extraction and re-insertion of shear keys, e.g.,for the intercoil structures, as well as tools for automatic welding of cryolines forthermal shields, for attachment/detachment of High Heat Flux Component(HHFC) to/from divertor cassettes in the hot cell.
Experience has shown that in order to develop reliable equipment, tools andprocedures, testing under conditions which are as realistic as possible is ofparamount importance. At present, two large scale test facilities have beenconstructed by Home Teams for the implementation of the L6 and L7 taskstogether with associated tests. During the construction phase these should beused to further develop procedures and equipment and train operators prior tothe initial machine assembly.
The above structured development approach is directed towards havingavailable at the start of ITER operations, fully proven RH Class 1 and 2procedures and some critical Class 3 operations, together with the associatedtransporters, manipulators, tools and inspection equipment. The following arethe main milestones:
FDR-ITER Plant Design Description Chapter II-Section 7.0-Page 30

At the end of EDA, proof of principle demonstration of the remotereplacement of blanket modules and divertor cassettes, and conceptualstudies of the ex-vessel procedures and equipment requirements;
At the completion of machine assembly, fully provenremotely-operated transporters, handling equipment, tools for in-vessel procedures and for hot cell repair;
At the start of tritium operations, proven bench-tested prototype tools,equipment and procedures for critical RH Class 3, ex-vessel operations.
7.6 Assessment
Remote maintenance of the ITER machine requires the development oflarge-scale transporters, tools and special equipment that have to operate reliablyin a significant radiation environment.
The remote maintenance requirements have a very strong impact on the designof machine components and on the overall machine and building configurationin order to guarantee a minimum availability of the facility for effectiveoperation, when taking into account the expected duration of necessary remotemaintenance.
The strategy described in this document for the remote maintenance procedureshas had a considerable impact on the design of components (e.g., blanketmodules, specific equipment in ports), on the building design (e.g., shielding inthe pit between different ports), hot cell configuration and the initial machineassembly.
As described, hands-on and hands-on-assisted maintenance are used, wherepossible, for effective maintenance operations and cost saving. This allows manypreparatory operations at the divertor and equatorial port interfaces to be carriedout manually. The initial calculations of the dose rate also offers the possibilityof hands-on interventions inside the cryostat at critical locations up to the end ofBPP, and possibly later.
Shielding inside the pit between ports has been provided to maximize parallelhands-on operations at different port locations. This development allows theremote maintenance to concentrate on in-vessel work, long-term operationsinside the cryostat and on transfer of components to and from the hot cell. Thistherefore results in a somewhat reduced, more focused RH developmentprogram.
The RH procedures for the main in-vessel components are now in such anadvanced state that prototype RH equipment has been procured and fabricated, orunder fabrication. During the demonstration tests, any shortcoming will berevealed both in design of in-vessel components with respect to RH compatibilityand in the design of the RH equipment. These can be corrected and re-testedbefore component procurement is initiated. This should therefore lead todesigns that have full RH compatibility. The subsequent installation in the
FDR-ITER Plant Design Description Chapter II-Section 7.0-Page 31

vacuum vessel using the RH equipment should lead to well-developed RHprocedures for component replacement.
Considerable progress has been achieved during the last year in the developmentof credible, ex-vessel, hands-on/remote repair procedures, includingmaintenance of the magnet break boxes as well as replacement of thecomponents inside the cryostat. The cryostat design (cover and bottom lids) hasbeen modified to enhance the possibility of removing and replacing cryostatsections for coil replacement. Procedures will be developed further to havesufficient details in hand for the evaluation of any design impact on the in-cryostat components and cryostat. This is expected to result in the identificationof a few particularly difficult operations that could then be considered fordevelopment through R&D.
Hot cell procedures are certainly less critical than those related to the in-vessel orin-cryostat remote action; they can be generally specified according to alreadyavailable experience. Nevertheless, on the one hand they should be developedto get enough details for the evaluation of design impact on the components tobe repaired; on the other hand, the procurement of the hot cell equipment can bedelayed for a long time, even after the start of ITER operation.
While posing complex problems, the design and development required for theremote maintenance of ITER has been given the priority it deserves and thedesign and R&D program involving the JCT and Home Teams is tackling theissues in an efficient, well-structured manner. The scale of the task is, however,such that these efforts need to continue through the construction phase.
FDR-ITER Plant Design Description Chapter II-Section 7.0-Page 32

Figure 7.2.1.2-1Divertor Remote Handling Port
Double Seal Door Operation

VACUUM VESSl
CASSETTE TOROIDAL MOVER
RADIAL CASSETTE CARRIER
OUTBOARD CTM FORK
TOROIDAL RAILS: (RAIL & RACK ) Figure 7.2.1.2-2Divertor Cassettes Handling Concept

Maintenance port
Removal of bioshield plug
±i.
Removal of blanket shield plug
±Deployment of rail
Transport blanket module
Inserting of blanket module
i.Storing rail
Installation of blanketshield plug
IInstallation of closure plate
Installation of bioshield plug
Removal of closure plate
C Cutting of cooling pipes J
>• Removal of blanket module
Installation of blanket module
Welding of cooling pipes
f Inspection of cooling pipes
Leak test J
Figure 7.2.2-1Replacement procedure of blanket module

Figure 72 3-1In-Vessel Transporter
(Rail Mounted Vehicle System)

Vehicle location forrail deployment & withdrawa.
Figure 7.2.3-2Deployed Rail and Vehicle

Trove I
Vehicle roll
Figure 7.2.3-3Overview of In-Vessel Transporter

V7777777777777777777,1. tfemove the ICH vacuum transmission tines (VTLS).
Fort assembly cooling pipes (not shown) andthe bioshield plug. * r r ^
ICH Removal Step 1(Hands-on)
1. feemove the remaining VTLS and Port AssemblyCooling Pipes (not shown) and the secondaryclosure plate using proper contamination control.2. Install/adjust the support bridge as required (TBD)3. Install trw contamination liner.
maintenance door.
ICH removal step 2(Hands-on)
\. Attach the vehicle and withdraw Raised antennathe portassembly onto the carrier. juDDOrt Dlatforms
2. Raise theRaise the support platforms once theclosure plate flange has passed bacJLplatform.
3. Close the cask door.4. Undock the cask and
transfer to the Hot Cell.
Step 31. Dock and seal the cask to the cryostat2. Open the double seal door (combined
cask and maintenance door).3. Deploy carrier to port4. Engage/adjust support bridge at W port end.5. Unbolt and cut the primary closure plate UP weld.6. Engage port assembly rollers as required.
ICH Removal Step 4
Figure 7.2.4.1-1ICH Removal Sequence
(Solid Port Insert)

Y\

U$l JQMfP OOOftf DOOR ASStMOLY
mi 5amx nuKKmta
C>IS<f / « OOWfO POSITION
Figure 7^.5-1NBI remote nandline equipment
(Transport cask in docked position)

Raodoc
<
Turntable Docking Port / / Receiving Cell /Cassette
Transfer Cask
Note: Unrepaired Divertor Cassette
Repaired Divertor Cassette
The process steps:
1. Extract divertor cassette from Tokamak into transfer cask.*2. Transport cassette to the Hot Cell Building.*3. Connect the transfer cask hermetically with Docking Port and unload the transfer cask.4. Remove dust and co-deposited tritium from divertor cassette HHF surfaces.5. Transfer divertor cassette from Receiving Cell into Divertor Cassette Storage Cell.6. Store divertor cassette before repair/waste processings.7. Transfer repaired cassette into the Receiving Cell and load the transfer cask.8. Transport repaired divertor cassette into the Tokamak Building.*9. Install cassette into the Tokamak.*
* - Interface process
Figure 7.4-1General arrangement of
the tokamak building, hot cell building,and transfer pathway

(GeneralComponents)
Tokamak-**-
(Divertor)
Waste <NV-P1 Disassemble Component)—*»1 Assemble Component!-»>ForlCRF
- Replace antenna array- Replace coaxial pipe
ForECRF-Replace Valve-Replace Window• Replace Mirror Assembly
Forlarfcet- Weld Cooling Pipe-Refurbish Surface
For Cryopump- Replace Valve Plug t Seat- Replace actuator £ Bartons
-Blockage test• Insulation Resistance-Minor Alignment-Leakiest- Pressure test
Repair STUMH Disassemble HHFsH Assemble HHF«H Radaca
Cask DockingOust Cleaning
Tritium Removal
-a.
i
i
InterimStorage
•Examination- Visual Inspection• 3D Measurement -Dlsassembleplug -SatnewHHFs -Cutpipe
-Cut Internal pipe -Setbolts -Setnewbolts-Rjnoveseang - W e W p l p . i • ^ W » *
- Remove HHF parts . inspect welds - Inspect welds-Align nozzle- Measure nozzle
jjdjgg-l Inspection h J
Figure 7.4-2 Hot Cell Operations Process Block Diagram

INTERNATIONAL THERMONUCLEAR EXPERIMENTAL REACTOR
V
TECHNICAL BASISFOR THE
ITER FINAL DESIGN REPORT, COSTREVIEW AND SAFETY ANALYSIS
(FDR)
Chapter III
PLASMA PERFORMANCE ASSESSMENTS
13 July 1998

CHAPTER IIIPLASMA PERFORMANCE ASSESSMENTS
TABLE OF CONTENTS
1.0 INTRODUCTION 12.0 PLASMA OPERATION overview 33.0 PHYSICS BASIS ISSUES (performance) 73.1 Energy confinement 73.2 Plasma operational limits 123.3 Divertor physics 184.0 PROJECTION OF ITER PLASMA PERFORMANCE 194.1 Fusion performance and effect of confinement variation 214.2 Time dependent scenarios and plasma kinetic control 264.3 Flexibility and plasma performance optimization 294.4 Non-inductive steady state operation 304.5 Power and particle control and divertor performance assessment 354.6 Energetic particles 415.0 PLASMA OPERATION AND DISRUPTIONS 445.1 Plasma operation scenario, control, and protection 445.2 Plasma disturbances (recoverable) 535.3 Disruptions, VDEs, runaways and fast shutdown 545.4 Disruption avoidance, mitigation and amelioration 646.0 ITER OPERATION PLAN AND PHYSICS PROGRAM 676.1 Operation plan 676.2 Physics program 686.2.1 Hydrogen plasma phase 686.2.2 Deuterium plasma phase 696.2.3 Deuterium-tritium plasma phase 697.0 PLASMA MEASUREMENTS AND DIAGNOSTICS 718.0 CONCLUSIONS 76

1.0 INTRODUCTION
ITER is envisioned to be the next major step in the world fusion program. As a"next-step" device on the development path defined by nearly thirty years ofimprovement of the tokamak fusion concept, ITER will combine a capability forachieving sustained ignition (Q = °o) and extended-duration fusion burn in DTplasmas with reactor-relevant engineering features that include superconductingmagnet systems and remotely-maintainable in-vessel nuclear shielding andplasma-facing-components with steady-state power and particle exhaustcapabilities. Key features and parameters of the ITER device are presented inFigure 1 and Table 1, and discussed in References [DDD97a,IDR95, & DDR96].
rr con
STRUCTURE CROWSVACUUM VESSELSUPPORT
FIGURE 1ITER Device and Plasma Cross-Section
ITER will represent a major step forward in terms of both the implementation oftokamak technology in a reactor-relevant manner and, in so far as plasmaphysics and operation issues are concerned, in plasma size, current and powerlevel. In terms of plasma size and current, ITER will be a step of about a factor ofthree in major radius and about a factor of five in current beyond JET and JT-60U.This step in size /current is not unprecedented, and is in fact commensurate withequivalent previous steps taken in fusion program, e.g., from T-3 to T-10, fromPLT to TFTR, from JFT-2M to JT-60U, or from ASDEX to JET.
In terms of fusion power, the step from the present generation of tokamaks(-10-15 MW) to ITER (-1-1.5 GW) is larger—about two orders of magnitude. Oneorder of magnitude comes naturally from the larger volume of ITER. The
FDR-Plasma Performance Assessments Chapter Ill-Page 1

second order of magnitude represents a true step in plasma performance and isthe critical step to a magnetic fusion reactor where self-heating must provide themajority of the plasma heating power. Our readiness to attempt this step in ITERis supported both by our understanding of the physics of plasma performance intokamaks [IPB98] and by recent explicit demonstrations of plasma performance inthe present generation of large tokamaks, including the achievement of multi-MW DT power pulses in TFTR and JET (Figure 2) and the achievement of anequivalent DT fusion Q of about 1 in JT-60U DD plasmas.
TABLE 1ITER Design Parameters
ParameterMajor/ minor radiusPlasma configurationVertical elongation/triangularity (at 95% flux)Plasma volumePlasma surface areaNominal plasma currentToroidal fieldMHD safety factor (q95)Fusion power (nominal)Average neutron wall loadingPoloidal field system flux swingFlux swing for burnBurn duration (ignited, inductive drive)Toroidal field ripple (peak/ average)Auxiliary heating power
Value8.14m/2.80m
Single null divertor1.6/0.24-2000 m3
-1200 m2
21 MA5.68 T (at R = 8.14 m)
-3.0 (at 21 MA)1.5 GW
~lMW/m2(atl.5GW)-530 Wb
a 80 Wb (at 21 MA)21000ss 0.7%
100 MW
15 -
.10-
-
TF
/JET
TR(1994)
XI
JETU997)
1 JET (1997)(2 5
0 1.0 2.0 3.0 4.0 5.0 6.0Time (s)
FIGURE 2Fusion Power Achieved in TFTR and JET DT Experiments
FDR-Plasma Performance Assessments Chapter Ill-Page 2

These recent results and our plans for ITER are based upon an increasinglymature understanding of the physics basis and considerations that govern bothbasic plasma physics and the confinement of plasmas in tokamaks. There are,however, new aspects of plasma physics and operation that will be unique to anITER-class tokamak. These plasma physics aspects—both those already tested andthose to be explored for the first time in ITER—are presented in detail in theITER Physics Basis, [IPB98], and their application to the design and performanceprojection of ITER plasmas is presented in the Plasma DDD [DDD97a]. In thisChapter, we present an overview of the major physics basis elements thatdetermine ITER plasma performance and operational feasibility. Section 2 startswith the summary of ITER operation basis and major plasma parameters.Section 3 gives a short discussion of the three key physics basis elements—confinement, beta and density limits and power and particle exhaust by adivertor—that combine to determine the achievable plasma performance inITER. Predictions for ITER plasma performance are summarized in Section 4.The sensitivity to energy confinement and to divertor/plasma edge optimizationare presented in this section. Operational flexibility, non-inductive steady-stateoperation and the effects of energetic particles are also discussed in the Section 4.Section 5 discusses plans for how ITER plasma operation will be implementedand control and how the potentially deleterious effects of disruptions and plasmaoperation anomalies will be accommodated. Section 6 presents a summary of theplanned ITER operation plan and physics program. Section 7 summarizes theplasma measurements and diagnostics that will be provided to support plasmacontrol and the conduct of the ITER operation and physics programs. Section 8summarizes the conclusions of this chapter.
The work presented in this chapter has been done by many individuals, bothwithin the JCT and in the Home Teams and the Physics R&D Programs of theITER Parties. Acknowledgments and references to the contributors can be foundin [DDD97a,IDR95,DDR96, & IPB98]. Here, for brevity and clarity, we have chosento omit references.
2.0 PLASMA OPERATION OVERVIEW
ITER is designed to achieve controlled ignition and extended burn with aninductively-driven plasma operation scenario. Performance projections showthat sustained ignition and adequate plasma power and helium exhaust can beobtained with operation in a sawtoothing, ELMing H-mode plasma with smallquantities of recycling impurity (Ne, Ar, etc.) added to promote pre-divertorradiation of thermal power. Here ELMing denotes the presence of quasi-periodicEdge Localized Modes, and H-mode denotes enhanced (High-mode) energyconfinement obtained with formation of a region of reduced energy and particletransport (transport barrier) just inside the separatrix of a magnetically-divertedplasma. Operation with a sawtoothing, ELMy H-mode is well studied in thepresent experiments and a large database is available for projection of the energyconfinement and other essential parameters to ITER. The mode providesadequate confinement and allows sustained stationary (time-independent)plasma operation with low impurity concentration, controlled density, high
FDR-Plasma Performance Assessments Chapter Ill-Page 3

plasma beta, and adequate helium transport to the plasma boundary.Quasi-stationary ELMy discharges with ITER-like plasma geometries have beendemonstrated in all major divertor tokamaks, and transition to the H-mode canbe achieved when sufficient heating power is applied.
Representative plasma parameters for inductively-driven plasma operation inignited ELMing H-mode plasmas are presented in Table 2. Two possible ignitedcases are shown: (1) nominal, with full 1.5-GW power, obtained with the plasmadensi ty sl ightly above the Greenwald densi ty ,nGw(1020 m-3) = I(MA)/rca(m)2 = 0.85, and (2) low-density, at reduced 1.2-GWpower, obtained with the plasma density equal to the Greenwald density. Bothcases include allowance for the plasma dilution and radiation loss due to ~0.15%argon which is added to limit total divertor target power to £ 50 MW. Thesecases are predicated on ignited operation with "nominal" ELMing (or ELMy) H-mode confinement as inferred from global energy confinement data. There arealso equivalent driven-burn cases that provide 1-1.5 GW operation in situationswhere energy confinement is degraded relative to this "nominal" basis. Detailsof these cases and the associated sensitivity of fusion power performance toenergy confinement quality are presented in Section 4.
FDR-Plasma Performance Assessments Chapter Ill-Page 4

TABLE 2ITER Plasma Parameters (for B = 5.7 T, I = 21 MA,
Nominal ELMy H-Mode Energy Confinement)
Parameters
Fusion power (MW)
Burn duration (s)
Auxiliary power, Paux (MW)
Volume-average beta, <P)(%)1'
PN[=<P>(%)a(m)BCT)/KMA)]
Safety factor, qElectron density, <n> (1020 m"3)
Average temperature, <T) (keV)
Plasma thermal energy Wth (GJ)
Plasma magnetic energy W m (GJ)
Energy confinement time, TE (S)
Impurity fractions (nz/ne) (%): Be/He/ Ar
ZrffRadiation from plasma core (MW)Ploss/Pth(L-H)4>
Power to divertor targets (MW)
Nominal
1500
1300
0
2.97
2.25
30.98
12.8
1.04
1.1
5.8
2/9/0.17
1.8
1201.3
50
Low Density
1200
1400
0
2.6
2.0
30.8512.7
0.88
1.1
6.3
2/8/0.16
1.8
100
1.250
Range2*
£1500
500-10000
<1003)
-
<4-5
2.6 - 5.2
0.2-2
3-30
sl.2
sl.2
3.5-8
-
. -
2:1
S1001 ( ) denotes volume average of the respective quantity.2 Including possible operation with reverse-shear or other optimized plasma
configurations.3 Upgradable to 150 MW.4 Ratio Pj o s s over nominal L- to H-mode power threshold. A value larger than 1
indicates that no hysterisis between L- to H- and H- to L-mode power thresholds isrequired to sustain the H-mode.
Power and particle control in ITER will be effected with a tightly baffled,single-null poloidal divertor (SND) that is actively pumped with cryo-pumps.Plasma fueling will be provided with gas puffing and pellet injection. Thedivertor plates are oriented vertically to reduce the heat flux on the targets, tominimize the density required for detached operation, and to provide a plasmaseal to minimize the leakage of neutrals from the divertor chamber by ionizingthem in the scrape-off layer plasma. The total heating power of 300-400 MW(alpha + auxiliary) will be exhausted via the first wall and divertor by acombination of bremsstrahlung and synchrotron radiation from the plasma core,impurity radiation from the plasma mantle, scrape-off layer and divertorchannel and conduction to the divertor targets (Table 2). Radiation losses to thefirst wall and divertor channel surfaces will reduce the peak heat loads on thedivertor targets to acceptable levels: 5-10 MW/m2. This corresponds to a totalpower on the target plates of about 40-70 MW. The radiation losses can beenhanced if necessary by the injection of small quantities of impurities (Ne orAr). Choice of the injected impurity species will provide some control over therelative partitioning of radiation losses among the plasma mantle, scrape-offlayer and divertor channels. Table 2 shows the operational scenario with Argon
FDR-Plasma Performance Assessments Chapter IH-Page 5

seeding as an example. For these conditions, the ITER divertor will operate inthe "partially-detached" regime achieved on modern divertor tokamaks. Thisregime has low heat loads on the divertor plates, and also provides adequate Heexhaust.
The reference plasma discharge scenario for ITER will follow the familiarsequence used in present tokamaks. The pulse will start with gas breakdown andcurrent initiation (assisted with ECH power) followed by a 150 s inductive currentramp up. The divertor configuration will be formed at In = 16 MA. Auxiliarypower (up to 20 MW in the limiter phase; 50-100 MW in the diverted phase) canbe applied if desired during current ramp up for control of plasma current profileand enhancement of toroidal rotation. The plasma density at the start of thecurrent flattop will be of 0.2-0.5 1020 nr3; the volume average temperature inohmically heated plasma will be 2-4 keV. Auxiliary heating of up to 100 MWwill be applied at the start of the flattop to obtain H-mode and the plasma densitywill be subsequently increased by fueling until ignition and nominal fusionpower are achieved. Burn (fusion power) control, divertor power control for^1000 s and subsequent normal fusion power shutdown over a 100 s shutdownperiod will be achieved with a coordinated combination of control of DT fueling,impurity fueling, pumping, and auxiliary power input. An example of time-dependent simulations of reference operation scenario is presented inSection 4.2. More details of the overall plasma scenario and the correspondingplasma control procedures are given in Section 5.1.
Alternate plasma operation scenarios and operation modes are possible. The PFsystem has flexibility to control steady state scenarios—with higher plasmaelongation and triangularity—within the reference in-vessel components.Steady-state scenarios with reversed central magnetic shear are possible in ITERat reduced current (at ~12 MA), and use of heating during current ramp up willmake it possible to create a hollow (reverse-shear) current profile at the start ofthe flat top of the discharge. These profiles can then be sustained bynon-inductive means. Addition of auxiliary power to the reference scenario willalso allow inductively-sustained extended burn (up to 6000 s) to be obtained.
Plasma control for the reference and reverse-shear scenarios will beimplemented with traditional means (magnetics, fueling and heating control).In addition, achieving the combination of adequate energy confinement, highbeta and high density needed for s 1 GW burn will likely require application ofactive "plasma optimization" means, including possible use of radially-localizedRF current drive for control of MHD island growth and provision of a coreplasma fueling capability to facilitate operation with good confinement at orslightly above the Greenwald limit density. These aspects of plasmaoptimization are presented in Sections 4.3 and 5.1.
It is expected that a certain number of plasma disruptions will inevitably occurduring the course of ITER operation, especially during the initial machinecommissioning and burning plasma development phases. The affected ITERsystems, especially the plasma facing surfaces and their supporting structures andthe vacuum vessel, are designed to accommodate both the direct effects ofdisruptions, the related effects of halo current produced by vertical displacement
FDR-Plasma Performance Assessments Chapter Ill-Page 6

events, and the effects of the conversion of plasma current to runaway electroncurrent following disruption. There will also be means provided to rapidlyterminate the plasma burn for machine protection and safety enhancement.These aspects of ITER operation are presented in Section 5.
3.0 PHYSICS BASIS ISSUES (PERFORMANCE)
The physics design basis issues that determine both the design of the ITER deviceand plasma, and resulting assessments of achievable plasma performance,encompass a wide range of physics and tokamak operation issues. Here most ofthe elements of ITER plasma performance have already been successfully testedin present-day experiments, and this testing and resulting experimental dataprovide the underlying basis for the ignited /driven-burn plasma operationconcept presented above. Here we address those three issues that most directlydetermine achievement of the required plasma performance: (i) energyconfinement, (ii) beta and density limits, and (iii) impurity dilution, radiationlosses, and divertor operation.
3.1 Energy confinement
Prediction of the expected energy confinement in ITER is a fundamental designbasis issue. Because an accurate prediction of plasma confinement and transportin a tokamak based on "first principles" is not yet available, we have pursuedthree more-empirical approaches to provide a foundation for the design of ITER.
(i) The first approach is based on the development of global scalings forconfinement and H-mode power threshold by means of statistical analysis of anextensive tokamak confinement and performance experimental database.
(ii) The second approach is based on experimental studies of non-dimensionallysimilar discharges having all major non-dimensional parameters (PN, V*,Pi*=Pi/a, q, a/R, K, etc.) as close as possible to ITER plasmas. This similarityapproach is used in other fields with turbulence, such as wind tunnelexperiments in fluid dynamics.
(in) The third approach for predicting ITER confinement is based on thedevelopment and application of semi-empirical and/or theoretical models.
Both global (empirical scaling) data analysis and non-dimensional plasmaparameter scans have been used to project energy confinement times for ITER.For the ELMy H-mode operation, both methods yield the same answer: theexpected energy confinement time for ignited ITER plasmas will be about 6 s.When other energy loss mechanisms (radiation and sawtoothing) and fueldilution from helium and added impurities are taken into account, thisconfinement is sufficient to allow sustained ignition at 1-1.5 GW fusion powerwith approximately 20% margin in the overall plasma energy balance.
FDR-Plasma Performance Assessments Chapter Ill-Page 7

It is also possible to predict ITER confinement on the basis of turbulent transportmodels. Here, however, our knowledge for turbulent transport is not complete,and there are several transport models that are able to explain some transportfeatures of present tokamak experiments. One-dimensional transport codes havebeen used to apply these models to ITER for predicting the confinement time,density and temperature profiles, and the ignition capability, etc. In order toderive transport coefficients for the transport codes, direct numerical simulationsof plasma turbulence using gyro-fluid and gyro-kinetic models are employed.
Global energy confinement scaling. A statistical analysis (log-linear regression) ofthe extensive H-mode database carried out by the ITER Confinement Modelingand Database Expert Group results in a recommended scaling [IPB98]—denoted byITERH-97P(y)—that is given in dimensional parameters by
•*ITERH-97P(y) = 0-029 Ri-84 a0™ K°«2 B°-2 Ip°o n i 90 - 4 M°-2 P-°-<* (1)
in units of sec, m, T, MA, MW, and 1019 nr3. Here P is conduction powercrossing the plasma edge, i.e. the difference between plasma heating power andcore radiation. Reformulation of this scaling in dimensionless variables (seebelow) shows that it is close to the so-called gyro-Bohm scaling. Figure 3 showsthe comparison of experimental data with the ITER-97(y) scaling. Extrapolationto ITER yields TB = 5.8 s with a 95% confidence interval (3.5 s TE (S) £ 9) [IPB98].
The approach based on the global energy confinement scalings is robust and has agood record of predicting energy confinement in the present machines. It isrecommended by the ITER Confinement Modeling and Database Expert Group asthe reference method for extrapolation of energy confinement time in ITER.
Dimensionless analysis. Theoretical analysis of H-mode database makes itpossible to identify a set of dimensionless parameters (in addition to geometricalparameters such as R/a, plasma elongation, q , etc.) that define the core plasmaconfinement. These dimensionless parameters (p*=p;/a, P, v*= ve/(0bounce) are:
p*= (2TM)i/2/eBa; p = 2^op/B2; v* = ve(me/T)i/2qR(R/aP/2, (2)
and if expectations for the dimensionless dependence of energy confinementapply, then the corresponding dimensionless confinement time £2JTE, where £2, isthe ion gyrofrequency, should depend only on the dimensionless plasmaparameters and the plasma geometry, i.e. Qitg = F(p*, p, v*, geometry). All ITERdimensionless parameters except p* can be reproduced in present experiments in"ITER demonstration" discharges and, therefore, extrapolation is needed only forthe p* dependence. This approach can potentially reduce uncertainties in theextrapolation and experimental studies of the dimensionless similar dischargeshave been used for test and validation of the database scaling approach.
FDR-Plasma Performance Assessments Chapter Ill-Page 8

0.01 -
0.01 10
FIGURE 3Observed ELMy H-Mode Confinement Times Versus ITER-97P(y) Fit
The choice of the principal dimentionless parameters has been confirmed byexperiments in the DIII-D and JET tokamaks, wherein discharges with the samedimensionless parameters, p*, p, v*, but different engineering plasma parametersare found to have the same dimensionless energy confinement time S2ITE-
Experimental studies of ITER-type discharges with ITER-similar values of p andv* in JET and DIII-D [IPB98] have also confirmed the gyro-Bohm-likedependence of energy confinement time on p*, and this finding increasesconfidence in the empirical scaling projection to ITER. However, thedegradation with p which is implicitly predicted by the previously-used ITER93Hscaling was not observed in either the JET or DIII-D p-scans. The ITERH-97P(y)scaling, which takes into account new additional data, has a somewhat weakerdegradation with P than the ITER93H scaling. The effect of eliminating the pdegradation is favorable for ITER and would increase TE by ~15%.
Aside from the question about the difference in the beta dependence, thedimensionless studies support the reference approach in estimation of energyconfinement in ITER based on the global energy confinement scaling.
Use of local transport models. Work is under way to develop and apply 1-Dtransport models—both empirical and first-principle—for projection of ITERperformance. A model testing activity has been organized by the ConfinementModeling and Database Expert Group and there has been good progress in
FDR-Plasma Performance Assessments Chapter 111-Page 9

developing a rigorous testing procedure against experiments [IPB98]. However,at the present time, the testing work is still incomplete and application of localtransport models for predicting ITER energy confinement is premature until themodels are more fully tested against experiments and confidence intervals havebeen more clearly established. In addition there is still a large diversity in theprediction of ITER performance among the models. Some yield pessimisticprojections unless a high edge temperature pedestal or peaked density profile isassumed; others yield optimistic projections and show a much weakerdependence on edge temperature pedestal or density peaking. It is not yetpossible to clearly discriminate between these differences [IPB98].
H-mode power threshold. Until the physics mechanisms responsible forsuppression of the L-mode (Low-mode) plasma edge turbulence and transition tothe H-mode confinement can be fully understood, empirical scalings for thepower threshold for the L-H transition provide the best physics basis forestimating ITER H-mode threshold powers [IPB98]. An analysis of theexperimental database for H-mode power threshold gives the followingrecommended power threshold scaling for L-H-mode transition in deuteriumplasmas [IPB98]
Pth = 0.45 (0.6 nR2)<*n°-75BR2 (3)
where the exponent a lies in the range - 0.25 s a £ 0.25 and the units are m, T,MW, 1020 irr3 (Figure 4). The transition from L- to H-mode occurs when plasmaheating power exceeds Pth, as given by Eq. (3).
The scaling given by Eq. (3) is for deuterium plasmas. However, it is well knownfrom comparison of H and D plasmas that increase of the mass leads to areduction of the power threshold. Recent DT experiments on JET [IPB98] haveshown a favorable isotope dependence, Pth ~ M-1. Hence, we expect that the L-Hpower threshold in ITER DT plasmas should be 20-30% less than what is given byEq. (3). On the other hand, for prediction of the L-H transition in ITER, we mustaccount for core bremsstrahlung radiation, which is negligible in the presentmachines. As a result, we have chosen to compare the difference between theheating power and the core radiation with the threshold power given by Eq. (3).The corresponding H-mode threshold powers for ITER at different plasmadensities are summarized in Table 3. The uncertainty in ITER predictions comesprimarily from the size scaling uncertainty, which is R1-5 to R2-5. Furtherexperiments and/or a viable theoretical model are needed to narrow this range.
FDR-Plasma Performance Assessments Chapter Ill-Page 10

102
S. 100
10-1
i H-mode Power Thershold Database (1996)
JET
ASDEX
Dlll-D
ASDEX-U
10-2
Pthr=0.45Bn<'75R2 '(MW.T, 102°m-3, m) -
10? 10-' 10°Plhr (MW)
102
FIGURE 4H-Mode Power Threshold in Deuterium Plasmas and
Empirical Scaling Fit
TABLE 3ITER H-mode Threshold Powers (in MW) Corrected for Mass Dependence
n (1020 m-3)
0.250.501.0
a = -0.25
273854
a = 0
4881136
a = 0.25
85170340
cfi paux - Prad ~ 80 MW (auxiliary-heated pre-ignited plasma)Pa - prad ~ 200 MW (ignited plasma)
The recommended scaling given by Eq. (3) is for the L-H transition. Systematicdata for the H-L transition are too sparse to obtain an explicit H-L scaling. Someexperiments report appreciable hysteresis for the reverse transition fromH-L-mode: the back transition occurs at lower powers than the L-H transition.Other experiments find little or no hysteresis. The hysteresis is important indetermining whether ignited FTER plasmas can maintain sustained H-mode (andhence sustained ignition) at fusion powers below about 1 GW.
Pending on resolution of the uncertainties noted above, we have adopted a"moderate risk" approach for modeling of ITER performance: the mean value(a = 0) of the power threshold scaling with no hysteresis in reverse transition isassumed. Modeling then shows that with 100 MW of auxiliary power, ITER willbe able to initially achieve H-mode at low plasma densities and will generally beable to remain in the H-mode in the ignited regime. However, the most
FDR-Plasma Performance Assessments Chapter Ill-Page 11

unfavorable limit given by Eq. (3) (a = 0.25) requires a hysteresis in the reversetransition for maintenance of sustained ignition H-mode.
3.2 Plasma operational limits
The plasma beta and density limits are major performance-determining issues.Of the two limits, performance projections show that the density limit will besomewhat more likely to constrain achievable fusion power in ITER.
Beta limit. Standard theoretical modeling confirms that typical ITER plasmaprofiles are stable to ideal MHD modes (without wall stabilization) fornormalized (iN = p(%)a(m)B(T)/I(MA) as high as 3.5 (p = 4.6%) [IPB98]. Sinceperformance modeling (see Section 4) shows that PN = 2.0-2.2 is generallysufficient for sustained ignition at fusion powers of up to 1.5 GW, ideal MHDstability is not expected to be a performance-limiting issue in the reference highcurrent plasmas. The non-ideal beta limits are, however, a potentially significantperformance limit.
Various non-ideal (resistive) MHD stability considerations can affect achievablepN- The limit set by the onset and uncontrolled growth of neoclassical islandtearing modes at the q = m/n surface and the associated propensity of such modesto be triggered by high-magnitude sawtooth and ELM activity raises the directconcern that such neoclassical modes may limit the achievable PN in ITER tovalues significantly below the Troyon limit, and the indirect concern thatuncontrolled sawtooth and ELM activity may unduly excite such modes and leadto disruption.
The present design specification for the beta limit in ITER is PN 2.5 (p ^ 3.3%at 21 MA). This specification is based on the normalized beta values achieved inthe experiments with quasi-steady-state discharges, including those with theITER-like dimensionless core plasma parameters. The lower limit reflectsobservations common to a wide range of experiments (DIII-D, TFTR,COMPASS-D) that beta limits in "long-pulse" discharges are usually lower thanthe ideal MHD limiting PN of ~3.5-4 that can be transiently obtained in the sameexperiment with "short-pulse" discharges [IPB98]. The decreased p-limit in long-pulse discharges is typically correlated with the onset of neoclassical island MHDmodes and degraded energy confinement ("soft" beta limit or beta saturation), asopposed to the onset of prompt disruption ("hard" beta limit) seen for ideallimits.
Present theoretical interpretation connects this long-pulse beta-limit behaviorwith the development of saturated neoclassical islands. Theory predicts that thebeta value for island growth onset should decrease with reduction of the plasmacollisionality, v*. Figure 5 shows values of PN for mode onset as a function ofcollisionality from the ITER long-pulse beta limit database and from reference[IPB98]. There is a general tendency in the data for the onset threshold to
FDR-Plasma Performance Assessments Chapter Ill-Page 12

decrease with collisionality, and the mean of the onset data at the estimatedcollisionality of an ignited ITER plasma is consistent with the ITER p-limitdesign basis specification. However, as can be seen in the figure, there issignificant scatter in the data and estimates of the applicable PN threshold in HERrange from about 1.5 to 2.5. In addition, not all experiments find neoclassicalmodes at high beta; such modes are not observed in JET and long-pulsedischarges with p close to the ideal MHD limit, pN = 3-4, can be obtained [IPB98].The absence of sawtooth triggering of the initial growth of the islands may beresponsible. Long-pulse high-P plasmas can also be obtained in DIII-D insituations where sawteeth are absent. These results illustrate the complexity ofthe considerations that enter into determining the neoclassical beta limit,especially the fact that the limit may be sensitive to the magnitude of theinitiating sawtooth or ELM. This makes exact prediction of what will happen inITER somewhat uncertain, and so significant concerns remain about thepotential performance-limiting effect of the neoclassical limit and the possibilitythat operation near the onset threshold may increase disruption frequency.
5
4
3 "i
2
1
; ! m
f -y
i! JT60-y ° n
_ __g»j J
% 1^J,p C0MPASS-D
1 .5?Ij
ASpEX-U | :
1o 1
0 |
C jDesign _.5 0 specification •
aR (Pfu£lj5GW^ !
1 1I 1
0 1 2 3 4 55.2 (ve*)a3
FIGURE 5PN for Neoclassical Tearing Mode Onset vs. Plasma Collisionality in
Long Pulse Quasi Steady State Discharges fromthe ITER Database and References in [IPB98]
The corresponding PN and v* required for ignition in ITER and designspecification for beta limit are also shown in Figure 5. It can be seen that ITERoperation at 1.5 GW is consistent with the present database. However, Figure 5also indicates that neoclassical island phenomena may be expected in ITER,especially in low current plasmas, and control of the island growth may beimportant to achieve optimal plasma performance. Study of beta limit inreactor-relevant plasmas and exploration of possible high (ideal-limit) betaregimes will be one of the major goals of the ITER experimental program.
FDR-Plasma Performance Assessments Chapter Ill-Page 13

Potential techniques for control of island growth are discussed below inSection 4.3.
Density limit. The limitation on the achievable plasma density imposed by thedensity limit (Greenwald limit) may restrict plasma performance in ITER [§4.1].The density limit in tokamaks fueled with gas puffing and with both Ohmic andauxiliary heating is generally (but not always) well represented by the Greenwaldscaling for the line-averaged density, i.e. nGr{l02Om'i)<Il>(MA)/{7ta2(m)). For ITER,this empirical relation implies a limit density of 0.85 x 10²⁰ nv3 at I = 21 MA. Inaddition, operation near the Greenwald value is often accompanied withdegraded energy confinement. It is, however, not clear that the Greenwald limitcan be simply extrapolated to ITER. The density limit in experiments dependsstrongly on the density profile and the edge operating conditions which in ITERare designed to maximize operation with good confinement. In addition, thepower flow through the edge of ITER results in an edge temperature which willlikely be high enough to avoid the normal density-limit disruption, which is dueto a radiative collapse of the edge.
The Greenwald scaling was developed for the line-averaged plasma density. Inpresent tokamaks, the limit for the line-average density strongly depends on thedensity profile. It is the density at the edge that appears to reach a limit, and theGreenwald scaling is more applicable for the edge density rather than the centraldensity. Higher volume-average densities are possible if the central densityprofile can be peaked with deep fueling of the plasma core.
The confinement degradation that normally accompanies operation near thedensity limit can be partially attributed to the high neutral density at the mainplasma edge that accompanies the intense gas puffing required to approach theGreenwald value. Efficient, deep pellet fueling can produce discharges with lineaveraged densities in excess of Greenwald (up to 1.5xncR in DIII-D and otherexperiments) with good confinement.
The density limit in tokamaks undoubtedly involves the trade-off of a number ofcomplex processes, and is presently an active area of research for theinternational fusion program. Recent experiments [IPB98] have demonstratedthat the density limit in tokamaks is the result of at least two distinct density-limiting processes and that the Greenwald scaling does not necessarily providean adequate description for the detailed dependences on the various plasmaparameters for all of these processes. In terms of ITER operation, there are twogeneral types of edge density limits.
(i) The first edge density limit occurs in L-mode discharges with a "cold" plasmaedge and is generally attributable to excessive power losses from impurityradiation and other atomic processes at the plasma edge or divertor. These lossescool the edge plasma, normally resulting in the formation of "MARFE" in thedivertor and scrape-off layer plasma. The MARFE subsequently migrates fromthe divertor to the X-point and then inside the separatrix, where it cools theplasma on the closed flux surfaces near the separatrix, leading to a shrinkage ofthe current profile, formation of an unstable pressure and current profile and a"density-limit" disruption. With H-mode operation, the heating power in FTER
FDR-Plasma Performance Assessments Chapter 111-Page 14

is expected to maintain a sufficiently high edge temperature to avoid theformation of MARFEs on the closed flux surfaces. The plasma will drop out ofH-mode before the edge temperatures are low enough to allow MARFEs on theclosed flux surfaces.
(ii) The second density limit is a limit on the edge density at which good H-modeconfinement can be obtained. It is a "hot-edge" density limit. It occurs when theedge density is sufficiently high that vigorous Type III ELMs occur. This usuallycauses the confinement to deteriorate. If the density is further increased, anH-L mode transition typically occurs, often leading to a rapid cooling of the edgeand sometimes to a thermal collapse of the edge and a disruption.
The considerations involved in the two density limits can be characterized interms of an "edge operational space" for the plasma temperature and density atr = a - A, where A is the "pedestal width" or width of the edge H-mode transportbarrier for full developed Type I ELM's with H-mode operation. This picture wasfirst developed for ASDEX Upgrade (Figure 6a). The corresponding projectededge operational space for ITER is shown in Figure 6b. There are fouroperational boundaries shown in the figures, labeled with numbers in Figure 6b:
• Transition between L and H mode operation [boundary 1];
• Transition between H-mode operations with Type III ELMs and ELM-free H-mode [boundary 2];
• Onset of Type I ELMs, possibly due to the ideal ballooning mode limitat the edge [boundary 3];
• Radiation unstable zone leading to a radiative collapse of the edge[boundary 4].
FDR-Plasma Performance Assessments Chapter Ill-Page 15

potential n range
ASDEX Upgrade , \ | p , iMA* f \
ELM-free H-mode '»-* ,(not stationary) ..i~)
Ideal MHD
~~;^. Jypaill ELMs
. Tn»IELM> "I' Conpound EUM H.Typ»IIIEU« J
L-mode0.8 MA
Radiation unstable7 « - s * - - . «-|pio.8
/ Radiation unstab
I
L102 0
ELM-freeH-mode region
ITER\ Operating* • » Region
Type I ELMs
• H-mode\ Type III ELMs
L-moderegion f4
I
ne (a-2 cm) [nr3]
(a)
HGURE 6(a) ASDEX Upgrade Edge Operating Space and (b) Predicted ITER Edge
Operational Space (Reference Ignited Scenario,Ip = 21 MA, Pedestal Width A = 15 cm)
The Preferred ITER Edge Operating region is shadowed and thePotential Edge Pedestal Density Range is outlined.
For very high edge temperatures, an ELM-free H-mode operation is observed.The edge pressure and pressure gradient are limited by MHD stability at the edge.At pped = Pcrit = dp/drcnt x Aped/ Type I ELMs occur and limit the pressure to po-it-(boundary 3). For lower pedestal temperatures, type III ELM's occur, whichusually lead to degraded confinement (boundary 2). The operational boundary(1) separating L and H-mode operation is manifested as a line in Te/edge-ne,edgespace with little or no hysteresis. This threshold behavior is unlike the heatingpower threshold, which usually does exhibit hysteresis. For sufficiently low edgetemperatures, high edge densities and high impurity levels, the radiated powercan become comparable to the conducted power reaching the separatrix(boundary 4). This leads to a thermal collapse of the edge, formation of a MARFEin the divertor and motion of the MARFE to the X-point and across theseparatrix, followed by cooling of the outer closed flux surface, shrinking of thecurrent profile and a disruption. Similar edge-operation-space diagrams havebeen obtained by the DIII-D, Alcator C-Mod and JET groups. These diagramshave the same general features as the ASDEX Upgrade diagram.
For ITER extrapolations, we have developed initial models for each of the fourboundaries and tested these models against the edge-space data. The data showthat the width of the H-mode transport barrier pedestal "jump", Ape<i, for type IELM and ELM-free operation varies from 0.6 cm on Alcator C-Mod to 4-5 cm onJET and JT-60/U. These data indicate that the pedestal width depends weakly onppol, and increases strongly with size (R). On the basis of these data, Aped isprojected to be between 10-20 cm for ITER. All experiments indicate that the
FDR-Plasma Performance Assessments Chapter 111-Page 16

pressure gradient in the pedestal is at least as large as calculated for idealballooning mode stability, so d p / d r ^ t is taken to be the critical gradient forhigh n ballooning mode stability calculated for ITER conditions. The pressure atthe top of the H-mode transport barrier is then given by dp/drcnt x Ape{j(boundary 3).
Because there is, at present, no generally accepted model for the L-H modetransition, especially one that can be used to predict the L-H-mode transitiontemperature in terms of the measured local plasma parameters, we developed asimple model for the L-H transition. In this model, the transition temperature isdetermined by the stabilization of Drift-Alfven turbulence at the edge(boundary 1). In a similar spirit, the temperature for the stabilization ofDissipative Flute modes determines the temperature for the Type Ill-Type IELM/ELM-free boundary (boundary 2). The boundary for radiative collapse hasbeen calculated with a two-point model for deep divertor detachment which hasbeen calibrated with 2-D divertor models and divertor experiments withMARFE's (boundary 4).
The desired operational point for ITER is ELMy H-mode with high densities(near boundary 3 and above boundary 2). These conditions for ASDEX Upgradeoccur near the intersection of the ELM-free Type I/Type III ELM boundary (2); andthe ideal ballooning limit (boundary 3) on Figure 6a. However, operation withgood confinement, somewhat to the right of this intersection on ASDEXUpgrade, is feasible since it is often observed that Type III ELMs in this region donot degrade confinement nearly as severely as do Type III ELMs at lower densites.The "normal" disruptive density limit (boundary 4), corresponding to a thermalcollapse of the edge, is almost never observed with H-mode operation in ASDEXUpgrade. The plasma usually first has an H to L transition, so that the relevantdensity limit for ITER operation with good confinement is the highest densitypoint along the MHD stability limit line, which is above the Type III ELMboundary (2). Our present analysis for ITER (Figure 6b) indicates that the Type IIIELM region lies substantially below the desired operating region, so that thedensity limit for the ITER parameters for good H-mode operation may be quite
large, perhaps greater than 1020 nv3. ITER requires (ne> ~ 1020 n r 3 to reach afusion power of ~ 1.5 GW. Assuming a relatively small density gradient insidethe H-mode transport barrier due to due to particle pinches and pellet fueling(§4.3), ITER should be able to operate with a density at the top of the H-modetransport barrier of 5-8 1019 nr 3 indicated on Figure 6b. The density at theseparatrix will be lower, 3-5 1019 nr3. For this range of densities, the temperatureat the top of the H-mode transport barrier should be in the 4-to-5 keV range. Thisis the temperature that should be used as a boundary condition for core transportmodels.
We expect that the radial pinch will be small and hence it will likely provedifficult to obtain highly peaked density profiles with gas puffing in ITER. Inaddition, very intense gas puffing will likely result in degraded confinement.However, several features have been included in the ITER design to minimizethese difficulties. First, the ITER divertor is tightly baffled to confine the neutralrecycling to the divertor chamber and minimize the interaction of the neutral gas
FDR-Plasma Performance Assessments Chapter Ill-Page 17

with the plasma inside the separatrix. This will minimize the neutral pressurearound the main plasma more effectively than in most present experiments andshould reduce the confinement degradation associated with strong fueling.Second, a modest degree of shaping (K95 ~ 1.65 and 895 = 0.25) has been providedin ITER to ensure as high a ballooning limit at the plasma edge as practical(Figure 6b). Third, several alternative fueling methods, which have been shownto allow operation in the present experiments with good confinement up to1.5 new/ are being considered for ITER. Modeling of pellet fueling in ITERpredicts the edge density 1.5 times smaller than the average one (§4.3). Pelletfueling from the high field side is planned for ITER to provide a modest degreeof deep fueling beyond the region in which ELMs will occur. High-field-sidepellet injection on ASDEX-U has resulted in substantially improved pelletpenetration and fueling efficiency compared to the normal injection from thelow field side. Finally, other novel fueling techniques, such as the injection ofcompact toroids currently being tested on TdeV and JFT-2M, can further bedeveloped and applied to ITER.
3.3 Divertor physics
The achievement of the ITER performance goals depends on successful powerand particle control and exhaust with the ITER divertor, pumping system andfueling system. Power exhaust in UER will be accomplished by radiating most ofthe heating power to the first wall and divertor chamber walls, with radiationlosses due to hydrogen and intrinsic impurities (e.g., He, Be, and C)supplemented with small, controllable amounts of added recycling impurities(Ne or Ar). The additional impurities, which radiate strongly near the edge, areadded to limit the divertor target power and plasma temperature to acceptablelevels, while not adversely affecting the overall plasma core energy balance.
Reductions of the heat flux on the divertor plates of up to a factor of five byradiation losses have been achieved on every divertor tokamak. However, inmany of these experiments, the confinement is degraded with either high densityoperation or operation with Prad/Ptotal ~0.7-0.8. Part of this degradation isattributed to the high neutral pressures in the main plasma chamber thataccompany the intense gas puffing often used to produce high densities and/orhigh radiative fractions. The ITER divertor is designed to reduce these effects byconfining the recycling neutrals to the divertor chamber. Particle exhaust anddensity control will be accomplished with 60 m3/s pumps (170 m3 /s total) in thedivertor and with fueling with gas puffing and inside launch pellet injection.The physics basis for the ITER divertor concept and additional details of the dataand modeling upon which the conclusions about ITER core and divertor plasmaperformance are based are presented in [IPB98] and in Section 4.5.
Although present experiments are essential to guide the development of theITER divertor concept, the parameters of these experiments (such as divertorconfigurations, heat loads, densities, and other conditions) are sufficientlydifferent from ITER that computational simulations are required to extrapolatefrom the experiments to ITER. Simulations with various 1.5-D transport codes
FDR-Plasma Performance Assessments Chapter Ill-Page 18

have been used to assess the radiation losses from the central plasma. Thesecodes have been extensively validated by comparison with experimental data.Indeed the state of these codes is such that they have predicted a number offeatures of divertor operation before the features were identified experimentally.
Results from these simulations indicate that about 100 MW will be radiated fromthe plasma core (bremsstrahlung + synchrotron radiation) and that, dependingon the amount of added impurities, an additional 50-150 MW can be radiated byimpurities from the plasma edge just inside the separatrix in a manner such thatthe radiation losses do not degrade the confinement. This is consistent withresults from divertor and limiter experiments.
Furthermore, simulations with various 2-D divertor codes show that theradiation losses in the range of 120-160 MW out of 200 MW input to the divertorcan be achieved for a range of assumptions about the mid-plane density, Zefflevel, impurity seeding level and transport models. With attached operation,radiation losses are at the low end of the power range; with "detached" operation,they are at the upper end. With attached operation, the peak heat loads on thedivertor plates are 6-8 MW/m2 and for detached operation 2-3 MW/m2. Most ofthe radiation losses are due to carbon rather than hydrogen or the seededimpurities. The carbon is produced by chemical and physical sputtering of thegraphite targets. This is consistent with the measured radiation levels on presentdivertor experiments with detached and partially-detached plasmas. Finally,experiments on a number of tokamaks with tungsten plasma facing componentsindicate that the use of tungsten under the proper conditions will not lead tounacceptable tungsten contamination of the core plasma.
The amount of injected impurity must be dynamically controlled (seeSections 4.2 and 5.1) to simultaneously obtain optimal divertor detachment andplasma core performance. Both computational simulations of ITER divertoroperation and experiments in present tokamaks with feedback-controlledimpurity injection have demonstrated the feasibility of such control. Thesimulation models also predict an average He partial pressure in the private fluxregion of about 0.1 Pa, which is adequate to exhaust the He produced, 2 Pa-m3/s,for the design pumping speed of 170 m3 /s with some margin. The observedneutral pressures in present divertor experiments are in the 1-8 Pa range, whichwould provide ample margin for He exhaust in ITER. The selected divertoroperating point is therefore favorable in several respects: low radiated power inthe main plasma, low neutral density in the main chamber, well-distributedradiation, low peak power on the plates, and adequate He pumping.
4.0 PROJECTION OF ITER PLASMA PERFORMANCE
As was discussed above, the full experimental simulation of ITER plasmas is notpossible in the present tokamaks and, therefore, prediction of ITER performancerequires restablishing a physics basis for each element—bulk plasma, edgephysics, and divertor, careful study of the compatibility of these elements, and
FDR-Plasma Performance Assessments Chapter Ill-Page 19

finally, extrapolating these elements to ITER conditions. The methodologyadopted to perform this integrated modeling and extrapolation is outlined below.
Model description and uncertainties. The major tools that were used for study ofthe ITER plasma performance are 1-D transport codes for plasma core and 2-Ddivertor codes for plasma edge and divertor modeling.
As has been discussed above, the largest uncertainty in the prediction of ITERplasma performance comes from extrapolation of the energy confinement timefrom the present database to ITER scale. Careful analysis of the globalconfinement database indicates that the 95% confidence interval for the energyconfinement time in ITER is [4.2,7.8] s if one uses a log-linear extrapolation [suchas reference energy confinement scaling, Eq. (3)]. To account for possiblenonlinearities in extrapolation, increase of 95% confidence interval to [3.5, 9]s hasbeen recommended. Introducing the enhancement factor HH defined by
TE,th = HH x tITERH-97P(y) (4)
the 95% confidence intervals for HH are approximately [0.7, 1.3] for log-linearextrapolations and [0.6, 1.55] for log-non-linear extrapolations. The energyconfinement time given by Eqs. (1) and (4) was used for normalization of heattransport coefficients in the 1-D transport code. Radial profiles of the transportcoefficients were chosen in such a way as to reproduce plasma profiles that areobserved in ITER demonstration discharges in the present tokamaks [IPB98].
The other uncertainty in the projection of plasma performance comes fromunknown impurity concentration in the ITER plasmas such as C or Be from theplasma facing components and He ash produced by the fusion reactions in theplasma core. In the case of He impurity, we rely on the results of 2-D divertorcodes which predict He concentration at the plasma edge. The results of ITERdivertor study were employed in 1-D transport code PRETOR as a simplifieddivertor/edge ITER model described in more details elsewhere [DDR96]. Thismodel predicts typical He concentration in the range 5-10%, which corresponds toHe particle confinement times, tHe* = 4-7 xg . Impurity radiation plays animportant role in the power balance in the divertor and, as will be exemplifiedbelow, provides the means to control divertor target heat loads. Here ITER has aprovision to add a small amount (<1%) of recycling impurities such as Ne or Arto control radiative power in the SOL plasma.
In addition to modeling of plasma fusion performance, substantial progress hasalso been achieved during EDA in improving physics understanding anddeveloping and validating numerical tools in such physics areas as ripple loss ofenergetic particles, plasma RF auxiliary heating and current drive, linear theoryof TAE modes, runaway electrons, halo current, disruption mitigation andothers. Codes applied to the ITER conditions and a analysis of a large database ofpresently-available results has significantly reduced the uncertainties in thedesign specifications which existed at the beginning of EDA phase. Below wesummarize the key performance-related results derived from these studies.
FDR-Plasma Performance Assessments Chapter Ill-Page 20

4.1 Fusion performance and effect of confinement variation
Two major requirements for the plasma performance in ITER are:(i) demonstration of ignition and high Q operation in the reactor relevantplasma, and (ii) operation at high fusion power 1-1.5 GW needed to provideneutron fluence required for nuclear testing program. In this section we considerhow the present uncertainties in the energy confinement can affect the plasmafusion performance.
Ignition performance CO = °Q). Figure 7 summarizes simulations of ITER ignitionperformance at the nominal 21 MA plasma current. The figure shows the fusionpower as function of the H-mode enhancement factor H H used to characterizethe global energy confinement time implemented in the simulations. The fullrange of HH shown in Figure 7 corresponds to the above-cited uncertainty in theextrapolation of the global confinement data to FTER. The darker dashed areacorresponds to the 95% confidence interval at log-linear extrapolation to ITER.Each point in Figure 7 represents an optimized plasma scenario underconstraints that the amount of seeded impurity is adjusted to reduce the divertorheat loads to 5MW/m2(50MW total power). Helium concentration is definedby balance of fusion volumetric sources, particle diffusion in the core, heliumenrichment at the edge evaluated by divertor model, and pumping speed. Itvaries along the curves but typical concentration is in the range of 5-10%. In thisexample Ar is used as seeded impurity: the required concentration is 0.1-0.2%.
Different curves (solid lines) correspond to different plasma densities: the lowercurve corresponds to the 80% of Greenwald limit «n e) = 0.68 1020 nr3), themiddle one corresponds to the Greenwald limit ((ne) = 0.85 1020 nr3), and theupper curve shows the fusion power at the density 1.5 times the Greenwald limit«ne) = 1.27 1020 nr3). The reference plasma scenario given in Table 2 is markedby a circle. The numbers that are shown near the curves indicate L-H modethreshold margin, i.e. ratio of the power crossing separatrix to the thresholdpower given by the reference scaling (3). If the number is less than 1, the plasmawill remain in the H-mode only if there is a hysteresis in the H-L transition. Itcan be seen that sustained ignition in ITER is possible for a wide range of plasmadensities if enhancement factor is larger than ~0.8. However, sustained ignitionat the low density and low H requires hysteresis in the H-L power threshold. Atthe nominal plasma confinement, H H = 1, the plasma can ignite and producemore than 1 GW of fusion power even at a density below the Greenwald limit.To achieve the design maximum 1.5 GW (shown by the circle) plasma densitymust exceed the Greenwald limit by about 15%.
If the energy confinement in ITER will be ~20% better than the reference, thefusion power may be limited by the beta limit (shown in Figure 7 by dashedlines). Better energy confinement leads to a higher plasma temperature, lessthan T2 dependence of the fusion cross-section on the plasma temperature T, andlarger fast alpha-particle contribution to the total pressure. As a result, theplasma will be closer to the beta limit at high H H than at lower HH.
FDR-Plasma Performance Assessments Chapter Ill-Page 21

FIGURE 7Fusion Powers (Solid Lines) as Function of Enhancement
Factor HH for Ignited Scenarios
Different curves correspond to different plasma densities. Dashed linesindicate the beta limits with normalized beta 2.5 and 3. Numbers near thesolid curves give ratio of power crossing separatrix to the threshold powerfor L to H mode transition. Divertor target heat loads are adjusted to50 MW by seeding with Ar impurity.
Summarizing the results given in Figure 7, we conclude that sustained ignitionin ITER is possible at H H > 0.8 (i.e., ~20% ignition margin). At the nominalenergy confinement, ITER is capable of achieving fusion power above 1 GWeven at a plasma density below the Greenwald limit. Sustained ignition with1.5 GW requires a density 10-20% higher than the Greenwald value.
Driven burn. To increase fusion power and /or keep plasma above the L-Hpower threshold at the lower end of the plasma confinement range ( H H < 0.9-1for the low density cases, and H H < 0.8 for the high density case), an auxiliaryheating power up to 100 MW can be added. Figure 8 shows the fusion power asfunction of enhancement factor for driven burn with 100 MW of auxiliaryheating power, modeled to be equally distributed between ions and electrons.Auxiliary power of 100 MW suffices to keep plasma well above the L-H powerthreshold in the full range of energy confinement at all plasma densitiesrepresented in the Figure. As in the case of sustained ignition, the fusion powercurves in Figure 8 correspond to the different plasma densities: n = 0.8 nGw,n = new and n = 1.5 new-
FDR-Plasma Performance Assessments Chapter Ill-Page 22

1.4
FIGURE 8Fusion Powers (Solid Lines) as Function of Enhancement Factor, HH,
for Driven Scenarios with Auxiliary Heating Power of 100 MW
Different curves correspond to different plasma densities. The dashedlines indicate beta limits with normalized beta 2.5 and 3. Divertortarget heat loads are adjusted to 50 MW by seeding with Ar impurity.
It can be seen that to achieve high fusion power in driven mode, HER mustoperate at/or above the Greenwald limit. At high density, ITER is able toproduce high fusion power, Pfus > 1 GW, and high fusion power gain, Q > 10,within the full confidence interval of plasma energy confinement. However, atthe lower end of the confidence interval and with plasma density at theGreenwald limit, the fusion gain, Q, drops to 5-8. Because of lower plasmatemperature and higher loop voltage, the burn duration also drops to about 500 sat this end of the energy confinement range. Possible means to increase fusionpower and Q in this region are discussed below.
As in the case of ignition, the plasma beta is predicted to limit fusionperformance in ITER for driven burn only if the energy confinement is betterthan that predicted by the energy confinement scaling given by Eq. (1). In theboth cases, the ideal MHD beta limit, PN = 3.5-4, does not restrict fusion plasmaperformance. However, if a soft beta limit occurs in ITER at PN = 2.5, this couldaffect fusion power at the high end of the plasma confinement. For example, atH H = 1.3 and PN = 2.5, the fusion power would be reduced to 1.25 GW. However,the confinement-degrading effect of the soft beta-limit may likely act to degradeconfinement in a manner such that H H ^1 .2 will not be obtained. Thedegradation of energy confinement observed in some experiments near the softbeta limit is not explicitly taken into account in the present analysis, because thiseffect is not yet quantified. However, beta-limit effects are likely to be significant
FDR-Plasma Performance Assessments Chapter Ill-Page 23

only if normalized confinement should prove to be better than the nominal onegiven by ITERH-97P(y) scaling (HH > 1)- Conversely, concerns about the effects ofa Greenwald density limit become most acute only at low confinement (HH < 1).
Optimized fusion performance. Results presented in Figures 7 and 8 allow us todevelop a strategy for optimization of the performance in ITER. At the high endof plasma energy confinement range the maximum fusion power 1.5 GW can beeasily achieved in the ignited regime at relatively low plasma density (near theGreenwald value). At the lower end of the energy confinement range the fusionpower can be maximized by auxiliary heating and increase of plasma density.
Figure 9 summarizes how the maximum achievable fusion power varies as afunction of confinement represented by the H H factor. Each point is computedconsistently, obeying all relevant operational constraints, using the aboveprescriptions and keeping the power to the divertor plates below the designnominal value of 50 MW by injecting Ar as a seed impurity for control: therequired concentration is 0.1-0.2%. Plasma density and auxiliary heating powerare chosen in each point to keep fusion power at the 1.5 GW level or maximize it(at the low end of plasma confinement range) and to keep plasma above the L-Hpower threshold. Figure 9 indicates that the ITER device is well optimized forachieving 1.5 GW of fusion power at the nominal confinement projectionH H ~ 1. Ignition is sustained at the nominal fusion power of 1.5 GW, whilesatisfying all other operational constraints, with a finite margin, for 0.9 <H H < 1.2. Higher confinement, ( H H > 1.2) although still ensuring sustainedignition, would imply operation at PN values above 2.5, whereas lowerconfinement (HH < 0.9) would imply progressively driven operation and areduction of fusion power below H H ~ 0.7.
It can be seen that the maximum fusion power of 1.5 GW can be achieved inITER if HH is :» 0.7. The range of the fusion power (1-1.5GW) required for nucleartesting is achievable in the full energy confinement range. However thisrequires operation at or significantly above the Greenwald density. If operationfar above the Greenwald value will prove to be difficult or unacceptable in ITERby some reason (plasma disruptivity, divertor conditions or ELM behavior, etc.),the fusion power would further decrease if confinement is below H H of about 1.1.Maximum fusion power at Greenwald limit is shown in Figure 9 by a dashedline.
FDR-Plasma Performance Assessments Chapter Ill-Page 24

Fusion power at the lower end of the energy confinement. At the lowest end ofthe energy confinement range, 0.6 < HH < 0.7, fusion power can be maximized bya combination of measures: increasing the plasma current to 24 MA, increasingthe auxiliary heating to 150 MW, and increasing the density above the Greenwaldvalue. Increase of the plasma current to 24 MA (qgs = 2.65) is technically possiblein ITER but leads to a reduction in burn duration because of a largerconsumption of inductive flux. An additional improvement at the low end ofthe plasma confinement range can be achieved in the case of ion heating,especially at lower plasma densities.
0.6 1.4
FIGURE 9Plasma Parameters as a Function of HH Factor, when Fusion Power is
Optimized at or Below 1.5 GW
Plasma current is 21 MA. Solid lines correspond to the optimizedplasma density. The dashed lines indicate the fusion power andauxiliary heating power when density is limited to the Greenwald value.
Table 4 shows that the fusion power at low confinement can be doubled bycombinations of these three measures.
An increase in the auxiliary power has a modest impact on the fusion power ifthe density is limited to the Greenwald value. In this case, the fusion gain, Q,tends to decrease when the auxiliary heating is raised from 100-150 MW. On theother hand, increase of the plasma density by factor of about 1.5 above theGreenwald limit can almost double the fusion power and Q.
FDR-Plasma Performance Assessments Chapter Ill-Page 25

TABLE 4Sustained Fusion Power as a Function of Current,
Auxiliary Heating and Plasma Density at Low End ofPlasma Energy Confinement, HH = 0.6
Plasma current (MA)
Auxiliary power (MW)Fusion power (n/t\Qyj s i ) (MW)
Fusion power (MW)[n/nGW>l)]
21
100
560 (660*'
1050 (1230*)[1.7]
150
685
1290[1.8]
24
100
870
1350[1.5]
150
1010
1800")[1.5]
(*' Pure ion heating (ASTRA code) at the same assumption than the rest of the results whichcorrespond to 50/50% electron and ion heating (PRETOR code).
(**' At the nominal fusion power of 1500 MW the plasma density is at 13 x Greenwald value.
As can be seen from Table 4, an additional increase of the fusion power by factorabout 1.2 can be achieved by 100% ion heating. This example is shown toillustrate the beneficial effect of ion heating on driven-burn performance. TheITER ICRH system can provide majority ion heating when operated in thetritium second-harmonic regime, but heating power will be limited to 50 MW.
The projections of plasma fusion performance show that ITER has energyconfinement margin of about 20% for achieving sustained ignition. At thereference energy confinement time, sustained ignition is possible in the widerange of plasma densities and fusion powers. In the driven operation assisted by100 MW of auxiliary power, ITER can produce 1-1.5 GW of fusion power in thefull range of uncertainty in the energy confinement.
Additional plasma parameters of the reference ignited regime (marked in theFigures 7 and 8 by a circle) are given in the first column of Table 2. Here there is acomfortable margin in burn duration and relatively low beta, but attainment of1.5 GW requires operation at a density slightly exceeding the Greenwald densitylimit. Sustained ignited burn at the Greenwald density limit is also possible butwill have a lower fusion power of 1.2 GW.
4.2 Time dependent scenarios and plasma kinetic control
ITER requires simultaneous control of the fusion power and power to thedivertor plates while maintaining H-mode operation with a density below amaximum value (for operation below the Greenwald value). Dynamic transportsimulations have been performed in order to study controllability of plasmapower balance in ITER and in order to outline general requirements for plasmakinetic control. These simulations show that three feedback loops are required:
• The fuel injection rate should be controlled to keep the fusion power ata required pre-programmed value.
FDR-Plasma Performance Assessments Chapter 111-Page 26

• Impurity (Ne, Ar) injection rate should be controlled by feedback toprotect the divertor target plates by limiting the target power to 50 MWwhile minimizing the amount of injected impurity.
• The amount of auxiliary heating should be controlled — in order ofdecreasing priority — to: maintain the plasma in H-mode, maintainthe plasma density below a maximum value if required and assist inthe control of the fusion power.
All these feedback schemes must react appropriately as the seeded impurity levelis independently changed for divertor protection and the helium removal ratevaries with the divertor conditions.
Figure 10 shows time traces of the plasma parameters for the reference ignitionscenario with the nominal fusion power of 1.5 GW. To make the plots readable,the burn phase was artificially limited to about 300 s even though the potentialburn length is in excess of 1000 s.
FDR-Plasma Performance Assessments Chapter 111-Page 27

Alpha power
.Auxiliary heating
0.5 1.0 1.5Electron density (1020 m-3)
(a) Effective input power (heating powercorrected by core radiation) vs. average
density, compared with L-H powerthreshold scalings (Nominal, Upper,
Lower from Table 3)
100 200 300 400Time (s)
(b) Time traces for alpha particle andauxiliary heating powers. At t=200 s one
can see the perturbation produced by asawtooth.
200-
150-
S 100-
n-
Edge power
J \ij$^ ^ Oiver^or targets
UP\^ /lr fraction * 10*
41/
-
-
-
\ , :100 200 300Time (s)
400 400
(c) Time traces for edge and divertorpowers and Ar fraction (added for
divertor power control)
(d) Time traces for plasma density,Greenwald density limit and Zeff.
FIGURE 10Simulation of Ignition, Controlled Burn, and Burn Termination with
Simultaneous Control by Ar Injection of Divertor Target Power with 50 MW
The simulations show a pre-programmed fusion power wave form can always beset in such a way .that a solution can be found. The lower the fusion power, theeasier the simultaneous control proves to be. These results were used to developspecifications for plasma kinetic control, plasma measurements, and auxiliarysystems such as DT and impurity gas puffing, plasma auxiliary heating systemsetc. Additional details can be found in [DDD97a] and in Section 5.
In conclusion, time-dependent simulations demonstrate that all requirementsfor plasma operation (low divertor heat loads, He pumping, H-mode powerthreshold, etc.) can be fulfilled and controlled simultaneously in one integrateddischarge.
FDR-Plasma Performance Assessments Chapter 111-Page 28

4.3 Flexibility and plasma performance optimization
The need to obtain adequate ELMy H-mode energy confinement simultaneouslywith operation near the neoclassical tearing mode beta-limit and at/above theGreenwald density limit suggests that careful optimization of ITER plasmaperformance will be required to obtain the desired fusion power, and that "activemeans" to control or inhibit the onset of neoclassical tearing mode activity—acommon precursor of plasma energy collapse or disruption in presentexperiments operating near the beta and/or density limits—will be required.Radially and/or spatially-localized current drive with electron cyclotron waveshas potential for island control, and both radially-localized electron-cyclotron andion-cyclotron current drive have near-axis current drive potential for providingthe sawtooth reconnection de stabilization that may be needed to prevent theonset of long-period "giant" sawteeth which in turn could provide a seed islandtrigger for neoclassical tearing modes. Lower hybrid current drive applied duringthe current ramp-up phase of the ITER discharge also has promise as a means toinhibit the onset of q(0) < 1 and sawtoothing and thus potential to promote bothenhanced confinement and the avoidance of seed islands [DDR96].
In addition, while present understanding of the operational factors needed forexceeding the Greenwald limit is not yet complete, provision of a plasma fuelingcapability that allows efficient fueling beyond the ELM region appears to be a keyrequirement for sustained above-Greenwald-limit operation. Figure 11 showsthat some degree of peaking can be achieved by frequent injection of moderatesize pellets. In this particular example the average electron density exceeds theGreenwald limit by a factor about 1.5, while the edge density remains below theGreenwald limit. The pellet injectors in ITER are designed to operate from thehigh field side, thereby maximizing the pellet penetration and achieving highfueling efficiency.
In addition to these developmental aspects of plasma optimization, the ITERdesign includes features that will provide additional aspects of plasma operationflexibility and optimization capability. The divertor design is expected to providehigh attenuation of divertor-produced neutrals, and hence will facilitateachievement of minimal confinement degradation at high densities. Inaddition, the combination of high gas fueling and exhaust capability providedwill make it possible to implement a net scrape-off-layer flow strategy ("puff andpump") that has been shown in DIII-D to enhance entrainment of medium-Zimpurities in the divertor, with ensuing improvement in the in-divertor to ex-divertor radiation loss ratio.
Finally, ITER will have auxiliary heating and poloidal field control capabilitiesthat are similar to the plasma shape and profile "optimization" means—currentand shape ramping combined with early auxiliary heating—that are presentlyused to optimize plasma performance and access negative-central-shear plasmaoperation modes in present experiments. The precise range of ITER capability inthis regard is still under study, but preliminary estimates suggest that themethods can be applied for optimization of ITER plasma performance for at leastseveral hundred seconds.
FDR-Plasma Performance Assessments Chapter Ill-Page 29

1.5- Electrons
DT ions
He
6 8 10Major radius (m)
FIGURE 11Edge Density Reduced to ~8 x 10¹⁹ nr3 by Injection of Seven 4 mm
Pellets Per Second at 1.5 km/s
Two profiles for electron and DT ion densities correspond to timingsbefore and after pellet injection.
Long inductive pulses. Very long inductive pulses can also be achieved in TTERwith ELMy H-mode plasmas. At the reference plasma current of 21 MA the PFsystem provides about 80 Wb for flat top of inductively driven scenario.Reduction of the plasma current increases the poloidal flux available for the flattop and extends duration of the pulse. Additional pulse extension can beproduced by the CD capabilities of ITER auxiliary heating systems. Modeling ofthe driven plasma scenarios under constrains of ITER heating and CD systemshas shown [DDR96] that the pulse length at the plasma current of 16-18 MA andQ > 5 can be extended up to 6000-10000 s. Full steady-state operation based onreversed shear operational modes will be discussed in the following section.
4.4 Non-inductive steady state operation
Development of a non-inductive steady-state (SS) operational capability is anultimate goal of the ITER program and the present intent is that ITER will havesufficient flexibility to exploit the advanced plasma operational scenarios that arepresently envisioned to be necessary to obtain full-power (si GW) SS operation.
Preliminary analysis has shown [IDR95] that ITER auxiliary powers (100 MWtotal) are sufficient to drive only a few MA of plasma current. At the same time,high fusion power requires a high plasma pressure and hence a plasma currentin excess of 10 MA. Therefore, the SS operation in ITER should rely on highbootstrap operation (70-80% of the total current) that in turn requires ability tomaintain high plasma beta at relatively low plasma current. It was also shownthat the standard H-mode energy confinement is not sufficient to fulfill this goal,
FDR-Plasma Performance Assessments Chapter Ill-Page 30
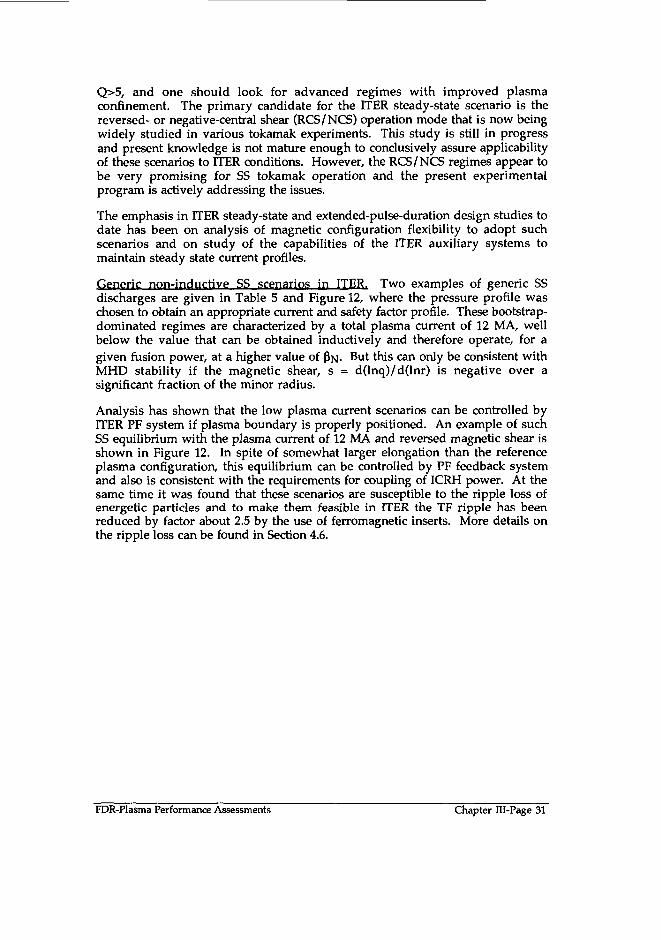
Q>5, and one should look for advanced regimes with improved plasmaconfinement. The primary candidate for the ITER steady-state scenario is thereversed- or negative-central shear (RCS/NCS) operation mode that is now beingwidely studied in various tokamak experiments. This study is still in progressand present knowledge is not mature enough to conclusively assure applicabilityof these scenarios to ITER conditions. However, the RCS/NCS regimes appear tobe very promising for SS tokamak operation and the present experimentalprogram is actively addressing the issues.
The emphasis in ITER steady-state and extended-pulse-duration design studies todate has been on analysis of magnetic configuration flexibility to adopt suchscenarios and on study of the capabilities of the ITER auxiliary systems tomaintain steady state current profiles.
Generic non-inductive SS scenarios in ITER. Two examples of generic SSdischarges are given in Table 5 and Figure 12, where the pressure profile waschosen to obtain an appropriate current and safety factor profile. These bootstrap-dominated regimes are characterized by a total plasma current of 12 MA, wellbelow the value that can be obtained inductively and therefore operate, for agiven fusion power, at a higher value of ($N- But this can only be consistent withMHD stability if the magnetic shear, s = d(lnq)/d(lnr) is negative over asignificant fraction of the minor radius.
Analysis has shown that the low plasma current scenarios can be controlled byITER PF system if plasma boundary is properly positioned. An example of suchSS equilibrium with the plasma current of 12 MA and reversed magnetic shear isshown in Figure 12. In spite of somewhat larger elongation than the referenceplasma configuration, this equilibrium can be controlled by PF feedback systemand also is consistent with the requirements for coupling of ICRH power. At thesame time it was found that these scenarios are susceptible to the ripple loss ofenergetic particles and to make them feasible in ITER the TF ripple has beenreduced by factor about 2.5 by the use of ferromagnetic inserts. More details onthe ripple loss can be found in Section 4.6.
FDR-Plasma Performance Assessments Chapter Ill-Page 31

TABLE 5Typical Generic Parameters Required for the
Steady State Non Inductive Discharge
Pfus/PCD[MW]
IBS/I (%)Ycd (lo20A/W-m2)
PNPtoroidal (%)ae)n/Teo(keV)<ne)/ne o(l02 0m-3)
<ne>/nGWTE (s)
H-Mode-LikeDensity Profile
1500/10079
0.213.83.7
12.5 / 25.91.0 / 1.1
1.42.46
Low DensityReversed-Shear
1000/100
710.213.6
3.515.8 / 32.90.71 / 0.78
1.02.84
1.2 T
< 1.0Eo 0.8CM
o 0.6
^ 0 . 4 +
0.0
0.00
(a) Plasma temperature profile
0.50
r/a(b) Plasma density profile
1.00
FDR-Plasma Performance Assessments Chapter Ill-Page 32
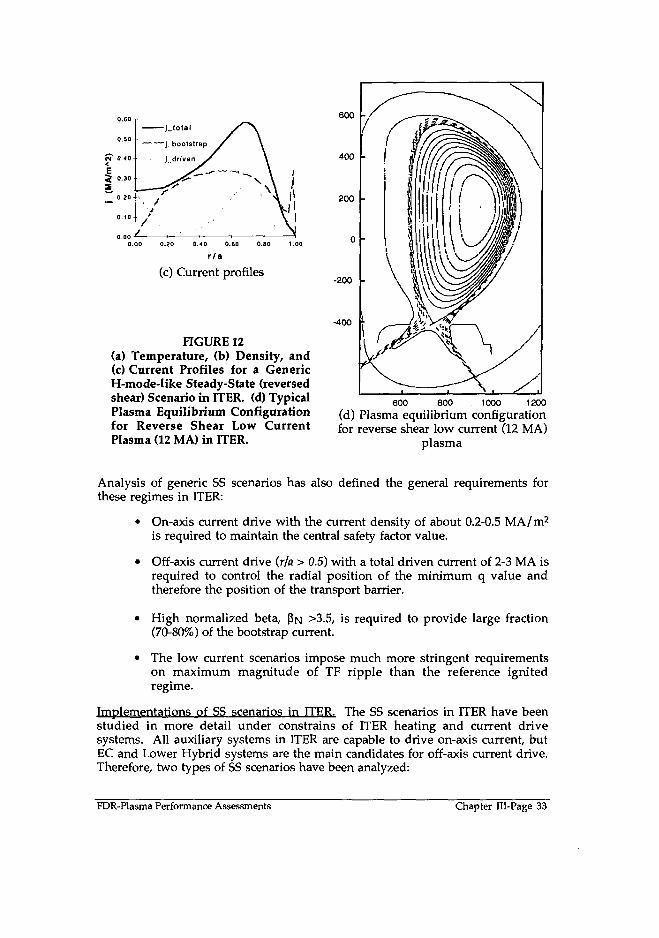
0.60
0.50
«" 0.40<E3 0.30S
H 0.20
0.10
0.000.80 1.00
r/a
(c) Current profiles
FIGURE 12(a) Temperature, (b) Density, and(c) Current Profiles for a GenericH-mode-Iike Steady-State (reversedshear) Scenario in ITER. (d) TypicalPlasma Equilibrium Configurationfor Reverse Shear Low CurrentPlasma (12 MA) in ITER.
600 -
400 -
200
-200
-400
600 800 1000 1200
(d) Plasma equilibrium configurationfor reverse shear low current (12 MA)
plasma
Analysis of generic SS scenarios has also defined the general requirements forthese regimes in ITER:
• On-axis current drive with the current density of about 0.2-0.5 MA/m2
is required to maintain the central safety factor value.
• Off-axis current drive (r/a > 0.5) with a total driven current of 2-3 MA isrequired to control the radial position of the minimum q value andtherefore the position of the transport barrier.
• High normalized beta, PN >3.5, is required to provide large fraction(70-80%) of the bootstrap current.
• The low current scenarios impose much more stringent requirementson maximum magnitude of TF ripple than the reference ignitedregime.
Implementations of SS scenarios in ITER. The SS scenarios in ITER have beenstudied in more detail under constrains of ITER heating and current drivesystems. All auxiliary systems in ITER are capable to drive on-axis current, butEC and Lower Hybrid systems are the main candidates for off-axis current drive.Therefore, two types of SS scenarios have been analyzed:
FDR-Plasma Performance Assessments Chapter Ill-Page 33

• Lower hybrid waves are used to drive off-axis current and fast wavesare used to drive on-axis current.
• Electron Cyclotron CD is used to drive off-axis current and NB injectionis used to drive on-axis current.
The principal difficulty in modeling of advanced modes in ITER arises from thelack of systematic knowledge regarding plasma energy and particle confinement,beta limit, operation of divertor, and plasma parameters at the edge that areessential for He and impurity pumping. There are no ITER demonstrationdischarges with fully-evolved steady-state current density and beta values neededto attain ~ 1 MW/m2 of neutron wall loading. Many present advanced-modeexperiments have features unavailable to tokamak reactors ( T ; » Te, centralparticle fueling by NB, etc.) Therefore, the ITER simulations employ the simplestpossible model for transport barrier in which the ion heat conductivity andparticle diffusion coefficients including He ash diffusion were reduced to theneoclassical level within the area with reversed shear. He concentration at theedge was evaluated by assumption of constant ratio of T*/IE-
The simulation of SS scenarios was carried out by means of 1-D transport codeASTRA, which employed sufficiently elaborate models for ITER CD systems.Some of assumptions made in the two studies are different and only theirqualitative features can be compared. Table 6 summarizes the two simulations.
It was found that:
(1) ITER auxiliary heating and current drive systems are capable to provide theplasma profiles required for advanced SS operation. The essential requirement isoff-axis current drive, which should be maximized for the plasma optimization.The on-axis current drive requires only 8-10 MW of auxiliary power.
(2) All SS operation requires high beta, PN =3.5 - 5.5. At PN < 3.5 plasmaperformance degrades sharply and operation with high fusion gain (Q) is notpossible. On the other hand, the Greenwald density limit does not necessarilypose a problem for the advanced regimes. The nominal fusion power ofPfus = 1.5 GW can be obtained at the densities (ne)/nGR s 1 for the NBI+ECCDcase. The LHCD+FWCD requires <ne>/riGR = 1.5.
(3) To maintain the required high beta and to achieve an attractive fusionperformance with Q > 5, the advanced regimes require improved plasma energyconfinement, 1.5-2 times better than the ELM'y H-mode (HH~1.5-2).
(4) If the anomalous particle pinch is absent in these regimes, then the narrowtransport barriers created by CD systems do not lead to an excessive Heaccumulation. The core He source is low and average density concentration isdetermined (as in inductive scenarios) by He enrichment at the plasma edge.
FDR-Plasma Performance Assessments Chapter Ill-Page 34

TABLE 6Major Plasma Parameters for ECR/NB
and LH/FW Driven Reversed Shear Scenarios
Scenario
<ne> (1020 m-3)
Pfus (GW)Ip (total) (MA)
IBS (MA)
ILHCD/ECCD (MA)IFW/NBI (MA)PLH/EC (MW)1)PFW/NBI (MW)nHe/ne
LHCD + FWCD
1.151.0138.54.30.3808
0.03
NBI + ECCD
0.701.5212.48.463.260.6590100.1
SS operation within the maximum of 50 MW for each auxiliary poweravailable at BPP are also possible but at a reduced Q~5.
In conclusion, the studies summarized above indicate that the ITER design hassufficient flexibility to test presently-envisioned steady-state operation modesbased on negative-central-shear profiles.
If the future experimental program will prove that these regimes have therequired improvement in the energy confinement and are stable at PN > 3-4, thenITER will conceptually be able to implement high-bootstrap-current-fraction,high beta scenarios with total plasma current in the 12-15 MA range maintainedby 100-150 MW of auxiliary power.
4.5 Power and particle control and divertor performanceassessment
The ITER power and particle control system is designed to exhaust the alpha andauxiliary heating power of 300-400 MW with acceptable peak heat loads on theplasma facing components, exhaust the helium ash and keep the central heliumconcentration below 10%, control the density and fusion power, fuel the plasma,ensure an impurity level in the plasma low enough to avoid degrading theplasma performance, withstand the time-varying heat loads due to disruptions,ELM's and other transients, and ensure that the neutral density near the mainplasma is sufficiently low that the confinement is not degraded. The first tworequirements can be met if the peak divertor plate heat loads can be reduced to5-to-10 M W / m 2 and a helium exhaust rate of 5 x 10² 0He atoms/s can beachieved.
Based on recent experiments on Alcator C-Mod, ASDEX Upgrade, DIII-D, JET andJT-60U with "detached" and "partially detached" divertor regimes, the ITERpower and particle control system has been designed to meet these requirements.The system consists of a single null poloidal divertor, active pumps with a netpumping speed through the divertor of ~170 m3/s, and gas puffing and pelletfueling systems (Figure 13). To reduce the peak heat flux on the divertor plates to
FDR-Plasma Performance Assessments Chapter Ill-Page 35

5-10 MW/m2, the divertor will be operated in a partially "detached" regime inwhich most of the heating power is deposited on the first wall and divertorchamber walls by radiation (Table 7). Low levels of recycling impurities such asNe and Ar will be injected with feedback control to control and enhance theradiation losses.
Blanket andFirst Wall
50 MWRadiation fromEdge Mantle
Plasma Edge andH-mode
confinement barrier
100 MWBremsstrahlungand synchrotron
100 MW SOUdivertorcharge exchange
H, He, Be radiationNe or Ar radiation
50 MWdivertor plates
(5 MW/m2) "
pumping access Divertor portsand pumps
FIGURE 13Schematic Illustration of the ITER Power and Particle Control System and the
Division of Power Flowing to the First Wall and Divertor
TABLE 7ITER Power Balance Summary for the Reference Ignited Scenario
ProcessAlpha heating (plus auxiliary heating)Bremsstrahlung+synchrotron+line radiation from plasma coreRadiation from mantle (Ne or Ar + He, Be /C,...)Divertor/SOL radiation (H, He, Be/C, Ne/Ar)Power transfer to divertor plate
Power (MW) (Range)
300 (300- 400)
100 (60 -120)
50 (20 _ 150)
100 (50-200)50 (50 -100)
To achieve the required helium exhaust rate, the helium partial pressure in thedivertor must be at least 0.012 Pa. The divertor has a "vertical target" plate
FDR-Plasma Performance Assessments Chapter 111-Page 36

configuration and the components are mounted in 60 removable cassettes forease of maintenance. Beryllium, graphite and tungsten, bonded to water cooledcopper alloy heat sinks, are used as the plasma facing materials. The front face ofthe divertor plates is clad with carbon fiber composite which can withstand thedisruption and other transient heat loads, and the divertor walls are tungsten-clad to minimize charge exchange erosion. Experiments indicate that a keyelement in achieving detached operation simultaneously with good plasmaperformance is maintaining a low neutral pressure near the main plasma. Thiswill be achieved in ITER by using a tightly baffled divertor which is designed toconfine the recycling neutrals within the divertor chamber.
During the last few years, divertor regimes of this type have been achieved onalmost all divertor tokamaks. An understanding of the basic physical processesinvolved for these regimes and how they apply to ITER has emerged. Thisunderstanding has been incorporated into sophisticated computational modelsfor the central and edge plasma and for the divertor. These models have beenextensively validated using data from divertor experiments includingexperiments on ASDEX Upgrade, DIII-D, JET, C-Mod and JT-60U. The dataencompasses a wide range of plasma conditions and divertor geometries. Thesecodes have then been used to extrapolate from the present experiments to ITER.
The calculations indicate that, from the standpoint of dilution and centralradiation losses, the power losses from the plasma core will be between80-to-100 MW due to bremsstrahlung, synchrotron and impurity line radiation.This level of energy loss is unavoidable under almost any circumstances. Inaddition, the radiation losses from the edge plasma "mantle" will be in the50-to-100 MW range, depending on the impurity level. These two losses reducethe energy that could potentially deposit on the divertor plates by 150-200 MW.
Calculations with the B2-EIRENE divertor modeling code, including the effects ofcarbon sputtering, indicate that, with Neon puffing, radiation losses in thedivertor with a partially attached divertor plasma will be sufficiently large thatthe peak heat flux on the divertor plate will generally be in the 5-10 MW/m2
range for 200 MW flowing across the separatrix (Figure 14). The calculations forthe reference conditions (C +Ne attached and detached) include radiation fromNe puffed in to increase the radiation losses, carbon from sputtering of graphitefrom the divertor plates, He from the He ash, and hydrogen from recyclinghydrogen and recombining hydrogen. For the reference partially detachedconditions, the peak heat loads are between 5 and 6 MW/m2 with Zeff in themain plasma of 1.4 to 1.6. For the more completely detached plasmas withslightly higher Zeff (1.7-1.9), the peak heat loads are in the 2-3 MW/m2 range.
FDR-Plasma Performance Assessments Chapter Ill-Page 37

14
12
Q_
*o 6
™ 4
s20
- dome changesreduced
reduced Xedge
„ . standard8 _C- partially-
attached : .refllon
Ne attached -C+Ne, attached
reduced C sputter yield
C+Ne, detached
I ' ' '1.5 2.5
Zeff
FIGURE 14Calculated Peak Power Load on the Targets from Plasma and Neutrals (Ion
Convection, Surface Recombination, Neutral Convection, MolecularDissociation) and Radiation versus Zeff (see §4)
The shaded area is the reference operating region. The reference conditionsinclude graphite sputtering and neon puffing.
The sensitivity to the assumptions used in the calculations and to the mainplasma conditions were investigated by (1) reducing the edge transportcoefficients, (2) lowering the upstream edge density, (3) reducing the graphitechemical sputtering yield, (4) modifying the divertor geometry by changing thesize of the divertor dome and (5) neglecting carbon radiation (Ne only). Thepeak heat loads were 10-to-12 MW/m2. for the reduced transport and reducededge density case. All but one of the divertor geometry cases achieved peak heatloads below 10 MW/m2. Peak heat loads of 5 MW/m2 could be obtained with Neonly for Zeff ~ 1.9.
The sensitivity studies indicate that peak powers of less than 10 MW/m2 shouldnormally be achievable, but that excursions of up to ~20 MW/m2 may be possible(Table 10). These results from all of the modeling codes indicate that partiallyattached operation on ITER is likely to provide an acceptable operating point inupstream separatrix density (3.5-4.0 x 10¹⁹ nr3), impurity concentration (e.g.0.5% Ne) and divertor power load (5-10 MW/m2) for the vertical target divertor.Indeed, peak heat loads of -10 MW/m2 can be achieved even without strongimpurity radiation from the main plasma. Because the design heat loads of10 MW/m2 can be achieved with no impurity seeding in the main plasma and inattached operation, impurity seeding in the divertor provides a reasonablemargin to ensure that the divertor will have an acceptably long lifetime. Furtherwork is ongoing to optimize the operational window and to assess the effects ofvarying the transport coefficients.
FDR-Plasma Performance Assessments Chapter 111-Page 38

TABLE 8Peak Heat Fluxes on the Divertor Plates and Plasma Conditions at the Divertor
Plates with 200 MW into the Scrape-off Layer
Partiallv Detached OperationPeak power density on divertor plates (MW/m2)Te at the divertor plate (eV)(1 eV at separatrix, 15 eV further out in SOL)
Fullv Detached OperationPeak power density on divertor plates/side walls (MW/m2)Tc at the divertor plate (eV)
Attache^ OperationPeak power density on divertor plates (MW/ m2) depending onthe radial transport assumptionsTe at the divertor plate (eV)
InnerChannel
s21-25
sisi
5-1210-30
OuterChannel
3-101-25
VI VI
10-3510-30
Plasma Facing Materials: Based on calculations of the erosion lifetime usingestimates for the plasma conditions at the divertor plate based on modelingresults and present experiments, graphite was chosen for the divertor platematerial because the erosion lifetime for Be was too short (~ 150-300 shots for Becompared to 2300-5500 for C). The lifetime for W would be 7500 shots butmelting during disruptions would produce irregular divertor plate surfaces,leading to very high peak heat loads. Conditions for normal plasma operationwere assumed with an admixture of high power transients (10% of the shots with100 MJ nv2) due to disruptions and ELMs and 10% high power transients(20 MW m"2). Be is acceptable for the first wall material where the heat andplasma fluxes are lower, and W is used for areas where the charge exchangeneutral flux is large because it has a much lower sputtering rate than graphiteand Be.
Particle control. 1.5 GW of fusion power will produce 5.5 x 10²⁰ He atoms/s(~ 2 Pa m3) which must be removed by the pumping system which has aneffective pumping speed of 170 m3 /s . To accomplish this, the helium partialpressure in the divertor pump duct must be at least 0.012 Pa. Several features ofthe vertical target plate design of the ITER divertor potentially reduce the heliumpressure. Due to presence of 2 dimensional particle flow patterns in the divertorplasma and the ion thermal force, the helium ions are predicted to preferentiallyaccumulate in the outer portions of the divertor scrape-off layer plasma.Recycling helium atoms which are directed toward the private flux regionswhere the pumping ducts are located (Figure 13) must pass through the highdensity plasma on the separatrix, where they are attenuated due to ionization bythe plasma near the separatrix. Calculations which include all of these effectsindicate, however, that the helium partial pressure should be in the 0.08-0.2 Parange, thus leading to helium exhaust rates of 16-40 Pa m3/s, more than adequatefor removing the helium in ITER. There will also be additional pumpingthrough the toroidal gaps between the outer divertor plates which will likely notbe subject to preferential attenuation of the helium.
FDR-Plasma Performance Assessments Chapter Ill-Page 39

Calculations using the divertor codes and estimates from experiments indicatethat the helium concentration in the exhaust gas may be as low as 2%, leading tothe requirement for the gas supply and reprocessing system to be able to handle50 Pa m3 /s of molecular deuterium and tritium along with the 2 Pa m 3 /s ofhelium. Fueling is needed to replace the deuterium and tritium consumed bythe fusion reactions and exhausted with the helium. A fueling rate of 500 Pam 3 / s is needed to buildup the plasma density up at the beginning of a pulse(Table 9) and for transient fueling during the pulse as required (e.g. tocompensate for the increased wall pumping as the configuration changes fromlimiter to divertor operation). Gas puffing will be done at five evenly-spacedtoroidal locations to produce a toroidally uniform flux of neutrals on the plasma.The puffing outlets will be recessed in the blanket to allow the gas to spreadpoloidally before it reaches the plasma. To provide a capability for fueling insidethe separatrix for more efficient fueling, and especially more efficient tritiumfueling, 100 Pa m 3 /s of inside launch pellet fueling is planned. This type offueling has proven to be much more effective than outside launch pellet fuelingin experiments on ASDEX Upgrade.
TABLE 9Net Gas and Pellet Fueling Requirements
Replacement of burned DTReplacement of gas pumped out with HeDensity ramp-up*During plasma burn
Gas Fueling Rate(Pa m3/s)
2
50500
50-200
Pellet Fueling Rate(Pa m3/s)
100
* for density ramp-up in 50 s or less
Wall conditioning is an important part of tokamak operation. ITER has morerestrictive constraints than many present tokamaks. The pressure limit of 4 MPafor the cooling water limits the baking temperature of the plasma facingcomponents to ~240°C. The toroidal field can be cycled to no more than 1000times during the life of the machine, and preferably less, so that the toroidal fieldwill be at its full value for most of the time. It is therefore planned to bake mostof the internal components at temperatures of at least 240°C and glow dischargeclean when the toroidal field is zero such as before beginning plasma operationand between major maintenance periods. After operation has commenced,conditioning with RF produced plasmas will be the major technique. Getteringand coating with Li, Be and B will be possible if needed, and the large surface areaof Be tiles (~ 1000 m2) will likely provide further impurity gettering. The highenergy and long pulse length of the ITER discharge will also clean the divertorplates. The active pumping system will remove a significant portion ofimpurities that are ionized in the scrape-off and recycle in the divertor.
FDR-Plasma Performance Assessments Chapter Ill-Page 40

4.6 Energetic particles
ITER plasmas shall have a variety of energetic particles produced by differentsources. The sources of super thermal ions are fusion reactions, NB injection,and ICR heating. Energetic runaway electrons can be produced by a high loopvoltage developed in the plasma during current quench phase of plasmadisruptions. In this section we discuss energetic ions. Runaway electron issuesare addressed in Section 5 below.
A good confinement of energetic alpha-particle produced by the fusion reactionsis essential for attaining ignition and sustained burn in ITER. It is expected thatthe energetic ions shall have close to classical behavior with the total loss of fewpercents. These expectations are based on the present experimental results withauxiliary heating and DT experiments on JET and TFTR [IPB98].
The ITER energy confinement margins allow to have ignited regimes at alpha-particle loss of 5-10%. However, at a loss larger than 5% the local heating or theplasma facing components becomes a serious issue.
Different loss channels have been analyzed in order to develop designspecification and requirements. The major potential loss channels for energeticparticles in ITER are TF ripple loss and loss due to collective instabilitiesincluding those excited by energetic particles themselves.
TF ripple loss. Toroidal field ripple, or variation of the magnitude of toroidalfield due to discreteness of TF coils should be low to avoid excessive loss ofenergetic alpha-particles and energetic deuterons produced during NB injection.The loss of ICRH minority ions are expected to be small in ITER because of verylocalized source near magnetic axis.
The TF ripple loss of energetic particles in tokamaks are well studied theoreticallyand experimentally and Monte-Carlo numerical codes have been developed andvalidated on experimental results [IPB98]. The codes have been applied todifferent ITER scenarios for evaluation of the TF ripple loss of alpha-particle andNB ions and associated heat loads on the plasma facing components. Table 10summarizes the results of analysis.
FDR-Plasma Performance Assessments Chapter Ill-Page 41

TABLE 10Ripple Loss of Fusion Alpha-Particles
Plasma scenario
Total heating by energetic ions (MW)
Energy loss fraction (%)
Peak heat load on wall*1) (MW/m2)
No ferritic inserts,5 = 1.8%
Ignited,21 MA
3131.1-2.2(2)
0.3-1.2 P)
Steady State,12MA
25316.4-19.4 0)
1.3-4.8 (2)
With ferritic inserts,8 = 0.7%
Ignited,21 MA
313<0.5
<0.05
Steady State,12 MA
253
0.8-1.5 (2)0.1-0.45 (2)
1 'The heat load is calculated on the axisymmetric wall.2) Lower and upper limits correspond to downward (reference) and upward toroidal driftdirections
Two options for the magnitude of TF ripple were considered: (1) withoutferromagnetic inserts, when maximum ripple [peak-average 5TF = (Bmax ~Bmin)/(Bmax + Bmin)] in the plasma cross section is 1.8% and (2) with ferromagneticinsert, which can be implemented in the design to reduce magnitude ofTF ripple. Analysis has shown that at the reference magnetic field the TF ripplecan be reduced by the inserts from 1.8% to 0.7%. Normalized, 2D TF rippleprofile remains practically the same for both cases.
The calculations have been done for two types of plasma scenarios: referenceignited plasma with plasma current 21 MA described in Section 4.1, and thereversed shear configurations with plasma current of 12 MA presented inSection 4.4 (see Figure 12). The results are summarized in Tables 10 and 11. Itcan be seen from Table 10 that the low current, reversed shear configurations arethe most susceptible to the alpha-particle ripple loss. At about the same fusionpower the alpha-particle loss is 10-15 larger in the reversed shear plasmas than inthe reference ignited scenario. At TF ripple amplitude of 1.8% alpha-particleripple loss fraction is too large in the reversed shear SS plasmas and alpha-particle heat loads exceeds the maximum acceptable value of 0.5 MW/m2. Anattempt to optimize plasma shape has shown that making plasma shorter andmoving it away from high ripple region located near the outer wall it is possibleto reduce alpha-particle ripple loss to below 5%. However, the ripple loss at theripple magnitude of 1.8% greatly reduces flexibility of the machine in operatingSS scenarios and also makes it impossible to keep small distance between plasmaand ICRH antennas needed for a good coupling with the plasma.
The loss fractions of NB presented in Table 11 are typically much larger than theloss fractions of alpha-particles. This is explained by the fact that the NB in ITERhas flat or even hollow deposition profiles while alpha-particles have peakedsource profile. It was found that the fast ions produced by NB injectionexperience large loss even at the reference high current scenario. While the heatload on the first wall (FW) produced by NB ions is not very large, the loss of theplasma heating power can exceed 15% which is not acceptable.
FDR-Plasma Performance Assessments Chapter Ill-Page 42

TABLE 11Ripple Loss of NB Deuterium Ions Energy of Injected Ions is 1 MeV
Plasma scenario
Energetic ions-total heating power (MW)Energy loss fraction (%)Peak heat load on wallM (MW/m2)
No ferritic inserts,8 = 1.8%
Ignited,21 MA
408.3-17.2(2)0.1 - 0.2 (2)
With ferritic inserts,8 = 0.7%
Ignited,21 MA
400.4 O)
3.5 lO"3 O)
Steady State,12 MA
403.2 (3)
0.15 (3)*' The heat load is calculated on the axisymmetric wall.2) Lower and upper limits correspond to co and counter injection.3 ' Co injection
To avoid excessive ripple loss, the TF ripple in ITER was reduced to about 0.7% byimplementation of ferromagnetic inserts in the design of the vacuum vessel.The inserts are placed between double walls of the vacuum vessel and locatedtoroidally under outer TF coil legs. Monte-Carlo calculations have shown thatreduction of TF ripple would be sufficient to significantly reduce ripple loss ofenergetic particles. It can be seen from Tables 10 and 11 that the ripple loss andthe heat loads in the presence of ferromagnetic inserts are well within the designspecifications, even for the low current scenarios.
Collective effects. It is believed that Alfven modes (TAE and other modes) couldbe a major potential candidate to cause anomalous loss of energetic alpha-particles in ITER. During last years there has been a significant progress in thelinear theory of Alfven instabilities and also in the experimental studies of thesemodes [IPB98]. Linear drives and damping mechanisms are presently wellunderstood and theoretical models have been validated in the dedicatedexperiments [IPB98]. Analysis of plasma linear stability in ITER has shown thatalpha-particle can excite a large number of TAE modes, with the toroidal modenumbers n>10. Therefore, ITER will operate in a regime different from thepresent experiments, where usually only a few low-n modes can be unstable.Hence, the analysis of the energetic particle loss in ITER requires a significantextrapolation from the loss observed in the present machines. Non-linear theoryof Alfven instabilities is far from completion and present estimates for the lossare based on simple assumptions. It was shown in [DDD97a] that ITER first wallcan withstand a diffusive loss of alpha-particles with the diffusion rate withinthe range observed in the present machines for anomalous heat and particletransport. It is also shown that ITER can withstand large (up to 50%), infrequentinstantaneous loss of energetic alpha-particle without termination of burn andwithout damage to first wall [DDD97a]\ Therefore, ITER will have flexibility forexploratory study of the ignited plasmas and for optimization of these regimesfor tokamak reactors.
FDR-Plasma Performance Assessments Chapter Ill-Page 43

5.0 PLASMA OPERATION AND DISRUPTIONS
The ITER tokamak and facility design incorporates many considerations thatcontribute to implementing the plasma operation basis presented above. Theseconsiderations, which collectively comprise the subject of plasma operation andcontrol, deal with how the various hardware systems that effect plasmaoperation are to be controlled, both to obtain the specified plasma operation andperformance and also to ensure that at-risk ITER components are protectedagainst the consequences of plasma operation and operation anomalies.Presenting these considerations here is organized into three elements: (1) plasmaoperation scenario and plasma control, (2) plasma disturbances, and (3) fastplasma dynamic events, including disruptions, vertical displacement events(VDEs), runaway electron current conversion and fast plasma shutdown. Thislatter element also includes disruption avoidance and effect mitigation.
Design solutions that meet ITER plasma operation and machine protectionrequirements have been identified for all foreseeable ITER plasma operation andcontrol needs. In most cases these solutions are based upon control andoperation procedures that are already fully proven in present tokamaks.However some of the control solutions identified require further demonstrationbefore the final feasibility of their application to ITER can be determined, andthere is a need for further physics R&D for refinement of projected ITER fastdynamic event predictions and for demonstration in present experiments ofcontrol means for non-inductively-sustained steady-state plasmas. There is alsoa need for further R&D on disruption avoidance and /or effect mitigation.
5.1 Plasma operation: scenario, control, and protection
Plasma operation and control in ITER will be effected within the framework of astandard plasma operation scenario. Figure 15 illustrates the key features of thisscenario. The scenario concept, order of events, and the sequence of transitionsbetween phases of the scenario are the principal considerations. The parametersof the scenario—current, auxiliary heating and/or current drive input and burnduration—can vary, but the sequencing requirements and general waveformsremain invariant. Variants of this standard scenario will support—withprovision of specific heating and current-drive means—driven-burn and/orextended-pulse-duration operation at reduced plasma current, and, withmodification of the plasma current ramp-up phase, initiation of steady-stateplasma operation that is then sustained by non-inductive means (see §4.4).
FDR-Plasma Performance Assessments Chapter Ill-Page 44

Begin Pulse
FIGURE 15PF and Plasma Parameter Waveforms for Nominal 21-MA Scenario
Plasma control concept and implementation. Control of the ITER device andplasma during plasma operation will be effected by means of the CODAC(COntrol and Data Acquisition) System, a facility-wide control, operation andprotection system that will have overall responsibility for control of the ITERfacility, device and ancillary systems. The CODAC system will supervise andmonitor all aspects of ITER device and plasma operation. Figure 16 shows aschematic representation of the CODAC system and the major control andprotection systems directly related to plasma operation. The control functions forplasma operation will be implemented within this CODAC environment by theITER Plasma Control System (PCS). Figure 16 illustrates the PCS concept andshows how it relates in a schematic manner to the larger scope of overall ITERfacility operation and control.
FDR-Plasma Performance Assessments Chapter Ill-Page 45

PlantSystemStatus
Control and Data Acquisition System (CODAC)
| Supervisory Control SystemI (Facility Executive)
{ Interlock System 11 (Machine Protection) j
Plasma Control System
Scenario and Sequencing
Parameters and Program Plasma State ID Abort
Magnetics (PF)
Kinetics
Edge/Drvertor
Fast Shutdown
HTSdata
FusionPowarShutdownSysttm
FIGURE16ITGR Plasma and Facility Control Schematic Illustrating PCS
Hierarchy and Integration with Facility Control
The PCS and the corresponding implementation of plasma control is organizedin a hierarchical manner that comprises four categories: (1) Plasma operationscenario and sequencing: PF pre-magnetization, plasma initiation, currentramp-up, divertor formation, auxiliary heating, ignition and burn, fusion powershutdown, current ramp down and termination and PF reset/recool; (2) Plasmamagnetics control: plasma current control, plasma shape control (Ro, a, K, 8 vs.time), plus control during the divertor/heating/ignition/burn/de-ignitionportion of the plasma scenario of plasma-to-first-wall clearance gaps, includingthe ion-cyclotron and/or lower-hybrid antennae coupling gaps, and the divertormagnetic configuration; also non-axisymmetric error field control; (3) Plasmakinetics and divertor control: core plasma kinetics control (density and/or fusionpower, impurity content and/or radiated power fraction, core plasma impurityinjection); core plasma profile control (auxiliary heating and/or current drive),and divertor control (pumping, in-divertor gas and/or impurity injection,magnetic optimization for divertor performance), and (4) Fast plasma shutdown:~1 s fusion power and current shutdown by impurity or hydrogen injection.
The plasma operation scenario — the superior category in the hierarchy—provides the framework within which plasma operation and control takes place.Magnetic control is subordinate to scenario control: once the sequence of scenarioevents that leads to plasma initiation is enabled, magnetic control of the plasmaconfiguration can proceed within each phase of the scenario. As Figure 17 shows,magnetic control involves a dynamic evolution of the plasma configurationduring the various phases of the scenario.
FDR-Plasma Performance Assessments Chapter Ill-Page 46

The plasma kinetic state must also be controlled to satisfy various physics andoperational requirements that apply. This is done independently by kineticscontrol. Meanwhile, the basic approach for magnetics control—closed-loopfeedback control of the voltages of the PF power supplies based on magneticmeasurements of the plasma current, shape and position—is common to allphases of the scenario.
Kinetic control is subordinate to magnetic control: control of the plasma kineticconditions, especially electron density or fusion power, proceeds with controlmeans and algorithms that are independent of magnetics control. Meanwhilemagnetic control maintains adequate plasma position, wall clearance gaps anddivertor geometry so as to allow kinetic control to be successfully implemented.
The requirement for fast plasma shutdown—essentially fast termination of theplasma thermal and magnetic energy—is independent of the magnetic andkinetic control and action (when needed) of the fast shutdown system(s) proceedsindependently of the actions of magnetic and kinetic control systems.
As shown in Figure 16, while the PCS has responsibility for plasma control andthrough such control, initial responsibility for the protection of ITERcomponents (e.g., the divertor targets and the first wall) that are at risk owing tothe effects of plasma operation, there is also a separate "machine-protection"Interlock System (IS) that provides backup plasma-affected-component protectionand PCS-independent protection of ITER systems (e.g., TF coils, TF and PF powersupplies, ex-vessel ancillary systems) that are not directly affected by plasmaoperation. There is also a CODAC-independent Fast Plasma Shutdown System(FPSS) that effects a fast plasma shutdown upon detection of anomalies in thePrimary Heat Transfer Systems (PHTSs) that provide major cooling to thedivertor targets and nuclear shield/first-wall modules. The FPSS ensures that afast plasma shutdown will occur—independent of all other considerations—if apotential or actual loss-of-in-vessel-coolant (LOCA) or loss-of-in-vessel-coolant-flow (LOFA) occurs. The FPSS serves a safety function, since continued plasmaoperation after a LOCA or LOFA could lead to a potentially safety-related event.
FDR-Plasma Performance Assessments Chapter Ill-Page 47

FIGURE 17Plasma Magnetic Configuration Evolution for a "Standard" 21-MA Scenario
The startup null and plasma expansion sequence shown here are for initiationat Z = 0: a similar startup null and sequence with Z * 1.3 m (to facilitate use of aport-mounted limiter) apply for the present (FDR) ITER design.
FDR-Plasma Performance Assessments Chapter Ill-Page 48

Plasma and machine-state cognizant control. The ITER PCS and IS willincorporate both machine-state and plasma-state-cognizance, and will be able toautonomously take plasma control and machine protection actions that are basedon this cognizance. Similar plasma and machine-state cognizant control andprotection systems are now implemented in present tokamaks. For ITER, avariety of magnetic and kinetic control algorithms will have to be implementedto effect optimal control of the ITER plasma, not only in the various global statesof the plasma operation scenario, but also in the various plasma sub-states(Ohmic, L-mode, H-mode, ELM-free, Type I ELMing, Type III ELMing, etc.) thatcan occur within the heating, burn and burn-termination phases of the scenario.A PCS capability to identify these states and to implement appropriate controlalgorithms will be provided. In addition, since the control and protection actionsof the PCS can affect power/energy loading on in-vessel plasma-facingcomponents and structural loads on in-vessel, vessel, and PF . systems,comprehensive cognizance of the ITER tokamak status by the PCS and"intelligent" control response that seeks to minimize plasma-control-inducedrisk to machine component integrity and lifetime will be required. Details ofhow the PCS, IS and FPSS are coordinated will be found in the Plasma DDD.Selected highlights of the various control concepts implemented in the PCSfollow below.
Scenario and Sequencing. The scenario and sequencing requirements for ITERand the plasma magnetics control concept are essentially identical to thoseimplemented in the present generation of tokamaks. The toroidal field (TF)magnitude will be preset prior to pulse initiation. The range for standard plasmaoperation is 4.0-5.7 T (70-100% of nominal BT). The TF field will remain constantwithin a single pulse within ±1%. This accuracy supports precise interpretationof field-sensitive diagnostics (e.g., electron cyclotron radiometer) and ensuresaccurate radial positioning of electron-cyclotron (EC) and ion-cyclotron (IC)heating or current-drive resonances within the plasma.
The deleterious effects of non-axisymmetric field errors that arise from TF and PFconstruction and alignment errors will be mitigated through the Error FieldCorrection Coil System (EFCCS). This system will allow the collective magnitudeof low m/n field errors to be reduced to a level <s 2 x 10"5 Bo. Reduction of errorfields to this level will allow Ohmic plasma operation at densities down to2 x 1019 rrr3 without onset of locked-mode disruption.
Plasma initiation. Scenario sequencing for an ITER pulse proceeds from pulseinitiation with attainment at t = 0 of a PF coil system pre magnetization state {Ics»IpFl/ IPF2/— t IpF9) with a plasma-axis flux linkage of ~210 Wb. This is followed bya 2 s plasma initiation phase that begins with application of pre-determinedvoltages {Vcs, VPFI, VPF2, - , Vpp9) to the PF coils. These voltages and the initialPF currents are chosen to produce a dynamic multipole field null (Figure 17)with low poloidal field (< 2 mT within a 1-m radius circle) that is positioned nearthe port-mounted startup limiters at t = 1 s. The in-vessel voltage is ~18 V(E = 0.3 V/m) at this time: with a gas fill pressure of about 1.3 mPa (~10"5 Torr)and the specified <. 2 mT error field, Townsend avalanche breakdown occurswithin 50 ms. A 0.5-MA circular plasma with R =10 m and a = 1 m follows byt = 2s.
FDR-Plasma Performance Assessments Chapter Ill-Page 49

During startup, 3 MW of electron-cyclotron (EC) startup assist power will beprovided to guarantee startup robustness. This assist will facilitate obtaininginitial breakdown over a range of pre-fill pressures and error-field conditions,and will also provide supplemental heating after breakdown to ensure rapidionization (burn-through) of -impurities in the initial low-current startupplasma. Two EC frequencies (~130 and ~110 GHz) are provided: these will allowthe TF field to be varied in ~10% steps. Pulse length of the startup system is a 2 s.
Current rampup. The balance of the plasma initiation sequence proceeds with acurrent rampup with average dl/dt = 0.15 MA/s. The current rampup iscoordinated with a minor radius expansion and elongation increase to maintaina nearly-constant edge safety factor 5 s q s 4. The plasma remains limited untilI = 15 MA is reached. Attainment of a SN divertor configuration atI = 15 MA (q95 =4) follows. Continuation of the current rampup results in a21-MA current flattop (q95 = 3) at t = 150 s. The current rise and minor-radiusexpansion minimize skin-current at the plasma edge and keep the plasmainternal inductance ^(3) s 0.7 during the plasma current rise. This avoidsinternal tearing-mode MHD instability near integer q values. The expansion alsofacilitates rampup with near-minimum resistive flux consumption,
corresponding to an Ejima coefficient (|>res/HoIR = 0.45 when current flattop isachieved. The 0.15 MA/s ramp rate and late-divertor-formation basis (= 0.75 Ipo)also satisfy PF system power demand limits and physics requirements for a nearlyfully-penetrated plasma current profile with /j(3) ~0.9] at start-of-current-flattop(SOF).
Shape and configuration control. Dynamic control of the plasma shape andposition and active control of the plasma radial and vertical position is requiredthroughout the scenario. Briefly stated, the shape control concept for thescenario will use a pre-programmed PF current evolution supplemented byfeedback control of the global plasma shape and position parameters(R, Z, K and 8) during the limiter phase of the expansion. The same "shape-control" approach used during the limiter phase of the plasma currentramp down after de-ignition. Following divertor formation, the feedback controlstrategy shifts to control of the critical plasma clearance and divertorconfiguration gaps. This "gap-control" strategy endeavors to hold both thedivertor strike points and key plasma separatrix-to-first-wall clearance gapswithin ±10-cm tolerance. Gap control will be used for the final current rampup(15-21 MA), the heating/ignition/burn/de-ignition phase, and the beginning ofcurrent rampdown (21-15 MA).
The response of the gap control system is finite, both with regard to being able tomaintain simultaneous control of the all gaps (typically the two divertor strikepoints plus four additional plasma-FW gaps) and also with regard to the timerequired following a disturbance to restore the gaps to pre-disturbance values.Accordingly, there is a s 10 cm clearance gap between the first wall and the "5-cm" plasma scrape-off layer (SOL) flux surface. This "SOL" clearance gapprovides margin for the transient response and finite gap controllability of the PFcontrol system. Studies of the response of the plasma shape to specified
FDR-Plasma Performance Assessments Chapter Ill-Page 50

"recoverable disturbances" (eg., a minor disruption with 20% beta loss, see §5.2)show that the PF control design provides adequate dynamic shape control.
Ignition and sustained burn. Following SOF, the scenario proceeds withapplication of auxiliary heating: this heating, coordinated with plasma fuelingvia gas or pellet injection results in attainment of H-mode confinement andinitiation of a self-sustained fusion burn at 1.5 GW within about 50 s.Attainment of rated fusion power is denoted as start-of-burn (SOB). Once SOB isattained, accumulation of thermal He results in a need to further increase theplasma density to maintain fixed power: the approach to sustained burn withstationary He requires about 200 s. Burn proceeds until the end-of-burn (EOB)inductive flux limit [~(-320) Wb] of the PF coil system is reached. For standardplasma confinement and impurity models, duration from SOB to EOB is 1300 s.
The long magnetic relaxation time of the ignited HER plasma (~500 s) will allowfor transient attainment of ignition and burn with a modified current profile, ascan be obtained at SOF state by means of control of the pre-SOF current ramp rateand/or plasma fueling. Using current ramp control combined with early (pre-SOF) auxiliary heating offers the possibility of studying ignition and the ensuingslow relaxation to a sustained-burn state with a modified current profile."Set up" of reverse-shear plasma safety factor profiles (see §4.4) by this method isalso possible. Allowable auxiliary power in the rampup phase is set by in-vesselsurface power handling capabilities: alOO MW auxiliary power input in thedivertor phase, and ~40 MW auxiliary power input in the limiter phase.
Kinetic control during burn phase. As is presented in §4.2, the kinetic propertiesof the burn phase plasma—specifically the fusion power, the plasma edge powerflow (which determines the maintenance of H-mode) and the divertor targetpower—will be individually controlled by the means of an algorithm that isbased upon separate feedback control loops for DT fuel injection rate (gas or pelletfueling), auxiliary power input and impurity (e.g., Ar or Ne) fueling. As isshown in Figure 10, such control can effect both dynamic control the fusionpower initiation and termination and control of the fusion power level duringthe sustained-burn portion of the scenario. Simulations of burn "disturbances"(e.g., ad hoc changes in plasma transport rate or intentional turn-on of auxiliarypower in an ignited plasma, Figure 18) show that the algorithm can also stabilizethe fusion power against such disturbances and limit power excursions to£(±20%).
Burn and current termination. A coordinated sequence of plasma power andcurrent shutdown is provided to ensure a disruption-free plasma shutdown.Once the PF flux-swing limit is reached, decrease of plasma current withdI/dt = -0.03 MA/s is initiated to keep the peak field in the central solenoids 12.75-T. Simultaneously, the plasma density and fusion power are reduced inan approximately linear manner, by reduction of the fueling rate, over 100 s,accompanied by a coordinated re-introduction of auxiliary heating to maintainH-mode confinement and adequate plasma edge power flow. Simulations(Figure 10) show that all operation limits can be satisfied if the power shutdownand density reduction duration is about 100 s. Current rampdown requires afurther 200 s.
FDR-Plasma Performance Assessments Chapter IH-Page 51

100 200 300 O 100 200 300 400
Pa (MW)
Power added to teatcontrol response
(MW)
3OO.
250.
150.
1OO.
50 .
P~p (MW)
*LI Purs.! <MW)
r"
-'Iv,
y1OO 200 300 400
Tlmo (•)100 200 300 400
Tims («)
FIGURE 18Simulation of Simultaneous Burn and Divertor Control (100 MW added)
PF reset and recool. The total plasma current pulse duration for the nominalscenario with 1000 s burn is 1400 s. Following the end of the current pulse, anadditional 800 s is provided to allow reset of the PF currents and recooling of themagnet systems. The latter requirement, set by the flow-through time of the Hecoolant, sets the allowable repetition rate, which is 1.6 pulses per hour.
Time-variation and adaptability of the shape/gap control algorithm. The PCSand PF controller will incorporate an adaptive/time-variable shape and gapcontrol algorithms. Here limitations on maximum PF coil currents, maximumPF control line power demand and maximum rate-of-change of PF powerdemand affect the "optimization" of the control algorithm at an given plasmashape and scenario state. In addition, since the individual PF currents requiredto produce a given shape vary during the scenario, the optimal algorithm willalso vary as the scenario state progresses. Accordingly, an adaptive approach inwhich the control algorithm can modified depending on the external systemparameters (power demand, PF currents, etc.) and plasma shape (and possiblyother measurable parameters such as plasma inductivity) will be used. The basic
FDR-Plasma Performance Assessments Chapter Ill-Page 52

outlines of this requirement are already clear, but future design work is requiredto fully identify the amounts and type of adaptivity needed in the shape/positioncontrol system. However, there is no doubt about the overall feasibility ofmaintaining robust and efficient plasma shape control throughout the scenario.
PF coil protection and limits. Adaptivity will also enter into protection of the PFcoils against overcurrent or excessive forces and into response of the PCS/PFcontroller to loss of ability to fully control one or more individual PF currents.Since there are more PF coils than controlled shape parameters, it will be possibleto maintain a certain degree of plasma shape and current control even if one ormore PF coils reach their allowable current. In this case, the PF control algorithmand/or plasma shape control request will be modified dynamically, ideally tobring the PF coil out of current saturation, or if such recovery is not possible, toeither allow the pulse to proceed with degraded control or to effect a controlled orfast plasma shutdown. The choice among these options will be made by the PFcontrol system, likely with "advice" from the PCS about the plasma energy andkinetic state. Here the PCS and PF controller and PF protection will becoordinated to provide "intelligent" control and protection that seeks tominimize the possibility of a plasma disruption that would otherwise occur if asimple "blind-stop" plasma and PF shutdown were to be initiated upon faultdetection.
5.2 Plasma disturbances (recoverable)
During the plasma operation scenario, repetitive plasma disturbances—minordisruptions, sawteeth, and ELMs—are expected or possible as part of normaloperation. Disturbances that affect vertical position control are also possible.ITER operation must be tolerant of such disturbances. The key factor involvedduring the divertor phase of operation is control of the plasma-to-wall clearancegaps to avoid the onset of plasma-wall contact. The design specifications for theITER plasma control system call for a capability to maintain the plasma shapeand position or critical clearance gaps within the alO-cm tolerance specified forthe SOL clearance. To allow evaluation of the control response, two types ofcandidate plasma disturbances are specified: 1) a loss-of-vertical-control event inwhich the plasma center (magnetic axis) is allowed to drift 10 cm upwards ordownwards before control is re-enabled, and 2) candidate plasma disturbancesthat reflect the expected effects of internal MHD activity and /or changes in theplasma energy confinement mode. Table 12 summarizes the latter types ofcandidate disturbances that are specified for control studies.
These plasma disturbances are to be recoverable: the control system responsemust be adequate to limit the separatrix-surface contact time to s i s. Thiscriterion applies on an ignited/driven-burn plasma with full (~1.5 GW) fusionpower. Contact duration allowables for lower power are longer. Studies ofcontrol response presented in [DDD97b] show that the ITER design providesadequate passive stabilization and recovery response to prevent plasma-wallcontact for a "worst-case" minor disruption with a 20% loss of plasma energy(App = -0.2).
FDR-Plasma Performance Assessments Chapter Hi-Page 53

Irrecoverable disturbances. Internal plasma disturbances with larger magnitudesthan those specified above (e.g., "giant" sawteeth or "giant" ELMs) or anH to L-mode transition or major disruptions are also expected. However, sincethese disturbances result in high transient energy deposition on the divertorand/or FW surfaces and occurrence of a major disruption and onset of a VDEmay occur.
TABLE 12Design Basis Specifications for Repetitive Disturbances
Disturbance
Minordisruption
Minordisruption(maximum)Sawtooth(normal)Type I ELMType Ic ELM
Giant ELM
FishboneburstL- to H-mode
A/i(3)*(decrease)
0
sO.l
s0.05
0sO.03
0.05
—
-0.1
Af}p*t(decrease)
s0.2
s0.2
s0.05
£0.03sO.03
0.05
—
-0.2(increase)
Waveform / frequency /recurrence/recoveryStep/0.2 Hz/<10 per pulse/5 s linear recovery
Step/0.2 Hz/<10 per pulse;5 s linear recovery (pp);a 20 s linear recovery (!j)Sawtooth: 0.1-0.01 Hz(lower freq. in burn phase)Sawtooth: 2-0.2 HzSolitary: ~£ 1 per 10 Type1,5 s lin. recov.Solitary (< 0.1 Hz);typically after a long ELM-free period or attermination of ELM-free H-mode phase
—
Ramp (5 s)/once per pulse
Importance
Mainly in startup (OH)phase, but basis is for fullWu, plasmaWorst-case minordisruption (for full W(hplasma)Giant sawteeth (s 0.01 Hz)also possible, not repeatedPrimary operation modePossible, but s 1:10 ofType ILikely near H-L powerthreshold: a few occur-rences OK, repetitiveoccurrence to be avoided
l(target erosion)Not design basis event
Included within PF scenariobasis
* Nominal pre-disturbance basis is l\ = 0.9; Pp = 0.9 (for ignited/high-Q driven-burn+ For Pp = 0.9 basis: scale 8pp values in Table as pp/0.9 for plasmas with Pp / 0.9
5.3 Disruptions, VDEs, runaways and fast shutdown
While ITER plasma operation events in the "fast dynamic" category—disruptions, VDEs and runaway conversion—are undesirable and are to beavoided if possible, in the context of ITER operation, they too must be consideredas normal occurrences, especially given that ITER operation will involve plasmaoperation near a number of operational limits that are known initiators fordisruption or loss of vertical equilibrium control. While there are proposals forintervention means (e.g., ECRF current drive, see below) to forestall onset ofdisruption and /or mitigate the severity of the ensuing cascade of events, theefficacy of such methods remains to be fully demonstrated in presentexperiments and in any case will also have to be proven when applied to anITER-class tokamak. In the meantime, permanent ITER components must bedesigned for the full number of fast dynamic events expected during the ITERoperation life cycle, and "replaceable" components (e.g., divertor targets) must be
FDR-Plasma Performance Assessments Chapter IH-Page 54

designed with enough lifetime and endurance to accommodate the expectednumber and severity of events that will arise during respective life cycles.
In addition, there are plasma operation and in-vessel component protectionconsiderations that call for plasma power and current shutdown on a ~1 s timescale—more than 100 times faster than normal shutdown. Fast shutdown sharesmany similarities with a disruption and can have similar design consequences toa "natural" disruption and a high likelihood of producing substantial runawayconversion. Here injection of massive amounts (~ 0.1 kg) of D appears to havethe best prospects of avoiding runaway conversion.
Table 13 summarizes the key ITER design basis specifications for fast plasmadynamic events and fast shutdown actions. These specifications are presentedhere without exhaustive explanation: definitions of disruption and disruption-related parameters and analysis of their effects for ITER follow below and inmore detail in [DDD97a].
TABLE 13Key Design Basis Specifications for Fast Plasma Dynamic Events
DisturbanceMajor Disruption
Major Disruption (duringplasma startup/shutdownand /or full-performanceplasma developmentVDE
VDE (loss-of-control)
Fast Shutdown
Runaway (RA) ElectronConversion
Design Basis ParametersWth = lGJ,Wmag = l.lGJ
WthsCXSGLWrnagsLlGJ
Wth s 0.1 GJ, Wmag = 1.1 GJ;Ihalos0.4Ip0;TPFs4Wth slGJ, W ^ = U GJ;Ihalos0.4Ipo;TPFs4tth- tmaj s 1 s; by impurity orD injection; D favored tominimize RA conversion10-15 MeV electrons, IRA to75% of Ipo (for 21 MA). Wtf,50-300 MJ, with potentiallyhigh poloidal and toroidallocalization on upper FW oroutboard lower FW. Mayoccur following disruption,loss-of-control VDE or fastplasma shutdown
Importance/Comment10% of 'full-performance' pulses,-500 occurrences during BPPUp to 30% of BPP pulses (-2500occurrences in BPP)
After each disruption
1% of pulses
-10% of pulses (?). Primaryplasma shutdown/in-vesselprotection meansMany uncertainties. Magnitudeof RA current, FW depositionand total RA thermal energy toFW sensitive to MHD fluctu-ation levels and /or effect ofvertical instability. Toroidallocalization depends on FWalignment. Shutdown specieswill influence RA current
Major disruptions and VDEs. The phenomenology and causative factors fordisruption well known and can be described in terms of the three classical phasesof a disruption: precursor development, thermal quench and current quench.Disruption typically proceeds with onset of a precursor phase wherein slowlyevolving external causes (e.g., current profile peaking owing to edge impurityinflux or radiative losses) initiate onset of growing internal MHD precursoractivity (2,1 mode coupling to 1,1 mode) that in turn results in internalreconnection and nearly instantaneous development of an internal magnetic
FDR-Plasma Performance Assessments Chapter Ill-Page 55

island that mixes the core and plasma edge regions. The resulting destruction ofthe internal magnetic surfaces leads to an ensuing rapid loss of plasma thermalenergy (thermal quench) that proceeds primarily by conduction to limiter and /ordivertor surfaces. Completion of the thermal quench is usually followed bybroadening of the current profile, with a resulting -15% increase in plasmacurrent. The thermal quench is followed by a current quench in which rapiddecay of the plasma current occurs. Plasma energy loss in this phase is causedprimarily by impurity radiation to the surrounding vacuum vessel or FWsurfaces. Influx of impurity and also fuel density into the plasma following thethermal quench is a key consideration in promoting the high specific radiationrates and low plasma temperatures that are required for a fast current decay.
Vertical displacement event. In a non-circular tokamak, changes in the plasmacurrent and pressure profiles that occur following disruption typically result in aloss of vertical equilibrium and plasma shape control, so onset of a VDE follows,with subsequent development of toroidal current flow (halo current) on plasmaflux surfaces that intersect the vacuum vessel or FW structures. Reconnection ofthese halo currents through in-vessel conducting structures (in-vessel halocurrents) then provides a significant fraction of the vertical restoring force that isrequired to maintain vertical equilibrium of the vertically-displaced plasmacolumn. There are corresponding vertical (and also radial) forces on the in-vessel components. For ITER, the magnitude of these forces is ~100 MN.
Runaway conversion. The high in-plasma electric fields produced by disruptionscan also give rise to generation of runaway electrons. In present experiments, themagnitude of runaway generation varies, ranging from none detectable toappreciable current conversion (up to ~50% of the initial plasma current). Ingeneral, appreciable runaway conversion is not seen in disruptions in non-circular cross-section divertor tokamaks, as contrasted with the appreciableconversion seen in circular limiter tokamaks. Recent data obtained in JT-60Uplasmas shows the key role that magnetic (MHD) fluctuations play indetermining the presence or absence of runaway generation: disruptions withhigh levels of fluctuation are runaway-free; disruptions or disruption phaseswith lower fluctuation levels have runaways.
Disruption frequencies. The design basis assumption for ITER disruptionfrequency in a developed full-performance operation mode with q95 = 3 andPN = 2.2 is 10%. The design basis assumption for overall disruption frequencyduring the commissioning and operations development phase that leads up tothis phase of ITER operation is 30%. While these frequencies are generallyconsistent with present experimental achievements, final justification for themas an ITER design basis will require continuing studies of the sensitivity ofinherent disruptivity to the proximity to operational limits (especially densityand non-ideal MHD beta limits, see above) and careful analysis of data to separatethe effects of plasma operational objectives, procedures and operator experiencefrom the underlying "physics" aspects of disruptivity.
There are significant caveats about the disruption frequency effects of plasmaoperation near neoclassical beta-limits and at/above the Greenwald density limit.Here we expect that to achieve disruption frequencies of ~10%, ITER operation
FDR-Plasma Performance Assessments Chapter Ill-Page 56

will have to be conducted with some care and a priori planning and with the useof "on-line" disruption prediction to warn the ITER operators and/or the ITERPlasma Control System to the likelihood of impending disruption. Theimplementation of active Electron Cyclotron Current Drive island growthcontrol to limit onset of P-limit disruption may also be required.
VDE frequency and direction. In elongated-cross-section tokamaks, verticalcontrol is usually lost following onset of rapid current quench. This type event issometimes a called a "vertical" disruption, to distinguish it from a"loss of [vertical]-control" VDE in which the VDE starts with appreciable plasmathermal energy and with a slow drift phase and onset of wall contact that thenleads to a rapid (but not disruptive) thermal collapse or to onset ofMHD-triggered disruptive thermal quench. For ITER, we treat both types ofevents as VDEs and where necessary distinguish after-disruption (cold-plasma)VDEs from loss-of-control (hot-plasma) VDEs.
Loss of vertical control following disruption is not always inevitable in presentelongated tokamaks. For example, vertical control can be maintained followingdisruption in JT-60U by means of plasma operation with a combination of factorsthat typically include moderate vertical elongation and initial vertical positionnear the "neutral point" and a relatively powerful vertical control system.
The ratio of disruption and after-disruption VDE frequencies in ITER is expectedto be unity: an after-disruption VDE is expected to occur after each thermalquench. The "neutral point" controlled rampdown strategy does not appear to bereliable in ITER owing to the higher plasma elongation and the (relatively)limited peak PF power. However, it may be possible that a certain fraction ofafter-disruption VDEs can be stabilized in ITER: this will avoid halo currents butmay likely exacerbate runaway conversion (see below).
The direction of an "after-disruption" VDE in ITER is not completely certain:disruptions with full current profile broadening [i.e., Zi(3) = 0.9 -» 0.5] and arelatively slow current quench evolve downward, with final current decayoccurring near the divertor entrance throat; disruptions with less or no profilebroadening [i.e., with Zi(3) = 0.9 after thermal quench] and/or a faster currentquench evolve upwards, terminating on the upper/inboard sector of the FW. Astudy with the DINA dynamic equilibrium code suggests that most after-disruption VDEs will be upward-going. However, the possibility ofdownward-going after-disruption VDEs cannot be excluded, and upward anddownward-going loss-of-control VDEs are expected with equal likelihood.
Figure 19 shows the plasma magnetic axis trajectories of two "fast radial"disruptions and various upward and downward-going VDEs. All disruptionsand VDEs terminate on two regions of the FW. This is an inherent consequenceof the ITER in-vessel component and PF coil configuration and is not affected bythe action of PF control during the after-disruption period. Accordingly, wall-interaction and/or damage effects associated with VDEs (and runaway depositionfollowing onset of a VDE) will be poloidally localized on the upper/inner andlower outboard areas of the FW. There is also some possibility of interactionwith the divertor "dome" in the final phase of a downward-going VDE.
FDR-Plasma Performance Assessments Chapter Hi-Page 57

Upper Port
FIGURE 19Magnetic Axis Trajectories for "Radial" Disruptions and Various VDEs
The frequency of "loss-of-control" VDEs wherein equilibrium control of afull-performance 1'1'HR plasma is lost and the plasma drifts vertically and initiatesa wall-contact-triggered energy and current collapse will depend on the controlsystem reliability and stability design margin. The present design basisassumption for the frequency of such loss-of-control VDEs is 1%.
Disruption thermal and current quench characteristics. For in-vessel componentdesign purposes, the most important disruption parameters are the durations ofthe thermal and magnetic energy quenches and the partitioning of thecorresponding energies among the divertor and FW surfaces. Thermal quenchduration is estimated to be ~0.5-3 ms: the range reflects uncertainty inextrapolation of data to ITER size and also the fact that thermal quenches aresometimes single-step and sometimes multi-step, wherein energy loss occurs intwo or more rapid steps separated by a delay that extrapolates to ~10 ms for ITER.
The location of thermal quench deposition is expected to be within the divertorchannels. The 80-100% range reflects the possibility that up to ~20% Wth may bedeposited on the divertor entrance baffle or the FW, since SOL widening of up toxlO is sometimes seen in present experiments (x3 is more typical). Partitioning ofthe in-divertor energy between the inside and outside channels is relativelyuncertain: however data typically show more energy to the inside channel.
For the divertor, ionization and formation of a dense plasma-shielding layernear the material surfaces is predicted. This shielding layer and the ensuing
FDR-Plasma Performance Assessments Chapter Ill-Page 58
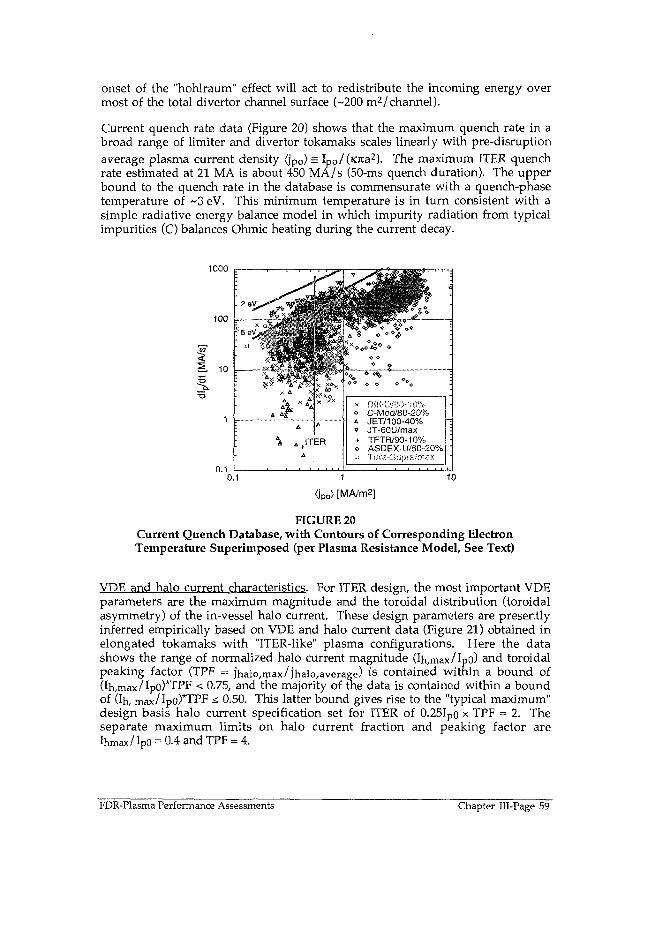
onset of the "hohlraum" effect will act to redistribute the incoming energy overmost of the total divertor channel surface (~200 m2/ channel).
Current quench rate data (Figure 20) shows that the maximum quench rate in abroad range of limiter and divertor tokamaks scales linearly with pre-disruptionaverage plasma current density <jpO) = IpO/(K7ca2). The maximum ITER quenchrate estimated at 21 MA is about 450 MA/s (50-ms quench duration). The upperbound to the quench rate in the database is commensurate with a quench-phasetemperature of ~3 eV. This minimum temperature is in turn consistent with asimple radiative energy balance model in which impurity radiation from typicalimpurities (C) balances Ohmic heating during the current decay.
1000
x Dlll-0/9Q--I0%» C-Mod/80-201*A JET/100-40%v JT-60U/max+ TFTR/90-10%o ASDEX-U/80-20"!a Tore-Suprs/rnax
<jpo> [MA/mZ]
FIGURE 20Current Quench Database, with Contours of Corresponding ElectronTemperature Superimposed (per Plasma Resistance Model, See Text)
VDE and halo current characteristics. For ITER design, the most important VDEparameters are the maximum magnitude and the toroidal distribution (toroidalasymmetry) of the in-vessel halo current. These design parameters are presentlyinferred empirically based on VDE and halo current data (Figure 21) obtained inelongated tokamaks with "ITER-like" plasma configurations. Here the datashows the range of normalized halo current magnitude (Ih,max/Ipo) and toroidalpeaking factor (TPF = jhalo,max/]'halo,average) is contained within a bound of(Ih,max/Ipo)*TPF <. 0.75, and the majority of the data is contained within a boundof (Ih, max/Ipo)*TPF <. 0.50. This latter bound gives rise to the "typical maximum"design basis halo current specification set for ITER of 0.25Ip0 x TPF = 2. Theseparate maximum limits on halo current fraction and peaking factor areIhmax/IpO = 0.4 and TPF = 4.
FDR-Plasma Performance Assessments Chapter Ill-Page 59

TER Design BasisCategory I, II loading)
1997 Data
(if JT-60U (97)
# JET-<Jawn (B7/SOFE)
<^> JET-wp(97/SOFE)
Extrapolated Ih^nai^pOat qss » 3 (m*«fVf2<T)
COHPASS-D ASDEX-U (6.W)
Hak> Current Database 11.11.07 (1.5 S K , S 2.0; JT-60U I . 3 S K , S 1.5)
Normalized Maximum Kato Current {Eh.maxApO}
FIGURE 21Halo Current Database
The shaded domain shows the loading envelope for ITER in-vessel andvessel component design for routine/normally-expected VDEs.
Figure 22 shows an axisymmetric simulation of a loss-of-control VDE in ITERdeveloped with the TSC modeling code. The resulting plasma current andhalo-current waveforms and peak halo current magnitude (~O.24xIpo) arerepresentative of a "typical worst-case" ITER VDE as inferred from the halocurrent database. The peak vertical force developed is -120 MN.
The inverse correlation between Ih,max/IpO and TPF evident in the database isqualitatively consistent with a VDE/halo-current model proposed inReference [DDD97a] in which the in-vessel halo current distribution is correlatedwith the corresponding interaction of a helically-deformed plasma with theaxisymmetric conducting vessel or in-vessel surface. The resulting inversecorrelation of Ih,max/Ip0 with TPF is consistent with the bounding domain inFigure 21.
Evidence for a helical and/or tilting deformation of the plasma column that iscorrelated with halo current asymmetries and lateral vessel forces is seen in JET.There is indication in the database that JET and JT-60U have somewhat lowermaximum Ih,max/Ipothan the medium to small-sized tokamaks. This suggeststhat there may be at least a weak inverse scaling of Ih,max/Ip0 with major radius.However, we believe that it is premature to adopt such a scaling as an ITERdesign basis, and suggest that future data from small to large experiments areneeded to clarify the size scaling of maximum halo current fraction with majorradius.
FDR-Plasma Performance Assessments Chapter 111-Page 60

FTER Model and Plasma Configuration Evolution
1.00 -
0.00 -
-2.00 -
-3.00 -
•4.00 -
-5.00 -
2O00
k Axla Trajectory [
i **TUA
r u M A
M U M
/
^ 120.7 UA2900 nu
21.0MJ
10 12 5.50 7.00 7.S0 6.00 6.50 9.00
R»dlu« (Bin, m)
FIGURE 22Loss-of-Control VDE in ITER, Simulated with TSC
The plasma current decay in even a "slow" (1 s) loss-of-control VDE is fastenough to generate in-plasma electric fields that are well in excess of the criticalelectric field for onset of knock-on avalanche runaway conversion. Hence loss-of-control VDEs have a potential for runaway conversion, and the ultimatetermination of such VDEs may be as a runaway current channel. However, thelikelihood for runaway conversion in an ITER VDE is uncertain owing to theobservation in present divertor tokamaks that disruptions followed by VDEs orloss-of-control initiated VDEs do not produce noticeable runaway conversion.While conclusive data are lacking to support the hypothesis that enhanced levelsof MHD fluctuation underlie the lack of runaway conversion when verticalinstability is present, it is likely that MHD fluctuation effects are responsible forthe nearly-universal lack of runaway conversion in present divertor tokamakdisruptions.
How this extrapolates to ITER is unclear, since the knock-on avalanche runawaygain in high-current ITER disruptions and VDEs is potentially much higher thanthe Dreicer runaway gain that is applies in present tokamaks. Whetherfluctuation levels in ITER VDEs can offset the higher knock-on avalanchegrowth rate remains to be determined. This will affect the degree of runawayconversion and also the VDE evolution that will be obtained in ITER.
Runaway conversion and effects of fast plasma shutdown. In ITER, the highelectric fields produced in either disruptions or the proposed use of impurity
FDR-Plasma Performance Assessments Chapter 111-Page 61

pellet injection to effect a fast fusion power and current shutdown are predictedto produce substantial conversion of plasma current to runaway electron current.Here knock-on avalanche multiplication of minute levels of pre-shutdownsuper-thermal electrons is predicted to result in wholesale conversion of theinitial plasma current to runaway current (up to 16 MA, with E -10-15 MeV).Similar runaway conversion can be expected during "natural" disruptions andpossibly during the current collapse phase of a VDE. The resulting eventualimpact of the runaway current on the first-wall can result in high near-surfaceenergy loadings and possible FW or limiter surface damage.
The dominant mechanism for runaway production in large multi-MA reactortokamaks is predicted to be avalanching of runaway electrons owing to large-angle (knock-on) Coulomb collisions that produce secondary electrons whichalso run away. The critical field for avalanche onset is given to sufficientapproximation by Ec(V/m) = 0.1 rie(1020m-3). For typical ITER after-disruption orafter-fast-shutdown current quench rates and plasma densities, E»E C , theresulting runaway growth rate yRA is -103 s"1, and the avalanche gain factorexP(YRATcq)ls sufficiently high to allow minute levels of seed runaways to grow tomulti-MA levels. This growth can result in conversion of a major fraction (up toabout 75%) of the decaying plasma current to runaway current.
Figure 23 summarizes data from simulations of ITER fast plasma power (thermalenergy) and current shutdown with injection of various pellet species andmasses. The data is plotted versus the after-injection density ratio ne/neo- Thedensity ratio boundary for runaway-free shutdown (E s: Ec) is also indicated.Runaway conversion is well correlated with the proximity of the correspondingdata points to this boundary. Limits for VDE minimization and FW heating bythermal radiation are also shown. Only injection of relatively massive amounts(~100 g) of deuterium (D) produces a (nearly) runaway-free shutdown that is fastenough to also minimize VDE halo currents and forces.
The deuterium injection modeled in the simulation provides a 100-x increase inplasma density. Whether such a density increase can be obtained by practicalmeans (multiple 1-km/s pellets or a 1-km/s liquid jet) in an actual plasmaremains to be investigated, and injected particle and transport effects importantin present low-mass pellet injection experiments remain to be added to thesimulation model. Runaway conversion expected in "natural" disruptions(contaminated by carbon impurity from divertor targets) has also been modeled,and conversion was found to be intermediate between that obtained for the low-Z (Be) and high-Z (Xe ) cases, with the runaway current in between 10 and 15 MA.
The knock-on avalanche limits the average runaway energy to about 10 MeV.The amount of kinetic energy in the runaways depends on the current: energy at15 MA is about 50 MJ. There is, however, about 250 MJ of magnetic energy andmodeling of the "scrape-off loss of runaways owing to the effect of plasmamotion (VDE) shows that avalanche regeneration of the lost runaway currentcan occur in slow (~300 ms) VDEs. In this case most of the magnetic energy canbe converted to runaway kinetic energy. The worst-case limit on kinetic energythat can be deposited on the FW is about 300 MJ.
FDR-Plasma Performance Assessments Chapter Ill-Page 62

10.00-3
0.001 •
i HoFWSurtactU.lt
oThwmal ] B»FW,T. ' -«00K)
duration j
1 100010 100
n e (after injection) / neO
FIGURE 23ITER Fast Shutdown with Xe, Be or D Injection
The model used for Figure 23 neglects the effects of MHD fluctuations. Suchfluctuations—particularly those associated with vertical instability—apparentlypromote prompt runaway losses and thus inhibit runaway buildup in presentexperiments. The magnitude and loss effects of fluctuations in ITER plasmasremain be quantified and incorporated into runaway and fast shutdownmodeling codes, and the extent to which fluctuations will be able to offset thehigh runaway generation potential of the knock-on avalanche in reactortokamaks remains to be quantified.
The effects on runaway deposition on the ITER in-vessel component surfacesalso require further study. Simulations of the plasma configuration evolution inthe after-disruption or after-control-loss phase of VDEs without runaways showthat the plasma-affected region of the FW will be poloidally localized near thedivertor entrance for downward-going VDEs or near the upper-inside cornerregion of the FW for upward-going VDEs. Study with the DINA code with arunaway model included gives a similar result: the 10 MA of runaways producedduring the VDE are deposited in the same upper-inside corner region. However,the safety factor in the runaways in end phase of the VDE is s 1; it is likely thatglobal MHD instability (not included in the simulation) will occur at this point.
Toroidal localization of runaway deposition in the end phase of a VDE willdepend on the effective runaway scrape-off lengths and the localFW-toroidal field alignment. The latter will depend of the FW and vacuumvessel tolerances and the overall toroidal-field-magnet to vessel/in-vesselalignment. Present limiter tokamak data suggests that ITER runaway scrape-offlengths will be ~2 mm: if so, then FW alignment to the toroidal field will
FDR-Plasma Performance Assessments Chapter Ill-Page 63

dominate the deposition localization. However, as noted above, it is possible orlikely that MHD instabilities will distort the current channel in the finaldeposition phase.
Poloidal and toroidal localization combined with worst-case runaway energycontent can result in FW surface energy loading slOO MJ/m2. Such levels maycompromise the long-term survival of the FW surface. However, MHDfluctuations may act to limit the magnitude of runaway energy and reducelocalization of the resulting losses. If so, runaway deposition levels will be moretractable, particularly since the poloidal localization will facilitate modifying theFW surface design to accommodate the corresponding localized energy loadings.
Prediction of ITER disruption and runaway effects. Present conclusions aboutrunaway conversion in ITER during disruption, VDEs and fast shutdown aresubject to significant caveats about the effects of prompt loss of runaways owingto MHD instabilities and open flux surfaces. It is clear that runaway and MHDfluctuation effects must be accounted for in the self-consistent prediction of ITERdisruption, VDE and fast shutdown characteristics. Given that there are noforeseeable opportunities to experimentally study alO-MA disruptions andrunaway conversion, definitive prediction of ITER disruption, fast shutdownand VDE characteristics will require development of a simulation model thatincorporates all of the physics effects involved—including 3-D MHDequilibrium, halo current and runaway conversion and MHD fluctuation loss.Development and validation of such a "integrated" disruption/VDE model isidentified as an urgent and yet incomplete ITER physics R&D requirement.
5.4 Disruption avoidance, mitigation and amelioration
Disruption avoidance and effect amelioration or mitigation are identified ashighly desirable ITER goals. These goals encompass three considerations:(1) prediction of the impending occurrence of disruption and/or avoidance ofdisruptions by a priori avoidance of the operation conditions that lead todisruption, (2) intervention, either before disruption precursors occur or beforeprecursor growth leads to irreversible onset of thermal quench, to actively effectavoidance or MHD instability control, and (3) amelioration or mitigation ofeffects, in which after-onset actions are taken to reduce the severity orconsequential effects of a disruption. In the latter regard, as has been presentedabove, pellet or jet injection-initiated fast shutdown is identified as the mostfeasible means for the amelioration or mitigation of disruption effects in ITER.Promising means for disruption avoidance and intervention means are alsoidentified, but further R&D is needed to quantify how well they can be expectedto work in ITER.
Disruption avoidance. Disruptions can in principle be avoided by the provisionof a plasma scenario that skirts the various operational limits and conditions thatcause disruptions and by the provision of adequately reliable plasma operationand control systems such that all critical parameters of the prescribed scenario canbe reliably obtained and repeated. Under such conditions, often embodied in
FDR-Plasma Performance Assessments Chapter Ill-Page 64

present so-called "setup" or "reference pulse" discharges but also in standardoperation mode discharges (e.g., the TFTR supershot used for DT experiments),per pulse disruption rates in present tokamaks can be very low (-1%).
This type of "passive" disruption avoidance can in principle be extended to ITER,but here, because ITER operation will necessarily require close proximity to anumber of disruption-initiating limits, provision of precise real-time disruptionprediction (onset warning) will be essential. Here monitoring of various plasmaperformance indicators, including edge safety factor (q9s), internal inductance (toquantify position in the q-Zi tearing mode stability domain), plasma densityrelative to the Greenwald density, radiated power fraction, and status of MHDactivity will be an essential plasma operation development tool and will beprovided as part of the ITER PCS and plasma operator interface.
Using a limit-proximity or disruption warning indicator to effect feedback-controlled intervention (i.e., feedback from PN to control PaUx and/or TDT) willalso be essential to allow ITER to be able to operate reliably near thecorresponding operational limit. This method of p-limit disruption avoidance isnow successfully implemented in a number of present tokamaks. In the samevein, provision of plasma control systems incorporating feedback algorithms tomore directly control sensitive scenario parameters (e.g., radiation fraction)makes reliable achievement of optimized scenarios in present experiments (e.g.,the CDH mode in ASDEX-U) without disruption a matter of closed-loop controlrather than open-loop setting of parameters. Such feedback control capability fordivertor and radiation-balance control will be provided by the ITER PCS.
Multi-parameter disruption predictors. Use in ITER of separate single-parameterproximity to operational limits may not provide high certainty for disruptionprediction; or conversely, may unduly restrict the accessible operation domain.Improvement is possible with a neural network disruption predictor, whereinmultiple disruption-related indicators or diagnostic signals are combined via aneural network to provide a composite disruption-warning indicator that ismore reliable than simple indicators. There has been recent successes in DIII-Din demonstrating the enhanced predictive capabilities of this method.Incorporation of such prediction the PCS is planned and will be straight-forwardin a conceptual sense: a wide range of diagnostic indications are used as networkinputs and the network is then "trained" to determine input signal weightingsthat then allow more-reliable disruption prediction.
In addition, real-time assessment of MHD stability can (via a real-time stabilitycode or look-up application of a pre-compiled stability database) in principle beused as a disruption predictor, and there are many examples in presentexperiments in which onset of disruption can be closely correlated (on an after-the-fact basis) with a corresponding prediction of MHD instability. Provision ofadequate and sufficiently-accurate diagnostic data (e.g., plasma flux configuration,pressure and current density) is however required for application of this method,and the effect of diagnostic measurement accuracy on the degree of achievabledisruption prediction reliability for ITER remains to be fully quantified.
FDR-Plasma Performance Assessments Chapter Ill-Page 65

Disruption avoidance means. The intervention actions that can be taken uponprediction of impending disruption fall into three categories—passive, active andimmediate (i.e., fast shutdown)—that are distinguished by the time that it takesto effect them. This division according to time-response sets the corresponding"look-ahead" time-requirement for the predictor.
Passive avoidance means act to mitigate the underlying cause of the disruption,for example, by reducing the plasma density if approach to a density-limitthreshold occurs, or by the addition of auxiliary power if a localized edge powerbalance condition (MARFE) develops. Routine operation of the feedback controlloops provided in the plasma control system for "control" of such operationparameters constitutes a first level of avoidance: by the further addition ofmaking the set points of such control plasma-state or event (disruption-onsetpredictor indication) dependent, more robust avoidance can be implemented.The concept planned for ITER kinetics control will allow implementation of thistype of state-determined disruption avoidance, and there have been recentsuccesses in experiments (e.g., in ASDEX-U) in incorporating state-transition-triggered plasma "repair" procedures that automatically act to avoid onset ofdisruption. Similar capabilities are envisioned for the ITER PCS.
The time response for passive avoidance is typically slow (few to few x 10 s inITER), and hence its application will be limited to situations where a predictorwith a corresponding "look-ahead" time is available. Here, for example,detection times for slowly-growing neoclassical-island tearing modes in ITERmay be long enough to take passive avoidance action. Detection times fortraditional pre-disruption MHD precursors are too short for passive avoidanceaction.
Active intervention schemes are more "direct" and are based on using activeheating or current-drive means to locally modify pressure and/or current densitygradients or plasma rotation profiles so as to slow or prevent growth of the MHDinstability that leads to disruption. The time scale for such intervention canbe ~1 s. Owing to the highly localized current drive capability that it can provide,ECCD is the primary means envisioned for active intervention. Power levelsof ~50 MW combined with proper localization of the driven current aresufficient to control growth of neoclassical tearing modes. Ion-cyclotron CD andLHCD may also have similar fast-intervention capabilities, as may theapplication of NBI momentum drive in situations where modification of theplasma rotation profile can forestall a locked-mode-initiated disruption. All ofthese means are possible in ITER, but their application requires both furtherdemonstration in present experiments and provision of the correspondingpower and/or wave launching capability in ITER.
FDR-Plasma Performance Assessments Chapter 111-Page 66

6.0 ITER OPERATION PLAN AND PHYSICS PROGRAM
6.1 Operation plan
The ITER operation plan is divided into two phases, i.e. the basic performancephase and the enhanced performance phase, each lasting approximately a decade.Figure 24 illustrates key features and milestones of the preliminary operationplan for the basic performance phase (BPP). The figure shows the plannedoperation approach, which comprises a 2.5 year period of initial operation inhydrogen, to allow for testing, integration and commissioning of tokamaksub-systems, followed by a 0.5-year deuterium phase with limited use of tritiumbefore proceeding to full-power DT operation. Various operational modes areenvisaged, including initial ohmic and auxiliary heated pulses in hydrogen anddeuterium, 1000 s ignited pulses, and longer plasma burn pulses assisted bycurrent drive. Although the main emphasis will initially be on optimizationand physics studies of ignition and extended burn of DT plasma, blanket moduletesting will also be done whenever significant neutron fluxes become available.
DKVXCXC0MIX8SX0
H i mYsar(-1)
Sub-SystemTesting,IntegrationandCommissi-oning
Baking andConditio-ning
zrao acTiv&TXOH n u t IPLWja camxasxama
Year! Year2 | Year3 Year 4
HlflE kCTXVMIOM FHJUJIxatarxoM, OTSTJUMZD BUXX and BIMTKET TEST
(DD.DI)I Year5 i Years i Year7 i Year6 i Year9
Htial Full Field,Ohmic Current andand HeatingAuxiliary PowerHeating OperationOperation i
Physics Studies IDiagnostics ICommissioningwith Plasma I
1200 1500 500
| DO Sub- ignition SustainedI Proto-Ignited studies <000s BunI type Operation 2 o 0 s
.Ignition
I initial Physics Studies
Sustained
1000 s
Htial Steady-State Studies
PreMnary Test of Blanket
Steady-State audies -
Blanket Modutes Test -
1400 1200
First Plasma
l Operation
Maintenance
\ Commissioning of ITCH Systems
FIGURE 24ITER Operation Plan for the Basic Performance Phase (BPP)
Approximate number of ITER pulses is shown for each operational phase.
FDR-Plasma Performance Assessments Chapter 111-Page 67

6.2 Physics program
Uncertainties associated with a substantial extrapolation from the present-daytokamaks, especially in plasma size and pulse length, and an unexplored area ofDT burn make it likely that prolonged experimental studies will be required inITER in order to understand the physics of an ignited plasma and to optimize theplasma performance. The experimental program for ITER as a first fusionreactor-scale device must investigate a number of topics.
Key topics are:
• Confinement physics in reactor-scale plasma;• H-mode power threshold;• Operational limits;• Disruption phenomena in reactor-scale plasma;• Physics of high-power-flux radiative divertor;• Alpha-particle confinement;• Burn control;• Steady state driven burn.
6.2.1 Hydrogen plasma phase
Although a major purpose of an initial operation with hydrogen/heliumdischarges is the commissioning of ITER systems with plasma, a number ofphysics problems important for optimizing ITER performance and for design offurther machines will be addressed during this phase. Measurements of theenergy confinement times in ITER in hydrogen and helium discharges at heatingpower up to 100 MW will provide valuable information on size scaling of theenergy confinement time and improve accuracy in ITER confinementprojections for the DD and DT phases. Also, initial tests of the ITER divertorconcept will be made at heating powers up to ~30% of alpha heating power inignited DT plasma. This will reduce uncertainties in projections of divertoroperation in full-power DT shots. The amount of auxiliary heating powerrequired for obtaining the H-mode in ITER will be checked though likely at lowplasma density and reduced magnetic field only, because of a strong negativedependence of the H-mode power threshold on the hydrogenic ion mass(Pthr^Mf1). Electromagnetic loads due to disruptions and vertical displacementevents and heat loads due to runaway electrons, which are expected to be close tothose of the DT-phase, will be measured. Techniques for disruption mitigationand control will be tested and applied. Comparisons of maximum densitiesachievable with gas fueling and pellet injection, including injection from theinner side of the torus, will check the density limit at ITER conditions and reduceuncertainty in projections of ITER performance in DD and DT phases. Also,fundamental tests of non-inductive current drive will be done.
FDR-Plasma Performance Assessments Chapter Ill-Page 68

6.2.2 Deuterium plasma phase
The main purpose of the DD phase is preparation of reliable prototype scenariosfor subsequent ignited DT operation. Long-pulse ELMy H-mode discharges willbe obtained with the reference current and magnetic field, although probably atreduced plasma density. Energy confinement of deuterium plasma in ELMy andELM-free H-mode and in L-mode will be measured as a function of current,heating power and plasma density. The H-mode power threshold and itshysteresis and edge pedestal characteristics in the H-mode will also be studied. Alimited amount of tritium will be injected into deuterium plasma for calibrationof fusion product diagnostics and for shielding tests.
6.2.3 Deuterium-tritium plasma phase
One of the major goals of the ITER basic performance phase is the investigationof the physics of burning DT plasma sufficient to predict with confidence plasmacharacteristics in a next-step device. Detailed physics studies will also benecessary to evaluate and optimize ITER plasma performance.
Confinement of reactor-scale plasma. Although heating of DT plasma by alphaparticles is, in many respects, similar to well-understood heating schemes basedon neutral beam injection or ion cyclotron minority heating, it is possible thatthere will be a change in confinement physics in a burning DT plasma comparedto present-day experiments. In particular, a strong dependence of the heatingpower on the ion density and temperature, Pa <* nDnTT2, will affect thetemperature and pressure profiles which, in turn, can influence the stability andtransport properties of a reactor plasma. Moreover, the heating source in areactor is coupled with internal injection of impurity (helium), which will affectthe plasma performance due to the plasma dilution and increase in thebremsstrahlung power loss. There is a possibility that, in a burning plasma, newmodes of operation will be discovered which are more favorable for sustainedignition compared to the ELMy H-mode.
Density limit. The physics processes that occur in the plasma edge region of atokamak appear to have different scalings from those in the plasma core. As aresult, a plasma with an FTER-like core (i.e., the same PN and v*) in present-daymachines must necessarily have density well below the Greenwald limit andheating power well above the H-mode power threshold. Similarly, a plasmawith an ITER-like edge will necessarily have a cold, collisional core. This meansthat the integrated demonstration of reactor-like core and reactor-like edgecannot be made in present-day devices and must wait for an ITER-scaleexperiment. Detailed studies of density limiting phenomena in burning plasmaand their effects on plasma performance will be an important part of the ITERexperimental program.
Beta limit. The P limit is a key parameter for a fusion reactor and experimentson ITER should address it. The "neoclassical" magnetic islands with n=l,considered presently as a major P limiting factor for reactor-grade plasma, areexpected to have a rather long growth time, i.e., 10-30 s. Experiments aiming at
FDR-Plasma Performance Assessments Chapter Ill-Page 69

increasing the (J-limit by the electron cyclotron current drive (ECCD) stabilizationof the islands are planned on ITER. Poloidal magnetic field fluctuations(f ~ 500 Hz) associated with rotating islands can be used as an input signal for thefeedback ECCD control system.
Disruption phenomena. Detailed information on disruption characteristics inITER, including heat loads on divertor plates and first wall, "halo" currents ininternal structures, and generation and loss of runaway electrons, is ofimportance for the design of next-step machines and for optimizing ITERoperation strategy. The number of intentional disruptions for this program willbe limited, especially at full plasma parameters; therefore, disruption studiesshall accompany other programs, with diagnostics being ready to recordparameters of interest during disruption on a fast time scale.
Physics of high-power-flux radiative divertor. Reduction of the heat load on thedivertor plates to acceptable levels by radiation of intrinsic and deliberatelyintroduced impurities and efficient removal of helium ash will be an essentialpart the physics of burning plasma to be explored on ITER. The main issue is thecompatibility of the radiative divertor with high-confinement operation modeand low impurity level in the main plasma at the pulse lengths sufficient toapproach plasma-wall equilibrium. Divertor physics represents a complicatedcombination of plasma physics, atomic and molecular physics, surface physics,plasma-wall interactions and material science. It can not be represented bysimple scaling relations and requires 2-D modeling for interpretation ofexperimental data and projections to new conditions. Detailed measurements ofplasma and neutral-gas characteristics in ITER divertor as well as key wallparameters are essential in order to validate the divertor models which arerequired for optimizing ITER operation scenarios and extrapolation to thenext-step device.
Alpha particle confinement. The classical losses of the alpha-particles in ITERare expected to be low. Several candidates for the anomalous loss of the alpha-particles have been identified. The toroidicity-induced Alfven eigenmode (TAE)is considered to be the most important one. Calculations show that low-n TAEmodes observed in present-day experiments will be stable in ITER. However,modes with 10 s n s 50, can be unstable, and their effect on alpha particleconfinement is not yet known. Alpha-particle transport can also be affected bythe sawtooth crash and low frequency MHD modes, such as internal kinks,fishbones and kinetic ballooning modes. On the other hand, fast alpha particlescan stabilize sawteeth for a long period up to ~100 s on ITER. Experiments onITER should determine the importance of anomalous loss of the alpha-particlesin reactor-scale plasma.
Burn control. Although ignited operating points identified for ITER arethermally stable, fast variations in fusion power are possible because of a stronglink between plasma parameters and heating power. Hence, active stabilizationof the fusion power is required. Due to a coupling between divertor and coreplasma parameters, the simultaneous control of fusion power and divertor heatload poses a new complicated task. Experimental verification of burn control
FDR-Plasma Performance Assessments Chapter Ill-Page 70
schemes and development of a reliable long-pulse operation are the major tasksfor the HER BPP phase.
Steady-state and advanced operation scenarios. Attainment of steady-stateoperation with a relatively high fusion power, i.e., Q a 5, is a high-priority itemin the ITER experimental program. It is presently expected that requirements forsteady-state operation of ITER can be met by reversed (or weak) shear modes withedge and internal transport barriers. A high level of plasma profile control, i.e.,current and pressure profile control in addition to the burn control schemes, willbe necessary for such regimes. ITER will be equipped with non-inductivecurrent-drive techniques capable to provide up to ~3 MA of current, that isexpected to be sufficient for this program.
7.0 PLASMA MEASUREMENTS AND DIAGNOSTICS
In order to meet its operational and programmatic goals, ITER will require themeasurement of a wide range of parameters which characterize the plasma anddescribe the condition of the first wall and the high heat flux components. Therequired measurements will serve different purposes in the ITER operationalprogram. They divide logically into three principal areas: (la) those necessary formachine protection and basic plasma control; (lb) those which can potentially beused for advanced plasma control; and (2) additional measurements forevaluating the plasma performance and for understanding important physicalphenomena which may limit ITER performance. Measurements of someparameters are expected to contribute to all three roles, although therequirements on the measurements (accuracies, resolutions, etc.) may bedifferent, depending on the role. The first column of Tables 14-la, 14-lb, and 14-2lists required measurements for ITER, arranged according to their role in theITER program.
Techniques and instrumentation which can measure almost all of theparameters required for ITER have been developed over many years and are inroutine use on existing tokamaks. In some cases, for example JET and TFTR,there already is experience with radiation levels similar to those that will bepresent in ITER, although the pulse duration is much shorter. For mosttechniques, the physics basis is already adequate, although for a few techniquesthe new parameter range of ITER has required a re-examination of the physics.The practical challenges, however, are substantial, and in many cases significantdifficulties arise in the implementation on ITER. The second column inTables 14-la, 14-lb, and 14-2 lists candidate diagnostic techniques for measuringthe required parameters.
On this basis, an extensive diagnostic system is being designed for ITER. Thesystem includes examples of all the main diagnostics that are in routine use onexisting tokamaks: magnetics, neutron systems, optical/IR systems, bolometricsystems, spectroscopic systems, microwave systems, and plasma facing/operational systems. The magnetics consist of a series of loops and coilsmounted on the backplate inside the vacuum vessel in a conventional
FDR-Plasma Performance Assessments Chapter Ill-Page 71

arrangement. The proposed neutron system includes a radial and a verticalneutron camera, neutron flux monitors, a high resolution neutron spectrometerand an activation system. Two Thomson scattering systems and an equatorialplane interferometer are among the principal optical systems under design. Oneof the Thomson scattering systems is optimized for making measurements in thecore region while the other is optimized for the edge region. Bolometer arraysare being designed for the main plasma and divertor regions. The spectroscopicsystem includes an extensive array of spectrometers covering the X-ray to visiblerange. The light impurities and particularly the He ash in the plasma corecannot be measured by passive spectroscopy but can, in principle, be measured byactive (charge exchange recombination) spectroscopy, using an energetic neutralbeam. Studies have shown that the beam energy must be ~ 100 keV/amu. Sincethis is substantially different from the energy of the heating beam, a dedicatedneutral beam (power ~ 5 MW) is proposed. Microwave diagnostics include asystem for measuring the electron cyclotron emission, several reflectometers,and possibly a fast wave reflectometer system operating in the ion cyclotronfrequency region. The condition of the high heat flux components in the mainchamber and in the divertor will be monitored using IR/visible cameras andthermocouples. Langmuir probes will be used to measure the parameters of thedivertor plasma near the target plates. Special divertor cassettes are beingdesigned for the divertor diagnostic measurements and will incorporate thediagnostic sensors and optical and microwave transmission lines. Finally, manydiagnostics, such as pressure gauges, residual gas analyzers, hard x-ray monitorsand "halo" current monitors, will be installed to aid in the protection andoperation of the tokamak.
A recent assessment of the probable performance of the diagnostic system hasshown that it should be possible to measure satisfactorily most of the basicplasma parameters: for example the plasma position and shape, plasma current,electron density and temperature, low m/n MHD activity, impurity species,temperature of the first wall, neutron fluence, and the ratio of hydrogenic species( n r / n o , n n / n o ) in the edge. For some other parameters, it is not yet clearwhether the defined measurement requirements will be met. Examples in thiscategory are the plasma beta, the radiated power, total neutron flux and emissionprofile, locked modes, runaway electrons, ion temperature profile, and thetemperature of the divertor plates. For a few plasma parameters, theimplementation of the established measurement techniques appears to beparticularly problematic, and new approaches are being sought. Examples are themeasurement of the fueling ratio nD / nT in the plasma core, the profile of thesafety factor q, and the measurement of confined and escaping alpha particles.
The third column of Tables 14-la, 14-lb, and 14-2 shows results of theperformance assessment. The parameters are divided into three status categories:(a) those which appear to be reasonably well diagnosed and for which we expectto meet the target measurement requirements; (b) those and for which moreinformation is required before it is clear what the final outcome will be; and(c) those for which serious difficulties exist and it may not be possible to meet thetarget measurement requirements. Not surprisingly, most parameters are in themiddle category at this stage. As the ITER design progresses, engineeringsolutions to many of these issues will be found.
FDR-Plasma Performance Assessments Chapter Ill-Page 72

All four ITER Parties are contributing to a comprehensive design and R&Dprogram. A significant R&D effort has been underway for several years toinvestigate the effects of high levels of neutron and gamma radiation onpotential diagnostic materials, such as metals, ceramics, and optical materials.That program has provided a database and guidelines for use in detailed designof diagnostic systems. Another R&D effort, studying the effects of bombardmentof metal mirrors with high fluxes of neutral atoms, has identified Rh and Mo ascandidate materials for plasma-facing first mirrors in optical systems. Proper useof the results of these two R&D programs in detailed design of diagnostic systemsshould reduce some of the uncertainties in measurement performance. Finally,there are a few parameters for which viable measurement techniques for use onITER have not yet been demonstrated. A variety of new techniques orapplications are under study to address these shortcomings.
FDR-Plasma Performance Assessments Chapter Ill-Page 73

TABLE 14-laMeasurements for Machine Protection and Basic Control
Parameter
Plasma current, q(a), q(95%)
Plasma position and shape
Loop voltage
Beta
Radiated power (main plasma,X-point, and divertor)
Line-averaged electron density
Fusion power
Locked modes
m=2 MHD modes
irr/nrj in plasma coreImpurity and D,T influx (mainplasma)
Impurity and D,T influx (divertor)
Zeff (line averaged)
ELMs
H/L mode indicator
Runaway electrons
Surface temperature (first wall)Surface temperature (divertorplates)
Divertor detachment indicator(Jsafc ne* T e a t divertor plate)
Gas pressure (divertor & duct)Gas composition (divertor & duct)
Halo currentsToroidal magnetic field
In-vessel inspection
Candidate Diagnostics
Rogowski coils, magnetic probesPosition loops & coils, reflectometry (plasmaposition)
Magnetic flux loops
Diamagnetic loops
Bolometer arrays
Toroidal interferometry/polarimetry,LIDAR, visible continuumNeutron flux monitors
Magnetic flux loops, ECE, reflectometry,soft x-ray arrayMirnov loops, ECE, reflectometry, neutrons,soft x-ray arrayNPA, fast wave reflectometry
Visible spectrometry, VUV, x-rayspectrometry
Impurity monitors (divertor), highresolution H a spectroscopy (divertor)
Visible/IR Bremmsstrahlung
H a spectroscopy, ECE, reflectometry,magnetics, IR camera, Langmuir probe
H a spectroscopy, reflectometry(fluctuations)Tangential view x-ray monitor, ECE,synchrotron radiation
Visible & IR TV
IR cameras, thermocouples
Langmuir probes, tile shunts
Pressure gauges
RGAs
Magnetic coils on structures
Current shunts, Rogowski coilsViewing camera
AssessmentStatus
aa
abb
a
b
b
a
c
a
b
b
a
a
b
ab
b
aabab
FDR-Plasma Performance Assessments Chapter Ill-Page 74

TABLE 14-lbAdditional Measurements for Control of Specific High Performance Scenarios
Parameter
Neutron and a-particle sourceprofileHe density profile (core)
Plasma rotation (toroidal &poloidal)Current density profile (q-profile)Electron temperature profile (core)Electron density profile (core)
Ion temperature profile
Radiation power profile (core,X-point, divertor)Zeff profileHelium density (divertor)
Heat deposition profile (divertor)Ionization front position in divertor
Impurity density profiles
Neutral density between plasmaand wallng, Te in divertor plasma
Alpha-particle lossLow m/n MHD activity
SawteethNet divertor plate erosion
Long term neutron fluence
Candidate Diagnostics
2-D neutron camera
CXRS with DNB, visible Bremsstrahlung,fast wave reflectometryCXRS with diagnostic NB, x-ray crystalspectrometryMSE with heating NB, polarimetryECE, LIDARLIDAR, reflectometry, interferometry/polarimetryx-ray crystal spectrometry, neutronspectrometry, neutron flux, CXRSBolometer arrays
Visible continuum arrayImpurity monitors, laser induced fluorescence(LIF)IR cameraVisible spectrometry, bolometry,reflectometryCXRS, VUV spectrometry, x-ray crystalspectrometryH-alpha spectroscopy, pressure gauges
Visible/UV spectroscopy reflectometry, ECA,Thomson scatteringLost alpha detectors, IR TVMirnov loops, ECE, reflectometry, neutrons,soft x-ray arrayECE, reflectometry, neutrons, soft x-ray arrayImpurity monitoring, reflectometry, plasmaviewingActivation transfer system
AssessmentStatus
b
b
c
c
a
a
b
b
b
b
b
b
b
a
c
c
a
a
c
a
FDR-Plasma Performance Assessments Chapter Ill-Page 75

TABLE 14-2Additional Measurements for Performance Evaluation and Physics Studies
Parameter
Confined alpha-particles
TAE Modes, fishbones
T e profile (edge)
ne , T e profiles (X-point)
Tj in divertor
Plasma flow in divertor
nr /nD/nH (edge)
n x / n o / n j i (divertor)
Te fluctuations
ne fluctuations
Radial electric field and fieldfluctuationsEdge turbulenceMHD activity in plasma corePellet ablation
Candidate Diagnostics
Collective scattering, CXRS/NPA with DNBor pellets, neutrons via knock on tail effect,gamma spectrometry
Mirnov loops, reflectometry, ECE
Thomson scattering (edge)
Thomson scattering (X-point)
Spectroscopy
SpectroscopyNPA, Ha spectroscopy, fast wavereflectometry, Two-photon Ly-cc floures.Ha spectroscopy
ECE, soft x-ray array
Reflectometry, microwave scattering
CXRS with DNB
ReflectometryECE, soft x-ray array
Ha spectroscopy
AssessmentStatus
c
bb
b
c
ca
b
b
b
c
bbb
8.0 CONCLUSIONS
Most of the physics basis elements of the ITER plasma performance have beensuccessfully tested in present-day experiments. However, since fundamentalphysics considerations make an integrated similarity simulation of a fully ITER-like plasma (core and divertor) impossible in present tokamaks, projection ofITER performance must rely on extrapolations and modeling simulations.
These projections of the ITER plasma performance show—by a variety ofextrapolation and modeling approaches—that sustained ignition and adequateplasma power and helium exhaust can be obtained in ITER with operation in anELMy, sawtoothing H-mode. With the reference energy confinement timemodeling basis, these projections show that sustained ignition is possible for amoderately wide range of plasma densities and a wide range of fusion powers.For powers a ~1 GW, ITER has an energy confinement margin (tolerance for lossof confinement relative to the nominal modeling basis) of about 20% forachieving sustained ignition. For driven-burn operation assisted by 100 MW ofauxiliary power, the margin is even larger. ITER is capable of producing1-1.5 GW of fusion power in the full range of uncertainty in the energyconfinement. Time-dependent simulations demonstrate that all requirementsfor plasma operation (low divertor heat loads, helium pumping, H-mode powerthreshold, etc.) can be fulfilled and controlled simultaneously in a singleintegrated discharge scenario.
FDR-Plasma Performance Assessments Chapter Ill-Page 76

Divertor operation with acceptable power loading and efficient helium exhaustcan be obtained. Here calculations based upon experimentally-validated divertormodeling codes support the ITER design basis. They show that partially-attachedoperation can provide an operating point that combines high upstream density(3.5-4.0 x 10¹⁹ nr3), acceptable impurity concentration (e.g. 0.5% Ne) andacceptable divertor power load (5-10 MW/m2) on a vertical target divertor.Calculations of the erosion lifetimes of the plasma facing materials show that theresulting plasma-facing surface erosion rates and disruption tolerance areacceptable and lead to a choice of materials that optimize the respectiverequirements; graphite for the divertor plates, tungsten for the divertor sidewalls and baffles, and beryllium for first-wall armor. The codes also indicate thatthe neutral helium partial pressure in the divertor will be several times higherthan the minimum level needed to ensure adequate helium exhaust. Fuelinglevels are specified at levels adequate for density ramp-up and maintenance ofthe specified operating density.
Studies of heating and current drive and PF control capabilities show that theITER design has a sufficient flexibility to test presently-envisioned advancedoperation modes based on negative central shear profiles. If future experimentalstudies will demonstrate that these regimes have improved energy confinementand are stable at PN > 3-4, then ITER should be able to implement correspondinghigh-bootstrap-current-fraction, high beta operation with total plasma current inthe 12-15 MA range maintained by 100-150 MW of auxiliary power.
The ability of the ITER design to accommodate the effects of disruptions andrelated fast plasma dynamic effects has been assessed, and there has beensignificant progress in many critical areas of this aspect of the physics design,including collection and analysis of various disruption databases, modeling ofplasma disruption and runaway formation, and development of scenarios andmeans of fast plasma shutdown. A general concept for plasma control andmachine protection against the effects of plasma operation has also been defined.Finally, various other operation issues, including ripple loss of energeticparticles, analysis and specifications of heat loads on the plasma facingcomponents, optimization of ITER auxiliary heating systems and specification ofcoil alignment and error-field correction requirements have been defined.
An extensive diagnostic system is being designed for ITER. Assessment of theperformance of the diagnostic system has shown that it should be possible tomeasure satisfactorily most of the basic plasma parameters: for example theplasma position and shape, plasma current, electron density and temperature,low m/n MHD activity, impurity species, temperature of the first wall, neutronfluence, and the ratio of hydrogenic species (ny/no, nn/no) in the edge. For someother parameters, it is not yet clear whether the defined measurementrequirements will be met and the work is in progress to achieve this goal. Allfour ITER Parties are contributing to a comprehensive design and R&D program.
During the course of the CDA and EDA, ITER and the ITER design process haveplayed a crucial role in highlighting important reactor-relevant physics issuesand in providing a focus for the coordination of physics R&D studies in magneticfusion research. The key physics issues have been and are continuing to be
FDR-Plasma Performance Assessments Chapter Ill-Page 77

addressed in the ITER-related Physics R&D Programs of the HER Parties. Herecontinuation of similar effort is needed. In particular, future experimentalstudies on tokamaks with highly-baffled divertors, advanced fueling capabilities,controlled injection of radiating impurity and effective divertor pumpingsystems are to validate the related elements of the ITER plasma operationconcept. Experiments with EC or other localized RF systems to suppressneoclassical modes and/or control sawteeth will also be needed to validatepresent expectations for reliable ITER plasma operation at the beta-values neededfor full-power operation. Finally, further R&D efforts to better understandrunaway production, confinement and losses in the knock-on avalanchedominated regime are also needed.
In addition to these R&D efforts that support the reference inductively-sustainedmode, it is also essential that non-inductively sustained high-bootstrap-current-fraction, high-beta operation regimes be studied in present experiments. This isrequired so that the various physics considerations involved can be betterunderstood, and so that reliable models for plasma confinement and plasmastability, allowing these regimes to be extrapolated to ITER, can be obtained.
FDR-Plasma Performance Assessments Chapter Ill-Page 78

REFERENCES
[DDD97a] Detail Design Description Document. WBS 1.9 (Physics), 1997; andreferences therein.
[IDR95] ITER Interim Design Report. 1995; and references therein.
[DDR96] Technical Basis for the ITER Detailed Design Report. Cost Reviewand Safety Analysis: Chapter V (Physics), 1996; and referencestherein.
[IPB98] ITER Physics Basis, to appear in Nuclear Fusion (1998); referencestherein.
[DDD97b] Detail Design Description Document. WBS 4.7 (Plasma Control),1997; and references therein.
FDR-Plasma Performance Assessments Chapter 111-Page 79

INTERNATIONAL THERMONUCLEAR EXPERIMENTAL REACTOR
TECHNICAL BASISFOR THE
ITER FINAL DESIGN REPORT, COSTREVIEW AND SAFETY ANALYSIS
(FDR)
Chapter IV
FDR SAFETY ASSESSMENT(FDR-SAFETY)
13 July 1998

FDR-SAFETY
TABLE OF CONTENTS
1 INTRODUCTION AND CONCLUSIONS 11.1 Introduction 11.2 ITER role in demonstrating safety potential of fusion 21.3 Conservative safety limits 31.4 Safety design integration 31.5 General safety characteristics of ITER 51.5.1 ITER fusion power is bounded and easy to terminate 51.5.2 Multiplicity of safety barriers 51.5.3 Control of decay heat 61.5.4 Low level of hazard inventory 61.5.5 Safety assurance by design 61.5.6 Conservative approach to ITER operations 81.6 ITER safety assessment 91.6.1 Radioactive and energy source terms 91.6.2 Public safety during accidents 101.6.3 Environmental attractiveness 111.6.4 Operating personnel safety 121.7 Conclusions 142 ENVIRONMENTAL IMPACTS FROM NORMAL OPERATION ....152.1 Release control 152.2 Summary of releases 162.3 Tritium 172.4 Activation products 172.4.1 Activated corrosion products from coolants 182.4.2 Activated dust 192.4.3 Activated gases 192.5 Non-nuclear effluents and emissions 202.5.1 Beryllium 202.5.2 Thermal 202.5.3 Cryogens 202.6 Waste management and decommissioning 212.6.1 Waste management strategy 212.6.2 Decommissioning strategy 222.6.3 Waste characteristics and classification 232.6.4 Overview of waste streams 263 IMPACT FROM ACCIDENTS 293.1 Safety analysis approach 293.1.1 Categorization of event sequences 293.1.2 Acceptance criteria 303.1.3 Identification of reference events 313.2 Summary of analysis of reference events 363.2.1 Plasma events 363.2.2 Loss of power 393.2.3 In-vessel coolant leak 403.2.4 Ex-vessel coolant leakage 42

3.2.5 Heat exchanger tube leakage 433.2.6 Loss of flow 443.2.7 Loss of vacuum 443.2.8 Maintenance 453.2.9 Tritium process pipe leakage .453.2.10 Magnets 463.2.11 Cryostat , 493.2.12 Hot cell 493.3 Seismic safety assessment 503.4 Ultimate safety margins 514 OCCUPATIONAL SAFETY 554.1 Radiation protection program (RPP) 554.2 Radiation hazard information and zoning 574.3 Radiation protection assessment 584.4 ALARA implementation 584.5 Conventional occupational safety 624.5.1 Beryllium hazard 624.5.2 Electromagnetic and radio frequency field exposures 634.5.3 Cryogenic fluid and inert gas hazard .644.5.4 High voltage hazard 644.5.5 Other industrial hazard 645 REFERENCES 65

1 INTRODUCTION AND CONCLUSIONS
1.1 Introduction
The ITER Project includes a vigorous design and assessment activity to ensurethe safety and environmental attractiveness of ITER. It also ensures that ITERcan be sited in any of the sponsoring Parties with a minimum of site-specificredesign. In this activity, detailed safety-related design requirements have beenestablished based on internationally recognized safety criteria and limits, andongoing assessments have been made to evaluate the success in implementationof these in the facility, system, and component designs. More information ondesign is found in the ITER Plant Design Description (IPDD).
A comprehensive safety and environmental assessment has recently beencompleted for the ITER Final Design. This assessment has shown that the ITERdesign has successfully met all of the safety-related requirements that wereestablished. This assessment further demonstrates that the safety issuesinvolved in construction and operation of ITER are adequately known andcharacterized, and that design solutions are being implemented to successfullydeal with these issues.
Component and system R&D projects have yet to be conducted that containsafety-related investigations; however, it is concluded that the design could meetthe specific regulatory requirements of any of the potential host countries withonly modifications required to accommodate the characteristics of the specific sitechosen. This conclusion is based on the generally broad international acceptanceof the ITER safety-related design requirements and safety characteristics that havebeen established and implemented in the design. It is further concluded that thefacility could be constructed and operated so as to ensure protection of the healthand safety of the occupational work force and the general public, and withminimal environmental impacts.
This chapter of the Final Design Report presents the most significantinformation from the safety assessment to illustrate the overall safety andenvironmental issues and features of the Final Design:
Section 1.0 is a general introduction to the chapter and summarizes itsmain conclusions;
Section 2.0 discusses public safety including analysis of reference events;
Section 3.0 discusses environmental impacts during normal operation,including waste management and decommissioning; and
Section 4.0 discusses operating personnel safety.
FDR-ITER Safety Assessment Chapter IV-Page 1

1.2 ITER role in demonstrating safety potential of fusion
Design, construction, and operation of ITER is a necessary step toward the worldwide development of commercial fusion power. There are a number of featuresof fusion that make it an attractive source of energy for the future. The primaryfeatures are that the fuel for fusion reactors is essentially inexhaustible and can beextracted at a minimal cost from ocean water, and fusion has intrinsicallypositive safety and environmental characteristics. In particular, hazardous andradioactive source terms and effluents are small and there are no greenhousegases (CO2) or sulfur emissions from the fusion process. ITER has an importantrole in demonstrating the safety potential of fusion by validating theseintrinsically positive characteristics.
The design of ITER is such that the hazards addressed are similar to those for afuture fusion power reactor; hence, many of the safety design issues addressed byITER are reactor relevant. Safe operation of ITER itself will help demonstratefusion's safety and environmental potential in areas such as personnel exposure,effluent control, and machine control. Data gathered though the progressivestages of operation will provide validation of safety data and analyses. Inaddition, operational data and experience from ITER will provide information toconfirm the safety design of future fusion facilities.
Although the size of ITER is similar to (or larger than) what would be expectedfor commercial reactors, ITER is a research facility, as opposed to a commercialpower demonstration facility. The experimental nature of ITER requires a designand safety approach that permits flexible operation, facilitates experimentation,and can accommodate changes. Changes, for example, could include testing ofalternative divertor designs, different plasma facing materials, tritium breedingblankets, etc. This need has driven the safety design to provide a robust safetyenvelope while minimizing the safety role and influence of experimentalcomponents and equipment.
Material development activities are underway in parallel with the ITER projectthat will provide the needed low activation materials for commercial fusion.The development of low-activation materials is not advanced enough for use inITER, thus all of fusion's potential safety advantages cannot be fully realized inthe ITER design. In particular, near-plasma components will typically require theuse of stainless steel and copper alloys. This leads to production of activationproducts with higher decay power and longer half-lives than would be desirablefor use in a commercial fusion power plant. Even so, decay heat removal issolved by design in FTER through the use of normal facility cooling systems andpassive heat transfer design without the requirement for emergency coolingsystems, even for extremely unlikely events. Also, radioactive wastemanagement and decommissioning issues involved with the ITER materialsselection can be resolved with only minimal long term storage (> 100 years)required for near plasma components.
FDR-ITER Safety Assessment Chapter IV-Page 2

1.3 Conservative safety limits
A general safety principle is that the ITER design, construction, operation anddecommissioning shall meet technology-independent radiation dose andradioactivity release limits for the public and site personnel. Also, a safety goal ofthe ITER Project is to provide a sufficiently safe facility so that for internalaccident initiators there would be reasonable technical justification for notrequiring an emergency plan involving evacuation of the nearby population(non-evacuation goal). In addition, ITER project policy is to provide aconservative level of protection such that ITER can be sited by any of the FourParties with minimum modification to accommodate site specific requirements.And finally, a general project safety objective is that the ITER site personnel andthe public shall be protected such that the risks to which they are exposed as aresult of ITER operation shall be maintained as low as reasonably achievable(ALARA).
Conservative safety limits have been established for the ITER design.Conservative release limits for tritium, activation products, and beryllium arebased on internationally accepted limits such as the International Basic SafetyStandards and on best performance of similar facilities.
Prior to site selection, a set of radiation criteria has been adopted for the design.These criteria and their derivation are described in the General Safety andEnvironmental Design Criteria (GSEDC) [GSE97]. In addition to meeting projectlimits, the ALARA principle is recommended by international nuclear safetyexperts and incorporated in national regulations of many countries. TheInternational Basic Safety Standards (IBSS) [IBS96] explains ALARA as theobjective to keep all exposures to values such that further expenditures fordesign, construction and operation would not be warranted by the correspondingreduction in radiation exposure. Application of the ALARA principle will leadto lower releases and worker exposures as the ITER design progresses and duringITER operation as a result of added experience.
1.4 Safety design integration
A high level of safety is integrated into the ITER design. Facility safety is a keyelement of the FTER design process. Safety-related requirements have beenintegrated into the overall design requirements for the facility, systems andcomponents. These design requirements include limiting of radioactive andtoxic releases as a result of normal operation, accidents and external events (e.g.,seismic events). The design incorporates the well-established concepts of Defensein Depth and multiple lines of defense to attain high confidence in the reliabilityof critical safety features of the facility and ensure protection against postulatedaccidents. The specific safety functions for meeting public safety in Table 1.4-1have been integrated into the design by taking advantage of the normal systemsneeded for operation and the inherent safety features of fusion, with a minimumof standby engineered safety features required.
FDR-ITER Safety Assessment Chapter IV-Page 3

TABLE 1.4-1Safety Functions for Public Safety and Their Implementation
Safety Function
Limit radioactive inventories
Provide confinement barriers
Ensure heat removal
Control hydrogen inventories andchemical reactions
Control effects of magnetic energy
Control the effects of coolantenergy
Monitoring
Support services to systemsproviding safety functions
Implementation
- isolation to separate inventories- monitoring and procedures for periodic in-vessel inventory
reduction- first barrier (e.g. vacuum vessel plus extensions)- second barrier (e.g. cryostat plus extensions)- exhaust drying, atmosphere detritiation, filtration, where
required- ventilation + stack, where required- isolation to limit releases, where required- heat transfer and heat sink- design for natural circulation- prevent hydrogen/air mixtures- limit inventory of chemically reactive materials- ensure heat removal to reduce reaction rates- provide off-normal fusion power shutdown- hydrogen recombination or removal- structural support/resistance to deformations- monitoring- fast discharge of coils- pressure suppression- confinement- overpressure relief- of safety functions- of releases to the environment- of radiation fields on-site- electrical power- instrument air- service water
These safety functions are being implemented in breadth and depth in the ITER.Results obtained during the safety analysis were used to refine the design toensure compliance with release limits and other safety-related requirements. Anassessment of the implementation of the safety-related design requirements andfunctions has been made for major ITER systems. This assessment has shownthat the safety design requirements established in the GSEDC and General DesignRequirements Document (GDRD) [GDR97] have been met.
FDR-UER Safety Assessment Chapter IV-Page 4

1.5 General safety characteristics of ITER
The following are some of the key favorable safety characteristics of ITER thathave formed an important part of the overall ITER safety strategy [Shi96] [Saj96].
1.5.1 ITER fusion power is bounded and easy to terminate
The total amount of fuel in the ITER plasma is only a few tenths of a gram andthe plasma cannot continue to burn for longer than about ten seconds withoutadditional fueling. During normal operation, fusion power isfeedback-controlled by changing the fueling rate of tritium and deuterium gasmixture into the plasma. Therefore, fusion power is easily terminated bystopping fueling or by injecting impurities. Under any failure conditions withany primary coolant or air leakage into the plasma vessel, the fusion reactionsare physically impossible. In the event of a loss of plasma control, the plasmawill be either suddenly lost (called disruption) or the fusion power may increase.The basic dynamic behavior of fusion power excursions is characterized byparticle and energy confinement times of a few seconds. Even withoutdepending on a fusion power shutdown system, the plasma will either reach anew steady state power level or terminate automatically in overpower transientsby reaching the plasma confinement limits or with ingress of impurities fromthe plasma facing components.
1.5.2 Multiplicity of safety barriers
ITER has an intrinsic multiplicity of barriers for control of hazardous materials.Most of the activation products are in solid metallic materials which are difficultor impossible to mobilize, and most of the tritium is either implanted into solidplasma-facing materials or in relatively conventional tritium plant components.Also there are intrinsic confinement barriers available to handle the residualmobilizable inventories such as tokamak dust (plasma-induced erosion productsfrom the plasma-facing materials), co-deposited tritium on plasma-facingmaterials, and activated corrosion products. Most notably, an ultra high vacuumvessel is required for plasma operation. The vacuum vessel (1st confinement) islocated inside a cryostat (2nd confinement), whose operation is required to keepsuperconducting magnets cool. In case of a cooling water leakage into thevacuum vessel, the accidental overpressure is relieved by a pressure suppressionsystem. These intrinsic confinement barriers, the vacuum vessel and thecryostat, are supplemented with additional confinement features tailored to thenature of hazards in various compartments. For example, the pumps and heatexchangers of the primary heat transfer systems are located in pressure-retainingvaults, which serve as a part of the 2nd confinement. And the cryostat is housedin a tokamak building, some rooms of which supplement the confinementbarriers with filter and dryer systems.
FDR-ITER Safety Assessment Chapter IV-Page 5

1.5.3 Control of decay heat
Since high temperatures in an accident could lead to release of radioactiveinventories or unintended chemical reactions, accident temperatures are limitedby decay heat removal. The multiple coolant systems are available to removefusion power during plasma operation, providing multiple methods to removedecay heat, cooling systems for the plasma-facing components and coolingsystems for the plasma chamber (vacuum vessel). The latter is designed to workin a natural circulation mode. With many possible cooling systems, it is veryunlikely that decay heat will become a major energy source to aggravatepostulated accidents.
The decay heat in fusion is not specific to the fusion reaction, but dependsstrongly on material selection and structural design and operation. The currentbest estimate shutdown decay heat for the shielding blanket design is about40 MW, which drops down to 2 MW in a day after shutdown. For the breedingblanket design the estimates are 16 MW and 1.2 MW, respectively. The decayheat density is very small and decay heat driven temperatures stay below 500°Cso that a "melt-through" accident is physically impossible. No emergencycooling system is required.
1.5.4 Low level of hazard inventory
The ITER radiological inventory and the mobilizable inventory are modest inthe sense that the confinement barriers need provide only about one order ofmagnitude reduction for tritium and mobilizable metallic dust in order to meetthe Project non-evacuation goal.
1.5.5 Safety assurance by design
The basic guiding principle for ITER design was first to select conservative designparameters and design a robust machine. This prudent approach has beenchosen because of the experimental nature of the ITER facility as well as frompublic safety considerations. Safety analyses have shown that this conservativedesign approach is very effective in mitigating accidents. Some examples areprovided below.
(1) Design Margins in High Heat Flux Components
ITER is designed with a nominal fusion power of 1.5 GW, with 80% of the energyreleased by neutrons mainly to the volumetric heating of the blanket and 20% byalpha particles to the first wall and the divertor. The partition for power loss tothe blanket and divertor is uncertain for different plasma configurations. Inview of this, the divertor is designed to be capable of exhausting up to ~ 300 MW,i.e., 100% of the alpha particle heating power. The same amount of power isassumed at the first wall, resulting in double counting this portion of power inthe design of heat removal. The divertor has a total plasma exposed surface of
FDR-ITER Safety Assessment Chapter IV-Page 6

~ 300 m2 exposed to the plasma, with 130 m2 of it comprising a vertical targetdesigned against a heat load of as high as 5 MW/m2. For short transients, a 25 m2
dump plate is designed to withstand a peak heat flux of 20 MW/m2. In the worstcase disruption from 120% of nominal fusion power level, total thermal energydissipation of 1.6 GJ is anticipated. Since the energy partition forconduction/radiation is uncertain, up to 100% of the energy is assumed to beconducted to the divertor and also to surfaces of the first wall.
(2) Structural Design of Vacuum Vessel
The vacuum vessel structure is designed for static loads, seismic loads, andtransient loads that could be induced from plasma operation. Largeelectromagnetic loads associated with the worst-case plasma verticaldisplacement event (VDE) may result from loss of the plasma vertical control.This VDE drives currents in the in-vessel structure that induce large mechanicalloading, i.e., ~ 150 MN of vertical force, which is a mutually attractive loadbetween the structure and poloidal magnets. This load is comparable to thegravity load of the vacuum vessel and in-vessel components, with a total weightof ~ 19000 ton (190 MN). Since there is a possibility that a VDE could be inducedby earthquakes, a combination of seismic load and VDE load are incorporated inthe design, while considering the probability of coincidence with different levelsof seismicity [Gor96]. Also, a vacuum vessel pressure suppression system limitsthe accidental overpressure resulting from any conceivable failure of coolingchannels to below 0.5 MPa.
(3) Robust Design of Magnets
The primary function of the magnet system is to provide the toroidal andpoloidal fields necessary to initiate, contain and control the plasma during thevarious phases of machine operation. This function is not safety related.However, the magnets use large currents to produce intense magnetic fields andstore large amounts of electromagnetic energy. Feeders of the magnet systemalso form a part of the confinement function of the cryostat.
In the event of a fast discharge of coil currents due to a quench, much of thehelium could be expelled from the coils. A system of relief valves and a relieftank will capture this helium. Quench detection is provided by a primary and abackup system for all coils. The magnetic energy will dump to discharge resistorsinstead of the quenched coil and the damage of the quenched coil will notsignificantly affect either confinement boundaries, even in an extreme case.Coils have multiple layers of insulation to prevent electrical shorts, and the coilpower supplies have grounding resistors to limit current if ground insulationshould fail. However, a double insulation fault could produce an arc causinglocal damage.
The toroidal field (TF) coil supports are linked with the first confinementboundary, i.e., the vacuum vessel, and other coils, such as the poloidal field (PF)coils and the central solenoid (CS) coils. These supporting structures provide ahigh degree of redundancy. For example, the vacuum vessel supports are
FDR-ITER Safety Assessment Chapter IV-Page 7

attached to each of the TF rigid coil cases. The vacuum vessel supports includeflexible elements to allow relative radial thermal movements between thevacuum vessel and TF coils. Preliminary structural analysis indicates that thereis no risk of gross structural failure in the event of: (1) CS and PF coilover-currents causing exceptional CS and PF forces; (2) exceptional PF coilcurrents which could cause off-normal, out-of-plane forces on the TF coils; (3)loss of symmetry in TF coil currents due to a coil short; and (4) TF coil case crackfrom initial defect [Mit96].
1.5.6 Conservative approach to ITER operations
ITER planning includes a conservative approach to operation at full facilitycapability to ensure that the facility components and systems meet their designrequirements and that facility construction and assembly has been accomplishedas intended. A vital part of this conservative approach is the validation ofassumptions and calculations made in the ITER safety analysis performed as partof the regulatory process. An ITER Construction/Commissioning Schedule,Operation and Decommissioning Plan (CCODP) has been initiated that providesthe planning details of this approach to facility operation. A summary of theCCODP is presented in Chapter VI of this Final Design Report. Specifically, theITER commissioning plan includes:
1) Individual Subsystem Tests both with and without loads;
2) Integrated Initial Commissioning Tests both with and withoutloads. These tests will include: vacuum and pressure tests at roomtemperature; baking tests; cooldown of the magnets to cryogenictemperature; toroidal field excitation; pulse operation withoutplasma; and required regulatory tests, including pressure, leak, andinterlock tests;
3) Non-Nuclear Commissioning with Hydrogen Discharges during thefirst and second year of operation;
4) Nuclear Commissioning with D and DT Discharges. Thiscommissioning will include: required regulatory tests; individualsub-system tests (e.g., tritium system testing) both with and withoutloads; and integrated facility tests without plasma. Initial plasmaoperation will be with deuterium plasmas. Initial tritium plasmaswill be with small quantities of tritium. The fraction of tritium inthe plasma will gradually be increased in subsequent operation;
5) Enhanced Performance Phase (EPP) with breeding blanketoperation. A detailed operational plan for the EPP has not beendeveloped at this time as it will depend upon the plasmaperformance and operating experience from the Basic PerformancePhase; however a systematic commissioning plan will be developedfor the EPP that will include performance of required regulatory andsafety testing.
FDR-1TER Safety Assessment Chapter IV-Page 8

1.6 ITER safety assessment
The ITER design ensures protection of the public. Operation of ITER will resultin no significant risk to the general public. Indeed, the primary focus of the ITERsafety-related design activities has been to ensure the protection of the generalpublic from exposure to radioactive or hazardous substances from postulatedaccidents. Furthermore, the ITER project goal of showing no technicaljustification for off-site evacuating planning is met.
1.6.1 Radioactive and energy source terms
D-T burning fusion reactors such as ITER contain radioactive and hazardousmaterial inventories and energy sources that must be analyzed as part of theoverall facility safety assessment. These inventories and energy sources include:
• Radioactive materials (tritium fuel, neutron activated products instructures and in-vessel dust, activated corrosion products in coolantwater);
• Potentially hazardous industrial materials (beryllium, hydrogen,cryogenic fluids, etc);
• Stored energy sources (plasma, electrical energy, magnet energy, decayheat, thermal-hydraulic energy, and chemical energy).
The total site inventory of tritium is limited to 4 kg, including the long-termstorage capability of 1 kg. The tritium inventory is highly segmented such that areasonably small fraction is available for mobilization and release during anyspecific accident. Multiple confinement barriers and tritium cleanup systems areprovided to mitigate the consequences of any tritium release. The plasma facingcomponents are beryllium, carbon, and tungsten. Beryllium and carbon erodedby plasma-wall interaction may be co-deposited in layers along with tritium. Inaddition, all materials are eroded during operation, forming dust. The tritiuminventories co-deposited with carbon and beryllium and the inventory in loosedust could be mobilized in the event of steam or air ingress.
The large majority of the activation products are tightly bound in solid metallicstructures and are not mobilizable during any credible accident scenario. ITERenergy sources are controlled such that activation product mobilization isgenerally limited to erosion (dust) and corrosion of structural materials. Facilitydesign features and administrative limits are provided to control release ofactivation products during normal operation and accidents to within establishedlimits.
A key factor in controlling mobilization of radioactivity is to ensure that thereactor energy sources do not lead to unacceptably high temperatures. Forexample, steam leaked inside the plasma chamber can chemically react withberyllium if the beryllium temperature is high, potentially generating hydrogen.
FDR-ITER Safety Assessment Chapter IV-Page 9

Such a situation is avoided by controlling the temperatures of the plasma-facingwall. The plasma will automatically passively terminate before the berylliumtemperature reaches those required for a self-sustained chemical reaction. Activefusion power shutdown systems are provided to further minimize the berylliumtemperature and the hydrogen generation.
The ultimate performance of confinement barriers that needs to be assured inaccidents to meet the non-evacuation goal will be just one order of magnitudereduction or decontamination factor (DF) for tritium and mobilizable metallicdust for ITER, even in a hypothetical situation of mobilizing 100% of vulnerableinventory.
1.6.2 Public safety during accidents
To assess any potential public radiation exposures and the effectiveness ofimplementation of the safety requirements and functions in the ITER design, acomprehensive analysis of twenty eight different reference events (along withmultiple sequence variations) has been performed using state of the art safetyanalysis computer programs. Together, these provide an envelope for allpostulated initiating events and event sequences. Event families consideredinclude plasma events, loss of electric power, coolant leakage inside the vacuumvessel, coolant flow decrease, coolant leakage outside the vacuum vessel, loss ofvacuum, accidents during maintenance, accidents in magnets, accident in thetritium system, etc.
In addition, ITER safety margins were assessed by analyses of hypothetical eventsequences, which are accidents where additional failures are postulated in theanalysis leading to typical frequencies that would be less than 10"6/a. Analysisshows that the ITER design provides for protection of the public even for thesehypothetical situations, and safety functions degrade gradually. Safety marginsare maintained for these hypothetical events because of:
• Conservative structural design of the facility;
• No catastrophic structural failures from internally generated forces(e.g., magnetic);
• Inherent plasma termination processes;
• Multiple active and passive heat removal systems and processes;
• Long time scales for component heat-up following events;
• Gross structural melting does not occur even if all cooling systems fail;
• Multiple layers and lines of defense to implement radioactiveconfinement;
• Design is tolerant of mitigation system failures.
FDR-ITER Safety Assessment Chapter IV-Page 10

A safety goal established in GSEDC [GSE97] is that, combined with the inherentlyfavorable safety characteristics and appropriate safety approaches, it should bepossible by safety analysis to show that for internal accident initiators, therewould be reasonable technical justification for not requiring an emergency planinvolving evacuation of the nearby population. This goal has been met usingthe international guidance of 50 mSv early dose averted [IBS96] [ICR40].
1.6.3 Environmental attractiveness
The ITER design incorporates many features to ensure that radioactive releasesduring normal operation will be low. A conservative set of limits for effluentsand emissions during normal operation was established in the GDRD andGSEDC documents. These limits were established in accordance withinternationally accepted criteria and the principles of ALARA. The sources ofradioactive and hazardous effluents and their release pathways were identifiedand estimated by comparison with facility releases from similar technologies.Preliminary estimates show that these releases are within established ITERlimits and provisions are identified in the design for added control, if operationalresults show them to be necessary.
The ITER design incorporates features to reduce effluents during operation, suchas water detritiation systems and active area ventilation systems with filters toreduce particulate levels and dryers to reduce tritium levels. Potential sources ofrelease have been identified by a systematic review of all systems. The majorsources of releases are from operations in the hot cell and outgassing during andafter maintenance operations and leakage across heat exchangers. Thepreliminary conservative estimation indicates that the ALARA principle is wellintegrated into the design, i.e., releases are less than the restrictive ITER projectdesign guideline for releases during normal operation including maintenance.
An analysis of ITER radioactive waste stream volumes and masses along withdetailed characterization of these wastes has been performed. Thecharacterization includes the specific isotopes, inventories, contact dose rates,contamination levels, and decay heat as functions of time and ITER component.Most operational wastes are neutron activated plasma facing components or lowlevel wastes. The facility includes provisions for initial processing and packagingof wastes in the Hot Cell and short-term storage in the Radioactive WasteBuilding. Long-term storage and ultimate disposal of radioactive wastes areassumed to be the responsibility of a waste management organization within thehost country and would be accomplished in accordance with the specificregulations of the host country.
Well-established structural materials such as a stainless steel are used in thedesign of ITER; however, the waste streams may be not representative for afuture commercial fusion power reactor. The FTER test modules will be used todevelop more environmentally benign materials such as ferritic/martensiticsteels and vanadium alloys, which have much better potential for waste hazardminimization and recycle. The major active wastes are from structural materialsof the divertor and the blanket, which must be replaced if damaged. These
FDR-ITER Safety Assessment Chapter IV-Page 11

components are modularized to allow only damaged modules to be replaced, ifnecessary. The higher activity plasma-facing components, that are moresusceptible to erosioa are designed to be replaceable to implement waste volumeminimization.
A possible preliminary scenario for ITER decommissioning has been developedto show feasibility. In this scenario, decommissioning would be accomplished ina phased approach. Low activation components could be disassembled andremoved shortly after facility shutdown. Higher activation components, e.g., thevacuum vessel, would be allowed to decay in place until removal is feasibleusing a combination of hands on and remote disassembly. This could requiredecay times of several tens of years. A previous study for commercial fusionreactors indicates that after about a hundred years, radiotoxicity indices (relatingto ingestion and inhalation) fall to levels comparable with the ashes fromcoal-fired power plants for the total activated materials from a fusion reactorwith the same total electrical power generated [Rae95]. Thus, although thematerials in ITER are not optimized for low activation, the waste managementadvantages of fusion of having little waste requiring geological storage is stillapparent for ITER.
1.6.4 Operating personnel safety
ITER is designed to provide protection for personnel. This is established andconfirmed by assessing ITER on occupational safety issues. The assessment isbased on establishing conservative exposure limits, development of an ITERoccupational safety program, and integrating design features (such as shielding,remote handling, water detritiation and coolant water chemistry control) to limithazards to personnel.
The hazards to which ITER operations personnel will be exposed have beenidentified and internationally recognized limits and practices have beenestablished to ensure worker safety. The principal hazards are direct radiation,radioactive contamination, beryllium dust, magnetic and RF fields, cryogenicliquids, inert gases, high voltages, chemical spills, rotating equipment, and liftingequipment.
A preliminary radiation protection program has been proposed for ITERconsistent with the recommendations of the ICRP [ICR91] and IAEA [IBS96]. Thisradiation protection program will be implemented throughout the life cycle ofITER to ensure that appropriate measures are taken to protect the ITER workforce from radiation exposure. The objectives of the radiation protectionprogram are to:
• Prevent occupational doses over legal limits;
• Maintain doses As Low As Reasonably Achievable (ALARA);
• Prevent acute unplanned exposures;
FDR-ITER Safety Assessment Chapter IV-Page 12

• Minimize spread of contamination;
• Maintain public exposures ALARA;
• Minimize releases of radioactivity to the environment.
As part of this program, radiation levels in the facility are estimated. Thisenables the establishment of radiation exposure and contamination controlzones and the development of access control procedures. A proposedclassification of workers, consistent with the access control and zoning schemes isalso developed. These worker classes are based on the level of occupationalradiological exposure anticipated for the various personnel types. Table 1.6-1shows the classes of workers for ITER and their assumed regulatory annual doselimits. As in current nuclear facilities, more restrictive operational limits willlikely be implemented to ensure regulatory limits are not exceeded.
TABLE 1.6-1Radiation Worker Classification
Class
RW-IRW-IINRW
Name
Radiation Worker Class IRadiation Worker Class IINon-Radiation Worker (administration,scientific staff, visitors, etc.)
Whole BodyAnnual Dose Limit
20mSv6mSvlmSv
These annual limits are based on ICRP/IAEA recommendations for regulatorylimits. Recognizing that a facility should be designed for much reducedexposures, an ALARA guideline of 2 mSv/ shift maximum individual exposurehas been established. Redesign of operational tasks or special authorization isrequired if it is estimated that a radiation worker would exceed one tenth of theannual limit in a single shift's work. As a guideline, the design should notrequire workers to exceed this exposure level during regular activities.
Furthermore, although it is considered premature to establish an annualcollective dose limit for ITER, systems that require more than 30 person-mSv forannual activities are to be analyzed for dose reduction. Also, recurring tasks thatare less frequent than once per year are also analyzed for dose reduction, if theyrequire more than 30 person-mSv collective dose.
Limits for exposure to electromagnetic fields and beryllium have beenestablished after reviewing various national limits among the ITER parties andselecting conservative values that would be acceptable at any of the potential hostcountries. It was concluded that the normal industrial regulations of the hostcountry would provide an adequate basis for worker protection for the morecommonly encountered industrial hazards.
FDR-ITER Safety Assessment Chapter IV-Page 13

1.7 Conclusions
Fusion has attractive inherent safety and environmental characteristics that havebeen used advantageously in the design of ITER. ITER has an important role indemonstrating that these characteristics are real and can be relied upon infulfilling the safety potential of fusion. Key safety characteristics of ITER are:
• The fusion reaction is self-limiting and bounded by the plasma physicscharacteristics. Off-normal events inside the tokamak willspontaneously terminate the fusion reaction;
• Fusion power density and radioactive decay heat densities aremoderate. Therefore structural melting of the plasma chamber isphysically impossible and fast acting emergency cooling systems are notrequired;
• The ultimate performance of confinement barriers that needs to beensured in accidents will be about one order of magnitude reductionfor tritium and mobilizable metallic dust to meet the ITERnon-evacuation goal;
• ITER design can reduce effluents and emissions to levels as low asreasonably achievable (ALARA). Higher activated wastes are limited tothe plasma-facing components.
It is recognized that ITER component and system R&D projects have yet to becompleted that contain significant safety-related investigations; however, it isconcluded that the design could meet the safety-related requirements of any ofthe potential host countries with only minimal modifications required toaccommodate the characteristics of the specific site chosen. This conclusion isbased on the comprehensive safety assessment recently performed by the Project,showing that there would be no significant risk to the public from accidentalreleases of radioactivity resulting from operation of ITER.
FDR-ITER Safety Assessment Chapter IV-Page 14

2 ENVIRONMENTAL IMPACTS FROM NORMALOPERATION
2.1 Release control
The ITER design incorporates many features to ensure that environmentalimpacts during normal operation will be low. The hazards are known and thecontrol technologies are well established. According to analyses performed forthe Final Design, the facility can be operated to stay below the conservative safetyand environmental limits that have been established for ITER. Furtherapplication of the process to implement the ALARA principle is expected tomaintain the estimated normal releases at this low level.
This section discusses releases that may be expected during normal operation.The primary materials of concern are tritium, activated materials, and beryllium.In addition, the facility will produce very limited direct radiation and will rejectthermal energy. Normal operations include operation of all facility systemsrequired to produce and control the plasma, as well as maintenance, hot celloperation, and waste management operations.
For ITER to be site-able by any of the Four Parties with a minimum of site-specificchanges, its design, construction, operation, and decommissioning must meetlimits set by the International Commission on Radiological Protection (ICRP)and the International Atomic Energy Agency (IAEA), as well as prospective HostCountries. For operational releases, off-site dose criteria vary by country from 0.1to 5 mSv/a. The ITER Project has chosen to use 0.1 mSv/a as a conservativedesign limit [IDR95]. Release limits were established to guide the design and areset to meet the stringent dose limit with additional reductions to implementALARA.
The FTER beryllium release limits for public protection are based on reviews ofexisting beryllium regulatory limits, official investigations and otherpublications. A restrictive limit of 10 g (Be)/day has been used by the ITERProject as a conservative design limit.
In addition to meeting prescribed limits, the ALARA principle is recommendedby international nuclear safety experts and incorporated in national regulationsof many countries. The International Basic Safety Standards [IAEA96] explainsALARA as the objective to keep all exposures to values such that furtherexpenditures for design, construction, and operation would not be warranted bythe corresponding reduction in radiation exposure.
FDR-ITER Safety Assessment Chapter IV-Page 15

2.2 Summary of releases
Sources of potential releases for the Basic Performance Phase (BPP) have beenidentified, release pathways determined, and design features and active releasecontrol systems assessed. Release pathways are controlled and monitoredthrough the exhaust stack, liquid discharge pathways, and the heat rejectionsystem. Table 2.2-1 provides a summary of estimated average annual releasesand compares these to the project guidelines from the GDRD [GDR97].
TABLE 2.2-1Estimates of BPP Annual
Releases for Comparison to Project Guidelines
Estimate of Release
Tritium - Tritiated water fromnormal operation andmaintenance
Activated dustActivated corrosion products
Activated gases
Ar41
C14
N13
Direct radiation at 250 m
Beryllium (not activated)Magnetic fields at 250 m
Thermal releases
Cryogen release
-106 TBq/a elevated-14 TBq/a ground level
-5.2 g/a elevated- 1.2 g /a elevated
-1.9 g/a ground level
2TBq/a15MBq/a90GBq/a
5 nSv/a
-21g/a0.03 mT
1300 MW ave<2800 MW max
-5t/a
Project Guideline
lg-T/a or 370 TBq/a
10 g-metal/a50 g-metal/a
-
-
10 g-Be/day-
-
-For tritium and activated metal the guideline assumes elevated release.For ground level release, use weighting factor of 10 for comparison with guideline.
A detailed release assessment was performed for each element in ITER WBS toensure that no significant release pathway was missed. Summaries provideinformation on the following:
• Major systems that contribute to releases of tritium, activationproducts, and other releases and emissions (Figure 2.2-1);
• Release points and control systems (Figure 2.2-2);
• Releases from operations and maintenance (Figure 2.2-3).
FDR-ITER Safety Assessment Chapter IV-Page 16

There is some uncertainty in these estimates that will only be resolved whenITER begins operation. However, any radioactive releases will increase slowlyover the project lifetime, so there is adequate time to upgrade release controlsystems if needed to maintain releases at low levels. The preliminary estimatesof releases and flexibility in the design to add additional control measuresprovide confidence that the design can meet the project guidelines.
2.3 Tritium
Tritium releases can be classified into the following categories based on thefollowing release characteristics:
• Discharge from atmosphere detritiation systems to the stack;
• Low concentrations released through the HVAC to stack;
• Released though the cooling tower;
• Water discharged from the water detritiation system (WDS);
• Low contaminated water discharged with site waste water.
For each of these, releases for normal operation, maintenance, and expectedevents have been assessed and are summarized in Figure 2.2-2.
In Figure 2.2-2, the large fraction of tritium loss through HVAC to the stackresults from numerous maintenance operations of large components where eachindividual release is small and further reduction by additional control systems isnot warranted. The small amount of discharge from operational ADS systemsresults from the high removal efficiency, 99%, of these systems.
Liquid releases are subject to site specific regulations that may differ dependingon the potential for ground-water contamination. Depending on the site, theWDS discharge may be combined with the liquid waste stream or released as anairborne release.
2.4 Activation products
The primary contributors to operational releases with activation products are thefollowing:
• Corrosion products from primary heat transfer systems;
• Activated dust from the torus; and
• Activated gases.
FDR-ITER Safety Assessment Chapter IV-Page 17

2.4.1 Activated corrosion products from coolants
Activated material enters the PHTS coolant by corrosion of the activated coolingchannels in the components (e.g., blanket modules) contained in the vacuumvessel. The isotopes entering the coolant depend on the material at the waterinterface. The ten loops for the First Wall/Inboard Baffle (FW/IBB) and the fourloops for the Limiter/Outboard Baffle (L/OBB) have 316SS at the water interface.The vacuum vessel also has a steel /water interface but the neutron fluence issignificantly lower. The four divertor loops have steel and copper at theinterface. This is also the case for the Neutral Beam Injector (NBI) coolantsystems but the neutron fluence is lower for those systems.
The corrosion rate and solubility are strongly affected by the water chemistry andthe extent of the water treatment during operation. The treatment duringoperation is performed by the Chemical and Volume Control System (CVCS).This system employs chemical control, filtering, and ion exchange to removeactivated corrosion products. Table 2.4-1 lists the most significant isotopes for the316L coolant systems.
TABLE 2.4-1Key Isotopes for ITER 316L Coolant Systems
316L SS Cr-51 Mn-54 Fe-55 Mn-56 Ni-57 Co-57 Co-58 | Co-60
The pathways for releases are by leakage from the primary to the heat rejectionsystems and leakage from components into the vaults. Primary pathways forreleases include the following:
• Leakage through the heat exchangers and loss to the cooling tower orHVAC;
• Water leakage into vaults and release in the HVAC system; and
• Discharged water.
Operational releases directly from the PHTS components not including heatexchanger leakage are primarily through the TCWS vault atmospheric controlsystems or from releases not captured by dryers or filters. During operation, theairflow in the vaults is continuously circulated through air filters with only asmall stream extracted to maintain negative pressure. The resultingdecontamination efficiency is very high so losses will not be significant comparedto those associated with heat exchanger leakage. During maintenance operationsin the TCWS vaults when worker doses are an important consideration, air flowmay be increased by directing flows directly to the stack filters.
FDR-ITER Safety Assessment Chapter IV-Page 18

2.4.2 Activated dust
The release pathway for dust from the torus includes these three steps:
• Dust carried outside vacuum vessel - For movement of the in-vesselcomponents, it is likely that some dust will remain in crevices of thecomponent after cleanup for each port opening. During the cuttingand rewelding required for divertor removal, some activatedparticulates could enter the contamination control areas;
• Dust lofted into air - A significant fraction of the dust is of smallparticle size (< one micrometer) and could potentially be lofted into theair during maintenance and cleanup operations;
• Dust transported through HEPA filters - During the maintenanceoperations, contamination control barriers will be in place with airnitration. Any dust by-passing these barriers would be in controlledareas served by the stack HEPA filters. Dust removal by HEPA filters isa function of particle size and removal efficiency is expected to exceed99.9% for particles > 0.3 \i in diameter;
• Dust released during transport in casks.
In-vessel components are brought into the hot cell for refurbishing that couldproduce significant dust. For each divertor replacement, on the order of eighttonnes of plasma facing material could be processed, and the yearly amount ofdust produced could be several tens-of-kilograms. Since all operations are donein the hot cell that is continually vented to maintain a negative pressure, theprimary pathway for release is the ventilation system. During cutting operations,the dust produced is captured by high-flow air cleaners and filtered with multiplebanks of HEPA niters.
2.4.3 Activated gases
Analyses have been performed to evaluate the consequences of release of variousactivated gases that may be produced during ITER operation. The gasesevaluated were:
• Activated air between the cryostat and bioshield. Isotopes of concernfrom this source include Ar41, and C14;
• Activated divertor gases. Noble gases argon, neon, krypton, and xenonmay be pumped into the divertor to produce line radiation;
• Activated cryogenic nitrogen. This could produce C14 and N13-
• Activated insulator gases in Neutral Beam System. If SF6 is used,isotopes would include F18, P32, etc.
FDR-ITER Safety Assessment Chapter IV-Page 19

Production rates, releases, and site boundary doses were calculated for the aboveactivated gas sources.
2.5 Non-nuclear effluents and emissions
2.5.1 Beryllium
Non-activated beryllium releases would primarily come from installation ofplasma facing component in the torus and refurbishing the divertor cassettes inthe hot cell. After the machine is activated, installation would be done incirculating gas that is maintained within the torus. HEPA filters are expected tohave an efficiency of better than 99.9%, so the losses would be maintained small.It is estimated that a few tens-of kg of beryllium dust would be produced fromrefurbishment of divertor cassettes in the hot cell.
2.5.2 Thermal
The heat rejected from ITER operations originates from nuclear heating(primarily during pulsing with only a small amount of decay heat after pulsing)and non-nuclear systems (during pulsing, the dwell between pulses, and periodsbetween pulsing scenarios). The non-nuclear systems include additional heatingsystems, component cooling, and chilled water. The heat loads are about1300MW(th) average (2800 MW(th) peak) during operation and 250MW(th)during shutdown. The thermal release will be primarily from the coolingtowers; however, there will be some direct losses to ambient from heat loss.Selection of an appropriate ITER site should allow dissipation of these heat loadswithout adverse environmental impact.
2.5.3 Cryogens
Cryogenic systems are required by ITER to cool the super conducting magnets andoperate cryopumps for hydrogen pumping. A large cryoplant will be on-site toprovide refrigeration and storage of cryogenic helium. Losses of cryogenichelium and nitrogen will be minimized for economic reasons. Based onperformance of large cryogenic systems employing helium, a yearly loss rate isestimated on the order of five tonnes. The environmental impact of thesereleases should be minimal.
FDR-ITER Safety Assessment Chapter IV-Page 20

2.6 Waste management and decommissioning
2.6.1 Waste management strategy
An important objective of ITER is to demonstrate the environmentalattractiveness of fusion over its entire life cycle including construction, operationand decommissioning. Thus, the ITER Project is focusing on the followingissues:
• Minimizing the quantity of relatively highly activated waste that willneed long-term storage;
• Designing for safe handling of waste during maintenance anddecommissioning;
• Exploring "on-site" waste treatment to prepare the ITER waste forfurther waste treatment by a separate waste management organization;and
• Providing the Host Country with detailed data concerning TTER waste.
The design of FTER has taken into account that operation and decommissioningof ITER will generate radioactive, chemical and miscellaneous other wastes thatwill require handling, treatment, packaging, storage and disposal. The ITERwaste management strategy provides safe handling and treatment of potentiallyactivated, tritium bearing and beryllium bearing wastes. It is assumed that theITER Project will provide initial treatment and short-term storage of wastes onthe ITER site. Longer-term storage and ultimate disposal is assumed to beaccomplished by a separate waste management organization in accordance withspecific national regulations, standards and practices. Several options forreducing the waste mass/ volume of relatively highly activated waste duringtreatment on ITER site are being considered:
• Cutting/segmenting with sorting;
• Removing surface contamination; and /or
• Modular design, reuse and repair of components such as the divertorcassette, divertor structure and blanket module.
For example, the contact dose of the first wall/shield module is peaked near thesurface. The benefit of segmenting the copper/stainless steel front part of themodule from the main body arises from the fact that the mass of the front part isonly about one tenth the mass of the body, but it has an order of magnitudehigher contact dose.
FDR-ITER Safety Assessment Chapter IV-Page 21

2.6.2 Decommissioning strategy
The decommissioning phase (DP) will be conducted under the regulations andpractices of the Host Country. Therefore, the details of the DP are at thediscretion of the waste management organization within the Host Country.However, the following is a possible decommissioning scenario that can beaccomplished with acceptable occupational exposure. International Basic SafetyStandards (IBSS) and other IAEA safety criteria are used for the definition ofterms and waste classification. A generalized scenario for ITER waste disposal isgiven. A detailed potential technical approach for ITER decommissioning ispresented. A discussion of ITER design optimization to minimize exposure andoptimize the decommissioning process is also presented.
The ITER Project policy provides a feasible and flexible plan for thedecommissioning of the ITER machine and its associated active components andplants. Flexibility is provided by the use of three separate phases, Phase 1 (DP-1),Phase 2 (DP-2), and Phase 3 (DP-3) as shown in Table 2.6-1. The phase durationand activity can be modified (to a certain extent) to accommodate the ITER HostCountry organization requirements and constraints. The plan provides aframework to help the Host Country waste management organization decidewhen and how to implement the ITER facility decommissioning depending onthe financial, schedule, resources and /or any other priorities applicable at thetime. As proposed, the plan:
(1) Maximizes the use of the existing facilities and equipment and takesadvantage of the experience and knowledge of the site personnel atthe end of ITER operation;
(2) Helps reduce the capital investment required for new equipment andfacility procurement required in the later stages of thedecommissioning;
(3) Allows a choice between two decommissioning strategies:
• Option 1: Use the existing equipment and teams for the earlydismantling of most ex-vessel components;
• Option 2: Postpone the expenditure required for the dismantling ofex-vessel components until after the decay phase (Phase 2).
FDR-ITER Safety Assessment Chapter IV-Page 22

TABLE 2.6-1Possible ITER Decommissioning Scenario
DP-l
• The first and secondconfinement barriers arepreserved but the mechanicalopening systems are blockedand sealed. Surveillance,monitoring and inspection arecarried out to assure thatITER remains in goodcondition.
• In-vessel components and thebackplate are removed andtransported to the hot cell byuse of the installed remotemaintenance equipment usedduring ITER operation.
• OPTION 1: Removal of theex-vessel components (if notdone in DP-3).
• No forced cooling required.
• Lower activation levelcomponents are immediatelyprocessed and packaged inthe radwaste building fortransport and ultimatedisposal.
• Non-radioactive componentsare disposed of as convenient.
DP-2
• The first confinementbarriers (essentially theW ) are reduced to theirminimum size (i.e., all partsthat can be easilydismantled by hands-ondisassembly are removed).
• After decontamination, thesecond confinement barriersmay be modified or removedif they are no longer requiredfor OPTION 1.
• The non-radioactivebuildings on-site can be usedfor other purposes.
• Sealing of the barriersreinforced by physicalmeans and the biologicalshield is extended if needed.
• Mothballing - A period oftime that permits theradioactive decay ofradioactive components,such as the magnets andcryostat, until manned accessand disassembly ispractical.
DP-3
• All material, equipment andparts still containingsignificant levels ofradioactivity are removed.
• OPTION 2: Removal of theex-vessel components (if notdone in DP-l).
• The VV will be eitherdisassembled for recycling orleft for future recycling.
• Disassembly anddecommissioning completed,ready for unrestricted reuse,or return to "greenfield"status. No further inspectionor monitoring required.
• Classification of wastebelow the clearance level, ifacceptable.
2.6.3 Waste characteristics and classification
General characteristics of ITER waste
The ITER Project has developed detailed data on waste volumes, masses, andradioactive characteristics (component specific activity, contact dose, decay heat,dominant isotope etc.). ITER waste characteristics include:
• A major portion of the wastes is from neutron induced activation ofcorrosion resistant metals, including structural material, such asstainless steel, plasma facing components such as tungsten and heatsink material such as copper. These activated metals emit gammaand/or beta radiation. The radiation characteristics, including specificactivities, energy of radiation, and half lives, depend strongly on thematerial selection;
FDR-ITER Safety Assessment Chapter IV-Page 23

• The wastes from plasma facing components of ITER will contain sometritium. Treatment is foreseen to recover this tritium, for example, bybaking the tritium-bearing beryllium wastes up to 700°C in the hot cell,about 90% of tritium can be recovered. The residual tritium isrelatively immobile in this state and difficult to recover;
• Use of chemically toxic beryllium as the first wall material can result inradioactive and chemically hazardous waste.
Waste classification
The quantity or concentration limits for the classification of radioactive wastewill be established by the regulatory body of the potential Host Country.Generally, some sources of ionizing radiation are excluded from regulatorycontrol because they present a relatively low exposure risk. Such exclusion fromcontrol is called clearance [IAE89], [IAE92], {IAE94]. Derived clearance levels havenot been developed for fusion decommissioning wastes where there is a largeamount of waste, but a significant portion of the waste has a very low level ofactivation. However, IAEA and IBSS guidelines are used in the feasibility study:
Low Case: Table I of IAEA-TECDOC-855 [IAE96]IBSS: Table I-I of IAEA Safety Series 115 [IBS96]High Case: The "High" range values in Table 1.6 of IAEA-TECDOC-855 [IAE96]
These guidelines are based on the IAEA Safety Series No 89 [IAE89] and thushave release levels derived for a 10 uSv/a individual dose. They are applicablewithout considering other options if the resulting collective effective dosecommitment is 1 person«Sv/a or less, provided the individual dose criterion issatisfied. All of these cases include incineration pathways, resulting insomewhat too conservative criteria for decommissioning waste.
For the application of the clearance principles to fusion waste, isotopicconcentration of radioactivity (Bq/g) is compared with the clearance levels ofeach isotope. When a material contains several nuclides, a summation formulais used to evaluate the clearance possibility:
n/ A L i < l
where Aj is the specific activity of the radionuclide in the material and Au is theclearance level for that radionuclide.
FDR-ITER Safety Assessment Chapter IV-Page 24

Accessibility for processing ITER decommissioning wastes
Some of the ex-vessel components will be disassembled without using remotehandling tools, either "hands-on" or "hands-on assisted" remote handling orusing light protection equipment. Necessary time for components to reachacceptable "hands-on" disassembly limits varies depending on materials,location, shielding/penetration design and operation scenario. Magnetactivation in the outboard varies in the poloidal direction due to a change intotal thickness of the blanket and vacuum vessel and due to streaming frommany ports.
Decay time for clearances
Figure 2.6-1 provides a summary of assessment of waste classification from thepoint of view of 'clearance levels' as given in the International Basic SafetyStandards. Note that in this case, practically all of the decommissioning wastes,except for the in-vessel components and backplate, will be below clearance levelsafter about ninety years.
Detailed analyses are shown for the vacuum vessel in Figure 2.6-2. In this graph,the decay time necessary for clearance is shown by plotting a sum of a fraction ofthe activity (Bq/g) over the isotopic clearance levels (Bq/g) for the outboardaverage of the vacuum vessel, for the three different clearance levels, LOW,IBSS, and High, individually. In the case of the IBSS, it takes about sixty years forthe outboard and ninety years for the inboard of the vacuum vessel for theseregions to drop below the clearance level.
FDR-ITER Safety Assessment Chapter IV-Page 25

2.6.4 Overview of waste streams
General overview of integrated waste streams
Waste data are categorized into the following streams in line with the ITER lifecycle:
• Operational Waste Streams:
- Basic Performance Phase (BPP);
- Extended Performance Phase (EPP).• Transition Period (TP);
• Decommissioning Waste Streams:
- Decommissioning Phase I (DP-1);
- Decommissioning Phase II (DP-2);
- Decommissioning Phase III (DP-3).
The transitional period wastes are due to the experimental nature of ITER inwhich most of the in-vessel components, in particular the shielding blanket,must be replaced with the breeding blanket to supply a part of the tritium for EPPoperation.
The total amount of waste is summarized in Table 2.6-2 and shown inFigure 2.6-3, Figure 2.6-4(a), and Figure 2.6-4(b) in line with ITERDecommissioning Technical Aspects in the Operation, Commissioning, andDecommissioning Plan.
TABLE 2.6-2Total Waste Stream Summary
(Integral mass, in tons)
ITER Life Cycle
Operational WasteBPPEPP
Total (BPP + EPP)Transition PeriodDecommissioning
DP-1DP-2DP-3
Decommissioning TotalGrand Total (BPP,EPP, TP,DP)
Option 1 Option 2
2200320054003400
192000
54700
15300
0
586007390082700
FDR-ITER Safety Assessment Chapter IV-Page 26

BPP + EPP
DP-1,-2,-390%
FIGURE 2.6-3Overview of the Total Operational, Transition Period
and Decommissioning Waste Stream
BPP TP
DP-3
EPP
Option 1
DP-2
BPP TP EPP
DP-371%
DP-1
Option 2
DP-2
FIGURE 2.6-4(a)Overview of the Integrated Waste Mass Generated during the ITER Life Cycle-
Option 1 Decommissioning Scenario
FIGURE 2.6-4(b)Overview of the Integrated Waste Mass Generated during the ITER Life Cycle-
Option 2 Decommissioning Scenario
FDR-ITER Safety Assessment Chapter IV-Page 27

Operational and Transition Period wastes
The component-wise contribution of these waste streams to the subtotal ofoperational waste (BPP and EPP) and the transition period waste is represented inFigure 2.6-5.
Decommissioning Wastes
Component-wise contributions to the total and to each decommissioning phaseare shown in Figure 2.6-6. Major contributions are from the Vacuum Vessel,Cryostat and Bioshield.
Disposal of Wastes
Disposal of ITER waste will be a decision of the waste organization within theHost Country. However, some fraction of wastes that are unlikely to decay belowthe clearance levels may be disposed of under the strict control of the regulatorybody in the Host Country. These wastes will be mostly operational wastes duringBPP and EPP, and decommissioning wastes. Most of the wastes are fromin-vessel components. Table 2.6-3 summarizes the total waste streams,operational and decommissioning.
TABLE 2.6-3Estimated Potential Disposal Waste Stream Summary
(About 60 years after operation)
Component
In-vessel Components (with NBI source)DiagnosticsDebris from Hot Cell
TotalGrand Total
Operational Waste(BPP+TP+EPP)
Mass, t591024030
= 6180
Decommissioning(DP-1, DP-2, DP-3)
Mass, t
57902630
20= 8440
~ 14,620 tons
Figure 2.6-7 shows fractions of decommissioning wastes that are still above theIBSS clearance levels for each component, for the three different clearance levels,LOW, IBSS, and High, individually.
At the end of decommissioning, all materials, equipment and parts of ITER stillcontaining concentrations of radioactivity exceeding the regulatory clearancelevel should be removed and the facilities and site released for unrestricted use.There should be no need for further institutional control nor further regulatoryinspection and monitoring. Practically all the ex-vessel components as well asthe vacuum vessel will drop below the IBSS clearance level after about sixty toninety years of decay. Further attention is being paid to aspects which wouldfacilitate decommissioning, including improvement in shielding performance ofthe breeding blanket and material tailoring, in particular impurity specificationsof cobalt and niobium.
FDR-ITER Safety Assessment Chapter IV-Page 28

3 IMPACT FROM ACCIDENTS
Operation of ITER will result in no significant risk to the general public frompostulated accidents. To assess the risks the ITER project has established limits ofconsequences based on accident frequency. These have been discussed withHome Team experts and agreed upon as acceptable as a common reference basis.To assess the potential for public radiation exposures and the effectiveness ofimplementation of the safety requirements and functions in the ITER design, acomprehensive analysis of 28 different reference events has been performed.The analyses included conservative assumptions of initial facility operating andaccident conditions and examined possible ways for tritium, activated corrosionproducts in coolants and neutron activated tokamak dust to be released to theenvironment. The results showed that radioactive releases for all 28 of thesereference events are well below the limits that have been established for publicexposure. In addition, ultimate safety margins of the facility were examined byanalysis of hypothetical events. Analysis shows that safety margins degradegradually, and that the ITER design provides a high level of public protectioneven for these hypothetical events.
3.1 Safety analysis approach
3.1.1 Categorization of event sequences
ITER uses a classification of plant conditions which divides plant conditions intocategories in accordance with anticipated frequency of occurrence. The categoriesare as follows:
Category I: Operational eventsCategory II: Likely event sequencesCategory III: Unlikely event sequencesCategory IV: Extremely unlikely event sequencesCategory V: Hypothetical events
Category I events and plant conditions are those planned and required fornormal operation, including some faults and events which can occur as a resultof the experimental nature of ITER. Category II event sequences are not plannedbut are likely to occur one or more times during the life of the plant but do notinclude Category I (normal operations) events. They cover a typical annualexpected frequency of greater than 10"2/a. The aim of Category II event analysis isto show that no significant radiation releases result from these events and noserious consequential failures are expected. Category III event sequences are notlikely to occur during the life of the plant (typical frequency 10"2/a to 10"4/a).Category IV event sequences are not likely to occur during the life of the plantwith a very large margin (typical frequency 10"4/a to 10"6/a). Investmentprotection is not included in this category. Category V events which typicallyhave a frequency below about lO 6 / a are postulated to limit the associated risk.
FDR-ITER Safety Assessment Chapter IV-Page 29

These Category V events are considered using best estimate analysis tools toexamine ultimate safety margins.
The basic principle in relating design requirements to each of the conditions isthat the most probable occurrences should yield the least radiation exposure tothe public, and those extreme conditions having the potential for the greatestexposure to the public shall be those least likely to occur.
3.1.2 Acceptance criteria
Table 3.1-1 lists the release limits for tritium and activation products forCategories II to IV which are the top level acceptance criteria used. Details on thederivation of these are found in GSEDC (General Safety and EnvironmentalDesign Criteria, part of Final Design Report). The project imposed restrictivedose limits such that the design would not have to be significantly modified aftersite selection. These limits were set taking into account internationalrecommendations and national regulations of countries in the Parties. They willbe reviewed after a site for ITER is chosen. Release limits were calculated usingconservative assumptions for weather.
Other acceptance criteria are:
• Maximum pressure inside the vacuum vessel is below 500 kPa(absolute);
• Maximum pressure inside cryostat is 200 kPa (absolute);
• Maximum heat transfer system vault pressure is below 260 kPa(absolute);
• Flammable mixtures of hydrogen and air shall be avoided; thefollowing four acceptance criteria quantify this further:
- Hydrogen production inside the vacuum vessel is below 10 kg;
- Maximum primary first wall beryllium temperature during plasmaburn (excluding disruption) is 800°C to avoid hydrogen formationin case of beryllium/steam reactions;
- Maximum long term (beyond one hour after shutdown) first wallberyllium armor temperature is 500°C to avoid hydrogen formationin case of beryllium/steam reactions;
- Maximum vacuum vessel temperature is below 300°C to avoidhydrogen formation between dust and steam;
• Maximum temperature of components in casks once outside thevacuum vessel is 200°C to limit tritium outgassing;
• Ozone formation in the cryostat is below 50 g.
FDR-ITER Safety Assessment Chapter IV-Page 30

TABLE 3.1-1Project Atmospheric Release Limits
EventSequenceCategory
Release LimitforHTO(tritiatedwater) (b,c)
Release Limitfor Divertor-First WallActivationProducts(b,d)
nLikely
Sequences
1 g-T/event
(1 g-T/a integratedover all Category II
events)
0.5 g-metal /event
(10 g-metal/aintegrated over allCategory II events)
mUnlikelySequences
50 g-T/event
25 g-metal/event
IVExtremelyUnlikely
Sequences (a)
100 g-T/event
2000 g-metal/event
(a) Beyond Category IV, some hypothetical Category V events with even lower frequencywill be assessed for compliance with the no-evacuation goal and for reducing theassociated risk, if necessary,
(b) These are release limits for design purposes, based on the dose limits in GSEDC, assumingatmospheric, elevated release. For ground level release, use 1/10 times the values shownhere. The release limits for different radiological species do not scale the same. Forexample, the scaling of tritium and activation products going from Category I to CategoryII and from Category III to Category IV differ because the type of dose limit changes,
(c) For tritium in the HT form, use 10 times the values shown here,(d) For activated corrosion products in in-vessel PHTS, use five times the values shown here.
3.1.3 Identification of reference events
For the accident analysis to be complete, it must be based on a comprehensive listof fault conditions, or accident initiating events, covering all conceivable hazardsarising in the plant. Thus accident sequence identification studies have beencarried out with this objective, and more specifically to confirm that anappropriate selection has been made of the postulated accidents which areanalyzed in detail.
To help ensure that all aspects of plant operation have been considered, twofundamentally different approaches have been applied to the identification ofpotential accident initiators. These are the component-level (bottom-up) and thetop-down approaches. The former is based on the application of systematicmethods which seek to catalogue all potential faults in the ITER plantcomponents and sub-systems, and to consider the conceivable consequences ofthese faults. The focus is on the failure of individual components, and is basedon the design in as much detail as is available.
In contrast, the top-down approach starts at the plant level, and takes a globalview of the potential hazards and the safety functions which provide protection.By considering the abnormal events which would have to occur to realize these
FDR-ITER Safety Assessment Chapter IV-Page 31

hazards, a list of accident initiators is again produced, in terms of system or insome cases component faults.
The concluding part of both the bottom-up and top-down studies is to show thatall identified accident sequences have in some way been addressed by analyseswhich show that all potential consequences are within acceptable limits.
Component Level Studies
The principal techniques used in the bottom-up studies were Failure Modes andEffects Analysis (FMEA) and Hazards and Operability Studies (HAZOP). Detail oftheir application has varied by system, because they have proceeded in parallelwith the evolution of the ITER design, resulting in systems being studied atvarious stages of their design maturity. FMEA catalogs all conceivable failures inevery plant component, and the potential consequences. It allows frequencies tobe assigned to each identified fault based, where possible, on failure frequencydata gathered from operational experience on existing plants. HAZOP is based ona nodal description of the plant, with the potential consequences of deviationsfrom normal behavior systematically noted.
The outcome of FMEA or HAZOP studies is lists of fault conditions which couldinitiate an accident sequence. These are sorted into groups of initiators referredto as Postulated Initiating Events (PIEs) according to their potential impact on theplant. Some other, less formal, assessments of initiating events have alsoproduced lists of PIEs. Table 3.1-2 summarizes those systems that have beenstudied and the resulting number of PIEs listed for the normal operation phase.
A screening procedure was then used to select PIEs for further development onthe basis of the assessed risk, and for these Event trees were developed to depictaccident event sequences in which successive lines of defense were considered tofail. Such event trees allow some quantification of the expected frequency of thesequences shown, by assigning a probability to each of the failures listed. Theoutcome is one or more hazardous consequences, for example the release oftritium, tokamak dust or activated corrosion products, with an assessed sequencefrequency. In most cases these event frequencies turn out to be very small, wellbelow the limit conventionally assumed for design basis accidents (l(h6 /yr.), andthis allows some sequences to be eliminated from further analysis.
FDR-ITER Safety Assessment Chapter IV-Page 32

TABLE 3.1-2Identification Methods Used for Plant Systems
System
Magnet systems
Vacuum vessel
FW/blanket heat transfer systems
Divertor heat transfer system
Fueling system
Divertor remote handling
Cryostat
Vacuum pumping
Tritium plant
Cryoplant
Coil power supplies
Electrical power network
Neutral Beam Injection
Hot Cell
IdentificationMethod1
IE list
FMEA
FMEA
FMEA
IE list
FMEA
FMEA
IE list
FMEA
FMEA
FMEA
IE list
FMEA
FMEA
No. PIEs
9
17
24
12
8
5
9
4
14
2
6
3
15
61. IE list Initiating Event list (by informal method)
FMEA Failure Modes and Effects Analysis
Top-Down Study
One of the motivations for performing a top-down study, to complement thealready voluminous bottom-up studies, was that it can provide a clarity ofpresentation. Another benefit of this approach is to ensure completeness ofhazardous situations that could lead to the unacceptable event "radioactiverelease to the environment." By expanding this unacceptable event into allpossible categories of events that could cause it to occur, the same initiatorsshould be identified as with the bottom-up approach, ensuring the consistencyand completeness of the analysis.
In order to start with a plant-level, safety functional approach, and work down toinitiating faults, a global fault tree is required. To implement this, a Master LogicDiagram (MLD) has been developed.
The top levels of the preliminary MLD are shown in Figure 3.1-1, together withthe expansion of one branch, representing the release of tritium from plasmafacing components (PFC), by way of illustration. The top-level event in the MLDis "excessive off-site release", meaning the release of radiological or toxicologicalhazards which exceed the adopted limits. Subsequent levels in the diagram showthe functions and barriers that protect against the release, and finally thepotential initiators of accident sequences. To further clarify the logic, additionallevels were introduced in some areas. Finally, level 7 shows lists of initiating
FDR-ITER Safety Assessment Chapter IV-Page 33

events and component failures. Several failures must occur to give rise to arelease based on the logic of the ITER MLD. For example in Figure 3.1-1, anin-vessel LOCA will create the conditions in which mobilization of tritium fromthe PFCs could occur, but a large release to the environment would only result if,additionally, other failures occurred resulting in loss of confinement.
As with the bottom-up studies, the initiating events can then be developed intoevent sequences depicted in event trees. The event sequence developmentleading to environmental releases is more straight forward in the top-downapproach because all failures leading to environmental releases have beenidentified during the process of identifying initiating events.
Enveloping by Reference Events
The catalogue of PIEs and the event sequences resulting from these studies havebeen evaluated to ensure that each one is covered, directly or indirectly, by one ofthe reference events chosen for detailed analysis. This process is on-going as thedesign proceeds. Up to now, it has been confirmed that the consequences of theidentified sequences are enveloped by the assessed consequences in one or moreof the analyses of reference events discussed below. Table 3.1-3 "ReferenceEvents" shows the 28 different reference events that have been analyzed in-depthwith their respective categories. These span the major systems and initiator typesas well as event categories.
Many events are grouped around the heat transfer systems which are a keyelement to safety. The plasma behavior is addressed in a conservative way toshow the limited effects of loss of plasma control. Air ingress into the vacuumvessel and cryostat under various off-normal plant conditions is investigated.Magnet system structural integrity and arcs are examined. Safety of the tritiumplant with its significant inventory is addressed in three reference events.Consequences of failures in confinement and decay heat removal in the Hot Cellare investigated. Maintenance will be a typical state of the ITER plant. Potentialaccidents during maintenance are investigated.
FDR-ITER Safety Assessment Chapter IV-Page 34

TABLE 3.1-3Reference Events
PIE Family
Plasma events
Loss of power
In-vessel loss ofcoolant
Ex-vesselcoolant leakage
Heat exchangerleakage
Loss of flow
Loss of vacuum
Maintenance
Tritium system
Magnets
Cryostat
Hot cell/Radwastebuilding
Category II
none
LOOP 1 hour
In-vessel FW pipeleakage
Heat exchangerleakageLoss of heat sink DV
Pump trip DVnone
Air leakage into Wduring maintenance
Tritium process lineleakage
none
none
none
Category III
Loss of plasma control
LOOP 32 hours
W pipe break
Large DV ex-vesselcoolant pipe break
Heat exchanger tuberupturePump seizure in DVHTS
none
none
Accident withtransport hydride bed
none
Cryostat air ingress
none
Category IV
none
Blackout for one hour
Multiple FW pipe break
Loss of coolant into breederblanket boxWet confinement bypass
Large ex-vessel FW coolant leak
none
none
Loss of vacuum through one Wpenetration line
Stuck DV cassetteand failure of container
Isotope Separation System (ISS)failureFailure of fueling or pumpingtritium confinementTF coil short
Arcs near confinement barrier
Cryostat water, air and Heingress
Loss of confinement in hot cell
W=vacuum vessel; FW=first wall; DV = divertor
The reference events were further analyzed using detailed quantitativecalculation and integrated system simulation codes. The verification andvalidation status of some of the codes is being improved by on-going R&Dduring the ITER EDA. Further efforts are expected to be necessary beyond theITER EDA. Figure 3.1-2 shows a schematic that illustrates the level of couplingfor modeling accident transients. Source terms for tritium and activationcorrosion products in coolants, tritium contained in plasma-facing componentsand tokamak dust are included. Thermo-hydraulic models of the various ITERcooling loops are an essential part of many transient studies. Further, thestructures of in-vessel components and the vacuum vessel are important because
FDR-ITER Safety Assessment Chapter IV-Page 35

they provide thermal inertia and condensation surfaces and they are the sourceof decay heat. The basic tokamak confinement volumes are the vacuum vessel,cryostat and tokamak cooling water system (TCWS) vaults. The walls of thesevolumes and cryogenics structures are important elements in the modeling ofcondensation. For confinement bypass studies, an additional "generic" room wasincluded to assess environmental releases. Coolant or air leaks of various sizesand locations were investigated with such models.
3.2 Summary of analysis of reference events
This section summarizes the results of the analysis for each PIE family shown inTable 2.1-3. For all reference events the releases are below the release limits; inmost cases by many orders of magnitude.
Figure 3.2-1 gives a summary of the margin against environmental release limitsfor the reference events. There are no releases that are in excess of the releaselimits established by the project. The largest releases in Category II and III comefrom heat exchanger leaks in in-vessel component cooling loops, but the marginfor these accidents is about an order of magnitude. The accident with the largestrelease in Category IV is a postulated bypass of the first and second confinementboundaries in conjunction with a coolant leak inside the vacuum vessel. Evenfor this extreme case, the environmental release is about a factor of three belowthe Category IV release limits.
Considering the wide breadth and depth of the cases analyzed, the conclusion isdrawn that there would be no significant risk to the public from accidentalreleases of radioactivity resulting from operation of ITER.
3.2.1 Plasma events
A basic principle of the ITER safety design is that the machine should have arobust safety envelope with a minimal safety impact from plasma physics andcontrol systems.
FDR-ITER Safety Assessment Chapter IV-Page 36

100.00% j
„ 10.00%--
IZ 1 -oo% • •o
89 0.10% ••
0 . 0 1 % - -
ia
a.|
•+•3 4 5
Cat II events
100.00% ••
^ 10.00%--
IZ 1.00% ••o
0.10%--
0.01%
1 I "2
I 301o
4 5 6
Cat III events
100.00%-r J g i. &
S > •* i f^ 10.00%--
IHi 1.00% • •o88 o . i o % - -
0.01%
2 Is i
HJ—H y
1
t1—H
e -a 13 «! X
2 I
*mj-
II
I
I i
H 1 1 h* H2 3 4 5 6 7 8 9 1 0 1 1 1 2 1 3
Cat IV events
FIGURE 3.2-1Margins against Project Environmental Release Limits for Reference Events.
Shown is the Sum of Tritium, Activated Dust and Activation Corrosion ProductReleases (Note: scale is logarithmic)
FDR-ITER Safety Assessment Chapter IV-Page 37

The three basic parameters in the fusion product: density, energy confinementtime and temperature are varied to investigate possible fusion power transients.Malfunction of the plasma control is postulated to increase fueling or cause asudden injection of all the auxiliary power into an ignited plasma. The first willinfluence plasma density, the latter increases plasma temperature. Anunexpected doubling of the confinement time is postulated to demonstrate thatITER safety is tolerant of uncertainties in plasma physics. Optimistic plasmadensity limits and beta-limits are assumed to maximize fusion power duringsuch transients. Up to 3.2 GW of fusion power can be reached transiently.
Figure 3.2-2 shows some selected plasma parameters for a scenario in which theplasma energy confinement time suddenly doubles due to unexpected plasmaphysics behavior. The plasma temperature and fusion power increases. Finally,the plasma exceeds the beta limit at about 3.4 seconds. At this time the fusionpower is about 3.2 GW. The plasma facing structures (first wall and divertor) aredesigned to withstand such kind of short-term thermal transients. The plasma isterminated by a disruption when a beta-limit is exceeded.
A parametric study has been performed to investigate the maximum fusionpower transient due to increased fueling. For a large increase in the fueling ratethe plasma will cool down and disrupt upon reaching its density limit. Themaximum fusion power is reached if the fueling rate increases by a factor of 2.2.In this case, the fusion power reaches 3.1 GW. The divertor heat flux on thetarget plate increases sharply when the divertor plasma is not kept in thedetached mode by active plasma control. This may lead to a failure of thedivertor plasma facing structures. As a consequence, a loss of coolant into thevacuum vessel will terminate the plasma burn. In-vessel loss of coolant eventsare discussed below. Failure of divertor structures due to large heat loads on thetarget plate might also occur for a sudden injection of 100 MW auxiliary heatinginto an ignited plasma without corrective actions from the plasma controlsystem.
In case of termination of plasma fueling, the fusion power decreases on theenergy confinement time scale (~ 5-10 seconds).
Plasma disruptions are assigned to the normal operational regime. They willoccur frequently during the initial experimental stages of ITER. In many accidentscenarios a disruption is also involved. The disruption energy load to the plasmafacing components was taken into account as a heat load of 1.5 GJ to the first wall(1.6 GJ to the divertor) surfaces within a short period of time. A peaking factor ofthree was added to account for the non-uniform distribution of the energy load.The PFCs are designed to withstand the thermal shocks. The electromagneticloads expected from VDEs and disruptions are calculated and taken into accountin the design of ITER components. No machine damage will arise fromCategory I disruptions.
It is one of the missions of the ITER experiment to study the behavior of plasmatransients. Therefore, it is not possible to completely predict how the plasma inITER will behave. Thus, uncertainties exist concerning the maximum possible
FDR-ITER Safety Assessment Chapter IV-Page 38

damage from a worst case disruption. One particular example is the productionof runaway electrons that could produce damage to plasma facing componentspotentially leading to coolant tube melting and an in-vessel coolant leak. Takingthe misalignment of the first wall/shield modules into account, the worstpossible breach size from runaway electron impact is estimated to be ~ 0.1 m2. Todemonstrate the robustness of the design to plasma events, a multiple failure offirst wall cooling tubes equivalent to 0.6 m2 was also analyzed. Such a break sizeis equivalent to double-ended ruptures of all outboard and inboard first wallcooling channels in a toroidal direction (see discussion of in-vessel coolant leaksbelow). Pressurization of the vacuum vessel due to water ingress is reduced by avery robust design of the vacuum vessel pressure suppression system which cansafely handle the maximum possible damage of plasma facing components.Consequently, no environmental release of radioactivity is expected due toplasma transients.
3.2.2 Loss of power
The consequences of a loss of off-site power for up to 32 hours were investigated.Loss of off-site power does not create any off-site hazard, and the consequencesfor the machine are very mild. After 30 seconds, the on-site emergency dieselgenerators pick up the loads of the equipment that are connected to the safetyrelated Class III busbars. Termination of fueling will automatically occur withina few seconds upon the loss of off-site power. The pumps of the primary coolantloops and in the heat rejection system loops for the divertor are tripped and coastdown. The plasma terminates either from active plasma shutdown due to lowflow signals in the primary cooling loops or from interruption of fueling. Whenthe Class III power is established, small pumps are started to maintain circulationin the first wall blanket, backplate and divertor primary heat transfer systemloops at about 10% of the nominal flow rate. In case of failure of these smallpumps, the water coolant will be slowly heated due to decay heat inside thestructures. Voiding in the cooling loop starts after ~ 25 minutes, but the coolingloop can initially absorb the steam and no coolant is expelled from the loop forabout two hours. About 10% of the primary coolant is expelled during the firstday. This coolant will be safely captured in drain tanks. The maximum FWtemperature reaches 400°C after 2-3 days. Thereafter temperatures decrease asdecay heat decreases.
Superconducting magnets remained cooled with helium circulation on Class IIIpower. The helium in the magnet coils provides substantial inertial coolingcapacity even if it is not circulated. The magnets can be discharged in case ofprolonged loss of external power. The breakers and instrumentation needed fordischarging operates on Class I electrical power (batteries). Slow discharge of thehelium is possible. In case fast discharge is necessary, the helium will be expelledfrom the coils but captured in expansion tanks.
The cryogen cooled parts in the tritium plant also remain cold with vacuumthermal insulation intact. If they heat up in a prolonged loss of off-site power,their inventory would be sent to the respective expansion tanks.
FDR-ITER Safety Assessment Chapter IV-Page 39

A loss of off-site power for one hour combined with loss of on-site emergencygenerators was examined to demonstrate the high degree of tolerance in thedesign. Although such a blackout is an extremely unlikely accident, the design issuch that there will be no off-site consequences.
The vacuum vessel heat transfer system is important to safety because it is themajor system that is intended to remove the decay heat. The flow control valvesin the vacuum vessel primary heat transfer system go to their fail safe position(heat exchanger bypass valve closes and flow limiting valve opens fully) andnatural circulation in the vacuum vessel loops is established to remove the decayheat.
3.2.3 In-vessel coolant leak
A large family of potential accidents is grouped around the IYER cooling systems.Sequences starting with coolant pipe failures in various cooling loops andlocations have been investigated and show the high degree of robustness in thedesign.
The thermal loads of a disruption of unexpectedly large magnitude canpotentially threaten the integrity of the first wall and divertor cooling channels.Different first wall pipe break sizes are investigated ranging from a single firstwall coolant pipe break (~ 1.6 cm2) to multiple first wall pipe break sizes up to0.6 m2. This is done to show that the ITER design can accommodate the worstpossible damage of in-vessel components caused by an unexpected disruptionwith perfect alignment of the first wall/shield modules that could conceivablylead to damage to two toroidal rings of modules (inboard and outboard).
For the worst-case 0.6 m2 break, the resulting water ingress into the vacuumvessel is severe. Figure 3.2-3 shows the pressure transient inside the vacuumvessel caused by this large coolant ingress. The vacuum vessel pressure reaches200 kPa at 4 seconds, causing the vacuum vessel pressure suppression systemrupture disks to open. The analyses show that the pressure suppression systemfunctions to suppress overpressures. At 21 seconds after the coolant ingress, thevacuum vessel pressure peaks at 380 kPa, i.e., below the vacuum vessel designpressure of 500 kPa. In the long term steam condensation inside the vacuumvessel pressure suppression system will re-establish subatmospheric conditions(< 100 kPa) inside the vacuum vessel.
Figure 3.2-4 shows the long-term thermal transient temperature of the first wall,shield and backplate. The temperatures increase due to decay heat, reaching apeak of 450°C at about one day, below the 500°C limit. Natural circulation in thevacuum vessel heat transfer system provides the long-term means of heatremoval. Chemical reactions between steam and dust on hot surfaces within thevacuum vessel can produce 5 kg of hydrogen.
While the accident could cause substantial damage to components in thevacuum vessel, the off-site dose consequences remain small. This is becausesome of the tritium and most of the corrosion products and dust will enter into
FDR-ITER Safety Assessment Chapter IV-Page 40

the coolant leaked into the vacuum vessel and remain in the liquid pool in thepressure suppression system. All releases remain more than four orders ofmagnitude below the Category III and IV limits.
An extremely unlikely case of a first wall coolant tube failure combined with afailure of a penetration line was analyzed. This event was selected as one of theCategory IV reference events because it combines a more realistic tube fault withan unlikely breach of the first and second confinement boundaries in one of themany hundred penetration lines. A representative bypass cross section of0.02 m2 to a standard room ("generic bypass room") was chosen. The room isassumed to be a stacked area without filtration for tritium and dust (ventilationrate ~ 100%/day). By including loss of off-site power and assuming a largebuilding leakage, the result demonstrates the robustness of safety in the ITERdesign. In this event, a tube in one of the in-vessel cooling systems breaks, andcoolant water flows into the vacuum vessel. The vacuum vessel is slow topressurize (i.e., minutes versus seconds) because of the small size of the break.The bleed lines to the pressure suppression system do open once the vacuumvessel pressure exceeds 110 kPa. In the case analyzed, the penetration linefailures connect the vacuum vessel to a standard room ("generic bypass room").Credit is taken for operator action to start the vacuum vessel maintenancedetritiation system after one hour. A large amount of the radioactive inventoryis carried through the bleed lines to the suppression pool where it remains forthe duration of the event. However, slow mobilization of tritium from co-deposited layers causes a continuous transport of radioactivity from the vacuumvessel to the generic bypass room. This flow is driven by the pressure build updue to the coolant break flow from the first wall tube break. The resultingenvironmental release of tritium, corrosion products and activation products forthis extremely unlikely event is a factor of three below the Category IV releaselimits.
To assess the ultimate safety margin, multiple first wall header pipe breaks with anet size of 7 m2 were investigated. This size exceeds the maximum in-vesselcomponent damage and can occur only if all pipes crossing the vacuum vesseltop ports would fail. Actuation of the pressure suppression system would limitthe maximum vacuum vessel pressure to 600 kPa. This maximum is reachedabout ten seconds after break occurrence and decays rapidly due to the operationof the pressure suppression system. This kind of pressure load stays withinallowable limits for "faulted" condition for the vacuum vessel and thus thedamage would be limited to local deformation. Failure of the weakest part of theconfinement barrier (e.g., windows) and failure of the valves in the lines behindthe windows was investigated as most challenging event to the confinementfunction. Releases from this hypothetical event are below the no-evacuationlimit because of limited inventory, isolation of the affected room and operationof the vacuum vessel pressure suppression system and maintenance detritiationsystem.
To assess the ultimate safety margin in decay heat removal, a calculation wasperformed with the very conservative assumption that all coolant is lost fromthe in-vessel components and the vacuum vessel. Best estimate decay heat
FDR-ITER Safety Assessment Chapter IV-Page 41
values were used in this analysis. Helium introduced inside the cryostat willbridge the thermal gap between the vacuum vessel thermal shield and the coldmagnets. Conduction and convection will provide heat transfer at 2.3W/m2-K.Figure 3.2-5 shows the temperature transients for various in-vessel componentsunder these hypothetical conditions. The first maximum in the FW temperaturecurve is 420°C and occurs at about one day. After one day, the FW temperaturedecreases due to the decrease in decay heat. A slow increase occurs again afterabout two weeks due to heat up of the magnet systems. Eventually a second peakof 475°C is reached after seven months. Environmental conditions assumedsurrounding the cryostat (20°C) lead to a subsequent decrease in temperature asdecay heat decreases with time. For air inside the cryostat the temperatureincrease beyond two weeks is larger due to the poorer heat transfer betweenvacuum vessel and cryostat (1.2 W/m2-K). In this case, it would take threemonths to surpass the FW temperature limit of 500°C
3.2.4 Ex-vessel coolant leakage
A range of coolant leaks outside of the vacuum vessel were investigated toensure that releases from such events will be acceptably small. The most severecase is discussed below. It is a postulated accident in the first wall cooling loop.
During plasma burn, a double-ended pipe rupture of the largest pipe(0.34 m2 flow area) is assumed to occur in the ex-vessel section of a Primary FirstWall/Inboard Baffle primary Heat Transfer System coolant loop. Coolant will bedischarged at a high rate into the heat transfer system vaults. The fusion powershutdown system will actuate on a signal from a pressure sensor in the vault orprimary cooling system and terminate plasma burn in three seconds. Even if theplasma is terminated, there is a possibility that the in-vessel cooling channelswill undergo damage because of the fast disruption that could be caused by theshutdown.
Only small amounts of hydrogen are generated by steam reacting with theuncooled plasma facing components because the maximum first walltemperature always stays below the maximum allowable long-term temperatureof500°C.
The maximum heat transport system vault pressure peaks at about 160 kPa.Larger coolant temperatures during baking (240 ± 10°C) would cause a peakpressure of about 240 kPa in case of a large coolant pipe rupture within the heattransport system vaults. This is below the design pressure of 260 kPa. Failure ofplasma facing components would cause pressurization within the vacuumvessel. The vacuum vessel pressure peaks at 0.11 MPa which is equal to thesetpoint for opening the bleed lines connecting the vacuum vessel and thepressure suppression system. The presence of water causes most of the tritium,dusts, and corrosion products to remain in the pool of water within the vacuumvessel pressure-suppression system. The corrosion products and tritium releasedinto the heat transfer system vaults also tend to remain with the condensedsteam on the vault floor. The off-site consequences of this event are small.
FDR-ITER Safety Assessment Chapter IV-Page 42

Releases are more than two orders of magnitude below Category IV releaselimits.
Fusion power shutdown is required for ex-vessel cooling system transients thatcould potentially propagate into an in-vessel loss of coolant event. Because thereis no direct inherent feedback between transients in the cooling systems (e.g.,ex-vessel loss of coolant, loss of flow, pump trips) and the plasma, an activesystem is required to terminate the plasma to prevent these ex-vessel eventsfrom propagating into an in-vessel loss of coolant event with the potential forsignificant hydrogen generation. The family of ex-vessel events examined inCategory III and IV show that as long as the fusion power shutdown systemworks, very little hydrogen is produced in-vessel and there are no significantradiological consequences. In the hypothetical event of an ex-vessel loss ofcoolant combined with the failure of the fusion power shutdown system, theuncooled first wall/shield modules experience elevated temperatures because ofon-going plasma operation until the plasma is terminated passively bysublimation of beryllium atoms from the first wall. This event is the mostsevere with respect to in-vessel loss of chemical energy control and hydrogenproduction. The results indicate that kilogram levels of hydrogen can begenerated in such events depending on key assumptions in the accident sequencedevelopment (e.g., in-vessel break size, chemical reaction rate safety factor).Since the hydrogen production stays below detonation limits, the secondconfinement barrier remains functional in the event and the radiologicalconsequences will remain well below the no-evacuation limit.
3.2.5 Heat exchanger tube leakage
On-line detection methods of the tritium level in the circulating water systemare available to measure heat exchanger leak rates. Based on experience inCANDU reactors, a tritium level of "7*104 Bq/ / can be detected with solidscintillators. For the maximum expected tritium concentration of 0.03 g(tritium) /m 3 in the primary heat transfer system, a coolant leak larger than 21 l/hcan be measured on-line. In these cases the circulating water system will beisolated in about five minutes following the leak, and releases will beinsignificant compared with the normal operational release limits. An ongoingplasma pulse will be terminated normally.
Small leaks (less than or equal 21 l/h) will be detected by taking regular testsamples of the circulating water system coolant. In case of such a small leakage,the leak will be detected and the circulating water system isolated to stopenvironmental releases ten hours following the leak. Decay heat is removed bythermal radiation to cooler modules and the vacuum vessel. Even with aconservative assumption of ground-level release for the cooling tower, thereleases are more than one order of magnitude below Category II release limits.
The unlikely event of a heat exchanger tube rupture will be detected, e.g., byonline measurements of increased tritium levels, in the heat rejection system.Isolation of the heat rejection systems occurs within five minutes and stopsenvironmental releases. By this time about 8% of the primary coolant has leaked
FDR-ITER Safety Assessment Chapter IV-Page 43

into the heat rejection system. Decay heat is removed by thermal radiation to thevacuum vessel The maximum in-vessel temperatures stay below 400°C in thelong term. Integrated releases are about a factor of 30 below Category III releaselimits.
3.2.6 Loss of flow
A pump trip in a cooling loop of the divertor primary heat transfer systemduring plasma operation is analyzed in detail. The divertor cooling loop wasselected because large heat fluxes experienced by this component makes it themost sensitive to loss of flow events. Operation of the fast fusion shutdownsystem on a reduced coolant flow signal terminates the heat load and no failuresoccur.
Consequences of a pump trip in a divertor primary cooling loop associated withthe failure of the fast fusion shutdown system have been investigated to showthat the design is tolerant to failures of this mitigating system. In case of a flowblockage in the divertor cooling loop, the temperature of the divertor targetincreases rapidly as shown in Figure 3.2-6. Copper heat sink temperatures above1000°C can be reached in 20 seconds. The plasma will be inherently terminatedonce the copper coolant channels are completely melted and coolant is releasedinto the vacuum vessel. In this case, hydrogen is produced by reaction of steamwith armor material of the divertor: carbon, beryllium or tungsten. The surfaceis rapidly cooled because of the large temperature gradient and residual coolant.Therefore the amount of produced hydrogen is less than 1 kg and there is nosafety concern. Another source of hydrogen production are reactions of steamwith dust particles on hot surfaces. The in-vessel dust inventory will be suchthat the maximum hydrogen production from dust stays below 5 kg.
3.2.7 Loss of vacuum
Although all vacuum vessel penetrations are designed with care to provide twoconfinement barriers, the large number of these penetration suggests that failureof a penetration line should be investigated. A loss of vacuum event resultsfrom this. The following event was selected to encompass all kinds ofCategory IV loss of vacuum events: failure of windows/valves in a vacuumvessel penetration line (0.02 m2 cross-sectional area). The penetration line isassumed to be connected to a generic bypass room with air atmosphere. Airingress into the plasma chamber terminates plasma burn by a disruption. Loss ofoff-site power is assumed to coincide with the initiating event and lasts onehour.
The air in the vacuum vessel heats up. The vacuum vessel and room pressureequalize about ten minutes after event initiation. Without crediting in-vesselcooling the first wall temperature heats up to about 400°C during the first day.Chemical reactions do not occur due to the limited temperatures. In-vesseltritium and dust are mobilized by the air ingress. Part of the mobilizedradioactivity is transported into the room due to the heat up of the air inside the
FDR-ITER Safety Assessment Chapter IV-Page 44

vacuum vessel. The room has a ventilation rate of 100%/day and the exhaust issent to the stack. After one hour it is assumed that operators will startmaintenance detritiation pumps to restore low pressure inside the vacuumvessel. Continued operation of this system is necessary to control the situationuntil the leak is plugged. The vacuum vessel atmosphere is cleaned up in are-circulation mode. Environmental stack releases are about a factor of fivebelow release limits for Category IV events.
To investigate ultimate safety margins, a loss of vacuum with a 0.2 m2
cross-sectional area was postulated into a room without connection to the stack.Initially, the ingress of air suspends dust and continues until pressure in thevacuum vessel equalizes in about three seconds. An air exchange flow (velocity~ 1 m/s) is established driven by the pressure difference between hot air withinthe vacuum vessel and cold air in the connected room. Operation of themaintenance detritiation system after one hour limits the environmentalground level releases below the no-evacuation threshold for conservativeweather conditions.
3.2.8 Maintenance
Since maintenance and changes to the in-vessel components are to be expectedfor ITER, potential accidents in this state are considered. An assumed failure ofone of the lines, port openings or closure plates was investigated to examine therobustness of confinement during maintenance. The worst postulated failure isaccidental opening of the temporary maintenance port cover. The failure can beat least partially corrected by operator intervention which is assumed to occuronly after about one hour. Since there is no driving pressure, releases are about afactor of 50 below the Category II project limits.
During the transfer operation of a divertor cassette to the hot cell, an accidentcould be postulated to occur which would damage the transfer cask and releasesome of its radioactive contents into the surrounding area. Decay heat will heatthe cassette up to about 130°C in a week without active cooling. The componentswill be cleaned in-situ before removal from the torus which limits theinventories at risk. However, assuming that in-situ removal was not possible fora particular cassette, the amount of tritium that could be mobilized under contactwith air is conservatively estimated as 10 g for one divertor cassette. In thegallery and the passages leading to the hot cell, no means are available to recovertritium so any leakage from the cask will be released from the stack. Since theHVAC systems for the areas where radioactive material is handled will includeparticulate filters, most of the activated particulate will be captured. The totalenvironmental releases are about one order of magnitude below Category IVlimits.
3.2.9 Tritium process pipe leakage
Failures of the tritium processing equipment have been investigated. In such anevent, process gas will be released to the secondary confinement if the primary
FDR-ITER Safety Assessment Chapter IV-Page 45

system pressure is higher than the confinement pressure, or confinementatmosphere will equalize inside of the primary component if initial pressure islower. There would be no flammable hydrogen mixtures since the secondaryboundary will either contain an inert gas or be evacuated. The tritium release isthe total of tritium losses from the glovebox to the process room and the releasesthrough the glovebox atmosphere detritiation system in series with the ventdetritiation system. The expected tritium atmospheric release is significantlybelow the daily normal effluents.
In the extremely unlikely event of failures in the process and secondaryconfinement piping, tritium will leak into the area room. The room will beisolated from normal ventilation and valved into the atmosphere detritiationsystem. A time delay of 15 seconds between detection and isolation was assumed.The total tritium content of the room is 16 g (tritium) at 15 seconds when theheader system is isolated from the pump and surge tank. The tritium inside theroom atmosphere is cleaned up in re-circulation mode by the atmospheredetritiation system. Instrumentation and control systems are provided withun-interruptible power and the room detritiation system is on emergency powerthat should be available within 30 seconds after a loss of off-site power. The totalexpected tritium loss is about 0.4 g-T. Essentially all of it is released during thefirst 15 seconds before the process room is isolated. The 0.06 m3 volume of theprocess gas mixture will not form a flammable mixture with air in the large2,000 m3 room, since less than < 0.1% of the room air will reduce the hydrogenconcentration below the lower flammable limit of 4%.
Failure of the cryogenic distillation column (CD50) in the isotope separationsystem that has the highest tritium inventory (200 g (tritium)) in its secondaryconfinement leads to a small tritium release. Releases from the isotopeseparation system are contained within secondary confinement and nohydrogen-air mixtures are formed.
3.2.10 Magnets
The magnet set has been designed to ensure that the electrical energy stored inthe magnets is controlled and off-normal events in the magnet system do notpropagate to nuclear confinement boundaries. However, the large energy storedin the toroidal field coils (~ 100 GJ) and the geometrical location of the magnetsbetween the two confinement barriers (vacuum vessel and cryostat) are strongreasons to examine events that could potentially damage confinement barriers.
A postulated event is a combination of faults that leads to an arc which maydamage a confinement barrier such as the vacuum vessel or cryostat. A quench(transition from superconducting to normal) is postulated in the joint regionnear a feeder connection of a toroidal field (TF) coil. Operational quenchdetection is provided by multiple primary and backup systems for all coils. Theprimary system uses voltage measurement. Resistive voltages as low as 0.1 Vcan be detected and a fast discharge would be initiated at ~ 1 V (within ~ 2 s forthe TF coils). A backup is provided by flow rate (or pressure) sensors within eachconductor cooling channel, which require longer to clearly identify the helium
FDR-ITER Safety Assessment Chapter IV-Page 46

expulsion associated with a quench (5-10 s). A final backup is provided for eachcoil by a flow rate sensor after the manifolding region with a response time in therange of 10-20 s.
If the operational quench detection fails to initiate a fast discharge of thequenching TF coil, a short may occur and develop into an arc. The safety-relatedarc detection system will detect the development of an arc into the cryostatwithin the TF coil system. The arc detection is limited to the TF coil joint regionand coil feeders, which is separate from the cryostat vacuum. Each separatefeeder containing the busbars and current leads of a TF coil has redundant(2 train) vacuum pressure detectors (arc development requires gas evolutionfrom burning insulation and would likely also lead to the leakage of helium intothe busbar containment). An alternative system may use thermal radiationdetectors. The detector will activate directly the fast discharge system of the TFcoils through an independent, hard-wired activation system.
Fast discharge of the coil system limits the coil energy to < 10 GJ even if thequenched coil is fully shorted. The quench will eventually spread but only afterextensive melting and arcing have developed at the initial quench location.Analysis shows that the TF coil case will be able to resist both the excess pressureand the thermal stresses arising from this event with local yielding developing atthe end stages of the internal quench. For a quench initiating in the joint region,some molten metal may enter the cryostat if the case/busbar containment islocally melted. An arc is likely to spread into the busbars themselves, burningback to the current leads driven by the energy from the other TF coils. Thehelium associated with the quenched coil could be vented into the cryostat. Thearc burning back to the current leads may cause damage to the cryostatfeedthroughs leading to air ingress.
For the TF coil accident analyzed, damage to the vacuum vessel, tritium linesand primary heat transport system pipes will not occur and no radioactivereleases are expected to occur. In any case, releases to the environment caused bypotential damage to confinement barriers from magnet-related events will bebounded by the assessments of cryostat water, helium and air ingress.
A large class of off-normal conditions is analyzed to investigate the potential forstructural damage to the magnets.
Exceptional CS or PF coil current can cause off-normal CS or PF coil forces. Asource of overcurrents in the CS and PF coils is a short circuit of the coil at itsnormal conducting busbars outside the cryostat. Short circuits ofsuperconducting bus bars are avoided by design. To investigate the structuraleffects of overcurrents due to shorted CS or PF coils, it is conservative to considerthe conditions where each individual coil is at its critical current (current atwhich coil quenches) and the others have been discharged to zero current. In theCS, some local yielding under hoop tension can occur in the inner conductorsbut this does not lead to structural failure. Catastrophic crack propagation isprevented by the distributed nature of the structural material in the individualconductor. In the PF coils, there is a sufficient margin not to exceed the allowable
FDR-ITER Safety Assessment Chapter IV-Page 47

stresses for all conceivable faulted load cases. The PF coil supports will bedesigned to preclude cracks that could lead to catastrophic failure, and they willbe monitored to detect signs of progressive failure.
Exceptional PF coil currents can cause off-normal, out-of-plane forces of the TFcoils. Overcurrent in individual PF coils, or exceptional combinations ofcurrents in sets of coils, can cause off-normal patterns in the out of plane forceson the TF coils that can overload the support structure or the cases themselves.Two sets of PF coil off-normal currents were used to bracket the off-normalforces:
• Any individual PF coil carries its critical current (due to a short) and allthe other coil currents are zero. This surveys the possibility of a shortedPF coil; and
• The PF coil currents can take any combination of values between thepositive and negative maximum operating current. This surveys thevarious cases of off-normal current distributions from the powersupplies that are considered to bound the most severe crediblecombinations.
A structural assessment has been made using a beam and shell finite elementmodel. From the point of view of the safety assessment, the stress levels areabove the allowable in several locations in the TF coil case, but below the yieldstress. There is also no contact between TF coils and vacuum vessel, even underthe worst faulted PF coil condition.
Since the TF coil case supports about 45% of the TF coil bursting force, fatiguecracks can occur within the case due to pulsing of the PF coil. Initial inspectionensures that any defects would be small; nonetheless, the consequences of afailure of the TF case due to crack growth was investigated. In the case of a largefailure of the complete case, complete structural failure of the coil cross-section(plates and case) is not possible even in the case of a shorted TF coil.
Although TF shorts are avoided by design, the structural effects of a shorted TFcoil on the magnets and their structures was investigated to determine therobustness of the magnet system. Severe local plastic deformation occurs in theTF case and intercoil structures, and some shear key and bolt failure may occur.Possible loss of cryostat vacuum may also occur due to thermal shield damage.However, there is no gross structural failure and no impact of magnets onvacuum vessel or cryostat wall.
To assess the ultimate safety margin, an unmitigated TF quench is investigated.It leads to arcing in either the busbar region of the TF coil or inside the TF coiland potential damage to confinement barriers is the most severe challenge. Suchan event is very difficult to analyze. None of the calculations performed thus farpredict coil damage configurations that would result in failure of both thevacuum vessel and cryostat confinement boundaries. Were such a configurationto occur in future calculations from an arc or from hypothetical missiles, thermalloads, etc. associated with release of magnetic energy, the consequences are
FDR-ITER Safety Assessment Chapter IV-Page 48

bounded by a postulated 1.0 m vacuum vessel and cryostat confinement bypass.In this confinement bypass event, although the mobilized inventories of tritiumand dust are large, releases are well below the no-evacuation limits because ofcapture of radioactivity by the vacuum vessel pressure suppression systemthrough the bleed lines, which open at 110 kPa, and cryopumping of the cryostatatmosphere by the magnets and other cryogenic surfaces in the cryostat.
3.2.11 Cryostat
The safety of the cryostat was investigated by postulating air, water and heliumingress into it. An air leak through a break size of 0.02 m2 was investigated. Thisis a representative size for many of the cryostat penetrations. During the firsthour, the pressure hardly rises inside the cryostat due to effective condensationof the air entering it. The accumulated weight of frozen air on cryogenic surfacesamounts to about seven tons. After about three hours, the cryostat reachesatmospheric pressures, and after eight hours the maximum pressure reaches102 kPa which is just above atmospheric pressure and causes air to flow back intothe room. For larger break sizes the basic phenomena stay the same. Vacuumbreakers are foreseen in the design of rooms with potential connections into thecryostat to avoid de-pressurization.
Postulating damage to one of the primary heat transfer system cooling lines leadsto rapid coolant ingress into the cryostat. Condensation on the cryogenic surfacescauses moderate pressurization to 8 kPa. Thus, subatmospheric conditions arepreserved and no environmental release of radioactivity inside the primarycoolant occurs for this event.
A combined leak of helium, air and primary coolant into the cryostat wasanalyzed to bound potential damage from the magnet system. The cryostatpressure reaches a maximum value of 103 kPa in six minutes. Without thepostulated air leakage the maximum cryostat pressure might reach 170 kPa for acombined helium and primary coolant leak. Pumping of the cryostat volumesrestores subatmospheric conditions in 32 hours. The condensed mass oncryogenic surfaces amounts to about 20 tons. Due to this condensation,environmental releases are more than four orders of magnitude below releaselimits Category TV events.
3.2.12 Hot cell
Potential accidents for the hot cell were investigated. Events within Category IIwill not result in failure of the hot cell confinement so releases are small. Arelease within Category IV would be bounded by an event with both loss ofconfinement and failure to cool the in-vessel components. This event wasanalyzed for the divertor storage area. A break at the inlet of the Air DetritiationSystem was assumed as this resulted in the maximum air flow from theconfinement. The temperature of the divertor cassettes was analyzed anddetermined to only increase by a few degrees after the air coolers failed. As aresult, the outgassing rate will not significantly increase. The tritium releases
FDR-ITER Safety Assessment Chapter IV-Page 49

were determined to be about 0.015 g-T. This is about four orders of magnitudebelow Category IV release limits.
3.3 Seismic safety assessment
In addition to the 28 reference events that envelope the safety consequences ofinternal failures, an assessment has been made to show that the ITER facility isadequately designed against site hazards consistent with the ITER siterequirements and site design assumptions, specifically earthquakes. Anassessment of site-specific natural and man-made external hazards will be carriedout following site selection to confirm required safety function capability.
An infrequent, severe earthquake (SL-2) which, although unlikely to occurduring the lifetime of the facility, is assessed to demonstrate adequate publicprotection. This earthquake is assumed to have a peak ground acceleration of0.2 g horizontal and vertical with a return period of 10,000 years. The designrequirement is to ensure that required safety functions are provided and releasesfrom the facility do not exceed Category IV release limits.
Both static and dynamic analysis of the tokamak building have been carried outusing the response spectra based on the assumed design basis ground motions. Asimplified 3-D Finite Element Shell-beam model has been built to performseismic analysis of the ITER machine [Sor97]. The model consists of thefollowing parts:
- TF and CS coils and Pre-Loading Structure;
- PF coils with their Flexible Plates Supports;
- Gravity Supports;
- Vacuum Vessel with Vertical Supports and Toroidal Links;
- Blanket with its Back Plate;
- Divertor;
- Ring Pedestal; and
- Cryostat.
Figure 3.3-1 provides a 3-D display of acceleration due to the horizontalearthquake forced at the basemat. The stiffness of the gravity support is aboutoptimum with the primary natural frequency of around 1.5 Hz. The maximumradial mutual displacements are within the acceptable range as well as thedisplacement between the vacuum vessel and back plate, between the vacuumvessel and TF coils, and between vacuum vessel and cryostat.
There is a probability that a seismic event that leads to in-vessel motion wouldtrigger a disruption, for example, due to dust falling into the plasma, loss of
FDR-ITER Safety Assessment Chapter IV-Page 50

magnetic signals, false (motion induced) signals or loss of plasma control.Control failures under some circumstances may lead to vertical displacementevents (VDEs) which in turn lead to higher loads on structures. For thesereasons, a disruption or VDE load is assumed in addition to that from theearthquake. The predicted vertical/horizontal load due to the maximum VDE is150/50 MN. It is unlikely that every potential disruption, resulting from the SL-2earthquake, is preceded by the most severe VDE. Referring to the seismicanalysis results, the maximum mutual displacement between the vacuum vesseland the TF coil is 19 ~ 25 mm for the horizontal seismic load of 85 ~ 110 MN,which should be compared with 40 mm of the available gap, indicating that thecurrent design is likely to accommodate the maximum horizontal load of~ 170 MN. Since the predicted seismic peak force, in the toroidal direction, is85 ~ 110 MN, the superposition of the maximum VDE (~ 50 MN) with SL-2Earthquake totaling to 135 ~ 160 MN, is likely to be accommodated with nodamage to the confinement function of the vacuum vessel. Under thiscondition, there will be some damage to thermal insulation between the TF coilsand the vacuum vessel. As to the vertical VDE load combined with the verticalearthquake and dead weight, the most critical components are the vacuum vesselsupports. With the FDR design of 224 of 25.4 mm diameter Inconel rods persector, which can be further optimized as needed, it is feasible to accommodate ahypothetical load combination of SL-2 and "maximum" VDE within thestructural margin of the vacuum vessel support structures. An SL-2 earthquakewith a maximum VDE is a category V event, extremely rare and hypothetical,that allows a "best estimate' approach with technical judgment. Application of aregulatory endorsed structural design code with a specified structural margin isnot required, and a code-based structural assessment has not yet been fullyperformed.
Designated, seismically-qualified systems will survive, and their safety functionwill not be impaired. In particular, there will be no primary heat transfer systempipe ruptures (although some increased leakage may occur). Adequateradioactive confinement barriers will remain intact although some releases mayoccur from non-seismically qualified, smaller inventory systems. Sufficientheating, ventilation and air conditioning systems are qualified to ensure anelevated release.
It is concluded that UER can be designed such that postulated earthquakes wouldnot cause releases exceeding project release limits. Design changes of thetokamak building can be introduced to accommodate seismic loading up to 0.4 g,if judged necessary for a site specific design.
3.4 Ultimate safety margins
Given the fail-safe nature of the fusion energy reaction, modest mobilizableradioactive inventories, multiple layers of confinement, and passive means fordecay heat removal, ITER is expected to be "safe" with little dependence onengineered, dedicated "safety systems" for public protection. However, theinventories are large enough to warrant a detailed assessment of accidents thatare very low in probability, so called hypothetical events (Category-V).
FDR-ITER Safety Assessment Chapter IV-Page 51

Table 3.4-1 shows the tolerable confinement release fractions to meet theCategory-IV dose limit and the Category-V no-evacuation objective (early dosebelow 50 mSv). These are the tolerable releases divided by the maximummobilizable inventories. For average and conservative weather, 100% of theinventory of tritium and W dust could be released via the stack in a Category Vevent and still meet the no evacuation objective. For average weather, tolerableground level release fractions range from 90-100%. Tolerable release fractions forground level releases with conservative weather are the most restrictive (7-25%)as expected for this conservative meteorological release condition.
TABLE 3.4-1Tolerable Confinement Release Fractions to Meet Category-IV
Dose Limit and Category-V No-Evacuation Objective
Event SequenceCategory
Criteria
Weather conditions*Release heightTritium as HTO fromin-vessel (1350 g-T)Tritium as HTO from a singletritium plant system(100-350 R-T)Tritium as HTO from totaltritium plant circulatinginventory (700 g-T)Metal from plasma-facingsurfaces via dust (100 kg W)
Extremely UnlikelySequences (Cat-IV)GDRD release limitGSEDC dose limit
ConservativeElevated
7%
30-100%
14%
2%
HypotheticalSequences (Cat-V)
50 mSv early dose, illustrative forno-evacuation objective
AverageElevated
100%
100%
100%
100%
Ground90%
100%
100%
100%
ConservativeElevated
100%
100%
100%
100%
Ground7%
25%
13%
16%
a. Conservative weather conditions refer to very little dispersion and dilution of the radioactiveplume.
Analysis of hypothetical events show that the ITER design has sufficient safetymargins to provide a high level of public protection and to meet the 50-mSvno-evacuation criterion for both average and conservative weather. Releases forthe events considered are summarized in Table 3.4-2. The most limiting casesare the wet and dry confinement bypass events. Releases in these events areroughly an order of magnitude below the no-evacuation threshold for averageweather. The margin decreases for conservative weather.
FDR-ITER Safety Assessment Chapter IV-Page 52

TABLE 3.4-2Summary of Category V Releases
Event(Type of Release)
Decay heatOverpowerEx-vessel / In-vesselLoss of CoolantT plant, circulatinginventory (elevated)T plant explosion(elevated)
1 m2 W + 1 m2 CVConfinement bypass(elevated)Wet bypass - 30 sisolation of GBR(ground)Wet bypass - 1 hrisolation of GBR(ground)Dry bypass - LOVA(ground)
%ofNo-evac
LimitAverageweather
« 1« 1« 1
<6(a)
0.2
< « 1
5
16
8
%ofNo-evac
LimitConservative
weather« 1« 1« 1
<44 (a)
2
<« 1
22
72
43
(a) Circulating tritium inventory (700 g) assumed to bereleased.
Safety margins are maintained in ITER for these hypothetical events because oi:
• Adequate structural margins in the design of the vacuum vessel tomaintain integrity for the range of potential in-vessel coolant leaksfrom one cooling channel to a hypothetical break of all in-vessel pipes;
• A robust structure such that there will be no catastrophic failure (orgross loss of geometry) due to plasma or magnetic forces;
• Inherent passive shutdown of the plasma when the first wall reaches800°C - 1150°C due to mechanical failure or beryllium evaporation, andintrinsic fail safe termination of the plasma in case of in-vessel water orair leaks;
• Modest mobilizable radioactive inventories of tritium and activationproducts. Therefore, ultimate performance of confinement barriers thatmust be assured in accidents is not very stringent; about one or twoorders of magnitude release reduction for tritium and mobilizablemetallic dust for ITER;
FDR-ITER Safety Assessment Chapter IV-Page 53

Releases from the vessel even in the case of an in-vessel coolant leakwith a bypass of the vacuum vessel and cryostat confinement barriersare limited due to limited inventories, isolation of the affected genericbypass room, and operation of the vacuum vessel pressure suppressionsystem and maintenance air detritiation system;
A passive heat removal system (the W HTS) and processes;
Long time scales for component heat-up following events because forheat removal by radiation from in-vessel components to the vacuumvessel and by natural circulation of the vacuum vessel heat transfersystem;
Low decay heat density which cannot melt the structure even if all theheat transfer systems are hypothetically assumed to be lost. Injection ofhelium into the cryostat within a few hours will bridge the thermalisolation between vacuum vessel and huge heat sink of the cryogenicstructures of the magnet system. The maximum temperatures in sucha case are low (< 500°C); and
A design that is tolerant of failure of mitigating systems, such as failureof vacuum vessel and cryostat penetration line isolation and failure ofthe fast fusion power shutdown system.
FDR-ITER Safety Assessment Chapter IV-Page 54

4 OCCUPATIONAL SAFETY
The ITER Project has established a program for personnel protection againsthazards that are anticipated to be present at the ITER facility during operationand maintenance activities. The objective of the occupational safety analysis istwofold. First to identify the hazards and conditions during operation andmaintenance as they relate to personnel safety. The hazards to personnel are:
• External and internal radiation exposure from activated components,tritium, tokamak dust and activated corrosion products;
• Industrial hazards, such as beryllium exposure, electromagneticexposure, cryogenic fluids, inert gases, high voltage, and otherhazardous substances.
The other part of the objective is to perform sufficient analysis and occupationalsafety program development to ensure that occupational safety has beenadequately considered in the design of ITER systems and components and,thereby, to gain sufficient confidence that a high level of worker safety will beachievable during operation and maintenance activities.
4.1 Radiation protection program (RPP)
The RPP is a set of systematic processes that identify and control both theradiation hazards and the exposure of personnel to these hazards. The ITER RPPis based on internationally accepted radiation protection principles andwell-established precedents. The objectives of the RPP are to:
• Prevent occupational doses over legal limits;
• Prevent acute over-exposures;
• Maintain personnel doses As Low As Reasonably Achievable(ALARA);
• Minimize spread of contamination;
• Maintain public exposures ALARA;
• Minimize releases of radioactivity to the environment.
To meet these objectives, the RPP relies on the principle of ALARA and on thecontrolled movement of personnel and materials. Accessibility is defined as afunction of hazard level and related zoning, worker classification and workerexposures. These must be achieved through good design practices. Guidance isgiven for the design process to ensure that the facility will be operable as per theRPP, recognizing ALARA as a key RPP element.
FDR-1TER Safety Assessment Chapter IV-Page 55

ALARA
The ALARA principle used for ITER is the following:
"Every effort shall be made to ensure that risks created by the existence ofradioactive hazards in ITER are maintained as low as reasonably achievable.Radiation exposures, risk of unplanned exposures, and production of radioactivewaste shall be minimized during the design, operation, modification, anddecommissioning phases of ITER by implementing known ALARA principles."
The ALARA principle is basic to each component of the RPP. The specificALARA process is described in Section 4.3.
Exposure Limits
Limits for occupational exposures are derived from the regulatory limits that, forITER, are taken from ICRP recommendations. As per ICRP-60, the assumedregulatory limit for Radiation Workers (RW) is 20 mSv/a. Following an IAEArecommendation, two classes of RW are identified (RW-I and RW-II) based ondifferent radiation exposures anticipated for different work activities. The RW-Iworkers will be subject to an annual exposure limit of 20 mSv, whereas theRW-II workers are not expected to be exposed as regularly and are thereforesubject to a reduced annual individual exposure limit of 6 mSv. The ICRPrecommended limit of 1 mSv per year for members of the public is applied toITER personnel considered Non-Radiation Workers (NRW).
These regulatory limits cannot be directly used as they are for design oroperation, but they are used to derive ALARA guidelines for exposure control.The design process is subject to ALARA guidelines for individual and collectiveexposures that have been derived and rationalized based on these regulatorylimits. It is anticipated that during operation, ITER will, as per present industrypractice, operate within limits that will be a fraction of the regulatory limit of thehost country.
Access and Zoning
A process to ensure safe access, including well designed radiation access zones, isfundamental to meeting the RPP objectives. Properly implemented, they form abasis for contamination control, dose control, and prevention of unplanned,acute over-exposures.
The room or area classification depends on the exposure and contaminationconditions estimated for 24 hours after shutdown for maintenance. This allowsthe design to be based on the accessibility of an area when access is actuallyrequired. Accessibility depends on the actual hazard levels and the classificationof the workers as well as the access zone designation.
Any activities or operating conditions that can cause an otherwise accessible areato have prohibitive occupational hazards, will cause the area to be "Restricted."
FDR-ITER Safety Assessment Chapter IV-Page 56

This is achieved with a physical system that has two requirements, (1) to preventthe activity or operating conditions, if an affected location is occupied, and (2) tophysically prevent human access for the duration of the activity or conditions.
Table 4.1-1 presents the RPP access zone definitions, exposure limits, andconditions.
TABLE 4.1-1Access Zones, Requirements and Conditions
AccessZone
A
B
C
D
Requirementsfor Access
These are areas with free access for all site personnel. Noradiation protective equipment requirements or restrictions.No significant radiation fields and no airborne or surfacecontamination hazards. No special monitoring required. NoRadiation Work Permit (RWP) required.An area allowing unregulated access for RW-I and RW-II.These areas have very low radiation hazards so radiationworkers may access without special planning or RWP.However, special permission is required for access of NRW.
An area where access for all personnel requires appropriateradiation protection (RP) and exposure planning. Access isconditional on an RWP with appropriate level of approvalfor the class of personnel.
These are restricted areas, entry is by exception and occursonly under an RWP with a high level of approval horn bothan operational and a radiological safety view. This meansthat, given the radiological hazards, the performance ofthe task is justified (operational approval), and thatadequate safety precautions have been taken (radiologicalsafety approval).
Contamination andExposure Conditions
Dose rates < 0.3 uSv/hand no detectableairborne or surfacecontamination
Dose rates< 3.0 nSv/h, includingboth external andinternal. Potential,infrequent cross-contamination allowedExternal dose rates<750 uSv/handairborne tritium< 75 MPCa.Contaminationallowed withadequate controlExposure orcontaminationconditions exceed thoseof Access Zone C.
The RPP also includes specific requirements for contamination control,personnel exposure control, hazard control and monitoring, and radiationprotection administration and management.
4.2 Radiation hazard information and zoning
Estimated radiological hazard information is used with the zoning criteria of theRPP to define the access zone maps for FTER. The basis for the radiologicalconditions is the neutron activation analysis modeled for the end of the BPP forthe limiting operational scenario. This is used for both neutron activation of in-vessel components and structures, and for calculation of activated corrosionproducts (ACP) in the coolant systems. The access zone maps illustrate howaccessible the various locations are, and what hazard levels are acceptable.
FDR-ITER Safety Assessment Chapter IV-Page 57

Access zone maps have been developed for the Tokamak Building, the TritiumBuilding, and the Hot Cell Building.
4.3 Radiation protection assessment
A radiation protection (RP) assessment process has been developed. Theassessment is performed to gain sufficient confidence that a high level of workersafety will be achievable during operation and maintenance activities. Byassessing the design, the highest exposure and risk areas are identified for dosereduction methods, such as shielding, remote handling, contamination control,etc., to be applied to these areas. More refined assessments are performed witheach iteration as the design is improved and greater design detail is available.
Since ITER is not an operating facility, the assessment process is of theengineering design and the proposed maintenance schemes, not of performance.However, the assessment is for the sake of performance. Hence, facility elementsthat are anticipated to be the cause of difficulties in access control, contaminationcontrol, or exposure control are identified for dose reduction methods. Dosereduction methods are applied to those areas where the impact is potentiallylargest.
The assessment methodology for ITER is graphically presented in Figure 4.3-1.The process begins with the review of the entire facility. It then proceeds to thedevelopment of goals, the application of these goals to the specific ITER systems,modification of the facility, and then repeats. Each repetition may likely result ina new set of goals being developed as the assessment is refined and the design isoptimized. The process should continue during operation, when the highest riskactivities should be reviewed for exposure reduction, and when precedent can beused to optimize activities.
4.4 ALARA implementation
The current ALARA methodology aims at showing that the ITER facility, as awhole, adequately considers ALARA. The ITER systems are compared to oneanother and dose reduction is applied to those systems with the greatestradiological hazard potential. Addressing the highest risk systems first is themost efficient way to reduce potential exposure and risk in ITER.
As the ITER design becomes more detailed, and dose estimates become morerefined, ALARA may be applied and demonstrated for each system. At this stageof the design, ALARA has been applied to the highest risk systems and theprocess is to be continued in an iterative way. The process is executed anddocumented in three steps as follows:
1. Preliminary qualitative RP review. Each system is reviewed for radiologicalsafety in a round table discussion with appropriate engineering and safety staffpresent. The intent is to identify potential problems in accessing componentsfor operation and maintenance activities, possible deterioration of
FDR-ITER Safety Assessment Chapter IV-Page 58

contamination control, or significant potential for individual or collectiveexposure during required operation and maintenance activities.
2. Judgment of occupational radiological safety risk of systems. This step is basedon the results of step 1 and is designed to identify systems that can benefitmost from a more thorough review. It is important to focus in step 3 onthose systems that pose the greatest potential risks. The systems are judgedbased on dose rates, collective exposure, contamination control, accessibility,and the current understanding of potential problems.
3. Detailed RP and/or ALARA analysis. This is the application of the ALARAgoals and guidelines as described in the RPP.
In step 1, the ITER systems were reviewed and areas of concern highlighted. Inmost cases, options for improvement have been discussed and are in the processof either being adopted or of being reviewed for iteration.
In step 2, the results of step 1 were ranked in a qualitative way to establish theneed for ALARA review. These judgments are also quantified to be able to moreclearly illustrate the priorities assigned to the systems. The results of this step aresummarized in Table 4.4-1:
TABLE 4.4-1Judgment on Occupational Radiological Safety Risk
Judgment of Need for ALARA Analysis
High
Medium
Low
Preliminary assessment to be performed
Systems4
4
4
4
• Divertor Cassette> Cryopumps• PHTS• HCB and Radwaste» Diagnostics• Vacuum Pumping Systems• ICH> NBI> RH Equipment> PS Coil/Dist> ECH> Fueling
> Tritium plant> Magnets and Structures
Vacuum Vessel> Blanket
Cryostat* Detailed design of the Diagnostics System will occur later in the project and is expected to
require ALARA implementation to reduce occupational radiation exposures duringmaintenance.
In the last part of the RP Assessment, the highest ranked systems are placedunder greater scrutiny using the specific ALARA process and guideline asdescribed below. Criteria are set for hazard levels as well as individual andcollective doses for guidance. These criteria are not absolute levels below which
FDR-ITER Safety Assessment Chapter IV-Page 59

there is no further concern. As described previously, the ALARA process is aniterative one that will continue into the operations stage.
A. The design is reviewed and if an activity is identified to likely requirean individual to exceed 2 mSv in one shift, then either the activity orthe system is modified.
B. The design is reviewed to identify those systems with the highestpotential for personnel exposure to radiological hazards.
C. The collective dose required for operation and maintenance activitiesfor the systems identified in step B is estimated. Those systemsrequiring annual activities that are expected to exceed a total of30 person-mSv are subject to possible dose reduction methods. Also forthese systems, any tasks performed less often than once per year arereviewed separately. If the occupational radiation exposure (ORE) forthe task is estimated to exceed 30 person-mSv, dose reduction methodsshould be considered.
D. A more formal ALARA process is applied to those systems identified instep C. Steps are taken to reduce the estimated exposure, unless it canbe shown that "deployment of resources is seriously out of line withthe consequent reduction."
Established ALARA iterative process and guidelines have been consistently usedin the ITER design process as an instrument to optimize shielding andmaintenance procedures during design evolution up to and including finaldesign when the basic machine parameters have been fixed. At this time OREestimates and ALARA analyses have been performed and documented fordivertor cassette replacement, cryopump replacement, and PHTS maintenance,as presented below, which have been ranked in Table 4.4-1 to be of highoccupational safety priority. Analysis is in process for the HCB/Radwaste and thediagnostic system activities.
Divertor Cassette replacement: The ALARA analysis of the DV cassettereplacement has been performed several times during design evolution to helpto find an optimal shielding design. The latest occupational radiation exposure(ORE) for divertor cassette replacement was estimated based on the FDRdocumentation and neutron activation and gamma transport analysis. In orderto reduce the dose rates in the DV and cryopump maintenance ports to a 100tiSv/h level which has been judged to be adequate to properly protect workersduring hands-on maintenance, the two basic shielding improvements have beenintroduced:
• Increase appropriately port wall thickness; and
• Install a 15 cm thick plate (75% SS and 25% water) between the vacuumvessel and the blanket to replace the original 3 cm thick gas sealconfiguration.
FDR-ITER Safety Assessment Chapter IV-Page 60

These measures have resulted in considerable reduction of occupationalexposure as shown in Table 4A-2, Case 2, in comparison with initial ALARAanalysis, Case 1, where gamma field levels were a conservative estimate for thetokamak design before optimization. Introduction of a thicker gas seal and fillingthe gaps around the struts have appreciably reduced neutron streaming frominterspace between Back Plate and VV into the divertor port. The results ofALARA analysis are summarized in Table 4.4-2:
TABLE 4.4-2Example of ALARA Application'
for Divertor Maintenance
Collective ORE
Single Cassette
Quadrant
Full Divertor
OREinitial
(pers-mSv)
73
101
404
OREreference FDR
(pers-mSv)
13
30
120
* The number of workers is based on 1 person required for each 3person-mSv collective doses estimated.
A full divertor replacement, which is anticipated to occur three times (only twotimes for activated divertor components) in the BPP and five times in the EPP,would require 120 person-mSv in the reference FDR case. The two key areas ofexposure in the quadrant case are the hands-on activities after the bioshield isremoved, and the cooling pipe cutting.
It should be noted the above estimate is for the FDR reference design. Furtherreduction of occupational exposure can be achieved, if necessary, by optimizinghands-on maintenance activities which will be clarified in more detail byimplementing appropriate mock-ups under the Project-7.
Cryopump replacement: The removal and replacement of the cryopump followsa similar set of steps as for the removal of a single divertor cassette. The largestdose contributor is work performed after the bioshield is removed.
The ALARA analysis of the cryopump replacement has also been done severaltimes to reflect evolving design and to help optimize the design. The firstestimate was based on preliminary modeling and analysis of the designconfiguration and maintenance scheme assumptions. The hands-on workingtimes were a first order estimate as per the maintenance strategy of June 1997.The collective dose estimated for the removal and replacement of a singlecryopump was in the range of 5.7~29 person-mSv, depending on shieldingconfiguration assumptions. This was approaching the ALARA benchmark of30 person-mSv.
FDR-ITER Safety Assessment Chapter IV-Page 61
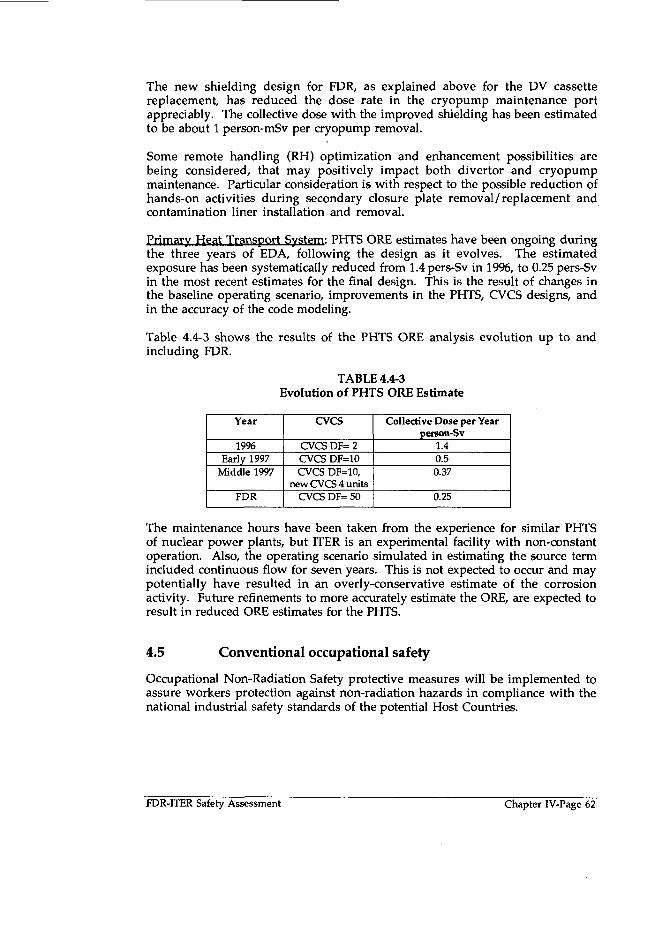
The new shielding design for FDR, as explained above for the DV cassettereplacement, has reduced the dose rate in the cryopump maintenance portappreciably. The collective dose with the improved shielding has been estimatedto be about 1 person-mSv per cryopump removal.
Some remote handling (RH) optimization and enhancement possibilities arebeing considered, that may positively impact both divertor and cryopumpmaintenance. Particular consideration is with respect to the possible reduction ofhands-on activities during secondary closure plate removal/replacement andcontamination liner installation and removal.
Primary Heat Transport System: PHTS ORE estimates have been ongoing duringthe three years of EDA, following the design as it evolves. The estimatedexposure has been systematically reduced from 1.4pers-Sv in 1996, to 0.25 pers-Svin the most recent estimates for the final design. This is the result of changes inthe baseline operating scenario, improvements in the PHTS, CVCS designs, andin the accuracy of the code modeling.
Table 4.4-3 shows the results of the PHTS ORE analysis evolution up to andincluding FDR.
TABLE 4.4-3Evolution of PHTS ORE Estimate
Year
1996Early 1997
Middle 1997
FDR
CVCS
CVCSDF=2CVCS DF=10CVCS DF=10,
new CVCS 4 unitsCVCS DF= 50
Collective Dose per Yearperson-Sv
1.40.50.37
0.25
The maintenance hours have been taken from the experience for similar PHTSof nuclear power plants, but ITER is an experimental facility with non-constantoperation. Also, the operating scenario simulated in estimating the source termincluded continuous flow for seven years. This is not expected to occur and maypotentially have resulted in an overly-conservative estimate of the corrosionactivity. Future refinements to more accurately estimate the ORE, are expected toresult in reduced ORE estimates for the PHTS.
4.5 Conventional occupational safety
Occupational Non-Radiation Safety protective measures will be implemented toassure workers protection against non-radiation hazards in compliance with thenational industrial safety standards of the potential Host Countries.
FDR-ITER Safety Assessment Chapter IV-Page 62

4.5.1 Beryllium hazard
Similar to radiation zoning, Beryllium Zoning and design measures formonitoring and control have been presented in compliance with the nationalregulations of the Parties and JET experience. Table 4.5-1 presents the Berylliumzoning criteria.
TABLE 4.5-1Beryllium Zoning
Zone Name
Uncontrolled Zone
Controlled Zone
Respiratory
Protection Zone
Hazard Level
Airborne
<0.01«g/m3
0.01 ng/m 3 -0.2 ng/m 3
>0.2(ig/m3
Surface
<10pg/m2
10Hg/m2-5O>/g/m2
>50ng/m2
Access and Control
ConditionsTime unlimited access areas with noprotective or monitoring devices.Control Rooms, ordinary offices, allother areas not directly or indirectlyconnected to operations with Be.Access time is determined by theparticular program and operationwith Be bearing equipment and if Becould appear in the air. Appropriatelight protective equipment should beworn: light respirators, clothes,gloves, shoes, etc. Be monitoringshould be installed during all periodsof work.
These zones will be identified by awarning notice at the entrance.
Be is present in these work areas undernormal operating conditions. Timelimited entry is permitted underspecial circumstances followingspecific instructions and usingprotective equipment that isolates theworker from the room atmosphere(e.g., bubble suit).
4.5.2 Electromagnetic and radio frequency field exposures
Electromagnetic (EM) and radio frequency field exposure limits have beenestablished. The limit is 10 mT for continuous electromagnetic field exposureduring the working day. This limit allows for the possibility of workers wearingcardiac pacemakers to work in such areas. According to this guidance, with thetoroidal field coils energized, electromagnetic working restrictions will berequired in the tokamak hall and, possibly, in portions of the buildingsimmediately surrounding the tokamak hall. Appropriate design andadministrative measures have been foreseen to monitor and control workerselectromagnetic exposure on the basis of the following suggested guidance:
FDR-ITER Safety Assessment Chapter IV-Page 63

TABLE 4.5-2Magnetic Field Exposure Guidance for ITER
Whole Body (mT)10 mTFromlOmTtolOOmTMore than 100 mT
Exposure Timeunlimited working timehalf working day/shift
restricted entry time
Comments
when B x t = 60 mT per houra few minutes per working day/shift
4.5.3 Cryogenic fluid and inert gas hazard
The potential harmful impact of cryogenic liquids and inert gases as a result ofcryogen leaks or spills has been assessed. It has been shown that cryogen chronicreleases during normal operation will not impose any risk to workers. As toaccidental breaks of cryogen pipelines in closed premises, the appropriatemonitoring system will be provided, to warn workers. Cryogen storage will be inthe open air and sufficiently far away from working buildings, so that failure ofthe storage container will not endanger workers health.
4.5.4 High voltage hazard
ITER operation will present routine high voltage hazards to workers similar tothose that are encountered at other ordinary installations utilizing high voltages.The main criteria of electric safety are maximum permissible levels of contactvoltage and currents flowing through the human body. The high voltagehazards will be managed using the industrial safety, engineering andadministrative control standards of the host country and will not imposesignificant risk to workers.
4.5.5 Other industrial hazard; chemical, mechanical, rotating machinery,lifting equipment, etc.
Other hazards that are likely at the ITER facility during construction and/oroperation include chemical hazards, mechanical hazards, rotating machinery,and lifting equipment (cranes). These hazards will be treated according to theindustrial safety standards of the host country.
FDR-ITER Safety Assessment . Chapter IV-Page 64

5 REFERENCES
[EPA93] U. S. Environmental Protection Agency (EPA), Chapter 40,Section 61.32, Code of Federal Regulations, (40CFR61), July 1,1993.
[GDR97] General Design Requirement Document. Revised in September 1997.
[Gor96] Gordon, C, "Safety Approach for External Events," 6th IAEA TechnicalGroup Meeting on Fusion Safety, Naka, Japan 21-25 October 1996.
[GSE97] General Safety and Environmental Design Criteria. Appendix toGeneral Design Requirement Document, Revised in September 1997.
[IDR95] Technical Basis for the ITER Interim Design Report, Cost Review andSafety Analysis, ITER EDA Documentation Series No. 7, IAEA, Vienna,1996.
[IBS96] International Basic Safety Standards for Protection Against IonizingRadiation and for the Safety of Radiation Sources, Safety Series No. 115,IAEA, Vienna, 1996.
[IAE88] IAEA Safety Series No. 89, "Principles for the Exemption of RadiationSources and Practices from Regulatory Control", IAEA Vienna (1988).
[IAE92] IAEA Safety Series No. 111-P-l.l, "Application of Exemption Principlesto the Recycle and Reuse of Materials from Nuclear Facilities", IAEAVienna (1992).
[IAE94] IAEA Safety Series No. 111-G.l.l, "Classification of Radioactive Waste",IAEA, Vienna (1994).
[IAE95] IAEA-TECDOC-807, "Experience in the Application of ExemptionPrinciples", IAEA, Vienna (1995).
[IAE96] IAEA-TECDOC-855, "Clearance Levels for Radionuclides in SolidMaterials", IAEA, Vienna (1996).
[ICR40] ICRP Publication 40, "Protection of the Public in the Event of MajorRadiation Accidents for Planning", [1984].
[ICR60] ICRP Publication 60, "1990 Recommendations of the InternationalCommission on Radiological Protection", [1990].
[Mit96] Mitchell, N., "Magnet Safety Assessment for ITER", 6th IAEATechnical Group Meeting on Fusion Safety, Naka, Japan 21-25 October1996.
[Saj96] Saji, G., "Safety and Environmental Activities for ITER", 6th IAEATechnical Group Meeting on Fusion Safety, Naka, Japan 21-25 October1996.
FDR-ITER Safety Assessment Chapter IV-Page 65

[Shi96] Shimomura, Y. , et al., "Safety Characteristics of ITER", 16th IAEAFusion Energy Conference, Montreal, Canada, 7-11 October, 1996.
[Sor97] Sorin, V.M. and Barabaschi, P., Seismic Analysis of the Tokamak ITERFull Model. Sixth All-Russian Conference on Engineering Problems ofThermonuclear Reactors, St. Petersburg, 27-29 May, 1997. Abstractsfrom Central Nllatominform, Moscow, 1997, p. 219 (in Russian), ISBN5-85164-155-5.
[Rae95] Raeder, J. et al. "Safety and Environmental Assessment of FusionPower (SEAFP)", EURFUBRU - XII-217/95, June 1995.
FDR-ITER Safety Assessment Chapter IV-Page 66

Cryoplant 0.0
Vacuum pumping | | ^ | |
Fueling ) ^ H
Port interfacing ^ ^ _systems ^ ^ ^
Heat transfer • • !
Remote handling • •
Tritium plant H H
Waste treatment ^ ^ ^and hot cell ^ ^ ^
0.0
Waste treatment ^ ^ _and hot cell _^^^
Remote handling I | ^ B
Heat transfer B o . !
0.0
Remote handlingWaste treatment and -
10
0.0
Tritium
• 8.0
• 8.0
•|1O.O
^••12.6
^ • • • • 2 1 . 3•{^••|^|22.4
10.0 20.0 30.0
TBq/a
ACP
• 1.5
1.0
>
2.0 4.0 6.0
g/a
Dust
.2
1 1 1
2.0 4.0 6.0g/a
| 3 6 . 7
40.0
8.0
18.0
50.0
10.0
10.0
FIGURE 2.2-1Tritium, Activated Corrosion Products and Activated Dust Release by System
FDR-ITER Safety Assessment Chapter IV-Page 67

Cryoplant
Discharge from ADS tothe stack
Released to stackthrough HVAC
Released through thecooling tower
Water discharged fromthe water detritiation
Discharged with sitewaste water
0%0%0%
0%0%
0%0%=15%
0%0%14%
0% 20%
• - —I 80%
100%
• Tritium D ACP El dust
62%
40% 60% 80% 100%
FIGURE 2.2-2Tritium, Activated Corrosion Products andActivated Dust Release by Release Points
FDR-ITER Safety Assessment Chapter IV-Page 68

ACP
20%
• Release during operationsRelease during maintenance
380%
60% 80% 100%
FIGURE 2.2-3Releases for Operations and Maintenance
FDR-rTER Safety Assessment Chapter IV-Page 69

Conf.&ShieldHot Coll/RW building
— B — Grand Total| 40,000
S 30,000
time ^ 2
FIGURE 2.6-1Decommissioning Waste with Activity Level > IBSS-115
Clearance Levels, in tons
FDR-FTER Safety Assessment Chapter IV-Page 70

100E+06
•3 l.OOE+05
2 l.OOE+04 .
| l.OOE+03 .
§ l.OOE+02 .
^ l.OOE+01 ,
f l.OOE+00 .
-3 l.OOE-01 .
;? l.OOE-02 •
I l.OOE-03 •
l.OOE-04 ,
; > i
- -VVOBAv
- VVOBAv
« _ y v > R A"
M
.Zones 59
i. Zones 5<
;. Zones 5S
m
-63 LOW
1-63 IBSS
1-63 pittli
s, •
ss
S
1%
l.OOE-01 l.OOE+00 l.OOE+01 l.OOE+02 l.OOE+03
Years
FIGURE 2.6-2Decay Time Necessary for the Vacuum Vessel Outboard, Average of
Zones 59-63 to Reach LOW, IBSS, and High Qearance Levels
FDR-ITER Safety Assessment Chapter IV-Page 71

5 <«O -P
f I I
£
I s g a
HGURE 2.6-5Component-wise Contribution to the Total Operational
Waste (BPP and EPP) and the Transition Period (TP)
FDR-ITER Safety Assessment Chapter IV-Page 72

0.45-
FIGURE 2.6-6Component-wise Contribution to the Total Decommissioning
Waste Stream (DP-1, DP-2, and DP-3)
FDR-ITER Safety Assessment Chapter IV-Page 73

Siin
I'2 g
s1-1
E2 g
§
I a)
>c
COS
in
•s
0.50-
0.45-
0.40-
0.3b-
0.30-
0.25-
0.20-0.15-
0.10-
0.05-0.00-
ru
PIff11Mil
ifli
] | 1
M Low
S IBSS
H High
HI D—IHfj
ir~^Bi mm
1o
cco
HGURE 2.6-7Fractions of Total Decommissioning Wastes that Exceed Clearance
Levels after 100 years in Major Components
FDR-ITER Safety Assessment Chapter IV-Page 74
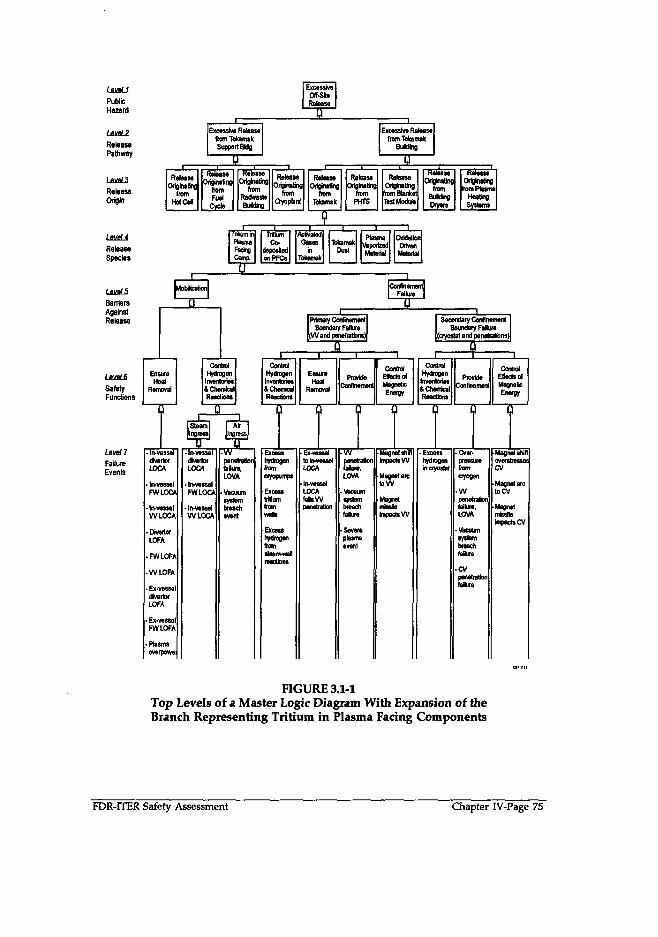
LaiaUPublicHazard
Pathway
Excess!)* Releasefrom TokamakSupport BMg
ExcessiveOff-SleRelease
Excessive Releasefrom Tokarriak
BuMiig
ReleaseOrigin
Release
HotCel
OriginatingtramFuel
Cycle
Or ig insfrom
RadwasteBuMng
ReleaseOriginating
fromCryopbnt
RelMStOriQinnng
fromTokamak
ReleaseOrigins tins
fromPHTS
Relea»Originatingtarn BlanketTestModita
HetoaseOriginating
fromBuWngDryers
KeieaseOriginatingtorn Plasm*
HeatingSystems
level 4
ReleaseSpecies
TncuminPlasmaFadngComfx
rnriumCo-
depoeledonPFC*
ActuatedS u e s
inTokamak
, l .
TokamakDutl
PbtmaVaporizedMaterial
OxidationDriven
Material
LaaL5BarriersAgainstRelease
SafetyFunctions
EnsureHeat
Removal
Mobfeatkm
u
ControlHydrogen
Inventories4 ChemicalReset ions
Primary ConfinementBoundary Failure
(Wandpenelrattiiis)
Secondary ConfinementBoundary Falure
(ay()stal and penetrations)
CortrdHydrogen
& ChemicalReactions
UfflLZFailure
Events
• In-vessaldvertorLOCK
lovesselFWLOC*
IrvvesselWLOCA
DrvertorLOFA
FWLOFA
WU5FA
Ex-vessaldvartorLOFA
Ex-vesselFWLOFA
Plasmaoverpowe
In-vesseldvartorLOCA
• IrHrasselFWLOCA
IrvvessdW L O C A
ArVpenetrationblurt,LOVA
Vacuumsystembreachevent
EnsureHeat
Removal
ControlEffects ofMagneticEnergy
_LControl
Hydrogen
tCnerrfcalReactions
ProvideContinemenl
ControlElects of
Energy
frontctyopumps
Excesstritiumfrom
Excess
from•feanvwal
Ex-vesseltokHresselLOCA
LOCA(abWpenetration
Wpenetrationlaiure,LCVA
VacuumsystembreachfakM
Severemait
Magnet shittnpacrsW
Magnet arctoW
MagnetmWfetnpacrsW
Excesshydrogenincryostet
Cver-pressurefromcryogen
Wpenetrationfailure,LOVA
vacuumsystembreachfaftire
CVpenehalkjnfaiirg
Magnet shinoveretresseiCV
Magnet arclo CV
Megnetmissrieimpacts CV
FIGURE 3.1-1Top Levels of a Master Logic Diagram With Expansion of theBranch Representing Tritium in Plasma Facing Components
FDR-ITER Safety Assessment Chapter IV-Page 75

2£\^111
o =: p <uO to b £
o
(D
f>ocu(0
anr
LCO
UJS
odel
s
FIGURE 3.1-2Schematics of MELCOR Modeling of in-vessel structures, vacuum vessel, andtheir cooling systems, vacuum vessel pressure suppression system, cryostat, heattransport system vaults and rooms around the tokamak.
FDR-ITER Safety Assessment Chapter IV-Page 76

%s.
35O03O00
250020001500
1O0050017.0
16.0
15.0
14.0
13.012.0
4.03.53.02.52.01.51.0160
140
120
100
8060
5.0
4.0
3.0
2.0
1.0
1.0
0.8
0.6
0.4
O.2
0.0,
fusion power
power into S O L I
I I I I I I 1 I I I I I I I I I I I I I I I I I I I I I I I I I I I I I I
BR limit(upper bound)
GW limitCupper bound) J
^ ^ ^ ^__ ^^^_ ____ ____ electron ^ ^ _ ^ ^ _ Ifn(*l ion ^ J
I • ' • • 1 ' I ' • I • • ' ' I ' • • ' I I • • ' I ' I ' ' I
L en. QTL CTL U.beta limit(upper bound)
poloidaLbeta __ _ _ _ _ — •— —* ~ n
• • • • • i i 1 1 • • • • • • i • i • • i i • i
-0.5 O.l> U.5 l.O 1.5 2.O 2.5 3.O 3.5
Time (s)
FIGURE 3.2-2Plasma Parameters for Doubling of Confinement Time
Fusion power increases, but transient is terminated when plasma beta limit isexceeded (SOL: scrape off layer, BR: Borrass Limit, GR: Greenwald Limit).
FDR-ITER Safety Assessment Chapter IV-Page 77

500
20 30 40time [s]
FIGURE 3.2-3Vacuum Vessel Pressurization after multiple first wall pipe break. The break sizeis 0.6 m2, the vacuum vessel pressure suppression system (WPSS) opens at200 kPa. Pressure in the vacuum vessel remains below its design pressure of500 kPa.
FDR-ITER Safety Assessment Chapter IV-Page 78

O
100
— FW— shield-back— BKP-front— BKP-back
•VV
• • ' • ' ' ' ' T • • • • • • •
011 100time [d]
FIGURE 3.2-4First wall, shield and backplate temperature transient for the Category IVmultiple first wall coolant leak into the vacuum vessel. No in-vessel cooling isassumed, i.e., the only heat sink is the vacuum vessel PHTS operating in naturalcirculation mode. The heat up is caused by decay heat. Primary first walltemperatures remain below the 500°C limit.
FDR-ITER Safety Assessment Chapter IV-Page 79

BKP-back--©-- VV-f ront~~*— magnets-front
•cryostat
o
-20a
FIGURE 3.2-5Decay heat driven temperature transient with no in-vessel cooling and nonatural circulation of the vacuum vessel (Category V event). Credit is takenfrom helium convection inside the cryostat. The cryostat is assumed to besurrounded by an environment of 20°C (FW: first wall, BKP: backplate, W :vacuum vessel).
FDR-ITER Safety Assessment Chapter IV-Page 80

2000-
1500-
1000-
5OO-
o -
: !—rn
1 S*i
: / •
'•
I 1— Cu/cooling— Cu/W••" W/plasma
— - - ^ .
2 0 40 60time [s]
8 0 1 0 0
FIGURE 3.2-6Temperature transient for the divertor wing structure during coolant flowblockage event. The plasma heating is stopped when the copper structure infront of the coolant is completely melted. The thermal load due to a disruptionat plasma shutdown was included in the analysis. The surface is rapidly cooledlimiting chemical reactions.
FDR-ITER Safety Assessment Chapter IV-Page 81

"., J
5.3DEC 24 1996
PLOT 110. JSOLUf
TO?RSYS-SQLUDMX »7.929SMX - 7 . 9 2 9
0•880S61.7622.6433.S244.40S5.2866.16?7.0487.929
mmenE33
FIGURE 3.3-1ITER Full Model for Spectrum Seismic Analysis,
including Acceleration for GDRD Design Response Spectra for 0.2 g
FDR-ITER Safety Assessment Chapter IV-Page 82

M ABA
Review designto prioritize on
ITERDesign
Find areasforImprovement
Implement I
Same process as for System 1
Repeat process for System X
FIGURE 4.3-1ALARA Implementation Process for ITER,
a Repeated Process of Iteration
FDR-ITER Safety Assessment Chapter IV-Page 83

9 June 1998
INTERNATIONAL THERMONUCLEAR EXPERIMENTAL REACTOR
«
TECHNICAL BASISFOR THE
ITER FINAL DESIGN REPORT, COSTREVIEW AND SAFETY ANALYSIS
(FDR)
Chapter V
ITER PROJECT COST ESTIMATE

9 June 1998
CHAPTER VITER PROJECT COST ESTIMATE
TABLE OF CONTENTS
Introduction 1Part 1. Resources required for ITER construction and commissioning 1
1.1 Cost estimating approach for ITER construction 11.2 Basic data — procurement packages for cost estimation 21.3 Evaluation of cost estimates 31.4 Conclusions on the approach to the ITER construction cost 51.5 Cost estimates summary 6
1.5.1 Component/system evaluated cost estimate 61.5.2 Allowance for indeterminates (AFI) 181.5.3 Siting and construction costs 181.5.4 Additional plasma heating and current drive 191.5.5 Comparison with previous estimates 201.5.6 Investment deferred after start of operation 211.5.7 Uncertainties in evaluated cost estimates 211.5.8 Aggregate costs of construction 21
1.6 Construction management, engineering support of construction, andintegrated commissioning costs 22
Part 2. Operation costs 252.1 Project manpower and overhead costs 272.2 Energy costs 272.3 Fuel costs 282.4 Capital improvements, spare parts, maintenance costs 282.5 Waste disposal costs 28
Part 3. Decommissioning costs 30Summary Estimate Tables 31

9 June 1998
Introduction
Article 2 of the ITER EDA Agreement states, inter alia, that the Parties shallconduct jointly the following EDA:
"(a) to establish the engineering design of ITER including
(iii) a planning schedule for various stages of supply, constructionassembly, tests, and commissioning of ITER together with acorresponding plan for human and financial resourcesrequirements;
(c) to establish both the proposed program and the cost, manpower andschedule estimates for the operation, exploitation anddecommissioning of ITER."
This Chapter addresses the estimated human and financial resourcesrequirements for the construction and commissioning of ITER (Part I) and for itssubsequent operations (Part II) and decommissioning (Part III). The estimatesfollow from and are consistent with the plans for construction, operation anddecommissioning as set out in Chapter VI, entitled "ITER Construction,Commissioning, Operation and Decommissioning plan".
Part 1. Resources required for ITER construction andcommissioning
1.1 Cost estimating approach for ITER construction
The approach to cost estimating for the construction and commissioning of ITERis based on the presumption that ITER will be constructed as an internationaljoint Project in which the participants' contributions will mainly be specificsystems or components contributed directly to the project.
The cost estimates are prepared from the results of detailed costing studies,undertaken by industrial firms throughout the Parties, of all the ITERcomponents and systems. The estimates have been developed from theengineering designs following a "bottom-up" approach which emphasisesphysical estimates (such as labour hours, material quantities, physical processes,etc.) so as to ensure that the data are comprehensive and coherent and provide abasis for evaluating results from different Parties.
In considering the ITER cost estimate, it is important to recognize that:
• Economic conditions in the Parties vary widely over time and thesechanges are not necessarily or adequately reflected in relative monetaryexchange rates;
• The overall ITER management approach and specific procurement andcontracting practices have not been determined and the host party hasnot been selected;
FDR-ITER project Cost Estimate Chapter V-Page 1

9 June 1998
• The aggregate costs that will be incurred in constructing andcommissioning ITER will depend greatly on how the responsibilitiesfor specific components are distributed between the differentparticipants, and on the procurement policies pursued by each.
Given these uncertainties, the approach adopted focusses on establishing anevaluated cost estimate which normalizes the industry estimates from theParties. The full scope of ITER is costed using itemized material and componentpricing; this approach provides for consistent comparison of estimates over theduration of the ITER collaboration. Manufacturing/installation costs are arrivedat from estimated industry productivity and typical labor costs within the Partiesindustries.
This approach allows the Parties, jointly, to appreciate the full cost of ITER andthe relative contributions that each might make to building ITER and,individually, to estimate from underlying physical data the absolute costs thateach might expect to incur in providing a given contribution.
1.2 Basic data — procurement packages for cost estimation
In order to elicit the basic data for ITER cost estimates, about 80 "procurementpackages" have been developed for the elements of the project Work Break-down Structure (WBS), each denned at a level consistent with a plausibleprocurement contract. Each package comprises comprehensive information,including the functional requirements, detailed designs, specifications, interfacesand other relevant data that would be needed by potential suppliers in order toprepare for contract quotations, e.g. the proposed split of responsibilities betweensupplier and customer and the necessary QA arrangements.
In some areas the packages provide for the possibility of splitting contractsbetween several suppliers in case more than one Party might wish to participatein a specific area. In some others, this splitting between suppliers in more thanone Party is necessary in order to produce the volume required because of thelimited capacity of each supplier (e.g. superconductor strand, shield/blanketmodules).
The main categories of procurement type referred to in the procurementpackages are defined below. The distributions of responsibility between vendorand customer (and hence the engineering resources required) vary significantlyby procurement type; this is reflected in the cost estimates.
A. "Build-to-print": The design is fully specified and the performanceresponsibility lies with ITER. Suppliers use the design exactly as it isprovided to develop fabrication/shop drawings. Suppliers can requestchanges to the design, if necessary during fabrication, but those changeshave to be analysed, and approved by ITER.
B. "Detailed design": ITER specifies a design that a supplier must follow.ITER is responsible for the analyses leading to the main design. Fromthis design, the supplier develops a detailed design to be approved by
FDR-ITER project Cost Estimate Chapter V-Page 2

9 June 1998
ITER prior to manufacture. Shop drawings are then generated fromthat detailed design. Analysis to verify adequacy of the detailed designare performed by the supplier. The supplier is responsible for thoseanalyses, and therefore shares performance responsibility with ITER.
C. "Functional specifications": ITER provides functional specificationsand accompanying explanatory drawings. The design and performanceresponsibility lie with the supplier.
Industrial companies or large laboratories with relevant experience were invited,through the Home Teams, to generate, from the Procurement Packages, their bestestimates of the likely current (1997 F.O.B.) costs of supply, assuming that all datanecessary to support procurement would be available on schedule. To allowreview and comparative evaluation of the estimates, the participants wererequested to provide detailed supporting data according to standard costingformats and to detailed descriptions of the potential deliverables and processes(columns and rows respectively of standard spreadsheets). The costing tablesallow for suppliers' engineering costs according to the category of procurementforeseen.
The information thus generated offers a comprehensive data base for costanalysis, comparison and evaluation.
1.3 Evaluation of cost estimates
The JCT has analysed the results of the procurement package studies inconsultation with Home Teams concerned, with the objective of deriving"evaluated estimates" which distill the database to a meaningful set of projectcost estimates. The main steps in this process for each package are:
(1) expression of input data in common terms;
(2) comparison and reconciliation of estimates from different Parties;
(3) "evaluated cost estimate" by JCT;
The final result is a complete set of "evaluated cost estimates"for building ITER,expressed in IUA, which is robust to currency fluctuations and domesticescalation rates and which can be used by the Parties jointly and individually inreviewing their options and the possible budgetary effects of participating in ITERconstruction.
(1) Expression in common terms
Data expressed in terms of physical quantities can be readily compared directly,after confirming the definition of the terms. Data expressed in money valuesneeds to be converted into common terms for the purposes of comparison andanalysis.
Financial data have first been converted from current costs to the establishedreference date for ITER cost estimates of Jan 1989, using standard inflation factors
FDR-ITER project Cost Estimate Chapter V-Page 3

9 June 1998
for each Party. Where basic data for estimates from the EU were expressed in oneof the European national currencies, the figures were first converted to ECUusing July 1997 ECU exchange rates and then converted through the ECUinflation factors to Jan 1989 values. Because of the shortage of reliable priceindices for the RF, basic data in 1997 roubles were converted to US dollars atcurrent exchange rates and then converted to Jan 1989 dollars using, arbitrarily,the inflation factors for the US. The deflated figures were then converted to IUAusing the prevailing exchange rates at Jan 1989. Table V 1.1 shows the exchangerates and deflation factors used.
This methodology has already been applied for the IDR and DDR cost estimatesin 1995 and 1996, respectively.
TABLE V.1.1
January 1989 IUA equivalentsIUA = $ 1000 = 875.8 ECU = ¥ 127,510 (January 1989)
Exchange rates [1],Year1997
DM/ECU
1.96
FF/ECU
6.61
BF/ECU40.42
Liras/ECU1931.2
SFr/ECU1.67
Pta/ECU165.62
£/ECU
0.702
RoubIe/$
5693.63Exchange rates were formulated as arithmetically averaged figures of monthly rates from Januaryto early September 1997.
De-escalation factors for Party currencies from Year 1997 to January 1989.YearMid-1997 (*)
January 1989
$[2]1.32
1.00
ECU [3]1.371.00
¥[2]1.131.00
(*) These factors are the products of the figures for 1996 multiplied by the averaged inflation ratefrom January to early September 1997.
References [1] : INFOR ECU, European Commission, 1997, [2] : International Financial Statistics,International Monetary Fund, 1997, [3]: EUR-12 Index, Eurostat, 1997
(2) Comparison and reconciliation of estimates
In consultation with the Home Teams concerned, the data were subjected todetailed analysis and comparison to check for consistency and completeness and,as far as possible, to identify and eliminate anomalies.
A distinct advantage of the ITER Project is the ability to obtain multiple estimatesfrom industries in the different Parties. These multiple estimates were evaluatedin detail and compared to identify missing items, possible misunderstandingsand opportunities from design or process improvements to achieve costreductions. When necessary, the estimates were discussed with industrial staffconcerned to gain a thorough understanding of cost considerations.
As a result of the detailed JCT review and interaction with industry, manyimprovements were made in the estimates to assure the resulting JCT cost
FDR-ITER project Cost Estimate Chapter V-Page 4

9 June 1998
estimate was consistent with the technical design requirements. In some cases,industries suggested changes to reduce costs; these were considered and, wherefeasible, the cost saving changes were made.
(3) Evaluated cost estimate by the TCT
In order to emphasise the relative costs of the different systems/components, thefollowing method has been used to derive from the basic data a JCT cost estimate,consistent across the whole ITER plant:
• world market prices have been used where they exist, for instance forstandard materials or items of equipment;
• unified standard labour costs have been established which reflect:
- 1997 rates for the main categories of labour, converted into ILJA/hr,averaged across skill levels and Parties;
- the different levels of manufacturing support costs, includingfacility, equipment, overhead and profit, for different types ofindustrial works and working conditions (e.g. staff in their existinghome facilities, on site, or in a facility charged as an itemised cost).
After analysis of the proposals from the different Parties for amounts of tooling,material quantities and labour hours to manufacture each identified item, theJCT has established its own assessed numbers for these cost driving elementsand, using the above-mentioned lists of standard materials prices and labourcosts, has derived an "evaluated cost estimate" for each identified item.
Summing all items per procurement package, the JCT provides through thismethodology a credible normalised cost for each package, which has beenreviewed by Experts from the four Parties.
1.4 Conclusions on the approach to the ITER construction cost
• The approach to develop a JCT evaluated cost estimate for ITERconstruction, expressed in IUA tries, to the extent possible, to removevariations in costs that are due to differences in estimating practices bythe different Parties, and to exchange rate fluctuations. This means thatalthough ITER costs in two Parties for each item reflect the same"value", they will not necessarily correspond to each other throughexchange rates at any date.
• The approach provides fair and consistent relative costs for thedifferent ITER systems and components. The Parties can, jointly,appreciate in advance the relative contributions that each might maketo building ITER and, individually, estimate from the underlyingphysical data the absolute costs that each might expect to incur inproviding a given contribution.
FDR-ITER project Cost Estimate Chapter V-Page 5

9 June 1998
• This detailed "evaluated cost estimate" aids the "design to cost" and,later, the "manufacture to cost" approaches by which design/processchanges are made to maintain costs within the budgetted amountbecause itemized quantities and manufacturing manhours are clearlydefined.
1.5 Cost estimates summary
1.5.1 Component/system evaluated cost estimate
The evaluated cost estimates for ITER construction in klUA, summarised byprocurement packages, mostly at WBS level 4 (three digits), are presented in the"Cost Estimate Summary" attached, and compared to previous such estimates forthe IDR (1995) and DDR (1996). The table also indicates which of the Partiesprovided data for each package. Additional Notes provide comments to helpunderstanding specific peculiarities. A much larger "Business Confidential"document provides for each procurement package the JCT detailed evaluatedcosting, and was the basis of the review by Parties' costing Experts.
FDR-ITER project Cost Estimate Chapter V-Page 6

1
3.
9
n
rTERFINAL DESIGN REPORT
COST ESTIMATE SUMMARYWBS
No.
1.1-1.3
1.5
1.6
Procurement Package
Magnet Systems
(Coil Power Supply andDistribution)
Vacuum Vessel
Blanket System
No.1
2
3
4
5
6
1
2
3
t
2
3
4
Toroidal Field Coil
Magnet Structure
Radial Plata
C*H*a
Crowns & Gravity/Vessel SupportPF Coil Support
CS Pre-load Structure
CS Support
Magnet Structure TotalPoloidal Field Coil & Correction Coils
Central Solenoid CoilFeedersConductor
1-6 SubtotalPower Supply tor TF Coil Cold Test
Facility
Cryogenic SystemMagnet total
Main VesselPort Structure
Assembly Welding
SubtotalBack Plate
FW/shield Modules, Key & Port Plugs
Blanket Module Connections
Assembly Welding
FDR HT COM Estimate
0 : full estimate
P : partial estimate
X : no estimate
EU
o
0
o
0
Xo
0
000
0
0
o
o
JA
o
o
p
0oo
0
0
0
0
0
0
0
0
RF
P
O
0
0
0
0
0
o0
o
o
p
p
0
us
0
o
0
o00
X
0o0
X
X
X
X
FDR
TOTAL COST(klUA)
238.7
138.0
219.7
88.336.712.8
2.3497.8
106.486.437.2
832.91799.4
3.44.0
1806.8145.7
57.3included in WBS
203.0
81.7
318.0
28.8
DDR
TOTAL COST(klUA)
770.0
94.6
195.2
143.0
851.02053.8
2053.8
2.2.175.0
included in WBS 2.2.
IDR
TOTAL COST(klUA)
687.0
73.0
176.0109.0
865.31910.3
1910.3
175.0
Note
1
2
3
4

s
T3
f
I
FTERFINAL DESIGN REPORT
COST ESTIMATE SUMMARYWBS
No.
1.7
1.8
2.2
Procurement Package
Divertor
Fueling & Wall ConditioningSystem
Machine Assembly & Tooling
No.
1
2
3
1
2
3
1
2
3
4
5
SubtotalCassette Integration & Testing
Plasma Facing Components
SubtotalIn-vessel Divertor Maintenance
EquipmentPellet Injector System
Gas Injector Valve BoxesGDC Conditioning System
SubtotalAssembly Operations
Optical Metrology SystemComponent Handling ToolsSub-assembly ToolsAssembly Tools
2-5 SubtotalSubtotal
FDR HT Cost Estimate
0 : full estimate
P : partial estimate
X : no estimate
EU
0
0
o
X
X
X
0
oo0
0
JA
0
0
0
p
p
p
0
X
XX
X
RF
P
P
X
P
X
X
X
X0
o0
IE
O
O
X
p
oX
X
X
p
X
X
FDR
TOTAL COST
(KIUA)
42S.5
69.1
151.5
220.6
14.0
25.6
71.0
59.5130.5
DDR
TOTAL COST(MUA)
410.0
80.0
98.0
178.0
34.0
177.0
IDR
TOTAL COST(KIUA)
410.0
80.0
98.0
178.0
34.0
177.0
Note
5

3JO
3
1an
I
1
HERFINAL DESIGN REPORT
COST ESTIMATE SUMMARYWBS
No.
2.3
2.4
2.6
Procurement Package
R/H Equipment
Cryostat
Tokamak Cooling WaterSystem (PHTS,CVCS.Ancillary Systems)
No.
1
a. Blanket R/Hb. Equator System Port R/H
c.Cryopump R/Hd. NBR/H
e. In-vessel Viewing
f. R/H Toolsg. Double Seal Doors & Transfer Casks
h. Control SystemsIn-vessel Divertor Maintenance
EquipmentAFI
SubtotalCryostat & Vacuum vessel Suppression
System
Guard Pipe (TWCS)AFI
Subtotala. PHTS including NBI cooling loops
(NBI Coolinq Loops)b.CVCS
c. Ancillary System (Drying System)
SHTS (eliminated)AFI
Subtotal
FOR HT COM Ertlmat*
O : full estimate
P : partial estimate
X : no estimate
EU
0
X
XX0
X
X
p
0
o
o
0
JA
0
?
XX
0
p
0
p
p
0
0
0
RF
X
X
X
X
X
X
X
X
P
P
X
X
usXp
X
X
0
p
0
p
X
X
X
X
FDR
TOTAL COST
(KIUA)
34.415.8
2.7
6.026.928.7
20.121.0
14.010.3
179.9
96.4
6.54.5
107.4
163.210.828.7
14.10.0
10.1216.1
DDR
TOTAL COST(klUA) .
246.0
95.6
0.095.6
146.6
11.0
0.0
15.5
173.1
IDR
TOTAL COST(klUA)
226.0
71.0
0.071.0
138.0
18.0
0.015.5
171.5
Note
6
7
8

anIi
FTERFINAL DESIGN REPORT
COST ESTIMATE SUMMARY
9i<
io
WBS
No.
2.7
3.1
Procurement Package
Thermal Shield for VacuumVessel & Cryostat
Vacuum Pumping System
PP1 : WBS 3.1C.D.B5.3
PP2 : WBS 3.1B/5.3
PP3-.WBS3.1K
PP4: Mechanical Equipment
PP5:1 & C
PP6: Installation
No.
a. Thermal Shield for Vacuum Vessel
b. Thermal Shield for Cryostat c.Transition Thermal Shield d.Support Thermal Shield
AFISubtotal
Roughing SystemTorus Pumping SystemCryostat Pumping SystemNB Pumping SystemICRF Pumping SystemECRF Pumping SystemGuard and Service Pumping SystemDiagnostic Pumping SystemLeak Detection SystemsMiscellaneous Vacuum Systems
Subtotal
FDR HT Coat Ettlnut*
O : full estimate
P : partial estimate
X : no estimate
EU
0
0
0
JA
X
0
0
RF
0
0
p
I E
X
X
X
FDR
TOTAL COST
(WUA)
13.6
20.64.1
38.3
8.022.6
2.48.21.33.510.6
0.98.81.4
67.7
DDR
TOTAL COST
(klUA)
25.0
8.623.0
2.512.0
1.53.511.0
0.69.01.5
61.0
IDR
TOTAL COST(klUA)
25.0
8.6
23.02.5
12.01.5
3.5
11.00.6
9.0
1.5
61.0used average for A H&CD systems.
Note
9
10

373
an
FINAL DESIGN REPORTCOST ESTIMATE SUMMARY
n2"
13
<;-a
WBS
No.
3.2
3.4
3.54.1
Procurement Package
Tritium Plant
Cryoplant andCry ©distribution
Heat Rejection System
Coil Power Supply andDistribution
No.
1
2
3
4
5
6
7
8
9
1
1
2
3
4
Tokamak Exhaust Processing
HDT Isotope Separation
Fuel Storaqe and DistributionWater Detritiation
Atmosphere Detritiation
Tritium Recovery from (PFC) SolidWaste
Analytical Facilities
Tritium Plant Control Systems
Tritium Plant Integration
AFISubtotal
Cryoplant and Cryodistribution
AFI
SubtotalHeat Rejection System
High Voltage Substation & ACDistribution System
Reactive Power Compensation &Harmonic FiltersAC/DC Convenors & Dummy Loads
Switching Networks, DischargeCircuites, DC Distribution &Instrumentation
FDR HT C O M Estimate
0 : full estimate
P : partial estimate
X : no estimate
EU
O
0
o0
o
0
X
o0
0
0
o
o
0
0
JA
p
0
0
o0
0
0
0
o
0
0
o
o
0
0
RF
X
X
X
X
X
X
X
X
X
X
X
o
0
0
0
usp
XX
X
X
X
X
X
X
X
X
X
X
X
X
FDR
TOTAL COST
(MUA)
7.4
7.66.29.4
25.5
2.5
2.S
2.98.2
5.4
77.6
131.2
13.0
144.2
63.6
41.0
12.7
144.6
124.7
DDR
TOTAL COST(WOA)
73.0
243.0
16.0
IDR
TOTAL COST(KIUA)
72.0
243.0
16.0
Note
1 1
12
13

I
IQ
n
Ii—i
ro
rTERFINAL DESIGN REPORT
COST ESTIMATE SUMMARYWBS
No.
4.3
4.5/4.6
5.5
6.2
6.3
6.46.56.66.8
6.7
Procurement Package
Steady State Power SupplySystem
CODAC/lnterlock Alarm(not issued)(not issued)
Diagnostics
Site and Building
Plant System
(not issued)
(not issued)(deleted)
No.
2
1
2
1
2
3
4
5
6
7
8
SubtotalSteady State Electrical Power Supply
System
Hardware, ComputersSoftware(Interlock Alarm)
SubtotalStart-up Set only
Reinforced Concrete and SiteInfrastructure Elements
Steel Frame Buildings
Subtotal
Waste Treatment and StorageRadiation Monitoring SystemLiquid DistributionGas DistributionSampling SystemGeneral Test Equipment
3-8 Subtotal
FDR HT Cott Elttmato
O : full estimateP : partial estimateX : no estimate
EU
o
0
p
o
0
0
o0
JA
0
0
P
0
0
p
p
0
RF
X
X
X
X
X
X
XX
US
X
X
X
X
0
X
X
X
FDR
TOTAL COST(IdUA)
323.0
74.725.825.0
0.0
50.8150.8
627.3172.5
799.8
87.47.4
59.414.3
4.0
0.0172.5
DDR
TOTAL COST(MUA)
340.0
39.0
78.5148.0
893.7
54.34.0
56.020.0
4.0
19.7158.0
IDR
TOTAL COST(klUA)
339.0
39.0
78.5148.0
891.0
69.04.0
56.020.0
4.0
25.0178.0
Note
14
15
16
17

If$mVt
a.
rTERFINAL DESIGN REPORT
COST ESTIMATE SUMMARYWBS
No.
Procurement Package
No.
Additional Heating Power Su
4.2Additional Heating Power
Supply System1
2
3
4
>ply System
ICRF Power supplies
ECRF Power Supplies
NBI Power Supplies
LH Power Supplies (= ECRF)
Additional Heating Current Drive System
5.1
5.2
ICRF System
ECRF System
1
2
3
1
2
Ion Cyclotron In-vessel Components
Main Transmission Line &Matching/Decoupling System
FF Power Sources, Supplies, Control &Auxiliaries
1-3 Subtotal
ICRF Pumping SystemSubtotal
Gyrotrons & Auxiliaries (includingstart-up EC)
Transmission & Injection System(including start-up EC)
1-2 Subtotal
Start-up EC only
ECRF Pumpinq System
FOR HT Cost Estimate
0 : full estimate
P : partial estimate
X : no estimate
6 U
oooX
o
0
0
0
o
JA
X
0
0
X
0
o
0
0
0
RF
X
X
0
X
X
X
X
X
X
us
0
X
X
X
0
o
o
0
0
FDR
TOTAL COST(HUA)
20.826.4
95.326.4
26.1
15.5
54.095.61.3
96.9
72.2
70.6
142.8
3.5
DDR
TOTAL COST(WUA)
34.2
31.0
125.4
110.0
133.021.0
IDR
TOTAL COST(KIUA)
17.0
27.0
99.0
110.0
133.021.0
Note
18
19/20
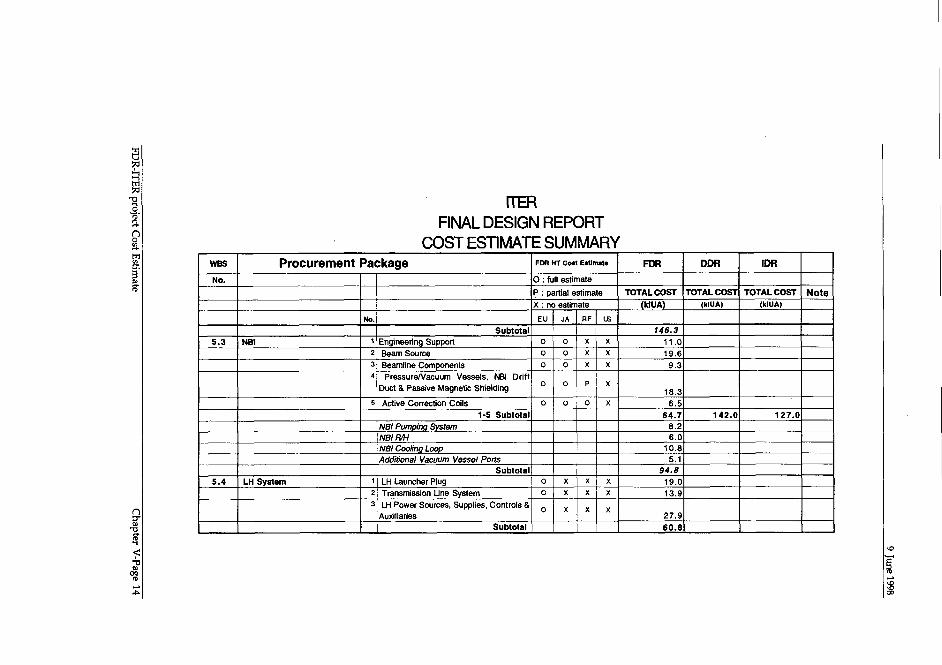
Io
m
FINAL DESIGN REPORTCOST ESTIMATE SUMMARY
n0
WBS
No.
5.3
5.4
Procurement Package
NBI
LH System
No.
1
2
3
4
5
1
2
3
SubtotalEngineering Support
Beam Source
Beamline ComponentsPressure/Vacuum Vessels, NBI Drift
Duct & Passive Magnetic Shielding
Active Correction Coils
1-5 SubtotalNBI Pumping SystemNBIFVHNBI Cooling LoopAdditional Vacuum Vessel Ports
SubtotalLH Launcher PlugTransmission Line System
LH Power Sources, Supplies, Controls &Auxiliaries
Subtotal
FDR HT COM Eltlmat.
O : full estimate
P : partial estimate
X : no estimate
EU
oo0
0
o
oo
0
JA
o0
0
0
0
X
X
X
RF
X
X
X
p
0
X
X
X
us
X
X
X
X
X
X
X
X
FDR
TOTAL COST
(WUA)
146.311.019.6
9.3
18.36.5
64.78.26.0
10.85.1
94.819.013.9
27.960.8
DOR
TOTAL COST(WUA)
142.0
IDR
TOTAL COST(klUA)
127.0
Note

9 June 1998
NOTES TO COST ESTIMATE SUMMARY1. -In IDR/DDR cost estimates, the cost of radial plates and case was included in the Toroidal FieldCoil fabrication cost.
For these two items, a very large saving can be made (respectively 48 and 42 klUA) if thematerial for radial plates and outer leg of cases can be changed to AISI (316LN) instead of amodified one.
2. -The cost of Feeders was included as an AFI (Allowance for Indeterminates) in the magnetestimates for the IDR/DDR.
3. -These costs are added to the TF coil manufacture, to cover the cryogenic testing of windingpancakes at the factory before including them in the case.
4. -No estimate is yet available for the ITER breeding blanket test module, the design of which isnot advanced enough.
5. -This equipment estimate is part of the global RH equipment estimate (WBS 2.3).
6. - The specific NB-RH equipment estimate Is part of the total NBI estimate (WBS 5.3).
7. -This estimate for WBS 2.4 includes an AFI of 4.5 klUA.
An additional cost of 6.5 klUA (0.9 klUA as material cost) should be incurred by the Cryostat (WBS2.4), taking into account the fabrication of the shrouds around penetrations (which was included inthe V.V. procurement package 2).
8. -An amount of 10.8 klUA is included for the NBI cooling loop, which is part of the total NBIestimate (WBS 5.3).
9. -The VV thermal shield estimate will be increased by 4.14 klUA in case its complete assemblycan be done at the factory before delivery. An AFI of 3.78 klUA is added to the Cryostat andTransition Thermal Shields, their designs not being completely frozen.
10 -The cost estimate for NBI, ICH and ECH pumping systems are to be part of their respectivetotal estimates.
11-The global tritium plant estimate includes an AFI of 5.4 klUA. Procurement of equipment for anamount of 9.8 klUA will be deferred to ITER operation.
12 - The Initial investment will be limited to 120 klUA, by installing only 5 He refrigerator units; 3more being procured during Operation for an estimate of 25 klUA.
13 -The installation of the modular cooling tower can be spread in time, deferring about 10 klUA tooperation costs.
14 -The start up diagnostic set requires in addition the contribution of laboratory staff (116 PPY).More diagnostics are installed during operation for an estimate of 71 klUA and the contribution of88 PPY laboratory staff.
15 -All the Waste Treatment and Hot Cell equipment can be procured after start of ITER operation.
16 -Similarly for the Radiation Monitoring System.
17 -Similarly for the Sampling System.
18 -The estimate for LH power supplies is assumed equal to the ECH power supplies, due to similargenerator unit power and efficiency.
FDR-ITER project Cost Estimate Chapter V-Page 15

9 June 1998
19-Each of the four additional heating and current drive systems is assumed to deliver 50MW to theITER plasma. They cannot be Installed simultaneously on the torus, the number of access ports beinglimited and the total power (200 MW) being larger than required initially (100 MW).
20 -Comparison of cost estimates (or the different systems:
WBS S.1 - ICH Each equipped torus port is expected to deliver 12.5 MW, under the present
design:Cost estimate for the first equipped port :• test stand = 1.4 klUA• launcher prototype = 6.7• auxiliaries = 22.9 (3.9+13.5+5.2+0.3 klUA)
(including transmission line+generator+power supply+pumping)Total cost for 12.5 MW (I torus port) = 31klUA i.e. 2.5 mlUA/watt
Cost estimate for any additional port• launcher = 6 klUA• auxiliaries = 22.9
Total = 28.9 klUAI.e. 2.3 mlUA/watt
Total cost for 50 MW (4 torus ports) = 117.7 klUAi.e. 2.35 mlUA/watt
WBS 5.2 - ECH Each equipped torus port is expected to deliver 28MW to the plasma, under thepresent design :
Cost estimate for the first equipped torus port• test stand = 0.4 klUA• launcher prototype
+ auxiliaries = 86 klUA (35+36+13.2+1.8)Total cost for 28 MW (Itorus port) = 86.4 klUA
56 MW (2 torus ports) = 172.4 klUAi.e. 3.45 mlUA/watt
WBS 5.3 - NBI The present planned installation includes globally 3 injectors of 1 MeV beamsfrom negative ion sources (plus one diagnostic injector) expected to deliver 50 MW to the plasmathrough 3 torus ports:
Global cost estimate for these three lines :• cost of 3 NB injectors = 64.7 klUA• cost of power supplies = 95.3• cost of special RH equipment = 6• cost of special cooling loops = 10.8• cost of pumping systems = 8.2• cost increase for special = 5.1
vacuum vessel portsTotal cost for 50 MW (3 torus ports) = 190.1 klUA i.e. 3.8 mlUA/watt
WBS 5.4 - LHH Each equipped torus port is expected to deliver 25 MW to the plasma under thepresent design:
cost estimate for the first equipped torus port• test stand = 2.3 klUA• launcher prototype = 10.2• auxiliaries = 34.2 (7+14+13.2)
Total cost for 25 MW (1 torus port) = 46.6 klUAcost estimate for any additional port• launcher = 6.5 klUA• auxiliaries = 34.2
Total cost for 25 MW (1 addit. port) = 40.7 klUA50 MW (2 torus ports) = 87.3klUA i.e. 1.75mlUA/watt
FDR-ITER project Cost Estimate Chapter V-Page 16

9 June 1998
ConclusionThe cost per watt of the four heating systems varies largely between i.75mlUA/w (LHH) to 3.8mlUA/w (NBI). From a cost point of view, without any reference to relevant physics arguments tomake a choice for providing 100 MW to the ITER plasma, the maximum initial investment should useNBI+ECH for a total cost of 363 klUA; the minimum should use (LHH+ICH) for a total cost of 205klUA.
FDR-ITER project Cost Estimate Chapter V-Page 17

9 June 1998
1.5.2 Allowance for indeterminates (AFI)
For a few items, no detailed cost estimate is yet possible following the describedmethod, because their design has not yet reached the level of details needed tomake a cost estimate "bottom up". They are included in a cost element defined asan "allowance for indeterminates (AFI)". The costs of transportation, beingunknowable, are also excluded from the estimates. The AFI is a positive value,i.e. additive to the estimated cost of the facility. The total amount of AFI is nowquite small (about 50 klUA).
1.5.3 Siting and construction costs
The present ITER design, and its "evaluated cost estimate", follows the "ITERSite Requirements" and "Site Design Assumptions", which have been agreedacross the Project. Site specific adaptations of the design may induce changes inthe cost of some systems; they will be analyzed during the expected extension ofthe EDA, when potential sites are characterised. Similarly, the present design isconsistent with codes, standards and procedures/criteria which have beendefined inside the Project. These rules are coherent but are not identical to thoseof any specific Party, even if they should not contradict them. Regulatory bodiesfrom potential host country may request application of different and specificdesign rules or quality assurance measures; this can induce cost variations to beanalyzed again during the EDA extension.
The "ITER Site Requirements and Site Design Assumptions", approved by theITER Council, include in summary the following list of Host responsibilities, forwhich the project bears no costs. (This is without prejudice to any futurenegotiations between the Parties to decide how to support their costs.)
• Infrastructure for industrial support of ITER, major contribution toITER workforce during assembly, socioeconomic provisions forinternational schools, dwellings, medical care facilities, etc.;
• Land for the 70 hectare "compulsory area" of the ITER site;
• Land for the ~ 60 hectare "additional land" required for constructionactivities, interim;
• High quality (potable water) water ~400m3/day average demand~5 m3/minute peak demand;
• "Raw" water if required for cooling towers (100 m3/min.), from whichabout 20 m3/min are discharged;
• Sewage treatment availability for the following daily averages -sanitary 400 m3/day and industrial 300 m3/day;
• Supply to steady state electric power network (peak demand 230 MWand 80 MW (average) and a tie line capable of 500-650 MW (active)/500 Mvar (reactive) pulsed power for magnet and plasma heating;
FDR-ITER project Cost Estimate Chapter V-Page 18
9 June 1998
• Off-site fire protection equipment and personnel to augment on-sitefire brigade;
• Receipt of waste of all types from ITER operation and deactivation suchthat on-site storage does not exceed that accumulated during 6 monthsaverage generation rate;
• Dismantling phases of decommissioning;
• Receipt of all types of waste generated during the dismantling phases ofdecommissioning.
1.5.4 Additional plasma heating and current drive
Before considering the global construction cost of ITER, it is necessary to decideseparately on the policy of implementing the additional heating and currentdrive systems in ITER. Each of the four possible systems (NBI, IC, EC and LH) hasbeen designed and cost estimated for delivering 50 MW to the plasma. Theycannot be all installed simultaneously on the torus; the envisaged number (8) ofaccess ports is limited, and their total power (200 MW) is larger than requiredinitially (100 MW).
It is not appropriate to decide now on which system should be installed; physicsarguments favour different systems for different aspects of plasma optimization(L to H transition, ion or electron heating, reliability of power coupling toplasma, induced plasma rotation, current drive localisation, etc.). It is alsothought prudent to be able to increase the power level above the initial 100 MW.Each system has its own limit on the capability of power coupling to the plasma,from a minimum of 12.5 MW for ICH, 16.5 for NBI, 25 MW for LH, to a possiblemaximum of almost 50 MW for ECH, per ITER port.
Therefore if the total power is be an issue, more than the presently planned100 MW of heating can be launched into the ITER plasma by a propercombination of heating methods. The only problem is now to devise a budgettowards this goal. All needed cost estimates are available and summarized in theCost Estimate Summary Table and the following Notes.
It is proposed to take into account the most expensive choice for the initial100 MW, i.e. 50 MW of NBI and 50 MW of ECH for a total cost of 190.1 + 172.4 =362.5 klUA, and to assume the possibility of adding 50 MW, shared between thetwo cheapest methods ICH and LH, for a cost of 59.9 + 46.6 = 106.5 klUA.
This proposal is different from the policy followed in the IDR/DDR for costingthe additional heating, i.e. the average between the cheapest and most expensivecombination of heating methods. This, if applied now, should have resulted in abudget of 1/2 (362.5 + 205) = 284 klUA, almost 80 klUA less than proposed.
FDR-ITER project Cost Estimate Chapter V-Page 19

9 June 1998
1.5.5 Comparison with previous estimates
The IDR-DDR cost estimates were obtained, in many cases, in the absence ofdetailed design, by scaling from global cost per finished unit mass of component,and from previous construction experience.
The FDR cost estimates have been obtained by building a cost from detailedestimates to obtain/manufacture subcomponents according to an availabledetailed design. These estimates, built "bottom-up", are clearly the most completeand the most well founded which have been produced to date.
Therefore, it is not surprising that the present FDR estimates differ fromprevious ones (IDR/DDR). The present estimate values result from three maindrivers :
i) The DDR estimates, when changed from the IDR, were obtained byapplying IDR unit cost to the then current design. Every increase of thenumber of equipment items or of their weight drove a correspondingincrease in cost. The methodology of "design to cost" has led JCT tolook for and apply cost reduction measures to the design;
ii) the available detailed design, and the results from R&D on processqualification, have eliminated most technical uncertainties orunknowns which, generically, move industrial estimates towardshigher values;
iii) sometimes, on the contrary, the exact and complete definition of allspecific equipment (number, size, performance, cabling and piping,etc.) has produced a more realistic estimate differing from purelyguessed value (e.g. this applies mostly to the costs of the Plant System,auxiliaries and services).
As recognized by Experts from the four Parties, who have reviewed the details ofthe component/systems costing which support these estimates, they are notintended to be the lowest values which could be obtained, keeping the sametechnical specifications since they were not the result of competitive estimationand tendering within each Party.
Globally for HER construction they represent the most credible cost estimates,given the present uncertainties on ITER Construction Management, Siting andCost sharing: a global value inside which one can be confident to be able to buildITER.
In addition, there is room to achieve substantial savings in some areas alreadyidentified, more might be found through the needed and expected industryfeedback on design to optimize manufacturing processes.
FDR-ITER project Cost Estimate Chapter V-Page 20

9 June 1998
1.5.6 Investment deferred after start of operation
In the global necessary investment for ITER, some items, for which estimates aregiven in the Summary Table, do not need to be implemented until after start ofoperation, sometimes long after, because they are not needed before, and /or theycan be optimized according to the initial operating results. They concern theWBS elements listed in Table V 1.5 and total 213.8 klUA. (181 klUA weresimilarly defered in the IDR/DDR: 64 klUA for WBS 2.3 Remote Handling and117 klUA for WBS 5.5 2nd set Diagnostics.)
TABLE V 1.5Investment Costs Deferred to Operational Costs
WBS 3.2 - Tritium Plant (more ADS)
WBS 3.4 - Cryoplant (more He cryogenic power)
WBS 3.5 - Heat Rejection System (more cooling towers)WBS 5.5 - 2nd Set Diagnostics
WBS 6.3 - Waste Treatment (not needed until DT operation)
WBS 6.4 - Radiation Monitoring
WBS 6.8 - Sampling System
Total
= 98kIUA
= 24.2
= 10.0= 71.0
= 87.4
= 7.4
= 4.0= 213.8 klUA
1.5.7 Uncertainties in evaluated cost estimates
No costing method can claim to be totally accurate: the competition betweenpotential manufacturers or service providers, most interested in establishingtheir cost proposals before bidding in a technically more well defined tenderaction, leads to a range of costs which is generally large, with their minimumbeing often lower than the provisionally estimated cost.
The accuracy achieved by the JCT in providing each procurement package withan evaluated cost estimate is bound inside the same limits, probably ±15% in thebest conditions. However, this does not result in a ±15% uncertainty in the totalestimated investment cost for ITER construction.
This is the benefit of the applied costing method, i.e. understanding detailedestimates from different Parties' industries for all ITER components/systems.Statistical averaging across the large number of independent procurementactions will lead to a lower global uncertainty evaluated at about ±5%.
It will be the total ITER management responsibility to keep the total cost insideagreed limits by applying the "design to cost" and "manufacture to cost"methodology. The largest remaining uncertainty concerns, as previouslydiscussed, the conditions under which FTER will be sited, managed and procured.
Taking into account all the above considerations, estimates of the aggregate costs,AFI and cost uncertainty are summarised in Table V.I .2 A
FDR-ITER project Cost Estimate Chapter V-Page 21

9]unel998
TABLE V.1.2 AConstruction Costs (klUAs)
Construction Costs includingAFI & Cost Uncertainty
AFICost Uncertainty
CDA
4900
-
+ 700
TAC4
5600
-
+ 933
IDR Estimate
5050-66205850
Point Value
270
(+770/-800)
DDR Estimate
5100-66706000
Point Value
240
(+670/-900)
FDR Estimate
5220-57005460
Point value47.4
+ 240/-240
1.6 Construction management, engineering support ofconstruction, and integrated commissioning costs
A precise estimate of the cost of construction management and support is notpossible because the structure of the organization to execute the construction, andthe manner of contracting and managing contracts, is not known.
It is expected that during the EDA extension, technical specifications forprocurement will be either completed or well advanced. Moreover, during thesame period, the "Safety Reports" needed to license the ITER facility will beprepared: the present costing does not include the personnel required for thelatter, which have always been assumed to be a host task due to the likely need toexpress them in the host country language.
The assumptions on which the costs for construction management and supportare estimated are stated below:
• There will have to be a core management group (50 or lessprofessionals) headed by an individual who is independent of Partyaffiliation, which will act as the overall project/ construction manager.This group will have minimum planning, contracts, legal,administrative and personnel staff, and will be responsible for theinterface with the Parties organizations who will be responsible formanagement of the major contracts.
Each Party will have its own "management" group with the usualplanning, legal, administrative and personnel staff, plus a strongprocurement and contracts staff and an engineering staff to support theprocurement and commissioning of systems the Party contributes tothe Project.
• A "central" engineering group will continue to follow the technicaltasks related to the procurement, manufacturing, delivery andinstallation of the major systems/components, and be available tosolve issues that may arise during construction. This group may andprobably should comprise those key personnel who had followedduring the EDA and its extension those systems and components up tothe writing of the technical specifications for procurement. Asconstruction approaches its end, this group will be suitably augmented
FDR-UER project Cost Estimate Chapter V-Page 22

9 June 1998
by personnel who will follow the integrated commissioning and startup and will eventually be involved in the operation of the facility.Thus the number of professionals that may be involved in this groupcan range from about 100 at the beginning of construction to about 300towards the end, including the operation personnel.
• Adding to these numbers will be a somewhat larger number of thoseprofessionals in the Parties organizations, which, according to the leveland complexity of their contribution, will be responsible for the majorprocurements and for providing engineering support to theprocurement and construction. Ideally at the core of theseorganizations should be the HT personnel who will be involved in theengineering tasks during the EDA extension. This number would beginto decrease about three years before first plasma, possibly to join theoperation personnel on site.
• Support personnel for the core management (mostly administrative),for the central engineering group (mostly CAD) and for theconstruction management and engineering organizations of the Parties(whole range of competences, including a large share of technicians) areassumed to have their costs charged to the costs of professionals theysupport.
The total number of professionals that would be involved in constructionmanagement/engineering support and procurement activities (includingidentification and support of R&D performed during construction) would beabout 2600 for a construction period of about nine years, in line with the schedulegiven in Chapter VI, Part I, and including the PPYs estimated as needed for theone year integrated commissioning as defined below.
Commissioning of ITER can be separated into two parts. In many cases,particularly where conventional plant is involved, commissioning of theindividual systems and components as their construction is completed is part of"on site acceptance testing" and is included in the construction costs shown inthe Table "Cost estimates summary". This table, however, does not include thecosts for the integrated testing and start-up of parts of systems procuredseparately, which are more usually included in overall "commissioning"; thesecosts are included separately in Table V 1.2 B.
In addition to personnel costs, a certain amount of R&D during constructionshould always be considered. The EDA phase and its extension are intended toprovide the qualification and testing of all design solutions to be implementedfor the BPP. Nevertheless, process changes and advances or unexpecteddifficulties during manufacturing of components could require new tests. Inaddition, R&D to prepare for the not precisely defined EPP has just started now. Itis prudent to expect a spending in R&D of 150 klUA after the end of the EDAextension.
FDR-ITER project Cost Estimate Chapter V-Page 23

9 June 1998
TABLE V.1.2 BOther Costs During Construction (klUAs)
ConstructionManagement/Support
R & D
CDA
800
300
TAC4
not given
not given
IDR-DDR
800-900
300
FDR
780150
FDR-ITER project Cost Estimate Chapter V-Page 24

9 June 1998
Part 2. Operation costs
Operating costs for ITER include the following items:
• Project Personnel and Overheads;
• Energy Costs During Operation;
• Fuel Costs (largely hypothetical);
• Spare Parts and Materials/Capital Improvements;
• Waste Packaging and Disposal (almost negligible during the projectlife).
Some of the above costs are related directly to the usage the machine receives,whereas others depend directly on the project duration. An estimate of the abovecosts therefore is based on the operation scenario for the device described in theschedule of Chapter VI, Part II. This estimate and its splitting during years ofoperation are shown in Table V 2.1.
FDR-ITER project Cost Estimate Chapter V-Page 25

TABLE V 2.1Operation Costs
Year of operation
No of years
No inductive pulses
Av. Ind. flat top length (s)
No Steady State pulses
Av. Steady. State, pulselength (s)Mean availability
Av. Energy/y (GWh)
Yearly fluence (MWa/m2)
Accumulated fluence(MWa/m2)
1 -3
2.5
2700
100
0
0
0.045
990
0
0
3 - 5
2
1600
300
500
500
0.052
1060
0.012
0.023
5 - 7
2
1000
1000
0
0
0.035
860
0.016
0.055
7-1 0
3.5
4000
1000
2000
1850
0.135
1225
0.070
0.300
1 1 -1 2
2
0
0
0
0
0.000
675
0.000
0.300
Lowfluence13-20
8
10500
1000
5500
2000
0.161
1200
0.085
0.98
Highfluence1 3-20
8
1500
1000
10000
8300
0.390
2200
0.335
2.98
LowfluenceTotals
HighfluenceTotals
Project Personnel (klUA) 225 180 180 315 180 720 720 1800 1800
Staffing Level(Professional)
300 300 300 300 300 300 300
Electricity Cost (killA) 130 116 92 230 70 496 896 1134 1534
Electricity Cost/y (klUA) 52 58 46 65 35 6 2 1 12
Cost of tritiumconsumption**
0.00 23 30 212 4 135 135 404 404
Required tritium breedingratio (net)***
0.00 0.00 0.00 0.00 0.00 0.79 0.95
Capital Improv/Maint 290 450 385 560 735 1240 1240 3660 3660
Total operation cost / year 258 385 343 375 500 385 435 350average
Maintenance costs will be approximately constant, while capital improvement costs willvary year by yearcosts will probably be incurred on a different timescale to consumption, i.e. spread overthe yearsassuming EPP tritium external supply limited to 1.7 kg/y
FDR-ITER project Cost Estimate Chapter V-Page 26
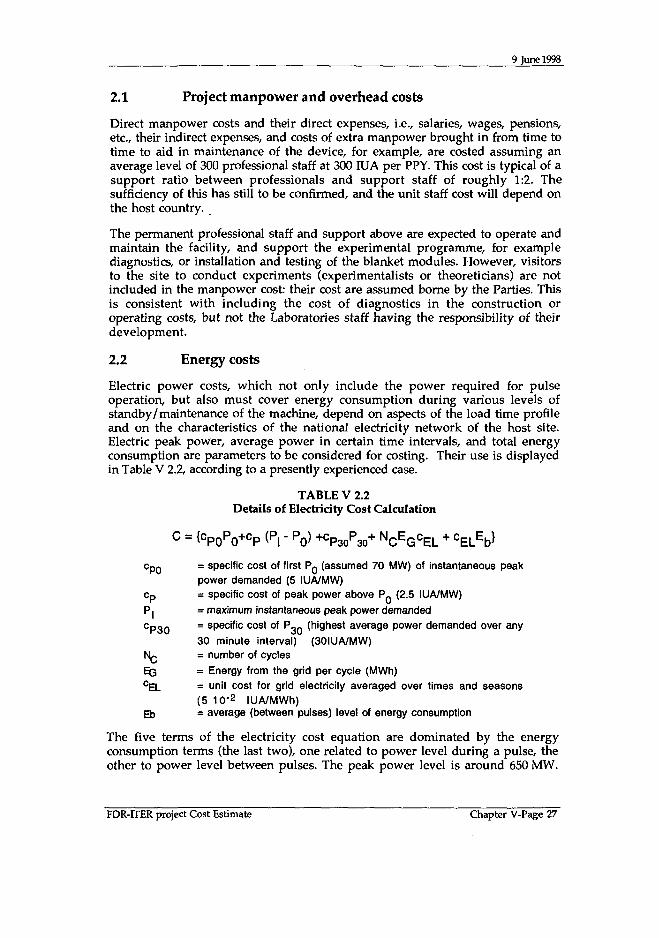
9 June 1998
2.1 Project manpower and overhead costs
Direct manpower costs and their direct expenses, i.e., salaries, wages, pensions,etc., their indirect expenses, and costs of extra manpower brought in from time totime to aid in maintenance of the device, for example, are costed assuming anaverage level of 300 professional staff at 300 IUA per PPY. This cost is typical of asupport ratio between professionals and support staff of roughly 1:2. Thesufficiency of this has still to be confirmed, and the unit staff cost will depend onthe host country.
The permanent professional staff and support above are expected to operate andmaintain the facility, and support the experimental programme, for examplediagnostics, or installation and testing of the blanket modules. However, visitorsto the site to conduct experiments (experimentalists or theoreticians) are notincluded in the manpower cost: their cost are assumed borne by the Parties. Thisis consistent with including the cost of diagnostics in the construction oroperating costs, but not the Laboratories staff having the responsibility of theirdevelopment.
2.2 Energy costs
Electric power costs, which not only include the power required for pulseoperation, but also must cover energy consumption during various levels ofstandby/maintenance of the machine, depend on aspects of the load time profileand on the characteristics of the national electricity network of the host site.Electric peak power, average power in certain time intervals, and total energyconsumption are parameters to be considered for costing. Their use is displayedin Table V 2.2, according to a presently experienced case.
TABLE V 2.2Details of Electricity Cost Calculation
C = {cpoPo+cp (P, - PQ) +Cp30P30+ N cEQcE L + cELEb}
CpQ = specific cost of first PQ (assumed 70 MW) of instantaneous peak
power demanded (5 IUA/MW)
Cp = specific cost of peak power above P_ (2.5 IUA/MW)
P| = maximum instantaneous peak power demanded
c p 3 0 = specific cost of P 3 Q (highest average power demanded over any
30 minute interval) (30IUA/MW)
N Q = number of cycles
B G = Energy from the grid per cycle (MWh)CEL = unit cost for grid electricity averaged over t imes and seasons
(5 1 0 - 2 lUA/MWh)Eb = average (between pulses) level of energy consumption
The five terms of the electricity cost equation are dominated by the energyconsumption terms (the last two), one related to power level during a pulse, theother to power level between pulses. The peak power level is around 650 MW.
FDR-ITER project Cost Estimate Chapter V-Page 27

9 June 1998
The steady state power of the HER plant is simplified to three levels: 175 MWduring and between pulses or when waiting for a pulse, 106 MW for 50% of a fiveday operating week and at weekends, for weeks during a test period, and 77 MWotherwise. To this is added the dynamic energy consumption for magnets andheating systems: typically 140 GJ for a 1000 s inductive burn, and an additional350 GJ per 1000 s of steady state burn.
As shown in Table V 2.1, during ITER operation, the between-pulse energyconsumption, given the expected availability of the machine, is the main driverfor the electricity costs for the high fluence EPP scenarios (higher availability andlong flat top steady state pulses) the energy consumption during pulsesdominates.
2.3 Fuel costs
Fuel costs include deuterium and tritium burnt during operation, plus that lostby decay, during plant operation, of the inventory (taken as 3.5 kg here). Aspecific cost of 2 IUA/kg for deuterium is used. There is no market for tritium forthe quantities required, and thus tritium may have little or no monetary value.Nevertheless a largely hypothetical 10 klUA/kg for tritium purchased off-site isused. The total tritium consumption should be compatible with externalresources, which are evaluated to be about 50 kg during the project life.
2.4 Capital improvements, spare parts, maintenance costs
Analysis of the expected capital costs to keep the ITER facility in the requiredeffective state has shown that very different ratios (annual cost against the initialinvestment) should be considered for the different systems, going from almost0% (e.g. Magnets) to 10% (for RF power generators and diagnostics), up to 15%(e.g. computers).
Considering all systems, the required maintenance cost amounts to 2.5% of theinitial investment, about 125 klUA/year. To these costs should be addedinvestments deferred initially to operation costs and the following largeidentified cost items : Plasma Facing Components of the divertor which will bereplaced 5 times [twice in Basic Performance Phase, 3 times (including initialinstallation) during Enhanced Performance Phase] and the shield blanket to bereplaced with a breeding blanket during the two years shutdown at the start ofthe Enhanced Performance Phase.
2.5 Waste disposal costs
The waste disposal cost, which covers the costs of packaging, transporting anddisposing of high level radioactive wastes (>104Ci/m3) during the operationallife of the project (excluding decommisioning) is taken as 45IUA/m 3ofuncompacted waste. It is assumed that the host country has available space in awaste repository, which is not purpose built and therefore is not chargeable solelyto ITER. The total cost of waste disposal during the life of the project amounts toonly about 20 klUA, including one first wall shield (~300 m3) and 5 divertorexchanges (high heat flux components, ~100 m3), i.e., less than 400 m3 in total.
FDR-1TER project Cost Estimate Chapter V-Page 28

9 June 1998
The above assumptions and consequences are shown in Table V 2.1. Theoperating costs of ITER amount to an average of 350 klUA/year with years ofsignificant capital improvements being higher, subdivided roughly into 1/4 forstaff, 3/16 for power, 1/16 for tritium supply, and 1/2 for capital improvements/maintenance costs.
FDR-ITER project Cost Estimate Chapter V-Page 29

9 June 1998
Part 3. Decommissioning costs
The policy proposed for the ITER decommissioning has been described inChapter VI, Part III. The technical implementation and schedule have beendetailed according to a credible option. Eve.n if the Host Party may consider otheroptions, the global cost to be borne should not change drastically as long as a fulldismantling of the machine is not required before the vacuum vessel activity hasdecayed substantially.
It is important to note that the ITER facility, because of the remote maintenanceimplemented during operation, offers initially most of the tools, procedures, andeven trained staff, to accomplish the decommissioning operations. This capacityis an essential element in keeping their cost down.
The manpower estimate is based on the requirements for the dismantling of themain active parts of the ITER facility only. The non-active parts are notconsidered, because their residual values are probably higher than theirdismantling costs.
For the technical operations described, with their schedule, in Chapter VI, theintegrated work force over 13 years (phase 0 + phase 1 + phase 3) amounts toabout 2 500 manyears. The average cost per manyear is rated at 2000 h/year x 0.045IUA/h=90kIUA. In addition, it is assumed that new hardware may be required toreplace a few aging tools, to procure new needed ones and to enhance the HotCell radwaste processing efficiency. One third of the manpower cost is put as anAFI, as observed in previous experience.
Other costs (dependant on the Host country) are not included in the presentestimate.
• radwaste disposal;
• components and facilities salvage value after dismantling whereapplicable (e.g. materials below "clearance");
• Site restoration;
• Financing related costs, if spending is made at a later stage.
Under the assumptions and limitations listed above, the estinated cost ofdecommissioning amounts to 300 klUA, 225 klUA for manpower costs and75 klUA for possible hardware costs.
FDR-ITER project Cost Estimate Chapter V-Page 30

9 June 1998
Summary Estimate Tables
For reference, summaries of the cost estimates for all phases are set out in thetables below and compared with previous estimates. These summaries aresubject to all the qualifications and considerations outlined above. In particularthe Construction cost estimates:
• assume the agreed Site Requirements and Site Design Assumptions
• include the policy for additional heating set out in Section 1.5.4
• exclude costs associated with site hosting, notably, the provision ofland, off-site facilities and all service supplies up to the boundary fence(Section 1.5.3)
• exclude items deferred beyond the start of operations (Section 1.5.6)
Construction Costs (klUAs)
Construction Costs includingAFI & Cost Uncertainty
AFICost Uncertainty
CDA
4900
-
+ 700
TAC4
5600
-
+ 933
IDR Estimate
5050-66205850
Point Value
270
(+770/-800)
DDR Estimate
5100-66706000
Point Value
240(+670/-900)
FDR Estimate
5220-57005460
Point value47.4
+ 240/-240
Other Costs During Construction (klUAs)
ConstructionManagement/SupportR & D
CDA
800
300
TAC4
not given
not given
IDR-DDR
800-900
300
FDR
780
150
Operating/Decommissioning Costs (klUAs)
Operating Costs(annual)
Decommissioning Costs(total)
CDA
390
excluded
TAC4
not given
not available
IDR-DDR
350-400
300-900
FDR
350
300
The FDR estimates comply with the basic constraint established by IC-1 that theaim should be to maintain "the cost of the device within the limits comparableto those indicated in the final report of the ITER CDA".
FDR-ITER project Cost Estimate Chapter V-Page 31

INTERNATIONAL THERMONUCLEAR EXPERIMENTAL REACTOR
«
TECHNICAL BASISFOR THE
ITER FINAL DESIGN REPORT, COSTREVIEW AND SAFETY ANALYSIS
(FDR)
Chapter VI
ITER CONSTRUCTION, COMMISSIONING,OPERATION AND
DECOMMISSIONING PLAN
13 July 1998

CHAPTER VIITER CONSTRUCTION, COMMISSIONING, OPERATION
AND DECOMMISSIONING PLAN
TABLE OF CONTENTS
PART I: ITER CONSTRUCTION AND COMMISSIONING SCHEDULE1.0 Introduction 22.0 Initial and Background Conditions 23.0 Overall Construction Summary Schedule 34.0 Construction Activities: Procurements
and Manufacturing 54.1 Procurement strategy 54.2 Procurement and fabrication 64.2.1 Magnet 64.2.2 Vacuum vessel and in-vessel components 64.2.3 Cryostat, W pressure suppression tank and drain tanks 74.2.4 Buildings and site civil works 74.2.5 Procurement summary 85.0 Construction Activities: Installation
and Tokamak Assembly 95.1 Tokamak assembly 95.2 Installation of major sub-systems 106.0 Commissioning Schedule 136.1 Individual sub-system test 136.2 Integrated commissioning up to the first plasma discharge 146.2.1 Preparation for integrated commissioning 146.2.2 Integrated commissioning procedure 146.3 Commissioning after first plasma 177.0 Critical Path 17
PART II: ITER OPERATION PLAN1.0 Introduction 182.0 ITER Plant Operation and Constraints 182.1 General considerations of ITER operation 183.0 BPP Phase 193.1 Operation plan 193.1.1 Pre-condition phase for first plasma 203.1.2 Hydrogen phase (H-phase, about 2.5 years) 223.1.3 Preparation phase for D-T operation (in parallel with H-phase,
about 2.5 years) 263.1.4 Deuterium phase with limited tritium use (D(T)-Phase,
about 0.5 years) 263.1.5 Deuterium-tritium phase (DT-phase, about 7 years) 273.2 ITER tritium breeding blanket and DEMO relevant blankets
testing 293.3 Maintenance 31

3.4 Tritium supply 314.0 Transient Phase from BPP to EPP 325.0 Enhanced Performance Phase (EPP) 32
PART III: ITER DECOMMISSIONING PLAN1.0 Introduction 332.0 Description of Decommissioning Plan 332.1 General policy 332.2 Assumption 342.2.1 Responsibilities 342.2.2 Status of the plant prior to decommissioning 342.3 Decommissioning scenario 362.4 Phase-0 de-activation 372.5 Phase-1 in-vessel and ex-vessel components dismantling 372.5.1 Removal of in-vessel components 372.5.2 Hot cell operation 382.5.3 Removal of ex-vessel components 392.5.4 Plant decommissioning .412.5.5 Disposal .412.6 Phase-2 radioactivity decay 412.7 Phase-3 final dismantling and disposal .422.7.1 Final dismantling - general description 422.7.2 Ex-vessel component removal 432.7.3 Machine sectors removal and vacuum vessel cutting 432.7.4 Disposal .453.0 Decommissioning schedule .46

ITER CONSTRUCTION, COMMISSIONING,OPERATION AND DECOMMISSIONING PLAN
Artide 2 of the ITER EDA Agreement states, in part, that the Parties shall conductjointly the following EDA:
(a) To establish the engineering design of ITER induding:
(b) A planning schedule for various stages of supply, construction,assembly, tests, and commissioning of ITER together with acorresponding plan for human and finandal resources requirements;
(c) To establish both the proposed program and the cost, manpower andschedule estimates for the operation, exploitation anddecommissioning of ITER.
This Chapter addresses the technical description of ITER Construction,Commissioning, Operation and Decommissioning Plan (CCODP). Thecorresponding plan for human and finandal resources requirements is addressedin the "ITER Project Cost Estimate" section of the 'Technical Basis for the ITERFinal Design Report, Cost Review and Safety Analysis."
Part I describes the ITER construction and commissioning schedule from theconstruction agreement to the first plasma discharge. Part II describes the ITERoperation plan. As a nuclear fusion fadlity, the first plasma experimental phasewith hydrogen is also "a pre-nuclear commissioning" phase of the machine andis described in Part II. Decommissioning plan is described at Part III.
FDR-ITER Construction Chapter Vl-Page 1

PARTIITER CONSTRUCTION AND COMMISSIONING SCHEDULE
1.0 INTRODUCTION
The planning schedule for Supply, Construction/Assembly and Commissioningof ITER ("the Plan") set out below will be maintained current as the designprogresses and as decisions reached by the Parties confirm or alter theassumptions that have led to its present status. Progress thereafter will dependon the actual organization and arrangements that will be put in place for theprocurement / construction commissioning.
2.0 INITIAL A N D BACKGROUND CONDITIONS
Appropriate level of detail design and necessary site-specific design has beendone during the EDA including the currently postulated extension period. TheConstruction Agreement is expected to be signed at the end of the extensionperiod and the regulatory procedure is started immediately after the agreementwith the appropriate ITER organization. The regulatory approval process,however, largely depends on which Host Party is selected. This will remainspeculative until a site is formally selected. As the site proposals are received andevaluated during the extension period, it will be possible to assess better the timeneeded for licensing in the various possible Host Parties and the effects on theoverall schedule. Since the start of the actual construction on the site dependsupon when site license or construction license is issued by the regulatoryauthority at the Host Party (these initial conditions are described in Figure 2-1:Initial Conditions for the Start of ITER Construction), dates in the Constructionand Commissioning Schedule are, therefore, measured in months from a startdate ("T=0") defined as the date at which the actual construction work ofexcavation for the Tokamak Building is started immediately after the site licenseor regulatory license is issued.
Furthermore, the following assumptions pertain at T=0:
• Documents required for the formal regulatory process are prepared bythe Host Party to allow the regulatory process to start immediately afterthe Construction Agreement;
• Preparations of contracts of equipment/material for the longest leaditems and critical buildings are complete including procurementsharing among Parties so as to permit placing of critical contracts atappropriate time;
• The site work starts immediately after T=0. Site preparation has beenstarted earlier by the Host Party.
FDR-ITER Construction Chapter Vl-Page 2
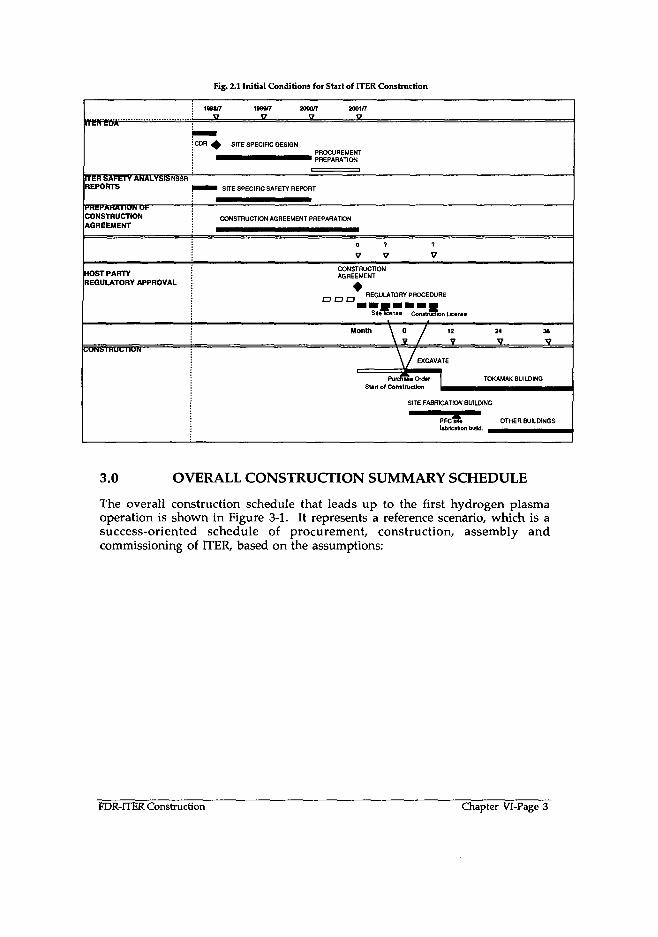
Fig. 2.1 Initial Conditions (or Start of ITER Construction
FTER SAFETY ANALYSISNSSRREPORTS
fKCI*AKAIIUN Uh
CONSTRUCTIONAGREEMENT
HOST PARTYREGULATORY APPROVAL
iiUNS 1 HUl* 1IUN
1SM/7 19M/7 2000/7 2001/7
C0H ^ SITE SPECIFIC DESIGNPROCUREMENT
• • ^ " SITE SPECIFIC SAFETY REPORT
CONSTRUCTION AGREEMENT PREPARATION
0 7 7
V V 7CONSTRUCTIONAGREEMENT
n n o REGULATORY PROCEDURE
SHebcense Constru?ion License
Month \ 0 / 12 24 M\ V / 7 V V
\ / EXCAVATE
Purcnue Order TOKAMAK BUILDING
SITE FABRICATION BUIL0ING
PFCsSe OTHER BUILDINGSlabrication build. mm^^mmm^^^lm
3.0 OVERALL CONSTRUCTION SUMMARY SCHEDULE
The overall construction schedule that leads up to the first hydrogen plasmaoperation is shown in Figure 3-1. It represents a reference scenario, which is asuccess-oriented schedule of procurement, construction, assembly andcommissioning of ITER, based on the assumptions:
FDR-ITER Construction Chapter Vl-Page 3

a
nI"
REGULATORY APPROVAL
CONSTRUCTION
STAKTUP&COMMISSIONING
PROCUREMENT
SITE LICENSE CONSTRUCTION LICENSE
w 24V
36
V48V
60
V72V
96
EXCAVATE
Purchase order I BUILD TOKAMAK BUILDING
SITE FABRICATION BUILDINGHVAC ready
OTHER BUILDINGS
PFC sitefabricationbuild.
TOKAMAK ASSEMBLY
Place firstTF/Winpit
Complete Complete Blanket/W torus Divertor Installation
Install ciyostat Place lowerbottom iid PFC
SYSTEM STARTUP & TESTING
INTEGRATEDCOMMISSIONING
Complete leak Magnet& pressure test exitarion
PROCUREMENT OF MAGNETSLast PFC complete
Purchase order TFCfab. CSfab. LastTFC csfab.start start complete complete
PROCUREMENT OF W SECTORS, BLANKET & DIVERTOR
Fig. 3.1 Overall Construction Summary Schedule

4.0 CONSTRUCTION ACTIVITIES: PROCUREMENTS ANDMANUFACTURING
4.1 Procurement strategy
The lead-times for the different components of ITER vary widely. Therefore aprocurement policy is established such that systems/components are deliveredjust in time (but with adequate time reserve ) for assembly, and installation/construction in accordance with the construction schedule. The policy alsoincludes delaying procurement as much as possible without affecting the overallschedule in order to ease planning for writing all specifications and ease the cashflow. Documentation required for purchasing the various items will be completein time for scheduled procurement. The placement of purchase orders forvarious systems/components is scheduled as shown in Table 4-1 to be consistentwith the assembly and commissioning schedule developed. The time, in month,from the Start of Construction under regulatory approval, corresponds to thetiming for purchase orders. Procurement typically takes six to twelve monthsfrom initiation of industrial consultations to the placing of purchase orders. Thismeans for example that the initiation of industrial consultations leading to thepurchase order for Vacuum Vessel must start right after the Start of Constructionso that the purchase order can be issued within 9-12 months. One of the mostcritical items regarding schedule is the volume production of superconductingstrand to meet the TF, CS and PF Coil fabrication schedule. The purchase orderfor the conductors must be awarded prior to or at the latest at the time of Start ofConstruction.
Three basic types of procurement define as follows the nature of the documentsprepared for the component or system procurement.
(A) Build-to-print: the design is fully specified and the performanceresponsibility lies with ITER. Suppliers use the design exactly as it isprovided to develop fabrication/shop drawings. Suppliers can requestchanges to the design, if necessary during fabrication, but those changeshave to be analyzed, and approved by ITER;
(B) Detailed design: ITER specifies a design that a supplier must follow.ITER is responsible for the analyses leading to the main design. Fromthis design, the supplier develops a detailed design to be approved byITER prior to manufacture. Shop drawings are then generated fromthat detailed design. Analysis to verify adequacy of the detailed designare performed by the supplier. The supplier is responsible for thoseanalyses, and therefore shares performance responsibility with ITER;
(C) Functional: ITER provides a functional specification and accompanyingexplanatory drawings and constraints. The design and performanceresponsibility lie with the supplier.
FDR-ITER Construction Chapter Vl-Page 5

4.2 Procurement and fabrication
4.2.1 Magnet
Due to limitations in world production capability of superconductor both ofNb3Sn and NbTi, it is essential to purchase the strands immediately after theconstruction agreement. It is assumed that (1) the detailed specifications formanufacturing TF coils, Magnet Structures and Central Solenoid are fullyavailable by the time of the Construction Agreement, (2) a sufficient number ofcontractors in the world will be qualified and trained for a massive production,and (3) procurement sharing will be agreed among the Parties before theConstruction Agreement in line with, thus, allowing the call for tender to beissued immediately and the contracts to be awarded at appropriate time prior toor, at the latest, at the Start of Construction.
Two manufacturing lines are assumed for TF coil fabrication. The fabrication ofthe prototype coil starts 27 months after the Purchase Order (PO), allowingsufficient time for the contractors' design and tooling preparation. The first pairof TF coils fabrication then starts six months later. Fabrication of a new pair ofcoils is then started every three months. Manufacturing time for a pair of coils isestimated to be 18 months in the beginning and 15 months at the end taking intoaccount of a learning curve. The first pair of coils will be shipped at month 51and the last pair of coils will be shipped at month 75 to meet the TokamakAssembly process as shown in the next section.
Fabrication of the lower PF coils and the correction coils has to be completed bymonth 50 from the Start of Construction, thus allowing the placement of thetrapped coils on the cryostat base at the beginning of the tokamak assembly. Allof nine PF coils are fabricated in the PF Fabrication Building on site because oftheir sizes. It is estimated that 30 months are needed to fabricate the four lowerPF coils and correction coils at site.
4.2.2 Vacuum vessel and in-vessel components
Twenty main vessel sectors are fabricated at the factory(s), shipped to theconstruction site and pre-assembled with the TF coils and thermal shield in theAssembly Hall before being installed sector by sector into the pit. Five W sectorsare simultaneously in different steps of manufacturing. Manufacturing time forone sector is 12 months based on the data obtained from the full scale W sectorfabrication R&D. Another three months are taken into account for shipping andinspection for acceptance at the site. The manufacturing time for the 20 sectors is51 months in total including about a year in advance for material and toolingprocurement. The last sector should be accepted at the site 72 months after theStart of Construction to meet the tokamak assembly schedule.
FDR-ITER Construction Chapter Vl-Page 6

4.2.3 Cryostat, W pressure suppression tank and drain tanks
The tokamak assembly starts with the installation, below the bottom lid of thecryostat, of the VV pressure suppression tank and drain tanks, placed on thebasemat level of the pit. Installation of the bottom lid of the cryostat startsmonth 45. The lower cryostat cylinder is installed sequentially. Manufacturingtime of the bottom lid is 18 months at the factory and another six months areneeded for field construction work on the site before installation. Earlyprocurement is required, namely within nine-twelve months after the Start ofConstruction. The upper cylinder and top lid of the cryostat will be fabricated tomeet the Tokamak assembly process. The completion of the cryostat with theinstallation of the top lid is after 98 months.
4.2.4 Buildings and site civil works
Construction of the Tokamak Building is a critical path. The excavation of theTokamak Building is started immediately after either site license or constructionlicense, depending upon the regulatory approval procedure in the Host Party.Excavation is completed within nine months. Installation of the large pipes ofthe heat Rejection System which are below grade will follow. The TokamakBuilding must be functional including cranes and HVAC system by the end offour years from the start of excavation in order to start the Tokamak assembly.
All Poloidal Field Coils are fabricated at the PF Coil Site Fabrication Building.Fabrication of lower PF coils must start 21 months after the Start of Construction.Allowing nine months for installation and commissioning of the winding andother tools at the building, the PF Coil Site Fabrication. Building has to beconstructed within 12 months from the Start of Construction.
FDR-ITER Construction Chapter Vl-Page 7

4.2.5 Procurement summary
Procurement for the major systems, components and buildings are summarizedin Table 4-1.
TABLE 4-1Purchase Order Timing for Major Systems/Components/Buildings
and Type of Procurement
Systems/Components/Buildings
Coils Conductor (Nb3Sn and NbTi)Toroidal Field CoilsPoloidal Field CoilsMagnet StructuresTokamak Building and Civil WorksPF Coil Fabrication BuildingCryostatVacuum Vessel Pressure Suppression TankCODAC SoftwareCentral SolenoidCryoplantOther BuildingsMagnet Feeder SystemHeat Rejection SystemHeat Transport SystemsSteady State Power SupplyLiquid and Gas DistributionVacuum VesselBackplateThermal ShieldCoil Power Supplies and DistributionNBI Power Supply*NBI Modules/Ion Sources/Acd*DivertorShield Blanket ModulesAssembly ToolingRemote Handling EquipmentVacuum/Pumping SystemsDiagnostic SystemsCODAC: Supervisory Control SystemICRF/ECRF Power Supplies*ICRFVECRF*Fueling/Wall Conditioning SystemTritium PlantBreeding Blanket Modules
PO Months fromStart of
Construction
0 (immediate)
9
18-21
21-24
Later
* If the technology is selected
Type ofProcurement
AABA
B/CB/C
BC
B/CACCBC
B/CB/C
CAAA
B/CC
A/BAA
B/CB/C
A/B/CA/B/C
CB/CA/CB/CB/CA
FDR-ITER Construction Chapter Vl-Page 8

5.0 CONSTRUCTION ACTIVITIES: INSTALLATION ANDTOKAMAK ASSEMBLY
5.1 Tokamak assembly
The assembly logic and procedure are described in detail in Chapter II- Section 6.0. The Tokamak assembly logic is summarized as follows.
1. Establish reference datums for assembly.
2. Install the vacuum vessel pressure suppression tank, drain tanks,cryostat foundations and cryostat lower cylinder.
3. Install and erect the cryostat base and cryostat mid-cylinder.
4. Install lower PF coils and lower correction coils with feeders intemporary locations, and install lower crown and it's support.
5. Subassembly one TF coil and one W sector with its internal shieldingand thermal shield in pre-assembly area, transport to pit and lower intoplace.
6. Repeat the pre-assembly and installation sequences for adjacent TF/VVsubassemblies. Connect intercoil structures of adjacent TF coils. Weldand leak test adjacent W sectors.
7. While doing the TF/VV pre-assembly, also pre-assemble backplatesectors by welding them in the pre-assembly area. Lower into the pitand introduce by toroidal rotation in the already welded VV portion.
8. Repeat the preassembly operation for other sectors of backplate, putthem in the pit and weld them to adjacent sectors before placing the lastW sector, store and nest the two final sectors of backplate inside theassembled vessel.
9. After placing all 20 TF coils with full W , install the upper crown andrelax lower crown support. The magnetic axis is then establishedgeometrically.
10. Attach the lower PF coils to the TF coils, and install the upper PF coils.
11. Install the CS coil and complete preload.
12. In parallel, weld the last W sectors and complete the final backplatewelds inside the vacuum vessel.
13. Raise Backplate to final position and fit supports.
14. Weld divertor rails inside the vessel.
15. Install divertor ports and equatorial ports.
FDR-ITER Construction Chapter Vl-Page 9

16. Place all Primary Shield Blanket Modules in the W.
17. Continue welding the cooling pipes for the VV and in-vesselcomponents and install all magnet leads, cooling lines,instrumentation, etc.
18. Install equipment attached outside of the ports.
19. Install upper cryostat lid, vacuum pumps and bioshield.
5.2 Installation of major sub-systems
The installation and assembly of all sub-systems and most of their functionalacceptance tests should be completed before the integrated commissioning ofITER aiming at the first plasma. Major utilities such as Steady State PowerSupply and Heat Rejection System are partially installed at the beginning of theseventh year from the Start of Construction, and ready to allow the start oftesting and commissioning of Heat Transfer System, Power Supply System,Cryoplant, etc. Parts of CODAC system which allow the individual sub-systemtesting are also ready by then. Installation and sub-system commissioningschedule is shown in Figure 5.2-1.
FDR-ITER Construction Chapter Vl-Page 10

Fig. 5.2.1 Installation/Assembly/Testing Schedule
n
I
System Area"87 I 90 99 102 105
MAJORMILESTONES Tokamak Building i Start TF/VWTS
HVAC ready pre-assemblyReady to use SSPS j& Heat Re|ection Sys |
TBW/TScomplete torus
Start Integrated CoolDown
i First! Plasma
BACKPLATE &BLANKETS,INSTALLATION
Backplata pre-astembly
Install bacVplate
Deliver BlankeMJmiterfflaffle
Equatorial Porta
Install Blanket Transporter
Install Blanket/Umiter/Baffle
G3 ^ AlignmentI
• Leak a pressure testI !
DIVERTORCASSETTE,INSTALLATION
Pre-assembly Oivwior Casaette
Dlvenor Ports I: I !I Instal Divenor Transporter
Install divertor railInstal tfveitor
Mignment
Leak & pressure test
IReady to integrated commissioningVACUUM VESSEL &TF CoUs
Pre-assenOly TF/W/TSPlace T F / W ^ S in Pit
VVweUsleak testInstall lower crown c j \
Install shield plugs
IInstall upper crown !
Estabtsh Mag. axis
n
s
PF COILS
Place lower PF coilsat bottom of eryostat
Instai Lower PFCs & CCsInstall upper PFCs » CCs
PFC & CCs Lead connection• d Leak (.pressure test
CS COILCS Lead connection i
Leak & pressure test
CRYOSTAT
Instal lower W.tewertmid cylinder in pit
Install upper cylinderInstil! cryojtatTS I
JTS leak A pressure test 1
|.f.;k:; i Oiag. ports 4 conn«ctk>na
! • • Leik A prMfure t«st
Ready to integrated commiuioning

Fig. 5.3.1 Installation/Assembly/Testing Schedule
99
ao3
I
57 60 63 66" « 7 2 " 7 5 1 78 1 81"" 84 87 ""W ^ 1 96 99 102 IDS ) 108

6.0 COMMISSIONING SCHEDULE
As much as possible, individual subsystem tests will be done before installationor before connecting to other subsystems. Inside or around the pit, allcommissioning (integrated or otherwise) will be done according to the mastercommissioning plan. Individual subsystems even outside the pit will also betested according to the master plan if the tests interface with others.
6.1 Individual sub-system test
Testing of each individual plant subsystem has to start immediately whenpermitted by corresponding assembly work. In the pit area, some overlap ofassembly and commissioning will be inevitable to save time. Individual plantsubsystem tests will be done by simulating interfaces with other systems or byusing dummy loads or bypasses. Links with the CODAC supervisory controlsystem are compulsory.
The following system tests will be carried out by simulating interfaces with othersystems or by using dummy loads or bypas, and taking advantage of theirmodularity:
• Magnet power supply with dummy load (one by one);
• Cryoplant and cryo-distribution with bypass (one by one);
• Cooling systems with bypass;
• Vacuum roughing pumps by closing gate valve to main chamber;
• Additional heating, current drive and diagnostics;
• Fueling without tritium.
A more complex example is that of the remote handling equipment andoperation. Many RH tools, especially transporters, will be tested on mock-upsduring the construction phase. Nevertheless, some complete RH techniques willbe used as part of the initial installation either for appropriate efficacy or fordemonstration purposes. Therefore, the major RH equipment will be installedand commissioned before first plasma.
Each individual subsystem must be ready before the next phase of integrated testwith other subsystems. Some subsystems are not needed in an early phase andtheir commissioning may be done in parallel with the following phases.
FDR-ITER Construction Chapter Vl-Page 13

6.2 Integrated commissioning up to the first plasma discharge
6.2.1 Preparation for integrated commissioning
There will be need of adequate testing of controls and interfaces amongsubsystems. CODAC is designed to permit testing of the complete CODAC systemin the absence of one or more of the sub-subsystems. Subsystem controllers aredesigned to provide simulated data for equipment status, alarm monitoring andresponse to command. (In reality, it is too complicated to provide perfectlysimulated data and response in many systems. However, at a minimum,simplified data and response will be provided.)
At the conclusion of this phase the whole CODAC system is ready.
6.2.2 Integrated commissioning procedure
All systems, including in-vessel viewing system and additional heating andcurrent drive system, are tested to the extent possible without plasma. Thisincludes major items such as:
(1) Vacuum leak and pressure test
The pump down of the Cryostat and Vacuum Vessel start for leak tests at Month95 from the Start of the Construction.
The following test sequence will be used for leak testing of both the vacuumvessel and cryostat:
(i) all components will be individually tested at operating pressure (withhelium);
(ii) a global leak test will be conducted with all components pressurizedto operating pressure;
(iii) pressure testing of the vacuum vessel and cryostat will be made; and
(iv) a final global leak test will be conducted with all componentspressurized to operating pressure, and VV and cryostat undervacuum.
(2) Hydraulic test and baking
(3) Magnet cool down
After completion of global leak test of the cryostat, the cool down of magnets canbe started at Month 100. It takes 40 days to cooldown all TF, CS, PF andCorrection coils. Information for optimization of the cooldown procedure isobtained during this testing period.
FDR-1TER Construction Chapter Vl-Page 14

(4) TF excitation
Main testing items are (1) all superconducting coils excitation, (2) fast dischargeunits and power supply units with coils and (3) AC loss measurements of eachcoil. It is scheduled to take about four months for the first coil excitation test.Error field measurement and accuracy of alignment of the first wall to thetoroidal magnetic field are also performed during this phase.
(5) Pulse without plasma
Wall conditioning including baking and glow discharge cleaning starts at Month106 and Commissioning of pulse operation without plasma, includingcalibration of magnetics is continued until the first plasma discharge at the end ofMonth 108.
At the end of this phase the following will be achieved:
• Readiness of operation of the tokamak machine (e.g., vacuum, baking,sufficiently high toroidal magnetic field (4T) to match ECRH forstart-up and discharge cleaning, and more than 50% of coil currents inall PF coils);
• Readiness of all subsystems, including additional heating and currentdrive system, start-up diagnostics set, and fueling (except tritiumsystem), which are needed for H plasma operation. Initial blanket testmodules (or blanking plugs) have been installed and commissioned.Some subsystems may be completed later.
The integrated commissioning schedule up to the first plasma is shown inFigure 6.2-1.
FDR-ITER Construction Chapter Vl-Page 15

Commissioning Activities
1 est electrical Oround, electricalIsolation and CODACCryostat'an'dTn'-cryostaTCbmiKmenisLeakTest
Vacuum Vessel and tit-vesselComponents Leak TestOyosUT£-VVVenfPfessureTes«6r
it II and Post Pressure TestCryosU'tTCmpDowntp'umping'speed test)FlHSlPrlfsSure&MydrVluIteTeStsaf"Cooling Systems
(pumping speed test-air)rue'ling'Tes'tP'umpingSpee'd'Te'st :'ElectricarCroundandTestEIectncaT": : I : j ! :"Isolation @ High Voltage /Interlocks I j j I i j :B-aKingTesfGlow Discharge Test
CrjiIsan"d'"Cryostat"CooTdown""
j ; | ; [ \ CbcffbwhSti
WagKefTxaar7onTesie(CS;TF;FFci | j | j j ! ; ! p ^ ^ ^ ^ ^ ^C O j I I j I I i j ' 'CdlTF6wefSuppTyTestswiQi"Magriet"i ; j : ] ;' \'"":ExcitationCS,TF,PrtCCExatafionTests'CoiTACLoss'MeasurerneHtsDiscHafgeConWoITestErrBfFtetdMMsUKHte'nT'MlUl-Magnets excitation (Room Temp./Atmosphere inside W )
- t i i ^ 4 t »—.
{ : : ; : ; •, ; : >....-v....^.. i..—! i -i'—i
-1 i i -r i t i.....;.. ,.; ', 'f ;... +....^.....i +.—<..
.; ; ; ;— ....** : *..
W P i i m p d b w n ' f i B a K n g j j ; : ; j \ ;' ! :'" "T ""T ;'""T
Glbw"DiscKargeCIeariing(GDCT ; i j ; ; ; :""T f j f -j f r -|-! i I i I i I ! I : |W>lfcoini>nh#lut
j j i ; : :—DCHGresffoi"DiagnSstics'FueTIiKgTest'FumpThg'Speed'resT : | | ; ] | \'""t ;"and Hearing Systems Test I i ! ! i i i I i
i •—? j .* "—? .*—?
—', ; . . - . ' , . . . . . • , - . . . ^ . . . .
V«curn"VeSsel'VifcUulH"
CrybstifVltcUUrh
t t ^ i
• C 'osM RimpDowASiCoolDoivh
'i i i }•—-s- >—}•—<—
Fig. 6.2.1 Integrated Commissioning Schedule up to First Hydrogen Plasma
FDR-ITER Construction Chapter Vl-Page 16

6.3 Commissioning after first plasma
After the first plasma there will be further integrated commissioning over aboutthree years leading to full operation in DT. The first 2.5 years of operationwithout DT is defined as "Pre-nuclear Commissioning Phase" and "NuclearCommissioning" will be done by using DD discharges with limited amount oftritium use. These commissioning activities are treated as part of the operationplan set out in Part II.
7.0 CRITICAL PATH
The critical path is the longest chain of activities, from start to finish, thatcontrols the overall project schedule. For ITER construction, the critical path willbegin with either the construction of the Tokamak Building or the procurementof superconductors, depending upon the regulatory procedure, and end with themilestone of the machine being "Ready for first plasma."
About 1000 tons of Nb3Sn superconductor strand are required for the TF coilsand CS coil and must be manufactured in five years - an average production rateof about approximately 265 tons per year sustained over four years. If theirpurchase order is awarded at the same time as the excavation starts, theprocurement of superconductors and construction of Tokamak Building are bothequally critical.
It likely needs nine to twelve months to make the first large purchase orderunder a new organization after the Construction Agreement. If the regulatoryapproval for starting the excavation would be offered by the Host Party earlierthan nine months from the Construction Agreement, the procurement of thesuperconductors could not be ready and, thus, it will be the prime critical path.On the other hand, if the regulatory approval process takes longer than twelvemonths, then the purchase order of the superconductors can be awarded prior tothe start of excavation. Consequently, in this condition, the prime critical pathwill be the construction of the Tokamak Building.
Once the Tokamak Assembly starts, the critical path is always connected to theTF, PF and CS coils manufacturing and assembly until the start of the IntegratedCommissioning.
FDR-ITER Construction Chapter Vl-Page 17
PART IIITER OPERATION PLAN
1.0 INTRODUCTION
The ITER plant operation is divided into two phases, i.e., the basic performancephase and the enhanced performance phase.
The basic performance phase (BPP) is expected to last a decade. This phase isdivided into Hydrogen Phase, Deuterium Phase with limited tritium use andDeuterium-Tritium Plasma Phase. As a plasma experimental facility, theoperation starts from the first plasma with hydrogen. However, as a nuclearfusion experimental facility, Hydrogen Phase is defined as "Pre-nuclearCommissioning Phase", and the ITER machine will be fully commissioned andoperated with the full plasma current and the full heating power with H plasmadischarges. Then, after nuclear commissioning by using D plasma dischargeswith limited use of tritium, the full deutrium-tritium operation starts towardsan extended burn at full performances.. The enhanced performance phase (EPP)is also expected to last a decade with high availability operation. In this section,the operation plan of these phases is summarized.
2.0 ITER PLANT OPERATION AND CONSTRAINTS
2.1 General considerations of ITER operation
ITER will be the first experimental fusion reactor and probably the only oneforeseen to exist during most of its operation phase. Therefore, efficient andcareful use of ITER is essential. From this point of view, the following principlesand assumptions are adopted for ITER operation.
(1) It is essential that all the individual sub-systems be separately tested to thegreatest extent possible before being linked to ITER to minimize the time devotedto integrated commissioning and trouble solving at the full plant level.
(2) The operation schedule should be as compact as possible. Commissioningshould proceed as rapidly as possible, but with adequate time devoted toidentifying and fixing machine problems. Before starting D operation withlimited use of tritium, all pre-nuclear commissioning should be completedwith/without hydrogen plasma with the fullest possible engineering parametersexcept those relating to fusion power. DT operation should begin as soon aspossible after the commissioning.
(3) ITER operation will have to be efficient in order to make optimum use ofthe machine, by:
• Participation of remote experimental sites;
• Continuous operation, i.e., three shifts - 24 hours/ day;
FDR-ITER Construction Chapter Vl-Page 18

• Long operation cycle and a relatively long break, e.g., ten dayscontinuous operation and one week break;
• A few months break per year for maintenance.
Very careful planning is essential for ITER operation. The permissibleparameters and conditions will have to be authorized in advance and theoperation must be within the envelope of the approved conditions. In order toassess the planned operation, a comprehensive simulation code, including bothengineering and physics, is essential. It will have to be developed during theconstruction phase, tested during the commissioning phase and improvedduring operation. This code will be also essential during operation for real orsemi-real time analysis and display to understand plasma and machine behaviorand to optimize operation conditions.
The ITER plant must be operated during the BPP, taking into account theavailable tritium, externally supplied. A reasonable estimate of the availabletritium from Canada is as follows:
• 22 kg by 2009 in storage;
• 1.5 kg / year from 2009 onwards.
3.0 BPP PHASE
3.1 Operation plan
The Basic Performance Phase (BPP) plan is shown in Table 3.1-1. Plasmaoperation will be preceded by a year of integration of the sub-systems, followed by2.5 years of initial operation in hydrogen to allow for the testing, integration andcommissioning of the tokamak sub-systems, and a brief DD phase with limiteduse of T before proceeding to operation with full DT. Various operational modesare envisaged, including initial ohmic and auxiliary heated pulses in H, 1000 signited pulses, and longer pulses assisted by current drive. Although the mainemphasis will initially be on studies of the reference scenario of ignition andextended burn with a pulse length of 1000 s and a fusion power of 1-1.5 GW,blanket module testing will also be done whenever significant neutron fluxesbecome available. The operating plan allows for maintenance, including anextended down time during the sixth and seventh year following the first fullyear of ignited operation.
The ITER Physics programme, which governs, besides engineering constraints,the operation plan, is described in Section 5.2 of Chapter IV.
FDR-ITER Construction Chapter Vl-Page 19

TABLE 3.1-1Plasma Operation Plan for the BPP
DXVICB
HI HO
Year(-1) Year 2 Yea-3 Year 4
HIOH ACTIVATIOtl PHUTCI0WITIO*, OTSTAIKED BURS *nd BrjUOCET TEST
<DD,DT)I Year5 I Year6 I Year7 I Years I Year9
Sub-SysteiTesting,
IntiaJOtimlc
Integration a rKf
Ful Reid,CurrentandHeatingPower
iDD Sub- Ignillon Sustained' FYoto- Ignled studies 10003 BumI type Operation 2 00s• IgnKion
India! Steady-State Studies
SustainedBum
1000 s
Steady-State Studes >
Banket Modules Test >
First ' Plasma
I I Operation
m Maintenance
\/'/I Commissioning of ITffl Systems
3.1.1 Pre-condition phase for first plasma
After about one year of integrated commissioning including vacuum pumpingof a few months and discharge cleaning of a few weeks, all of the ITER plantexcept some subsystems such as tritium plant, hot cells and radioactive materialstorage will have been completed and be ready to operate with hydrogen plasmaswith conservative coil currents (50 ~ 70%) and low heating power (~ 10 MW),and with the necessary diagnostics of hydrogen plasmas,
(0) Before the first plasma (see Integrated Commissioning Plan (Part I,Section 6.2))
Vacuum pumping > 5 months including leak test periodBaking > 3 months including test and Glow/ECHGlow/ECH > 1 month including test(The first wall is ready for ohmic discharges)BT =4T
IpF/ICS > 50%Adjustment of axes of the toroidal magnetic field and the first wall is done.Error Field Measured(Assuming limited human access to adjust magnetic sensors)Diagnostics (see Table 3.1-2)
All other facilities, except those directly related to tritium operation, are ready.
FDR-ITER Construction Chapter Vl-Page 20

TABLE E 3.1-2Diagnostics System (* Start-up Diagnostics System)
Diagnostics Type
Magnetic DiagnosticsEx-Blanket MagneticsIn-Blanket Magnetics
Divertor Magnetics
Continuous Rogowski CoilsDiamagnetic Loop
Neutron DiagnosticsRadial Neutron Camera
Vertical Neutron Camera
Micro fission Chambers (In-Vessel)Neutron Flux Monitors (Ex-Vessel)
Radial Neutron SpectrometerGamma-Ray Spectrometers
Activation SystemLost Alpha Detectors
Knock-on Tail Neutron Spectrometer
Optical/IR SystemsThomson Scattering (Core)Thomson Scattering (Edge)Thomson Scattering (X-Point)
Thomson Scattering (Divertor)
Toroidal Interfer. / Polarimetric SystemPolarimetric System (Poloid Field
Measurem.)Collective Scattering System
Bolometric SystemBolometric Array For Main Plasma
Bolometric Array For DivertorSpectroscopic and NPA Systems
Active Spectroscopy (based on DNB)
H Alpha SpectroscopyImpurity Monitoring (Main Plasma)
Impurity Monitoring (Divertor)
X-Ray Crystal Spectrometers
Visible Continuum ArraySoft X-Ray Array
Neutral Particle Analyzers
Two Photon Ly-Alpha Fluorescence
Laser Induced Fluorescence
Status at ITER Start up
Complete
Complete
Complete
Complete
Complete
Complete
Complete
CompleteComplete
Collimators, interfaces
Two detectors in vertical and horizont neutroncameras
All in-vessel components and interfacesIn-vessel interfaces complete
Collimators, interfaces
CompletePenetrations, in-vessel optics, interfaces
Penetrations, in-vessel optics, interfaces
Penetrations, in-vessel optics, interfaces
CompletePenetrations, in-vessel optics, interfaces
Penetrations, in-vessel optics, interfaces
Complete
Complete
Penetrations, in-vessel optics, windows;partially ready to work in passive option
CompleteComplete
CompleteCollimators, interfaces
Complete
Complete
Penetrations, interfaces; one channel ready towork in passive option
Penetrations, in-vessel optics, interfaces
Penetrations, in-vessel optics, interfaces
FDR-ITER Construction Chapter Vl-Page 21

TABLE E 3.1-2 (cont)Diagnostics System (Start-up Diagnostics System)
Diagnostics Type
Microwave DiagnosticsECE Diagnostics for Main Plasma
Reflectometers for Main Plasma
Reflectometers for Plasma Position
Reflectometers for Divertor Plasma
ECA for Divertor Plasma
Microwave Scattering (Main Plasma)
Fast Wave Reflectometry
Microwave Scattering (Divertor)
Plasma-Facing Componentsand Operational Diagnostics
IR/Visible CamerasThermocouples
Pressure Gauges
Residual Gas AnalyzersHard X-Ray Monitor
Langmuir Probes/ Tile Shunts
Diagnostic Neutral Beam
Status at ITER Start-Up
Complete
Complete
In-vessel components, interfaces
In-vessel components and interfaces; twochannels complete
In-vessel components and interfaces; twochannels complete
In-vessel components, interfacesIn-vessel components and interfaces; one channelcomplete
In-vessel components and interfaces
CompleteComplete
Complete
CompleteCompleteComplete
Penetration, interface, main components on site
3.1.2 Hydrogen phase (H-phase, about 2.5 years)
In this phase, no fusion reaction occurs, and ITER in-vessel components are notactivated and not contaminated by tritium. However, ITER will becommissioned with tokamak discharges with the same electromagneticcharacteristics as during active operation.
In this H-phase, a reference operational scenario is developed, i.e. plasma currentinitiation, current ramp-up, formation of divertor configuration andramp-down. By the end of the H-phase, the maximum plasma current of 21 MAwill have been achieved at the maximum toroidal magnetic field of 5.7 T andabout 100 MW of external heating power with a flat top duration of a fewhundred seconds. The heat flux on to the limiter and the peak heat flux onto thevertical target will be in the same range of average values as for the referenceoperation during the DT-phase. Therefore, control of both the main plasma andthe divertor plasma can be studied with a partially detached and compared withnumerical predictions.
Adequacy of heating power for L-H transition should be confirmed as early aspossible. However, L- to H-mode transition may not be obtained in H-plasmaoperation unless working with a low toroidal magnetic field, a low densityplasma, and full heating power. Due to the divertor high heat load and the high
FDR-ITER Construction Chapter Vl-Page 22

shine through at low density plasma, the heating pulse length should be limited.Extrapolation to full power operation with DT plasma will be needed.
Concerning transient phenomena, electromagnetic loads due to disruptions orvertical displacement events, and heat loads due to runaway electrons, have thesame characteristics as that during the DT-phase. The confined plasma thermalenergy of H-plasma is much less than that of full DT-plasma. Therefore, the veryshort pulse thermal load due to the thermal quench preceding the currentquench during disruption is much less than that of full DT plasma. Therefore,only three effects, i.e., the effect of this thermal quench, mainly evaporation ofthe surface of the divertor target, the effects of neutrons and the effect of alphaparticle plasma heating and material bombardment, can not be tested in thisH-phase, but almost all other plasma effects can be investigated in this phasewhich reduces significantly the uncertainties and allows optimization of plasmacontrol to prevent and/or mitigate severe disruptions and vertical displacementevents (VDEs).
For steady state operation, only a preliminary experiment will be performed witha small bootstrap current due to the low power achieved in these H plasmas.However, fundamental tests of non-inductive current drive will be done.
Possible or expected pulses during the first two years have been developed basedon the body of tokamak operating experience by assuming three shift operations(5 days/weeks) with limited activities during the night, e.g., discharge cleaning.In two years the total operation days are estimated at 240 days and the totalnumber of shots at 3000-4000, including commissioning shots without plasmasand wall conditioning shots. The real experimental shots would be about2000-3000. In this period, no vacuum vent is planned. The major steps are asfollows:
(1 -1) First year, first period: 4 months operation
Milestone:
• >10MA, >100 s (flat top), >4T;
• Commissioning of Div. NB(H injection)/RF/Diag;
• On-line Time Analysis Code available;
• Confirmation of plasma control system;
• Cleaning machine for high current and long pulse operation.
FDR-ITER Construction Chapter Vl-Page 23

Remarks:
(a) With relatively easy plasma operation, e.g., ^95^4, all plasma controlsystems, pumping/ fueling systems, the initial set of diagnostics and most ofNB/RF heating will be tested by combining plasma discharges. For the longpulse operation, on-line analysis and display of results are essential.
(b) In order to have careful and useful operation, pulse repetition time will berelatively long, typically one hour except for standard pulses for wallconditioning shots or machine test shots.
(c) During this period, in parallel with plasma discharges, commissioning ofthe magnet system including AC loss measurements and increase of coilcurrents will continue.
(d) The most efficient combination of cleaning methods of the first wall and thedivertor with ECH/ICRF will be developed during this period.
(1-2) First year, second period: 3 months operation.
Milestone:
• >16MA, >100~300s, 5.7T, Div., NB/RF>30 MW/lOOs;
• Reference Ip scenario at 15 MA, 4T, ^95=3;
• Initial long pulse heating test;
• Initial current drive test;
• Demonstration of boundary plasma control;
• Characterization of plasma transients.
Remarks:
(a) Focus on the reference scenario which involves initiation with ECH, plasmacurrent ramp-up, limiter to divertor configuration transition, plasmadensity build up, flat top at %5~3 and ramp down. This full scenario can bedeveloped at 15MA current flat top and 4T toroidal field.
(b) Heat load to the limiter is the same as in full DT operations.
(c) Reduce uncertainties of plasma transient and divertor operation.
(d) Study suppression and/or mitigation of VDEs and disruptions.
FDR-HER Construction Chapter Vl-Page 24

(e) Almost full engineering performance of ITER except systems relating totritium.
(f) The pulse length should be as long as possible and several experiments canbe performed during each pulse.
(2-1) Second year, first period: 5 months operation-
Milestone
• <21MA, >100~300s, 5.71, Div., NB/RF> 80 MW/100 s;
• Reference full Ip with heating and current drive;
• Test of mitigation of VDEs and disruption;
• Test of remote experimental sites if required;
• Demonstration of L-H transition.
Remarks:
(a) Focus on reference scenario at full current.
(b) Test of the Heating Power necessary for L-H transition. Because of lowdensity in hydrogen, and low radiation losses, the divertor will probablywork with an "attached" plasma. Therefore, heating pulse should belimited at around ten seconds. Examples of parameters for this experimentmay be as follows: ne = 3 x 10¹⁹nr3, BT = 4T, NB/RF = 80 MW and a heatingpulse of 10 seconds.
(2-2) Second year, second period: three months operation-
Milestone
• <21MA, >300~500s, 5.71, Div., NB/RF> 100 MW/300 s;
• Long pulse with heating and current drive;
• Medium density (0.5xl020 nr 3) & clean plasma (Zeff ~ 2) with adetached/semi detached divertor;
• Mitigation of VDE and disruption;
• Full operation of remote experimental sites if required.
FDR-ITER Construction Chapter Vl-Page 25

Remarks:
(a) Full test of high current and long pulse operation.
(b) Electromagnetic and heat loads due to VDEs and disruptions are almost thesame as in full DT operations except the heat load due to thermal quench ismuch lower. *
(c) Peak heat flux on the divertor target is almost the same as in full DToperations.
(3-1) Third year, first period: 6 months maintenance.
This period is reserved for maintenance of plasma facing components withhuman access, further installation/commissioning and/or further H-plasmadischarges. Removal of hydrogen or replacement of hydrogen by deuterium willalso be done by using baking, glow discharges and ECH discharge cleaning.
3.1.3 Preparation phase for D-T operation (in parallel with H-phase, about2.5 years)
In parallel with H-phase, commissioning of the remote maintenance system,tritium system and other additional systems is completed. The final test of safetysystems is also done. By the end of the phase, ITER is ready to go to Deuteriumplasma phase with limited tritium use.
3.1.4 Deuterium phase with limited tritium use (D(T)-Phase, about0.5 years)
By using limited amounts of tritium in deuterium plasma, the integrated ITERsystem is commissioned, especially with regard to shielding performance,including:
• "Nuclear Commissioning" of the machine with D/(T) plasma,including check and calibration of nuclear diagnostics, shielding testand radiation monitoring;
• Research operation with D/(T) plasma.
Characteristics of deuterium plasma behavior are very similar to that ofdeuterium tritium even if the alpha heating power is much less than theexternal heating power. Therefore, the reference plasma operational scenarioincluding L-mode to H-mode transition, very short burn, demonstration ofELMy H-mode for a long period and plasma termination may be confirmed inthis phase. Tritium balance is studied. In this period, no vacuum vent isplanned. The major steps are as follows:
FDR-ITER Construction Chapter Vl-Page 26

DP Experiment with limited T (third year: 4 months operation).
Milestone
• Replacement of H by D, clean D-plasma;
• Confirmation of neutron measurements;
• Confirmation of neutron shield;
• Confirmation L-H transition, confinement;
• Reference plasma (full current, heating power, density, detached/semidetached divertor, ELMy H-mode);
• Current drive with full power;
• Finalize nuclear commissioning with a limited T;
• Obtain Full operating license if required.
3.1.5 Deuterium-tritium phase (DT-phase, about seven years)
Under DT burning conditions, the experimental program for ITER, as the firstfusion reactor, must investigate a number of topics (see Chapter IV. 5.2).
Development of a reference scenario will be intensively done as follows: byoptimizing plasma and increasing tritium fueling, fusion power and burn pulsewill be gradually increased and reference operation with fusion power of~ 1.5 GW and flat top duration of ~ 1000 s is planned to be achieved within thefirst two years of this phase. In this process, the key topics will be investigatedand development of a reliable reference operation without severe disruptionsand vertical displacement events will be finalized. In parallel, additionalscenarios will be studied for future operation.
After developing a reliable operation scenario, series of experiments includingcontinuous operation for three-six days are planned mainly for engineering testincluding breeding blanket test modules for the next phase. Accumulation ofaverage neutron fluence on the first wall is planned to be about 0.3 MW a/m2.
FDR-ITER Construction Chapter Vl-Page 27

The major steps are as follows:
DT-1 Experiment (4th-5th year)
Milestone of 4th year
• Burn control with Pfus > 0.75 GW and tburn > 100 s;
• Initial test of advanced modes with DT.
Milestone of 5th year
• Burn control with Pfus =1.5 GW and tburn > 100 s;
• Test of advanced modes;
• Beta limit.
DT-2 Experiment (6th year)
Milestone
• 1.5 GW, 1000 s, reliable operation;
• Fusion power and pulse length increase with advanced modes.
DT-3 Experiment (7th - 10th year)
Milestone
• High repetition of the reference scenario;
• Development of EPP scenarios;
• Reactor plasma basis;
• Achievement of a fluence of about 0.3 MWa/m2.
FDR-ITER Construction Chapter Vl-Page 28

3.2 ITER tritium breeding blanket and DEMO relevant blanketstesting
One of the objectives of ITER is to demonstrate fusion technologies in anintegrated system by performing integrated testing of nuclear componentsrequired to utilize fusion energy. In the agreed detailed objectives, it is stated that"ITER should test design concepts of tritium breeding blankets relevant to areactor. The tests foreseen on modules include the demonstration of a breedingcapability that would lead to tritium self-sufficiency in a reactor, the extraction ofhigh-grade heat, and electricity generation."
At present, four tritium breeding DEMO relevant blanket concepts are planned inthe Parties' programme for testing in ITER, in addition to one for the breedingblanket for the EPP of ITER to produce a large fraction of the tritium fuel. ITERhas assigned four equatorial ports during the BPP for testing tritium breedingblankets.
The ITER blanket test program is intended to achieve the following mainobjectives:
1) Evaluate the performance of the ITER breeding blanket for the EPP andthe DEMO relevant blanket designs;
2) Demonstrate tritium breeding performance and verify the on-linetritium recovery and control systems;
3) Demonstrate the high-grade heat extraction and the electricitygeneration from available one of the DEMO relevant blanket;
4) Validate and calibrate the design tools and the data base used in theblanket design process including neutronics, electromagnetic, heattransfer, hydraulics;
5) Demonstrate the integral performance of the blanket systems underdifferent loading conditions;
6) Observe possible irradiation effects on the performance of the blanketmodules.
The test program requires installing the blanket test modules early in the BPP ofITER operation, before the DT operation. The BPP test schedule is shown inFigure 3.2-1 for each blanket concept, featuring the main test items (T=0 at theFirst Plasma). This test plan will be integrated with the different phases of thePhysics programmef, with emphasis of test campaigns of three to six days, ofrepetitive pulses, dedicated to functional blanket tests mostly during DT-3Experimental Phase.
FDR-ITER Construction Chapter Vl-Page 29

Figure 3 5 . 1 . Test Ran Schedule
Activity Namei 1liirfii&M
3 1 4 i 5
fitt6 8 : 9 10
1 ^ 1
Nuclear environment wiaeactenzation
Nuctear'HeaiingMeasiiemen'B
Neutron and Gamma' 'rays Measur'aiients'"
MKation'and'DecaVHeaVMaasuiemeiite''
"Gas'pV^'uc^on'Measure'mente
IIBEMBB!tlBHZESlISEEIlinillBDBinSBHE
rfER'Breeding"Bianl<et
'"System *6'heckouVand cKaracterizatioii''
"Neu ion ics fes is '
"'6rvDne'1friHunVEWraction'
F^offnanoeTeste
ftater'Cooled*Ceramic Breeder'Blanket"
System Checkoutand Characterization' *
"Neufronicsteste*
"ofhD'rie'Yntium'SxtfacSon'
Performance Tests
"LeadBianket"
System 'Checkout'and Characterization'
"tyeutronicsfests
''frSum'p'eVTTOation'BarTieraf'
"iifniiitiLead"chernis'iy'Con'lfoT
Orcline Tritium EJrtraction and Control
"Steerc'ofTosion
1IBB1X9SBSMBBIIBDBIIIOB!SiBBSSBBBSllBaiBBSBBBBBBSB
"System'ciieckout'and Characterization*'
"SrhLTiiefrii iurnEiSaction"'
"pertofmanoe'feste
System'checkout'andCharacterization '
"TMeufronicsTesfs
"Chemi'stry'Con'tro'andTri'tium Recovery
'Performance Tests'
1Z354 13 34.123*1234 aSH 1 23-4=1 23-:
4 = 5 1 6 7 : 8 : 9
FDR-ITER Construction Chapter Vl-Page 30

3.3 Maintenance
In the first two years, i.e., Hydrogen Plasma Phase, two-three months will beneeded for maintenance and small additional installation and commissioningevery half a year. After the H-phase, half a year is reserved for maintenance,installation and commissioning. After starting D/T operation, maintenance willbe remote. A few months regular maintenance will probably be needed everyyear.
3.4 Tritium supply
During the BPP, all tritium will be supplied by external sources. For example, apossible supply from Canada is sufficient to have 1.5 GW x 0.3 years operation oran average fluence of 0.3 MWa/m2 at the first wall. The typical tritium receipt,consumption, and site inventory during the BPP are given in Table 3.4-1.
TABLE 3.4-1Receipt, Consumed and Site Inventory
Year
1
2345678910
Receipt(kgT)
0.10.01.02.52.52.04.05.56.06.5
Consumed(kgT)
00
0.61.01.51.54.05.56.06.5
Site Inventory(kgT)
0.1
0.1
-0.5
~2*-3
-3.5-3.5-3.5
-3.5
-3.5
For commissioning of the tritium plant, several tens of grams of tritium will beneeded; it will be done in parallel with the hydrogen plasma operation in thefirst 2.5 years. A small amount of tritium will be burned during the deuteriumplasma operation in the third year.
The ITER divertor is designed to minimize the retention of tritium bydevelopping efficient methods of removing co-deposited layers. Depending onthe success of ITER design features and the R&D, the dominant part of the siteinventory might be inside the tokamak, especially in co-deposited layers after DToperation. Therefore, a relatively large receipt compared with the consumedtritium is planned even at the beginning of DT operation. In case of efficientcleaning methods available to remove co-deposited layers, the site inventory willremain smaller.
FDR-ITER Construction Chapter Vl-Page 31
The total tritium transportation per year will be about 2 kg/year in the beginningof the DT burn period and about 6 kg/year in the last year of the DT burn period.Assuming a 100 gr transport tritium container, there will be one shipment everyone-three weeks.
4.0 TRANSIENT PHASE FROM BPP TO EPP
For the EPP-Phase, the shielding blankets will be replaced by the breedingblankets because external tritium resources are not sufficient for a significantlyhigher fluence than that of the BPP. This process requires about two years. Atritium breeding ratio of about 0.8 would be sufficient to provide about1 MWa/m 2 during ten years operation assuming an external supply of 1.7 kgtritium per year. A 3 MWa/m2 during the same period requires a breading ratiomore than 0.95 with the same external supply.
5.0 ENHANCED PERFORMANCE PHASE (EPP)
A detailed operational plan for the EPP has not been developed because it willdepend on the plasma performance and operating experience obtained duringthe BPP. However, it is foreseen that there will be less emphasis on physicsstudies, and more emphasis on optimization of performances and reliableoperation to produce high neutron fluxes and fluences, using the mostpromising operational modes developed during the BPP.
FDR-ITER Construction Chapter Vl-Page 32

PART IIIITER DECOMMISSIONING PLAN
1.0 INTRODUCTION
A plan for the decommissioning of the ITER facility is presented. The impact ofessential drivers like availability of equipment, facilities, staff, etc. and basicconstraints like activation decay time are taken into account. The plan is brokendown in four phases:
• Phase 0 (de-activation): tritium and activated dust are removed fromthe machine;
• Phase 1 (in-vessel components dismantling): removal of all in-vesselcomponents, optional ex-vessel components removal;
• Phase 2 (activity decay): vacuum vessel activity decay prior to phase 3;
• Phase 3 (final dismantling and disposal): dismantling of the vacuumvessel, removal of the ex-vessel components (if not done in phase 1)removal from the site of any radioactive and toxic material.
The Plan does not include the dismantling of the buildings and of the non-activecomponents (except, when applicable, for the ex-vessel components) or thedisposal of wastes from decommissioning.
2.0 DESCRIPTION OF DECOMMISSIONING PLAN
2.1 General policy
The ITER facility decommissioning is examined from an engineering viewpointto provide the basic information required for the implementation of thedecommissioning programme.
The ITER project policy is to provide a feasible and flexible plan for thedecommissioning of the ITER machine and associated active components/plants.
Flexibility is provided by the use of separate phases. The phase duration andactivity can be modified (to a certain extent) to accommodate the ITER HostCountry organization requirements and constraints. The plan provides aframework to help the Host Country organization decide when and how toimplement the ITER facility decommissioning, depending on the financial,schedule, resources and/or any other priorities actually applicable at the time.
FDR-ITER Construction Chapter Vl-Page 33

As proposed, the plan:
Allows to maximize the use of the existing facilities and equipmentwhile taking advantage of the experience and knowledge of the sitepersonnel at the end of ITER operation;
Reduces capital investment required for new equipment and facilitiesprocurement required in the later stages of the decommissioning;
Allows to choose between two decommissioning strategies.
- Option 1 = use of existing equipment and teams for an earlydismantling of most ex-vessel components;
- Option 2 = postpone until after the decay phase the expenditurerequired for the dismantling of ex-vessel components.
2.2 Assumption
2.2.1 Responsibilities
It is assumed that the ITER organization will be responsible for handing over thefacility in a ready-for-decommissioning status. This means that the machine will,immediately after shutdown be de-activated and cleaned by removing tritiumfrom the in-vessel components and any removable dust. This activity, describedunder phase 0 of the decommissioning plan, will be carried out by the ITERorganization. At the end of phase 0, the ITER facility will be handed over to anorganization at Host Country who will be responsible for the subsequent phasesof decommissioning.
2.2.2 Status of the plant prior to decommissioning
It is assumed that the ITER facility decommissioning will start after completionof the following main phases:
• BPP phase: ten years, providing a 14 MeV neutron fluence of0.3MWa/m2;
• Transition phase: two years;
• EPP phase: ten years providing a 14 MeV neutron fluence of1 MWa/m2.
All ITER machine and associated supporting services and facilities are assumedto be operational prior to the decommissioning.
FDR-ITER Construction Chapter Vl-Page 34

The exact radiological conditions existing at the end of the operational phase cannot be firmly and completely predicted at this stage. However, the followingassumptions are made (at the start of decommissioning phase), immediately afterthe final shutdown:
(Sv
Rat
eD
ose
Con
tact
1 00E+03 .
1.00E+02 •
1.00E+01 •
1.00E+00 !
1.00E-01 -
1.00E-02 •
1.00E-03 -<
1.00E-04 -
1.00E-05 -
1.00E-06 -
1.00E-07 -
1.00E-08 -
1 .OOE-09 -
1.00E-10 -
100E-11 -
Vacuant of 0 At Rear ofurn Vessel Vacuum Ve;>sel Cryo
ont of the
stat
' <
i i
i
i•
• — - A
1 1
, i
* — *
*—*
^ ,
£ ^
11
11
11
• 1 I 1 1 1 1 1 • J
14d 30d 6mo 1y 2y 10y 20y 30y 50y 100y 1K
Time After Shutdown
•
:y
FIGURE 2-1Contact Dose After Final Shutdown of ITER
Figure 2-1 above gives an indication of the radiation contact dose decay forvacuum vessel and TF coil. The corresponding dose rate curves are expected tofollow, at a lower absolute value, the contact dose curves.
Beryllium
Present in bulk and dust form inside the vacuum vessel and blanket modules(approximately 3501).
FDR-ITER Construction Chapter Vl-Page 35

Tritium
Approximately 800 g in the tritium plant and fueling system. Tritium is alsopresent in the in-vessel components (~ 100 g in the beryllium layer of the firstwall, and ~ 1 kg in co-deposited layers), about 1 kg of tritium in the berylliumneutron multiplier inside the breeding modules). Small quantities of tritium arealso expected in the Neutral Beam Systems and Heat Transfer Systems.
2.3 Decommissioning scenario
The proposed decommissioning scenario is broken down as follows :
TABLE 2-1Summary of ITER Decommissioning Phases
Phase0
ActivityDe-activation
Description
a) removal of mobilizable tritium and dust from themachine using available techniques & equipment
b) classification & packaging of active, contaminated andtoxic material
Duration
- 3 months
THE ITER FACILITY IS HANDED OVER TO AN ORGANIZATION AT THE HOST COUNTRY1
2
3
In-vessel(and possiblyex-vesselcomponentsdismantling)
Radioactivitydecay
FinalDismantling&Disposal
a) removal of all the in-vessel components including thebackplate
b) OPTION 1: removal of ex-vessel components (if not done inphase 3)
c) classification & packaging of active, contaminated andtoxic materialThe vacuum vessel radioactivity is left to decay to a levelwhich allows extraction of vessel sectors into the tokamakbuilding (during phase 3) for size reduction & disposal.
Site activities are limited to safety monitoring andmaintenance of site equipmenta) removal of vacuum vessel sectors and their size reductionby remote/semi-remote operations
b) OPTION 2: removal of ex-vessel components (if not done inphase 1)
c) classification & packaging of active, contaminated andtoxic material
- 6.5 years
- 23 years
~ 6 years(9 years withOption 2)
FDR-ITER Construction Chapter Vl-Page 36

2.4 Phase-0 de-activation
Aim of phase 0 is to bring the machine into a safe state soon after end ofoperations, in preparation for the subsequent phase 1, utilizing the facilities andmanpower still available on site from the previous operation phase.
As mentioned before, this phase is responsibility of the ITER organization andwill terminate with the handing over of the facility to the Host Countryorganization in a ready-for-decommissioning status.
Phase 0 will mainly consist of the removal of all removable activity (tritium)from the in-vessel components and of any recoverable activated dust.
Tritium will first be removed from the surface of the in-vessel components byestablished techniques (such as baking, glow discharge and gas or steam flushing)and stored prior to its removal from site.
Beryllium dust and any recoverable activated dust will be also be removed to thegreatest possible extent from the vacuum vessel using the existing remotehandling equipment.
During phase 0, the Hot Cell is expected to function within its operational limits,the main activity being processing of the active dust removed from the vesseland servicing of the remote handling equipment as required.
2.5 Phase-1 in-vessel and ex-vessel components dismantling
2.5.1 Removal of in-vessel components
Aim of this phase is to remove of all in-vessel components, i.e., blanket, divertorand backplate. All equatorial and divertor port mounted systems are alsoremoved.
With the exception the backplate, all in-vessel components are dismantledaccording to established procedures which are part of the facility remotemaintenance programme. This means that only a minimum amount ofadditional equipment and procedures needs to be provided for phase 1. Thecutting and removal of the back plate, instead, requires new procedures andequipment Table 2-2 gives the basis for the estimated time to cut and remove thebackplate.
FDR-ITER Construction Chapter Vl-Page 37

TABLE 2-2Estimated Backplate Removal Time
ANumberof cut
sections
730
BEntry,exit,
unload,setup
time persection
h
4
CTotalentry,exit,
unload,setup
timemonths
~7.1
DEst.
cuttingtime
mm/mm
380
ECut linear length(x 2 for double
wall)m
ToroidalPoloidal
1,227 x2
= 2,454
574x2
= 1,148
FTotal
cutting timedays
ToroidalPoloidal
6.7 3.1
TotaltimeC + F
months
7.4
N.ofparallelworkingstations
Totaltime[m)
2
3.7
Conting-ency **
50%
months
1.9
Totalestimatedtime
months
5.6
Assume: 16 h/day, 6 days/week, 4.3 weeks/month
Following removal of the backplate, the vacuum vessel is cut from the insidealong the field joints and the corresponding interspace shielding blocks removed.Table 2-3 gives the basis for the estimated time to cut the inner wall of thevacuum vessel. The outer vessel skin is not cut to preserve structural integrityand guarantee containment during the next phase 2 and the early part of phase 3.The poloidal rail required to drive the cutting tools is left in place for future use.The vacuum vessel is eventually cleaned to remove any remaining dust prior tostart of phase 2. Shielding plugs are installed inside the equatorial and divertorports and the vessel sealed.
TABLE 2-3Vacuum Vessel Inner Wall Cutting
Operation Time Total
Assumptions: 16 h/day, 6 days/ week, 380 mm/min plasma gouging cutting speed, 4.3 weeks/month
20 poloidal cuts
Cutting of divertor, equatorial and vertical ports
Shield blocks removal
Entry/exit time, tools set up & remove, cleaningwork area
TOTALContingency 50 %
TOTAL
34.9 m inner wall perimeter x 20 sectorsx 2 cuts (inner splice) /380 mm/minplasma gouging = 3.8 days
18 m x 20 sectors x 2 cuts (inner splice)/380 mm/min plasma gouging = 1.9 day
35 blocks x 2 h/block x 20 = 87.5 days
(4 h insertion +1 h disengage + 2 hcleaning) x 20 sectors = 8.75 days
4d
2d88 d
9d103 days
51.5 days155 days6 months
2.5.2 Hot cell operation
During phase 1, Hot Cell operations are expected to run high due to the largeamount of components that needs to be processed prior to disposal. Thus, duringphase 1, the Hot Cell may act as the bottleneck in the components wasteprocessing and disposal path, creating hold-ups in the flow of components fromthe machine to the Hot Cell. To eliminate this bottleneck, some modification ofthe Hot Cell equipment will be required. However:
FDR-ITER Construction Chapter Vl-Page 38

(a) the Hot Cell does not need to be structurally changed specifically fordecommissioning;
(b) the Hot Cell needs to be provided, for increased radwaste processingefficiency, with the following extra equipment:
- Two or more vacuum furnaces for tritium removal fromcomponents;
- Two or more cutting stations for components size reduction;
- Equipment and tools for the removal of beryllium pellets andbreeder material from the breeding blanket modules;
- Facility for materials re-cycling;
- Additional radwaste storage.
2.5.3 Removal of ex-vessel components
With regard to the dismantling of ex-vessel components, two options areavailable:
Option 1 - Most Ex-vessel components are dismantled during phase 1
This option is desirable if:
• Overall decommissioning time is to be minimized;
• Early re-cycling or re-use of some machine components is required.
According to option 1, additional activities are performed inside the cryostat andpit in parallel with the in-vessel operations. To be performed hands on, suchactivities cannot start at least ~ 4 years from end of machine operations. Thisleaves approximately three years of parallel ex-vessel work during phase 1,sufficient for the execution of the following operations:
(a) opening of the cryostat top central bioshield/lid assembly (13.95 m diaopening) and of other cryostat access points as required;
(b) dismantling of : cryostat thermal shield (part), all coils feeders, centralsolenoid, PF1, PF2, upper crown, upper and lower correction coils;
(c) lowering onto cryostat floor of PF6, PF7, PF8, PF9;
(d) fitting of toroidal braces at the top of the TF coils (in place of the uppercrown). These braces stabilize the TF coils during removal and canalso be individually removed as the TF/VV sectors removalprogresses;
(e) positioning of a structure to support the lower crown;
FDR-ITER Construction Chapter Vl-Page 39

(f) disconnection of the lower crown from the TF coils;
(g) upper and lower intercoil structures disconnection;
(h) wedging of the W vertical ports against the TF coils;
(i) removal of the vessel tangential supports;
(j) release and removal of bolts and pins from the upper and lowerintercoil structures.
The above operations can be performed using the existing equipment plus,possibly, some additional new equipment and tools, as required. However, newstaff would have to be recruited because it is assumed that for the initial ~ 4 yearswaiting period no such staff would be required on site.
The above operations will not increase the duration of phase 1 because they areentirely in parallel with the in-vessel operations and they are not on the criticalpath.
Removed ex-vessel components which are not activated are transferred outsidethe tokamak building for storage or size reduction, prior to disposal, re-use ormaterial re-cycling.
Option 2 - Ex-vessel components are dismantled during phase 3
This option (which requires that the operations from a to 1 listed above areperformed in phase 3) is desirable if:
• Overall decommissioning time is not an issue;
• Early re-cycling or re-use of some machine components is not required;
• There is an advantage or a specific requirement by the Host Country;
• Organization to delay the decommissioning work and relatedexpenditure until later, i.e., in phase 3.
This option offers no time advantage. It actually lengthens phase 3 by about threeyears as the operations listed above must be performed ahead of those alreadyplanned in phase 3.
No additional requirement for the maintenance of equipment and plant duringthe activation decay period (phase 2) is necessary because these items are alreadyto be maintained for the final dismantling of the vacuum vessel.
At the end of phase 1, the cryostat openings are sealed ready for phase 2.
FDR-ITER Construction Chapter Vl-Page 40

2.5.4 Plant decommissioning
Other activities performed during phase 1 are:
• Tritium removal from the in-vessel components coolant. Throughoutphase 0 and 1 the in-vessel components coolant is processed to removethe suspended (un-dissolved in the coolant) and plated out (firmlybound to the pipe inner walls) activated corrosion products and thende-tritiated. Tritium removal from the coolant is expected to takeabout 4.3 years. This time is determined by the capacity of the water de-tritiation system and taking into account that it will also be required forsupport the Hot Cell processing activities;
• Removal of remaining active systems, such as part of the neutral beam(NB) injectors/diagnostics;
• The Hot Cell radwaste processing operations are completed and the HotCell is decontaminated and dismantled;
• At the end of Hot Cell operation, the tritium plant is not furtherrequired. All tritium in the plant is removed and the plant isdismantled.
At this stage, all tritium and beryllium can be removed from the ITER site.
2.5.5 Disposal
Disposal of radwaste will take place during and /or after the dismantlingoperations, depending on the policy adopted by the Host Country organization atthe time. Depending on the local requirements, disposal may be preceded bytemporary storage.
Further information and details of the ITER general decommissioning wastemanagement policy can be found in the NSSR-2 document.
2.6 Phase-2 radioactivity decay
For reference, it is assumed that phase 2 starts after that all phase 1 activities areterminated.
During phase 2, radioactivity inside the vacuum vessel will continue to decay.During this phase site activities are reduced to a bare minimum and consistingmainly in the following:
• Vacuum vessel radioactivity monitored to establish when finaldismantling (phase 3) can be initiated;
• Cranes periodically maintained in preparation for phase 3 activities;
FDR-FTER Construction Chapter Vl-Page 41

• Plant systems (like ventilation, etc.) required for phase 3 maintained asnecessary (possibly not running continuously, but inspectedperiodically).
2.7 Phase-3 final dismantling and disposal
2.7.1 Final dismantling - general description
For reference, the end of the W activity decay period is assumed to mark thebeginning of phase 3.
The main activity during phase 3 is the removal of the vacuum vessel/toroidalfield coil sectors and dismantling of the vacuum vessel.
Further, if Option 2 described at paragraph 2.5.3 is adopted, all ex-vesseldismantling operations are also performed in phase 3.
Phase 3 operations are carried out using, in part, components and plant whichhave been maintained or kept in an operational state during phase 2.Dismantling of the vacuum vessel is done using remote techniques.Dismantling of ex-vessel components is mostly done hands on. In principle,remote handling equipment used previously for the removal of the in-vesselcomponents could be used. However, it is expected that due to the intensive usein the previous years and age this equipment will require upgrading or, mostlikely, need to be entirely replaced. Other, general handling equipment (likecranes, etc.) would have been maintained during phase 2 and it will be used forboth the vessel and ex-vessel dismantling. Other activities during this phaseinclude completion of the NB dismantling and the removal of the VVPSS anddrain tanks.
Separation of the TF coil from the associated VV sectors is performed remotelyinside a cutting bay which has to be built and equipped with all the associatedsystems before the start of the cutting operations.
The vacuum vessel activity decay determines the length of phase 3. The twomajor sources which contribute to the dose are:
• The torus: after the removal of one or more TF/VV sector a largeopening is exposed;
• The TF/VV sectors: during their transfer from the machine to theshielded area of the assembly hall (cutting bay) where the TF coil isseparated from the vessel sector and the vessel sector reduced in sizefor disposal.
The requirement that the two sources above do not exceed the statutory doselimits at the site boundary (set for reference at 500 m) and for the site workers issatisfied after a 30 years decay period from the end of machine operation.
FDR-ITER Construction Chapter Vl-Page 42

After this period, the VV/TF sector can be extracted and transferred to theshielded cutting bay without time limiting restrictions. Further, the additionalsky shine radiation from the machine after removal of one or more TF/VVsectors is insignificant. The estimated W dose rate near the vacuum vesselinside the cutting bay is expected to be in the region of 2,500 /iSv/h. The doseoutside a 10 cm steel shield is about 23 fiSv/h (note: all values are verypreliminary and may change after a more accurate analysis).
2.7.2 Ex-vessel component removal
All ex-vessel dismantling operations are, with a few exceptions (as indicatedbelow) carried out hands on. In case of option 2, all operations described inActions 1.5.3 have to be carried out. In addition, the following operations arecarried out in phase 3:
• PHTS guard pipes and inner pipes are cut (semi-remote);
• Coils PF3 and PF4 are removed;
• Remaining section of the cryostat thermal shield are removed;
• Equatorial ports are cut and removed (semi-remote);
• Coil PF5 and side correction coils are removed;
• Top part (above the equatorial ports) of the cryostat cylinder is cut andremoved;
• Radial braces are fitted as necessary to secure the TF/VV assemblyagainst the inner bioshield wall during and after it is cut, prior tolifting. Lifting eyes are fitted, where necessary, to facilitate the interfacewith the lifting jigs;
• Intercoil structures are disconnected (in the region near the vacuumvessel field joint (where only the outer vessel skin is left) the dose rateis expected to be such to allow time limited man access for thedisconnection of the intermediate intercoil structures).
2.7.3 Machine sectors removal and vacuum vessel cutting
Vessel sectors separation is achieved by cutting the remaining outer skin andthermal shield at the outer field joint region using new remote handlingequipment inserted through the divertor ports (using cutting tools traveling onthe previously installed rails). The equatorial and vertical ports shielding platesare progressively removed, from outside, to allow port cutting. Also the divertorports are cut. Once the external vessel splice plate is cut through, access insidethe cryostat will be time limited or semi-remote. Table 2-4 gives the basis for thetime estimate for this operation.
FDR-ITER Construction Chapter Vl-Page 43

TABLE 2-4Vacuum Vessel Outer Wall Cutting
Operation Time Total
Assumptions: 16 h/day, 6 days/week, 380 mm/min plasma gouging cutting speed, 4.3 weeks/month
20 poloidal cuts
Cutting of divertor, equatorial and vertical ports
Tools set up & remove, cleaning area
TOTALContingency 50 %
TOTAL
36.6 m outer wall perimeter x 20 sectors/380 mm/min plasma gouging = 2 days
18 m x 20 sectors /380 mm/min plasmagouging = 1 day
(1 h insertion + 1 h disengage + 2 hcleaning) x 20 sectors
2d
Id
5d
8 days4 days12 days
After cutting, the vessel sector (together with the associated TF coil) is lifted outof the cryostat and transferred to a cutting bay in the adjacent assembly hall.
The bay consist of work area surrounded by shielding steel walls. The bay top canbe removed to allow use of a crane. The top is not a radiation shield but isneeded to prevent the escape of active dust during cutting. Near the cutting bay atemporary facility is set up to allow the transfer of the cut W sections intocontainers prior to shipment. The facility also provides space for the storage andmaintenance of the remote handling equipment required throughout the VVcutting period.
Within the cutting bay, the sector is positioned on a special purpose stand(possibly similar to or the same which was used for initial TF/vacuum vesselassembly-TF/W). Shielding walls are then erected around the T F / W assemblyand cutting is performed using remote/semi-remote techniques. The vacuumvessel is first cut into two halves which are separated from the TF Coil. Thevessel halves are then cut into pieces which are placed into containers fordisposal. Table 2-5 gives the basis for the time estimate for the cutting bayoperation.
FDR-ITER Construction Chapter Vl-Page 44

TABLE 2-5W Cutting - Catting Bay Operations
Operation
Assumptions: 16 h/day, 6 days/week, 380 mm/min
Rig up, transfer and drop TF/Wsector s in cuttingbayPoloidal cut to free TF coil
Removal of shield blocks
Rig up 1 /4 W sector, remove it & then remove TFcoil
Cut 1st 1/4 W sector in pieces
Bring 2nd 1 / 4 W sector back to cutting bayCut 2nd 1 /4W sector in pieces
Cut pieces removal time, clean up area after eachcut sector, put pieces into containerTOTAL
Contingency 20 %
TOTAL
Time Total
>lasma gouging cutting speed, 4.3 weeks/month
2 days/sector x 20 sectors = 40 days
36.6 m av.W perimeter x 2 walls x 3cuts (inner splice +1 outer cut) / 380mm/min x 20 sectors = 12 daysAssume 36 blocks x 2 h/block x 20 sectors= 90 days
2 day x 20 = 40 days
Assume 45 cut pieces approx. 1.5 msquare x 2 walls x 6,000 mm perimeter/380 mm/min x 20 sectors = 29.6 days
0.5 dayAssume 45 cut pieces (approx. 1.5 msquare)x 2 walls x 6,000 mm perimeter/380 mm/min x 20 sectors = 30 days
Est 2 h x 90 pieces x 20 sectors = 225days
40d
12 d
90d
40d
30d
0.5 d
30d
225d
467.5days
93.5 d561 days1.8 years
Once the vacuum vessel is completely removed from the pit, the remainingcomponents left inside the cryostat (gravity supports, tools and fixtures, etc.) areremoved and final cryostat dismantling can take place. The last componentsremoved from the pit are the drain tanks and the WPSS tank.
2.7.4 Disposal
Disposal of radwaste will take place during and /or after the dismantlingoperations, depending on the policy adopted by the Host Country at the time.Depending on the local requirements, disposal may be preceded by temporarystorage.
Further information and details of the ITER general decommissioning wastemanagement policy can be found in the NSSR-2 document.
FDR-ITER Construction Chapter Vl-Page 45

3.0 DECOMMISSIONING SCHEDULE
The estimated overall schedule for ITER decommissioning is shown inFigure 3-1.
ITBWECOfcMSSIONNG P U NIIIIIIIIHII11
19 20 21 22 23 24 25 26 27 28 29 30 31 32 33 34 35 36 37 38 39
'II MilRHASHJ)
TrWum remove* from th« VVDust removal
PHTSACP-g removalPHTScodentdHrlietlon
JPJUASEi.
Divert or or HHporta clearanceDivert or or cassettaa removal
^MW.Btf.g.grit.gl.wnii'C.ff.. -j s t m j ( s t ! 9 i m j s L _ _
Other equal «M poita removalHfsBadcplataremovalVacuum vessel Inner^lcuHIng
3aelo(VYopar*i||»NHrmoyHTPIenlifamanolmOveralHotCrtvaateprocaaainaDecoitimHaHirtu H HLWiyjteroHotCefdeconlamirrtion
gearlojiarayosMOpenCryoalat openingsRemovelopCryoalallhennelahleldC U i J C S C C J F ; "
op CCa *
Remove loRwrfovalovelrCCa
Place lovercrovnaupport structure _Dfacorm«tlovtfCfowi,uppwflov«f
asMtSiIFJXIgosaCiyoalBt openinga
ACWVW DECAY PERIOO
PHASE 21• llyen
NO SITE OPERATIONS
PHASE 3Open cryoslat.re-eafablah plantsystems __Setop~V¥cuttlno."ti«V~Cut itremovePHTS&guard pipes
Remove_PF3;4vii remove equet/vert/ifvertor
p_orta „R~em ova PFS
I23ye«re
FHTFIYYmftHweeaYV out e rv i l cutting
Tronsler lstTF(YYsedorlromP«toAaaanMyHal __YYaectorslnnVer<isizeralliictiiinlrT'Assembly HaWvorfcingstall on)
A»emMyHalC om PI ot e rem oval ol in CryostatcprnjponentaCtvnpiatB AsmanUrig olOrvoatat
"TSiTd«f«fiin •pprox.ilt yiiri"Remove"vvpsstarjc
HGURE 3-1Overall Schedule for ITER Decommissioning
FDR-UER Construction Chapter Vl-Page 46