Tea and Chicory Extract Characterization, Classification and ...
16
foods Article Tea and Chicory Extract Characterization, Classification and Authentication by Non-Targeted HPLC-UV-FLD Fingerprinting and Chemometrics Josep Pons 1 , Àlex Bedmar 1 , Nerea Núñez 1 , Javier Saurina 1,2 and Oscar Núñez 1,2, * Citation: Pons, J.; Bedmar, À.; Núñez, N.; Saurina, J.; Núñez, O. Tea and Chicory Extract Characterization, Classification and Authentication by Non-Targeted HPLC-UV-FLD Fingerprinting and Chemometrics. Foods 2021, 10, 2935. https://doi.org/ 10.3390/foods10122935 Academic Editor: Susana González Manzano Received: 3 November 2021 Accepted: 26 November 2021 Published: 28 November 2021 Publisher’s Note: MDPI stays neutral with regard to jurisdictional claims in published maps and institutional affil- iations. Copyright: © 2021 by the authors. Licensee MDPI, Basel, Switzerland. This article is an open access article distributed under the terms and conditions of the Creative Commons Attribution (CC BY) license (https:// creativecommons.org/licenses/by/ 4.0/). 1 Department of Chemical Engineering and Analytical Chemistry, University of Barcelona, Martí i Franquès 1-11, E08028 Barcelona, Spain; [email protected] (J.P.); [email protected] (À.B.); [email protected] (N.N.); [email protected] (J.S.) 2 Research Institute in Food Nutrition and Food Safety, University of Barcelona, Recinte Torribera, Av. Prat de la Riba 171, Edifici de Recerca (Gaudí), Santa Coloma de Gramenet, E08921 Barcelona, Spain * Correspondence: [email protected] Abstract: Tea is a widely consumed drink in the world which is susceptible to undergoing adulter- ations to reduce manufacturing costs and rise financial benefits. The development of simple analytical methodologies to assess tea authenticity, as well as to detect and quantify frauds, is an important matter considering the rise of adulteration issues in recent years. In the present study, untargeted HPLC-UV and HPLC-FLD fingerprinting methods were employed to characterize, classify, and authenticate tea extracts belonging to different varieties (red, green, black, oolong, and white teas) by partial least squares-discriminant analysis (PLS-DA), as well as to detect and quantify adulteration frauds when chicory was used as the adulterant by partial least squares (PLS) regression, to ensure the authenticity and integrity of foodstuffs. Overall, PLS-DA showed a good classification and grouping of the tea samples according to the tea variety and, except for some white tea extracts, perfectly discriminated from the chicory ones. One hundred percent classification rates for the PLS-DA cali- bration models were achieved, except for green and oolong tea when HPLC-FLD fingerprints were employed, which showed classification rates of 96.43% and 95.45%, respectively. Good predictions were also accomplished, also showing, in almost all the cases, a 100% classification rate for prediction, with the exception of white tea and oolong tea when HPLC-UV fingerprints were employed that exhibited a classification rate of 77.78% and 88.89%, respectively. Good PLS results for chicory adulteration detection and quantitation were also accomplished, with calibration, cross-validation, and external validation errors beneath 1.4%, 6.4%, and 3.7%, respectively. Acceptable prediction errors (below 21.7%) were also observed, except for white tea extracts that showed higher errors which were attributed to the low sample variability available. Keywords: tea; chicory; HPLC-UV; HPLC-FLD; fingerprinting; Chemometrics 1. Introduction Food adulteration and the absence of authenticity of beverages and foods have been increasing in the last years, being considered globally as one of the main food safety problems for consumers. In fact, food safety may be endangered by the use of fraudulent actions pursuing economic benefits, but that can represent important health problems for consumers when illegal (toxic) substances are employed or because of the presence of non-declared allergens. Food handling and adulteration practices are increasing because it is, in fact, easier to carry out fraud without being detected, and, today, it is one of the most important risks in food production which is gaining much attention from the industry and the governments, as well as from the standards-setting organizations [1]. In general, food adulteration is usually carried out to increase volume, mask the presence of inferior-quality components, or replace the authentic substances for the seller’s economic Foods 2021, 10, 2935. https://doi.org/10.3390/foods10122935 https://www.mdpi.com/journal/foods
-
Upload
khangminh22 -
Category
Documents
-
view
0 -
download
0
Transcript of Tea and Chicory Extract Characterization, Classification and ...

foods
Article
Tea and Chicory Extract Characterization, Classification andAuthentication by Non-Targeted HPLC-UV-FLD Fingerprintingand Chemometrics
Josep Pons 1, Àlex Bedmar 1, Nerea Núñez 1, Javier Saurina 1,2 and Oscar Núñez 1,2,*
�����������������
Citation: Pons, J.; Bedmar, À.;
Núñez, N.; Saurina, J.; Núñez, O. Tea
and Chicory Extract Characterization,
Classification and Authentication by
Non-Targeted HPLC-UV-FLD
Fingerprinting and Chemometrics.
Foods 2021, 10, 2935. https://doi.org/
10.3390/foods10122935
Academic Editor: Susana González
Manzano
Received: 3 November 2021
Accepted: 26 November 2021
Published: 28 November 2021
Publisher’s Note: MDPI stays neutral
with regard to jurisdictional claims in
published maps and institutional affil-
iations.
Copyright: © 2021 by the authors.
Licensee MDPI, Basel, Switzerland.
This article is an open access article
distributed under the terms and
conditions of the Creative Commons
Attribution (CC BY) license (https://
creativecommons.org/licenses/by/
4.0/).
1 Department of Chemical Engineering and Analytical Chemistry, University of Barcelona,Martí i Franquès 1-11, E08028 Barcelona, Spain; [email protected] (J.P.);[email protected] (À.B.); [email protected] (N.N.); [email protected] (J.S.)
2 Research Institute in Food Nutrition and Food Safety, University of Barcelona, Recinte Torribera,Av. Prat de la Riba 171, Edifici de Recerca (Gaudí), Santa Coloma de Gramenet, E08921 Barcelona, Spain
* Correspondence: [email protected]
Abstract: Tea is a widely consumed drink in the world which is susceptible to undergoing adulter-ations to reduce manufacturing costs and rise financial benefits. The development of simple analyticalmethodologies to assess tea authenticity, as well as to detect and quantify frauds, is an importantmatter considering the rise of adulteration issues in recent years. In the present study, untargetedHPLC-UV and HPLC-FLD fingerprinting methods were employed to characterize, classify, andauthenticate tea extracts belonging to different varieties (red, green, black, oolong, and white teas) bypartial least squares-discriminant analysis (PLS-DA), as well as to detect and quantify adulterationfrauds when chicory was used as the adulterant by partial least squares (PLS) regression, to ensure theauthenticity and integrity of foodstuffs. Overall, PLS-DA showed a good classification and groupingof the tea samples according to the tea variety and, except for some white tea extracts, perfectlydiscriminated from the chicory ones. One hundred percent classification rates for the PLS-DA cali-bration models were achieved, except for green and oolong tea when HPLC-FLD fingerprints wereemployed, which showed classification rates of 96.43% and 95.45%, respectively. Good predictionswere also accomplished, also showing, in almost all the cases, a 100% classification rate for prediction,with the exception of white tea and oolong tea when HPLC-UV fingerprints were employed thatexhibited a classification rate of 77.78% and 88.89%, respectively. Good PLS results for chicoryadulteration detection and quantitation were also accomplished, with calibration, cross-validation,and external validation errors beneath 1.4%, 6.4%, and 3.7%, respectively. Acceptable predictionerrors (below 21.7%) were also observed, except for white tea extracts that showed higher errorswhich were attributed to the low sample variability available.
Keywords: tea; chicory; HPLC-UV; HPLC-FLD; fingerprinting; Chemometrics
1. Introduction
Food adulteration and the absence of authenticity of beverages and foods have beenincreasing in the last years, being considered globally as one of the main food safetyproblems for consumers. In fact, food safety may be endangered by the use of fraudulentactions pursuing economic benefits, but that can represent important health problems forconsumers when illegal (toxic) substances are employed or because of the presence ofnon-declared allergens. Food handling and adulteration practices are increasing becauseit is, in fact, easier to carry out fraud without being detected, and, today, it is one ofthe most important risks in food production which is gaining much attention from theindustry and the governments, as well as from the standards-setting organizations [1]. Ingeneral, food adulteration is usually carried out to increase volume, mask the presence ofinferior-quality components, or replace the authentic substances for the seller’s economic
Foods 2021, 10, 2935. https://doi.org/10.3390/foods10122935 https://www.mdpi.com/journal/foods

Foods 2021, 10, 2935 2 of 16
gain. The deliberate adulteration of foods and its misrepresentation to deceive the finalconsumers is illegal worldwide, and, in some cases, food fraud threats may be even riskierthan traditional food safety issues since the contaminants are unconventional [2].
Tea is an aromatic drink made by pouring hot (or boiling) water over cured or freshleaves of Camellia sinensis, an evergreen shrub original from China and East Asia. Fromthere, it expanded to Europe by the (British) East India Company (founded in 1600) andthe United (Dutch) East India Company (founded in 1602) [3]. There are mainly five typesof tea, with green and black teas being the most traditional ones, representing around 22%and 78% of the production in the world, respectively [4]. Green tea is produced from driedharvested tea leaves followed by fermentation, while black tea is a fully oxidized product.Red tea (Pu-erh teas) is made with a specific variant of the tea plant (Camellia sinensis var.assamica) grown in the region of Yunnan (China), where dried tea leaves are subjected tocomposting under humid conditions favoring changes in the chemical composition causedby bacteria [5]. Oolong tea is also a fermented tea similar to the black one, but fermentationis controlled to limit oxidation between 10 to 70% [5]. White tea involves buds and youngertea leaves. It can also have been shaded from sunlight through its short growth to reducethe production of chlorophyll. It is dried soon after harvest to prevent fermentation, whichneeds to be carefully controlled [5].
The drinking of tea is also related to its well-recognized health properties, beingproposed for the mitigation of minor diseases, such as headaches and pains, since theirdiscovery back in China. In addition, tea extracts contain a wide variety of bioactive sub-stances, among them polyphenols, being responsible for their antioxidant properties [5–7].Evidence of anti-Alzheimer’s effect and prevention of obesity have also been described intea extracts [8,9].
Together with coffee, tea is today one of the most worldwide consumed drinks, and itcan be found among the food products that present more fraudulent practices. For example,tea is vulnerable to replacement with lower quality components, addition of undeclaredflavors or colors, and mislabeling of geographical production origin and manufactureprocedures. Tea shows a great variation in qualities when taken from different producersas they are grown under different environmental conditions of soil, rainfall, altitude, andmethods of processing—especially fermentation—, but the extensive factor is the presenceor absence of adulterants [10]. All these factors will influence the standard parameterswhich bring a variation in the market value of tea products. For instance, tea has beenadulterated with different types of azo dyes, such as sunset yellow, tartrazine, and indigocarmine. In addition, starch, sand, China clay, French chalk, chicory, lather flakes, caffeine,and used tea leaves have also been employed as adulterants in tea products to reducemanufacturing costs and deceive the consumers [10,11].
Most of the strategies proposed for the detection of frauds are targeted methodologies,focusing on the determination and quantification of a specific analyte or group of analytes.Their concentrations or related signals are employed as food markers to assess their au-thenticity. For example, Ma et al. [12] studied the geographical production origin of severalgreen teas from China by employing linear discriminant analysis based on the compositionof 37 metal elements—including rare earth elements—quantified by inductively coupledplasma-mass spectrometry (ICP-MS). The determination of specific stable isotopes andelemental composition has also been described to assess the authenticity of teas [13–18].Volatile profiling carried out by gas chromatography (GC) was also reported for the au-thentication of commercial powdered tea extracts [19]. In another application, Fang et al.evaluated the traceability of the production origin of Keemun black teas by employing itsnon-volatile composition, by means of the target analysis of phenolic compounds, caffeine,theanine, and theaflavins [20]. The use of commercially available standards (if quantitationis required) and the requirement of compound identification when profiling approachesare employed are among the main handicaps of targeted strategies, especially when con-sidering the complexity of some food samples. In contrast, non-targeted methodologies(fingerprinting strategies) focus on detecting instrumental responses without any required

Foods 2021, 10, 2935 3 of 16
knowledge about the food components [21]. With the idea of detecting as many compo-nents of the analyzed food matrices as possible, simple and unspecific sample treatmentsto avoid losing information are frequently employed [22], making non-targeted fingerprint-ing strategies the ideal methodologies for the authentication of tea products as they canbe analyzed directly after pouring the tea with hot water. Near-infrared (NIR) [23–28],Fourier transform infrared (FTIR) [29], and ultraviolet-visible (UV-vis) [6,29,30] spectro-scopies have been widely applied to generate fingerprints to address tea authenticationissues. High-performance liquid chromatography with UV-detection (HPLC-UV) finger-prints have also been described for the authentication and discrimination of green teasamples [29], to authenticate Laoshan green tea plucking seasons [31], and to assess teageographical origin [32], among other applications. Liquid chromatography coupled withmass spectrometry (LC-MS), particularly with high-resolution mass spectrometry (LC-HRMS), is also gaining popularity as a non-targeted fingerprinting strategy to addressfood authenticity, and some applications dealing with tea authentication issues have beenreported. As an example, Navratilova et al. assessed the authentication of the geographicorigin of Chinese, Japanese, and South Korean green teas by ultra-high performance liq-uid chromatography-high-resolution mass spectrometry (UHPLC-HRMS) metabolomicfingerprinting using a Synapt G2 MS system, which combined ion-mobility with HRMSin a quadrupole-time-of-flight (qTOF) analyzer [33]. The huge amount of chemical dataprovided by these techniques, especially when using non-targeted fingerprinting, willrequire the use of chemometric techniques to find relationships among chemical variablesand sample features, as well as to assess the significance of the descriptors [34].
This research aims to study the application of untargeted high-performance liquidchromatography with ultraviolet (HPLC-UV) and fluorescence (HPLC-FLD) detection tocharacterize, classify, and authenticate tea samples based on their variety (black, green, red,oolong, and white teas). Under this fingerprinting strategy, conclusions can be observedwithout the requirement of identifying or quantifying the compounds responsible for thetea discrimination. With this objective, the HPLC-UV and HPLC-FLD chromatographicfingerprints obtained will be used as tea chemical descriptors. The resulting data will besubmitted to chemometric multivariate methods, such as exploratory principal componentanalysis (PCA) and supervised partial least squares-discriminant analysis (PLS-DA), tostudy the distribution and classification of tea samples. Moreover, the feasibility of thedeveloped chromatographic fingerprinting method for the detection of frauds and thequantitation of adulterated tea extracts with chicory, a plant root (Chicorium intybus var.sativum) which is employed as a non-declared tea ingredient on many occasions (i.e., anadulterant), will also be evaluated. Partial least square (PLS) regression will be employedto quantify chicory percentages in adulterated tea extracts.
2. Materials and Methods2.1. Reagents and Chemicals
Methanol (Chromosolv™ for HPLC, ≥99.9%) was obtained from PanReac AppliChem(Barcelona, Spain) and formic acid (≥98%) from Sigma-Aldrich (St. Louis, MO, USA).Water was purified with an Elix 3 coupled to a Milli-Q system from Millipore Corporation(Millipore, Bedford, MA, USA) and was filtered through a 0.22 µm nylon membraneintegrated into the Milli-Q system. A commercially available mineral water, purchasedfrom Eroski (Barcelona, Spain) was employed for tea and chicory extraction to preventany influence from the water in the obtained results. The chemical composition of thiswater was as follows: dry residue (at 180 ◦C): 403 mg/L; bicarbonate: 326 mg/L; chloride:44 mg/L; calcium: 85 mg/L: magnesium: 28 mg/L; sodium: 18 mg/L; and silica: 8 mg/L.
2.2. Instrumentation
Non-targeted HPLC-UV and HPLC-FLD chromatographic fingerprints were obtainedwith an Agilent 1100 Series HPLC instrument (Waldbronn, Germany) equipped withan automatic injector, a binary pump, and both diode-array and fluorescence detectors

Foods 2021, 10, 2935 4 of 16
(connected in series). Agilent Chemstation software was employed for instrument controland data processing. Reversed-phase separation using a Kinetex® C18 (100 × 4.6 mmi.d., 2.6 µm partially porous particle size) column (Phenomenex, Torrance, CA, USA) wasemployed. Separation was carried out by gradient elution employing as mobile phasecomponents a 0.1% formic acid aqueous solution and methanol. The gradient elutionconditions are shown in Table 1. An injection volume of 5 µL was used. Acquisition wascarried out at 280 nm for UV detection and at 280 nm (excitation) and 350 nm (emission)for FLD detection.
Table 1. Gradient elution conditions.
Time (min) Elution % Methanol Flow Rate (µL/min)
0–15 Linear gradient 20–75% 40015–17 Linear gradient 75–95% 40017–19 Isocratic 95% 400
19–19.2 Linear gradient 95–20% 40019.2–25 Isocratic 20% 400
2.3. Samples and Sample Extraction Procedure
One hundred seven tea and chicory samples of different typologies (Table 2), andobtained from supermarkets in Barcelona (Spain) were used. Some sample characteristics, asthe commercial name and production region, are listed in Table S1 (Supplementary Material).
Table 2. Summary of the studied samples.
Sample Class Sample Type Number of Samples
Tea
Black tea 35Green tea 20
Oolong tea 10Red tea 12
White tea 10
Chicory Chicory 20
The sample treatment consisted of extracting 0.5 g of tea/chicory sample with 25 mLof hot water in a 50 mL PTFE centrifuge tube (Serviquimia, Barcelona, Spain) by vigorouslyshaking for 1 min employing a Vortex (Stuart, Stone, United Kingdom). The obtainedextracts were then centrifuged for 5 min at 3500 rpm (Rotanta 460 RS centrifuge, Hettich,Tuttlingen, Germany). The final aqueous extracts were filtered using 0.45 µm nylonfilters (by discarding the first mL) and kept at 4 ◦C in amber glass injection vials untiltheir analysis.
Fifty microliters of each aqueous sample extract were mixed to prepare a qualitycontrol (QC) solution that was employed to study the repeatability of the proposed methodsand the robustness of chemometric results.
2.4. Data Analysis
The sample aqueous extracts were randomly analyzed. After each ten sample extractsinjected, an instrumental blank (mineral water) and a QC solution were analyzed. Datamatrices were built with the obtained HPLC-UV or with the HPLC-FLD fingerprints ofthe analyzed teas and were subjected to principal component analysis (PCA), partial leastsquares-discriminant analysis (PLS-DA), and partial least squares (PLS) regression usingSOLO 8.6 chemometric software from Eigenvector Research (Manson, WA, USA). Thetheoretical background of these chemometric methods are given elsewhere [35].
PCA was used as an exploratory methodology to study the distribution of samplesand the QCs behavior. PLS-DA was used as a supervised classificatory method and PLS toquantify the chicory percentages added to the tea samples. In all cases, the X-data matrix

Foods 2021, 10, 2935 5 of 16
was based on the registered HPLC-UV (absorbance versus retention time) or the registeredHPLC-FLD (fluorescence intensity versus retention time) fingerprints. In contrast, Y-datamatrices established each sample class and the adulterant percentage employed for PLS-DAand PLS, respectively. All the registered HPLC fingerprints were pretreated by smoothing,baseline-correcting, and aligning to improve the quality of the obtained chemometric data.Finally, data was autoscaled to achieve the same weight to each variable by minimizingdifferences in the magnitude and amplitude of their scales. PLS-DA model validation wascarried out by using 70% of the samples (randomly selected) as the calibration set and theremaining 30% of the samples as the prediction set. The number of latent variables (LVs) inPLS-DA was obtained as the first important minimum point of the cross-validation (CV)error by a Venetian blind method. In the case of the PLS studies, adulteration cases of eachtea sample class with chicory were evaluated, and the models were built and validated byusing calibration and validation sets as defined in Table 3.
Table 3. Samples employed for calibration and validation in the adulteration studies by PLS (n = 5for each sample).
Tea (%) Chicory (% Adulterant)
Calibration set
100 080 2060 4040 6020 800 100
Validation set
85 1575 2550 5025 7515 85
The external prediction was also performed by means of adulterated samples usingdifferent tea and chicory samples than the ones used to made the PLS models at 15, 50, and85% of chicory as an adulterant.
3. Results and Discussion3.1. HPLC-UV and HPLC-FLD Fingerprints
Figure 1a,b show, respectively, the obtained HPLC-UV and HPLC-FLD fingerprintsfor a selected sample of each analyzed class (black, green, oolong, red, and white teas,and chicory).
Without taking into consideration the identity of the extracted and detected com-pounds, noteworthy differences can be detected among the chromatograms concerningthe amount of peaks detected, their distribution, and the peak signals. In the case ofHPLC-UV (Figure 1a.1–a.6), chicory samples provide a richer fingerprint in terms of de-tected peak signals in comparison to the ones obtained for tea samples, although peaksignal intensities are 100-fold lower. Tea extracts tend to provide a similar HPLC-UVfingerprint. For example, an intense peak signal is observed at a retention time close to11 min independently of the tea variety. In addition, more peak signals were observed forblack and green tea samples in comparison to the other three tea varieties. Differences inpeak signal intensities are also observed among the different tea classes, being white teathe one providing the most intense profiles. Similar behavior can also be observed whenstudying the obtained HPLC-FLD fingerprints (Figure 1b.1–b.6), although it seems thatthe chromatographic fingerprints are more different among the analyzed tea samples incomparison to the ones obtained with HPLC-UV. Again, the chicory sample showed themost different HPLC-FLD fingerprint. In this case, black and green teas are providing moreintense signals in comparison with the other tea extracts, while, in contrast, red teas tend

Foods 2021, 10, 2935 6 of 16
to provide richer fingerprints in terms of peaks detected, a comparable behavior with thatobserved for chicory samples.
Foods 2021, 10, x FOR PEER REVIEW 7 of 17
Figure 1. Non-targeted HPLC-UV (a) (at 280 nm) and HPLC-FLD (b) (at 280 nm (excitation) and 350 nm (emission)) fin-
gerprints observed for a selected sample of each analyzed class: black (a.1,b.1), green (a.2,b.2), white (a.3,b.3), red (a.4,b.4),
and oolong (a.5,b.5) teas, and chicory (a.6,b.6).
The noteworthy differences detected by HPLC-UV and HPLC-FLD fingerprinting,
and the fact that these observed characteristics were reproducible within the samples of
each sample class (each specific tea and the chicory samples), suggested that the resulting
data could be used as chemical descriptors to classify the studied samples by means of
multivariate chemometric procedures.
Figure 1. Non-targeted HPLC-UV (a) (at 280 nm) and HPLC-FLD (b) (at 280 nm (excitation) and 350 nm (emission))fingerprints observed for a selected sample of each analyzed class: black (a.1,b.1), green (a.2,b.2), white (a.3,b.3), red(a.4,b.4), and oolong (a.5,b.5) teas, and chicory (a.6,b.6).
The noteworthy differences detected by HPLC-UV and HPLC-FLD fingerprinting,and the fact that these observed characteristics were reproducible within the samples ofeach sample class (each specific tea and the chicory samples), suggested that the resulting

Foods 2021, 10, 2935 7 of 16
data could be used as chemical descriptors to classify the studied samples by means ofmultivariate chemometric procedures.
3.2. Sample Exploration by PCA
PCA was employed as an exploratory procedure to evaluate sample distributionaccording to the obtained fingerprinting features but mainly to assess the data repeatabilityand the robustness of the obtained chemometric results from the study of QCs. So, PCAscore plots of PC1 versus PC2 using HPLC-UV fingerprints and HPLC-FLD fingerprintsare shown, respectively, in Figure 2a,b.
Foods 2021, 10, x FOR PEER REVIEW 8 of 17
3.2. Sample Exploration by PCA
PCA was employed as an exploratory procedure to evaluate sample distribution ac-
cording to the obtained fingerprinting features but mainly to assess the data repeatability
and the robustness of the obtained chemometric results from the study of QCs. So, PCA
score plots of PC1 versus PC2 using HPLC-UV fingerprints and HPLC-FLD fingerprints
are shown, respectively, in Figure 2a,b.
Figure 2. Principal component analysis (PCA) score plots of PC1 versus PC2 of the analyzed tea and chicory samples, and
QCs. (a) Raw HPLC-UV fingerprints; (b) raw HPLC-FLD fingerprints; (c) HPLC-UV fingerprints after correction with
QCs; (d) HPLC-FLD fingerprints corrected with QCs.
Working with the obtained raw fingerprinting data, it can be observed that QCs do
not appear in a compact group, showing a dependence with the injection order in the
employed analytical sequence, and this behavior is observed with both UV (Figure 2a)
and FLD (Figure 2b) detection. This poor reproducibility may be related to changes in the
lamps’ intensity during the sequence. Consequently, the distribution of the analyzed sam-
ples within the PCA score plot should be affected by the same problem; thus, a corrective
mechanism should be applied to diminish the influence of the variations in sensitivity
through the employed analytical series. This correction will rely on the QC injection per-
formances. With this aim, the obtained HPLC-UV and HPLC-FLD fingerprints were cor-
rected by dividing their signals with those obtained in the closest QC within the analysis
sequence (each QC fingerprint was divided by itself). After this QC correction, all the QCs
will be depicted in the same plot point (all the variables within their fingerprints will equal
1), whereas the variation in signal sensitivities caused by lamp fluctuations within the
analysis sequence will be corrected. The plots of scores of PC1 versus PC2 from corrected
data are depicted in Figure 2c,d, respectively. With this correction performed, samples
tend to be better grouped based on their sample class, although this grouping was better
achieved with HPLC-FLD fingerprints (Figure 2d). In any case, chicory samples are
grouped at the left part of the plots, showing negative PC1 values, while tea samples are
mainly located to the right side of the score plots, distinguished by increased values of
PC1. Samples tend to be grouped in more compact groups with HPLC-FLD fingerprints
-100 -80 -60 -40 -20 0 20 40 60 80 100-100
-50
0
50
Scores on PC 1 (54.33%)
Sco
res
on
PC
2 (
14
.63
%)
-80 -60 -40 -20 0 20 40 60 80 100 120
-40
-20
0
20
40
Scores on PC 1 (44.00%)
Sco
res
on
PC
2 (
10
.87
%)
Black tea
Chicory
Green tea
Oolong tea
Red tea
White tea
QC
-100 -80 -60 -40 -20 0 20 40 60 80 100 120-60
-40
-20
0
20
40
60
Scores on PC 1 (51.81%)
Sco
res
on
PC
2 (
11
.55
%)
-80 -60 -40 -20 0 20 40 60 80 100 120-40
-20
0
20
40
Scores on PC 1 (43.38%)
Sco
res
on
PC
2 (
6.8
6%
)
(a) (b)
(c) (d)
Figure 2. Principal component analysis (PCA) score plots of PC1 versus PC2 of the analyzed tea and chicory samples, andQCs. (a) Raw HPLC-UV fingerprints; (b) raw HPLC-FLD fingerprints; (c) HPLC-UV fingerprints after correction with QCs;(d) HPLC-FLD fingerprints corrected with QCs.
Working with the obtained raw fingerprinting data, it can be observed that QCs donot appear in a compact group, showing a dependence with the injection order in theemployed analytical sequence, and this behavior is observed with both UV (Figure 2a) andFLD (Figure 2b) detection. This poor reproducibility may be related to changes in the lamps’intensity during the sequence. Consequently, the distribution of the analyzed sampleswithin the PCA score plot should be affected by the same problem; thus, a correctivemechanism should be applied to diminish the influence of the variations in sensitivitythrough the employed analytical series. This correction will rely on the QC injectionperformances. With this aim, the obtained HPLC-UV and HPLC-FLD fingerprints werecorrected by dividing their signals with those obtained in the closest QC within the analysissequence (each QC fingerprint was divided by itself). After this QC correction, all theQCs will be depicted in the same plot point (all the variables within their fingerprintswill equal 1), whereas the variation in signal sensitivities caused by lamp fluctuationswithin the analysis sequence will be corrected. The plots of scores of PC1 versus PC2 fromcorrected data are depicted in Figure 2c,d, respectively. With this correction performed,samples tend to be better grouped based on their sample class, although this grouping wasbetter achieved with HPLC-FLD fingerprints (Figure 2d). In any case, chicory samples aregrouped at the left part of the plots, showing negative PC1 values, while tea samples are
Foods 2021, 10, 2935 8 of 16
mainly located to the right side of the score plots, distinguished by increased values ofPC1. Samples tend to be grouped in more compact groups with HPLC-FLD fingerprints(Figure 2d) in comparison to HPLC-UV counterparts (Figure 2c), and discrimination amongthe different tea types was also observed through PC2. For example, red and oolong teasexhibit positive PC2 values, while green and white teas tend to be distributed at the bottomarea of the plot, with negative PC2 values. However, it should be mentioned that PCAis not a classificatory method, so, corrected HPLC-UV and HPLD-FLD fingerprints werefurther submitted to a PLS-DA classificatory method.
3.3. Sample Classification by Partial Least Squares-Discriminant Analysis
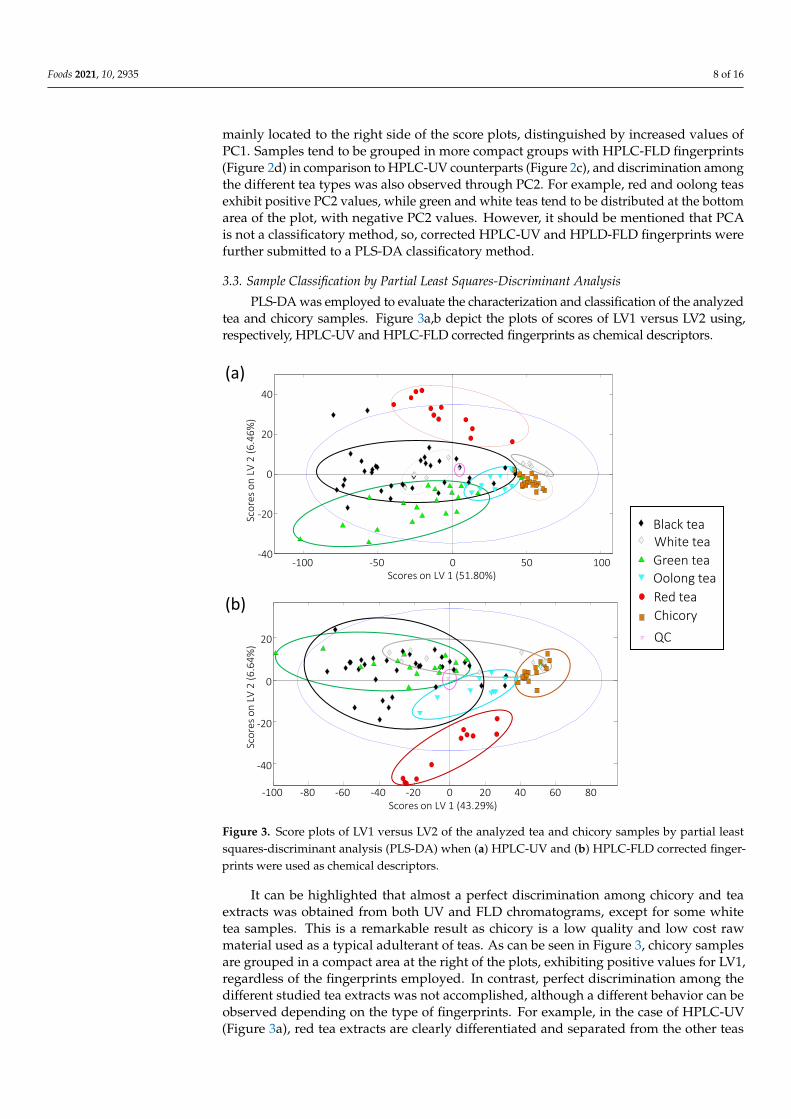
PLS-DA was employed to evaluate the characterization and classification of the analyzedtea and chicory samples. Figure 3a,b depict the plots of scores of LV1 versus LV2 using,respectively, HPLC-UV and HPLC-FLD corrected fingerprints as chemical descriptors.
Foods 2021, 10, x FOR PEER REVIEW 9 of 17
(Figure 2d) in comparison to HPLC-UV counterparts (Figure 2c), and discrimination
among the different tea types was also observed through PC2. For example, red and oo-
long teas exhibit positive PC2 values, while green and white teas tend to be distributed at
the bottom area of the plot, with negative PC2 values. However, it should be mentioned
that PCA is not a classificatory method, so, corrected HPLC-UV and HPLD-FLD finger-
prints were further submitted to a PLS-DA classificatory method.
3.3. Sample Classification by Partial Least Squares-Discriminant Analysis
PLS-DA was employed to evaluate the characterization and classification of the ana-
lyzed tea and chicory samples. Figure 3a,b depict the plots of scores of LV1 versus LV2
using, respectively, HPLC-UV and HPLC-FLD corrected fingerprints as chemical de-
scriptors.
Figure 3. Score plots of LV1 versus LV2 of the analyzed tea and chicory samples by partial least
squares-discriminant analysis (PLS-DA) when (a) HPLC-UV and (b) HPLC-FLD corrected finger-
prints were used as chemical descriptors.
It can be highlighted that almost a perfect discrimination among chicory and tea ex-
tracts was obtained from both UV and FLD chromatograms, except for some white tea
samples. This is a remarkable result as chicory is a low quality and low cost raw material
used as a typical adulterant of teas. As can be seen in Figure 3, chicory samples are
grouped in a compact area at the right of the plots, exhibiting positive values for LV1,
regardless of the fingerprints employed. In contrast, perfect discrimination among the dif-
ferent studied tea extracts was not accomplished, although a different behavior can be
observed depending on the type of fingerprints. For example, in the case of HPLC-UV
(Figure 3a), red tea extracts are clearly differentiated and separated from the other teas
-100 -50 0 50 100-40
-20
0
20
40
Scores on LV 1 (51.80%)
Sco
res
on
LV 2
(6
.46
%)
-100 -80 -60 -40 -20 0 20 40 60 80
-40
-20
0
20
Scores on LV 1 (43.29%)
Sco
res
on
LV 2
(6
.64
%)
(a)
(b)
Black tea
Chicory
Green tea
Oolong tea
Red tea
White tea
QC
Figure 3. Score plots of LV1 versus LV2 of the analyzed tea and chicory samples by partial leastsquares-discriminant analysis (PLS-DA) when (a) HPLC-UV and (b) HPLC-FLD corrected finger-prints were used as chemical descriptors.
It can be highlighted that almost a perfect discrimination among chicory and teaextracts was obtained from both UV and FLD chromatograms, except for some whitetea samples. This is a remarkable result as chicory is a low quality and low cost rawmaterial used as a typical adulterant of teas. As can be seen in Figure 3, chicory samplesare grouped in a compact area at the right of the plots, exhibiting positive values for LV1,regardless of the fingerprints employed. In contrast, perfect discrimination among thedifferent studied tea extracts was not accomplished, although a different behavior can beobserved depending on the type of fingerprints. For example, in the case of HPLC-UV(Figure 3a), red tea extracts are clearly differentiated and separated from the other teas

Foods 2021, 10, 2935 9 of 16
based on LV2 (exhibiting positive values), while green tea samples are spread at the bottomof the PLS-DA plot, showing negative LV2 values. The other three types of tea understudy are widely distributed through the LV1 axis. Two groups are observed for whitesamples, one of them located quite close to the chicory samples with some superposition.The clear discrimination of the white samples in these two groups can be attributed tothe fact that all the samples came from different lots of two different white tea types, oneproduced in Fujian (China) and the other of a premium artisanal white tea production,also from China. Oolong tea samples were compactly grouped, although also close to thechicory samples. With HPLC-FLD fingerprints (Figure 3b), again, red tea samples wereperfectly discriminated from the other tea groups, depicted at the bottom of the plot ofscores. Similarly, oolong tea samples were grouped close to the chicory samples, althoughin a less compacted group in comparison with HPLC-UV fingerprints, and two groupswere also found for white tea samples, one of them mixed with the chicory ones. Nodiscrimination was observed between black and green tea samples, that appeared mixed inthe left zone of the plot of scores.
Even though full discrimination among the analyzed tea samples was not accom-plished, most of the tea extracts, except for some white tea samples, are differentiatedfrom the chicory ones, as previously commented. This finding allows for proposing theHPLC-UV and HPLC-FLD fingerprints as good chemical descriptors to guarantee teaauthentication when frauds based on chicory adulterations are produced. To ensure theapplication of the developed methodology for fraud detection, the classification rate oftea samples in front of chicory ones was studied from paired PLS-DA models (each teavariety versus chicory). For that purpose, paired PLS-DA models were built by using 70%of the samples (randomly selected) for each pair tea-chicory as the calibration set, and theremaining 30% of the samples were considered as “unknown samples” for validation andprediction purposes. Figure 4 depicts the validation results of the paired PLS-DA modelswhen HPLC-UV and HPLC-FLD corrected chromatographic fingerprints were used aschemical descriptors. The obtained PLS model and prediction classification rates are alsosummarized in Table S2 (Supplementary Material).
Very acceptable results were achieved. One hundred percent classification rates forthe calibration models were obtained in all the cases except for green and oolong tea usingHPLC-FLD data, which showed a classification rate of 96.43% and 95.45%, respectively. Agood prediction was also accomplished, with a 100% classification rate for prediction inalmost all the cases, except for white tea and oolong tea, when HPLC-UV fingerprints wereemployed that exhibited a classification rate of 77.78% and 88.89%, respectively. Theseresults show that, a priori, both HPLC-UV and HPLC-FLD corrected chromatographicfingerprints can be proposed as good sample chemical descriptors to address tea extractauthentication when adulterated with chicory samples.
3.4. Detection and Quantitation of Tea Adulterations with Chicory by PLS
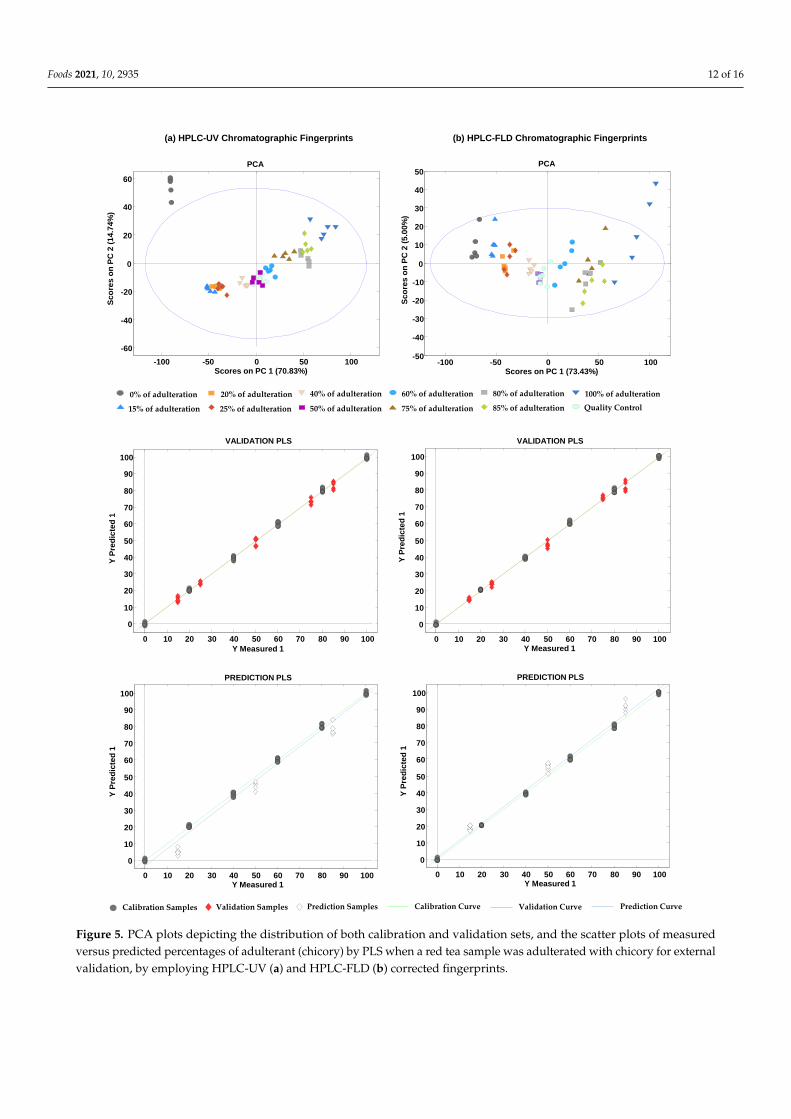
Five adulteration cases were studied to evaluate the viability of the proposed HPLC-UV and HPLC-FLD corrected chromatographic fingerprints for the detection and quantita-tion of chicory adulterations in tea extracts. The adulteration cases under study involvedeach one of the tea groups (red, green, black, oolong, and white teas) which were adul-terated with chicory at different percentages, all of them by quintuplicate (see Table 3).HPLC-UV and HPLC-FLD data were then subjected to PCA to explore sample distributionaccording to the percentage of adulterant, as well as to PLS to quantify the adulterationpercentage. As an example, Figure 5 depicts the PCA plots showing the distribution ofboth calibration and validation samples, and the scatter plots of measured versus predictedpercentage levels of adulteration (chicory) for a red tea sample adulterated with chicory,using HPLC-UV (Figure 5a) and HPLC-FLD (Figure 5b) corrected data.

Foods 2021, 10, 2935 10 of 16Foods 2021, 10, x FOR PEER REVIEW 11 of 17
Figure 4. Cont.

Foods 2021, 10, 2935 11 of 16Foods 2021, 10, x FOR PEER REVIEW 12 of 17
Figure 4. Validation of the paired PLS-DA models when using HPLC-UV and HPLC-FLD corrected chromatographic
fingerprints as sample chemical descriptors. Red line establishes the separation between both classes.
As can be seen, scatter plots of PCA scores distributed the adulterated samples ac-
cording to the adulterant percentage, from pure red tea extracts (at the left of the plots) to
pure chicory extracts (at the right of the plots). Similar performance was also achieved for
the other cases under evaluation. In this adulteration study (red tea versus chicory), very
good validation and prediction PLS results were obtained, regardless of the type of fin-
gerprints, with linearities higher than 0.999, although, as expected, prediction errors of
validation and prediction steps were higher taking into consideration that different sam-
ple extracts were used to build the calibration model. Table 4 summarizes the LVs used,
the linearity (R2) and the PLS calibration, cross-validation, and external validation and
prediction errors for all the adulteration cases under study.
Figure 4. Validation of the paired PLS-DA models when using HPLC-UV and HPLC-FLD corrected chromatographic fingerprints assample chemical descriptors. Red line establishes the separation between both classes.
As can be seen, scatter plots of PCA scores distributed the adulterated samplesaccording to the adulterant percentage, from pure red tea extracts (at the left of the plots)to pure chicory extracts (at the right of the plots). Similar performance was also achievedfor the other cases under evaluation. In this adulteration study (red tea versus chicory),very good validation and prediction PLS results were obtained, regardless of the type offingerprints, with linearities higher than 0.999, although, as expected, prediction errorsof validation and prediction steps were higher taking into consideration that differentsample extracts were used to build the calibration model. Table 4 summarizes the LVs used,the linearity (R2) and the PLS calibration, cross-validation, and external validation andprediction errors for all the adulteration cases under study.
Foods 2021, 10, 2935 12 of 16Foods 2021, 10, x FOR PEER REVIEW 13 of 17
Figure 5. PCA plots depicting the distribution of both calibration and validation sets, and the scatter
plots of measured versus predicted percentages of adulterant (chicory) by PLS when a red tea sam-
ple was adulterated with chicory for external validation, by employing HPLC-UV (a) and HPLC-
FLD (b) corrected fingerprints.
(a) HPLC-UV Chromatographic Fingerprints (b) HPLC-FLD Chromatographic Fingerprints
-100 -50 0 50 100
-60
-40
-20
0
20
40
60
Scores on PC 1 (70.83%)
Sc
ore
s o
n P
C 2
(1
4.7
4%
)
PCA
-100 -50 0 50 100-50
-40
-30
-20
-10
0
10
20
30
40
50
Scores on PC 1 (73.43%)
Sc
ore
s o
n P
C 2
(5
.00
%)
PCA
0% of adulteration
15% of adulteration
20% of adulteration
25% of adulteration
40% of adulteration
50% of adulteration
60% of adulteration
75% of adulteration
80% of adulteration
85% of adulteration
100% of adulteration
Quality Control
0 10 20 30 40 50 60 70 80 90 100
0
10
20
30
40
50
60
70
80
90
100
Y Measured 1
Y P
red
icte
d 1
VALIDATION PLS
0 10 20 30 40 50 60 70 80 90 100
0
10
20
30
40
50
60
70
80
90
100
Y Measured 1
Y P
red
icte
d 1
VALIDATION PLS
0 10 20 30 40 50 60 70 80 90 100
0
10
20
30
40
50
60
70
80
90
100
Y Measured 1
Y P
red
icte
d 1
PREDICTION PLS
0 10 20 30 40 50 60 70 80 90 100
0
10
20
30
40
50
60
70
80
90
100
Y Measured 1
Y P
red
icte
d 1
PREDICTION PLS
Calibration Samples Validation Samples Prediction Samples Calibration Curve Validation Curve Prediction Curve
Figure 5. PCA plots depicting the distribution of both calibration and validation sets, and the scatter plots of measuredversus predicted percentages of adulterant (chicory) by PLS when a red tea sample was adulterated with chicory for externalvalidation, by employing HPLC-UV (a) and HPLC-FLD (b) corrected fingerprints.

Foods 2021, 10, 2935 13 of 16
Table 4. Results for the evaluation of adulteration of tea samples with chicory using HPLC-UV and HPLC-FLD as chemicaldescriptors for PLS.
HPLC-UV Fingerprints
LVs Linearity(R2)
Calibration Error(%)
Cross-ValidationError (%)
External ValidationError (%)
Prediction Error(%)
Red tea 4 0.999 1.0 1.5 2.0 8.0Green tea 5 0.999 0.5 1.3 1.0 15.7Black tea 4 0.999 1.0 3.6 2.1 21.6
Oolong tea 2 0.998 1.4 6.4 1.8 15.0White tea 3 0.999 1.3 2.3 2.2 80.7
HPLC-FLD Fingerprints
LVs Linearity(R2)
Calibration Error(%)
Cross-ValidationError (%)
External ValidationError (%)
Prediction Error(%)
Red tea 4 0.999 0.9 2.4 2,5 5.7Green tea 5 0.999 0.3 1.1 1.4 18.3Black tea 3 0.999 1.1 1.6 1.6 2.6
Oolong tea 2 0.998 1.4 1.9 1.4 13.0White tea 3 0.999 0.8 2.3 3.7 132.9
As can be seen, similar figures of merit were achieved for both HPLC-UV and HPLC-FLD fingerprints. In all cases, good linearity values (R2 > 0.998) and calibration errorsand cross-validation errors lower than 1.4% and 6.4%, respectively, were achieved. Ascommented in Section 2.4, PLS external validation was carried out at different chicoryadulteration levels using the same tea and chicory extracts for building the PLS models. Asshown in the table, quite acceptable external validation errors, with values below 2.2% and3.7% for HPLC-UV and HPLC-FLD fingerprints, respectively, were obtained. In contrast,the prediction step relied on different tea and chicory extracts than the ones employed forbuilding the PLS models. As expected, an increase in the prediction errors was observed,showing a different behavior depending on the tea variety. For most of the adulterationcases under study, prediction errors increased up to 21.6% and 18.3% for HPLC-UV andHPLC-FLD, respectively. Better predictions were obtained using HPLC-FLD fingerprintsfor red tea and black tea adulterated with chicory, with prediction errors of 5.7% and 2.6%,respectively. The contribution in the increment on the prediction errors observed camemainly for the prediction of the lowest (15%) and the highest (85%) adulteration levels,as can be seen in the prediction PLS plots of Figure 5. Nevertheless, these values canbe considered acceptable taking into consideration the type of application under study,as tea adulteration with low chicory levels will not be expected (no economic benefit),but either high chicory adulteration levels are expected to be employed (the adulterationmay be then easily detected by visual inspection). Only in the case of white tea extractsadulterated with chicory did none of the proposed HPLC-UV and HPLC-FLD methodsseem to be useful for predicting adulteration levels when different sample extracts than theones used for building the PLS calibration models, showing very high prediction errors(80.7% and 132.9% for HPLC-UV and HPLC-FLD fingerprints, respectively). This findingwas attributed to the similarity in the compositional fingerprints of white teas and chicorysamples as they were always in close locations in the plots of scores of the previous PCAand PLS-DA systems.
4. Conclusions
Untargeted HPLV-UV fingerprints acquired at 280 nm and HPLC-FLD fingerprintsacquired at 280 nm and 350 nm for excitation and emission, respectively, have shown tobe appropriate chemical descriptors to characterize, classify, and authenticate tea samplesbelonging to the main five tea varieties (red, green, black, oolong, and white teas). Gooddiscrimination of the tea samples against chicory extracts was achieved by PLS-DA. In

Foods 2021, 10, 2935 14 of 16
addition, 100% classification rates (in both, calibration and prediction evaluation) wereachieved when validating paired PLS-DA models of each tea extract type against chicory,with very few exceptions, thus enhancing the classification and authentication capacity ofthe developed methodology.
PLS was employed in several adulteration cases representing each tea extract varietyadulterated with chicory. Generally, good PLS results for chicory adulteration detectionand quantitation were also accomplished, with calibration, cross-validation, and externalvalidation errors below 1.4%, 6.4%, and 3.7%, respectively. Acceptable prediction errorsusing adulterated samples prepared with different extracts than the ones employed forPLS calibration (below 21.7%) were also observed, except for the white tea extracts thatshowed higher errors, a fact that was attributed to the similarity of their fingerprints.
The proposed non-targeted HPLC-UV and HPLC-FLD fingerprinting methods can beused as a simple and inexpensive approach to ensure and guarantee tea extract authenticity,as well as to prevent fraudulent practices against adulteration with chicory (a commonnon-tea-based adulterant).
Supplementary Materials: The following are available online at https://www.mdpi.com/article/10.3390/foods10122935/s1, Table S1: Information about the analyzed samples, Table S2: PLS modeland prediction classification rates in the tea extract versus chicory adulteration studies.
Author Contributions: Conceptualization, J.S. and O.N.; methodology, J.P., À.B. and N.N.; validation,J.P., À.B. and N.N.; formal analysis, J.P., À.B. and N.N.; investigation, J.P., À.B., N.N., J.S. and O.N.;writing—original draft preparation, N.N. and O.N.; writing—review and editing, J.P., À.B., N.N., J.S.and O.N.; supervision, J.S. and O.N.; funding acquisition, J.S. and O.N. All authors have read andagreed to the published version of the manuscript.
Funding: This research was supported by the project PID2020-114401RB-C22 financed by the AgenciaEstatal de Investigación (Spain) (AEI/10.13039/501100011033), and by the Agency for Administrationof University and Research Grants (Generalitat de Catalunya, Spain) under the projects 2017SGR-171and 2017SGR-310.
Institutional Review Board Statement: Not applicable.
Informed Consent Statement: Not applicable.
Data Availability Statement: Data is available upon request to the authors.
Conflicts of Interest: The authors declare no conflict of interest. The funders had no role in the designof the study; in the collection, analyses, or interpretation of data; in the writing of the manuscript, orin the decision to publish the results.
References1. Núñez, O. Current Legal Context in Food Integrity and Authenticity. In Chromatographic and Related Separation Techniques in Food
Integrity and Authenticity. Volume A: Advances in Chromatographic Techniques; Núñez, O., Campmajó, G., Eds.; World ScientificPublishing: London, UK, 2021; pp. 1–24. ISBN 978-1-78634-994-1.
2. Spink, J.; Moyer, D.C. Defining the Public Health Threat of Food Fraud. J. Food Sci. 2011, 76, R157–R163. [CrossRef]3. Kennedy, S.P.; Gonzales, P.; Roungchun, J. Coffee and tea fraud. In Food Fraud. A Global Threat with Public Health and Economic
Consequences; Hellberg, R.S., Everstine, K., Sklare, S.A., Eds.; Academic Press Inc.: Cambridge, MA, USA, 2021; pp. 139–150.ISBN 978-0-12-817242-1.
4. Cabrera, C.; Artacho, R.; Giménez, R. Beneficial Effects of Green Tea—A Review. J. Am. Coll. Nutr. 2006, 25, 79–99. [CrossRef]5. McKenzie, J.S.; Jurado, J.M.; de Pablos, F. Characterisation of tea leaves according to their total mineral content by means of
probabilistic neural networks. Food Chem. 2010, 123, 859–864. [CrossRef]6. Palacios-Morillo, A.; Alcázar, Á.; De Pablos, F.; Jurado, J.M. Differentiation of tea varieties using UV-Vis spectra and pattern
recognition techniques. Spectrochim. Acta—Part A Mol. Biomol. Spectrosc. 2013, 103, 79–83. [CrossRef]7. Jie, G.; Lin, Z.; Zhang, L.; Lv, H.; He, P.; Zhao, B. Free radical scavenging effect of Pu-erh tea extracts and their protective effect on
oxidative damage in human fibroblast cells. J. Agric. Food Chem. 2006, 54, 8058–8064. [CrossRef]8. Jang, M.H.; Piao, X.L.; Kim, J.M.; Kwon, S.W.; Park, J.H. Antilipogenic Effect of Green Tea Extract in C57BL/6J-Lepob/ob Mice.
Phyther. Res. 2009, 23, 467–471. [CrossRef]

Foods 2021, 10, 2935 15 of 16
9. Okello, E.J.; Savelev, S.U.; Perry, E.K. In vitro anti-β-secretase and dual anti-cholinesterase activities of Camellia sinensis L. (tea)relevant to treatment of dementia. Phyther. Res. 2004, 18, 624–627. [CrossRef] [PubMed]
10. Sharma, K.; Singh, S.; Tanwar, K. Recognition and Evaluation of Authenticity of Tea and Coffee. Int. J. Adv. Res. Sci. Commun.Technol. 2020, 11, 19–26.
11. Pal, A.D.; Das, T. Analysis of adulteration in black tea. Int. J. Biol. Res. 2018, 3, 253–257.12. Ma, G.; Zhang, Y.; Zhang, J.; Wang, G.; Chen, L.; Zhang, M.; Liu, T.; Liu, X.; Lu, C. Determining the geographical origin of Chinese
green tea by linear discriminant analysis of trace metals and rare earth elements: Taking Dongting Biluochun as an example. FoodControl 2016, 59, 714–720. [CrossRef]
13. Liu, W.; Chen, Y.; Liao, R.; Zhao, J.; Yang, H.; Wang, F. Authentication of the geographical origin of Guizhou green tea usingstable isotope and mineral element signatures combined with chemometric analysis. Food Control 2021, 125, 107954. [CrossRef]
14. Liu, H.; Zeng, Y.; Yan, J.; Huang, R.; Zhao, X.; Zheng, X.; Mo, M.; Tan, S.; Tong, H. CNHO and mineral element stable isotope ratioanalysis for authentication in tea. J. Food Compos. Anal. 2020, 91, 103513. [CrossRef]
15. Liu, Z.; Yuan, Y.; Zhang, Y.; Shi, Y.; Hu, G.; Zhu, J.; Rogers, K.M. Geographical traceability of Chinese green tea using stableisotope and multi-element chemometrics. Rapid Commun. Mass Spectrom. 2019, 33, 778–788. [CrossRef]
16. Zhang, J.; Yang, R.; Li, Y.C.; Wen, X.; Peng, Y.; Ni, X. Use of mineral multi-elemental analysis to authenticate geographical originof different cultivars of tea in Guizhou, China. J. Sci. Food Agric. 2020, 100, 3046–3055. [CrossRef] [PubMed]
17. Ye, N.S. A minireview of analytical methods for the geographical origin analysis of teas (Camellia sinensis). Crit. Rev. Food Sci.Nutr. 2012, 52, 775–780. [CrossRef]
18. Xia, W.; Li, Z.; Yu, C.C.; Liu, Z.; Nie, J.; Li, C.; Shao, S.; Zhang, Y.; Rogers, K.M.; Yuan, Y. Understanding processing, maturity andharvest period effects to authenticate early-spring Longjing tea using stable isotopes and chemometric analyses. Food Control2021, 124, 107907. [CrossRef]
19. Inarejos-García, A.M.; Helbig, I.; Klette, P.; Weber, S.; Maeder, J.; Morlock, G.E. Authentication of Commercial Powdered TeaExtracts (Camellia sinensis L.) by Gas Chromatography. ACS Food Sci. Technol. 2021, 1, 596–604. [CrossRef]
20. Fang, S.; Huang, W.J.; Wei, Y.; Tao, M.; Hu, X.; Li, T.; Kalkhajeh, Y.K.; Deng, W.W.; Ning, J. Geographical origin traceability ofKeemun black tea based on its non-volatile composition combined with chemometrics. J. Sci. Food Agric. 2019, 99, 6937–6943.[CrossRef]
21. Campmajó, G.; Núñez, N.; Núñez, O. The Role of Liquid Chromatography-Mass Spectrometry in Food Integrity and Authenticity.In Mass Spectrometry—Future Perceptions and Applications; Kamble, G.S., Ed.; IntechOpen: London, UK, 2019; pp. 3–24. ISBN 978-1-83962-756-9.
22. Campmajó, G.; Núñez, O. Chromatographic Fingerprinting Approaches in Food Authentication. In Chromatographic and RelatedSeparation Techniques in Food Integrity and Authenticity. Volume A: Advances in Chromatographic Techniques; Núñez, O., Campmajó,G., Eds.; World Scientific Publishing: London, UK, 2021; pp. 137–165. ISBN 978-1-78634-994-1.
23. Budínová, G.; Vlácil, D.; Mestek, O.; Volka, K. Application of infrared spectroscopy to the assessment of authenticity of tea.Talanta 1998, 47, 255–260. [CrossRef]
24. He, W.; Zhou, J.; Cheng, H.; Wang, L.; Wei, K.; Wang, W.; Li, X. Validation of origins of tea samples using partial least squaresanalysis and Euclidean distance method with near-infrared spectroscopy data. Spectrochim. Acta—Part A Mol. Biomol. Spectrosc.2012, 86, 399–404. [CrossRef]
25. Yan, S.M.; Liu, J.P.; Xu, L.; Fu, X.S.; Cui, H.F.; Yun, Z.Y.; Yu, X.P.; Ye, Z.H. Rapid discrimination of the geographical origins of anoolong tea (Anxi-Tieguanyin) by near-infrared spectroscopy and partial least squares discriminant analysis. J. Anal. MethodsChem. 2014, 2014. [CrossRef] [PubMed]
26. Firmani, P.; De Luca, S.; Bucci, R.; Marini, F.; Biancolillo, A. Near infrared (NIR) spectroscopy-based classification for theauthentication of Darjeeling black tea. Food Control 2019, 100, 292–299. [CrossRef]
27. Liu, P.; Wen, Y.; Huang, J.; Xiong, A.; Wen, J.; Li, H.; Huang, Y.; Zhu, X.; Ai, S.; Wu, R. A novel strategy of near-infraredspectroscopy dimensionality reduction for discrimination of grades, varieties and origins of green tea. Vib. Spectrosc. 2019,105, 102984. [CrossRef]
28. Mishra, P.; Nordon, A.; Tschannerl, J.; Lian, G.; Redfern, S.; Marshall, S. Near-infrared hyperspectral imaging for non-destructiveclassification of commercial tea products. J. Food Eng. 2018, 238, 70–77. [CrossRef]
29. Aboulwafa, M.M.; Youssef, F.S.; Gad, H.A.; Sarker, S.D.; Nahar, L.; Al-Azizi, M.M.; Ashour, M.L. Authentication and discrimina-tion of green tea samples using UV–vis, FTIR and HPLC techniques coupled with chemometrics analysis. J. Pharm. Biomed. Anal.2019, 164, 653–658. [CrossRef] [PubMed]
30. Diniz, P.H.G.D.; Barbosa, M.F.; De Melo Milanez, K.D.T.; Pistonesi, M.F.; De Araújo, M.C.U. Using UV-Vis spectroscopy forsimultaneous geographical and varietal classification of tea infusions simulating a home-made tea cup. Food Chem. 2016, 192,374–379. [CrossRef] [PubMed]
31. Peng, T.Q.; Yin, X.L.; Gu, H.W.; Sun, W.; Ding, B.; Hu, X.C.; Ma, L.A.; Wei, S.D.; Liu, Z.; Ye, S.Y. HPLC-DAD fingerprintscombined with chemometric techniques for the authentication of plucking seasons of Laoshan green tea. Food Chem. 2021, 347,1–8. [CrossRef]
32. Wang, L.; Wei, K.; Cheng, H.; He, W.; Li, X.; Gong, W. Geographical tracing of Xihu Longjing tea using high performance liquidchromatography. Food Chem. 2014, 146, 98–103. [CrossRef]

Foods 2021, 10, 2935 16 of 16
33. Navratilova, K.; Hrbek, V.; Kratky, F.; Hurkova, K.; Tomaniova, M.; Pulkrabova, J.; Hajslova, J. Green tea: Authentication ofgeographic origin based on UHPLC-HRMS fingerprints. J. Food Compos. Anal. 2019, 78, 121–128. [CrossRef]
34. Sentellas, S.; Saurina, J. The Role of Chemometrics in Food Integrity and Authenticity. In Chromatographic and Related SeparationTechniques in Food Integrity and Authenticity. Volume A: Advances in Chromatographic Techniques; Núñez, O., Campmajó, G., Eds.;World Scientific Publishing: London, UK, 2021; pp. 167–200. ISBN 978-1-78634-994-1.
35. Massart, D.L.; Vandeginste, B.G.M.; Buydens, L.M.C.; de Jong, S.; Lewi, P.J.; Smeyers-Verbeke, J. Handbook of Chemometrics andQualimetrics; Elsevier: Amsterdam, The Netherlands, 1997.