Redalyc.Frank Parsons: Trajetória do pioneiro da orientação ...
Upload
khangminh22Category
view
5download
0
F I N A L R E P O R T
TASK 3.2 30 PERCENT DESIGN REPORT
PARSONS SLOUGH SILL PROJECT
Prepared for
Elkhorn Slough Foundation P.O. Box 267 Moss Landing, CA 95039
March 19, 2010
Ducks Unlimited, Inc. 3074 Gold Canal Drive Rancho Cordova, CA 95670
US-CA-485-1
Dixon Marine Services, Inc

TABLE OF CONTENTSTABLE OF CONTENTSTABLE OF CONTENTSTABLE OF CONTENTS
i
Dixon Marine Services
Section 1 ONE Introduction..................................................................................................................... 1-1
1.1 Background.............................................................................................. 1-1 1.2 Purpose and Scope ................................................................................... 1-1 1.3 Organization of Design Report ................................................................ 1-1
Section 2 Existing Conditions........................................................................................................ 2-1
2.1 General..................................................................................................... 2-1 2.2 Geotechnical Conditions.......................................................................... 2-1 2.3 Seismic Conditions .................................................................................. 2-1 2.4 Hydraulic Conditions............................................................................... 2-2
2.4.1 UPRR Bridge Mp 103.27............................................................. 2-2 2.4.2 UPRR Rail Line From Bridge MP 103.27 North to MP
102.6............................................................................................. 2-2
Section 3 Design Criteria ................................................................................................................ 3-1
3.1 ESNERR Design Criteria......................................................................... 3-13.2 Surveying and Mapping........................................................................... 3-1
3.2.1 Coordinates and Datum................................................................ 3-1 3.2.2 Base Map Survey Data................................................................. 3-1
3.3 Structure Alignment and Geometry......................................................... 3-1 3.3.1 Alignment .................................................................................... 3-13.3.2 Dimensions of Sill Structure........................................................ 3-1 3.3.3 Top of Structure ........................................................................... 3-2
3.4 Design Earthquake................................................................................... 3-2
Section 4 Project Description......................................................................................................... 4-1
4.1 Sill Structure ............................................................................................ 4-1 4.1.1 Compatibility With Future Scenarios .......................................... 4-2 4.1.2 Sea Level Rise.............................................................................. 4-2
4.2 Staging Area............................................................................................. 4-2 4.2.1 Kirby Park.................................................................................... 4-2 4.2.2 Moss Landing Wildlife Area ....................................................... 4-3
Section 5 Sill Structure Design Analyses...................................................................................... 5-1
5.1 Sheetpile Analysis.................................................................................... 5-1 5.2 Pile Analysis ............................................................................................ 5-2 5.3 Settlement Analysis ................................................................................. 5-2
5.3.1 Settlement at UPRR Bridge MP 103.27 ...................................... 5-2
Section 6 Hydraulic Modeling ........................................................................................................ 6-3
6.1 General..................................................................................................... 6-3

TABLE OF CONTENTSTABLE OF CONTENTSTABLE OF CONTENTSTABLE OF CONTENTS
ii
Dixon Marine Services
6.2 Analysis Approach................................................................................... 6-3 6.2.1 Geometry...................................................................................... 6-3 6.2.2 Tidal Boundary ............................................................................ 6-4 6.2.3 Model Calibration ........................................................................ 6-4
6.3 Model Scenario ........................................................................................ 6-4 6.4 Results...................................................................................................... 6-5
6.4.1 Tidal Prism................................................................................... 6-5 6.4.2 Tidal Range.................................................................................. 6-56.4.3 Water Level Differences Across UPRR ...................................... 6-5 6.4.4 Habitat.......................................................................................... 6-6 6.4.5 Velocities ..................................................................................... 6-6 6.4.6 Potential Scour and Erosion......................................................... 6-7
Section 7 30 Percent Design Construction Schedule and Cost Estimate .................................. 7-1
7.1 Constructability........................................................................................ 7-1 7.2 Construction Schedule .............................................................................7-1 7.3 Construction Cost Estimate...................................................................... 7-2
Section 8 Operation and Maintenance........................................................................................... 8-1
8.1 Maintenance............................................................................................. 8-1 8.1.1 Inspection of the Sill Structure .................................................... 8-1 8.1.2 Debris Removal ........................................................................... 8-1
Section 9 Future Design Considerations ...................................................................................... 9-1
9.1 Unresolved Technical, Design or Construction Issues ............................ 9-1 9.2 Value Engineering ................................................................................... 9-1 9.3 Development of Technical Specifications ............................................... 9-1
Section 10 Limitations .................................................................................................................... 10-1
Section 11 References .................................................................................................................... 11-1

List of Tables, Figures, Appendices, Drawings and Acronyms
iii
Dixon Marine Services
Tables
Table 5-1 Base Structure Sheetpile Lengths
Table 6-1 Maximum Difference in Stage Across UPRR at High Tide in Elkhorn Slough
Figures
Figure 1-1 Project Location
Figure 2-1 UPRR Profile From MP 103.31 to 102.74
Figure 6-1 HEC-RAS Model Schematic
Figure 6-2 Locations of Water Level Output from PWA Delft3D Model
Figure 6-3 December 2005 Water Levels, HEC-RAS and Delft3D Output at PWA Station 2, Downstream Reach of Elkhorn Slough
Figure 6-4 December 2005 Water Levels, HEC-RAS and Delft3D Output at PWA Station 4, Parsons Slough Downstream of UPRR
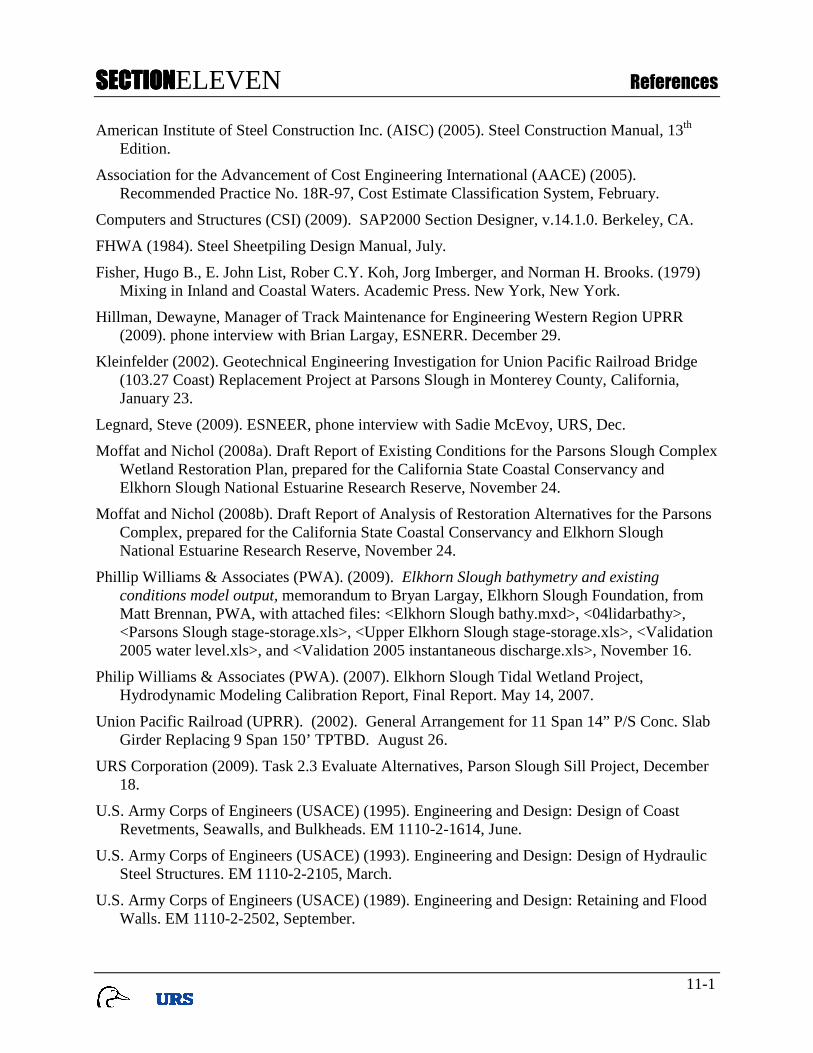
Figure 6-5 December 2005 Water Levels, HEC-RAS and Delft3D Output at PWA Station 5, Parsons Slough Upstream of UPRR
Figure 6-6 December 2005 Discharge, HEC-RAS and Delft3D Output at UPRR Bridge
Figure 6-7a Water Levels in Parsons Slough Upstream of UPRR for Existing and Proposed Conditions (showing spring/neap cycle)
Figure 6-7b Water Levels in Parsons Slough Upstream of UPRR for Existing and Proposed Conditions (showing daily variation)
Figure 6-8 Difference in Stage across UPRR versus Stage in Elkhorn Slough, from 10-minute HEC-RAS output from 12/6/05 to 1/6/06 for Existing and Proposed Conditions
Figure 6-9 Velocity Across Proposed Sill in Parsons Slough During a Spring Tide
Figure 6-10a Velocity in Parsons Slough about 150 feet Northwest of Sill Structure for Existing and Proposed Conditions (showing spring/neap cycle)
Figure 6-10b Velocity in Parsons Slough about 150 feet Northwest of Sill Structure for Existing and Proposed Conditions (showing daily variation)
Figure 6-11a Velocity in Parsons Slough about 10 feet Downstream of Railroad Bridge for Existing and Proposed Conditions (showing spring/neap cycle)
Figure 6-11b Velocity in Parsons Slough about 10 feet Downstream of Railroad Bridge for Existing and Proposed Conditions (showing daily variation)
Figure 6-12 Approximate Velocity Profile at UPRR Bridge for Sill Velocity of 12 ft/s

List of Tables, Figures, Appendices, Drawings and Acronyms
iv
Dixon Marine Services
Figure 7-1 Low Range Estimated Construction Schedule for 30 Percent Design
Figure 7-2 High Range Estimated Construction Schedule for 30 Percent Design
Drawings
Drawing T-1 Title Sheet
Drawing T-2 Notes and Legend
Drawing T-3 Staging Areas Plan
Drawing E-1 Existing Conditions
Drawing L-1 Layout Plan and Sections
Drawing L-2 Layout Profile
Drawing S-1 Structural Details - 1
Drawing S-2 Structural Details - 2
Appendices
Appendix A ESNERR Design Criteria for Engineers 12/17/09
Appendix B Base Structure Engineering Analyses
Appendix C Opinion of Estimated Construction Cost
Appendix D Adjustable Weir Alternative

List of Tables, Figures, Appendices, Drawings and Acronyms
v
Dixon Marine Services
Acronyms
ARRA American Reinvestment and Recovery Act
CBC California Building Code
CDFG California Department of Fish and Game
DBE Design basis earthquake
ESF Elkhorn Slough Foundation
ESNEER Elkhorn Slough National Estuarine Research Reserve
FHWA Federal Highway Administration
NOAA National Oceanic and Atmospheric Administration
MBARI Monterey Bay Aquarium Research Institute
MHHW Mean high high water
MHW Mean high water
MLLW Mean low low water
MP Milepost
PWA Phillip Williams & Associates
UBE Upper bound earthquake
UPRR Union Pacific Railroad
USACE United States Army Corps of Engineers
SECTIONSECTIONSECTIONSECTIONONE Introduction
1-1
Dixon Marine Services
1. Section 1 ONE Introduction
1.1 BACKGROUND
Elkhorn Slough Foundation (ESF) has been awarded a grant from the National Oceanic and Atmospheric Administration (NOAA) through the American Reinvestment and Recovery Act (ARRA) for design, permitting and construction of a sill at the mouth of Parsons Slough in Monterey County, California (see Figure 1-1). The proposed location of the sill is just downstream of UPPR Bridge Milepost (MP) 103.27 Coast Subdivision, approximately 0.2 miles upstream of the confluence with Elkhorn Slough. Increased tidal energy in Parsons Slough resulting from historical development and subsequent restoration are resulting in accelerated tidal marsh loss and habitat degradation. The purpose of the sill is to allow for a reduction of erosive energy into Parsons Slough due to tidal exchange while allowing for sufficient flushing to maintain water quality.
1.2 PURPOSE AND SCOPE
The ESF has retained Ducks Unlimited, teamed with URS Corporation and Dixon Marine Services, to provide professional engineering services for the 30 percent design of the Parson Slough Sill Project. As part of the 30 percent design, our scope of services, dated October 15, 2009, includes documentation of the 30 percent design. This report presents the basis of design for the 30 percent design of the sill structure.
1.3 ORGANIZATION OF DESIGN REPORT
After this introductory section, this design report organized into the following sections:
• Section 2 describes the existing conditions at the project site.
• Section 3 discusses the design criteria used in developing the 30 percent design.
• Section 4 describes the sill structure and staging areas for construction.
• Section 5 discusses the engineering analyses of the sill structure.
• Section 6 discusses the hydraulic analyses performed to support the 30 percent design.
• Section 7 discusses constructability, conceptual construction schedule and cost.
• Section 8 describes operation and maintenance of the sill structure.
• Section 9 discusses considerations for future design phases.
• Section 10 describes the limitations of this technical memorandum.
• Section 11 lists pertinent references related to this report.
The appendices for this report are as follows:
• Appendix A includes the design criteria provided by ESNERR for the sill structure and how those criteria have been incorporated into the 30 percent design.
• Appendix B contains engineering analyses including pile analyses, sheetpile analyses, and settlement analyses for the sill structure.

SECTIONSECTIONSECTIONSECTIONONE Introduction
1-2
Dixon Marine Services
• Appendix C is the estimated opinion of construction cost for the sill structure.
• Appendix D contains the description, hydraulic analyses, drawings, estimated cost and structural analyses for a potential adjustable weir that could be placed on the sill structure.

SECTIONSECTIONSECTIONSECTIONTWO Existing Conditions
2-1
Dixon Marine Services
2. Section 2 TW O Existing Conditions
2.1 GENERAL
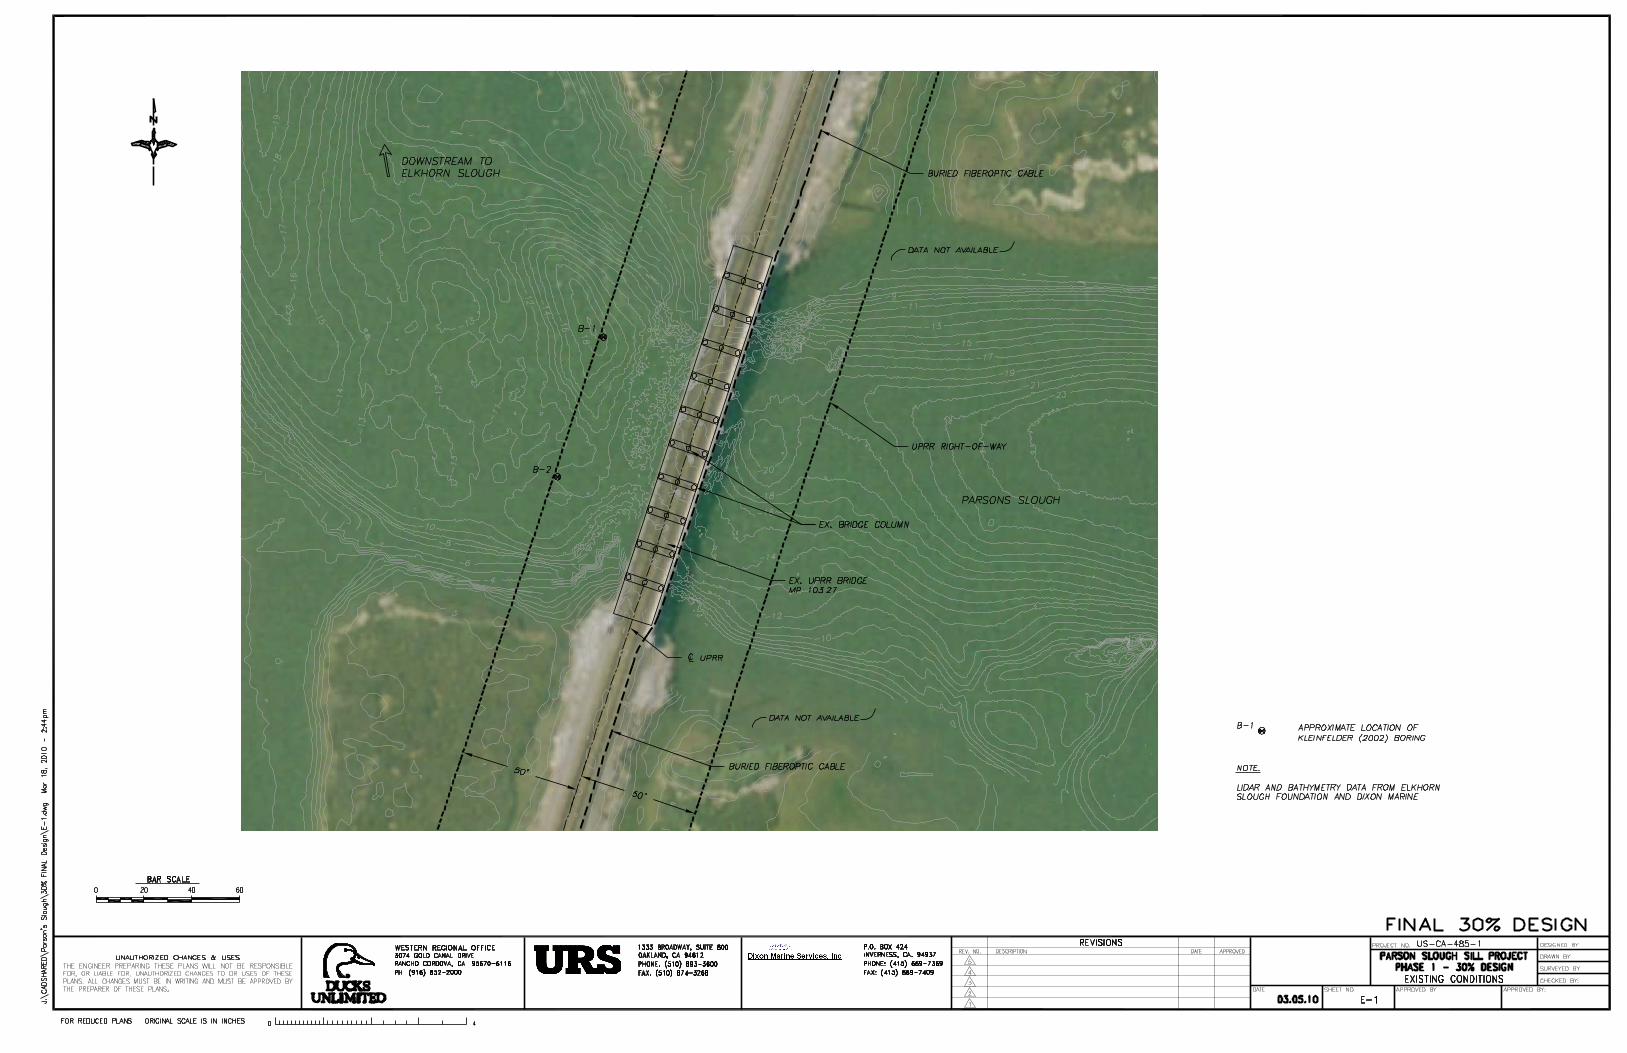
The proposed location for the sill structure weir is just downstream of UPPR Bridge MP 103.27 Coast Subdivision, which was replaced in 2003. The bridge is a 165-foot-long concrete slab girder bridge with new concrete abutments that were set just inboard of the previous abutments, which are still present, so as to not widen the existing channel. Sheetpiles were driven between the old and new abutments. The bridge is supported on ten bents each having three 24-inch-diameter concrete filled pipe piles that extend down approximately 100 feet below the rail line (Moffat and Nichol, 2008a). The bents are spaced at distances of 9 to 14 feet apart. The rail line embankment has a crest elevation of approximately 91 feet in the vicinity of the bridge based on LIDAR data (PWA, 2009). A fiber optic cable line is buried along the east side of the rail line within the UPRR rail corridor right of way (Moffat and Nichol, 2008a).
The existing topographic and bathymetric conditions are shown on Drawing E-1. As shown on Figure 2-1, the channel invert ranges between elevation -10 to -14 feet in the area downstream of the bridge. Rip-rap has been placed below the UPRR bridge for scour protection, however, the extent of the rip-rap is unknown (Kleinfelder, 2002). Based on Kleinfelder (2002), the rip-rap had a maximum size of 3 feet in diameter and was delivered in forty 50-cubic-yard capacity rail cars.
2.2 GEOTECHNICAL CONDITIONS
Geotechnical field investigations were not performed specifically for the design of the sill structure. The geotechnical conditions in the vicinity of the proposed sill structure are based on two borings drilled in September 2001 for the replacement of UPRR Bridge MP 103.27 Coast Subdivision (Kleinfelder, 2002). The two borings, which are located approximately 40 feet downstream of the bridge, were drilled to depths of 89 and 99 feet below the channel invert. The subsurface conditions found in both borings were approximately 62 feet of soft clayey silt underlain by very dense sandy soils.
2.3 SEISMIC CONDITIONS
A seismic hazards analyses was not performed specifically for the 30 percent design of the sill structure. The seismic hazard analysis and development of seismic design criteria developed for replacement of UPRR Bridge MP 103.27 Coast Subdivision (Kleinfelder, 2002) was reviewed for appropriateness for the 30 percent design. The closest faults to the site are the Zayante-Vergeles Fault (9.2 km distant), the Rinconada Fault (15 km distant) and the San Andreas Fault (15 km distant). The site is not located within an Alquist-Priolo Earthquake Fault Zone and there is no known evidence of active or potentially active faults crossing under the site.
According to the 1998 California Building Code (CBC) the site is located in Seismic Zone 4 and the soil type is SE
2. Kleinfelder (2002) documents a probabilistic seismic hazard analysis for the
1 The elevation/vertical datum used in this design report is NAVD 88. 2 Soil type is SE which is a soil profile with more than 10 feet of soft clay and an undrained shear strength less than 500 psf.
SECTIONSECTIONSECTIONSECTIONTWO Existing Conditions
2-2
Dixon Marine Services
bridge site to develop the design basis earthquake (DBE) and the upper bound earthquake (UBE). The DBE, according to the 1997 UBC, is defined as the ground motion with a 10 percent probability of exceedance in 50 years (475 year return period). The UBE, according to the 1998 CBC, is defined as the ground motion with a 10 percent probability of exceedance in 100 years (950 year return period). The DBE and UBE peak horizontal accelerations are 0.55g and 0.68g, respectively (Kleinfelder, 2002).
2.4 HYDRAULIC CONDITIONS
2.4.1 UPRR Bridge MP 103.27
Tides at the UPRR bridge are approximately the same as that of the ocean with a mean tide range of 5.6 feet (Moffat and Nichol, 2008a). The spring tide range in January 2007 was 8.3 feet from about elevation 6.8 feet to -1.5 feet (Moffat and Nichol, 2008a). The highest recorded tide in Monterey Bay since 1973 is 8.03 feet.
The velocity of tidal flows at the UPRR bridge are high enough to erode the soft clayey silts in which the channel is formed. Tidal velocities measured in 2002 were 5.6 feet per second during ebbing tides and 4.9 feet per second during flooding tides (Moffat and Nichol, 2008a).
Hydraulic modeling of the existing conditions for the 30 percent design including tidal elevation and velocities in the vicinity of the bridge are discussed in Section 6 of this report.
2.4.2 UPRR Rail Line From Bridge MP 103.27 North to MP 102.6
The railroad embankment dividing the Parson Slough Complex from Elkhorn Slough between UPRR bridge MP 103.27 and an island at about MP 102.6 has subsided to elevations that allow higher tide events to cross the railroad embankment. Based on available LIDAR data (PWA, 2009) and an interview with UPRR maintenance personnel (Hillman, 2009), there is a portion of the track located approximately 2,000 feet north of the bridge where the top of the embankment is covered when tides are in excess of 6.3 feet (see Figure 2-1). When tides are very high (elevation 7.0 feet) approximately 1,300 feet of the top of the railway embankment is inundated as shown on Figure 2-1.
UPRR currently protects the embankment in this area and another area to the north of the Parson Complex (North Marsh) against erosion using plastic sheeting (Hillman, 2009). Past efforts to protect the tracks included raising the tracks 1.5 to 2 feet in 1986 and 1987, raising the tracks an additional 0.5 feet three times during the past eight years and placement of rock armor (Hillman, 2009). Efforts to raise the tracks have not been successful due to settlement of the underlying soft soils. Rock armoring was also not successful because the gravel ballast washed out through the riprap.
Potential effects of the sill structure on the tidal head difference across the embankment is discussed in Section 6 of this report.

SECTIONSECTIONSECTIONSECTIONTHREE Design Criteria
3-1
Dixon Marine Services
3. Section 3 THR EE Design Cr iter ia
3.1 ESNERR DESIGN CRITERIA
ESNERR provided design criteria covering hydraulic design requirements, operation and maintenance, structure life, etc., which are presented in Appendix A. Appendix A also includes a summary of how the ESNERR design criteria have been incorporated into the 30 percent design.
3.2 SURVEYING AND MAPPING
3.2.1 Coordinates and Datum
The 30 percent design was developed using the following coordinate system and vertical datum:
• Coordinate system: California Coordinate System of 1983 (NAD83), California Coordinate System Zone 4.
• Vertical datum: North American Vertical Datum of 1988 (NAVD88).
3.2.2 Base Map Survey Data
Topographic data collected using a LIDAR survey and bathymetric data for the project site was provided by ESF (PWA, 2009). Additional Bathymetric surveys in the project vicinity were conducted by Dixon Marine Services, Inc. in December 2009. Additional field surveys of the railroad embankment in the vicinity of the bridge were conducted by Ducks Unlimited in January 2010.
3.3 STRUCTURE ALIGNMENT AND GEOMETRY
3.3.1 Alignment
The location of the alignment of the sill structure was selected based on the following criteria:
• Locate downstream of UPRR Bridge 103.27 for construction accessibility.
• Locate structure a sufficient distance from the bridge so as to not impose additional loads on the bridge foundation;
• Locate structure so that construction and operation and maintenance work would generally be conducted at distances greater than 25 feet from the centerline of the UPRR rail line to minimize need for safety flagmen.
3.3.2 Dimensions of Sill Structure
For the 30 percent design, the sill structure would include a 25-foot-wide center section with a top elevation of -5 feet and a total of 92 feet with a top elevation of -2 feet on either side of the center section. The dimensions and elevations of the open areas will be optimized during future design phases using hydraulic modeling to minimize potential impacts to the railroad as discussed in Section 6 of this report.

SECTIONSECTIONSECTIONSECTIONTHREE Design Criteria
3-2
Dixon Marine Services
3.3.3 Top of Structure
The top elevation of the sill structure is set at 9.6 feet, which is equal to the maximum tide elevation (8.03 feet) observed in Monterey Bay since 1973 plus the required design sea level rise (ESNERR Criteria 17 and 19) of 1.6 feet (0.5 m) during the 50 year design life of the project.
3.4 DESIGN EARTHQUAKE
The design earthquake for the sill structure, which is not a critical structure, was selected as the DBE (10% probability of exceedance in 50 years) of 0.55g.

SECTIONSECTIONSECTIONSECTIONFOUR Project Description
4-1
Dixon Marine Services
4. Section 4 F OUR Project Description
The project includes the sill structure and the staging area required for construction. The sill structure and potential staging areas are described in the following paragraphs.
4.1 SILL STRUCTURE
The sill structure consists of a sheetpile wall structure that will extend 270 feet across the channel as shown in plan and profile on Drawings L-1 and L-2. The 25 foot-wide central bay is located slightly to the north of the center of the base structure sheetpile wall alignment. The 92 feet of open area adjacent to the central bay is distributed with 37 feet and 55 feet north and south of the central bay, respectively. Sheetpile would be driven to a top elevation of -5 feet in the central bay and to about elevation -2.1 feet in the open areas adjacent to the central bay. Outside of the open area, the sheetpile wall will have a top elevation of 9.6 feet until it transitions to an earthen connection embankment where the top elevation will transition down to the UPRR railroad embankment elevation of about 9 feet.
Short earthen embankments that wrap around the ends of the sheetpile would be used to tie-in the sill structure to the railroad embankment. The existing drainage ditch along the UPRR embankment would be rerouted along the Elkhorn Slough edge of the sill structure. A rockfill buttress is included in the design on both sides of the sheetpile wall extends from elevation -2 feet to the channel invert with a slope of 2H:1V. The rockfill buttress provides several benefits as follows:
• Guide for benthic fish and marine animals moving from the channel invert over the sill and back down to the channel invert;
• Minimize plunging flows across the central bay that could trap marine life at the base of the sheetpile as tidal water flows over the sill invert; and
• Provide additional lateral support to the sill structure.
The UPRR embankment near the bridge location does not show indications of significant erosion occurring during high tide events. As such, for the 30 percent design, a 0.5-foot-thick layer of 6-inch riprap covering the slopes of the embankment tie-ins has been provided as a conservative measure for erosion control.
The potential for scouring of the channel invert due to tidal flows is discussed in Section 6. The rockfill buttress would provide scour protection for the portions of the wall below the sill top. In addition, a 2-foot-thick, 10-foot-wide apron of riprap would also extend between the rockfill buttress and the embankment abutments to prevent scour adjacent to remaining portion of exposed sheetpile as shown on Drawing L-1. The riprap apron would also extend to the UPRR bridge abutments to provide the banks between the sill structure and the bridge abutments against scour induced by potential vortices that may form as tides flow from Elkhorn Slough into Parsons Slough.
As shown on Drawing L-2, two rows of seven HP12x84 end bearing piles would be driven through the soft soils to the dense underlying sandy soils to form a foundation for a Adjustable Weir Alternative3 that could be installed within the sill structure. Although not necessary for the
3 A concept of an Adjustable Weir Alternative is described in Appendix D.

SECTIONSECTIONSECTIONSECTIONFOUR Project Description
4-2
Dixon Marine Services
the sill structure, the piles would need to be installed during sill structure construction to preclude the need to remove the rockfill buttress in the future if plans for an adjustable weir were to proceed.
A buoy line and signage warning boaters to stay away from the structure will be installed some distance away from the sill structure on the Elkhorn Slough side.
4.1.1 Compatibility with Future Scenarios
ESNERR Design Criteria 15 as modified (see Appendix A) requires that the sill structure be able to be modified in the future to provide permanent open channel geometry of about 100 feet wide with a top elevation of -10 feet. This can be achieved by removal of the rockfill buttress and H-piles and driving of the central 100 feet of sheetpile down to elevation -10 feet. Such modification would require mobilization of a barge and a barge mounted crane. The cost for such modification is estimated to be in the range of $500,000 to $700,000 in 1st quarter 2010 costs assuming that the rockfill could be regraded on either side of the lowered sheetpile and left on site.
4.1.2 Sea Level Rise
ESNERR Design Criteria 17 and 19 requires that the sill structure be designed to accommodate 1.6 feet (0.5 m) of sea level rise during the design life of 50 years and consider how a total of 6.5 feet (2.0 m) of sea level rise might be accommodated. As described in Section 3, the sill structure is being designed for sea level rise during the next 50 years. Additional sea level rise beyond 1.6 feet could be provided, if needed, by extending the height of the sheetpile and raising the embankment tie-ins to the railroad embankment. If required, the central bay of the base structure could be adjusted for future sea level rise by placing additional rockfill. However, the sill structure design described in this report does not account for the water pressure acting at the top of a structure that would 1.5 m taller. In order to be able to raise the structure in the future for sea level rise beyond 50 years, the final design of the sill structure would need to be modified. Such modification would require longer and heavier sheetpile extending deeper into the foundation.
4.2 STAGING AREA
The two potential staging areas along Elkhorn Slough considered for the 30 percent design are Kirby Park and the Moss Landing Wildlife Area as shown on Drawing T-3. The two staging areas are described in the following paragraphs.
4.2.1 Kirby Park
Kirby Park, which is owned and operated by Moss Landing Harbor District, is located approximately 1.9 miles up Elkhorn Slough from the project site. Access to Kirby Park is by Elkhorn Road, which is a two-lane paved roadway, to Kirby Road, which is a two-lane gravel roadway. Based on our site visits during the week of January 4, 2010, the parking area surface is 4 inches of asphalt and is undergoing significant erosion at the edge of the slough. The existing boat ramp at Kirby Park is located at the southern end of the parking area and there was no dock present at the time of our site visit. Two concrete piles are located in the slough along the south

SECTIONSECTIONSECTIONSECTIONFOUR Project Description
4-3
Dixon Marine Services
side of the ramp. Based on the site visit, a dock extending about 100 feet from shore would be required to reach water that is sufficiently deep for operation of the barges and push boats.
For construction of the sill structure, it is anticipated that the southern two-thirds of the parking area would be fenced off from the northern third for use as the staging area as shown on Drawing T-3. The fence would split the site into a 0.1 acre area for public access and a 0.5 acre staging area. A twenty-foot-wide gate would be installed in the fence for access to the staging area. In order to be used as the staging area for loading of barges, the following improvements would be required:
• Construction of a temporary 10-foot-wide by 40-foot-long floating dock and 10-foot-wide gravel boat ramp for public use in the northern third of the Kirby Park parking area. The temporary dock would be held in place by two temporary H-piles.
• Construction of a pile supported temporary dock about 40-foot-wide by 80-foot-long for use by the crane that would load barges. The temporary dock would likely be I beams and crane mats supported on piles installed on a 10 foot by 10 foot grid. The total of up to 45 piles might be required for the temporary dock.
• Construction of a temporary 100-foot-long by 10-foot-long floating dock for tying off push boats. The temporary dock would be tied to the existing concrete piles near the existing boat ramp.
• Dredging is not anticipated to be required.
• Restoration of Kirby Park after construction may require repaving of the parking area.
Staging from Kirby Park may need to be timed with higher tides given relatively shallow water depths at this location in Elkhorn Slough. Additional bathymetric data from Parsons Slough up to Kirby Park would confirm if there are limitations in the timing of staging of materials from this location. Such a survey should be performed prior to completion of final bid documents so that bidders are informed of the bathymetric conditions in the slough for navigation of the barges.
For the 30 percent design, it has been assumed that Kirby Park will be the location of the staging area.
4.2.2 Moss Landing Wildlife Area
The Moss Landing Wildlife Area, which is owned by California Department of Fish and Game (CDFG), is located approximately 2.5 miles down Elkhorn Slough from the project site. Access to the wildlife area is a driveway off of Highway 1 to a parking area and across a pedestrian bridge to the southwest corner of the southernmost pond. Efforts to permit improvement of access to the ponds by replacing the pedestrian bridge with a culvert crossing are currently underway. Additional minor improvements would be required on the embankment adjacent to Elkhorn Slough so that materials could be loaded onto the barges.
A staging area at this location would offer the benefits of deeper water that would allow a contractor greater flexibility in scheduling the barging of materials to the sill location. The amount of area that can be used for staging at Moss Landing Wildlife Area is limited to about 0.6

SECTIONSECTIONSECTIONSECTIONFOUR Project Description
4-4
Dixon Marine Services
acres. The ingress and egress from Highway 1 for trucks delivering materials to the staging area would be difficult.
Costs for preparation of the staging area might be reduced if access improvements at the Moss Landing Wildlife Area are completed by the time of the Notice to Proceed for construction of the sill structure.

SECTIONSECTIONSECTIONSECTIONFIVE Sill Structure Design Analyses
5-1
Dixon Marine Services
5. Section 5 F IVE Sil l Stru cture D esign An alyses
Engineering analyses for the sill structure included sheetpile analyses, pile analyses, settlement analyses and erosion analyses as discussed in the following paragraphs. In order to not preclude a possible future installation of an adjustable weir, the sill structure was designed assuming the concept adjustable weir described in Appendix D was in place.
5.1 SHEETPILE ANALYSIS
The sheetpile portion of the sill structure is designed to resist the forces caused by differential tide levels and sediment that may accrete behind the structure during the life of the structure. In addition, the sheetpile is designed to withstand loading resulting from the DBE. The sheetpile was designed in accordance with the procedures by FHWA (1984). The sheetpile was checked for two tidal conditions; during maximum flood tide and during the ebb tide when the maximum water surface elevation differential of 5 feet occurs based on the hydraulic modeling discussed in Appendix D. The controlling tidal condition was found to be during the ebb tide when a maximum water surface elevation differential of 5 feet occurs. Dynamic active earth pressure was calculated using the Seed and Whitman (1970) Procedure.
The required length of sheetpile was estimated using the computer code PROSHEET2 as described in Appendix B. Four sections along the structure were analyzed as follows:
• Section 1 - The tallest free standing portion of the wall located to the right or left of the Adjustable Weir Alternative;
• Section 2 - The free standing portion of the wall located in the central bay;
• Section 3 - The free standing portion of the wall near the channel edge; and
• Section 4 - The portion of the wall below the Adjustable Weir Alternative.
The calculated embedment depth and total length of sheetpile required for the controlling tidal conditions are summarized in Table 5-1 for each section of the wall.
Table 5-1 Base Structure Sheetpile Lengths
Sheetpile Section Channel Invert (feet)
Embedment Depth (feet)
Additional Embedment for Factor of Safety (feet)
Top Elevation
(feet)
Total Sheetpile Length (feet)
Sheetpile Pile Length
Used (feet)
1 -9 16.1 8.1 9.6 42.8 43
2 -12 7.2 3.6 -5 17.8 33 (a)
3 -2 10 5 9.6 26.6 27
4 -12 17.4 8.7 -2 36.1 36 (a) The sheetpile length for the center section was increased to match the bottom elevation of the sheetpile under the Adjustable Weir Alternative to reduce the potential for flow under the sheetpile.
PROSHEET2 was also used to estimate the type of sheetpile section required to limit the horizontal deflection to one inch or less during normal operations. A typical sheetpile section

SECTIONSECTIONSECTIONSECTIONFIVE Sill Structure Design Analyses
5-2
Dixon Marine Services
that would meet the criteria is AZ-50. A standard AZ-50 sheetpile weighs 50 pounds per foot of length, is 46 inches wide, and 19 inches deep. Seventy-one pairs of AZ-50 sheetpiles are estimated to be required for the 270-foot-long sill structure. Under seismic loading the horizontal displacement could be up to 2 inches for the largest sheetpile section (Section 1).
5.2 PILE ANALYSIS
As discussed in Appendix D, the Adjustable Weir Alternative portion of the base structure will be primarily supported on two rows of seven HP12x84 end bearing piles driven through the soft soils to the dense underlying sandy soils and secondarily on the single row of sheetpile located between the piles. The axial and lateral capacity of a single HP 12x84 pile was calculated as described in Appendix B. Assuming that the piles are driven 13 feet into the sandy soils, the ultimate axial capacity of each pile will be about 150 kips. This is slightly greater than the compression load transmitted from the Adjustable Weir Alternative to the H-piles during the DBE as shown in the structural calculations in Appendix D. The resulting factors of safety for axial compression of the piles are 5.5 for the case when waves are acting against the structure and the water level differential is 5 feet and 1.1 for the case when the DBE occurs simultaneously with a water level differential across the structure of 5 feet.
5.3 SETTLEMENT ANALYSIS
5.3.1 Settlement at UPRR Bridge MP 103.27
Settlement of the soft sediment upstream of the sill structure could occur due to the accretion of sediment behind the structure increasing the vertical stress. The magnitude of the settlement of the channel invert upstream of the sill structure was estimated using simplified one dimensional settlement analyses as described in Appendix B. Based on the calculation, accretion of 10 feet of sediment up to an elevation of -2 feet will result in about 2 feet of settlement of the channel invert upstream of the structure. Settlement directly adjacent to the structure would be less because sediment would not build up on the downstream side. Actual settlement during the life of the project would depend on the cumulative accretion of the sediment behind the structure.
The design of the sill structure assumes that during the life of the structure sediment may accrete behind the structure up to an elevation of -2 feet. Based on recent bathymetry data between 10 and 17 feet of sedimentation could occur under the bridge. Settlement of the soft soils adjacent to piles can induce downdrag forces on the piles. In the case of the end bearing piles like those supporting the bridge, the pile capacity can be reduced by the downdrag forces. As indicated in Kleinfelder (2002), the capacity of an 18-inch concrete steel pipe pile driven to full end-bearing is much greater (250 tons) than the design load of 112 tons which includes 85 tons for dead-plus-live vertical loads and the effects of downdrag due to settlement of soft sediment and an additional 1/3 increase due to short term wind and seismic effects. The capacity of the 24-inch concrete filled steel pipe piles actually used for construction would be much greater than the 18-inch pipe piles. Therefore, any downdrag forces induced by settlement of the soft soils due to accretion of incremental sediment, which is expected to occur slowly, will not likely impact the bridge foundation.

SECTIONSECTIONSECTIONSECTIONSIX Hydraulic Modeling
6-3
Dixon Marine Services
6. Section 6 SIX H ydraulic Mod el ing
6.1 GENERAL
As described in Section 3.3.2 of the report, the sill structure considered for the 30 percent design consists of a 25-foot-wide deeper center section (elevation -5 feet) and a total of 92 feet of open area (elevation -2 feet) distributed on either side of the center section. A hydraulic analysis was performed to confirm that the sill dimensions would meet the ESNERR Tidal Wetland Working Group hydraulic design criteria (Appendix A).
6.2 ANALYSIS APPROACH
The hydraulic modeling was performed using the United States Army Corps of Engineers (USACE) software, HEC-RAS version 4.0.0. This software was used to perform one-dimensional river hydraulic calculations using unsteady flow. The following sections describe the inputs to the model.
6.2.1 Geometry
The cross-section geometry used in the model was based on a grid generated from the following electronic data sources:
1) Bathymetric data from a multibeam sonar survey of Elkhorn Slough performed in 2005;
2) Topographic data developed from a LiDAR survey performed in April 2004;
3) Bathymetric data from a multibeam sonar survey in Parsons Slough near the project site performed in December 2009.
The bathymetry and topography for the first two sources were provided by Phillip Williams & Associates (PWA, 2009). The third source was collected by Dixon Marine Services for this study. All elevations were provided in feet relative to the North American Vertical Datum of 1988 (NAVD). The cross-sections were developed in ArcGIS version 9.1 using the HEC-GeoRAS version 4.1.1 extension so that they could be imported into HEC-RAS. Elkhorn Slough was modeled from the Pacific Ocean to approximately 900 feet upstream of Parsons Slough, for a total of approximately three miles. Parsons Slough was modeled from the confluence with Elkhorn Slough to approximately 180 feet upstream of the Union Pacific Railroad crossing, for a total of approximately 1,900 feet. The upstream areas of Elkhorn Slough and Parsons Slough were modeled as storage areas. Stage-storage curves were generated for these upstream areas by PWA using the Delft3D model described in their calibration report (PWA, 2007). The stage-storage relationships were used as input for the storage areas in the HEC-RAS model. The model extents and locations of cross-sections are shown in Figure 6-1.
Two bridges were included in the HEC-RAS model. The geometry for the Union Pacific Railroad crossing over Parsons Slough was based on construction plans. The bridge deck is 17 feet wide and is supported by 10 bents with three 24-inch diameter piles each (Kleinfelder, 2002 and UPRR, 2002). The Highway 1 crossing over Elkhorn Slough consisted of a road deck 52 feet wide (based on aerial photography) with four 15-foot-wide pier bents (based on the bathymetry).

SECTIONSECTIONSECTIONSECTIONSIX Hydraulic Modeling
6-4
Dixon Marine Services
6.2.2 Tidal Boundary
The downstream boundary of the model used a stage hydrograph that was comprised of the hourly measured tide at NOAA’s Monterey station (ID 9413450). The preliminary model results were based on the input tide for the 28-day period from 12/9/05 to 1/6/06.
6.2.3 Model Calibration
The water level output from the HEC-RAS model for existing conditions was compared to output from the PWA model for existing conditions at several locations in Elkhorn Slough and Parsons Slough. The locations with water level output from the PWA model are shown on Figure 6-2. The modeled water levels were also compared to measured water depths collected as part of the Monterey Bay Aquarium Research Institute (MBARI) nutrient sensor network. The MBARI data were not referenced to a vertical datum (such as NAVD), so they cannot be compared directly to the model output for calibration efforts. However, they can be used to check the tidal phase and amplitude. Since the PWA model results were found to correspond well to the measured data, the PWA output was used to calibrate the HEC-RAS model.
The bed roughness (Manning’s n) was used as the calibration parameter. Initial model results using a Mannings’s n of 0.04 in the main channels and 0.06 for the overbank areas showed that the water levels in Parsons Slough and the upstream portion of Elkhorn Slough were not falling as fast as they should, and the amplitude was noticeably smaller. Using Manning’s n values of 0.025 in the main channels and 0.04 for the overbank areas improved the calibration. Water level results are shown on Figures 6-3 through 6-5. The discharge through the UPRR bridge for the HEC-RAS output before and after calibration is compared to the PWA output on Figure 6-6. Prior to calibration, the peak ebb flow volumes (shown as positive discharge values) were consistently less than the values calculated by PWA with the Delft3D model. The calibration helped to increase the peak discharges.
6.3 MODEL SCENARIO
Model scenarios were used to check that the hydraulics associated with the sill geometry would meet the following ESNERR Tidal Wetland Working Group hydraulic design criteria (see Appendix A).
• There should be no less than 95% of the current tidal prism.
• There should be no more than 5% reduction in existing tidal range due to the structure alone.
• There should be no net loss of salt marsh.
• There should be no more than a 50% loss of intertidal mudflats.
• The maximum acceptable velocities within the Parsons complex and the exit channel range from 10-15 feet per second.
For the purpose of evaluating the design criteria, the area of intertidal mudflat was assumed to be equivalent to the upstream area of Parsons Slough between mean lower low water (MLLW) and mean high water (MHW). The mean water levels were calculated using water level output for

SECTIONSECTIONSECTIONSECTIONSIX Hydraulic Modeling
6-5
Dixon Marine Services
the 28-day period from 12/9/2005 to 1/6/2006. This period was selected because it included unusually high tides resulting from a low pressure system combined with high spring tides. Tidal datum calculations were performed by Wetlands and Water Resources, Inc. to translate the 28-day-average water levels to the 19-year tidal epoch (WWR, 2010). The corresponding areas in Parsons Slough were determined from the elevation-area-storage relationships that had been provided by PWA from the Delft3D model output (PWA 2009).
The pertinent model parameters were as follows:
• Center opening 25 feet wide;
• Invert of center opening at elevation of -5 feet NAVD;
• Invert of remaining 92 feet of structure at elevation of -2 feet NAVD;
• Top of structure connection to UPRR embankment at elevation of 8 feet NAVD;
• Sill located 70 feet downstream of UPRR bridge centerline.
6.4 RESULTS
Parameters for tidal prism, tidal range, and habitat were calculated for existing conditions and for the proposed project to be able to compare the parameters to the ESNERR design criteria. The model output for the 28-day period from 12/9/05 to 1/6/06 was used for the analysis. Water level output is shown on Figures 6-7a and 6-7b. Figure 6-7a shows the water level variation during the spring/neap tidal cycle, and Figure 6-7b gives a more detailed view of the daily fluctuations.
6.4.1 Tidal Prism
The tidal prism was determined by calculating the volume of water flowing into or out of Parsons Slough each time the flow changed direction. The ebb and flood volumes were determined separately to determine the effect on the largest ebb tides, which currently have the highest velocities. Tidal prism results for the proposed project are adequately represented by the “Most Open” scenario described in Appendix D. The tidal prism criteria were met with the modeled configuration.
6.4.2 Tidal Range
The tidal range was determined from the difference between the values for Mean Higher High Water (MHHW) and Mean Lower Low Water (MLLW). Tidal Range results for the proposed project are adequately represented by the “Most Open” scenario described in Appendix D. The tidal range criteria were met with the modeled configuration.
6.4.3 Water Level Differences Across UPRR
The UPRR alignment divides the Parson Slough complex from Elkhorn Slough. As discussed in Section 2.4.2, when the tide at Monterey reaches an elevation above 6.3 feet MLLW, a portion of the railroad embankment adjacent to the Parsons Complex north of UPRR bridge MP 103.27 begins to be overtopped (Hillman, 2009). The difference in water surface elevations between the

SECTIONSECTIONSECTIONSECTIONSIX Hydraulic Modeling
6-6
Dixon Marine Services
upstream portion of Elkhorn Slough and the upstream portion of Parsons Slough were compared to the tide level in Elkhorn Slough for the modeled scenarios and existing conditions on Figure 6-8. Table 6-1 summarizes the maximum stage differences determined for the modeled scenarios when the tide in Elkhorn Slough is at least 6 feet NAVD.
Table 6-1 Maximum Difference in Stage Across UPRR at High Tide in Elkhorn Slough
Modeled Scenario Maximum Stage Difference when tide in
Elkhorn Slough is at least 6 feet NAVD (feet)
Existing Conditions 0.1
Sill Structure Modeled Configuration 0.3
As shown in Table 6-1 and on Figure 6-8, the modeled sill structure configuration will slightly increase the maximum stage difference from 0.1 feet to 0.3 feet.
6.4.4 Habitat
The areas of intertidal mudflat and salt marsh were estimated for existing conditions and for the model scenarios. Habitat areas were calculated using the elevation-area-storage relationships for the upstream Parsons Slough complex. It was assumed that the area below MLLW would be classified as subtidal, the intertidal mudflat would include the area between MLLW and MHW, and the salt marsh would include the rest of the Parsons Slough complex above MHW. It was assumed that the entire area of the Parsons Slough complex was 440 acres, which is consistent with the total area specified in the ESNERR design criteria. However, since the classifications were based on the areas at specific tidal datums to be able to compare habitat areas, the areas of salt marsh and intertidal mudflat for existing conditions varied slightly from the areas specified in the ESNERR design criteria. Habitat results for the proposed project are adequately represented by the “Most Open” scenario described in Appendix D. Table D.3-3 shows the calculated areas and shows that the design criteria were met with the open sill.
6.4.5 Velocities
Peak velocities at the sill exceeded 10 feet per second (ft/s) during spring ebb tides for the modeled configuration. The velocities across the sill are shown for a spring tide on Figure 6-9. The maximum velocity through the center section was less than 12 ft/s, and the maximum velocity outside of the center section was nearly 10 ft/s. The ESNERR design criteria for velocities over the sill are for maximum velocities between 10 and 15 ft/s. Therefore, the criteria should be met with the modeled configuration. Impacts associated with the increased velocities, and associated design consideration as necessary, are discussed in Section 6.4.6.

SECTIONSECTIONSECTIONSECTIONSIX Hydraulic Modeling
6-7
Dixon Marine Services
6.4.6 Potential Scour and Erosion
Operation of the sill will decrease average flows upstream in Parsons Slough due to the constriction in cross-sectional area. However, the design of the sill with the notch in the center will concentrate flows near the center of the channel. The velocities in the concentrated portion of the flow will exceed the velocities under existing conditions and, to the extent the “jet” comes in contact with either the shoreline or the railroad bridge piers, could result in increased erosion.
Average channel velocities were calculated by the HEC-RAS model for the scenarios discussed above. For the modeled configuration, flow extends across the entire channel but mostly above elevation -2.0 NAVD88. Figures 6-10 and 6-11 compare the average channel velocities at a location 150 feet northwest of the sill structure and just down estuary of the UPPR railroad bridge (approximately 40 feet east of the sill structure). Figures 6-10a and 6-11a show results over the full spring/neap tidal cycle, and Figure 6-10b and 6-11b show the daily variation in more detail. As shown in the figures, the sill structure results in a significant decrease in average channel velocity at both locations.
Although the average channel velocities will decrease due to the sill structure, there will be locations within the channel where the velocity will be greater after construction of the sill structure than they were under existing conditions. The locations of the increased velocity will be within the “jet” formed by flow going through the notch. Figure 6-9 showed velocities at the sill structure. At the structure the velocities could exceed 10 feet per second. This is sufficient to cause scour or erosion if the jet were to contact soil. For the case of a non-buoyant jet discharging into a water body after about a distance on the order of the width of the notch, the maximum velocity in the jet will start to decrease (Fisher et al., 1979). It will continue to decrease in value until it reaches the background or average channel velocity. The rate of decrease will be on the order the square root of the ratio of the depth of water in the notch to distance from the notch (Fisher et al 1979). The nearest marsh shoreline is located due west of the sill structure about 180 feet. The velocity due to the structure will likely not reach ambient before this distance, however, by the time the jet reaches the shoreline, the maximum velocity should be significantly lower than at the sill structure, on the order of 1/3 of the velocity. This would result in a maximum velocity at the shoreline of about 3-5 ft/s. A velocity of this magnitude could cause erosion of an unprotected and unvegetated shoreline. If there is vegetation on the shoreline, erosion should be minimal. In addition, the current in the channel is turning away from the bank towards the north reducing the erosion potential of the velocity. The post-30% detailed design should consider planting along the shoreline to fill in any exposed bank areas in the vicinity.
The railroad bridge is located about 50 feet from the sill structure. The jet discharging through the structure towards the railroad bridge will have a high surface velocity and near zero velocity along the bottom. As the distance from the structure increases, the velocity profile will become more uniform. Figure 6-12 provides an approximation of the vertical velocity profile near the railroad bridge. As shown, the velocity near the channel bottom will be close to 1 ft/s when the velocity near the surface is around 12 ft/s. Scour at the bridge piers will be due to velocities closer to the bottom of the channel than those near the surface. That is, the scour at the bridge piers will be representative of velocities on the order of 2 to 4 ft/s rather than the greater than 10 ft/s velocities seen in and near the openings in the structure. Although unlikely based on these

SECTIONSECTIONSECTIONSECTIONSIX Hydraulic Modeling
6-8
Dixon Marine Services
preliminary estimates, post-30% design should include a detailed pier scour analysis to determine the need for pier scour protection.

SECTIONSECTIONSECTIONSECTIONSEVEN30 Percent Design Construction Schedule and Cost Estimate
7-1
Dixon Marine Services
7. Section 7 SEVEN 30 Percent D esign Construction Sch edule and Co st Es timat e
7.1 CONSTRUCTABILITY
Access for construction of the sill structure would be from the water. Construction would be from barges made up of flexi-floats assembled inside Elkhorn Slough at the Kirby Park or Moss Landing Wildlife Area staging areas discussed in Section 4. The size of barge used for the work could be on the order of 40-ft wide by 60 to 80-foot long, set up to support a 90-ton crane with a least a 2 cubic yard (cy) bucket. These types of cranes can typically place material about 60 feet from center of pin, which would be around 50 feet from the edge of the barge. The barge would need about 3-4 feet of water depth to float. Barges used to haul earth and rockfill materials to the project site would be of a similar size. The barge and crane set up and used for placement of fill could also be used for driving sheetpile and H piles. Sheetpile and H piles would be driven starting with a vibratory hammer to set the piles, but may require an impact hammer to complete driving.
Tidal velocities within Parsons Slough will be a significant factor in production rates for driving the sheetpile and H piles. These activities will likely need to be performed during near slack tide periods when flow velocities are on the order of 2 feet per second or less. An analysis for such periods during the 7 month period from May 2010 through November 2010 indicates that every other week there are periods of time greater than 4 hours each day when the average velocity in Parson Slough could be less than 2 feet per second.
7.2 CONSTRUCTION SCHEDULE
The construction duration for the 30 percent design was estimated for planning purposes. The duration of construction required for the various project elements was based on experience during other projects and, where applicable, on the estimates used to develop construction costs. Factors that would affect the actual duration of the project include the timing of Notice to Proceed (NTP), the start of construction, tide conditions, adverse weather, and site environmental constraints.
The general approach of the construction sequencing would be as follows:
• Mobilize, prepare staging area at Kirby Park, assemble barges, and prepare project site. Preparation will include installing temporary mooring piles at each location.
• Construct embankment tie-ins and drive sheetpile from ends to the edge of the channel. This work will require the presence of a UPRR flagman where it occurs within 25 feet of the centerline of the tracks.
• Drive H-piles in the channel.
• Drive sheetpile in the channel starting at the edges and working towards the center.
• Place rockfill and erosion protection.
• Remove temporary facilities and restore staging area.
Two construction schedules were prepared that reflect a low range and high range project duration based on the uncertainties associated with the work in Parsons Slough. Assumptions made in estimating the construction durations for the 30 percent design include:

SECTIONSECTIONSECTIONSECTIONSEVEN30 Percent Design Construction Schedule and Cost Estimate
7-2
Dixon Marine Services
• One shift per day working up to 12 hours a day and up to 6 days per week. The timing of the shift each day would be adjusted to take the greatest advantage of the tide cycle.
• H pile production of between 2 and 3 piles per day.
• Sheetpile production of between 580 and 750 square feet per day.
• Fill placement of 145 and 200 cubic yards per day..
Based on these assumptions, the estimated duration of construction would be about 11 to 15 weeks as shown on Figures 7-1 and 7-2.
7.3 CONSTRUCTION COST ESTIMATE
The construction cost estimate is a Class 3 estimate as described by the Association for the Advancement of Cost Engineering (AACE, 2005) as follows:
“Class 3 estimates are generally prepared to support full project funding requests, and become the first of the project phase “control estimates” against which all actual costs and resources will be monitored for variations to the budget. They are typically used for forming the basis of budget authorization, appropriation, and/or funding. Typical engineering is from 10% to 40% complete. The expected range of accuracy for this class estimate is –10% to –20% on the low side and +10% to +30% on the high side.”
The construction cost estimate was prepared for the sill structure based on the 30 percent design drawings. Quantities were measured manually from the drawings or within the AutoCAD Land Development Desktop (LDD) software utilized in preparation of the drawings. Earthwork quantities were checked using end area methods. Unit cost ranges were developed based on a combination of previous, similar project experience, the buildup of crews and equipment, the R.S. Means estimate guide, and vendor quotes. The estimated low and high range construction cost estimated for the sill structure in 1st quarter 2010 dollars is $1,700,000 to $2,340,000. The 30 percent construction cost estimates are included in this technical memorandum as Appendix C. The estimated construction cost does not include hazmat abatement, if any, legal feed and finance costs, permit and plan check fees, cost escalation, soft costs including fees for design and engineering, construction and project management and other consulting costs or environmental costs.

SECTIONSECTIONSECTIONSECTIONEIGHT Operation and Maintenance
8-1
Dixon Marine Services
8. Section 8 EIGHT Operation and Mainten an ce
8.1 MAINTENANCE
Maintenance of the sill structure will require minimal routine activities. Routine maintenance of the sill structure will require the following activities:
• Inspection of the structure and
• Removal of debris.
8.1.1 Inspection of the Sill Structure
The sill structure should be inspected on a quarterly basis and after extreme events such as extreme tide or flood events and after significant earthquake events. Inspections should be conducted by a two-person crew. Quarterly inspections would include observing the structure for the following:
• Debris obstructing the opening in the structure;
• Erosion damage to the embankment tie-ins or the channel banks upstream and downstream of the structure; and
• Observation of settlement of rockfill buttress with respect to the sheetpile and H-piles. Observations of settlement could be performed annually.
8.1.2 Debris Removal
Debris that accumulates within the structure opening could be removed using poles and accessed from a boat during tidal periods when both tidal changes and the differential tidal elevation on either side of the sill structure are relatively small.

SECTIONSECTIONSECTIONSECTIONNINE Future Design Considerations
9-1
Dixon Marine Services
9. Section 9 N INE Future D esign Co nsideration s
Future design phases would include additional detailed design addressing unresolved technical, design or construction issues, value engineering and development of the technical specifications for the sill structure. Each of these considerations is discussed in the following paragraphs.
9.1 UNRESOLVED TECHNICAL, DESIGN OR CONSTRUCTION ISSUES
Unresolved technical, design or construction issues include the following:
• Optimization of the geometry and alignment of the sill structure;
• Detailed scour analysis at UPRR bridge using HEC-18;
• Sizing and type of erosion protection;
• Coordination with owner of fiber-optic line on upstream side of UPRR bridge;
• Receipt of approval of design from UPRR;
• Development of construction documents.
9.2 VALUE ENGINEERING
Potential areas for value engineering during future design phases include the following:
• Refining the effort required for developing the staging area.
• Consider reducing size of rockfill buttress for sill structure. Would result in some waterfall flow over the sill.
9.3 DEVELOPMENT OF TECHNICAL SPECIFICATIONS
Technical specifications for the project would be developed during future design phases. The likely technical specifications that would required are listed in Table 9-1.
Table 9-1 Potential List of Technical Specifications
Specification Description of Specification
02110 - Site Preparation Requirement for preparing site for placement of Earthfill (clearing and grubbing).
02200 - Earthwork Requirements materials and placement of earthfill, rockfill and riprap.
02460 - Steel H-Piles Requirements for materials and driving of H-piles.
02464 - Steel Sheetpiles Requirements for materials and driving of sheetpiles.
Division 1 specifications will also need to be developed for the project. Division 1 specifies the general requirements under which the contractor would have to perform the work. Division 1

SECTIONSECTIONSECTIONSECTIONNINE Future Design Considerations
9-2
Dixon Marine Services
specifications typically include provisions regarding measurement and payment provisions, access to the site, project management and coordination, coordination with UPRR, surveying, project meetings, submittals, development and restoration of staging areas, environmental protection, temporary facilities, record drawings and project closeout.

SECTIONSECTIONSECTIONSECTIONTEN Limitations
10-1
10. Section 10 T EN Limit ations
The design presented herein represents the preliminary (30 percent design level) design of the sill structure. It is not intended as a final design nor should this design be used to construct the sill structure. The engineering analyses, 30 percent design and engineer’s opinion of construction schedule and cost herein were performed for 30 percent design presentation only. The discussions of subsurface conditions provided in this design report are based on subsurface soil conditions at limited exploration locations as reported by others. Variations in subsurface conditions may exist between exploration locations. Information presented in this design report should not be used for any purpose outside those indicated above. This design report is for the use and benefit of the Elkhorn Slough Foundation. Use by any other parties is at their own discretion and risk.
The Ducks Unlimited, URS Corporation and Dixon Marine Services team represents that the services were conducted in a manner consistent with the standard of care ordinarily applied as the state of practice in the profession within the limits prescribed by our client. Standard of care is defined as the ordinary diligence exercised by fellow practitioners in this area performing the same services under similar circumstances during the same period. No other warranties, either expressed or implied, are included or intended in this technical memorandum.
SECTIONSECTIONSECTIONSECTIONELEVEN References
11-1
11. Section 11 ELEVEN Referen ces
American Institute of Steel Construction Inc. (AISC) (2005). Steel Construction Manual, 13th
Edition.
Association for the Advancement of Cost Engineering International (AACE) (2005). Recommended Practice No. 18R-97, Cost Estimate Classification System, February.
Computers and Structures (CSI) (2009). SAP2000 Section Designer, v.14.1.0. Berkeley, CA.
FHWA (1984). Steel Sheetpiling Design Manual, July.
Fisher, Hugo B., E. John List, Rober C.Y. Koh, Jorg Imberger, and Norman H. Brooks. (1979) Mixing in Inland and Coastal Waters. Academic Press. New York, New York.
Hillman, Dewayne, Manager of Track Maintenance for Engineering Western Region UPRR (2009). phone interview with Brian Largay, ESNERR. December 29.
Kleinfelder (2002). Geotechnical Engineering Investigation for Union Pacific Railroad Bridge (103.27 Coast) Replacement Project at Parsons Slough in Monterey County, California, January 23.
Legnard, Steve (2009). ESNEER, phone interview with Sadie McEvoy, URS, Dec.
Moffat and Nichol (2008a). Draft Report of Existing Conditions for the Parsons Slough Complex Wetland Restoration Plan, prepared for the California State Coastal Conservancy and Elkhorn Slough National Estuarine Research Reserve, November 24.
Moffat and Nichol (2008b). Draft Report of Analysis of Restoration Alternatives for the Parsons Complex, prepared for the California State Coastal Conservancy and Elkhorn Slough National Estuarine Research Reserve, November 24.
Phillip Williams & Associates (PWA). (2009). Elkhorn Slough bathymetry and existing conditions model output, memorandum to Bryan Largay, Elkhorn Slough Foundation, from Matt Brennan, PWA, with attached files: <Elkhorn Slough bathy.mxd>, <04lidarbathy>, <Parsons Slough stage-storage.xls>, <Upper Elkhorn Slough stage-storage.xls>, <Validation 2005 water level.xls>, and <Validation 2005 instantaneous discharge.xls>, November 16.
Philip Williams & Associates (PWA). (2007). Elkhorn Slough Tidal Wetland Project, Hydrodynamic Modeling Calibration Report, Final Report. May 14, 2007.
Union Pacific Railroad (UPRR). (2002). General Arrangement for 11 Span 14” P/S Conc. Slab Girder Replacing 9 Span 150’ TPTBD. August 26.
URS Corporation (2009). Task 2.3 Evaluate Alternatives, Parson Slough Sill Project, December 18.
U.S. Army Corps of Engineers (USACE) (1995). Engineering and Design: Design of Coast Revetments, Seawalls, and Bulkheads. EM 1110-2-1614, June.
U.S. Army Corps of Engineers (USACE) (1993). Engineering and Design: Design of Hydraulic Steel Structures. EM 1110-2-2105, March.
U.S. Army Corps of Engineers (USACE) (1989). Engineering and Design: Retaining and Flood Walls. EM 1110-2-2502, September.

SECTIONSECTIONSECTIONSECTIONELEVEN References
11-2
U.S. Army Corps of Engineers (USACE) (2000). Engineering and design: design and construction of levees. Proponent: CECW-EG, EM 1110-2-1913, April.
U.S. Army Corps of Engineers (USACE) (2005). Engineering and Design: Stability Analysis of Concrete Structures. EM 1110-2-2100, December.
Wetlands and Water Resources, Inc. (WWR). (2010). Tidal Datum Reckoning, Parsons Slough Sill Project, Modeled Sill Operational and Existing Conditions Scenarios, memorandum to Bryan Largay, Elkhorn Slough Foundation, from Stuart Siegel, WWR, March 1.
Wright, S. (1999). “A Computer Program for Slope Stability Calculations.” Technical Manuals for UTEXAS4, May 1999, Revised September 1999, Shinoak Software, Austin, Texas.

FIGURES

MontereyBay
Elkhorn SloughUn
ion Pa
cific
RR
North Azevedo Pond
Project location
Moss Landing
1
URS C
orp - O
aklan
d CA -
B.Ja
cobs
enL:\
Proje
cts\P
arson
s_Slo
ugh\M
aps\F
ig_01
_1_P
rojec
t_vici
nity.m
xd - 1
1/13/2
009 @
12:22
:56 P
M
0 10.5MILES
Imagery source:DigitalGlobe ImageConnect Service, 6/1/2009
Maparea
PACIFICOCEAN 101
Salinas
Stockton
San Jose
Santa Cruz
San Francisco
Figure1-1Parsons Slough
Sill ProjectINC.UNLIMITEDDUCKS
WESTERN REGIONAL OFFICE
Project no. 26817594
Project location

Ele
vatio
n (F
t.) (
NA
VD
88)
Milepost (MP)
PROFILE OF UPRR EMBANKMENTFROM MP 103.31 TO 102.74
FIGURE2-1
-20.0
-15.0
-10.0
-5.0
0.0
5.0
10.0
102.74102.84102.94103.04103.14103.24

FIGURE 6-1 HEC-RAS Model Schematic

FIGURE
6-2 Locations of Water Level Output
from PWA Delft3D Model
Figure source: PWA 2009

FIGURE 6-3
December 2005 Water Levels, HEC-RAS and Delft3D Output at PWA Station 2, Downstream Reach of
Elkhorn Slough
-2
-1
0
1
2
3
4
5
6
7
8
12/16/2005 0:00 12/17/2005 0:00 12/18/2005 0:00 12/19/2005 0:00 12/20/2005 0:00 12/21/2005 0:00
Date/Time Local Standard Time
Elev
atio
n (ft
, NA
VD)
NOAA Tide at MontereyCalibrated HEC-RAS OutputDELFT3D Output from PWA

FIGURE 6-4
December 2005 Water Levels, HEC-RAS and Delft3D Output at PWA Station 4, Parsons Slough
Downstream of UPRR
-2
-1
0
1
2
3
4
5
6
7
8
12/16/2005 0:00 12/17/2005 0:00 12/18/2005 0:00 12/19/2005 0:00 12/20/2005 0:00 12/21/2005 0:00
Date/Time Local Standard Time
Elev
atio
n (ft
, NA
VD)
NOAA Tide at MontereyCalibrated HEC-RAS OutputDELFT3D Output from PWA
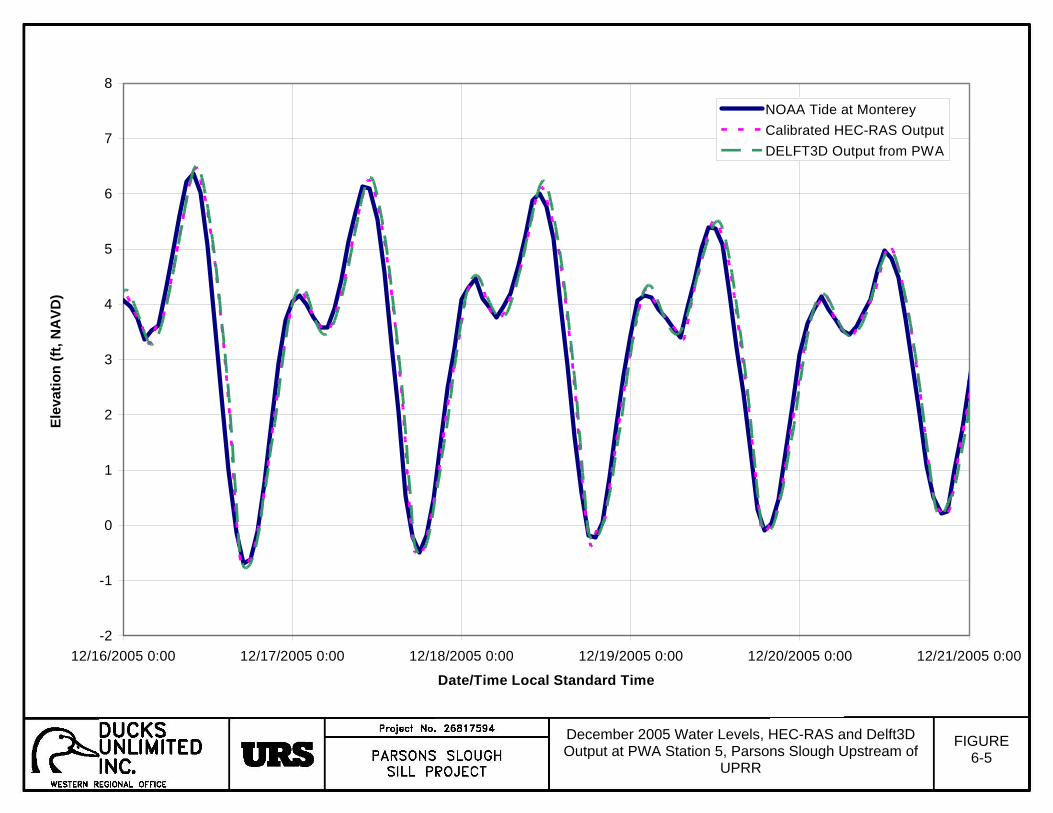
FIGURE 6-5
December 2005 Water Levels, HEC-RAS and Delft3D Output at PWA Station 5, Parsons Slough Upstream of
UPRR
-2
-1
0
1
2
3
4
5
6
7
8
12/16/2005 0:00 12/17/2005 0:00 12/18/2005 0:00 12/19/2005 0:00 12/20/2005 0:00 12/21/2005 0:00
Date/Time Local Standard Time
Elev
atio
n (ft
, NA
VD)
NOAA Tide at MontereyCalibrated HEC-RAS OutputDELFT3D Output from PWA

FIGURE 6-6
December 2005 Discharge, HEC-RAS and Delft3D Output at UPRR Bridge
-5000
-4000
-3000
-2000
-1000
0
1000
2000
3000
4000
5000
6000
7000
12/16/2005 0:00 12/17/2005 0:00 12/18/2005 0:00 12/19/2005 0:00 12/20/2005 0:00 12/21/2005 0:00
Date/Time Local Standard Time
Dis
char
ge (c
fs),
Posi
tive
Flow
for E
bb T
ide
Calibrated HEC-RAS OutputDELFT3D Output from PWA
FIGURE 6-7a
Water Levels in Parsons Slough Upstream of UPRR for Existing and Proposed Conditions
(showing spring/neap cycle)
-2
-1
0
1
2
3
4
5
6
7
8
12/18/20050:00
12/20/20050:00
12/22/20050:00
12/24/20050:00
12/26/20050:00
12/28/20050:00
12/30/20050:00
1/1/20060:00
1/3/20060:00
1/5/20060:00
1/7/20060:00
Date/Time Local Standard Time
Elev
atio
n (fe
et, N
AVD
)
Existing Conditions
Proposed Sill

FIGURE 6-7b
Water Levels in Parsons Slough Upstream of UPRR for Existing and Proposed Conditions
(showing daily variation)
-2
-1
0
1
2
3
4
5
6
7
8
12/26/2005 0:00 12/27/2005 0:00 12/28/2005 0:00 12/29/2005 0:00 12/30/2005 0:00 12/31/2005 0:00 1/1/2006 0:00 1/2/2006 0:00
Date/Time Local Standard Time
Elev
atio
n (fe
et, N
AVD
)
Existing Conditions
Proposed Sill

FIGURE 6-8
Difference in Stage across UPRR versus Stage in Elkhorn Slough, from 10-minute HEC-RAS output from 12/6/05 to 1/6/06 for Existing and Proposed Conditions
-6
-5
-4
-3
-2
-1
0
1
2
3
-2 -1 0 1 2 3 4 5 6 7 8
Stage in Elkhorn Slough (feet, NAVD)
Diff
eren
ce in
Sta
ge (u
pstr
eam
Elk
horn
Slo
ugh
min
us u
pstr
eam
Par
sons
Sl
ough
) (fe
et)
Proposed Sill
Existing Conditions
UPRR Flood Monitor Stage at 6.3 feet MLLW = 6.44 feet NAVD

FIGURE 6-9
Velocity Across Proposed Sill in Parsons Slough During a Spring Tide
-20
-15
-10
-5
0
5
10
15
20
25
30
12/28/20050:00
12/28/200512:00
12/29/20050:00
12/29/200512:00
12/30/20050:00
12/30/200512:00
12/31/20050:00
12/31/200512:00
1/1/20060:00
1/1/200612:00
1/2/20060:00
Date/Time Local Standard Time
Velo
city
(Pos
itive
= e
bb, N
egat
ive
= Fl
ood)
(ft/s
)
-2
-1
0
1
2
3
4
5
6
7
8
Elev
atio
n (ft
, NA
VD)
Velocity through outer sections with invert at -2 ft NAVD (ft/s)
Velocity through center section with invert at -5 ft NAVD (ft/s)
NOAA Tide at Monterey (ft, NAVD)

FIGURE 6-10a
Velocity in Parsons Slough about 150 feet Northwest of Sill Structure for Existing and Proposed Conditions
(showing spring/neap cycle)
-3
-2
-1
0
1
2
3
4
12/10/05 12/12/05 12/14/05 12/16/05 12/18/05 12/20/05 12/22/05 12/24/05 12/26/05 12/28/05 12/30/05 1/1/06 1/3/06 1/5/06 1/7/06
Date
Ave
rage
Cha
nnel
Vel
ocity
(Pos
itive
= e
bb) (
ft/s)
Existing Proposed Sill
`

FIGURE 6-10b
Velocity in Parsons Slough about 150 feet Northwest of Sill Structure for Existing and Proposed Conditions
(showing daily variation)
-3
-2
-1
0
1
2
3
4
12/26/05 0:00 12/27/05 0:00 12/28/05 0:00 12/29/05 0:00 12/30/05 0:00 12/31/05 0:00 1/1/06 0:00 1/2/06 0:00
Date
Ave
rage
Cha
nnel
Vel
ocity
(Pos
itive
= e
bb) (
ft/s)
Existing Proposed Sill
`

FIGURE 6-11a
Velocity in Parsons Slough about 10 feet Downstream of Railroad Bridge for Existing and Proposed
Conditions (showing spring/neap cycle)
-4
-3
-2
-1
0
1
2
3
4
5
6
12/10/05 12/12/05 12/14/05 12/16/05 12/18/05 12/20/05 12/22/05 12/24/05 12/26/05 12/28/05 12/30/05 1/1/06 1/3/06 1/5/06 1/7/06
Date
Ave
rage
Cha
nnel
Vel
ocity
(Pos
itive
= e
bb) (
ft/s)
Existing Proposed Sill
`

FIGURE 6-11b
Velocity in Parsons Slough about 10 feet Downstream of Railroad Bridge for Existing and Proposed
Conditions (showing daily variability)
-4
-3
-2
-1
0
1
2
3
4
5
6
12/26/05 0:00 12/27/05 0:00 12/28/05 0:00 12/29/05 0:00 12/30/05 0:00 12/31/05 0:00 1/1/06 0:00 1/2/06 0:00
Date
Ave
rage
Cha
nnel
Vel
ocity
(Pos
itive
= e
bb) (
ft/s)
Existing Proposed Sill
`

FIGURE 6-12
Approximate Velocity Profile at UPRR Bridge for Sill Velocity of 12 ft/s
0
2
4
6
8
10
12
14
0 2 4 6 8 10 12 14
Velocity (ft/s)
Dep
th (f
t)

FIGURE 7-1
Low Range Estimated Construction Schedule for 30 Percent Design

FIGURE 7-2
High Range Estimated Construction Schedule for 30 Percent Design

DRAWINGS


Appendix A
ESNERR Design Criteria for Engineers 12/17/09

Appendix A ESNERR Design Criteria for Engineers 12/17/09
A-1
# ESNERR Design Criteria ESNERR Goal Incorporation Into 30 Percent Design
1 At the most restrictive setting, the resultant tidal prism of the Parsons complex should be between 60% and 80% of the current tidal prism. At the most open setting, there should be no less than 95% of the current tidal prism. (These numbers refer to tidal prism conditions resulting directly from the structure; in the future sediment addition projects might decrease the tidal prism of the complex further through replacement of subtidal channels and mudflats with marsh habitat.)
The ESNERR goal in decreasing the tidal prism is to affect a decrease in tidal velocities and tidal scour in the main channel, so at least a reduction to 80% of today’s prism is required. However, ESNERR does not want a structure that can reduce the prism below 60% of today’s prism, out concerns that such a structure might be used inappropriately in the future to manage for non-estuarine functions. ESNERR wants to ensure that water quality and biodiversity can be protected by allowing reversibility in tidal prism, to 95% of current conditions.
As discussed in Appendix D of this report, operation of the sill structure would result in the following percentage of the current tidal prism:
99% when fully open
69% when fully restricted
2 The structure will inevitably change the distribution of habitat. However, no more than 55% of the Parsons area (excluding Whistlestop) should consist of subtidal habitat (no more than 242 acres of the 440 acre total), no less than 40% of the habitat area should consist of intertidal mudflat (no less than 174.4 acres), and no less than 5.2% should consist of salt marsh (no less than 22 acres).
The ESNERR goal in setting habitat conversion constraints is to ensure that there is adequate diversity of habitat available. The numbers were chosen so that there would be no net loss of salt marsh, and no more than a 50% loss of intertidal mudflats important for shorebirds.
As discussed in Appendix D of this report, operation of the sill structure would result in the following estimated habitat conversion:
18 to 61% subtidal habitat
34 to 77% intertidal mudflat
5 to 6% salt marsh
3 At the most restrictive setting, there should be no more than 50% reduction in existing tidal range due to the structure alone. At the most open setting, there should be no more than 5% reduction in existing tidal range due to the
The ESNERR goal in setting boundaries on tidal range reduction is to minimize risk to water quality with an emphasis on dissolved oxygen or hypoxia (<2.3 mg/L) events, which are currently <5% of the time. ESNERR wants to ensure that
As discussed in Appendix D of this report, operation of the sill structure would result in the following percentage reduction in tidal range:
4% when fully open

Appendix A ESNERR Design Criteria for Engineers 12/17/09
A-2
structure alone. tidal range is never artificially restricted far beyond what was natural at Elkhorn or is typical at other similar California estuaries, and aims to support estuarine diversity which has been shown to require substantial tidal range.
50% when fully restricted
4 The maximum acceptable velocities within the Parsons complex and the exit channel range from 10-15 ft./sec, assuming that water is crossing the sill at some depth and creates a “white-water cascade” rather than a waterfall.
The ESNERR goal in setting maximum allowable tidal velocities over the sill is to prevent injury to marine mammals and fish species likely to move across the sill and to maintain connectivity between populations within and outside the sill structure. Plunging flow from a waterfall is understood to produce more hazardous conditions for fish and wildlife than cascading flow. Precautions should be taken, however, to ensure that fish and wildlife transported over the weir are not at risk of injury by impacting elements of the hard structure.
As discussed in Appendix D of this report, operation of the sill structure would result in the following maximum velocities at the sill:
12 ft/sec when fully open
14 ft/sec when fully restricted
Cascading flow would be expected to occur in the notched section of the sill. Waterfall or cascade conditions may occur in the adjustable weir section, depending on the number of flashboards in place.
5 Marsh habitat should be regularly inundated, somewhere between 2-13% of the time.
The ESNERR goal in setting a range of inundation for the marsh is to ensure that marsh habitats are inundated at a frequency and duration typical for representative estuarine plants and animals. ESNERR wants to ensure that marsh habitats in Parsons Slough receive the spring tides that maintain vigor and diversity.
Operation of the sill structure would result in regular inundation of the marsh habitat as summarized in Table B.3-3.
6 Design should avoid creating a tidal regime that results in periodic large shifts in mean water level (>10 cm) which may last for weeks at a time. (This refers to within a period without adjustments; mean water level may change 10 cm or more following major adjustment of the
Tidal regimes with large changes in mean water levels such as observed at North Marsh have been associated with mosquito breeding events and die-offs in the estuarine benthos, including native oyster populations.
Due to the limited tidal series modeled at this time, the 30% design does not address this issue.

Appendix A ESNERR Design Criteria for Engineers 12/17/09
A-3
structure.)
Maintenance Activities – These criteria pertain to maintenance activities to keep the structure functioning properly.
7 The structure will be designed to function with minimal maintenance for at least 30 years, with a lifespan of at least 50 years.
No additional goals or rationale. The steel structure discussed in Appendix D will function with minimal maintenance for 30 plus years. Some wooden flashboards may require replacement after 20 years.
8 Structure will be designed so that frequent adjustments will not be necessary for normal functioning. However, it should be possible to rapidly open the structure up from a fairly restrictive setting under emergency conditions (fish kill, etc.); i.e., this should not require months of lead time to hire specialized contractors or to garner substantial additional funds.
In the first years, planned adjustments might be made as frequently as every 6 months, and emergency adjustments (to stop hypoxia/fish kill events) might need to be made within weeks. However the optimal configuration has been determined, the hope is that adjustments will rarely or never need to be made.
Flashboard removal from the adjustable weir discussed in Appendix D would not require months of lead time or specialized contractors. It is estimated that rapid opening of the structure from the most restricted setting would require2 days assuming that 4 to 6 personnel were removing flashboards at the same time. If some of the adjustable bays contain frame mounted tide gates, any closed gates could be opened during slack periods or ebb tide.
9 The structure should require no more than two internal staff to perform routine (16 hrs/month total staff time or less) maintenance.
Once the current grant is finished, limited staff time is available for regular maintenance.
Routine maintenance will consist of visually observing the structure for debris, removal of such debris, and an annual removal of biofoul.
10 The structure should require no more than $3,000 per year for routine maintenance.
ESNERR budgets are limited. Material costs for routine maintenance should be minimal.
11 Medium-scale maintenance activities should occur no more than every 3 to 5 years and cost no more than $5,000 (including the cost for hiring contractors, if needed).
ESNERR budgets are limited. Refer to Appendix D.
12 The structure should be reliably and regularly accessible. The design may include a stable platform to dock a boat to.
Access for maintenance should be safe and easy. Access to the adjustable weir in Appendix D would have to be from downstream by boat. The structure would have tie-ups adjacent to a ladder on each side to access the working platform. It is

Appendix A ESNERR Design Criteria for Engineers 12/17/09
A-4
recommended that the structure be approached and adjustments be made when flow across the sill structure is slack or when tidal flows are moving out of Parsons Slough into Elkhorn Slough. Making adjustments when tidal flows are moving from Elkhorn Slough into Parson Slough would be more dangerous as they will tend to drive the boat into the sill structure.
13 Design should minimize biofouling and debris obstruction, or allow for regular, simple maintenance to address those potential problems.
Mussels, barnacles, algae, sponges, tunicates, and bryozoans rapidly colonize submerged substrates.
Flashboard rails in the adjustable weir discussed in Appendix D would require annual or more frequent removal of biofoul from the guide rails and boards.
Adjustment Activities – The following criterion pertains to the infrequent (less than annual) adjustments needed for the adaptive management process.
14 Adjustments (i.e. changes from fairly open to fairly restricted setting) should cost no more than $5,000 in equipment and contractors, and should be able to be accomplished with existing Reserve staff and equipment or easily rented/operated equipment.
Ideally, even major adjustments to the structure could be conducted with regular internal funding, but if necessary, outside funds may need to be sought for major adjustments. If so, this will take substantial lead time
Adjustments of the adjustable weir discussed in Appendix D involving the removing or placement of flashboards or opening or closing of frame mounted tide gates should be feasible for Reserve staff at minimal cost.
Compatibility with future scenarios – these criteria ensure that the structure is compatible with future scenarios.
15 Permanent cross section area must not be smaller than 156 m2 for a 2.1 m water level (relative to Mean Lower Low Water (MLLW). For instance, a 30 m wide channel should have a permanent elevation no higher than -3.7 meters (relative to MLLW).
The sill should allow a cross-sectional area similar to the historical one to be achieved at a future point, without major destructive changes; it should be compatible with restoration of historical salt marshes and channel bathymetry. The permanent structure height should correspond to the width of the opening under Parson’s. Since a major restoration project requiring the sill to be open to this level is
See 12/17/09 Clarification of Previous Criteria below.

Appendix A ESNERR Design Criteria for Engineers 12/17/09
A-5
probably decades away, the design of the sill could incorporate this option with the assumption that removable elements that would be anticipated to be removed only once, if at all, potentially at substantial cost ($50,000-$100,000). This would be funded later as a part of the restoration project.
The structure should be flexible enough to allow for future restoration projects. Specifically, the structure should have a maximum permanent height -3.7 meters below MLLW in order to allow the potential restoration of salt marsh, through sediment addition, in the Parsons Slough Complex. In a sediment addition scenario, the described base height should allow for a fully tidal marsh plain, and the Parsons channel morphology will approximate its 1900 condition. This scenario would require that the top of the permanent structure be at an elevation of -10’, and that the permanent structure allow an open top section that spans the full width of the channel.
16 Design should enable the structure to withstand damage from storm surges, floods, earthquakes and debris obstruction.
No additional goals or rationale. The sill structure has been designed for a DBE (10 percent probability of exceedance in 50 year) having a peak horizontal acceleration of 0.55 g assuming the adjustable weir discussed in Appendix D is in place. The structure has also been designed for debris impact as described in Appendix D.
17 The structure should have the capability to It should be possible to shift the elevation of the See Design Criteria 19.

Appendix A ESNERR Design Criteria for Engineers 12/17/09
A-6
accommodate subsidence and sea level rise up to a total of 2 meters additional height of the structure.
structure up 2 meters in order to accommodate relative increase in water levels, either resulting from sea level rise or from subsidence of the structure. Such an adjustment would likely be a rare, one-time event during a 50 year period and might require additional funding, but initial design should permit this adjustment to be made.
ADDITIONAL DESIGN CRITERIA provided 11/20/2009
These criteria incorporate the key information from the memo form ESNERR to DU dated 11/4/09 regarding “Follow-up on 10/28/09 Kick-off meeting”.
18 Clarification of Criteria 14: Equipment costs Equipment above and beyond what is presently owned by ESNERR can be included as part of the design and cost estimate. The maintenance costs on that equipment should also be considered.
OK
19 Clarification of Criteria 17: Sea Level Rise Gates shall be designed to accommodate anticipated sea level rise. The structure should accommodate 0.5 m of sea level rise during the design life of 50 years. The design should consider how a total of 2.0 m of sea level rise would be accommodated, and where cost effective to do so, incorporate elements that provide for that accommodation.
The top of the sill structure has been designed to accommodate 0.5 m (1.6 feet) of sea level rise. Provision to accommodate a total of 2 m of sea level rise would require sheetpile to extend deeper into the foundation and heavier sheetpile than is currently in the 30 percent design. In addition, structural members of the adjustable weir described in Appendix D would also likely need to be heavier..
20 Criteria specific to Tasks 2.2B Alternative 2, Side Hinged Tide Gates - Following receipt of the deliverables associated with Task 2.1 and 2.2B, the following additional design criteria were identified:
-
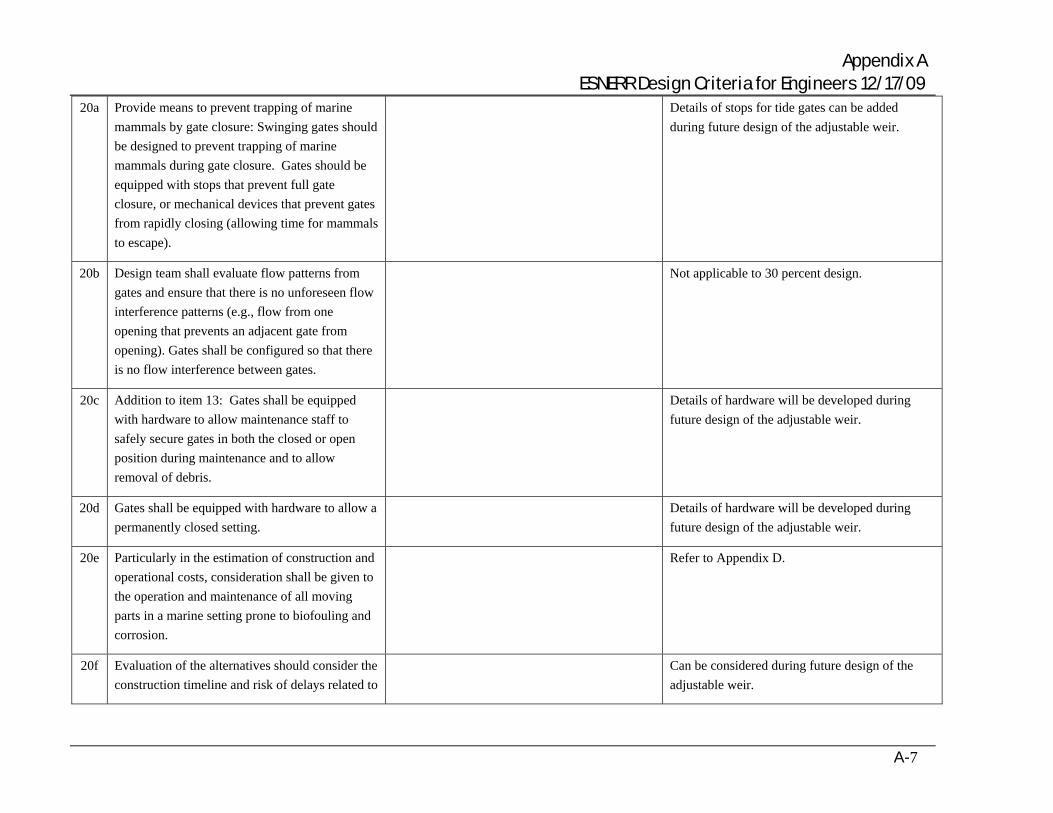
Appendix A ESNERR Design Criteria for Engineers 12/17/09
A-7
20a Provide means to prevent trapping of marine mammals by gate closure: Swinging gates should be designed to prevent trapping of marine mammals during gate closure. Gates should be equipped with stops that prevent full gate closure, or mechanical devices that prevent gates from rapidly closing (allowing time for mammals to escape).
Details of stops for tide gates can be added during future design of the adjustable weir.
20b Design team shall evaluate flow patterns from gates and ensure that there is no unforeseen flow interference patterns (e.g., flow from one opening that prevents an adjacent gate from opening). Gates shall be configured so that there is no flow interference between gates.
Not applicable to 30 percent design.
20c Addition to item 13: Gates shall be equipped with hardware to allow maintenance staff to safely secure gates in both the closed or open position during maintenance and to allow removal of debris.
Details of hardware will be developed during future design of the adjustable weir.
20d Gates shall be equipped with hardware to allow a permanently closed setting.
Details of hardware will be developed during future design of the adjustable weir.
20e Particularly in the estimation of construction and operational costs, consideration shall be given to the operation and maintenance of all moving parts in a marine setting prone to biofouling and corrosion.
Refer to Appendix D.
20f Evaluation of the alternatives should consider the construction timeline and risk of delays related to
Can be considered during future design of the adjustable weir.

Appendix A ESNERR Design Criteria for Engineers 12/17/09
A-8
custom fabrication of tide gates.
21 Adjustments to the structure should be made from a stable platform.
Adjustments of the structure shall be made from a stable work area or platform integral to the structure rather than from a boat. Such access may be a walkway across the top of the structure.
Large objects integral to the structure such as flashboards should be stored on the structure.
Attachment points or rails to provide mechanical advantage for the placement of flashboards or the replacement of tide gates should be integral to the structure. Tide gates should be designed to provide for removal and replacement.
A working platform at the top of the adjustable weir is shown in Appendix D.
Flashboards are stored on the platform above each adjustable bay as shown in Appendix D.
Details of attachment of base mount for portable davit would be developed during final design of the future adjustable weir. Tide gates would require mobilization of a contractor to remove and replace.
22 Opening in the base of the structure The design for the base of the structure should include as an optional item an opening that would provide for the passage of fish moving near the bed and for the circulation of bottom water. An adjustable gate over this opening should also be considered as an optional item.
See 12/17/09 Clarification of Previous Criteria below.
23 Plunging flow At times, the head drop across the structure may be up to five feet. Plunging flow has been identified as a potential hazard for fish, marine mammals and (trespassing) boaters, which could be trapped at depth. Cascading flow has been identified as preferable, as long as impacts with hard objects are minimized. The design alternatives considered should include a qualitative description of the type of flow anticipated and avoid plunging flow where
Plunging flow would occur over flashboards of the future adjustable weir described in Appendix D if they are set such that adjustable bays are only partially closed.

Appendix A ESNERR Design Criteria for Engineers 12/17/09
A-9
possible.
24 Flood dominance Elkhorn Slough habitat deterioration is related to the high ebb tide velocities that export sediment from the estuary. Parsons Slough hydrology is also strongly ebb dominant. If the design targets the reducing the velocity of ebb currents, then it will provide greater ecologic benefits for Elkhorn Slough for the same reduction in tidal range. Most of the adverse effects of the project on water quality and habitats are associated with that reduction in tidal range, so this approach may be warranted.
Suggestions on ways to reduce the ebb dominance of Parsons Slough include designing the structure with a geometry that funnels water smoothly into Parsons Slough, and has increased turbulence and head losses as water flows out of Parsons Slough.
The future adjustable weir can be operated in a flood dominant state when using panel mounted tide gates.
25 Ease of operation and maintenance The design should be developed to maximize the ease of operation with respect to operation and maintenance in a difficult work environment.
Flashboards for the future adjustable weir described in Appendix D would be relatively easy to remove or install using portable hand powered davits temporarily mounted on the working platform.
26 Reliability The design should be developed to maximize the reliability of the structure between adjustments and following the period of regular adjustment.
Flashboards for the future adjustable weir described in Appendix D would be reliable only requiring monthly inspection for debris or vandalism and annual removal of biofoul.
27 Long term cost of ownership The design should be developed to consider the long term cost of ownership, including O&M
Refer to Appendix D.

Appendix A ESNERR Design Criteria for Engineers 12/17/09
A-10
costs.
28 Construction costs The project budget is insufficient to cover the construction costs projected in the Task 2.1 and Task 2.2 B reports. While supplemental funding approaches are being sought, the design process moving forward will need to be increasingly cost conscious. If construction costs can be substantially reduced by adjusting or dropping specific design criteria, those opportunities should be identified and reported as soon as possible.
ADDITIONAL DESIGN CRITERIA provided 12/17/2009
Clarifications of Previous Criteria
Criteria 15. Permanent cross section area
The design report should include a description of the steps required to achieve the cross sectional area specified in this criteria, and an order of magnitude cost estimate for those modifications. Removable elements are not required as part of the project design.
As described in Section 4 of this report, the cross sectional area specified in Criteria 15 can be achieved in the future by removing a portion of the rockfill buttress and driving the central 100 feet of sheetpile down to elevation -10 feet. The cost for such a permanent adjustment is described in Section 4 of this report.
Criteria 22. Opening in the base of the structure
This requirement is dropped, provided that included in the design is sloped rock buttressing the base that rises to the elevation of the notch. If rock to that elevation is not incorporated into the 30% design, this criterion may be revisited. This requirement should not drive the decision of whether to include the rock.
The rockfill buttress is included in the 30 percent design and as such an opening is not included in the base structure.

Appendix A ESNERR Design Criteria for Engineers 12/17/09
A-11
New Criteria
29 The jet from the notch and alignment with the thalweg
The structure may initiate a jet of high velocity water. The effects of that jet and associated eddies should be considered, and measures, such as structure orientation, should be incorporated to minimize bank erosion impacts without the need for bank armoring.
The structure should be oriented, and the notch located, such that the highest velocity flow is directed to the existing thalweg, if feasible.
If these criteria conflict, avoiding bank erosion will take precedence.
Jet velocity and any potential associated impacts are addressed in Section 6 and Appendix D.
30 Preventing seawater intrusion The design should ensure sea water intrusion does not occur via structural elements that may act as conduits, such as round piles that are not filled with concrete.
The 30 percent design does not include any elements that would cause seawater intrusion.
31 Optimal flashboard length The design process should consider 6', 8' and 10' long flashboard bays in order to identify the best option. Factors should include flashboard weight and maneuverability, loading on individual H-Piles and H-Pile size in order to balance the ease of operation against overall project cost.
The future adjustable weir described in Appendix D includes 6-foot-long flashboards mounted within 5-foot-wide bays. The reduction in board length results in significantly lighter more maneuverable boards.
32 Frame mounted gates The flashboard slots should be designed to receive a frame mounted gate (or other flow control device) inserted into it using a crane. The structure should be designed to provide a high degree of versatility for later retrofits using this feature. At a minimum, top hinged gates should be accommodated using this approach. Side-
A concept design of a frame mounted tide gate is included in the design of the adjustable weir described in Appendix D. Each frame would include two top hinged tide gates. The frame mounted gate would slide into and be secured in the same rails used for the flashboards.

Appendix A ESNERR Design Criteria for Engineers 12/17/09
A-12
hinged gates should also be accommodated, unless the additional requirements will add substantially to the cost of the frame. The installation must have the proper structural resistance as well as the form and features to allow this retrofit.
The 30% design should include a frame mounted top-hinged tide gate.
33 Modeling structure performance Configurations with tide gate inserts and flashboard should be evaluated using hydraulic and hydrodynamic modeling. Three configurations should be evaluated for the flashboards: 0%, 50% and 100% of flashboards installed. One configuration for the tide gates should be evaluated: 50% of bays with top-hinged tide gate inserts, and 50% with flashboards installed.
The three configurations are modeled as described in Appendix D of this report.
34 Flashboard operation The design should specify the mechanism by which flashboards will be raised and lowered. The flashboards will need to be moved efficiently. Zero head differential across the structure will not occur at slack tide, and often several boards will be under water when zero head differential occurs. Speed of operation and mechanical advantage will be important.
Design suggestions include:
a. A metal beam that fits the flashboard racks and which can be lowered and raised to clean the racks. This beam could also be used to drive
Suggestions considered in development of the design of the adjustable weir described in Appendix D.

Appendix A ESNERR Design Criteria for Engineers 12/17/09
A-13
flashboards down into place, and to lift them out.
b. One or two electric winches that would raise and lower flashboards by lifting either the middle of the metal beam or both ends of the flashboards. Winches and batteries would be stored off site.
c. A screw type device to assist in raising or lowering the flashboards when a head differential exists (an alternative to the winches).
d. An automatic attachment mechanism to secure flashboards to the lifting mechanism perhaps incorporated into the metal beam. The lifting mechanism should be able to be attached to the lower boards without the assistance of a diver. One suggestion is a cant hook, such as is used to handle logs in timber operations. Another suggestion is a carabineer/eye bolt combination.
e. Attachment points for the lifting mechanism that is integral to the flashboards.
f. A positive stop to prevent boards from floating.
g. Capping the ends of the flashboards with HDPE or similar material to reduce the possibility of jammed boards.
h. A leaky flashboard structure is not a concern, and should not preclude the use of attachment holes or undersized flashboards to achieve the criteria above.

Appendix B
Sill Structure Engineering Analyses

Appendix B Sill Structure Engineering Analysis
B-1
B1. MATERIAL PROPERTIES The material properties of the foundation soil were developed from the available geotechnical data (Kleinfelder, 2002) and engineering judgment. The shear strength of the soft silt at the foundation (saturated non-free-draining material) was characterized using an undrained shear strength as shown in Table B-1.
The selected unit weight and shear strength parameters are summarized in Table B-1.
Table C-1 Materials Properties for Geotechnical Analysis
Effective Stress Parameters Total Stress ParametersMaterial
Unit Weight (pcf) c’, psf Φ’, deg su, psf
Soft Silt 110 0 29 250
B2. SHEETPILE ANALYSIS As described in Section 4 of the report, the sill structure will consist of sheetpiles. The sheetpiles are designed to support potential loads due to accretion of sediment behind the sill structure and for differential heads that will develop on either side of the structure during tidal exchange. The analyses were performed assuming that the potential future adjustable weir is installed. The analyses were performed using the computer program Prosheet 2 to calculate the length of the sheetpile walls.
B2.1 Analysis Approach The lateral support for a cantilevered wall is developed from the passive pressure developed on the portion embedded below the bottom of excavation and the required penetration depths are often quite high. Below the bottom of the retained soil, the sheet pile is subjected to active pressure on the side retaining soil and passive pressure on the side not retaining soil. When the sheet pile rotates away from the side retaining soil, there is active pressure on the side retaining soil and passive pressure on the side not retaining soil. The steps involved in the sheet pile design calculations can be summarized as follows:
• Assume a trial depth of penetration (this may be estimated using approximate correlations).
• Calculate the active and passive lateral earth pressures.
• Satisfy the requirements of static equilibrium.
• Readjust the depth of penetration, if needed.
The above steps are repeated until convergence is reached; i.e., the sum of the moments about a point at the bottom of the sheet pile is zero. The computer program Prosheet 2 was used to calculate the pressures and the length of the sheet pile.

Appendix B Sill Structure Engineering Analysis
B-2
The plan and profile and sections are shown in Figures L-1 and L-2. Four sections along the structure were analyzed as follows:
• Section 1 - The tallest free standing portion of the wall located to the right or left of the potential future adjustable weir;
• Section 2 - The free standing portion of the wall located in the central bay;
• Section 3 - The free standing portion of the wall near the channel edge; and
• Section 4 – The portion of the wall below the potential future adjustable weir.
Analysis details for Section 1 were discussed below for illustrative purposes. Based on the available topographic data, the slough bottom was assumed to be at elevation -9 feet. The analysis assumed that sedimentation had accreted to the top of the sill structure at Elevation -2 feet.
The maximum water surface elevation differential used in the analysis was based on hydraulic modeling results discussed in Appendix D. Based on the hydraulic studies a maximum water surface elevation differential of about 5 feet used in the analysis.
Dynamic active earth pressure was calculated using the Seed and Whitman (1970) Procedure. Force acting on the sheet pile was calculated for a Design Basis Earthquake (DBE) with peak horizontal ground acceleration (PGA) of 0.55g. Calculated force due to the dynamic loading is 0.015H2 kips per foot length of the sheet pile, which acts 0.4 H ft from the top of the backfill. Where, H is the thickness of the backfill. For section 1, the calculated dynamic force is 0.74 kips per foot.
The conditions analyzed are shown in Figure B-2.
Figure B-2
Sheetpile Conditions Assumed for Analysis
Force represents the additional active earth pressure due to dynamic loading
El. 9.6 ft
El. -2 ft El. 1 ft
El. 6 ft
El. -9 ft El. -4.8 ft

Appendix B Sill Structure Engineering Analysis
B-3
B2.2 Results of Sheetpile Analyses The calculated total pressure diagram for the sheetpile wall is Figure B-3. The calculated embedment depth is about 16.1 ft. With a 50 percent increase of embedment depth to assure a margin of safety, the total length of the sheetpile is 42.8 feet. The recommended sheet pile length is 43 feet.
Figure B-3
Pressure Diagram for Sheetpile Wall
The portion of the wall below the potential future adjustable weir (section 4) will have lateral support from the H-piles to be driven to support the silt structure. The support from the H-piles to the sheet pile is accounted in the estimation of the length of the sheet pile for section 4.
Prosheet 2 was also used to evaluate what type of sheetpile would be required to limit horizontal deflection to about 1 inch for static loading conditions and 2 inches for dynamic loading conditions. A sheetpile section that would meet these criteria is AZ-50. The calculated deflections at the top of the sheet piles are provided in the table below. Seventy-one pairs of AZ-50 sheetpiles would be required for the 270-foot-long base structure.

Appendix B Sill Structure Engineering Analysis
B-4
Table B-1 Sill Structure Sheetpile Results
Deflection at the Top of the
Sheetpile (in) Sheetpile Section
Channel Invert (feet)
Embedment Depth (feet)
Additional Embedment for Factor of Safety
(feet)
Top Elevation
(feet)
Total Sheetpile Length (feet)
Sheetpile Pile
Length Used (feet)
due to Static
Loading
due to Seismic Loading
1 -9 16.1 8.1 9.6 42.8 43 1 1.4
2 -12 7.2 3.6 -5 17.8 18 <0.1 <0.1
3 -2 10 5 9.6 26.6 27 <0.1 0.1
4 -12 17.4 8.7 -2 36.1 36 1 2
B3. PILE ANALYSIS As described in Section 3 of the report, the future potential adjustable weir would be supported on HP12x84 end bearing piles. The ultimate axial capacities were computed using the program Driven 1.2 (2001). As discussed in Section B1, the soil stratum at the project site includes about 60 feet thick compressible soft silt layer. Since the thickness of the soft compressible layer is larger than 30 ft the negative shaft resistance was considered in the axial capacity calculations. Nordlund (1963) and α- (total stress) methods were used to calculate the ultimate axial capacity of a single pile in cohesionless and cohesive soil layers respectively. The estimated ultimate axial capacity variation with the depth for a single pile is shown below. The ultimate axial capacity of the 85 feet long end bearing pile is 150 kips.

Appendix B Sill Structure Engineering Analysis
B-5
0
20
40
60
80
100
120
-100 0 100 200 300 400 500 600
Ultimate Axial Capacity (kips)D
epth
(ft)
Figure B-4
Variation of Ultimate Axial Capacity with the Depth for HP 12x84 Piles
Soil-pile interaction under combined axial and lateral loading was modeled using nonlinear Winkler foundation models. The computer program LPILE Plus 5.0M was utilized to analyze the individual pile response to applied lateral and axial loads with a series of nonlinear springs that

Appendix B Sill Structure Engineering Analysis
B-6
are internally generated by the program as a function of user-specified soil properties. Pile properties used in the analyses include length, diameter, moment of inertia, area, and modulus of elasticity. The maximum shear load and the maximum bending moment corresponding to the specified deflection are shown
Table B-2 Pile Analysis Results
Maximum Lateral Displacement (inches)
Lateral Load (kips)
Maximum Shear (kips)
Maximum Moment (kip-in)
0.5 5 -47 890 1.0 10 -94 1780
HP 12 x 84 Pile
2.0 20 -188 3550
B4. SETTLEMENT ANALYSIS As described in Section 5.1 of the report, simplified one dimensional consolidation analyses was performed assuming sediment builds up behind the sill structure resulting in settlement of the channel invert upstream of the sill structure. The one dimensional consolidation analyses conservatively assumed that sediment accretes to the sill elevation of -2 feet.
B4.1 Material Properties Engineering properties for consolidation analysis were based on consolidation tests that were performed on samples of the soft clayey silt reported in the Geotechnical Engineering Investigation for Union Pacific Railroad Bridge Replacement Project at Parsons Slough (Kleinfelder, 2002). These test results show virgin compression indices (Cc/(1+e0)) ranging from 0.175 to 0.235 and recompression indices (Cr/(1+e0)) ranging from 0.025 to 0.049. A virgin compression index of 0.2 and a recompression index of 0.03 were selected for use in the consolidation calculations. The maximum past pressure was taken as function of depth based on the consolidation test results.
B4.2 Analysis Approach The consolidation settlements were calculated using the one dimensional consolidation theory. The settlement due to accretion of sediment behind the structure was calculated assuming 10 feet of sediment accreting over 62 feet of soft soil divided into 20 layers of equal thickness.
The time rate of consolidation was not estimated because the consolidation tests reported in Kleinfelder (2002) did not include displacement with time plots for each loading increment. However, Based on published data and our experience with similar soils, the time required for primary consolidation to be complete could be in the range of 2 to 10 years. In addition, settlement of the channel invert upstream of the sill structure due to sedimentation will depend on the rate of accretion It is our understanding that the rate of accretion is low, and thus, it may take several years to accumulate 10 feet of sediment.

Appendix B Sill Structure Engineering Analysis
B-7
B4.3 Results of Settlement Analyses The calculated total consolidation settlement of the channel invert upstream of the sill structure due to the sedimentation behind the structure was about 2 feet.

Appendix C
Opinion Of Estimated Construction Cost

Parsons Slough Sill Project - Sill Structure Date 3/18/2010Engineers Opinion of Construction Cost - 30 Percent Design
Unit Cost Cost Unit Cost Cost
1 MOBILIZATION AND DEMOB 1 ls 120,000$ 120,000$ 160,000$ 160,000$ 2 PREPARE STAGING AREA 1 ls 200,000$ 200,000$ 290,000$ 290,000$ 3 FURNISH AND INSTALL H PILES 14 each 11,500$ 161,000$ 15,100$ 211,400$ 4 FURNISH AND INSTALL SHEETPILE 8,125 sqft 57$ 463,125$ 79$ 641,875$ 5 EARTHEN EMBANKMENT 130 cy 123$ 15,990$ 176$ 22,880$ 6 ROCKFILL 1,470 cy 88$ 129,360$ 128$ 188,160$ 7 EROSION PROTECTION 360 cy 189$ 68,040$ 238$ 85,680$ 8 RESTORE STAGING AREA 1 ls 75,000$ 75,000$ 100,000$ 100,000$
1,232,515$ 1,699,995$ 123,252$ 170,000$
1,355,767$ 1,869,995$ 338,942$ 467,499$
1,694,708$ 2,337,493$ Notes:
12
Item Item Description Quantity UnitLow Range High Range
SubtotalGeneral Requirements (10%)
Costruction costs are 1st quarter 2010 costs. Estimated construction cost does not include hazmat abatement, if any, legal feed and finance costs, permit and plan check fees, cost escalation, soft costs includingfees for design and engineering, construction and project management and other consulting costs or environmental costs.
SubtotalDesign Contingency (20%)
Total Estimated Construction Cost

Parsons Slough Sill Project - Sill Structure Date 3/18/2010Engineers Opinion of Construction Cost - 30 Percent Design
Item Item Permanent Construction Sub- Direct Indirect Total Unit PriceNumber Description Material Matl/Exp Contract Total Charge Cost Used
1 MOBILIZATION AND DEMOB 1 ls 7,200 0 0 90,600 0 97,800 9,780 107,580 10,758 118,338 118,338.00 120,000.00 120,0002 PREPARE STAGING AREA 1 ls 22,920 23,520 0 51,000 0 164,539 16,454 180,993 18,099 199,092 199,092.43 200,000.00 200,0003 FURNISH AND INSTALL H PILES 14 each 14,261 55,776 30,000 28,000 0 132,778 13,278 146,056 14,606 160,662 11,475.84 11,500.00 161,0004 FURNISH AND INSTALL SHEETPILE 8,125 sqft 27,040 252,525 15,000 65,000 0 381,030 38,103 419,133 41,913 461,046 56.74 57.00 463,1255 EARTHEN EMBANKMENT 130 cy 3,973 1,300 0 7,800 0 13,183 1,318 14,502 1,450 15,952 122.71 123.00 15,9906 ROCKFILL 1,470 cy 22,462 36,750 0 44,100 0 106,435 10,644 117,079 11,708 128,787 87.61 88.00 129,3607 EROSION PROTECTION 360 cy 11,002 21,600 0 21,600 0 56,038 5,604 61,641 6,164 67,805 188.35 189.00 68,0408 RESTORE STAGING AREA 1 ls 22,920 0 0 45,000 0 67,920 6,792 74,712 0 74,712 74,712.09 75,000.00 75,000
Totals 131,777 391,471 45,000 353,100 0 1,019,723 101,972 1,121,696 104,698 1,226,394 1,232,515
Summary of Low Range Cost
TotalProfit Total Unit PriceQuantity Unit Labor Equipment

Parsons Slough Sill Project - Sill Structure Date 3/18/2010Engineers Opinion of Construction Cost - 30 Percent Design
Activity or Description Pieces Quantity Unit Unit Cost Labor Permanent Construction Equipment Sub- DirectResource Material Matl/Exp Contract Total
BID ITEM 1Description MOBILIZATION AND DEMOB Unit = ls Takeoff Quan = 1
1.1 MOBILIZE EQUIPMENT Quantity: 1 ls Hours/Shift: 8
eqBC70 Barge and Crane 1 40,000 40,000 40,000eqB Barge 1 20,000 20,000 20,000eqPB Push Boat 1 4,000 4,000 4,000eqLDR Loader 1 2,000 2,000 2,000eqC70 Crane 1 4,000 4,000 4,000eqPU Pickup 2 300 600 600maBFLEXI Furnish floating docks 20 1,000 20,000 20,000
1.2 MOBILIZE PERSONNEL Quantity: 1 ls Hours/Shift: 8
laBO Boat Operator 1 1,300 1,300 1,300laCM Crewman 1 1,100 1,100 1,100laCR Crane Operator 2 1,400 2,800 2,800laL Laborer 2 1,000 2,000 2,000
Total Bid Item 1 7,200 0 90,600 0 97,800
BID ITEM 2Description PREPARE STAGING AREA Unit = ls Takeoff Quan = 1
2.1 Quantity: 1 lbs Hours/Shift: 8# = 14x40x84maHPILE Furnish piles 1 47,040 lbs 0.50 23,520 23,520maBFLEXI Furnish floating docks 3 60 months 1000.00 60,000 60,000rSTAX Sales Tax 7,099
0 83520 0 0 0 90,619
2.2 Quantity: 1 ls Hours/Shift: 860.0 Crew Hours Production: 0.02 Units/Hour Labor Pieces Equip Pieces
eqBC70 Barge and Crane 1 60.0 hr 250.00 15,000.00 15,000eqB Barge 2 120.0 hr 100.00 12,000.00 12,000eqPB Push Boat 1 60.0 hr 105.00 6,300.00 6,300eqLDR Loader 1 60.0 hr 115.00 6,900.00 6,900eqC70 Crane 1 60.0 hr 150.00 9,000.00 9,000eqPU Pickup 2 120.0 hr 15.00 1,800.00 1,800laBO Boat Operator 1 60.0 hr 72.00 4,320.00 4,320laCM Crewman 1 60.0 hr 60.00 3,600.00 3,600laCR Crane Operator 2 120.0 hr 70.00 8,400.00 8,400laL Laborer 2 120.0 hr 55.00 6,600.00 6,600
22,920 0 0 51,000 0 73,920Totals for Bid Item 2 1 ls 164,539.20 22,920 23,520 0 51,000 0 164,539
BID ITEM 3Description FURNISH AND INSTALL H PILES Unit = each Takeoff Quan = 14
3.1 FURNISH PILES Quantity: 92,960 lbs Hours/Shift: 8# = 20x80x83maHPILE Furnish piles 1 92,960 lbs 0.60 55,776 55,776
Low Range Cost Buildup

Parsons Slough Sill Project - Sill Structure Date 3/18/2010Engineers Opinion of Construction Cost - 30 Percent Design
Activity or Description Pieces Quantity Unit Unit Cost Labor Permanent Construction Equipment Sub- DirectResource Material Matl/Exp Contract Total
Low Range Cost Buildup
rSTAX Sales Tax 4,741
0 55776 0 0 0 60,517
3.2 DRIVE H PILES Quantity: 14 each Hours/Shift: 837.3 Crew Hours Production: 0.38 Units/Hour Labor Pieces Equip Pieces
eqBC70 Barge and Crane 1 37.3 hr 250.00 9,333.33 9,333eqB Barge 1 37.3 hr 100.00 3,733.33 3,733eqPB Push Boat 1 37.3 hr 105.00 3,920.00 3,920eqLDR Loader 1 37.3 hr 115.00 4,293.33 4,293eqC70 Crane 1 37.3 hr 150.00 5,600.00 5,600eqPU Pickup 2 74.7 hr 15.00 1,120.00 1,120laBO Boat Operator 1 37.3 hr 72.00 2,688.00 2,688laCM Crewman 1 37.3 hr 60.00 2,240.00 2,240laCR Crane Operator 2 74.7 hr 70.00 5,226.67 5,227laL Laborer 2 74.7 hr 55.00 4,106.67 4,107cmPGF Pile Guide Frame 2 10000.0 lbs 3.00 30,000.00 30,000
14,261 0 30,000 28,000 0 72,261Totals for Bid Item 3 14 each 9,484.16 14,261 55,776 30,000 28,000 0 132,778
BID ITEM 4Description FURNISH AND INSTALL SHEETPILE Unit = sqft Takeoff Quan = 8,125
4.1 FURNISH PILES Quantity: 420,875 lbs Hours/Shift: 8AZ50 sheetpilesmaSHTPILE Furnish piles 1 420,875 lbs 0.60 252,525 252,525rSTAX Sales Tax 21,465
0 252525 0 0 0 273,990
4.2 DRIVE SHEETPILES Quantity: 8,125 sqft Hours/Shift: 886.7 Crew Hours Production: 93.75 Units/Hour Labor Pieces Equip Pieces
eqBC70 Barge and Crane 1 86.7 hr 250.00 21,666.67 21,667eqB Barge 1 86.7 hr 100.00 8,666.67 8,667eqPB Push Boat 1 86.7 hr 105.00 9,100.00 9,100eqLDR Loader 1 86.7 hr 115.00 9,966.67 9,967eqC70 Crane 1 86.7 hr 150.00 13,000.00 13,000eqPU Pickup 2 173.3 hr 15.00 2,600.00 2,600laBO Boat Operator 1 86.7 hr 72.00 6,240.00 6,240laCM Crewman 1 86.7 hr 60.00 5,200.00 5,200laCR Crane Operator 1 86.7 hr 70.00 6,066.67 6,067laL Laborer 2 173.3 hr 55.00 9,533.33 9,533cmPGF Pile Guide Frame 2 5000 lbs 3.00 15,000.00 15,000
27,040 0 15,000 65,000 0 107,040Totals for Bid Item 4 8,125 sqft 46.90 27,040 252,525 15,000 65,000 0 381,030
BID ITEM 5Description EARTHEN EMBANKMENT Unit = cy Takeoff Quan = 130
5.1 FURNISH EARTHEN FILL Quantity: 130 cy Hours/Shift: 8
maEFILL Furnish earthfill 1 130 cy 10.00 1,300 1,300rSTAX Sales Tax 111

Parsons Slough Sill Project - Sill Structure Date 3/18/2010Engineers Opinion of Construction Cost - 30 Percent Design
Activity or Description Pieces Quantity Unit Unit Cost Labor Permanent Construction Equipment Sub- DirectResource Material Matl/Exp Contract Total
Low Range Cost Buildup
0 1300 0 0 0 1,411
5.2 PLACE EARTHEN FILL Quantity: 130 cy Hours/Shift: 810.4 Crew Hours Production: 12.50 Units/Hour Labor Pieces Equip Pieces
eqBC70 Barge and Crane 1 10.4 hr 250.00 2,600.00 2,600eqB Barge 1 10.4 hr 100.00 1,040.00 1,040eqPB Push Boat 1 10.4 hr 105.00 1,092.00 1,092eqLDR Loader 1 10.4 hr 115.00 1,196.00 1,196eqC70 Crane 1 10.4 hr 150.00 1,560.00 1,560eqPU Pickup 2 20.8 hr 15.00 312.00 312laBO Boat Operator 1 10.4 hr 72.00 748.80 749laCM Crewman 1 10.4 hr 60.00 624.00 624laCR Crane Operator 2 20.8 hr 70.00 1,456.00 1,456laL Laborer 2 20.8 hr 55.00 1,144.00 1,144
3,973 0 0 7,800 0 11,773Totals for Bid Item 5 130 cy 101.41 3,973 1,300 0 7,800 0 13,183
BID ITEM 6Description ROCKFILL Unit = cy Takeoff Quan = 1,470
6.1 FURNISH ROCKFILL Quantity: 1,470 cy Hours/Shift: 8
maRFILL Furnish rockfill 1 1,470 cy 25.00 36,750 36,750rSTAX Sales Tax 3,124
0 36750 0 0 0 39,874
6.2 PLACE ROCKFILL Quantity: 1,470 cy Hours/Shift: 858.8 Crew Hours Production: 25.00 Units/Hour Labor Pieces Equip Pieces
eqBC70 Barge and Crane 1 58.8 hr 250.00 14,700.00 14,700eqB Barge 1 58.8 hr 100.00 5,880.00 5,880eqPB Push Boat 1 58.8 hr 105.00 6,174.00 6,174eqLDR Loader 1 58.8 hr 115.00 6,762.00 6,762eqC70 Crane 1 58.8 hr 150.00 8,820.00 8,820eqPU Pickup 2 117.6 hr 15.00 1,764.00 1,764laBO Boat Operator 1 58.8 hr 72.00 4,233.60 4,234laCM Crewman 1 58.8 hr 60.00 3,528.00 3,528laCR Crane Operator 2 117.6 hr 70.00 8,232.00 8,232laL Laborer 2 117.6 hr 55.00 6,468.00 6,468
22,462 0 0 44,100 0 66,562Totals for Bid Item 6 1,470 cy 72.41 22,462 36,750 0 44,100 0 106,435
BID ITEM 7Description EROSION PROTECTION Unit = cy Takeoff Quan = 360
7.1 FURNISH RIPRAP Quantity: 360 cy Hours/Shift: 8
maRIPRAP Furnish riprap 1 360 cy 60.00 21,600 21,600rSTAX Sales Tax 1,836
0 21600 0 0 0 23,436
7.2 PLACE RIPRAP Quantity: 360 lbs Hours/Shift: 8

Parsons Slough Sill Project - Sill Structure Date 3/18/2010Engineers Opinion of Construction Cost - 30 Percent Design
Activity or Description Pieces Quantity Unit Unit Cost Labor Permanent Construction Equipment Sub- DirectResource Material Matl/Exp Contract Total
Low Range Cost Buildup
28.8 Crew Hours Production: 12.50 Units/Hour Labor Pieces Equip PieceseqBC70 Barge and Crane 1 28.8 hr 250.00 7,200.00 7,200eqB Barge 1 28.8 hr 100.00 2,880.00 2,880eqPB Push Boat 1 28.8 hr 105.00 3,024.00 3,024eqLDR Loader 1 28.8 hr 115.00 3,312.00 3,312eqC70 Crane 1 28.8 hr 150.00 4,320.00 4,320eqPU Pickup 2 57.6 hr 15.00 864.00 864laBO Boat Operator 1 28.8 hr 72.00 2,073.60 2,074laCM Crewman 1 28.8 hr 60.00 1,728.00 1,728laCR Crane Operator 2 57.6 hr 70.00 4,032.00 4,032laL Laborer 2 57.6 hr 55.00 3,168.00 3,168
11,002 0 0 21,600 0 32,602Totals for Bid Item 7 360 cy 155.66 11,002 21,600 0 21,600 0 56,038
BID ITEM 8Description RESTORE STAGING AREA Unit = ls Takeoff Quan = 1
8.1 Quantity: 1 ls Hours/Shift: 8
rSTAX Sales Tax 0
0 0 0 0 0 0
8.2 Quantity: 1 ls Hours/Shift: 860.0 Crew Hours Production: 0.02 Units/Hour Labor Pieces Equip Pieces
eqBC70 Barge and Crane 1 60.0 hr 250.00 15,000.00 15,000eqB Barge 1 60.0 hr 100.00 6,000.00 6,000eqPB Push Boat 1 60.0 hr 105.00 6,300.00 6,300eqLDR Loader 1 60.0 hr 115.00 6,900.00 6,900eqC70 Crane 1 60.0 hr 150.00 9,000.00 9,000eqPU Pickup 2 120.0 hr 15.00 1,800.00 1,800laBO Boat Operator 1 60.0 hr 72.00 4,320.00 4,320laCM Crewman 1 60.0 hr 60.00 3,600.00 3,600laCR Crane Operator 2 120.0 hr 70.00 8,400.00 8,400laL Laborer 2 120.0 hr 55.00 6,600.00 6,600
22,920 0 0 45,000 0 67,920Totals for Bid Item 8 1 ls 67,920.09 22,920 0 0 45,000 0 67,920
Totals 131,777 391,471 45,000 353,100 0 1,019,723

Parsons Slough Sill Project - Sill Structure 3/18/2010Engineers Opinion of Construction Cost - 30 Percent Design
DESCRIPTION CODELOW RANGE UNIT PRICE UNIT COMMENT
-Sales Tax on Materials rSTAX 8.50% -Overhead rOVH 10.00% -Profit rPROF 10.00% -
-
Crane eqC70 150.00 hourFront End Loader eqLDR 115.00 hourBarge and Crane eqBC70 250.00 hourBarge eqB 100.00 hourPush Boat eqPB 105.00 hourPickup eqPU 15.00 hourFurnish floating docks maBFLEXI 1,000.00 month
Superintendent laSUP 80.00 hourForeman laFOR 66.00 hourBoat Operator laBO 72.00 hourCrewman laCM 60.00 hourCrane Operator laCR 70.00 hourLaborer laL 55.00 hour
Earthfill maEFILL 10.00 cyRockfill maRFILL 25.00 cyRiprap maRIPRAP 60.00 cyAgregate Base maAGG 20.00 tonSheetpile maSHTPILE 0.60 lbH piles maHPILE 0.50 lb H12x80
Indirect and Markup Rates
Equipment Rates
Labor Rates
Material Quotes

Parsons Slough Sill Project - Sill Structure 3/18/2010Engineers Opinion of Construction Cost - 30 Percent Design
Production Rate
(units/hour) Unit Number UnitDuration (hours)
PREPARE STAGING AREA 2.2 0.01666667 Units/Hour 1 ls 60DRIVE H PILES 3.2 0.375 Units/Hour 3 each 8DRIVE SHEETPILES 4.2 93.75 Units/Hour 750 sqft 8PLACE EARTHEN FILL 5.2 12.5 Units/Hour 100 cy 8PLACE ROCKFILL 6.2 25 Units/Hour 200 cy 8PLACE RIPRAP 7.2 12.5 Units/Hour 100 cy 8RESTORE STAGING AREA 8.2 0.01666667 Units/Hour 1 ls 60
CommentDescription Item
Production for Low Range Cost
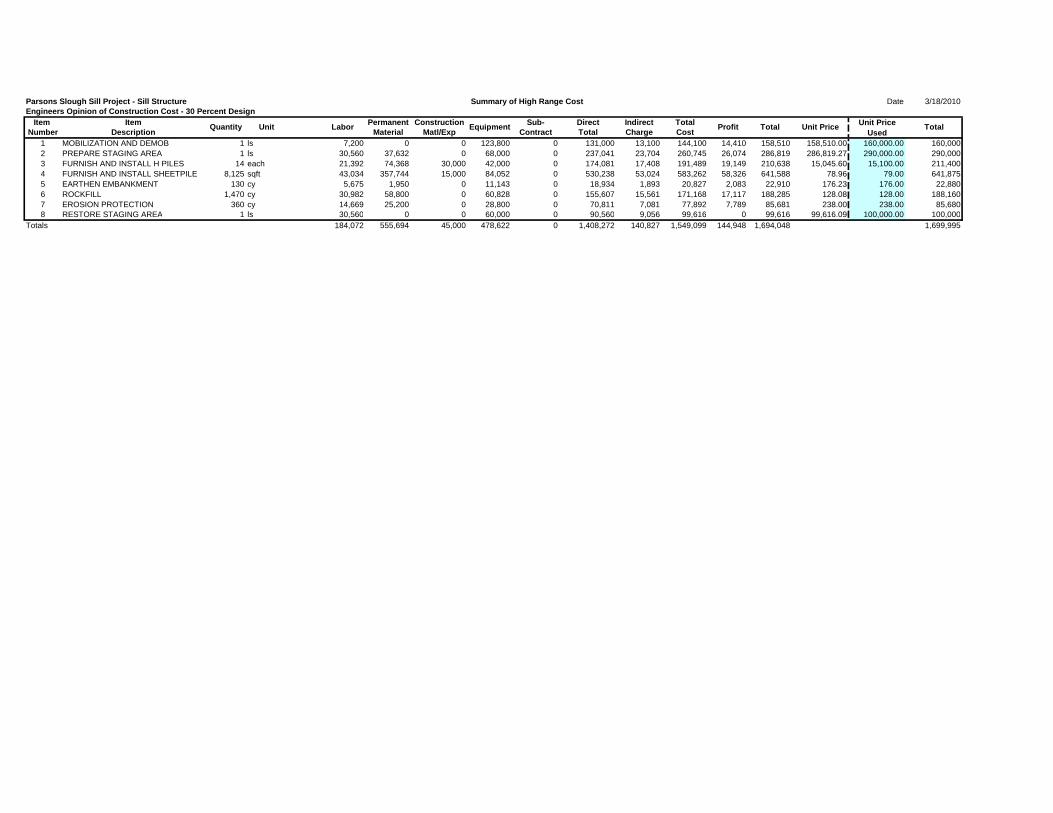
Parsons Slough Sill Project - Sill Structure Date 3/18/2010Engineers Opinion of Construction Cost - 30 Percent Design
Item Item Permanent Construction Sub- Direct Indirect Total Unit PriceNumber Description Material Matl/Exp Contract Total Charge Cost Used
1 MOBILIZATION AND DEMOB 1 ls 7,200 0 0 123,800 0 131,000 13,100 144,100 14,410 158,510 158,510.00 160,000.00 160,0002 PREPARE STAGING AREA 1 ls 30,560 37,632 0 68,000 0 237,041 23,704 260,745 26,074 286,819 286,819.27 290,000.00 290,0003 FURNISH AND INSTALL H PILES 14 each 21,392 74,368 30,000 42,000 0 174,081 17,408 191,489 19,149 210,638 15,045.60 15,100.00 211,4004 FURNISH AND INSTALL SHEETPILE 8,125 sqft 43,034 357,744 15,000 84,052 0 530,238 53,024 583,262 58,326 641,588 78.96 79.00 641,8755 EARTHEN EMBANKMENT 130 cy 5,675 1,950 0 11,143 0 18,934 1,893 20,827 2,083 22,910 176.23 176.00 22,8806 ROCKFILL 1,470 cy 30,982 58,800 0 60,828 0 155,607 15,561 171,168 17,117 188,285 128.08 128.00 188,1607 EROSION PROTECTION 360 cy 14,669 25,200 0 28,800 0 70,811 7,081 77,892 7,789 85,681 238.00 238.00 85,6808 RESTORE STAGING AREA 1 ls 30,560 0 0 60,000 0 90,560 9,056 99,616 0 99,616 99,616.09 100,000.00 100,000
Totals 184,072 555,694 45,000 478,622 0 1,408,272 140,827 1,549,099 144,948 1,694,048 1,699,995
Total
Summary of High Range Cost
Quantity Unit Labor Equipment Profit Total Unit Price
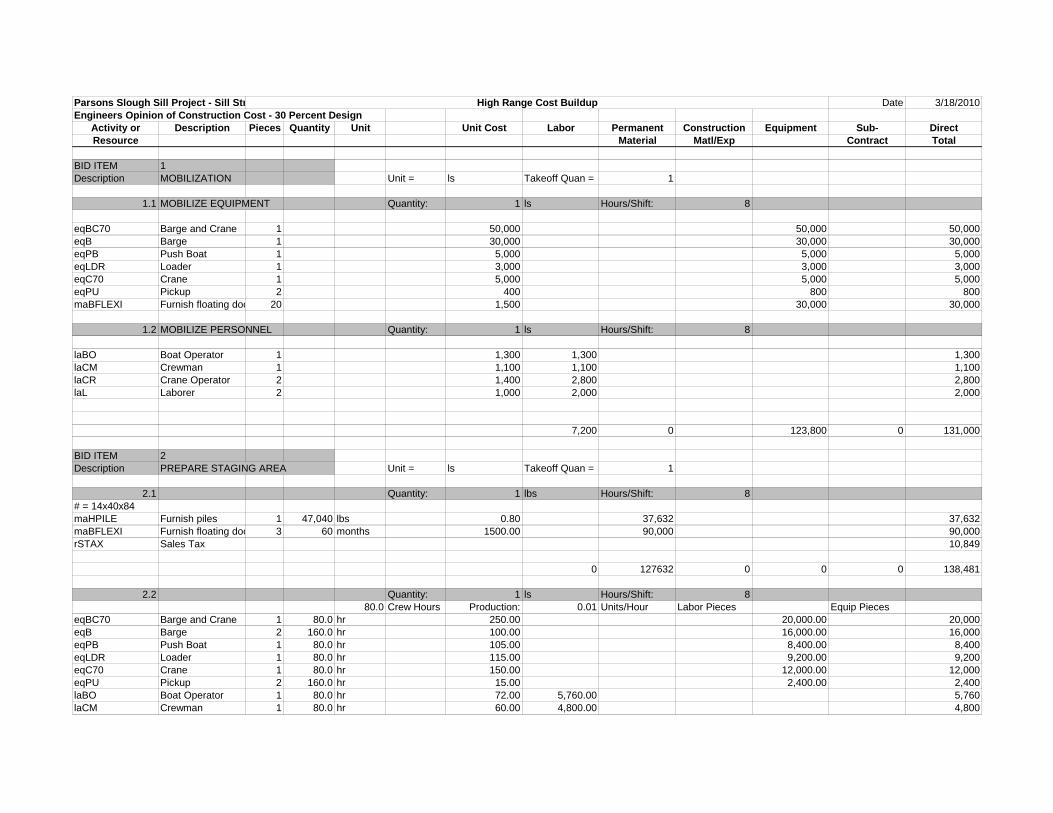
Parsons Slough Sill Project - Sill Structure Date 3/18/2010Engineers Opinion of Construction Cost - 30 Percent Design
Activity or Description Pieces Quantity Unit Unit Cost Labor Permanent Construction Equipment Sub- DirectResource Material Matl/Exp Contract Total
BID ITEM 1Description MOBILIZATION Unit = ls Takeoff Quan = 1
1.1 MOBILIZE EQUIPMENT Quantity: 1 ls Hours/Shift: 8
eqBC70 Barge and Crane 1 50,000 50,000 50,000eqB Barge 1 30,000 30,000 30,000eqPB Push Boat 1 5,000 5,000 5,000eqLDR Loader 1 3,000 3,000 3,000eqC70 Crane 1 5,000 5,000 5,000eqPU Pickup 2 400 800 800maBFLEXI Furnish floating docks 20 1,500 30,000 30,000
1.2 MOBILIZE PERSONNEL Quantity: 1 ls Hours/Shift: 8
laBO Boat Operator 1 1,300 1,300 1,300laCM Crewman 1 1,100 1,100 1,100laCR Crane Operator 2 1,400 2,800 2,800laL Laborer 2 1,000 2,000 2,000
7,200 0 123,800 0 131,000
BID ITEM 2Description PREPARE STAGING AREA Unit = ls Takeoff Quan = 1
2.1 Quantity: 1 lbs Hours/Shift: 8# = 14x40x84maHPILE Furnish piles 1 47,040 lbs 0.80 37,632 37,632maBFLEXI Furnish floating docks 3 60 months 1500.00 90,000 90,000rSTAX Sales Tax 10,849
0 127632 0 0 0 138,481
2.2 Quantity: 1 ls Hours/Shift: 880.0 Crew Hours Production: 0.01 Units/Hour Labor Pieces Equip Pieces
eqBC70 Barge and Crane 1 80.0 hr 250.00 20,000.00 20,000eqB Barge 2 160.0 hr 100.00 16,000.00 16,000eqPB Push Boat 1 80.0 hr 105.00 8,400.00 8,400eqLDR Loader 1 80.0 hr 115.00 9,200.00 9,200eqC70 Crane 1 80.0 hr 150.00 12,000.00 12,000eqPU Pickup 2 160.0 hr 15.00 2,400.00 2,400laBO Boat Operator 1 80.0 hr 72.00 5,760.00 5,760laCM Crewman 1 80.0 hr 60.00 4,800.00 4,800
High Range Cost Buildup

laCR Crane Operator 2 160.0 hr 70.00 11,200.00 11,200laL Laborer 2 160.0 hr 55.00 8,800.00 8,800
30,560 0 0 68,000 0 98,560Totals for Bid Item 2 1 ls 237,040.72 30,560 37,632 0 68,000 0 237,041
BID ITEM 3Description FURNISH AND INSTALL H PILES Unit = each Takeoff Quan = 14
3.1 FURNISH PILES Quantity: 92,960 lbs Hours/Shift: 8# = 20x80x83maHPILE Furnish piles 1 92,960 lbs 0.80 74,368 74,368rSTAX Sales Tax 6,321
0 74368 0 0 0 80,689
3.2 DRIVE H PILES Quantity: 14 each Hours/Shift: 856.0 Crew Hours Production: 0.25 Units/Hour Labor Pieces Equip Pieces
eqBC70 Barge and Crane 1 56.0 hr 250.00 14,000.00 14,000eqB Barge 1 56.0 hr 100.00 5,600.00 5,600eqPB Push Boat 1 56.0 hr 105.00 5,880.00 5,880eqLDR Loader 1 56.0 hr 115.00 6,440.00 6,440eqC70 Crane 1 56.0 hr 150.00 8,400.00 8,400eqPU Pickup 2 112.0 hr 15.00 1,680.00 1,680laBO Boat Operator 1 56.0 hr 72.00 4,032.00 4,032laCM Crewman 1 56.0 hr 60.00 3,360.00 3,360laCR Crane Operator 2 112.0 hr 70.00 7,840.00 7,840laL Laborer 2 112.0 hr 55.00 6,160.00 6,160cmPGF Pile Guide Frame 2 10000.0 lbs 3.00 30,000.00 30,000
21,392 0 30,000 42,000 0 93,392Totals for Bid Item 3 14 each 12,434.38 21,392 74,368 30,000 42,000 0 174,081
BID ITEM 4Description FURNISH AND INSTALL SHEETPILE Unit = sqft Takeoff Quan = 8,125
4.1 FURNISH PILES Quantity: 420,875 lbs Hours/Shift: 8AZ50 sheetpilesmaSHTPILE Furnish piles 1 420,875 lbs 0.85 357,744 357,744rSTAX Sales Tax 30,408
0 357743.75 0 0 0 388,152
4.2 DRIVE SHEETPILES Quantity: 8,125 sqft Hours/Shift: 8112.1 Crew Hours Production: 72.50 Units/Hour Labor Pieces Equip Pieces
eqBC70 Barge and Crane 1 112.1 hr 250.00 28,017.24 28,017eqB Barge 1 112.1 hr 100.00 11,206.90 11,207eqPB Push Boat 1 112.1 hr 105.00 11,767.24 11,767

eqLDR Loader 1 112.1 hr 115.00 12,887.93 12,888eqC70 Crane 1 112.1 hr 150.00 16,810.34 16,810eqPU Pickup 2 224.1 hr 15.00 3,362.07 3,362laBO Boat Operator 2 224.1 hr 72.00 16,137.93 16,138laCM Crewman 1 112.1 hr 60.00 6,724.14 6,724laCR Crane Operator 1 112.1 hr 70.00 7,844.83 7,845laL Laborer 2 224.1 hr 55.00 12,327.59 12,328cmPGF Pile Guide Frame 2 5000 lbs 3.00 15,000.00 15,000
43,034 0 15,000 84,052 0 142,086Totals for Bid Item 4 8,125 sqft 65.26 43,034 357,744 15,000 84,052 0 530,238
BID ITEM 5Description EARTHEN EMBANKMENT Unit = cy Takeoff Quan = 130
5.1 FURNISH EARTHEN FILL Quantity: 130 cy Hours/Shift: 8
maEFILL Furnish earthfill 1 130 cy 15.00 1,950 1,950rSTAX Sales Tax 166
0 1950 0 0 0 2,116
5.2 PLACE EARTHEN FILL Quantity: 130 cy Hours/Shift: 814.9 Crew Hours Production: 8.75 Units/Hour Labor Pieces Equip Pieces
eqBC70 Barge and Crane 1 14.9 hr 250.00 3,714.29 3,714eqB Barge 1 14.9 hr 100.00 1,485.71 1,486eqPB Push Boat 1 14.9 hr 105.00 1,560.00 1,560eqLDR Loader 1 14.9 hr 115.00 1,708.57 1,709eqC70 Crane 1 14.9 hr 150.00 2,228.57 2,229eqPU Pickup 2 29.7 hr 15.00 445.71 446laBO Boat Operator 1 14.9 hr 72.00 1,069.71 1,070laCM Crewman 1 14.9 hr 60.00 891.43 891laCR Crane Operator 2 29.7 hr 70.00 2,080.00 2,080laL Laborer 2 29.7 hr 55.00 1,634.29 1,634
5,675 0 0 11,143 0 16,818Totals for Bid Item 5 130 cy 145.65 5,675 1,950 0 11,143 0 18,934
BID ITEM 6Description ROCKFILL Unit = cy Takeoff Quan = 1,470
6.1 FURNISH ROCKFILL Quantity: 1,470 cy Hours/Shift: 8
maRFILL Furnish rockfill 1 1,470 cy 40.00 58,800 58,800rSTAX Sales Tax 4,998
0 58800 0 0 0 63,798
6.2 PLACE ROCKFILL Quantity: 1,470 cy Hours/Shift: 8

81.1 Crew Hours Production: 18.13 Units/Hour Labor Pieces Equip PieceseqBC70 Barge and Crane 1 81.1 hr 250.00 20,275.86 20,276eqB Barge 1 81.1 hr 100.00 8,110.34 8,110eqPB Push Boat 1 81.1 hr 105.00 8,515.86 8,516eqLDR Loader 1 81.1 hr 115.00 9,326.90 9,327eqC70 Crane 1 81.1 hr 150.00 12,165.52 12,166eqPU Pickup 2 162.2 hr 15.00 2,433.10 2,433laBO Boat Operator 1 81.1 hr 72.00 5,839.45 5,839laCM Crewman 1 81.1 hr 60.00 4,866.21 4,866laCR Crane Operator 2 162.2 hr 70.00 11,354.48 11,354laL Laborer 2 162.2 hr 55.00 8,921.38 8,921
30,982 0 0 60,828 0 91,809Totals for Bid Item 6 1,470 cy 105.86 30,982 58,800 0 60,828 0 155,607
BID ITEM 7Description EROSION PROTECTION Unit = cy Takeoff Quan = 360
7.1 FURNISH RIPRAP Quantity: 360 cy Hours/Shift: 8
maRIPRAP Furnish riprap 1 360 cy 70.00 25,200 25,200rSTAX Sales Tax 2,142
0 25200 0 0 0 27,342
7.2 PLACE RIPRAP Quantity: 360 lbs Hours/Shift: 838.4 Crew Hours Production: 9.38 Units/Hour Labor Pieces Equip Pieces
eqBC70 Barge and Crane 1 38.4 hr 250.00 9,600.00 9,600eqB Barge 1 38.4 hr 100.00 3,840.00 3,840eqPB Push Boat 1 38.4 hr 105.00 4,032.00 4,032eqLDR Loader 1 38.4 hr 115.00 4,416.00 4,416eqC70 Crane 1 38.4 hr 150.00 5,760.00 5,760eqPU Pickup 2 76.8 hr 15.00 1,152.00 1,152laBO Boat Operator 1 38.4 hr 72.00 2,764.80 2,765laCM Crewman 1 38.4 hr 60.00 2,304.00 2,304laCR Crane Operator 2 76.8 hr 70.00 5,376.00 5,376laL Laborer 2 76.8 hr 55.00 4,224.00 4,224
14,669 0 0 28,800 0 43,469Totals for Bid Item 7 360 cy 196.70 14,669 25,200 0 28,800 0 70,811
BID ITEM 8Description RESTORE STAGING AREA Unit = ls Takeoff Quan = 1
8.1 Quantity: 1 ls Hours/Shift: 8
rSTAX Sales Tax 0
0 0 0 0 0 0

8.2 Quantity: 1 ls Hours/Shift: 880.0 Crew Hours Production: 0.01 Units/Hour Labor Pieces Equip Pieces
eqBC70 Barge and Crane 1 80.0 hr 250.00 20,000.00 20,000eqB Barge 1 80.0 hr 100.00 8,000.00 8,000eqPB Push Boat 1 80.0 hr 105.00 8,400.00 8,400eqLDR Loader 1 80.0 hr 115.00 9,200.00 9,200eqC70 Crane 1 80.0 hr 150.00 12,000.00 12,000eqPU Pickup 2 160.0 hr 15.00 2,400.00 2,400laBO Boat Operator 1 80.0 hr 72.00 5,760.00 5,760laCM Crewman 1 80.0 hr 60.00 4,800.00 4,800laCR Crane Operator 2 160.0 hr 70.00 11,200.00 11,200laL Laborer 2 160.0 hr 55.00 8,800.00 8,800
30,560 0 0 60,000 0 90,560Totals for Bid Item 8 1 ls 90,560.09 30,560 0 0 60,000 0 90,560
Totals 184,072 555,694 45,000 478,622 0 1,408,272

Parsons Slough Sill Project - Sill Structure 3/18/2010Engineers Opinion of Construction Cost - 30 Percent Design
DESCRIPTION CODEHIGH RANGE UNIT COST UNIT COMMENT
-Sales Tax on Materials rSTAX 8.50% -Overhead rOVH 10.00% -Profit rPROF 10.00% -
-
Crane eqC70 150.00 hourFront End Loader eqLDR 115.00 hourBarge and Crane eqBC70 250.00 hourBarge eqB 100.00 hourPush Boat eqPB 105.00 hourPickup eqPU 15.00 hourFurnish floating docks maBFLEXI 1,500.00 month
Superintendent laSUP 80.00 hourForeman laFOR 66.00 hourBoat Operator laBO 72.00 hourCrewman laCM 60.00 hourCrane Operator laCR 70.00 hourLaborer laL 55.00 hour
Earthfill maEFILL 15.00 cyRockfill maRFILL 40.00 cyRiprap maRIPRAP 70.00 cyAgregate Base maAGG 25.00 tonSheetpile maSHTPILE 0.85 lbH piles maHPILE 0.80 lb H12x80
Indirect and Markup Rates
Equipment Rates
Labor Rates
Material Quotes

Parsons Slough Sill Project - Sill Structure 3/18/2010Engineers Opinion of Construction Cost - 30 Percent Design
Production Rate
(units/hour) Unit Number UnitDuration (hours)
PREPARE STAGING AREA 2.2 0.0125 Units/Hour 1 ls 80DRIVE H PILES 3.2 0.25 Units/Hour 2 each 8DRIVE SHEETPILES 4.2 72.5 Units/Hour 580 sqft 8PLACE EARTHEN FILL 5.2 8.75 Units/Hour 70 cy 8PLACE ROCKFILL 6.2 18.125 Units/Hour 145 cy 8PLACE RIPRAP 7.2 9.375 Units/Hour 75 cy 8RESTORE STAGING AREA 8.2 0.0125 Units/Hour 1 ls 80
CommentDescription Item
Production for High Range Cost

Appendix D
Adjustable Weir Alternative

Appendix D
Adjustable Weir Alternative
D-1
D1. DESCRIPTION OF ADJUSTABLE WEIR ALTERNATIVE
The Adjustable Weir Alternative would consist of a series of flashboards, optional panel mounted top-hinged tide gates and associated frame structure installed within the sill structure as shown on Drawings L-1x, L-2x and S-x. The structure would consist of fifteen 11.5-foot-high by 5-foot-wide bays, comprised of a steel frame structure into which the boards could be stacked at various heights, or panel mounted tide gates could be installed to control flow through each bay. Flashboards would be installed or removed from a steel platform mounted on top of the adjustable weir. Installation of the panel mounted tide gates would require mobilization of a barge mounted crane. The frame and platform would be prefabricated using H beams and other structural steel members as shown on Drawings S-1x and S-2x.
D1.1 Flashboards
Flashboards can be manufactured from various materials, including wood, fiberglass, reinforced HDPE or other synthetic that would provide a relatively light weight, stiff board. The boards would abut one another and would include protruding steel pins at each end for placement or removal. Manufacturing lead times for flashboards is 3 to 4 weeks for wood and 8 to 12 weeks for fiberglass/plastic. The cost of fiberglass boards is on the order of 20 to 30 times greater than for wood. Fiberglass boards would likely not need to be replaced during the life of the structure, whereas wooden boards would likely need to be replaced at least once. For the 30 percent design, wooden flashboards were chosen due to cost. The flashboards would be constructed using wood that could be either Redwood or treated Douglas Fir.
Flashboard lengths of 6-, 8- and 10-foot were considered. The primary advantage of shorter flashboards is their greater ease of maneuverability due to being lighter than longer boards. In addition, shorter flashboards would develop less friction against the guide rails due to water pressure against them and thus would require less mechanical advantage for removal when differential tide elevations are present across the structure. Waterlogged wooden 6-foot-long flashboards would weigh on the order of 120 to 130 pounds compared with 200 to 220 pounds for 10-foot-long flashboards. Longer flashboards would have the advantage of requiring fewer adjustable bays and thus some construction cost savings would be realized. The wider bays would likely be less susceptible to debris obstruction. For the draft 30-percent design, it was judged that the benefits of the shorter flashboards in maneuverability and thus safety, outweighed the incrementally greater cost for additional adjustable bays.
The flashboards would be installed in rails mounted on the sides of each adjustable bay. The rails are dimensioned to be about 1-inch wider than the thickness of the flashboards to reduce the potential for the flashboards becoming jammed within the rails. The length of the flashboards allows for a gap of ½-inch on either end of the bay so that the boards will not jam in the rails if one side is lifted more quickly than the other. As such, the approximate dimensions of the wooden flashboards would be 5-foot-10 -inches-long by 1-foot-high by 4-inches-thick.
Once installed, the flashboards would be held in place using either weighted or fixed stops that would slide down the guide rails over the uppermost board.

Appendix D
Adjustable Weir Alternative
D-2
D1.2 Optional Panel Mounted Tide Gates
Optional panel mounted tide gates would consist of 110-inch-tall by 54-inch-wide gates that could be either top-hinged or side-hinged. The gates could be manufactured from either steel or fiberglass. The gate would come from the manufacturer installed on a steel plate frame that would be able to be mounted in the flashboard guide rails within the adjustable bays. The steel plate would be attached to the steel column by field welding or using steel bolts. Side-hinged gates would require greater precision and care during installation in order to operate correctly. A concept design of a panel mounted top-hinged tide gate is shown on Drawing S-2x. The tide gate would be set to open on the upstream side of the sill structure during flood tides and close during ebb tides. The gates would also be able to be fixed in a closed position. The top-hinged gates could also be fixed in the open position if additional mechanical equipment such as a winch and cable system were installed on the working platform to lift and support the gates.
D2. DESIGN CODES, CRITERIA & PROPOSED DESIGN
The structural elements used for the Adjustable Weir Alternative support structure were designed and detailed in accordance with the U.S. Army Corps’ Engineering Manual (EM) 1110-2-2105, Engineering Design - Design of Hydraulic Steel Structure (USACE 1989). In addition, design and detailing procedures provided by the American Institute of Steel Construction's (AISC) Steel Construction Manual (AISC 2005) were used as appropriate.
D2.1. Design Loads
The loads and forces considered in the design of the Adjustable Weir Alternative support structure are listed below. All loading calculations assume that the adjustable weir is closed, i.e. the flashboards would be installed to its full height of 11.5 feet and the panel mounted tide gates would be at their closed position. The maximum elevation of both types of adjustable weirs at their closed position would be at El. 9.5 feet. Additional calculation details, including load combinations, are provided at the end of this appendix.
• Dead Load: structural steel unit weight of 490 pounds per cubic foot (pcf)
• Hydrostatic: unit weight of water equal to 64.2 pcf for seawater, with an assumed 5-foot hydraulic head differential. The maximum water elevation when the 5-foot hydraulic head differential occurs is conservatively assumed to be El. 9.5 feet, which is at the top of the adjustable weir.
• Seismic: Design Basis Earthquake (DBE) with peak horizontal ground acceleration (PGA) of 0.55g. The direction of earthquake considered is in the upstream-downstream direction. Effects of ground motion in the cross-stream and vertical directions were considered negligible.
• Hydrodynamic: effects of hydrodynamic forces were approximated by the added hydrodynamic mass concept (Westergaard method) (USACE 2005). A horizontal PGA of 0.55g and a 5-foot hydraulic head differential was assumed for calculating the hydrodynamic forces. The maximum water elevation when the 5-foot hydraulic head differential occurs is conservatively assumed to be El. 9.5 feet, which is at the top of the adjustable weir.

Appendix D
Adjustable Weir Alternative
D-3
• Wave Action: forces due to breaking waves were calculated based on an assumed maximum wave height of 2 feet (USACE 1995). This appears to be reasonable for this preliminary design.
• Wind: wind pressure of 30 pounds per square foot based on the conservative assumption of a non-hurricane wind velocity of 100 mph acting on a structure of less than 20 feet tall (USACE 1993).
D2.2. Proposed Design
Two steel frame structures are designed to support the two segments of the Adjustable Weir Alternative and steel platforms. See Drawing S-1x for overall plan and profile views and Drawing S-2x for specific details. The support structure design is comprised of 10 W14x74 steel columns for the 9-bay 55 feet long segment and another 7 W14x74 steel columns for the 6-bay 37 feet long segment. The 14-foot-high columns are stiffened at the base with additional steel web and flange plates. The columns are to be welded to 1½ inch steel sill plates that span 55 ft and 37 ft. The sill plates would be 9 feet wide at the H-pile locations and 3 feet wide between the H-piles. At the H-pile locations, 12-inch-long rectangular sleeves (2-13¼”x½” flange plates and 2-12¾”x½” web plates) are to be welded to the sill plates. The sleeves would be welded to the structure in the field after the locations of the installed H-piles are surveyed. The support structures would be anchored via bolted connections between the H-piles and sleeves.
The proposed design has one L5x3x½ angle bolted to each side of the W14x74 columns, as shown on Drawings S-1 and S-2. The flashboards would be installed in the slot created by the angle and the W14x74 column. Panel mounted tide gates would be installed in the same slot butted up against the flange of the W14x74 column. The tide gate would then be attached to the W14x74 column by either field welding or using stainless steel bolts.
Grated steel platforms would be attached to support beams welded on the Parson Slough side of the W14x74 columns as shown on Drawings S-1x and S-2x. The steel platforms are to provide access to the weir for the installation and removal of the flashboards or for adjusting the panel mounted tide gates. Steel boxes formed out of steel grating would be mounted on the platform above each adjustable bay for storage of flashboards that are not in use. Platform and storage box details would be developed during potential future design of the Adjustable Weir Alternative.
D2.3. Settlement at Sill Structure
Settlement of the Adjustable Weir Alternative will be minimal because it will be supported on the end bearing piles driven to the dense sandy soils underlying the soft sediments. Localized consolidation and settlement of the soft soils is anticipated under the rockfill buttress.
D3. HYDRAULIC ANALYSIS
Modeling was completed to analyze the potential to include an adjustable sill at some point in the future within the 92-foot portion of the sill structure (at elevation -2 feet). A hydraulic analysis was performed to confirm that potential adjustable sill options would meet the ESNERR Tidal Wetland Working Group hydraulic design criteria.

Appendix D
Adjustable Weir Alternative
D-4
D3.1. ANALYSIS APPROACH
The hydraulic modeling was performed using the United States Army Corps of Engineers (USACE) software, HEC-RAS version 4.0.0. This software was used to perform one-dimensional river hydraulic calculations using unsteady flow. Geometry, tidal boundaries and model calibration are summarized in Section 6 of the main report.
D3.2. MODEL SCENARIOS
The model scenarios were used to check that the adjustable sill would meet the following ESNERR Tidal Wetland Working Group hydraulic design criteria (see Appendix A).
• At the most restrictive setting, the resultant tidal prism of the Parsons complex should be between 60% and 80% of the current tidal prism.
• At the most open setting, there should be no less than 95% of the current tidal prism.
• At the most restrictive setting, there should be no more than 50% reduction in existing tidal range due to the structure alone.
• At the most open setting, there should be no more than 5% reduction in existing tidal range due to the structure alone.
• There should be no net loss of salt marsh.
• There should be no more than a 50% loss of intertidal mudflats.
• The maximum acceptable velocities within the Parsons complex and the exit channel range from 10-15 feet per second.
For the purpose of evaluating the design criteria, the area of intertidal mudflat was assumed to be equivalent to the upstream area of Parsons Slough between mean lower low water (MLLW) and mean high water (MHW). The mean water levels were calculated using water level output for the 28-day period from 12/9/2005 to 1/6/2006. This period was selected because it included unusually high tides resulting from a low pressure system combined with high spring tides. Tidal datum calculations were performed by Wetlands and Water Resources, Inc. to translate the 28-day-average water levels to the 19-year tidal epoch (WWR, 2010). The corresponding areas in Parsons Slough were determined from the elevation-area-storage relationships that had been provided by PWA from the Delft3D model output (PWA 2009). When the parameters for the 30 percent design were used at the most restrictive setting with the 25-foot-wide center section allowing flow across the sill, it was determined that even though design criteria for tidal prism and range were met, the area of intertidal mudflat would decrease by more than 50 percent compared to existing conditions, which does not meet the specified goal.
It was found that the goal for intertidal mudflat could be met at the most restrictive setting for a sill with a 28-foot-wide center opening. Therefore, subsequent modeling was performed using design parameters consistent with the 30 percent design, except that the center opening was increased from 25 feet to 28 feet. The pertinent parameters were as follows:
• Center opening 28 feet wide;
• Invert of center opening at elevation of -5 feet NAVD;
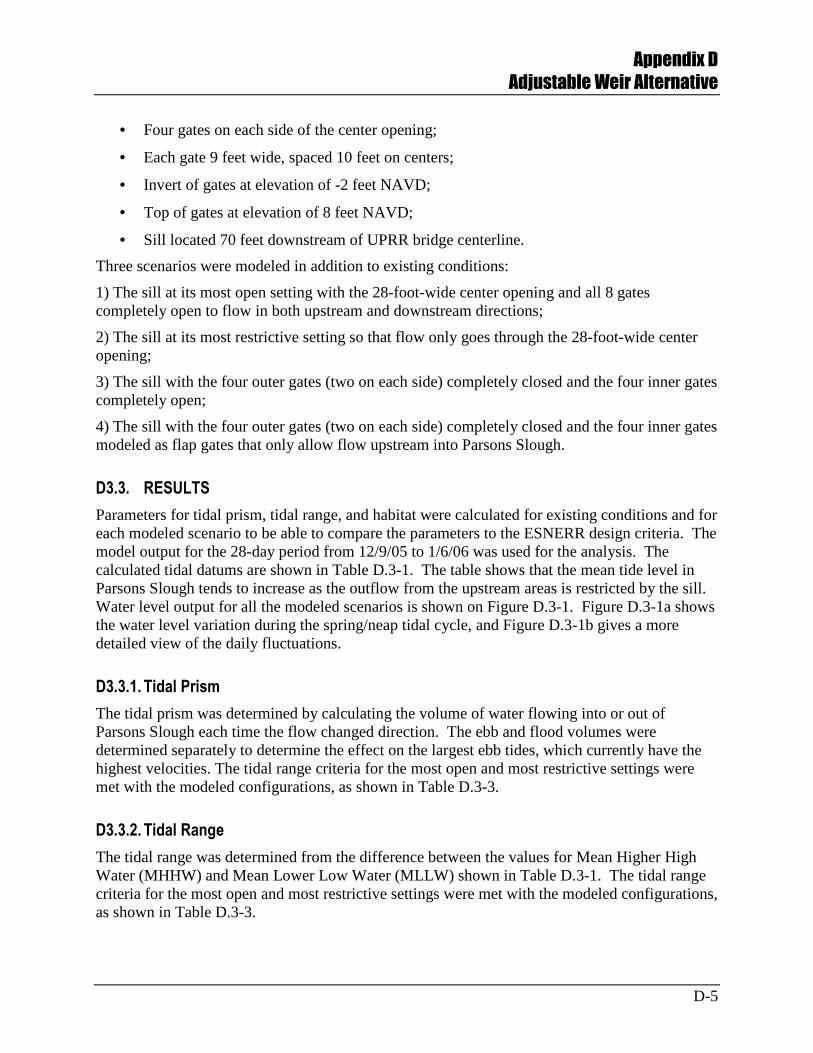
Appendix D
Adjustable Weir Alternative
D-5
• Four gates on each side of the center opening;
• Each gate 9 feet wide, spaced 10 feet on centers;
• Invert of gates at elevation of -2 feet NAVD;
• Top of gates at elevation of 8 feet NAVD;
• Sill located 70 feet downstream of UPRR bridge centerline.
Three scenarios were modeled in addition to existing conditions:
1) The sill at its most open setting with the 28-foot-wide center opening and all 8 gates completely open to flow in both upstream and downstream directions;
2) The sill at its most restrictive setting so that flow only goes through the 28-foot-wide center opening;
3) The sill with the four outer gates (two on each side) completely closed and the four inner gates completely open;
4) The sill with the four outer gates (two on each side) completely closed and the four inner gates modeled as flap gates that only allow flow upstream into Parsons Slough.
D3.3. RESULTS
Parameters for tidal prism, tidal range, and habitat were calculated for existing conditions and for each modeled scenario to be able to compare the parameters to the ESNERR design criteria. The model output for the 28-day period from 12/9/05 to 1/6/06 was used for the analysis. The calculated tidal datums are shown in Table D.3-1. The table shows that the mean tide level in Parsons Slough tends to increase as the outflow from the upstream areas is restricted by the sill. Water level output for all the modeled scenarios is shown on Figure D.3-1. Figure D.3-1a shows the water level variation during the spring/neap tidal cycle, and Figure D.3-1b gives a more detailed view of the daily fluctuations.
D3.3.1. Tidal Prism
The tidal prism was determined by calculating the volume of water flowing into or out of Parsons Slough each time the flow changed direction. The ebb and flood volumes were determined separately to determine the effect on the largest ebb tides, which currently have the highest velocities. The tidal range criteria for the most open and most restrictive settings were met with the modeled configurations, as shown in Table D.3-3.
D3.3.2. Tidal Range
The tidal range was determined from the difference between the values for Mean Higher High Water (MHHW) and Mean Lower Low Water (MLLW) shown in Table D.3-1. The tidal range criteria for the most open and most restrictive settings were met with the modeled configurations, as shown in Table D.3-3.
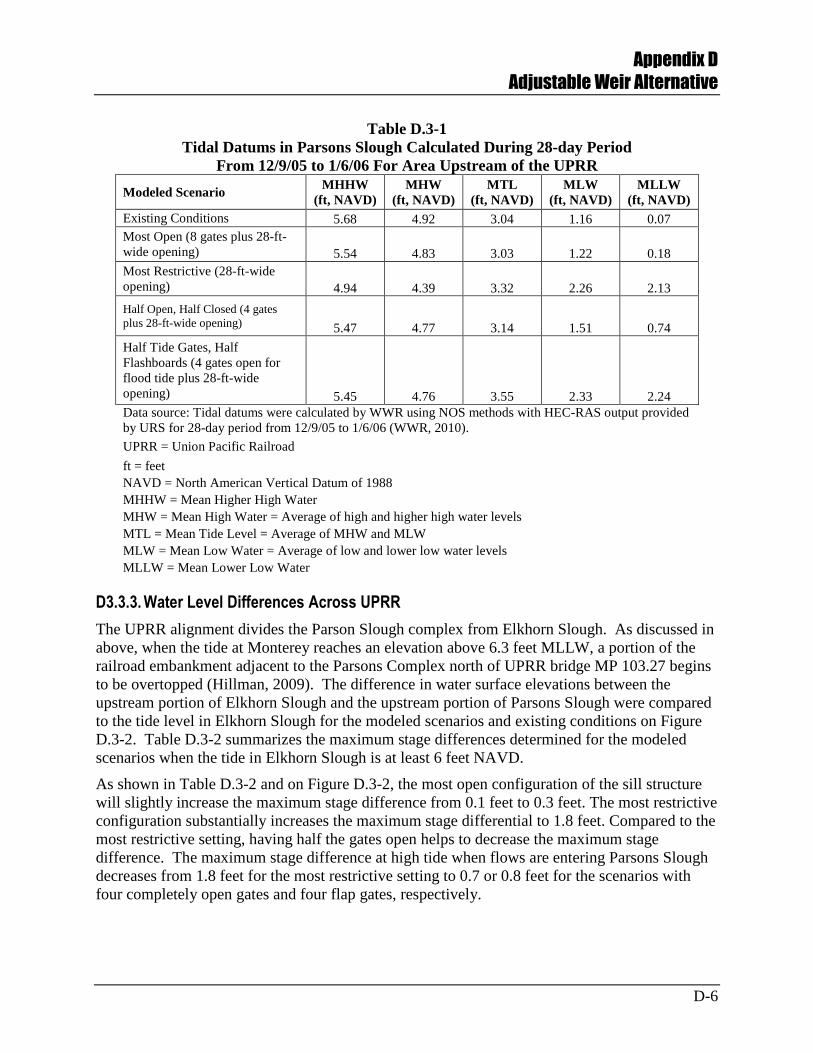
Appendix D
Adjustable Weir Alternative
D-6
Table D.3-1 Tidal Datums in Parsons Slough Calculated During 28-day Period
From 12/9/05 to 1/6/06 For Area Upstream of the UPRR
Modeled Scenario MHHW
(ft, NAVD) MHW
(ft, NAVD) MTL
(ft, NAVD) MLW
(ft, NAVD) MLLW
(ft, NAVD) Existing Conditions 5.68 4.92 3.04 1.16 0.07 Most Open (8 gates plus 28-ft-wide opening) 5.54 4.83 3.03 1.22 0.18 Most Restrictive (28-ft-wide opening) 4.94 4.39 3.32 2.26 2.13
Half Open, Half Closed (4 gates plus 28-ft-wide opening) 5.47 4.77 3.14 1.51 0.74
Half Tide Gates, Half Flashboards (4 gates open for flood tide plus 28-ft-wide opening) 5.45 4.76 3.55 2.33 2.24 Data source: Tidal datums were calculated by WWR using NOS methods with HEC-RAS output provided by URS for 28-day period from 12/9/05 to 1/6/06 (WWR, 2010).
UPRR = Union Pacific Railroad
ft = feet NAVD = North American Vertical Datum of 1988 MHHW = Mean Higher High Water MHW = Mean High Water = Average of high and higher high water levels MTL = Mean Tide Level = Average of MHW and MLW MLW = Mean Low Water = Average of low and lower low water levels MLLW = Mean Lower Low Water
D3.3.3. Water Level Differences Across UPRR
The UPRR alignment divides the Parson Slough complex from Elkhorn Slough. As discussed in above, when the tide at Monterey reaches an elevation above 6.3 feet MLLW, a portion of the railroad embankment adjacent to the Parsons Complex north of UPRR bridge MP 103.27 begins to be overtopped (Hillman, 2009). The difference in water surface elevations between the upstream portion of Elkhorn Slough and the upstream portion of Parsons Slough were compared to the tide level in Elkhorn Slough for the modeled scenarios and existing conditions on Figure D.3-2. Table D.3-2 summarizes the maximum stage differences determined for the modeled scenarios when the tide in Elkhorn Slough is at least 6 feet NAVD.
As shown in Table D.3-2 and on Figure D.3-2, the most open configuration of the sill structure will slightly increase the maximum stage difference from 0.1 feet to 0.3 feet. The most restrictive configuration substantially increases the maximum stage differential to 1.8 feet. Compared to the most restrictive setting, having half the gates open helps to decrease the maximum stage difference. The maximum stage difference at high tide when flows are entering Parsons Slough decreases from 1.8 feet for the most restrictive setting to 0.7 or 0.8 feet for the scenarios with four completely open gates and four flap gates, respectively.

Appendix D
Adjustable Weir Alternative
D-7
Table D.3-2 Maximum Difference in Stage Across UPRR at High Tide in Elkhorn Slough
Modeled Scenario Maximum Stage Difference when tide in
Elkhorn Slough is at least 6 feet NAVD (feet)
Existing Conditions 0.1
Most Open (8 gates plus 28-ft-wide opening) 0.3
Most Restrictive (28-ft-wide opening) 1.8
Half Open, Half Closed (4 gates plus 28-ft-wide opening) 0.7
Half Tide Gates, Half Flashboards (4 gates open for flood tide plus 28-ft-wide opening)
0.8
One additional configuration, flashboards set at elevation 5 feet, was evaluated. This configuration resulted in a maximum stage difference of 1.8 feet.
Based on the modeling, operation of the sill structure in any configuration other than fully open could increase the potential for erosion of ballast from under the rails during high tide events. The sill could be operated in a more restricted configuration, except when tide events in excess of the ballast top elevation or greater are predicted, at which time all flashboards could be removed so that the sill operates in the most open configuration during the tide event. After the tide event, the flashboards would be replaced. Based on data recorded at the NOAA Monterey Station during the past year, the flashboards would have needed to be removed from the sill structure approximately seven times.
D3.3.4. Habitat
The areas of intertidal mudflat and salt marsh were estimated for existing conditions and for the model scenarios as described in Section 6 of the main report. Table D.3-3 shows the calculated areas for the modeled scenarios and shows that the design criteria were met for the most open sill configuration. Not all the analyzed design criteria were met for two of the scenarios. Slightly less than half of the existing intertidal mudflat habitat would remain for the most restrictive setting as well as the scenario with tide gates. It should be noted that the area of intertidal mudflat actually decreases somewhat when tide gates allowing flow upstream are included compared to the most restrictive setting. The use of tide gates increases both MLLW and MHW compared to the most restrictive setting. However, the loss of intertidal area due to the increase in MLLW is greater than the gain in intertidal area due to the increase in MHW. Results for the two scenarios also showed more subtidal habitat than desired.

Appendix D
Adjustable Weir Alternative
D-8
Table D.3-3 Comparison of Parameters Calculated During 28-day Period from 12/9/05 to 1/6/06 to ESNERR Design Criteria
Modeled Scenario
Average flood and ebb tidal
prism1
(acre-feet)
Spring Tide2
Flood Volumes
(acre-feet)
Spring Tide2
Ebb Volumes (acre-feet) Tidal Range3 (feet)
Salt Marsh4
(acres) Intertidal Mudflat5 (acres) Subtidal6
(acres)
Existing Conditions 1,087 1,636 2,242 5.6 20 346 74
Most Open (8 gates plus 28-ft-wide opening) 1,082 1,620 2,218 5.4 21 338 80
Most Restrictive (28-ft-wide opening) 751 1,205 1,507 2.8 29 155 256
Half Open, Half Closed (4 gates plus 28-ft-wide opening)
1,031 1,566 2,114 4.7 22 301 117
Half Tide Gates, Half Flashboards (4 gates open for flood tide plus 28-ft-wide opening)
888 1,512 1,728 3.2 22 149 269
Tidal Prism (ESNERR D.C. 1) Tidal Range (ESNERR D.C. 3) Habitat (ESNERR D.C. 2)
Criteria/Goal: No less than 95% of existing tidal prism No less than 95% of
existing range No loss of salt marsh
No less than 50% of existing intertidal mudflat
No more than 242 acres7Most Open
Percent of Existing: 99% 99% 99% 96% 106% 98% 109%
Criteria/Goal: Between 60% and 80% of existing tidal prism No less than 50% of
existing range No loss of salt marsh
No less than 50% of existing intertidal mudflat
No more than 242 acres7Most Restrictive
Percent of Existing: 69% 74% 67% 50% 141% 45% 348%
Criteria/Goal: No criteria specified No loss of salt marsh
No less than 50% of existing intertidal mudflat
No more than 242 acres7Half Open, Half
Closed Percent of Existing: 95% 96% 94% 84% 110% 87% 159%
Criteria/Goal: No criteria specified No loss of salt marsh
No less than 50% of existing intertidal mudflat
No more than 242 acres7Half Tide Gates,
Half Flashboards Percent of Existing: 82% 92% 77% 57% 111% 43% 365%
1 Calculated as the average of the flood and ebb volumes during the 28-day period. Volumes less than 100-acre feet calculated during brief changes in direction near slack tide were excluded from the average. 2 Spring tide flood and ebb volumes were calculated as the average of the highest three flood or ebb volumes within the first half and second half of the 28-day period. 3 Tidal range was calculated as the difference between Mean Higher High Water and Mean Lower Low Water.4 Assumed that entire area above Mean High Water within the 440-acre area of Parsons Slough is considered salt marsh. However, some of this area may be inundated less than 2% of the time. 5 Assumed that intertidal mudflat is the area between Mean Lower Low Water and Mean High Water. 6 Assumed that subtidal area is below Mean Lower Low Water. 7 Criteria has no more than 65% of existing 440-acre complex, but assumed this was supposed to be 55% (242 acres) for totals to add up to 100%.

Appendix D
Adjustable Weir Alternative
D-9
D3.3.5. Velocities
Peak velocities at the sill exceeded 10 feet per second (ft/s) during spring ebb tides for all the modeled scenarios. The velocities across the sill are shown for a spring tide on Figure D.3-3. The highest velocities occur during ebb tide. Table D.3-4 summarizes the peak velocities through the center opening of the sill (portion with invert at -5 feet NAVD), as well as through the gates (portion with invert at -2 feet NAVD). The highest ebb tide velocities through the center section reached 14 ft/s, and the highest ebb tide velocities through the gates reached nearly 12 ft/s.
Table D.3-4 Peak Velocities at the Sill
Ebb Tide Flood Tide
Modeled Scenario
Peak Velocity through
Center Section (ft/s)
Peak Velocity through
Gates (ft/s)
Peak Velocity through Center
Section (ft/s)
Peak Velocity through
Gates (ft/s) Most Open 11.6 10.7 6.7 7.2 Most Restrictive 13.8 N/A 10.4 N/A Half Open, Half Closed 12.8 11.6 8.1 8.5
Half Tide Gates, Half Flashboards 14.0 N/A 8.2 7.4 N/A = not applicable
Since the flap gates only allow flow during the flood tide, the maximum velocity through the gates was lower. The maximum flood velocity through the center section was over 8 ft/s, and the maximum flood velocity through the gates was over 7 ft/s. The most restrictive setting had the highest flood velocity of the modeled scenarios with a peak just over 10 ft/s. The ESNERR design criteria for velocities over the sill are for maximum velocities between 10 and 15 ft/s. Therefore, the criteria should be met with the modeled configuration. Impacts associated with the increased velocities, and associated design consideration as necessary, are discussed below.
D3.3.6. Potential Scour and Erosion
Operation of the sill will decrease average flows upstream in Parsons Slough due to the constriction in cross-sectional area. However, the design of the sill with the notch in the center will concentrate flows near the center of the channel. The velocities in the concentrated portion of the flow will exceed the velocities under existing conditions and, to the extent the “jet” comes in contact with either the shoreline or the railroad bridge piers, could result in increased erosion.
Average channel velocities were calculated by the HEC-RAS model for the scenarios discussed above. For the most restricted case, flow is restricted to a 28-foot-wide opening. For the most open case, flow extends across the entire channel but mostly above elevation -2.0 NAVD88. Figures D.3-4 and D.3-5 compare the average channel velocities at a location 150 feet northwest of the sill structure and just down estuary of the UPPR railroad bridge (approximately 40 feet east of the sill structure). Figures D.3-4a and D.3-5a show results over the full spring/neap tidal

Appendix D
Adjustable Weir Alternative
D-10
cycle, and Figure D.3-4b and D.3-5b show the daily variation in more detail. As shown in the figures, the sill structure results in a significant decrease in average channel velocity at both locations.
Although the average channel velocities will decrease due to the sill structure, there will be locations within the channel where the velocity will be greater after construction of the sill structure than they were under existing conditions. The locations of the increased velocity will be within the “jet” formed by flow going through the notch or gates. Figure D.3-3 showed velocities at the sill structure. At the structure the velocities could exceed 10 feet per second. This is sufficient to cause scour or erosion if the jet were to contact soil. For the case of a non-buoyant jet discharging into a water body after about a distance on the order of the width of the notch, the maximum velocity in the jet will start to decrease (Fisher et al., 1979). It will continueto decrease in value until it reaches the background or average channel velocity. The rate of decrease will be on the order the square root of the ratio of the depth of water in the notch to distance from the notch (Fisher et al 1979). The nearest marsh shoreline is located due west of the sill structure about 180 feet. The velocity due to the structure will likely not reach ambient before this distance, however, by the time the jet reaches the shoreline, the maximum velocity should be significantly lower than at the sill structure, on the order of 1/3 of the velocity. This would result in a maximum velocity at the shoreline of about 3-5 ft/s. A velocity of this magnitude could cause erosion of an unprotected and unvegetated shoreline. If there is vegetation on the shoreline, erosion should be minimal. In addition, the current in the channel is turning away from the bank towards the north reducing the erosion potential of the velocity. The post-30% detailed design should consider planting along the shoreline to fill in any exposed bank areas in the vicinity.
The railroad bridge is located about 50 feet from the sill structure. The jet discharging through the structure towards the railroad bridge will have a high surface velocity and near zero velocity along the bottom. As the distance from the structure increases, the velocity profile will become more uniform. Figure D.3-6 provides an approximation of the vertical velocity profile near the railroad bridge. As shown, the velocity near the channel bottom will be close to 1 ft/s when the velocity near the surface is around 12 ft/s. Scour at the bridge piers will be due to velocities closer to the bottom of the channel than those near the surface. That is, the scour at the bridge piers will be representative of velocities on the order of 2 to 4 ft/s rather than the greater than 10ft/s velocities seen in and near the openings in the structure. Although unlikely based on these preliminary estimates, post-30% design should include a detailed pier scour analysis to determine the need for pier scour protection.
D4. CONSTRUCTION SCHEDULE AND COST ESTIMATE
D4.1 Constructability
Access for construction of the Adjustable Weir Alternative would be from the water using barges. Constructability issues for the adjustable weir would be similar those discussed for the sill structure in Section 7.1 in this report. Similar to driving the sheetpile and H piles, tidal velocities within Parsons Slough will be a significant factor in production rates for placing the prefabricated adjustable weir onto the piles.

Appendix D
Adjustable Weir Alternative
D-11
D4.2 Construction Schedule
The construction duration for installation of the Adjustable Weir Alternative was estimated for planning purposes. The duration of construction required for the various project elements was based on experience during other projects and, where applicable, on the estimates used to develop construction costs. Factors that would affect the actual duration of the future project include the timing of Notice to Proceed (NTP), the start of construction, tide conditions, adverse weather, and site environmental constraints.
The general approach of the construction sequencing would be as follows:
• Mobilize, prepare staging area at Kirby Park, assemble barges, and prepare project site. Preparation will include installing temporary mooring piles at each location.
• Prefabricate adjustable weir sections, haul to site and weld rectangular sleeves to sections.
• Set prefabricated adjustable weir sections on the H-piles.
• Install platform and flashboards.
• Remove temporary facilities and restore staging area.
Two construction schedules were prepared that reflect a low range and high range future project duration based on the uncertainties associated with the work in Parsons Slough. Assumptions made in estimating the construction durations for the 30 percent design include:
• One shift per day working up to 12 hours a day and up to 6 days per week. The timing of the shift each day would be adjusted to take the greatest advantage of the tide cycle.
• Flashboards only (panel mounted tide gates would be optional).
Based on these assumptions, the estimated duration of construction including fabrication of the adjustable weir would be about 9 to 12 weeks.
D4.3 Construction Cost Estimate
The construction cost estimate for the Adjustable Weir Alternative is a Class 3 estimate as described in Section 7.3 of this report. The estimated low and high range construction cost estimated for the future adjustable weir in 1st quarter 2010 dollars is $1,240,000 to $1,780,000. The draft 30 percent construction cost estimates for the Adjustable Weir Alternative are included at the end of this Appendix. The estimated construction cost does not include hazmat abatement, if any, legal fees and finance costs, permit and plan check fees, cost escalation, soft costs including fees for design and engineering, construction and project management and other consulting costs or environmental costs.
Optional panel mounted tide gates are estimated to have a 1st quarter 2010 construction cost of about $41,300 to $52,700 per gate if purchased as part of the future construction project.

Appendix D
Adjustable Weir Alternative
D-12
D5. OPERATION AND MAINTENANCE
D5.1 OPERATION
Operation of the Adjustable Weir Alternative would be relatively simple requiring placement or removal of flashboards to either partially or fully open or close any number of the 15 adjustable bays. Tidal flow through adjustable bays that are equipped with panel mounted tide gates would be adjusted by either allowing the tide gates to operate or securing the gates in either the open or closed position.
Flashboards would be lowered horizontally down rails along the sides of the bays. The rails would keep the boards in place and aid in installation. As previously indicated, the 6-foot-long boards would weigh approximately 120 to 130 pounds when waterlogged. Additional friction between the flashboards and rails due to differential tide elevations on either side of the boards or tidal currents could also be present. It is recommended that installation and removal occur during periods in the tide cycle when the differential tidal elevation on either side of the sill structure is relatively small.
Installation and removal of the boards would require appropriately sized mechanical equipment or a hand operated system. Potential methods of installing and removing the flashboards from the platform include:
• lifting poles;
• portable davits that can be temporarily mounted on the working platform; or
• an overhead structure consisting of a rail and electric winch system.
Lifting poles are not a viable option given the weight of the flashboards.
Portable hand-operated davits (cranes) capable of lifting 500 to 1,000 pounds could be brought to the sill structure and temporarily mounted on the platform. The davit would be mounted in stainless steel pipes located on the platform between every other adjustable bay so that the davit could swing to remove or install boards in two adjacent bays before needing to be moved. A lifting beam and adjustment poles would be used to assist during installation or removal of flashboards with the davit. The lifting beam would be connected to the davit wire which would be lowered and placed, with assistance from the adjustment poles, over the top of the flash board. Two hooks on each side of the lifting beam would hook the metal pins on the flash board. The board would be raised by the davit until it could be placed in the storage box. The adjustment poles could be used to help guide the boards as they are lifted and placed. The process of removing a single flashboard is estimated to require between 7 to 10 minutes using the portable davit. Removal of a full bay of 10 boards is estimated to require approximately 1.5 hours.
Electric winches capable of lifting 500 to 2,000 pounds could be brought to the sill structure and temporarily attached to a reinforced rail over the flashboard rails to lower and raise the boards. The electric winch would require a power source such as a portable generator or marine batteries that would be operated in the access boat or lifted onto the platform for operation. A lifting beam and adjustment poles similar to that described for the davit would be used. The time required to remove flashboards using the winch would be similar to that of the davit but would require less physical labor.

Appendix D
Adjustable Weir Alternative
D-13
For the 30-percent design, portable davits are recommended because they would be simpler to use, would not require a power source, and are more able to maneuver boards from the storage boxes into the flashboard rails.
D5.1.1 Emergency Opening of Structure
Emergency opening of the bays would require removal of all flashboards or fixing any tide gates in the fully open position. The worst case scenario would be that the sill structure is being operated in its most restricted configuration with all of the adjustable bays filled with flashboards. The emergency opening process would require 2 - two to three-person crews with each crew working to remove flashboards from starting with the bays closest to the center bay and working outward. A total of 120 flashboards would be required for removal. Removal of all of the flashboards would require 4 to 6 people about 2 days. The duration required for emergency removal of the flashboards could be shortened by removing a portion of the boards using chainsaws.
D5.1.2 Adjustments for Sea Level Rise
Adjustment of the sill elevation of the adjustable bays would be made by installing the appropriate number of flashboards in each adjustable bay. For example, if at a future point in time, 1 foot of sea level has been documented one flashboard would be permanently installed in each adjustable bay to raise the sill elevation from -2 feet to -1 feet.
Adjustment of the sill elevation of the central bay would require mobilization of a contractor to place an additional 1 foot of rockfill to raise the elevation from -5 feet to -4 feet.
D5.2 MAINTENANCE
Maintenance of the Adjustable Weir Alternative will include both routine and less frequent activities. Routine maintenance of the Adjustable Weir Alternative will require the following activities:
• Inspection of the structure;
• Removal of debris; and
• Removal of biofouling.
Maintenance activities that would be required on a less frequent basis would include the following:
• Replacement of Flashboards
• Installation of Panel Mounted Tide Gates
D5.2.1 Inspection of the Sill Structure
The sill structure should be inspected on a monthly basis and after extreme events such as extreme tide or flood events and after significant earthquake events. Inspections should be conducted by a two-person crew. Monthly inspections would include observing the structure for the following:

Appendix D
Adjustable Weir Alternative
D-14
• Debris obstructing the bays;
• Any damage to the flashboards or structure due to debris impact or vandalism.
• Damage to tide due to obstructions, debris impact or vandalism.
D5.2.2 Debris Removal
Debris that accumulates within the adjustable bays could be removed using poles from the working platform. Some debris that is too large to remove from the working platform may have to be removed from a boat during tidal periods when both tidal changes and the differential tidal elevation on either side of the sill structure are relatively small.
D5.2.3 Removal of Biofoul
The accumulation of biofoul on the flashboards, flashboard rails and panel mounted tide gates will make the removal and placement of boards difficult. Routine maintenance would require regular removal of biofouling from the boards and the guides. Biofoul could be removed from the working platform using a scrapers mounted on poles. A special shaped pole-mounted scraper would be used to remove biofoul from the flashboards and rails. Removal of biofoul from the lowermost flashboards could require a diver working during periods when the head differential on each side of the sill structure is small.
Annual removal of biofoul is recommended based on the experience of Steve Legnard of ESNERR (Legnard, 2009), who maintains similar flashboard weirs in North Marsh. The rate of growth of biofoul on the flashboards, within the flashboard guides and on frame mounted tide gates should be monitored during monthly inspections and the frequency for removal of biofoul adjusted accordingly, as needed.
D5.2.4 Replacement of Flashboards
The wooden boards are expected to last 20 years or longer based on the ESNERR’s experience with wooden flashboards currently located in North Marsh (Legnard, 2009) where there have not been any boards replaced during approximately 20 years of operation. However, it is unlikely that all of the boards would last the 50 year life of the project. Procurement and replacement of the boards could be readily performed by ESNERR staff.
D5.2.5 Installation of Panel Mounted Tide Gates
Installation of panel mounted tide gates in the adjustable bays after construction would require mobilization of a contractor. Installation would involve removal of any flashboards in the adjustable bay, placement of the panel mounted tide gate in the flashboard rails and attachment of the gate frame to the structure by either bolting or welding.

Appendix D
Adjustable Weir Alternative
D-15
D5.3 Estimated Cost of Operations and Maintenance
The estimated cost for the Adjustable Weir Alternative includes both annual and other than annual costs. These costs were estimated for a flashboard weir structure during the development of weir alternatives (Task 2.3, URS, 2009) for annual operation and maintenance efforts associated with biofouling and removal of debris and flow obstructions. Costs were also developed for operation and maintenance costs that would occur less frequently than annually. These costs would be primarily associated with the replacement of elements of the adjustable weir that have corroded or worn out. The costs presented in Table D5-1 are for the 4th quarter 2009.

Appendix D
Adjustable Weir Alternative
D-16
Table D5-1 Estimated Operation and Maintenance Costs - Alternatives 1A (Flashboard) and 1B (Needle Dam) from TM 2.3 (URS, 2009)
Maintenance Activity Time
Required (man-hours)
Expected Frequency
Annual Time Required
(man-hours) Unit Cost ($)
Total Material Cost ($)
Equipment Comments
Inspect for & remove debris & obstructions
16 monthly 192 NA NA Boat for access
Remove biofouling 64 (1A) 80 (1B)
yearly (1A) 2xyearly (1B)
64 (1A) 80 (1B)
NA NA Boat for access, tool for biofoul removal
Frequency based on experience of Steve Legnard (ESNEER) with flashboards at North Marsh and our experience; Alternative 1B requires twice per year to keep bottom guide rail operational
Wood 160(a) 40 boards/50 years
$107/board $4,280
Boat for access, hoist for board removal, lifting beam
Life expectancy > 20 years Replacement of boards
Fiberglass NA NA NA NA NA Life expectancy > 50 years
Minor Adjustment
16(b) see (c) NA NA
Boat for access, hoist for board removal, lifting beam
Adjustments
Emergency Adjustment
160(e) see (d) NA NA
Boat for access, hoist for board removal, lifting beam
(a) time= (0.5hr/board x 8 board + 4hr mob) x 10 days x 2 people; 5 days for removal and 5 days for replacement (b) time= (0.5hr/board x 1 board x 8 bays + 4hr mob) x 2 people (c) Assume addition or removal of one board in each bay per minor adjustment (d) Assume removal of all 80 boards or needles (e) time= (0.5hr/board x 8 boards + 4hr mob/day) x 10 days x 2 people

FIGURES

FIGURE D.3-1a
Water Levels in Parsons Slough Upstream of UPRR for Scenarios Modeled in HEC-RAS
(showing spring/neap cycle)
-2
-1
0
1
2
3
4
5
6
7
8
12/18/20050:00
12/20/20050:00
12/22/20050:00
12/24/20050:00
12/26/20050:00
12/28/20050:00
12/30/20050:00
1/1/20060:00
1/3/20060:00
1/5/20060:00
1/7/20060:00
Date/Time Local Standard Time
Elev
atio
n (fe
et, N
AVD
)
Existing ConditionsMost OpenMost RestrictiveHalf Open, Half Closed4 Flap Gates

FIGURE D.3-1b
Water Levels in Parsons Slough Upstream of UPRR for Scenarios Modeled in HEC-RAS
(showing daily variation)
-2
-1
0
1
2
3
4
5
6
7
8
12/26/2005 0:00 12/27/2005 0:00 12/28/2005 0:00 12/29/2005 0:00 12/30/2005 0:00 12/31/2005 0:00 1/1/2006 0:00 1/2/2006 0:00
Date/Time Local Standard Time
Elev
atio
n (fe
et, N
AVD
)
Existing ConditionsMost OpenMost RestrictiveHalf Open, Half Closed4 Flap Gates
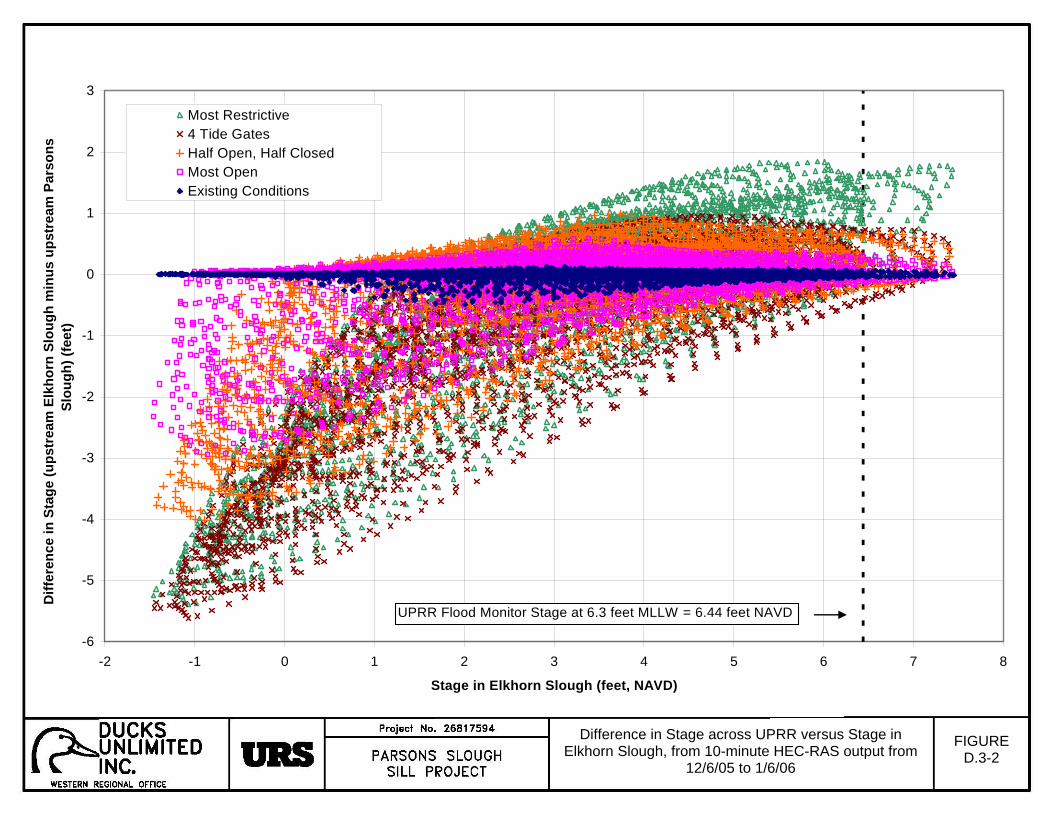
FIGURE D.3-2
Difference in Stage across UPRR versus Stage in Elkhorn Slough, from 10-minute HEC-RAS output from
12/6/05 to 1/6/06
-6
-5
-4
-3
-2
-1
0
1
2
3
-2 -1 0 1 2 3 4 5 6 7 8
Stage in Elkhorn Slough (feet, NAVD)
Diff
eren
ce in
Sta
ge (u
pstr
eam
Elk
horn
Slo
ugh
min
us u
pstr
eam
Par
sons
Sl
ough
) (fe
et)
Most Restrictive4 Tide GatesHalf Open, Half ClosedMost OpenExisting Conditions
UPRR Flood Monitor Stage at 6.3 feet MLLW = 6.44 feet NAVD

FIGURE D.3-3
Velocity Across Sill in Parsons Slough During a Spring Tide
-20
-15
-10
-5
0
5
10
15
20
25
30
12/28/20050:00
12/28/200512:00
12/29/20050:00
12/29/200512:00
12/30/20050:00
12/30/200512:00
12/31/20050:00
12/31/200512:00
1/1/20060:00
1/1/200612:00
1/2/20060:00
Date/Time Local Standard Time
Velo
city
(Pos
itive
= e
bb, N
egat
ive
= Fl
ood)
(ft/s
)
-2
-1
0
1
2
3
4
5
6
7
8
Elev
atio
n (ft
, NA
VD)
Most Open, velocity through gatesMost Open, velocity through center section4 Flap Gates, velocity through center section4 Flap Gates, velocity through gatesMost Restrictive, velocity through center sectionHalf Open, Half Closed, velocity through center sectionHalf Open, Half Closed, velocity through gatesNOAA Tide at Monterey (ft, NAVD)

FIGURE D.3-4a
Velocity in Parsons Slough about 150 feet Northwest of Sill Structure (showing spring/neap cycle)
-3
-2
-1
0
1
2
3
4
12/14/05 12/16/05 12/18/05 12/20/05 12/22/05 12/24/05 12/26/05 12/28/05 12/30/05 1/1/06 1/3/06 1/5/06 1/7/06
Date
Ave
rage
Cha
nnel
Vel
ocity
(Pos
itive
= e
bb) (
ft/s)
Existing Most Open Half Open, Half Closed 4 Flap Gates Most Restrictive
`
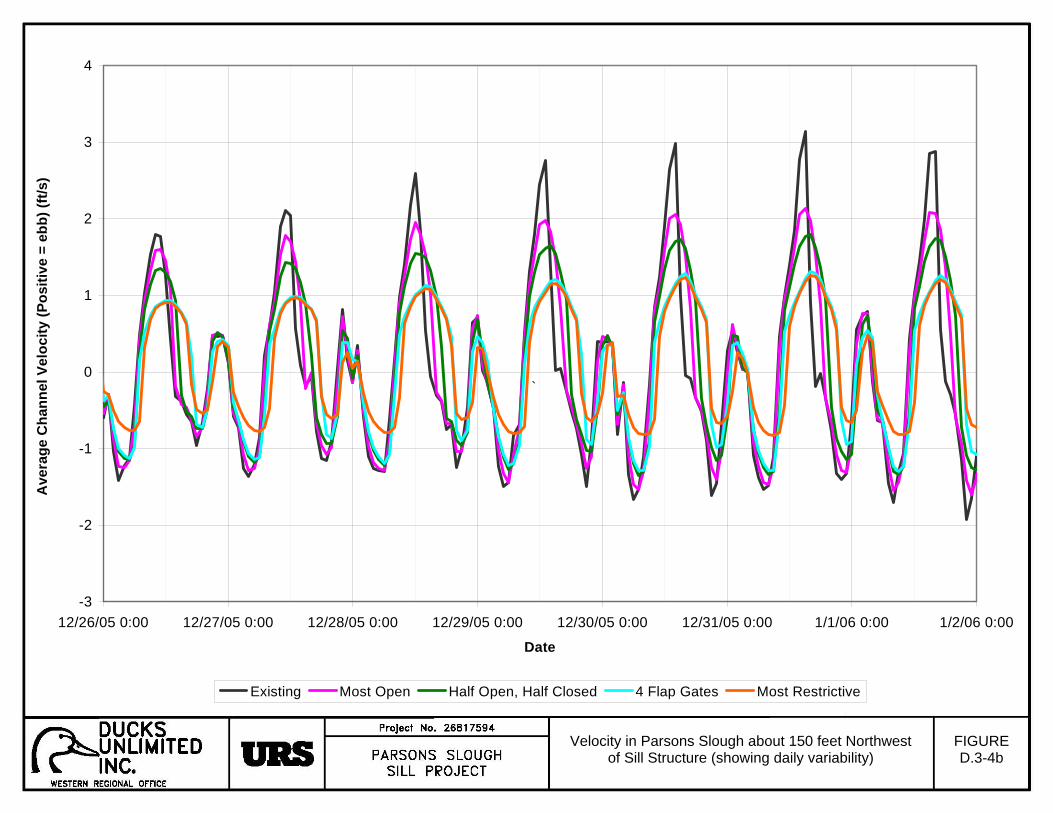
FIGURE D.3-4b
Velocity in Parsons Slough about 150 feet Northwest of Sill Structure (showing daily variability)
-3
-2
-1
0
1
2
3
4
12/26/05 0:00 12/27/05 0:00 12/28/05 0:00 12/29/05 0:00 12/30/05 0:00 12/31/05 0:00 1/1/06 0:00 1/2/06 0:00
Date
Ave
rage
Cha
nnel
Vel
ocity
(Pos
itive
= e
bb) (
ft/s)
Existing Most Open Half Open, Half Closed 4 Flap Gates Most Restrictive
`

FIGURE D.3-5a
Velocity in Parsons Slough about 10 feet Downstream of Railroad Bridge (showing spring/neap cycle)
-4
-3
-2
-1
0
1
2
3
4
5
6
12/14/05 12/16/05 12/18/05 12/20/05 12/22/05 12/24/05 12/26/05 12/28/05 12/30/05 1/1/06 1/3/06 1/5/06 1/7/06
Date
Ave
rage
Cha
nnel
Vel
ocity
(Pos
itive
= e
bb) (
ft/s)
Existing Most Open Half Open, Half Closed 4 Flap Gates Most Restrictive
`

FIGURE D.3-5b
Velocity in Parsons Slough about 10 feet Downstream of Railroad Bridge (showing daily variability)
-4
-3
-2
-1
0
1
2
3
4
5
6
12/26/05 0:00 12/27/05 0:00 12/28/05 0:00 12/29/05 0:00 12/30/05 0:00 12/31/05 0:00 1/1/06 0:00 1/2/06 0:00
Date
Ave
rage
Cha
nnel
Vel
ocity
(Pos
itive
= e
bb) (
ft/s)
Existing Most Open Half Open, Half Closed 4 Flap Gates Most Restrictive
`

FIGURE D.3-6
Approximate Velocity Profile at UPRR Bridge for Sill Velocity of 12 ft/s
0
2
4
6
8
10
12
14
0 2 4 6 8 10 12 14
Velocity (ft/s)
Dep
th (f
t)

DRAWINGS

Dixon Marine Services, Inc


Parsons Slough
Sill Project
Adjustable Weir - 30% Design
Calculations Book
January 2010

Page of
Job Parsons Slough Sill Project Project No. 26817594 Sheet of
Description Adjustable Weir - 30% Design Computed by W. Li Date
Checked by A. Gotauco Date
TABLE OF CONTENTSPage
1.0 Introduction 1
2.0 Design Criteria 2
2.1 Dimensions 2
2.2 Loading 3
2.3 Load Combinations 4
2.4 Additional Design Parameters 4
2.5 Assumptions 5
3.0 Calculation of Demand Forces 6
3.1 Case 1: Seismic 6
3.2 Case 2: Wave Force 9
3.3 Case 3: Wind 12
3.4 Summary of Demands Forces 14
4.0 Design 15
4.1 Column Design 15
4.2 Sill Design 17
4.3 H-pile Sleeve Design 18
4.4 Design of Sill Plate Stiffeners 21
4.5 Summary of Design 23
5.0 Quantities 24
6.0 References 27
1/12/2010
Reference
1/12/2010

Page of
Job Parsons Slough Sill Project Project No. 26817594 Sheet of
Description Adjustable Weir - 30% Design Computed by W. Li Date
Checked by A. Gotauco Date
1.0 Introduction
The design presented herein represents the preliminary (30% design level)
design of the subject weir. It is not intended as a final design nor should
this design be used to construct the weir.
The adjustable weir support structure contained in this Calculation Book is
designed in accordance with the U.S. Army Corps' Engineering Manuals
(Ems). In addition, design and detailing procedures provided by the
American Institute of Steel Construction's (AISC) Steel Construction
Manual were used as appropriate.
1/12/2010
Reference
A sill and an adjustable weir are proposed for the mouth of Parsons Slough
for protection against erosion due to tidal flow. The base structure consists
of sheet piles, H-piles, and an earthen and rockfill embankement. The
proposed adjustable weir is a removable gated structure, with either
flashboards or panel mounted top-hinged tide gates.
This Calculation Book contains the 30% design of the steel columns and sill
plates that support the wood or plastifab flashboards. However, the current
design can be modified in the future to support other types of adjustable
weirs. This Calculation Book also contains the design of the sleeves and
bolted connections to anchor the adjustable weir support structure to h-piles
in the base structure. Other connections are not included in this 30%
design.
1/12/2010

Page of
Job Parsons Slough Sill Project Project No. 26817594 Sheet of
Description Adjustable Weir - 30% Design Computed by W. Li Date
Checked by A. Gotauco Date
2.0 Design Criteria
2.1 Dimensions
schematic of adjustable weir
3 typical bays between h-piles
main intermediate
column columns main column
18 ft
6 ft center to center
11.5
(sheetpiles not shown)
H-piles sill
top of weir elevation = 9.5 ft (at top of flashboards)
bottom of weir elevation = -2 ft (at sill)
bottom of channel elevation = -12 ft
assumed width of each support = 1 ft
width of each bay = 6 ft, center to center
tributary width per column = 6 ft
tributary width for h-piles = 18 ft (cross-stream direction)
tributary width for h-piles = 6 ft (upstream-downstream direction)
height per column = 11.5 ft
1/12/2010
Reference
1/12/2010

Page of
Job Parsons Slough Sill Project Project No. 26817594 Sheet of
Description Adjustable Weir - 30% Design Computed by W. Li Date
Checked by A. Gotauco Date
1/12/2010
Reference
1/12/2010
2.2 Loading
2.2.1 Earthquake
Design Basis Earthquake (DBE) with peak horizontal ground acceleration Kleinfelder
Table 4.2.1-1
PGA Sa(g) = 0.55 g
2.2.2 Hydrostatic Pressure
Hydrostatic pressures acts on the adjustable weir in the both the upstream and
downstream directions. The differential head between the upstream and
downstream directions is 5ft.
Hs = ρ·g·h per unit tributary width
where ρ = density of water = 64.2 pcf
g = gravitational acceleration (32.2 ft/s2)
h = height of water (max water elevation assumed to be El. 9.5 ft)
2.2.3 Added Hydrodynamic Masses
The effects of hydrodynamic forces acting on the weir are approximated by the
added hydrodynamic mass concept (Westergaard Method).
The added hydrodynamic masses will be lumped and applied at one location
(at the vertical height of the centroid of the parabolic distribution).
m = (7/8)·ρwater·√(hwater(hwater-zi) EM 1110-2-2100
Sec 4-7
This mass is applied to the structure as a pressure. The pressure is a parabolic
distribution with the total lump force calculated as follows:
P = (7/12)·(Sa)·(ρwater·g)√[hwater(hwater-zi)]·(tributary area) EM 1110-2-2100
Sec 4-7
2.2.4 Wave Action
Forces due to waves are included in the demand calculations. The forces
are calculated based on EM 1110-2-2104 (Ref).Em 1110-2-1614
F = (1/2)[ds(P1 + P2) + hc(P1 + P4)] (force per unit height of weir) Eqn. 2-31
where ds = depth of structure Em 1110-2-1614
P1, P2, P3, and P4 are breaking wave pressures at various elevations Fig 2-9
Waves forces are calculated based on the following assumptions:
1. waves are breaking waves.
2. wave forces act uniformly along the depth of the submerged structure (P2 = P1)
3. the top of the weir is assumed to be at the static wave line (SWL), therefore
no forces are considered above the SWL. (hc = 0)
Based on these assumptions, Eqn 2-31 can be simplied:
F = ds(P1) (force per unit height of weir)

Page of
Job Parsons Slough Sill Project Project No. 26817594 Sheet of
Description Adjustable Weir - 30% Design Computed by W. Li Date
Checked by A. Gotauco Date
1/12/2010
Reference
1/12/2010
2.2.5 Wind Load
Wind loading is calculated based on EM 1110-2-2502.
Non-hurricane wind velocity = 100 mph (conservative assumption)
Height of structure (adjustable weir) < 20 ftEM 1110-2-2502
Wind pressure (W) = 30 psf Sec 3-25
2.3 Load Combinations
EM 1110-2-2105
Case 1: 1.2 D + 1.2 Hs + 1.0 E Eqn (B-3)
Case 2: 1.2 D + 1.4 Hs + 1.0 Wa Eqn (B-1a)
Case 3: 1.3 Wi
where D = Dead load
Hs = Hydrostatic Load
E = Design Basis Earthquake (DBE) load
Wa = Breaking wave forces
Wi = Wind load
2.4 Additional Design Parameters
Type of Adjustable Weir
The calculations for the current design is for a flashboard type of weir. However
the design can be modified for other types of weirs.
H-Piles
Size: W12x84
Spacing: 6 ft center-to-center (upstream-downstream direction)
18 ft center-to-center (crossstream direction)
Sill
Length1 = 3 ft (upstream-downstream direction between h-piles)
Length1 = 9 ft (upstream-downstream direction at h-piles)

Page of
Job Parsons Slough Sill Project Project No. 26817594 Sheet of
Description Adjustable Weir - 30% Design Computed by W. Li Date
Checked by A. Gotauco Date
1/12/2010
Reference
1/12/2010
2.5 Assumptions
Dimensions
1. Center to center distance between vertical supports is 6ft. This provides
+/- 5 ft clear spacing between supports.
Loading
1. Seismic loading only considers horizontal ground accelerations. The worst
seismic loading case is for eathquake motion in the upstream-downstream.
direction. Seismic loading in the cross-stream and vertical directions
is considered minimal and not included in these calculations.
2. Added hydrodynamic effects are approximated by Westergaard's
method. The forces are applied as a single lumped force at
the vertical height of the centroid of the parabolic distribution.
3. Wave force calculation assumes breaking waves with wave height
conservatively assumed at 2ft. The type of waves is assumed to be breaking
waves. The pressure distribution is assumed to be uniform.
4. The direction of flow, and related loading such as wave force, depends on
the direction of the tide. However, the structure is symmetric in
the upstream-downstream direction and is applicable for direction of flow
in either direction.
5. Maximum hydraulic head differential is assumed to be 5 ft. This is
conservatively assumed to occur at maximum water elevation (maximum tide
elevation plus required design sea level rise), which is approx. El. 9.5 ft.
6. For Case 3 (wind loading), the water elevation is assumed to be less than
El. -2 ft, which is at the base of the adjustable weir.

Page of
Job Parsons Slough Sill Project Project No. 26817594 Sheet of
Description Adjustable Weir - 30% Design Computed by W. Li Date
Checked by A. Gotauco Date
3.0 Calculation of Demands Forces
The adjustable weir is designed for a differential head of 5ft. The worst loading
case is with the gate closed and the following for each case:
Case 1: direction of earthquake opposite the direction of flow
Case 2: wave forces acting in the direction of flow
Case 3: water elevation at El. -2 ft with wind at 30 psf
3.1 Case 1
direction of flow direction of earthquake
e-add Fadd
Fadd-eq El. 9.5 ft
Feq ht
Fhdu Fhsu
hu/2
Fhsd Fhdd
2hu/5 Fd .
hu/3 hd/3 2hd/5 El. -2 ft
(not drawn to scale) Ru-pile Rd-pile
d-pile
a. Fd = self weight of column
b. Feq = seismic load
c. Fadd = additional dead load (e.g. platform)
d. Fadd-eq = seismic load due to additional dead load
e. Fhsu = hydrostatic load - upstream
f. Fhsd = hydrostatic load - downstream
g. Fhdu = hydrodynamic load - upstream
h. Fhdd = hydrodynamic load - downstream
ht = total height of adjustable weir = 11.5 ft
hu = upstream water height = 11.5 ft (from top of sill)
hd = downstream water height = 6.5 ft (from top of sill)
e-add = distance between c.g. of column and center of platform = 2.5 ft
Ru-pile = Reaction at upstream pile
Rd-pile = Reaction at downstream pile
d-pile = center to center distance between piles = 6 ft
1/12/2010
Reference
1/12/2010

Page of
Job Parsons Slough Sill Project Project No. 26817594 Sheet of
Description Adjustable Weir - 30% Design Computed by W. Li Date
Checked by A. Gotauco Date
1/12/2010
Reference
1/12/2010
tributary width (w) = 6 ft
Sa = 0.55 gρwater = 64.2 pcf/g for seawater
El. -12 ft, elevation at bottom of channel at weir
du-channel = 21.5 ft, depth of channel just upstream of weir
dd-channel = 16.5 ft, depth of channel just downstream of weir
a. Fd = 0.1 kips/ft x 11.5 ft (assumed weight)
+ 0.11 kips x 12 boards (assumed weight)
Fd = 2.47 kips
b. Feq = Fd (Sa) = 1.36 kips
c. Fadd = 0.3 kips/ft x 6 ft (assumed additional weight)
Fadd = 1.8
d. Fadd-eq = Fadd (Sa) = 0.99 kips
e. Fhsu = 0.5(ρwater·g·hu)·hu·w = 25.47 kips
f. Fhsd = 0.5(ρwater·g·hd)·hd·w = 8.14 kips
g. Fhdu = (7/12)(Sa)(ρwater·g)√(du-channel·hu)(hu)(w)
Fhdu = 22.35 kips
h. Fhdd = (7/12)(Sa)(ρwater·g)√(dd-channel·hd)(hd)(w)
Fhdd = 8.32 kips
Load combination
1.2 D + 1.2 Hs + 1.0 E
Column: Maximum Axial Demand
Pu -max = 1.2 (Fd + Fadd)
Pu -max = 5.124 kips at base of column
Column: Maximum Shear Demand
Vu-max = 1.2 (Fhsu - Fhsd) + 1.0 (Feq + Fadd-eq + Fhdu + Fhdd)
Vu-max = 53.82 kips at base of column

Page of
Job Parsons Slough Sill Project Project No. 26817594 Sheet of
Description Adjustable Weir - 30% Design Computed by W. Li Date
Checked by A. Gotauco Date
1/12/2010
Reference
1/12/2010
Column: Maximum Bending Moment Demand
Mu-add = 1.2 [Fadd(e-add)] moment due to eccentric additional loading
Mu-add = 5.40 kip-ft
Mu-hs = 1.2 [Fhsu(hu/3) - Fhsd(hd/3)] moment due to hydrostatic loading
Mu-hs = 96.01 kip-ft
Mu-hd = 1.0 [Fhdu(2hu/5) + Fhdd(2hd/5)] moment due to hydrodynamic loading
Mu-hd = 124.43
Mu-eq = 1.0 [Feq(hu/2) + Fadd-eq(hu)] moment due to inertial forces of
Mu-eq = 19.20 kip-ft adjustable weir
Mu-max = Mu-add + Mu-hs + Mu-hd + Mu-eq
Mu-max = 245.04 kip-ft
Piles: Maximum Axial Demand
Span length per set of h-pile =
3 bays x 6 ft/bay = 18 ft
Rd-pile = (3bays) x [(Mu-max)/(d-pile) + 1.2 (Fd + Fadd)]
Rd-pile = 137.89 kips (compression)
Ru-pile = (3 bays) x [(Mu-max)/(d-pile)]
Ru-pile = 122.52 kips (tension)
Sill: Maximum Shear Demand
Vu-max = max(Rd-pile, Ru-pile)
Vu-max = 137.89 kips
Sill: Maximum Bending Moment Demand
Mu-max = [max(Rd-pile, Ru-pile)](d-pile/2)
Mu-max = 413.67 kip-ft
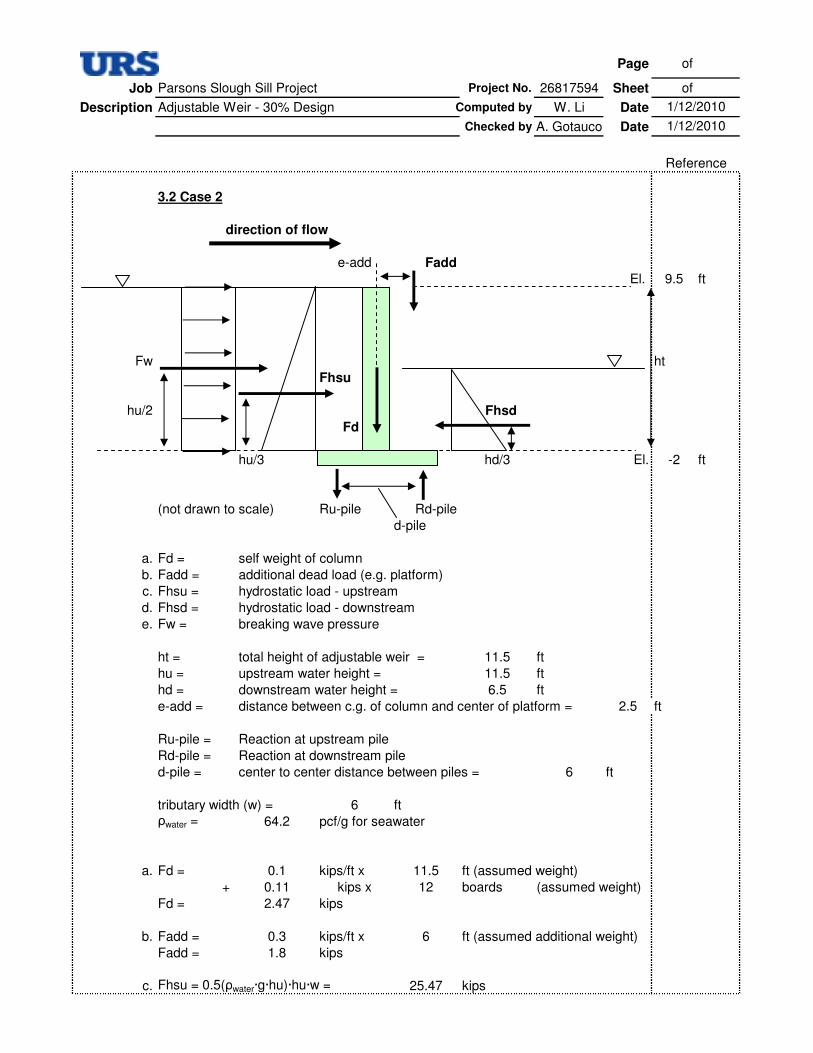
Page of
Job Parsons Slough Sill Project Project No. 26817594 Sheet of
Description Adjustable Weir - 30% Design Computed by W. Li Date
Checked by A. Gotauco Date
1/12/2010
Reference
1/12/2010
3.2 Case 2
direction of flow
e-add Fadd
El. 9.5 ft
Fw ht
Fhsu
hu/2 Fhsd
Fd .
hu/3 hd/3 El. -2 ft
(not drawn to scale) Ru-pile Rd-pile
d-pile
a. Fd = self weight of column
b. Fadd = additional dead load (e.g. platform)
c. Fhsu = hydrostatic load - upstream
d. Fhsd = hydrostatic load - downstream
e. Fw = breaking wave pressure
ht = total height of adjustable weir = 11.5 ft
hu = upstream water height = 11.5 ft
hd = downstream water height = 6.5 ft
e-add = distance between c.g. of column and center of platform = 2.5 ft
Ru-pile = Reaction at upstream pile
Rd-pile = Reaction at downstream pile
d-pile = center to center distance between piles = 6 ft
tributary width (w) = 6 ftρwater = 64.2 pcf/g for seawater
a. Fd = 0.1 kips/ft x 11.5 ft (assumed weight)
+ 0.11 kips x 12 boards (assumed weight)
Fd = 2.47 kips
b. Fadd = 0.3 kips/ft x 6 ft (assumed additional weight)
Fadd = 1.8 kips
c. Fhsu = 0.5(ρwater·g·hu)·hu·w = 25.47 kips

Page of
Job Parsons Slough Sill Project Project No. 26817594 Sheet of
Description Adjustable Weir - 30% Design Computed by W. Li Date
Checked by A. Gotauco Date
1/12/2010
Reference
1/12/2010
d. Fhsd = 0.5(ρwater·g·hd)·hd·w = 8.14 kips
e. Fw = d(P1) (tributary width)
P1 = (α1 + α2)·γwater·Hb
α1 = 0.6 + (1/2)[(4πh/L)/(sinh(4πh/L))]2
α2 = min[ ((hb-d)/(3hb))(Hb/d)2, (2d/Hb)]
where Hb = wave height = 2 ft assumption
L = wave length = large assumption
h = hb = water depth where Hb is determined = channel depth = 21.5 ft
γwater = specific weight of water = 64.2 pcf
d = ds = depth of weir = 11.5 ft
for large L, (4πh/L) --> 0, therefore α1 = 0.6
α2 = min[ ((hb-d)/(3hb))(Hb/d)2 , (2d/Hb) ]
α2 = min[ 0.005 , 11.5 ]
α2 = 0.005
Fw = d(P1) (w) = d(α1 + α2)·γwater·Hb (w)
Fw = 5.36 kips
Load combination
1.2 D + 1.4 Hs + 1.0 Wa
Column: Maximum Axial Demand
Pu -max = 1.2 (Fd + Fadd)
Pu -max = 5.124 kips at base of column
Column: Maximum Shear Demand
Vu-max = 1.2 (Fhsu - Fhsd) + 1.0 Fw
Vu-max = 26.16 kips at base of column

Page of
Job Parsons Slough Sill Project Project No. 26817594 Sheet of
Description Adjustable Weir - 30% Design Computed by W. Li Date
Checked by A. Gotauco Date
1/12/2010
Reference
1/12/2010
Column: Maximum Bending Moment Demand
Mu-add = 1.2 [Fadd(e-add)] moment due to eccentric additional loading
Mu-add = 5.4 kip-ft
Mu-hs = 1.2 [Fhsu(hu/3) - Fhsd(hd/3)] moment due to hydrostatic loading
Mu-hs = 96.01 kip-ft
Mu-i = 1.0[Fw(hu/2)] moment due to hydrostatic loading
Mu-i = 30.80 kip-ft
Mu-max = Mu-add + Mu-hs + Mu-i
Mu-max = 132.22 kip-ft
Piles: Maximum Axial Demand
Rd-pile = (Mu-max)/(d-pile) + 1.2 (Fd + Fadd)
Rd-pile = 27.16 kips (compression)
Ru-pile = (Mu-max)/(d-pile)
Ru-pile = 22.04 kips (tension)
Sill: Maximum Shear Demand
Vu-max = max(Rd-pile, Ru-pile)
Vu-max = 27.16 kips
Sill: Maximum Bending Moment Demand
Mu-max = [max(Rd-pile, Ru-pile)](d-pile/2)
Mu-max = 81.48 kips

Page of
Job Parsons Slough Sill Project Project No. 26817594 Sheet of
Description Adjustable Weir - 30% Design Computed by W. Li Date
Checked by A. Gotauco Date
1/12/2010
Reference
1/12/2010
3.3 Case 3
direction of flow
e-add Fadd
El. 9.5 ft
Fw ht
ht/2
Fd .
hd/3 El. -2 ft
(not drawn to scale) Ru-pile Rd-pile
d-pile
a. Fd = self weight of column
b. Fadd = additional dead load (e.g. platform)
c. Fw = wind load
ht = total height of adjustable weir = 11.5 ft
e-add = distance between c.g. of column and center of platform = 2.5 ft
Ru-pile = Reaction at upstream pile
Rd-pile = Reaction at downstream pile
d-pile = center to center distance between piles = 6 ft
tributary width (w) = 6 ft
a. Fd = 0.1 kips/ft x 11.5 ft (assumed weight)
Fd = 1.15 kips
b. Fadd = 0.3 kips/ft x 6 ft (assumed additional weight)
Fadd = 1.8 kips
c. Fw = W(tributary area)
W = 30.00 psf, based on conservative assumption of EM 1110-2-2502
100 mph wind for walls 20 ft high or less Sec 3-25
Fw = 2.07 kips

Page of
Job Parsons Slough Sill Project Project No. 26817594 Sheet of
Description Adjustable Weir - 30% Design Computed by W. Li Date
Checked by A. Gotauco Date
1/12/2010
Reference
1/12/2010
Load combination
1.2 D + 1.3 Wi
Column: Maximum Axial Demand
Pu -max = 1.2 (Fd + Fadd)
Pu -max = 3.54 kips at base of column
Column: Maximum Shear Demand
Vu-max = 1.3 Fw
Vu-max = 2.69 kips at base of column
Column: Maximum Bending Moment Demand
Mu-add = 1.2 (Fadd(e-add)) moment due to eccentric additional loading
Mu-add = 5.4 kip-ft
Mu-w = 1.3 [Fw(ht)] moment due to hydrostatic loading
Mu-w = 30.95 kip-ft
Mu-max = Mu-add + Mu-w
Mu-max = 36.35 kip-ft
Piles: Maximum Axial Demand
Rd-pile = (Mu-max)/(d-pile) + 1.2 (Fd + Fadd)
Rd-pile = 9.60 kips (compression)
Ru-pile = (Mu-max)/(d-pile)
Ru-pile = 6.06 kips (tension)
Sill: Maximum Shear Demand
Vu-max = max(Rd-pile, Ru-pile)
Vu-max = 9.60 kips
Sill: Maximum Bending Moment Demand
Mu-max = [max(Rd-pile, Ru-pile)](d-pile/2)
Mu-max = 28.79 kips

Page of
Job Parsons Slough Sill Project Project No. 26817594 Sheet of
Description Adjustable Weir - 30% Design Computed by W. Li Date
Checked by A. Gotauco Date
1/12/2010
Reference
1/12/2010
3.4 Summary of Maximum Demands
Case 1 Case 2 Case 3 MAX
Column
Pu-max 5.12 5.12 3.54 5.12 kips
Vu-max 53.82 26.16 2.69 53.82 kips
Mu-max 245.04 132.22 36.35 245.04 kip-ft
H-piles
Rd-pile 137.89 27.16 9.60 137.89 kips (compression)
Ru-pile 122.52 22.04 6.06 122.52 kips (tension)
Sill
Vu-max 137.89 27.16 9.60 137.89 kips
Mu-max 413.67 81.48 28.79 413.67 kip-ft

Page of
Job Parsons Slough Sill Project Project No. 26817594 Sheet of
Description Adjustable Weir - 30% Design Computed by W. Li Date
Checked by A. Gotauco Date
4.0 Design
4.1 Column Design
Column design is evaluated for the intermediate columns. The main columns
are the same size except with a larger stiffened section. The controlling section
is, therefore, the intermediate columns.
Maximum Demands
Pu-max = 5.12 kips
Vu-max = 53.82 kips
Mu-max = 245.04 kip-ft
Steel Properties
fy = 36 ksi fu = 58 ksi
E = 29000 ksi
W14x74 Ag = 21.80 in2
d = 14.13 in
bf = 10.13 in direction of flow
tf = 0.81 in
dw = 14.13 in
tw = 0.44 in
Nominal wt = 74.00 lb/ft
Ixx = 795.00 in4
Sx = 111.97 in3
Zx = 126.00 in3 stiffeners
rx = 6.04 in
Iyy = 134.00 in4
Sy = 26.50 in3
Zy = 40.50 in3
ry = 2.48 in
Stiffened Ag = 44.92 in2
W14x74 d = 31.63 in
bf = 10.13 in
tf = 0.81 in
dw = 31.63 in
tw = 0.44 in
Nominal wt = 152.85 lb/ft
Ixx = 5398.23 in4
Sx = 341.39 in3 W14x74
Zx = 446.67 in3
rx = 10.96 in stiffeners
Iyy = 265.81 in4
Sy = 52.51 in3
Zy = 80.75 in3
ry = 2.43 in
1/12/2010
Reference
1/12/2010

Page of
Job Parsons Slough Sill Project Project No. 26817594 Sheet of
Description Adjustable Weir - 30% Design Computed by W. Li Date
Checked by A. Gotauco Date
1/12/2010
Reference
1/12/2010
Axial Φc·Pn = Φc·Ag·Fcr (W14x74 section only)
Φc = 0.9
Ag = 44.92 in2
Fcr = for λc ≤ 1.5, Fcr = (0.658λ^2
)Fy = 12.66 ksi
for λc > 1.5, Fcr = (0.877/λ2)Fy = 20.27 ksi
λc = (K·L/r·π)√(Fy/E)
K = 2 for fixed base cantilever
L = ht = 11.5 ft = 138 in
rx = 2.48 in
Fy = 36 ksi
E = 29000 ksi
λc = 1.25
Fcr = 12.66 ksi
Φc·Pn = 511.95 kips
Pu-max = 5.12 kips
CHECK OK
Bending Moment Φb·Mnx = Φb·Mp = Φb·FyZx (stiffened section)
Φb = 0.9
Fy = 36 ksi
Zx = 446.67 in3
Φb·Mnx = 14472.108 kip-in = 1206.009 kip-ft
Mux-max = 245.04 kip-ft
CHECK OK
Combined Axial Force and Bending Moment
AISC Eqn (H1-1a)
Pu-max/(Φc·Pn) + (8/9)[Mux-max/(Φb·Mnx)] = 0.19
AISC Eqn (H1-1b)
Pu-max/(2·Φc·Pn) + [Mux-max/(Φb·Mnx)] = 0.21
For Pu-max/(Φc·Pn) ≥ 0.2, use Eqn (H1-1a)
For Pu-max/(Φc·Pn) < 0.2, use Eqn (H1-1b)
Pu-max/(Φc·Pn) = 0.010 use Eqn (H1-1b)
Pu-max/(2·Φc·Pn) + [Mux-max/(Φb·Mnx)] = 0.21
CHECK OK

Page of
Job Parsons Slough Sill Project Project No. 26817594 Sheet of
Description Adjustable Weir - 30% Design Computed by W. Li Date
Checked by A. Gotauco Date
1/12/2010
Reference
1/12/2010
Shear Φv·Vn = Φv·(0.6·Fy·Aw) (W14x74 section only)
Φv = 0.9
Fy = 36 ksi
Aw = dw·tw = 6.18 in
Φv·Vn = 120.13 kips
Vu-max = 53.82 kips
CHECK OK
4.2 Sill Design
Vu-max = 137.89 kips
Mu-max = 413.67 kip-ft
Use 1.5 in. thick steel plate
t = 1.5 in
schematic of three bays of adjustable weir
(not drawn to scale)
H-piles
Vertical support
9 ft = L
3 ft
w = 3 ft 3 ft
Shear Φv·Vn = Φv·(0.6·Fy·Aw) (sill plate only)
Φv = 0.9
Fy = 36
Aw = W·t = 54 in2
Φv·Vn = 1049.76 kips
Vu-max = 137.89 kips
CHECK OK

Page of
Job Parsons Slough Sill Project Project No. 26817594 Sheet of
Description Adjustable Weir - 30% Design Computed by W. Li Date
Checked by A. Gotauco Date
1/12/2010
Reference
1/12/2010
Bending Moment Φb·Mnx = Φb·Mp = Φb·FyZx (stiffened sill plate)
Φb = 0.9
Fy = 36 ksi
Zx = 172.25 in3
Φb·Mnx = 5580.90 kip-in = 465.08 kip-ft
Mux-max = 413.67 kip-ft
CHECK OK
Ag = 66.00 in2
d = 25.50 in
bf = 36.00 in
tf = 1.50 in
dw = 25.50 in
tw = 0.50 in
Nominal wt = 224.58 lb/ft
Ixx = 2182.19 in4
Sx = 97.28 in3
Zx = 172.25 in3
rx = 5.75 in
Iyy = 5832.25 in4
Sy = 324.01 in3
Zy = 487.50 in3
ry = 9.40 in
4.3 H-pile Sleeve Design
H-pile size: W12x84
t = 0.685 in
12.28 in. x 12.295 in. outside to outside
use 4 13 in x 0.5 in plates
t = 0.5 in
d = 12.78 in x 13.30 in
12.78 in x 12.80 in (inside to inside clear distance)
inside clearance: OK OK
Rd-pile = 137.89 kips (compression)
Ru-pile = 122.52 kips (tension)
Vu-max = 53.82 kips

Page of
Job Parsons Slough Sill Project Project No. 26817594 Sheet of
Description Adjustable Weir - 30% Design Computed by W. Li Date
Checked by A. Gotauco Date
1/12/2010
Reference
1/12/2010
Shear - Sleeve Φv·Vn = Φv·(0.6·Fy·Aw) (2 sleeves)
Φv = 0.9
Fy = 36
Aw = 2·d·t = 12.78 in2
Φv·Vn = 496.89 kips
Vu-max = 53.82 kips
CHECK OK
Pin Connection
Ru-pile = 122.5 kips
sill
sleeve
pin
Use 1.5 in. dia A490 bolts
d = 1.5 in
Check shear strength of bolt:
Φ·Rn = Φ·Fv·Ab (2 planes of shear)
Φ = 0.75
Fv = 60 ksi
Ab = 1.77 in2
Φ·Rn = 159.04 kips
Ru-pile = 122.52 kips
CHECK OK

Page of
Job Parsons Slough Sill Project Project No. 26817594 Sheet of
Description Adjustable Weir - 30% Design Computed by W. Li Date
Checked by A. Gotauco Date
1/12/2010
Reference
1/12/2010
Check bearing strength of sleeve
h = d + 1/16 = 1.56 in
Lc ≥ 2d, Φ·Rn = 0.75(1.2·Lc·t·Fu)(2 planes)
Φ = 0.75
Fu = 58 ksi
t = 0.5 in
d = 1.5 in
edge distance = 6 in
Lc = (edge distance) - (h/2) = 5.22 in
Φ·Rn = 272.42 kips
Ru-pile = 122.52 kips
CHECK OK
Check bearing strength of H-pile
h = d + 1/16 = 1.56 in
Lc ≥ 2d, Φ·Rn = 0.75(1.2·Lc·t·Fu)(1 plane)
Φ = 0.75
Fu = 58 ksi
t = 0.685 in
d = 1.5 in
edge distance = 6 in
Lc = (edge distance) - (h/2) = 5.22
Φ·Rn = 186.61 kips
Ru-pile = 122.52 kips
CHECK OK

Page of
Job Parsons Slough Sill Project Project No. 26817594 Sheet of
Description Adjustable Weir - 30% Design Computed by W. Li Date
Checked by Date
4.4 Design of Sill Plate stiffeners
stiffeners for sill plate
Sill plate assumed to be simply supported by H-piles with vertical loading
Span (L1) = 6 ft per bay
Span (L2) = 18 ft between H-piles
Pp = live load
Pc = weight of platform and columns
Ff = flashboards
Fs = self weight
Height of columns = 11.5 ft
Weight of columns = ( 74 lb/ft) (height of columns)
= 0.85 kips per column
Length of platform = 6 ft per column
Weight of platform = ( 0.3 kips/ft) (length of platform)
= 1.80 kips per column
Pc = 2.65 kips
Weight of flashboards = ( 50 pcf) (width) (height)
width = 4 in
height = 11.5 ft
Ff = 0.19 kips/ft
Self weight of Sill = (Area) (490 pcf)
Fs = 0.18 kips/ft
Load Combination
1.2 D + 1.6 L
where Pp = 400 lbs for Live Load
Maximum Shear
Vu-max = 1.2 [(Ff·L2)/2 + (Fs·L2)/2 + (Pc)] + 1.6 (Pp/2)
Vu-max = 7.56 kips
Maximum Moment
Mu-max = 1.2 [(Pc·L1) + (Ff·L22/8) + (Fs·L2
2/8)] + 1.6 [Pp·L2/2]
Mu-max = 43.09 kip-ft
1/12/2010
Reference

Page of
Job Parsons Slough Sill Project Project No. 26817594 Sheet of
Description Adjustable Weir - 30% Design Computed by W. Li Date
Checked by Date
1/12/2010
Reference
Design
Sill Plate
Width = 3 ft = 36 in
Thickness = 1.5 in
Ix = 10.13 in4
Sx = 13.50 in3
Zx = 20.25 in3
Fy = 36 ksi
Vn = 0.6·Fy·Av
Vn = 1166.40 kips
Φ = 0.9
Φ·Vn = 1049.76 kips
Vu-max = 7.56 kips
CHECK OK
Mn = Zx·Fy
Mn = 729 kip-in = 60.75 kip-ft
Φ = 0.9
Φ·Mn = 54.68 kip-ft
Mu-max = 43.09 kip-ft
CHECK OK
Deflection
D = (Pa)/(24EI) (3L^2-4a^2) I = 10.13 in^4
Pc = 2.65 kips
D1 = 3.87 in
Pp = 0.4 kips
D2 = 0.78 in
D = 5wL^2 / 384EI Ff + Fs = 0.38 kips/ft
D3 = 3.62 in
Total D = 8.27 in

Page of
Job Parsons Slough Sill Project Project No. 26817594 Sheet of
Description Adjustable Weir - 30% Design Computed by W. Li Date
Checked by Date
1/12/2010
Reference
New Section - Add 1"x6" plates (vertical) at L =
D = (Pa)/(24EI) (3L^2-4a^2) I = 184.19 in^4
Pc = 2.65 kips
D1 = 0.21 in
Pp = 0.40 kips
D2 = 0.04 in
D = 5wL^2 / 384EI Ff + Fs = 0.38 kips/ft
D3 = 0.20 in
Total D = 0.46 in
A = 66 in2
I33 = 184.19 in4
Z33 = 64.25 in3
4.5 Summary of Design
Main Column: W14x74 with stiffeners (8"x½" web plates and 10"x¾" Fl. Plates)
Intermediate Column: W14x74 with stiffeners (8"x½" web plates and 10"x¾" Fl. Plates)
Slot for Flashboards: 2 L5x3x1/2
Sill: 1½" thick steel plate (9ft wide at main columns and 3ft at intermediate columns)
Two 6"x1" vertical stiffeners below sill plate
H-pile Sleeve: 2-13.3"x0.5" Fl. Plates and 2-12.8"x0.5" web plates
Connections:
H-pile to Sleeve Connection: 1½" diameter A490 HS bolts
Other Connections: TBD

Page of
Job Parsons Slough Sill Project Project No. 26817594 Sheet of
Description Adjustable Weir - 30% Design Computed by W. Li Date
Checked by A. Gotauco Date
5.0 Quantities
Weight of steel = 0.49 kcf
Summary of Weights
Columns = 14.47 kips
Column stiffeners = 4.48 kips
Sill = 29.16 kips
Angles for Flashboards = 2.61 kips
Sleeve for H-piles = 1.86 kips
Platform = 6.62 kips
Total = 59.20 kips
Column
W 14 X 74
Number of columns = 17
Length per column = 11.5 ft
Total column weight = 14.47 kips
Column Stiffeners
Main: 2 stiffeners x 7 columns
Flange : thickness = 0.75 in
width = 10 in
height = 24 in
Web: thickness = 0.5 in
width = 28 in
height (at column) = 24 in
height (at h-pile) = 52 in
Total volume = 1424 in3 per main column
Intermediate: 2 stiffeners x 10 columns
Flange : thickness = 0.75 in
width = 10 in
height = 24 in
Web: thickness = 0.5 in
width = 8 in
height (at column) = 24 in
height (at h-pile) = 32 in
Total volume = 584 in3 per intermediate column
Total stiffener volume = 9.15 ft3
Total stiffener weight = 4.48 kips
1/12/2010
Reference
1/12/2010

Page of
Job Parsons Slough Sill Project Project No. 26817594 Sheet of
Description Adjustable Weir - 30% Design Computed by W. Li Date
Checked by A. Gotauco Date
1/12/2010
Reference
1/12/2010
Sill
At main columns
width = 9 ft
length = 3 ft
thickness = 1.5 in
count = 7
Between main columns
width = 15 ft
length = 3 ft
thickness = 1.5 in
count = 5
Total sill volume = 51.75 ft3
stiffeners
width = 6 in
length = 93 ft
thickness = 1 in
count = 2
Total stiffener volume = 7.75 ft3
Total sill weight = 29.16 kips
Angles for Flashboards
L5x3x½
Number of angles per column = 1
Number of columns = 17
Height per column = 12
Weight/length of angle = 12.80 lbf
Total weight of angle = 2.61 kips

Page of
Job Parsons Slough Sill Project Project No. 26817594 Sheet of
Description Adjustable Weir - 30% Design Computed by W. Li Date
Checked by A. Gotauco Date
1/12/2010
Reference
1/12/2010
Sleeve for H-piles
Number of H-piles (supporting adjustable weir) = 14
Flange : thickness = 0.75 in
width = 13.30 in
height = 12 in
count = 2
Web: thickness = 0.75 in
width = 12.78 in
height = 12 in
count = 2
Total volume = 6570.9 in3 per sleeve
Total sleeve volume = 3.80 ft3
Total sleeve weight = 1.86 kips
Platform (sizes to be determined)
Railing (1.5" dia, t = 1/8") A = 0.28 in2
front 92 ft long
back 92 ft long
vertical 4 ft high X 47
Total Volume = 0.73 ft3
Total weight = 0.36 kips
Support beams
Main 17 @ 5 ft X 25 lbf assumption
Purlins 3 @ 92 ft X 10 lbf assumption
Total weight = 4.89 kips
Metal Grating
Area = 460.0 ft2 X 3 psf assumption
Total weight = 1.38 kips
Platform Total weight = 6.62 kips

Page of
Job Parsons Slough Sill Project Project No. 26817594 Sheet of
Description Adjustable Weir - 30% Design Computed by W. Li Date
Checked by A. Gotauco Date
6.0 References
3. U.S. Army Corps of Engineers, "Engineering Design - Retaining and Flood
Walls," EM 1110-2-2502, Department of the Army, Washing DC, September 1989.
5. Computers and Structures Inc. (CSI), "SAP2000 Section Designer," v. 14.1.0,
Berkeley, CA 1999-2009.
6. American Institute of Steel Construction Inc. (AISC), "Steel Construction Manual,"
13th Edition, 2005
7. Kleinfelder Inc., "Geotechnical Engienering Investigation For Union Pacific
Railroad Bridge (103.27) Replacement Project at Parsons Slough in Monterrey
County California," January 2002.
4. U.S. Army Corps of Engineers, "Engineering Design - Stability Analysis of
Concrete Structures," EM 1110-2-2100, Department of the Army, Washing DC,
December 2005.
1/12/2010
Reference
1. U.S. Army Corps of Engineers, "Engineering Design - Design of Coastal
Revetments, Seawalls, and Bulkheads," EM 1110-2-1614, Department of the Army,
Washing DC, June 1995.
2. U.S. Army Corps of Engineers, "Engineering Design - Design of Hydraulic Steel
Structures," EM 1110-2-2105, Department of the Army, Washing DC, March 1993.
1/12/2010

Parsons Slough Sill Project - Future Adjustable Weir Date 3/18/2010Engineers Opinion of Construction Cost - 30 Percent Design
Unit Cost Cost Unit Cost Cost
1 MOBILIZATION AND DEMOB 1 ls 120,000$ 120,000$ 160,000$ 160,000$ 2 PREPARE STAGING AREA 1 ls 200,000$ 200,000$ 290,000$ 290,000$ 3 ADJUSTABLE WEIR 1 ls 300,000$ 300,000$ 440,000$ 440,000$ 4 PLATFORM 1 ls 175,000$ 175,000$ 263,000$ 263,000$ 5 FLASHBOARDS 160 each 186$ 29,760$ 252$ 40,320$ 6 RESTORE STAGING AREA 1 ls 75,000$ 75,000$ 100,000$ 100,000$
899,760$ 1,293,320$ 89,976$ 129,332$
989,736$ 1,422,652$ 247,434$ 355,663$
1,237,170$ 1,778,315$
7 PANEL MOUNTED TIDE GATES 15 each 30000 450,000$ 38,300 574,500$ 45,000$ 57,450$
495,000$ 631,950$ 123,750$ 157,988$ 618,750$ 789,938$
Notes:12
Costruction costs are 1st quarter 2010 costs. Estimated construction cost does not include hazmat abatement, if any, legal feed and finance costs, permit and plan check fees, cost escalation, soft costs includingfees for design and engineering, construction and project management and other consulting costs or environmental costs.
SubtotalDesign Contingency (20%)
Total Estimated Construction Cost
General Requirements (10%)Subtotal
Design Contingency (20%)Total Estimated Construction Cost of Optional Items
Optional Items
Item Item Description Quantity UnitLow Range High Range
SubtotalGeneral Requirements (10%)

Parsons Slough Sill Project - Future Adjustable Weir Date 3/18/2010Engineers Opinion of Construction Cost - 30 Percent Design
Item Item Permanent Construction Sub- Direct Indirect Total Unit PriceNumber Description Material Matl/Exp Contract Total Charge Cost Used
1 MOBILIZATION AND DEMOB 1 ls 7,200 0 0 90,600 0 97,800 9,780 107,580 10,758 118,338 118,338.00 120,000.00 120,0002 PREPARE STAGING AREA 1 ls 22,920 23,520 0 51,000 0 164,539 16,454 180,993 18,099 199,092 199,092.43 200,000.00 200,0003 ADJUSTABLE WEIR 1 ls 9,168 200,000 0 18,000 0 246,088 24,609 270,697 27,070 297,766 297,766.48 300,000.00 300,0004 PLATFORM 1 ls 12,224 100,000 0 24,000 0 144,724 14,472 159,196 15,920 175,116 175,116.04 175,000.00 175,0005 FLASHBOARDS 160 each 3,056 9,376 0 6,000 0 24,579 2,458 27,037 2,704 29,741 185.88 186.00 29,7606 RESTORE STAGING AREA 1 ls 22,920 0 0 45,000 0 67,920 6,792 74,712 0 74,712 74,712.00 75,000.00 75,000
Totals 77,488 332,896 0 234,600 0 745,650 74,565 820,215 74,550 894,765 899,760
Summary of Low Range Cost
TotalProfit Total Unit PriceQuantity Unit Labor Equipment

Parsons Slough Sill Project - Future Adjustable Weir Date 3/18/2010Engineers Opinion of Construction Cost - 30 Percent Design
Activity or Description Pieces Quantity Unit Unit Cost Labor Permanent Construction Equipment Sub- DirectResource Material Matl/Exp Contract Total
BID ITEM 1Description MOBILIZATION AND DEMOB Unit = ls Takeoff Quan = 1
1.1 MOBILIZE EQUIPMENT Quantity: 1 ls Hours/Shift: 8
eqBC70 Barge and Crane 1 40,000 40,000 40,000eqB Barge 1 20,000 20,000 20,000eqPB Push Boat 1 4,000 4,000 4,000eqLDR Loader 1 2,000 2,000 2,000eqC70 Crane 1 4,000 4,000 4,000eqPU Pickup 2 300 600 600maBFLEXI Furnish floating docks 20 1,000 20,000 20,000
1.2 MOBILIZE PERSONNEL Quantity: 1 ls Hours/Shift: 8
laBO Boat Operator 1 1,300 1,300 1,300laCM Crewman 1 1,100 1,100 1,100laCR Crane Operator 2 1,400 2,800 2,800laL Laborer 2 1,000 2,000 2,000
Total Bid Item 1 7,200 0 90,600 0 97,800
BID ITEM 2Description PREPARE STAGING AREA Unit = ls Takeoff Quan = 1
2.1 Quantity: 1 lbs Hours/Shift: 8# = 14x40x84maHPILE Furnish piles 1 47,040 lbs 0.50 23,520 23,520maBFLEXI Furnish floating docks 3 60 months 1000.00 60,000 60,000rSTAX Sales Tax 7,099
0 83520 0 0 0 90,619
2.2 Quantity: 1 ls Hours/Shift: 860.0 Crew Hours Production: 0.02 Units/Hour Labor Pieces Equip Pieces
eqBC70 Barge and Crane 1 60.0 hr 250.00 15,000.00 15,000eqB Barge 2 120.0 hr 100.00 12,000.00 12,000eqPB Push Boat 1 60.0 hr 105.00 6,300.00 6,300eqLDR Loader 1 60.0 hr 115.00 6,900.00 6,900eqC70 Crane 1 60.0 hr 150.00 9,000.00 9,000eqPU Pickup 2 120.0 hr 15.00 1,800.00 1,800laBO Boat Operator 1 60.0 hr 72.00 4,320.00 4,320laCM Crewman 1 60.0 hr 60.00 3,600.00 3,600laCR Crane Operator 2 120.0 hr 70.00 8,400.00 8,400laL Laborer 2 120.0 hr 55.00 6,600.00 6,600
22,920 0 0 51,000 0 73,920Totals for Bid Item 2 1 ls 164,539.20 22,920 23,520 0 51,000 0 164,539
BID ITEM 3Description ADJUSTABLE WEIR Unit = ls Takeoff Quan = 1
3.1 FURNISH ADJUSTABLE WEIR Quantity: 51,400 lbs Hours/Shift: 8# = 100,000maFSTL Furnish prefabricated steel1 100,000 lbs 2.00 200,000 200,000
Low Range Cost Buildup

Parsons Slough Sill Project - Future Adjustable Weir Date 3/18/2010Engineers Opinion of Construction Cost - 30 Percent Design
Activity or Description Pieces Quantity Unit Unit Cost Labor Permanent Construction Equipment Sub- DirectResource Material Matl/Exp Contract Total
Low Range Cost Buildup
rSTAX Sales Tax 17,000
0 200000 0 0 0 217,000
3.2 PLACE ADJUSTABLE WEIR Quantity: 2 sections Hours/Shift: 824.0 Crew Hours Production: 0.08 Units/Hour Labor Pieces Equip Pieces
eqBC70 Barge and Crane 1 24.0 hr 250.00 6,000.00 6,000eqB Barge 1 24.0 hr 100.00 2,400.00 2,400eqPB Push Boat 1 24.0 hr 105.00 2,520.00 2,520eqLDR Loader 1 24.0 hr 115.00 2,760.00 2,760eqC70 Crane 1 24.0 hr 150.00 3,600.00 3,600eqPU Pickup 2 48.0 hr 15.00 720.00 720laBO Boat Operator 1 24.0 hr 72.00 1,728.00 1,728laCM Crewman 1 24.0 hr 60.00 1,440.00 1,440laCR Crane Operator 2 48.0 hr 70.00 3,360.00 3,360laL Laborer 2 48.0 hr 55.00 2,640.00 2,640laDIV Diver 1 24.0 hr 80.00 1,920.00 1,920
9,168 0 0 18,000 0 29,088Totals for Bid Item 3 1 ls 246,088.00 9,168 200,000 0 18,000 0 246,088
BID ITEM 4Description PLATFORM Unit = ls Takeoff Quan = 1
4.1 FURNISH PLATFORM Quantity: 10,000 lbs Hours/Shift: 8# = 100,000maFSTL Furnish prefabricated steel1 50,000 lbs 2.00 100,000 100,000rSTAX Sales Tax 8,500
0 100000 0 0 0 108,500
4.2 PLACE PLATFORM Quantity: 1 ls Hours/Shift: 832.0 Crew Hours Production: 0.03 Units/Hour Labor Pieces Equip Pieces
eqBC70 Barge and Crane 1 32.0 hr 250.00 8,000.00 8,000eqB Barge 1 32.0 hr 100.00 3,200.00 3,200eqPB Push Boat 1 32.0 hr 105.00 3,360.00 3,360eqLDR Loader 1 32.0 hr 115.00 3,680.00 3,680eqC70 Crane 1 32.0 hr 150.00 4,800.00 4,800eqPU Pickup 2 64.0 hr 15.00 960.00 960laBO Boat Operator 1 32.0 hr 72.00 2,304.00 2,304laCM Crewman 1 32.0 hr 60.00 1,920.00 1,920laCR Crane Operator 2 64.0 hr 70.00 4,480.00 4,480laL Laborer 2 64.0 hr 55.00 3,520.00 3,520
12,224 0 0 24,000 0 36,224Totals for Bid Item 4 1 ls 144,724.00 12,224 100,000 0 24,000 0 144,724
BID ITEM 5Description FLASHBOARDS Unit = each Takeoff Quan = 160
5.1 FURNISH FLASHBOARDS Quantity: 160 each Hours/Shift: 8
maFBRD Furnish wood 1 160 each 58.60 9,376 9,376maDAVIT Davit Crane 2 2 each 2675.00 5,350 5,350rSTAX Sales Tax 797

Parsons Slough Sill Project - Future Adjustable Weir Date 3/18/2010Engineers Opinion of Construction Cost - 30 Percent Design
Activity or Description Pieces Quantity Unit Unit Cost Labor Permanent Construction Equipment Sub- DirectResource Material Matl/Exp Contract Total
Low Range Cost Buildup
0 14726 0 0 0 15,523
5.2 INSTALL FLASHBOARDS Quantity: 160 each Hours/Shift: 88.0 Crew Hours Production: 20.00 Units/Hour Labor Pieces Equip Pieces
eqBC70 Barge and Crane 1 8.0 hr 250.00 2,000.00 2,000eqB Barge 1 8.0 hr 100.00 800.00 800eqPB Push Boat 1 8.0 hr 105.00 840.00 840eqLDR Loader 1 8.0 hr 115.00 920.00 920eqC70 Crane 1 8.0 hr 150.00 1,200.00 1,200eqPU Pickup 2 16.0 hr 15.00 240.00 240laBO Boat Operator 1 8.0 hr 72.00 576.00 576laCM Crewman 1 8.0 hr 60.00 480.00 480laCR Crane Operator 2 16.0 hr 70.00 1,120.00 1,120laL Laborer 2 16.0 hr 55.00 880.00 880
3,056 0 0 6,000 0 9,056Totals for Bid Item 5 160 each 153.62 3,056 9,376 0 6,000 0 24,579
BID ITEM 6Description RESTORE STAGING AREA Unit = ls Takeoff Quan = 1
6.1 Quantity: 1 ls Hours/Shift: 8
maFBRD Furnish prefabricated steel1 0 each 58.60 0 0rSTAX Sales Tax 0
0 0 0 0 0 0
6.2 Quantity: 1 ls Hours/Shift: 860.0 Crew Hours Production: 0.02 Units/Hour Labor Pieces Equip Pieces
eqBC70 Barge and Crane 1 60.0 hr 250.00 15,000.00 15,000eqB Barge 1 60.0 hr 100.00 6,000.00 6,000eqPB Push Boat 1 60.0 hr 105.00 6,300.00 6,300eqLDR Loader 1 60.0 hr 115.00 6,900.00 6,900eqC70 Crane 1 60.0 hr 150.00 9,000.00 9,000eqPU Pickup 2 120.0 hr 15.00 1,800.00 1,800laBO Boat Operator 1 60.0 hr 72.00 4,320.00 4,320laCM Crewman 1 60.0 hr 60.00 3,600.00 3,600laCR Crane Operator 2 120.0 hr 70.00 8,400.00 8,400laL Laborer 2 120.0 hr 55.00 6,600.00 6,600
22,920 0 0 45,000 0 67,920Totals for Bid Item 6 1 ls 67,920.00 22,920 0 0 45,000 0 67,920
Totals 77,488 332,896 0 234,600 0 745,650
OPTIONAL ITEMS
BID ITEM 7Description PANEL MOUNTED TIDE GATES Unit = each Takeoff Quan = 15
7.1 FURNISH TIDE GATES Quantity: 15 each Hours/Shift: 8
maTGATE Furnish tide gate 1 15 each 20,000 300,000 300,000rSTAX Sales Tax 25,500
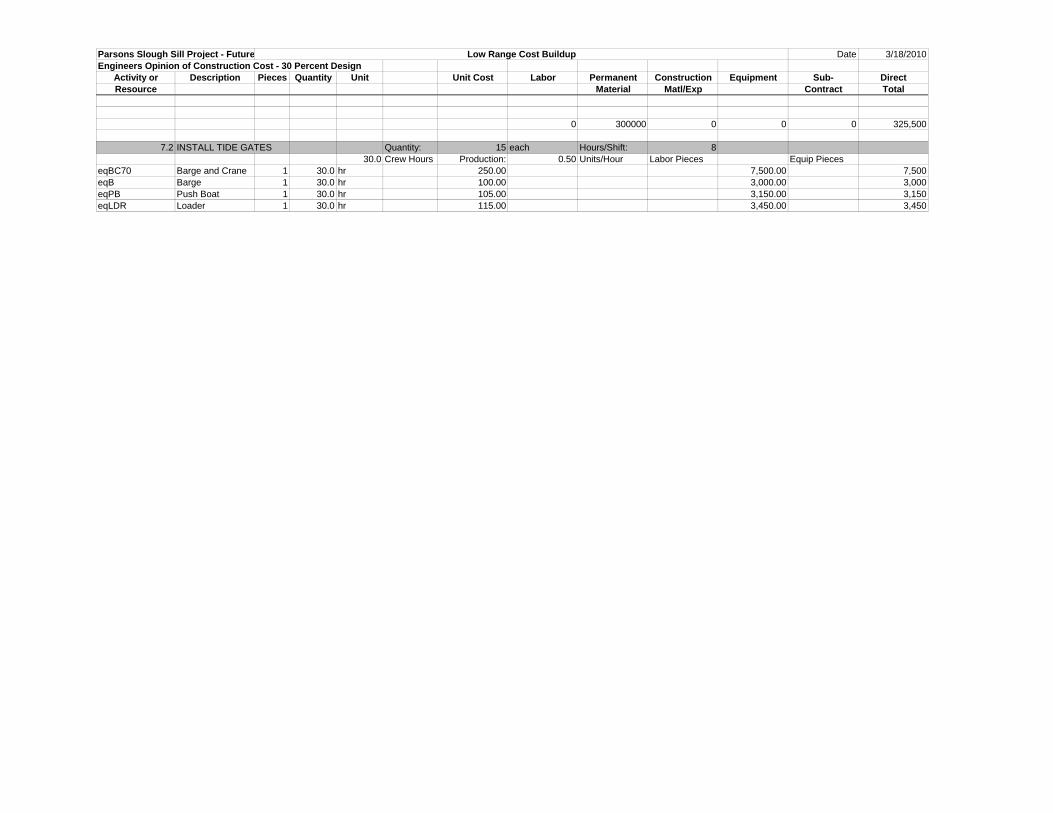
Parsons Slough Sill Project - Future Adjustable Weir Date 3/18/2010Engineers Opinion of Construction Cost - 30 Percent Design
Activity or Description Pieces Quantity Unit Unit Cost Labor Permanent Construction Equipment Sub- DirectResource Material Matl/Exp Contract Total
Low Range Cost Buildup
0 300000 0 0 0 325,500
7.2 INSTALL TIDE GATES Quantity: 15 each Hours/Shift: 830.0 Crew Hours Production: 0.50 Units/Hour Labor Pieces Equip Pieces
eqBC70 Barge and Crane 1 30.0 hr 250.00 7,500.00 7,500eqB Barge 1 30.0 hr 100.00 3,000.00 3,000eqPB Push Boat 1 30.0 hr 105.00 3,150.00 3,150eqLDR Loader 1 30.0 hr 115.00 3,450.00 3,450

Parsons Slough Sill Project - Future Adjustable Weir 3/18/2010Engineers Opinion of Construction Cost - 30 Percent Design
DESCRIPTION CODELOW RANGE UNIT PRICE UNIT COMMENT
-Sales Tax on Materials rSTAX 8.50% -Overhead rOVH 10.00% -Profit rPROF 10.00% -
-
Crane eqC70 150.00 hourFront End Loader eqLDR 115.00 hourBarge and Crane eqBC70 250.00 hourBarge eqB 100.00 hourPush Boat eqPB 105.00 hourPickup eqPU 15.00 hourFurnish floating docks maBFLEXI 1,000.00 month
Superintendent laSUP 80.00 hourForeman laFOR 66.00 hourBoat Operator laBO 72.00 hourCrewman laCM 60.00 hourCrane Operator laCR 70.00 hourLaborer laL 55.00 hourDiver laDIV 80.00 hour
Fabricated Steel maFSTL 2.00 lbFlashboards maFBRD 58.60 each quote for 12"x4"x 6-foot-longDavit Cranes maDAVIT 2,675.00 each quote for 1 stainless crane, 4 pedestals, 1 36' spool of stainless cableTide Gate maTGATE 20,000.00 each quote for stainless steel
Indirect and Markup Rates
Equipment Rates
Labor Rates
Material Quotes

Parsons Slough Sill Project - Future Adjustable Weir 3/18/2010Engineers Opinion of Construction Cost - 30 Percent Design
Production Rate
(units/hour) Unit Number UnitDuration (hours)
PREPARE STAGING AREA 2.2 0.01666667 Units/Hour 1 ls 60PLACE ADJUSTABLE WEIR 3.2 0.08333333 Units/Hour 1 section 12PLACE PLATFORM 4.2 0.03125 Units/Hour 1 ls 32PLACE FLASHBOARDS 5.2 20 Units/Hour 160 boards 8RESTORE STAGING AREA 6.2 0.01666667 Units/Hour 1 ls 60PLACE TIDE GATES 7.2 0.5 Units/Hour 4 each 8
CommentDescription Item
Production for Low Range Cost

Parsons Slough Sill Project - Future Adjustable Weir Date 3/18/2010Engineers Opinion of Construction Cost - 30 Percent Design
Item Item Permanent Construction Sub- Direct Indirect Total Unit PriceNumber Description Material Matl/Exp Contract Total Charge Cost Used
1 MOBILIZATION AND DEMOB 1 ls 7,200 0 0 123,800 0 131,000 13,100 144,100 14,410 158,510 158,510.00 160,000.00 160,0002 PREPARE STAGING AREA 1 ls 30,560 37,632 0 68,000 0 237,041 23,704 260,745 26,074 286,819 286,819.27 290,000.00 290,0003 ADJUSTABLE WEIR 1 ls 12,224 300,000 0 24,000 0 364,284 36,428 400,712 40,071 440,784 440,783.64 440,000.00 440,0004 PLATFORM 1 ls 18,336 150,000 0 36,000 0 217,086 21,709 238,795 23,879 262,674 262,674.06 263,000.00 263,0005 FLASHBOARDS 160 each 6,112 9,376 0 12,000 0 33,293 3,329 36,622 3,662 40,284 251.78 252.00 40,3206 RESTORE STAGING AREA 1 ls 30,560 0 0 60,000 0 90,560 9,056 99,616 0 99,616 99,616.00 100,000.00 100,000
Totals 104,992 497,008 0 323,800 0 1,073,263 107,326 1,180,590 108,097 1,288,687 1,293,320
Optional Items
7 PANEL MOUNTED TIDE GATES 15 each 22,920.00 375,000.00 0.00 45,000.00 0.00 474,795.00 47,480 522,275 52,227 574,502 38,300.13 38,300 574,500
Total
Summary of High Range Cost
Quantity Unit Labor Equipment Profit Total Unit Price

Parsons Slough Sill Project - Future Adjustable Weir Date 3/18/2010Engineers Opinion of Construction Cost - 30 Percent Design
Activity or Description Pieces Quantity Unit Unit Cost Labor Permanent Construction Equipment Sub- DirectResource Material Matl/Exp Contract Total
BID ITEM 1Description MOBILIZATION Unit = ls Takeoff Quan = 1
1.1 MOBILIZE EQUIPMENT Quantity: 1 ls Hours/Shift: 8
eqBC70 Barge and Crane 1 50,000 50,000 50,000eqB Barge 1 30,000 30,000 30,000eqPB Push Boat 1 5,000 5,000 5,000eqLDR Loader 1 3,000 3,000 3,000eqC70 Crane 1 5,000 5,000 5,000eqPU Pickup 2 400 800 800maBFLEXI Furnish floating docks 20 1,500 30,000 30,000
1.2 MOBILIZE PERSONNEL Quantity: 1 ls Hours/Shift: 8
laBO Boat Operator 1 1,300 1,300 1,300laCM Crewman 1 1,100 1,100 1,100laCR Crane Operator 2 1,400 2,800 2,800laL Laborer 2 1,000 2,000 2,000
7,200 0 123,800 0 131,000
BID ITEM 2Description PREPARE STAGING AREA Unit = ls Takeoff Quan = 1
2.1 Quantity: 1 lbs Hours/Shift: 8# = 14x40x84maHPILE Furnish piles 1 47,040 lbs 0.80 37,632 37,632maBFLEXI Furnish floating docks 3 60 months 1500.00 90,000 90,000rSTAX Sales Tax 10,849
0 127632 0 0 0 138,481
2.2 Quantity: 1 ls Hours/Shift: 880.0 Crew Hours Production: 0.01 Units/Hour Labor Pieces Equip Pieces
eqBC70 Barge and Crane 1 80.0 hr 250.00 20,000.00 20,000eqB Barge 2 160.0 hr 100.00 16,000.00 16,000eqPB Push Boat 1 80.0 hr 105.00 8,400.00 8,400eqLDR Loader 1 80.0 hr 115.00 9,200.00 9,200eqC70 Crane 1 80.0 hr 150.00 12,000.00 12,000eqPU Pickup 2 160.0 hr 15.00 2,400.00 2,400laBO Boat Operator 1 80.0 hr 72.00 5,760.00 5,760laCM Crewman 1 80.0 hr 60.00 4,800.00 4,800
High Range Cost Buildup

laCR Crane Operator 2 160.0 hr 70.00 11,200.00 11,200laL Laborer 2 160.0 hr 55.00 8,800.00 8,800
30,560 0 0 68,000 0 98,560Totals for Bid Item 2 1 ls 237,040.72 30,560 37,632 0 68,000 0 237,041
BID ITEM 3Description ADJUSTABLE WEIR Unit = ls Takeoff Quan = 1
3.1 FURNISH ADJUSTABLE WEIR Quantity: 51,400 lbs Hours/Shift: 8# = 100,000maFSTL Furnish prefabricated steel1 100,000 lbs 3.00 300,000 300,000rSTAX Sales Tax 25,500
0 300000 0 0 0 325,500
3.2 PLACE ADJUSTABLE WEIR Quantity: 2 sections Hours/Shift: 832.0 Crew Hours Production: 0.06 Units/Hour Labor Pieces Equip Pieces
eqBC70 Barge and Crane 1 32.0 hr 250.00 8,000.00 8,000eqB Barge 1 32.0 hr 100.00 3,200.00 3,200eqPB Push Boat 1 32.0 hr 105.00 3,360.00 3,360eqLDR Loader 1 32.0 hr 115.00 3,680.00 3,680eqC70 Crane 1 32.0 hr 150.00 4,800.00 4,800eqPU Pickup 2 64.0 hr 15.00 960.00 960laBO Boat Operator 1 32.0 hr 72.00 2,304.00 2,304laCM Crewman 1 32.0 hr 60.00 1,920.00 1,920laCR Crane Operator 2 64.0 hr 70.00 4,480.00 4,480laL Laborer 2 64.0 hr 55.00 3,520.00 3,520laDIV Diver 1 32.0 hr 80.00 2,560.00 2,560
12,224 0 0 24,000 0 38,784Totals for Bid Item 3 1 ls 364,284.00 12,224 300,000 0 24,000 0 364,284
BID ITEM 4Description PLATFORM Unit = ls Takeoff Quan = 1
4.1 FURNISH PLATFORM Quantity: 10,000 lbs Hours/Shift: 8# = 100,000maFSTL Furnish prefabricated steel1 50,000 lbs 3.00 150,000 150,000rSTAX Sales Tax 12,750
0 150000 0 0 0 162,750
4.2 PLACE PLATFORM Quantity: 1 ls Hours/Shift: 848.0 Crew Hours Production: 0.02 Units/Hour Labor Pieces Equip Pieces
eqBC70 Barge and Crane 1 48.0 hr 250.00 12,000.00 12,000eqB Barge 1 48.0 hr 100.00 4,800.00 4,800eqPB Push Boat 1 48.0 hr 105.00 5,040.00 5,040eqLDR Loader 1 48.0 hr 115.00 5,520.00 5,520

eqC70 Crane 1 48.0 hr 150.00 7,200.00 7,200eqPU Pickup 2 96.0 hr 15.00 1,440.00 1,440laBO Boat Operator 1 48.0 hr 72.00 3,456.00 3,456laCM Crewman 1 48.0 hr 60.00 2,880.00 2,880laCR Crane Operator 2 96.0 hr 70.00 6,720.00 6,720laL Laborer 2 96.0 hr 55.00 5,280.00 5,280
18,336 0 0 36,000 0 54,336Totals for Bid Item 4 1 ls 217,086.00 18,336 150,000 0 36,000 0 217,086
BID ITEM 5Description FLASHBOARDS Unit = each Takeoff Quan = 160
5.1 FURNISH FLASHBOARDS Quantity: 160 each Hours/Shift: 8
maFBRD Furnish wood 1 160 each 58.60 9,376 9,376maDAVIT Davit Crane 2 2 each 2675.00 5,350 5,350rSTAX Sales Tax 455
0 14726 0 0 0 15,181
5.2 INSTALL FLASHBOARDS Quantity: 160 each Hours/Shift: 816.0 Crew Hours Production: 10.00 Units/Hour Labor Pieces Equip Pieces
eqBC70 Barge and Crane 1 16.0 hr 250.00 4,000.00 4,000eqB Barge 1 16.0 hr 100.00 1,600.00 1,600eqPB Push Boat 1 16.0 hr 105.00 1,680.00 1,680eqLDR Loader 1 16.0 hr 115.00 1,840.00 1,840eqC70 Crane 1 16.0 hr 150.00 2,400.00 2,400eqPU Pickup 2 32.0 hr 15.00 480.00 480laBO Boat Operator 1 16.0 hr 72.00 1,152.00 1,152laCM Crewman 1 16.0 hr 60.00 960.00 960laCR Crane Operator 2 32.0 hr 70.00 2,240.00 2,240laL Laborer 2 32.0 hr 55.00 1,760.00 1,760
6,112 0 0 12,000 0 18,112Totals for Bid Item 5 160 each 208.08 6,112 9,376 0 12,000 0 33,293
BID ITEM 6Description RESTORE STAGING AREA Unit = ls Takeoff Quan = 1
6.1 Quantity: 1 ls Hours/Shift: 8
maFBRD Furnish prefabricated steel1 0 each 58.60 0 0rSTAX Sales Tax 0
0 0 0 0 0 0
6.2 Quantity: 1 ls Hours/Shift: 880.0 Crew Hours Production: 0.01 Units/Hour Labor Pieces Equip Pieces

eqBC70 Barge and Crane 1 80.0 hr 250.00 20,000.00 20,000eqB Barge 1 80.0 hr 100.00 8,000.00 8,000eqPB Push Boat 1 80.0 hr 105.00 8,400.00 8,400eqLDR Loader 1 80.0 hr 115.00 9,200.00 9,200eqC70 Crane 1 80.0 hr 150.00 12,000.00 12,000eqPU Pickup 2 160.0 hr 15.00 2,400.00 2,400laBO Boat Operator 1 80.0 hr 72.00 5,760.00 5,760laCM Crewman 1 80.0 hr 60.00 4,800.00 4,800laCR Crane Operator 2 160.0 hr 70.00 11,200.00 11,200laL Laborer 2 160.0 hr 55.00 8,800.00 8,800
30,560 0 0 60,000 0 90,560Totals for Bid Item 6 1 ls 90,560.00 30,560 0 0 60,000 0 90,560
Totals 104,992 497,008 0 323,800 0 1,073,263
OPTIONAL ITEMS
BID ITEM 7Description PANEL MOUNTED TIDE GATES Unit = each Takeoff Quan = 15
7.1 FURNISH TIDE GATES Quantity: 15 each Hours/Shift: 8
maTGATE Furnish tide gate 1 15 each 25,000 375,000 375,000rSTAX Sales Tax 31,875
0 375000 0 0 0 406,875
7.2 INSTALL TIDE GATES Quantity: 15 each Hours/Shift: 860.0 Crew Hours Production: 0.25 Units/Hour Labor Pieces Equip Pieces
eqBC70 Barge and Crane 1 60.0 hr 250.00 15,000.00 15,000eqB Barge 1 60.0 hr 100.00 6,000.00 6,000eqPB Push Boat 1 60.0 hr 105.00 6,300.00 6,300eqLDR Loader 1 60.0 hr 115.00 6,900.00 6,900eqC70 Crane 1 60.0 hr 150.00 9,000.00 9,000eqPU Pickup 2 120.0 hr 15.00 1,800.00 1,800laBO Boat Operator 1 60.0 hr 72.00 4,320.00 4,320laCM Crewman 1 60.0 hr 60.00 3,600.00 3,600laCR Crane Operator 2 120.0 hr 70.00 8,400.00 8,400laL Laborer 2 120.0 hr 55.00 6,600.00 6,600
22,920 0 0 45,000 0 67,920Totals for Bid Item 7 15 each 31,653.00 22,920 375,000 0 45,000 0 474,795

Parsons Slough Sill Project - Future Adjustable Weir 3/18/2010Engineers Opinion of Construction Cost - 30 Percent Design
DESCRIPTION CODEHIGH RANGE UNIT COST UNIT COMMENT
-Sales Tax on Materials rSTAX 8.50% -Overhead rOVH 10.00% -Profit rPROF 10.00% -
-
Crane eqC70 150.00 hourFront End Loader eqLDR 115.00 hourBarge and Crane eqBC70 250.00 hourBarge eqB 100.00 hourPush Boat eqPB 105.00 hourPickup eqPU 15.00 hourFurnish floating docks maBFLEXI 1,500.00 month
Superintendent laSUP 80.00 hourForeman laFOR 66.00 hourBoat Operator laBO 72.00 hourCrewman laCM 60.00 hourCrane Operator laCR 70.00 hourLaborer laL 55.00 hourDiver laDIV 80.00 hour
Fabricated Steel maFSTL 3.00 lbFlashboards maFBRD 58.60 each quote for 12"x4"x 6-foot-longDavit Cranes maDAVIT 2,675.00 each quote for 1 stainless crane, 4 pedestals, 1 36' spool of stainless cableTide Gate maTGATE 25,000.00 each quote for stainless steel
Indirect and Markup Rates
Equipment Rates
Labor Rates
Material Quotes

Parsons Slough Sill Project - Future Adjustable Weir 3/18/2010Engineers Opinion of Construction Cost - 30 Percent Design
Production Rate
(units/hour) Unit Number UnitDuration (hours)
PREPARE STAGING AREA 2.2 0.0125 Units/Hour 1 ls 80PLACE ADJUSTABLE WEIR 3.2 0.0625 Units/Hour 1 section 16PLACE PLATFORM 4.2 0.02083333 Units/Hour 1 ls 48PLACE FLASHBOARDS 5.2 10 Units/Hour 160 boards 16RESTORE STAGING AREA 6.2 0.0125 Units/Hour 1 ls 80PLACE TIDE GATES 7.2 0.25 Units/Hour 2 each 8
CommentDescription Item
Production for High Range Cost
Copyright © 2022 FDOKUMEN