Taphonomic and paleoecological change in the large mammal sequence from Boomplaas Cave, Western...
16
Taphonomic and paleoecological change in the large mammal sequence from Boomplaas Cave, western Cape, South Africa J. Tyler Faith Archaeology Program, School of Social Science, University of Queensland, Brisbane, QLD 4072, Australia article info Article history: Received 10 April 2013 Accepted 4 September 2013 Available online 5 October 2013 Keywords: Cape Floristic Region Howiesons Poort Last Glacial Maximum Later Stone Age Middle Stone Age Zooarchaeology abstract Excavations conducted by H.J. Deacon in the 1970s at Boomplaas Cave (BPA) uncovered a stratified sequence of Middle Stone Age (MSA) and Later Stone Age (LSA) deposits spanning the last >65,000 years. This study provides the first comprehensive and integrated taphonomic and paleoecological analysis of the BPA large mammals, with a focus on its implications for understanding human adaptations and environmental changes in southern Africa’s Cape Floristic Region (CFR), an area that features promi- nently in understanding modern human origins. Taphonomic data indicate a complex history of human, carnivore, and raptor accumulation of the large mammal assemblage. The anthropogenic signal is largely absent from the bottom of the sequence (>65,000 years ago), intermediate in MSA and LSA assemblages from w50,000 to 20,000 years ago, and strong in LSA deposits post-dating the Last Glacial Maximum (LGM). When viewed in the broader CFR context, the inferred occupation history of BPA is consistent with the hypothesis that both MSA and LSA human populations were concentrated on the submerged coastline from w60,000 to w20,000 years ago. Intensive occupation following the LGM parallels an apparent increase in regional population densities, which may have been driven in part by rising sea levels. The BPA ungulate assemblage is characterized by the rise and decline of a taxonomically diverse grazing community, which peaks during the LGM. These changes are not correlated with taphonomic shifts, meaning that they are likely driven by environmental factors, namely the expansion and contraction of grassland habitats. Changes in ungulate diversity indicate that effective precipitation was highest during the LGM, corresponding with an intensified winter rainfall system. This is consistent with recent arguments that the LGM in this region may not have been extremely harsh and arid. Ó 2013 Elsevier Ltd. All rights reserved. Introduction The archaeological record of southern Africa’s Cape Floristic Region (CFR) features prominently in understanding the behavioral and ecological context of early modern humans. Middle Stone Age (MSA) sites from the CFR document the earliest recurrent evidence for complex material culture and symbolic behavior. This evidence includes shell beads (Henshilwood et al., 2004; d’Errico et al., 2005), decorated ochre and ostrich eggshell (Henshilwood et al., 2002, 2009; Texier et al., 2010), worked pigments (Marean et al., 2007; Mackay and Welz, 2008; Watts, 2010; Henshilwood et al., 2011), lithic heat treatment (Brown et al., 2009), and microlithic technology (Brown et al., 2012) dating from >70,000 years ago to the later middle Pleistocene (w164,000 years ago at Pinnacle Point). The rich CFR record from >70,000 years ago is followed by an apparent depopulation of the region from w60,000 to w20,000 years ago, as evidenced by a rarity of human occupation sites (Mitchell, 2008). The few sites that do sample this time frame provide little evidence for behavioral complexity in the form of artwork or symbolism. The apparent depopulation has been attributed by some to extreme aridity (e.g., Klein et al., 2004), although this is inconsistent with paleoenvironmental records (Mitchell, 2008). Rather, populations may have been concentrated on the now submerged coastline (Mitchell, 2008; Marean, 2010). Understanding why signatures of behavioral complexity appear when and where they do requires an understanding of how they relate to past environments and human adaptations (Marean, 2010). To this end, this study explores the relationship between human behavior and environmental change over the last 65,000 years through an analysis of the large mammals from Boomplaas Cave (BPA, Fig. 1)(Klein, 1978; Deacon, 1979, 1995). Boomplaas Cave provides one of the few archaeological and paleoenvironmental records spanning this time period in the CFR. Boomplaas Cave is also one of a small number of sites to include a Howieson’s Poort (HP) lithic industry associated with well-preserved fauna. The E-mail address: [email protected]. Contents lists available at ScienceDirect Journal of Human Evolution journal homepage: www.elsevier.com/locate/jhevol 0047-2484/$ e see front matter Ó 2013 Elsevier Ltd. All rights reserved. http://dx.doi.org/10.1016/j.jhevol.2013.09.001 Journal of Human Evolution 65 (2013) 715e730
Transcript of Taphonomic and paleoecological change in the large mammal sequence from Boomplaas Cave, Western...
lable at ScienceDirect
Journal of Human Evolution 65 (2013) 715e730
Contents lists avai
Journal of Human Evolution
journal homepage: www.elsevier .com/locate/ jhevol
Taphonomic and paleoecological change in the large mammalsequence from Boomplaas Cave, western Cape, South Africa
J. Tyler FaithArchaeology Program, School of Social Science, University of Queensland, Brisbane, QLD 4072, Australia
a r t i c l e i n f o
Article history:Received 10 April 2013Accepted 4 September 2013Available online 5 October 2013
Keywords:Cape Floristic RegionHowiesons PoortLast Glacial MaximumLater Stone AgeMiddle Stone AgeZooarchaeology
E-mail address: [email protected].
0047-2484/$ e see front matter � 2013 Elsevier Ltd.http://dx.doi.org/10.1016/j.jhevol.2013.09.001
a b s t r a c t
Excavations conducted by H.J. Deacon in the 1970s at Boomplaas Cave (BPA) uncovered a stratifiedsequence of Middle Stone Age (MSA) and Later Stone Age (LSA) deposits spanning the last >65,000 years.This study provides the first comprehensive and integrated taphonomic and paleoecological analysis ofthe BPA large mammals, with a focus on its implications for understanding human adaptations andenvironmental changes in southern Africa’s Cape Floristic Region (CFR), an area that features promi-nently in understanding modern human origins. Taphonomic data indicate a complex history of human,carnivore, and raptor accumulation of the large mammal assemblage. The anthropogenic signal is largelyabsent from the bottom of the sequence (>65,000 years ago), intermediate in MSA and LSA assemblagesfrom w50,000 to 20,000 years ago, and strong in LSA deposits post-dating the Last Glacial Maximum(LGM). When viewed in the broader CFR context, the inferred occupation history of BPA is consistentwith the hypothesis that both MSA and LSA human populations were concentrated on the submergedcoastline from w60,000 to w20,000 years ago. Intensive occupation following the LGM parallels anapparent increase in regional population densities, which may have been driven in part by rising sealevels. The BPA ungulate assemblage is characterized by the rise and decline of a taxonomically diversegrazing community, which peaks during the LGM. These changes are not correlated with taphonomicshifts, meaning that they are likely driven by environmental factors, namely the expansion andcontraction of grassland habitats. Changes in ungulate diversity indicate that effective precipitation washighest during the LGM, corresponding with an intensified winter rainfall system. This is consistent withrecent arguments that the LGM in this region may not have been extremely harsh and arid.
� 2013 Elsevier Ltd. All rights reserved.
Introduction
The archaeological record of southern Africa’s Cape FloristicRegion (CFR) features prominently in understanding the behavioraland ecological context of early modern humans. Middle Stone Age(MSA) sites from the CFR document the earliest recurrent evidencefor complex material culture and symbolic behavior. This evidenceincludes shell beads (Henshilwood et al., 2004; d’Errico et al.,2005), decorated ochre and ostrich eggshell (Henshilwood et al.,2002, 2009; Texier et al., 2010), worked pigments (Marean et al.,2007; Mackay and Welz, 2008; Watts, 2010; Henshilwood et al.,2011), lithic heat treatment (Brown et al., 2009), and microlithictechnology (Brown et al., 2012) dating from >70,000 years ago tothe later middle Pleistocene (w164,000 years ago at PinnaclePoint).
The rich CFR record from >70,000 years ago is followed by anapparent depopulation of the region from w60,000 to w20,000
All rights reserved.
years ago, as evidenced by a rarity of human occupation sites(Mitchell, 2008). The few sites that do sample this time frameprovide little evidence for behavioral complexity in the form ofartwork or symbolism. The apparent depopulation has beenattributed by some to extreme aridity (e.g., Klein et al., 2004),although this is inconsistent with paleoenvironmental records(Mitchell, 2008). Rather, populations may have been concentratedon the now submerged coastline (Mitchell, 2008; Marean, 2010).
Understanding why signatures of behavioral complexity appearwhen and where they do requires an understanding of how theyrelate to past environments and human adaptations (Marean,2010). To this end, this study explores the relationship betweenhuman behavior and environmental change over the last 65,000years through an analysis of the large mammals from BoomplaasCave (BPA, Fig. 1) (Klein,1978; Deacon,1979,1995). Boomplaas Caveprovides one of the few archaeological and paleoenvironmentalrecords spanning this time period in the CFR. Boomplaas Cave isalso one of a small number of sites to include a Howieson’s Poort(HP) lithic industry associated with well-preserved fauna. The
Figure 1. The location of BPA and other sites mentioned in the text. Dashed line corresponds to LGM coastline at 120 m belowmodern sea level (Van Andel, 1989). BPA ¼ BoomplaasCave; DK1 ¼ Die Kelders Cave; BNK ¼ Byneskranskop Cave; BBC ¼ Blombos Cave; PP ¼ Pinnacle Point; NBC ¼ Nelson Bay Cave; KRM ¼ Klasies River Mouth.
J.T. Faith / Journal of Human Evolution 65 (2013) 715e730716
emergence and disappearance of the HP is the subject of substantialdiscussion (e.g., Wurz, 1999; Lombard, 2005; Clark and Plug, 2008;Jacobs et al., 2008; Chase, 2010; Clark, 2011; McCall and Thomas,2012) and BPA provides a unique opportunity to place this tech-nologywithin a long-term environmental and behavioral sequence.
To better understand human behavior and past environments ata time and place of substantial archaeological interest, this studypresents a taphonomic and paleoecological investigation of the BPAlarge mammals. The goal of the taphonomic analysis is to deter-mine who or what accumulated the large mammal remains, whichin turn provides a framework for reconstructing the occupationhistory of the cave, human subsistence behavior, and changes infaunal community composition. The goal of the paleoecologicalanalysis is to contribute to the growing understanding of climaticand environmental change in the CFR, especially with respect to itsimpact on large mammal communities and human populations.Together, these analyses provide an opportunity to examine theinterplay between human subsistence behavior, settlement stra-tegies, and ecological change through time.
CFR flora and fauna
The vegetation of the CFR is exceptionally diverse relative to itsgeographic area (w90,000 km2), latitude, precipitation, and pro-ductivity (Myers et al., 2000; Cowling and Lombard, 2002;Goldblatt and Manning, 2002; Linder and Hardy, 2004; Manning,2008). The primary vegetation types include fynbos and renos-terveld. Fynbos is dominant and characterized by hard-leavedevergreen shrubland occurring on nutrient-poor soils. Renos-terveld is found on more nutrient-rich soils and is composed ofevergreen asteraceous shrubs with a sparse understory of grass.Within both vegetation types, plant species with carbohydrate-richbulbs, corms, rhizomes, or tubers, are diverse and abundant(Cowling et al., 1997; Proches et al., 2006). This source of
carbohydrates may have featured prominently in the diets of MSApeople (Deacon, 1993; Marean, 2010), and is documented insouthern African ethnographic accounts (Lee, 1979) and Later StoneAge (LSA) sites (Liengme, 1987; Deacon, 1993).
Like the vegetation, the coastal margin of the CFR is rich inpotential food sources, supporting more than 3000 species ofmollusk and 2000 species of fish (Branch and Branch, 1992;Gibbons, 1999; Griffiths et al., 2010). Archaeological sites along themodern coastline demonstrate that people have long exploitedmarine resources, including shellfish and Cape fur seals (Arctoce-phalus pusillus) (Klein, 1976; Volman, 1978; Klein and Cruz-Uribe,2000; Henshilwood et al., 2001; Parkington, 2003; Marean et al.,2007; Jerardino and Marean, 2010). The earliest evidence for ma-rine resource exploitation dates to w164,000 years ago at PinnaclePoint (Marean et al., 2007; Jerardino and Marean, 2010).
Whereas plant and marine foods are abundant and diverse, theshrubby vegetation found across the CFR today supports animpoverished large mammal community. Historic records andHolocene faunal assemblages indicate that the dominant ungulatesincluded a small number of small-bodied browsers, such as Capegrysbok (Raphicerus melanotis), steenbok (Raphicerus campestris),and duiker (Sylvicapra grimmia) (Skead, 1980, 2011; Klein, 1983).Large grazers are rare, due to the limited availability and produc-tivity of grassy habitats (Boshoff and Kerley, 2001; Boshoff et al.,2001; Faith, 2011a). However, this characterization does not applyto glacial phases of the late Pleistocene, when large grazers wereoften abundant and diverse (e.g., Klein, 1983). This likely reflectsexpanded grasslands and perhaps also the presence of an extinctmigratory ecosystem (Marean, 2010; Faith and Thompson, 2013).
Boomplaas Cave
Boomplaas Cave is located on the southern flanks of theSwartberg Mountains overlooking the Cango River Valley,
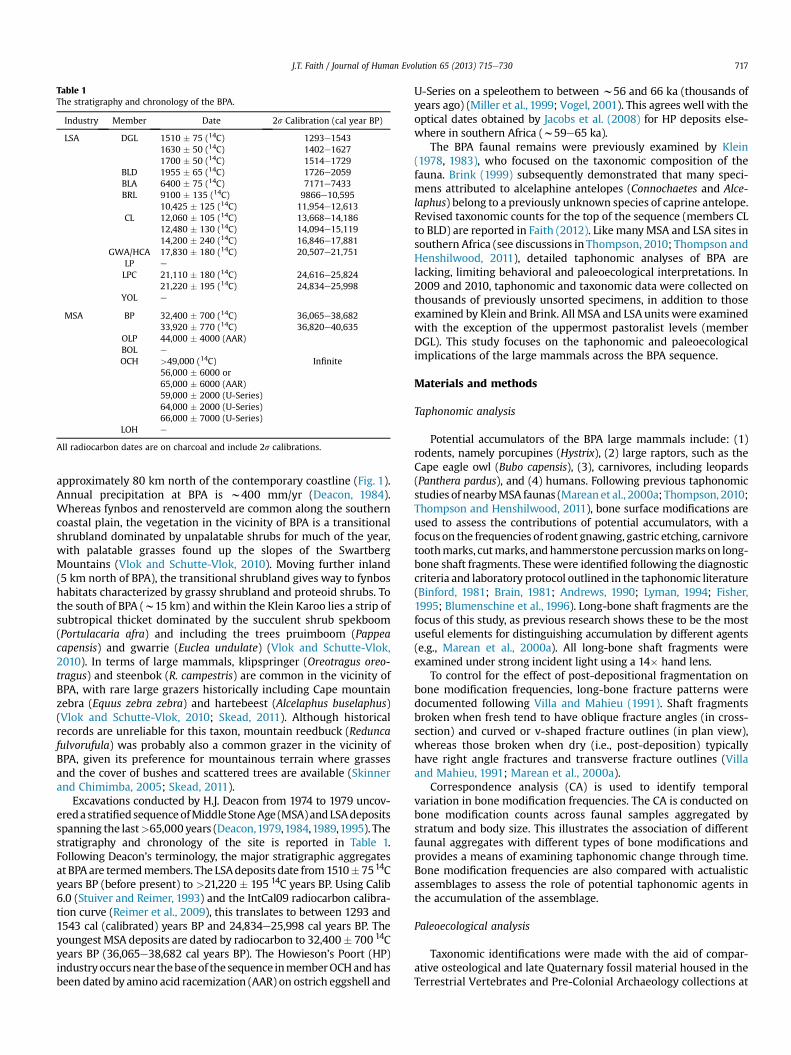
Table 1The stratigraphy and chronology of the BPA.
Industry Member Date 2s Calibration (cal year BP)
LSA DGL 1510 � 75 (14C) 1293e15431630 � 50 (14C) 1402e16271700 � 50 (14C) 1514e1729
BLD 1955 � 65 (14C) 1726e2059BLA 6400 � 75 (14C) 7171e7433BRL 9100 � 135 (14C) 9866e10,595
10,425 � 125 (14C) 11,954e12,613CL 12,060 � 105 (14C) 13,668e14,186
12,480 � 130 (14C) 14,094e15,11914,200 � 240 (14C) 16,846e17,881
GWA/HCA 17,830 � 180 (14C) 20,507e21,751LP e
LPC 21,110 � 180 (14C) 24,616e25,82421,220 � 195 (14C) 24,834e25,998
YOL e
MSA BP 32,400 � 700 (14C) 36,065e38,68233,920 � 770 (14C) 36,820e40,635
OLP 44,000 � 4000 (AAR)BOL e
OCH >49,000 (14C) Infinite56,000 � 6000 or65,000 � 6000 (AAR)59,000 � 2000 (U-Series)64,000 � 2000 (U-Series)66,000 � 7000 (U-Series)
LOH e
All radiocarbon dates are on charcoal and include 2s calibrations.
J.T. Faith / Journal of Human Evolution 65 (2013) 715e730 717
approximately 80 km north of the contemporary coastline (Fig. 1).Annual precipitation at BPA is w400 mm/yr (Deacon, 1984).Whereas fynbos and renosterveld are common along the southerncoastal plain, the vegetation in the vicinity of BPA is a transitionalshrubland dominated by unpalatable shrubs for much of the year,with palatable grasses found up the slopes of the SwartbergMountains (Vlok and Schutte-Vlok, 2010). Moving further inland(5 km north of BPA), the transitional shrubland gives way to fynboshabitats characterized by grassy shrubland and proteoid shrubs. Tothe south of BPA (w15 km) andwithin the Klein Karoo lies a strip ofsubtropical thicket dominated by the succulent shrub spekboom(Portulacaria afra) and including the trees pruimboom (Pappeacapensis) and gwarrie (Euclea undulate) (Vlok and Schutte-Vlok,2010). In terms of large mammals, klipspringer (Oreotragus oreo-tragus) and steenbok (R. campestris) are common in the vicinity ofBPA, with rare large grazers historically including Cape mountainzebra (Equus zebra zebra) and hartebeest (Alcelaphus buselaphus)(Vlok and Schutte-Vlok, 2010; Skead, 2011). Although historicalrecords are unreliable for this taxon, mountain reedbuck (Reduncafulvorufula) was probably also a common grazer in the vicinity ofBPA, given its preference for mountainous terrain where grassesand the cover of bushes and scattered trees are available (Skinnerand Chimimba, 2005; Skead, 2011).
Excavations conducted by H.J. Deacon from 1974 to 1979 uncov-ereda stratifiedsequenceofMiddle StoneAge (MSA)andLSAdepositsspanning the last>65,000 years (Deacon,1979,1984,1989,1995). Thestratigraphy and chronology of the site is reported in Table 1.Following Deacon’s terminology, the major stratigraphic aggregatesat BPAare termedmembers. The LSAdeposits date from1510� 7514Cyears BP (before present) to >21,220 � 195 14C years BP. Using Calib6.0 (Stuiver and Reimer, 1993) and the IntCal09 radiocarbon calibra-tion curve (Reimer et al., 2009), this translates to between 1293 and1543 cal (calibrated) years BP and 24,834e25,998 cal years BP. Theyoungest MSA deposits are dated by radiocarbon to 32,400� 700 14Cyears BP (36,065e38,682 cal years BP). The Howieson’s Poort (HP)industryoccursnear thebaseof thesequence inmemberOCHandhasbeen dated by amino acid racemization (AAR) on ostrich eggshell and
U-Series on a speleothem to between w56 and 66 ka (thousands ofyears ago) (Miller et al., 1999; Vogel, 2001). This agrees well with theoptical dates obtained by Jacobs et al. (2008) for HP deposits else-where in southern Africa (w59e65 ka).
The BPA faunal remains were previously examined by Klein(1978, 1983), who focused on the taxonomic composition of thefauna. Brink (1999) subsequently demonstrated that many speci-mens attributed to alcelaphine antelopes (Connochaetes and Alce-laphus) belong to a previously unknown species of caprine antelope.Revised taxonomic counts for the top of the sequence (members CLto BLD) are reported in Faith (2012). Like manyMSA and LSA sites insouthern Africa (see discussions in Thompson, 2010; Thompson andHenshilwood, 2011), detailed taphonomic analyses of BPA arelacking, limiting behavioral and paleoecological interpretations. In2009 and 2010, taphonomic and taxonomic data were collected onthousands of previously unsorted specimens, in addition to thoseexamined by Klein and Brink. All MSA and LSA units were examinedwith the exception of the uppermost pastoralist levels (memberDGL). This study focuses on the taphonomic and paleoecologicalimplications of the large mammals across the BPA sequence.
Materials and methods
Taphonomic analysis
Potential accumulators of the BPA large mammals include: (1)rodents, namely porcupines (Hystrix), (2) large raptors, such as theCape eagle owl (Bubo capensis), (3), carnivores, including leopards(Panthera pardus), and (4) humans. Following previous taphonomicstudies of nearbyMSA faunas (Marean et al., 2000a; Thompson, 2010;Thompson and Henshilwood, 2011), bone surface modifications areused to assess the contributions of potential accumulators, with afocus on the frequencies of rodent gnawing, gastric etching, carnivoretoothmarks, cutmarks, andhammerstone percussionmarks on long-bone shaft fragments. These were identified following the diagnosticcriteria and laboratory protocol outlined in the taphonomic literature(Binford, 1981; Brain, 1981; Andrews, 1990; Lyman, 1994; Fisher,1995; Blumenschine et al., 1996). Long-bone shaft fragments are thefocus of this study, as previous research shows these to be the mostuseful elements for distinguishing accumulation by different agents(e.g., Marean et al., 2000a). All long-bone shaft fragments wereexamined under strong incident light using a 14� hand lens.
To control for the effect of post-depositional fragmentation onbone modification frequencies, long-bone fracture patterns weredocumented following Villa and Mahieu (1991). Shaft fragmentsbroken when fresh tend to have oblique fracture angles (in cross-section) and curved or v-shaped fracture outlines (in plan view),whereas those broken when dry (i.e., post-deposition) typicallyhave right angle fractures and transverse fracture outlines (Villaand Mahieu, 1991; Marean et al., 2000a).
Correspondence analysis (CA) is used to identify temporalvariation in bone modification frequencies. The CA is conducted onbone modification counts across faunal samples aggregated bystratum and body size. This illustrates the association of differentfaunal aggregates with different types of bone modifications andprovides a means of examining taphonomic change through time.Bone modification frequencies are also compared with actualisticassemblages to assess the role of potential taphonomic agents inthe accumulation of the assemblage.
Paleoecological analysis
Taxonomic identifications were made with the aid of compar-ative osteological and late Quaternary fossil material housed in theTerrestrial Vertebrates and Pre-Colonial Archaeology collections at
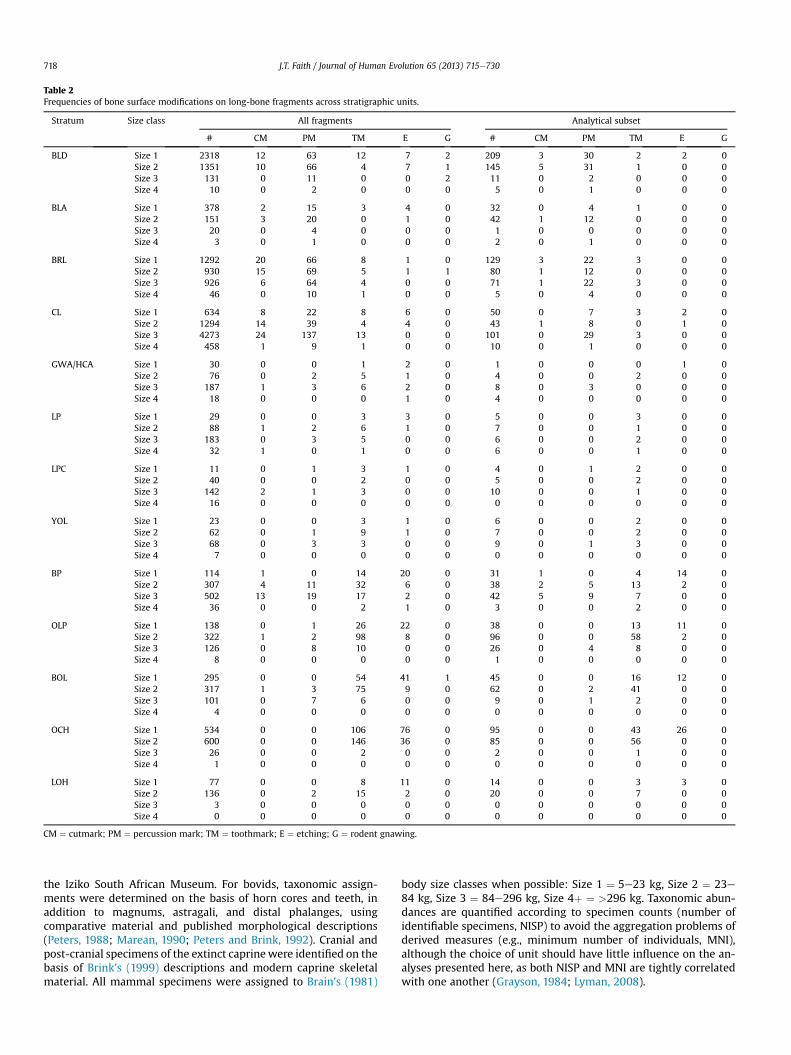
Table 2Frequencies of bone surface modifications on long-bone fragments across stratigraphic units.
Stratum Size class All fragments Analytical subset
# CM PM TM E G # CM PM TM E G
BLD Size 1 2318 12 63 12 7 2 209 3 30 2 2 0Size 2 1351 10 66 4 7 1 145 5 31 1 0 0Size 3 131 0 11 0 0 2 11 0 2 0 0 0Size 4 10 0 2 0 0 0 5 0 1 0 0 0
BLA Size 1 378 2 15 3 4 0 32 0 4 1 0 0Size 2 151 3 20 0 1 0 42 1 12 0 0 0Size 3 20 0 4 0 0 0 1 0 0 0 0 0Size 4 3 0 1 0 0 0 2 0 1 0 0 0
BRL Size 1 1292 20 66 8 1 0 129 3 22 3 0 0Size 2 930 15 69 5 1 1 80 1 12 0 0 0Size 3 926 6 64 4 0 0 71 1 22 3 0 0Size 4 46 0 10 1 0 0 5 0 4 0 0 0
CL Size 1 634 8 22 8 6 0 50 0 7 3 2 0Size 2 1294 14 39 4 4 0 43 1 8 0 1 0Size 3 4273 24 137 13 0 0 101 0 29 3 0 0Size 4 458 1 9 1 0 0 10 0 1 0 0 0
GWA/HCA Size 1 30 0 0 1 2 0 1 0 0 0 1 0Size 2 76 0 2 5 1 0 4 0 0 2 0 0Size 3 187 1 3 6 2 0 8 0 3 0 0 0Size 4 18 0 0 0 1 0 4 0 0 0 0 0
LP Size 1 29 0 0 3 3 0 5 0 0 3 0 0Size 2 88 1 2 6 1 0 7 0 0 1 0 0Size 3 183 0 3 5 0 0 6 0 0 2 0 0Size 4 32 1 0 1 0 0 6 0 0 1 0 0
LPC Size 1 11 0 1 3 1 0 4 0 1 2 0 0Size 2 40 0 0 2 0 0 5 0 0 2 0 0Size 3 142 2 1 3 0 0 10 0 0 1 0 0Size 4 16 0 0 0 0 0 0 0 0 0 0 0
YOL Size 1 23 0 0 3 1 0 6 0 0 2 0 0Size 2 62 0 1 9 1 0 7 0 0 2 0 0Size 3 68 0 3 3 0 0 9 0 1 3 0 0Size 4 7 0 0 0 0 0 0 0 0 0 0 0
BP Size 1 114 1 0 14 20 0 31 1 0 4 14 0Size 2 307 4 11 32 6 0 38 2 5 13 2 0Size 3 502 13 19 17 2 0 42 5 9 7 0 0Size 4 36 0 0 2 1 0 3 0 0 2 0 0
OLP Size 1 138 0 1 26 22 0 38 0 0 13 11 0Size 2 322 1 2 98 8 0 96 0 0 58 2 0Size 3 126 0 8 10 0 0 26 0 4 8 0 0Size 4 8 0 0 0 0 0 1 0 0 0 0 0
BOL Size 1 295 0 0 54 41 1 45 0 0 16 12 0Size 2 317 1 3 75 9 0 62 0 2 41 0 0Size 3 101 0 7 6 0 0 9 0 1 2 0 0Size 4 4 0 0 0 0 0 0 0 0 0 0 0
OCH Size 1 534 0 0 106 76 0 95 0 0 43 26 0Size 2 600 0 0 146 36 0 85 0 0 56 0 0Size 3 26 0 0 2 0 0 2 0 0 1 0 0Size 4 1 0 0 0 0 0 0 0 0 0 0 0
LOH Size 1 77 0 0 8 11 0 14 0 0 3 3 0Size 2 136 0 2 15 2 0 20 0 0 7 0 0Size 3 3 0 0 0 0 0 0 0 0 0 0 0Size 4 0 0 0 0 0 0 0 0 0 0 0 0
CM ¼ cutmark; PM ¼ percussion mark; TM ¼ toothmark; E ¼ etching; G ¼ rodent gnawing.
J.T. Faith / Journal of Human Evolution 65 (2013) 715e730718
the Iziko South African Museum. For bovids, taxonomic assign-ments were determined on the basis of horn cores and teeth, inaddition to magnums, astragali, and distal phalanges, usingcomparative material and published morphological descriptions(Peters, 1988; Marean, 1990; Peters and Brink, 1992). Cranial andpost-cranial specimens of the extinct caprinewere identified on thebasis of Brink’s (1999) descriptions and modern caprine skeletalmaterial. All mammal specimens were assigned to Brain’s (1981)
body size classes when possible: Size 1 ¼ 5e23 kg, Size 2 ¼ 23e84 kg, Size 3 ¼ 84e296 kg, Size 4þ ¼ >296 kg. Taxonomic abun-dances are quantified according to specimen counts (number ofidentifiable specimens, NISP) to avoid the aggregation problems ofderived measures (e.g., minimum number of individuals, MNI),although the choice of unit should have little influence on the an-alyses presented here, as both NISP and MNI are tightly correlatedwith one another (Grayson, 1984; Lyman, 2008).
1.0
0.5
-1 0.5
BLD
BLA
BRL
CL
GWALP
LPC
YOL
BP
OLP
BOL
OCH
LOH
Axis 1 Score
-1 0.5
E
T
GWA
LOH BP
LP
OLPBOL OCH
GWA
OCH
YOL LPC
GWA
BPLP
BOLOLP
OCHLPC
LPOLP
LPCYOL
BOL
BP
CL
BLA
BLD CLBLD
BLABLD
BLA
BRLCBRL CL
BRL
Axis 1 (81.8%)
Axis 2 (14%
)
Size 1Size 2Size 3/4
Size 2Size 1 Size 3/4
(A) (B)0 0.5 1.0 1.5-1.0 -0.5
Group 4
Group 1
Group 2
LOHYOL
Group 3P
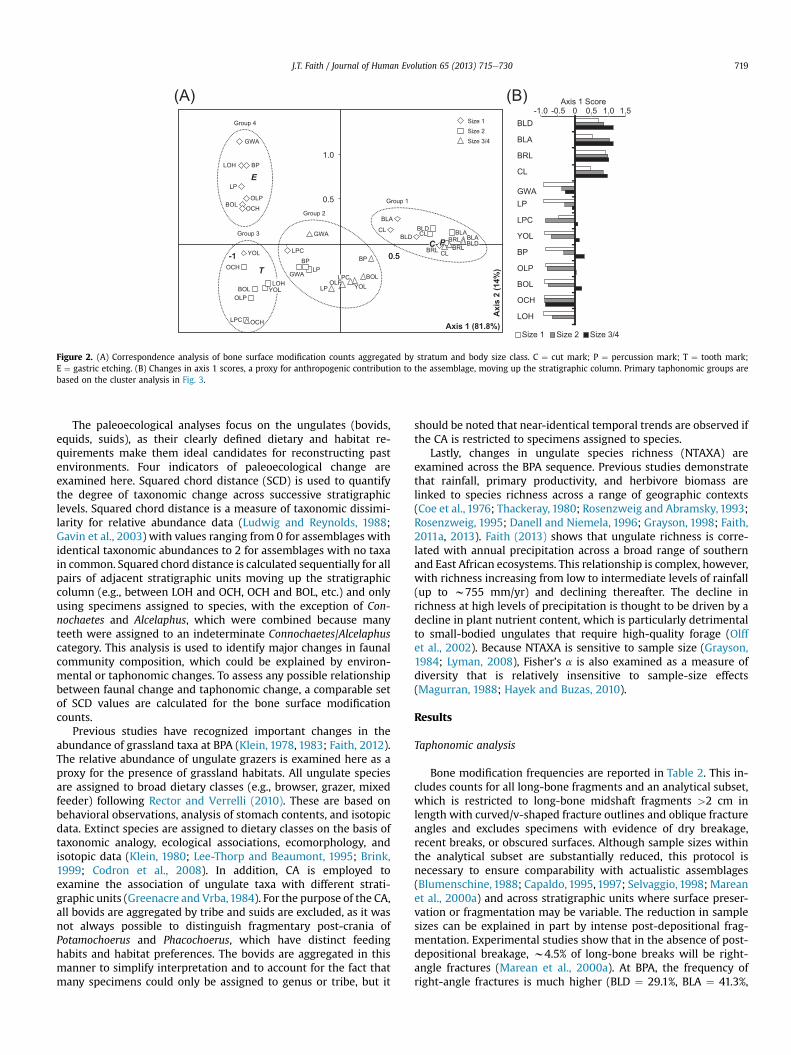
Figure 2. (A) Correspondence analysis of bone surface modification counts aggregated by stratum and body size class. C ¼ cut mark; P ¼ percussion mark; T ¼ tooth mark;E ¼ gastric etching. (B) Changes in axis 1 scores, a proxy for anthropogenic contribution to the assemblage, moving up the stratigraphic column. Primary taphonomic groups arebased on the cluster analysis in Fig. 3.
J.T. Faith / Journal of Human Evolution 65 (2013) 715e730 719
The paleoecological analyses focus on the ungulates (bovids,equids, suids), as their clearly defined dietary and habitat re-quirements make them ideal candidates for reconstructing pastenvironments. Four indicators of paleoecological change areexamined here. Squared chord distance (SCD) is used to quantifythe degree of taxonomic change across successive stratigraphiclevels. Squared chord distance is a measure of taxonomic dissimi-larity for relative abundance data (Ludwig and Reynolds, 1988;Gavin et al., 2003) with values ranging from 0 for assemblages withidentical taxonomic abundances to 2 for assemblages with no taxain common. Squared chord distance is calculated sequentially for allpairs of adjacent stratigraphic units moving up the stratigraphiccolumn (e.g., between LOH and OCH, OCH and BOL, etc.) and onlyusing specimens assigned to species, with the exception of Con-nochaetes and Alcelaphus, which were combined because manyteeth were assigned to an indeterminate Connochaetes/Alcelaphuscategory. This analysis is used to identify major changes in faunalcommunity composition, which could be explained by environ-mental or taphonomic changes. To assess any possible relationshipbetween faunal change and taphonomic change, a comparable setof SCD values are calculated for the bone surface modificationcounts.
Previous studies have recognized important changes in theabundance of grassland taxa at BPA (Klein, 1978, 1983; Faith, 2012).The relative abundance of ungulate grazers is examined here as aproxy for the presence of grassland habitats. All ungulate speciesare assigned to broad dietary classes (e.g., browser, grazer, mixedfeeder) following Rector and Verrelli (2010). These are based onbehavioral observations, analysis of stomach contents, and isotopicdata. Extinct species are assigned to dietary classes on the basis oftaxonomic analogy, ecological associations, ecomorphology, andisotopic data (Klein, 1980; Lee-Thorp and Beaumont, 1995; Brink,1999; Codron et al., 2008). In addition, CA is employed toexamine the association of ungulate taxa with different strati-graphic units (Greenacre and Vrba,1984). For the purpose of the CA,all bovids are aggregated by tribe and suids are excluded, as it wasnot always possible to distinguish fragmentary post-crania ofPotamochoerus and Phacochoerus, which have distinct feedinghabits and habitat preferences. The bovids are aggregated in thismanner to simplify interpretation and to account for the fact thatmany specimens could only be assigned to genus or tribe, but it
should be noted that near-identical temporal trends are observed ifthe CA is restricted to specimens assigned to species.
Lastly, changes in ungulate species richness (NTAXA) areexamined across the BPA sequence. Previous studies demonstratethat rainfall, primary productivity, and herbivore biomass arelinked to species richness across a range of geographic contexts(Coe et al., 1976; Thackeray, 1980; Rosenzweig and Abramsky, 1993;Rosenzweig, 1995; Danell and Niemela, 1996; Grayson, 1998; Faith,2011a, 2013). Faith (2013) shows that ungulate richness is corre-lated with annual precipitation across a broad range of southernand East African ecosystems. This relationship is complex, however,with richness increasing from low to intermediate levels of rainfall(up to w755 mm/yr) and declining thereafter. The decline inrichness at high levels of precipitation is thought to be driven by adecline in plant nutrient content, which is particularly detrimentalto small-bodied ungulates that require high-quality forage (Olffet al., 2002). Because NTAXA is sensitive to sample size (Grayson,1984; Lyman, 2008), Fisher’s a is also examined as a measure ofdiversity that is relatively insensitive to sample-size effects(Magurran, 1988; Hayek and Buzas, 2010).
Results
Taphonomic analysis
Bone modification frequencies are reported in Table 2. This in-cludes counts for all long-bone fragments and an analytical subset,which is restricted to long-bone midshaft fragments >2 cm inlength with curved/v-shaped fracture outlines and oblique fractureangles and excludes specimens with evidence of dry breakage,recent breaks, or obscured surfaces. Although sample sizes withinthe analytical subset are substantially reduced, this protocol isnecessary to ensure comparability with actualistic assemblages(Blumenschine, 1988; Capaldo, 1995, 1997; Selvaggio, 1998; Mareanet al., 2000a) and across stratigraphic units where surface preser-vation or fragmentation may be variable. The reduction in samplesizes can be explained in part by intense post-depositional frag-mentation. Experimental studies show that in the absence of post-depositional breakage, w4.5% of long-bone breaks will be right-angle fractures (Marean et al., 2000a). At BPA, the frequency ofright-angle fractures is much higher (BLD ¼ 29.1%, BLA ¼ 41.3%,
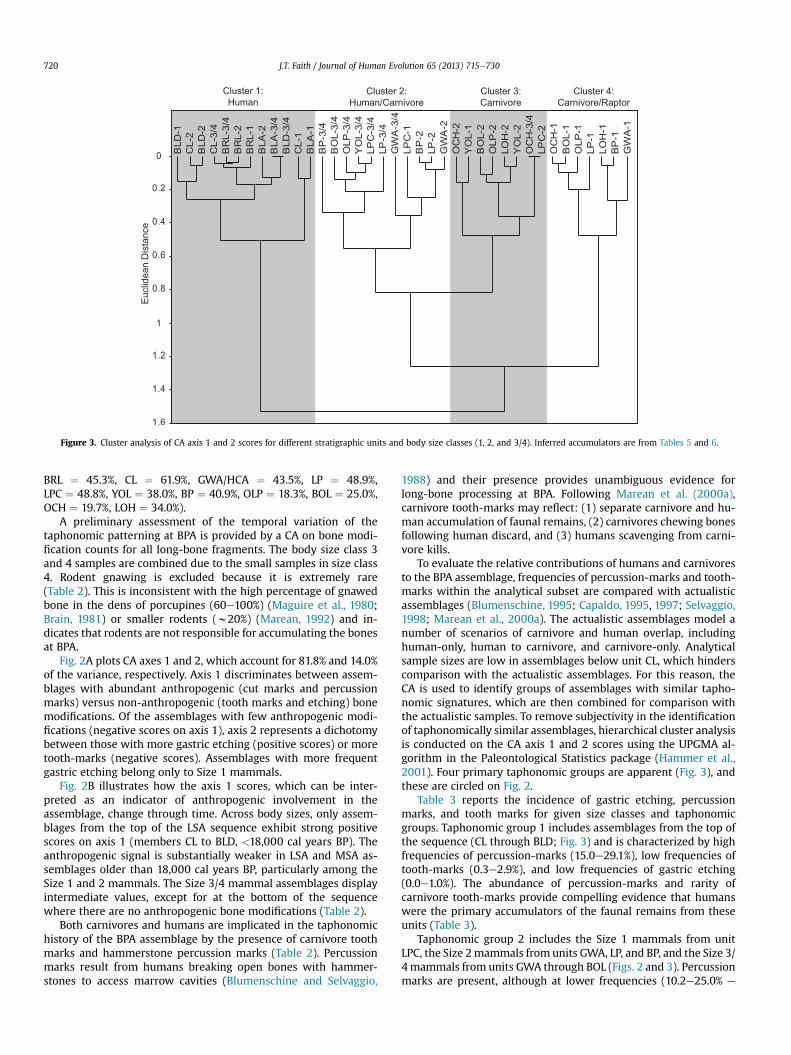
Figure 3. Cluster analysis of CA axis 1 and 2 scores for different stratigraphic units and body size classes (1, 2, and 3/4). Inferred accumulators are from Tables 5 and 6.
J.T. Faith / Journal of Human Evolution 65 (2013) 715e730720
BRL ¼ 45.3%, CL ¼ 61.9%, GWA/HCA ¼ 43.5%, LP ¼ 48.9%,LPC ¼ 48.8%, YOL ¼ 38.0%, BP ¼ 40.9%, OLP ¼ 18.3%, BOL ¼ 25.0%,OCH ¼ 19.7%, LOH ¼ 34.0%).
A preliminary assessment of the temporal variation of thetaphonomic patterning at BPA is provided by a CA on bone modi-fication counts for all long-bone fragments. The body size class 3and 4 samples are combined due to the small samples in size class4. Rodent gnawing is excluded because it is extremely rare(Table 2). This is inconsistent with the high percentage of gnawedbone in the dens of porcupines (60e100%) (Maguire et al., 1980;Brain, 1981) or smaller rodents (w20%) (Marean, 1992) and in-dicates that rodents are not responsible for accumulating the bonesat BPA.
Fig. 2A plots CA axes 1 and 2, which account for 81.8% and 14.0%of the variance, respectively. Axis 1 discriminates between assem-blages with abundant anthropogenic (cut marks and percussionmarks) versus non-anthropogenic (tooth marks and etching) bonemodifications. Of the assemblages with few anthropogenic modi-fications (negative scores on axis 1), axis 2 represents a dichotomybetween those with more gastric etching (positive scores) or moretooth-marks (negative scores). Assemblages with more frequentgastric etching belong only to Size 1 mammals.
Fig. 2B illustrates how the axis 1 scores, which can be inter-preted as an indicator of anthropogenic involvement in theassemblage, change through time. Across body sizes, only assem-blages from the top of the LSA sequence exhibit strong positivescores on axis 1 (members CL to BLD, <18,000 cal years BP). Theanthropogenic signal is substantially weaker in LSA and MSA as-semblages older than 18,000 cal years BP, particularly among theSize 1 and 2 mammals. The Size 3/4 mammal assemblages displayintermediate values, except for at the bottom of the sequencewhere there are no anthropogenic bone modifications (Table 2).
Both carnivores and humans are implicated in the taphonomichistory of the BPA assemblage by the presence of carnivore toothmarks and hammerstone percussion marks (Table 2). Percussionmarks result from humans breaking open bones with hammer-stones to access marrow cavities (Blumenschine and Selvaggio,
1988) and their presence provides unambiguous evidence forlong-bone processing at BPA. Following Marean et al. (2000a),carnivore tooth-marks may reflect: (1) separate carnivore and hu-man accumulation of faunal remains, (2) carnivores chewing bonesfollowing human discard, and (3) humans scavenging from carni-vore kills.
To evaluate the relative contributions of humans and carnivoresto the BPA assemblage, frequencies of percussion-marks and tooth-marks within the analytical subset are compared with actualisticassemblages (Blumenschine, 1995; Capaldo, 1995, 1997; Selvaggio,1998; Marean et al., 2000a). The actualistic assemblages model anumber of scenarios of carnivore and human overlap, includinghuman-only, human to carnivore, and carnivore-only. Analyticalsample sizes are low in assemblages below unit CL, which hinderscomparison with the actualistic assemblages. For this reason, theCA is used to identify groups of assemblages with similar tapho-nomic signatures, which are then combined for comparison withthe actualistic samples. To remove subjectivity in the identificationof taphonomically similar assemblages, hierarchical cluster analysisis conducted on the CA axis 1 and 2 scores using the UPGMA al-gorithm in the Paleontological Statistics package (Hammer et al.,2001). Four primary taphonomic groups are apparent (Fig. 3), andthese are circled on Fig. 2.
Table 3 reports the incidence of gastric etching, percussionmarks, and tooth marks for given size classes and taphonomicgroups. Taphonomic group 1 includes assemblages from the top ofthe sequence (CL through BLD; Fig. 3) and is characterized by highfrequencies of percussion-marks (15.0e29.1%), low frequencies oftooth-marks (0.3e2.9%), and low frequencies of gastric etching(0.0e1.0%). The abundance of percussion-marks and rarity ofcarnivore tooth-marks provide compelling evidence that humanswere the primary accumulators of the faunal remains from theseunits (Table 3).
Taphonomic group 2 includes the Size 1 mammals from unitLPC, the Size 2mammals from units GWA, LP, and BP, and the Size 3/4mammals from units GWA through BOL (Figs. 2 and 3). Percussionmarks are present, although at lower frequencies (10.2e25.0% e
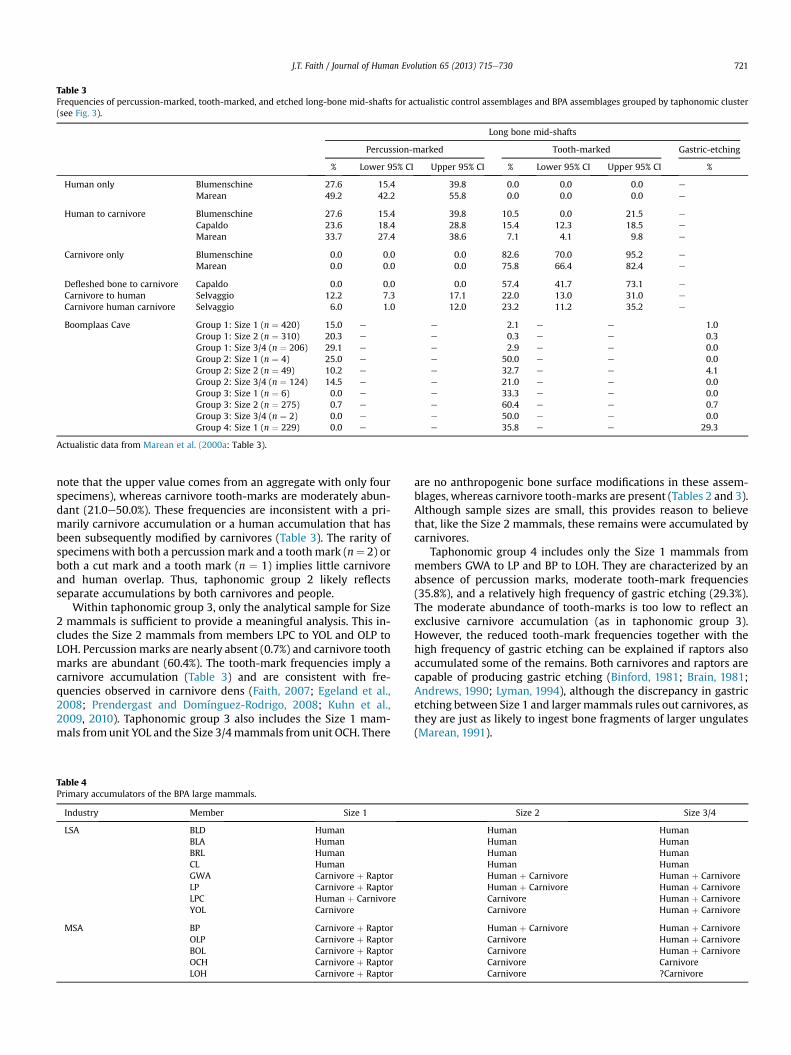
Table 3Frequencies of percussion-marked, tooth-marked, and etched long-bone mid-shafts for actualistic control assemblages and BPA assemblages grouped by taphonomic cluster(see Fig. 3).
Long bone mid-shafts
Percussion-marked Tooth-marked Gastric-etching
% Lower 95% CI Upper 95% CI % Lower 95% CI Upper 95% CI %
Human only Blumenschine 27.6 15.4 39.8 0.0 0.0 0.0 e
Marean 49.2 42.2 55.8 0.0 0.0 0.0 e
Human to carnivore Blumenschine 27.6 15.4 39.8 10.5 0.0 21.5 e
Capaldo 23.6 18.4 28.8 15.4 12.3 18.5 e
Marean 33.7 27.4 38.6 7.1 4.1 9.8 e
Carnivore only Blumenschine 0.0 0.0 0.0 82.6 70.0 95.2 e
Marean 0.0 0.0 0.0 75.8 66.4 82.4 e
Defleshed bone to carnivore Capaldo 0.0 0.0 0.0 57.4 41.7 73.1 e
Carnivore to human Selvaggio 12.2 7.3 17.1 22.0 13.0 31.0 e
Carnivore human carnivore Selvaggio 6.0 1.0 12.0 23.2 11.2 35.2 e
Boomplaas Cave Group 1: Size 1 (n ¼ 420) 15.0 e e 2.1 e e 1.0Group 1: Size 2 (n ¼ 310) 20.3 e e 0.3 e e 0.3Group 1: Size 3/4 (n ¼ 206) 29.1 e e 2.9 e e 0.0Group 2: Size 1 (n ¼ 4) 25.0 e e 50.0 e e 0.0Group 2: Size 2 (n ¼ 49) 10.2 e e 32.7 e e 4.1Group 2: Size 3/4 (n ¼ 124) 14.5 e e 21.0 e e 0.0Group 3: Size 1 (n ¼ 6) 0.0 e e 33.3 e e 0.0Group 3: Size 2 (n ¼ 275) 0.7 e e 60.4 e e 0.7Group 3: Size 3/4 (n ¼ 2) 0.0 e e 50.0 e e 0.0Group 4: Size 1 (n ¼ 229) 0.0 e e 35.8 e e 29.3
Actualistic data from Marean et al. (2000a: Table 3).
J.T. Faith / Journal of Human Evolution 65 (2013) 715e730 721
note that the upper value comes from an aggregate with only fourspecimens), whereas carnivore tooth-marks are moderately abun-dant (21.0e50.0%). These frequencies are inconsistent with a pri-marily carnivore accumulation or a human accumulation that hasbeen subsequently modified by carnivores (Table 3). The rarity ofspecimens with both a percussion mark and a toothmark (n¼ 2) orboth a cut mark and a tooth mark (n ¼ 1) implies little carnivoreand human overlap. Thus, taphonomic group 2 likely reflectsseparate accumulations by both carnivores and people.
Within taphonomic group 3, only the analytical sample for Size2 mammals is sufficient to provide a meaningful analysis. This in-cludes the Size 2 mammals from members LPC to YOL and OLP toLOH. Percussion marks are nearly absent (0.7%) and carnivore toothmarks are abundant (60.4%). The tooth-mark frequencies imply acarnivore accumulation (Table 3) and are consistent with fre-quencies observed in carnivore dens (Faith, 2007; Egeland et al.,2008; Prendergast and Domínguez-Rodrigo, 2008; Kuhn et al.,2009, 2010). Taphonomic group 3 also includes the Size 1 mam-mals fromunit YOL and the Size 3/4mammals from unit OCH. There
Table 4Primary accumulators of the BPA large mammals.
Industry Member Size 1
LSA BLD HumanBLA HumanBRL HumanCL HumanGWA Carnivore þ RaptorLP Carnivore þ RaptorLPC Human þ CarnivoreYOL Carnivore
MSA BP Carnivore þ RaptorOLP Carnivore þ RaptorBOL Carnivore þ RaptorOCH Carnivore þ RaptorLOH Carnivore þ Raptor
are no anthropogenic bone surface modifications in these assem-blages, whereas carnivore tooth-marks are present (Tables 2 and 3).Although sample sizes are small, this provides reason to believethat, like the Size 2 mammals, these remains were accumulated bycarnivores.
Taphonomic group 4 includes only the Size 1 mammals frommembers GWA to LP and BP to LOH. They are characterized by anabsence of percussion marks, moderate tooth-mark frequencies(35.8%), and a relatively high frequency of gastric etching (29.3%).The moderate abundance of tooth-marks is too low to reflect anexclusive carnivore accumulation (as in taphonomic group 3).However, the reduced tooth-mark frequencies together with thehigh frequency of gastric etching can be explained if raptors alsoaccumulated some of the remains. Both carnivores and raptors arecapable of producing gastric etching (Binford, 1981; Brain, 1981;Andrews, 1990; Lyman, 1994), although the discrepancy in gastricetching between Size 1 and largermammals rules out carnivores, asthey are just as likely to ingest bone fragments of larger ungulates(Marean, 1991).
Size 2 Size 3/4
Human HumanHuman HumanHuman HumanHuman HumanHuman þ Carnivore Human þ CarnivoreHuman þ Carnivore Human þ CarnivoreCarnivore Human þ CarnivoreCarnivore Human þ Carnivore
Human þ Carnivore Human þ CarnivoreCarnivore Human þ CarnivoreCarnivore Human þ CarnivoreCarnivore CarnivoreCarnivore ?Carnivore
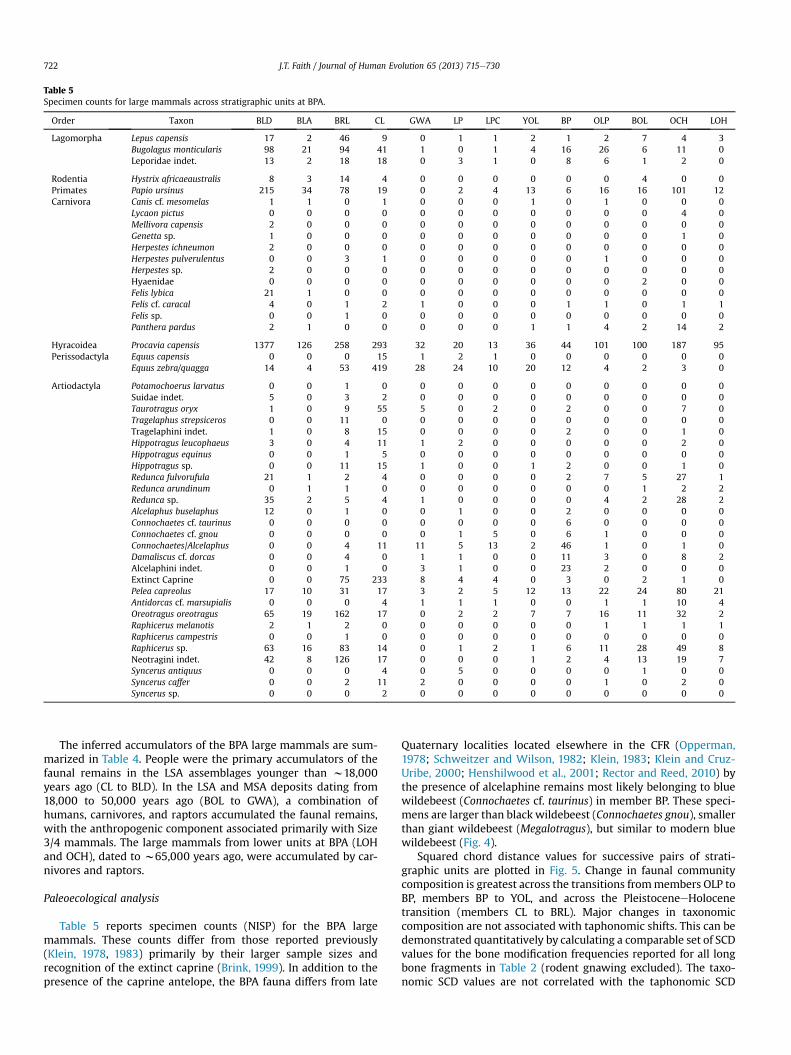
Table 5Specimen counts for large mammals across stratigraphic units at BPA.
Order Taxon BLD BLA BRL CL GWA LP LPC YOL BP OLP BOL OCH LOH
Lagomorpha Lepus capensis 17 2 46 9 0 1 1 2 1 2 7 4 3Bugolagus monticularis 98 21 94 41 1 0 1 4 16 26 6 11 0Leporidae indet. 13 2 18 18 0 3 1 0 8 6 1 2 0
Rodentia Hystrix africaeaustralis 8 3 14 4 0 0 0 0 0 0 4 0 0Primates Papio ursinus 215 34 78 19 0 2 4 13 6 16 16 101 12Carnivora Canis cf. mesomelas 1 1 0 1 0 0 0 1 0 1 0 0 0
Lycaon pictus 0 0 0 0 0 0 0 0 0 0 0 4 0Mellivora capensis 2 0 0 0 0 0 0 0 0 0 0 0 0Genetta sp. 1 0 0 0 0 0 0 0 0 0 0 1 0Herpestes ichneumon 2 0 0 0 0 0 0 0 0 0 0 0 0Herpestes pulverulentus 0 0 3 1 0 0 0 0 0 1 0 0 0Herpestes sp. 2 0 0 0 0 0 0 0 0 0 0 0 0Hyaenidae 0 0 0 0 0 0 0 0 0 0 2 0 0Felis lybica 21 1 0 0 0 0 0 0 0 0 0 0 0Felis cf. caracal 4 0 1 2 1 0 0 0 1 1 0 1 1Felis sp. 0 0 1 0 0 0 0 0 0 0 0 0 0Panthera pardus 2 1 0 0 0 0 0 1 1 4 2 14 2
Hyracoidea Procavia capensis 1377 126 258 293 32 20 13 36 44 101 100 187 95Perissodactyla Equus capensis 0 0 0 15 1 2 1 0 0 0 0 0 0
Equus zebra/quagga 14 4 53 419 28 24 10 20 12 4 2 3 0
Artiodactyla Potamochoerus larvatus 0 0 1 0 0 0 0 0 0 0 0 0 0Suidae indet. 5 0 3 2 0 0 0 0 0 0 0 0 0Taurotragus oryx 1 0 9 55 5 0 2 0 2 0 0 7 0Tragelaphus strepsiceros 0 0 11 0 0 0 0 0 0 0 0 0 0Tragelaphini indet. 1 0 8 15 0 0 0 0 2 0 0 1 0Hippotragus leucophaeus 3 0 4 11 1 2 0 0 0 0 0 2 0Hippotragus equinus 0 0 1 5 0 0 0 0 0 0 0 0 0Hippotragus sp. 0 0 11 15 1 0 0 1 2 0 0 1 0Redunca fulvorufula 21 1 2 4 0 0 0 0 2 7 5 27 1Redunca arundinum 0 1 1 0 0 0 0 0 0 0 1 2 2Redunca sp. 35 2 5 4 1 0 0 0 0 4 2 28 2Alcelaphus buselaphus 12 0 1 0 0 1 0 0 2 0 0 0 0Connochaetes cf. taurinus 0 0 0 0 0 0 0 0 6 0 0 0 0Connochaetes cf. gnou 0 0 0 0 0 1 5 0 6 1 0 0 0Connochaetes/Alcelaphus 0 0 4 11 11 5 13 2 46 1 0 1 0Damaliscus cf. dorcas 0 0 4 0 1 1 0 0 11 3 0 8 2Alcelaphini indet. 0 0 1 0 3 1 0 0 23 2 0 0 0Extinct Caprine 0 0 75 233 8 4 4 0 3 0 2 1 0Pelea capreolus 17 10 31 17 3 2 5 12 13 22 24 80 21Antidorcas cf. marsupialis 0 0 0 4 1 1 1 0 0 1 1 10 4Oreotragus oreotragus 65 19 162 17 0 2 2 7 7 16 11 32 2Raphicerus melanotis 2 1 2 0 0 0 0 0 0 1 1 1 1Raphicerus campestris 0 0 1 0 0 0 0 0 0 0 0 0 0Raphicerus sp. 63 16 83 14 0 1 2 1 6 11 28 49 8Neotragini indet. 42 8 126 17 0 0 0 1 2 4 13 19 7Syncerus antiquus 0 0 0 4 0 5 0 0 0 0 1 0 0Syncerus caffer 0 0 2 11 2 0 0 0 0 1 0 2 0Syncerus sp. 0 0 0 2 0 0 0 0 0 0 0 0 0
J.T. Faith / Journal of Human Evolution 65 (2013) 715e730722
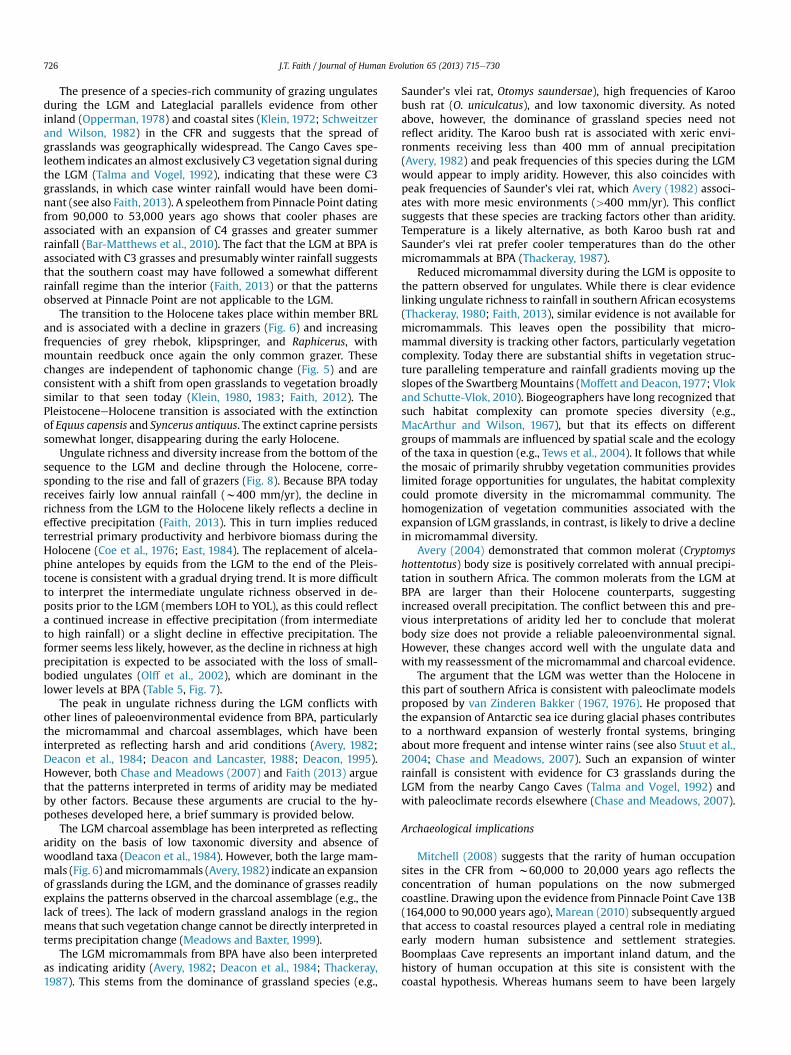
The inferred accumulators of the BPA large mammals are sum-marized in Table 4. People were the primary accumulators of thefaunal remains in the LSA assemblages younger than w18,000years ago (CL to BLD). In the LSA and MSA deposits dating from18,000 to 50,000 years ago (BOL to GWA), a combination ofhumans, carnivores, and raptors accumulated the faunal remains,with the anthropogenic component associated primarily with Size3/4 mammals. The large mammals from lower units at BPA (LOHand OCH), dated to w65,000 years ago, were accumulated by car-nivores and raptors.
Paleoecological analysis
Table 5 reports specimen counts (NISP) for the BPA largemammals. These counts differ from those reported previously(Klein, 1978, 1983) primarily by their larger sample sizes andrecognition of the extinct caprine (Brink, 1999). In addition to thepresence of the caprine antelope, the BPA fauna differs from late
Quaternary localities located elsewhere in the CFR (Opperman,1978; Schweitzer and Wilson, 1982; Klein, 1983; Klein and Cruz-Uribe, 2000; Henshilwood et al., 2001; Rector and Reed, 2010) bythe presence of alcelaphine remains most likely belonging to bluewildebeest (Connochaetes cf. taurinus) in member BP. These speci-mens are larger than black wildebeest (Connochaetes gnou), smallerthan giant wildebeest (Megalotragus), but similar to modern bluewildebeest (Fig. 4).
Squared chord distance values for successive pairs of strati-graphic units are plotted in Fig. 5. Change in faunal communitycomposition is greatest across the transitions frommembers OLP toBP, members BP to YOL, and across the PleistoceneeHolocenetransition (members CL to BRL). Major changes in taxonomiccomposition are not associated with taphonomic shifts. This can bedemonstrated quantitatively by calculating a comparable set of SCDvalues for the bone modification frequencies reported for all longbone fragments in Table 2 (rodent gnawing excluded). The taxo-nomic SCD values are not correlated with the taphonomic SCD
Connochaetes cf. taurinus
BPA (2)
Alcelaphus buselaphus
modern (20)
Connochaetes gnou
modern (11)
Connochaetes taurinus
modern (35)
Megalotragus
fossil (31)
20 25 30 35 40 45 50
Figure 4. Box plots illustrating m3 (mandibular) occlusal lengths of Connochaetes cf.taurinus from member BP at BPA compared with modern and fossil alcelaphines. FossilMegalotragus are from various East African localities (Harris, 1991; Vrba, 1997; Faithet al., 2011).
BLD
BLA
BRL
CL
GWA
LP
LPC
YOL
BP
OLP
BOL
OCH
LOH
% Grazing Ungulates (NISP)
0 25 50 75 100
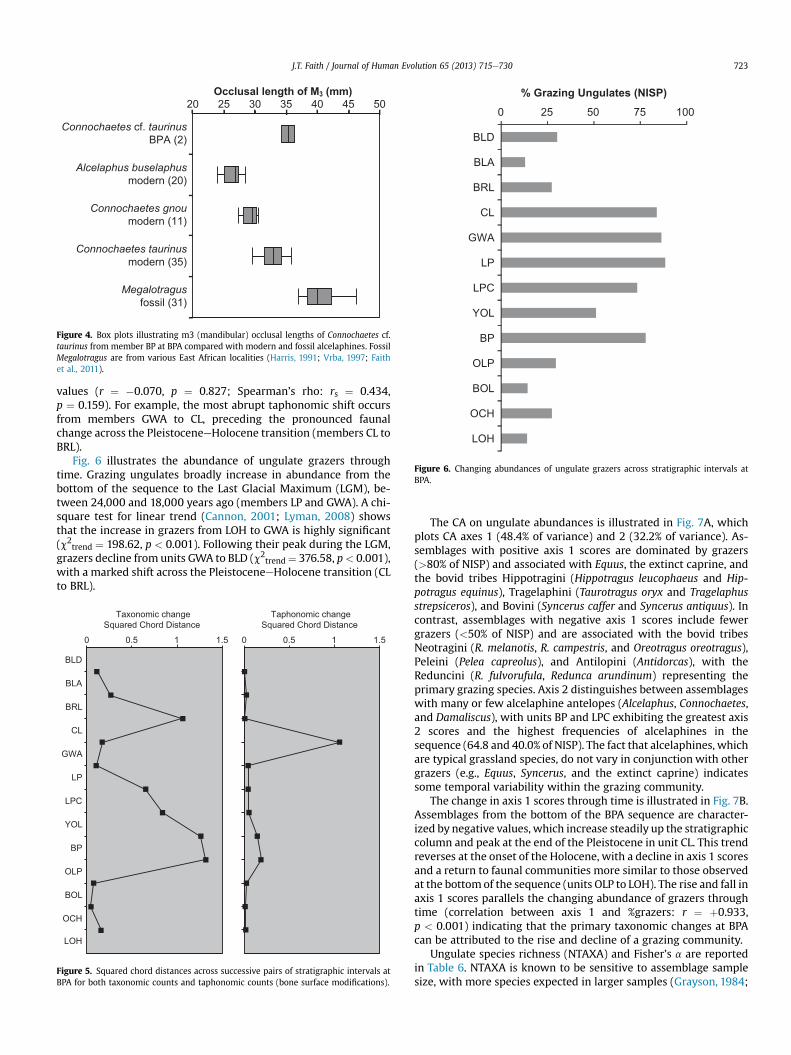
Figure 6. Changing abundances of ungulate grazers across stratigraphic intervals atBPA.
J.T. Faith / Journal of Human Evolution 65 (2013) 715e730 723
values (r ¼ �0.070, p ¼ 0.827; Spearman’s rho: rs ¼ 0.434,p ¼ 0.159). For example, the most abrupt taphonomic shift occursfrom members GWA to CL, preceding the pronounced faunalchange across the PleistoceneeHolocene transition (members CL toBRL).
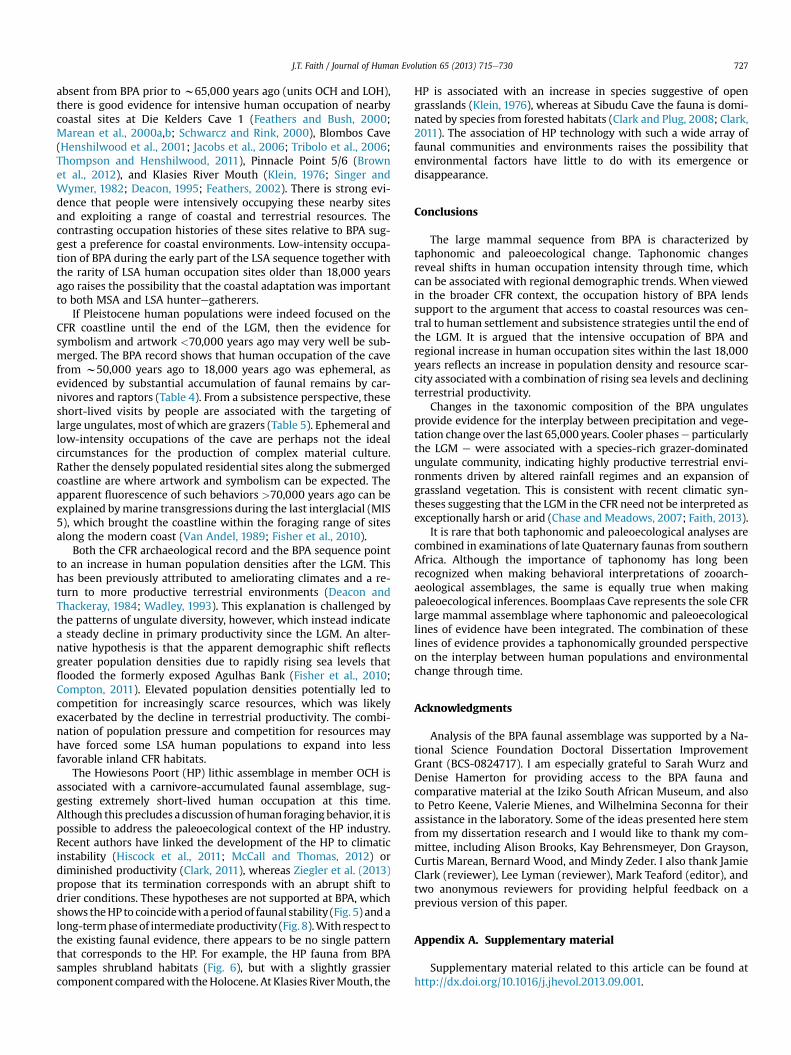
Fig. 6 illustrates the abundance of ungulate grazers throughtime. Grazing ungulates broadly increase in abundance from thebottom of the sequence to the Last Glacial Maximum (LGM), be-tween 24,000 and 18,000 years ago (members LP and GWA). A chi-square test for linear trend (Cannon, 2001; Lyman, 2008) showsthat the increase in grazers from LOH to GWA is highly significant(c2trend ¼ 198.62, p < 0.001). Following their peak during the LGM,grazers decline from units GWA to BLD (c2trend¼ 376.58, p< 0.001),with a marked shift across the PleistoceneeHolocene transition (CLto BRL).
BLD
BLA
BRL
CL
GWA
LP
LPC
YOL
BP
OLP
BOL
OCH
0 0.5 1 1.5 0 0.5 1 1.5
Taxonomic changeSquared Chord Distance
Taphonomic changeSquared Chord Distance
LOH
Figure 5. Squared chord distances across successive pairs of stratigraphic intervals atBPA for both taxonomic counts and taphonomic counts (bone surface modifications).
The CA on ungulate abundances is illustrated in Fig. 7A, whichplots CA axes 1 (48.4% of variance) and 2 (32.2% of variance). As-semblages with positive axis 1 scores are dominated by grazers(>80% of NISP) and associated with Equus, the extinct caprine, andthe bovid tribes Hippotragini (Hippotragus leucophaeus and Hip-potragus equinus), Tragelaphini (Taurotragus oryx and Tragelaphusstrepsiceros), and Bovini (Syncerus caffer and Syncerus antiquus). Incontrast, assemblages with negative axis 1 scores include fewergrazers (<50% of NISP) and are associated with the bovid tribesNeotragini (R. melanotis, R. campestris, and Oreotragus oreotragus),Peleini (Pelea capreolus), and Antilopini (Antidorcas), with theReduncini (R. fulvorufula, Redunca arundinum) representing theprimary grazing species. Axis 2 distinguishes between assemblageswith many or few alcelaphine antelopes (Alcelaphus, Connochaetes,and Damaliscus), with units BP and LPC exhibiting the greatest axis2 scores and the highest frequencies of alcelaphines in thesequence (64.8 and 40.0% of NISP). The fact that alcelaphines, whichare typical grassland species, do not vary in conjunction with othergrazers (e.g., Equus, Syncerus, and the extinct caprine) indicatessome temporal variability within the grazing community.
The change in axis 1 scores through time is illustrated in Fig. 7B.Assemblages from the bottom of the BPA sequence are character-ized by negative values, which increase steadily up the stratigraphiccolumn and peak at the end of the Pleistocene in unit CL. This trendreverses at the onset of the Holocene, with a decline in axis 1 scoresand a return to faunal communities more similar to those observedat the bottomof the sequence (units OLP to LOH). The rise and fall inaxis 1 scores parallels the changing abundance of grazers throughtime (correlation between axis 1 and %grazers: r ¼ þ0.933,p < 0.001) indicating that the primary taxonomic changes at BPAcan be attributed to the rise and decline of a grazing community.
Ungulate species richness (NTAXA) and Fisher’s a are reportedin Table 6. NTAXA is known to be sensitive to assemblage samplesize, with more species expected in larger samples (Grayson, 1984;
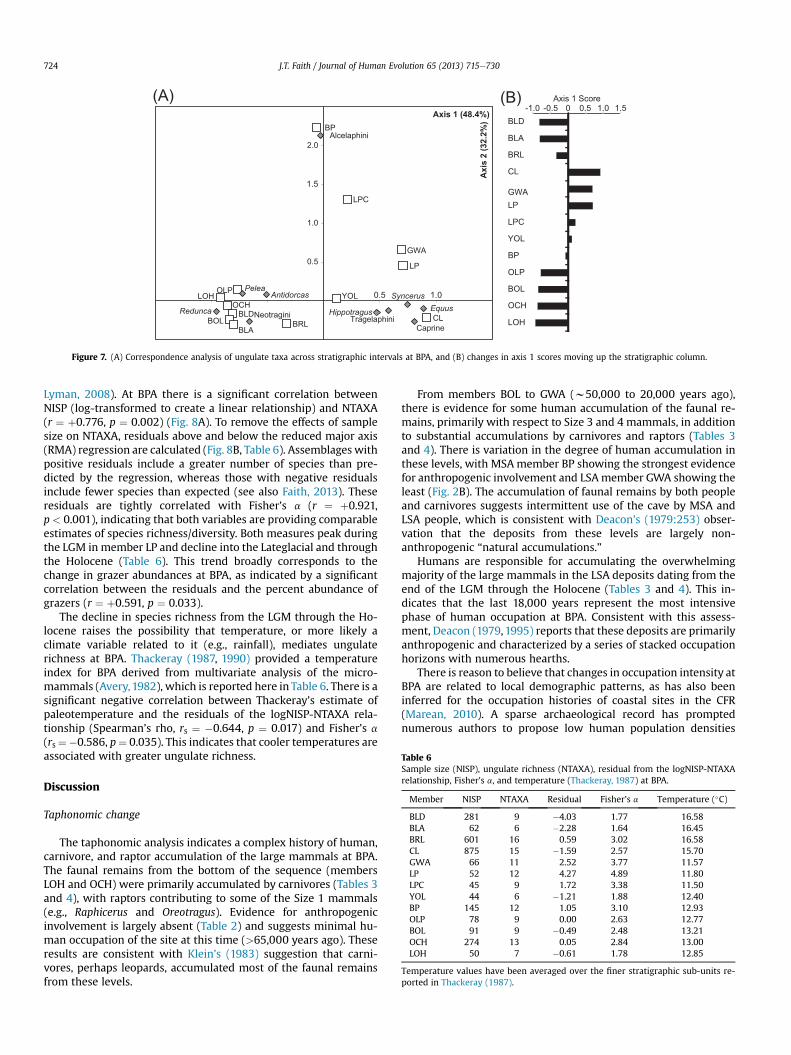
1.5
0.5
0.5
BLD
BLA
BRL
CL
GWALP
LPC
YOL
BP
OLP
BOL
OCH
LOH
Axis 1 Score
AlcelaphiniBP
LPC
GWA
LP
CL
YOL
BRLBLA
BOLBLD
OCHLOH
OLPAntidorcas
Pelea
NeotraginiReduncaEquus
Caprine
Syncerus
Hippotragus
Tragelaphini
1.0
2.0
Axis 1 (48.4%)
Axis 2 (32.2%
)
0 0.5 1.0 1.5-1.0 -0.5
1.0
(A) (B)
Figure 7. (A) Correspondence analysis of ungulate taxa across stratigraphic intervals at BPA, and (B) changes in axis 1 scores moving up the stratigraphic column.
Table 6Sample size (NISP), ungulate richness (NTAXA), residual from the logNISP-NTAXArelationship, Fisher’s a, and temperature (Thackeray, 1987) at BPA.
Member NISP NTAXA Residual Fisher’s a Temperature (�C)
BLD 281 9 �4.03 1.77 16.58BLA 62 6 �2.28 1.64 16.45BRL 601 16 0.59 3.02 16.58CL 875 15 �1.59 2.57 15.70GWA 66 11 2.52 3.77 11.57LP 52 12 4.27 4.89 11.80LPC 45 9 1.72 3.38 11.50YOL 44 6 �1.21 1.88 12.40BP 145 12 1.05 3.10 12.93OLP 78 9 0.00 2.63 12.77BOL 91 9 �0.49 2.48 13.21OCH 274 13 0.05 2.84 13.00LOH 50 7 �0.61 1.78 12.85
Temperature values have been averaged over the finer stratigraphic sub-units re-ported in Thackeray (1987).
J.T. Faith / Journal of Human Evolution 65 (2013) 715e730724
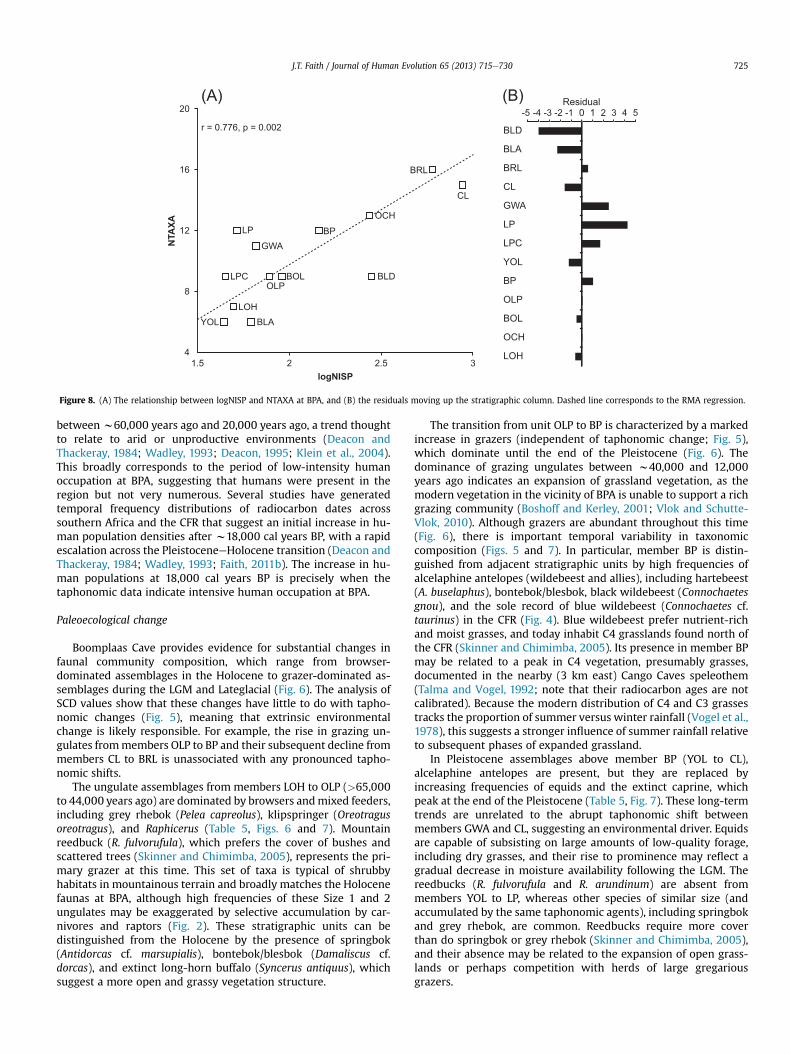
Lyman, 2008). At BPA there is a significant correlation betweenNISP (log-transformed to create a linear relationship) and NTAXA(r ¼ þ0.776, p ¼ 0.002) (Fig. 8A). To remove the effects of samplesize on NTAXA, residuals above and below the reduced major axis(RMA) regression are calculated (Fig. 8B, Table 6). Assemblages withpositive residuals include a greater number of species than pre-dicted by the regression, whereas those with negative residualsinclude fewer species than expected (see also Faith, 2013). Theseresiduals are tightly correlated with Fisher’s a (r ¼ þ0.921,p < 0.001), indicating that both variables are providing comparableestimates of species richness/diversity. Both measures peak duringthe LGM in member LP and decline into the Lateglacial and throughthe Holocene (Table 6). This trend broadly corresponds to thechange in grazer abundances at BPA, as indicated by a significantcorrelation between the residuals and the percent abundance ofgrazers (r ¼ þ0.591, p ¼ 0.033).
The decline in species richness from the LGM through the Ho-locene raises the possibility that temperature, or more likely aclimate variable related to it (e.g., rainfall), mediates ungulaterichness at BPA. Thackeray (1987, 1990) provided a temperatureindex for BPA derived from multivariate analysis of the micro-mammals (Avery,1982), which is reported here in Table 6. There is asignificant negative correlation between Thackeray’s estimate ofpaleotemperature and the residuals of the logNISP-NTAXA rela-tionship (Spearman’s rho, rs ¼ �0.644, p ¼ 0.017) and Fisher’s a
(rs¼�0.586, p¼ 0.035). This indicates that cooler temperatures areassociated with greater ungulate richness.
Discussion
Taphonomic change
The taphonomic analysis indicates a complex history of human,carnivore, and raptor accumulation of the large mammals at BPA.The faunal remains from the bottom of the sequence (membersLOH and OCH) were primarily accumulated by carnivores (Tables 3and 4), with raptors contributing to some of the Size 1 mammals(e.g., Raphicerus and Oreotragus). Evidence for anthropogenicinvolvement is largely absent (Table 2) and suggests minimal hu-man occupation of the site at this time (>65,000 years ago). Theseresults are consistent with Klein’s (1983) suggestion that carni-vores, perhaps leopards, accumulated most of the faunal remainsfrom these levels.
From members BOL to GWA (w50,000 to 20,000 years ago),there is evidence for some human accumulation of the faunal re-mains, primarily with respect to Size 3 and 4 mammals, in additionto substantial accumulations by carnivores and raptors (Tables 3and 4). There is variation in the degree of human accumulation inthese levels, with MSAmember BP showing the strongest evidencefor anthropogenic involvement and LSAmember GWA showing theleast (Fig. 2B). The accumulation of faunal remains by both peopleand carnivores suggests intermittent use of the cave by MSA andLSA people, which is consistent with Deacon’s (1979:253) obser-vation that the deposits from these levels are largely non-anthropogenic “natural accumulations.”
Humans are responsible for accumulating the overwhelmingmajority of the large mammals in the LSA deposits dating from theend of the LGM through the Holocene (Tables 3 and 4). This in-dicates that the last 18,000 years represent the most intensivephase of human occupation at BPA. Consistent with this assess-ment, Deacon (1979, 1995) reports that these deposits are primarilyanthropogenic and characterized by a series of stacked occupationhorizons with numerous hearths.
There is reason to believe that changes in occupation intensity atBPA are related to local demographic patterns, as has also beeninferred for the occupation histories of coastal sites in the CFR(Marean, 2010). A sparse archaeological record has promptednumerous authors to propose low human population densities
1.5 2 2.5 3
4
8
12
16
20
NTAXA
logNISP
LP
GWA
LPC BLD
BLAYOL
LOH
OLPBOL
BP
OCH
CL
BRL
r = 0.776, p = 0.002 BLD
BLA
BRL
CL
GWA
LP
LPC
YOL
BP
OLP
BOL
OCH
LOH
Residual0 1-5 52 3 4-1-2-3-4
(A) (B)
Figure 8. (A) The relationship between logNISP and NTAXA at BPA, and (B) the residuals moving up the stratigraphic column. Dashed line corresponds to the RMA regression.
J.T. Faith / Journal of Human Evolution 65 (2013) 715e730 725
between w60,000 years ago and 20,000 years ago, a trend thoughtto relate to arid or unproductive environments (Deacon andThackeray, 1984; Wadley, 1993; Deacon, 1995; Klein et al., 2004).This broadly corresponds to the period of low-intensity humanoccupation at BPA, suggesting that humans were present in theregion but not very numerous. Several studies have generatedtemporal frequency distributions of radiocarbon dates acrosssouthern Africa and the CFR that suggest an initial increase in hu-man population densities after w18,000 cal years BP, with a rapidescalation across the PleistoceneeHolocene transition (Deacon andThackeray, 1984; Wadley, 1993; Faith, 2011b). The increase in hu-man populations at 18,000 cal years BP is precisely when thetaphonomic data indicate intensive human occupation at BPA.
Paleoecological change
Boomplaas Cave provides evidence for substantial changes infaunal community composition, which range from browser-dominated assemblages in the Holocene to grazer-dominated as-semblages during the LGM and Lateglacial (Fig. 6). The analysis ofSCD values show that these changes have little to do with tapho-nomic changes (Fig. 5), meaning that extrinsic environmentalchange is likely responsible. For example, the rise in grazing un-gulates frommembers OLP to BP and their subsequent decline frommembers CL to BRL is unassociated with any pronounced tapho-nomic shifts.
The ungulate assemblages from members LOH to OLP (>65,000to 44,000 years ago) are dominated by browsers andmixed feeders,including grey rhebok (Pelea capreolus), klipspringer (Oreotragusoreotragus), and Raphicerus (Table 5, Figs. 6 and 7). Mountainreedbuck (R. fulvorufula), which prefers the cover of bushes andscattered trees (Skinner and Chimimba, 2005), represents the pri-mary grazer at this time. This set of taxa is typical of shrubbyhabitats in mountainous terrain and broadly matches the Holocenefaunas at BPA, although high frequencies of these Size 1 and 2ungulates may be exaggerated by selective accumulation by car-nivores and raptors (Fig. 2). These stratigraphic units can bedistinguished from the Holocene by the presence of springbok(Antidorcas cf. marsupialis), bontebok/blesbok (Damaliscus cf.dorcas), and extinct long-horn buffalo (Syncerus antiquus), whichsuggest a more open and grassy vegetation structure.
The transition from unit OLP to BP is characterized by a markedincrease in grazers (independent of taphonomic change; Fig. 5),which dominate until the end of the Pleistocene (Fig. 6). Thedominance of grazing ungulates between w40,000 and 12,000years ago indicates an expansion of grassland vegetation, as themodern vegetation in the vicinity of BPA is unable to support a richgrazing community (Boshoff and Kerley, 2001; Vlok and Schutte-Vlok, 2010). Although grazers are abundant throughout this time(Fig. 6), there is important temporal variability in taxonomiccomposition (Figs. 5 and 7). In particular, member BP is distin-guished from adjacent stratigraphic units by high frequencies ofalcelaphine antelopes (wildebeest and allies), including hartebeest(A. buselaphus), bontebok/blesbok, black wildebeest (Connochaetesgnou), and the sole record of blue wildebeest (Connochaetes cf.taurinus) in the CFR (Fig. 4). Blue wildebeest prefer nutrient-richand moist grasses, and today inhabit C4 grasslands found north ofthe CFR (Skinner and Chimimba, 2005). Its presence in member BPmay be related to a peak in C4 vegetation, presumably grasses,documented in the nearby (3 km east) Cango Caves speleothem(Talma and Vogel, 1992; note that their radiocarbon ages are notcalibrated). Because the modern distribution of C4 and C3 grassestracks the proportion of summer versus winter rainfall (Vogel et al.,1978), this suggests a stronger influence of summer rainfall relativeto subsequent phases of expanded grassland.
In Pleistocene assemblages above member BP (YOL to CL),alcelaphine antelopes are present, but they are replaced byincreasing frequencies of equids and the extinct caprine, whichpeak at the end of the Pleistocene (Table 5, Fig. 7). These long-termtrends are unrelated to the abrupt taphonomic shift betweenmembers GWA and CL, suggesting an environmental driver. Equidsare capable of subsisting on large amounts of low-quality forage,including dry grasses, and their rise to prominence may reflect agradual decrease in moisture availability following the LGM. Thereedbucks (R. fulvorufula and R. arundinum) are absent frommembers YOL to LP, whereas other species of similar size (andaccumulated by the same taphonomic agents), including springbokand grey rhebok, are common. Reedbucks require more coverthan do springbok or grey rhebok (Skinner and Chimimba, 2005),and their absence may be related to the expansion of open grass-lands or perhaps competition with herds of large gregariousgrazers.
J.T. Faith / Journal of Human Evolution 65 (2013) 715e730726
The presence of a species-rich community of grazing ungulatesduring the LGM and Lateglacial parallels evidence from otherinland (Opperman, 1978) and coastal sites (Klein, 1972; Schweitzerand Wilson, 1982) in the CFR and suggests that the spread ofgrasslands was geographically widespread. The Cango Caves spe-leothem indicates an almost exclusively C3 vegetation signal duringthe LGM (Talma and Vogel, 1992), indicating that these were C3grasslands, in which case winter rainfall would have been domi-nant (see also Faith, 2013). A speleothem fromPinnacle Point datingfrom 90,000 to 53,000 years ago shows that cooler phases areassociated with an expansion of C4 grasses and greater summerrainfall (Bar-Matthews et al., 2010). The fact that the LGM at BPA isassociated with C3 grasses and presumably winter rainfall suggeststhat the southern coast may have followed a somewhat differentrainfall regime than the interior (Faith, 2013) or that the patternsobserved at Pinnacle Point are not applicable to the LGM.
The transition to the Holocene takes place within member BRLand is associated with a decline in grazers (Fig. 6) and increasingfrequencies of grey rhebok, klipspringer, and Raphicerus, withmountain reedbuck once again the only common grazer. Thesechanges are independent of taphonomic change (Fig. 5) and areconsistent with a shift from open grasslands to vegetation broadlysimilar to that seen today (Klein, 1980, 1983; Faith, 2012). ThePleistoceneeHolocene transition is associated with the extinctionof Equus capensis and Syncerus antiquus. The extinct caprine persistssomewhat longer, disappearing during the early Holocene.
Ungulate richness and diversity increase from the bottom of thesequence to the LGM and decline through the Holocene, corre-sponding to the rise and fall of grazers (Fig. 8). Because BPA todayreceives fairly low annual rainfall (w400 mm/yr), the decline inrichness from the LGM to the Holocene likely reflects a decline ineffective precipitation (Faith, 2013). This in turn implies reducedterrestrial primary productivity and herbivore biomass during theHolocene (Coe et al., 1976; East, 1984). The replacement of alcela-phine antelopes by equids from the LGM to the end of the Pleis-tocene is consistent with a gradual drying trend. It is more difficultto interpret the intermediate ungulate richness observed in de-posits prior to the LGM (members LOH to YOL), as this could reflecta continued increase in effective precipitation (from intermediateto high rainfall) or a slight decline in effective precipitation. Theformer seems less likely, however, as the decline in richness at highprecipitation is expected to be associated with the loss of small-bodied ungulates (Olff et al., 2002), which are dominant in thelower levels at BPA (Table 5, Fig. 7).
The peak in ungulate richness during the LGM conflicts withother lines of paleoenvironmental evidence from BPA, particularlythe micromammal and charcoal assemblages, which have beeninterpreted as reflecting harsh and arid conditions (Avery, 1982;Deacon et al., 1984; Deacon and Lancaster, 1988; Deacon, 1995).However, both Chase and Meadows (2007) and Faith (2013) arguethat the patterns interpreted in terms of aridity may be mediatedby other factors. Because these arguments are crucial to the hy-potheses developed here, a brief summary is provided below.
The LGM charcoal assemblage has been interpreted as reflectingaridity on the basis of low taxonomic diversity and absence ofwoodland taxa (Deacon et al., 1984). However, both the large mam-mals (Fig. 6) andmicromammals (Avery,1982) indicate an expansionof grasslands during the LGM, and the dominance of grasses readilyexplains the patterns observed in the charcoal assemblage (e.g., thelack of trees). The lack of modern grassland analogs in the regionmeans that such vegetation change cannot be directly interpreted interms precipitation change (Meadows and Baxter, 1999).
The LGM micromammals from BPA have also been interpretedas indicating aridity (Avery, 1982; Deacon et al., 1984; Thackeray,1987). This stems from the dominance of grassland species (e.g.,
Saunder’s vlei rat, Otomys saundersae), high frequencies of Karoobush rat (O. uniculcatus), and low taxonomic diversity. As notedabove, however, the dominance of grassland species need notreflect aridity. The Karoo bush rat is associated with xeric envi-ronments receiving less than 400 mm of annual precipitation(Avery, 1982) and peak frequencies of this species during the LGMwould appear to imply aridity. However, this also coincides withpeak frequencies of Saunder’s vlei rat, which Avery (1982) associ-ates with more mesic environments (>400 mm/yr). This conflictsuggests that these species are tracking factors other than aridity.Temperature is a likely alternative, as both Karoo bush rat andSaunder’s vlei rat prefer cooler temperatures than do the othermicromammals at BPA (Thackeray, 1987).
Reduced micromammal diversity during the LGM is opposite tothe pattern observed for ungulates. While there is clear evidencelinking ungulate richness to rainfall in southern African ecosystems(Thackeray, 1980; Faith, 2013), similar evidence is not available formicromammals. This leaves open the possibility that micro-mammal diversity is tracking other factors, particularly vegetationcomplexity. Today there are substantial shifts in vegetation struc-ture paralleling temperature and rainfall gradients moving up theslopes of the SwartbergMountains (Moffett and Deacon,1977; Vlokand Schutte-Vlok, 2010). Biogeographers have long recognized thatsuch habitat complexity can promote species diversity (e.g.,MacArthur and Wilson, 1967), but that its effects on differentgroups of mammals are influenced by spatial scale and the ecologyof the taxa in question (e.g., Tews et al., 2004). It follows that whilethe mosaic of primarily shrubby vegetation communities provideslimited forage opportunities for ungulates, the habitat complexitycould promote diversity in the micromammal community. Thehomogenization of vegetation communities associated with theexpansion of LGM grasslands, in contrast, is likely to drive a declinein micromammal diversity.
Avery (2004) demonstrated that common molerat (Cryptomyshottentotus) body size is positively correlated with annual precipi-tation in southern Africa. The common molerats from the LGM atBPA are larger than their Holocene counterparts, suggestingincreased overall precipitation. The conflict between this and pre-vious interpretations of aridity led her to conclude that moleratbody size does not provide a reliable paleoenvironmental signal.However, these changes accord well with the ungulate data andwith my reassessment of the micromammal and charcoal evidence.
The argument that the LGM was wetter than the Holocene inthis part of southern Africa is consistent with paleoclimate modelsproposed by van Zinderen Bakker (1967, 1976). He proposed thatthe expansion of Antarctic sea ice during glacial phases contributesto a northward expansion of westerly frontal systems, bringingabout more frequent and intense winter rains (see also Stuut et al.,2004; Chase and Meadows, 2007). Such an expansion of winterrainfall is consistent with evidence for C3 grasslands during theLGM from the nearby Cango Caves (Talma and Vogel, 1992) andwith paleoclimate records elsewhere (Chase and Meadows, 2007).
Archaeological implications
Mitchell (2008) suggests that the rarity of human occupationsites in the CFR from w60,000 to 20,000 years ago reflects theconcentration of human populations on the now submergedcoastline. Drawing upon the evidence from Pinnacle Point Cave 13B(164,000 to 90,000 years ago), Marean (2010) subsequently arguedthat access to coastal resources played a central role in mediatingearly modern human subsistence and settlement strategies.Boomplaas Cave represents an important inland datum, and thehistory of human occupation at this site is consistent with thecoastal hypothesis. Whereas humans seem to have been largely
J.T. Faith / Journal of Human Evolution 65 (2013) 715e730 727
absent from BPA prior to w65,000 years ago (units OCH and LOH),there is good evidence for intensive human occupation of nearbycoastal sites at Die Kelders Cave 1 (Feathers and Bush, 2000;Marean et al., 2000a,b; Schwarcz and Rink, 2000), Blombos Cave(Henshilwood et al., 2001; Jacobs et al., 2006; Tribolo et al., 2006;Thompson and Henshilwood, 2011), Pinnacle Point 5/6 (Brownet al., 2012), and Klasies River Mouth (Klein, 1976; Singer andWymer, 1982; Deacon, 1995; Feathers, 2002). There is strong evi-dence that people were intensively occupying these nearby sitesand exploiting a range of coastal and terrestrial resources. Thecontrasting occupation histories of these sites relative to BPA sug-gest a preference for coastal environments. Low-intensity occupa-tion of BPA during the early part of the LSA sequence together withthe rarity of LSA human occupation sites older than 18,000 yearsago raises the possibility that the coastal adaptation was importantto both MSA and LSA hunteregatherers.
If Pleistocene human populations were indeed focused on theCFR coastline until the end of the LGM, then the evidence forsymbolism and artwork <70,000 years ago may very well be sub-merged. The BPA record shows that human occupation of the cavefrom w50,000 years ago to 18,000 years ago was ephemeral, asevidenced by substantial accumulation of faunal remains by car-nivores and raptors (Table 4). From a subsistence perspective, theseshort-lived visits by people are associated with the targeting oflarge ungulates, most of which are grazers (Table 5). Ephemeral andlow-intensity occupations of the cave are perhaps not the idealcircumstances for the production of complex material culture.Rather the densely populated residential sites along the submergedcoastline are where artwork and symbolism can be expected. Theapparent fluorescence of such behaviors >70,000 years ago can beexplained bymarine transgressions during the last interglacial (MIS5), which brought the coastline within the foraging range of sitesalong the modern coast (Van Andel, 1989; Fisher et al., 2010).
Both the CFR archaeological record and the BPA sequence pointto an increase in human population densities after the LGM. Thishas been previously attributed to ameliorating climates and a re-turn to more productive terrestrial environments (Deacon andThackeray, 1984; Wadley, 1993). This explanation is challenged bythe patterns of ungulate diversity, however, which instead indicatea steady decline in primary productivity since the LGM. An alter-native hypothesis is that the apparent demographic shift reflectsgreater population densities due to rapidly rising sea levels thatflooded the formerly exposed Agulhas Bank (Fisher et al., 2010;Compton, 2011). Elevated population densities potentially led tocompetition for increasingly scarce resources, which was likelyexacerbated by the decline in terrestrial productivity. The combi-nation of population pressure and competition for resources mayhave forced some LSA human populations to expand into lessfavorable inland CFR habitats.
The Howiesons Poort (HP) lithic assemblage in member OCH isassociated with a carnivore-accumulated faunal assemblage, sug-gesting extremely short-lived human occupation at this time.Although this precludes a discussion of human foragingbehavior, it ispossible to address the paleoecological context of the HP industry.Recent authors have linked the development of the HP to climaticinstability (Hiscock et al., 2011; McCall and Thomas, 2012) ordiminished productivity (Clark, 2011), whereas Ziegler et al. (2013)propose that its termination corresponds with an abrupt shift todrier conditions. These hypotheses are not supported at BPA, whichshows theHP to coincidewith aperiodof faunal stability (Fig. 5) andalong-termphase of intermediate productivity (Fig. 8).With respect tothe existing faunal evidence, there appears to be no single patternthat corresponds to the HP. For example, the HP fauna from BPAsamples shrubland habitats (Fig. 6), but with a slightly grassiercomponent comparedwith theHolocene. At Klasies RiverMouth, the
HP is associated with an increase in species suggestive of opengrasslands (Klein, 1976), whereas at Sibudu Cave the fauna is domi-nated by species from forested habitats (Clark and Plug, 2008; Clark,2011). The association of HP technology with such a wide array offaunal communities and environments raises the possibility thatenvironmental factors have little to do with its emergence ordisappearance.
Conclusions
The large mammal sequence from BPA is characterized bytaphonomic and paleoecological change. Taphonomic changesreveal shifts in human occupation intensity through time, whichcan be associated with regional demographic trends. When viewedin the broader CFR context, the occupation history of BPA lendssupport to the argument that access to coastal resources was cen-tral to human settlement and subsistence strategies until the end ofthe LGM. It is argued that the intensive occupation of BPA andregional increase in human occupation sites within the last 18,000years reflects an increase in population density and resource scar-city associated with a combination of rising sea levels and decliningterrestrial productivity.
Changes in the taxonomic composition of the BPA ungulatesprovide evidence for the interplay between precipitation and vege-tation change over the last 65,000 years. Cooler phasese particularlythe LGM e were associated with a species-rich grazer-dominatedungulate community, indicating highly productive terrestrial envi-ronments driven by altered rainfall regimes and an expansion ofgrassland vegetation. This is consistent with recent climatic syn-theses suggesting that the LGM in the CFR need not be interpreted asexceptionally harsh or arid (Chase and Meadows, 2007; Faith, 2013).
It is rare that both taphonomic and paleoecological analyses arecombined in examinations of late Quaternary faunas from southernAfrica. Although the importance of taphonomy has long beenrecognized when making behavioral interpretations of zooarch-aeological assemblages, the same is equally true when makingpaleoecological inferences. Boomplaas Cave represents the sole CFRlarge mammal assemblage where taphonomic and paleoecologicallines of evidence have been integrated. The combination of theselines of evidence provides a taphonomically grounded perspectiveon the interplay between human populations and environmentalchange through time.
Acknowledgments
Analysis of the BPA faunal assemblage was supported by a Na-tional Science Foundation Doctoral Dissertation ImprovementGrant (BCS-0824717). I am especially grateful to Sarah Wurz andDenise Hamerton for providing access to the BPA fauna andcomparative material at the Iziko South African Museum, and alsoto Petro Keene, Valerie Mienes, and Wilhelmina Seconna for theirassistance in the laboratory. Some of the ideas presented here stemfrom my dissertation research and I would like to thank my com-mittee, including Alison Brooks, Kay Behrensmeyer, Don Grayson,Curtis Marean, Bernard Wood, and Mindy Zeder. I also thank JamieClark (reviewer), Lee Lyman (reviewer), Mark Teaford (editor), andtwo anonymous reviewers for providing helpful feedback on aprevious version of this paper.
Appendix A. Supplementary material
Supplementary material related to this article can be found athttp://dx.doi.org/10.1016/j.jhevol.2013.09.001.
J.T. Faith / Journal of Human Evolution 65 (2013) 715e730728
References
Andrews, P., 1990. Owls, Caves, and Fossils. University of Chicago Press, Chicago.Avery, D.M., 1982. Micromammals as palaeoenvironmental indicators and an
interpretation of the late Quaternary in the southern Cape Province, SouthAfrica. Annls. S. Afr. Mus. 85, 183e274.
Avery, D.M., 2004. Size variation in the common molerat Cryptomys hottentotusfrom southern Africa and its potential for palaeoenvironmental reconstruction.J. Archaeol. Sci. 31, 273e282.
Bar-Matthews, M., Marean, C.W., Jacobs, Z., Karkanas, P., Fisher, E.C., Herries, A.I.R.,Brown, K., Williams, H.M., Bernatchez, J., Ayalon, A., Nilssen, P.J., 2010. A highresolution and continuous isotopic speleothem record of paleoclimate andpaleoenvironment from 90 to 53 ka from Pinnacle Point on the south coast ofSouth Africa. Quatern. Sci. Rev. 29, 2131e2145.
Binford, L.R., 1981. Bones: Ancient Men and Modern Myths. Academic Press, NewYork.
Blumenschine, R.J., 1988. An experimental model of the timing of hominid andcarnivore influence on archaeological bone assemblages. J. Archaeol. Sci. 15,483e502.
Blumenschine, R.J., 1995. Percussion marks, tooth marks, and experimental de-terminations of the timing of hominid and carnivore access to long bones at FLKZinjanthropus, Olduvai Gorge, Tanzania. J. Hum. Evol. 29, 21e51.
Blumenschine, R.J., Selvaggio, M.M., 1988. Percussion marks on bone surfaces as anew diagnostic of hominid behavior. Nature 333, 763e765.
Blumenschine, R.J., Marean, C.W., Capaldo, S.D., 1996. Blind tests of inter-analystcorrespondence and accuracy in the identification of cut marks, percussionmarks, and carnivore toothmarks on bone surfaces. J. Archaeol. Sci. 23, 493e507.
Boshoff, A.F., Kerley, G.I.H., 2001. Potential distributions of the medium- to large-sized mammals in the Cape Floristic Region, based on historical accounts andhabitat requirements. Afr. Zool. 36, 245e273.
Boshoff, A.F., Kerley, G.I.H., Cowling, R.M., 2001. A pragmatic approach to estimatingthe distributions and spatial requirements of the medium- to large-sizedmammals in the Cape Floristic Region, South Africa. Divers. Distrib. 7, 29e43.
Brain, C.K., 1981. The Hunters or the Hunted? An Introduction to African CaveTaphonomy. University of Chicago Press, Chicago.
Branch, G.M., Branch, M., 1992. The Living Shores of Southern Africa. Struik Pub-lishers, Cape Town.
Brink, J.S., 1999. Preliminary report on a Caprine from the Cape mountains, SouthAfrica. Archaeozoology 10, 11e26.
Brown, K.S., Marean, C.W., Herries, A.I.R., Jacobs, Z., Tribolo, C., Braun, D.,Roberts, D.L., Meyer, M.C., Bernatchez, J., 2009. Fire as an engineering tool ofearly modern humans. Science 325, 859e862.
Brown, K.S., Marean, C.W., Jacobs, Z., Schoville, B.J., Oestmo, S., Fisher, E.C.,Bernatchez, J., Karkanas, P., Matthews, T., 2012. An early and enduring advancedtechnology originating 71,000 years ago in South Africa. Nature 491, 590e593.
Cannon, M.D., 2001. Archaeofaunal relative abundance, sample size, and statisticalmethods. J. Archaeol. Sci. 28, 185e195.
Capaldo, S.D., 1995. Inferring hominid and carnivore behavior from dual-patternedarchaeofaunal assemblages. Ph.D. Dissertation, Rutgers University.
Capaldo, S.D., 1997. Experimental determinations of carcass processing by Plio-Pleistocene hominids and carnivores at FLK 22 (Zinjanthropus), Olduvai Gorge,Tanzania. J. Hum. Evol. 33, 555e597.
Chase, B.M., 2010. South African palaeoenvironments during marine oxygen isotopestage 4: a context for the Howiesons Poort and Still Bay industries. J. Archaeol.Sci. 37, 1359e1366.
Chase, B.M., Meadows, M.E., 2007. Late Quaternary dynamics of southern Africa’swinter rainfall zone. Earth Sci. Rev. 84, 103e138.
Clark, J.L., 2011. The evolution of human culture during the later Pleistocene: usingfauna to test models on the emergence and nature of “modern” humanbehavior. J. Anthropol. Archaeol. 30, 273e291.
Clark, J.L., Plug, I., 2008. Animal exploitation strategies during the South AfricanMiddle Stone Age: Howiesons Poort and post-Howiesons Poort fauna fromSibudu Cave. J. Hum. Evol. 54, 886e898.
Codron, D., Brink, J.S., Rossouw, L., Clauss, M., 2008. The evolution of ecologicalspecialisation in southern African ungulates: competition or physical environ-mental turnover? Oikos 117, 344e353.
Coe, M.J., Cumming, D.H., Phillipson, L., 1976. Biomass and production of large Af-rican herbivores in relation to rainfall and primary production. Oecologia 22,341e354.
Compton, J.S., 2011. Pleistocene sea-level fluctuations and human evolution on thesouthern coastal plain of South Africa. Quatern. Sci. Rev. 30, 506e527.
Cowling, R.M., Lombard, A.T., 2002. Heterogeneity, speciation/extinction history andclimate: explaining regional plant diversity patterns in the Cape Floristic Re-gion. Divers. Distrib. 8, 163e179.
Cowling, R.M., Richardson, D.M., Mustart, P.J., 1997. Fynbos. In: Cowling, R.M.,Richardson, D.M., Peirce, S.M. (Eds.), Vegetation of Southern Africa. CambridgeUniversity Press, Cambridge, pp. 99e130.
d’Errico, F., Henshilwood, C.S., Vanhaeren, M., Van Niekerk, K., 2005. Nassariuskraussianus shell beads from Blombos Cave: evidence for symbolic behavior inthe Middle Stone Age. J. Hum. Evol. 48, 3e24.
Danell, K.L., Niemela, P., 1996. Species richness in mammalian herbivores: patternsin the boreal zone. Ecography 19, 404e409.
Deacon, H.J., 1979. Excavations at Boomplaas cave e a sequence through the UpperPleistocene and Holocene in South Africa. World Archaeol. 10, 241e257.
Deacon, H.J., 1989. Late Pleistocene palaeoecology and archaeology in the southernCape, South Africa. In: Mellars, P., Stringer, C. (Eds.), The Human Revolution.Princeton University Press, Princeton, pp. 547e564.
Deacon, H.J., 1993. Planting an idea: an archaeology of Stone Age gatherers in SouthAfrica. S. Afr. Archaeol. Bull. 48, 86e93.
Deacon, H.J., 1995. Two late PleistoceneeHolocene archaeological depositories fromthe Southern Cape, South Africa. S. Afr. Archaeol. Bull. 50, 121e131.
Deacon, H.J., Thackeray, J.F., 1984. Late Pleistocene environmental changes andimplications for the archaeological record in southern Africa. In: Vogel, J.C. (Ed.),Late Cainozoic Palaeoclimates of the Southern Hemisphere. Balkema, Rotter-dam, pp. 375e390.
Deacon, H.J., Deacon, J., Scholtz, A., Thackeray, J.F., Brink, J.S., 1984. Correlation ofpalaeoenvironmental data from the Late Pleistocene and Holocene deposits atBoomplaas Cave, southern Cape. In: Vogel, J.C. (Ed.), Late Cainozoic Palae-oclimates of the Southern Hemisphere. Balkema, Rotterdam, pp. 339e351.
Deacon, J., 1984. The Later Stone Age of southernmost Africa. British ArchaeologicalReports International Series, vol. 213. Oxford, p. 160.
Deacon, J., Lancaster, N., 1988. Late Quaternary Palaeoenvironments of SouthernAfrica. Oxford University Press, New York.
East, R., 1984. Rainfall, soil nutrient status and biomass of large African savannamammals. Afr. J. Ecol. 22, 245e270.
Egeland, A., Egeland, C.P., Bunn, H.T., 2008. Taphonomic analysis of a modernspotted hyena den (Crocuta crocuta) from Nairobi, Kenya. J. Taphon. 6, 275e300.
Faith, J.T., 2007. Sources of variation in carnivore tooth-mark frequencies in amodern spotted hyena (Crocuta crocuta) den assemblage, Amboseli Park, Kenya.J. Archaeol. Sci. 34, 1601e1609.
Faith, J.T., 2011a. Ungulate community richness, grazer extinctions, and humansubsistence behavior in southern Africa’s Cape Floral Region. Palaeogeogr.Palaeoclimatol. Palaeoecol. 306, 219e227.
Faith, J.T., 2011b. Late Quaternary megafaunal extinctions in southern Africa’s CapeFloral Region. Ph.D. Dissertation, The George Washington University, Wash-ington DC.
Faith, J.T., 2012. Paleozoological insights into management options for a threatenedmammal: southern Africa’s Cape mountain zebra (Equus zebra zebra). Divers.Distrib. 18, 438e447.
Faith, J.T., 2013. Ungulate diversity and precipitation history since the Last GlacialMaximum in the Western Cape, South Africa. Quatern. Sci. Rev. 68, 191e199.
Faith, J.T., Thompson, J.C., 2013. Fossil evidence for seasonal calving and migrationof extinct blue antelope (Hippotragus leucophaeus) in southern Africa.J. Biogeogr. http://dx.doi.org/10.1111/jbi.12154.
Faith, J.T., Choiniere, J.N., Tryon, C.A., Peppe, D.J., Fox, D.L., 2011. Taxonomic statusand paleoecology of Rusingoryx atopocranion (Mammalia, Artiodactyla), anextinct Pleistocene bovid from Rusinga Island, Kenya. Quatern. Res. 75, 697e707.
Feathers, J.K., 2002. Luminescence dating in less than ideal conditions: case studiesfrom Klasies River Main Site and Duinefontein, South Africa. J. Archaeol. Sci. 29,177e194.
Feathers, J.K., Bush, D.A., 2000. Luminescence dating of Middle Stone Age depositsat Die Kelders. J. Hum. Evol. 38, 91e118.
Fisher, E.C., Bar-Matthews, M., Jerardino, A., Marean, C.W., 2010. Middle and LatePleistocene paleoscape modeling along the southern coast of South Africa.Quatern. Sci. Rev. 29, 1382e1398.
Fisher, J.W., 1995. Bone surface modifications in zooarchaeology. J. Archaeol.Method Th. 2, 7e68.
Gavin, D.G., Oswald, W.W., Wahlf, E.R., Williams, J.W., 2003. A statistical approach toevaluating distance metrics and analog assignments for pollen records. Qua-tern. Res. 60, 356e367.
Gibbons, M.J., 1999. The taxonomic richness of South Africa’s marine fauna: a crisisat hand. S. Afr. J. Sci. 95, 8e12.
Goldblatt, P., Manning, J.C., 2002. Plant diversity of the Cape Region of South Africa.Annls. Missouri Bot. Gard. 89, 281e302.
Grayson, D.K., 1984. Quantitative Zooarchaeology. Academic Press, Orlando.Grayson, D.K., 1998. Moisture history and small mammal community richness
during the latest Pleistocene and Holocene, northern Bonneville Basin, Utah.Quatern. Res. 49, 330e334.
Greenacre, M.J., Vrba, E.S., 1984. Graphical display and interpretation of antelopecensus data in African wildlife areas using correspondence analysis. Ecology 65,984e997.
Griffiths, C.L., Robinson, T.B., Lange, L., Mead, A., 2010. Marine biodiversity in SouthAfrica: an evaluation of current states of knowledge. PLoS One 5, 1e13.
Hammer, Ø., Harper, D.A.T., Ryan, P.D., 2001. Paleontological statistics softwarepackage for education and data analysis. Palaeontol. Electron. 4, 9.
Harris, J.M., 1991. Family Bovidae. In: Harris, J.M. (Ed.), Koobi Fora Research Project,The Fossil Ungulates: Geology, Fossil Artiodactyls, and Palaeoenvironments, vol.3. Clarendon Press, Oxford, pp. 139e320.
Hayek, L.-A.C., Buzas, M.A., 2010. Surveying Natural Populations. Columbia Uni-versity Press, New York.
Henshilwood, C.S., Sealy, J.C., Yates, R., Cruz-Uribe, K., Grine, F.E., Klein, R.G.,Poggenpoel, C., van Niekerk, K., Watts, I., 2001. Blombos Cave, Southern Cape,South Africa: Preliminary report on the 1992e1999 excavations of the MiddleStone Age levels. J. Archaeol. Sci. 28, 421e448.
Henshilwood, C.S., d’Errico, F., Yates, R., Jacobs, Z., Tribolo, C., Duller, G.A.T.,Mercier, N., Sealy, J.C., Valladas, H., Watts, I., Wintle, A.G., 2002. Emergence ofmodern human behavior: Middle Stone Age engravings from South Africa.Science 295, 1278e1280.
J.T. Faith / Journal of Human Evolution 65 (2013) 715e730 729
Henshilwood, C.S., d’Errico, F., Vanhaeren, M., Van Niekerk, K., Jacobs, Z., 2004.Middle Stone Age shell beads from South Africa. Science 304, 404.
Henshilwood, C.S., d’Errico, F., Watts, I., 2009. Engraved ochres from the MiddleStone Age levels at Blombos Cave, South Africa. J. Hum. Evol. 57, 27e47.
Henshilwood, C.S., d’Errico, F., van Niekerk, K.L., Coquinot, Y., Jacobs, Z.,Lauritzen, S.-E., Menu, M., García-Moreno, R., 2011. A 100,000-year-old ochre-processing workshop at Blombos Cave, South Africa. Science 334, 219e222.
Hiscock, P., Clarkson, C., Mackay, A., 2011. Big debates over little tools: ongoingdisputes over microliths on three continents. World Archaeol. 43, 653e664.
Jacobs, Z., Duller, G.A.T., Wintle, A.G., Henshilwood, C.S., 2006. Extending thechronology of deposits at Blombos Cave, South Africa, back to 140 ka usingoptical dating of single and multiple grains of quartz. J. Hum. Evol. 51, 255e273.
Jacobs, Z., Roberts, R.G., Galbraith, R.F., Deacon, H.J., Grün, R., Mackay, A., Mitchell, P.,Vogelsang, R., Wadley, L., 2008. Ages for the Middle Stone Age of southernAfrica: implications for human behavior and dispersal. Science 322, 733e735.
Jerardino, A., Marean, C.W., 2010. Shellfish gathering, marine paleoecology andmodern human behavior: perspectives from cave PP13B, Pinnacle Point, SouthAfrica. J. Hum. Evol. 59, 412e424.
Klein, R.G., 1972. The late Quaternary mammalian fauna of Nelson Bay Cave (CapeProvince, South Africa): its implications for megafaunal extinctions and envi-ronmental and cultural change. Quatern. Res. 2, 135e142.
Klein, R.G., 1976. The mammalian fauna of the Klasies River Mouth sites, SouthernCape Province, South Africa. S. Afr. Archaeol. Bull. 31, 75e98.
Klein, R.G., 1978. A preliminary report on the larger mammals from the Boomplaasstone age cave site, Cango Valley, Oudtshoorn District, South Africa. S. Afr.Archaeol. Bull. 33, 66e75.
Klein, R.G., 1980. Environmental and ecological implications of large mammals fromUpper Pleistocene and Holocene sites in southern Africa. Annls. S. Afr. Mus. 81,223e283.
Klein, R.G., 1983. Palaeoenvironmental implications of Quaternary large mammalsin the fynbos region. In: Deacon, H.J., Hendey, Q.B., Lambrechts, J.J.N. (Eds.),Fynbos Palaeoecology: a Preliminary Synthesis. Mills Litho, Cape Town,pp. 116e138. South African National Scientific Programmes Report No 75.
Klein, R.G., Cruz-Uribe, K., 2000. Middle and Later Stone Age large mammal andtortoise remains from Die Kelders Cave 1, Western Cape Province, South Africa.J. Hum. Evol. 38, 169e195.
Klein, R.G., Avery, G., Halkett, D., Parkington, J., Steele, T., Volman, T.P., Yates, R.,2004. The Ysterfontein 1 Middle Stone Age site, South Africa, and early humanexploitation of coastal resources. Proc. Natl. Acad. Sci. 101, 5708e5715.
Kuhn, B.F., Berger, L.R., Skinner, J.D., 2009. Variation in tooth mark frequencies onlong bones from the assemblages of all three extant bone-collecting hyaenids.J. Archaeol. Sci. 36, 297e307.
Kuhn, B.F., Berger, L.R., Skinner, J.D., 2010. Examining criteria for identifying anddifferentiating fossil faunal assemblages accumulated by hyenas and homininsusing extant hyenid accumulations. Int. J. Osteoarchaeol. 20, 15e35.
Lee, R.B., 1979. The !Kung San: Men, Women and Work in a Foraging Society.Cambridge University Press, Cambridge.
Lee-Thorp, J.A., Beaumont, P.B., 1995. Vegetation and seasonality shifts during thelate Quaternary deduced from 13C/12C ratios of grazers at Equus Cave, SouthAfrica. Quatern. Res. 43, 426e432.
Liengme, C., 1987. Botanical remains from archaeological sites in the western Cape.In: Parkington, J.E., Hall, M. (Eds.), Papers in the Prehistory of the Western Cape,South Africa, British Archaeological Reports International Series, vol. 332. Ox-ford, pp. 236e261.
Linder, H.P., Hardy, C.R., 2004. Evolution of the species-rich Cape flora. Phil. Trans. R.Soc. B 359, 1623e1632.
Lombard, M., 2005. The Howiesons Poort of South Africa: what we know, what wethink we know, what we need to know. S. Afr. Hum. 17, 33e55.
Ludwig, A.J., Reynolds, J.F., 1988. Statistical Ecology: a Primer on Methods andComputing. Wiley, New York.
Lyman, R.L., 1994. Vertebrate Taphonomy. Cambridge University Press, Cambridge.Lyman, R.L., 2008. Quantitative Paleozoology. Cambridge University Press,
Cambridge.MacArthur, R.H., Wilson, E.O., 1967. The Theory of Island Biogeography. Princeton
University Press, Princeton.Mackay, A., Welz, A., 2008. Engraved ochre from a Middle Stone Age context at
Klein Kliphuis in the Western Cape of South Africa. J. Archaeol. Sci. 35, 1521e1532.
Maguire, J.M., Pemberton, D., Collet, M.H., 1980. The Makapansgat Limeworks greybreccia: hominids, hyaenas, hystricids, or hillwash? Palaeont. Afr. 23, 75e98.
Magurran, A.E., 1988. Ecological Diversity and its Measurement. Princeton Univer-sity Press, Princeton.
Manning, J., 2008. Field Guide to Fynbos. Struik Publishers Ltd., Cape Town.Marean, C.W., 1990. Late Quaternary paleoenvironments and faunal exploitation in
East Africa. Ph.D. Dissertation, University of California, Berkeley.Marean, C.W., 1991. Measuring the postdepositional destruction of bone in
archaeological assemblages. J. Archaeol. Sci. 18, 677e694.Marean, C.W., 1992. Hunter to herder: the large mammal remains from Enkapune
Ya Muto rockshelter (Central Rift, Kenya). Afr. Archaeol. Rev. 10, 65e127.Marean, C.W., 2010. Pinnacle Point Cave 13B (Western Cape Province, South Africa)
in context: the Cape Floral kingdom, shellfish, and modern human origins.J. Hum. Evol. 59, 425e443.
Marean, C.W., Abe, Y., Frey, C.J., Randall, R.C., 2000a. Zooarchaeological and taph-onomic analysis of the Die Kelders Cave 1 Layers 10 and 11 Middle Stone Agelarger mammal fauna. J. Hum. Evol. 38, 197e233.
Marean, C.W., Goldberg, P., Avery, G., Grine, F.E., Klein, R.G., 2000b. Middle StoneAge stratigraphy and excavations at Die Kelders Cave 1 (Western Cape Province,South Africa): the 1992, 1993, and 1995 field seasons. J. Hum. Evol. 38, 7e42.
Marean, C.W., Bar-Matthews, M., Bernatchez, J., Fisher, E., Goldberg, P.,Herries, A.I.R., Jacobs, Z., Jerardino, A., Karkanas, P., Minichillo, T., Nilssen, P.J.,Thompson, E., Watts, I., Williams, H.M., 2007. Early human use of marine re-sources and pigment in South Africa during the Middle Pleistocene. Nature 449,905e908.
McCall, G.S., Thomas, J.T., 2012. Still Bay and Howiesons Poort foraging strategies:recent research and models of cultural change. Afr. Archaeol. Rev. 29, 7e50.
Meadows, M.E., Baxter, A.J., 1999. Late Quaternary palaeoenvironments of thesouthwestern Cape, South Africa: a regional synthesis. Quatern. Int. 57, 193e206.
Miller, G.H., Beaumont, P.B., Deacon, H.J., Brooks, A.S., Hare, P.E., Jull, A.J.T., 1999.Earliest modern humans in southern Africa dated by isoleucine epimerizationin ostrich eggshell. Quatern. Sci. Rev. 18, 1537e1548.
Mitchell, P., 2008. Developing the archaeology of Marine Isotope stage 3. S. Afr.Archaeol. Soc. Goodwin Ser. 10, 52e65.
Moffett, R.O., Deacon, H.J., 1977. The flora and vegetation in the surrounds ofBoomplaas Cave: Cango Valley. S. Afr. Archaeol. Bull. 32, 127e145.
Myers, N., Mittermeier, R.A., Mittermeier, C.G., de Fonesca, G.A.B., Kent, J., 2000.Biodiversity hotspots for conservation priorities. Nature 403, 853e858.
Olff, H., Ritchie, M.E., Prins, H.H.T., 2002. Global environmental controls of diversityin large herbivores. Nature 415, 901e905.
Opperman, H., 1978. Excavations in the Buffelskloof rock shelter near Calitzdorp,Southern Cape. S. Afr. Archaeol. Bull. 33, 18e38.
Parkington, J., 2003. Middens and moderns: shellfishing and the Middle Stone Ageof the Western Cape, South Africa. S. Afr. J. Sci. 99, 243e247.
Peters, J., 1988. Osteomorphological features of the appendicular skeleton of Africanbuffalo, Syncerus caffer (Sparrman, 1779) and of domestic cattle, Bos primigeniusf. taurus (Bojanus, 1827). Z. Saugetierkd. 53, 108e123.
Peters, J., Brink, J.S., 1992. Comparative postcranial osteomorphology and osteom-etry of springbok, Antidorcas marsupialis (Zimmerman, 1780) and grey rhebok,Pelea capreolus (Forster, 1790) (Mammali: Bovidae). Navorsinge van die Nasio-nale Mus. Bloemfontein 8, 161e206.
Prendergast, M., Domínguez-Rodrigo, M., 2008. Taphonomic analyses of a hyenaden and a natural-death assemblage near Lake Eyasi (Tanzania). J. Taphon. 6,301e336.
Proches, S., Cowling, R.M., Goldblatt, P., Manning, J.C., Snijman, D.A., 2006. Anoverview of the Cape geophytes. Biol. J. Linn. Soc. 87, 27e43.
Rector, A.L., Reed, K.E., 2010. Middle and Late Pleistocene faunas of Pinnacle Pointand their paleoecological implications. J. Hum. Evol. 59, 340e357.
Rector, A.L., Verrelli, B.C., 2010. Glacial cycling, large mammal community compo-sition, and trophic adaptations in the Western Cape, South Africa. J. Hum. Evol.58, 90e102.
Reimer, P.J., Baillie, M.G.L., Bard, E., Bayliss, A., Beck, J.W., Blackwell, P.G., BronkRamsey, C., Buck, C.E., Burr, G.S., Edwards, R.L., Friedrich, M., Grootes, P.M.,Guilderson, T.P., Hajdas, I., Heaton, T.J., Hogg, A.G., Hughen, K.A., Kaiser, K.F.,Kromer, B., McCormac, F.G., Manning, S.W., Reimer, R.W., Richards, D.A.,Southon, J.R., Talamo, S., Turney, C.S.M., van der Plicht, J., Weyhenmeyer, C.E.,2009. IntCal09 and Marine09 radiocarbon age calibration curves, 0e50,000years cal BP. Radiocarbon 51, 1111e1150.
Rosenzweig, M.L., 1995. Species Diversity in Space and Time. Cambridge UniversityPress, Cambridge.
Rosenzweig, M.L., Abramsky, Z., 1993. How are diversity and productivity related?In: Ricklefs, E., Schluter, D. (Eds.), Species Diversity in Ecological Communities.University of Chicago Press, Chicago, pp. 52e65.
Schwarcz, H.P., Rink, W.J., 2000. ESR dating of the Die Kelders 1 site, South Africa.J. Hum. Evol. 38, 121e128.
Schweitzer, F.R., Wilson, M.L., 1982. Byneskranskop 1, a late Quaternary living site inthe southern Cape Province, South Africa. Annls. S. Afr. Mus. 88, 1e203.
Selvaggio, M.M., 1998. Evidence for a three-stage sequence of hominid and carni-vore involvement with long bones at FLK Zinjanthropus, Olduvai Gorge,Tanzania. J. Archaeol. Sci. 25, 191e202.
Singer, R., Wymer, J., 1982. The Middle Stone Age at Klasies River Mouth in SouthAfrica. University of Chicago Press, Chicago.
Skead, C.J., 1980. Historical Mammal Incidence in the Cape Province, vol. 1.Department of Nature and Environmental Conservation of the ProvincialAdministration of the Cape of Good Hope, Cape Town.
Skead, C.J., 2011. Historical Incidence of the Larger Land Mammals in the BroaderWestern and Northern Cape. Centre for African Conservation Ecology, NelsonMandela Metropolitan University, Port Elizabeth.
Skinner, J.D., Chimimba, C.T., 2005. The Mammals of the Southern African Subre-gion. Cambridge University Press, Cambridge.
Stuiver, M., Reimer, P.J., 1993. Extended 14C database and revised CALIB radiocarboncalibration program. Radiocarbon 32, 215e230.
Stuut, J.-B.W., Crosta, X., van der Borg, K., Schneider, R.R., 2004. On the relationshipbetween Antactic sea ice and southwestern African climate during the lateQuaternary. Geology 32, 909e912.
Talma, A.S., Vogel, J.C., 1992. Late Quaternary palaeotemperatures derived from aspeleothem from Cango Caves, Cape Province, South Africa. Quatern. Res. 37,203e213.
Tews, J., Brose, U., Grimm, V., Tielbörger, Wichmann, M.C., Schwager, M., Jeltsch, F.,2004. Animal species diversity driven by habitat heterogeneity/diversity: theimportance of keystone structures. J. Biogeogr. 31, 79e92.
J.T. Faith / Journal of Human Evolution 65 (2013) 715e730730
Texier, P.J., Porraz, G., Parkington, J.E., Rigaud, J.-P., Poggenpoel, C., Miller, C.,Tribolo, C., Cartwright, C., Coudenneau, A., Klein, R.G., Steele, T., Verna, C., 2010.A Howiesons Poort tradition of engraving ostrich eggshell containers dated to60,000 years ago at Diepkloof Rock Shelter, South Africa. Proc. Natl. Acad. Sci.117, 6180e6185.
Thackeray, J.F., 1980. New approaches to interpreting archaeological faunal as-semblages with examples from southern Africa. S. Afr. J. Sci. 76, 216e223.
Thackeray, J.F., 1987. Late Quaternary environmental changes inferred from smallmammalian fauna, southern Africa. Climat. Change 10, 285e305.
Thackeray, J.F., 1990. Temperature indices from late Quaternary sequences in SouthAfrica: comparisons with the Vostok core. S. Afr. Geogr. J. 72, 47e49.
Thompson, J.C., 2010. Taphonomic analysis of the Middle Stone Age faunal assem-blage from Pinnacle Point Cave 13B, Western Cape, South Africa. J. Hum. Evol.59, 321e339.
Thompson, J.C., Henshilwood, C.S., 2011. Taphonomic analysis of the Middle StoneAge larger mammal faunal assemblage from Blombos Cave, southern Cape,South Africa. J. Hum. Evol. 60, 746e767.
Tribolo, C., Mercier, N., Selo, M., Valladas, H., Joron, J.-L., Reyss, J.-L.,Henshilwood, C.S., Sealy, J.C., Yates, R., 2006. TL dating of burnt lithics fromBlombos Cave (South Africa): further evidence for the antiquity of modernhuman behavior. Archaeometry 48, 341e357.
Van Andel, T.H., 1989. Late Pleistocene sea levels and the human exploitation of theshore and shelf of southern South Africa. J. Field. Archaeol. 16, 133e155.
van Zinderen Bakker, E.M., 1967. Upper Pleistocene stratigraphy and Holoceneecology on the basis of vegetation changes in Sub-Saharan Africa. In:Bishop, W.W., Clark, J.D. (Eds.), Background to Evolution in Africa. University ofChicago Press, Chicago, pp. 125e157.
van Zinderen Bakker, E.M., 1976. The evolution of late Quaternary paleoclimates ofsouthern Africa. Palaeoecol. Afr. 9, 160e202.
Villa, P., Mahieu, E., 1991. Breakage patterns of human long bones. J. Hum. Evol. 21,27e48.
Vlok, J., Schutte-Vlok, A.L., 2010. Plants of the Klein Karoo. Umdaus Press, Hatfield,South Africa.
Vogel, J.C., 2001. Radiometric dates for the Middle Stone Age in South Africa. In:Tobias, P.V., Raath, M.A., Maggi-Cecchi, J., Doyle, G.A. (Eds.), Humanity fromAfrican Naissance to Coming Millennia. Florence University Press, Florence,pp. 261e268.
Vogel, J.C., Fuls, A., Ellis, R.P., 1978. The geographical distribution of Kranz grasses inSouth Africa. S. Afr. J. Sci. 74, 209e215.
Volman, T.P., 1978. Early archaeological evidence for shellfish collecting. Science201, 911e913.
Vrba, E.S., 1997. New fossils of Alcelaphini and Caprinae (Bovidae, Mammalia) fromAwash, Ethiopia, and phylogenetic analysis of Alcelaphini. Paleontol. Afr. 34,127e198.
Wadley, L., 1993. The Pleistocene Later Stone Age south of the Limpopo River.J. World Prehist. 7, 243e296.
Watts, I., 2010. The pigments from Pinnacle Point Cave 13B, Western Cape, SouthAfrica. J. Hum. Evol. 59, 392e411.
Wurz, S., 1999. The Howiesons Poort backed artefacts from Klasies River: anargument for symbolic behavior. S. Afr. Archaeol. Bull. 54, 38e50.
Ziegler, M., Simon, M.H., Hall, I.R., Barker, S., Stringer, C., Zahn, R., 2013. Develop-ment of Middle Stone Age innovation linked to rapid climate change. Nat.Commun. 4 (1905), 1e9.