TAFRICAN JOU RN IC RESEA
159
West African Journal of Industrial and Academic Research December 2016 v0l.17 1 ISSN: 2276-9129 W E S T A F R I C A N J O U R N A L O F I N D U S T R I A L & A C A D E M I C R E S E A R C H
-
Upload
khangminh22 -
Category
Documents
-
view
6 -
download
0
Transcript of TAFRICAN JOU RN IC RESEA

West African Journal of Industrial and Academic Research December 2016 v0l.17 1
I S S N : 2 2 7 6 - 9 1 2 9
WES
TAFRICANJOURNA
L OF INDUSTRIAL
&ACADEMICRESEAR
CH

West African Journal of Industrial and Academic Research December 2016 v0l.17 2
West African Journal of Industrial & academic research
Vol.17 No.1. December, 2016
West African Journal of Industrial
& Academic Research
EEnnggiinneeeerriinngg RReesseeaarrcchh aanndd PPrroodduuccttiioonn • Effects of size and site factors on the availability of a standalone microgrid
A.Abdulkarim, S. M. Abdelkader , D. J. Morro 3 • System Maintenance toward Promoting Healthy Environment
(A Case) Study of Federal Capital Territory (FCT) Metropolis Abuja) Engr. Gana A.J and Engr Theophilus.T 25
• Multi-Class Load Balancing Scheme for QoS and Energy Conservation in Cloud Computing
Olasupo O. AJAYI1, Florence A. OLADEJI2, and Charles O. UWADI 30
CCoommppuuttiinngg,, IInnffoorrmmaattiioonn TTeecchhnnoollooggyy RReesseeaarrcchh aanndd PPrroodduuccttiioonn • ICT Education: A Tool For Quality Assurance In Tertiary Institution In Nigeria Ugwuanyi Fidelis Onyebu and Agomuo Princewill ChijiubaI 37
• Information Thnology Infrastructure In Information Processing For Enhancing Workplace Safety In Rivers State Anthonia Enefaa Bestman 47 • ICT in Building Construction: Prospects and Challenges in Developing Countries
Veronica Nkechi Imakwu and Babatunde Bayodele Olofin 54 • iCT in Teaching Mathematics: Nigerian Teachers’ perspective
Kevin C. Anaeche Babatunde Bayodele Olofin, and Nnamani Francis Onah 66 • Video Conferencing: Most Effective Technology to Run Assemblies and Meetings
for Large Audience Dispersed In Distant Locations: Is It Feasible To Deploy in Nigeria? Osuagwu O.E., Ndigwe Chinwe, Ihedigbo C , Suleiman U. and Babatunde Olofi 75
Mathematics, Statistics, Econometrics and Operations Research • Effect Of Determinants Of Infant And Child Mortality In Nigeria: Hazard And Odds Ratio Models
OnatunjiAdewaleP. and A AdesinaOluwaseun `````````` 84 • Analysis of Factors Influencing Import f Demand in Nigeria
Alwell Nteegah and Nelson Mansi 90 • Application of cluster analysis for data driven market segmentation
Akomolafe .A. A And Adebola F.B 103
MMaannaaggeemmeenntt,, EEdduuccaattiioonn && SSoocciiaall SScciieennccee AAggrriiccuullttuurraall EEnnggiinneeeerriinngg && RReesseeaarrcchh • External Trade and its implications on Foreign Exchange Reserves in Nigeria
Alwell Nteegah and Godspower Ebimotimi Okpoi 108
• Forensic Accounting And Financial Crisis In Nigeria Anuolam O. M, Onyema T. E, and Ekeke Ussim 126
• The Effect of Electricity and Gas Losses on Nigeria`s Gross Domestic ProducMarcus,
Samuel Nnamdi , Nwosu Chinedu Anthony and Odii Alex` 132 • Risk Assessment of Sediment of Aforemu River, Oye Ekiti, Nigeria
Fatoye, A.O and Ojo, T.J 144
• The Biological Father Of Jesus Christ; A Critique Of James Tabor’s Hypothesis
Nwaocha Ogechukwu 147 Editor-in-Chief: PPrrooffeessssoorr OO..EE.. OOssuuaaggwwwwuu,, DD..SScc,, FFNNCCSS,, FFBBCCSS

West African Journal of Industrial and Academic Research December 2016 v0l.17 3
West African Journal of Industrial & academic research
Vol.17 No.1. December, 2016
West African Journal of Industrial
& Academic Research Editor-in-Chief: Prof. Oliver E. Osuagwu, DSc CS, PhD IT, FNCS, FBCS, CITP, MIEEE, MACM
Editorial Board: Prof Tony B.E. Ogiemien, PhD, BL, (USA), Engr. Prof E. Anyanwu, Ph.D, FNSE, Prof. G. Nworuh, PhD,, Dr. B. C. Ashiegbu, PhD ,Prof .E. Emenyionu, PhD, (Connecticut USA,) , Prof. E.P. Akpan, Ph.D, Engr. Prof. C.D. Okereke, Ph.D, Prof. B.E.B. Nwoko, Ph.D, Prof. N..N. Onu, PhD, Prof M.O. Iwuala, PhD, Prof C.E.Akujo, PhD, Prof. G. Okoroafor, PhD, Prof Leah Ojinna, Ph.D (USA), Prof. O. Ibidapo-Obe, PhD, FAS., Prof. E. Adagunodo, PhD, Prof. J.C .Ododo, PhD, Dan C. Amadi, PhD(English), Prof.(Mrs) S.C. Chiemeke, PhD,FNCS, Prof (Mrs) G. Chukwudebe,PhD, FNSE, Prof. E.N.C. Okafor, PhD, (Mrs) I. Achumba, PhD, T. Obiringa, PhD, Prof S. Inyama, PhD, Prof. C. Akiyoku, PhD, FNCS, Prof. John Ododo, PhD, Prof. E. Nwachukwu, Ph.D, FNCS, Prof. S. Anigbogu, PhD,FNCS, Prof. H. Inyama, PhD, FNSE , .Prof. B.N.. Onwuagba, PhD, Prof J..N. Ogbulie, PhD, Prof. M..M. Ibrahim, PhD, Prince Oghenekaro Asagba, PhD
Published by: Olliverson Industrial Publishing House The Research & Publications Division of Hi-Technology Concepts (WA) Ltd For The International Institute for Science, Technology Research & Development, Owerri, Nigeria & USA All rights of publication and translation reserved. Permission for the reproduction of text and illustration should be directed to the Editor-in-Chief @ OIPH, 9-14 Mbonu Ojike Street, Ikenegbu, Owerri, Nigeria or via our email address or the international office for those outside Nigeria
© IInntteerrnnaattiioonnaall IInnssttiittuuttee ffoorr SScciieennccee,, TTeecchhnnoollooggyy RReesseeaarrcchh && DDeevveellooppmmeenntt,, [[IIIISSTTRRDD]]
OOwweerrrrii,, NNiiggeerriiaa//UUSSAA

West African Journal of Industrial and Academic Research December 2016 v0l.17 4
Effects of size and site factors on the availability of a standalone microgrid
A.Abdulkarim, S. M. Abdelkader2 , D. J. Morrow3
1Department of Electrical & Electronics Engineering, University of Ilorin, Nigeria 2Electrical Engineering Department, Mansoura University, Mansoura 35516 Egypt
3School of Electronics, Electrical Engineering and Comp Sci. QUB, United Kingdom [email protected]; [email protected]; [email protected]
\ Abstract
In this paper, effects of storage and diesel generator on the availability hybrid renewable energy microgrid
have been investigated. Markov technique has been used for the analysis of the output powers of the wind
energy conversion system (WECS) and solar energy conversion system (SECS).The proposed method has
been tested by increasing the rated power of the WECS and SECS by 25 %, 50%, 75% and 100%. The results
have shown a decreased in the number of times a diesel generator starts by 2 %, 7%, 9% and 9 % for WECS.
Similarly, SECS decreased same by 4 %, 8 %, 11%, and 13 %. Also, the study of wind generator parameter at
different cut-in-speeds levels, including 2 m/s, 2.5m/s, 3.5m/s and 4 m/s reduced the number of times a diesel
generator start by 122, 147, 116 and 134. In addition, the effects of weather on the availability of system have
been investigated using Boolean Logic Drivenazarkov process. In the same way, neglecting weather factor
overestimate the system availability by 3.55%. Also, increasing the rated power of the WECS is the best way
of maximizing the benefit-to-cost ratio (BCR) of the system.
Keywords---Microgrid, renewable energy, wind storage diesel generator, availability weather, PV ________________________________________________________________________________________ Introduction Recently, integrating an existing diesel generator with renewable energy such as wind and solar in the form of a microgrid is being planned for isolated loads. In some cases, battery storage is added to reduce the variations in power from the renewable energy. In this arrangement, the diesel generator operates only when all the other resources cannot meet the demand. The operation of the battery storage and diesel generator may have effects on the economy and availability of the system. This makes the development of strategies for maximising the benefits of these units an important priority for system planners. This paper investigated the factors that will maximise the benefits of storage and diesel generators connected to an isolated microgrid. The study is divided into two sections. Section one study the effects of the renewable energy resource on the operation of a diesel generator. The relationship between the availability of the storage and the availability of the microgrid have been analysed in section two. In order to achieve these, Markov and Boolean logic driven Markov processes are used in order to take the randomness of the renewable energy power output into
consideration. This is achieved by representing the output power of the WECS (wind energy conversion system) and SECS (solar energy conversion system) using a transition matrix. The elements of this matrix are the transition rates between the different power output levels of the WECS and SECS. Such presentations enable incorporating the failure rate of both solar and wind energy conversion systems in the power classes. The output of the classification is used to develop a Markov model whose solution is used to estimate the system parameters. The parameters
include the number of times a diesel generator
starts, the energy produced and the energy used
by the system. Additionally, the effects of site and
size factors on the number of times a diesel generator starts are investigated. Finally, since the system may be exposed to bad weather, the effects of weather on the availability need to be known in order to deliver autonomous, economical and reliable energy to the isolated systems.
1. 2. Analyses of the renewable energy resources
The hourly renewable energy power of the study area is obtained by adding the hourly output

West African Journal of Industrial and Academic Research December 2016 v0l.17 5
power of the WECS and SECS. It is assumed that modelling this way takes the hourly fluctuations of both the wind and solar energy conversion systems into consideration. WECS system output power is a function of the three wind speeds that results in different design alternatives(Yang, Pei, & Qi, 2012
). The wind speeds include cut-in speed
( cut-out speed ) and the rated speed of
the wind turbine ( ). The power output of the wind energy conversion system is obtained using
(1) The wind turbine considered is assumed to be highly reliable and compact in size. It is considered ideal for both populated and remote areas due to the compact size that make it easy to transport. It has a rated power of 850 kW(Manco & Testa, 2007). The proposed wind turbine has the ability to
optimise the output power using pitch technology in both high and medium wind speed conditions. It is also available in various tower heights and the characteristics of this wind turbine are shown in Table 1.
Table 1: Wind turbine specification.
Cut-in-speed (m/s)
Normal wind speed (m/s)
Cut-out- speed (m/s)
4 16 25
On the other hand, the output power of the SECS can be determined from different mathematical models expressed in (Yang, Pei, & Qi, 2012 )-(Zhao, Xuesong, Jian, Caisheng, & Li, 2013). In these models, the output power of the system can be determined depending on some parameters. These parameters include its rated power under standard test condition, light intensity, and the operating ambient temperature. The model used in the determination of the output power of the solar energy conversion system is expressed in equation (2).
(2) where, is the solar radiation of the operating
point ( , is the instantaneous PV generator efficiency, is the area of a single
module used in the analysis ( and is the number of module. The module efficiency can be determined based on the mathematical model defined in (Tafreshi, Zamani, Ezzati, & Vahedi, 2010) Renewable energy potential of Belfast, United Kingdom is used in the analysis. Application of the wind turbine characteristic and site wind speed result in the output power of the WECS. Similar analysis is carried out for the SECS. Finally, the total hourly output power of the renewable energy side of the proposed system is shown in Figure 1.The hourly output power of the renewable energy systems is obtained by summing the output power of the wind and solar energy systems, as shown in Figure 1.

West African Journal of Industrial and Academic Research December 2016 v0l.17 6
0 1000 2000 3000 4000 5000 6000 7000 8000 90000
200
400
600
800
1000
1200
1400
1600
1800
2000
Time (Hours)
Tota
l
Renew
able
Energ
y O
utp
ut P
ow
er (k
W)
Figure 1: Total renewable energy output power. 3. Modelling of the renewable energy output power The output power of the renewable energy system is used to derive the renewable energy power classes - . In addition, the output power is used to assume a class interval of 200 kW span between and . On the other hand, represent a class with output power equal to zero and is the class of outputs greater 1600 kW and less than or equal to the 1836 kW. These are used to define the powers in each class according as shown in Table 2.In each class the minimum power is defined as (Pmin), the upper limit is called the maximum power (Pmax) and the mean power in each class is defined as (Pmean) of the class. In order to treat the output power statistically, the transition rates among different states (different power classes) are determined
from the power output of the system. The expressions for the determination of the transition rates are given by Equations (3) and (4).
[events/hour] (3)
(4)
where is the transition rate between state and
the state is the is considered as one hour,
The result of Equations (3) and (4) is presented in
Table 3, the row represents the state and the
column of the state.
Table 2: Total renewable energy output power classifications.
Power Class
Pmin Pmax Pmean Sample in the Class
Class frequency
0 0 0 1327 0.1515
0 200 200 738 0.0842
200 400 300 142 0.0162
400 600 500 789 0.0901
600 800 700 999 0.1140
800 1000 900 791 0.0903
1000 1200 1100 458 0.0523

West African Journal of Industrial and Academic Research December 2016 v0l.17 7
1200 1400 1300 764 0.0872
1400 1600 1500 1375 0.1570
1600 1836 1718 607 0.0693
1836 1836 1836 770 0.0879
Table 3: Transition rates between power classes.
0 1 2 3 4 5 6 7 8 9 10
0 0.3926 0.2724 0 0.2269 0.2342 0.2149 0.2205 0.25 0.3513 0.3328 0.4792
1 0.3406 0.2696 0.6197 0.3194 0.2533 0.2807 0.2795 0.3442 0.312 0.3328 0.3662
2 0.1771 0.1816 0.1761 0.2231 0.1832 0.177 0.1354 0.1649 0.176 0.201 0.1247
3 0.0799 0.1328 0.1268 0.1242 0.1532 0.1252 0.1376 0.0864 0.0865 0.0923 0.0273
4 0.0083 0.061 0.0211 0.076 0.0991 0.1024 0.1026 0.0654 0.0313 0.0379 0.0026
5 0.0015 0.0474 0.0141 0.0228 0.0501 0.0594 0.059 0.0445 0.0291 0.0033 0
6 0 0.0217 0.007 0.0038 0.013 0.019 0.0459 0.0275 0.0116 0 0
7 0 0.0108 0.007 0.0038 0.009 0.0152 0.0131 0.0092 0.0022 0 0
8 0 0.0027 0.0282 0 0.003 0.0038 0.0044 0.0039 0 0 0
9 0 0 0 0 0.002 0.0013 0 0.0039 0 0 0
10 0 0 0 0 0 0.0013 0.0022 0 0 0 0 4. Markovian model In order to analyse the hybrid microgrid using a Markov process, the model presented in Figure 2 is proposed. The model consists of the output power of the two renewable energy resources. Each state
corresponds to a class with the corresponding output power levels of the state. Modelling this way makes it possible to observe the transition between states.
Figure 2: Markov model of hybrid PV-wind Microgrid. 5. Solution of the proposed model The solution of the proposed model is based on the expressions of the steady state probabilities, durations and frequencies of entry into the states. The mathematical expressions of these variables are described in (Manco & Testa, 2007). Also, the state probabilities are defined using the relationships between the input and output frequencies of each state.
N 0
N 0
N 0
……
……

West African Journal of Industrial and Academic Research December 2016 v0l.17 8
(5) It can be observed that these are systems of linear Equations of N unknowns. In this case, the unknowns are . Eliminating the last equation and adding it to the steady state probability, the steady state probabilities are given by Equation (6).
(6) The system frequency is determined using Equation (7).
(7) Finally the mean state
durations are determined directly from the transition rate using the expressions described in Equation (8).
(8) In order to test the application of the procedure, the proposed model has been implemented. The result is shown in Table 4.
Table 4: Steady state solution of the model.
Power Class Pmin Pmax Pmean
Steady State Probability
Duration (Hours)
.
Frequency (Event/hour)
.
P0 0 0 0 0.1615 1.6464 0.0920
P1 0 200 200 0.0842 1.3692 0.0615
P2 200 400 300 0.0162 1.2137 0.0134
P3 400 600 500 0.0901 1.1418 0.0789
P4 600 800 700 0.1140 1.1100 0.1027
P5 800 1000 900 0.0903 1.0632 0.0849
P6 1000 1200 1100 0.0523 1.0481 0.0499
P7 1200 1400 1300 0.0872 1.0092 0.0864
P8 1400 1600 1500 0.1570 1.0000 0.1570
P9 1600 1836 1718 0.0693 1.0000 0.0693
P10 1836 1836 1836 0.0879 1.0000 0.0879
Figure 3 shows the load profile and the probability of occurrences for each load demand for a period of a typical day. The system demand is repeated
for a period of one year and is used in the simulation.
Figure 3: Daily demand and probability at each hour.

West African Journal of Industrial and Academic Research December 2016 v0l.17 9
For the load distribution, the daily energy need of the system is obtained using equation (9).
(9) The annual energy need by the system is determined using Equation (10).
(10) Comparing the output power of the renewable energy sources shown in Figure 1 and the system demand in Figure 3; it can be observed that there is a need for storage and a diesel generator
Algorithm for adding the storage and diesel generator In order to integrate both storage and diesel generator, the following algorithm is implemented. Since the amount of energy stored is time dependant, the input/output power of the battery is controlled by the following algorithm,
where
where is the power demanded by the load, and is efficiency of the DC/AC inverter, which is usually specified by the manufacturer. Depending on the manufacturer’s recommendation and on the value, the following strategy is applied:
If the and the battery is not fully charged, the battery absorbs the difference in power.
On the other hand, when the following strategy applied that is depending on the dispatch strategy: If the battery is able to supply the deficit, the diesel generator turns off.
Application of the algorithm presented results into new output power. The new system output power for the renewable energy and the battery storage is shown in Figure 4. The output of the simulation shows that the output power generated by the renewable energy sources is stored for use at another time. In addition, the result has shown the need for the diesel generator.
Figure 4: New power profile without diesel generator.
If the battery cannot supply the demand, it is assumed that the battery is neither charging nor discharging, and therefore the diesel generator is turned ON and is supplying the deficit.
The proposed algorithm is used to estimate the number of times a diesel generator starts. Different
alternatives for reducing the number of times a diesel generator starts could be proposed. This will maximize the lifespan of the diesel generator, and the economic benefit of the system might be improved. The alternative includes the effects of the size and site factors on the annual number of times the diesel generator starts.

West African Journal of Industrial and Academic Research December 2016 v0l.17 10
6. Effects of size factors on the diesel generator operation This section investigates the relationship between the size factors and the operation of the diesel generator. The analysis is proposed in order to recommend ways of maximising the benefits of size factors on the diesel generator operation. The effects come down to the rated power of the WECS and SECS. Various case studies considered include the base case in which the actual renewable energy sizes of the WECS and SECS are used. The base case is followed by cases II, III, IV and V for 25%, 50%, 75% and 100% increases in size factors. The results of the simulations are presented as a percentage of the base case, as shown in Figure 5. The results have shown that increasing the rated power of the WECS and SECS by 25% decreased the number of times a diesel generator starts by 2%
and 4% respectively. Similarly, increasing the rated power in the same order by 50% results in 7% and 8% decreases in the number of times the diesel generator starts. In the same way, increasing the rated power by 75% decreased the number by 9% and 11% respectively. Also, increasing the rated power of the WECS and SECS by 100% decreased the number of times the diesel generator starts by only 9% and 13% respectively. Increasing the rated power of SECS has the highest percentage decrease in the number of times the diesel generator starts. However, the benefit of the system is not proportional to the corresponding increase in the rated power of the WECS and SECS. Increases in the rated power of the WECS and SECS do not produce corresponding decreases in the number of times a diesel generator starts by the same factor.
Figure 5: Number of diesel generator starts VS rated power of WECS & SECS. 7. Effects of the site factor on diesel generator operation Another factor used in the analysis of the proposed hybrid microgrid is the cut-in speed of the wind turbine generator. The cut-in-speed affects the number of times the diesel generator starts. This section explored how variations of the cut-in speed affect the number times a diesel generator starts. To achieve this aim, the cut-in
speed of the wind turbine is varied according to the proposed strategies. The proposed strategy in this case is to change the cut-in speed at different levels, including 2.0, 2.5, 3.0, 3.5 and 4.0 m/s. The result of this analysis is shown in Figure 6. Hence it can be seen that the best system benefit is obtained when the cut-in speed is 4 m/s
.

West African Journal of Industrial and Academic Research December 2016 v0l.17 11
Figure 6: Effects of cut-in-speed on the DG start. 8. Benefits of storage on the net savings of hybrid microgrid The output power of the renewable energy depends on the failure and repair rates of both the WECS and the SECS. Therefore a model that takes the failure and a repair rate into consideration is proposed in Figure 7(Abdelkader, 2013). This presentation enables us to use series and parallel theorems in the determination of the failure and
repair rates of the system (Billinton & Allan, 1983). Modelling this way enables using a Markov theorem for the determination of the capacity of the storage system so that it would have economic value. In order to use the proposed method, the output power of the renewable energy sources is represented by the 3-state Markov model.
Figure 7: Proposed Markov model. where, REP is the renewable energy output power The proposed model can be represented mathematically in two different forms. The first presentation is to drive the system transition matrix and obtain the probability distributions of state at times k+1 in terms of the preceding state k. The second alternative is to drive the state equations by
using the state diagram. The latter option has the advantage of reducing the order of equations by one half (Abdelkader, 2013). Therefore, the developed model is solved according to the second method. The state equation of the Markov process
REP UP REP UP REP UP
REP DOWN REP DOWN REP DOWN
class 1 class 2 class 3
West African Journal of Industrial and Academic Research December 2016 v0l.17 12
consisting of three different renewable output powers is defined by:
12 1 0 021 31 1131
12 1 0 012 32 2132
12 1 0 013 23 3133
12 10 01 21 31131
12 10 02 12 322 13
12 10 0 3 13 231 13
tt t
tp
tt tp t
tt tp t
tt tq t
tt tq t
tt tq t
λ µ
λ µ
λ µ
λλ
λλ
λλ
− − • − −• −
− • −− − = −• − −
• − − − • −−
−
1
2
3
1
2
3
p
p
p
q
q
q
(11) The probabilities of the output power of the renewable energy system are represented by ,
for states 1, 2 and 3 respectively. The corresponding failure probabilities of the three states are represented by . In the same way, the transition rate of each state is given as
for states to respectively. According to the proposed model, it is can be seen that states 3, 4, 5 and 6 have equal power levels, all equal to zero. These states can be lumped together in order to reduce the number of equations. State 3 has zero output power due to low wind speed and low solar radiation. On the other hand, states 4, 5 and 6 have zero output power due to failures of the WECS and/or of the SECS. Mathematical expressions of the new states are given in Equation (12),
(12)
where = Equation (12) can be presented in a reduce form as:
(13)
In this case, , and is the probability of the lumped states. The elements of the B matrix are determined as follows:
and
Also, is the steady states probability of p and q
Presentation of the model in the reduced states enables us to determine the average time spent before the output power of the WECS and SECS drop from a specified value to zero. This time is used for the determination of the storage capacity required so that it has capacity credit. The aim is to determine the storage capacity that could be used for the maximum net savings.
8.1 Average return time From the state equation
(14) taking the Laplace transform of both sides and assuming the initial state probabilities , the solution is given by
(15) Hence Equation (15) expresses the probability of being in each state as a function of time. In order to solve this equation, it is assumed that the system starts from the down state. That means
and . Having obtained the probabilities, the average output power at each interval is obtained from
(16)
where are the average output power for classes 1, 2 and 3 respectively. At any output power level, the average return time is obtained by solving Equation (17).
(17)

West African Journal of Industrial and Academic Research December 2016 v0l.17 13
Therefore, the storage capacity ( required to achieve capacity credit is determined by solving Equation (18).
(18) This section obtained the optimum storage capacity that needs to be added to the system so that it will have capacity credit. To achieve this, the analysis is divided into two sections. Section one determined the total annual system cost; this is the cost of the renewable energy resources and storage system. The second section obtained the total savings that maximised the capacity credit. In order to determine total savings, the total cost of the system is defined in Equation (19).
(19) Annual cost is estimated using the expression(Zhao, Zhang, Chen, Wang, & Guo, 2013)
111111111111111 (20)
where is the annual cost, is the present value,
is the interest rate, is the useful life years and
is the inflation rate. 8.2 Savings 8.3
The savings as a result of the proposed storage is divided into two parts consisting of the avoided
cost of displaced capacity and the cost of energy saved. The avoided cost of the displaced 111ventional capacity is defined in Equation (21)
(21) where
: annual savings due to the displaced capacity : the annual cost of kW of the displaced
capacity : the displaced capacity kW
To determine the cost of energy saved, the following assumptions are applied. If the renewable energy systems have no storage system, then the output energy cannot be scheduled. Therefore the savings are determined based on the peak load. Alternatively, if storage is added, then the firm capacity is only a fraction of the rated power. The energy output is evaluated as a fraction of the peak energy price, and the energy saved is defined as
(22) The total savings are:
(23)
8.4 Application of the procedure The application of the proposed procedure is tested using renewable output power of the model and the cost data shown in Table 5.
Table 5: Cost data for the benefits of storage system.
Interest rate 0.40%
Inflation rate 0.50%
On peak energy price 0.2724 $/kWh
Off peak energy prices 0.1369 $/kWh
Cost of WECS 4700 $/kW
Cost of SECS 3000 $/kW
Rated power of WECS 850 kW
Rated Powers of SECS 10 kW
Conventional unit rated power 500 kW
Cost of Conventional unit 600 $/kW
Cost of storage system` 280 $/kWh
West African Journal of Industrial and Academic Research December 2016 v0l.17 14
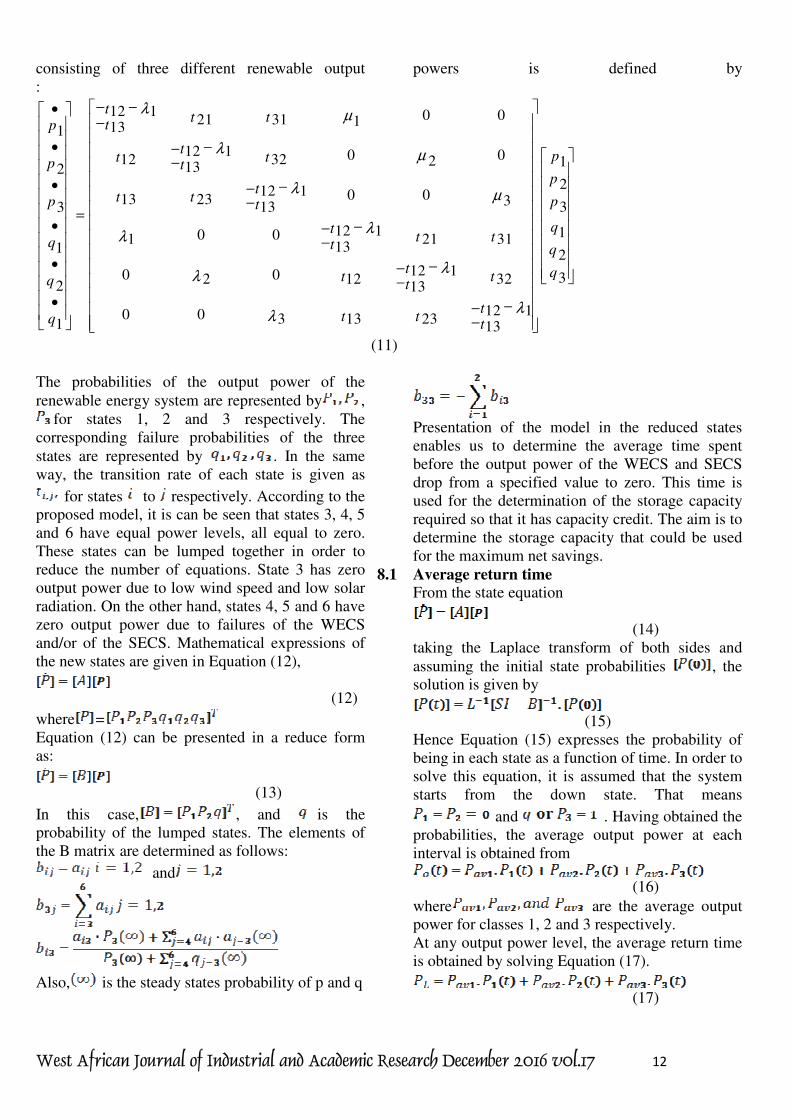
In order to determine the storage requirement of the system, the cyclic behaviour of the system output power has to be taken into consideration. This is achieved by defining the output states of
the output power as and for the up, medium and down states respectively. The up state represents when the output power of the renewable resources is greater than average power, the medium state represents the renewable energy
output power being equal to or less than the average power, and the down state is when the output power is equal to zero. Application of the proposed classification of the output power of the WECS and SECS yields the results presented in Table 6. Also, the transition rates between the defined power levels are observed and reported in Table 7.
Table 6: average power and the probability.
State Power Probability
1 Up State 415.4618 0.3643
2 Medium state 77.8078 0.3268
3 Down State 0 0.3089
Table7: Transition rate between the power levels.
1 2 3
1 0.328 0.4867 0.2887
2 0.326 0.2918 0.3567
3 0.346 0.2216 0.3546
In addition to the cost data, the failure and repair rates for each state are shown in Table 8. Table 8: failure and repair rates.
State 1 2 3
0.0136 0.0034 0.0023
0.0516 0.03639 0.2149
The state equation of the system is given by
1
2
3
1
2
1
p
p
p
q
q
q
•
• •
•
• •
=
-0.6856 0.4867 0.2887 0.0516 0 0
0.326 -0.7117 0.3567 0 0.03639 0
0.346 0.2216 -0.6477 0 0 0.2149
0.0136 0 0 -0.7236 0.4867 0.2887
0 0.0034 0 0.326 -0.74469 0.3567
0 0 0.0023 0.346 0.2216 -0.8603
1
2
3
1
2
3
p
p
p
q
q
q
Lumping states 3, 4, 5 and 5, the resultant state equation is given by

West African Journal of Industrial and Academic Research December 2016 v0l.17 15
1
2
p
p
q
•
•
•
=
-0.672 0.4867 0.1084
0.326 -0.7083 0.1341
0.3596 0.225 -0.2426
1
2
p
p
q
(24)
Finally, the solution of the system, assuming that it started in state 3, gives the following equation:
Using the average output power of each state, the output power at any time is obtained as
(25) The system average return time is obtained at any output level by solving
(26) Finally, the average return time and storage capacity Q as a function of the firm levels is shown in Figure 8. This result can be used to estimate the storage capacity required for maintaining different capacity levels. Figure 9 shows the relationship between the total cost of the system and the annual savings at different firm levels. The system benefit-to-cost ratio (BCR) and total savings at different storage capacities are shown in Figure 10. It can be observed that to increase the firm level from 20 kW to 40 kW, the storage capacity has to increase from 500 kWh to 700 kWh. In the same way, the system annual cost has increased from 4.22 x10⁶ $ to 4.24 x10⁶ $. It is clear that the overall system savings will increase from 1.91 x10⁶ $ to 1.97 x10⁶ $ per annum. A sensitivity analysis was carried out on the rated power of the wind and solar energy conversion systems. A representative sample of the results is shown in Figure 11. The results show that the BCR of the proposed systems is more sensitive to the rated power of the WECS. Hence increasing the rated power of the WECS increased the BCR of the system more than increasing the rated power of the SECS. Also, the system savings is not sensitive to the rated power of these units. An
increase in the rated power of the renewable energy resources increased the project cost without actually increasing the benefits of the system. The effects of the capital cost of each unit on the system BCR ratio have been investigated. The study was done with the anticipation that the cost of each unit will decrease in the future(Chowdhury, Chowdhury, & Crossley, 2009). Therefore, it is assumed that the cost decreased by 10, 20 and 30% in each case. In the same way, a sample of the results is shown in Figure 12. The results of the WECS have shown an increase in the BCR of the system by 9.2, 18. 5 and 38.5%. In the case of the SECS, the system BCR increased by 0.07%, 0.14% and 0.2088% in that order. In the same way, the BCR of the system increased by 0.62, 1.34 and 1.76% of the storage system cost. Also, the system BCR increased by 0.42%, 0.85% and 1.27% of the conventional unit cost. It can be seen that in each case, the system BCR increases with decreases in the capital cost. In general, decreases in the capital cost of the WECS system increased the BCR by nearly the same factor. Therefore the best way to increase the benefit of the system is to decrease the capital costs of the WECS.

West African Journal of Industrial and Academic Research December 2016 v0l.17 16
Figure 8: Annual return time and storage capacity at different firm levels.
Figure 9: Total cost of the system and savings as a function of storage capacity.
Figure 10: BCR and annual savings at different storage capacities.

West African Journal of Industrial and Academic Research December 2016 v0l.17 17
Figure 11: Effects of increasing the rated power of WECS by 25%.
Figure 12: Decrease in the capital cost of WECS by 10%. 9. Analysis of system availability using the Boolean logic driven Markov process A hybrid renewable energy microgrid has many systems that are connected in standby mode. Therefore the availability model of the system is very difficult to obtain. Monte Carlo simulation could have solved the problem. However, it is time-consuming, and the precision of the results has not been determined. Due to the dependence of the proposed microgrid on the weather, conventional methods such as a fault tree may not be suitable. In order to solve these problems, usually papers rely on dynamic models such as Markov processes. In recent applications, higher level methods are now being applied. In order to address all the weaknesses of the existing techniques, a new method that combined the application of the Markov process and of the fault
tree called Boolean logic driven Markov process (BDMP) has been proposed. This method has created a compromise among the three available techniques. It has also provided a new graphical representation of the fault tree augmented by a new link represented by a dotted arrow (Carer, Bellvis, Bouissou, & J., 2002), (Bouissoua & Bon, 2003). The procedure is proposed because it uses state transition rates. In addition, it also assumes that the system or equipment failure follows an exponential distribution. Similarly, other parameters, such as switching and repair rates, are within the exponential distribution(Billinton & Bollinger, 2007). One of the benefits of the proposed method is that it is applicable to any size and complexity.

West African Journal of Industrial and Academic Research December 2016 v0l.17 18
The state transition rate or probability is obtained by using the differential equation
(27)
where = probability of system state at time
in general. Equation (6.28) can be written in matrix form as
(28)
The solution of the differential equation can be written as
(29) where is the initial vector of all states. On the other hand, the exponential of Equation (29) converges absolutely and uniformly to a finite interval of time. In this case, it is assumed that all states with all components in upstate have unity probability while the rest have zero. Therefore, the exponent can be defined as
(30) Since our interest is on the final value, the derivative of the equation will be zero. Finally, we have a system of algebraic equations as
(31) The determinant of T is zero, meaning that the equations are linearly dependent. Hence one of the equations can be discarded and substituted with Equation (32)
(32) The system transition matrix can be written as
T=
..11 12 1
...21 22 2
.... .... ... ....
...1 2
t t t n
t t t n
t t tn n nn
(33) where the off-diagonal elements of T are the failure and repair rates that represent the transitions between the states of the system. The diagonal elements are the transitions out of states with a negative sign. Substituting the nth row of the T matrix, a new equation is obtained as
( ) ( ) ( )
....11 12 1
... ... ... ...
1 2 ...1 1 1
... ... ... ...
t t t n
T n nt t tn n n
= − − −
(34)
and a new steady state equation is obtained as follows:
( ) ( ) ( )
....11 12 1 1... ... ... ... ...
1 2 ...1 1 1 1
1 1 1 1
t t t pn
bn pt t tn n n n
pn
= − − − −
(35)
where,
b =
1
0
...
0
Since the right hand side is no longer zero, it is possible to write the final solution of the steady state equation as Equation (36)
(36)
Finally, Equation (36) gives the probability of every state in the model. Since the microgrid network may be exposed to weather fluctuations, the environment may have considerable effects on system availability. The proposed model is

West African Journal of Industrial and Academic Research December 2016 v0l.17 19
assumed to be installed in an environment having normal weather as well as bad weather conditions such as a storm. In order to achieve this, an exponential distribution is assumed. Once the basic assumptions are well understood and the modelling
approach is known, it is possible to apply the procedure on a single unit with a two state failure. Figure 13 shows the state space diagram of the single unit with a state fluctuating environment
.
Figure 13: State space diagram of the single unit. The differential equation of the model is defined as
( )
( )
( )
( )
( )( )
( )( )
( )
( )
( )
( )
0
1
2
3
0
1
2
3
0
0
0
p t p tn n p
p tp t m m
n n p tp tm n p t
p t
λ λ
λ λ
µ µ
µ µ
′ ′ − + ′ ′ ′− + = − +′ ′ ′− + ′
(37)
The steady state probabilities of the model are given by
and
,
P (system availability) = P (system unavailability)# = The proposed procedure is applied to a hybrid microgrid, and the solution is presented. Initially, it is assumed that the system consists of a diesel generator. This is because isolated loads and communities relied on diesel generators. In this case, the availability of the system is the
availability of the diesel generator. The proposed methodology takes into consideration that the system is integrated with wind and solar. Therefore, the model can be presented in the form of the state space model shown in Figure 14.
State 0 Normal weather
System in operation
State 2
Normal weather
System failed
State 1
Bad weather
System in operation
State 3
Bad weather
System failed
m m n n
�

West African Journal of Industrial and Academic Research December 2016 v0l.17 20
Figure14: State space of the microgrid without storage. Application of the procedure above to a microgrid yields the differential equation in matrix form presented in Equation (38)
( )
( )
( )
( )
( )
( )
( )
( )
( )
( )( )
( )
( )
( )( )( )
( )( )
0 0 000
0 011
0 0 02 2
0 0 33
40 0 04
50 0 0
5
tps DG DG S tp
tp DG s w wDG S tp
tp tps S DG DG
tptp s wDG DG S wtp
w s w stptp
w s s wtp
µ µλ λ
µ µλ λ λ λ
µ µ µλ
µ µ µ µλ λ
µλ λ λ
µ µλ λ
′ − +
′ − + +
′ − + = ′ − + + − + ′ − + ′
(38) The failure and repair rates assumed are given in the Table 9. Finally, the differential equation is solved and the result is presented in Equation (39). Table 9: Annual failure and repair rates of each unit.
Failure rate
Normal weather
Stormy weather
Repair rate
Bat 0.1 0.13 0.25
RE 0.13 0.17 0.27
DG 0.1 0.13 0.4
TR 0.34 0.44 0.02
1
2
3
4
5
po
p
p
p
p
p
=
0.91611
0.0226
0.04554
0.00087
0.01421
0.00067
(39)
It can be seen that the availability of the power supply to the consumer connected to the microgrid is 0.9993308. The unavailability of the network is 0.000669. 10. Effects of weather on the availability of a standalone microgrid

West African Journal of Industrial and Academic Research December 2016 v0l.17 21
This section investigates the availability of the microgrid while considering weather conditions. The BDMP model presented in section 9 is modified to accommodate weather factors. Figure 15 shows the new model that considers good and bad weather fluctuations. The differential equation of the network can be defined in Equation (40).
(40)
where, and are the durations of normal and stormy weather, is a matrixdescribing the transitions between the normal weather conditions descried in Equation (41), and is a matrix describing the transitions between the stormy weather conditions defined in Equation (42).
( )( )
( )( )
( )( )
0 0 0
0 0
0 0 0
0 0
0 0 0
0 0 0
ns sDG DG
ns w s wDG DG
ns s DG DG
ns s w wDG DG
nw s w s
nw s s w
λ λ µ µ
λ µ λ λ µ λ
λ µ µ µ
λ µ µ µ λ µ
λ λ λ µ
λ λ µ µ
− + + − + + +
− + + − + + + − + +
− + +
(41)
( )( )
( )( )
( )( )
0 0 0
0 0
0 0 0
0 0
0 0 0
0 0 0
ms sDG DG
ms w s wDG DG
ms s DG DG
ms s w wDG DG
mw s w s
mw s s w
λ λ µ µ
λ µ λ λ µ λ
λ µ µ µ
λ µ µ µ λ µ
λ λ λ µ
λ λ µ µ
′ ′ ′ ′− + +
′ ′ ′ ′ ′ ′ − + + +
′ ′ ′ ′− + + ′ ′ ′ ′ ′ ′− + + +
′ ′ ′ ′ − + +
′ ′ ′ ′− + +
(42)
where and are the failure and repair rates during a stormy weather condition.

West African Journal of Industrial and Academic Research December 2016 v0l.17 22
Figure 16: BDMP of the standalaone microgrid.
1 0.9161
2 0.0226
3 0.0455
4 0.0009
5 0.0142
0.0007
0.46541 0.1005
0.232120.0409
3 0.1263
0.03484
5
po
p
p
p
p
p
Po
P
P
P
P
P
′
= ′ ′ ′ ′ ′ (43)
Hence the availability of the network is obtained by solving the steady state equation. Figure 17 compared the availability of the two models. It can
be observed that neglecting weather and its duration could lead to overestimation of the system availability
.
Normal weather
Normal weather
Normal weather
Normal weather
Normal weather
Normal weather
Bad weather
Bad weather
Bad weather
Bad weather
Bad weather
Bad weather

West African Journal of Industrial and Academic Research December 2016 v0l.17 23
Figure 17: Effects of weather on the availability of a hybrid microgrid. Another factor that affects the availability of the system is the duration of the normal and bad weather, as shown in Equation (40). The effects of periods of 200, 300, 500 and 1000 hours were studied. The system availability variation with the duration of bad weather is shown in Figure 18. It is
observed that the system is very sensitive to the duration of the disturbed weather. The results show that increases in bad weather durations decrease the availability of the system by 5.36%, 9.73% and 13.05%, respectively. Hence system availability is sensitive to the duration of bad weather.
Figure 18: variation of the system availability with bad weather. 11. Conclusion The output power of the hybrid renewable energy microgrid has been analysed based on the Markov theory. It has been shown that it is possible to preserve the information of the output power of a hybrid renewable energy microgrid statistically. The possibility of using the Markov approach and BDMP in the analysis of a hybrid microgrid has been demonstrated. The results show that increasing the rated power of a SECS is the best way to maximise the benefits of a diesel
generator connected to a standalone microgrid. Also, the number of times a diesel generator starts in this proposed system is proportional to the cut-in speed of the wind turbine generator. An analysis of the storage connected to the system has been carried out by introducing a model that takes the failure and repair rates into consideration. The result shows that it is possible to determine the average return time at the specified output level of the system. This is used to

West African Journal of Industrial and Academic Research December 2016 v0l.17 24
determine the storage capacity at a specified firm level that causes the WECS and SECS to have a capacity credit. The analysis has shown that increases in the firm level from 100% to 200% require 40% additional capacity for the storage system. This will translate into a 0.5% and 3.14% increase in the capital cost and savings respectively.
Sensitivity analysis of the size factors has shown that the system is more sensitive to the rated power of the WECS. In the same way, the best way to increase the benefits of the system is to decrease the capital costs of the WECS. Also, neglecting weather conditions overestimates system availability by 3.55%. System availability is sensitive to bad weather’s duration.
________________________________________________________________________________________
References Abdelkader, S. (2013). Analysis of wind energy conversion system based on Markov state model. Renewable Power
Generation Conference (RPG 2013), 2nd IET. Beijing. Billinton, R., & Allan, R. (1983). Reliability evaluation of engineering systems concepts and techniques. Toronto:
Pitman. Billinton, R., & Bollinger, K. (2007). Transmission system reliability evaluation using Markov processes. IEEE
Transactions on power apparatus and systems, PAS-87(2), 538-547. Bouissoua, M., & Bon, J. (2003). A new formalism that combines advantages of fault-trees and Markov models:
Boolean logic driven Markov processes. Reliability Engineering & System Safety, 82(2), 1469-163. Carer, P., Bellvis, J., Bouissou, M., & J., D. (2002). A new method for reliability assessment of electrical power
supplies with standby redundancies. Proceedings of the 7th International Conference on Probabilistic
Methods Applied to Power Systems (PMAPS’02). Suva. Chowdhury, S., Chowdhury, S., & Crossley, P. (2009). S. Chowdhury, S.Microgrid and active distribution networks.
London, United Kingdom: IET. Manco, T., & Testa, A. (2007). A Markovian approach to model power availability of a wind turbine. Power Tech,
IEEE. Lausanne. Tafreshi, S., Zamani, H., Ezzati, S., & Vahedi, H. (2010). Optimal Unit Sizing of Distributed Energy Resources in
MicroGrid Using Genetic Algorithm. Electrical Engineering (ICEE), 18th Iranian Conference on. Isfahan, Iran.
Yang, Y., Pei, W., & Qi, Z. (2012 ). Optimal sizing of renewable energy and CHP hybrid energy microgrid system. Innovative Smart Grid Technologies - Asia (ISGT Asia), IEEE. Tianjin.
Zhang, L., Barakat, G., & Yassine, A. (2012). Deterministic optimization and cost analysis of hybrid PV/wind/battery/diesel power system. International journal of Renewable Energy Research, 2(4), 687-696.
Zhang, L., Barakat, G., & Yassine, A. (2012). Deterministic Optimization and Cost Analysis of Hybrid PV/Wind/Battery/Diesel Power System. International journal of Renewable Energy Research, 2(4), 687-696.
Zhao, B., Xuesong, Z., Jian, C., Caisheng, W., & Li, G. (2013). Operation Optimization of Standalone Microgrids Considering Lifetime Characteristics of Battery Energy Storage System. IEEE Transaction on Sustainable
Energy, 4(4), 934-942. Zhao, B., Zhang, X., Chen, J., Wang, C., & Guo, L. (2013). Operation Optimization of Standalone Microgrids
Considering Lifetime Characteristics of Battery Energy Storage System. , IEEE Transactions on Sustainable
Energy, 4(4), 934- 943.

West African Journal of Industrial and Academic Research December 2016 v0l.17 25
Drainage System Maintenance toward Promoting Healthy Environment (A Case) Study of Federal Capital Territory (FCT)
Metropolis Abuja)
Engr. Gana A.J1 and Engr Theophilus.T2
1Civil Engineering Department, Collage of Science and Engineering Landmark University,Omu-Aran, Kwara state
Emails: - [email protected], [email protected] Mobile: - 080599668656, 08101351405, 08178395842
2Civil Engineering Department Federal University of Technology Minna, Niger State
Mobile: 08065263801
Abstract One of the most important aspects of the design of road is the provision made for protecting road from
surface water and pavements usefully solos own traffic and contributes to accidents from hydro
planning and loss of spray. If water is allowed to enter the structure of the road, the parliament and sub-
grade will be weekend and it will be much more susceptible to damage by the traffic. Water can enter
the road as a result of rain penetrating the surface. Or as a result of the infiltration of ground water
when the roads fail, which is usually due to inadequate drainage that Financially lead to un healthily
Environment when proper maintenance is not Introduced. This study was conducted in selected areas
Abuja metropolis. The areas are Mararaba, Nyanya, Dutse, Kuje and Bwari. The purpose of the study
was to identify the Courses of drainage problems and recommend solutions. A Survey was conducted
and appraised, which finally provided the lack of Improper and Comprehensive drainages management
systems in the metropolis. s: Key words: - Drainage system, problems, flood, Healthy environments, maintenances
Introduction
Drainage is generally defined as the orderly removal and also disposal of excess waste water from the surface and subsurface of any band through the improved natural channels or constructed ditches. A gun Wanba (2000) defines drainage as the disposal of excess waters on land before they enter the streams and rivers. Persona and Abraham (1992) defined drain are as a form applied to systems of dealing with excess water before it reaches streams, rivers or lakes. Flood is generally known to be the major component of any excess water which has caused a lot of damage to lives and properties in many countries of the world. Examples of flood occurring places in Nigerian are Kano, Lagos, Anambah state, Bauchi State, Kebbi State, Benue State, and other states not mentioned in this paper.
Functions of drainage The drainage system has four main functions. These are:-
i. To convey storm water from the surface of the carriage way to out falls
ii. To control the level of the water table in the sub-grade beneath the carriage way
iii. To intercept ground water and surface water flowing towards the road
iv. To convey water across the alignment of the road in a controlled fashion. The first three functions are performed by longitudinal drainage components in particular side drains, while the fourth. Function requires across-drainage structures such as culverts, fords, drifts and bridges. General drainage problems The general drainage associated problems are:-
i. Destruction of road pavements through infiltration of rain water
ii. Soil erosion by run-off from storms and aquifers iii. Flood which usually occurs when the volumes
of rain water generated becomes more than the capacity of the channels provided to discharge run-off.
West African Journal of Industrial and Academic Research December 2016 v0l.17 26
iv. Structural failures of buildings v. Exposure of water pipes laid under the ground
and vi. Sedimentation causing blockage of the drainage
channels (Schwab 1979) Approach methodology
The approach methodology for this study was conducted in five major satellite towns in Abuja, the federal capital territory, these satellite towns are:-
i. Mararaba ii. Nyanya
iii. Dutse iv. Bwari
The first step was to conduct reconnaissance survey to this major metropolis, and to have a proper understanding on the drainage system construction and its operation during the rainy season, especially on the days of heavy down fall of rains. The mass media and the news paper information on poor drainage system and users contribution to available drainage provision in the above satellite towns within Abuja (FCT) Discussion The residents of Mararaba, Nyanya, Dutse, Kuje and Bwari which are generally known to be major satellite towns in Abuja usually count their loses after any heavy down fall of rains within the said metropolis mentioned above the rains is usually accompany by heavy flood that normally bock the highways. The Aurcilysis in each of the satellite towns is briefly summarized below: Mararaba: - it is a satellite town that host very close to thousands of people who work in the city center. It is also a link to the states north east of the city. It has however become a flash point of flooding which professionals blame on the poor drainage system within the satellite. The provided drainages in this satellite town are completely blocked, which is the major cause of flood, with the addition of dumping of refuse in the drainages, which also does not allowed the free flow of water all the year round, Nyanya: - this is the boundary between the FCT and Nasarawa state to Masaka. The highways along this route has no provision of
drainages, which is the major reason why the occurrence of flood along this highway is easy to over take the highways, since there are no proper drainages provided. Dutse: - the situation in Dutse generally is usually caused by continuous down power of rains, which usually result into heavy flood thereby allowing inner axis of Dutse to become barely possible Bwari: - the situation in Bwari is associated by poor drainage and mostly untarred roads, couple with the attitude of residents who usually dumped wastes on the road and those who built on erosion channels. The causes of drainage problems covering the above satellite towns are due to the following summarized the factors:-
i. Dumping of refuse and emptied their refuse into waterways
ii. Poor drainage maintenance iii. Total absence of drainage system on the
highway passing through some satellite towns iv. Continuous down pour of rains v. Absence of erosion channels
Recommendation To savage the situation within these four satellite towns, the following are recommended:-
i. Adequate provision of drainage systems for the highways
ii. National monthly environmental sanitation which should be carry out with proper supervision
iii. Launching of the clean and green campaign that will eliminate the menace of open defecation of plastic and polythene bags
iv. Installation of automated web- based flood early warning equipment in flood prone communities’
v. Constant maintenance of drainage system in the concerned satellite towns. Conclusion Drainage problems are common all over the world. They are more frequent in developing countries than in advanced drainage problems are many and may also be similar in nature. In Nigeria, it is a major nuisance and if properly managed, it will improve the quality of life and also protect the environment

West African Journal of Industrial and Academic Research December 2016 v0l.17 27
for human’s benefit.
References 1. B.L Gupta, Amit Gupta (2010) Highway and Bridge Engineering published by A.K John distributors Nai Sarak, Delhi India 2. S.T. Tyagher (2009) causes of drainage problems in Benue State, published by compendium of Engineering Monographs Vol 4, No.1, Pgs 31-34 3. P.K. Guha (2009) maintenance and Repairs of Buildings published by new central Book Agency Ltd, ansari Road, DaryaganJ, and New Delhi, India. 4. B.L Gupta, Amit Gupta (2007) maintenance and repairs of civil structures, published by John distributors Nai. Sarak, Delhi India. 5. Fred L. Mannering, Wailter P. Kilareski, Scott S. Washburn (2007) principles of Highway Engineering and Traffic Analysis, published by John wiley and Sons, Inc., Ansari Road India.
6. Daily Truts, Wednesday, August 1, 2016

West African Journal of Industrial and Academic Research December 2016 v0l.17 28
Multi-Class Load Balancing Scheme for QoS and Energy Conservation in Cloud Computing
Olasupo O. AJAYI1, Florence A. OLADEJI2, and Charles O. UWADIA3
1,2,3 University of Lagos, Nigeria
[email protected], [email protected], [email protected]
Abstract he challenges of adhering to stringent Quality of Service requirements, efficiently utilize resources, and
conserve energy consumption are constantly being faced by Cloud Service Providers. In a bid to proffer
solutions to these challenges, numerous researchers have proposed varied solutions. However, there has
yet to be an all-encompassing solution that tackles all these challenges at once, as these challenges are
often times contrasting. Authors therefore usually focus on one then seek to manage the compromises on
the other(s). In this work, we propose a new scheme for load balancing that uses multiple workload
classes to guarantee end-to-end QoS while conserving energy with little compromise on either.
Experiments were done using CloudSim toolkit and obtained results show that our scheme outperforms
the other approaches both in terms of energy conservation and QoS adherence.
Keywords: Load balancing, QoS cloud comutng, energy conservation ____________________________________________________________________________________ Introduction
The relative decrease in cost of Internet access and the proliferation of smart devices has led to an increase in workloads at Cloud data centers. These increased workloads with varied requirements and a less than equal increase in resource levels have led to the need to efficiently utilize Cloud resources in order to effectively service these workloads and at the same time make money for the Cloud provider. There is also the dire need to conform to standards for green computing by reducing overall energy consumption and carbon emission levels.
One approach to energy conservation is server consolidation and multi-tenancy [1], [2]; which through the use of virtualization and virtual machines [3] seek to aggregates workloads on Physical Machines (PMs) together in a bid to reduce the total number of active PMs. Doing this however could have negative effects on user workloads as the illusion of dedicated PMs which Virtual Machines (VMs) provide to users is in not perfect and shared resources can sometimes be fiercely contested for by these workloads [2]. Cloud providers are then faced with the issue of contending with energy conservation versus guaranteeing QoS adherence.
In this work, an approach that uses multiple
workload classes to guarantee an end-to-end QoS adherence while at the same time conserving energy is proposed.
The rest of this paper is organized as follows: section 2 discusses on related works, in section 3 the proposed Multi-Class load balancing approach is presented, experimental results are presented in section 4 and the paper is concluded in section 5. Related Works Multi-Queue Workload Classification
Classification of user workloads has been done by numerous authors some of which include: [4] where user workloads were split into two groups – Gold and Bronze based on user required response times. In the works of [5], [6] user workloads were grouped into three groups – Short, Medium and Long based on the user indicated burst time of each tasks. In works done by [7], [8] the authors used multiple user supplied criteria for classification of workloads. Though their works focused on workload preemption, they had to classify these workloads in order to determine priority of preemption. Reference [9] proposed a resource based classification of PMs using RAM, CPU and Bandwidth, in which user workloads were allocated to the PM that offered minimum

West African Journal of Industrial and Academic Research December 2016 v0l.17 29
completion time for such tasks. In the works of [10], [11] multiple SLA parameters (such as product type, account type, request type, response time etc.) were considered but ultimately workloads were classified into three groups – Small, Medium and Max or Gold, Silver and Bronze respectively.
From literature it can be concluded that classification of user workloads is not a trivial tasks, as it is almost impossible to consider every requirement/criterion during these classifications, and because workload classification is outside the scope of this work, we simply adopted the state of the art approach used in [5], [6].
Energy Aware Load Balancing of Workloads Reference [12] proposed an energy aware
approach to tasks allocation and load balancing in Cloud Data Centers (DC). The focus of this work is on conservation of energy while minimizing SLA violations. Workloads on admission were allocated to PMs using a modified best fit descending algorithm called Power-Aware Best Fit Descending (PABFD), which performed a power-growth test prior to workload allocation and only allocates after confirming that such allocation would not make the power consumption of the PM greater than a preset threshold value. With respect to load balancing, the approach compares PMs’ CPU utilization level against pre-set upper and lower threshold values to detect an over/under worked. If a PM’s CPU utilization grows above the upper threshold, VMs are migrated off the PM similarly, if the CPU utilization is below the lower threshold, all VMs are migrated off and PM put to sleep to conserve energy.
Reference [14] improved on the work of [12], [13] by proposing a prediction based approach to resource management in Cloud computing called VMCUP. Rather than checking for CPU utilizations after allocation, this work predicts the short-term future state of the PM and determines if such a PM will be over/under utilized. This is a preventive approach which contrasts to the corrective approach used in [12].
Mosa and Paton [15] proposed a utility function based VM allocation approach to energy conservation, SLA adherence and profit maximization. The work identifies optimal allocation of VMs to PMs as a NP-hard problem
and thus used a meta-heuristic genetic algorithm to achieve this goal in the most rewarding (profit) way. The authors employed a utility factor which was based on expected income less estimated energy, violation and performance degradation costs. The approach recorded improvements in terms of QoS adherence and energy conservation.
Notable shortcomings of some of these energy-aware approaches to load balancing are: heavy reliance on the use of agents to get status information of resources prior to and during the allocation and load balancing phases, which invariably leads to increased response time. With the exception of [15] scalability might be a challenge as the schedulers in these other approaches has to keep an active communication channel with all the PMs and VMs; this is impracticable especially in Cloud data centers with large number of PMs. The PM’s CPU utilization level was the only metric used to measure QoS adherence; other factors such as class of payment, required response time and burst time could have been considered. The “power-growth” tests performed during allocation of VMs to PMs might seem effective but [16] shows that an idle PM consumes about 70% of its maximum usable power, hence there can only be an energy saving of 30% per PM at best when used. To this end, we propose an approach that uses workload classes for QoS and energy conservation in Cloud Computing. Proposed Approach
We propose a hybrid scheme with feature sets from [12-14,17], called Multi-Class Load Balancer (MC-BAL). The proposed approach incorporates significant enhancements that address the short-comings of these approaches while leveraging on their individual strengths. It is a two-phased approach with phases described below.
In the first phase, user requests (VMs) are allocated to PMs using our Binary Search Best Fit Algorithm. The proposed algorithm is similar to [12] but uses the Binary Search Tree (BST) to speed up the search for a suitable PM. It has been proven that BST has an average, best and worst case running complexity of O(log2n) which for large entries, is much faster than the average and worst cases of the linear array search O(n) used in both [13],[14].
We introduce multiple workload classes to the

West African Journal of Industrial and Academic Research December 2016 v0l.17 30
allocation phase. There are three different classes of user workloads – Gold, Silver and Bronze and grouped based on their QoS requirements, with Gold being premium and bronze being best effort.
Like in the work of [14], the usage prediction model is used in the allocation of VMs to PMs however, the power growth check is removed. It is expected that the process of VM consolidation carried out in the load balancing phase would cater for energy efficiency as the higher the number of PMs actively running the higher the total energy consumption of the entire data center and vice versa. This is an analogy drawn from the works of [18],[19].We also introduce a Binary Search Best Fit allocation (BSBF), which is used in place of the PABFD. PABFD, searches linearly through all the PMs in the data center for the most suitable to host a VM. Our justification for this is, given a data center with N number of PMs, PABFD has to do N comparison at the worst case before allocating a PM to a user workload. If N is large, this process can slow down the allocation process and lead to an increase in delay time (SLA violation). This is where BSBF has an advantage. Being based on a binary search tree, it has an average and worse case search complexity of log2N thus able to find suitable PMs much faster than linear search based best fit descending used in [12] and [14].
In the load balancing phase the VMs allocation carried out in the allocation phase is improved on with a view of uniformly re-distributing allocated workloads amongst PMs. This would improve QoS adherence, as well as consolidate VMs onto fewer PMs to reduce overall energy consumption of the data center. This phase is split into two parts – utilization detection and VM-Migration. The utilization detection process is the same is in [14]. However, in choosing which VM to migrate, the class to which it belongs is considered. This implies that all bronze class VMs if present in a PM would be selected for migration first before any silver class. Likewise all silver classed VMs would be selected before any gold classed VM is selected. This would ensure lower SLA violation for the gold class as a result indiscriminate VM migration. In the case of under-utilized PMs, all VMs are selected for migration irrespective of the class they belong
to after which the underutilized PMs are put in sleep to conserve energy.
Algorithm 1: The Binary Search Best Fit Algorithm 1. Get total number of PMs in system 2. Arrange all PMs in ascending order of their available processing capacity (LcP) 3. Accept VMs to be allocated (VM_Set) 4. Foreach vm in VM_Set a. Get vm’s requirement (wR) b. Build BinaryTree (BT_LcP) from LcP
c. SuitablePM = MBS_Method(wR, BT_LcP)
5. MBS_Method(wR, BT_LcP) //recursive search a. Search BT for a PM p, such that p.AvailableMIPS - wR � 0 //search for the most suitable PM b. If found, return p c. Else
i. Remove p from BT_LcP and update BT_LcP ii. Return MBS_Method(wR, BT_LcP)
The MC-BAL builds on the works of [12] and [13] but with modifications leading to the following contributions: 1. QoS adherence and energy conservation through the use of workload classes. Though numerous works have used multiple workload classes, such as those of [4-11], most have focused on billing and/or QoS only. We do not know of any work where workload classes has been used for QoS and energy conservation. 2. The use of workload classes in VM migration, thus guaranteeing end-to-end QoS compliance 3. Binary Search Best Fit heuristic for the allocation of VMs to PMs, which speeds up allocations. Performance Evaluation Experimental Setup
To verify the efficiency of our proposed model, simulations were carried out using CloudSim toolkit [20] and the same experimental setup used in [12] and [14] was used for comparison purpose. The data center consisted of 800 heterogeneous PMs of two categories and with specifications and power consumption models based on benchmarked data from real servers [21]. These are depicted in table 1.

West African Journal of Industrial and Academic Research December 2016 v0l.17 31
TABLE 1 SPECIFICATIONS OF THE PMS USED FOR SIMULATION
Category Make CPU Cores Memory
1 HP ProLiant ML110 G4
1,860 MHz
Intel Xeon 3040, 2 cores
4GB
2 HP ProLiant ML110 G5
2,600 MHz
Intel Xeon 3075, 2 cores
4GB
Data used for this experiment are from
workload traces of over 5,000 PlanetLab VMs [22], measured at preset intervals of five minutes over a five day period and Google Test Cluster (GTC) [23] consisting of about 168 jobs recorded over a 7 day period.
Evaluation Metrics The following metrics were used in order to
maintain consistency and for comparison purpose with [14], they are: Energy consumption; Average number of power state changes per PM; Average SLA violation and
Average job delay. In our experiments only
the static threshold based overutilization host detection approach of CloudSim was considered. Also only the performance of workloads classified as Gold was of significant interest to us hence comparisons are based on this workload class only.
Experimental Results In order to determine the utilization level of a
CPU, static thresholds of 80% and 25% were set for both the upper and lower limits respectively. Above the upper threshold, the PM is classified as overworked and workloads are selected for migration from it, while below the lower threshold the PM is classified as underutilized and all workloads migrated from it.
The performance of MC-BAL was compared with the PABFD [12] and VMCUP [14] using the static threshold for 1,078 VMs logs
.
Fig. 1. Comparison of Total Energy Consumption - PlanetLab dataset
West African Journal of Industrial and Academic Research December 2016 v0l.17 32
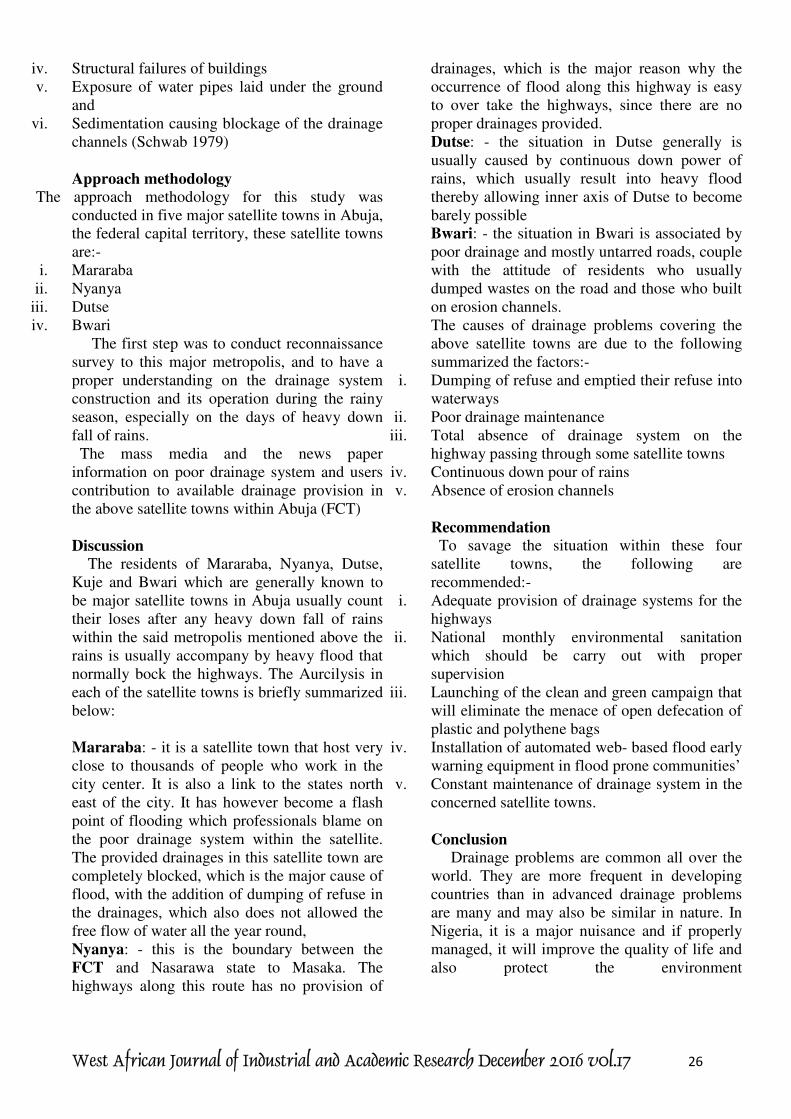
Fig. 2. Average number of power state changes per PM –PlanetLab datas
Fig. 3. Comparison of SLA Violation -PlanetLab dataset
Fig. 4. Workload allocation delays – PlanetLab dataset

West African Journal of Industrial and Academic Research December 2016 v0l.17 33
Fig. 5. Comparison of Total Energy Consumption – GTC dataset
Fig. 6. Average number of power state changes per PM –GTC dataset
Fig. 7. Compariosn of SLA violations –GTC dataset

West African Journal of Industrial and Academic Research December 2016 v0l.17 34
Fig. 8. Workload allocation delays – GTC dataset
Obtained results show a similar trend across both datasets. Fig. 1 shows that MC-BAL clearly outperforms both VMCUP and PABFD with a total energy value of 102.83KWh as against by 175.43KWh for PABFD and 151.42KWh for VMCUP. This implies that MQ-BAL is 70.6% and 47.3% more energy efficient than PABFD and VMCUP respectively for PlanetLab dataset. The same trend is observed with the GTC in Fig. 5, where MC-BAL with a total energy consumption of 6.33KWh conserves energy better than PABFD (11.1KWh) and VMCUP (10.28KWh), representing a 42.9% and 38.2% improvement over PABFD and VMCUP respectively.
In terms of the average number of power state changes, Fig. 2 depicts that MC-BAL (1.02) slightly outperforms VMCUP (1.04) by 1.92% and PABFD (6.82) by about 85%. Consistent with PlanetLab results, MC_BAL also outperforms the other approaches using GTC dataset as depicted in Fig. 6. This implies that MC-BAL is able to better limit the frequency at which PMs are switched off and on.
Compliance to SLA requirements is depicted in Fig. 3 and Fig. 7 for both datasets. For PlanetLab dataset (Fig. 3), MC-BAL results in the least SLA violation with 9.43%. It edges out VMCUP (9.48%) by about 1.48% and clearly outperforms PABFD (10.11%). For GTC dataset (Fig. 7); MC-BAL also outperforms the other approaches with an average SLA violation of 9.38% as against 10% obtained for both PABFD and VMCUP; this represents an 8% improvement in SLA compliance. MC-BAL is thus able to guarantee end-to-end QoS adherence while providing services to user
workloads. Finally we introduced a last metric, which is
job delay. This is the amount of time a VM spends waiting to be allocated to a PM. Fig. 4 shows that PABFD has the least delay at about 0.0039 second and VMCUP has the longest delay at 0.0055 seconds. Since both approaches apply the same linear search based Best Fit Descending (BFD) allocation algorithm, it implies that the utilization prediction algorithm used in VMCUP greatly slows it down. MC-BAL also uses the same utilization prediction algorithm used in VMCUP but the application of BSBF during the allocation phase accounts for the improvement in delay (0.0047 seconds) experienced by MC-BAL. A similar trend is also observed with the GTC dataset and depicted in Fig. 8. Conclusion Numerous research works have been done in resource management in Cloud computing, however most of them have focused on tackling a single challenge at a time or considering one as the primary challenge and others as secondary. In this work, an approach to load balancing is proposed that leveraging on the strengths of previous works while at the same time addressing most of their shortcomings is proposed. The proposed approach introduces a class-based workload migration coupled with a BSBF allocation technique. Implementation results show that our approach is better than other state of the art approaches in terms of overall energy conservation, SLA adherence and power state switching; and slightly below par in the area of workload delay

West African Journal of Industrial and Academic Research December 2016 v0l.17 35
REFERENCES
[1] Le-Quoc, M. Fiedler, C. Cabanilla, “The Top 5 AWS EC2 Performance Problems” Whitepaper.
Datadog Inc, 2013. [2] Y. Xu, Z. Musgrave, B. Nobel, M. Bailey, “Workload-Aware Provisioning in Public Cloud. Internet
Computing”, vol. 18, no. 4, IEEE Computer Society Press, 2014, pp.15-21. [3] P. Barham, B. Dragovic, K. Fraser, S. Hand, T. Harris, A. Ho, R. Neugebauer, I. Pratt, and A.
Warfield, “Xen and the art of virtualization,” Proc. of 19th ACM symposium on Operating systems principles, 2003, pp. 177.
[4] H. Goudazi, M. Pedram, “Multi-dimensional SLA-based Resource Allocation for Multi-tier Cloud Computing Systems” Intl Conf. on Cloud Computing (CLOUD), IEEE Computer Society Press, 2011, pp. 324-331.
[5] A. Karthick, E. Ramaraj, R. Subramanian, “An Efficient Multi Queue Job Scheduling for Cloud Computing”, World Congress on Computing and Communication Technologies (WCCCT), IEEE Computer Society Press, 2014, pp. 164-166.
[6] V. Rajeshram and C. Shabarran, “Heuristics Based Multi Queue Job Scheduling for Cloud Computing Environment”, International Journal of Research in Engineering and Technology, vol. 4 no. 5, 2015, pp. 163 – 166.
[7] K. Gouda, T. Radhika, M. Akshatha, “Priority Based Resource Allocation Model for Cloud Computing”, International Journal of Science, Engineering and Technology Research, vol. 2, no. 1, pp. 215 -219, 2013.
[8] C. Pawar, R. Wagh, “Priority Based Dynamic Resource Allocation in Cloud Computing”, Proc. of the Intl Symposium on Cloud and Services Computing, IEEE Cloud Computing, 2012, pp. 1-6.
[9] W. You, K. Qian, Y. Qian, “Hierarchical Queue Based Task Scheduling” Journal of Advances in Computer Networks, 2014, vol. 2, no. 2, pp. 138–141.
[10] L.Wu, S. Garg, R. Buyya, “SLA-based Resource Allocation for Software as a Service Provider (SaaS) in Cloud Computing Environments” 11th IEEE/ACM International Symposium on Cluster, Cloud and Grid Computing, 2011, pp. 195-204.
[11] M. Macias, J. Guitart, “Client Classification Policies for SLA Enforcement in Shared Cloud Datacenters”, Proc. of 12th IEEE/ACM International Symposium on Cluster, Cloud and Grid Computing, 2012, pp. 156-163.
[12] A. Beloglazov, R. Buyya, “Optimal online deterministic algorithms and adaptive heuristics for energy and performance efficient dynamic consolidation of virtual machines in Cloud data centers”, Concurrency and Computation: Practice and Experience, pp. 1397–1420.
[13] A. Beloglazov, J. Abawajy, R. Buyya, “Energy-Aware Resource Allocation Heuristics for Efficient Management of Data Centers for Cloud Computing”, Future Generation Computing Systems, 2012, vol. 28 no. 5, pp. 755-768.
[14] N. Hieu, M. Francesco, A. Yla-Jaaski, “Virtual Machine Consolidation with Usage Prediction for Energy-Efficient Cloud Data Centers”, Proc. of 8th IEEE International Conference on Cloud Computing, 2015, pp. 750-757.
[15] A. Mosa, N. Paton, “Optimizing Virtual Machine Placement for Energy and SLA in Clouds Using Utility Functions”, Journal of Cloud Computing: Advances, Systems and Applications, 2016, 5:17
[16] Pennsylvania, “Computer Power Usage”, University of Pennsylvania, 2013. [17] Y. Lu, Q. Xie, G. Kliot, A. Geller, J. Larus, A. Greenberg, “Join-Idle-Queue: A Novel Load
Balancing Algorithm for Dynamically Scalable Web Services”, ACM Journal of Performance Evaluation, vol. 68, no. 11, 2011, pp. 1056-1071.
[18] M. Uddin, A. Rahman, “Server Consolidation: An Approach to Making Data Centers Energy Efficient and Green”, Intl Journal of Scientific & Engineering Research, vol. 1, no. 1, 2010, pp. 1-7.
[19] R. Talaber, “Using Virtualization to Improve Data Center Efficiency”, The Green Grid, White Paper 19, 2009.

West African Journal of Industrial and Academic Research December 2016 v0l.17 36
[20] N. Rodrigo, Calheiros, R. Ranjan, A. Beloglazov, A. Cesar, F. De Rose, R. Buyya, “CloudSim: A Toolkit for Modeling and Simulation of Cloud Computing Environments and Evaluation of Resource Provisioning Algorithms”, Software: Practice and Experience (SPE), 2011, vol. 41, no. 1, pp. 23-50.
[21] SPECPower, “The SPECpower benchmark results for the fourth quarter of 2010”, Online at https://www.spec.org/power_ssj2008/results/ res2011q1/power_ssj2008-20110124-00338.html
[22] K. Park and V. S. Pai, “Comon: A mostly-scalable monitoring system for planetlab,” SIGOPS Oper. Syst. Rev., vol. 40, no. 1, pp. 65–74, 2006
[23] J. Wilkes, C. Reiss, “Google Cluster Usage Traces: format + schema of Google Workloads”, 2011 http://code.google.com/p/googleclusterdata/

West African Journal of Industrial and Academic Research December 2016 v0l.17 37
ICT Education: A Tool For Quality Assurance In Tertiary Institution In Nigeria
Ugwuanyi Fidelis Onyebu1 and Agomuo Princewill Chijiubs,2
1 Department of Computer Science, College of Education, Pankshin, Plateau State. Nigeria. E-mail: fugwuanyi@yahoo,com.
Mobile No: +234806773073Department of Comp-uter Scx 1 Department of Computer Science, College of Education, Imo State University, Owerri. %T3l; 08035084543
Abstract
Information and Communication Technology (ICT) affects the ways we do things nowadays, including
our educational processes. This paper considers information and communication technology (ICT)
education and how it can improve quality assurance in our tertiary institutions. It also discussed ICT
education, the use of ICT in education, ICT and quality education and ICT education and quality
assessment. Key Words: Information and Communication Technology (ICT), Education, Quality, Assurance, Tools.
1. Introduction Quality assurance in education is a common target for all education system especially in developing countries of Africa like Nigeria [1]. He argued that many countries are progressing towards the goals of education for all but struggle to achieve quality education for all. The quality of education according to [1] is the prime factor that determine the worth and or significance of the system to both the recipients and the society at large. Education according to [2]; [3] is the driving force of economic and social development of any country. If so, it is necessary to find ways to make education become qualitative, accessible and affordable to all. ICT is that tool that will make education qualitative, accessible and affordable. In recent years according to [4], there has been groundswell of interest in how computer and internet can be best harvested to improve the efficiency and effectiveness (quality) of education at all levels in both formal and informal settings. ICT stands for Information and Communication Technology and are defined for the purpose of this paper according to [4] as diverse set of technological tools and resources used to communicate, and to create, disseminate, store and manage information. These technologies include but not only these:
• Computers
• The internet
• Broadcasting technologies such as (radio and television)
• Telephone
• Interactive whiteboards
• ETC [4]. ICT is also defined as a powerful collection of elements which includes computer hardware, software, telecommunication networks, workstations, robotics and smart chips [5]. ICT increases the flexibility of delivery of education so that learners can access knowledge anytime and from anywhere [6]. It influences the way students are taught and how they learn, since the process of learning are now focused on learners instead of teachers. It improves the quality of learning and provides several tangible and intangible benefits for all stakeholders involved in the economic growth of any country [7]. Wider availability of best practices and best course materials in education, which can be shared by means of ICT can foster better teaching [8]. ICT allows the academic instructions to reach disadvantaged groups in the society. ICT has the potential to remove the barriers that are causing the problems of low rate and poor quality of education, cost of education, less number of teachers as well as overcome time and barrier [9]. This paper will discuss how ICT education could be used to improve the quality of education. 2. Related literatures. There are a lot of researches on how ICT education can improve the quality of education.

West African Journal of Industrial and Academic Research December 2016 v0l.17 38
ICT provides some avenues for those looking to use benchmark as a means of quality assurance [10]. But according to [11], one of the difficulties benchmarking posses for quality assurance in high education is the process of describing best practices in a way that supports the necessary comparative process. There have been a number of recent attempts to describe and state standards as an alternative means. Standards provide levels of achievement of a benchmark that can be qualitatively or quantitatively measured [10]. Without quality, education becomes wastage and even poses danger to the individual beneficiary and the society [12]. Indicators of declining quality and wastage in the education system include high drop-outs; and failure rates, rampant examination malpractices, poor reading and writing skills among students at all levels [4]. Quality is perceived differently by various professionals who often use the item, but however quality is something everyone considers good and want to have. According [4], quality has to do with whether something is good or bad, it is about the standard of something when compared with other things. It is therefore presupposes that there is a standard. [1] quoting [13], noted that quality in an organization could be characterized by three inter-related and interdependent strands as follows:
• Efficiency in the meaning of goals.
• Relevance to human and environmental conditions and needs.
• Exploration of new ideas, the pursuit of excellence, encouragement and creativity. On the other hand, assurance implies a positive or encouraging declaration, full confidence, firmness of mind and certainty. It is a statement that something will certainly be true or will certainly happen, particularly when there have been doubts about it [14]. The purpose of quality assurance in institutions is capacity building within an institution for pursuing quality improvement leading to stakeholder’s satisfaction. Quality assurance is a continuous and conscious process aiming at excellence. This can be ensured through quality assessments that the institutions are doing what it claims to have been doing [1]. Quality assurance may be seen as any action
taken to pervert quality substandard from occurring. Quality assurance aims to ensure that product or service of an organization meets the already established standard and a well fit for the purpose for which such product is meant to serve [15].
3. ICT Education Information and Communication Technology (ICT) education is the study and ethical practices of facilitating learning and improving performance by creating, using and managing appropriate technological processes and resources [16]. Since we live in information society everyone is expected to be ICT literate which according to [5], entails awareness, knowledge and interaction. It is also referred to e-learning, which means the use of modern technology such as computers, digital technologies, networked digital devices and associated software and course ware with learning scenarios, worksheets and interactive exercise which facilitates learning [16]. E-learning encompasses learning at all levels, both formal and non-formal, that uses an informational network, i.e. the internet and intranet (LAN) or extranet (WAN) – whether wholly or in part, for course delivery, interactions, evaluations and/or facilitation [4]. Another system of ICT education is the blended learning. Blended learning according to [17], refers to learning models that combine traditional classroom practice with e-learning solution. These is such that students in traditional class can be assigned both print-based and on-line materials, have on-line mentoring sessions with their teachers through chatting and are also subscribe to class e-mail list. Or web-based training course can be enhanced by periodic face - to face instructions. Blending was prompted by the recognition that not all learning is best achieved in an electronically-mediated environment particularly one that depends with a live instructor all together. Instead consideration must be given to the subject matter, the learning objective of the learner, and the learning context in order to arrive at optimum mix of instructional and delivery method [17]. Information and communication technologies (ICTs) such as laptops, low cost video cameras, cell phone etc according to [18] have become affordable, accessible and integrated in large

West African Journal of Industrial and Academic Research December 2016 v0l.17 39
sections of society throughout the world and this brings education to our doorsteps. According to [18], ICT can be used as a tool in the process of quality education in the following ways:
• Information tools: It provides vast amount of data in various formats such as audio, video, and document.
• Situating tools: It creates situation, which the students experiences in real life thus simulation and virtual reality is possible.
• Constructive tools: To manipulate the data and generate analysis
• Communicative tools: It can be used to remove communication barriers such as that of space and time. ICT uses the following mechanism for the delivery and for conducting educating process, according to [3].
• Voice: Instructional audio that include interactive technology as well as the passive ones.
• Video: Instructional video tools that include still images, prerecorded moving images and real-time moving images combined with audio conferencing.
• Print: Instructional print formats that include textbooks, study guides, work books, and care studies. ICT allows for the creation of digital resources like digital libraries where students and professionals can access research materials and course materials from any place at any time [19]. Such facilities allows the networking academics and researchers and hence sharing of scholarly materials. This helps to avoid the duplication of works according to [2]. UNESCO listed the following as the advantages of ICT education [20].
• It eliminates time barriers in education for learners as well as the teachers.
• It eliminates geographical barriers as learners can log in from any place.
• Asynchronous interaction is made possible leading to thoughtful and creative interactions.
• Enhanced group collaboration is made possible through ICT
• It can provide speedy dissemination of education to target disadvantaged groups.
4. Use of ICT in education Education policy makers must first of all be clear about what educational outcome are being targeted. The targeted educational outcome
should guide the choice of technologies and modalities to be used. There are at least five levels of technology use in education. These according to [21], are as follows:
• Presentation
• Demonstration
• Drill and practice
• Interactive
• Collaboration At the level of presentation and demonstration, technologies such as print, audio cassette, radio and television broadcast, computers or the internet are applied, which is the most basic of the five levels. On the other hand, networked computers, and the internet are the ICTs that enable interactive and collaborative learning the most [21]. It will be interesting to note that if these ICT tools are used merely for presentation and demonstration, their full potentials as education tools will remain unrealized. Below are few lists of these ICT tools.
1. Radio and TV Broadcasting: Radio and television have been used widely as educational tools since 1950s [22]. There are three general approaches to the use of radio and TV Broadcasting in education. They are according to [21] as follows.
• Direct class teaching: This is where broadcast programming substitutes for the teachers on temporary basis.
• School broadcasting: This is where programming provides complementary teaching and learning resources not otherwise available.
• General education programming over community: In this case, national and international stations provide general and informal education opportunity. Examples of these are the Interactive Radio Instruction (IRI) that are implemented in Thailand, Indonesia, Pakistan, Bangladash etc in the 1980s [21]. Another according to [6] includes Mexico’s Telescundria, the 44 radio and TV Universities in China, Japan’s university of Air, etc.
2. Teleconferencing: This refers to interactive electronic communication among people located at two different places. According to [23], there are four types of teleconferencing based on the nature and extent of interactivity and the sophistication of the technology. They are:
• Audio conferencing
• Audio-graphic conferencing

West African Journal of Industrial and Academic Research December 2016 v0l.17 40
• Video conferencing
• Web-based conferencing [23]. Audio conferencing: This involves the live (real-time) exchange of voice message over a telephone network. When low bandwidth text and still images such as graphs, diagrams or pictures can also be exchanged along with voice messages, it is called Audio-graphic. Non-moving visuals are added using computer keyboard or by drawing/writing on graphics or whiteboard. Video conferencing allows the exchange of not just voices and graphics but also of moving images. Video conferencing technology does not use telephone lines but either a satellite link or television network. Web-based conferencing as the name implies involves the transmission of and graphics, audio and visual media via the internet. It requires the use of computer with a browser and communication can both be synchronous and asynchronous [23]. Teleconferencing is use in both formal and non-formal learning contexts to facilitate teacher-learner and learner-learner discussion as well as to access experts and other resource person remotely. In open and distance learning, teleconferencing is a useful tool for providing direct instruction and learner support, minimizing learner isolation.
3. Computer and internet: [22] described three approaches to the instructional use of computers and internet. They are as follows:
• Learning about computer and the internet, in which technological literacy is the end goal.
• Learning with computers and the internet, in which technology facilitates jlearning across the curriculum.
• Lhearning through computers and internet, which is integrating technological skills development with curriculum applications [22] When we learn about computers, and the internet, attention are focused on developi3ng technological literacy. It typically includes:
• Fundamentals; basic terms, concepts and operations.
• Use of the keyboards.
• Use of productivity tools, such as word processing, spreadsheets, database and graphic programs.
• Use of research and collaboration tools such as search engines and e-mails.
• Basic skills in using programming and authority applications such as Logo or Hyper studio.
• Developing an awareness of the social impact of technological change [22]. When we learn with computer and the internet it means focusing on how the technology can be the means to learning ends across the curriculum. It includes the following, according to [22]:
• Presentation, demonstration and manipulation of data using production tools.
• Use of curriculum; specific application types such as educational games, drill and practice eliminations, tutorials, virtual laboratories, visualizations and graphical representation of abstract concepts, musical composition, and expert system.
• Use of information and resources on CD-ROM or online materials such as encyclopaedia, interactive maps and atlases, electronic Journals and other references. Technological literacy is required for learning with technologies to be possible. This implies a two - step process in which students will first learn about the technologies before they can actually use them to learn [22]. Learning through computers and the internet combines learning about them with learning with them. This according to [8], involves learning the technological skills “just in time” or when the learner needs to learn them as he or she engages in a curriculum-related activity. For example secondary School students who must present report on the impact on their community of an increase in the price of oil for an economic class, may start doing research online, using spreadsheet and database programs to help organize and analyze the data they have collected as well as using word processing application to prepare their written reports
4. Tele-collaborating: This is an online learning that involves students to login into online formal courses. This is perhaps the most commonly thoughts of the internet in education. However, it is by no means the only application. According to [10], web-based collaboration tools such as e-mail, list servers, message board, real-time chat, and web-based conferencing connect learners to other learners, teachers, educators, scholars and researchers, scientists and artists, industry leaders and politicians; in schools, to any individual with access to the internet who can enrich the learning process.

West African Journal of Industrial and Academic Research December 2016 v0l.17 41
The organized use of web resources and collaboration tools for curriculum purpose is called Tele-collaboration. [24] described Tele-collaboration as “an educational endeavours that involves people in different location using internet tools and resources to work together.” Most Educational Tele-collaboration are curriculum-based, teacher designed, and teacher coordinated. They use e-mail to help participants communicate with each other. Most Tele-collaborative activities and projects have websites to support [24]. The best Tele-collaborative projects according to [2] are those that are fully integrated into the curriculum and not just extra-curriculum that would not have been possible without it, and those that empower students to become active, collaborative, creative, integrative, and evaluative learners. One of example is the voice of youth project developed by UNICEF. This project encourages students to share their views on global issues such as HIV/AIDS, and child labour with other Youths and Adults around the world through an electronics discussion forum [2]. The voice of Youths website also provides background information on the different discussion topics as well as resources materials to help teachers integrate other classroom activities. Other Tele-collaborative projects according to [24] are as follows:
• International Telementor program (ITP)
• Global Learning and Observation to Benefit the Environment (GLOBE). Their websites are http://www.unicef.org/voy, http://www.telemelor.org, and http://www.globe.org respectively
5. ICT and Quality Education Improving the quality of education is a
critical issue. ICT enhances the quality of education in several ways. This can be done by several ways according to [1] quoting [25], ICT potentially offer increased possibilities for codifications of knowledge in education and for more innovations in teaching activities especially through the delivery of learning and cognitive activities anywhere anytime. ICT support and spurs learning at a distance which can be more learner-centred, self paced, and problem solving based, than face-to face teaching using traditional medium [1]. ICT creates social media through networking; create open space interactions between the
instructor/lecturers and the students without necessary face-to face classroom situation [26]. ICT are transformational tools which, when used properly and appropriate, can promote the shift to learner-centred environments. Below are ways ICT can enhance the quality of education.
• Motivation to learn: ICT such as video, television, multimedia, computer software etc, that combine text, sound, and colourful moving images can be used to provide challenging authentic contents that will engage the students in the learning process. Interactive radio likewise makes use of sound effects, songs, dramatization comic skills and other performance convention to compel the students to listen and become involved in the lesson being delivered. More so than any other type of ICT, networked computers with internet connectivity can increase learner motivation as it combines the media richness and interactivity of other ICT, with the opportunity to connect with real people and to participate in real world events [23].
• Facilitating the acquisition of basic skills: The transformation of basic skills and concepts that are the foundation of higher order thinking skills and creativity can be facilitated by ICT through drills and practice. Educational television program use repetition and reinforcement to teach the alphabets, numbers, colours, shapes, and other basic concepts. Most of the early uses of computer were for computer based learning (also called computer assisted instruction) that focused on insisting of skills and contents through expectation and reinforcement [23] .
• Enhancing teacher training: [1] noted that staff development; growth and career advancement is one of the indices or indicators of quality assurance in education. With the use of ICTs; teachers are opportune to be trained and re-trained in the use of ICT in discharge of education. Thus, the use of ICT in education today is a common agenda pursued by both developed and developing nation across the globe. This in keeping with the development of knowledge economy as well as the new trend of internationalization of institution of higher learning, both of which are clear indicators of quality in the education system [1].

West African Journal of Industrial and Academic Research December 2016 v0l.17 42
• Holding and up-dating of minimum academic standard: The development holding up-dating of benchmark minimum academic standard (BMAS) is one of the primary functions of the monitoring bodies of tertiary institutions in Nigeria [1]. The discharge of this function is supported by the use of ICTs. In doing this, the bodies can easily develop, up-date, and disseminate BMAS to institution where they are needed for implementation. This singular responsibility according to [1] is very vital in the pursuit of quality assurance in education. Thus, the role of ICT in holding, maintaining and updating the BMAS cannot be under estimated. Such is the same in the records holding role of ICT keeping with quality assurance [1].
• Provision of virtual library services: According to [1], the relevance of library information in quality assurance cannot be under-estimated. Most institutions stock only limited number of books, journals, and periodicals. The limited copies are equally outdated in contents. The provision of virtual library information is in fact one of the best cardinal areas where the ICT impact on quality of education [1]. With the ICT powered by the internet facilities, students and teachers have limitless opportunities and provisions to surf the web for and in search of vital and current information that are required for research and knowledge growth of students and lecturers in their various endeavours.
6. ICT Education and Quality Assessment One of the problems facing those who seek to describe quality in ICT education are to understand precisely what constitutes ICT education. ICT education occurs in a wide range of teaching activities where technology of one form or another is involved. Technology necessarily underpins the administrative functions of higher institution. ICT takes many forms and our common instantiations in ICT delivery and approaches according to [10] include the following:
• Flexible learning, technology support for learning anytime and anywhere.
• Blended learning varying mixes technology with conventional learning.
• Online learning, where technology provides the means for higher the implementation and
delivery of learning programmes totally distinct from face-to face teaching. Within this diverse and broad range of activities, we are now seeing increased levels of awareness and concern for the quality of activities and their results. According to [27] quoted by [10], there is a heightened level of interest in being able to monitor and review performance and to demonstrate successful outcomes. In catering for diversity, most exercises in quality assurance steer towards the activities with the highest levels of technology use and dependence. There are usually two main ways by which the quality of process or activity can be assessed. They are through Benchmarking or by the specification of standards. Benchmarking compares the performance of an outcome in one setting against that achieved by selected others operating in a similar sphere. This is a process of relativity. The use of standard on the hand uses criteria-related references to judge performance [10] Benchmarking is a difficult process to apply in most University setting. [28] argued that learning and teaching is difficult to Benchmark because there will always be diversity from institution to other. E-learning which is embedded in the ICT education is one activity in higher institution setting where benchmarking processes might be employed to ascertain quality? E-learning comprises of discrete and distinct teaching and learning elements that can be isolated and identified for benchmarking purposes. There are currently existing number of standards and guidelines that have developed to aid this process. These includes
• Institution for higher education policy.
• Learning Objects Metadata (LOM)
• Learning Technology Standard Committee (LTSC)
• QAA
• ETC At the same time, there has been considerable research and development in e-learning and many reports have resulted that showcases examples of best practice that can be used as potential benchmark against which comparison can be drawn [10]. According to [29], there are number of researches that have attempted to provide frameworks that can be used to provide over reaching models to describe the critical elements of learning

West African Journal of Industrial and Academic Research December 2016 v0l.17 43
settings that can be used to contexualize the factors influencing effective outcomes. Typically, the framework distinguishes four discrete elements. They are:
• The curriculum, that which is to be learned
• The learning design, that planned learning environment
• The learning resources, the courses contents
• The delivery processes, supports and scaffolds for learning Within these four elements, there are examples of best practice that apply to teaching and learning in general and examples that could be considered unique to e-learning. Since e-learning is primarily a descriptor of the medium of instruction, descriptions of best practice would tend to apply mainly to instantiations of curriculum and course itself. Therefore learning designs, learning resources, and delivery processes are the elements of e-learning that could form the basics of any benchmarking activity.
7. 8. Conclusion
ICT affects the delivery of education and enable wider access to the same. It increases flexibility so that learners can access the education regardless of time and geographical barriers. It influences the way students are taught and how they learn. It enables development of collaboration skills as well as knowledge creation skills. This in turn would better the learners for lifelong learning. It improves the quality of learning and this contributes to the economy. Wider availability of best practice and best course material in
education which can be shared by means of ICT can foster better teaching. However, successful implementation of ICT to lead change is more about influencing and empowering teachers and supporting them in their engagements with students in learning rather than acquiring computer skills and obtaining software and equipment. Also proper controls should be ensured so that accountability, quality assurance, accreditation and consumer protection are taken care of.
9. Recommendations The European standards and guidelines for internal quality assurance within higher education institution (2009) recommended thus.
• Policy and procedures for quality assurance: Institutions should have policy and associated procedures for the assurance of the quality and standards of their programmes and awards.
• Approval, monitoring and periodic review of programmes and awards: Institutions should have formal mechanisms for the approval, periodic review and monitoring of their programmes and awards.
• Assessment of students: Students should be assessed using published criteria, regulations and procedures, which are applied consistently.
• Quality assurance of teaching staff: Institution should have ways of satisfying themselves that staff involved with teaching of students are qualified and competent to do so.
• Information System: Institutions should ensure that they collect, analyse and use relevant information for the effective management of their programmes of study and other activities
• .
Reference
[1] C.A. Oduma,’’Quality Assurance in Education: The Role of ICT and Quality Control Measures in Tertiary Institution in Nigeria’’, International Journal of Science and Technology, Bahir Da Ethiopia, Vol. 3(2), No 7, pp 136 – 158, 2014.
[2] V.S. Chollin, ‘Study of the Application of Information Technology for Effective Access to Resources in
India’, The International Information & Library Review,37 (3), 189 – 197,2005. [3] S. Mehta & M. Kalra, ‘Information and Communication Technology: A Bridge for Social Equality and
Sustainable Development in India’, The International Information & Library Review, 39 (3) 147 – 160, 2006.

West African Journal of Industrial and Academic Research December 2016 v0l.17 44
[4] C. Blurton, ‘New Direction of ICT use in Education, 2000, Availableonline,http//www.unesco/education/educ/rpg/1wf/edict/pdf, accessed Sept 2016
[5] A.N. Yekini, J.O.Adigun, & M.M. Rufai, ‘ICT Tools to Improve Quality Assurance in Africa Educational System, JCS ST (12), 19 – 15, 2012.
[6] A. P. Rovai, ‘A Practical Framework for Evaluating Online Distance education Programs’, The Internet
and Higher EducationI, (2), 109 – 134,2003. [7] V.R. Ron, ‘Audio Teleconference Technological Prescription for Interactive Learning, 2005, Available
from http://www.drec.org/rama, Retrieved 2nd Oct. 2016 [8] M.N. Amutabi & M.O. Oketeh, ‘Experimenting in Distance Education: The African Virtual University
(AVU) and paradox of the World Bank in Kenya’, The International Journal of Education
Development,23 (1), 57- 73, 2013. [9] S.Y. McGorry, ‘From Distance to Online Education’, The Internet and Higher Education,3 (12), 63-74,
2002. [10] R. Oliver, ‘Quality Assurance and E-Learning: Blue Skies and Pragmatization’ Research in Learning
Tecnology,Vol 13, No 3, pp 173-178, 2005. [11 S. Achtemeir & R. Simpson, ‘Pratical Consideration when using Benchmarking for Accountability in
Higher Education’, Innovative Higher Education, 30 (2), 112-128, 2005. [12] N.Y.S. Ijaiya, ‘A Guide to Supervision in Instruction’, Ilorin, My Grace Prod. Co, 1991. [13] S.O. Adegbasan, ‘Establishing Quality Assurance in Nigeria Education System: Implication for
Educational Managers’, National Institute for Educational Planning and Administration, (NIEPA) http://www.academic.journal.org/ERR, 2011.
[14] G.A. Cole, ‘Management Theory and Practice’, London, DP Publications, 1996. [15] C. Mungle, ‘Inspection, education and Quality Assurance’, Washington D C USA Department of
Education, office of Education Research and improvement ,2013. [16] N. Selwyn, ‘Education and Technology: Key Issues and Debates’, London CIP Group, 2001. [17] L. Cuben, ‘Teachers and Machines: The Classroom use of Technology since 1920’, New York, T C Press,
1986. [18] C.P.S. Lim & C.S. Chai, ‘An Activity-Theoritical Approach to Research of ICT Integration in Singapore
Schools’, Computers and Education, 43 (3) 215-236, 2004. [19] I. Bharttachanya & K. Sharma, ‘India in Knowledge Economy- An Electronic Paradigm’, International
Journal of Education Management, Vol 21 No 6 pp 543-658, 2007. [20] UNESCO, ‘Open and Distance Learning Trends: Policy and Stategy Considerations, 2012. [21] W.D. Haddad & A. Draxler, ‘The Dynamic of Technologies for Education, Washington DC: Academy for
Education Development, 2002. [22] H. Peratton & C. Creed, ‘Applying New Technologies and Lost Effective Delivery System in Basic
Education, 2002, Available from http://unesco.org/images/0012001234/123482e-pdf, Retrieved 2nd Oct 2016.
[23] S Chandra & V Parker, ‘ICTs: A Catalyst for Enriching the Learning Process and Library Service in India’, The International information & Library Review, 37 (3), 189-197, 2007.
[24] J Harris, ‘First Step in Telecollaboration’ 2001, Available from http:cewutexas.edu/2.jharris/virtual-
architecture.articles/first-steps.pdf, Retrieved Oct 2016. [25] B. Robbinson, ‘Using Distance Education and ICT to Improve Equality and the Quality in Rural Teachers’
Professional Development in Western World’, 2008, Available from http:www.edu.tech/users/application
of ICT inedu/0012.
[26[ D.O. Igwe, ‘The Role of ICT in an open and Distance Education Achievemets:Prospects and Challenges, National open University of Nigeria, 2010.

West African Journal of Industrial and Academic Research December 2016 v0l.17 45
[27] J Fressen, ‘Quality Assurance Practice in Online (web-supported) Learning in Higher Education: An Exploratory Study’,Unpublished Doctorate Thesis, 2005.
[28] K.R. Mckimon, ‘Benchmarking: A Manual for Australian universities, 2002, Available at
http:www.dest.gov.au/achieve/highered/otherpub/bench.pdf.
[29] R. Sim, G. Dobb & T. Hand, ‘Enhancing Quality in Online Learning: Scaffolding, Planning and Design Through Provocative Education, Distance Education, 23 (2) 135-148, 2012.

West African Journal of Industrial and Academic Research December 2016 v0l.17 46
Application of Infomation Technology Infrastructure In Information Processing For Enhancing Workplace Safety In
Rivers State.
Anthonia Enefaa Bestman Department of Office and Information Management, Rivers State University of Science and Technology,
Port Harcourt, Rivers State. Email:[email protected].
Tell: +2347032034211
Abstract The study investigated the application of infotech infrastructure in information processing for enhancing
workplace safety in Rivers State. In view of this, the study was a research survey design. The population of
the study comprised 600 oil company workers in Rivers State. A-30% basis was used to randomly select
the sample size of 120 oil company workers of whom 70 were male and 50 female. In all, 60 oil company
workers,wasselected through simple random sampling from the sample size. The instruments for data
collection was a quesitonnaire code-named Application of infotech infrastructure in Workplace safety
Assessment Questionnaire (AIIWSAQ). The instruments was subjected to face and content validities and
yielded a reliability index of 0.81 upon correlation with the use of Sperarman correlation coefficient.
Mean and standard deviation statistical tools were used provide to answers to the research questions
while Kuder-Richardson formula was used to test the null hypotheses. The results of the study revealed
that common accidents/injuries are increasingin workplaces in Rivers State. The result also indicated that
the use of infotech infrastructure can prevent common accidents or injuries in workplaces much more
efficiently than any other approaches can do. The study recommended that the oil companies in Rivers
States should prioritize the safety by injecting enough funds in providing adequate safety related
information gadgets and facilities and should integrate their safety policies and approaches into the
maintream of infotech infrastructure. Introduction A workplace efficiency begins with having a team of workforce whose safety is guaranteed in all respects. Safety of workers is very crucial in any organization as no meaningful achievement could be made in the presence of relegation of workforce’s safety to the background. Neglect for safe workplace does not only lead to wasting of money, time and efforts trying to defend an organization against lawsuits and payments of huge compensation and fines but also give rise to losing best set of human resources by death or permanent injury, that could have turned organizations fortunes and assets for better and greater competitive advantage. Again, an organization can lose both good image and focus for showing laxity towards workplace safety. Kofi Anna, the former UNSecretary General once said that safety and health at work is not only a sound economic policy; it is a basic human right. World Health Organization [1] defines a workplace as any place that physical and/or mental labour occurs, whether paid or unpaid.
This includes formal worksites, private home, vehicles, or outdoor locations on public or private property. On the other hand, WHO defines safety as the state of being protected against physical, social, spiritual, financial, psychological or types of consequences of failure, error, accidents or harm. That can take form of being protected from the event or from exposure to something that causes health or economic losses. It can include protection of people or of possession [1]. From the above definitions, workplace safety could be defined as the aggregate measures put in place or taken by an organization to ensure that physical, social, spiritual, financial, mental or psychological wellbeing of people working in a particular place is protected. WHO also has stated that all workers have the right to health and safe work and to a work environment that enables them to live a socially and economically productive live [2]. This statements puts the human life at the centre of all productive activities, which must not be compromised at any cost [8]. In spite of this,

West African Journal of Industrial and Academic Research December 2016 v0l.17 47
2.2 million men and women are victims of occupational accidents and work related diseases every year [3]. By conservative estimates, workers suffer 270 Million occupational accidents and 160 million occupational diseases annually [3]. Disease control priority project [4] is of the view that this is perhaps just the tip of the iceberg, as data for estimating non-fatal illness and injury are not available in most developing countries. Globally, [5], deaths, diseases, and illness accounts for an estimated loss of 4% of the Gross Domestic Product. Similarly, [6] International Labour Organization report as saying that every fifteen seconds, 151 workers have a work related accident. The global number of non-fatal occupational accidents reaches a staggering 317 million annually. Even more concerning, 321,000 people die each year from occupational accidents. Work accidents remain a huge cross-industry problem, despite of regulations and procedures. Furthermore, it was [6] stresses that even a non-fatal injury can have a potentially devastating effect on an employees health and livelihood. For employers, in addition to the distress of an employee suffering from injury, work accidents affect productivity and organizations can suffer significant financial losses. In the United States alone, workplace injuries and illnesses cost employers more than $220 billion annually, with 27 million working days lost per year.The majority of workplace injuries or accidents are easily prevent able through monitoring workers status. Injuries can be prevented, whether by ensuring that protective equipment is used correctly, or that time or location limitations for hazardous situations are monitored. It is in this very situation of monitoring that the use of infotech infrastructure is called to aid [5]. The term infrastructure in an information technology contexts refers to the entire collection of hardware, software, networks, data centre, facilities and related equipment used to develop, test, operate, monitor, manage and/or support information technology services [7]. An organizations infortech infrastructure includes the physical IT devices used in operating and managing IT services. Similarly, as defined [8] information technology infrastructure as a combined set of hardware, software, networks, facilities, etc, (including all the information
technologies) used in order to develop, deliver, monitor, control or support IT services. As succinctly put [10], maintaining a safe work environment reflects a level of compassion and vigilance for workers welfare that is as important as any other aspect of health care. The way to improve safety is to learn about causes of errors and use this knowledge to design systems of care to “… make errors less common and less harmful when they do occurs”. Computers and designated software can be used to detect weather related risks and danger accurately and can also be used to pinpoint the geographical locations in which the potential disasters such as storms, flooding, earthquake, Tsunami, tarnadoes, erosion, etc are imminent [6]. Wearable and embedded sensors are making it possible for workers to be monitored within their surroundings to prevent injury from fall, over-exertion and heavy machinery. Wearable technology taps into the internet for gathering, integrating and analyzing sensor data. A sensor which is one of the inpotech products can also be used to detect landmines, volcanic eruption-prone zones so that workers to steer clear from the zones. Computers, the internet, the web, social media platforms and software can be deployed in teaching safety tips in workplaces. Digital alarm system automatically alert workers of potential dangers in a workplace [6]. Apart from this, sensors have the capacity of gathering information on potential hazards and impending dangers of chemical or biological substances. Data collected for the purposes averting dangers and hazards can be analyzed using the appropriate computers. Servers and protocols provide links and sharing of resources to computers deployed in monitoring the workers to ensure that they do not step into dangerous or hazardous zones in the work place. Digital videos can be employed to show workers who are to embark on exploration or voyages the probably dangers and appropriate safety tools or devices to take along with them [6]. Digital trackers have the capacity to accurately track the leakage points of highly inflammable, dangerous and hazardous chemical, or gaseous substances [8[. In the same vein, digital monitoring devices such as computers, wireless digital cameras or CCTV can be used to monitor workers in the field to ascertain whether or not they (workers) are observing the safety tips given to them. The information so gathered are processed for onward administrative

West African Journal of Industrial and Academic Research December 2016 v0l.17 48
decisions. So also, it is an irrefutable that infotech tools such as computers, software, the web, the internet, search engine, among others, act as stress eliminators in that they make information processing about safety issues easy, fast, cheap and convenient [9]. Notwithstanding the above, infotect infrastructure offers the opportunity for mental well-beingness [11]. The major functions of information technology infrastructure in respect of guarantecing safety in workplaces is to generate information which can be processed to make safety – related decisions in on organization. The mental wellbeingness of the workers is assured because computers and/or appropriate software can assist and support rational sound decision making. Problem Any organization that requires high productivity, economic prosperity and vantage point of competitive advantage must not toy with the safety of its workforce. Workplace safety is multifaceted because it covers the physical, emotional and mental wellbeingness of workers and as such comprehensive approaches have to be adopted in order to ensure that the workers are safe in their workplace. But quite unfortunately, this is not to be as the recorded figures of deaths, injuries and illnesses in organizations across the world, particularly in developing world like Nigeria, resulting from obvious neglect of safety rules, standards and approaches continue to grow astronomically each year.
According to a [3], Wooping 321,000 people die each year from occupational accidents while the global number of non-fatal occupational accidents occurs mostly in developing world like Nigeria, where safety rules and approaches are most of times not adhered to. The modern approaches like the use of infotect infrastructure, which has proved to offer effective preventive solutions to the disastrous consequences of the failed condition of safety in workplaces, seems not to have been embraced
and given a place of honour it desires in most organizations in Nigeria, particularly in Rivers State. Consequently, this study launched investigation into the application of infotech infrastructure in information processing for enhancing workplace safety in Rivers State Objectives The cardinal aim of this study is to investigate the application of infotech infrastructure in information processing for enhancing workplace safety in Rivers State. In a specific term, this study sought to accomplish the following objectives: To examine the common accidents or injuries usually associated with workplaces in Rivers State. To determine whether or not the use of infotech infrastructure can prevent common accidents or injuries in workplace in Rivers State. Research Questions The conduct of this study was guided by the following formulated research question: What are the common accidents or injuries usually associated with workplaces in Rivers State? Can the use of infotech infrastructure prevent common accidents or injuries in workplaces in Rivers State? Hypotheses The conduct of the study was guided by the follow hypotheses There is no significant difference between the mean rating of male and female oil company workers on the common accidents or injuries usually associated with workplaces in Rivers State. There is no significant difference between the mean ratings of male and female oil company workers on whether or not the use of infortech infrastructure prevent common accidents or injuries in workplaces in Rivers State.
Methods
This study was a research survey design. The population of this study comprised 600 oil company workers in River State. 300 workers each emerged and a-30% basis was used to randomly select the sample of 120 oil company workers of whom 70 were male and 50 female. In all, 60 oil company workers were selected
through simple random sampling from the state constituted the sample size. The instrument for data collection was a questionnaire code-named Application of Infotech Infrastructure in Workplace Safety Assessment Questionnaire (AIIWSAQ). The instrument contained a modified 4 Likert scale of Strongly Agree (SA),

West African Journal of Industrial and Academic Research December 2016 v0l.17 49
Agree (A) Disagree (D and Strongly Disagree (SD). The instrument was subjected to face and content validities and yielded a reliability index of 0.81 upon correlation with the use of spearman correlation coefficient. Mean and
standard deviation statistical tools were used to provide answer to the research questions while Kuder-Richardson Formula was used to test the null
hypotheses,
−
−=
−−
)(
)(1
121
2SDK
xk
K
KKR
x
The criterion mean for measuring each item of the questionnaire is 2.50, which was obtained by summing the 4 points Likert Scale, thus,
50.24
1234=
+++. Thus, any calculated mean
#value that is 2.50 and above indicates
acceptance and the one below it (2.50) indicates rejection. Results~
The results achieved from the field are presented below:
Research Question One What are the common accidents or injuries usually associated with workplaces in Rivers State? Table 1: Mean and Standard Deviation Analysis Presenting Common Accidents or Injuries Associated with Workplaces S/N ITEMS Male : N = 70 Female : N = 50
Mean Set
−
x SD −
x SD
2
21 xx +
Decision
1. Chemical explosion 2.91 1.13 2.60 1.11 2.76 Agree
2. Fire incidents 3.00 0.96 2.98 1.08 2.99 Agree
3. Involvement in road accidents 3.09 1.13 2.68 1.05 2.89 Agree
4. Flooding 2.40 1.24 2.26 1.12 2.33 Disagree
5. Falling off from the top 2.80 1.27 2.70 1.18 2.75 Agree
6. Fainting as a result of fatigue 2.64 1.14 2.58 1.11 2.61 Agree
7. Suffocating due to non-ventilation 2.83 1.04 2.56 1.37 2.70 Agree
8. Bruises fracture 3.27 0.99 2.66 1.17 2.97 Agree
9. Ship/board capsizing or mishaps 2.06 1.25 2.28 1.14 2.17 Agree
10. Injuries/accidents due to wrong handling of tools or equipment
3.20 1.24 2.66 1.19 2.93 Disagree
11. Collapse of erected structure with injuries and causality
2.87 1.03 2.84 1.11 2.86 Agree
12. Non-recognition and rewards denial 3.46 0.90 2.68 1.30 3.07 Agree
Aggregate Mean 34.53 13.32 31.48 13.98 Agree
Table 1shows that, with exception of items 4 and 9, all items had the calculated mean above the criterion mean of 2.50. this result therefore indicates that the common accidents or injuries associates with workplaces in Rivers State include chemical explosion, fire out break incidents, involvement in road accidents, falling offs from the top, fainting as a result of fatique, suffocating due to non-ventilation and bruises/fractures. Others include
injuries/accidents due to wrong handling of tools and equipment, collapse of erected structures with injuries and causality and non-recognition and award denial. Research Question Two he use of InfoTech infrastructure prevent common accidents or injuries in workplaces in Rivers State?
Table 2: Mean and standard Deviation Analysis Presenting Whether the use of Infotech Infrastructure Prevents Common Accidents/Injuries in Workplaces.

West African Journal of Industrial and Academic Research December 2016 v0l.17 50
S/N ITEMS Male : N = 70 Female : N = 50
Mean Set
−
x SD −
x SD
2
21 xx +
Decision
1. Computers and software can monitor oil installations to foretall explosion.
3.10 1.22 2.80 1.28 2.95 Agree
2. Digital alarming system can process information and automatically generate alarm in case of fire outbreak
3.07 1.13 2.86 1.03 2.97 Agree
3. Digital trackers can monitor drivers and make them drive with care for knowing that they being monitored.
2.84 1.07 2.90 1.20 2.87 Agree
4. Computers and software can accurately predict weather or climate conditions that are not favourable to work or operations.
3.29 1.07 3.30 0.99 3.30 Agree
5. Digital video clips and computers can be employed in teaching workers climbing related safety clues and even monitor and issue safety instructions while climbing.
2.64 1.09 2.72 1.29 2.68 Agree
6. Using computers and software can adequately help in work schedules and promptly alert workers for a break.
2.76 1.04 2.60 1.23 2.68 Agree
7. Digital sensors can accurately and quickly generate information that a workplace is too hot or cold.
2.61 1.17 3.02 0.94 2.82 Agree
8. Social media and computers adequately help in giving workers safety instructions and equally monitoring them carry the instructions out to avoid industrial accidents/injuries such as bruises and fractures.
3.33 0.93 2.86 1.09 3.10 Agree
9. Computers and appropriate software can spot with accuracy the dangerous and hazardous zones in the field of work
2.83 1.18 3.06 1.02 2.95 Agree
10. Computers can assist adequately in monitoring all the workers for the purpose of awarding recognitions and rewards for psychological well-being of workers.
3.17 0.99 2.80 1.05 2.99 Agree
11. Software, computers, the internet and other related technologies can make safety related information quickly accessible, easy and cheap.
3.43 0.96 2.78 1.18 3.11 Agree
Aggregate Mean 33.07 11.85 31.70 12.30 Agree
Table 2 shows that all the items had their calculated mean values above the criterion of 2.50. The result therefore indicates that the use of infotech infrastructure can prevent common accidents/injuries in workplaces in Rivers State with the following points: computers and software can monitor oil installations to forestall explosion, digital alarm system can process information and automatically generate alarm in case of fire outbreak, digital trackers can monitor drivers and make them drive with care for knowing that they are being monitored, computers and software can accurately predict weather or climatic conditions that are not favourable to work or operations, digital video
clips and computers can be employed in teaching workers climbing safely clues and even monitor and issue safety instructions while climbing and computers and software can adequately help in work schedules and promptly alert workers for a break. Other include the digital sensors can accurately and quickly generate information that a workplace is too hot or cold, social media and computers can adequately help in giving workers safely instructions and equally monitoring them carry the instruction out to avoid industrial injuries/accidents such as bruises, fractures, computers and software can spot with accuracy the dangerous and hazardous zones in the field of work, can assist in monitoring all the workers for

West African Journal of Industrial and Academic Research December 2016 v0l.17 51
the purpose of awarding recognitions and rewards for psychological well being of worker and with the internet and other related technologies can make safety related information quickly accessible, easy and cheap.
Test of Hypotheses H01: There is no significant difference between the mean ratings of male and female oil workers on the common accidents or injuries usually associated with workplaces in Rivers State
. Table 3: KR21 Analysis Presenting the Difference between the Mean Rating of Male and Female Oil Workers on the Common Accidents or injuries associated with workplaces.
Variables No. of Items on Instrument
−
x SD KR21-
Cal. Value
KR21-Agg.Cal.= EKR211,+KR212 2
KR21 Cut-off point
Decision
Male (70) 12 34.53 13.32 0.691 H01
Female (50)
12 31.48 13.98 0.812
0.75
0.50 Accepts
Table 3 shows that the KR21 aggregate calculated value is 0.75, while the KR21 cut off point is 0.50, since the KR21aggregate calculated value is greater than the KR21 cut-off point, the male hypothesis is accepted. Therefore, there exists no significant difference between the mean ratings of male and female oil workers on the common accidents or injuries usually associated with workplaces in Rivers State.
Ho1: There is no significant difference between the mean ratings of male and female oil workers on whether or not the use of infotech infrastructure prevent common accidents or injuries in workplaces in Rivers State. Table 4: KR21 Analysis Presenting the Difference between the Mean Ratings of Male and Female Oil Workers on Whether or not the use of Infotech Infrastructure prevent common accidents or Injuries in workplaces.
Variables No. of Items on Instrument
−
x SD KR21-
Cal. Value
KR21-Agg.Cal.= EKR211,+KR212 2
KR21 Cut-off point
Decision
Male (70) 11 33.07 11.85 0.581 H02
Female (50)
11 31.70 12.30 0.672
0.63
0.50 Accepts
Table 4 reveals that the KR21 – aggregate calculated value is 0.63, while the KR21 Cut-off point is 0.50. since the KR21 – aggregate calculated value is greater than the KR2 cut-off point, the null hypothesis is accepted. Therefore,
there exists no significant difference between the mean ratings of male and female oil workers, on whether or not the use of infotech infrastructure prevent common accidents or injuries in workplaces in Rivers State.
Discussions Common accidents or injuries usually associated with workplaces in which the application of infotech infrastructure is required The result merging from analyzing research question one revealed that in Rivers State, the common accidents or injuries associated with workplaces of which infotech infrastructures can be of a great remedy are chemical explosion, fire outbreak, involvements in road accidents, failing offs from the top,
fainting as a result of fatigue, suffocating due to non-ventilation, bruises or fractures, injuries/accidents due to wrong handling of tool or equipment, collapse of erected structure with injuries and causality and non-recognitions and award denial. Of all the aforementioned common accidents or injuries, only “non-recognition and award denial” falls within the category of injuries which could be described as the psychological injury which does not actually ensure the
West African Journal of Industrial and Academic Research December 2016 v0l.17 52
workers safety or wellbeing. This result actually showed that the injuries or accidents to the oil workers industrial or occupational safety is very high in workplaces in Rivers State. This results is in agreements with the study of International Labour Organization (2005). Which revealed that by estimate, workers suffer 270 million occupational accidents (injuries) and 160 million occupational diseases annually. The Use Of Infotech Infrastrructure In Workplace And Oil Worker’s Safety The result generated from analyzing research question two indicated that the use of infotech infrastructure can prevent common accidents or injuries in workplaces in Rivers State in a number of ways. As revealed by the result, infotech tools such as computers, software, digital alarming system, trackers, video clips, sensors, social media, the internet, among others can prove successful for preventing common accidents or injuries in workplaces. For instance, computer and software can monitor oil installations to prevent explosion, digital alarming system can process information and automatically generate alarm that will enable the workers escape to safety in the events of fire outbreak. The result also revealed digital trackers can monitor drivers and make them drive with care to prevent road accidents or injuries; computers and appropriate software accurately predict weather or climate conditions that are not favoruable to work or operations, can adequately help in work schedules and promptly alert worker fora break, thereby forestalling any event of fainting, stress etc, can spot with accuracy the dangerous and hazardous zones in the field of work so that the workers would avoid them and stay safe.
The result also revealed that computers, software, the internet and other related technologies can make safety related information rapidly accessible, easy and cheap thereby encouraging safety informed and conscious
workforce. So also the result revealed that digital sensors can accurately and quickly generate information that a workplace is too hot and cold thereby prevent the incidents of workers working under adverse climatic conditions or situation or climate condition against their safety, and digital video clips and computers can be deployed in teaching ‘avoidence of falling off from the top’ and even monitor and issue safety instructions. The result equally revealed that social media and computers adequately help in giving workers safety instructions and equally monitoring them carry the instructions out to avoid industrial accidents/injuries such as bruises and fractures. Equally revealed by the result was that computers can assist adequately in monitoring all workers for the purpose of awarding recognitions and reward for the promotion of their psychological safety or wellbeing. This result is in conformity with the studies ofwhich indicated that infotech infrastructure can adequately prevent common accidents or injuries in workplaces [8] [7] [6]. Conclusion Emanating from the results is the conclusion that the oil workers in Rivers State confront varieties of safety threatening situations or conditions and that the use of infotech infrastructure can adequately and effectively prevent common accidents and injuries in workplaces for promotion of workers’ safety and wellbeing.
Based on the results, the study recommended as follows: Oil companies should proritize the safety by injecting enough funds in providing adequate safety related information gadgets and facilities.
They should integrate their safety policies and approaches into the mainstream Infotech infrastructure so that safety problems will be brought to the bearest minimum.
References [1] WHO (2010). WHO Healthy Workplace Framework and Model: Background and Supporting Literature and Practices, Geneva.
2] WHO (1994). Global Strategy on Occupational Health for all: The way to health at work, Geneva. [3] Ilo (2005). Safe Work: Global Estimates of Fatal Work related Diseases and occupational Accidents,
World Bank Regions.

West African Journal of Industrial and Academic Research December 2016 v0l.17 53
[4] Disease Control Priorities Project (2007) Developing Countries can Reduce
hazards.Retrieved on 04/12/2016 from www.dcp2.org/file/DCPP- OccupationalHealth.pdf.
[5] Takala, J. (2002). “Introduction Report: Decent Work – Safe Work”. Paper Presented at the 16th World congress on safety and Health, Vienna.
[6] O’Connor, C.(2016). Improving safety with Wearables. Retrieved on 04/12/2016 from www.Ibm.com [7] Stroud, F. (2016). Infrastructure. Retrieved on 04/12/2016 from www.webopedia.com [8] Kwesi, A. T. and Kwasi, D.B.(2015). Occupational health and safety: Key Issues and concerns in Ghana.
International Journal of Business and Social Science, vol2 No14:1-8 [9] Van der, V.A. and Van Bon, J. (2007). Foundations of ITIL v3. Van Haren Publishing. [10] Institute of Medicare (2001). Crossing the Quality Chasm: A new Health System for 21st century.
Washington DC National Academic Press. [11] Nick, S. and Macdonald, C.(2014). Workplace safety: Achieving Mental Wellbeing through information
technologies. New Jersey: Millers

West African Journal of Industrial and Academic Research December 2016 v0l.17 54
ICT in Building Construction: Prospects and Challenges in Developing Countr
1Veronica Nkechi Imakwu&2Babatunde Bayodele Olofin
Department of Technology and Vocational Education, Ebonyi State University Abakaliki, Nigeria
1Cell: +2348063443867; Email: [email protected]
2Department of Computer Science,
Enugu State University of Science & Technology, PMB 01660, Enugu, Nigeria 2Cell: +2348033215972; Email: [email protected]
Abstract
For century, humans have created structures but the American wonder which is technology, made what
seems impossible possible. The traditional adobe buildings with thatched roof and mud block have been
developed to the modern skyscraper. Today, a house can be built with insulation and can be inflated or
deflated to adjust to outside temperature through technology. This paper looked into the roles of ICT in
building design, innovations in building construction through modern technology and challenges facing
the use of ICT in developing countries. Building construction demands a tacit coordination, collaboration,
and communication among all stakeholders. Project team structures are complex and sometimes located
at different places. It is only the adoption of ICT that can perform the “magic” of effective teamwork, just
as the world is now a global village. Keywords:Building, Construction, Globalisation,ICT, Team, Technology, Introduction Computers are used directly or indirectly in almost every aspect of our lives. ICT has made possible the use of computer and other communication gadgets such as telephone, radio, television, satellite, internet and other computer allied devices.We write letters using word processor, withdraw money from an automatic teller machine (ATM) and also when we make online purchases. This shows that our society is becoming so dependent on information technology (IT). The potentials of ICTs lie in the capability to “instantaneously connect vast network of individuals and organizations across great geographic distances at very little cost” [1]. According to [2], “Information Technology is the acquisition, processing, storage and dissemination of vocal, pectoral textual and numerical information by a micro-electronic based combination of computing and telecommunication”. [3] observed that ICT acts as a developmental engine both for mental and physical aspects of the body. They also see ICT as set of telecommunication devices that accept data, process, store, retrieve and transmit information electronically. According to [4], Information and Communication Technology
(ICTs) are terms often used to a broad area of human activities. Generally, ICT is the acquisition, processing, and storage of information (of numbers) using a microelectronic-based merger of computation and telecommunication. Adebayo further stated ICT is a set of processes that speed up the capture, process, transmission, display, and storage of information electronically [1].It is on this note that, [5] asserted that a new concept of youth empowerment programme known as skill acquisition programme in the direction of ICT education is proposed to be the best empowerment and a panacea to reduce youth restiveness as it opens up multi-dimensional opportunities in a developing country like Nigeria. Modern computer started as a product of man’s continued search for a tool that will enable him meet his computational requirement with a minimal manual and mental effort. Today’s computer was developed as a natural progression from the early calculating aids. The first being the Abacus to the following-the Napier’s Bones, Logarithm-slide rule, the Pascal machine, the difference Engine, the Punch Card, electronic

West African Journal of Industrial and Academic Research December 2016 v0l.17 55
computer, AtanaSoff-Berry Computer (ABC), Mark I computer, ENIAC, UNIVAC, EDVAC, first generation computer to fifth generation presently. The present day computer started in 1990 till date [6]. ICT has become inevitable with the advance of computer as both go simultaneously. Science and engineering are not left out with this modern trend. Development of theories by researchers, collection of data for testing, information exchange with colleagues by means of electronically-based equipment are part of the benefits of ICT. One of the automated systems that aid the facilitation of data collection is the Building Information Modelling (BIM). This system is used for a regular data collection in building under construction. The BIM enhances effective communication among the Designers and Engineers in a Building project. Computer Aided Design (CAD) assists in the design of a flawless building through simulations by the use of computers so that issues in the design can be discovered and resolved prior to the physical construction of the building; and progress in technological developments has made remarkable innovations in the building industry [7]. Stewart Brand, a famous American Writer remarked “Once a new technology rolls over you, if you are not part of the stream-roller, you
are part of the road”. This paper tends to examine the role of ICT in building design, innovations in building construction through modern technology and its accompanying challenges. Developing countries, such as Nigeria, is working hard to be part of the stream-roller and not the road but through industrialization, moving from developing to a developed country. The Role Of Ict In Building Design Building is indispensable to life. It serves as a place where man lives, sleeps, cooks, relaxes and many more.The transformation effect of advancement in technology through ICT in design and construction of building cannot be measured. Some of the roles of ICT in building design are highlighted below:
1) PredictiveSoftware:this has been used by Civil Engineers to integrate arch rotation brackets at Wembley Stadium (see Figures 1a & 1b). The ANSYS is “a simulation tool that simulates materials’ response to short-range duration severe loading from impact, high pressure or explosions” [8]. The work was made possible through design by integrating vast number of pieces so as to perform under normal or extreme conditions
2) .
Figure 1a: Wembley Stadium Exterior Source:https://en.wikipedia.org/w/index.php?title=Wembley_Stadium&oldid=771901954

West African Journal of Industrial and Academic Research December 2016 v0l.17 56
Figure 1b: Close-up of the arch at the Wembley Stadium
Source:https://en.wikipedia.org/w/index.php?title=Wembley_Stadium&oldid=771901954
3) Computer Aided Design (CAD): The software like AutoCAD, Arch CAD, Revit Architecture, Atlantis, Sketch up, just to mention but a few have been used by Architects in presenting wonderful designs. They help in flawless buildings designs so that problems discovered through simulations can be detected and resolved prior to construction.
4) Building Information Modelling (BIM):The US National Building Information Model Standard Project Committee defined BIM as “a digital representation of physical and functional characteristics of a facility. A BIM is a shared
knowledge resource for information about a facility forming a reliable basis for decisions during its life-cycle; defined as existing from earliest conception to demolition” [9]. Though the concept had existed in 1970s, it is being used by Architects, Engineers, and Building professionals, in collaborating designs, in minimising errors, to reducing costs. The use of the BIM software enables objects to be defined parametrically, so that a relationship exists between one object and the other one. In this way, when there is an amendment to one object, the other dependent objects are automatically changed [9].

West African Journal of Industrial and Academic Research December 2016 v0l.17 57
Figure 2: 3D Modelling of Smart City
Source: https://www.raconteur.net/wp-content/uploads/2015/06/cybercity3D.jpg The advent of 3D Modelling has made innovative planning in the development of smart cities. CyberCity3D (CC3D) is a geospatial-demonstrating trailblazer gaining practical experience in the generation of shrewd 3D building models[10]. It makes savvy advanced 3D structures to help the compositional, building and development part imagine and impart plan and information with CC3D restrictive programming[10]. The models incorporate with 3D geographic data framework stages, for example, Autodesk and ESRI, and can stream 3D urban building information to Caesium’s open design virtual 3D globe. It gives information to urban, vitality, supportability and configuration arranging, and works in conjunction with many
brilliant city SaaS stages, for example, Cityzenith[10].
5) Modular Construction:this is similar to a car-hybrid for the home-building industry. In terms of cots, these types of homes are cheaper and superior in quality to homes built on stocks. The moment they are built, they may not be distinguished from the conventional structures. The use of CAD technology helps the Architects and Building Engineers to customise the flooring and produce sheets specifications to the requirements of clients [11]. This type of construction limits disruptions to environmental degradation, and has strong sustainability benefits
6) .
Figure 3: Example of Modular Construction Source: https://www.raconteur.net/wp-content/uploads/2015/06/modular-construction.jpg

West African Journal of Industrial and Academic Research December 2016 v0l.17 58
7) Cloud Collaboration: BaseStone is a portable and web application worked for development groups to get to, catch and convey data; all through the venture, BaseStone digitizes and streamlines forms for venture delivery, and this is first of its kind, a computerized conveyance stage that the development business has since a long time ago merited[12]. Base-stone is a framework permitting the remote sharing of information on a development site continuously; it is prevalently an audit instrument for designers and modellers which digitizes the drawing survey handle on development extends, and takes
8) into consideration better coordinated effort[10]. The cloud-construct cooperation instrument is engaged with respect to the establishment of everything from steel bars to light fittings [10]. The framework is utilized to include "tangles", issues that occur amid development, on to pdfs, then clients can check or include notes through base-stone [10]. Trials have uncovered conceivable cost-reserve funds of around 60 for every penny contrasted and conventional paper-based review methods [10].
Figure 4: Description of BaseStone Software
Source: https://www.raconteur.net/wp-content/uploads/2015/06/basestone.png
9) Asset Mapping: Asset mapping centres around operational hardware, including warming and ventilating, lighting and security frameworks, gathering information from serial numbers, firmware, building notes of when it was introduced and by whom, and consolidates the information in one place. The framework can indicate designs progressively on a guide where the hardware should be introduced and, once the
benefits are associated with the constant framework utilizing the web of things, these can be checked by means of the web, application, and other remote gadgets and frameworks. It helps clients assemble databases of benefit execution, which can aid proactive building support, and furthermore decrease building acquisition and protection costs
10) .

West African Journal of Industrial and Academic Research December 2016 v0l.17 59
Figure 5: Asset Mapping Source: https://www.raconteur.net/wp-content/uploads/2015/06/asset-mapping.jpg Building Construction Innovations Through Modern Technology Innovation is a concept that helps improve an existing process, by-product, or system. Innovation also involves a change from applying new ideas to a process that can be systematically controlled, managed, and measured. Building industries have witnessed the following innovations recently: Kinetic footfall, Photovoltaic Glazing, Thermal Bridging and Self-healing Concrete, Kinetic Roads, Predictive Software, 3D Modelling, Modular Construction, Cloud Collaboration, and Asset Mapping.
1) Kinetic Energy:The technology in this innovative area is being developed and perfected. Meanwhile, Pavegen is a company that renders by harnessing footsteps energy using the flooring capability [13]. This kind of flooring can be done indoors or traffic-concentrated areas whereby electricity can be generated from footballers and pedestrians by induction process of electro-magnetism. In other to store the energy being generated, flywheels were developed. In Figure 6a, it is a woollen roller coaster that illustrates how energy is stored in a rotational motion
2) .
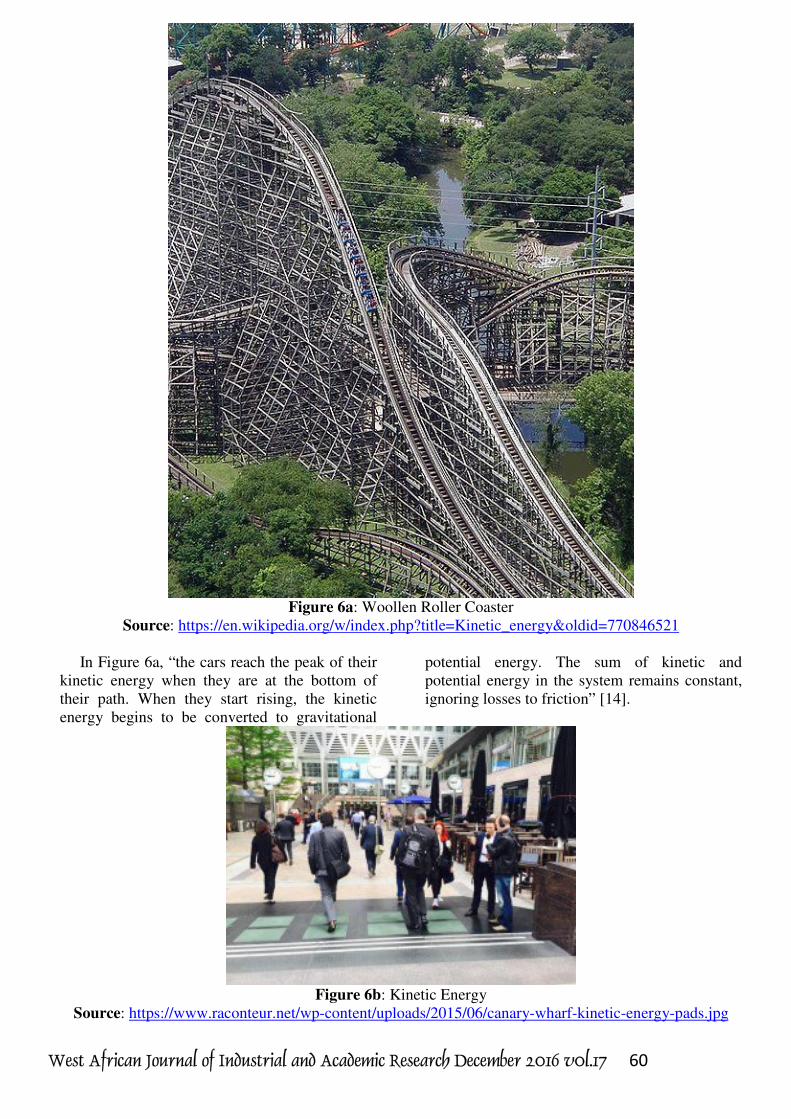
West African Journal of Industrial and Academic Research December 2016 v0l.17 60
Figure 6a: Woollen Roller Coaster
Source: https://en.wikipedia.org/w/index.php?title=Kinetic_energy&oldid=770846521 In Figure 6a, “the cars reach the peak of their kinetic energy when they are at the bottom of their path. When they start rising, the kinetic energy begins to be converted to gravitational
potential energy. The sum of kinetic and potential energy in the system remains constant, ignoring losses to friction” [14].
Figure 6b: Kinetic Energy
Source: https://www.raconteur.net/wp-content/uploads/2015/06/canary-wharf-kinetic-energy-pads.jpg
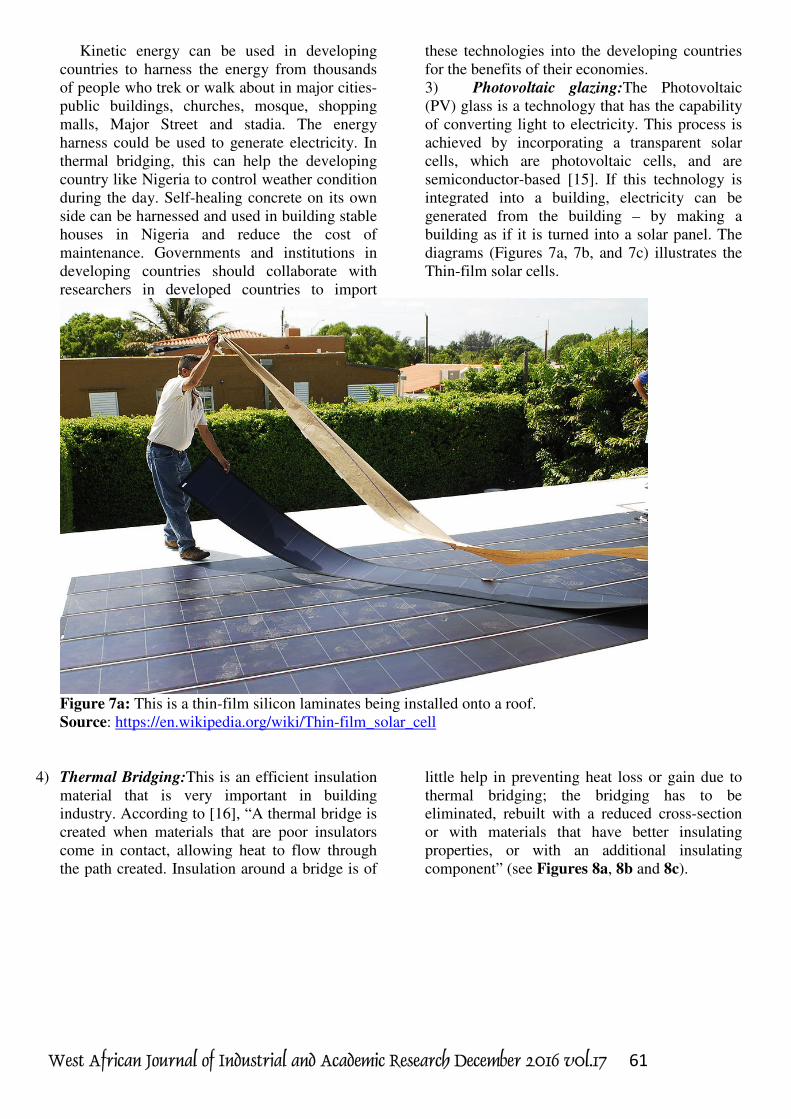
West African Journal of Industrial and Academic Research December 2016 v0l.17 61
Kinetic energy can be used in developing countries to harness the energy from thousands of people who trek or walk about in major cities-public buildings, churches, mosque, shopping malls, Major Street and stadia. The energy harness could be used to generate electricity. In thermal bridging, this can help the developing country like Nigeria to control weather condition during the day. Self-healing concrete on its own side can be harnessed and used in building stable houses in Nigeria and reduce the cost of maintenance. Governments and institutions in developing countries should collaborate with researchers in developed countries to import
these technologies into the developing countries for the benefits of their economies. 3) Photovoltaic glazing:The Photovoltaic (PV) glass is a technology that has the capability of converting light to electricity. This process is achieved by incorporating a transparent solar cells, which are photovoltaic cells, and are semiconductor-based [15]. If this technology is integrated into a building, electricity can be generated from the building – by making a building as if it is turned into a solar panel. The diagrams (Figures 7a, 7b, and 7c) illustrates the Thin-film solar cells.
Figure 7a: This is a thin-film silicon laminates being installed onto a roof. Source: https://en.wikipedia.org/wiki/Thin-film_solar_cell
4) Thermal Bridging:This is an efficient insulation material that is very important in building industry. According to [16], “A thermal bridge is created when materials that are poor insulators come in contact, allowing heat to flow through the path created. Insulation around a bridge is of
little help in preventing heat loss or gain due to thermal bridging; the bridging has to be eliminated, rebuilt with a reduced cross-section or with materials that have better insulating properties, or with an additional insulating component” (see Figures 8a, 8b and 8c).

West African Journal of Industrial and Academic Research December 2016 v0l.17 62
Figure 7b: This thin-film laminates on rooftops
Source: https://en.wikipedia.org/wiki/Thin-film_solar_cell
Figure 7c: This is the CIS Tower in Manchester, England was clad in PV panels at a cost of £5.5 million.
It started feeding electricity to the National Grid in November 2005. Source: https://en.wikipedia.org/wiki/Building-integrated_photovoltaics

West African Journal of Industrial and Academic Research December 2016 v0l.17 63
Figure 8a: Temperature distribution in a thermal bridge
Source:http://www.constructivedetails.co.uk/the-concept-of-a-psi-value/
Figure 8b: This thermal image shows a thermal bridging of a high-rise building
Source: https://en.wikipedia.org/wiki/Thermal_bridge
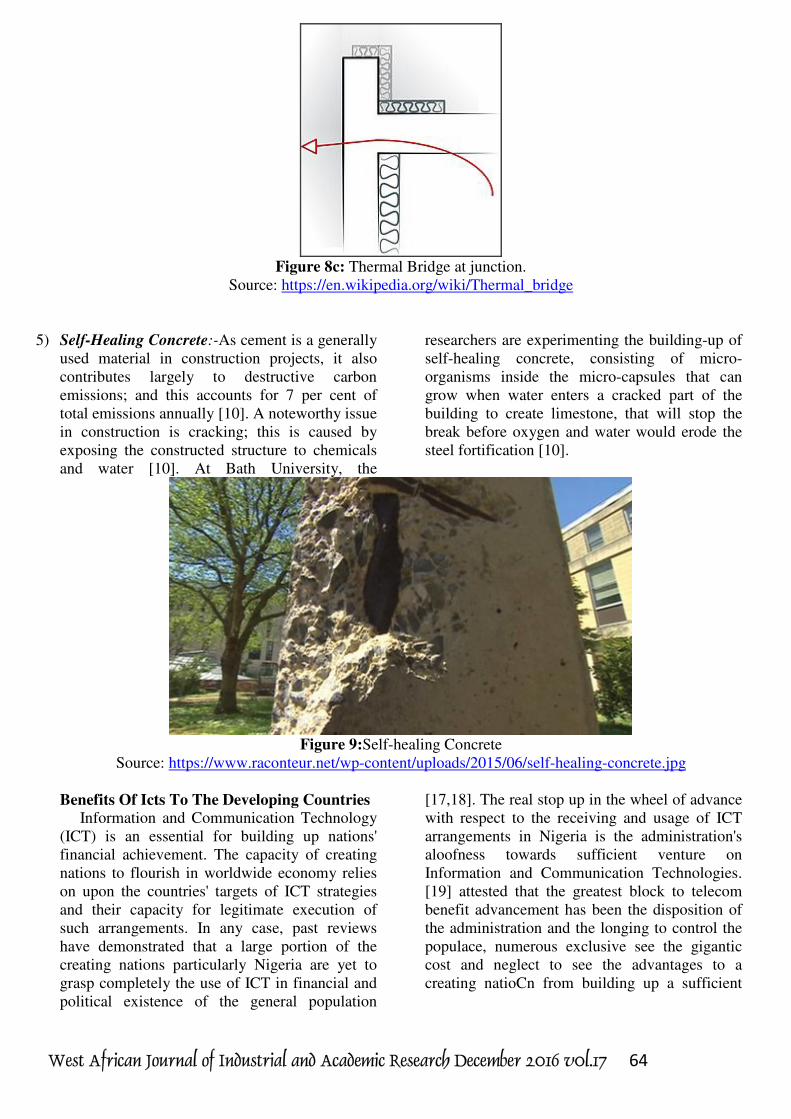
West African Journal of Industrial and Academic Research December 2016 v0l.17 64
Figure 8c: Thermal Bridge at junction.
Source: https://en.wikipedia.org/wiki/Thermal_bridge
5) Self-Healing Concrete:-As cement is a generally used material in construction projects, it also contributes largely to destructive carbon emissions; and this accounts for 7 per cent of total emissions annually [10]. A noteworthy issue in construction is cracking; this is caused by exposing the constructed structure to chemicals and water [10]. At Bath University, the
researchers are experimenting the building-up of self-healing concrete, consisting of micro-organisms inside the micro-capsules that can grow when water enters a cracked part of the building to create limestone, that will stop the break before oxygen and water would erode the steel fortification [10].
Figure 9:Self-healing Concrete
Source: https://www.raconteur.net/wp-content/uploads/2015/06/self-healing-concrete.jpg Benefits Of Icts To The Developing Countries Information and Communication Technology (ICT) is an essential for building up nations' financial achievement. The capacity of creating nations to flourish in worldwide economy relies on upon the countries' targets of ICT strategies and their capacity for legitimate execution of such arrangements. In any case, past reviews have demonstrated that a large portion of the creating nations particularly Nigeria are yet to grasp completely the use of ICT in financial and political existence of the general population
[17,18]. The real stop up in the wheel of advance with respect to the receiving and usage of ICT arrangements in Nigeria is the administration's aloofness towards sufficient venture on Information and Communication Technologies. [19] attested that the greatest block to telecom benefit advancement has been the disposition of the administration and the longing to control the populace, numerous exclusive see the gigantic cost and neglect to see the advantages to a creating natioCn from building up a sufficient

West African Journal of Industrial and Academic Research December 2016 v0l.17 65
broadcast communications framework. Therefore, some of these benefits include:
1) Globalization- this involves activities of interacting and integrating among individuals, organisations, and governments institutions in different countries. This action is driven by locally and internationally-based trade with the aid of Information Technology [20].
2) Repetitive Operation- through the copy command in computer aided design (CAD) one object can be duplicated as many times as possible. A drawing can be copied, pasted and adjustment made instead of repeating the drawing all-over again.
3) Speed- computerization of standard procedures can speed up day-to-day operations. These procedures include: billing, inventory and tracking. In banks, workers can check their account any time even at home. In engineering, robot work all nights.
4) Crime Detection- Closed circuit television (CCTV) a product of ICT is used in crime detection when mounted at a strategic locations in cities, market, churches, highways and public buildings.
5) Cashless Economy- the use of automatic teller machine (ATM), instant money transfers, e-payment systems, electronic wallet have given rise to cashless economy. ICT has enabled instant money transfer by people without going to the bank.
6) Job Opportunities- ICT has created new jobs globally and in developing countries, such jobs include: website designs, cyber security management, web hosting, use of e-mail addresses, softwaredevelopers, online advertisement, online shopping, e-book publications, just to mention but a few.
7) Sharing of Data- ICT has made it possible for people working on different packages or software to import or export information using ICT related gadgets. Challenges Of Usingict In A Developing Countries n every technological development, there are challenges that could hinder the progressive utilisation of such technology. One of the major challenges of ICT utilisation is the inability to effectively communicate, interact and engage with others online. Others include illiteracy, lack of adequate skilled workers, lack of capital, irregular power supply, political instability, vision syndrome, etc.
1) Illiteracy-majority of people in developing world
are not computer literate and cannot utilize or enjoy the benefits of ICT. Even when some people are educated, they still behave like illiterates when it comes to the use of computer and its allied devices.
2) Skilled Workers-skilled work force that will translate their genuine efforts into realizing in practical terms the sophisticated information based and modern means of construction is a big problem to the developing countries. Another problem is effective collaboration and coordination of workers (building team) during construction as a result of inadequacy of ICT facilities [21].
3) Lack of Capital-ICT cannot be utilized without computers and network systems, financial capital is highly needed to be able to adapt, develop and utilize ICT in its fullest capacity.
4) Power Supply-Information and Communication Technology cannot be used without electricity. The epileptic power supply in our country has made the use of ICT difficult even to the literate ones.
5) Political Instability-soldier come soldier go is the case in Nigeria political situation. Each government comes with new policies instead of developing the one on ground. Abandoned projects become the other of the day, because no government has focus enough to think about the new era which is ICT and even when in the blue print, the subsequent governments tend to frustrate efforts of the previous government thereby making the consolidation on ICT difficult.
6) Vision Syndrome- this is one of the symptoms associated with infrequent blinking of eyes and problem of focusing on an image that is tiny. The user of computers blinks less while using computer which causes dryness of the eyes and poor focusing [6]. Conclusion ICT in building construction can be used in developing countries to improve construction methods and reduce cost. The use of innovation in modern building construction should be encouraged by developing countries through collaboration with researchers in developed countries and globalization. Kinetic, thermal bridging and use of self-healing concrete in buildings will help to produce electricity and

West African Journal of Industrial and Academic Research December 2016 v0l.17 66
improve maintenance of buildings respectively. Despite the obvious challenges of ICT utilization in building design and construction, developing
countries will benefit more from using ICT in construction if fully embraced.
References
[1] Adebayo, P.A. (2011). Investment in Information and Communication Technology and Financial Institutions Earnings: An Appraisal of Nigerian Commercial Banks Journal of the Management
Sciences Nnamdi Azikiwe University Awka Vol II (3) 33-46. [2] Ugwuwoti, P.E. (2015). Relevance of Information Communication Technology to Accounting Education
in 21st Century. Journal of Research in Science and Technology Education 5(1) pp 149-152. [3] Umoke, C.C. and Esheya, S.E. (2015). ICT Facilities: Solutions to the Problem of Digital divide among
students in Public Secondary Schools in Nigeria. Journal of Research in Science and Technology
Education 5(1) pp 1-5. [4] Anigbo, L.C and Orie, M.J. (2015). Information and Communication Technologies: Impression of Science
Lecturers in the South-South Zone of Nigeria. International Technology Research Journal (INTERJ). 3(1), 248-254.
[5] Akpan, G.A., Ebieme, O.E. and Akaenang M.S. (2014). Information and communication Technology ICT Education: A Panacea for Youth Restiveness in Nigeria. Nigeria Vocational Association Journal 19(2), 210-219.
[6] Ngene, N.J. and Ekemezie, W.N. (2004). Computers and Information Technology. Agbani Enugu: San Press Limited.
[7] Understandcontruction.com (2017). Construction Technology. Retrieved March 25, 2017, from http://www.understandconstruction.com/construction-technology.html
[8] Ansys. (2017, March 4). In Wikipedia, The Free Encyclopedia. Retrieved 12:37, March 25, 2017, from https://en.wikipedia.org/w/index.php?title=Ansys&oldid=768523327
[9] Building Information Modelling. (2017, March 24). In Wikipedia, The Free Encyclopedia. Retrieved 13:03, March 25, 2017, from https://en.wikipedia.org/w/index.php?title=Building_information_modeling&oldid=771916804
[10] Jackson, F. (2015). Top Ten Construction Innovations. Retrieved March 25, 2017, fromhttps://www.raconteur.net/business/top-ten-construction-innovations
[11] Express Homes Inc., 2017). Modular Construction. Retrieved March 25, 2017, from https://expressmodular.com/modular-construction/
[12] BaseStone.io. (n. d.). BaseStone. Retrieved March 26, 2017, from https://basestone.io/ [13] PaveGen. (2017, March 10). In Wikipedia, The Free Encyclopedia. Retrieved 03:56, March 26, 2017,
from https://en.wikipedia.org/w/index.php?title=PaveGen&oldid=769584286 [14] Kinetic energy. (2017, March 17). In Wikipedia, The Free Encyclopedia. Retrieved 04:12, March 26,
2017, from https://en.wikipedia.org/w/index.php?title=Kinetic_energy&oldid=770846521 [15] TechTarget. (2017). Photovoltaic glass (PV glass). Retrieved March 26, 2017, from
http://whatis.techtarget.com/definition/photovoltaic-glass-PV-glass [16] Thermalbriding.com (2009). Thermal Bridging. Retrieved March 26, 2017, from
http://thermalbridging.com/ [17] Browery, K. (1995). Africa; Missing Link? Telecommunications. Vol 29, No 10. [18] Anie, S.O. (2007). Rural Telephony: Challenges before the Nigerian TelecomStakeholders and the
Citizenry. The Information Technologist. Vol 4; No 2. [19] Lee, C.R. (1993). Achieving Global Connectivity. Directors and Boards. Vol 17.No. 2. Winter. [20] Okechukwu, E. (2015). Global Economic Environment. Ph.D Business Administration Lecture note
Department of Business Administration, Enugu State University of Science and Technology (ESUT)
Enugu.
[21] Yang, J.V. and Ravi, S. (2007). Managing Building Projects through Enhancing Communication. An ICT
Based Strategy for Small and Medium Enterprises. Publications of World Building congress 2007, pg 2344-2355. Retrieved from http://eprints.gut.edu.au/15565/1/1565pdf August (2016).

West African Journal of Industrial and Academic Research December 2016 v0l.17 67
ICT in Teaching Mathematics: Nigerian Teachers’ perspective
1Kevin C. Anaeche &2Babatunde Bayodele Olofin, 3Nnamani Francis Onah
1,3Department of Science and Computer Education (Mathematics Education)
Enugu State University of Science & Technology, PMB 01660, Enugu, Nigeria 1Cell: +2348064292180; Email: [email protected]
3Cell: +2348064771939; Email: [email protected]
2Department of Computer Science,
Enugu State University of Science & Technology, PMB 01660, Enugu, Nigeria 2Cell: +2348033215972; Email: [email protected]
Abstract
The use of Information Communication Technology (ICT) in teaching Mathematics: Nigerian
teachers’ perspective formed the basis of this study. The study was designed to find out the perception
of secondary school Mathematics teachers about the use of ICT in teaching Mathematics. The study
specifically centred on finding the need of enhancing teacher education programme so as to serve as
an avenue of improving teachers’ perception and orientation on ICT in Mathematics teaching. It also
sought for the most common ICT applications available for Mathematics teachers to use. Barriers to
the integration of ICT were also examined. The study adopted a survey design. A sample size of 180
was used. This comprises of Mathematics teachers who were randomly selected from secondary
schools in Enugu state – the area of the study. The questionnaire used for data collection had 26 items
which covered the scope of the study. The data collected were analysed with mean score with a bench
mark of 2.50. Among the findings made were that Mathematics teachers were found to be enthusiastic
about the application of ICT in Mathematics teaching but only few were already incorporation it in
their teaching. Most Mathematics teachers were discovered to be willing and ready to integrate ICT in
their teaching. Again the most common ICT applications used by the few teachers who are already
making effort to integrate ICT into their teaching include: word processing packages, spreadsheet,
drill/practice tutorials and graphic applications. These applications are less technical and easy to
manipulate. Among the leading barriers to the ICT usage in secondary school Mathematics teaching
as found out in the study were: lack of enough technical skills for ICT projects, poor electricity power
supply in schools and lack of Mathematics laboratories with ICT facilities. Owning to the findings, the
following recommendations were madethat: Mathematics teachers should be encouraged to embrace
the new method of teaching (use of ICT) and pursue it with all the zeal it deserves; in-service training,
especially on ICT usage in Mathematics lesson be made compulsory for all Mathematics teachers;
seminars and conferences be organized by experts for teachers, especially Mathematics teachers on
ICT usage in teaching; and state government should make frank efforts to provide all the necessary
facilities and equipment for the proper ICT usage in teaching secondary school Mathematics. Keywords: Challenges, Curriculum ICT, Mathematics, Teachers, Teaching, Training Introduction The bedrock of all science related courses is usually credited to Mathematics. It is the foundation of all technological advancement. Being aware of this, the federal government of Nigeria through the National Policy on Education [1] maintained the compulsory nature of Mathematics in all levels of education up to tertiary level (though as a general course at the tertiary level). Owning to this, the government, at all levels is making serious effort to provide high quality Mathematics
education. It is worthy of note that recognizable attempts, by various stake holders, have been made in the past to enhance Mathematics teaching and learning of Mathematics. One of the laudable attempts made was to introduce ICT usage in the teaching and learning in secondary schools. [2] cited that “technology is essential in teaching and learning of Mathematics; it improves the way Mathematics should be taught and enhances students’ understanding of basic concepts” It is

West African Journal of Industrial and Academic Research December 2016 v0l.17 68
obvious that researches have been conducted on the benefits of ICT usage in Mathematics. According to [3], the key benefits include: “ICT promotes greater collaboration among students and encourages communication and sharing of knowledge; ICT gives rapid and accurate feedbacks to students and this contributes towards positive motivation; it also allows them to focus on strategies and interpretation of answers rather than spend time on tedious computational calculations; ICT also supports constructivist pedagogy, wherein students use technology to explore and reach an understanding of mathematical concept” Buttressing the points, [4] said that higher order thinking can be promoted through the use of technology and this helps to improve their strategies for problem solving. This is indeed in consonance with the recommendations forwarded by the Mathematics Association of Nigeria (MAN) after its 2015 national conference in Enugu state. This implies that students would use more of technology to solve problems instead of manual way of problem-solving. This can only be achieved if the teachers who are the interpreters of the policy in the classroom are very much positive about the ICT usage in their instruction. That is, if the teachers’ perspective about ICT usage is in tandem with the policy, then, the policy can be sustained. This is in agreement with the famous aphorism that “no nation can rise above the standard of her teachers”. No wonder [5] opined that the teacher implements any curriculum material and hence determines to a large extent the success or failure of any teaching and learning process. Supporting the idea, [6] in [5] stated that the teacher is the key to the success or otherwise of the child in and outside the school learning. This can be achieved depending on the teachers’ perspective on the use of ICT which is now advocated for in order to make better Mathematics teaching and learning. As already noted, [1] places emphasis on acquisition of skill, being creative and having the attitude of enquiry and problem solving. It also aims at the development of ability and willingness in the students of carrying out experiments using various mathematical theories and operations. In addition to the reform to meet the demands of modern society, the policy emphasized the ICT for teaching of Mathematics. It is therefore targeted at meeting
the standard expected of Mathematics in various parts of the world. PROBLEM STATEMENT However, in spite of the expectations of this policy document, i.e., ICT being used in the secondary school Mathematics learning, there are indications that point to the fact that computers are not widely used into Nigerian secondary school Mathematics. For ICT to be successfully used in the secondary school Mathematics curriculum, it is good for the teachers to have a clear knowledge of the available software packages they can use in their day-to-day teaching of Mathematics [4]. In a study conducted by [7], “61% of the respondents (Teachers) use spread sheets, 45% used word processing and 30% used internet browsers. In the same survey, it was found that 19% used Geometer’s Sketchpads, 19% used CD ROMs that accompanied Mathematics textbooks, 18% used Graphmatica, 14% used Mathematics Blaster and 8% used other mathematics-specific software” Apart from the lack of knowledge of the available software packages usable by Mathematics teachers, a good methodical knowledge on how to those software, is another issue of concern on the teachers’ perception of Mathematics teaching through the use of ICT in secondary schools. Furthermore, [8] discovered that there exist seven barriers to the use of ICT in a Mathematics lesson. These include the following: ‘Lack of confidence among teachers during integration (21.2% responses), lack of access to recourses (20.8%); lack of time for the integration (16.4%); lack of effective training (15.0%); facing technical problems while the software is in use (13.3%); lack of personal access during lesson preparation (4.9%); the age of the teacher (1.8%)” Furthermore, [9] pointed out that in despite of government efforts, the way Mathematics is presented is yet to change. This is evidenced in the consistent poor performance of students in Mathematics at the secondary school level. Several studies conducted by many authors on the poor performance of secondary school students, especially in the Senior Secondary School Certificate Examination (SSSCE), revealed that failure rates in Mathematics have been dramatically high. It is very obvious that many researches have been carried out to explain the reason for this consistent mass failure of students in

West African Journal of Industrial and Academic Research December 2016 v0l.17 69
Mathematics. For instance, a study in other Sub-Sahara African suggests reasons for poor students’ performance in Mathematics: “Poorly-resourced school; large class; a curriculum hardly relevant to the daily lives of students; a lack of qualified teachers; and inadequate teacher education programmer” [10]. More so, some other studies dwelt much on the possible ways to solve this problem without considering the teachers’ perception on ICT usage in Mathematics teaching in secondary school. For instance, a report on Developing Science, Mathematics and ICT(SMICT) Education in Sub-Saharan Africa suggested that teachers should change their role as mere presenters of knowledge with the use of drill a student centred and participatory teaching & learning [10]. This is in compliance with the National Policy on Education [1] which suggests that “teachers should start every lesson with a practical problem to help students acquire the habit of analytical thinking and the ability to apply knowledge in solving practical problem and also make use of the calculator and computer (ICT) for solving and investigation of real life situations” On the whole, this new method of teaching and learning of Mathematics in secondary school requires more than expectations contained in the policy. It also requires more than finding out numerous factors responsible for the poor performances of the students in Mathematics in secondary school. It has more to do with the perception of the teachers on ICT usage in teaching Mathematics. The teachers who interpret the policy seem to be passive in the use of ICT in the class. This is why this study was geared towards finding the perception of Nigerian Mathematics teachers in the use of ICT in improving the teaching and learning of Mathematics. It is quite true that some schools, especially private schools in Enugu state, have invested more money in procurement of computer and establishment of computer labs, but it is still doubtable whether these computers are put to adequate use by teachers in their instructions. Thus, the issue of whether there is need for Mathematics teachers to be trained on how to effectively use ICT in their daily teaching routines, becomes a point of attraction [9]. Therefore, this study specifically sought to find out:
1) If enhancing teachers’ education programmes would enhance teachers’ perception in teaching of Mathematics through the use of ICT.
2) The most common ICT applications used by Mathematics teachers in their instructions.
3) The barriers to the use of ICT in Mathematics teaching. SIGNIFICANCE OF THE STUDY The importance of this study was for a clear understanding of the need for integration of ICT in Mathematics teaching and learning to both the teachers and the students. It will also educate the Mathematics teachers on the most common ICT applications and how they are used in the classroom. This would certainly, if properly adhered to, change for good the perception of Mathematics teachers on the use of ICT in of Mathematics teaching. Finally, this study would reveal the barriers to the use of ICT in improving Mathematics teaching and learning. RESEARCH QUESTIONS
The researcher formulated the following research questions to guide the study:
1) What are the needs of enhancing the teacher education programme so as to improve the perception of Mathematics teachers on ICT usage in teaching secondary school Mathematics?
2) What are the most common ICT applications used by Mathematics teachers in the classroom?
3) What are the possible challenges of ICT usage in Mathematics teaching in secondary schools? TEACHER EDUCATION PROGRAMME FOR MATHEMATICS TEACHERS
Among other goals, [1] stated that “teacher education shall provide teachers with the intellectual and professional background adequate for their assignment and to make them adaptable to changing situation”. Apart from all teachers in educational institutions being professionally trained, the policy went further to say that teachers’ education programs “shall be structured to equip teachers for the effective performances of their duties” The policy went further to maintain that information Technology (IT) training shall be incorporation into all teachers training programs. Against this backdrop, the policy expects that all teachers, especially Mathematics teachers, in attempt to adapt to the changing technological world, should be ICT complaint. That is, they should have positive perception on ICT usage in teaching Mathematics. This will

West African Journal of Industrial and Academic Research December 2016 v0l.17 70
in turn help them to teach students to learn the mathematical skills, values, understanding, aptitude, attitudes and insights; needed to succeed in their careers of choice and daily living. According to [9], “this policy is based on the premises that all students can learn Mathematics and that all need to learn Mathematics” The students are expected at senior secondary school level to acquire the necessary mathematical skills so as to apply their knowledge in the solution of everyday problem. Secondly, they are expected to be able to further their education is such areas as Mathematics, Sciences, Engineering, Medicine, Commerce, Industry and other related professions.
The expectation of secondary school Mathematics placed a lot of implications for teachers’ education program. Therefore, in order to meet the target of the [1], i.e. the teachers being able to integrate ICT for the improvement of Mathematics teaching, much emphasis needs to be laid on the perception of teachers on ICT usage in teaching Mathematics. At the moment, ICT is yet to be fully integrated into teacher education programme. If this is done, teachers’ perception of the use of ICT in secondary school Mathematics teaching can be improved. Since some of the Mathematics teachers did not have the opportunity of being exposed to ICT training during their teacher training days, in-services training is advocated for, in order to fill in the gap and change their perception about ICT usage in teaching exercise. Most Common Ict Applications Packages Used In The Classroom By Mathematics Teachers
The ICT usage in teaching and learning of Mathematics in school is still sounding strange to many, including some Mathematics teachers. The reason for this ugly situations ranges from not being trained in ICT during their teacher training days; to lack of knowledge of possible ICT application to be used in a classroom situation. Some example of ICT applications used in classroom include, portable, graphic calculators and computerized graphing, specialized software, programmable, Drill/practice tutorials, internal activityand computer in general. Studies have shown that these applications enhance Mathematics teaching and learning. For [11], pupils can gather and
manipulate data with potables devices with the aid of databases and spreadsheet which are used for numerical work. With the use of portable devices for the study of Mathematics, fieldwork can be possible instead of only classroom activities. In the separate studies conducted by [12,13,14], it was observed that using calculators (graphic) and computerized graphing in Mathematics can hasten the processes involved in graphing; thereby making it easier for people to analyse and delineate the relationship between data.
[14,12] further stated that “Specialist software such as Computer Algebra System (CAS), Dynamic Geometry System (DGS) and Mathematics Curriculum software improvespupils’ skills and understanding in algebra, allow pupils to manipulate and measure shapes leading to higher level of learning among them”. Programmable toys or floor robots are among the first application of ICT to Mathematics. These programmable toys are controlled by software on programming.It has been reported that wherever this software is used, tremendous changes are also recorded teaching of Mathematics [3]. Logo on its own helps pupils to acquire problem solving skill, improves their thinking abilities, especially mathematical thinking and finally learn the concept of geometry[12].
Finally, ICT encourages practical method of teaching which gives the students the opportunity to understand Mathematics concept. According to [2], “this approach promotes higher order thinking and better problem solving strategies”. Owning to this, teachers can make maximum use of the relevance of ICT in teaching and learning of Mathematics so as to achieve the set goals and objectives. BARRIERS TO ICT USAGE IN THE CLASSROOM
Several studies have been conducted on the challenges to the use of ICT and change of orientation andMathematics teachers’ perception on ICT usage in the Mathematics teaching in secondary schools. As already stated earlier, [8] identified seven factors to be responsible for this. These include:
1) The age of the teacher 2) Inaccessibility of computer during lesson 3) Inadequate on the time timetable for the use of
ICT in the classroom 4) Lack of technical know-how especially if the
software is in use

West African Journal of Industrial and Academic Research December 2016 v0l.17 71
5) Low confidence among teachers during classroom instruction with ICT.
6) Lack of effective training 7) Lack of access to resources
Similarly, [15]in their own study discovered the following as the barriers to the use of ICT in Mathematics teaching: “lack of computer, lack of quality software, lack of time, technical problems, teachers’ attitude (perception) towards computers, poor funding, lack of teacher confidence, resistance to change, poor administrative support, lack of teacher skills, poor fit with curriculum, scheduling difficulties, poor training opportunities, and lack of vision as to how to integrate ICT in instruction”. Frthermore, low competencies and access level of ICT facilities by both Mathematics teachers and students are the leading barriers (after lack of electricity power supply) to ICT usage in Mathematics teaching and learning. Again, another inexcusable factors are lack of maintenance culture and theft in the society in general. When all these things areput in check, then, the perception of Nigerian Mathematics teachers in using ICT in secondary school Mathematics becomes a hard knock to crack. This is why this study was so imperative so as to ascertain the perception of the teachers who are going to be key partners in solving all other barriers facing the integration of ICT in secondary school Mathematics.
Methods This study used a survey research design to examine the Nigerian Mathematics teachers’ perception in ICT usage in secondary school Mathematics in Enugu State. This design was considered appropriate owning to the fact that it was meant to collect opinions of Mathematics teachers using a sample, on their perception about ICT usage in secondary school Mathematics. This is in line with what [16] described survey design to be. That is “a method of gathering information from a sample of individuals”. This sample represents the entire population under study. The study was conducted in Enugu state. A sample of 180 secondary schools Mathematics teachers was randomly selected for the study. The researcher employed a structured 26 itemed-questionnaire for data collection from the respondents. The questionnaire used a four Likert scale which has the following responses: Strongly Agreed, Agreed, Disagreed and Strongly Disagreed. Appropriate experts in Mathematics Education and Measurement & Evaluation in Enugu State University of Science and Technology, (ESUT) validated the instrument. The reliability of the instrument was 0.87. This was adjudgedas highly reliable. The data so collected were analysed with mean score with a bench mark of 2.5. This implies that any mean value below 2.5 is considered negative while any mean value equal or above 2.5 is considered positive.
Result Analysis
Table 1 – Response on the Mathematics Teachers perception on ICT usage S/N Items
SA Response A
D
SD
X
1 I fully use ICT in my teaching programmes 28 31 76 45 2.23 2 I use ICT in my specific units of instruction 40 58 51 31 2.99 3 I frequently use ICT with the students 42 39 61 38 2.47 4 I have not used ICT before in my teaching 48 41 56 35 2.57
Grand mean 2.56
From table 1 above, the mean value of 2.23 of item 1which is less than the bench mark value of 2.50 indicates that ICT has not been fully integrated into Mathematics instruction in secondary school. The situation is quite different in item 2 with mean value of 2.99; where those who have made attempt of integrating ICT into Mathematics instruction, have gone to the extent of including it into the specific instructional units. Furthermore, item 3 shows that Mathematics teachers do not use
ICT frequently with the students. The mean value of 2.47 is an indication of this. On the last item, however, the mean value shows that Mathematics teachers have used ICT but not to a great extent due to certain barriers. On the whole, the grand mean concluded that though ICT has not been fully integrated by Mathematics teachers, efforts are being made by them to embrace the change. This implies that they have open mind towards ICT usage in Mathematics

West African Journal of Industrial and Academic Research December 2016 v0l.17 72
teaching in secondary schools. Table 2 – Most common application packages on ICT for Mathematics teachers
S/N Items Resp
As a Mathematics teacher, I have used the following in my teaching:
SA A D SD X
1 Word processing packages 40 58 51 31 2.99 2 Portable 26 23 54 77 1.99 3 Graphic calculator 56 66 34 24 2.86 4 Spreadsheet 48 41 56 35 2.57 5 Simulation programmes 23 32 58 67 2.06 6 Drill/practice tutorials 58 49 40 33 2.73 7 Internet activity 42 39 61 38 2.47 8 Graphical applications 47 63 39 31 2.70 9 Databases 24 53 64 39 2.34 10 Flash presentations 28 31 76 45 2.23 11 Desktop publishing 37 41 59 43 2.40
Grand mean 2.48
In table 2 above, teachers expressed their level of usage of most common applications for Mathematics instruction. Such applications like word processing (item 1), graphic calculator (item 3), spreadsheet (item 4), drill/practice tutorials (item 6) and graphical applications (item 8) were the most commonly used by the few Mathematics teachers who attempted integrating ICT into teaching of Mathematics. This is evidenced by the mean value
of all these items which are all above 2.50. The table 2 also indicates that every other application was not frequently used by the teachers in their Mathematics instruction. Their mean values are all below 2.50. On the whole, the grand mean indicates that most of the applications for Mathematics instruction are not frequently used by the teachers. The response also indicates lack of knowledge of such applications.
Table 3 – Response on the challenges to ICT usage in the classroom
S/N Items Resp.
As a Mathematics teacher, I face the following barriers in using ICT in my teaching:
SA A D SD X
1 Lack of Available computer software 60 46 47 27 2.77 2 Inadequate time in the school timetable for
ICT usage 61 45 31 43 2.69
3 Lack of enough technical know-how for ICT projects
68 66 43 3 3.11
4 Lack of training for teachers onICT usage 71 41 24 44 2.80 5 Poor knowledge of how to use ICT to
improve curriculum 57 62 41 20 2.87
6 Lack of auxiliary teachers or substitutes when teachers go for training
58 49 40 33 2.73
7 Inaccessibility of necessary technology by the students at home
42 39 61 38 2.47
8 Inaccessibility of necessary technology by the teachers at home
47 63 39 31 2.70
9 Lack of electricity power supply in schools 78 67 21 14 3.16 10 Lack of Mathematics laboratories with ICT
facilities 78 56 31 15 3.09
11 Lack of maintenance due to bureaucracies 59 43 37 41 2.67
Grand mean 2.82
In table 3 above, all the 11 items amounted to the noticeable challenges to ICT usage in Mathematics instruction. The mean values indicate that the chief barriers include: Lack of enough technical know-how for ICT projects,
lack of electricity power supply in schools and lack of Mathematics laboratories with ICT facilities. The grand mean value of 2.82 is a serious over all indication that ICT integration into Mathematics instruction in secondary

West African Journal of Industrial and Academic Research December 2016 v0l.17 73
school is facing a lot of challenges and setbacks. These barriers account for the Mathematics teachers ill-feeling and rigid to the change brought in by ICT. Conclusion And Recommendations
The use of ICT in secondary school Mathematics teaching in Nigeria, especially in Enugu state, has been advocated for by all concerned. Many approaches have been followed to see that it becomes a reality. Teachers are the vehicle of curriculum implementation and no amount of effort made that will be effective without the teachers having a positive attitude towards the change. In this study therefore, it has been found out the ICT was yet to be fully integrated into the teaching of Mathematics in secondary schools in Enugu state. It was also discovered that the teachers of Mathematics showed readiness and open mind to accept the use of ICT in their Mathematics instruction. This readiness was shown on the way few teachers who already have access to ICT incorporated it in their specific instructional units. Furthermore, this study revealed a lot of applications for Mathematics teaching which are unknown by the teachers. Many teachers have not used the known one in their instruction for the first time. This makes ways for apathy and lack of confidence discovered when ICT integration is mentioned. This situation was evidenced by the surprise shown by many teachers when they asked for the meaning of many of the applications indicated
for Mathematics instruction Finally, the study found out that there are so many challenges to ICT usage in the teaching of Mathematics. These challenges range from lack of available computer software, inadequate time in the school timetable for ICT usage, lack of training for teachers on ICT usage, poor knowledge of how to use ICT to improve curriculum,lack of auxiliary teachers or substitutes when teachers go for training to inaccessibility of necessary technology by the students at home. The chief of them all were: lack of adequate technical support for ICT projects, lack of electricity power supply in schools and lack of Mathematics laboratories with ICT facilities. These are the challenges Nigerian Mathematics teachers are facing in attempt to employ ICT usage in Mathematics teaching. Following the above discoveries, the following recommendation were made: that Mathematics teachers should be encouraged to embrace the new method of teaching (use of ICT) and pursue it with all the zeal it deserves; that in-service training, especially on ICT usage in Mathematics teaching be made compulsory for all Mathematics teachers; that seminars and conferences be organized for teachers by experts in the use of ICT in teaching, especially Mathematics teachers; and state government should make frank efforts to provide all the necessary facilities and equipment for the proper ICT usage in teaching Mathematics in secondary schools.
References
[1] National Policy on Education (2013). Federal Republic of Nigeria. Lagos: NERDC press.
[2] Ittigson, R. J & Zewe J.G (2003) Technology in the Mathematics Classroom. In Tomei L.A (Ltd). Challenges of Teaching with Technology across the Curriculum: Issues and solutions. Hershey: Information Science Publishing, 114-133.
[3] British Education Communications and Technology Agency. (BECTA) (2003). What Research
Says about using ICT in Mathematics. Retrieved December 19, 2016, from www.becta.org.UK/research
[4] Chong C.K. (2006). A Study on the use of ICT in Mathematics Teaching. Malaysian online
Journal of Instructional Technology (MOJIT). Vol.2, No3, PP 43-51. [5] Salman, M.F & Adeniyi, C.O. (2012). Influence of Teachers’ Qualification and Experience on
Secondary School Mathematics. ABACUS (Journal of Mathematical Association of Nigeria, (MAN),
37 (1), 134-141. [6] Morey, M. K. (1990). Status of science education in Illinois elementary schools. Journal of
Research in Science Teachers. John Wiley and sons. Inc.

West African Journal of Industrial and Academic Research December 2016 v0l.17 74
[7] Forgasz, H.J. & Prince, N (2002). Software Used for Maths Learning-reporting on a survey. Vinculum, 39(1), 18-19.
[8] Jones, A. (2004). A Review of the Research Literature on Barriers to the Uptake of ICT by Teachers. UK: Becta.
[9] Douglas D.A. (2010). ICT Use in the Teaching of Mathematics Implication for Professional
Development of Service Teachers in Ghana. Ghana: Springerlink.com. [10] Ottevanger, W., Van den Akker, J.J.H; & de Feiter, I. (2007). Developing Science, Mathematics and
ICT Education in Sub-Saharan Africa. (SMICT): Patterns and Promising Practices. Work Bank Working Paper (101), PP.1-84.
[11] Moseley, D. & Higgins, S. (1999). Ways Forward with ICT: Effective Pedagogy using Information and
Communication Technology for Literacy and Numeracy in Primary Schools. London: Teacher Training Agency.
[12] Clements, D.H. (2000). From excise and task to problems and project-unique contribution of computer to innovative Mathematics education. The Journey of Mathematics Behaviour. 19(1), 9-47.
[13] Hennessy, S. (2000). Graphing Investigations Using Portable (Palm top) Technology Journal
of Computer Assisted Learning. 16, 243-258. [14] Hennessy, S, Fung, P & Scanlon, E (2001). The Role of the Graphic Calculation in Mediating
Graphing Activity: International Journal of Mathematics for Education in Sciences and Technology,
32(2), 267-290. [15] Snoeyink, R., & Ertmer, P. A. (2002). Thrust into technology: how veteran teachers respond. Journal
of Educational Technology Systems, 30(10), 85–111. [16] Ozofor, N.M. (2012). Contemporary Research Designs and Methods volume 1. Enugu: Franklead Pub.
Co.

West African Journal of Industrial and Academic Research December 2016 v0l.17 75
. Video Conferencing: Most Effective Technology to Run Assemblies and Meetings for Large Audience Dispersed In
Distant Locations: Is It Feasible To Deploy in Nigeria?
Osuagwu O.E1., Ndigwe Chinwe2, Ihedigbo C3 , Suleiman U4.and Babatunde Olofi
1Department of Computer Science, Imo State University, Owerri 2Department of Computer Science, ODIMEGWU OJUKWU University, Anambra State
3Department of Computer Science , Michael Okpara University of Agriculture, Umudike1 4Department of Computer Science, Kaduna Polytechnic artment of Computer Science, Enugun~State University
Abstract Solutions to Current economic problems associated with national economic depression need be
approached from technology point of view. The cost of air and land movements have tripled in the last
few months with the attendant risk of accident, armed robbery attacks and vehicular breakdown. If
every member of staff, student or congregation can remain in his location and join lectures, meetings
and listen to sermons without the additional burden, cost of travelling, we think such a technology that
would make this feasible is friendly, economic and useful. Video conferencing technology, if
effectively deployed, can achieve the above goals. Videoconferencing is a technology developed to
conduct a conference between two or more participants at different sites by using computer networks
to transmit audio and video data The objetives of this paper is to present the need for its deployment,
the technology involved, the cost and how it can be implemented in Nigeria. Its deployment will make
life more meaningful and convenient, reduce costs and dangers of travelling as well as reduce the
number of hands needed to execute meeting. The eBaithak model has been adopted in this article.
Key words video conferencing mulyimedia data, protocols. Student motivation. Codec
1.0 Introduction What is Video-Conferencing (VC? It is a medium where two or more people at different locations can meet face-to-face in real time. Video conferencing technology is a communication technology that uses audio, video, and data streams and allows participants at disparate locations to interact with each other by creating a face-to-face meeting environment for easy collaboration [5] It offers new possibilities t connect with guest speakers and experts. VC can make relevant learning opportunities more accessible and exciting. The real benefits of Vc can come clearer with a simple illustration. Let us assume you are taken a group of students to an excvursion to inspect the of a fagal bus accident where over 100 passengers died. Students present at the site can ask pertinent questios about the accident and this is relayed to all waitng stations where the vc is linked n real tme.Thus
Videoconferencing provides students with the opportunity to learn with experts rich in knowledge and experience. Such experts are often in distant places, Videoconferencing provides students with an opportunity to observe the discovery of authentic artifacts in real time, which stimulates active learning Authenticity – interaction with the real world increases motivation and Promotes Confidence – success through participation, Realistic Outcomes – authentic learning opportunities provide real world results Combining lecture with interactive learning activities ensures that content is covered while engaging students and giving them real world experiences Actively involving learners early and often requires student engagement in discussion Actively involving learners early and often requires student engagement in discussion Be sure all sites have the necessary
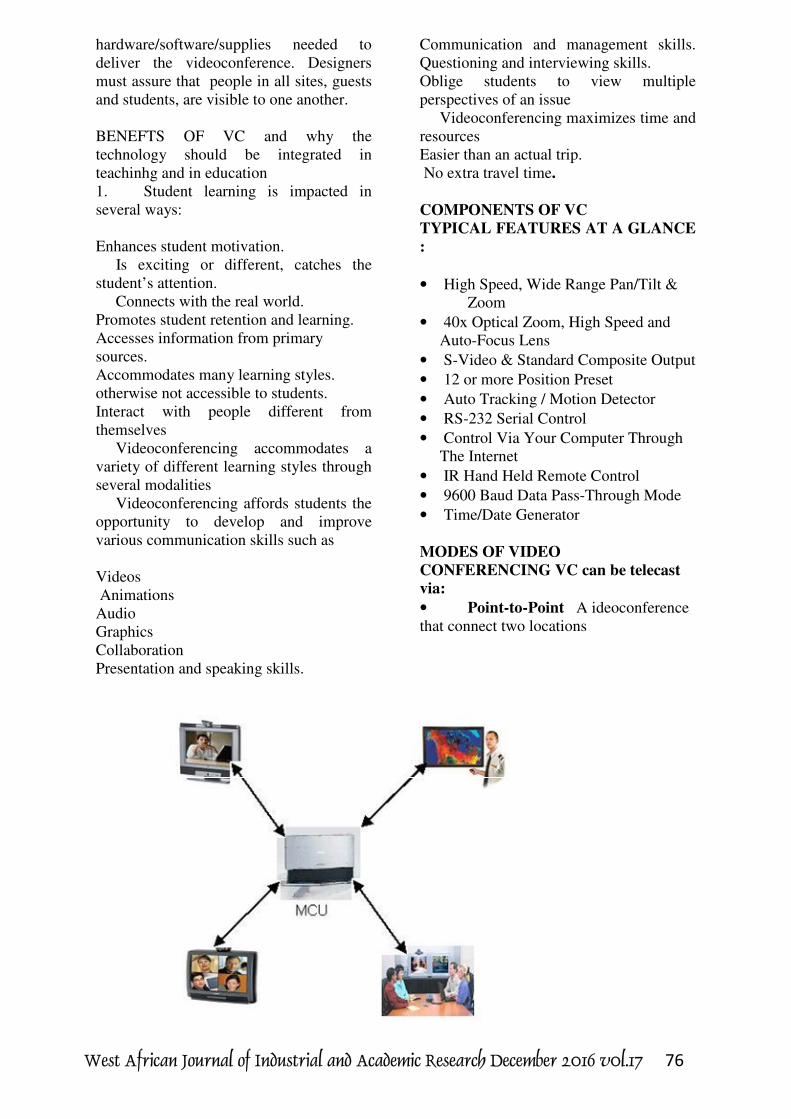
West African Journal of Industrial and Academic Research December 2016 v0l.17 76
hardware/software/supplies needed to deliver the videoconference. Designers must assure that people in all sites, guests and students, are visible to one another. BENEFTS OF VC and why the technology should be integrated in teachinhg and in education 1. Student learning is impacted in several ways: Enhances student motivation. Is exciting or different, catches the student’s attention. Connects with the real world. Promotes student retention and learning. Accesses information from primary sources. Accommodates many learning styles. otherwise not accessible to students. Interact with people different from themselves Videoconferencing accommodates a variety of different learning styles through several modalities Videoconferencing affords students the opportunity to develop and improve various communication skills such as Videos Animations Audio Graphics Collaboration Presentation and speaking skills.
Communication and management skills. Questioning and interviewing skills. Oblige students to view multiple perspectives of an issue Videoconferencing maximizes time and resources Easier than an actual trip. No extra travel time. COMPONENTS OF VC TYPICAL FEATURES AT A GLANCE :
• High Speed, Wide Range Pan/Tilt & Zoom
• 40x Optical Zoom, High Speed and Auto-Focus Lens
• S-Video & Standard Composite Output
• 12 or more Position Preset
• Auto Tracking / Motion Detector
• RS-232 Serial Control
• Control Via Your Computer Through The Internet
• IR Hand Held Remote Control
• 9600 Baud Data Pass-Through Mode
• Time/Date Generator MODES OF VIDEO CONFERENCING VC can be telecast via:
• Point-to-Point A ideoconference that connect two locations

West African Journal of Industrial and Academic Research December 2016 v0l.17 77
Fig 1 PoiNT TO POINT
Multi-point AMulti-poinbt videoconference is one that connects more than two locations through a Multi-point Control Unit (MCU) An Omni Directional Microphone which picks up sound equally well from all directions. It has 360 degrees of voice pick up and an Integrated Mute button A Unidirectional microphone is sensitive to sounds from only one direction. Lcd TV Viewing angle : 176º (H) / 176º (V)
• Diagonal screen size (inch) : 42 inch
• Display screen type : LCD WXGA Active Matrix TFT
• Panel resolution : 1366 x 768p
• Sound Output power (RMS) : 2x12W + 1x24 W
• Loudspeakers Built-in speakers : 5
• Loudspeaker types : Integrated subwoofer, Dome tweeter
• Picture in Picture : HDMI-Component PIP
• Playback Formats : MP3, Slideshow files (.alb), JPEG, Still pictures
• Mains power : AC 110 - 240 V +/- 10%
• Power consumption : 263 W
• Bandwidth / Data Rate Requirement • Frame Rate. • Frame Size. • Color. • Mono / Stereo Audio. • Sample per second. • Bit per sample.
Compressson Standard
• Lossy and Lossless Compression • Audio: G.711, G.722.1, G.728, MPEG-4 • Still Image: JPEG, JPEG-LS, JPEG-2000 • Video: MPEG-2, MPEG-4, H.263, H.264
Band-width requirements of different compressed multimedia data Table 1
Protocols
• H.320 ( 1990) ISDN • H.323 (1996) IP • SIP (Session Initiation Protocol)
Used by most Voice Over IP (VOIP) solutions • H.235 : for security within H.323, including both signaling and media security

West African Journal of Industrial and Academic Research December 2016 v0l.17 78
• H.239 : describes dual stream use (usually for live video, the other for presentation.) • H.460 : optional extensions that might be implemented by an endpoint or a Gatekeeper. • In addition to those ITU recommendations, H.323 utilizes various IETF RFCs for media transport and media packetization, including RTP. Codecs • Video codecs: H.261, H.263, H.264. • Audio codecs: G.711, G.729, G.729a, G.723.1, G.726 • Text codecs: T.140
CODEC UNIT
Features include
• Embedded MCU(Multi-Control Unit)
• Support IP (4 Mbps) and ISDN (2 Mbps) connection
• ISDN & IP connections can be mixed-up
• Dial –In / Dial-Out Capabilities
• Up to 6 sites (5+yourself) H.320 and H.323 MCUs
• Up to 10 sites when MCU cascaded
• Multiple Display Output
• Improved Picture MPEG-4/AAC-LD
• Audio 14kHz Quality
• Supported Protocols : H.323 (LAN) and H.320 (ISDN)
• Video Standards : H.261, H.263, H.264, MPEG-4
• Video Resolution : QCIF, 4CIF, FCIF, SIF
• Frame Rate : Max 30 frames per second
• Bit Rate : Up to 2 Mb/s in H.320 (including audio), Up to 4 Mb/s in H.323 (including audio)
• Audio Bandwidth and Coding : G.711, G.722.1, G.728, MPEG-4, AAC-LD
• Echo Cancellation : Reduction rate 30 dB
• ITU-T Standards : H.320, H.323; H.221; H.281 FECC; H.225.0; H.245; T.120
• Network Protocols : TELNET (Server), HTTP (Server), FTP (Server), SNMP (Server), PING, DNS (Client), DHCP (Client), RTCP, RTP, TCP, ARP, NTP (Client)
• Built-in Streaming:Students or faculties can view and listen to your videoconference session in their PC from almost any location that has access to your network. Site - Name Display: The Lecturer at the main hub should identify the institute location name from which institute the question had been asked. ISDN - Connects sites utilizing the H.320 standard IP - Connects sites utilizing the H.323 standard
The most cost effective speed for typical videoconferencing meetings is 384 Kbps or 512 Kbps. Optional accessories
• Data Solution Box
• Streaming / Archiving Equipment
• Interactive Whiteboard LCD Projector & Laptop
QoS Three advanced functions to enhance QoS over network are:
• Forward Error Correction(FEC): FEC function that corrects errors in transmission at the receiving end.
• Adaptive Rate Control(ARC): ARC function automatically varies the video data transfer rate to meet changing network conditions. Real-time Auto Repeat Request (ARQ):ARQ function recovers lost IP packets Challenges in nternet VC
• Firewalls – Port Blocking • NAT – Hidden IP Address • Bandwidth – NOT! Dial Up Modem
– MAYBE… Cable Modem/DSL
– Yes!!! Internet2 Networ servers
• Gatekeeper – Allows assignment of static
numbers Allows use of MCUs, and Gateways

West African Journal of Industrial and Academic Research December 2016 v0l.17 79
• MCU Allows more than two participants to be in the call at the same time.#Gateway Allows calls to and from telephones.
• Ridgeway Server Firewall/NAT solution Tyes of VC • Dedicated Video Conferencing
Suites – Special hardware required – Dedicated Communication
links such as ISDN Drawbacks :- Costly
Desktop Video Conferencing Webcams & Multimedia Phones required Internet Connection that allows multimedia communication Drawbacks :- Bandwidth &
– Proxy limitations Mobile Video Conferencing Just a Mobile with 3G services Drawbacks:- Low quality DTVC Advantages
• Video Conferencing can be done from office or from anywhere.
• Very Low Cost devices such as Webcams and inbuilt microphones can be used
• Existing Internet connections can be used
• People from anywhere on the globe can connect
• Limitations – Bandwidths often
deteriorates quality of Video – Corporate proxies often
block regular protocols such as UDP/RTP which is main protocol for video transmission
Video servers • Progressive
– Video files are kept at a location on the server.
– Files can be downloaded at a later stage for viewing in a suitable player
– The problem is whole files has to be downloaded before actually playing
– Any Server can host multi-media files.
• Streaming
– Video files are kept at a location on the server.
– Video file is played as it is being downloaded.
– Video file need not to be saved at the client
– Special streaming servers to be used for hosting files
– RED5, WOWZA, FMS, DARWIN, MICROSOFT MEDIA SERVER are example. Protocols used • RTMP Available as an open specification to create products and technology that enable delivery of video, audio, and data in the open AMF, SWF, FLV, and F4V formats compatible with Adobe Flash Player • RTMPT Basically is a HTTP wrapper around the RTMP protocol Send POST requests from the client to the server. Clients to poll for updates periodically in order to get notified about generated – events – Four possible request types can be sent to the server • Initial connect (command "open") • Client updates (command "send") • Polling requests (command "idle") • Disconnect of a session (command "close") • RTMPS
– works just like RTMPT, but over a secure HTTPS connection • eBaithak uses Red5 as its Media Server • Red5 is Open Source Flash Media Server written in Java • Protocols Supported: RTMP/RTMPT/RTMPS
West African Journal of Industrial and Academic Research December 2016 v0l.17 80
• RTMP : Real Time Messaging Protocol is a proprietary protocol of ADOBE Systems. RTMP based on top of TCP and uses 1935 port
• RTMPT is RTMP encapsulated within HTTP requests.
• RTPMS is RTMP encapsulated with in secure HTTP requests
eBank client Flash Application
• Flash is a multimedia graphics program specially for use on the Web
• Flash enables you to create interactive Applications on the Web
• Flash uses vector graphics, which can be scaled to any size without losing clarity/quality
• ActionScript v3.0 is used for programming complicated Flash Applications
eBan and flash • Software Client Side:
– Adobe CS4 for developing GUI • Uses Action Scripting 3.0 – Adobe Flash Player for displaying GUI • Across-platform browser plug-in that delivers multimedia content. • Embedded inside html pages which can be served through Red5 Server. Software server side • Software Server Side: – Embed Flash Application inside server-side scripting program like JSP/ASP for Client Access: <object width="550" height="400"> <param name="movie" value="somefilename.swf"> <embed src="somefilename.swf" width="550" height="400"> </embed> </object>
• This can be saved a HTML file and has to be put on the website alongwith "somefilename.swf" Flash application Cliebt Req • Installed Webcam, Head-Phones Any web-browser with flash player
installed. • Internet connection for connecting Video Server User credentials for connecting the server Red 5 server side • In Simple form, it is a server side java program, hosted on the Red5 Server. • It contains methods such as connect, appConnect, start, stop etc. • Authentication etc are applied in appConnect method • If any VOD data is there, it can be hosted in the streams directory. RRed5 file structure Red5 Folder Structure webapps -> application-folder -> WEB-INF -> classes -> logback-APPLICATION.xml -> APPLICATION_NAME.class -> lib -> red5-web.properties -> red5-web.xml -> web.xml -> streams Server side progr\m package path.to.my.package; import <all reqd packages> public class Application extends ApplicationAdapter { public boolean appStart(IScope app) { } public boolean appConnect(IConnection conn, Object[] params) {} // and others } Compiled in Java and stored in Red5 Server.

West African Journal of Industrial and Academic Research December 2016 v0l.17 81
Video quality parameters • Quality of Video Depends on the following factors: 1. Frame Rate: This parameters define how many frames are displayed in one second. 2. Frame Resolution: Dimensions of each frame. 3. Frame Quality: Compression of each frame. 4. Bitrate: Supported on specific Video Formats • Quality of images in the video depend on Frame Resolution & Quality. • Smoothness of Video depends on Frame Rate.
Bandwidth and vdeo quality • Bandwidth also known as bitrate, is rate of data transfer measured in bits per second. • Higher the Video Quality we prefer, higher bandwidth is required. • Video Quality has to be adjusted to meet the current bandwdith available. • eBaithak prefers bandwidth of 512kbps at client • Frames Per Second: • Number of frames captured per second. • Determines how many frames are captured by the camera for video transferring.
• Value ranges from 1/x to x frames. • If the FPS is specified as 1/5, then per 5 seconds, one frame is captured. • If the FPS is specified as 5, then per second, 5 frames are captured. • Frame dimensions: – Size of video image. – Vary anything from 160x120 to 1600x1200 provided the camera can support for – capturing. – Capturing and rendering large images result in excessive CPU usage. Hence often few frames are dropped while rendering large images. However it has been found that the frame drop is acceptable for resolutions up to 352x288 (CIF). eBaithak Client’s Interaction with Server 1. Connect Camera & Headphone 2. Set Video Quality Options
– Frame Rate (3-5 fps) – Frame Size (176x144) – Frame Quality (60-80)
3. Provide User & Password – Provided by eBaithak Administrator 4. Click Connect Button 5. Click Publish Button 6. Select Remote User 7. Click on Play Button of Remote Video

West African Journal of Industrial and Academic Research December 2016 v0l.17 82
Fig.2: CLIENT SIDE OF VC~ source [1] [2]
Fig. 3: COMPONENTS OF VC [1] [2] [3] [4]

West African Journal of Industrial and Academic Research December 2016 v0l.17 83
Summary conclusion and recommendations We have decomposed the properties of video conferencing technology. We have also identified various types of VC with examples. We have also shown how the technology will work. The component technologies have been presented and we conclude that VC can be lamented in Nigera without difficulties. The benefits highlighted earlier show that the teaching budget of most tertiary institutions can be reduced by half with all the attendant
benefits of VC. Nigeria should as a matter of urgency include vc as one of the crucial teaching aids to shore up quality of education in Nigeria. The National Council on Education should move for the integration of VC into most schools curriculum as q component of educational technology.. The National Open University of Nigeria should take the first shot at pragmatic implementation for all the courses run at various centers throughout NIGERIA.
References
[1] https://defence.pk/pdf/threads/e-baithak-is-the-newest-co-working-space-for-lahoris.481035/#
[2] https://e-baithak.com/news/ [3] https://e-baithak.com/news/ [4] https://www.bluejeans.com/video-collaboration/video-conferencing-technology [5] https://www.bluejeans.com/video-collaboration/what-is-video-conference-technology

West African Journal of Industrial and Academic Research December 2016 v0l.17 84
Effect of Determinants of Infant and Child Mortality In Nigeria: Hazard And Odds Ratio Models
OnatunjiAdewaleP.1 and A AdesinaOluwaseun A 2
1Lautech International College, Ogbomoso, Oyo State, Nigeria 2Department of Mathematics and Statistics, The Polytechnic, Ibadan, Nigeria,
Email: [email protected] Corresponding Author’s Email:[email protected]
Abstract
Infant and child mortality is a major public health problem; however, quantifying its burden
in a population is a challenge. Routine data collected provided a proxy for measuring the
incidence of mortality among children under five years of age and for crudely estimating
mortality rate. The data collected from National Demography Health Survey (NDHS,
2013)were used to investigate the determinants of infant and child mortality in Nigeria. Cox
proportional, logistic model were developed to timely hazardously and probabilistically
continuous variable, mother age and other specific covariates such as educational level,
household income level, residence type and place of delivery which are categorical data.The
Cox proportional analysis showed that the hazard risk and odds ratios of infant and child
mortality are significantly less frequent over specified covariates, insignificant in residence
type but significant in odds ratio. Also, there is an increased risk of infant and child mortality
in place of delivery. It is evident from the results obtained that social economic risk factors
contribute significantly to infant and child mortality in Nigeria. Finally these findings
revealed that Mothers’ educational level determines place of delivery (home, health centre)
which should be improved; increase in household income contributes to child survival and
reduces child mortality in Nigeria
Key words: odds ratio, hazard ratio, mortality
Introduction One of the Millennium Development Goals is the reduction of infant and child mortality by two-thirds by 2015. Infant and child mortality in the agenda of public health and international health organizations has received attention as a part of millennium goal. In order to achieve this goal, all the countries of the world have been trying their best to determine the major factors responsible this and also put efforts towards identifying cost-effective strategies as many international agencies have advocated for more resources to be directed to health sector. Universally, there is huge literature that focused on the determinants of infant and child mortality. A great deal of efforts were made to target communicable diseases as majors
determinants of Infant Mortality(IM) such as malaria, measles, diarrhea, respiratory infections and other immunisablechildhood infections[3]; however, it was noticed later that disease oriented vertical programmes were not adequate to reduce IM. Most of the studies have shown significant association between socioeconomic, demographic factors and infant-child mortality. Ksenhya categorized environmental health risks into traditional hazards related to poverty and lack of development, such as lack of safe water, inadequate sanitation and inadequate waste disposal, indoor air pollution, food contamination, occupational injury hazard, natural disasters and modern hazards such as urban air pollution, water pollution, solid

West African Journal of Industrial and Academic Research December 2016 v0l.17 85
and hazardous waste accumulation, chemical and radiation hazards, infectious disease hazards, ecological changes and climate changes[10]. World Health Organisation(WHO) reported that among the 10 identified leading mortality risks in high-mortality developing countries, unsafe water, sanitation and hygiene, indoor smoke from solid fuels. About 3% of these deaths (1.7 million) are attributable to environmental risk factors and child deaths account for about 90% of the total population[13]. In Kenya, it was reported that there was inconsistent relationship between socioeconomic status (measured by wealth index) and infant mortality[6]. The results indicate that sanitation, education and per capita income contributed to the decline in infant mortality in Brazil, the effects being stronger in the long run than in the short run. The fixed effects associated with municipality characteristics help explain the observed dispersion in child mortality rates[4].The proximate determinants are found to have stronger influence on under-five mortality than the socioeconomic factors considered in the study carried inBangladesh[1].Pandey and Manoj reported a strong association between maternal health and child mortality in rural India; the effects of maternal height, weight, presence of any disease and anemia were found significant[12]. Ghenga revealed that maternal, child and family were important risk factors of U5M in Nigeria using multivariate logistic method of analysis[5]. The following
factors were included in the study: Maternal (current age, education, occupation, parity, marital status, age at first marriage, family planning, preceding birth interval, breastfeeding and health seeking behaviour); Childhood (sex, birth order, birth weight); Household (family size, sanitation number of wives, wealth index, fuel and water sources); Paternal factors (age, occupation); and other factors (place of residence, ethnicity and geopolitical region). Uddin investigated the predictors of child mortality using cross tabulation and multiple logistic regression and reported that father’s education and occupation of father, mother standard of living index, breastfeeding status, birth order have impact on child mortality[11]. Zeraiexamined socio-economic and demographic variables in a multi-level framework to determine conditions influencing infant survival in Zimbabwe. He employed Cox regression analysis to the 1988 Zimbabwe DHS data to study socioeconomic determinants of infant mortality[14]; and the strength of the relationships of the independent (maternal, socioeconomic and sanitation) variables with the dependent variables (infant and child mortality) remain much smaller in the 2005-06 ZDHS survey than in the other ZDHS surveys[8]. They employed multivariate Proportional Hazards Regression
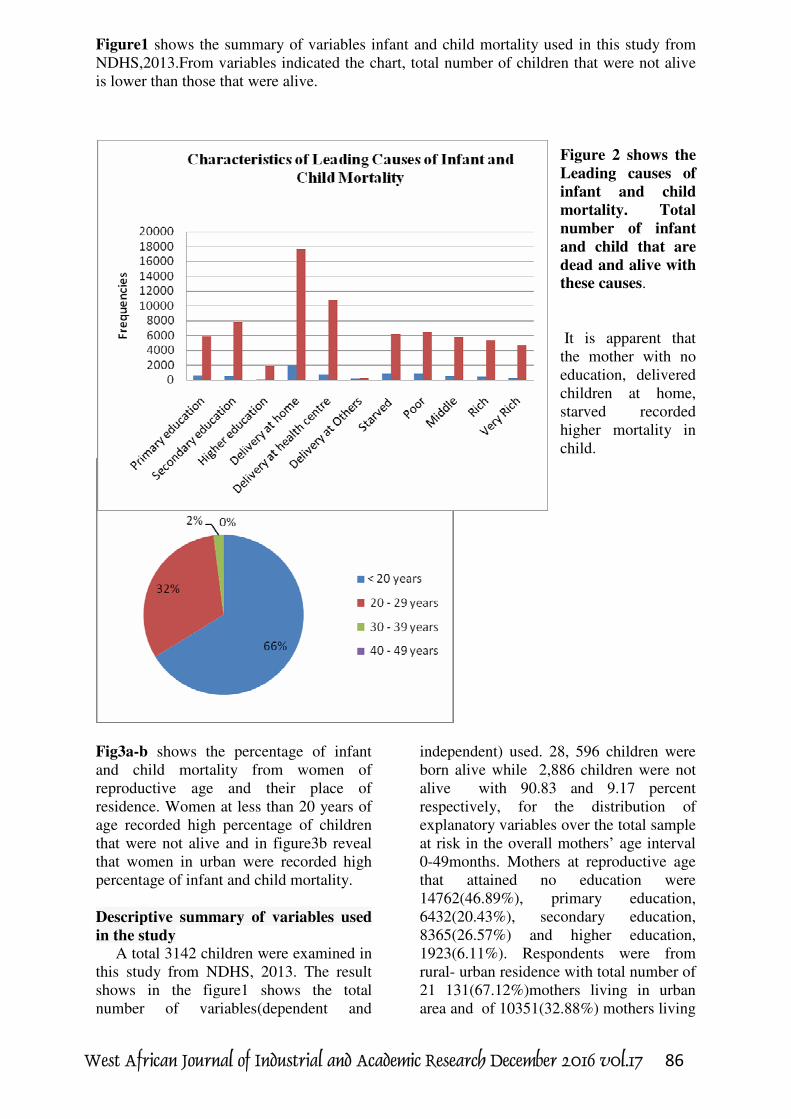
West African Journal of Industrial and Academic Research December 2016 v0l.17 86
Figure1 shows the summary of variables infant and child mortality used in this study from NDHS,2013.From variables indicated the chart, total number of children that were not alive is lower than those that were alive.
Figure 2 shows the Leading causes of infant and child mortality. Total number of infant and child that are dead and alive with these causes. It is apparent that the mother with no education, delivered children at home, starved recorded higher mortality in child.
Fig3a-b shows the percentage of infant and child mortality from women of reproductive age and their place of residence. Women at less than 20 years of age recorded high percentage of children that were not alive and in figure3b reveal that women in urban were recorded high percentage of infant and child mortality. Descriptive summary of variables used in the study A total 3142 children were examined in this study from NDHS, 2013. The result shows in the figure1 shows the total number of variables(dependent and
independent) used. 28, 596 children were born alive while 2,886 children were not alive with 90.83 and 9.17 percent respectively, for the distribution of explanatory variables over the total sample at risk in the overall mothers’ age interval 0-49months. Mothers at reproductive age that attained no education were 14762(46.89%), primary education, 6432(20.43%), secondary education, 8365(26.57%) and higher education, 1923(6.11%). Respondents were from rural- urban residence with total number of 21 131(67.12%)mothers living in urban area and of 10351(32.88%) mothers living
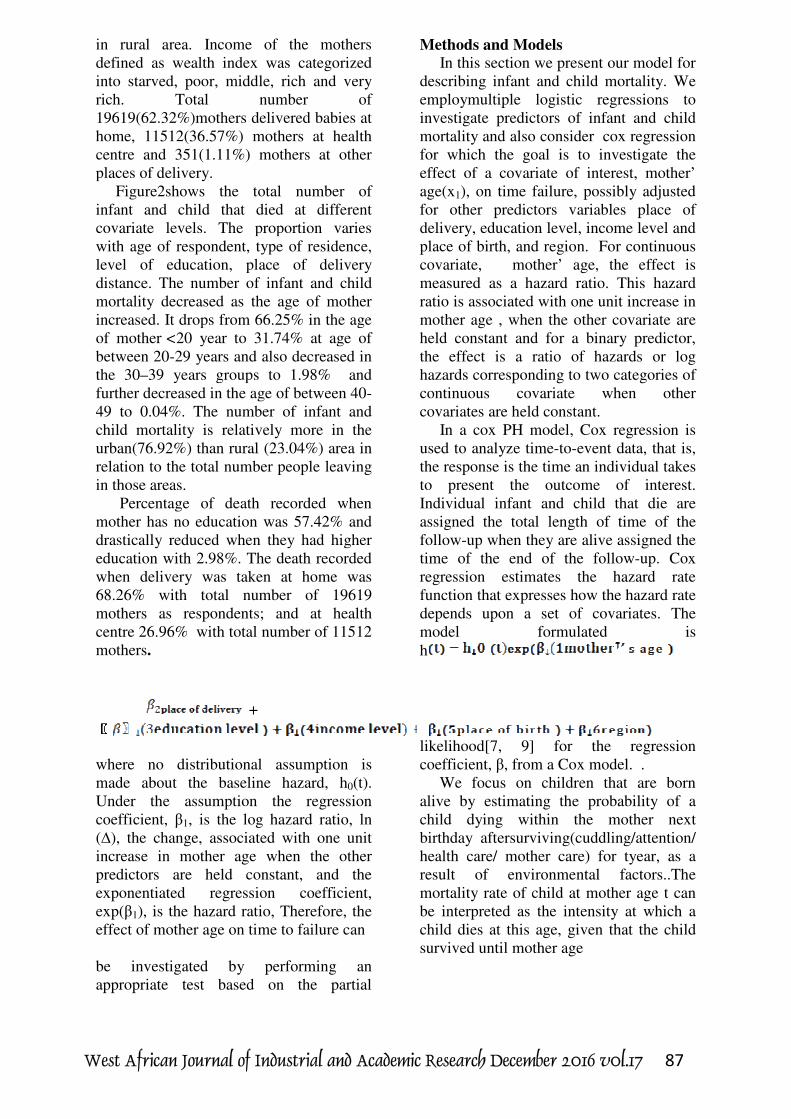
West African Journal of Industrial and Academic Research December 2016 v0l.17 87
in rural area. Income of the mothers defined as wealth index was categorized into starved, poor, middle, rich and very rich. Total number of 19619(62.32%)mothers delivered babies at home, 11512(36.57%) mothers at health centre and 351(1.11%) mothers at other places of delivery. Figure2shows the total number of infant and child that died at different covariate levels. The proportion varies with age of respondent, type of residence, level of education, place of delivery distance. The number of infant and child mortality decreased as the age of mother increased. It drops from 66.25% in the age of mother <20 year to 31.74% at age of between 20-29 years and also decreased in the 30–39 years groups to 1.98% and further decreased in the age of between 40-49 to 0.04%. The number of infant and child mortality is relatively more in the urban(76.92%) than rural (23.04%) area in relation to the total number people leaving in those areas. Percentage of death recorded when mother has no education was 57.42% and drastically reduced when they had higher education with 2.98%. The death recorded when delivery was taken at home was 68.26% with total number of 19619 mothers as respondents; and at health centre 26.96% with total number of 11512 mothers.
Methods and Models In this section we present our model for describing infant and child mortality. We employmultiple logistic regressions to investigate predictors of infant and child mortality and also consider cox regression for which the goal is to investigate the effect of a covariate of interest, mother’ age(x1), on time failure, possibly adjusted for other predictors variables place of delivery, education level, income level and place of birth, and region. For continuous covariate, mother’ age, the effect is measured as a hazard ratio. This hazard ratio is associated with one unit increase in mother age , when the other covariate are held constant and for a binary predictor, the effect is a ratio of hazards or log hazards corresponding to two categories of continuous covariate when other covariates are held constant. In a cox PH model, Cox regression is used to analyze time-to-event data, that is, the response is the time an individual takes to present the outcome of interest. Individual infant and child that die are assigned the total length of time of the follow-up when they are alive assigned the time of the end of the follow-up. Cox regression estimates the hazard rate function that expresses how the hazard rate depends upon a set of covariates. The model formulated is h
+
where no distributional assumption is made about the baseline hazard, h0(t). Under the assumption the regression coefficient, β1, is the log hazard ratio, ln (∆), the change, associated with one unit increase in mother age when the other predictors are held constant, and the exponentiated regression coefficient, exp(β1), is the hazard ratio, Therefore, the effect of mother age on time to failure can be investigated by performing an appropriate test based on the partial
likelihood[7, 9] for the regression coefficient, β, from a Cox model. . We focus on children that are born alive by estimating the probability of a child dying within the mother next birthday aftersurviving(cuddling/attention/ health care/ mother care) for tyear, as a result of environmental factors..The mortality rate of child at mother age t can be interpreted as the intensity at which a child dies at this age, given that the child survived until mother age
West African Journal of Industrial and Academic Research December 2016 v0l.17 88
In logistic regression model, given a set
observations (yi, xi), i = 1, ⋯, n,
where yi is a binary response such that yi = 1 if a child died and yi = 0 a child lived,
and xi = (xi1, ⋯, xip)' are covariates, we
consider a multiple logistic model to estimate the probability of dying , yi = 1 versus the probability of being alive, yi = 0. The response is distributed as a Bernoulli random variable in which fitted response function defined
is = , Where = b0+ b1mother agei1 + b2educational leveli2 + b3incomei3+ b4place of deliveryi4 + b5residencei5.Odd
ratio model = Discussion of Results This s tudy investigates the predictors of child mortality in Nigeria. It utilizedthe nationally representative data from the National Demographic Health Survey(NDHS, 2013. Cox Proportional and Logistic regressiontechnique were used to ascertain the effect of predictors of infant and childmortality. From these analyses several interesting observation
can be made, although the analysis itself was subject to various types of problem. Sometimes, it is observed that logical or theoretical hypothesis is supported by the results of fittedhazard and logistic response function. Logistics revealed that infant and child mortality significantly decreased as a result ``of unit change in educational level(No education, Primary education, Secondary education and Higher education) by 17%, household income(Starved, Poor, Middle, Rich and Very Rich) by 15%, residence(urban and rural) by 20% and mother age by 10%. However, infant and child mortality significantly increased as a result of unit change in place of delivery(Delivery at home, Delivery at health centre and Others) by 46%. Cox proportional also revealed that educational level at 17%, household income at 16%, residence type at 13% significantly decreased risk, and residence type at 13% significantly decreased risk, while place of delivery at 42% significantly increased risk (with hazard ratio of one, indicating the chance of infant and child not being alive) of not infant and child mortality as mother’s age increases. So, ur gent attention should begiven to place of delivery and other factors in order to further reduce the risk of infant and child mortality in Nigeria
.
References
[1]Abdul Hamid Chowdhury(2013).Determinants of Under-Five Mortality in Bangladesh. Open Journal of Statistic vol 3, No 3
[2]Bennett and Jennifer (1999): Correlates of Child Mortality in Pakistan: a Hazards Model Analysis.http://www.biomedsearch.com/issn/0030-9729.html
[3]Clive J. Mutunga(2004). Environmental Determinants of Child Mortality in Urban Kenya,Department of Economics, University of Nairobi, Kenya
[4]DenisardAlves and Walter Belluzzo(2005). Child Health and Infant Mortality in Brazil,Inter-American Development Bank Felipe Herrera Library(Research Network Working papers ; R-493)
[5] Gbenga A Kayode, Victor T Adekanmbiand Olalekan A Uthman(2012).Risk factors and a predictive model for under-five mortality in Nigeria: evidence from Nigeria demographic and health survey.
[6]Hisham E. M. and Clifford O.(2008).Socioeconomic determinants of infant mortality in Knya: analysis of Kenya 2003, Journal of Humanities & Social Science, volume(2)

West African Journal of Industrial and Academic Research December 2016 v0l.17 89
[7]Hosmer, D.W., Lemeshow, S. and May, S.(2008).Applied survival analysis: Regression
modeling of Time-to-Event Data(2nd ed.) Hoboken, John Wiley & Sons, inc. [8]Joshua Kembo and Jeroen K. van Ginneken (2013). Determinants of Infant and Child Mortality
in Zimbabwe: Results of Multivariate Hazard Analysis [9]Klein, J. P., and M. L. Moeschberger(2003). Survival analysis: Techniques for Censored and
Truncated Data. 2nd ed.New York: Springer [10]KsenhyaLvovsky(2001). Health and Environment, Environment Strategy Papers Health and
Strategy Series. The World Bank Environment Department, Strategy Series Number, 1(31) [11]Md. Jamal Uddin, Md. ZakirHossain and Mohammad OhidUllah(2009).Child mortality in a
Developing Country:A Statistical Analysis, Journal of Applied Quantitative Methods [12]Pandey and Manoj K.(2009). Maternal Health and Child Mortality in Rural India, MPRA
[13]WHO.(2002).The world health report 2002:Reducing Risks, promoting life, Geneva:WorldHealtOrganisation.
[14]Zerai, A. [1996]. Preventive Health Strategies and Infant Survival in Zimbabwe. African Population Studies 11(1): 29-62.

West African Journal of Industrial and Academic Research December 2016 v0l.17 90
Analysis of Factors Influencing Import Demand in Nigeria
Alwell Nteegah and Nelson Mansi Department of Economic, University of Port Harcourt
Corresponding authors email: [email protected]
Abstract This paper investigated the factors influencing import demand in Nigeria over the period
1980-2014. The large population size of Nigeria and the surge in importation of goods into
the country over the years necessitated this investigation. The study identified real income
level, real exchange rate, domestic price level, external debt stock, degree of openness and
level of domestic investment as possible factors that influences import demand in Nigeria. In
order to achieve our objectives data on the above independent variables and total import
demand as dependent variable was sourced from secondary sources. Using the Ordinary
Least Square (OLS) and cointegration/error correction mechanism, the study shows that:
real income level, domestic price change, exchange rate all have negative and significant
impact on total import demand in Nigeria, this implies that these variables significantly
retarded total import demand in Nigeria over the period of this study. The result also
revealed that degree of openness; gross capital formation and external debt have positive
and significant implication on total import demand. This implies that these variables
significantly spurred total import over the period of this study. The study therefore concludes
that import demand has serious implication on the Nigerian economy over the period. Based
on these results/findings, the study recommends: increase in real income (GDP), trade
restrictions, review of conditions for foreign investments and a friendly investment climate as
possible measures of growing the Nigerian economy.
Key words:`import demands, factors, dependent variable Introduction Foreign trade and its implications on a country’s economic progress has been of serious attention to scholars of economics and policy makers. This issue has indeed has been emphasized in the two–gap model constructed by McKinnon (1964) and Chenery and Shout (1966). Imports are crucial part of external trade and the import of productive commodities specifically, is important for domestic investment and economic progress. Evidence available generally points out that most low income countries and indeed Nigeria registered a continuous decline in their earnings from foreign exchange from the beginning of the 1980s and in recent years This development is linked largely to the decline of prices of goods produced by the country (crude oil and raw agricultural products) in the international market. In
relationship with this factor, are two basic issues; viz: Foreign lending reduction likely due to the inabilities of somedeveloping countries like Mexico to meet her debt obligations by 1982; The rise in external borrowing cost fueled by the deficit financing in the United States by the Reagan’s administration then; andThe exploitation and sales of crude oil by the United States of America one of the major buyer of Nigerian oil. These scenarios fueled series of events in most oil exporting countries including Nigeria. Income from external trade transaction dropped astronomically. It is necessary to point out that revenue from crude oil trade (export) has serious implication on government revenue in most low income countries producing and exporting crude oil. Fluctuations in the

West African Journal of Industrial and Academic Research December 2016 v0l.17 91
international market affect both exports and imports of low income countries and revenue from trade tends to be unpredictable and unsustainable as well. It is however not surprising that the crash of commodity exports prices in the early 1980s and recently from 2014 engendered fiscal crisis in Nigeria cumulating in huge extra budget spending as currently experienced in the country. This led to the introduction of catalogues ofeconomic reform projects/strategies such; as the import substitution industrialization (ISI) strategy, export promotion programme (export free zones), Structural Adjustment Programme (SAP) to mention but a few. These strategies were expected to boost export and reduce imports to restore external balance and stimulates economic growth. However, imports demands by Nigeria kept escalating over the years. For instance, the value of non-oil imports trade grew from a mean value of N36.55 billion; representing 96.8% of total import into Nigeria within the duration 1970-1979, to N118.36 billion; representing 93.4% ofaggregate import trade during duration 1980-1989, N3.48 trillion in the period 1990-1999; representing 79.9% of aggregate import trade and N19.33 trillion; representing 82.0% of aggregate imports trade for the duration 2000-2008. The latest value for Imports of goods and services (BoP, current US$) in Nigeria was $85,354,940,000 as of 2014. The rising volume of importin Nigeria has agitated the thinking of scholars and policy makers and attempts have been made to try to identify the factors affecting import in Nigeria.Egwaikhide (1999) in a quest to examining factors influencing import demand, identified a rise in foreign exchange earnings and relative price changes as the key factors of imports in Nigeria between 1953 and 1989. Ozo-Eson (1984) in his study included money supply and relative prices as the major factors affecting demand for imported goods into Nigeria over the period 1960-1979. In examining the nature of Nigeria's imports trade and crucial variables influencing it during the duration 1970 -
2004, Abdullahi and Suleiman (2008) using the error correction model, they discovered that real income level (GDP) and the proxy used in measuringdegree of openness greatly influenced demand for imports while real exchange rate and actual foreign exchange reserve were found to have less implication in influencing the nature of import trade in the Nigerian economy. While acknowledging that some studies have indeed been carried out in an attempt to identify the major factors in influencing import demand in Nigeria, we are not sure that such studies have been to expose all the determinants. Moreover, there is the need to extend, update and deepen our knowledge on this matter given the important place the issue of import trade occupies in our economic management and the performance of the Nigerian economy. To examine the issue of import determinants, the paper seeks to address the following questions through empirical investigation: (i) what are the factors that influence imports demand in Nigeria? (ii) to what extent do the factors like: exchange rate, price level, external debt stock, degree of openness and gross capital formation influenced import demand in Nigeria? The paper shall continue by reviewing relevant literature, followed by the methodology, results and discussions and concluding remarks. Literature Review The relationship between trade and macroeconomic stability are limited. Trade policy determines the functional openness of an economy but the trade balance is determined by the balance between national income and expenditure. According to Desai and Potter (2008), exchange rate overvaluation and fiscal deficits provide the crucial relationship between macroeconomic balances and stability. To them trade reforms if properly planned and executed can provide impetus for government to control inflation and can also influence the prevention of real exchange rate appreciation. Countries liberalizing trade often devalue their
West African Journal of Industrial and Academic Research December 2016 v0l.17 92
currency to compensate for the liberalization impact on the balance of payments. The potential inflationary effects of depreciation are likely to hamper the use of nominal exchange rate policy hence sustained trade liberalization is likely to involve some deterioration in the external balance until there is an export response (Desai and Potter, 2008), Trade policy and macroeconomic stability are linked through trade taxes. It is pertinent that most developing economies like Nigeria depend so much on trade taxes and the sluggishness of possible non-trade tax reforms, fiscal effects must be taken seriously. The theoretical basis of this paper is situated on the link between trade and macroeconomic stability. Nigeria’s macroeconomic management depends so much on trade (import and export). For instance, revenue from oil export is crucial for execution of budget while trade policy with regards to import determine the level of industrial production and consumption in the country. Myriad of empirical literatures exist on possible factors that influence import demand. The investigation by Hemphill (1974) is specifically interesting. In his study, he developed the stock adjustment import-exchange equation that has its foundation in the theory of balance of payments. Using information from eight low income countries, the result from the study indicated general compliance with the aprioritheoretical relationship between aggregate importtrade and foreign exchange revenue. The study therefore laid credence the position that revenue from foreign exchange transaction is a principal variable influencing demand for aggregate imports demand in low income countries. Mwega (1993) studied the factors influencing demand for import in Kenya. Using yearly data over the duration 1964-1991, He finds an insignificant relationship between short-run relative price,level of real income and aggregate import demand elasticties for Kenya. However, total imports demand is significantly related to previous level of
demand for imports,the lagged value of foreign exchange reserves and to revenue from foreign exchange. The study also confirmed the long run relationship amongst the variables given the correctness of the sign of the ECM and its significance at 5 percent. The study therefore concludes that in Kenya, the outcomes of the study suggest that strategies which directly stimulated export revenue. In examining the demand for imports model for Macuo, using two models: aggregate and disaggregated, Ho (2004) found using the Johansen-Juseluis(JJ) test that Macao’s imports are cointegratedwith some of the factors influencing it possessing correct signs in the separated model when; (a) a constant is introduced into the model and (b) both constant and trend are introduced into the it. However, the former case leads to the ECM result been unstable, while the later resulted to stability in the ECM results. Bahmani-Oskooee et al (1998) also investigated the demand for imports relationship for 30 countries for the duration 1960 – 1992. Using annual data and employing the aggregate demand model by using Johansen-Juseluis (JJ) cointegration tests. Out of the 30 countries, 14 countries were found to have onecointegrating equations and 12 of them are found to contain two cointegrating equations. In most of the results, the price and income elasticities were very high. Dutta et al (2001) employed the total demand for import function to analyzed the factors affecting India’s import demand over the period, 1971-1995. Using Johansen (1988 and 1991) and JJ (Johansen et al 1990, 1992 and 1994) tests for cointegration to obtain the necessarycointegrating equations. Also, the Error Correction Model was estimated using the method of the general – to – specific, only one cointegrating equation was detected and built into the error correction model. The level of import was found to be rather price inelastic with calculated coefficient of -0.47. The income elasticity of demand value for import

West African Journal of Industrial and Academic Research December 2016 v0l.17 93
demand of two-years lag was more than one (unity), indicating that the demand for import varies higher than the variations in real national income. However, the coefficient of the calculated one-year lagged error correction term (ECT) was -0.12 which is of right sign for short-run adjustment while in the long-run disequilibrium occurs. It was also discovered from the study that all the key calculated coefficients in the model was statistically significant at 5percent level. In analyzing the long-run dynamics between Malaysian actual demand for imports and the composition of final expenditure demand approximated by actual final consumption expenditure, investment expenditure and export trade and prices of relative goods over the period 1970-1998, Mohammad et al (2000) usedthe Johansen multivariate cointegration analysis andthe Error Correction Model to evaluate the short-run responses of demand for imports and the factors influencing it. It was found from the results that only one cointegrating equation is detected from the model. This implies that the partial responsiveness of demand for imports with respect to expenditure on consumption was 0.72, investment expenditure 0.78 and exports 0.385. At -0.69, the import price was fairly insensitive.At -0.637, the Error Correction Model result, showsa speedy adjustment to long run dynamics impliedby the one-period lagged ECT which was very speedy. The effect of expenditure on final consumption was statistically insignificant to importhencethe ECM specification dropped out the effect of final consumption expenditure. Osei (2012) analysed demand for imports and growth in the Ghanaian economy using the Ordinary Least Squares method and discovered from the result that the encouragement of export trade could lead to economic growth either throughpromotion of manufacturing of exportable commodities or real foreignexchange that enhance the importation of capital input assets. He further posits that such act of trade may
encourage the efficiency of capital utilization. In Nigeria, the pioneering study on demand for imports determinants was done byOlayide (1968) hisattention was on some selected imports goods by Nigeria for the period 1948-1964. Results and findings from theestimated regression models revealed that terms of trade, real income (measured by GDP) and trade restriction index had relatively good estimates. Ozo-Eson (1984) investigated the same phenomenon using a monetarist import demand model, thus incorporating real money balance excess supply into the traditional model for import demand. The estimated results from the analysis show that money supply and relative prices significantly affectedaggregate demand for imports from 1960-1979 in Nigeria.Egwaikhide (1999) analyzed also the factors affecting aggregate imports and its major composition in Nigeria, utilizing yearly data over the period 1953 - 1989 and analyzing it using Ordinary Least Squares. The results of study indicate that variations in short-run availability of earnings from foreign transactions (exchange) relative prices and actuallevel of output significantly determined total imports growths during the period. In examining the behavior of Nigeria's imports and important factors that determine it for the period 1970 to 2004, Abdullahi and Suleiman (2008) using the error correction model, they discovered that real GDP and measure of openness significantly determined import demand while real exchange rate and real foreign reserve were insignificant in determining the behavior of import in the country. Based on the results of the study, it was concluded that to raise aggregate imports, the implementation of a set of macroeconomic and sector-specific policies that relatively have implications on real income and trade openness is necessary. The studies above appeared to have a common trend in term of variables identified to have affected import demand and the methodology adopted in analyzing

West African Journal of Industrial and Academic Research December 2016 v0l.17 94
data sourced. This study deviated from others in terms of scope, exchange rate, price level; market size, external debt stock, trade openness, domestic investment and the level of financial deepening are factors to be examined in this study over the period 1980-2014. Methodology This study adopted this theory on the argument that countries with bigger export sector stand to gain more from trade than those with large import sector. Nigeria over the years appeared to be import dependent with greater volume of raw materials for her industries and much of her consumable goods imported. Though in theproduction of some raw materials like crude oil and cassava,the country has comparative advantage, the relative effect of these commodities on the local economy had not been felt due to poor value chain. The country presently imports most stable foods like rice, beans and about 80 percent of her industrial raw materials. Given this scenario, it is therefore necessary to determine the factors that influences import demand in the country. Erlat and Erlat (1991), and Osei (2012) used the ordinary least square (OLS) method in the investigation of the factors influencing demand for imports while Dutta and Naasiruddin(2006) used the co-integration and error correction mechanism in their study of determinants of import demand in Indian. Though this study adopted the co-integration approach, it however, deviated from these studies in terms of the scope (variables, case study and time frame). In this study, we specify a functional nexus between demand for imports as dependent variable, and the independent variables: exchange rate, market size (real income), external debt stock, gross capital formation, trade openness, financial deepening and price level of Nigeria, over the period 1980-2014 as follows: Imd = F (Exr, GDP, Eds, Gcf, Top, Inf,) - 1.0
Where: Imd = import demand,Exr = exchange rate,GDP = market size/ real income level,Eds = external debt stock,Gcf = gross capital formation, Top = trade openness and Inf = price level. During estimation, parameters are introduced and a disturbance term “U” to accounts for variables not incorporated in the model but affect economic growth. Hence equation 3.1 above is transformed thus:
Imdt =∝o(Exrt)∝1(GDPt)∝2
(Edst)∝3(Gcft)
∝4(Topt)∝5(Inft)
∝6eUt--------------- 1.1 After expressing equation (1.1) in log-linear form, the dynamic model is specified as follows:
lnImdt =∝o+∝1lnExrt
+∝2lnGDPt+∝3lnEdst
+∝4lnGcft+∝5lnTopt+ ∝6lnInft +Ut------ (1.2)
∝1, ∝2, ∝3, ∝4, ∝5, and∝6 are elasticities of exchange rate, market size, external debt, gross capital formation, trade openness, financial deepening and inflation rate.
Aprioriexpection is that ∝1<0, ∝2>0, ∝3
>0, ∝4<0,∝5 >0, ∝6 <0, and ∝7 >0. This implies that fall in exchange rate, gross capital formation, level of financial deepening are expected to reduced import demand while rise in income level (market size), external debt stock, trade openness, and inflation are expected to spur import demand over the period. Estimation Procedure After conducting a correlation test, the ordinary least squares (OLS) was utilized in the analysisof the model being the best linear unbiased estimator. This is premised on the condition that the variables (in the model) in their behaviour conform to the assumption of the classical regression model. Necessary precaution was taken to ensure that the model adheres to the principles of parsimony using the AIC (Akaike Information Criterion) and SBC (Swartz Bayersian Criterion). The stabilitytest was conducted using the Augmented Dickey Fuller (ADF) and Philip Perron (PP) to determine the unit roots(time series) characteristics of the

West African Journal of Industrial and Academic Research December 2016 v0l.17 95
variables in the model. The level of integration of the residual error term of a set of non-stationary time series aggregate should be zero (ieUt~ 1(0)) in order to qualify as an error correction model. Using
the Recursive residual and CUSUM tests, the stability test was carried out to find out the steadiness of the model across samples within the period under investigation.
Table 1: Descriptive Statistics
Variable IMP GDP INF EXR EXD GCF OPN
Mean 2192.085 429.4766 20.50400 66.73036 1087.797 10.78857 8.286092
Median 837.4000 367.2000 13.70000 21.88610 595.9000 8.100000 5.098502
Maximum 10235.20 950.1000 76.80000 158.5500 4890.300 28.60000 30.04530
Minimum 6.000000 31.60000 0.200000 0.550000 1.866800 3.100000 0.057813
Std. Dev. 3097.224 214.2850 18.88773 64.09348 1356.963 6.887276 9.434786
Skewness 1.422746 0.820606 1.535651 0.253326 1.531148 1.200741 0.905394
Kurtosis 3.653929 3.019087 4.329581 1.239995 4.169815 3.244671 2.452923
Jarque-Bera 12.43149 3.928660 16.33433 4.891708 15.67142 8.497681 5.218275
Probability 0.001998 0.140250 0.000284 0.086652 0.000395 0.014281 0.073598
Sum 76722.99 15031.68 717.6400 2335.563 38072.89 377.6000 290.0132
Sum Sq. Dev. 3.26E+08 1561214. 12129.38 139671.1 62605857 1612.775 3026.516
Observations 35 35 35 35 35 35 35
The descriptive statistics result reported in Table 1 indicates that total import demand has the highest mean value of N2192.085 billion. This is followed by gross domestic product with a mean of N429.4766billion over the period. External debt stock has a mean value of N1087.797 billion over the period while the mean for total domestic investment (gross capital formation) stood at N10.78857billion. The average inflation rate stood at 20.5 percent over the period while the mean degree of openness stood at 8.3percent and the average rate at which the Nigerian Naira exchanged to 1USD stood at N66.7. During the period under review, the maximum total import demand stood at N10235.20billion and minimum value of N6.000000billion. Gross domestic product has maximum value of N950.1000billion
and minimum value of N31.60000billion. External debt has maximum value of N4890.300billion and a minimum value of N1.866800billion while gross capital formation has a maximum value of N28.60000billion and a minimum value of N3, 100000 billion. The maximum value for trade openness stood at 30.05 percent and a minimum of 0.06percent. Inflation rate has the highest value of 76.8percent and the least of 0.20percent. Finally, exchange has a peak rate of 158.5 to 1USD and the lowest rate of 0.55 to 1USD over the period of this study. The above statistic indicates that the value of total import is more than the national income earn in Nigeria over the period. These statistics have further attest to the dependent nature of the Nigerian economy
. Table 2. Correlation Matrix
Variable IMP GDP INF EXR EXD OPN GCF
IMP 1
GDP 0.8025683 1
INF -0.307870 -0.2171090 1
EXR 0.8203410 0.79356771 -0.37556579 1

West African Journal of Industrial and Academic Research December 2016 v0l.17 96
EXD 0.1350388 0.25213481 -0.16290696 0.59337241 1
OPN 0.9198218 0.92329017 -0.31963662 0.88595746 0.24878675 1
GCF 0.9225706 0.66746553 -0.29983862 0.74755667 0.06757035 0.80086683 1
The correlation result reported in Table
2 indicates that gross domestic product (GDP), exchange rate, degree of openness and gross capital formation have positive and strong relationship with import demand while the relationship between import demand and external debt stock is
positive but weak. Inflation on the other hand has negative and very weak relationship with total import demand. This result reveals that most of the explanatory variables have very strong and positive relationship with import demand.
Table 3: Unit Root Tests Result Augmented Dickey Fuller (ADF) Test Statistic Philip-Perron (PP) Test Statistic
Variable
ADF Statistic
1% 5% 10% Decision
PP Statistic
1% 5% 10% Deciion
Log(Imp)
-6.6198
94
-3.6463
42
-2.9540
21
-2.6158
17
i(1) -6.5688
85
-3.64634
2
-2.9540
21
-2.6158
17
i(1)
Log(Gdp)
-5.5151
14
-3.6394
07
-2.9511
25
-2.6143
00
I(0) -5.1314
80
-3.63940
7
-2.9511
25
-2.6143
00
i(0)
Log(Inf)
-4.9568
39
-3.6394
07
-2.9511
25
-2.6143
00
I(0) -4.9584
08
-3.63940
7
-2.9511
25
-2.6143
00
i(0)
Log(Exr)
-5.1496
20
-3.6463
42
-2.9540
21
-2.6158
17
i(1) -5.1496
20
-3.64634
2
-2.9540
21
-2.6158
17
i(1)
Log(Exd)
-4.1306
52
-3.6463
42
-2.9540
21
-2.6158
17
i(1) -4.1306
52
-3.64634
2
-2.9540
21
-2.6158
17
i(1)
Log(Opn)
-5.7869
76
-3.6463
42
-2.9540
21
-2.6158
17
-5.7901
11
-3.64634
2
-2.9540
21
-2.6158
17
i(1)
Log(Gcf)
-5.4510
89
-3.6537
30
-2.9571
10
-2.6174
34
I(1) -4.6520
50
-3.64634
2
-2.9540
21
-2.6158
17
i(1)
The stationarity test result using the Augmented Dickey Fuller test approach reported in table 3 indicates that income level (GDP) and inflation were stationary at level. This implies that they attained stability without differencing or at level. On the other hand, total import demand, exchange rate, external debt stock, degree of openness and gross capital formation attained stationarity at first difference.
This implies that these variables were stable at order one. The stability test conducted using the Philip-Perron test reported in table 3 also reveals that income level (GDP) and inflation were stationary at level. This implies that they attained stability without differencing or at level. On the other hand, total import demand, exchange rate, external debt stock, degree of openness and gross capital formation attained stationarity at first difference. This implies
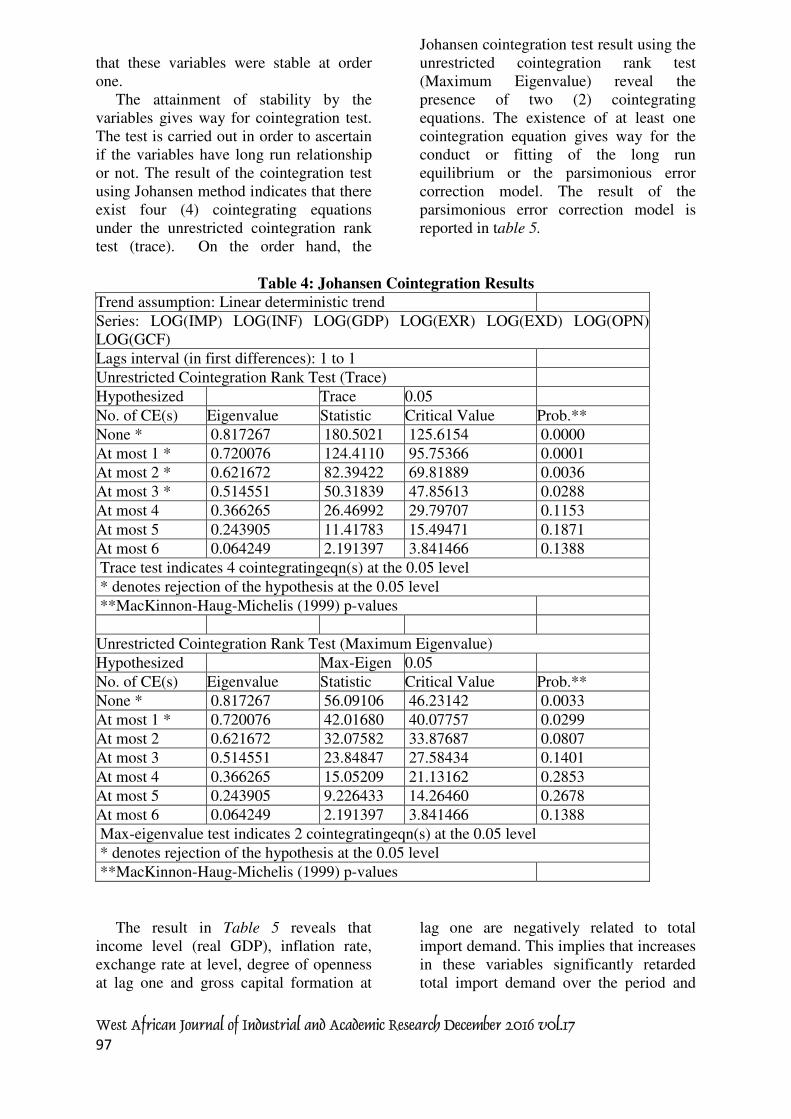
West African Journal of Industrial and Academic Research December 2016 v0l.17 97
that these variables were stable at order one. The attainment of stability by the variables gives way for cointegration test. The test is carried out in order to ascertain if the variables have long run relationship or not. The result of the cointegration test using Johansen method indicates that there exist four (4) cointegrating equations under the unrestricted cointegration rank test (trace). On the order hand, the
Johansen cointegration test result using the unrestricted cointegration rank test (Maximum Eigenvalue) reveal the presence of two (2) cointegrating equations. The existence of at least one cointegration equation gives way for the conduct or fitting of the long run equilibrium or the parsimonious error correction model. The result of the parsimonious error correction model is reported in table 5.
Table 4: Johansen Cointegration Results
Trend assumption: Linear deterministic trend
Series: LOG(IMP) LOG(INF) LOG(GDP) LOG(EXR) LOG(EXD) LOG(OPN) LOG(GCF)
Lags interval (in first differences): 1 to 1
Unrestricted Cointegration Rank Test (Trace)
Hypothesized Trace 0.05
No. of CE(s) Eigenvalue Statistic Critical Value Prob.**
None * 0.817267 180.5021 125.6154 0.0000
At most 1 * 0.720076 124.4110 95.75366 0.0001
At most 2 * 0.621672 82.39422 69.81889 0.0036
At most 3 * 0.514551 50.31839 47.85613 0.0288
At most 4 0.366265 26.46992 29.79707 0.1153
At most 5 0.243905 11.41783 15.49471 0.1871
At most 6 0.064249 2.191397 3.841466 0.1388
Trace test indicates 4 cointegratingeqn(s) at the 0.05 level
* denotes rejection of the hypothesis at the 0.05 level
**MacKinnon-Haug-Michelis (1999) p-values
Unrestricted Cointegration Rank Test (Maximum Eigenvalue)
Hypothesized Max-Eigen 0.05
No. of CE(s) Eigenvalue Statistic Critical Value Prob.**
None * 0.817267 56.09106 46.23142 0.0033
At most 1 * 0.720076 42.01680 40.07757 0.0299
At most 2 0.621672 32.07582 33.87687 0.0807
At most 3 0.514551 23.84847 27.58434 0.1401
At most 4 0.366265 15.05209 21.13162 0.2853
At most 5 0.243905 9.226433 14.26460 0.2678
At most 6 0.064249 2.191397 3.841466 0.1388
Max-eigenvalue test indicates 2 cointegratingeqn(s) at the 0.05 level
* denotes rejection of the hypothesis at the 0.05 level
**MacKinnon-Haug-Michelis (1999) p-values
The result in Table 5 reveals that income level (real GDP), inflation rate, exchange rate at level, degree of openness at lag one and gross capital formation at
lag one are negatively related to total import demand. This implies that increases in these variables significantly retarded total import demand over the period and

West African Journal of Industrial and Academic Research December 2016 v0l.17 98
vice versa. On the other hand, our result also shows that exchange rate at lag two, external debt stock, degree of openness at level and gross capital formation were
found to be positively related to total import demand. This implies that increases in these variables spurred total import demand over the period of this study
. Table 5: Parsimonious Error Correction Model Result
Dependent Variable: DLOG(IMP)
Method: Least Squares
Sample (adjusted): 1983 2014
Included observations: 32 after adjustments
Variable Coefficient Std. Error t-Statistic Prob.
C 0.059114 0.029246 2.021270 0.0584
DLOG(INF) -0.043396 0.015890 -2.731052 0.0137
DLOG(INF(-2)) -0.018183 0.013098 -1.388232 0.1820
DLOG(GDP) -0.356840 0.071841 -4.967065 0.0001
DLOG(GDP(-2)) -0.110461 0.058225 -1.897127 0.0740
DLOG(EXR) -0.183294 0.082662 -2.217391 0.0397
DLOG(EXR(-2)) 0.245730 0.074672 3.290784 0.0041
DLOG(EXD) 0.107553 0.073215 1.469011 0.1591
DLOG(OPN) 0.926629 0.056925 16.27797 0.0000
DLOG(OPN(-1)) -0.601282 0.170047 -3.535978 0.0024
DLOG(GCF) 0.347833 0.094878 3.666094 0.0018
DLOG(GCF(-1)) -0.300565 0.127285 -2.361354 0.0297
DLOG(IMP(-1)) 0.351029 0.147311 2.382918 0.0284
ECM(-1) -0.916011 0.207908 -4.405839 0.0003
R-squared 0.956305 Mean dependent var 0.207561
Adjusted R-squared 0.924748 S.D. dependent var 0.373172
S.E. of regression 0.102369 Akaike info criterion -1.420829
Sum squared resid 0.188630 Schwarz criterion -0.779570
Log likelihood 36.73327 Hannan-Quinn criter. -1.208270
F-statistic 30.30368 Durbin-Watson stat 2.048244
Prob(F-statistic) 0.000000
Discussions of results and Findings The parsimonious error correction model result reported in Table 1.6 indicates that import demand is negatively but significantly related to income level (GDP) at initial level but not significant at 5 percent lag two. This implies that increase in import demand retarded national income level over the period of this study. This result is in tandem with Dutta and Ahmed (2006). Using OLS, they found import demand in India to be largely determined by real income (GDP) and less sensitive to import price changes. An increase in import demands may raise income leakages (increase expenditure on imported goods and services) thereby reducing domestic income and consumption. The persistent rise in total
import demand over the period of this study may have contributed to the behaviour of this variable in this model. The result also indicated that total import demand is negatively but significantly related to inflation rate at initial level but not significantly linked at 5 percent level to import demand at lags two. This implies that increase in import demand reduced prices of goods and services over the period of this study. This result is not in consonance with our apriori theoretical expectation but it is in tandem with the study by Egwaikhide (1999). He identified exchange rate, relative prices and real output as the salient factors affectingdemand for imports in Nigeria over the period 1953-1989. Usually, an increase in import demands may raise prices of goods and services in the
West African Journal of Industrial and Academic Research December 2016 v0l.17 99
domestic economy thereby reducing domestic consumption. However, the importation of raw materials which have value added may stabilize prices in the domestic economy. Nigeria is a net importer of raw materials for her local industries. This may have accounted for the behavior of this variable in this model. The error correction model result also shows that total import demand is negatively but significantly related to exchange rate at level and lags two. This implies that reduction in exchange rate has significant reduction in total import demand. This result is in consonance with apriori theoretical expectation and also in agreement with the work of Ozturk (1998). He found real exchange rate to have significant negative relationship with import demand in Turkey. Depreciation in foreign currencies in relation to domestic currency raises total import demand since foreign goods may become cheaper than locally produced goods. Nigeria under the exchange rate regimes of regulation and guided deregulation in the 1980s and 1990s subsidized her currency (a situation in which local currency was given higher value that does not reflect its true market value). This made foreign goods and services cheaper compared to the local currency hence increase in total import demand over the period. External debt from our result was found to be positively but insignificantly related to total import demand. This result is in consonance with theoretical expectation. Increases in external debts may reduce domestic investment and production thereby increasing total import demand. Nigeria’s debt profile has been on the rise since the early 1980s thus increasing debt services and reducing domestic investment and production. This development may have accounted for the behaviour of this variable in the model. Total import demand was found to be positively related to the degree of openness at level but negatively linked to degree of openness at lag one. However, the variable was significant at 5 percent level at both lags. The first result is in
tandem with our theoretical expectation while the second one deviated from it. This implies that trade openness has significant implications on total import demand. Globalization has turned the World into a global village hence information and resource flow freely across countries of the World. This development has turned most developing countries into dumping ground for foreign goods and services. The mix implications of trade liberalization may have influenced the outcome of this results. Results The result further indicates that gross capital formation at level is positively and significantly related to total import demand while capital formation at lag one was found to be negatively and significantly influenced by changes in import demand in Nigeria over the period of this study. This implies that gross capital formation has mixed implications on import demand over the period of this study. Increase in gross capital formation (domestic investment) stimulates domestic production and retards import while reduction in capital formation/domestic investment and production spurred imports demand. The fall in domestic investment as a result of poor infrastructure may have contributed to the behaviour of this variable in this model. The estimated coefficient of the error correction term has the expected negative sign and significant at 5 percent. This implies that the independent variables responded speedily to long run changes in import demand model over the period of this study. The coefficient of determination (R2) of 0.93, used to measure the goodness-of-fit of the estimated model, indicates that the model is reasonably fit for prediction that is, the model explains about 93 percent of the systematic change in total import demand in Nigeria over the period 1980-2014. At 2.05, the Durbin Watson statistics reveal very low evidence of serial correlation. While the F-statistic of 30.3 indicates that the import demand model is

West African Journal of Industrial and Academic Research December 2016 v0l.17 100
statistically significant at 5 percent level. Furthermore, a stability of parameters in the growth equation reported in figure 4.2 is paramount. It is a standard practice to incorporate short-run dynamics in testing for stability of the long run parameters of the growth
equation. To this end, this study applies the cumulative sum of recursive residuals (CUSUM) to the residuals of parsimonious model.
Figure 4.2 Stability Test- Results
-.4
-.3
-.2
-.1
.0
.1
.2
.3
.4
1998 2000 2002 2004 2006 2008 2010 2012 2014
Recursive Residuals ± 2 S.E. Figure 4.2(b) Recursive Residuals Test
0
2
4
6
8
10
12
-0.20 -0.15 -0.10 -0.05 0.00 0.05 0.10 0.15
Series: ResiduaSample 1983 2Observations 3
Mean Median Maximum Minimum Std. Dev. Skewness Kurtosis
Jarque-BeraProbability

West African Journal of Industrial and Academic Research December 2016 v0l.17 101
-15
-10
-5
0
5
10
15
1998 2000 2002 2004 2006 2008 2010 2012 2014
CUSUM 5% Significance Figure 4.2(c) CUSUM Test
Source: Researcher’s Computation
For stability of the short run dynamics and the long run equilibrium parameter of the growth model, it is important that the recursive residuals and cusum of squares stay within the 5 percent critical bound (represented by two straight lines whose equations are detailed in Brown et al 1975,) as shown in figures 4.2(b) and 4.2 (c), neither the recursive residuals nor CUSUM of squares plots cross the 5 percent critical lines, therefore, the study concludes that the estimated parameters for the short run dynamics and long run equilibrium of the growth model during deregulation are relatively stable. In order
words, a stable growth model exists over the entire sample period. From our results and findings, the study therefore concludes that there is no significant relationship between real income level (GDP), inflation rate, exchange rate, degree of openness, external debt stock, gross capital formation and total import demand in Nigeria over the period of this study. This implies that the above independent variables have significant impact on total import demand in ;lpNigeria during the period of our i=[]nvestigation.
References
Abdullahi, Sa'ada Abba and Suleiman, Hassan, An Analysis of the Determinants of Nigeria's Import (August 18, 2008). Available at SSRN: http://dx.doi.org/10.2139/ssrn.1232942
Bahmani-Oskooe et al (1998) Trade policy reform in developing countries since 1985; A Review of the Evidence. World Bank discussion paper.
Chenery, H.B. and A. Strout. (1966) Foreign Assistance and Economic Development. The American
Economic ReviewVol. 56, No. 4, Part 1 (Sep., 1966), pp. 679-733 Desai, D and Potter, R.B (2008). The companion to Development studies. Hodder Education, UK
Dutta, D. and A. Naasirudin (2006). An aggregate Import Demand Function for Indian. Available at https://crawford.anu.edu.au/acde/asarc/pdf/papers/2001/WP2001_02.pdf

West African Journal of Industrial and Academic Research December 2016 v0l.17 102
Egwaikhide, F.O. (1999) Determinants of Imports in Nigeria: A Dynamic Specification.African Economic
Research Consortium, Research Consortium, Research Paper no. 91. Nairobi, March 1999. Erlat, G. and Erlat, H., (1991) An Empirical Study of Turkish Export and Import Function. CBRTandMETU.Available@https://mpra.ub.uni-uenchen.de/4260/1/MPRA_paper_4260.pdf
Hemphill, W. L. (1974) The Effects of Foreign Exchange Receipts on Imports of Less Developed Countries, IMF
staff papers, vol. 27, 637-677. Hendry, D.F. (1989). PC-GIVE: An Interactive Econometric Modeling System. Oxford: Institute of Economics
and Statistics. Ho W. S (2004) Estimating Macao’s import demand functions, Monetary authority of Macao.
Johnsen, S. (1988) Statistical analysis of cointeration vectors. Journal of economic dynamics and control 12:231-
54 Johnsen S. and K. Juselius (1990) Maximum likelihood estimation and inference on cointegration with application
to the demand for money. Oxford bulletin of economics and statistics vol 52:269-270 Johansen, S. and K. Juselius (1990). Maximum Likelihood Estimation andInference on Cointegration with Applications to the Demand for Money. Oxford Bulletin of Economics and Statistics, 52: 169-210.
Johansen, S.and K. Juselius (1992). Testing Structural Hypothesis in a MultivariateCointegration Analysis of the PPP and the UIP for UK. Journal of Econometrics, 53: 211-44.
Johansen, S. and K. Juselius (1994). Identification of the Long-Run and the Short-Run Structure: An Application to the ISLM Model.Journal of Econometrics,63: 7-36
Mckinnon, R.I. (1964) Foreign Exchange Constraints in Economic Development and Efficient Aid Allocation, Economic Journal, vol. 74: 388–409. Mohammed, H.A. and T.C. Tang, (2000). Aggregate imports and expenditure components in Malaysia: Acointegration and error correction analysis.ASEAN Econ. Bull., 17: 257-269.
Mwega, F.M (1993) Import Demand Elasticities and stability during Trade liberalization: a case study of Kenya,
Journal of African Economies vol.2 National Economic Emancipation and Development strategy (NEEDS) Document 2003. Olayide, S.O (1968) Import demand model: an econometrics analysis of Nigeria’s import trade, the Nigerian
journal of economics and social studies vol. 10 no 3:303-319 Ozo-Eson, P.I. (1984) Determinants of Imports Demand in Nigeria: A monetary approach, The Nigerian Journal
of Economic and Social Studies, vol. 26, no. 1: 73–83.
Osei, Victor, 2012. Import Demand and Economic Growth Analysis in Ghana. Journal of Economics
andSustainable Development, 3 (14), 73-90.
Ozturk (1998). Macroeconomic factors affecting the import in Turkey.UOT
330.44www.qu.edu.az/downloads/articles/1072_971.pdf

West African Journal of Industrial and Academic Research December 2016 v0l.17 103
Application of Cluster Analysis For Data Driven Market Segmentation
AKOMOLAFE .A. A And ADEBOLA F.B
Department of Statistics, Federal University of Technology, Akure, Ondo state Nigeria
[[email protected]][[email protected]]
Abstract Despite the wide variety of techniques available for grouping individuals intomarket segments on the
basis of multivariate survey information, clusteringremains the most popular and most widely applied
method.Clustering is a popular and widely used method for identifying or constructing data based market
segments. Over decades of applying cluster analysis procedures for the purpose of searching for
homogenous subgroups among consumers, questionable standards of using the techniques have emerged
one of such is the black-box approach ignoring crucial parameters of the algorithm applied or the lack of
harmonization of methodology chosen and data conditions. This research work is all out to capture:
which standard of application of cluster analysis have emerged in the academic marketing literature,
compare their standards of applying the methodological knowledge about clustering procedures and
delineate sudden changes in clustering habits. These goals are achieved by systematically reviewing some
data-driven segmentation studies that apply cluster analysis for partitioning purposes. Keywords: Clustering, Black-Box Approach, Data-driven market segmentation and Homogeneous subgroup. Introduction The analysis of the consumer behavior is not only a key factor for the success of companies, but also gives a good insight in the way the society in which the consumers live, its orientation and its values. As Solomon et al. mention without understanding the way the consumer feel and think, it is almost impossible for a company to offer the products he wants and in the way he wants. This fact is amplified in the recent years by the fact that the bought products don’t represent anymore just some things which cover their needs, but they also describe the way the consumer is. Cluster analysis is a term that refers to a large number of techniques for grouping respondents based on similarity or dissimilarity between each other. Each technique is different; has specific properties, which typically (this is assuming that the data does not contain strong cluster structure) lead to different segmentation solutions. . As Aldenderfer and Blashfield (1984, p.16) say: “Although the strategy of clustering may be structure-seeking, its operation is one that is structure-imposing.” It is therefore very important to carefully select the algorithm that is to be imposed on the data. For instance, hierarchical procedures might not be
feasible when large data sets are used due to the high number of distance computations needed in every single step of merging respondents. Market segmentation is a central strategic issue in marketing, these issues depend on the quality of the market segments constructed or identified. Market segmentation is a marketing strategy which involves dividing a broad target market into subsets of consumers, businesses, or countries that have, or are perceived to have, common needs, interests, and priorities, and then designing and implementing strategies to target them. Market segmentation strategies are generally used to identify and further define the target customers, and provide supporting data for marketing plan elements such as positioning to achieve certain marketing plan objectives. Businesses may develop product differentiation strategies, or an undifferentiated approach, involving specific products or product lines depending on the specific demand and attributes of the target segment. This research focuses on clustering techniques exclusively which was first applied by Myers and Tauber (1977) and have since developed to become the major tool for segmentation purposes according

West African Journal of Industrial and Academic Research December 2016 v0l.17 104
to Wedel and Kamakura (1998). Knowing the behavior and the complex motives which drive the consumer to buy products helps not only the producers, but also the retailers to develop their strategies (Dabija, 2011). The aim of this research is to showcase the common practice for the purpose of market segmentation. The assumption underlying this investigation is that cluster analysis is typically used in a non-explorative manner (a black-box manner with lack of match using data conditions). Organizing data into clusters such that there is high intra-cluster similarity, low inter-cluster similarity or, finding natural groupings among objects. Area of application includes: Sociology, Biology, Psychology, Economics, and Engineering and medical or paramedical sciences. Source Of Data The data used is purely a secondary data culled from already prepared document of standard sales outlet in south western part of Nigeria. All the data were analyzed with respect to predefined criteria mirroring the issues known to be most crucial. Analysis And Results Among the segmentation studies investigated, the smallest sample size detected contains only 10 elements, the biggest one 20,000 (Table 1). Half of the studies (123, on some of the research work reported on more than one solution) with samples including fewer than 300
Table 1.Sample size statistics.
Mean 698 Median 293 Standard deviation 1697 Minimum 10 Maximum 20,000
Table 2.Statistics on the number of variable.
Mean 17 Median 15 Standard deviation 11.48 Minimum 10 Maximum 66
objects, data sets smaller than 100 were used by 52 studies (22%). The media sample size amounts to 293.
The range varies between 10 and 66 (Table 2). Nearly the thirds of the studies use less than 20 variables as segmentation base. About one fifth uses one to five variables; another fifth bases the segmentation solution on 11 to 15 variables. The number of sample size and the number of variable used is expected to be correlated, as large number of variables (high data dimensionality) requires large data set.
Surprisingly, both Pearson’s and spearman’s correlation coefficients render insignificant results leading to the inference that even very small sample sizes are used for clustering in very high dimensional attribute space. Due to lack of rules, the only recommendation that can be given concerning size of the ad variables is to critically question if the dimensionality is not too high for the number of cases to be grouped. Clustering Algorithm Clustering algorithm can be used in identifying the cancerous data set. Initially we take known samples of cancerous and non-cancerous data set. Label both the samples data set. We then randomly mix both samples and apply different clustering algorithms into the mixed samples data set (this is known as learning phase of clustering algorithm) and accordingly check the result for how many data set we are getting the correct results (since this is known samples we already know the results beforehand) and hence we can calculate the percentage of correct results obtained. Now, for some arbitrary sample data set if we apply the same algorithm we can expect the result to be the same percentage correct as we got during the learning phase of the particular algorithm. On this basis we can search for the best suitable clustering algorithm for our data samples. It has been found through experiment that cancerous data set gives best results with unsupervised nonlinear clustering algorithms and hence we can conclude the nonlinear nature of the cancerous data set.Varieties of clustering algorithms exist, some of them have restrictions in terms of the maximum number of cases in the data in other to keep calculative feasible e.g, hierarchical approaches (Aldenderfer and Blashfield, 1984), and others are known to structures. More clustering techniques are been developed permanently (e.g. neural networks
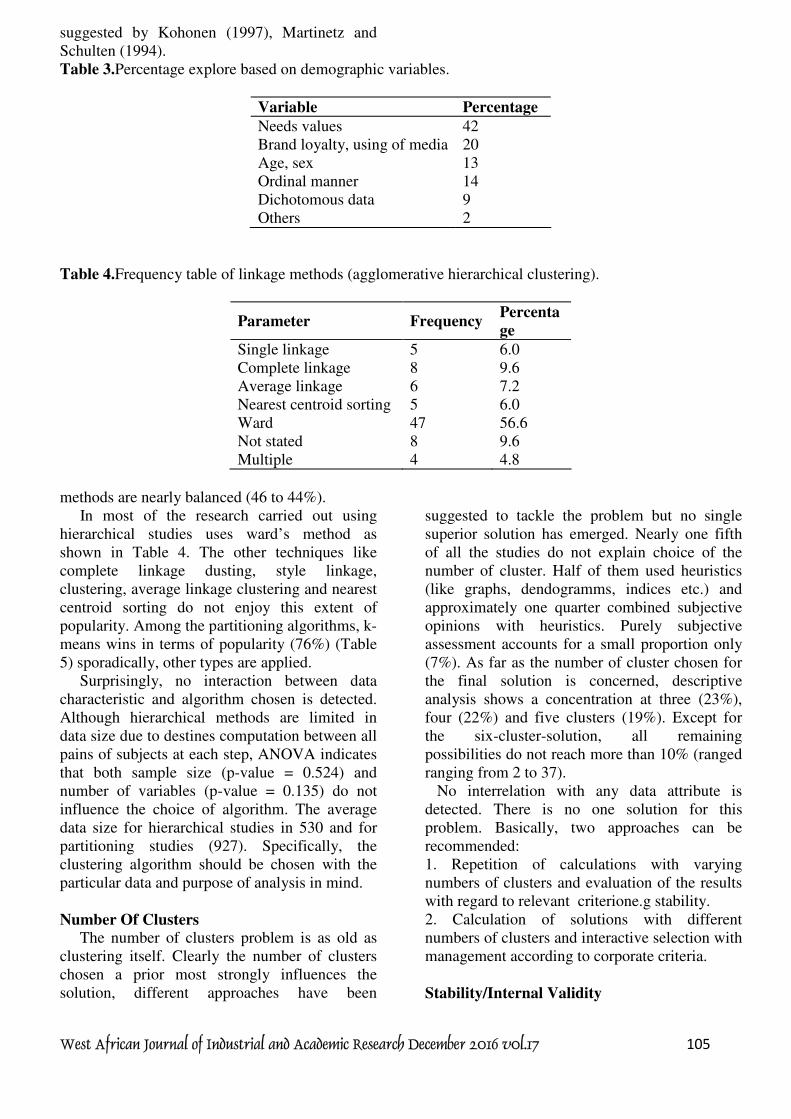
West African Journal of Industrial and Academic Research December 2016 v0l.17 105
suggested by Kohonen (1997), Martinetz and Schulten (1994).
Table 3.Percentage explore based on demographic variables.
Variable Percentage Needs values 42 Brand loyalty, using of media 20 Age, sex 13 Ordinal manner 14 Dichotomous data 9 Others 2
Table 4.Frequency table of linkage methods (agglomerative hierarchical clustering).
Parameter Frequency Percentage
Single linkage 5 6.0 Complete linkage 8 9.6 Average linkage 6 7.2 Nearest centroid sorting 5 6.0 Ward 47 56.6 Not stated 8 9.6 Multiple 4 4.8
methods are nearly balanced (46 to 44%).
In most of the research carried out using hierarchical studies uses ward’s method as shown in Table 4. The other techniques like complete linkage dusting, style linkage, clustering, average linkage clustering and nearest centroid sorting do not enjoy this extent of popularity. Among the partitioning algorithms, k-means wins in terms of popularity (76%) (Table 5) sporadically, other types are applied.
Surprisingly, no interaction between data characteristic and algorithm chosen is detected. Although hierarchical methods are limited in data size due to destines computation between all pains of subjects at each step, ANOVA indicates that both sample size (p-value = 0.524) and number of variables (p-value = 0.135) do not influence the choice of algorithm. The average data size for hierarchical studies in 530 and for partitioning studies (927). Specifically, the clustering algorithm should be chosen with the particular data and purpose of analysis in mind. Number Of Clusters The number of clusters problem is as old as clustering itself. Clearly the number of clusters chosen a prior most strongly influences the solution, different approaches have been
suggested to tackle the problem but no single superior solution has emerged. Nearly one fifth of all the studies do not explain choice of the number of cluster. Half of them used heuristics (like graphs, dendogramms, indices etc.) and approximately one quarter combined subjective opinions with heuristics. Purely subjective assessment accounts for a small proportion only (7%). As far as the number of cluster chosen for the final solution is concerned, descriptive analysis shows a concentration at three (23%), four (22%) and five clusters (19%). Except for the six-cluster-solution, all remaining possibilities do not reach more than 10% (ranged ranging from 2 to 37).
No interrelation with any data attribute is detected. There is no one solution for this problem. Basically, two approaches can be recommended: 1. Repetition of calculations with varying numbers of clusters and evaluation of the results with regard to relevant criterione.g stability. 2. Calculation of solutions with different numbers of clusters and interactive selection with management according to corporate criteria. Stability/Internal Validity

West African Journal of Industrial and Academic Research December 2016 v0l.17 106
Assuming that clearly separated clusters exist in the data, stability is no necessary criterion for the quality of the solution; it is most natural by-product with criteria like classification rate (if the true memberships are known) being the target, but typically such density clusters do not exist in empirical data.
Stability thus becomes a major issue in data-driven market segmentation as compared to the prior approach (Myers and Tauber, 1977). Stability has not been examined by 67% of the studies under investigation. Among the studies which did, the split-half-method (15%), analysis of hold-out-samples (4%) replication of clustering using other techniques (5%) were applied most often.
The recommendation is to validate results in as many ways as possible (e.g. by discriminant analysis on background variables and by multiple repetition of the actual clustering procedure with different numbers of clusters and different algorithms). Conclusion The assumptions about the use of cluster analysis for the purpose of market segmentation that motivated this review are supported to a high extent. A number of observations advocate the assumptions: (1) the typically non- explorative use of the explorative cluster analysis is mirrored by the fact that single runs of calculations are conducted and interpreted.
In only 5% of the studies, analytic procedures were repeated. (2) Indicators of the use of cluster analysis in a black-box manner include the fact that characteristics of the algorithm are not studied, the number of variables as related to sample size is not questioned critically and data format is ignored when applying measures of association as well as in data pre-processing. (3) Most applications ignored parameters that define any tool within the family of cluster analytic techniques. Using default settings leads to what was addressed as “lack of dependence of data requirements” in the introduction.
The algorithm chosen should depend on data size, the measure of association on data format, and the number of variables included on sample
size etc. instead of critically choosing the building components of the cluster analytic tool applied, most studies are based on ward’s hierarchical clustering or the k-means partitioning algorithm both using Euclidean Sdistance. Implications for data-based marketing research are obvious: the application of cluster analytic procedures for the purpose of data-driven segmentation studies should become more careful in the setting of parameters in order to substantially improve the quality of clustering outcome and reduce the proportion of “random results” which are interpreted in detail and misunderstood as best representation of the data in reduced space.
Researchers have to be aware of the fact, that cluster analytic techniques always render a result. This neither means that it is the only possible way of splitting customers into groups nor that the result is of any practical use to a company. Thus, thorough understanding of the procedures, Careful harmonization of algorithm and the data at hand and finally transparent reporting on the application of cluster analysis for segmentation is required to improve the quality of the application of this technique for the purpose of data-driven market segmentation. Reccommendation For Further Research Future contributions to the field of market segmentation by means of cluster analysis embrace all improvements in the methodology that supports researchers in optimizing the crucial decisions: choice of algorithm, number of clusters, algorithm parameters, optimal ratio of variables to sample size etc, for the time being the best way of dealing with these issues is to critically question each step and transparently report on the results to ease the interpretation of the value of a particular segmentation solution. Future contributions to the field of market segmentation by means of cluster analysis embrace all improvements in the methodology that supports researchers in optimizing the crucial decisions: choice of algorithm, number of clusters, algorithm parametersand optimal ratio of variables to sample size etc.

West African Journal of Industrial and Academic Research December 2016 v0l.17 107
References
Aldenderfer MS, Blashfield RK (1984). Cluster analysis series on quantitative applications in the social sciences.
Beverly hills: Sage Publications. Arabie P, Hubert LJ (1994). Cluster analysis in marketing research. In advanced methods in marketing research. Ed.
R. P. Bagozzi. Blackwell: Oxford, pp.160 – 189. Dolni-ar, S. and Leisch, F. (2000). Behavioral Market Segmentation Using the Bagged Clustering Approach Based on Binary Guest Survey Data: Exploring and Visualizing Unobserved Heterogeneity.Tourism Analysis, 5(2-4), 163-170. Dolni-ar, S. and Leisch, F. (2001). Knowing What You Get - a Conceptual Clustering Framework for Increased Transparency of Market Segmentation Studies. Paper presented at the Marketing Science, Edmonton, Canada. Dolni-ar, S. and Leisch, F. (2003). Winter Tourist Segments in Austria – Identifying Stable Vacation Styles for Target Marketing Action.Journal of Travel Research, 41(3), 281-193. Formann, A.K. (1984). Die Latent-Class-Analyse: Einführung in die Theorie und Anwendung.
Weinheim: Beltz. Frank, R. E., Massy, W. F. and Wind, Y. (1972).Market Segmentation. Englewood Cliffs: Prentice-Hall. Haley, R. J. (1968). Benefit Segmentation: A Decision-Oriented Research Tool. Journal of
Marketing, 32, 30-35. Ketchen DJ jr, Shook CL (1996). The application of cluster analysis in strategic management research: an analysis
and critique. Strategic management journal17(6):441-458. Kohonen T (1997). Self-organizing Maps, 2nd Edition. Berlin: Springer. 26-33
Ketchen D.J. jr. and Shook, C.L. (1996). The application of cluster analysis in strategic management research: an analysis and critique. Strategic Management Journal, 17(6), 441-458. Leisch, F. (1998).Ensemble methods for neural clustering and classification. Dissertation.Technical University of Vienna. Leisch, F. (1999).Bagged Clustering. Working Paper # 51, SFB ``Adaptive Information Systems and Modeling in Economics and Management Science'', http://www.wuwien. ac.at/am. Mazanec, J. A. (1997). Segmenting city tourists into vacation styles. In K. Grabler, G. Maier, J. Mazanec& K. Wober (Eds.), International City Tourism: Analysis and Strategy (pp.114-128). London: Pinter / Cassell. Mazanec, J. A. (2000). Market Segmentation.In J. Jafari (Ed.), Encyclopedia of Tourism.
London: Routledge. Mazanec, J. and Strasser, H. (2000).A Nonparametric Approach to Perceptions-Based
Market Segmentation: Foundations. Berlin: Springer. Milligan, G.W. and Cooper, M.C. (1985). An examination of procedures for determining the number of clusters in data sets. Psychometrika, 50, 159-179. Milligan, G.W. (1981). A montecarlo study of thirty internal criterion measures for cluster analysis. Psychometrika, 46(2), 187-199. Myers, J.H. and Tauber, E. (1977).Market structure analysis. Chicago: American Marketing Association.
Leisch F (1998). Ensemble methods for neural clustering and classification.Discertation. Technical University of Vienna
Leisch F (1999). Bagged clustering. Working paper #51, SFB “adaptive information systems and modeling in economics and management science”, http://www.wuwien,ac.at/am
Martinetz T, Schulten K (1994). Topology representing networks. Neural Networks 7: 507-522. Myers JH, Tauber E (1977). Market structure analysis. Chicago: American Marketing Association. 38-49. Wedel M, Kamakura W (1998). Market segmentation – conceptual and methodological foundations. Boston: Kluwer
academic publishers. Vol 5:203-215 Thorndike, R.L. (1953). Who belongs in the family? Psychometrika, 18(4), 267-276. Wedel, M. and Kamakura, W. (1998). Market Segmentation - Conceptual and
Methodological Foundations.Boston: Kluwer Academic Publishers Figure 8b: This thermal image shows a thermal bridging of a high-rise building

West African Journal of Industrial and Academic Research December 2016 v0l.17 108
#
External Trade and its implications on Foreign Exchange Reserves in Nigeria
Alwell Nteegah and Godspower Ebimotimi Okpoi
Department of Economics, University of Port Harcourt
Corresponding author’s email: [email protected]
Abstract The fluctuations in Nigeria’s foreign exchange reserves and the increase in both import and export trade
make it imperative to determine how trade has influenced the country’s foreign reserves. Utilizing data on
foreign reserves, oil imports, non-oil imports, oil export, non-oil exports and exchange rate in Nigeria
during the period 1980 – 2015 and analysing it using the cointegration and Vector Error Correction
Model, the findings revealed that foreign trade has serious implications for Nigeria’s foreign reserves.
This is evidenced from the causality test results which revealed that oil import, non-oil imports, oil
exports, non-oil exports and exchange rate propelled foreign reserves. Also the Vector Error Correction
result indicates that oil and non-oil export are positively and correctly signed hence has positive
implication on foreign reserves while oil and non-oil imports were negatively signed implying that they
retarded foreign reserves in Nigeria. Specifically, oil export, non-oil imports and exchange rate were
significant at 5 percent. This implies that they impacted significantly on foreign exchange reserves in
Nigeria during the period covered by the study. Based on these findings, we suggestthe need to diversify
the country’s export base and eliminating frivolous imports as possible measures of improving foreign
reserves in Nigeria.
Introduction In recent years, global foreign exchange reserves have increased tremendously and significantly. This growth in foreign exchange reserves is a reflection of the huge concern countries attach to holding sufficient volume of international exchange reserves. Some of the reasons for keeping foreign exchange reserves include:to protect the value of the local currency,settle international payment responsibilities, especially, financing foreign trade needs, accumulation of wealth,exchange rate management, improving the credit worthiness of an economy, and to provide a safety nets for future external shocks among others. Foreign exchange reserves accumulation in emerging economies is directly related to the rise in the currentaccount deficit in countries whose currency is used for accumulation, especially in the United States. Consequently,adjustments in the United States dollar have serious costs implications for other countries of the world, mostly in countries which foreign exchange reserves accumulation is in dollars. The emerging economies experienced show the
importance of theaccumulation of foreign exchange reserves in order to solve precautionary problems, capital flows instability and other developments that may negatively affect expectationsKruskovic and Tina (2014). For over thirty years now, numerous policy initiatives and strategies in the administration of its foreign exchange reserves have been taken by the Nigerian government. However, very marginal outcome was realized due to the fact that structures put in place then could not provide enough support for efficient foreign reserves management. Since the 1970s, the Nigerian economy has consistently relied on oil exports as the major source of her foreign exchange earnings and local revenue source with the enormous cycles of economic booms and recessions.Fortunately for Nigeria and most oil dependent economies, world oil prices began to rise again in the year 1999 resulting in a well-managed boom and unprecedented accumulation in the level of foreign reserves rising from USD4.98 billion by the end of May 1999, to USD59.37 billion by the end of first quarter of 2007.

West African Journal of Industrial and Academic Research December 2016 v0l.17 109
Building on the earlier works of Lardell-mills (1989) and Borodo andEichengreen (1998), Lane and Barke (2001) in their investigation and concluded that “tradeopenness is easily the most important factor in explainingcross-country variation in external reserve”. They further note that “there are facts that financial development mostly among industrial countries, country size and external volatility are association with an increase in thereserves/GDP ratio”. Their study found developing and low income countries to have negative partial correlation between external debt andreserves. In a study by Usman and Ibrahim (2010) on aggregation of foreign exchangereserves with implications for investment,price level and change in exchange rate, using Vector Error Correction(VEC), the authors found that demand for externalreserves in Nigeria was majorly influenced by currentaccount variability, actualrate of exchange and opportunitycost of reserves accumulation (estimated by the variationbetween the real return on domestic investments and real return on reserves. They argued that their findings are in tandem with those of Adam and Leonce (2007) who found that “demand for foreign exchange reserve in Africa is determined by export trade, real national income growth and forgone cost of holding reserves. These are evidence to show that external reserve in most countries including Nigeria depends significantly on external trade. Given the vagaries in trade and external reserves accumulation in Nigeria over the years, it pertinent to investigate the implication of external trade on the level of foreign exchange accumulation in Nigeria over the period 1985 – 2014. Hence the objectives of this paper are to analyse the trend in external trade and external reserve accumulation in Nigeria and the extent to which external trade has impacted on the accumulation of external reserve. In the remaining part of this paper, we shall review relevant literature, explain the methodology adopted to achieve the objectives, analyse the data and expose the findings and recommendations. Literature Review The benefits of foreign reserves as a shock absorber of crisis associated with external economic transactions cannot be overemphasized. Fischer (2001), emphasizes this position by positing that there is a restriction to
the level of foreign exchange reserves required to prevent thefinancial crisis, given the fact that accumulation oflarge foreign reserves implyhigher costs. If foreignexchange reserves holding is spurred by preventable desires, it should terminate at thelevel where the country has reached its optimal level. In addressing the issue of what constitute an adequate foreign reserve.Frenkeland Jovanovic (1981) argued that some of the conditions for the demand for foreignexchange reserves of an economy centres on variables, like total trade (import and export), external debt, possible trade shocksseverity and considerations of monetary policy. Also in his study, Shcherbakov (2002) argued that, there are some common parameters used to assessed the adequacy of foreignreserves for an economy. To the author, some of these measures show the level of foreign weakness of an economy and the ability of foreign exchange reserves to guide against this vulnerability. These parameters are: sufficiency of imports, adequacy of debts and monetarysufficiency. Notwithstanding, recently, an active strategy for foreign exchange reserves administration appears to centre on the creation of future wealth for a country. This happens when exchange rate, debt management and monetary policy issues to central banks are of marginal interest. On the hand, when weaknesses in thefinancial and corporate sectors are low; when government seriously drives a flexibleexchange rate policy; and when the government has an efficient fiscal policy and sound management framework as well ashighly developed domestic financial markets, in this case, the foreign exchange reserves portfolio is organised into active and non-active parts. The inactive portfolio centre on macroeconomic objectives concentrating on mainly finance while the active portfolio is used for maximising profit, taking into consideration the objective of liability management (Carlos et al 2004). Peter and Machiel(2004) arguing in tandem with the motive of profit maximization to foreign exchange reserves administration,posits that, “over a decade now, foreign currency reserves administration has changed itsaim from sustaining liquidity and economic protection objectives to that of maximizing total profit”. In analysing the impact and factors that influences external reserves, Umeora (2013) investigated accumulation of external reserves and its effects on exchange rates and inflation in

West African Journal of Industrial and Academic Research December 2016 v0l.17 110
Nigeria using ordinary least squares regressionanalysis. He found that foreignexchange reserves do not have significant effect on foreign exchange rate. The study also discovered that foreign exchange reservesdo not have significant effects on inflation in Nigeria. In analysing the factors that influences foreign exchange reserves in Nigeria over the period of 1999 to 2011, Irefin and Yaaba (2012) used the Autoregressive Distributed Lag (ARDL) to investigate restructured econometrics the ‘Buffer Stock Model’ of (1981) by Frenkel and Jovanovic with emphasis on level of income,interest rate, imports and exchange rate. Their findings altered the presence of buffer stock model forforeign exchange reserves aggregation and provided vital indicators in support oflevel of income as the key variable influencing reservesaggregation in Nigeria. Chowdhury et al (2014) recently conducted an empirical analysis of the factors influencing foreignexchange reserves in Bangladesh, applying the Augmented Dicky Fuller (ADF) test,to analyse unit roots properties of the variables and Engle Granger residual based co-integration test to examine the long run relationship among thevariables, and some diagnostic tests for better modelling, results of the analyses revealed thepresence of strong relationship among foreign exchange reserves, exchange rate, remittances, domestic interest rate,broad money, United Payment Interface (UPI) of export and import, and per capita income. The study therefore suggested an efficient exchange rate administration, strong remittance related policies, quality products for exports trade and sustainable national income level as possible measures thatcan enhance healthy amount of foreign exchange reserves for a developing country like Bangladesh. Abdullateef and Waheed (2010) extended the study on the factors contributing to foreign exchange reserves byinvestigating the effect of variation in external reserve positions of Nigeria on domestic investment, price level,and exchange rate during the period 1986 to 2006. Using the Ordinary Least Square (OLS) and vector error correction (VEC)estimation techniques, they found that change in foreign exchangereserves in the country affect only foreign directinvestment (FDI) and exchange rates, and do not affect local investment and price level.
The results further indicated that there is the need for comprehensiveforeign reserve management strategies that will focus onmaximizing the benefits from oil export revenue by usingmore of these resources to improve local investment. Chin-Hong, et al (2011) affirms the nexus between foreign exchange reserves and factors affecting it suchas, income level, exchange rate, balance of payments and the real cost of foreign exchange reserves aggregation in Malaysiafor the period 1975 to 2007. The co-integration test technique was used to analyse the data and the findingsshowed that the foreign exchange reserves and the identified factors affecting it were co-integrated. The implicationsof the findings are that the government needs to understand the vital variables which can significantly influence thevolume of foreign exchange reserves to enable the country have better focus on how to maintain foreign exchange reserve sufficiency. Charles-Anyaogu (2012) in his study on the relationship between selected macroeconomic factors and external reserve inNigeria, utilized econometric analytical techniques of VAR and Wald tests and discovered that past values of gross domestic product explain the current values of foreign exchange reserves significantly. The result of the model further indicated thatexternal reserve was significant statistically in the year of study but insignificant in past years;while among the macroeconomic variables only inflation was found to have serious implication on foreign exchange reserves while trade balanceand exchange rate were found to have less impact on foreign exchange reserve. In a study by Osuntogun, et al (1997), theypointed out the strength in expandingthe Nigeria’s non-oil exportto non-traditional markets and found that the country could not fully maximize her productive potentials due to thefact that execution of export promotion policies followed basic market concentration strategy i.e. concentration onadvanced economies like Europe or USA, thereby leading to less focus to assembling trade facilitatinginformation that may further widen Nigeria’s export market to underdeveloped economies such as the economies in Sub-Saharan Africa. To them,trade within the continent, if pursued, will require cheaper transport andenhance the competitiveness of goods and services traded and ensure market clearing of

West African Journal of Industrial and Academic Research December 2016 v0l.17 111
export goods therebydiminishing the problems faced in exports by developing economies. Lyakurwa (1991) argued further that export diversification is very crucial because it plays a vitalrole in minimizing the variation in exports earnings of less developed economies and increasing the growth rates of both exports and local production. However, the constituents of a diversifying economy’s exports have to be in tandem with theimport composition of the target economies. Lewis (1980) in hisstudy also discoveredthat diversification of exports could assist most economies achieve asustainable high level of economic growth and development. Opara (2010) submittedthat exports trade is the background of any economic prosperity which is centred meaningfully on export of non-oil commodities in most economies of the world. He added that the encouragement non-oil export could lead to a reduction of an economy’s level of dependence on crude oil. The review above shows that very few studies have been done on the impact of trade on foreign reserve accumulation. For instance, Charles-Anyaogu (2012) in his study examined trade under macroeconomic factors that affect external reserve. Also Chin-Hong, et al (2011) in investigating the determinants of external reserve in Malaysia identified balance of payment as a proxy for trade. This study deviated from others by examining the impact of trade: imports and exports on external reserve in Nigeria over the period 1980 – 2015. Methodology Theoretical and Analytical framework The theoretical basis for this paper is centred on the argument that as most countries engage in international trade, foreign reserves would be important to ensure that trade would not be interrupted in the event of a drastic drop in the inflow of foreign exchange into the country, due to, financial crisis. Conventionally, it is expected that the Central bankshould hold,at least, an amount of foreign currency equivalent to three months of imports. As commercial openness increases it could increase foreign reserves. Also, as imports grew, reserves should grow as well to maintain the ratio. Though few studies reviewed emphasized the relationship between export trade and foreign reserve accumulation. For instance, Charles-Anyaogu (2012) in his study on external reserve and macroeconomic variables inNigeria, employed econometric tools of VAR and Wald
tests and found that only inflation has serious implication on external reserves while trade balanceand exchange rate where insignificant. Chin-Hong, et al (2011) studied the relationship between international reserves and its determinant suchas, economic size, exchange rate, balance of payments and the opportunity cost of reserves holding in Malaysia for the period 1975 to 2007. Using the Cointegration approach, the resultsshowed that the international reserves and the specified determinants were cointegrated. The implicationsof the study were that the government needs to know the important factors which can significantly affect thelevel of international reserves to enable it gain better insight on how to maintain reserve adequacy. Given the critical role trade play in enhancing foreign reserve accumulation, the paper specified a functional nexus between foreign exchange reserve as dependent variable and external trade as independent variable thus: FERX = f(OMP, NOMP, OEX, NOEX, EXR)--(1) Where: FERX = Foreign exchange reserve, OMP = oil import, NOMP = non-oil imports, OEX = oil export, NOEX =non-oil exports, EXR = exchange rate of the naira to the United States Dollar. In the estimation process, parameters and a disturbance term “U” are incorporated into the model to take care of variables not included in the model but affect foreign exchange reserves. Therefore, equation 1 above could be transformed as follows: FERXt = αo(OMPt)
α1(NOMPt) α2(OEXit)
α3
(NOEXt) α4(EXRt)
α5eUt2 In order to estimate the above model using ordinary least squares, equation 2 could be transformed into a log -linear form by taking the natural log of the variables as follows: LnFERXt
=αo+α1lnOMPt+α2lnNOMPt+α3lnOEXt+α4lnNOEX+α5EXR+Ut 3 α1, α2, α3, α4, and α5 are elasticities of oil imports, non-oil imports, oil exports, non-oil export, and exchange rate in Nigeria. Apriori expection is that α 1<0, α 2<0, α 3 >0, α 4>0, and α 5 <0. Estimation Procedure and Results

West African Journal of Industrial and Academic Research December 2016 v0l.17 112
To really ascertain the impact of external trade on external reserve in Nigeria, annual data was collected on foreign reserve, oil import, non-oil import, oil export, ono-oil export and exchange rate for the period 1980 - 2015. To enhance detail analysis, we undertook a descriptive analysis of the data using the
descriptive statistics, this is followed by the unit roots test using the Augmented Dickey Fuller (ADF) and Philip –Perron methods, cointegration and Vector Error Correction Mechanism (VECM), Granger Causality tests on the foreign exchange reserve model. The results of the analyses are presented as follows:
Table 1. Descriptive Statistics of the Variables in the Model
Statistic FERX OMP NOMP OEX NOEX EXR
Mean 15.60720 563.1286 1789.003 3590.209 187.7486 66.73036
Median 7.298546 166.9000 650.9000 1169.500 23.30000 21.88610
Maximum 53.59929 3064.300 8323.700 14323.20 1130.200 158.5500
Minimum 0.932990 0.100000 5.100000 7.200000 0.200000 0.550000
Std. Dev. 18.11571 886.3001 2565.016 4866.790 329.7958 64.09348
Skewness 0.994049 1.767604 1.446662 1.150452 1.733303 0.253326
Kurtosis 2.320846 4.934207 3.699260 2.827943 4.502901 1.239995
Jarque-Bera 6.436763 23.68167 12.92125 7.763817 20.81926 4.891708
Probability 0.040020 0.000007 0.001564 0.020611 0.000030 0.086652
Sum 546.2521 19709.50 62615.10 125657.3 6571.200 2335.563
Sum Sq. Dev. 11158.09 26707945 2.24E+08 8.05E+08 3698020. 139671.1
Observations 35 35 35 35 35 35
The descriptive statistics result in table 1 indicates that foreign exchange reserves has mean value of $15.6billion with minimum value of $0.9billion, maximum value of $53.6billion and standard deviation of $18,1billion. Oil import stood at N565.1billion on an average with a minimum value of N0.1billion, maximum value of N3064.3billion and standard deviation of N886.3billion. Non-oil imports under the period under investigation stood at N1789.0bilion on the average with minimum import value of N5.1billion, maximum of N8323.7billion and standard deviation of N2565.0billion. Oil export in Nigeria has mean value of N3590.2billion with minimum oil export value of N7.2billion, maximum value of N14323.2billion and standard deviation of N4866.8billion. Nigeria’s non-oil export stood at N187.7biilion on the average with minimum value of N0.2billion, maximum value of N1130.2billion and standard deviation of N329.8billion. Exchange rate of the naira to the United States
Dollar averaged N66.7 with minimum rate of N0.56, maximum rate of N158.6 and standard deviation of N64.1 to a dollar. The results above show that the variables all witnessed increasing trend over the period under investigation. However, Nigeria has fared poorly possibly due to inappropriate application of resources. The stationarity tests results reported in tables
2 show that all the variables under consideration- foreign exchange reserve(FERX), oil import (OMP), non-oil import(NOMP), oil export (OEX) non-oil export (NOEX) and exchange rate attained stationarity at first difference. This implies that the variables are integrated of order one i.e i(1). These results show that the null hypotheses of non-stationarity for the variables under investigation are rejected. Based on the stability of the variables, we went further to establish whether or not there is a long run cointegrating relationship among the variables by using the Johansen full information maximum likelihood method
. Table 2: Unit Root Tests Result
Augmented Dickey Fuller (ADF) Test Statistic Philip-Perron (PP) Test Statistic
Variable ADF Statistic
1% 5% 10% Decision PP Statistic
1% 5% 10% Decision
Log(FERX) -4.941248 -3.653730 - - i(1) - - - - i(1)

West African Journal of Industrial and Academic Research December 2016 v0l.17 113
2.957110 2.617434 5.417770 3.646342 2.954021 2.615817
Log(OMP) -6.899154 -3.639407 -2.951125
-2.614300
I(1) -6.892795
-3.639407
-2.951125
-2.614300
i(1)
Log (NOMP) -7.320029 -3.639407 -2.951125
-2.614300
I(1) -7.223385
-3.639407
-2.951125
-2.614300
i(1)
Log (OEX) -5.790116 -3.639407 -2.951125
-2.614300
I(1) -5.789090
-3.639407
-2.951125
-2.614300
i(1)
Log (NOEX) -6.477332 -3.639407 -2.951125
-2.614300
I(1) -7.517711
-3.639407
-2.951125
-2.614300
i(1)
Log(EXR) -5.257780 -3.639407 -2.951125
-2.614300
I(1) -5.257780
-3.639407
-2.951125
-2.614300
i(1)
The Johansen cointegration tests indicates that the trace and maximum eigenvalue statistics show the existence of four (4) and two (2) cointegrating equations/relationships respectively between foreign reserves and the variables influencing it at 5 percent level of significance. The implication of this result is that there exists a
unique long run relationship between foreign reserves, oil import, non-oil import, oil export, non-oil export and exchange rate. The identified cointegrating equation(s) can then be used as an error-correction term (ECM) in the error correction model
. Table3.Cointegration Test Result
Series: LOG(FERX) LOG(OMP) LOG(NOMP) LOG(OEX) LOG(NOEX) LOG(EXR)
Lags interval (in first differences): 1 to 2
Unrestricted Cointegration Rank Test (Trace)
Hypothesized Trace 0.05
No. of CE(s) Eigenvalue Statistic Critical Value Prob.**
None * 0.898281 171.1775 95.75366 0.0000
At most 1 * 0.744342 98.04035 69.81889 0.0001
At most 2 * 0.469694 54.39506 47.85613 0.0107
At most 3 * 0.463813 34.09744 29.79707 0.0150
At most 4 0.280023 14.15275 15.49471 0.0788
At most 5 0.107508 3.639597 3.841466 0.0564
Trace test indicates 4 cointegrating eqn(s) at the 0.05 level
* denotes rejection of the hypothesis at the 0.05 level
**MacKinnon-Haug-Michelis (1999) p-values
Unrestricted Cointegration Rank Test (Maximum Eigenvalue)
Hypothesized Max-Eigen 0.05
No. of CE(s) Eigenvalue Statistic Critical Value Prob.**
None * 0.898281 73.13719 40.07757 0.0000
At most 1 * 0.744342 43.64529 33.87687 0.0025
At most 2 0.469694 20.29762 27.58434 0.3209
At most 3 0.463813 19.94469 21.13162 0.0726
At most 4 0.280023 10.51316 14.26460 0.1804
At most 5 0.107508 3.639597 3.841466 0.0564
Max-eigenvalue test indicates 2 cointegrating eqn(s) at the 0.05 level
* denotes rejection of the hypothesis at the 0.05 level
**MacKinnon-Haug-Michelis (1999) p-values

West African Journal of Industrial and Academic Research December 2016 v0l.17 114
Table 4: Parsimonious Vector Error Correction Model Dependent Variable: DLOG(FERX)
Sample (adjusted): 1983 2014
Included observations: 32 after adjustments
Variable Coefficient Std. Error t-Statistic Prob.
C 0.160013 0.088604 1.805934 0.0853
DLOG(OMP) -0.265771 0.139519 -1.904915 0.0706
DLOG(NOMP) -0.589801 0.278855 -2.115078 0.0465
DLOG(NOMP(-1)) -0.319568 0.160127 -1.995723 0.0591
DLOG(OEX) 0.706237 0.218596 3.230780 0.0040
DLOG(NOEX(-2)) 0.065803 0.134554 0.489047 0.6299
DLOG(EXR) -0.601452 0.204934 -2.934855 0.0079
DLOG(EXR(-1)) 0.438228 0.182130 2.406125 0.0254
DLOG(FERX(-1)) 0.290747 0.129474 2.245604 0.0356
DLOG(FERX(-2)) 0.204640 0.137710 1.486020 0.1521
ECM(-1) -0.620674 0.162005 -3.831196 0.0010
R-squared 0.724829 Mean dependent var 0.092769
Adjusted R-squared 0.593795 S.D. dependent var 0.459650
S.E. of regression 0.292954 Akaike info criterion 0.648687
Sum squared resid 1.802269 Schwarz criterion 1.152534
Log likelihood 0.621001 Hannan-Quinn criter. 0.815698
F-statistic 5.531613 Durbin-Watson stat 2.054303
Prob(F-statistic) 0.000484
Findings The results so far show that the variables in the foreign exchange reserve model in equation 3 tend to move together in same direction in the long run as predicted by economic theory. In the short run, variations from this relationship could occur due to shocks to any of the variables. Also, the dynamics governing the short run behavior of foreign reserves are distinct from those in the long run. As a result of this distinction, the short run interactions and the adjustments to long run equilibrium are vital because of policy implications. Engle and Granger (1987) argued that, if cointegration exists between nonstationary variables, then an error-correction is applicable for these variables just like the one specified in equation 4 below. Based on the fact that the variables of the foreign exchange reserves equation are cointegrated, the next procedure is the analysis of the short run dynamics within a Vector Error Correction model (VECM). This takes the simple instance of estimating a model involving only two variables, Y and K, and the general form of the VECM could be written thus:
Yit = e + f it+ gj∑ Kit-1 + hj∑ Yit-1 + nECMit-1 + uit 4
Where: i = number of banks
= first difference of a series e,f,g,h, n are the parameters of the model to be estimated j = the number of lags included for the first difference of both the dependent and explanatory variables ECMt-1 is the lagged error correction term, that is, the fitted residuals from the co-integrating equation; t represents time period and ut is a white noise error term. The result in shows that oil and non-oil exports are positively signed. However, only oil export is statistically significant at 5 percent level. The positive sign of oil and non-oil exports is consistent with the prediction of economic theory, and it suggests that as exports trade increase, foreign reserves of Nigeria also increased over the period of this study. This result highlights the crucial role of exports trade in foreign exchange reserves accumulations. Oil and non-oil import are consistent with theoretical economic expectations with negative sign. This implies that import trade retarded foreign reserve accumulation in Nigeria over the period of this study. An increase in imports lead to depletion in a country’s external reserves since

West African Journal of Industrial and Academic Research December 2016 v0l.17 115
its serves as a backup for trade. It is also important to note that import constitute a leakage to the resources of an economy. Nigeria has been an import dependent economy hence the continuous depletion of her foreign reserves. (see appendix A). Exchange rate has mixed result with a positive sign at lag 1 and negative sign at level. However, the variable is significant at 5 percent level both at level and lag 1. This implies that exchange rate has significant negative and positive implications on foreign reserve of Nigeria. For an export based country, a fall in domestic exchange rate boosts export trade and spur external reserves but in an import dependent country, depreciation in exchange rate will lead to depletion in foreign reserves. The VECM indicate how the model/variables adjusts to the long run equilibrium as demostrated by the cointegrating equations. As expected, the error-correction term (ECMt-1) is of the expected negative sign and significant in the foreign reserves function. This result substantiates the findings of cointegration among the variables reported earlier. The coefficient of determination indicates that about 59 percent of the total variation in Nigeria’s foreign reserves is influenced by
changes in oil import, non-oil imports, oil export, non-oil export and exchange rate over the period under investigation. At 2.05, the Durbin Watson statistics does not suggest evidence of autocorrelation. Furthermore, the crucial issue for empirical analysis is the stability of variables of the performance equation. It is pertinent to incorporate short-run dynamics in testing for stability of the long run parameters of the foreign reserves model. To this end, this study adopted the Bahmani-Oskooee and Shin (2002), stability test procedure as well as the cumulative sum of recursive residual (CUSUM) to the residuals of the parsimonious model. For stability of the short run dynamics and the long run parameters of the foreign reserves function, it is inevitable that the recursive residuals and CUSUM of squares stay within the 5 percent critical bound represented by two straight lines whose equation are detailed in Brown et al (1975). As shown in figures 1 and 2, neither the recursive residuals nor CUSUM of squares plots cross the 5 percent critical lines, therefore, we can conclude that the estimated parameters for the short- run dynamics and the long-run of the foreign reserves function are relatively stable. That is, a stable foreign reserves function exists over the period under investigation
. Tests- Recursive Residual
-1.6
-1.2
-0.8
-0.4
0.0
0.4
0.8
1.2
1.6
86 88 90 92 94 96 98 00 02 04 06 08 10 12 14
Recursive Residuals ± 2 S.E. Figure 1. Stability

West African Journal of Industrial and Academic Research December 2016 v0l.17 116
-16
-12
-8
-4
0
4
8
12
16
86 88 90 92 94 96 98 00 02 04 06 08 10 12 14
CUSUM 5% Significance Figure 2. Stability Tests- CUSUM
Table 5. Pairwise Granger Causality Tests Result
Pairwise Granger Causality Tests
Sample: 1980 2015
Lags: 2
Null Hypothesis: Obs F-Statistic Prob.
LOG(OMP) does not Granger Cause LOG(FERX) 33 4.92616 0.0147
LOG(FERX) does not Granger Cause LOG(OMP) 0.28716 0.7526
LOG(NOMP) does not Granger Cause LOG(FERX) 33 5.76877 0.0080
LOG(FERX) does not Granger Cause LOG(NOMP) 1.02262 0.3727
LOG(OEX) does not Granger Cause LOG(FERX) 33 6.98842 0.0035
LOG(FERX) does not Granger Cause LOG(OEX) 2.41601 0.1077
LOG(NOEX) does not Granger Cause LOG(FERX) 33 6.87674 0.0037
LOG(FERX) does not Granger Cause LOG(NOEX) 0.23638 0.7910
LOG(EXR) does not Granger Cause LOG(FERX) 33 4.71890 0.0171
LOG(FERX) does not Granger Cause LOG(EXR) 0.04169 0.9592
LOG(NOMP) does not Granger Cause LOG(OMP) 34 0.11904 0.8882
LOG(OMP) does not Granger Cause LOG(NOMP) 9.61007 0.0006
LOG(OEX) does not Granger Cause LOG(OMP) 34 0.09304 0.9114
LOG(OMP) does not Granger Cause LOG(OEX) 6.14170 0.0060
LOG(NOEX) does not Granger Cause LOG(OMP) 34 1.32571 0.2812
LOG(OMP) does not Granger Cause LOG(NOEX) 2.57776 0.0932
LOG(EXR) does not Granger Cause LOG(OMP) 34 2.46835 0.1023
LOG(OMP) does not Granger Cause LOG(EXR) 1.28141 0.2929
LOG(OEX) does not Granger Cause LOG(NOMP) 34 5.51150 0.0094
LOG(NOMP) does not Granger Cause LOG(OEX) 0.37660 0.6895
LOG(NOEX) does not Granger Cause LOG(NOMP) 34 1.66407 0.2069
LOG(NOMP) does not Granger Cause LOG(NOEX) 0.32949 0.7219
LOG(EXR) does not Granger Cause LOG(NOMP) 34 8.82550 0.0010
LOG(NOMP) does not Granger Cause LOG(EXR) 0.07663 0.9264
LOG(NOEX) does not Granger Cause LOG(OEX) 34 0.29054 0.7500
LOG(OEX) does not Granger Cause LOG(NOEX) 0.88908 0.4219
LOG(EXR) does not Granger Cause LOG(OEX) 34 7.89375 0.0018
LOG(OEX) does not Granger Cause LOG(EXR) 0.69876 0.5054
LOG(EXR) does not Granger Cause LOG(NOEX) 34 2.84401 0.0745

West African Journal of Industrial and Academic Research December 2016 v0l.17 117
Source: computed result The pairwise Granger causality test result in table 5 shows that oil imports, non-oil imports, oil exports, non-oil exports and exchange rate have unidirectional causation with foreign reserves. This implies that oil imports, non-oil imports, oil exports, non-oil exports and exchange enhanced foreign reserve but foreign reserve did not determine oil imports, non-oil imports, oil exports, non-oil exports and exchange rate in Nigeria over the period of this study. 3.3. Concluding Remarks The results and findings of this work have demonstrated that foreign trade has serious implications on foreign reserves of Nigeria. This is evidenced in the causality test results which
shows that oil import, non-oil imports, oil exports, non-oil exports and exchange rate propelled foreign reserves. Also the Vector Error Correction result indicates that oil and non-oil export are positively and correctly signed hence has positive implication on foreign reserves while oil and non-oil imports were negatively signed implying that they retarded foreign reserves in Nigeria. Specifically, oil export, non-oil imports and exchange rate were significant at 5 percent. This implies that they impacted significantly on foreign reserves in Nigeria over the period of this study. Based on these results, the paper suggests the improvement in exports base, diversification of exports and review of imports trade as possible measures of improving foreign reserves in Nigeria.
References
Abdullateef .U. and Waheed .I. (2010). External Reserve Holdings in Nigeria: Implications for Investment, Inflation and Exchange Rate. Journal of Economics and International Finance, Vol.2 (9), pp.
183-189.
Adam E. & Leonce N. (2007). Reserves Accumulation in African Countries-Sources, Motivation and Effects. African Economic Conference. Abebefe, H. A. (1995). The structure of Nigeria’s external trade. Central Bank of Nigeria Bullion, 19 (4). Bordo M and Eichengreen B. (1998). The Rise and Fall of a Barbarous Relic: The Role of Gole. Mimeo. Universityof California, at Berley. Bastourre, D, Jorge C, and J. Ibarlucia(2009).What is driving reserve accumulation? A dynamic panel data approach.Review of International Economics vol.17 no.4: 861–877. Bordo M and James, A. (2008) The IMF as a reserve manager. Voxeu.org. Retrieved on 18 July 2013.
Charles-Anyaogu, .N. (2012).External reserves: causality effect of macroeconomic variables in Nigeria (1980-2009). Kuwait Chapter of Arabian Journal of Business and Management Review, 1 (12)
Carlos, B., C. Pierre, C. Joachim, X. D. Francis, and M. Simone, (2004): Risk Management forCentral Bank Foreign Reserves. European Central Bank, April. Chin-Hong, P. Mohamad.J, Affendy .A, and Oi-Khim .L. (2011). Determinants of International Reserves in Malaysia. International Journal of Business Research, Vol. 11(4).
Chowdhury N.M, Uddin M.J, and Islam M.S. (2014). An Econometric Analysis of the Determinants of Foreign Exchange Reserves in Bangladesh. Journal of World Economic Research. Vol. 3(6), pp. 72-82.
Central Bank of Nigeria (CBN). Central Bank of Nigeria: Reserves Management. http://wwwcenbank.org/intops/reservesmgmt.asp retrieved25/4/2012. Fischer, S. (2001): Opening Remarks. IMF/World Bank International Reserves: Policy IssuesForum, International Monetary Fund, Washington, DC. Available at:www.imf.org/external/np/speeches/2001/042801.htm, April 28. Frenkel, J. A and B. Jovanovic, (1981): Optimal International Reserves. Economic Journal Vol. 91, No.
362, pp.507-14. IMF Country Report (2013) Colombia, Article IV Consultation no 13/35 IMF (2009). Intergovernmental Group of Twenty-Four on International Monetary Affairs and Development: A Communiqué International Monetary Fund (2009). August 2009, IMF Country Report No. 09/262
LOG(NOEX) does not Granger Cause LOG(EXR) 1.01754 0.3740

West African Journal of Industrial and Academic Research December 2016 v0l.17 118
Jeanne, O. (2012). Capital Account Policies and the Real Exchange Rate. National Bureau of Economic
Research, No. w18404 Korinek, A and L. Serven(2010). Undervaluation through foreign reserve accumulation: static losses, dynamic gains. World Bank Policy Research Working Paper Series, Vol 2010.
Kruskovic, B. D and Tina .M (2014). Empirical Analysis of the Impact of foreign Exchange Reserves on Economic growth in Emerging Economies. Journal of Applied Economics and Finance vol.2, no.1 pp 102
– 109.
Lanedell-Mills, Joshin N. (1989). The Demand for International Reserves and their Opportunity Cost. IMF
Staff Papers, 36
Lewis, W. (1980).The slowing down of engine or the engine of growth. American Economic Review, 70
(4).
Lyakurwa, W. M. (1991).Trade policy and promotion in sub-Saharan Africa. Africa Economic Research
Consortium Special Paper 12.
Irefin, D. and Yaaba, B.N. (2012). Determinants of Foreign Reserves in Nigeria: An Autoregressive Distributed Lag Approach. CBN Journal of Applied Statistics Vol. 2, No. 2.
Opara, B. C. (2010). Export Marketing: Catalyst for Nigeria economy. Research Journal of
InternationalStudies, 13.
Osuntogun, A., Edordu, C.C., & Oramah, B. O. (1997). Potentials for diversifying Nigeria’s non-oil exports to non-traditional markets. AERC Research Paper, No. 68.
Peter, F. and Z. Machiel, (2004): The risk of Diversification in Risk Management for CentralBank Foreign Reserves. European Central Bank, May 2004.
Rodrik, D.(2006). The social cost of foreign exchange reserves. International Economic Journal vol.20
no.3 pp.253-266.
Shchebakov, S. G. (2002): Foreign Reserves Adequacy: Case of China. prepared for the Fifteenth
Meeting of the IMF Committee on Balance of Payment Statistics, Canberra, Australia, October.
Usman Abdullateef & Ibrahim Waheed (2010). ExternalReserve Holding in Nigeria: Implications for Investment,Inflation and Exchange Rate. Journal of Economics and International Finance, 2(9). Appendix: Exchange Rate, Oil Imports, Non-oil Imports, Oil Exports, Non-oil Exports and Foreign Reserves in Nigeria 1980 - 2015
Year Exr (N =$) Omp (Nb) Nomp(Nb) Oex (Nb) Noex (Nb) FERX (S)
1980 0.55 0.2 8.7 13.6 0.6 10.63979
1981 0.6369 0.1 12.7
10.7 0.3 4.168453
1982 0.6702 0.2 10.5
8.0 0.2 1.926434
1983 0.7486 0.2 8.7
7.2 0.3 1.251987
1984 0.8083 0.3 6.9
8.8 0.2 1.674114
1985 0.9996 0.1 7.0
11.2 0.5 1.891868
1986 3.3166 0.9 5.1
8.4 0.6 1.349903
1987 4.1916 3.2 14.7
28.2 2.2 1.497832
1988 5.353 3.8 17.6
28.4 2.8 0.9329898
1989 7.65 4.7 26.2
55.0 3.0 2.041078
1990 9.0001 6.1 39.6
106.6 3.3 4.12879
1991 9.7545 7.8 81.7
116.9 4.7 4.678023
1992 19.6609 19.6 123.6
201.4 4.2 1.196053

West African Journal of Industrial and Academic Research December 2016 v0l.17 119
1993 22.6309 41.1 124.5
213.8 5.0 1.640444
1994 21.8861 42.3 120.4
200.7 5.3 1.649172
1995 21.8861 155.8 599.3
927.6 23.1 1.709113
1996 21.8861 162.2 400.4 1,286.2 23.3 4.329392
1997 21.8861 166.9 678.8 1,212.5 29.2 7.781251
1998 21.886 175.9 661.6
717.8 34.1 7.298546
1999 92.5284 211.7 650.9 1,169.5 19.5 5.649725
2000 109.55 220.8 764.2 1,920.9 24.8 10.09945
2001 113.45 237.1 1,121.1 1,839.9 28.0 10.6466
2002 126.9 361.7 1,151.0 1,649.4 94.7 7.566806
2003 137 398.9 1,681.3 2,993.1 94.8 7.415088
2004 132.85 318.1 1,668.9 4,489.5 113.3 17.25654
2005 129 797.3 2,003.6 7,140.6 106.0 28.63205
2006 127 710.7 2,397.8 7,191.1 133.6 42.73547
2007 116.8 768.2 3,143.7 8,110.5 199.3 51.90704
2008 131.25 1,315.5 4,277.6 9,861.8 525.9 53.59929
2009 148.1 1,068.7 4,411.9 8,105.5 500.9 45.50982
2010 148.8127 1,757.1 6,406.8 11,300.5 711.0 35.88492
2011 156.7 3,043.6 7,952.3 14,323.2 913.5 36.26366
2012 155.92 3,064.3 6,702.3 14,260.0 879.3 47.5484
2013 155.75 2,429.4 7,010.0 14,131.8 1,130.2 46.25476
2014 158.55 2,215.0 8,323.7 12,007.0 953.5 37.49724
2015 193.2792 1,725.2 9,350.8 8,184.5 660.7 28.284.82
Source: Central Bank of Nigeria Statistical Bulletin and the World Bank 2015

West African Journal of Industrial and Academic Research December 2016 v0l.17 120
Effect of Determinants of Infant and Child Mortality In Nigeria: Hazard and Odds Ratio Models
OnatunjiAdewaleP.1 and A AdesinaOluwaseun A 2
1Lautech International College, Ogbomoso, Oyo State, Nigeria 2Department of Mathematics and Statistics, The Polytechnic, Ibadan, Nigeria,
Email: [email protected] Corresponding Author’s Email:[email protected]
Abstract Infant and child mortality is a major public health problem; however, quantifying its burden in a
population is a challenge. Routine data collected provided a proxy for measuring the incidence of
mortality among children under five years of age and for crudely estimating mortality rate. The data
collected from National Demography Health Survey (NDHS, 2013)were used to investigate the
determinants of infant and child mortality in Nigeria. Cox proportional, logistic model were developed to
timely hazardously and probabilistically continuous variable, mother age and other specific covariates
such as educational level, household income level, residence type and place of delivery which are
categorical data. The Cox proportional analysis showed that the hazard risk and odds ratios of infant
and child mortality are significantly less frequent over specified covariates, insignificant in residence type
but significant in odds ratio. Also, there is an increased risk of infant and child mortality in place of
delivery. It is evident from the results obtained that social economic risk factors contribute significantly
to infant and child mortality in Nigeria. Finally these findings revealed that Mothers’ educational level
determines place of delivery (home, health centre) which should be improved; increase in household
income contributes to child survival and reduces child mortality in Nigeria
Key words: odds ratio, hazard ratio, mortality
______________________________________________________________________________________
Introduction
One of the Millennium Development Goals is the reduction of infant and child mortality by two-thirds by 2015. Infant and child mortality in the agenda of public health and international health organizations has received attention as a part of millennium goal. In order to achieve this goal, all the countries of the world have been trying their best to determine the major factors responsible this and also put efforts towards identifying cost-effective strategies as many international agencies have advocated for more resources to be directed to health sector. Universally, there is huge literature that focused on the determinants of infant and child mortality. A great deal of efforts were made to target communicable diseases as majors determinants of Infant Mortality(IM) such as malaria, measles, diarrhea, respiratory infections and other immunisablechildhood infections[3]; however, it
was noticed later that disease oriented vertical programmes were not adequate to reduce IM. Most of the studies have shown significant association between socioeconomic, demographic factors and infant-child mortality.
Ksenhya categorized environmental health risks into traditional hazards related to poverty and lack of development, such as lack of safe water, inadequate sanitation and inadequate waste disposal, indoor air pollution, food contamination, occupational injury hazard, natural disasters and modern hazards such as urban air pollution, water pollution, solid and hazardous waste accumulation, chemical and radiation hazards, infectious disease hazards, ecological changes and climate changes[10]. World Health Organisation(WHO) reported that among the 10 identified leading mortality risks in high-mortality developing countries, unsafe

West African Journal of Industrial and Academic Research December 2016 v0l.17 121
water, sanitation and hygiene, indoor smoke from solid fuels. About 3% of these deaths (1.7 million) are attributable to environmental risk factors and child deaths account for about 90% of the total population[13]. In Kenya, it was reported that there was inconsistent relationship between socioeconomic status (measured by wealth index) and infant mortality[6]. The results indicate that sanitation, education and per capita income contributed to the decline in infant mortality in Brazil, the effects being stronger in the long run than in the short run. The fixed effects associated with municipality characteristics help explain the observed dispersion in child mortality rates[4].The proximate determinants are found to have stronger influence on under-five mortality than the socioeconomic factors considered in the study carried inBangladesh[1].Pandey and Manoj reported a strong association between maternal health and child mortality in rural India; the effects of maternal height, weight, presence of any disease and anemia were found significant[12]. Ghenga revealed that maternal, child and family were important risk factors of U5M in Nigeria using multivariate logistic method of analysis[5]. The following factors were included in the study: Maternal (current age, education, occupation, parity, marital status,
age at first marriage, family planning, preceding birth interval, breastfeeding and health seeking behaviour); Childhood (sex, birth order, birth weight); Household (family size, sanitation number of wives, wealth index, fuel and water sources); Paternal factors (age, occupation); and other factors (place of residence, ethnicity and geopolitical region).
Uddin investigated the predictors of child mortality using cross tabulation and multiple logistic regression and reported that father’s education and occupation of father, mother standard of living index, breastfeeding status, birth order have impact on child mortality[11]. Zeraiexamined socio-economic and demographic variables in a multi-level framework to determine conditions influencing infant survival in Zimbabwe. He employed Cox regression analysis to the 1988 Zimbabwe DHS data to study socioeconomic determinants of infant mortality[14]; and the strength of the relationships of the independent (maternal, socioeconomic and sanitation) variables with the dependent variables (infant and child mortality) remain much smaller in the 2005-06 ZDHS survey than in the other ZDHS surveys[8]. They employed multivariate Proportional Hazards Regression
Figure1 shows the summary of variables infant and child mortality used in this study from NDHS,2013.From variables indicated the chart, total number of children that were not alive is lower than
those that were alive.
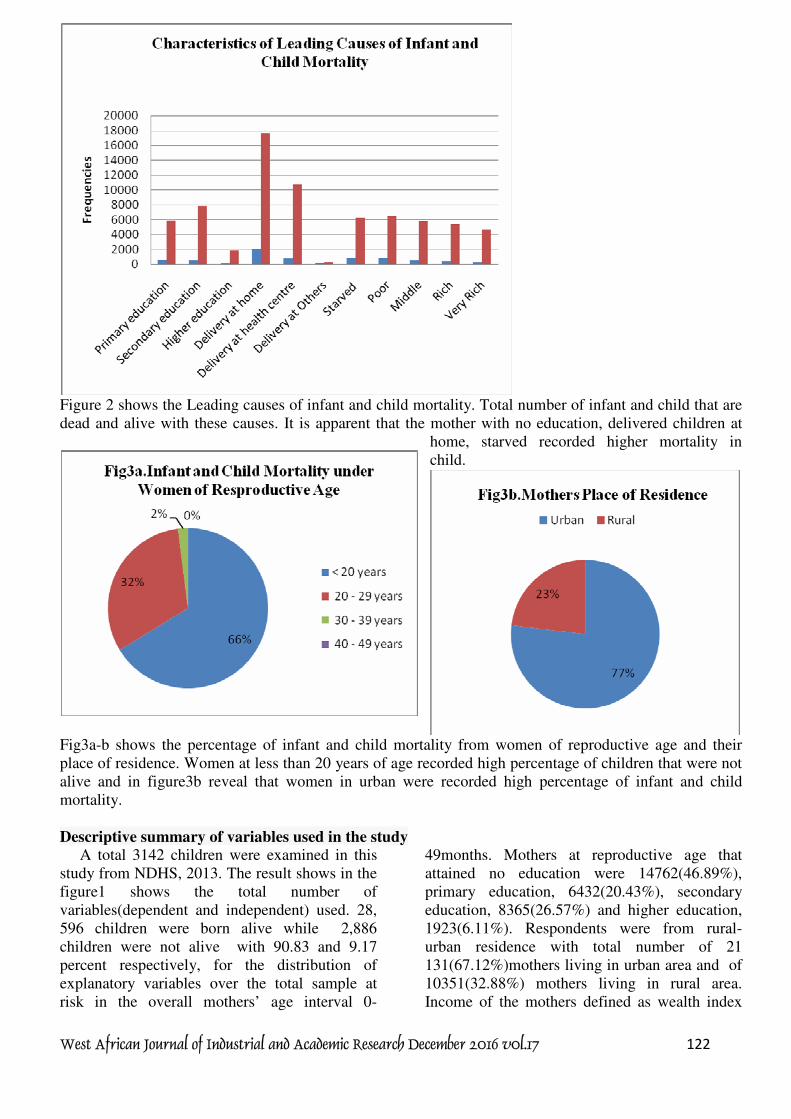
West African Journal of Industrial and Academic Research December 2016 v0l.17 122
Figure 2 shows the Leading causes of infant and child mortality. Total number of infant and child that are dead and alive with these causes. It is apparent that the mother with no education, delivered children at
home, starved recorded higher mortality in child.
Fig3a-b shows the percentage of infant and child mortality from women of reproductive age and their place of residence. Women at less than 20 years of age recorded high percentage of children that were not alive and in figure3b reveal that women in urban were recorded high percentage of infant and child mortality. Descriptive summary of variables used in the study A total 3142 children were examined in this study from NDHS, 2013. The result shows in the figure1 shows the total number of variables(dependent and independent) used. 28, 596 children were born alive while 2,886 children were not alive with 90.83 and 9.17 percent respectively, for the distribution of explanatory variables over the total sample at risk in the overall mothers’ age interval 0-
49months. Mothers at reproductive age that attained no education were 14762(46.89%), primary education, 6432(20.43%), secondary education, 8365(26.57%) and higher education, 1923(6.11%). Respondents were from rural- urban residence with total number of 21 131(67.12%)mothers living in urban area and of 10351(32.88%) mothers living in rural area. Income of the mothers defined as wealth index

West African Journal of Industrial and Academic Research December 2016 v0l.17 123
was categorized into starved, poor, middle, rich and very rich. Total number of 19619(62.32%)mothers delivered babies at home, 11512(36.57%) mothers at health centre and 351(1.11%) mothers at other places of delivery. Figure2shows the total number of infant and child that died at different covariate levels. The proportion varies with age of respondent, type of residence, level of education, place of delivery distance. The number of infant and child mortality decreased as the age of mother increased. It drops from 66.25% in the age of mother <20 year to 31.74% at age of between 20-29 years and also decreased in the 30–39 years groups to 1.98% and further decreased in the age of between 40-49 to 0.04%. The number of infant and child mortality is relatively more in the urban(76.92%) than rural (23.04%) area in relation to the total number people leaving in those areas. Percentage of death recorded when mother has no education was 57.42% and drastically reduced when they had higher education with 2.98%. The death recorded when delivery was taken at home was 68.26% with total number of 19619 mothers as respondents; and at health centre 26.96% with total number of 11512 mothers. Methods and Models In this section we present our model for describing infant and child mortality. We employmultiple logistic regressions to investigate predictors of infant and child mortality and also consider cox regression for which the goal is to investigate the effect of a covariate of interest, mother’ age(x1), on time failure, possibly adjusted for other predictors variables place of delivery, education level, income level and place of birth, and region. For continuous covariate, mother’ age, the effect is measured as a hazard ratio. This hazard ratio is associated with one unit increase in mother age , when the other covariate are held constant and for a binary predictor, the effect is a ratio of hazards or log hazards corresponding to two categories of continuous covariate when other covariates are held constant. In a cox PH model, Cox regression is used to analyze time-to-event data, that is, the response is the time an individual takes to present the outcome of interest. Individual infant and child that die are assigned the total length of time of
the follow-up when they are alive assigned the time of the end of the follow-up. Cox regression estimates the hazard rate function that expresses how the hazard rate depends upon a set of covariates. The model formulated is h +
+
where no distributional assumption is made about the baseline hazard, h0(t). Under the assumption the regression coefficient, β1, is the log hazard ratio, ln (∆), the change, associated with one unit increase in mother age when the other predictors are held constant, and the exponentiated regression coefficient, exp(β1), is the hazard ratio, Therefore, the effect of mother age on time to failure can be investigated by performing an appropriate test based on the partial likelihood[7, 9] for the regression coefficient, β, from a Cox model. . We focus on children that are born alive by estimating the probability of a child dying within the mother next birthday after surviving(cuddling/attention/ health care/ mother care) for tyear, as a result of environmental factors..The mortality rate of child at mother age t can be interpreted as the intensity at which a child dies at this age, given that the child survived until mother age
In logistic regression model, given a set of observations (yi, xi), i = 1, ⋯, n, where yi is a binary response such that yi = 1 if a child died and yi = 0 a child lived, and xi = (xi1, ⋯, xip)' are covariates, we consider a multiple logistic model to estimate the probability of dying , yi = 1 versus the probability of being alive, yi = 0. The response is distributed as a Bernoulli random variable in which fitted response function
defined is = , Where = b0+ b1mother agei1 + b2educational leveli2 + b3incomei3+ b4place of deliveryi4 + b5residencei5.Odd ratio model =
Discussion of Results This study investigates the predictors of child mortality in Nigeria. It utilizedthe nationally representative data from the National Demographic Health Survey(NDHS, 2013. Cox Proportional and Logistic regressiontechnique were used to ascertain the effect of predictors of infant and childmortality. From these analyses

West African Journal of Industrial and Academic Research December 2016 v0l.17 124
several interesting observation can be made, although the analysis itself was subject to various types of problem. Sometimes, it is observed that logical or theoretical hypothesis is supported by the results of fittedhazard and logistic response function. Logistics revealed that infant and child mortality significantly decreased as a result of unit change in educational level(No education, Primary education, Secondary education and Higher education) by 17%, household income(Starved, Poor, Middle, Rich and Very Rich) by 15%, residence(urban and rural) by 20% and mother age by 10%. However, infant and child mortality significantly increased as a result of unit change in place of delivery(Delivery at home, Delivery at health centre and Others) by 46%. Cox proportional also revealed that educational level at 17%, household income at 16%, residence type at 13% significantly decreased risk, and residence type at 13% significantly decreased risk, while place of delivery at 42% significantly increased risk (with hazard ratio of one, indicating the chance of infant and child not being alive) of not infant and child mortality as mother’s age increases. So, urgent attention should begiven to place of delivery and other factors in order to further reduce the risk of infant and child mortality in Nigeri

West African Journal of Industrial and Academic Research December 2016 v0l.17 125
.
Reference [1]Abdul Hamid Chowdhury(2013).Determinants of Under-Five Mortality in Bangladesh. Open
Journal of Statistic vol 3, No 3 [2]Bennett and Jennifer (1999): Correlates of Child Mortality in Pakistan: a Hazards Model
Analysis.http://www.biomedsearch.com/issn/0030-9729.html [3]Clive J. Mutunga(2004). Environmental Determinants of Child Mortality in Urban
Kenya,Department of Economics, University of Nairobi, Kenya [4]DenisardAlves and Walter Belluzzo(2005). Child Health and Infant Mortality in Brazil,Inter-
American Development Bank Felipe Herrera Library(Research Network Working papers ; R-493)
[5] Gbenga A Kayode, Victor T Adekanmbiand Olalekan A Uthman(2012).Risk factors and a predictive model for under-five mortality in Nigeria: evidence from Nigeria demographic and health survey.
[6]Hisham E. M. and Clifford O.(2008).Socioeconomic determinants of infant mortality in Knya: analysis of Kenya 2003, Journal of Humanities & Social Science, volume(2)
[7]Hosmer, D.W., Lemeshow, S. and May, S.(2008).Applied survival analysis: Regression modeling of
Time-to-Event Data(2nd ed.) Hoboken, John Wiley & Sons, inc. [8]Joshua Kembo and Jeroen K. van Ginneken (2013). Determinants of Infant and Child Mortality in
Zimbabwe: Results of Multivariate Hazard Analysis [9]Klein, J. P., and M. L. Moeschberger(2003). Survival analysis: Techniques for Censored and
Truncated Data. 2nd ed.New York: Springer [10]KsenhyaLvovsky(2001). Health and Environment, Environment Strategy Papers Health and
Strategy Series. The World Bank Environment Department, Strategy Series Number, 1(31) [11]Md. Jamal Uddin, Md. ZakirHossain and Mohammad OhidUllah(2009).Child mortality in a
Developing Country:A Statistical Analysis, Journal of Applied Quantitative Methods [12]Pandey and Manoj K.(2009). Maternal Health and Child Mortality in Rural India, MPRA
[13]WHO.(2002).The world health report 2002:Reducing Risks, promoting life, Geneva:WorldHealtOrganisation.
[14]Zerai, A. [1996]. Preventive Health Strategies and Infant Survival in Zimbabwe. African Population Studies 11(1): 29-

West African Journal of Industrial and Academic Research December 2016 v0l.17 126
Forensic Accounting And Financial Crisis In Nigeria
Anuolam O. M1, Onyema T. E2 , and Ekeke Ussim3
1Hezekian University Umudi
2Gregory University Uturu 3Michael Okpara University Of Agriculture Umudike.
Abstract
In recent times, there has been a spate of dramatic increase in Economic and financial crimes
across the globe. The developing economies have not been left out, especially Nigeria. No day
passes without a report of some financial crime or the other. Forensic accounting has become an
emerging topic for research in recent time as a panacea for financial crimes. This study
examines the significance of forensic accounting in the face of increasing fraudulent practices in
Nigeria with a view to advancing some solution. A sample of 98 respondents were selected from
a population of 140 using the Taro Yemen formular. 90 questionnaires were returned fully and
correctly completed by the respondents. Regression analysis, correlation coefficient, Ordinary
Least Squares (OLS) and E-view 7 Geometric software were used to analyze the data. The
findings of the study show that forensic accounting is significant in the face of the increasing
fraudulent practices in Nigeria. Based on the findings, it is recommended that the government
should make forensic accounting compulsory for all accounting majors in the University and
create enabling environment for the practice of forensic accounting in the country.
Keyword: Forensic accounting, fraudulent practices, true and fair value, financial crimes,
enabling Environment
Introduction The unrelenting series of embarrassing audit failure, over the last 50 years has prompted in paradigin shift in accounting. In the mid 20th Century when the fight for fraud detection was at its height, a few observers predicted that in future there would be acceptance of general responsibility of the auditors to perform tests to detect material defalcation and errors if they exist (11). These events led to the
hiring of fraud detection experts called
forensic accountants. Forensic accounting is therefore defined as the practice of rigorous data collection and analysis in the area of litigation support, consulting, expert witnessing and fraud examination (22). Forensic accounting therefore refers to the comprehensive view of fraud investigation and includes the interview process of interviewing related parties to a fraud, act of
serving as an expert witness, etc. It is a known fact that financial fraud is gradually becoming a normal way of life in Nigeria. Various authors acknowledge that the increasing incidence of fraud and fraudulent activities in Nigeria has reached a crescendo (20; 14 and 12), all attest to this. There is therefore a general belief that the role of a forensic accountant is very significant in the face of increasing fraud and fraudulent activities in Nigeria. It is a known fact that with the world becoming a global village and the more sophisticated Information Communication Technology (ICT), fraudsters will continue to fine-tune their tactics towards more fraudulent practices. It now becomes paramount that forensic accountants with training and experience in computer programming and customization, litigation support, expert testimony and

West African Journal of Industrial and Academic Research December 2016 v0l.17 127
investigative skills are the only ones who can help tackle the problem of white collar crime and fraud detection and prevention in organization. The main objective of this study therefore is to examine through an empirical study the relevance of forensic accounting in the face of increasing fraudulent practices in Nigeria. The specific objectives are: To examine the extent to which the application of forensic accounting services can help detect and prevent fraud in Nigeria, and to determine to what degree the use of forensic accounting can validate the true and fair value of audited financial statements in Nigeria. Hypothesis: HO1: The application of forensic accounting services cannot prevent and detect fraud in Nigeria HO2: Forensic accounting does not validate the true and four value of financial statements in Nigeria HO3: Nigerian accountants are not adequately qualified to carryout forensic accounting practice. Literature Review: Conceptual Framework: Forensic accounting is one of the oldest professions and dates back to the Egyptians. (13) ascribes the origin of forensic accounting to Kutilya, the first economist to openly recognize the need for the forensic accountant, whom he said mentioned forty ways of embezzlement centuries ago. He, however, stated that the term forensic accounting was carried by Peloubet in 1946. (6), writing on the same issue opined that a form of forensic accounting can be traced back to 1817 court decision and that in 1824, a young Scottish accountant issued a circular advertising his expertise in arbitration support, butPeloubet was probably the first to publish the phrase forensic accounting. Formalized procedures for the practice was not put in place until the
1980s when major academic studies in the field were published. Investigation of fraud and corruption is confirmed thus, not to be new even in Nigeria. It is only gaining prominence because of the growing wave of crime under the seemingly new nomenclature the last five years (5). (3) opines that fraud is rarely seen, maintaining that the symptoms of fraud are usually observed. The symptoms do not necessarily mean fraud is being undergone as it may be caused by mistakes. But the act might also be deliberated. (6), defines forensic accounting as the application of the laws of nature to the laws of man. He describes forensic scientists as examiners and interpreters of legally admissible evidence and facts in cases that also require expert opinions regarding their findings in law court. (4) assert that the primary orientation of forensic accounting is explanatory analysis of phenomenon including discovery of deception, and its effects, introduced into the accounting domain. (15), defines forensic accounting as the combination of accounting, auditing and investigation skills to a standard that is acceptable by a court of jurisdiction to address issues in dispute in the context of civil and criminal litigation. (1) sees forensic accounting as the practice of utilizing accounting, auditing and investigation skills to assist in legal matters and the application of specialized body of knowledge to evidence of economic transaction and reporting suitable for the purpose of establishing accountability or valuation of administrative proceeding. Forensic accounting as documented in literature is an offshoot of forensic science and accounting (23). Forensic accounting provides an accounting analysis that is suitable to the organization in the resolution of dispute and in this vein differ from the orthodox accounting practice. Theoretical Framework White-Collar Crime:

West African Journal of Industrial and Academic Research December 2016 v0l.17 128
Sutherland, 1949 cited in Michael, (2004) defined White collar Crime as crime committed by a person of respectable and high social status in the course of his occupation. He noted that in his time, less than 2 percent of the persons committed to Prison in a year belong to the upper class. He tried to establish a relationship between money, social status, and the likelihood of going to jail for a white collar crime with a more visible, typical crime. He tried to separate and define the difference between the blue collar street crimes like burglary, theft, rape, arson and vandalism which are often blamed on psychological, associational and structural factor with white collar crimes committed by criminals who are opportunists who overtime learn that they can take advantage of their circumstances to accumulate financial gains. These criminals are educated, intelligent, affluent individuals who can get a job which allows them unfettered and unmonitored access to often large sum of money. White collar crimes include such illegal acts which are characterize by deceit, concealment, or violation of trust and which are not dependent on the application of physical force or violence. This study will be anchored on white collar crime. Empirical Studies: (7) states that Kessler International experts said that the forensic accounting field’s popularity has attracted many inexperience accountants who lack skills to carefully and cost effectively conduct enquiries. However, forensic accounting as a panacea to organizational dispute arising out of financial mismanagement has come to stay. (10) undertook a study on how to apply forensic accounting in investigating variances and suspected fraudulent activities in manufacturing processes. He finally opined that the application of forensic accounting applies to all scenes where fraud is a possibility. (20) in their study on the
application of forensic accounting in developing economics like Nigeria notes that forensic accounting is faced with so many bottlenecks. (6) dwelt on the challenges confronting the application of forensic accounting (18) dwelt on economic and financial crime and forensic accounting: an antidote. They noted that lack of adequate litigation support services by forensic accountants has been the bane of Nigerian development process. (9) studied the impact of confidential privilege on forensic accountant in litigation services and were of the opinion that confidentiality of information influences forensic accountants effectiveness during litigation support services. (8) noted that an important challenge to the application of forensic accounting in financial fraud control in Nigeria is that the law is not always up to date with the latest advancements in technology. (17), in their study on forensic accounting and financial fraud in Nigeria: An empirical approach using binomial test noted that there is significant agreement amongst stakeholders on the effectiveness of forensic accounting in fraud control, financial reporting and internal control quality. (2), in their exploratory study on the growing relevance of forensic accounting as a tool for combating fraud and corruption: The Nigeria Experience, noted that though the relevance of forensic accounting in unraveling complex official corruption is on the increase in Nigeria, despite the fact that the practice is largely considered to be at its infancy stage and lacking statutory support, it nevertheless has no significant impact on corruption, fraud and financial crime in Nigeria. (19) in their theoretical research on the relevance of forensic accounting in the detection and prevention of fraud in Nigeria found out among others, that their services would assist audit committee members in carrying out their oversight functions by

West African Journal of Industrial and Academic Research December 2016 v0l.17 129
providing them assurances on internal audit report. Methodology: The survey research design is used in the study. The population of the study consists of 130 staff drawn from key government parastatals like the Central Bank of Nigeria (CBN) Federal Inland Revenue, Accounting Firms and Economic and Financial Crimes Commission (EFCC). A sample size of 98 was calculated using the YaroYamenformular. The respondents were directors of finance, audit and assurance services, accounting technicians, IT directors and those identified as having justifiable views on forensic accounting and fraud detection in Nigeria and are involved at one stage or another in the preparation, analysis and usage of financial reports. They are therefore expected to be knowledgeable about the thrust of the study. A well-structured 5 point likert scale questionnaire was used to elucidate information from the respondents. These results were analysed using the simple regression, ordinary least square (OLS) and the E view 7 econometrics software including the correlation coefficient.
Model Specification FDP = f (FAS, FAV, FAP)- - - - - - - - (1) FDP = a0+b1FAS+b2FAV+b3FAP Where FDP = Fraudulent Practices FAS = Forensic Accounting Services FAV = Forensic Accounting Validation Ut = Stochastic error term a0 = Regression constant b1b2 = Regression coefficient Apriori expectation: b1,b2b3>0 Data presentation, analysis and interpretation: A total number of 98 copies of likert scale questionnaire were distributed to respondents who were identifies as having separate views on forensic accounting and fraud detection in Nigeria and are involved at one stage or the other in the preparation, analysis and usage of financial reports but 90 were returned duly and correctly completed, hence 90 was used for data analysis. Selected questions in the questionnaire which are closely related to the purpose of the study are tabulated and analyzed below
Description Statistics of Variables FAS FAV FAP Mean 12.8090
4 12.4383 7
12.9880 5
Sta. Dev. 1.85609 3
1.75160 4
1.78810 7
Probability 0.03045 5
0.01440 6
0.03480 4
Observations 90 90 90
Source : Researcher’s computation The above table shows the descriptive statistics of the understudied variables in terms of numbers. The mean values for FAS, FAV, and FAP are 12.81, 12.4 and 13.0 respectively while their respective
standard deviation are 1.9, 1.8 and 1.8 respectively. The probability values of the statistics of FAS (0.3), FAV (0.01) and FAP (0.03) are normally distributed.

West African Journal of Industrial and Academic Research December 2016 v0l.17 130
Correlation Matrix of Variables
VARIABLES FAV FAP FAP FAS 0.013033
5
FAS 0.40264 4
1
FAV 0.012899 6
1
Source : Researcher’s computation The above tables shows thecorrelation matrix of the variables FAS/FAV (0.013), FAS/FAP (0.040), FAV/FAP (0.013) (significant at 5%). All these have positive relationship with FDP. Therefore, as FDP
decreases, FAS, FAV and FAP increases. Since the numeric strength of the correlation coefficient of all the variables observed is lower than 0.5, then we accept the alternative hypothesis
. Regression Result: Estimation of variables
Variable Coefficient Std. Error Z-Statistic Probability FAS 0.013033 0.12327
5 0.41 0.03045
FAV 0.040264 0.12624 4
0.22 0.01440
FAP 0.012899 0.11935 6
0.20 0.03480
R2 0.9484 0.9484 0.9484 0.9484
Source : Researcher’s computation The R2 value of 0.9484 shows a high correlation between the variables under study. We therefore reject the null hypothesis and accept the alternative hypothesis. Conclusion And Recommendations: The increasing rate of fraudulent activities in Nigeria has become so wearisome that there need to be put in place a means of curbing or if need be, eradicating it. Forensic accounting, though, a new branch of accounting can be an effective tool in combating fraudulent activities within and outside the organization. Based on the above result, we conclude that the application of forensic accounting practice
in Nigeria can help to detect and prevent fraud, validate the true and fair view of audited accounts and that Nigerian accountants are well equipment to use forensic accounting to combat fraud if well designed legislation is put in place. We therefore recommend that government should make the study of forensic accounting as a compulsory course for all accounting majors and put in place well-structured legal system to facilitate the administration of forensic accountin

West African Journal of Industrial and Academic Research December 2016 v0l.17 131
. References
1. Adewumi, B. and Toluyemi, T. (2000): Auditing and Corporate Transparency, Lagos: Evans Pub. Nig. 2. Akhidime and Uagbale-Ekatah (2014): “The growing relevance of forensic accounting as a tool for
combating fraud and corruption: Nigerian Experience” Research Journal of Finance and Accounting:
5(2).
3. Albrecht, W.S. (2005): Identifying fraudulent financial transaction: A framework for detecting financial statement fraud. Brigham: Brigham Young University.
4. Bhasin, M. (2007): “Forensic Accounting: A new paradigm for riche consulting”. The Chartered
Accountant 1000 – 1010. 5. Coenen, T.L. (2005) “Forensic Accounting, a new twist on being an accountant.” Tracy@squence-
inc.com 6. Crumbley, D.L. (2001): “Forensic Accounting: older than you think”. JFA 2(2)181.
7. David, M. (2008): The Role of forensic Accountant. Toronto Ontario 8. Degboro, D; and J. Olufinsola (2007): “Forensic Accountants and the litigation support engagement”.
Nigerian Accountant 40(2), 49-52.
9. Enofe, A.O; Izvbigie, D.P.I; and Usifo, E.J. (2015): “Impact of confidential privilege or forensic accountant in litigation support services”. West African Journal of Business and Management Science
4(2):119-126. 10. Enyi, R. (2009): “Fraudulent Activities in manufacturing processes”. International Journal of Business
and social science 4 (7); 289-293. 11. Gray, O.R; and Moussah, S.D. (2006): “Forensic Accounting and Auditing United again: A historical
perspective” Journal of Business issues No. 2 pp. 15-25Available at SSRN
http://ssrn.com/abstract=1642100. 12. Izedomin, F.I; and Mgbame, C.O. (2011): “Curbing financial frauds in Nigeria: A case for forensic
Accounting” African Journal of Humanities & Society, 1(12)52-56.
13. Josh, M.S (2003): “Definition of Forensic Account”. www.forensicaccount.com. 14. Kasum, A.S. (2009): “The Relevance of Forensic Accounting to Financial Crimes in Private and
Public sectors of third World Economies: A Study from Nigeria”. Proceeding of the 1st Instructional
Conference on Governance, Fraud, Ethics and Social Responsibility. http://ssrn.com/abstract=1384242 15. Manning (2002): Financial Investigation and Financial Accounting USA, CRC Press. 16. Mauro, Paslo, Forensic and Development (1998): “Corruption: Causes, Consequences”.Agenda for
further Research 5(1): 11-14. 17. Moduga, K.P; and Anyaduba, J.O. (2013): “Forensic Accounting and Financial Fraud in Nigeria: An
Empirical Approach”. International Journal of Business and Social Science: 4(7).
18. Ogbonna, G.N; and Ikebujo, O.S. (2016): “Economic and financial crime and forensic accounting: An Antidote”. West African Journal of Business and Management Services: 5(1)27-40.
19. Olukowade, E; and Balogun, E. (2015): “Relevance of Forensic Accounting in the Detection and Prevention of Fraud in Nigeria”. International Journal of Accounting Research. 2(7)
20. Okoye, E.I; and Akenbor, J (2009): “The Role of Forensic Accounting in Fraud Investigation and Litigation Support”. The Nigerian Academic Forum 17(1)
21. Rezace, Z; Crumbley, D.L; and Elmore, R.C. (2003): Forensic Accounting Education: A Survey of Academicians and Practitioners, Advances in Accounting Education, Forthcoming, Avaiablessrn:http://ssrn.com/abstract=518263
22. Rezace, Z; Crumbley, D.L; and Elmore, R.C. (2006): “Forensic Accounting Education: A Survey of Academicians and Practitioners”. Journal of forensic Accounting 10(3):48-59.
23. Zysmen, A. (2004): Forensic Accounting Demystified. World Investigators Network, Standard Practive for Investigation and forensic Accounting Engagements.Canadian Institute of Chartered
Accountants.

West African Journal of Industrial and Academic Research December 2016 v0l.17 132
The Effect of Electricity and Gas Losses on Nigeria`s Gross Domestic Product
1Marcus, Samuel Nnamdi , 2Nwosu Chinedu Anthony and 2Odii Alex 1Department of Economics, Achievers University, Owo
2Department of Economics, Alvan Ikoku College of Education, Owerri
Abstract
Electricity and gas are key factor inputs that could reduce or increase economic activity over time. The
conversion, transmission, and distribution process of electricity and gas could increase or reduce output. This study investigated the effect of electricity and gas losses on the Gross Domestic Product (GDP) of
Nigeria from the period covering 1970 to 2012. The objective of the study is to examine the impact of
Electricity and gas losses on GDP of Nigeria using the ordinary least squares method. Results show that
gas loss was in line with the ‘a priori’ expectation while electricity loss was not in both short and long
run. Hence, gas loss showed an inverse relationship with GDP while electricity loss showed a direct
relationship. Further, electricity loss was significant in explaining variations in GDP while gas loss is
insignificant. The model will return to equilibrium at the speed of 29 per cent as revealed by the error
correction test. The study concludes that a reduction in electricity and gas loss will increase productive
activity and GDP. The paper recommends a reinforced policy on gas loss via flaring to reduce the
quantity of gas loss. In the same vein, investment in modern technology in the power sector will in no
small measure reduce power transmission and distribution losses. Key words: Electricity loss, Gas loss, Gross Domestic Product1.0 Introduction ____________________________________________________________________________________ Introduction Electricity and gas are critical for modern existence and important infrastructural inputs for economic growth and development especially since the oil shocks of 1970’s. There is a general belief and concession amongst researchers, analysts, economists, and policymakers, that energy use is related to economic activity, hence, plays a vital role in the process of economic growth and development (Alam, 2006; Ayodele, 204; Birol, 2007). In all economies, all economic units have extensive demand for electricity and gas demand propelled by economic factors like industrialization, population growth, urbanization, rising standard of living as well as modernized agriculture. Birol (2007) posit that demand for energy has surged and that, the unrelenting increase has helped fuelled global economic growth. Shahbaz and Lean (2011) argue that production growth and an expansion of economic activities in Pakistan are restrained by its under-developed energy infrastructure. Ayodele (2004) opine that the quest to rapidly and firmly put the Nigerian economy on course of economic development is technically, a function of adequate and distribution of energy, particularly electricity. Considering the role of energy in the
Nigerian economy, Aderibigbe (2010) assert that electricity delivery system (transmission and distribution networks) must be robust and flexible enough, every second of the day and every day of the year to accommodate the nations demand for electricity and deliver regular, reliable and affordable electricity especially in the production economy. The above underscore the importance of adequate energy use in the growth of an economy. Economic expansion in Nigeria is heavily restrained by undeveloped and poor managed energy sector, characterized by the limited supply, and poor quality of services given rise to captive energy production in Nigeria. Currently, however, the Nigeria economy is faced with insufficient and low quality energy use resulting partly from electricity and gas differentials. Energy literature shows a good number of studies done on energy and economic growth in Nigeria. While some focused on causality others dwelt on energy pricing, unemployment, per capita income e.t.c. For instance, Odlaru and Okonkwo (2009) examined energy consumption and its contribution to economic growth.

West African Journal of Industrial and Academic Research December 2016 v0l.17 133
Mozumder and Marathe (2007) investigated the causal relationship between electricity consumption and economic GDP e.g. Of all these, non to the best of our knowledge is directed to study the effect of energy loss to the Nigerian economy except for Nwosu and Marcus (2013) who examined the relationship between electricity differentials and per capita income of Nigeria, and George and Oseni (2012) who considered the relationship between un-generated, wasted electricity and industrial electricity consumption and unemployment in Nigeria from 1970 to 2005. Again, Najid, Muhammad, Naqvi and Muhammad (2012) in estimating energy consumption and economic growth in Pakistan employing the Cobb- Douglas production function did not show link between their model and that of Cobb- Douglas and the place of total factor productivity (A) in production activity. Hence, this study fills these gaps which include the inclusion of gas loss in our model, the consideration of the Nigerian economy as against per capita income. Also, this study considers electricity loss as energy generated but not consumed due to transmission and distribution (not the un-generated or wasted) hiccups and in gas loss as those flared. The objective of the study therefore is to investigate the effect of electricity and gas losses on the Nigerian economy using the ordinary least square method. This study differs from the others because it is positioned to study the effect of both electricity and gas losses on the gross domestic product of Nigeria. The study will enhance energy management and forecasting as well as contributing to energy literature development in Nigeria. Following the introduction is literature review in section 2, materials and method in section 3, presentation of results in section 4 and conclusion and policy recommendation is section 5. 2.0 Literature Review 2.1 Conceptual issues For any type of fuel to be usable after production, it requires to go through the process of cleaning and beneficiation. This process of cleaning and beneficiation is necessary to remove impurities. Since most forms of energies like crude oil may not be put to use without processing or conversion in the case of electricity, they are transported to the various centers of conversion or use. After processing
and conversion, energy is transported to the end users and all these involve losses. Electricity Loss According to International Energy Agency (2011) electric power transmission and distribution losses include losses in transmission between sources of supply and points of distribution and in the distribution to consumers, including pilferage. Before consumption, some storage may be required for some of energy, while for electricity no practical and economic storage solution exists (Bhattacharyya, 2011). Energy Information Administration (n.d) defined electricity loss as the difference between electricity input and output as a result of an energy transfer between two points. Geitena (2008) states that electricity loss can be technical and non- technical. She further states that, technical losses are losses on power lines (such as Joule losses and losses by corona effect) and losses in transformers (such as losses in magnetic cores). These losses are the result of the inherent resistance of electrical conductors. Non-technical losses include more or less all energy, which gets lost because of energy theft, errors in metering, billing und data processing as well as differences between real consumption of customers with annual meter reading within a year and the estimated consumption within an accurately defined period. Gas Loss Gas loss is simply the difference of the physical inputs and the physical outputs of the pipeline system (Duane, n. d). A loss in this sense occurs whenever the physical inputs are greater than outputs of the pipeline system. This loss includes those of cleaning and beneficiation and flaring. For this study however, gas loss resulting from flaring only is considered. Paul Metro (n. d) Gas loss or unaccounted for is the difference between gas sales billed and gas send out. During a given period, the quantity of gas sold will differ from the quantity sent into the distribution system. According to him, gas loss does not always indicate a leak. Leakage is only one of a number of factors contributing to gas loss. Leaks are defined as gas escaping to the atmosphere at a given rate at an unknown location. The rate of gas loss is dependent on the pressure and the size of the hole.

West African Journal of Industrial and Academic Research December 2016 v0l.17 134
2.2. Theoretical Perspective The basis of neo-classical growth theory is that it is possible to explain the patterns of economic change within a country, by making use of an aggregate production function. The aggregate production function relates the total output of an economy to the aggregate amounts of labor, human capital and physical capital in the economy, and some simple measure of the level of technology in the economy as a whole. According to this theory, production in each period begins with given amounts of capital, labor and technology, and terminates in the production of goods. This implies that increase in the inputs will increase output as well, and decrease in the inputs will also decrease output. The neoclassical economists are generally reticent about how labor is produced or reproduced; they assume that it grows exogenously. Technology is described as the stock of knowledge available to an economy. Knowledge may be embodied in machines, human skills, or it may take the form of social codes and arrangements. Not included in this account of the economy is the primary force that drives all economic activities- energy. Clearly, energy enters the neoclassical economy as the effort of labor, but this source of energy has been declining progressively over the past two centuries. Energy from non-human sources (coal, oil, electricity, food or fertilizer) enters the economy only as an intermediate input; it is incorporated into a country’s national income accounts as value-added in the energy sector. Quite simply, energy is not a factor of production. In other words, neoclassical economics is built upon a disjunction between the economy and ecology (Alam, 2006). This study however argue in line with authors such as Stern (2003) to assume that energy inputs like electricity and gas could take the place of technology in the neoclassical theory considering the role of energy in driving technology. Though the classical economists did not explicitly recognize energy as a factor of production in their macroeconomic framework, they understood clearly the limits which land- nature imposes on economic activities, especially as it affects agriculture. When classical economists speak of the “fertility of nature”, (Adam Smith 1776), “the productive and indestructible powers of the soil” (David Ricardo),”the natural and inherent powers of the
soil (John McCulloch),” or speak of the earth as “a wondrous chemical workshop wherein many materials and elements are mixed together and worked on (Jean-Baptiste Say),” their language conveys a clear understanding of the energy that nature contributes to the economy. In a similar vein, Mill (1848) wrote that matter contains “active energies by which it cooperates, with, and even be used as a substitute for, labor.” Likewise, Bastiat (1850) identifies the different forms in which energy as light, heat, electricity, plant life, wind, gravitation contributes to production, but he sees these forces at work both in agriculture and manufacturing (as cited in Alam, 2006). Nicholas Georgescu-Roegen (1971) is one of the first economists to comment on the absence of energy in economic theory as a productive resource or agent. He pointed out that Marxists and neoclassical economists abstract from nature suggest that they take resources and energy flows for granted. Other economists such as Solow, Romar and Cobb-Douglas have therefore included in their models technological progress and total factor productivity (TFP) to capture other inputs that affects production or growth other than labor and capital. Because technological progress is difficult to measure directly with the growth rate of the GDP, economists resorted to taking the part of growth that is not accounted for by observable growth of inputs to be a measure of technological progress. That is, residual of growth not accounted for by capital and labor- given the interaction with other observable inputs. Among these residual of growth or other inputs unaccounted for we assume includes energy. The study of the characteristics of economic growth and electricity consumption has been an area of interest to scholars, analysts, economists and researchers. For instance, Chima and Freed (2005) confirm a relationship between energy consumption and real GDP. They further assert that Energy availability and consumption play a key role in the process of economic development as well as a key to industrialization and the development of industrial infrastructural facilities. According to them, Energy use is a function of, and a consequence of economic growth. Ovienimo (2006) agrees that energy efficiency is the indispensible component of any effort by an economy to improve productivity which then translates to income growth. In Bangladesh, Buysse, Begum, Alam, and

West African Journal of Industrial and Academic Research December 2016 v0l.17 135
Huylenbroeck, (2012) observe that inadequate supply of electricity to meet the growing demand of the economy, result to frequent electrical power outages or load shading used to manage the gap between power generation and demand of electricity and this has clear impact on economic activities. Balat (2007) highlights the importance of energy consumption in an economy. According to him, energy consumption in developing countries has been increased. For instance, he asserts that Turkish government is encouraging national and international investors to invest in energy projects. Goerge and Oseni (2012) posit that Nigerians are resilience and hardly give up in the face of challenges that affect their welfare and aspirations and could explain the self help provisions of electricity from privately owned generators. Ayodele (2004) appreciates the linkage between the energy sector and the other sectors of the economy and assert that electricity development and utilization have pervasive impact on a range of socio-economic activities and consequently the living standard of the citizens in the country. According to Odularo and Okonkwo (2009) energy is a bone for economic growth. They found positive relationship between energy consumption and economic growth in Nigeria and asserts that greater energy consumption means more economic activity of the nation and as a result higher economic growth. He suggests this sector should be given attention for the development of the country. 2.2 Empirical Issues Buysse et al. (2012) investigated the relationship between electricity consumption, carbon emissions and economic growth in Bangladesh. The results indicate that uni-directional causality exists from energy consumption to economic growth both in short and long run, while bi-directional long run causality exists between electricity and electricity generation. Odularu and Okonkwo (2009) examined energy consumption and economic performance in Nigeria, findings show a positive relationship and economic growth for a period spanning from 1970 to 2005. Ferguson, William and Hill (2000), studies the relationship between electricity use and economic development for over one hundred countries. Their study reveals that wealthy nations have a stronger correlation between electricity use and wealth creation than
do poor countries. Again, for the global economy as a whole, there is a stronger correlation between electricity use and wealth creation than there is between total energy use and wealth. And, in wealthy countries, the increase in wealth over time correlates with an increase in the proportion of energy that is used in the form of electricity. In Spain Ciarreta and Zarraga (nd) examined the linear and non-linear causality between Electricity Consumption and Economic Growth. Findings reveal unidirectional linear causality running from real GDP to electricity consumption and a nonlinear Granger causality between the series in either direction. Masuduzzaman (2012) studies the relationship between economic growth, electricity consumption and investment for Bangladesh through co-integration and causality analysis over the period 1981 to 2011. The results for this study show that long run elasticity of economic growth with respect to electricity consumption and investment are higher than their short run elasticity which implies that over time higher electricity consumption and investment in Bangladesh give rise to more economic growth. Ouedraogo (2010) investigated Electricity Consumption and Economic Growth in Burkina Faso using Co-Integration Analysis for the period spanning from 1968 to 2003. He found that there was a long run bi-directional causal relationship between electricity consumption and GDP and posit that electricity was a significant factor in economic development. Bekhet, and Othman, (2011) examined electricity consumption, consumer expenditure, gross domestic product (GDP) and foreign direct investment (FDI) in Malaysia. The results suggest that electricity consumption is an important element determining economic growth in Malaysia and a powerful tool in executing government policy for energy saving. Chen, HI and Chen (2007) use different types of energy consumption (electricity) to test the causal relationship with GDP in Asian countries. They used data for 1971 to 2001 period to conclude that there was a unidirectional causality from GDP to electricity consumption in the short run in Malaysia. Mozumder and Marathe (2007) use the Granger causality analysis to analyze causality direction between GDP and electricity consumption. He found that GDP affected electricity consumption and no causality was found from electricity consumption to GDP.

West African Journal of Industrial and Academic Research December 2016 v0l.17 136
Najid, et al (2012) investigated the relationship between energy consumption and economic growth in Pakistan. The results of Granger causality test show uni-directional causality running from GDP to energy consumption. The results of ordinary least squares test show positive relation between GDP and energy consumption in Pakistan meaning that Pakistan economy is energy dependent. Shortage of energy means lower the economic growth of Pakistan. Ugwu, Nwankwojike, Ogbonnaya, and Ekoi (2012) in studying energy and economic losses due to constant power outages in Nigeria found that the economic losses associated with self generation of electricity is high. Ubi and Effiom (2013) considered the dynamic analysis of electricity supply and economic development in Nigeria. Their result indicates that Per Capita GDP, lagged electricity supply, technology and Capital are the significant variables that influence Economic development in Nigeria. Furthermore, the outcome of the study reveals that despite the poor state of electricity supply, it influences economic growth in Nigerian though its impact is relatively very low. 3.0 Materials and Methods 3.1 Theoretical Framework To investigate the relationship between economic growth and energy loss, the study employed a type of Cobb Douglas production function with constant return to scale as adopted by Najid etal (2012). The relationship can be expressed as follows: GDP=
φECβ1ʯ………………………………………1
Where, GDP is the Gross Domestic Product, φ is the total factor productivity, EC is the energy usage (in mw), β1 is the coefficient of energy consumption and ⋯ is the white noise error term. The authors, however, did not show the link between the cob- Douglas function and their model in equation 1 and the place of the total factor productivity in production activities. In its most standard form for production of a single good with two factors, the Cobb-Douglas function is stated as shown below; Y = ALβ Kα……………………………………………2 Where: Y = total production
L = labor input K = capital input A = total factor productivity α and β are the output elasticities of labor and capital, respectively. Total-factor productivity (TFP) is a variable which accounts for effects in total output not caused by traditionally measured inputs of labor and capital. If all inputs are accounted for, then total factor productivity can be taken as a measure of an economy’s long-term technological change or technological dynamism. Total Factor Productivity is often seen as the real driver of growth within an economy and studies reveal that whilst labour and investment are important contributors, Total Factor Productivity may account for up to 60% of growth within economies (Easterly, 2001) Therefore, an increase in either A, K or L will lead to an increase in output and vice versa. While capital and labor input are tangible, total-factor productivity appears to be more intangible as it can range from technology to knowledge of worker (human capital). Hence, Y = A x Lβ x Kα……………………………………………….3 It has been shown that there is a historical correlation between TFP and energy conversion efficiency, such that technology growth and efficiency are regarded as two of the biggest sub-sections of Total Factor Productivity. The assumption is that all forms of technology are energy driven while energy production requires heavy technology. In whichever way therefore, technological progress and energy correlates. From the foregoing this study considers electricity and gas losses as an aspect of TFP and a factor that can affect production with the assumption that a reduction in them will increase output. 3.2 Model Specification Considering GDP loss as a function of energy loss, A in equation 3 becomes energy loss (in mw). GDP=
Aβ……………………………………………….4
Where, A is energy loss in form of electricity and gas losses. Equation (4) can be expressed as follows: GDP = ELsβ1 GLsβ2
………………………………………….5
Where EL is electricity loss, GL is gas loss, β1, β2 are negative parameters of the variables. The
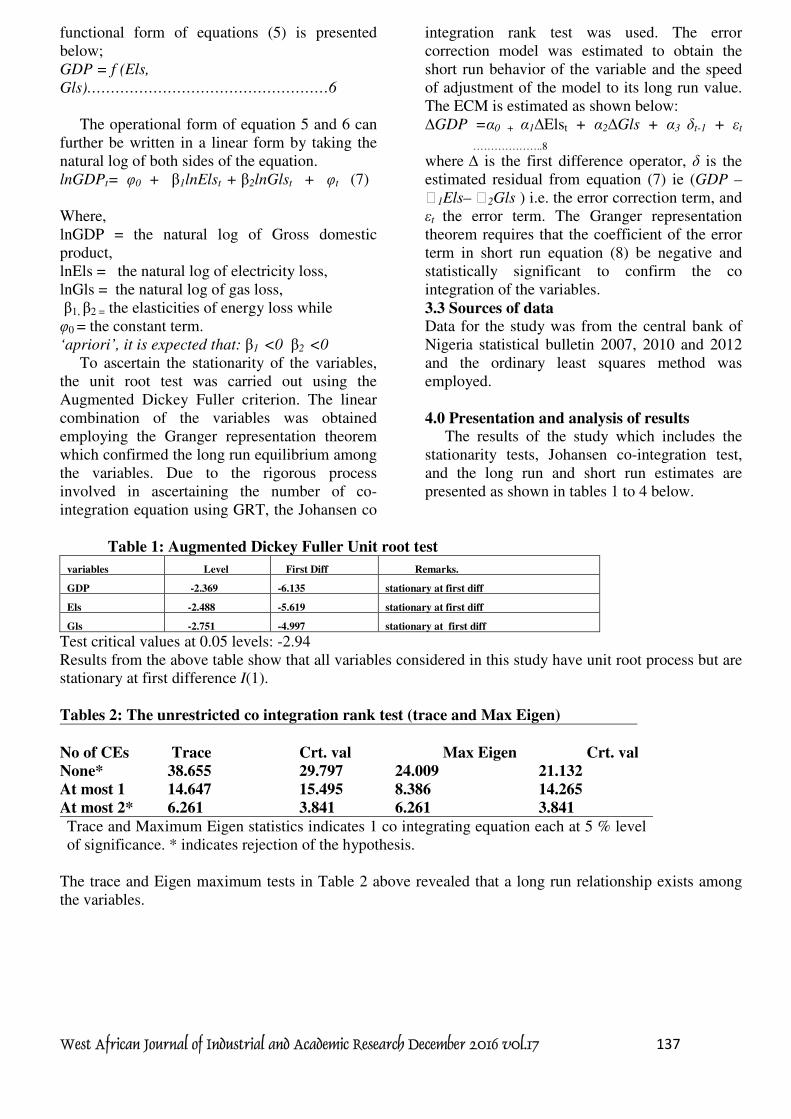
West African Journal of Industrial and Academic Research December 2016 v0l.17 137
functional form of equations (5) is presented below; GDP = f (Els,
Gls)……………………………………………6
The operational form of equation 5 and 6 can further be written in a linear form by taking the natural log of both sides of the equation. lnGDPt= φ0 + β1lnElst + β2lnGlst + φt (7) Where, lnGDP = the natural log of Gross domestic product, lnEls = the natural log of electricity loss, lnGls = the natural log of gas loss, β1, β2 = the elasticities of energy loss while φ0 = the constant term. ‘apriori’, it is expected that: β1 <0 β2 <0
To ascertain the stationarity of the variables, the unit root test was carried out using the Augmented Dickey Fuller criterion. The linear combination of the variables was obtained employing the Granger representation theorem which confirmed the long run equilibrium among the variables. Due to the rigorous process involved in ascertaining the number of co-integration equation using GRT, the Johansen co
integration rank test was used. The error correction model was estimated to obtain the short run behavior of the variable and the speed of adjustment of the model to its long run value. The ECM is estimated as shown below: ∆GDP =α0 + α1∆Elst + α2∆Gls + α3 δt-1 + εt
………………..8
where ∆ is the first difference operator, δ is the estimated residual from equation (7) ie (GDP –
ʯ1Els– ʯ2Gls ) i.e. the error correction term, and εt the error term. The Granger representation theorem requires that the coefficient of the error term in short run equation (8) be negative and statistically significant to confirm the co integration of the variables. 3.3 Sources of data Data for the study was from the central bank of Nigeria statistical bulletin 2007, 2010 and 2012 and the ordinary least squares method was employed. 4.0 Presentation and analysis of results The results of the study which includes the stationarity tests, Johansen co-integration test, and the long run and short run estimates are presented as shown in tables 1 to 4 below.
Table 1: Augmented Dickey Fuller Unit root test
variables Level First Diff Remarks.
GDP -2.369 -6.135 stationary at first diff
Els -2.488 -5.619 stationary at first diff
Gls -2.751 -4.997 stationary at first diff
Test critical values at 0.05 levels: -2.94 Results from the above table show that all variables considered in this study have unit root process but are stationary at first difference I(1). Tables 2: The unrestricted co integration rank test (trace and Max Eigen)
No of CEs Trace Crt. val Max Eigen Crt. val None* 38.655 29.797 24.009 21.132 At most 1 14.647 15.495 8.386 14.265 At most 2* 6.261 3.841 6.261 3.841 Trace and Maximum Eigen statistics indicates 1 co integrating equation each at 5 % level of significance. * indicates rejection of the hypothesis.
The trace and Eigen maximum tests in Table 2 above revealed that a long run relationship exists among the variables.

West African Journal of Industrial and Academic Research December 2016 v0l.17 138
Table 3: Ordinary least squares equation, dependent variable, DGDP Variables Coefficients Std Error T- statistic Prob. DGls -0.375 0.352 -1.065 0.293 DEls 1.326 0.094 14.125 0.000 C 7.811 3.247 2.406 0.021 R2 0.86 Adjusted R2 0.85 F-statistic 121.074 Prob(F-stat) 0.0000 DW 1.542
The error correction model estimated from equation 8 is presented as follows; Table 4: ECM result, dependent variable, DGDP Variables Coeff Std Error T- statistics Prob. Val DEls 0.297 0.073 4.04 0.0003
DGls -0.834 0.223 -3.736 0.0006 (ECM) -0.285 0.075 -3.837 0.0005 C 0.096 0.035 2.716 0.010 R2 0.51 F-Stat 12.335 Prob(F-stat) 0.000 DW 2.6
4.1 Discussion of Results Results show that gas loss affected the economy negatively in both short and long run. This means that increase in gas loss decreased the gross domestic product in Nigeria within the period of study. Reason for this relationship may not be unconnected with the fact that most industrial and commercial machines in Nigeria as well as most power stations are gas driven. Hence, gas loss or even insufficient supply of it will affect negatively the productive activities of the sectors. On the other hand, electricity loss negated the ‘apriori’ expectation. This implies that increased electricity loss increased gross domestic product in Nigeria for the period covering 1970-2012. A possible reason for this outcome is that the Nigerian economy is driven by auto- production of electricity. The implication is that production and other economic activities continued to increase while there was loss of electricity from the providers. Electricity loss however, is significant in explaining systemic variations in gross domestic product in both short and long run. This is because it drives all productive, research and development processes and a persistent trend may cripple economic activities because of high cost private electricity generation. Gas loss on
the other hand, is significant in the short run but insignificant in the long run in explaining systemic variation in GDP. The long run result showed that gas loss was not a major factor determining systemic variations in gross domestic product of Nigeria within the period of study; rather factors such as electricity loss play a more significant role hence, an insignificant result. Also very important to note is the effect of all variables not capture in the model, represented by the intercept term. Its probability value of 0.021 and the standard error of 3.25 imply its significance in explaining changes in gross domestic product of Nigeria with the period under study. Though the Durbin Watson shows a weak autocorrelation, the F-statistics and the R2 shows that the explanatory variables collectively explained variations in gross domestic product of Nigeria, hence, a well specified model. The error correction test shows that the speed of adjustment is 29 per cent. This means that the model will return to equilibrium at the rate of 29 per cent when the variables are above their equilibrium.
West African Journal of Industrial and Academic Research December 2016 v0l.17 139
4.2 Trend Analysis Electricity loss is electricity generated but not consumed due to transmission and distribution and not those un-generated or wasted. Electricity loss covering the period of study is 23,178.9 mw representing an average of 551.88mw per annum. Electricity loss increased in the 80’s to 3912 mw from 723.7mw in the 70’s or a 441 per cent increase. It further increased in the 90’s to 7168.2 mw and 11374.5 mw in the 2000’(see appendix 2).The study connects the continuous increased loss of electricity to inadequate maintenance of equipments, investments and expansion, and robust policies in the power sector. In Nigeria, gas flaring or loss is attributed to inadequate storing due to lack of development in the sector. Total gas loss within the period under consideration is 887,917.4million cubic meters representing an average of 20,649.25 million cubic meters loss per year. Gas loss in the 80’s reduced to 148,292 million cubic meters from 191,273 million cubic meters in the 70’s representing a 22.5 per cent reduction. The loss increased in the 90’s and 2000’s to 251,718 million cubic meters and 296,634 million cubic meters respectively or a 69.7 per cent and 17.8 per cent increase respectively. The increase from the 90’s to 2000’s was 0.8 per cent (see appendix
1). This study does not have any explanation for the decrease in gas loss in the 80’s but attributes the increase in loss in the 90’s and 2000’s to increase in production of gas in those year. 5.0 Conclusion and Policy Implications The study examined the effect of energy loss on Nigeria economy for the period of 43 years. Based on literature, the study adopted the Cobb Douglas production function as its theoretical framework. From the basics of this framework, and considering the centrality of energy in modern economies, a model was specified using real GDP as a function of electricity and gas loss. The study applied methods of econometric tests of stationarity, co integration and ordinary least square. Although the study did not dwell on the causes of energy loss in Nigeria, a major finding is that energy loss affects the gross domestic product of Nigeria in both short and long run. The study concludes that a drastic reduction of annual average electricity and gas loss of 551.88mw and 20649.24 million cubic meters respectively will increase productive activities and subsequently the GDP. Government should reinforce Policy issues on gas flaring to reduce the quantity of gas loss. In the same vein, investment on modern technology in power sector will in no small measure reduce power transmission and distribution losses.
____________________________________________________________________________________
References
Alam, M. S. (2006). Economic Growth with Energy. Retrieved on the 16th September 2012
www.economics.neu.edu/papers/documents/06-003pdf. Ayodele, A.S (2004). Improving and Sustaining Power (electricity) Supply for Socio Economic Development in Nigeria. www.CBnbank.org/OWT/publications/..RD/2001/OWE-01-3.
Retrieved on 4th january 2013. Balat, M. (2008). Energy Consumption and Economic Growth in Turkey during the past two decades. Energy plicy , 118-127. Bekhet, H. A & Othman, N. S (2011). Causality analysis among Electricity Consumption, consumer expenditure, Gross Domestic Product (GDP) and Foreign Direct Investment (FDI): Case study of Malaysia. Journal of Economics and International Finance Vol. 3(4), pp. 228-235,
Birol, F (2007) World Energy Prospects and Challenges. Melbourne: Blackwell publishing. Bhattacharyya, S.C (2011). Energy Economics: Concepts, Issues, Markets and Governance. Springer London Dordrecht Heidelberg New York.

West African Journal of Industrial and Academic Research December 2016 v0l.17 140
Buysse, J.; Begum, I. A.; Alam, M. J. and Huylenbroeck, G.V. (2012). Energy Consumption, Carbon Emissions and Economic Growth Nexus in Bangladesh: Co-integration and Dynamic Causality Analysis. Energy Policy, Volume-45, 217–225. Chen ST, Kuo HI, & Chen C (2007). The relationship between GDP and electricity consumption in 10 Asian countries. Energy Policy, 35: 2611-2621. Chima, C.M and Freed, R (2005). Empirical Study of the Relationship between Energy Consumption and Gross Domestic Product in the U.S.A. International Business & Economics Research Journal
Volume 4(12)
Ciarreta,A & Zarraga, A (nd). Electricity Consumption and Economic Growth: Evidence from Spain. Unpublished manuscript Department of Economic university of the Basque Country, Spain. Duane, A.H (n.d). Determining Lost and Unaccounted for Gas Loss. Retrieved from http://flowcal.com/wp-content/uploads/2012/02/Determining-Lost-and-Unaccounted-`For-Gas-Loss.pdf Easterly, W.; Levine, R. (2001). It`s Not Factor Accumulation: Stylized Facts and Growth Models. www.openknowledge.worldbank.org/bitssteam/handle/10986/17440/773550JRNNO2001Factor0Accumulation. Energy Information Agency (n. d). Power Loss.
http://www.eia.gov/tools/glossary/index.cfm?id=P 2/8/15 Ferguson, R., Wilkinson, W., and Hill, R. (2000). Electricity Use and Economic Development. Energy
Policy, 28 923-934. Geitena, F (2008). Treatment of losses by Network Operators. http://www.ceer.eu/portal/page/portal/eer_home/eer_consult/closed%20public%20consultations/electricity/treatment%20of%20losses/rr/enbw_treatment%20of%20losses.pdf. Retrieved on 2/8/15
` George, E.O and Oseni, J.E, (2012). The Relationship between Electricity Power And Unemployment rate in Nigeria. Australian Journal of Business and Management Research.
22(4), 10-19. Georgescu-Roegen, N. (1971). The Entropy Law and the Economic Process,
Harvard University Press, Cambridge, Mass. International Energy Agency (2011). Electricity Transmission and Distribution Loss http://data.worldbank.org/indicator/eg.elc.loss.zs Masuduzzaman, M (2012). Electricity Consumption and Economic Growth in Bangladesh: Co-Integration and Causality Analysis. Global Journal of Management and Business
Research Volume 12 (11) Metro, P (n. d). Pennsylvania Public Utility http://www.naruc.org/international/Documents/Technical_losses_in_natural_gas_transportation_distribution_storage_Paul_Metro.pdf. Retrieved on 2/8/15 Mozumder P, & Marathe, A (2007). Causality Relationship Between Electricity Consumption and GDP in Bangladesh. Energy Policy, 35: 375-402. Najid, A.; Muhammad, F.H.; Naqvi, H. & Muhammad, I.(2012). Energy Consumption and Economic Growth: evidence from Pakistan. Australian Journal of Business and Management
Research Vol.2 (6) 0-14 Odularu, O .O & Okonwo, C. (2009). Does Energy Consumption Contribute to Economic Performance? Empirical
Evidence from Nigeria. Journal of Economic and International Finance 2(12),044-058. Ouedraogo, I. M. (2010). Electricity Consumption and Economic Growth in Burkina Faso: A Co- Integration Analysis. Energy Economics 32, 524– 531.

West African Journal of Industrial and Academic Research December 2016 v0l.17 141
Oviemuno, A. O (2006). Impact Of Energy On Manufacturing Sector Of Nigeria. Retrieved from www.searhswarp .com
Shahbaz , M & Lean, H, H (2011). The Dynamics of Electricity Consumption and Economic Growth: A Revisit Study of Their Causality in Pakistan. http://mpra.ub.uni muenchen.de/33196/ MPRA Paper No. 33196. Stern, D. I.(2003) Energy and Economic Growth. Unpublished manuscript, department of Economics, Rensselaer Polytechnic Institue, NY, USA Ubi, P. S & Effiom, L. (2013). The Dynamic Analysis of Electricity Supply and Economic Development: Lessons from Nigeria. Journal of Sustainable Society Vol. 2,(1) 1-11 Ugwu, H.U. ,Nwankwojike, B.N., Ogbonnaya, E.A. & Ekoi, E.J (2012). Energy And Economic Losses Due To Constant Power Outages In Nigeria. Nigerian Journal of Technology (NIJOTECH)
Vol. 31, (2) 181-188
Appendix Charts
2
3
4
5
6
7
1970 1975 1980 1985 1990 1995 2000 2005 2010
LNELEC
Fig 1 electricity loss 1970-2012
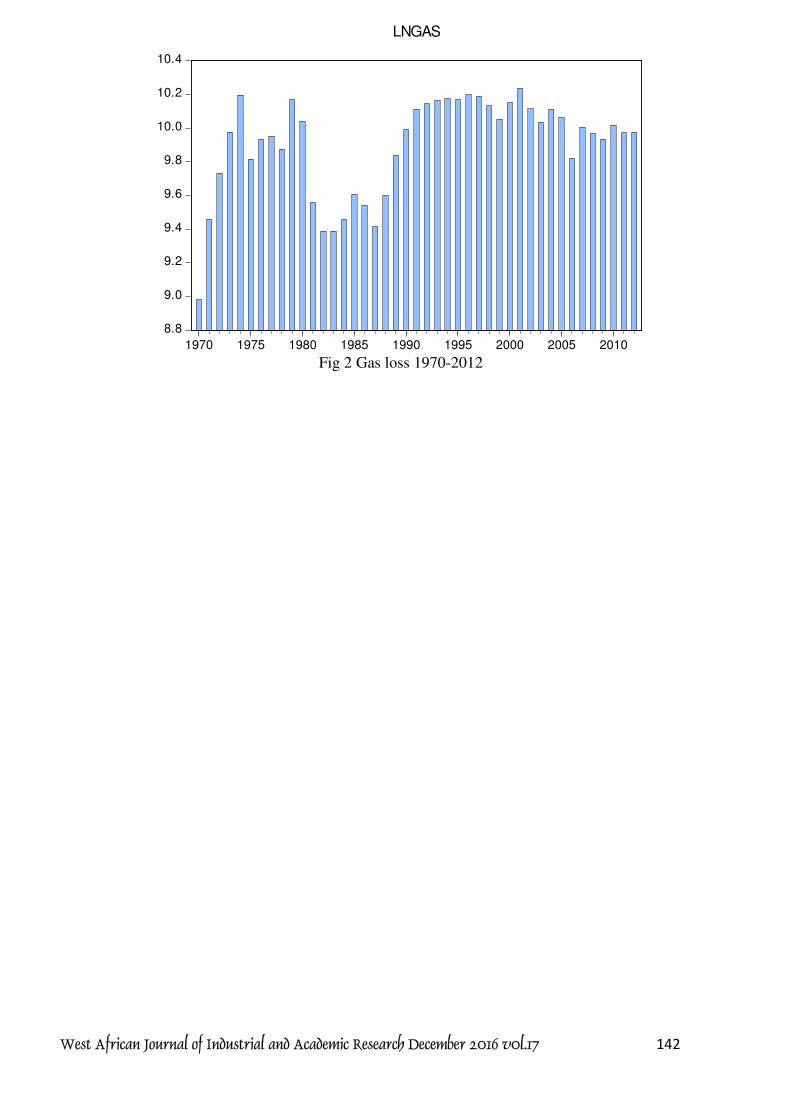
West African Journal of Industrial and Academic Research December 2016 v0l.17 142
8.8
9.0
9.2
9.4
9.6
9.8
10.0
10.2
10.4
1970 1975 1980 1985 1990 1995 2000 2005 2010
LNGAS
Fig 2 Gas loss 1970-2012

West African Journal of Industrial and Academic Research December 2016 v0l.17 143
Risk Assessment of Sediment of Aforemu River, Oye Ekiti, Nigeria
Fatoye, A.O and Ojo, T.J Department of Science Technology, Federal Polytechnic Ado Ekiti,
PMB 5351, Ado Ekiti, Ekiti State, Nigeria [email protected]
Abstract
The pollution properties of Pb, Cr, Cu, Zn, Cd, and Ni in river sediments were studied. The results
indicate varying degree of contamination with respect to their location in this order of 5>4>1>2>3 . The
concentrations of Pb, Cr, Cu, Zn, and Ni in the soil were low, so their potential ecological risks were far
lower than other heavy metals and exerted no potential harm to environment except Cd which is of great
concern. Key words: Heavy metals, geoaccumulation index, potential, ecological, indexs
1.0 Introduction Heavy metals are regarded as serious pollutants of sediment because of their toxicity and environmental persistence [1]. They can be migrated from the soil to other ecosystem componensts, such as groundwater, sediment and plants, thus affecting human health through drinking water and food chain. Health problems can be developed as a result of excessive dietary accumulation of heavy metals in human body [2]. There are various sources of heavy metals; some originates from anthropogenic activities like draining of sewerage, dumping of Hospital wastes and recreational activities. Conversely, metals also occur in small amounts naturally and may enter into aquatic system through leaching of rocks, airborne dust, forest fires and vegetation [3] Elements like Pb, Cd, Cr and Ni, are said to be non biodegradable thus, persist everywhere in the environment and have the ability to be deposited in various body organs which poses a great threat to the human health [4].Several researches have shown that food plants, growing in heavy metal contaminated soils have higher concentrations of heavy metals than those grown in uncontaminated soil [5]. It has been reported that serious health problems have develop as a result of high accumulation of heavy metals such as Cd, and Pb in the human body [6]. Despite Zn and Cu being essential elements in the diet, high concentration in food plants is of great concern because they are toxic to humans and animals [7]. Therefore, this study focuses on level and
risk of the heavy metals in the sediment of Aforemu River, oye Ekiti, Nigeria. 2.0 Material And Method 2.1 Sample collection and preparation Oye Ekiti is a town and headquarters of Oye Local Government Area in Ekiti state, western Nigeria. It has a geographical coordinates of 7°8′00″N and 5°33′00″E. The major occupation of the inhabitant is farming. A total of 25 sediment samples were collected from a depth of approximately 12cm at 5 different locations along Aforemu River stored in previously acid washed clean polythene container, which were subsequently thoroughly mixed. The samples were oven dried at 500C until a constant weight is achieved. Then, these samples were pulverized and sieved through 0.8mm mesh and stored in polythene bag for further analysis. 2.2 Determination of total heavy metal in soil Dried and powdered samples of 1.2 g were digested with mixture of HCl-HNO3-HF-HClO4. Pb, Cr, Cu, Zn, Cd, and Ni in the digest were determined using 210 VGP (Buck Scientific) atomic absorption spectrophotometer. The detection limit of the atomic absorption spectrophotometer used is 0.01. 2.3 Assessment method (1) Geo accumulation index (Igeo)
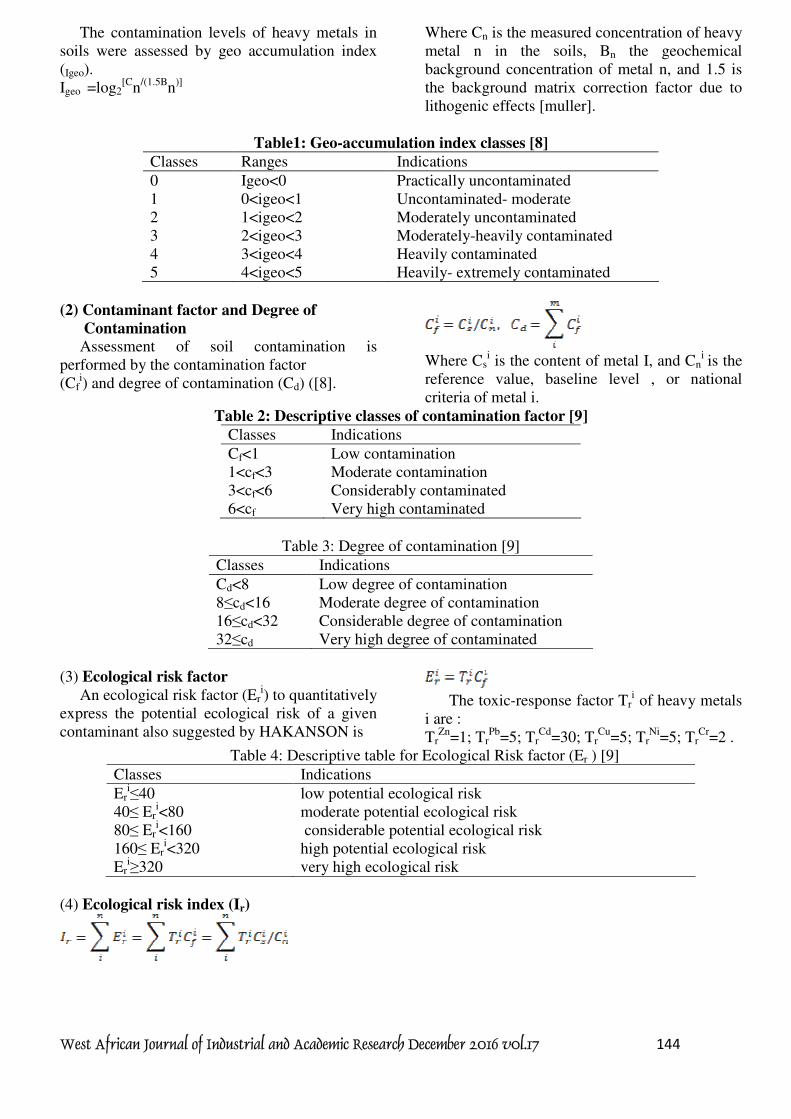
West African Journal of Industrial and Academic Research December 2016 v0l.17 144
The contamination levels of heavy metals in soils were assessed by geo accumulation index (Igeo). Igeo =log2
[Cn/(1.5Bn)]
Where Cn is the measured concentration of heavy metal n in the soils, Bn the geochemical background concentration of metal n, and 1.5 is the background matrix correction factor due to lithogenic effects [muller].
Table1: Geo-accumulation index classes [8]
Classes Ranges Indications
0 Igeo<0 Practically uncontaminated 1 0<igeo<1 Uncontaminated- moderate 2 1<igeo<2 Moderately uncontaminated 3 2<igeo<3 Moderately-heavily contaminated 4 3<igeo<4 Heavily contaminated 5 4<igeo<5 Heavily- extremely contaminated
(2) Contaminant factor and Degree of Contamination Assessment of soil contamination is performed by the contamination factor (Cf
i) and degree of contamination (Cd) ([8].
Where Cs
i is the content of metal I, and Cni is the
reference value, baseline level , or national criteria of metal i.
Table 2: Descriptive classes of contamination factor [9] Classes Indications
Cf<1 Low contamination 1<cf<3 Moderate contamination 3<cf<6 Considerably contaminated 6<cf Very high contaminated
Table 3: Degree of contamination [9]
Classes Indications
Cd<8 Low degree of contamination 8≤cd<16 Moderate degree of contamination 16≤cd<32 Considerable degree of contamination 32≤cd Very high degree of contaminated
(3) Ecological risk factor An ecological risk factor (Er
i) to quantitatively express the potential ecological risk of a given contaminant also suggested by HAKANSON is
The toxic-response factor Tri of heavy metals
i are : Tr
Zn=1; TrPb=5; Tr
Cd=30; TrCu=5; Tr
Ni=5; TrCr=2 .
Table 4: Descriptive table for Ecological Risk factor (Er ) [9]
Classes Indications
Eri≤40 low potential ecological risk
40≤ Eri<80 moderate potential ecological risk
80≤ Eri<160 considerable potential ecological risk
160≤ Eri<320 high potential ecological risk
Eri≥320 very high ecological risk
(4) Ecological risk index (Ir)

West African Journal of Industrial and Academic Research December 2016 v0l.17 145
Table 5: Descriptive table for Ecological Risk index (Ir ) [9] Classes Indications
Ir<150, low ecological risk low ecological risk 150≤ Ir<300 moderate ecological risk 300≤ Ir<600 considerable ecological risk Ir>600 very high ecological risk
3.0 Results Muller Descriptive Tables 1 is used to categorize the average values of Igeo for each metal and their pollution levels. To further determine the environmental pollution and the ecological damage of heavy metals in the soil, potential ecological risk index method proposed by HAKANSON [9] was employed and the descriptive Table 2-5 was used to categorize them.
Geo-accumulation Index (Igeo) The Igeo values were calculated by the heavy metals (Cu, Ni, Zn, Cr, Cd, Pb) average concentrations in soil samples. The average values of Igeo for each metal and their pollution levels are shows that they are uncontaminated-moderate The assessment results were in the following trend: Cd>Cr>Cu>Pb.>Zn>Ni
Table 6: Result for Contamination factor(Cf) and degree of contamination (Cd) in the sediment
Cf
Location Cr Ni Pb Zn Cd Cu Cd
1 0.10 0.97 1.52 0.50 4.34 0.10 7.53 2 0.11 0.81 1.92 0.51 4.20 0.13 7.68 3 0.09 0.75 2.12 0.55 3.92 0.14 7.58 4 0.13 0.86 1.66 0.44 4.40 0.12 7.61 5 0.12 0.88 2.03 0.49 4.64 0.14 8.30
Average 0.11 0.85 1.85 0.50 4.30 0.13
Contamination factor and degree of contamination, descriptive table 3.0 and 4.0 are used to categorized them. Cd is greater than 3 and less than 6 which indicated that it is considerable contaminated while Pb is greater than 1 and less than 3 which indicated moderate contamination. Cr, Ni, Zn and Cu were less than 1 which indicated low contamination. As can be seen from Table 6, the contamination degrees of location 1,2,3and 4 were less than 8 which indicated that they were
within low degree of contamination. The contamination degree of location 5 is greater than 8 but less than 16 which indicated moderate degree of contamination. The average contamination degree of all soil samples was 8.45, which suggested that they were within moderate degree of contamination. The order of contamination degree of each sampling area was5>2>4>3>1.
Table 7: Result for Ecological Risk factor(Er) and Potential Ecological Risk index (Ir) in the
sediment Er
Location Cr Ni Pb Zn Cd Cu Ir
1 0.20 4.85 7.60 0.50 130.20 0.50 143.85 2 0.22 4.05 9.60 0.51 126.00 0.65 141.03 3 0.20 3.75 10.60 0.55 117.60 0.70 133.40 4 0.26 4.30 8.30 0.44 132.00 0.60 145.90 5 0.24 4.40 10.15 0.49 139.20 0.70 155.18

West African Journal of Industrial and Academic Research December 2016 v0l.17 146
Average 0.22 4.27 9.25 0.50 129.0 0.63
According to Table 7, the potential ecological risk factor of Cr, Ni, Pb, Zn and Cu were much less than 40, indicating low ecological risk. The potential ecological risk factor of Cd was greater than 80 and less than 160, indicating considerable potential ecological risk. The order of the potential ecological risk factor of heavy metals was Cd>Pb>Ni>Cu>Cr. The potential ecological risk index for each location was in the order of 5>4> 1>2>3. In addition, the potential ecological risk index for location 1, 2, 3, and 4
was less than 150, indicating that the potential ecological risk was low. Among them, the Ir value of location 5 was greater than 150, indicating moderate potential ecological risk index. The concentrations of Cr, Ni, Pb, Zn, Cd, and Cu in the sediment were low, so their potential
ecological risks were far lower than other heavy metals and exerted no potential harm to environment except Cd which is of great concern . ` 4.0 Conclusion The Igeo values suggest that the soil samples were uncontaminated-moderate with the heavy metals. The assessment results show that the contamination degree from considerable to low in soil is Cd>Pb>Ni>Zn>Cu>Cr. The potential ecological risk index for each location is in the order of 5>4>1>2>3. The order of the potential ecological risk factor of heavy metals is Cd>Pb>Ni>Cu>Zn>Cr.
Reference
[1] CHEN Jian-qun, WANG Zhen-xing, WU Xie, ZHU Jian-jun, ZHOU Wen-bin. Source and hazard identification of heavy metals in soils of Changsha based on TIN model and direct exposure method [J]. Transactions of Nonferrous Metals Society of China, 2011, 21(3): 642−651. [2] LIM, H S, LEE J S, CHONG H T, SAGER M. Heavy metal contamination and health risk assessment in the vicinity of the abandoned Songcheon Au−Ag mine in Korea [J]. Journal of Geochemical Exploration, 2008, 96(2−3): 223−230. [3] LG Fernandez and HY Olalla, “Toxicity and bioaccumulation of lead and cadmium in marine protozoan communities”, Ecotoxicology and Environmental Safety, vol. 47, pp. 266-276, 2000. [4] Chen Y, Wang C, Wang Z. Residues and source identification of persistent organic pollutants in farmland soils irrigated by effluents from biological treatment plants. Environ. Intern, 2005, 31: 777-783. [5] Akan JC, Abdulrahaman FI, Sodipo OA, Lange AG. Physicochemical parameters in soil and vegetable samples from Gongulon Agricultural site, Maiduguri, Borno state, Nigeria. J. Am. Sci., 2010, 6: 12. [6] Zhuang P, McBride MB, Xia H, Li H, Li Z . Heavy metal contamination in soils and food crops around Dabaoshan mine in Guangdong, China: implication for human health. Environ. Geochem. Health, 2008,31: 707-715. [7] Kabata-Pendias A, Mukherjee A.B. Trace elements from soil to human. NewYork: Springer-Verlag, 2007. [8]Muller, G. Index of geoaccumulation in sediments of the Rhine River. Geojournal, , 1996, 2(3), 108-118. [9]Hakanson, L. An ecological risk index for aquatic pollution control. A sedimentological approach. Water Resources, 1980, 28, 975-1001.

West African Journal of Industrial and Academic Research December 2016 v0l.17 147
The Biological Father of esus Christ; A Critique Of James Tabor’s Hypothesis
Nwaocha Ogechukwu
Abstract
This article centers on the importance and methods ofusing Theory and Hypothesis as scientific tools and
how they could be usedin the scientific study of religious tradition, institutions, and founders. Using James
tabor’s Hypothesis ascholar can easily understand the underlining biased factors that affect scholars in
the scientific study of Religion and several ways thesescientific tools have been employed for theological
studies and as such have led to the formation of various concepts and religious doctrines about Jesus’
nature and birth in particular. With thecritique involved in Tabor’s Hypothesis, several scientific and
historical evidence have been called into question for their validity and further verification and
clarification namely, the historicity of Celsius and the reliability of his information about Jesus’
illegitimacy, the reliability of archeological evidence in religion and theological studies, and the Realness
of Mary’s infidelity as regard to Adultery if Justified.
Key Words: Jesus’ Birth, scientific theology, religious theory, hypothesis, James Tabor _____________________________________________________________________________________
Introducton Originally, it is a tradition of religions with different belief systems to develop theological hypothesis and theories like Kenosis theory (Oord 2010) and the Swoon hypothesis (David Strauss 1879) to justify certain doctrines and dogma. Central to the dogma of Christian Traditions is the dual nature of Christ, his origin and the doctrine of “immaculate conception” which several scholastic theologians have tried to justify using hypothesis and theories to support the religious “beliefs”. Generally Hypothesis denotes a supposition or perhaps proposed explanation (for a phenomenon) made on the basis of limited evidence, as a starting point for further investigation. Using hypothesis for the development of theological tradition or researches in theological related projects, several controversial and religious conflicting ideas that will definitely contradict already established dogma have been developed but with little conflicting ideology because of the elements of scientific principles employed for empirical inquiry and analysis of a test methods used for the explanation of phenomenon through hypothesis and its contradiction against certain religious belief and doctrines which has caused several controversies both within and outside the religious context. In the formal logic-hypothesis denote the antecedent of a proposition, andLogically it can be explained as ; If P then Q,
P is the hypothesis or antecedent thus the assumption in a (possibly counter factual) what if question Q can be called a consequent In theology, it is generally believed that the dual nature of Christ comprises of both his spiritual and human nature. This doctrine is called the doctrine of the hypostatic union, which from the Greek word means “hypostasis” (e.i. substantive reality). Early church figures such as Athanasius used the term "hypostatic union"(the P antecedent) to describe the teaching (Hypothesis) that these two distinct natures (divine and human) co-existed substantively and in reality in the single person of Jesus Christ. The aim was to defend the doctrine using theological theories and hypothesis that Jesus was simultaneously truly God and truly man.Contrary to the theological Justification of deification of Jesus from the theological support little did theologians understand justification of Jesus’ biological father by a Greek Philosopher- Celsus in the contra celum 1.33. Here, his statement has in this modern time led to the development of several social scientific theories and Hypothesis for the scientific study of Jesus Biological Father. The 1:33 of the contra Celum states:

West African Journal of Industrial and Academic Research December 2016 v0l.17 148
“Let us return however, to the words put into the
mouth of the Jew, where the mother (May) of
Jesus is described as having been turned out by
the carpenter who was betrothed to her, as she
had been convicted of adultery and had a child
by a certain solder named panther.” (p.32) About 177 AD Celsus, in his book ‘The True Word’, expressed what appears to have been the consensus Jewish opinion about Jesus’ Paternity; that his father was a Roman soldier called Pantera. ‘Pantera’ means Panther and was a fairly common name among Roman soldiers. The rumor is repeated in the Talmud and in medieval Jewish writings where Jesus is referred to as “Yeshu ben Pantera”. This idea of Jesus biological father was propagates by many historians who perhaps may have little empirical knowledge to justify the Historical events centered on the life of Christ, like the defense of Origen and Celsius. Basing his Argument from Celsius Apologetic Defense of the ancient Italian religion and his attack against Christ’ legitimacy, James Tabor linked his Hypothesis with Tiberius Julius AbdesPantera’s artifacts discovered by historians in German. Judging by Tabor’s Hypothesis, a scientific study of Jesus’ origin leads to a radical conclusion that Jesus is a
biological produce of nature as skeptics alleged or a spiritual product of a supernatural force. This article will help provide empirical methods, though highly controversial to theological faith, of studying Jesus birth apart from a traditional Christian doctrine that has no scientific Justification, and also provide a better way Hypothesis and Social scientific Theories can be employed for non-theological scholarly study of unexplained and “mysterious” events that have no Empirical proves. To understand the critical analysis of this article, a closer understanding of Tabor’s hypothesis is required.
James Tabor’s Hypothesis During the construction of a railroad in Bingerbrück in Germany, tombstones for nine Roman soldiers were accidentally discovered.https://en.wikipedia.org/wiki/Tiberius_Ju
lius_Abdes_Pantera - cite_note-page15-2 One of the tombstones was that of Tiberius Julius AbdesPantera and is presently kept in the Römerhalle museum in Bad Kreuznach, Germany (Rousseau 1995). The inscription, according to Campbell (1994) in (CIL XIII 7514) on the tombstone of AbdesPantera, reads
Tib(erius) Iul(ius)
AbdesPantera
Sidoniaann(orum)
LXII
stipen(diorum)
XXXX miles
exs(ignifer?)
coh(orte) I
Tiberius Julius
AbdesPantera
from Sidon, aged
62 years
Served 40 years,
former standard
bearer (?)
of the first cohort
sagittariorum
h(ic) s(itus) e(st)
of archers
lies here
The Photograph above showed Tiberius Pantera's tombstone in Bad Kreuznach and Pantera (Left), and a Roman legionary (right), who archeologists maintained that he remains a plausible biological father for
Jesus111

West African Journal of Industrial and Academic Research December 2016 v0l.17 149
James Tabor hypothesized the possible connection between the two Panteras hinging on the assumption that Celsus' information about Jesus' paternity was correct,the Rabbinic Talmud calls Jesus “Ben Pantera”, son of Pantera and a soldier with this name, living at the right period, might be his father. Tiberius Julius AbdesPantera's career would place him in Judea (present-day Israel) as a young man around the time of Jesus' conception, and Tabor has hypothesized that as a connection (Tabor 2006). According to Tabor, Tiberius Julius
AbdesPantera (c. 22 BC – AD 40) was a Roman soldier whose tombstone was found in Bingerbrück, Germany, in 1859.
Analysis of Inscription The name “Pantera” is Greek, although it appears in Latin in the inscription. It was perhaps his last name, and means panther. The names Tiberius Julius are acquired names and were probably given to him in recognition of serving in the Roman army as he obtained Roman citizenship.https://en.wikipedia.org/wiki/Tiberius_Ju
lius_Abdes_Pantera - cite_note-page15-2 The name “Abdes” means "servant of God" (Latinate form of Aramaic Ebed) and suggests that Pantera had a Semitic or even Jewish background. Pantera was from Sidonia, which is identified with Sidon in Phoenicia, and joined the Cohors I Sagittariorum (first cohort of archers)(James Whitehead 2009).Pantera is not an unusual name, and its use goes back at least to the 2nd century (Craig A. Evans 2003). Prior to the end of the 19th century, at various times in history scholars had hypothesized that the name Pantera was an uncommon or even a fabricated name, but in 1891 French archeologist C. S. Clermont-Ganneau showed that it was a name that was in use in Iudaea by other people and Adolf Deissmann later showed with certainty that it was a common name at the time, and that it was especially common among Roman soldiers(Adolf Deissmann 2003).At that time Roman army enlistments were for 25 years and Pantera served 40 years in the army until his death at 62.The reign of Emperor Tiberius was between 14 and 37 and the Cohors I Sagittariorum was stationed in Judaea and then in Bingen. Pantera was probably the standard bearer (signifer) of his cohort (James Tabor 2006).A possible connection between the two Panterasdiscovered differently has been
hypothesized by James Tabor, and hinges on the assumption that Celsus' information about Jesus' paternity was correct, and a soldier with this name, living at the right period, might be his father. Tiberius Julius AbdesPantera's career would place him in Judea (present-day Israel) as a young man around the time of Jesus' conception, and Tabor has hypothesized that as a connection with Jesus (Tabor 2006
Hypothetical Connection With Jesus According to Historians, It appeared that this First Cohort of Archers moved from Palestine to Dalmatia in 6 AD and to the Rhine in 9 AD. Pantera came from Sidon, on the coast of Phoenicia just west of Galilee, presumably enlisted locally. He served in the army for 40 years until sometime in the reign of Tiberius. On discharge he would have been granted citizenship by the Emperor (and been granted freedom if he had formerly been a slave), and added the Emperor’s name to his own. Tiberius ruled from 14 AD to 37 AD. Pantera’s 40 years of service would therefore have started between 27 BC and 4 BC.As Pantera would probably have been about 18 when he enlisted, it means he was likely born between 45 BC and 22 BC. He could have been as old as 38 or as young as 15 at the time of Jesus’ conception in the summer of 7 BC.In 6 AD when Jesus was 12, Judas of Galilee led a popular uprising that captured Sepphoris, the capital of Galilee. The uprising was crushed by the Romans some four miles north of Nazareth. It is possible (and appealing to lovers of historical irony) that Pantera and Joseph fought on opposite sides. As Joseph is never heard of again he may well have been killed in the battle, or have been among the 2,000 Jewish rebels crucified afterwards.So IuliusAbdesPantera is indeed a possibility as Jesus’ father according to Tabor. The only thing we know for certain is that Mary’s husband Joseph wasn’t the father, and that Mary was already pregnant when they married. It could
have been rape, or Mary may have been a wild
young teen who fell for a handsome man in a
uniform, even if he was part of an occupying army(SimchaJaconbovici 2014). Originally AbdesPantera adopted the name “Tiberuis” after he gained freedom. According to Jaconbovici (2014), General Varus (during the roman battle for conquest) moved to Germany from Judea and fought war with less success. He tried to expand
West African Journal of Industrial and Academic Research December 2016 v0l.17 150
the Roman Empire across the Rhine, leading three Roman legions to one of the worst defeats in Roman history. On September 9th, 9 CE/AD, thirteen years after his victory in Judea, the General marched three legions east of the Rhine and into an ambush, lead by Arminius. The slaughter was total. Roman Armies were captured and sacrificed to Germanic gods; others were caged and burned alive. Varus was decapitated; kind of what he did to Simon of Peraea. Worse, the Germanic tribes captured the Romans’ standards i.e., their as if their very gods had been defeated. The defeat at Teutoburg Forest was avenged by the Roman general Germanicus, adopted son of Emperor Tiberius, in 14 and 15 CE. Germanicus recaptured two of the lost eagles and even managed to capture the pregnant wife of Arminius, the tribal chief who defeated Varus. In Germanicus’ army, there was an officer named Tiberius Julius Pantera, a bowman who died at the age of 62 and was buried with honors in Bingerbrück. He carried the standards of the legion. He was not originally from Germany, nor was he from Rome, but in fact born in Sidon, just north of the Galilee and it seems that he served in the area of Judea just after Herod died and before Jesus was born, during the reign of Emperor Tiberius. Originally, he had been taken captive but he got his freedom after serving in the Roman army and he took on the name “Tiberius”, after the emperor who liberated him. It was during this emperor’s reign that Jesus was crucified.
Critical Analyses of Tabor’s Hypothesis Within the scope of the Christian theological ChristsHumanness theory. In many New testament references like the Gospel account of Matthew, Jesus was referred to as the son of Mary or perhaps that of the carpenter Joseph (13:55). Again, his blood brothers and sisters were even mentioned (Matthew 55:56). Possibly, he was born through the birth Canal of a woman which is the natural process for birth in man as one of the Mammals in Animal Kingdom .The possibility of birth through the female carnal to take place without fertilization that occur between the sperm cells of the man and the female oocyte in mammals has not yet been established in man except the controversial case reportsof In vitro Parthenogenesis in Mammals which is still one of the greatest religious controversy against science. For example, Scientists at Tokyo University of Agriculture in
April 2004 used parthenogenesis successfully to create a fatherless mouse. Using gene targeting, they were able to manipulate two imprinted loci H19/IGF2 and DLK1/MEG3 to produce bi-maternal mice at high frequencyand subsequently show that fatherless mice have enhanced longevity(Kawahara 2009).Again, On August 2, 2007, after much independent investigation, a South Korean scientist named Hwang Woo-Suk unknowingly produced the first human embryos resulting from parthenogenesis. Initially, Hwang claimed he and his team had extracted stem cells from cloned human embryos, a result later found to be fabricated. Further examination of the chromosomes of these cells show indicators of parthenogenesis in those extracted stem cells, similar to those found in the mice created by Tokyo scientists in 2004. Although Hwang deceived the world about being the first to create artificially cloned human embryos, he did contribute a major breakthrough to stem cell research by creating human embryos using parthenogenesis (Williams Chris 2007). The truth was discovered in 2007, long after the embryos were created by him and his team in February 2004. This made Hwang the first, unknowingly, to successfully perform the process of parthenogenesis to create a human embryo and, ultimately, a human parthenogenetic stem cell line. Fertilization, from the science of biology, involves the fusion of the oocyte with the sperm cells to form a zygote through mitotic and mitotic division mechanism (pre-natal development). This process usually occurs in the ampulla of the fallopian tube of the female reproductive tract in the case of human, and takes nine months through various Biological transformations to form a baby that will be delivered. Infact, this mechanism naturally cannot take place withoutcopulationin man, except in the case of advanced medicaltherapeutic methods for fertility problem like artificial insemination or in-vitro fertilization method, but must involves the two cells – spermatozoa and oocyte. According to Gospel account of John 6:42, the Jews stated that they are sure of his father Joseph and his Mother Mary. And is it also possible to believe that his brother James, Joseph, Simon and Judas and his sisters were all born through the same birth carnal by copulation between Joseph and Mary, except him? Why is his own case exceptional and the acceptance of fertilization prior to his
West African Journal of Industrial and Academic Research December 2016 v0l.17 151
birth very difficult to accept?Infact, Mary the mother of Jesus, even questioned the possibility of “fertilization and birth” to take place without sexual relationship between a man and a woman (Luke 1:34). Furthermore, an attempt to divorce Mary by her betrothed is a suspect of infidelity from the human standpoint (Mathew 1:19). Although the Jews referred to Jesus as son of Joseph, but Gospel writers never acknowledge Joseph as His human father, but acknowledged Mary to be his mother, except Philip who referred to him as the son of Joseph from Nazareth (John 1:45). As far as the Jews were concerned, he was a real man, of flesh and blood as other men were. To them, Jesus was not a phantom or apparition but truly a man born of a woman. On the contrary Christian Theologians believed that Jesus claimed that he was from God as a spirit being who lived in a transcendental realm; heavens, as his origin (John 6:40, 6:38). By this, was Jesus referring to himself as demigod if he claims an ultimate supreme being above all to be his father? Or perhaps does it means that the god of the Christian faith and that of the Jews has the transforming ability of the Greek God-king Zeus who fathered generations of heroes and heroines and featured in their mythologies? In review of James Tabor’s Hypothesis of Jesus biological, how come all the founders of various religious groups – cults, sects, denomination etc – trace their origin from a parent that comprises of both a father and a mother while traditional Christian teachings of Jesus Birth took a different shape ofa single parent of one single woman? For instance, in the case of the (1) Founder of Judaism – Moses – the Book of Exodus (Among the Pentateuch) 2:1-2 reads, “…. About that time, a certain man of the house
of Levi married a daughter of Levi. And the
woman became pregnant and gave birth to a son.
When she saw how beautiful he was, she kept
him concealed for three months.” Verses 20 of chapter 6 of the Exodus identified the parents as Amram (father) and Jochebed (mother). The parents of the (2) Founder of Islam – Prophet Muhammad – are Abdullah Ibn Abdul – Muttalib (father) and Aminah (mother). In fact, as regard his spiritual natures, Gerald Benedict (2008 pg. 380) stated, “unlike Jesus of
Nazareth, he (Muhammad) made no claim to
divinity and repudiated any power to
it……………….”.In (3)Buddhism, Buddha’s
parents are not hidden as evidence showed tragic event that affected his parents shortly after his birth and his father’s role and supports towards his training. Buck and his researcher (2016) recorded that Buddha’s father was ruler of a poor Indian tribe, the Shakyas and his mother died seven days after giving birth to him. Infact, the the above mentioned authors stated, “that………. Gautama’s(Buddha’s) father, in order to prevent him from worrying about the problems of suffering, death and in justice, build a special place for him surrounded with distracting luxuries. Gautama eventually Married and had a son……………… but later Historic research identified Buddha’s parents as king Suddhodana (his father) and Queen Maya Devi (His mother), but he was raised by his mother’s younger sister MahaPajapati (FerdinadHerold 1922). As for (4)Confucius (the founder of Confucianism) record had it that his father Shuliang He- Kong He and his mother, Yan Zhengzai had prayed at Nigu mountain for a son, and so they named their child after that mountain. His father passed away three years later after his birth and his mother passed away after seventeen years (Su-Fen Lin 2011). Furthermore, according to the records of the Historical (slipstitch) believed that Confucius’s father divorced his first wife at an advanced age because she had borne him only daughters and one disfigured son. He then married a fifteen –year-old girl from yen clan, who gave birth to confucius. SSu-ma Ch’ien refers to the relationship as a “wild- Union,” which very possible indicates that Confucius was an illegitimate child, or perhaps a child born out of wedlock (Collns2016).
(5)Loa – Tzu was another founder of Toaism whose birth has mysterious events based on mythological and legendary tales. His personal life is shoulder in mystery and there are many legends associated with his birth and life. One “Shiji” written by SimaQuan (Histronan of 145 BC) is the only reliable account for his life. He explained that Lao Tzu was born in the Ku County of the state of Chu- the present day LuyiCounty of the Hena province. Legend said that he was born after spending eight or eight years in his mother’s womb, for which he was called the “the old child”. Perhaps, there is silence on the biological father because his origin is based on mythological folktales of the ancient
Chinese tradition.

West African Journal of Industrial and Academic Research December 2016 v0l.17 152
Discussion Apart from the scientific explanation of the mechanism behind Jesus birth, Tabor’s Hypothesis called into question (1) the possibility of self and auto fertilizationin the body of Mary only without copulation with Joseph if his Hypothesis is not scientifically proven. Or perhaps does it mean that Mary is a Hermaphrodite; a living person bearing two genital organs of the opposite sexes or was Jesus formed as Chimeras? Chimerasare the result of fusion of two zygotes to form a single embryo, producing an individual with genetically different kinds of tissue. If the fused zygotes are of different sex, the individual develops both ovarian and testicular tissues. But if from one sex it produces one. However majority of these people are best reared as females and many pregnancies with living offspring have been reported in persons reared as female, and several cases has fathered a child. Here, during ovulation, a negative pressure occurs in the lumen of the oviduct and it produces a vacuum effect which has made several pregnancies possible in subjects lacking in ipsilateral ovary by allowing the trans-peritoneal migration of oocyte from the coito-lateral gonad. In science, self-fertilization has been reported in many flowering Plants,kind of fish , in a case of rabbit . Here they have both eggs and sperms cell in their body and at fertilization, one sperm cell fuses with oocyte to form an embryo. Tabor’s Hypothesis (2) projectedMary as a woman infidelity; an idea contrary to the immaculate theology of the Orthodox Church. Perhaps she could have been stoned since her attitude could be considered a gross sin against the Jewish law (Exodus 20:14 and compare with Deuteronomy 32:2), infact, Leviticus 20:10 sated, “Now regarding a manwho committed
adultery with another man’s wife: The one who
commits adultery with the wife of his fellow man
should be put to death without fail, the adultery
and the adulteress”. In fact, an attempt was made to stone a woman accused of such by the Jews Matthew { }. On the hand Mary was not yet married as the Gospel writer put it she was engaged to her betrothed as a virgin,but the Jewish law made provision for a punishment of both the engaged Virgin and her violator. Deuteronomy 22:23-4 states; “If a virgin is engaged to a man, and another
man happens to meet her in the city and lies
down with her, you should bring them both out to
the gate of that city and stone them to death, the
girl because she did not scream in the city and
the man because he humiliated the wife of his
fellow man. So you must remove what is evil
from you midst.” If by James Tabor’s hypnosis that panther beget Jesus, does it mean that Jesus is an illegitimate son like Confucius as Collins (2016) stated? Perhaps that could violate the Jewish Law of illegitimacy or as Picknet termed him “the
bastard son of Mary”!The book of Deuteronomy 32:2 states: “No illegitimate son may commit into the
congregation of (Jehovah) God. Even to the tenth
germination, none of leg decedents may come
into the congregation of Jehovah.” (New World Translation 2013) Naturally, it is always difficult for a woman who is sexually humiliated to openly discuses, debate, ormakes public the violated experience to another person because of psychological trauma, feeling of shyness, and embarrassment.Even, most female victims of rape don’t easily open up! Most cry because of feeling of dejection and humiliation when the violator or perhaps the rapist is subjected for public prosecution. On the other hand, it is not common for a young man to easily many a pregnant human whose pregnancy he’s not responsible for. The Gospel accounts of Matthew, mark, Luke and John did not record any emotional trauma and disturbance of a sexual experience on account of Mary but only the trembling and fear of seeing a strange being (Luke 1:29-30), it can be possible for her to conceal the “assumed secret sexual act” because of fear of being stoned to death, humiliation, public disgrace and embranchment or perhaps in other not to make her a public spectacle, Joseph decided to obey the Jewish law by intended to divorce her secretly (Matthew 1:19). In the Hebrew Scripture, the book of Deuteronomy 24:1, 4 states,”
“If a man marries a woman but she does not please him
because he found something indecent about her,
he must write out a certificate of divorce for her,
hand it to her, and dismiss her from his house
…… her first husband who dismissed her will not
be allowed to take her back again as his wife
after she has been defiled….” In the case of self-fertilization, it also occurs in human. A case study has been discovered by MK Irmak ( 2010)where a woman has a son without a
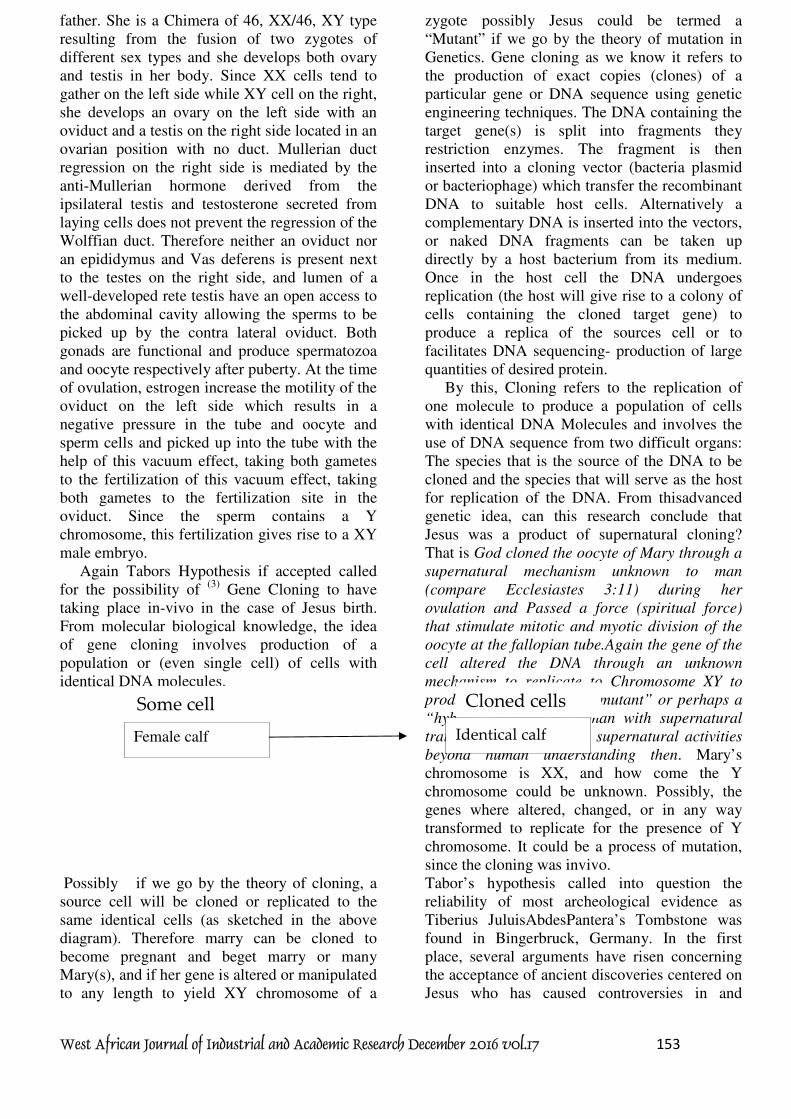
West African Journal of Industrial and Academic Research December 2016 v0l.17 153
father. She is a Chimera of 46, XX/46, XY type resulting from the fusion of two zygotes of different sex types and she develops both ovary and testis in her body. Since XX cells tend to gather on the left side while XY cell on the right, she develops an ovary on the left side with an oviduct and a testis on the right side located in an ovarian position with no duct. Mullerian duct regression on the right side is mediated by the anti-Mullerian hormone derived from the ipsilateral testis and testosterone secreted from laying cells does not prevent the regression of the Wolffian duct. Therefore neither an oviduct nor an epididymus and Vas deferens is present next to the testes on the right side, and lumen of a well-developed rete testis have an open access to the abdominal cavity allowing the sperms to be picked up by the contra lateral oviduct. Both gonads are functional and produce spermatozoa and oocyte respectively after puberty. At the time of ovulation, estrogen increase the motility of the oviduct on the left side which results in a negative pressure in the tube and oocyte and sperm cells and picked up into the tube with the help of this vacuum effect, taking both gametes to the fertilization of this vacuum effect, taking both gametes to the fertilization site in the oviduct. Since the sperm contains a Y chromosome, this fertilization gives rise to a XY male embryo. Again Tabors Hypothesis if accepted called for the possibility of (3) Gene Cloning to have taking place in-vivo in the case of Jesus birth. From molecular biological knowledge, the idea of gene cloning involves production of a population or (even single cell) of cells with identical DNA molecules. Possibly if we go by the theory of cloning, a source cell will be cloned or replicated to the same identical cells (as sketched in the above diagram). Therefore marry can be cloned to become pregnant and beget marry or many Mary(s), and if her gene is altered or manipulated to any length to yield XY chromosome of a
zygote possibly Jesus could be termed a “Mutant” if we go by the theory of mutation in Genetics. Gene cloning as we know it refers to the production of exact copies (clones) of a particular gene or DNA sequence using genetic engineering techniques. The DNA containing the target gene(s) is split into fragments they restriction enzymes. The fragment is then inserted into a cloning vector (bacteria plasmid or bacteriophage) which transfer the recombinant DNA to suitable host cells. Alternatively a complementary DNA is inserted into the vectors, or naked DNA fragments can be taken up directly by a host bacterium from its medium. Once in the host cell the DNA undergoes replication (the host will give rise to a colony of cells containing the cloned target gene) to produce a replica of the sources cell or to facilitates DNA sequencing- production of large quantities of desired protein. By this, Cloning refers to the replication of one molecule to produce a population of cells with identical DNA Molecules and involves the use of DNA sequence from two difficult organs: The species that is the source of the DNA to be cloned and the species that will serve as the host for replication of the DNA. From thisadvanced genetic idea, can this research conclude that Jesus was a product of supernatural cloning? That is God cloned the oocyte of Mary through a
supernatural mechanism unknown to man
(compare Ecclesiastes 3:11) during her
ovulation and Passed a force (spiritual force)
that stimulate mitotic and myotic division of the
oocyte at the fallopian tube.Again the gene of the
cell altered the DNA through an unknown
mechanism to replicate to Chromosome XY to
produce possibly a male “mutant” or perhaps a
“hybrid” product of human with supernatural
traits who could perform supernatural activities
beyond human understanding then. Mary’s chromosome is XX, and how come the Y chromosome could be unknown. Possibly, the genes where altered, changed, or in any way transformed to replicate for the presence of Y chromosome. It could be a process of mutation, since the cloning was invivo. Tabor’s hypothesis called into question the reliability of most archeological evidence as Tiberius JuluisAbdesPantera’s Tombstone was found in Bingerbruck, Germany. In the first place, several arguments have risen concerning the acceptance of ancient discoveries centered on Jesus who has caused controversies in and
Some cell
Female calf
Cloned cells
Identical calf

West African Journal of Industrial and Academic Research December 2016 v0l.17 154
outside the Christian faith. For instance, all the four Christian gospel account about Christ were preserved on several ancient manuscripts and survived this day in modern formats. Again their authenticity was confirmed by leading ancient historians and church fathers of the Catholic Church. For example, the first manuscript of the Christian Greek scripture was written on papyrus that was one of the traditional style of publishing until about fourth century C.E. in the 19th century, Archeologist have discovered few biblical papyri that contains the authentic writings of the Greek Scriptures (new Testaments). In 1931, a papyrus was discovered containing parts of II codices which contain 15 books of the Christian Greek Scripture. And it ranges in date of writing covering thesecond andfourth century C.E. Major Part of the papyrus were preserved in the Chester Beatty collections and were listed as P45, P46, and P47. In the Codices, the P45 were bound together as the four gospel account and Acts, and the P46 covers 9 of the 14 letters of St. Paul thus showing that the Christina sacred scriptures were assembled shortly after the death of the apostles. Again, other manuscripts as Archival documents have been discovered with different contents of Jesus biography but none has yet explained his biological fathers except the Gnostic Gospel that conveyed controversial concepts of his marital statute. In fact, Vellum , Erasmus’ Text, TextusReceptus of Stephanus (1550), Westcott and Hort Text, Jerome’s Latin vulgate etc all contain details for the Greeks scriptures’ authenticity. On the other hand, artifacts of archeological importance have brought to light many interesting evidence to support the contents of the Greek Scripture. Here we have the Denarius Coin with Tiberius inscription which the Gospel writers explained was used during Christ’s ministry when Tiberius Ceaser was ruling in Rome. In fact the Tiberius coin was put in circulation about 15 C.E. and brought added support to the record stating that John the Baptizer’s ministry commenced in the 15th Year of Tiberius, or the spring of 29C.E. (Luke 3:1,2). Tabor’s Hypothesis as a “hypothesis” is based on Archeological discoveries unearthed as ancient archives for scientific studies and not like the fabricated shroud of Turin discovered by Geoffroi De Charnay in 1354 over a millennium after the Death of Jesus Christi and the built
tomb of Jesus constructed in Talpiot of modern Jerusalem. Finally Tabor’s Hypothesis Questioned the reliability of Celsius words concerning Jesus. According to his Origen, Celsius referred Mary to been 'turned out by the carpenter who was betrothed to her, as she had been convicted of adultery and had a child by a certain soldier named Panthera' ( Chadwick 1980). Unfortunately, Celsus' claim is only known from Origen's reply, but Celsus’ view drew responses from Origen who considered it a fabricated story which Raymond E. Brown considered a fanciful explanation of the birth of Jesus which includes very little historical evidence (Brown 1978). Celsus' wide ranging criticism of Christianity included the assertions that Christians had forsaken the laws of their fathers, that their minds had been held captive by Jesus and that the teachings of Jesus included nothing new and were simply a repetition of the sayings of the Greek philosophers (AntoníaTripolitis 2001). Again Marcus J. Borg and John Dominic Crossan state that given the antagonism of Celsus towards Christianity, his suggestion of the Roman parentage of Jesus might derive from the memory of Roman military operations suppressing a revolt at Sepphoris near Nazareth around the time of Jesus' birth. The "common legionary name" Panthera could have arisen from a satirical connection between "Panther" and the Greek word "Parthenos" meaning virgin (Eerdmans and Rapids 2000).
Conclusion Criticism against Tabor’s hypothesis has given rise to many questions concerning the validity of archeological evidence for supporting certain proofs for academy use. Again it has also questioned the possibility of using scientific knowledge to explain the unexplainable phenomena that have been considered supernatural both in mythological folklores and in the ancient world. Or could the mind of a believer becomes strongly feeble and remained unknowingly biased because of the influence of dogmatism? As a result this has questioned the superiority and validity of secular science over the dogmatic theological knowledge of religion in the modern world. Perhaps could post-modern system of thinking be used as a tool to justify beliefs and faith with empirical evidence as it is in most scholarly works and theological research

West African Journal of Industrial and Academic Research December 2016 v0l.17 155
works? The academic study of religion does not require assumptions or faith, as it is in theology, but requires social scientific knowledge and more recently phenomenological approach as advocated by Geralduis Van der lew. Tabor’s hypothesis is for academic use for the scientific study of the origin of the founder of the Christian faith from empirical perspectives, and not to support orcriticize faith as most theistic and Christian scholars and theologians misunderstood, like wised the used of evolution for explanation of man’s origin from pre-historic era through biology and anthropological perspective. the science of history of religion does not concern theological claims apart from their historical significance, but center on the historicity of religious figure, events, and the evolution of doctrinal matters with empirical knowledge which calls for the use of archeological discovery like that of tombstone of AbdesPantera and its inscription. Celsius criticism against the Jesus’ Immaculate Conception was rejected by mainstream scholars of the Christian faith and jugged as blasphemous idea because of the pejorativeacknowledgement of his ancient Italian religion as “pagan”, but as one of the “pagans” he used the historical criticism against the Christian founder as an apologetic defense of his traditional roman religion. By faith and belief in the religious stories of Christian theology,Jesus’ nature and origin can be attributed to any supernatural or perhaps unimaginable events. After all there are several mysterious events centered on the birth and activities of most founders of Religious based on myths and beliefs on supernatural events. For instance, the birth of John the Baptist was prophesied and the birth of Muhammad, according to Koran, was a “spiritual revelations” of the words of Allah from angel Gabriel according to Islamic tradition.Tabor’s Hypothesis is severely criticized by theistic scholars most likely mainstream scholars, given that there is no evidence to support it as a result
of “bounded rationality” (Daniel Kahneman) and due to the inability to contradict one’s already established belief which has indirectly became glaring in the acceptance of pre-historic studies and knowledge for the scientific study of man’s origin. The greatest scientist of all time is the atheistic scientist who searches through the unknown with experimentation and not with belief to explore and discoverphenomenon behind natural occurrences. Tabor’s hypothesis, like the Avogadro’s hypothesis in Chemistry, is an academic social scientificskills for academic use and not be criticized with “bounded rationality” due to dogmatism or to be used as a critical techniques to support or criticized faith as some scholars and theologians of both the western and African world misunderstood. By scholastic method of studying New testaments studies in tertiary institutions, the Gnostic Gospels that have been violently rejected by Mainstream and traditional orthodox Christian have because of numerous controversial details it reveals against Jesus Christi have been used in the Scientific, historical n archeological and Gnostic Mysteries studies of Jesus Christi in the Academic disciplines. Max Muller (1873) Advised that is should be the duty of those who have devoted their life to the study of the principal religions of the world in their original documents, and not value and reverence it in whatever form it may present itself; to take possession of this new territory (science) in the name of true science. My argument is this, “hypothesis” and “theories” arescientific skillsemployed for the explanation of phenomenon and mechanism in the secular academic tradition of religious studies and not for enhancement of indoctrination, and as such should not be criticized with “bounded rationality”. In fact with “hypothesis” and “theory” from scientific perspectives, “God” can be bad and “Satan” can be good. That is the academic tradition in the scientific study of Religio
References
(1) Contra Celsum by Origen, Henry Chadwick 1980 ISBN 0-521-29576-9 page 32 (2) Jesus and his world: an archaeological and cultural dictionary by John J. Rousseau, Rami Arav1995 , page
225

West African Journal of Industrial and Academic Research December 2016 v0l.17 156
(3) Kawahara, Manabu; Wu, Qiong; Takahashi, Nozomi; Morita, Shinnosuke; Yamada, Kaori; Ito, Mitsuteru; Ferguson-Smith, Anne C; Kono, Tomohiro (2007). "High-frequency generation of viable mice from engineered bi-maternal embryos". Nature Biotechnology.
(4) Kawahara, M.; Kono, T. (2009)."Longevity in mice without a father". Human Reproduction. (5) Light From the Ancient East Or The New Testament Illustrated by Recently Discovered Texts of the
Graeco Roman World by Adolf Deissmann 2003 ISBN 0-7661-7406-9, pages 73-74 (6) Marcus Borg, John Dominic Crossan (2007). The First Christmas: What the Gospels Really Teach About
Jesus's Birth. HarperOne. p. 104. ISBN 0-06-143070-6 (7) Mary in the New Testament by Raymond Edward Brown, et al. 1978 ISBN 0-8091-2168-9 page 262 (8) Origen(1980) Contra Celsum, Henry Chadwick page 32 (9) Origen, Contra Celsum I.32. Given in J.Stevenson, A New Eusebius: Documents illustrating the history
of the Church to AD 337, page 133 (new edition revised by W. H. C. Frend, SPCK, 1987). (10) Patrick, John The Apology of Origen in Reply to Celsus 2009 ISBN 1-110-13388-X, pages 22–24 (11) Patrick, John (2009) The Apology of Origen in Reply to Celsus, pages 22–24 (12) Religions of the Hellenistic-Roman age by AntoníaTripolitis 2001 ISBN 0-8028-4913-X page 100 (13) Tabor, The Jesus Dynasty, pp. 64-72(Collns, Michael, Conncy, Sean 2016)world Biography ICO-
DA-confuses Brography forum Williams, Chris. "Stem cell fraudster made 'virgin birth' breakthrough: Silver lining for Korean science scandal", The Register, 3 August 2 by Alexander Roberts 2007 ISBN 1-60206-476-8 page 682
(14) The Roman army, 31 BC-AD 337: a sourcebook by J. B. Campbell 1994 ISBN 0-415-07173-9, page 37 (15) The Bible Knowledge Background Commentary: Matthew-Luke, Volume 1 by Craig A. Evans
2003 , page 146The panther: posthumous poems By James Whitehead, Michael Burns 2009 pages 15-17 (16) Light From the Ancient East Or The New Testament Illustrated by Recently Discovered Texts of
the Graeco Roman World by Adolf Deissmann 2003 , pages 73-74
(17) Tabor, James D. (2006). The Jesus Dynasty: A New Historical Investigation of Jesus, His Royal Family, and the Birth of Christianity. Simon & Schuster.p. 69.
(18) Jesus’ biological father! by Simcha Jacobovici · may 18, 2014 · jesus archeology ·http://www.simchajtv.com/jesus-biological-father/
(19) Max Muller Introduction to the Science of Religion (1873) (16) Buck and his researcher (2016)Advameginc. – Buddha’s Biography forum(A.FerdinadHerold, Fr. By Paula Blum 1922 at sacred texts. com the life or Buddha, (Su-fen Lin and Timothy Baker.Jn (2011) Taipeiconfricous temple Goney board). A young man’s quiet for knowledge).
(20) New word Translation of the Holy Scripture. 2013 – Watch Tower Bible and tract society of New York, Inc. New York, U.S.A).
(21) Robert E. van Voorst, Jesus outside the New Testament, .B. Eerdmans, Grand Rapids, MI., 2000, p.109 Self-fertilization in human having a male embryo without a father .1 Department of Histology, and embryology, school of Medicine, Gulharne military Medical Academic Turkey – Irmak Mk. 1b.https://www.ncbi.nlm.nih.gov/pubmed/204 ABSTRACT This article centers on the importance of Theory and Hypothesis as scientific tools and how they could beusedin the scientific study of religious tradition, institutions, and founders. Using James tabor’s Hypothesis, a scholar can easily understand the underlining biased factors that affect scholars in the Scientific study of Religion and several ways thesescientific tools have been employed for theological Studies which have led to the formation of various concepts and religious doctrines about Jesus’ nature and birth in particular. With thecritique involved in Tabor’s Hypothesis, several scientific and historical evidence have been called into question for their validity and further verification and clarification namely; the historicity of Celsius and the reliability of his information about Jesus’ illegitimacy, the reliability ofarcheological evidence in religion and theological studies, and the Realness of Mary’s infidelity as regardto adultery if Justified.
(22)

West African Journal of Industrial and Academic Research December 2016 v0l.17 157
Instructions for Authors
WAJIAR provides a multidisciplinary forum for the publication of original research and technical papers, short communications, state-of-the-art developments in Information and communications technology, bio-medical informatics, computers, mathematics, control and information technology, physics, industrial electronics and engineering, Industrial chemistry, general technology, rocketry, space and astronomy, earth science, oceanography and the environment with special emphasis on the application of communications and information technology to these fields of importance in our modern civilization. The journal will review papers on advances, techniques, practice and application of information and communications technology in these areas.
• Economics, Statistics and Mathematic
• Information Technology & Applications
• Electronics and Computer Engineering
• Computer networks, Satellite & communications Engineering Research
• Industrial Computer applications Today
• Computer and Electro-Mechanical Maintenance
• GPRS and Remote Sensing
• Robotics ,Telemedicine & Remote Medical Monitoring
• Artificial Intelligence & Expert Systems Development & Applications
• Developments in Forensic Science Research
• Information Assurance & Network Security: The African Dilemma
• Space Information Systems & Rockery : which way for Africa
• Video and Teleconferencing Innovations for Deployment in Africa
• Telecommunications Technology & 4G Applications
• Biotechnology
• Agriculture , Food Technology & Processing Environmental Technology & Impact Analysis
• E-Waste Management & Environmental Protection
• Management Science & Operations Research
• Wireless Technology, GSM and 4G Applications
• Alternative ,Grid and Green Energy Solutions for Africa
• Converting Academic Research in Tertiary Institutions for Industrial Production
• Nano Technology WAJIAR is an international Journal of Science and Technology and is published quarterly in February, May, August and December. Key Objectives: provide avenue for the advancement, dissemination of scientific and technology research in the fields of science and technology with special emphasis on the deployment of Information & Communications Technology as an enabler and solution tool. Versions: Two versions of the journal will be published quarterly (electronic version posted in the web and hardcopy version. Submission Typescript and soft copy in MS-word format should be submitted by email to: [email protected]. Typescripts should be written in English, double-spaced and single-sided on either Quarto or A4-sizeed sheets, and should be numbered beginning with the title page. The first page of an article should contain: i) The title of the paper, the name(s) and address(s) of the author(s)

West African Journal of Industrial and Academic Research December 2016 v0l.17 158
ii) A short title not exceeding 45 letters with space An abstract of 50-200 words should follow the title page on a separate sheet.
Text Headings and subheadings for different sections of the paper (e.g. Introduction, Methods, Results, and Discussions) should be clearly indicated. Units of measurement, abbreviations and symbols should follow the international system of units (SI), Equations and formulae should be typewritten or word-processed. Equations should be numbered consecutively with Arabic numerals in parentheses on the right-hand side of the page. Special symbols should be identified in the margin.
Tables and Figures Tables should be given short informative titles and should be numbered consecutively in Arabic numerals. Tables will be reproduced directly from the typed or word-processed softcopy. Figures in a form suitable for reproduction should be submitted separately from the text as original drawings in Indian ink, or as high contrast sharp photographs on glossy paper. Lettering on figures should be proportional to the size of the figure to ensure legibility after reduction. On the back of each figure, the orientation of the figure and the author and figure number should be cited consecutively in the text and a list of short descriptive captions should be provided at the end of the paper.
References References should be cited in the text using a number in square brackets in order of appearance. The references are listed at the end of the paper in numerical order.
General Information Proofs: Proofs will be sent to the nominated author to check typesetting accuracy. No changes to the original manuscript are accepted at this stage. Proofs should be returned within seven days of receipt. Reprints: reprints may be ordered (pre-paid) at prices shown on the reprint order form which will be sent to the author together with the proofs. Page Charge: Please note that there will be a page charge of N20,000 or $100 (Twenty thousand naira or One Hundred American Dollars only) for each article accepted for publication in the journal. Annual Subscription is pegged at N20,000 or $125 per annum for four volumes. Electronic copies will be free access at our website. Subscription for the printed version will be completed via our Website www.wajiaredu.com. Subscriptions can also be sent via the journal’s email address: www.wajiaredu.com/webmail / [email protected] .ISSN: 2276-9129

West African Journal of Industrial and Academic Research December 2016 v0l.17 159
#
West African Journal of Industrial & academic research
Vol.17 No.1. December, 2016
West African Journal of Industrial
& Academic Research Editor-in-Chief: Prof. Oliver E. Osuagwu, D.Sc CS, PhD IT, FNCS, FBCS CITP, MIEEE, MACM Editorial Board: Prof Tony B.E. Ogiemien, PhD, BL, (USA), Engr. Prof E. Anyanwu, Ph.D, FNSE, Prof. G. Nworuh, PhD,, Dr. B. C. Ashiegbu, PhD ,Prof .E. Emenyionu, PhD, (Connecticut USA,) , Prof. E.P. Akpan, Ph.D, Engr. Prof. C.D. Okereke, Ph.D, Prof. B.E.B. Nwoko, Ph.D, Prof. N..N. Onu, PhD, Prof M.O. Iwuala, PhD, Prof C.E.Akujo, PhD, Prof. G. Okoroafor, PhD, Prof Leah Ojinna, Ph.D (USA), Prof. O. Ibidapo-Obe, PhD, FAS., Prof. E. Adagunodo, PhD, Prof. J.C .Ododo, PhD, Dan C. Amadi, PhD(English), Prof.(Mrs) S.C. Chiemeke, PhD,FNCS, Prof (Mrs) G. Chukwudebe,PhD, FNSE, Prof. E.N.C. Okafor, PhD, (Mrs) I. Achumba, PhD, T. Obiringa, PhD, Prof S. Inyama, PhD, Prof. C. Akiyoku, PhD, FNCS, Prof. John Ododo, PhD, Prof. E. Nwachukwu, Ph.D, FNCS, Prof. S. Anigbogu, PhD,FNCS, Prof. H. Inyama, PhD, FNSE , .Prof. B.N.. Onwuagba, PhD, Prof J..N. Ogbulie, PhD, Prof. M..M. Ibrahim, PhD, Prince Oghenekaro Asagba, PhD _____________________________________________________________________________________
Subscription Application Form
Name of Subscriber:_____________________________________________________________ Institutional affiliation:___________________________________________________________ Mailing Address to send copies of journals __________________________________________ _____________________________________________________________________________ Email Address:_____________________________Tel:_________________________________ Version of Journal requested: (a) hard copy N20,000 or $125
(b) electronic N10000 or $63* Method of payment: Wire Transfer Visa Card Master Card Direct payment into our Diamond Bank
Account No:. 0024189096 Douglas Rd branch, Owerri Bank Draft Tick
All subscription Application should be forwarded to: [email protected] Subscribers Signature: _______________________ Date: DD/MM/YYYY___/____/___ *WWW.WAJIAREdu.com is free access