Tab 5.0 - User's manual - Lae Electronic
17
User’s manual
-
Upload
khangminh22 -
Category
Documents
-
view
0 -
download
0
Transcript of Tab 5.0 - User's manual - Lae Electronic

User’s manual

Technical support and product information
http://www.lae-electronic.com/

Tab 5.0 - User’s manual
INTRODUCTION
Tab is a software monitoring and supervising plants that are controlled by LAE instruments. It performs datalogging, overall plant supervision, alarm management and Virtual Instrument tasks.The Tab features are described in the following chapters:1. CONFIGURATION2. PLANT OVERVIEW3. DATA LOGGER4. DISPLAY AND PRINTOUT OF THE RECORDED DATA5. QUICK EXPORT OF RECORDED DATA6. ALARM MANAGEMENT AND REPORT SENDING7. VIRTUAL INSTRUMENT
SYSTEM REQUIREMENTS
• Computer with Windows 10, 8, or 7 operating system installed and running properly; minimum processor andmemory as required by the Windows version – Mouse
• At least 800x600 pixel screen resolution; 24 bit colour• USB to RS-485 adapter mod. USB485-STIXL or other RS-485 interface internal or external to the computer
For SMS messages sending:• 1 RS-232 serial port (can be obtained from an external USB to RS-232 converter)• 1 GSM modem (it must be one of the suitable models; consult the supplier of software)
For e-mail sending:• Access to Internet
INSTALLATION
Connect the USB key supplied to a PC USB port. Based on the Tab version purchased, the key will enable all functions or part of them. If the key is not connected, the Tab will just perform the plant overview task.
Before proceeding to installation, close all other active programs. Get access to the folder including theinstallation files (be it available on a removable support or downloaded from the website www.lae-electronic.com)and execute setup.exe. Then follow the instructions supplied by the installation program. When the installationhas been completed successfully, in the start menu the group “LAE Tab 5.0” will be available, inside of this youwill have to choose “Tab 5.0” to get the program started.
LAE electronic – Tab5.0 – User’s guidePage 3
1. CONFIGURATION
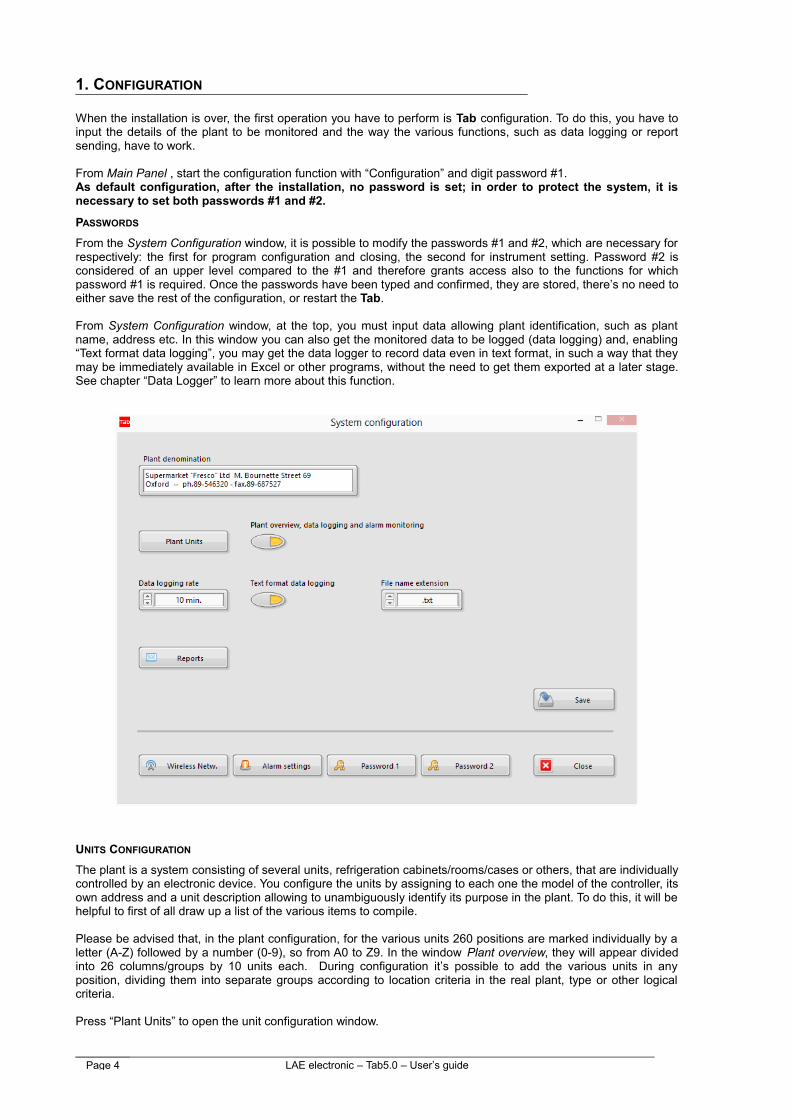
When the installation is over, the first operation you have to perform is Tab configuration. To do this, you have toinput the details of the plant to be monitored and the way the various functions, such as data logging or reportsending, have to work.
From Main Panel , start the configuration function with “Configuration” and digit password #1.As default configuration, after the installation, no password is set; in order to protect the system, it isnecessary to set both passwords #1 and #2.
PASSWORDS
From the System Configuration window, it is possible to modify the passwords #1 and #2, which are necessary forrespectively: the first for program configuration and closing, the second for instrument setting. Password #2 isconsidered of an upper level compared to the #1 and therefore grants access also to the functions for whichpassword #1 is required. Once the passwords have been typed and confirmed, they are stored, there’s no need toeither save the rest of the configuration, or restart the Tab.
From System Configuration window, at the top, you must input data allowing plant identification, such as plantname, address etc. In this window you can also get the monitored data to be logged (data logging) and, enabling“Text format data logging”, you may get the data logger to record data even in text format, in such a way that theymay be immediately available in Excel or other programs, without the need to get them exported at a later stage.See chapter “Data Logger” to learn more about this function.
UNITS CONFIGURATION
The plant is a system consisting of several units, refrigeration cabinets/rooms/cases or others, that are individuallycontrolled by an electronic device. You configure the units by assigning to each one the model of the controller, itsown address and a unit description allowing to unambiguously identify its purpose in the plant. To do this, it will behelpful to first of all draw up a list of the various items to compile.
Please be advised that, in the plant configuration, for the various units 260 positions are marked individually by aletter (A-Z) followed by a number (0-9), so from A0 to Z9. In the window Plant overview, they will appear dividedinto 26 columns/groups by 10 units each. During configuration it’s possible to add the various units in anyposition, dividing them into separate groups according to location criteria in the real plant, type or other logicalcriteria.
Press “Plant Units” to open the unit configuration window.
LAE electronic – Tab5.0 – User’s guidePage 4

These appear arranged in the rows of a table, marked from A0 to Z9. For each row, in the various columns themain settings such as name given to the unit, instrument model (device), address, communication port used andactivation appear.
DETECTION OF THE UNITS CONNECTED
During configuration, the Tab is able to detect the new units connected, in other words units of which LAE devicemeets the following conditions: 1- it must be connected to the line or wireless communication network; 2- it musthave the address already configured and different from any other address, both amongst the connected devicesand those which are already present in the configuration, if any; 3- it must be a model included in the driver of thedevices installed.When these conditions are met and therefore after having suitably set the address of all devices, it will bepossible to detect all the connected units at the first configuration as much as new units added at a later stage, ifany. When pressing “Detect units”, the following window appears.
LAE electronic – Tab5.0 – User’s guidePage 5

Proceed as follows: press “Port” and choose the communication port used for the connection with the devices. Ifthey belong to a wireless network, enable “Wireless connection”. If communication is particularly slow (forexample because of USB/RS-232/485 converters for wired line or because of a complex wireless networkfeaturing high latency), it’s possible to set a longer timeout for the detection of the individual device through thesuitable cursor. Then press “Start” to get the detection process started. Now, the advancement bar will start to getfilled and the newly detected units will one after the other appear in the table. It’s possible to get the processstopped by pressing “Stop”.At the end of the detection, process by means of the selector below the table, it will be possible to set the positionin which the new units will be added. This selector is set by default to the position selected in the table of theprevious window. Press “OK” to add newly detected units in the configuration and to go back to the previouswindow, from where it will be possible to complete the information obtained.
CONFIGURING A UNIT
To add or modify the configuration data of a unit, select the desired row, then double click or press “Edit”.
In this window it will be possible to freely set the unit name/description, model and address of the device,communication port and enable the unit to the Tab functions. Press “Advanced” to customise the monitored andrecorded data for that unit.
LAE electronic – Tab5.0 – User’s guidePage 6

For the plant overview, choose a value (for ex. temperature) from the menu and, if need be, a state (for ex.defrost) that you judge to be meaningful to display according to the type of unit. See the relevant chapter for moredetails.For the data logging function, it’s possible to choose up to 3 values and 3 states.The values and the states available in the menus depend on the device model.Values or states to be logged will be preset and not modifiable if a particular device, because of its driver settings,requires data logging of more than 3 values or states.Press “To default” to revert to the pre-defined setting.
Please bear in mind that, also based on the number of units fitted, a high total quantity of data to be acquired andstored will imply a lower data updating frequency for all the Tab functions. So, for example, you will have asmaller sampling frequency of the recent dynamical data of the virtual instrument function and slower responsespeed in the alarm detection function.
At the end of the configuration of the single unit, press “OK” to accept the setting and revert to the previouswindow. To remove a unit, cancel the text in the “Name” field and press “OK”.In the Plant Units configuration it’s possible to change the unit position by selecting it and pressing “Move Up” or“Move Down”.
Caution: the peripheral number (address) must be set on all devices with different values. The samenumbers must be set when configuring the Tab in the relevant units and must consequently be alldifferent from each other.
REPORT CONFIGURATION
By clicking on “Reports” you have got access to the Report configuration window. From here it's possible toconfigure if, to whom and when Tab will send SMS and e-mail reports. For further details on this function, seesection “Message transmission”, in chapter “Alarm Management and Report Sending”.In "Short Header" input the identification of the calling plant which will appear as header in the SMS messages.To enable SMS messages, the relevant switch has to be enabled, choose the GMS modem model and the COMport to which it’s connected. To enable messages to be sent via e-mail, just enable the relevant switch and add avalid e-mail address, which will be the sender of the messages.It’s now possible to define up to 12 receivers: for each one of them enter name, phone number, e-mail addressand choose if message send option has to be disabled temporarily, if it must only take place in case of an alarmor in case of an alarm at programmed times (up to 12) in “Report time”. If need be, press “-“ to eliminate the lasttime programmed.
LAE electronic – Tab5.0 – User’s guidePage 7

With “OK” confirm the data and revert to the System Configuration window.
Now save the configuration with the command “Save” and exit with “Close”.To make the new configuration effective, shut down the Tab and re-start it.In order to shut down Tab, press “Exit” and insert password #1.
CONFIGURATION OF A WIRELESS NETWORK
If the controllers present in the plant, or a part of them, must communicate with the Tab through SWB wirelessmodules, it’s then necessary to associate the controller peripheral number to the SWB module address to whichthe controller is connected. In order to proceed, the wireless network should have already been installed byfollowing the instructions of the SWB modules and it must be fully active, i.e. both the SWB-C connected to thecomputer and all the SWB-R’s connected to the controllers must be switched on.After saving the plant configuration with “Save”, press “Wireless Netw.”.
In the window opening up there is a list of all peripheral numbers given to the devices of the units added. On theside of every single device number that is connected to an SWB wireless module, you must write the 16-characteraddress appearing on the external label of the SWB box.In order to avoid writing all individual characters of all addresses present, click on “Get addr. list“ and choose theCOM port to which the SWB-C (network coordinator) is connected. In this way you will obtain a list of addressesof all the SWB-R’s detected in the network. Now, just click on the arrow on the side of the address field andchoose the right address from the menu.For those devices connected to the same SWB-R you must logically choose the same address. For those deviceswhich are connected to the PC directly via a hard-wired RS485 line, the field must be left empty.Caution: the SWB-R modules in the network can not be detected while the Tab is already acquiring data. So inorder to make modifications to the wireless network configuration after the Tab has been activated, it’s first of allnecessary to deactivate the plant overview, data logging and alarm monitoring functions through the relevantswitch in the main configuration page and re-start the Tab.
ALARM CONFIGURATION
When pressing “Alarm settings” the alarm setting window opens up.In the list at the left all alarm types of the LAE controllers available appear. For each one of them, according to theimportance that you wish to give, it’s possible to set a priority value between 0 and 255.This value will appear in the current and stored alarm lists.In the box at the side of the list it’s possible to set the minimum priority an alarm must have to cause theimmediate SMS or e-mail sending.
LAE electronic – Tab5.0 – User’s guidePage 8

2. PLANT OVERVIEW
The Plant Overview window will show the main information of all the units in the plant. The displayed data are thevalues and the status defined in the configuration of the single unit. The status is indicated by a box of whichcolour changes depending on the overall unit status: grey for a unit deactivated, green if there are no alarms andthe associated status is not active, yellow if there are no alarms but the associated status is active (for ex.defrost), colour red indicates an alarm status or communication error.
The units appear arranged in 26 columns (A….Z) of 10 elements (0….9). In order to get the visible columns scroll,press the buttons with the arrows, at the top right page.
LAE electronic – Tab5.0 – User’s guidePage 9

Clicking on or tapping on the rectangle that bounds a unit, it will be possible to get a direct access to the windowVirtual Instrument of the relative device (if the Virtual Instrument function is included in the Tab versionpurchased).
3. DATA LOGGER
The data logging function performs a permanent recording of the values (for ex. temperature) and status (for ex.defrost). This function starts automatically at the same time as the Tab and you may check its operation throughthe blinking dot in the Main Panel window. In the main configuration window you enable this function and you mayset the data recording rate (between 5 and 30 minutes). When configuring the individual unit, it’s possible tomodify the pre-defined setting of which data to record. You have to choose up to 3 values and 3 status amongstthe ones proposed based on the device model. The data are then stored by creating a file for every individual unitand per every individual month.
DATA LOGGING IN TEXT FORMAT
If in the main configuration window the option “Text format data logging” option has been enabled, the data loggerwill record data even in text format. The files generated will be stored in the “Datalog” folder, which is locatedinside the folder where the Tab is installed and will bear a name consisting of the UD letters followed by 3 figuresidentifying the device address, 2 figures for the year, 2 figures for the month data refer to and, between brackets,which data have been recorded. The extension may be .txt or .xls. The data have to be matched with the unitpresent in the plant by using the number (address) of the device.Caution: these files may be opened directly in spreadsheets or other applications but, in order to allowthe files of the current month to be updated by Tab, it’s first of all mandatory to create a copy of thosefiles, preferably in a separate folder, then you’ll have to work on the copy created. Nevertheless, if when saving data, Tab finds an open file, the data of that recording will be saved in a file with thesame name plus “_m” at the end, so that they may be retrieved. Please bear in mind that the reference dataremain those which are saved in the Tab format and that may always be analysed with the Tab tools and alsoexported in a text format.
4. DISPLAY AND PRINTOUT OF THE RECORDED DATA
From Main Panel, by clicking on “Data retrieve” you may get access to the retrieve, display and recorded dataprintout functions.
LAE electronic – Tab5.0 – User’s guidePage 10

First of all it’s necessary to choose the plant unit of which you’d like to retrieve data and set the start and end dateand time of the time frame you are interested in. Then press button “Load” at the side of the period end box toload data. To set date and time, press the right hand button in the relative boxes: a window will pop up where itwill be easy to choose day, month, year and time.
After selecting a unit, it’s possible to load the recorded data with the current configuration relating to which data torecord. In the event that you’d like to retrieve recorded data with a configuration different from the current one ordata of a unit which is no longer present in the configuration, select “free device No.” at the bottom of the unit listand then set the device address and press “Load” (to move to the end of the list you may press button “End”).Now it will be possible to choose the file of a specific month of that specific device. Bear in mind that the file nameconsists of the UD letters followed by 3 figures identifying the device address, 2 figures for the year, 2 figures forthe month the data refer to and, between brackets, which data have been recorded.
For particular device models, Tab will consider some of the recorded data as events (active when their value isdifferent from 0). If, in the selected period of data to be retrieved, one or more events are detected, a window willpop up showing a list of the detected events; in this list, there will be the option to choose one single event andthen display the data recorded only during that event.
Once data have been loaded, these may be displayed in a graph format or, if button “Table” is pressed, in a tableformat. In the event of a graph representation, the curves representing a value refer to the scale at the left,whereas those representing a status refer to the scale at the right. The left scale may be modified for a better datareadout, by clicking on the extreme values and by adding new limits.By clicking on the legend at the right hand, it’s possible to modify the outlook of the various curves.
Moreover several tools for graph analysis, such as zooming or the cursor or several other options for customisingcurves and scale, are available.
By clicking on “Export”, the loaded data can be saved in a text format readable from Excel or other spreadsheets;the data that will be exported are those of the period selected before loading and are the same as thoseappearing in the table representation. Following zooming or scale modification, the graph might include just partof them.
The displayed data can be printed by pressing “Print”; the printout will either show the table or the graphdepending on what is on the screen at that specific moment. In case of graph printout, a preview window opensup, from which you can again choose the type of line, colour and other features of the curves in such a way as toobtain the best result according to the type of printer used (for example, although it’s always preferable to use a
LAE electronic – Tab5.0 – User’s guidePage 11

colour printer, if you have a monochromatic printer you can have the various curves distinguished by choosingdotted lines).The printouts will always be sent to the Windows default printer.
5. QUICK EXPORT OF RECORDED DATA
This function has been fundamentally conceived to ease the production of the documentation required by theCompetent Bodies in charge for the survey and respect of the HACCP norms.
With just a few clicks it’s possible to create files and printouts of the recorded data in text and graph format for aselection of units in a certain period of time.From the unit list, choose those of interest, by keeping “Ctrl” or “Shift” pressed in order to add elements.Then choose date/time of start and end period, file destination folder (even USB drive), formats (text, graph orboth), output type (file, printout or both). Now press “Export” to obtain what is required.
LAE electronic – Tab5.0 – User’s guidePage 12

6. ALARM MANAGEMENT AND REPORT SENDING
Alarm management means a comprehensive set of functions pertaining alarm status acquisition, storage, displayof the ongoing events, display and printout of the past event, report sending – such as e-mail and SMSmessages, based on alarm priority.
The current alarm situation is displayed in the Alarm List window. It shows the recent alarm history by reportingthe unit where the alarm took place, the starting time, the source, its priority and, whenever the alarm is over, itsending time. In addition, on the left of every event a red light signals that the alarm is still on, and it turns greenwhen the alarm is over. The lighting up of the “New Alarm” indicator means that new alarms took place since thelast acknowledgement.Whenever in a controller an alarm condition occurs, it is detected and stored by Tab. At the same time, regardlessof the window you are working in, a red “Alarm” window comes up, showing a plant anomaly. Now, clicking on“Alarm” or on Alarm List in Main panel opens Alarm list window.After you have become aware of the situation, you can switch off the “New Alarm” indicator and remove thealready ended alarms from the list (they will however remain stored on file) by clicking on “Acknowledge”.All ended alarm events may be displayed or printed out from the Alarm History window, which is opened byclicking on “History”. In this window, you must choose the month concerned, load the data and if necessary thenprint out on the list on the default device by clicking on “Print”. It’s possible to choose a specific unit to limit all thedisplayed events to it. The inhibited units are excluded from alarm management.
MESSAGE TRANSMISSION
TAB incorporates an e-mail and SMS message sending function, in order to constantly keep one or more peopleon the proper plant operation and, in case of alarms, inform them promptly.As a matter of fact the messages can either be sent in case of an alarm or even at programmed times. In theReport configuration window you can choose if and when alarms are sent according to the following options:Never, temporarily excluded; Alarm, only when alarms occur; Alarm/Time, therefore when alarms occur orhowever at the times set into the "Report Time" boxes.
The alarm condition for the immediate sending must consist of one or more new alarms, with priority greater thanor equal to the minimum priority set in the Alarms Setting window, detected in one or more units. In the event thatthe message is sent at a set time, it will report that there are alarms, even not new ones and with priority lowerthan the minimum priority set, in one or more units or, if no alarm is on, it will indicate that no alarm is going on. Inthis latter case, the enabled receiver will however be informed about the correct operation of the whole system.Differently, if the set message is not received at the due time, this will mean that a failure in any of the vital partsof the system occurred (PC, modem, etc.).
LAE electronic – Tab5.0 – User’s guidePage 13

In case of alarms with priority great enough for the immediate sending of the SMS report, at the end of the event aend of alarm message is sent, with the indication of all ended events.If the length of the SMS is greater than 160 characters, a series of linked messages will be sent out according tothe ETSI GSM 03.40 specifications. Usually, the receiving device will be able to link all elements together.
The sent message includes the following information:Short Header, Date and Time, list of the units where alarms have taken place and the alarm type (if none, "NoAlarms"). In the event of scheduled e-mail message or new alarm, a text file will be sent as an attachment listing all ongoingevents.
The use of the GSM modem allows an alarm report to be sent not only automatically but also as a reply to anoccasional request by any GSM mobile phone. To achieve this it’s necessary to send a message like the followingto the modem telephone number: R[receiver’s number]:[required function]. As an example: R+391231234567:LCR
The report request message sent to the Tab may also omit the receiver’s number of the report (R:LCR); in thiscase the report will be sent to the sender of the request. Presently the only supported function is LCR (Last Check Report), which requires a report on the alarms, just likethe report that is sent automatically at set times.
If an SMS or e-mail report sending has been enabled, when the Tab is started a window comes on, showing thereceivers and message sending mode; you can also have direct access to the relevant settings through the button“Modify”.
LAE electronic – Tab5.0 – User’s guidePage 14

7. VIRTUAL INSTRUMENT
This function shows you the details of the device (instrument/controller) controlling the unit. It displays the valuesof input/output and current status, the graph of recent values, the device configuration panel, the access to therecorded alarms.
It’s accessible both from the Main Panel (press “Virtual Instrument”) and in the “Plant overview” window (click onthe area bounding a unit). Through “Unit” it’s possible to choose a unit. If you have had access through “Plant overview”, in this case the unitis already chosen.Once the communication has been established, the current device data will be displayed. If the Error indicatorlights up, this means that there is no communication with the device. In this case, check the connections and theconfiguration.
LATEST PERIOD TREND
By pressing “Recent Trend”, you obtain the graph representation of the trend of all the analog inputs and of somestatus of the controller in the last 72 hours.This function offers the engineer a valid tool for diagnostics and to determine how to fine tune the controller setup,in order to improve the performance of the unit.As per the historical graphs, tools such as zooming, panning, cursors and several different curve outlookcustomisation tools are available for an ideal data consultation
RECORDED ALARMS
Pressing “Alarm History” gets you into the display and printout window relating to the recorded alarms of theselected unit. Now choose the month of interest and upload the data.
DEVICE CONFIGURATION
To get access to the device configuration window, press “Device Settings” and insert password No. 2. If apassword has been set and you don’t put it in, you will however get access to the parameter window but you willhave no right to modify them.The values currently set in the controller are read and displayed automatically when the window is opened. Laterthey can be read again by clicking on “Read”.
Parameters may be set in two different ways: using values previously stored in the files related to a specific modelor choosing the data to set one by one. In the first case, click on “Load” to read a default-programming mask
LAE electronic – Tab5.0 – User’s guidePage 15

among the files stored with “Save”. For manual parameter modification, first of all with select the data tochange, then modify the value by using: left sided , numeric keypad / arrows, pull-down menu if present, orby numerically typing the new value. In this latter case, confirm the new data with .After performing all modifications, click on “Write” to send the ticked off values only () to the device
Troubleshooting of most common faults
The comm.error indicator remains red1. Check that the SBC485 converter is powered correctly (on LED lit).2. If the on LED is lit but the other LED’s of the SBC485 never light up, check that the selected PC COMport actually corresponds to the one connected to the SBC485, that it’s not used for other tasks, that thecable is correct (of the type used for the modems, with RXRX TXTX straight connections).3. If just the yellow LED of the SBC485 never lights up, check the device connections (the signals A and Bof the RS-485 line could be inverted) and the address on Tab and peripheral.4. In the case of a wireless network, check the network configuration, if necessary by using the “SWBNetwork Manager” software.
LAE electronic – Tab5.0 – User’s guidePage 16

Designed with LabVIEW, copyright 2015 of National Instruments Corporation. All rights reserved.
The above mentioned trademarks are property of the respective holders.
LAE electronic – Tab5.0 – User’s guidePage 17