Organizational resilience: a capability-based conceptualization

Synthesis of System Dynamics Tools for HolisticConceptualization of Water Resources Problems
Ali Mirchi & Kaveh Madani & David Watkins Jr. &Sajjad Ahmad
Received: 14 June 2011 /Accepted: 5 March 2012 /Published online: 23 March 2012# Springer Science+Business Media B.V. 2012
Abstract Out-of-context analysis of water resources systems can result in unsustainablemanagement strategies. To address this problem, systems thinking seeks to understandinteractions among the subsystems driving a system’s overall behavior. System dynamics,a method for operationalizing systems thinking, facilitates holistic understanding of waterresources systems, and strategic decision making. The approach also facilitates participatorymodeling, and analysis of the system’s behavioral trends, essential to sustainable manage-ment. The field of water resources has not utilized the full capacity of system dynamics inthe thinking phase of integrated water resources studies. We advocate that the thinking phaseof modeling applications is critically important, and that system dynamics offers uniquequalitative tools that improve understanding of complex problems. Thus, this paperdescribes the utility of system dynamics for holistic water resources planning and manage-ment by illustrating the fundamentals of the approach. Using tangible examples, we providean overview of Causal Loop and Stock and Flow Diagrams, reference modes of dynamicbehavior, and system archetypes to demonstrate the use of these qualitative tools for holisticconceptualization of water resources problems. Finally, we present a summary of thepotential benefits as well as caveats of qualitative system dynamics for water resourcesdecision making.
Water Resour Manage (2012) 26:2421–2442DOI 10.1007/s11269-012-0024-2
A. Mirchi :D. Watkins Jr. (*)Department of Civil & Environmental Engineering, Michigan Technological University, 1400 TownsendDr, Houghton, MI 49931-1295, USAe-mail: [email protected]
A. Mirchie-mail: [email protected]
K. MadaniDepartment of Civil, Environmental, and Construction Engineering, University of Central Florida, 4000Central Florida Blvd, Orlando, FL 32816-2450, USAe-mail: [email protected]
S. AhmadDepartment of Civil & Environmental Engineering, University of Nevada, Las Vegas, 4505 S. MarylandParkway, Las Vegas, NV 89154-4015, USAe-mail: [email protected]

Keywords Systems thinking . System dynamics . Integrated water resources modeling .
Causal loop and stock and flow diagrams . Feedback loop . Archetypes
1 Introduction
An event-oriented view of the world or linear causal thinking cannot address complexproblems adequately (Forrester 1961, 1969; Richmond 1993; Sterman 2000). Figure 1illustrates this unidirectional thinking paradigm, which is grounded on the intuitive assump-tion that outputs or events are shaped by the collective effect of a series of inputs or causesacting sequentially (Sterman 2000). One artifact of this type of thinking is that manyproblems, manifested by discrepancies between the present state and an expected or desiredstate, are singled out and treated in isolation from the surrounding environment. Conse-quently, no in-depth understanding of root causes of problems is obtained. Thus, managingcomplex water resources systems using uni-directional, mechanistic models may be doomedto provide unrealistic, or at least, questionable results (Hjorth and Bagheri 2006).
Closed-loop or non-linear causal thinking enables analysts to consider important feed-back loops and interconnections characterizing the system’s structure, and to account fortime delays, collectively shaping the behavior of complex systems (Richmond 1993). Thistype of thinking is conceptually illustrated in Fig. 2. The growing discrepancy between theexisting and ideal states tends to generate a perception of problem, which often leads humansto alter the environment in hopes of reaching the desired state. Although the quick-fixsolutions appear to alleviate the symptoms, which may be helpful when responding toemergencies, they often fail to address the problem appropriately and only result in itsspatial and/or temporal translation (Richmond 1993; Simonovic 2009). The decisions tomodify the environment may have unintended consequences, perhaps with time delays,which may aggravate the original problem or create even more challenging issues (Madaniand Mariño 2009). Unlike the quick-fix approach to planning and management of waterresources, a non-linear thinking paradigm offers the holistic framework needed to promotesustainable development trajectories.
Systems thinking provides methods and techniques to apply non-linear causal thinking toplanning and management problems. In essence, systems thinkers recognize the fact thatwhile problematic systems are comprised of interrelated parts or subsystems, they functionas a unit and should ultimately be treated as a whole (Simonovic 2009). Simonovic andFahmy (1999) consider the systems approach as a discipline for seeing wholes and for seeingstructures that underlie complex domains. Further, they state that the systems approach is aframework for seeing patterns of change rather than static snapshots, and for seeing
Intermediate causal states Outputs Inputs
Present situation
Desired state
Decision Alteration of environment
Problem Outcome
Fig. 1 Linear causal thinking (adapted from Sterman 2000)
2422 A. Mirchi et al.

processes and interrelationships rather than objects. Thus, the principles of systems thinkingare critical to solving problems in water resources systems which inevitably consist ofinterrelated subsystems.
System dynamics (Forrester 1961, 1969; Meadows et al. 1972; Richmond 1993; Ford1999; Sterman 2000) is one of the methods that facilitate recognition of interactions amongdisparate but interconnected subsystems driving the system’s dynamic behavior. The methodcan thus help water resources analysts to identify problematic trends and comprehend theirroot causes in a holistic fashion. By identifying and capturing feedback loops betweencomponents, system dynamics models can provide insights into potential consequences ofsystem perturbations, thereby serving as a suitable platform for sustainable water resourcesplanning and management at the strategic level (Hjorth and Bagheri 2006; Madani andMariño 2009; Simonovic 2009). To this end, system dynamics offers several qualitative andquantitative tools to identify and explain system behavior over time.
We contend that system dynamics has not been used by most water resources scholarsand practitioners to its full capacity. The majority of system dynamics applications in waterresources have underutilized the method’s qualitative modeling tools. We advocate that theconceptualization or thinking phase of integrated water resources studies is of paramountimportance as it provides fundamental understanding of leverage points for sustainablesolutions. High-level and qualitative models can be developed relatively quickly andaffordably to facilitate trend identification, and to provide insights into root causes ofmulti-faceted water resources problems, facilitating formulation of preemptive and sustain-able solution strategies. In this paper we provide a synthesis of qualitative modelingtechniques offered by system dynamics and argue that these techniques offer importantinsights and should not be overlooked by water resource modelers. To do this, we firstpresent a synopsis of system dynamics applications in water resources. Then, the funda-mentals of system dynamics and its qualitative modeling tools such as Causal LoopDiagrams (CLD) and Stock and Flow Diagrams (SFD) are discussed in detail, using tangibleexamples to illustrate why this approach is well suited for integrated water resourcesmodeling, planning, and management. Furthermore, reference modes of dynamic behaviorand merits of using system archetypes for qualitative modeling prior to quantitative analysesare illustrated. Finally, the method’s benefits and caveats, stemming from application of theapproach without proper regard for its philosophy, are discussed.
2 System Dynamics and Water Resources
System dynamics, a sub-field of systems thinking (Richmond 1994; Ford 1999), originatedin the 1960’s when the concepts of feedback theory were applied by Forrester and his
Desiredstate
Presentsituation
Problem
Decision Alteration ofenvironment
Outcome
Unintendedconsequences
Fig. 2 Non-linear causal think-ing; causal states and causal rela-tionships are denoted by wordsand arrows, respectively. Doublebars indicate presence of time de-lay. (Adapted from Sterman 2000)
Synthesis of System Dynamics Tools 2423

colleagues to understand the underlying structure and dynamics of industrial and urbansystems (Forrester 1961, 1969). The method has since been widely used by analysts fromvarious disciplines as a convenient tool to explore the causal relationships forming feedbackloops between different components of large systems. In the past 50 years, system dynamicshas become a well-established methodology that has been applied in many different practicaland scientific fields, including management, ecology, economics, education, engineering,public health, and sociology (Sterman 2000).
Application of system dynamics in water resources engineering and management hasgrown over the past two decades (Winz et al. 2009). Reviewing the literature, three generalapproaches to water resources system dynamics modeling can be identified: (i) predictivesimulation models; (ii) descriptive integrated models; and (iii) participatory and sharedvision models. In the first class of system dynamics models, modelers have successfullyused the method as a tool to quantitatively simulate the processes governing particularsubsystems within a broader water resources system. For example, Ahmad and Simonovic(2000) used system dynamics to model the interactive components of the hydrologic cycle todevelop reservoir operation rules for flood mitigation. Ideally, this type of system dynamicsmodel is developed to help predict the future behavior of the system accurately enough toprovide a basis for tactical decisions. Table 1 presents some examples of water resourcesproblems addressed using system dynamics as a convenient simulation tool for analyzingwater resources problems and/or physical watershed processes.
In the second class of system dynamics models, analysts have adopted a more holisticapproach, striving to identify and characterize the main feedback loops among two or moredisparate subsystems, such as hydrological, ecological, environmental, socio-economic, andpolitical subsystems. Typically, these integrated feedback models facilitate testing andselection of water resources management plans and policies at the strategic level. Table 2summarizes example water resources studies, which have used system dynamics to describeand better understand the feedback structure and long-term behavioral patterns of interactingwater resources subsystems.
Additionally, system dynamics models have been used as practical tools for promotingshared vision planning, participatory modeling, and shared learning opportunities for diversegroups of decision makers and stakeholder groups (Werick and Whipple 1994; Lund andPalmer 1997; Creighton and Langsdale 2009). Stakeholders’ participation in a group modelbuilding activity can increase understanding of the scope and complexity of the problem,increase trust in model results and, subsequently, increase support for the selected policy(Stave 2003; Tidwell et al. 2004). Table 3 presents examples of participatory water resourcesmodeling using system dynamics.
3 Qualitative Modeling Tools in System Dynamics
Qualitative modeling or conceptualization of systems’ problematic behavior is useful fordescribing the problem, its possible root causes, and solutions. System dynamics dependsheavily upon both quantitative and qualitative data to characterize feedback loops incomplex systems (Forrester 1975; Luna-Reyes and Andersen 2003). In effect, a significantbenefit of system dynamics stems from its ability to facilitate conceptualization of multi-disciplinary models by providing a number of qualitative tools to complement quantitativesimulations (Wolstenholme 1999; Coyle 2000). Being accustomed to a tradition of devel-oping highly quantified models, however, many water resources system dynamics modelerstend to overlook the approach’s useful qualitative tools (Mirchi et al. 2010). Examples of
2424 A. Mirchi et al.

these tools and ideas are CLDs, SFDs, reference modes of dynamic behavior, and systemarchetypes. In this section we provide an overview of the fundamental constructs andqualitative modeling techniques offered by system dynamics.
Table 1 Example applications of system dynamics as a convenient simulation tool for modeling waterresources problems and/or physical watershed processes
Issue(s) addressed Modeling approach Citation, location Authors’ remarks
Freshwatereutrophication
Simulated the effects of directdischarge of nutrients fromsewage and agriculture runoffon phosphorus and planktondynamics
Vezjak et al.(1998), Slovenia
Facilitated setting standards fornutrient loading; suitabledecision support tool forwater quality management
Developingreservoir operationrules for flooddamage mitigation
Simulated hydrologic behaviorof the reservoir and upstreamand downstream areas undermajor historical floods
Ahmad andSimonovic(2000), Canada
Ease of model modification andsensitivity analysis noted,suitable for participatorymodeling and building trustinto model results
Assessing climatechange impacts onan urban floodprotection system
Hydrologic processes and floodprotection performancesimulated under variousclimate scenarios
Simonovic and Li(2003), Canada
Flexible model structure andease of sensitivity analysisnoted, suitable for floodmanagement policy testing
Adaptive waterqualitymanagement of anutrient impairedstream
Total maximum daily load(TMDL) simulation
Tangirala et al.(2003), USA
Facilitated evaluation ofalternative options forimpairment mitigation
Flood damageestimation
Developed and applied a newmethodology forspatiotemporal simulation ofprocesses governing floodpropagation
Ahmad andSimonovic(2004), Canada
Innovative generic approach forbuilding distributed systemdynamics models, capable ofaccounting for spatialvariability and its impacts onfeedbacks in multi-sectoralsystems
Adaptive waterresources planningand management
Basin-scale hydrologicsimulation
Stewart et al.(2004), MexicoSehlke andJacobson (2005),USA
Integrated basin-scale water-shed process model capableof incorporating policy, regu-latory, and management crite-ria to form a decision supportsystem
Thermal and massbalance of a spring
Simulated physical processesinfluencing the spring’sgeothermal characteristics
Leaver andUnsworth(2006), NewZealand
A lumped parameter modeladdressing hydrologic andgeothermal processes
Salinity loadforecast andremoval fromreturn flows
Simulated processes governinghydrology, water use, andwater quality
Venkatesan et al.(2011a, b), USA
Integrated simulation modelproviding insights intopotential future watershortages, and cost-effectiveand energy-efficient water re-use plans
Energy use andcarbon footprint ofdifferent waterssupply alternatives
Simulated processes fordesalinating sea water, andprojected carbon emission ofsupplying urban water fromremote areas
Shrestha et al.(2011, 2012),USA
Guides urban water supplymanagement by facilitatingevaluation of energyefficiency, and selection oflow-carbon emission watersupply management options
Synthesis of System Dynamics Tools 2425

3.1 Causal Relationships
At the core of system dynamics models are reinforcing (positive) and balancing (negative)causal relationships. A positive causal relationship means an increase/decrease in modelVariable A would result in an increase/decrease in model Variable B, whereas a negativecausal relationship signifies that an increase/decrease in model Variable A triggers a
Table 2 Example applications of system dynamics in integrated or multi-subsystem feedback modeling ofwater resources systems for strategic policy testing and selection
Issue(s) addressed Modeling approach Citation, location Authors’ remarks
Water resourcespolicy analysis anddecision making
Object-oriented modelinglinking alternative socio-economic developmentplans with water availabili-ty at the national level
Simonovic and Fahmy(1999), EgyptSimonovic andRajasekaram (2004),Canada
Flexible, transparentframework facilitatingparticipatory modeling;complex due to accountingfor several interconnectedsectors
Water quality andenvironmentaldeterioration due tosocio-economicgrowth
Various regional-scale physi-cal and socio-economicsubsystems linked to a wa-ter quality model
Guo et al. (2001),China Leal Neto etal. (2006), Brazil
Supported effective regional-scale environmental plan-ning, management, and de-cision making
Sustainable waterresourcesmanagement in theface of growingdemand
Various physical subsystemsand water use sectorssimulated under differentscenarios (i.e., climate andmanagement)
Xu et al. (2002), ChinaQaiser et al. (2011),USA
Captured main drivers ofsupply and demand, andprovided insights forregional water managementroadmap
Effective crisismanagement inresponse toflooding
Simulated human behaviorduring flood emergencyevacuation
Simonovic andAhmad (2005),Canada
Practical framework formonitoring and policyselection for emergencyplanning
Long-term impactsof interbasin waterdiversions into awater scarce area
Interactions among variousdrivers of water shortageanalyzed, and sustainablemanagement strategiesrecommended
Madani and Mariño(2009), Iran
Provided insights foreffective regional-scale wa-ter resources managementand policy selection
Long-term waterallocation amongvarious stakeholdergroups
Basin-scale hydrological,agricultural, economic, andecological subsystemssimulated
Gastélum et al. (2009),Mexico Ahmad andPrashar (2010), USA
Integrated watershed processmodel, supporting policytesting and formulatingintegrated managementcriteria
Post-disaster waterresourcesmanagement
Simulated post-earthquakechanges in water consump-tion patterns, population,and water infrastructuredevelopment
Bagheri et al. (2010),Iran
Facilitates monitoring andpolicy selection for post-disaster water managementto accommodate increaseddemand due to relief opera-tion and reconstruction
Growing globalwater scarcity
Simulated differentsubsystems includingclimate, carbon cycle,hydrologic cycle, andsocio-economic subsystemlinked to food productionsubsystem and global wateravailability, use, and quality
Davies and Simonovic(2011), N/A
Facilitates global-scale evalu-ation of feedbacks betweenwater resources and socio-economic and environmen-tal change, providinginsights for understandingglobal water scarcity
2426 A. Mirchi et al.

decrease/increase in model Variable B. For example, if the area of cultivated land in anagricultural district is increased, agricultural water demand will rise (positive causal rela-tionship). Likewise, increase in hydraulic conductivity and temperature will increasegroundwater recharge and evaporation, respectively. In contrast, as infiltration increases,the amount of surface runoff into a storage reservoir will decrease. Similarly, increasedevaporation will cause the stored water in the reservoir to decrease. In another balancingrelationship, as the groundwater table falls, the pumping cost will rise. A summary of thegiven examples, along with graphical notation of reinforcing and balancing causal relation-ships and their interpretation, is presented in Table 4.
3.2 Causal Loop Diagrams and Basic Feedback Loops
Developing the system’s CLD helps graphically capture the relationships between interac-tive subsystems, and can thus be considered as the conceptual modeling step. CLDs providevaluable information about the system including the presence of feedback loops, loopdominance, and presence of time delays. They are comprised of words and arrows withappropriate polarity, depicting combinations of positive and/or negative causal relationships.A causal relationship may exist between any two system variables, regardless of their type.
Table 3 Example applications of system dynamics in participatory water resources modeling for integratedpolicy assessment
Issue(s) addressed Modeling approach Citation,location
Author’s remarks
Over-appropriation of riverflow to diverse stakeholdergroups
A system dynamics model ofprocesses governing annualriver flow used byparticipants fromagricultural andhydropower productionsectors
Ford (1996),USA
Facilitated shared learningand useful participation of adiverse group ofstakeholders, simulationresults led to constructivediscussions about complexwater issues
Enhancing publicunderstanding of watermanagement options in afast growing area
A strategic-level system dy-namics model used in apublic forum to illustratethe effectiveness of avail-able and proposed manage-ment alternatives
Stave (2003),USA
Counterintuitive modelresults triggeredinformative discussionsamong participants, andeffective managementstrategies were identified
The need for publicparticipation in integratedwater resources planningand management
Participatory systemdynamics simulation of keyhydrologic, social, andenvironmental drivers forquantitative comparison ofalternative managementoptions
Tidwell et al.(2004), USA
Facilitated publicinvolvement in decisionmaking, and increasedpublic understanding ofwater managementcomplexities; facilitatedanalysis of water supply,demand, and conservation
Incorporating theimplications of climatechange in integrated waterresources planning andmanagement
Participatory, scenario-basedapproach to build a water-shed model to explore wa-ter resources futures andbasin-scale policy options
Langsdale etal. (2007),Langsdale etal. (2009),Canada
Provided shared learningexperience and increasedthe participants’appreciation of future watermanagement challenges(reduced supply andincreased demand)
Synthesis of System Dynamics Tools 2427

In complex systems, combinations of positive and negative causal relationships may formfeedback loops. There are two fundamental feedback loops–balancing (negative) and rein-forcing (positive) loops. Typically, a balancing feedback loop comprises causal relationshipswhich collectively attempt to reduce the discrepancy between the current state and a desiredstate. On the other hand, reinforcing feedback loops often characterize continuing trends ofgrowth or decline. As a rule of thumb, a loop is reinforcing if the number of its negativecausal links is even, and it is balancing otherwise, provided that the CLD appropriatelyrepresents the main drivers and causal relationships between them (Sterman 2000). Theability to observe the structure of systems to identify dominant feedback loops in arepresentative CLD can provide qualitative information about their typical dynamic behav-ior. Therefore, when systems are not overly complex, it may be possible by looking at theCLD to determine the behavior of some variables even before quantitative modeling. Wewill use a simple example to illustrate the behavior of reinforcing and balancing feedbackloops, and the use of CLDs in qualitative modeling.
To better understand the behavior of a reinforcing feedback loop, consider a reservoirsupplying water for a growing urban area. Net precipitation increases the inflow, raising thereservoir’s stored water and increasing the potential for development (positive relationships).Subsequently, new opportunities for development lead to actual development, raising waterdemand, which then prompts the reservoir operators to allocate more space in the reservoirto storage. Allocating more space to storage would then create potential for more develop-ment which, in turn, would ultimately call for still more stored water. In the absence of otheroperating feedbacks (e.g., flooding, environmental flows, evaporation), the stored water inthe system would grow exponentially until storage capacity has completely been used.Figure 3 shows a simple CLD broadly illustrating the interrelationships within the “urbanwater supply loop” and corresponding behavior of the hypothetical system.
In the “urban water supply loop” it was assumed that the reservoir is solely used for thepurpose of water supply. Now suppose the reservoir functions only for flood control. In thiscase, high inflows raise the reservoir’s stored water, increasing flood risk. Consequently, thereservoir release is increased to reduce the stored water and accommodate the future inflows.This is an example of a balancing or negative feedback loop where the reservoir releasehelps maintain the reservoir’s water level below levels that would jeopardize the urban area.Neglecting all other operating loops, a CLD of the “flood control loop,” along withbehavioral graph of the reservoir system, is shown in Fig. 4.
Table 4 Graphical notation and polarity of causal relationships
2428 A. Mirchi et al.

When studied separately, the “urban water supply loop” and “flood control loop”demonstrate distinctively different behavioral patterns (i.e., respectively, exponential growthand decline). However, when both feedback loops are present (Fig. 5a), the system’s long-term dynamic behavior may undergo variations depending on which loop is dominant.Figure 5b depicts potential long-term behavior of the system. Although this may seem likea trivial example, it represents the long-term behavior observed in a number of systemsaffected by development, where reservoir reallocation has been proposed (McMahon andFarmer 2004).
3.3 Stock and Flow Diagrams
Based on the CLD of the problem, a Stock and Flow Diagram (SFD) can be developed tobetter characterize accumulation and/or depletion of stock(s) and flow of quantities in thesystem. General steps for translating CLD into SFD are summarized in Table 5. Represent-ing the system in terms of stocks and flows precedes quantification of the processes that havebeen accounted for in the CLD. Easy-to-learn software programs (e.g., STELLA (High
Storedwater
Net precipitation
Inflow
+
+
Flood controlloop
Floodingrisk
Reservoirrelease
+
+
-
B
(a) (b)
Reservoir storage allocation
Time
Fig. 4 CLD of the “flood control loop” of the hypothetical reservoir system a and corresponding dynamicbehavior b. “B” denotes a balancing feedback loop
Netprecipitation
Inflow
Storedwater
Potential fordevelopment
Development
Waterdemand
+
+
+
+
+
+Urban watersupply loop
R
(a) (b)
Reservoir Storage allocation
Time
Fig. 3 CLD of the “urban water supply loop” a and corresponding behavior of the hypothetical reservoirsystem b. “R” denotes a reinforcing feedback loop
Synthesis of System Dynamics Tools 2429

Performance Systems 1992), Powersim (Powersim Corp. 1996), and Vensim (VentanaSystems 1996)) can be used to facilitate qualitative as well as quantitative system dynamicsmodeling. These simulation environments provide building blocks for developing quantita-tive models, obviating the need for learning complex programming languages, and allowingmore people to gain hands-on experience with system dynamics modeling. Stocks (levels)are measured at one specific time and represent any variable that accumulates or depletesover time, while flows (rates) are measured over an interval of time and denote activities orvariables causing the stock to change. For example, the stored water in a reservoir systemcan be modeled as a stock with inflow and release being its associated flows. Auxiliaryvariables, such as flood risk and potential for development, are functions of stocks orconstants that help formulate and calibrate the model. Stocks, flows and auxiliary variablesare connected by arrows (connectors), which are used to build relationships between themodel variables by transferring information such as the value of parameters present in aparticular model equation. Figure 6 shows a simple SFD of the reservoir example.
Table 5 Procedure for building SFD using CLD (Adapted from Wolstenholme and Coyle 1983)
Step Purpose
Key variablerecognition
Identify main drivers giving rise to problem symptoms
Stock identification Identify system resources (stocks) associated with the main drivers
Flow moduledevelopment
Provide rates of change and represent processes governing each stock
Qualitative analysis Identify: (i) additional main drivers that may have been overlooked; (ii) causalrelationships that require further analyzing by specific methods; (iii) controllablevariables and their controllers; (iv) systemic impact of changes to controllablevariables; (v) system’s vulnerability to changes in uncontrollable variables
Storedwater Development
R
Net precipitation
Inflow
+
Reservoirrelease
(a)
(b)
+ Potential fordevelopment
Waterdemand
Floodingrisk
+
+
+
+ Urban watersupply loop
Flood controlloop
+
+
-
B
Reservoir storage allocation
Time
Fig. 5 CLD of “water supplyloop” and “flood control loop” a,and corresponding long-term be-havior of the hypothetical reser-voir system b. “R” and “B”denote reinforcing and balancingfeedbacks, respectively
2430 A. Mirchi et al.

3.4 Reference Modes
A reference mode is an overall pattern of system’s behavior over time as opposed to shorthistorical time series which may be dominated by noise (Sterman 2000; Ford 1999;Simonovic 2009). Saeed (1998) considers a reference mode as a qualitative and intuitiveconcept facilitating conceptualization processes, which does not represent the precise de-scription/prediction of past/future events. Fundamental reference modes of dynamic behav-ior include exponential growth, goal seeking, and oscillation. Typically, reinforcing andbalancing feedback loops demonstrate continuous growth and goal seeking behavior, re-spectively. Oscillation is generated by presence of delayed corrective components in bal-ancing loops causing the system to constantly move above and then below its goal. Othercommon modes of dynamic behavior, which are caused by the fundamental modes, includeS-shaped growth, oscillating overshoot, and overshoot and collapse. S-shaped growth isgenerated when the balancing feedbacks in a system dominate its behavior after it has, underimpact of reinforcing loops, grown toward a limiting state (e.g., carrying capacity of anenvironmental system). When significant time delays hinder the balancing feedbacks toinitiate the corrective action on time, the system will likely overshoot the limiting state,demonstrating an oscillatory behavior around the constraining limit (oscillating overshoot).In this situation, if the resource is non-renewable or carrying capacity is irreversiblyexceeded, the system will collapse before the balancing feedbacks can salvage it (overshootand collapse). Figure 7 presents common modes of dynamic behavior.
Awater-stressed region’s ongoing trend of development, facilitated by continuous supplyof imported water, is an example of exponential growth driven by a reinforcing feedbackstructure (Madani and Mariño 2009). In contrast, irrigation water withdrawal in an agricul-tural district where appropriate water pricing schemes are applied often follows a goalseeking dynamic behavior (Cai and Wang 2006). An example of oscillatory dynamicbehavior is a lake’s water level which fluctuates seasonally due to seasonal precipitationpatterns and water demands, and perhaps as mandated by lake operation rules (e.g., Watkinsand Moser 2006). When water resources limit a region’s development (i.e., no water can besupplied from outside the watershed), the water consumption pattern will likely demonstrateS-shaped behavior (Bagheri and Hjorth 2007). If long delays hinder timely response towarning signals (e.g., severe water stress), the system may overshoot its limit, causing social,economic, and/or environmental hardships. On the other hand, if the water resources areeventually replenished, it is likely that continued growth and consumption will exhaust thenewly available water, generating alternating periods of replenishment and depletion, char-acterized by an oscillating overshoot mode of dynamic behavior. In an extreme case,
Netprecipitation
Potential fordevelopment
Development
Waterdemand
Floodingrisk
Storedwater
Inflow
Reservoirrelease
Flood controlloop
Urban watersupply loop
Fig. 6 Stock Flow Diagram(SFD) of the reservoir problem
Synthesis of System Dynamics Tools 2431

extensive development in resource-stressed areas can completely exhaust the resourcesnecessary for survival of the system causing it to collapse (Erickson and Gowdy 2000).
3.5 System Archetypes
System archetypes are generic system structures showing common patterns of behavior(Senge 1990; Wolstenholme 2003). Reinforcing and balancing feedback loops are essen-tially the basic system archetypes. In real systems, however, a combination of reinforcingand balancing feedback structures can form more complex dynamic behaviors that can becharacterized using more sophisticated system archetypes. Through closely studying thestructure of many systems, a number of archetypes have been identified that can serve asdiagnostic tools, describing or predicting the system’s long-run behavior. Some commonarchetypes are Limits to Growth, Success to the Successful, Fixes that Backfire, and Tragedyof the Commons (Senge 1990). Knowledge of the governing dynamics of water resourcessystems may help decision makers prognosticate problematic behavior and take appropriatecorrective actions in a timely fashion, leading to more sustainable water resources planningand management. In this section, the applicability of some system archetypes to characterizewater resources management problems is illustrated through a number of examples.
Limits to Growth The Limits to Growth archetype hypothesizes that continuous growth,driven by reinforcing feedback loops in natural systems, will eventually push the systemtoward its limit (e.g., carrying capacity). Once the system has grown beyond a critical level,balancing feedback loops take over and dominate the system’s behavior, attempting toprevent its collapse (Meadows et al. 1972). Dynamic behavior of an agricultural systemusing groundwater as its source of irrigation water is an example of this archetype. A CLD ofthe Limits to Growth archetype for the given agricultural system is depicted in Fig. 8a. Inthis system, agricultural growth raises the demand of irrigation water. Farmers may thendevelop additional groundwater resources and increase pumping, enhancing the potential foragricultural growth and an increase in cultivated land (reinforcing loop). However, pumpingexcessive amounts of groundwater will cause severe drawdown of the groundwater table,increasing the pumping cost which, in turn, reduces the demand for groundwater (balancingloop). As shown in Fig. 8b, pumping cost increases with continuous agricultural growth until
Exponential growth
Oscillating overshoot
Goal seeking
Time Time Time
Time Time Time
S-shaped growth
Oscillation
Overshoot and collapse
Fig. 7 Common modes of dynamic behavior (Adapted from Sterman 2000)
2432 A. Mirchi et al.
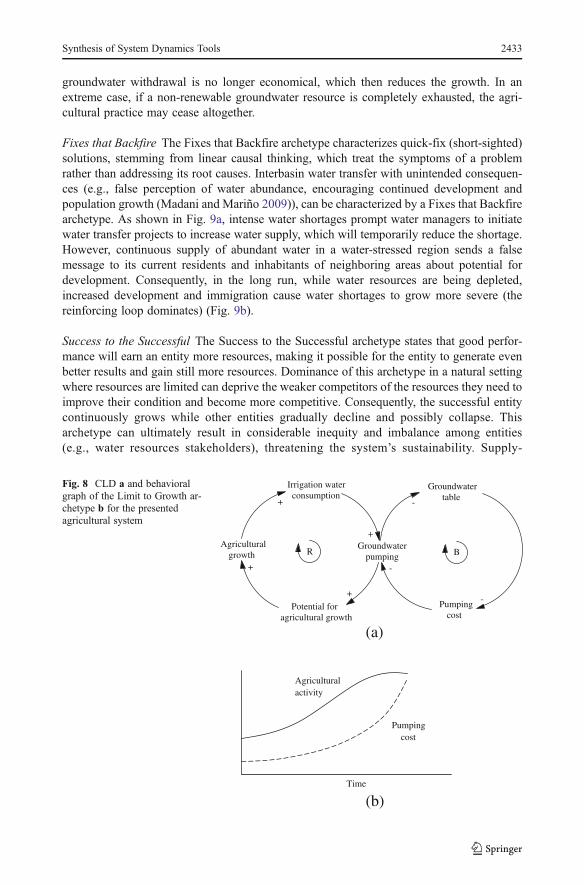
groundwater withdrawal is no longer economical, which then reduces the growth. In anextreme case, if a non-renewable groundwater resource is completely exhausted, the agri-cultural practice may cease altogether.
Fixes that Backfire The Fixes that Backfire archetype characterizes quick-fix (short-sighted)solutions, stemming from linear causal thinking, which treat the symptoms of a problemrather than addressing its root causes. Interbasin water transfer with unintended consequen-ces (e.g., false perception of water abundance, encouraging continued development andpopulation growth (Madani and Mariño 2009)), can be characterized by a Fixes that Backfirearchetype. As shown in Fig. 9a, intense water shortages prompt water managers to initiatewater transfer projects to increase water supply, which will temporarily reduce the shortage.However, continuous supply of abundant water in a water-stressed region sends a falsemessage to its current residents and inhabitants of neighboring areas about potential fordevelopment. Consequently, in the long run, while water resources are being depleted,increased development and immigration cause water shortages to grow more severe (thereinforcing loop dominates) (Fig. 9b).
Success to the Successful The Success to the Successful archetype states that good perfor-mance will earn an entity more resources, making it possible for the entity to generate evenbetter results and gain still more resources. Dominance of this archetype in a natural settingwhere resources are limited can deprive the weaker competitors of the resources they need toimprove their condition and become more competitive. Consequently, the successful entitycontinuously grows while other entities gradually decline and possibly collapse. Thisarchetype can ultimately result in considerable inequity and imbalance among entities(e.g., water resources stakeholders), threatening the system’s sustainability. Supply-
Irrigation waterconsumption
Groundwaterpumping
Potential foragricultural growth
Agriculturalgrowth
Groundwatertable
Pumpingcost
(a)
(b)
+
+
+
+
-
-
-
R B
Time
Pumping cost
Agricultural activity
Fig. 8 CLD a and behavioralgraph of the Limit to Growth ar-chetype b for the presentedagricultural system
Synthesis of System Dynamics Tools 2433

oriented water resources management in a large metropolitan area can be explained using theSuccess to the Successful archetype, illustrated in Fig. 10a. Water scarcity in less-populatedneighboring areas is secondary to the needs of a water-stressed megacity (Bagheri andHjorth 2007). As the megacity’s share of water resources increases, so does potential fordevelopment, which in turn adds to the power of the megacity to gain more water resources.Simultaneously, the neighboring towns’ share of water resources decreases, hindering theirdevelopment and ability to gain necessary resources (Fig. 10b). Another real example of awater resources problem based on the Success to the Successful archetype is floodplaindevelopment in California, which results in a continuous profit to the local developers(success) and continuous increase in risk of economic loss to the state of California as aresult of development behind unreliable levees (Madani et al. 2007).
Tragedy of the Commons This archetype is observed when multiple users exploit a sharedwater resource. Suppose two farmers use groundwater as the primary source for irrigatingtheir crops. The shared resource can last longer under a regulated groundwater consumptionscheme, maximizing the long-term profit of each individual stakeholder. However, in theabsence of appropriate regulations, the farmers can pump as much as they want to maximizetheir profit. This situation is well represented by a Tragedy of the Commons (Hardin 1968)archetype, whereby each party depletes the common pool resource solely based on their ownself-interest (Loaiciga 2004; Madani 2010). Figure 11a shows a CLD of the Tragedy of theCommons archetype for the groundwater problem in which two farmers (A and B) competeto maximize their own net profit by exploiting the groundwater resource. Initially, thereinforcing loops R1 and R2 drive the system such that each farmer gains satisfactoryprofits. This situation holds until the groundwater table is excessively drawn down, at whichpoint the balancing loops B1 and B2 dominate the system’s dynamic behavior. Ultimately,increased pumping cost due to pumping from a lower groundwater table reduces the netprofit for each individual farmer (Fig. 11b). This archetype can be generalized to qualita-tively analyze any common pool resource problem (Madani and Dinar 2012), includingtransboundary water resources. In an extreme case, the competition between stakeholderscan jeopardize local or regional sustainability and wellbeing of inhabitants, potentiallyinitiating political conflicts (Lowi 1993).
Watertransfer
Watersupply
Watershortage
DevelopmentWater
demand
+
+
-
+
+
+
B
R
(a) (b)
Development
Water shortage
Time
Fig. 9 CLD a and long-term behavior of Fixes that Backfire archetype b for interbasin water transfer. Notethe lag time until unintended consequences are observed, indicated by the double bars
2434 A. Mirchi et al.

4 Discussion
4.1 Qualitative Versus Quantitative Modeling
Qualitative system dynamics modeling can be used at different levels for different purposes(Richmond 1994). Randers (1980) believes that “most human knowledge takes a descriptivenonquantitative form”, and thus analysts should not restrict themselves to numerical data,which is a small fraction of knowledge fit for statistical analysis. However, developingqualitative models may not be enough for complete analysis of the problem. Proponents ofquantitative modeling argue that numerical simulation nearly always adds value, even in theface of significant uncertainties about data and important qualitative information used insimulations (Forrester 1975; Homer and Oliva 2001; Dhawan et al. 2011). We recognize thepitfall of oversimplifying a problem and neglecting the value of conducting detailedsimulations, which may reveal complex system behaviors that could not be understoodthrough simple diagramming (Homer and Oliva 2001; Forrester 2007). However, to accom-plish a successful system dynamics application, extensive computer simulations should beperformed only after a clear picture of the integrated water resources system has beenestablished through reasonably simplified conceptual models. Contrary to conventionalmodeling which may fail to capture the big picture of the problem with important feedbackloops, a thorough system dynamics study can provide reliable qualitative and quantitativebases for policy selection. In this way, instead of investing resources prematurely, analystscan prioritize what to study in more detail to ensure an in-depth understanding of theproblem is obtained.
Megacity'swater resources
Developmentof megacity
Share of megacitywith respect to
neighboring towns
Neighboringtowns' water
resources
Developmentof neighboring
towns
+
+
+-
+-
R1 R2
Time
Neighboring towns’ development
Megacity’s
(a)
(b)
development
Fig. 10 CLD a and long-termbehavior of Success to the Suc-cessful archetype b for the urbanwater development problem
Synthesis of System Dynamics Tools 2435

System dynamics’ qualitative modeling tools, and the insights that they provide, makethis approach accessible to a wide range of decision makers and stakeholders. The tools forvisually exploring systems are a major distinguishing factor between this approach andtraditional simulation methods. These qualitative analysis tools help generate a constructivemedium for understanding a system’s structure using an iterative approach best implementedthrough interaction with people who are familiar with the system at different levels (Randers1980). Therefore, attempts to reveal the main drivers of the problem using CLDs, SFDs, andarchetypes are necessary. However, analysts should be aware of the general concerns aboutusing qualitative modeling tools. In particular, problems might be encountered when trans-lating CLDs into SFDs. Richardson (1986) argues that traditional definitions of the polaritiesof causal links and feedback loops are inadequate. In order to address this inadequacy hesuggests that CLDs should account for the accumulating nature of the Flow-to-Stock links.As an alternative way for dealing with this problem, modelers can use CLDs along withreasonably representative SFDs to ensure qualitative insights are properly communicated.
System archetypes provide generic CLDs that reveal qualitative information about theunderlying structure of the system, enabling water managers to detect current problematictrends and anticipate future problems. Thus, system archetypes are not meant to address anyspecific problem, but instead are applicable to classes of problems that share one or more
Net profit forfarmer A
Farmer A'sgroundwater use
Totalgroundwater use
Farmer B'sgroundwater use
Net profit forfarmer B
Groundwater level
+
+
+
+
+
+
R1
R2
B1
B2
Pumping cost-
-
-
-
Time
Gain per
(a)
(b)
individual farmer Pumping cost
Fig. 11 CLD a and the behavioral graph of Tragedy of the Commons archetype b for the groundwaterproblem when two users (farmers A and B) compete to maximize their own share of the resource
2436 A. Mirchi et al.

modes of dynamic behavior. For various classes of problems, generic solution archetypeshave been reported in the literature (Wolstenholme 2004). As such, system archetypes can beused along with other system dynamics tools such as SFDs to generate a broad, holisticunderstanding of the system’s state and its long-term behavioral pattern. Essentially, onceanalysts reach a consensus regarding the system archetype that governs their particularsystem of interest, they can obtain valuable insights into solution strategies, which can befurther analyzed and tested using detailed simulations (Wolstenholme 2003). This is aunique characteristic of system dynamics that facilitates conceptual or high-level strategicwater resources modeling.
System dynamics models should have comprehensive, and yet simple structures, partic-ularly when presented to non-technical audiences (Stave 2003). In this context, simplicity isnot equivalent to misrepresentation of the system’s structure. Rather, it is more consistentwith Albert Einstein’s maxim that “a good explanation is one that is as simple as possible,but not simpler.” Often, it is also important for system dynamics water resources models tohave transparent structures that facilitate sensitivity analysis, which is critical for adaptivewater resources management and scenario-based policy screening (Simonovic and Fahmy1999). If too much detail is included in the CLD, the structure of the system dynamics modelmay become overly difficult to understand for people who have not been involved in themodel development. In addition to increased data requirements for complex, integratedmodels, to be able to provide meaningful interpretation of behavioral trends modelers mustdevelop appropriate methods and protocols for quantifying socio-political subsystems–a taskwhich remains a formidable challenge (Hellström et al. 2000; Luna-Reyes and Andersen2003). Furthermore, regardless of the scope of the problem, modelers need to applyappropriate aggregation and hierarchical decomposition principles to accomplish the mod-eling task, with the level of aggregation and decomposition varying according to the scale ofproblem, modeling objectives, and desired model sophistication.
4.2 Validation of System Dynamics Models
Model “verification” or “validation”, i.e., testing of the model using an independent data set,is often problematic due to limited data and, in some cases, a lack of appropriate methods forquantifying particular (e.g., socio-political) subsystems. Sterman (2000), in fact, argues thatno model can ever be verified or validated, for models are simplified representations of realprocesses and are thus different from reality in infinitely many ways. Nevertheless, in orderfor models to be useful as decision support tools for water resources planning and manage-ment, it is necessary to verify the model structure to ensure that mathematical equations andinterrelationships between subsystems follow logical explanations and are not spurious orerroneous. Unlike purely data-driven black-box models, generating an “accurate” outputbehavior is not sufficient for validation of causal-descriptive white-box system dynamicsmodels, which in addition to reproducing the system behavior, should explain how thebehavior is generated (Barlas 1996). Thus, as Barlas (1996) explains, in the context ofsystem dynamics, model validation is a semi-formal process consisting of a balanced mix ofboth quantitative tests and qualitative behavioral criteria targeting the system’s internalstructure. In participatory system dynamics modeling, validation can be done throughoutmodel development by a range of experts and stakeholders, which may be much morereliable than an external review of the model at the end of the process. The verification phaseof system dynamics models developed for water resources problems has not always beendiscussed in detail, but modelers have reported a variety of verification methods, includingbehavior replication, sensitivity analysis, dimensional consistency, and structure assessment
Synthesis of System Dynamics Tools 2437

(Ahmad and Simonovic 2000; Stave 2003; Tangirala et al. 2003). Table 6 summarizes thesemethods of verification of water resources system dynamics models.
4.3 Strengths and Limitations of System Dynamics Modeling
To summarize, Table 7 lists the major benefits and potential pitfalls of holistic waterresources system dynamics models, including problems which might arise due to inappro-priate application of the method without proper regard for its philosophy. Caution should beused when interpreting system dynamics models, for it is easy to formulate erroneousdynamic hypotheses due to inadequate information about a complex system, or due to lackof expertise. Biased simulation results may stem from faulty CLDs and SFDs. This caveat isparticularly important when creating integrated models to simulate feedback relationshipsamong socio-economic, political, natural, and technological subsystems. Tradeoffs amongaccuracy, breadth, and time must be considered in any modeling study. Nevertheless,although quantification of socio-economic and political components of water resourcessystems is challenging, and sometimes even speculative (Madani and Mariño 2009), systemdynamics modeling helps to prioritize information gathering and holistically investigateinteractions and potential impacts of different drivers of the problem.
Table 6 Common methods for verification of water resources system dynamics models (Adapted fromSterman 2000, revised for water resources applications)
Method Rationale Procedure(s) Citation
Behaviorreplication
Reproduce the system’scommon modes ofdynamic behaviorboth qualitatively andquantitatively
Perform statistical analyses ofmodel results and observed data(e.g., R2); qualitatively comparemodel results with data;investigate anomalies; changeequilibrium conditions todisequilibrium conditions
Ahmad and Simonovic (2000),Guo et al. (2001), Stave(2003), Tangirala et al. (2003),Tidwell et al. (2004),Madani and Mariño (2009),Bagheri et al. (2010),Venkatesan et al. (2011a),Qaiser et al. (2011)
Dimensionalconsistency
Ensure each modelequation isdimensionally correct
Perform dimensional analyses;double check conversionfactors; ensure correlationcoefficients are dimensionallycorrect
Tangirala et al. (2003)
Sensitivityanalysis
Test numerical,behavioral,and policy sensitivity
Conduct univariate andmultivariate sensitivitytests; simulate extremeconditions; changetime step
Ahmad and Simonovic (2000),Tangirala et al. (2003),Bagheri et al. (2010),Venkatesan et al. (2011a, b)
Structureassessment
Ensure model structurecomplies withnatural laws (e.g.,continuity) andrepresents descriptionof the system, andappropriateaggregationand decision rules areapplied
Develop CLDs and SFDs;delineate appropriateboundaries; test performanceof each sub-model;change aggregation level anddecision rules
Bagheri et al. (2010) Qaiseret al. (2011)
2438 A. Mirchi et al.

5 Conclusions
The traditional linear thinking paradigm lacks the mental and organizational framework forsustainable development trajectories, and may lead to quick-fix solutions that fail to addresskey drivers of water resources problems. In contrast, systems thinking can help waterresources decision makers comprehend the interactions among various interlinked subsys-tems of a water resources system which drive its long-run dynamic behavior. Applying asystems thinking paradigm to water resources modeling is thus critical in the thinking phaseof formulating strategic-level water management policies and plans. System dynamicsmodeling facilitates the application of systems thinking and holistic conceptualization ofwater resources systems.
In recent decades, while system dynamics has been widely used by water resourcesscholars as a tool for quantitative water resources modeling, it has not typically been utilizedto its full capacity for scrutinizing the system’s structure to provide insights into potentialreasons behind problematic behavioral trends. At the strategic level, emphasis should beplaced on trend identification and pattern recognition rather than exact quantitative predic-tions of dynamic variables. Although the quantitative modeling phase using extensivecomputer simulations is still very important and needed for policy screening, especiallywhen characterizing complex systems, qualitative system dynamics models can improveunderstanding of general trends and the root causes of problems, and thus promote sustain-able water resources decision making.
In this paper, tangible water resources examples were presented to illustrate the funda-mentals of system dynamics, emphasizing that developing CLDs and SFDs is necessary foridentifying causal relationships forming feedback loops within water resources systems.Furthermore, water managers should use the knowledge of reference modes and systemarchetypes (e.g., Limits to Growth, Fixes that Backfire, Success to the Successful, andTragedy of the Commons) to gain insights into sustainable solution strategies by recognizingcommon patterns of dynamic behavior. Compared to other modeling approaches, perhaps
Table 7 Benefits and limitations of integrated water resources system dynamics models
Benefits Limitations
• Provide tools for graphical representation ofsystems (CLDs and SFDs) promoting qualitativemodeling
• Easy to conceptualize erroneous CLDs and SFDs
• Facilitate flexible, transparent modeling • Easy to develop faulty models based on wrong CLDsand SFDs
• Facilitate holistic understanding of the problem • Require experience and expertise to developsufficiently detailed, insightful, and representativedescription of the system (dynamic hypothesis)
• Capture long-run behavioral patterns and trends • Require substantial interdisciplinary knowledge togenerate meaningful quantitative predictions due tocomplexity and multitude of subsystems
• Facilitate clear communication of model structureand results
• Speculative quantification of some subsystems(e.g., socio-economic, and political subsystems).
• Promote shared vision planning, participatorymodeling, and shared learning experience
• Facilitate sensitivity analysis
• Suitable for policy assessment and/or selection
Synthesis of System Dynamics Tools 2439

the most significant advantage of system dynamics is that when systems are not toocomplicated, the qualitative modeling tools can help describe the behavior of many varia-bles, even before quantitative (numerical) modeling begins. This characteristic facilitatesconceptual or high-level strategic water resources modeling using multi-disciplinary, multi-sectoral, and participatory approaches critical to sustainable water resources planning andmanagement.
Acknowledgments This work was supported in part by the National Science Foundation under Grant No.0725636. The authors appreciate comments and suggestions from F. Nasiri, J. Zimmerman, V. Fuchs, F.Boschetti, and two anonymous reviewers. All opinions, findings, conclusions and recommendationsexpressed in this material are solely those of the authors.
References
Ahmad S, Prashar D (2010) Evaluating municipal water conservation policies using a dynamic simulationmodel. Water Resour Manag 24(13):3371–3395
Ahmad S, Simonovic SP (2000) System dynamics modeling of reservoir operations for flood management. JComput Civ Eng 14(3):190–198
Ahmad S, Simonovic SP (2004) Spatial system dynamics: a new approach for simulation of water resourcessystems. J Comput Civ Eng 18(4):331–340
Bagheri A, Hjorth P (2007) A framework for process indicators to monitor for sustainable development:practice to an urban water system. Environ Dev Sustain 9(2):143–161
Bagheri A, Darijani M, Asgary A, Morid S (2010) Crisis in urban water systems during the reconstructionperiod: a system dynamics analysis of alternative policies after the 2003 earthquake in Bam-Iran. WaterResour Manag 24(11):2567–2596
Barlas Y (1996) Formal aspects of model validity and validation in system dynamics. Syst Dyn Rev 12(3):183–210
Cai X, Wang D (2006) Calibrating holistic water resources-economic models. J Water Resour Plann Manag132(6):414–423
Coyle G (2000) Qualitative and quantitative modelling in system dynamics: some research questions. SystDyn Rev 16(3):225–244
Creighton JL, Langsdale S (2009) Analysis of process issues in shared vision planning cases, IWR Report 09-R-05, Institute for Water Resources, U.S. Army Corps of Engineers, Alexandria, Virginia
Davies EGR, Simonovic SP (2011) Global water resources modeling with an integrated model of the social–economic–environmental system. Adv Water Resour 34:684–700
Dhawan R, O’Connor M, Borman M (2011) The effect of qualitative and quantitative system dynamicstraining: an experimental investigation. System Dynamics Review. doi:10.1002/sdr.455
Erickson JD, Gowdy JM (2000) Resource use, institutions and sustainability: a tale of two Pacific islandcultures. Land Econ 76(3):345–354
Ford A (1996) Testing the Snake River Explorer. Syst Dyn Rev 12(4):305–329Ford A (1999) Modeling the environment. Island Press, WashingtonForrester J (1961) Industrial dynamics. MIT Press, CambridgeForrester J (1969) Urban dynamics. MIT Press, CambridgeForrester JW (1975) Industrial dynamics—a response to Ansoff and Slevin. In: Collected Papers of Jay W.
Forrester. Wright-Allen Press, Cambridge, Massachusetts, pp 151–165Forrester J (2007) System dynamics—the next 50 years. Syst Dyn Rev 23:359–370Gastélum JR, Valdés JB, Stewart S (2009) A decision support system to improve water resources management
in the Conchos Basin. Water Resour Manag 23(8):1519–1548Guo HC, Liu L, Huang GH, Fuller GA, Zou R, Yin YY (2001) A system dynamics approach for regional
environmental planning and management: a study for the Lake Erhai Basin. Environ Manag 61(1):93–111Hardin G (1968) The tragedy of the commons. Science 162:1243–1248Hellström D, Jeppsson U, Kärrman E (2000) A framework for systems analysis of sustainable urban water
management. Environ Impact Assess Rev 20(3):11–321High Performance Systems (1992) Stella II: an introduction to systems thinking. High Performance Systems,
Inc, Hanover, New Hampshire
2440 A. Mirchi et al.

Hjorth P, Bagheri A (2006) Navigating towards sustainable development: a system dynamics approach.Futures 38(1):74–92
Homer J, Oliva R (2001) Maps and models in system dynamics: a response to Coyle. Syst Dyn Rev 17(4):347–356
Langsdale S, Beall A, Carmichael J, Cohen S, Forster C (2007) An exploration of water resources futuresunder climate change using system dynamics modeling. Integr Assess 7(1):51–79
Langsdale S, Beall A, Carmichael J, Cohen S, Forster C, Neale T (2009) Exploring the implications of climatechange on water resources through participatory modeling: case study of the Okanagan Basin, BritishColumbia. J Water Resour Plann Manag 135(5):373–381
Leal Neto AC, Legey LFL, Gonzalez-Araya MC, Jablonski S (2006) A system dynamics model for theenvironmental management of the Sepetiba Bay watershed, Brazil. Environ Manag 38(5):879–888
Leaver JD, Unsworth CP (2006) System dynamics modeling of spring behaviour in the Orakeikorakogeothermal field, New Zealand. Geothermics 36(2):101–114. doi:10.1016/j.geothermics.2006.08.001
Loaiciga HA (2004) Analytic game—theoretic approach to ground-water extraction. J Hydrol 297:22–33Lowi M (1993) Water and power—the politics of a scarce resource in the Jordan River Basin. Cambridge
University Press, CambridgeLuna-Reyes LF, Andersen DL (2003) Collecting and analyzing qualitative data for system dynamics: methods
and models. Syst Dyn Rev 19(4):271–296Lund JR, Palmer RN (1997) Water resource system modeling for conflict resolution. Water Resources Update,
Universities Council on Water Resources 108: 70–82Madani K (2010) Game theory and water resources. J Hydrol 381(3–4):225–238. doi:10.1016/
j.jhydrol.2009.11.045Madani K, Dinar A (2012) Non-cooperative institutions for sustainable common pool resource management:
application to groundwater. Ecol Econ 74:34–45. doi:10.1016/j.ecolecon.2011.12.006Madani K, Mariño MA (2009) System dynamics analysis for managing Iran’s Zayandeh-Rud river basin.
Water Resour Manag 23(11):2163–2187. doi:10.1007/s11269-008-9376-zMadani K, Rowan D, Lund JR (2007) The next step in Central Valley flood management: connecting costs
and benefits. In: Proceedings of the University Council on Water Resources Annual Conference, Boise,Idaho
McMahon GF, Farmer MC (2004) Reallocation of federal multipurpose reservoirs: principles, policy, andpractice. J Water Resour Plann Manag 130(3):187–197
Meadows DH, Meadows DL, Randers J, Behrens WW (1972) The limits to growth. Universe Books, NewYork
Mirchi A, Watkins DW Jr, Madani K (2010) Modeling for watershed planning, management and decisionmaking. In: Vaughn JC (ed) Watersheds management, restoration and environmental impact. Nova,Hauppauge, New York
Powersim Corporation (1996) Powersim 2.5 reference manual. Powersim Corporation Inc., Herndon, VirginiaQaiser K, Ahmad S, Johnson W, Batista J (2011) Evaluating the impact of water conservation on fate of
outdoor water use: a study in an arid region. J Environ Manag 92(8):2061–2068Randers J (1980) Guidelines for model conceptualization. In: Randers J (ed) Elements of the system dynamics
method. MIT Press: Cambridge, Massachusetts, pp 117–139Richardson GP (1986) Problems with causal-loop diagrams. Syst Dyn Rev 2:158–170Richmond B (1993) Systems thinking: critical thinking skills for the 1990ies and beyond. Syst Dyn Rev 9
(2):113–133Richmond B (1994) Systems thinking/system dynamics: let’s just get on with it. Syst Dyn Rev 10(2/3):135–
157Saeed K (1998) Defining a problem or constructing a reference mode. In: Proceedings of the 16th Interna-
tional Conference of the System Dynamics Society Quebec ’98, Quebec City, CanadaSehlke G, Jacobson J (2005) System dynamics modeling of transboundary systems: the Bear River Basin
model. Ground Water 43(5):722–730Senge P (1990) The Fifth Discipline: the art & practice of the learning organization. Doubleday/Currency,
New YorkShrestha E, Ahmad S, Johnson W, Shrestha P, Batista JR (2011) Carbon footprint of water conveyance versus
desalination as alternatives to expand water supply. Desalination 280:33–43Shrestha E, Ahmad S, Johnson W, Batista JR (2012) The carbon footprint of water management policy
options. Energ Pol 42:201–212Simonovic SP (2009) Managing water resources: methods and tools for a systems approach. UNESCO, Paris
and Earthscan James & James, LondonSimonovic SP, Ahmad S (2005) Computer-based model for flood evacuation emergency planning. Nat Hazard
34(1):25–51
Synthesis of System Dynamics Tools 2441

Simonovic SP, Fahmy H (1999) A new modeling approach for water resources policy analysis. Water ResourRes 35(1):295–304
Simonovic SP, Li L (2003) Methodology for assessment of climate change impacts on large-scale floodprotection system. J Water Resour Plann Manag 129(5):361–371
Simonovic SP, Rajasekaram V (2004) Integrated analyses of Canada’s water resources: a system dynamicsapproach. Canadian Water Resour J 29(4):223–250
Stave KA (2003) A system dynamics model to facilitate public understanding of water management options inLas Vegas, Nevada. Environ Manag 67(4):303–313
Sterman JD (2000) Business dynamics, systems thinking and modeling for a complex world. McGraw-Hill,Boston
Stewart S, Valdés J, Gastélum J, Brookshire D, Aparicio J, Hidalgo J, Velazco I (2004) A decision supportsystem for demand management in the Rio Conchos Basin, México. In: Proceedings of hydrology:science & practice for the 21st Century. British Hydrological Society II, pp 487–494.
Systems V (1996) Vensim user’s guide. Ventana Systems Inc, Belmont, MassachusettsTangirala AK, Teegavarapu RSV, Ormsbee L (2003) Modeling adaptive water quality management strategies
using system dynamics simulation. Environ Inf Arch 1:245–253Tidwell VC, Passell HD, Conrad SH, Thomas RP (2004) System dynamics modeling for community-based
water planning: application to the Middle Rio Grande. Aquat Sci 66:357–372Venkatesan AK, Ahmad S, Johnson W, Batista JR (2011a) Salinity reduction and energy conservation in direct
and indirect potable water reuse. Desalination 272(1–3):120–127Venkatesan AK, Ahmad S, Johnson W, Batista JR (2011b) System dynamics model to forecast salinity load to
the Colorado River due to urbanization within the Las Vegas Valley. Sci Total Environ 409:2616–2625Vezjak M, Savsek T, Stuhler EA (1998) System dynamics of eutrophication processes in lakes. Eur J Oper Res
109(2):442–451Watkins DW Jr, Moser DA (2006) Economic-based optimization of Panama Canal system operations. J Water
Resour Plann Manag 132(6):426–438Werick WJ, Whipple W (1994) Managing Water for Drought, IWR Report 94-NDS-8, Institute for Water
Resources, U.S. Army Corps of Engineers, Alexandria, VirginiaWinz I, Brierley G, Trowsdale S (2009) The use of system dynamics simulation in water resource manage-
ment. Water Resour Manag 23(7):1301–1323Wolstenholme EF (1999) Qualitative vs. quantitative modelling: the evolving balance. In: Coyle RG,
Morecroft JDW (eds) Special issue: system dynamics for policy, strategy and management education.Journal of the Operational Research Society 50(4): 354–361
Wolstenholme EF (2003) Towards the definition and use of a core set of archetypal structures in systemdynamics. Syst Dyn Rev 19(1):7–26
Wolstenholme EF (2004) Using generic system archetypes to support thinking and modelling. Syst Dyn Rev20:341–356
Wolstenholme EF, Coyle RG (1983) The development of system dynamics as a methodology for systemdescription and qualitative analysis. J Oper Res Soc 34(7):569–581
Xu ZX, Takeuchi K, Ishidaira H, Qhang XW (2002) Sustainability analysis for Yellow River water resourcesusing the system dynamics approach. Water Resour Manag 16(3):239–261
2442 A. Mirchi et al.
Copyright © 2022 FDOKUMEN