Synergistic Effects of Agronet Covers and Companion ... - MDPI
Upload
independentCategory
view
1download
0
Synergistic carbon metabolism in a fast growing
mixotrophic freshwater microalgal species
Micractinium inermum
Richard T. Smith a,b,*, Krys Bangert a,b, Stephen J. Wilkinson b,1,D. James Gilmour a
a Department of Molecular Biology and Biotechnology, University of Sheffield, Western Bank, Sheffield,
South Yorkshire, S10 2TN, United Kingdomb Department of Chemical and Biological Engineering, University of Sheffield, Mappin Street, Sheffield,
South Yorkshire, S1 3JD, United Kingdom
a r t i c l e i n f o
Article history:
Received 29 July 2014
Received in revised form
26 March 2015
Accepted 8 April 2015
Available online xxx
Keywords:
Microalgae
Carbon dioxide
Mixotrophic growth
Synergistic
Biodiesel
Dissolved inorganic carbon
a b s t r a c t
In recent years microalgae have attracted significant interest as a potential source of
sustainable biofuel. Mixotrophic microalgae are able to simultaneously photosynthesise
while assimilating and metabolising organic carbon. By combining autotrophic and het-
erotrophic metabolic pathways biomass productivity can be significantly increased. In this
study, acetate-fed mixotrophic Micractinium inermum cultures were found to have a specific
growth rate 1.74 times the sum of autotrophic and heterotrophic growth. It was hypoth-
esised that gas exchange between the two metabolic pathways within mixotrophic cul-
tures may have prevented growth limitation and enhanced growth. To determine the
extent of synergistic gas exchange and its influence on metabolic activity, dissolved
inorganic carbon (DIC), dissolved oxygen (DO) and photosynthesis and respiration rates
were measured under different trophic conditions. A 32.7 fold and 2.4 fold increase in DIC
and DO concentrations, relative to autotrophic and heterotrophic cultures respectively,
were coupled with significant increases in rates of photosynthesis and respiration. These
data strongly support the hypothesis of mixotrophic gas exchange within M. inermum
cultures. In addition to enhanced growth, this phenomenon may provide reductions in
aeration and oxygen stripping costs related to microalgae production.
© 2015 The Authors. Published by Elsevier Ltd. This is an open access article under the CC
BY license (http://creativecommons.org/licenses/by/4.0/).
* Corresponding author. Department of Molecular Biology and Biotechnology, University of Sheffield, Western Bank, Sheffield, SouthYorkshire, S10 2TN, United Kingdom. Tel.: þ44 (0) 114 222 4412.
E-mail address: [email protected] (R.T. Smith).1 Present address: Department of Chemical Engineering, Thornton Science Park, University of Chester, Chester, Cheshire, CH2 4NU,
United Kingdom.
Available online at www.sciencedirect.com
ScienceDirect
http: / /www.elsevier .com/locate/biombioe
b i om a s s a n d b i o e n e r g y x x x ( 2 0 1 5 ) 1e1 4
http://dx.doi.org/10.1016/j.biombioe.2015.04.0230961-9534/© 2015 The Authors. Published by Elsevier Ltd. This is an open access article under the CC BY license (http://creativecommons.org/licenses/by/4.0/).
Please cite this article in press as: Smith RT, et al., Synergistic carbon metabolism in a fast growing mixotrophic freshwatermicroalgal species Micractinium inermum, Biomass and Bioenergy (2015), http://dx.doi.org/10.1016/j.biombioe.2015.04.023

1. Introduction
Microalgae derived biofuels have the potential to meet a sig-
nificant fraction of global transport fuel demand, enabling a
reduction in our dependency on finite fossil fuels and their
associated greenhouse gas emissions. Although microalgae
have similar photosynthetic machinery to higher plants, their
simpler cellular structure and planktonic mode of growth
allow efficient access via diffusion to CO2 and other nutrients,
enabling high biomass productivities. Furthermore, oleagi-
nous microalgae accumulate significant proportions of their
biomass as lipids (typically 20e50% compared to <5% for oil
palm); lipid being the desired feedstock for biodiesel produc-
tion [1]. Consequently, compared to terrestrial crop biofuel
feedstocks such as soybean or sugarcane, microalgae have
orders of magnitude higher land use efficiencies [2]. In addi-
tion, microalgae can be grown on non-arable degraded land
using wastewater as a nutrient source [3]. These attributes are
particularly important because, unlike first generation bio-
fuels, they allow extensive microalgal cultivation while
avoiding the economic and environmental issues associated
with food production competition.
Unfortunately, the numerous advantages of microalgal
biofuels are matched by several technical challenges that
must be overcome to reach full environmental and economic
feasibility. One such challenge is achieving a high enough
productivity to drive down processing and harvesting costs,
which, due to the microscopic and aqueous nature of micro-
algae, are considerably higher than terrestrial crops [3].
Biomass productivity, expressed, for example, in units of
grams of dry cells per litre of culture per day, depends on both
cell density and specific growth rate [4]. Photoautotrophic
(henceforth referred to as autotrophic) algae rely entirely on
solar energy for growth, consequently cell density is inversely
proportional to light penetration and as cell density increases
specific growth rate declines due to self-shading [5]. Achieving
a high cell density and biomass productivity can therefore be
limited by light availability. For large-scale cultivation sys-
tems, photosynthetic autotrophic growth is usually consid-
ered as the dominant mode for engineering design purposes.
For this mode of growth, reactors and ponds are designed to
ensure adequate access to sunlight for photosynthesis, with
operating cell densities maintained at a reasonably low level
to prevent excessive shadowing of other cells. On the other
hand, heterotrophic cultivation of microalgae by promoting
aerobic respiration on an organic carbon source enables
biomass production to be maintained during the night hours,
and at higher cell densities due to light independent growth.
Cultivation using both modes of carbon metabolism therefore
offers the potential to maximise productivity; particularly
when a source of cheap organic carbon is available such as
acetate in the effluent of anaerobic digestors [6].
Mixotrophic algae are capable of simultaneously photo-
synthesising while assimilating and metabolising organic
carbon as both a carbon and energy source. This mode of
growth reduces dependency on light penetration, enabling
higher cell densities than autotrophy, while using consider-
ably less organic material per unit of biomass than dark het-
erotrophic growth [7]. Mixotrophic growth can enable
significantly enhanced biomass productivity, which in turn
leads to enhanced lipid productivity [5]. These characteristics
make mixotrophy a promising alternative strategy for micro-
algae biofuel production, especially when coupled with the
use of waste organic carbon sources [8].
A frequently overlooked challenge facing microalgal bio-
fuel commercialisation is CO2 supply. Autotrophic algal
growth is highly dependent on the availability of CO2, which
provides the main source of elemental carbon for the pro-
duction of new biomass and energy carrying molecules. Car-
bon dioxide is freely available in the atmosphere, but at a low
concentration of around 0.04%which limits the diffusivemass
transfer of CO2 into an algal culture. In order to reach
economically feasible productivity rates, this mass transfer
limitation to autotrophic growth can be removed by sparging
cultures with external sources of concentrated CO2. Anthro-
pogenic CO2 sources such as waste flue gases from power
plants are envisaged to meet the requirement for large scale
microalgae production. However, providing sufficient CO2 to
produce a quarter of US annual transport fuel demand
(roughly 227 billion litres of biodiesel) would require har-
nessing a large proportion (36e56%) of total CO2 emissions
from all US power plants [9,10]. Furthermore, in the US,
without an extensive and costly infrastructure of CO2 capture
and transportation, only a limited number of these concen-
trated emission sources are within range of areas suitable for
large scale algal cultivation. Consequently the availability and
cost of supplying CO2 is a significant bottleneck for large scale
microalgae production and further research is needed to
reduce reliance on external concentrated CO2 sources [10,11].
Mixotrophic growth could mitigate this problem by
providing an endogenic source of CO2 through the respiration
of organic carbon [12]. One of the earliest experiments
comparing trophic modes in the green alga, Chlorella regularis,
discovered that the two metabolic pathways, photosynthesis
and heterotrophic respiration, can act non-competitively
under mixotrophic growth [13]. Consequently the mixo-
trophic specific growth rate should equate to the sum of the
autotrophic and heterotrophic growth rates. This can be
expressed as a specific growth rate ratio (Equation (1));
mM
mA þ mH
¼ 1 (1)
where mM, mA, mH, equate to mixotrophic, autotrophic and
heterotrophic specific growth rates respectively. Subsequent
studies have reported a similar relationship in Chlorella vul-
garis, Haematococcus pluvialis, Chlamydomonas humicola, but not
in Scenedesmus acutus [14e17]. The species specific nature of
non-competitive mixotrophic growth is largely influenced by
both the degree to which organic carbon assimilation inhibits
the production of chlorophyll and the degree to which illu-
mination inhibits the production of organic carbon uptake
enzymes [12,16]. However, conformity to this ratio is also
governed by the aeration conditions under which the cultures
are grown. Martinez and Orus [15] reported that when the C.
vulgaris cultures were aerated with 2% CO2-air the ratio was
recorded as 1.00, in line with earlier aerated studies. However
when the cultures were aerated with air or grown under non-
aerated conditions this ratio increased to 1.10 and 1.28
respectively. A possible explanation for this phenomenon is
b i om a s s a n d b i o e n e r g y x x x ( 2 0 1 5 ) 1e1 42
Please cite this article in press as: Smith RT, et al., Synergistic carbon metabolism in a fast growing mixotrophic freshwatermicroalgal species Micractinium inermum, Biomass and Bioenergy (2015), http://dx.doi.org/10.1016/j.biombioe.2015.04.023

that under non-aerated conditions autotrophic and hetero-
trophic cultures are limited by CO2 and O2 respectively. In
mixotrophic conditions the activity of both metabolic path-
ways could enable synergistic rather than non-competitive
growth, with the assimilation and metabolism of organic
carbon providing an endogenic source of CO2 to fuel photo-
synthesis, which in turn provides an enriched source of O2 for
respiration. This synergistic effect could reduce gaseous
growth limitations and enhance growth. On the other hand it
is possible that the assimilation of photosynthetically derived
O2 by respiration could prevent oxygen accumulation. This
principle could be extended to cultures containing commu-
nities of two or more algal species.
This work investigated the growth of a locally isolated
strain of Micractinium inermum under autotrophic, heterotro-
phic and mixotrophic conditions. The objectives of the study
were (1) to investigate the specific growth rate ratio of
M.inermum with different organic carbon sources (2) to deter-
mine the degree of CO2 and O2 limitation in autotrophic and
heterotrophic M.inermum cultures respectively, and (3) to
investigate the capability of mixotrophic growth to reduce
these growth limitations via synergistic gas exchange be-
tween the two metabolic processes.
2. Materials and methods
2.1. Identification of the microalga
A mixotrophic green algae species was isolated from Weston
Park Pond, Sheffield, UK. Total DNA was extracted from
lyophilised cells from both mixotrophic and autotrophic cul-
tures following the procedure outlined by Chen et al. [18].
Subsequently small subunit (SSU) RNA gene sequences for
18S, ITS1, 5.8S, and ITS2 were amplified by polymerase chain
reaction (PCR) using primers detailed in Huss et al. [19] and
Hoshina and Fuiwara [20]. Purified PCR products were
sequenced (Eurofins MWG Operon) in forward and reverse
directions using cycle sequencing technology on an ABI
3730XL sequencing machine. SSU sequences were assembled
using SeqMan Pro software (12.0.0222, DNASTAR, Inc) and
compared with existing sequences on the NCBI GenBank
database via BLAST. The closest alignment match was
Micractinium inermum (NLP-F014) (accession number KF597304)
with a 99% similarity. Consequently the species was identified
as Micractinium inermum. The new sequences for the strain
used in this work were deposited in the NCBI database under
the accession number KM114868.
2.2. Growth conditions
M. inermumwas grown in 3N-BBMþ Vmedium (www.ccap.ac.
uk); with the addition of HEPES buffer (0.05 M). Initial pH was
adjusted to 6.5. For heterotrophic and mixotrophic growth
treatments, the base medium was modified with the addition
of 1.2 g l�1 (14.6 mM) sodium acetate or 1.2 g l�1 (6.67 mM) D-
glucose.
M. inermum was inoculated at 1% (v/v) from a mixotrophic
subculture into 250 ml Erlenmeyer flasks containing 100 ml of
fresh medium. Inoculum cultures were diluted to a cell
density of 5.5 � 105 ml�1. The flasks were placed in a tem-
perature controlled room (25 �C ± 2) and agitated daily.
Autotrophic and mixotrophic cultures were grown under
continuous illumination with a light intensity of
91 ± 7 mmol m�2 s�1. Heterotrophic cultures were wrapped in
foil and incubated in the dark in the 25 �C room. Experiments
investigating dissolved oxygen and inorganic carbon con-
centrations were carried out using a fed-batch approach,
replacing the extracted culture volume with fresh medium
(5 ml). All flask experiments were carried out in quintupli-
cate. In aerated experiments, cultures were grown in
specially designed 130 ml tubular air loop miniature bio-
reactors fitted with ceramic diffusers (design detailed in
Fig. S1 in the supplementary material, [21]), containing 100 ml
of medium. The cultures were grown in a temperature
controlled room (25 �C ± 2). Autotrophic cultures were
aerated under two treatments of aseptic filtered (0.22 mm) 5%
CO2 (balance air) and atmospheric air (0.04% CO2) with a flow
rate of 5 cm3 min�1. Heterotrophic cultures were aerated
under two treatments of aseptic filtered (0.22 mm) 100% N2
(0% O2) and atmospheric air (21% O2) with a flow rate of
10 cm3 min�1. Additionally, air was pumped through a
perforated silicone tube ring at the base of reactors for 1 min
every 3 h at a flow rate of 120 cc/min in order to resuspend
cells accumulated in dead zones of the reactor (Fig. S1).
Autotrophic cultures were grown under continuous illumi-
nation with a light intensity of 77 ± 9 mmol m�2 s�1. Hetero-
trophic cultures were grown in the dark. Aerated
experiments were also carried out in a fed-batch approach in
order to maintain the liquid volume in the bioreactor (1 ml
daily replacement). Aerated experiments were carried out in
quadruplicate.
2.3. Determination of biomass concentration, growth
rate and productivity
Dry weight was determined gravimetrically by oven drying
dH2O washed algal pellets at 50 �C for 24 h. Cell density was
measured using a haemocytometer as outlined in Guillard and
Sieracki [22]. Growth was monitored daily by using a UVeVis
Unicam Helios a spectrophotometer to quantify the optical
density of the culture at 600 nm (OD600). Each plastic cuvette
was agitated before a reading was taken to ensure homoge-
neous cell dispersal. Cultures were checked daily through
microscopy observation for bacterial contamination. OD600
was calibrated with cell density and dry weight for each tro-
phic condition and carbon source. Calibration equations
(Table S1), calculations of specific growth rate (m, Equation
S(1)), and maximum biomass productivity (Prmax, Equation
S(2)) are outlined in the supplementary material.
2.4. Chlorophyll analysis
Prior to analysis, cells were freeze dried for 48 h and ground
with a glass rod. Freeze dried samples were resuspended in
dH2O and sonicated for 30 s (10 kHz) followed by chlorophyll
extraction with 90% acetone as described by Jeffery and
Humphrey [23]. All analyses were carried out in biological
triplicate.
b i om a s s a n d b i o e n e r g y x x x ( 2 0 1 5 ) 1e1 4 3
Please cite this article in press as: Smith RT, et al., Synergistic carbon metabolism in a fast growing mixotrophic freshwatermicroalgal species Micractinium inermum, Biomass and Bioenergy (2015), http://dx.doi.org/10.1016/j.biombioe.2015.04.023

2.5. Dissolved inorganic carbon and dissolved oxygen
measurements
Dissolved oxygen (DO) was measured using a Thermo Scien-
tific Orion 3-Star Plus™ Dissolved Oxygen probe. A 5 ml
aliquot of culture was transferred to a magnetically stirred
10 ml flask. The probe was inserted and a stable reading was
taken at 20 �C ± 1. At the pH range of 6.5e7.5 measured during
cultivation, dissolved inorganic carbon (DIC) analysis pro-
vided a reliable measurement of the dissolved inorganic car-
bon species available for photosynthetic assimilation
including dissolved CO2 and bicarbonate. DIC was measured
using an acid stripping method adapted from Hodson et al.
[24]. A 5 ml aliquot of culture was filtered through a What-
man™ 1.2 mm glass microfiber filter to remove algae cells. The
supernatant was transferred to a closed, CO2 purged, acidi-
fying system (hand-built via a 3-Gang Luer™ Stopcock Mani-
fold connecting 4 syringes). Within the manifold a 15 ml
aliquot of air was passed through a CO2 scrubber (60 ml sy-
ringe containing 35 ml of soda lime granules) and transferred
to a syringe containing 2 ml of 3 M HCl. The mixture was then
drawn into the sample and immediately sealed. The sample
syringe was agitated for 1 min and subsequently left to stand
for 2 min. The 15 ml headspace was transferred to a dry 20 ml
syringe then injected into a PP Systems EGM4 IR CO2 gas
analyser. A stable reading was taken. The DIC was calculated
from a calibration curve using five Na2CO3 solution standards
(0, 0.125, 0.25, 0.5 and 1 mM C).
2.6. Net O2 evolution
Photosynthetic and respiration rates were determined daily
using a Hansatech Clark-type oxygen electrode connected to
a DrDaq data logger. After calibration with sodium dithion-
ite, a 2 ml aliquot of culture of known cell density was
transferred to a magnetically stirred and temperature
controlled (25 �C) electrode chamber. The net O2 evolution
was continuously monitored under illumination
(68 mmol m�2 s�1) for a 6 min period followed by 6 min in the
dark. Rate of O2 evolution/consumption under light and dark
conditions equates to rate of net photosynthesis and respi-
ration respectively. The gross photosynthesis rate was
calculated from the sum of net photosynthesis and respira-
tion, i.e., assuming that respiration rate was the same in the
light and the dark.
2.7. Statistics
All results are expressed asmean values (±standard deviation,
SD). The effect of growth conditions on measured observa-
tions (inter-treatment variation)were analysed using one-way
analysis of variances (ANOVAs) following a linear model. The
effect of time on measured observations within a growth
condition (intra-treatment variation) were analysed using
repeated measures nested ANOVA following a linear mixed
effects model (nlme package). Data that did not meet the as-
sumptions of parametric analysis were log transformed
before analysis. If analysis indicated a significant effect, the
significance of differences between growth conditions (inter-
treatment) and time points within a treatment (intra-
treatment) were measured using Tukey Honestly Significant
Differences (HSD) or Tukey Multiple Comparison using Gen-
eral Linear Hypothesis function (multicomp package) respec-
tively. All analyses were carried out with the statistical
software R v.3.1.2 [25].
3. Results
3.1. Effect of trophic mode on M. inermum growth and
chlorophyll content
The effect of organic carbon addition on the growth of M.
inermum was investigated in a non-aerated batch culture
experiment. The specific growth rate (m) and maximum
biomass productivity (Prmax) ofM. inermum under autotrophic,
mixotrophic and heterotrophic conditions are compared and
summarised in Table 1. As demonstrated in Fig. 1, growth was
strongly influenced by the addition of both acetate and
glucose (ANOVA F ¼ 1839, d.f 3,17, p < 0.001). Autotrophic
cultures grew slowly at a linear rate, achieving a specific
growth rate of 0.38 d�1± 0.04 and a Prmax of
10.55 mg l�1 d�1± 0.55. Under heterotrophic conditions M.
inermum grew exponentially at m of 0.87 d�1± 0.07 and 1.40
d�1± 0.09 for acetate and glucose respectively and achieved a
maximum productivity more than 3 fold higher than auto-
trophic cultures (Table 1). The growth rate of M. inermum
under mixotrophic conditions was significantly higher than
the sum of autotrophic and heterotrophic growth. Mixo-
trophic cultures achieved specific growth rates more than 5
fold higher and a Prmax nearly 40 fold higher than autotrophic
cultures (Table 1). In this study, the specific growth rate ratios
(Equation (1)) were 1.74 and 1.34 for acetate and glucose
respectively (Table 1).
The chlorophyll content of M. inermum cultures under
different trophic conditions were analysed during the
exponential phase of growth (Table 2). The addition of both
acetate and glucose caused a significant decrease in relative
chlorophyll production compared to the autotrophic con-
trol. This decrease was considerably greater in mixotrophic
and heterotrophic glucose supplemented cultures, which
were found to have 89% and 97% less chlorophyll (mg g�1)
respectively compared to autotrophic cultures. In order to
avoid photosynthetic limitation, acetate was used in sub-
sequent experiments rather than glucose. The other
important reason for focusing on acetate in this study is
that this carbon source is far more likely to be freely avail-
able for large scale cultivation systems, most notably in the
soluble fraction of the liquor produced by anaerobic
digesters.
The chlorophyll content of acetate supplemented mixo-
trophic and heterotrophic cultures was also analysed at the
start and end of the stationary phase. Due to slow growth,
autotrophic cultures did not reach their stationary phase and
continued to grow linearly after 70 days of cultivation; how-
ever, results are included for comparison. The chlorophyll
content of autotrophic and heterotrophic cultures did not
change significantly throughout the growth cycle. Mixo-
trophic cultures displayed the most variability over time,
initially decreasing from the exponential to initial stationary
b i om a s s a n d b i o e n e r g y x x x ( 2 0 1 5 ) 1e1 44
Please cite this article in press as: Smith RT, et al., Synergistic carbon metabolism in a fast growing mixotrophic freshwatermicroalgal species Micractinium inermum, Biomass and Bioenergy (2015), http://dx.doi.org/10.1016/j.biombioe.2015.04.023

Table 1 e Comparison of the effect of light and organic carbon on specific growth rate of mixotrophic species.
Species Growth condition Light intensity(mmols m¡2 s¡1)
Organic Carbon Aeration m (d¡1) mMmAþmH
Prmax (mg l¡1 d¡1) Source
M. inermum Autotrophic 91 None Shaken daily 0.38 ± 0.04ae 10.55 ± 0.55a* This study
“ Mixotrophic 91 NaAc (1.2 g l¡1) Shaken daily 2.18 ± 0.07be 351.50 ± 7.18b*
“
“ Heterotrophic e NaAc (1. g l¡1) Shaken daily 0.87 ± 0.07c 1.74 42.04 ± 0.40c*“
“ Mixotrophic 91 Glucose (1.2 g l¡1) Shaken daily 2.46 ± 0.04be 373.37 ± 23.10d*
“
“ Heterotrophic e Glucose (1.2 g l¡1) Shaken daily 1.40 ± 0.09e 1.37 32.70 ± 1.75e*“
H. pluvialis Autotrophic 20 None Shaken daily 0.32 e e [14]
“ Mixotrophic 20 NaAc (0.6 g l¡1) Shaken daily 0.57 e e “
“ Heterotrophic e NaAc (0.6 g l¡1) Shaken daily 0.18 1.14 e “
C. vulgaris Autotrophic 70.2 None Shaken cont. þ 2% CO2 2.64 e e [16]
“ Mixotrophic 70.2 Glucose (5 g l¡1) Shaken cont. 4.75 e e “
“ Heterotrophic e Glucose (5 g l¡1) Shaken cont. 2.35 0.95 e “
S. acutus Autotrophic 70.2 None Shaken cont. þ 2% CO2 1.46 e e “
“ Mixotrophic 70.2 Glucose (0.5 g l¡1) Shaken cont. 1.15 e e “
“ Heterotrophic e Glucose (0.5 g l¡1) Shaken cont. 0.96 0.48 e “
C. vulargis Autotrophic 150 None Shaken 0.85 ± 0.02 e e [15]
“ Mixotrophic 150 Glucose (5 g l¡1) Shaken 2.48 ± 0.09 e e “
“ Heterotrophic e Glucose (5 g l¡1) Shaken 1.08 ± 0.01 1.28 e “
“ Autotrophic 150 None Shaken þ 2% CO2 1.95 ± 0.09 e e “
“ Mixotrophic 150 Glucose (5 g l¡1) Shaken þ 2% CO2 3.16 ± 0.07 e e “
“ Heterotrophic e Glucose (5 g l¡1) Shaken þ Air 1.2 ± 0.05 1 e “
C. humicola Autotrophic 70 None None 0.21 ± 0.04 e e [17]
“ Mixotrophic 70 NaAc (0.82 g l¡1) None 1.66 ± 0.24 e e “
“ Heterotrophic e NaAc (0.82 g l¡1) None 0.78 ± 0.21 1.68 e “
Values denoted by a different letter at each data point differ significantly at p <0.01 by (*denoted log transformed) one-way ANOVA and Tukey analysis. Information in bold is from this study.
bio
mass
and
bio
energy
xxx
(2015)1e14
5
Please
citeth
isarticle
inpress
as:
Sm
ithRT,etal.,
Synergistic
carb
on
metabolism
inafast
gro
wingm
ixotro
phic
fresh
water
micro
algalsp
ecie
sMicra
ctinium
inerm
um,Biom
ass
andBioenergy(2015),http
://dx.doi.o
rg/10.1016/j.b
iom
bioe.2015.04.02
3
phase, then increasing significantly (p < 0.05) at the end sta-
tionary phase to a similar (i.e. not significantly different)
content to the 70 day old autotrophic cultures (Table 2).
3.2. Gaseous limitation in autotrophic and heterotrophic
cultures
The beneficial effects of mixotrophic gas exchange would be
apparent only if, under non-aerated flask conditions, auto-
trophic and heterotrophic growth rates are limited by CO2 and
O2 availability. In order to determine the degree of this
gaseousmass transfer limitation on the growth ofM. inermum,
cultures were grown in aerated miniature bioreactors with
different gas concentrations: autotrophic cultures were grown
under air (0.04% CO2) and 5% CO2 (balance air) aeration; ace-
tate supplemented heterotrophic cultures were aerated with
N2 (0%O2) and air (21%O2). N2 aerationwas used as a control in
heterotrophic cultures to avoid oxygenation of the culture
while mirroring the mixing effect of aeration used in the air
aerated treatment.
Autotrophic growth was significantly enhanced under
both air (m¼ 1.38d�1± 0.02, Prmax¼ 80.97mg l�1d�1
± 23.10) and
5%CO2 aeration (m¼ 2.39 d�1± 0.04, Prmax¼ 841.20mg l�1 d�1
±
86.64), as demonstrated in Fig. 2A. CO2 aeration led to a 6.3 fold
increase in m and 80 fold increase in productivity compared to
non-aerated flask cultures (Table 1). There was a significant
difference between both m (ANOVA F¼ 699.11, d.f 1,6, p < 0.001)
and Prmax (ANOVA F ¼ 287.5, d.f 1,6, p < 0.001) for air and CO2
aerated cultures.
Under heterotrophic cultivation, air aeration (21%O2) led to
49% higher m (ANOVA F ¼ 820.57, d.f 1,6, p < 0.001) and 91%
higher Prmax (ANOVA F¼ 1982.7, d.f 1,6, p < 0.001) compared to
N2 aeration (0% O2) (Fig. 2B). After 168 h growth, the dry weight
of air aerated culture peaked at 249 mg l�1. This compares to
the non-aerated heterotrophic flask culture which reached a
dry weight of 240 mg l�1 after 192 h and then continued to
grow peaking at 271 mg l�1 after 240 h (Fig. 1). The slower
growing N2 aerated culture reached 191 mg l�1 after 240 h
growth. The Prmax of air aerated cultures was 97% higher than
flask cultures (ANOVA F ¼ 224.71, d.f 1,7, p < 0.001), but sur-
prisingly the m of air aerated cultures (0.74 d�1± 0.01) was
slightly but significantly lower than that (0.87 d�1± 0.07, Table
1) recorded in heterotrophic flask cultures (ANOVA F ¼ 12.35,
d.f 1,7, p < 0.001).
3.3. Effect of trophic mode on dissolved gas
concentration, photosynthesis and respiration
In order to investigate the existence and growth effect of
mixotrophic synergistic gas exchange; the DIC concentration,
Fig. 1 e Growth curve of M. inermum under autotrophic, heterotrophic (sodium acetate or glucose) and mixotrophic (sodium
acetate or glucose) conditions. Experiment carried out in batch flask cultures. Bars represent standard deviation.
b i om a s s a n d b i o e n e r g y x x x ( 2 0 1 5 ) 1e1 46
Please cite this article in press as: Smith RT, et al., Synergistic carbon metabolism in a fast growing mixotrophic freshwatermicroalgal species Micractinium inermum, Biomass and Bioenergy (2015), http://dx.doi.org/10.1016/j.biombioe.2015.04.023

DO concentration, photosynthetic rate, and respiration rate of
cultures were analysed daily for each trophic condition over a
7 day period. In parallel, DO and DIC measurements were
taken of non-inoculated sterile medium over the course of the
experiment to give an abiotic air-equilibrated control. The
control was subject to the same experimental conditions as
autotrophic cultures. In order to avoid depleting the culture
volume, two parallel fed batch experiments were carried out:
experiment a, measuring DIC, and experiment b, measuring
DO, photosynthetic rate and respiration rate. As shown in
Fig. S2 in the supplementary material, the growth curves of
cultures in each experiment were similar, enabling a direct
comparison between results of the two experiments.
The DIC concentration in autotrophic cultures dropped
significantly below the air-equilibrated control culture within
24 h (0.008 mM C ± 0.0001). Beyond 24 h the DIC remained
relatively stable (Fig. 3). This trend was matched by an initial
small but significant accumulation of DO concentration above
the air equilibrated control after the first 24 h. Beyond this
point there was no significant difference from the control
(Fig. 4). Oxygen evolution measurements show that after 24 h
(the first measurement point) rates of autotrophic photosyn-
thesis were low and did not significantly differ throughout the
experiment (Fig. 5).
The DIC concentration in heterotrophic cultures increased
steadily over time as cell density increased, reaching
0.74mMC ± 0.01 after 7 days, compared to 0.04mMC ± 0.01 in
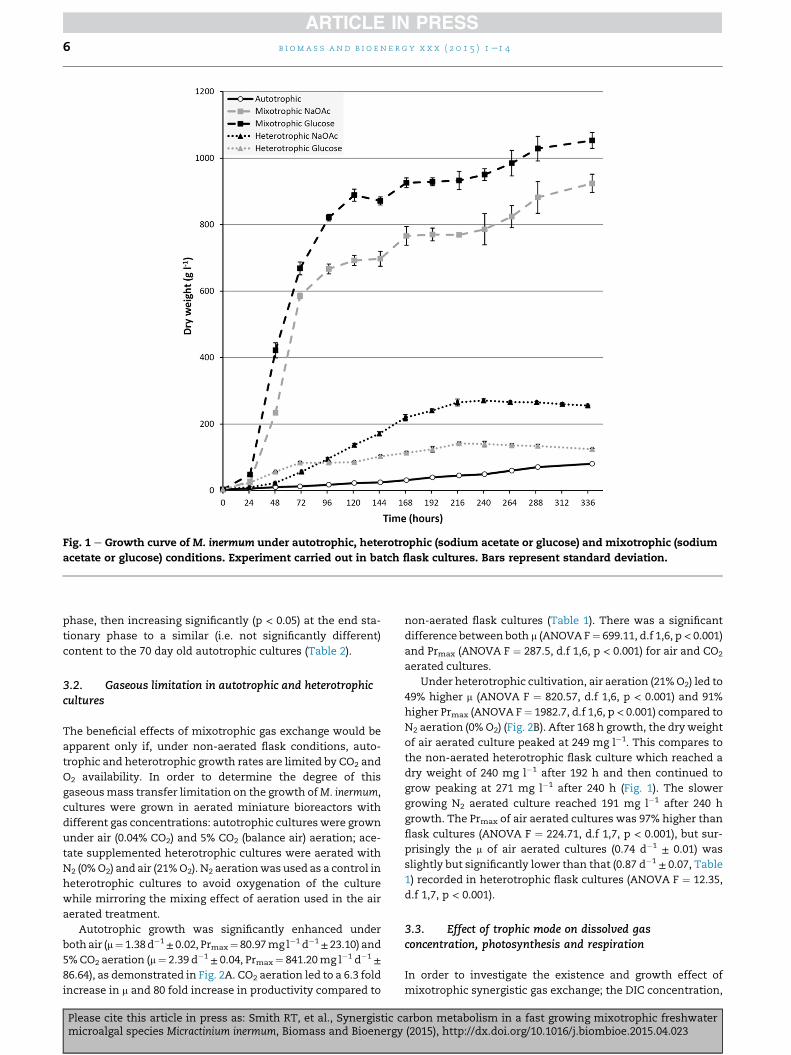
the air-equilibrated control (Fig. 3). Similarly, the DO in het-
erotrophic cultures steadily decreased over time reaching
0.06 mM O2 ± 0.008, compared to 0.27 mM ± 0.001 in the air-
equilibrated control (Fig. 4). The rates of photosynthesis and
respiration (mM O2 per mg DCW�1 min1) over the growth
period are shown in Fig. 5. Over a 48 h period respiration
significantly increased in heterotrophic cultures during a
period of exponential growth. Beyond 48 h there was a weak
decline in respiration rate, but only significant at 144 h (Fig. 5).
Despite having a significantly higher DIC, the heterotrophic
photosynthesis rate did not significantly differ from autotro-
phic cultures. After 48 h there was a statistically significant
(60%, Fig. 5) increase in the rate of photosynthesis in
Fig. 2 e A. Growth curve of autotrophic M. inermum under 0.04% (atmospheric air) and 5% CO2 (air balanced) aeration. B.
Growth curve of heterotrophic M. inermum under 0% O2 (100% N2) and 21% O2 (atmospheric air) aeration. Cultures were
grown in miniature bioreactors (100 ml volume).
Table 2 e Chlorophyll analysis of M. inermum underdifferent trophic conditions.
Total chlorophyll content(% dry cell weight)
Culture
conditions
Exponentiala Initial
StationarybEnd
Stationaryc
Autotrophic 2.53 ± 0.17A 2.44 ± 0.15A 2.29 ± 0.06AB
Mixotrophic
(Sodium acetate)
1.89 ± 0.01CD 1.65 ± 0.07C 2.03 ± 0.04BD
Heterotrophic
(Sodium acetate)
0.73 ± 0.01E 0.78 ± 0.01E 0.77 ± 0.06E
Mixotrophic
(Glucose)
0.28 ± 0.02F ND ND
Heterotrophic
(Glucose)
0.064 ± 0.01G ND ND
Values denoted by a different upper case letter at each data point
differ significantly at p < 0.05 by log transform. ND represents data
not determined.a Expontential phase e samples taken after 2 days (mixotrophic
and heterotrophic glucose), 3 days (heterotrophic acetate) and (21
days autotrophic).b Initial stationary phase e samples taken after 4 days (mixo-
trophic), 8 days (heterotrophic), 28 days (autotrophic). By this point
mixotrophic and heterotrophic growth was limited by availability
of acetate but autotrophic cultures were still growing (and unlikely
to be nutrient limited).c End stationary phase e samples taken after 49 days (mixotrophy
and heterotrophy), 70 days (autotrophy). By this point autotrophic
cultures were still not at a stationary phase.
b i om a s s a n d b i o e n e r g y x x x ( 2 0 1 5 ) 1e1 4 7
Please cite this article in press as: Smith RT, et al., Synergistic carbon metabolism in a fast growing mixotrophic freshwatermicroalgal species Micractinium inermum, Biomass and Bioenergy (2015), http://dx.doi.org/10.1016/j.biombioe.2015.04.023

heterotrophic cultures, this remained relatively stable
throughout the experiment despite continually rising DIC.
As demonstrated in Figs. 3 and 4, mixotrophic cultures
showed significant variability in both dissolved gas concen-
trations throughout the experiment. After 48 h both the DIC
and DO concentration in mixotrophic cultures increased
significantly (Figs. 3 and 4). DIC concentration in mixotrophic
cultures was 4.9 and 32.7 times higher than the air-
equilibrated control and autotrophic cultures respectively.
Similarly, the DO concentration in mixotrophic cultures was
1.6 and 2.4 times higher than the air-equilibrated control and
heterotrophic cultures respectively. The substantial increase
in dissolved gases was synchronous with significantly
enhanced rates of both photosynthesis and respiration (Fig. 5).
At 48 h the average rate of photosynthesis per mg DCW was
3.9 times higher than autotrophic cultures. Similarly, average
respiration rates were 2.7 times higher than heterotrophic
cultures.
Over the next 24 h both DO and DIC concentrations of the
mixotrophic cultures increased further (Figs. 3 and 4). Despite
the increase in DIC concentration, between 48 and 72 h
respiration was reduced by a factor of 5.7 (Fig. 5). Photosyn-
thetic activity also significantly decreased, although still
remaining 2.27 times higher than autotrophic cultures (Fig. 5).
Beyond 72 h there was significant decline in both DIC and DO
concentration to levels just above saturation (Figs. 3 and 4).
Fig. 3 e DIC concentration (mM C) of M.inermum cultures under different trophic conditions. Values denoted by a different
letter at each data point differ significantly at p < 0.05. Uppercase letters correspond to significance between treatments
within time points, analysis was performed by one-way ANOVA followed by Tukey analysis, Lowercase letters correspond
to significance between time points within treatments, analysis was performed by repeated measures nested ANOVA and
Tukey analysis. Data was log transformed for intra-treatment statistical analysis.
b i om a s s a n d b i o e n e r g y x x x ( 2 0 1 5 ) 1e1 48
Please cite this article in press as: Smith RT, et al., Synergistic carbon metabolism in a fast growing mixotrophic freshwatermicroalgal species Micractinium inermum, Biomass and Bioenergy (2015), http://dx.doi.org/10.1016/j.biombioe.2015.04.023

The decline in DIC and DO was mirrored by gradually
decreasing rates of respiration and photosynthesis (Fig. 5).
4. Discussion
Two major constraints to the commercialisation of micro-
algae biofuels are high production costs and availability of
concentrated CO2 [11]. Mixotrophic cultivation through the
supplementation of waste organic carbon sources is a prom-
ising strategy to significantly increase productivity [26].
Results from previous studies demonstrated that under non-
aerated conditions the specific growth rate of mixotrophic
cultures is higher than the sum of autotrophic and hetero-
trophic growth (Table 1)[15]. This additional growth is not
apparent when autotrophic and heterotrophic cultures are
aerated. In this study, a locally isolated strain of chlorella like
green algae M. inermum showed a similar pattern of growth,
mixotrophic cultures supplemented with acetate or glucose
had a specific growth rate 1.74 and 1.37 times the sum of
autotrophic and heterotrophic growth respectively under
non-aerated conditions (Fig. 1, Table 1).
Fig. 4 e DO concentration (mM O2) of M. inermum cultures under different trophic conditions. Values denoted by a different
letter at each data point differ significantly at p < 0.05. Uppercase letters correspond to significance between treatments
within time points, analysis was performed by one-way ANOVA followed by Tukey analysis, Lowercase letters correspond
to significance between time points within treatments, analysis was performed by repeated measures nested ANOVA and
Tukey analysis. Data was log transformed for intra-treatment statistical analysis.
b i om a s s a n d b i o e n e r g y x x x ( 2 0 1 5 ) 1e1 4 9
Please cite this article in press as: Smith RT, et al., Synergistic carbon metabolism in a fast growing mixotrophic freshwatermicroalgal species Micractinium inermum, Biomass and Bioenergy (2015), http://dx.doi.org/10.1016/j.biombioe.2015.04.023

The faster growth rates found in glucose supplemented
cultures are consistent with previous studies and this pref-
erence can be attributed to the higher energy content
(2.8 kJ mol�1) compared to acetate (0.8 kJ mol�1) [27]. Chloro-
phyll analysis of the cultures under different trophic condi-
tions revealed a significant reduction in chlorophyll content in
both the mixotrophic and heterotrophic glucose supple-
mented cultures. Stadnichuk et al. [28] reported that, amongst
other physiological changes, glucose inhibits the biosynthesis
of chlorophyll a in the red alga Galdieria sulfuraria by partially
blocking the transformation of a precursor molecule cop-
roporphyrin III. This synthesis inhibition is reduced under
mixotrophic conditions as light stimulates the production of
coproporphyrin III [28]. While many studies have reported
reduced chlorophyll content in glucose supplemented cul-
tures, the degree of chlorophyll synthesis reduction varies
substantially between species and strains [16,26,28]. In
Micractinium inermum the large reduction in chlorophyll
content in glucose supplemented cultures is likely to have
reduced photosynthetic efficiency, which provides a reason-
able explanation for the reduced specific growth rate ratio
compared to acetate supplemented growth. This point high-
lights the large variability in physiological changes caused by
supplementation of different organic carbon sources.
It was hypothesised that the enhanced growth rate under
mixotrophic conditions was due to synchronous activity of
the respiratory and photosynthetic metabolic components.
These components could act synergistically, providing a
source of endogenic CO2 and O2 which in turn reduces growth
limitation and thus enhances growth. Firstly, in order to
confirm that the growth of the, previously uncharacterised,M.
inermum was limited by the availability of CO2 and O2
respectively, cultures were grown under aerated conditions
(Fig. 2A and B). Significant increases in the growth rate of
autotrophic cultures under both air and 5% CO2 (balance air)
aeration clearly demonstrates that availability of DIC is a key
Fig. 5 e Photosynthesis and respiration rates (mM O2 mg DCW¡1 min¡1) of M.inermum under autotrophic, heterotrophic
(sodium acetate) and mixotrophic (sodium acetate) conditions. Values denoted by a different letter at each data point differ
significantly at p < 0.05. Uppercase letters correspond to significance between treatments within time points, analysis was
performed by one-way ANOVA followed by Tukey analysis, Lowercase letters correspond to significance between time
points within treatments, analysis was performed by repeated measures nested ANOVA and Tukey analysis. Mixotrophic
intra-treatment data was log transformed to meet the assumptions of statistically analysis.
b i om a s s a n d b i o e n e r g y x x x ( 2 0 1 5 ) 1e1 410
Please cite this article in press as: Smith RT, et al., Synergistic carbon metabolism in a fast growing mixotrophic freshwatermicroalgal species Micractinium inermum, Biomass and Bioenergy (2015), http://dx.doi.org/10.1016/j.biombioe.2015.04.023

limiting factor for growth in autotrophic M. inermum culture
(Fig. 2A). This phenomenon is well understood and is consis-
tent with previous work investigating the effect of DIC con-
centration on growth of other algae species [29,30].
In contrast to autotrophic growth, previous studies have
shown that in heterotrophic microalgae cultivation oxygen
supply is a key limiting factor [27,31] as would certainly be
expected. In this study air aerated cultures had a significantly
higher specific growth rate when compared to N2 sparged
cultures. The peak and subsequent decline in biomass con-
centration of air-aerated cultures after 168 h of growth was
likely to be due to acetate depletion (Fig. 2B). A similar pattern
of decline occurred in both acetate and glucose supplemented
cultures in the flask experiment (Fig. 1). Surprisingly, although
the N2 sparged cultures had slower growth than the air
aerated treatment, the cultures still reached a relatively high
biomass concentration (Fig. 2B). Dissolved oxygen measure-
ments of the aerated cultures (Fig. S3 in the supplementary
data) indicated that the slow flow rate of the N2 aeration did
not lead to oxygen stripping, but followed a pattern similar to
that found in flask cultures (Fig. 4). The limited oxygen strip-
ping in the N2 aerated control culture was mostly likely due to
a combination of low flow rate (10 cm3 min�1) and the inter-
mittent high flux of air used to resuspend cells accumulated in
the dead zones of the reactor. Rather than comprising the
conditions of the control this slow oxygen limitation
mimicked the growth conditions of the flask culture more
closely than a control with immediate oxygen stripping.
Despite this similarity, both aerated treatments had a lower
specific growth rate than acetate supplemented non-aerated
flask cultures. Given the high ambient concentrations of dis-
solved oxygen, the growth during the early log phase would
not be expected to be significantly elevated or depressed due
to the treatment conditions. Both aerated cultures had a more
pronounced lag period in the first 24 h of growth than the
equivalent flask culture, it is possible this differencemay have
been due to different inoculum and culture conditions used
(constantly mixed air loop reactors rather than flasks).
Consequently it is difficult to draw strong conclusions based
on data from the early log phase of growth (i.e specific growth
rate). Nethertheless, enhanced productivity during later
stages of growth in the air-aerated cultures indicates that
oxygen availability is a limiting factor in heterotrophic growth
of M. inermum but to a greater degree at higher cell densities.
Comparatively, O2 limitation in heterotrophs is small relative
to CO2 limitation in autotrophic cultivation, which is expected
due to the ambient concentration of gases. Therefore, the ef-
fect of any mixotrophic gas exchange is likely to enhance
photosynthetic activity to a greater degree than respiration,
especially at low cell densities.
Finally, in order to test the hypothesis of synergistic gas
exchange in mixotrophic cultures the DIC concentration, DO
concentration and rates of photosynthesis and respiration
weremeasured in autotrophic,mixotrophic and heterotrophic
cultures. It was expected that during the growth period the
DIC concentration would increase in heterotrophic cultures
but decline in autotrophic cultures. The reverse was expected
for the DO concentration. This pattern would result in
increasing limitation on photosynthesis and respiration for
autotrophic and heterotrophic cultures respectively. In
contrast, withinmixotrophic cultures it was expected that the
activity of both metabolic pathways would lead to relatively
more stable concentrations of both DIC and DO.
The results show that autotrophic and heterotrophic cul-
tures largely followed the predicted trend. Autotrophic cul-
tures quickly became depleted in DIC and remained at a stable
low level (Fig. 3). It is likely that the photosynthetic con-
sumption of DIC by the autotrophic algae was met by mass
transfer of CO2 into the culture (once below equilibrium
levels). The depletion in DIC was matched with no significant
accumulation of DO and a low level of photosynthesis (Figs. 4
and 5). These data support the conclusions of the previous
section, that photosynthesis in non-aerated autotrophic
M.inermum cultures is significantly limited by the availability
of DIC.
As predicted in heterotrophic cultures the metabolism of
acetate led to a significant accumulation of DIC and depletion
of DO (Figs. 3 and 4). After an initial significant increase in
respiration, there was slight decline (although only significant
at 144 h) in the rate of respiration (Fig. 5). Whilst the decline
does support the hypothesis of oxygen limitation, given the
disparately pronounced depletion of dissolved oxygen, strong
conclusions cannot be made from this data. The limited
photosynthetic rate in heterotrophic cultures despite a high
concentration of DIC is likely to be due to a combination of low
photosynthetic efficiency due to low level of cellular chloro-
phyll and the short period of photosynthesis induction (cul-
tures only exposed to light for 6 min during oxygen evolution
measurements) [32,33].
In contrast to the expected stability, mixotrophic cultures
showed the most variability in DIC and DO concentration.
This variability reflects the rapid growth of mixotrophic cul-
tures during a short log phase, followed by depletion of ace-
tate and a gradual acclimation to autotrophic conditions. This
trend is supported by the increased chlorophyll content dur-
ing the stationary phase of growth (Table 2). The substantial
increases in dissolved gases during log growth (first 48 h) were
synchronous with significantly enhanced rates of both
photosynthesis and respiration. This correlation strongly in-
dicates that themixotrophic endogenic production of CO2 and
O2 significantly stimulated metabolic activity.
In contrast to the weak trend found in heterotrophic cul-
tures, these data indicate that respiration is significantly
increased under conditions of high oxygen concentrations.
This trend is supported by the significantly higher productiv-
ity found in the air-aerated heterotrophic relative to the con-
trol and non-aerated flask culture (Fig. 2B). Previous studies on
species within the closely related Chlorella genus, have shown
that DCMU addition (an inhibitor of electron transport from
PSII to PSI) to mixotrophic cultures reduces growth and
respiration rates to heterotrophic values [13,15]. However,
because of the difficulty of separating rates of active photo-
synthesis and respiration under illumination in oxygen elec-
trode experiments, these studies do not give any indication on
the impact of photosynthesis or illumination on the efficiency
of acetate assimilation and metabolism. Consequently it is
possible that the augmented respiration rates in mixotrophic
cultures could be influenced by light rather than or in addition
to oxygen concentration. Further research is needed before
strong conclusions about the effect of illumination and
b i om a s s a n d b i o e n e r g y x x x ( 2 0 1 5 ) 1e1 4 11
Please cite this article in press as: Smith RT, et al., Synergistic carbon metabolism in a fast growing mixotrophic freshwatermicroalgal species Micractinium inermum, Biomass and Bioenergy (2015), http://dx.doi.org/10.1016/j.biombioe.2015.04.023

oxygen availability on the respiration, acetate uptake and
growth of M.inermum can be made.
The synchronous increase of both dissolved gases appears
paradoxical as one would expect either a dominance of one
metabolic pathway causing accumulation of inorganic car-
bon and depletion of oxygen or vice versa. However as
demonstrated in Fig. 6, showing the % change in both DIC
and DO per unit of biomass, the accumulation of both gases
can be explained by shifting dominance of the contrasting
metabolic pathways during the initial growth period. Over
the first 24 h accumulation of DO and decline in DIC con-
centration indicates net autotrophic growth (Fig. 6). Beyond
this point, the DIC, DO and oxygen evolution measurements
indicate rapidly increasing rates of respiration, accumulation
of DIC and reduction in the rate of oxygen accumulation per
unit of biomass (Figs. 5 and 6). This initial photosynthetic
dominance suggests a lag phase in the expression of en-
zymes involved in the metabolism of acetate. Such a
phenomenon has been reported in Chlorella sorokiniana,
where increasing acetate concentration led to a longer lag
period of growth [34]. This phenomenon has been reproduced
in M. inermum (Fig. S4, in the supplementary data). It is
possible that this pattern reflects an increase in light limita-
tion and a shift to a heterotrophic pathway, however given
the relatively low cell density during the second day of
growth this explanation is unlikely (Fig. S2). Although the
rapid production of CO2 fuelled an increase in the rate of
photosynthesis, allowing the mixotrophic cultures to remain
net autotrophic (Fig. 5), it is possible that CO2 production
exceeded the rate at which it could be sequestered via the
CalvineBenson cycle, leading to DIC accumulation and
diffusion into the media [35]. Alternatively, even if the rate of
sequestration met the rate of production, high levels of CO2
and O2 production at different sites within the cell (mito-
chondria and chloroplast) may have led to a diffusive loss
from the cell into the media. Again the dynamics of this gas
Fig. 6 e Change (%) per mg DCW in DIC and DO concentration (from original values) of M.inermum cultures under different
trophic conditions. Bars represent standard deviation.
b i om a s s a n d b i o e n e r g y x x x ( 2 0 1 5 ) 1e1 412
Please cite this article in press as: Smith RT, et al., Synergistic carbon metabolism in a fast growing mixotrophic freshwatermicroalgal species Micractinium inermum, Biomass and Bioenergy (2015), http://dx.doi.org/10.1016/j.biombioe.2015.04.023

exchange deserves more in depth research before any strong
conclusions can be made.
At 72 h both DO and DIC concentrations of themixotrophic
culture increased further (Figs. 3 and 4). Despite the increase
in DIC, between 48 and 72 h respiration was reduced by a
factor of 5.7 (Fig. 5). This disparity can be explained by the fact
that the oxygen evolution measurements represent a snap
shot at that time, rather than the more cumulative effect
represented by dissolved gas measurements. The decline in
respiration was synchronous with the end of exponential
growth andwas followed by a sudden drop in both DIC andDO
within 24 h (Figs. 3 and 4), indicating that acetate was
exhausted from the medium. Given the significantly elevated
respiratory activity at 48 h in high DIC, it is unlikely that high
DIC concentration limited heterotrophic respiration as previ-
ously reported in Chlorella protothecoides and Nannochloropsis
salina [36]. Despite the peak in DIC concentration, at 72 h
photosynthetic activity also significantly decreased, although
still remaining 2.27 times higher than autotrophic cultures
(Fig. 5). Given the four fold increase in cell density, it is prob-
able that, at this point, self-shading induced light limitation
prevented maximum rates of photosynthesis [37].
Although the pattern of dissolved gas concentrations did
not follow the predicted stability in mixotrophic cultures, if
measurements given in Figs. 3 and 4 are standardised to a per
mg DCW basis, the percentage change in DIC in mixotrophic
cultures after 48 h (from initial value) were nearly 5 times less
than the change observed in heterotrophic cultures (Fig. 6).
Correspondingly, at 24 h the percentage change in DO in
autotrophic cultures were only 25% lower than mixotrophs,
despite autotrophs being significantly limited by DIC avail-
ability. The apparent ability of mixotrophic metabolic activity
to stabilise DO concentrations relative to autotrophic growth
may provide important additional benefits in reducing
photorespiration and photoinhibition induced by oxygen
accumulation [38,39].
5. Conclusion
In summary, acetate-fed mixotrophic Micractinium inermum
cultures were found to have a specific growth rate 1.74 times
the sum of autotrophic and heterotrophic growth under non-
aerated condition. Changes in DIC, DO and rates of photo-
synthesis and respiration were tracked in autotrophic, mixo-
trophic and heterotrophic M. inermum cultures over a 7 day
growth period. The significantly enhanced metabolic activity,
augmented growth rates and comparative stability of dis-
solved gas concentrations support the hypothesis of syner-
gistic gas exchange between photosynthetic and respiratory
metabolic pathways within mixotrophic cultures. The data
provide strong evidence that endogenic production of CO2
significantly reduces inorganic carbon limitation of photo-
synthetic activity. In addition, the results provide some, albeit
weaker, evidence for increased respiratory activity through
photosynthetic production of O2. Further work is needed to
elucidate whether enhancedmixotrophic respiration is due to
reduced oxygen limitation or greater efficiency of acetate
metabolism under illuminated conditions in M. inermum.
Endogenic production of CO2 in particular could remove or
reduce the costs of aeration in large scale production systems
and importantly reduce reliance on limited sources of
concentrated CO2. In addition, the consumption of photo-
synthetically derived O2 by enhanced respiration in mixo-
trophic cultures could reduce oxygen stripping costs
associated with autotrophic microalgae production systems.
Thiswork has also highlighted that the benefits ofmixotrophy
are very dependent on the species and organic carbon com-
pound utilised. Sustainable mixotrophic growth requires the
use of waste organics, consequently further research is
required to investigate whether the benefits of synergistic gas
exchange can be realised with other organic carbon sources
typically found in waste streams suitable for algal growth.
Acknowledgements
We thank Professor Andrew Hodson for help with DIC anal-
ysis. The researchwas funded by the Engineering and Physical
Sciences Research Council (EPSRC) (grant number EP/G037477/
1) and carried out as part of the E Futures DTC at theUniversity
of Sheffield.
Appendix A. Supplementary data
Supplementary data related to this article can be found at
http://dx.doi.org/10.1016/j.biombioe.2015.04.023.
r e f e r e n c e s
[1] Chisti Y. Biodiesel from microalgae. Biotechnol Adv2007;25:294e306.
[2] Chisti Y. Biodiesel from microalgae beats bioethanol. TrendsBiotechnol 2008;26:126e31.
[3] Brennan L, Owende P. Biofuels from microalgaedA review oftechnologies for production, processing, and extractions ofbiofuels and co-products. Renew Sustain Energy Rev2010;14:557e77.
[4] Liu J, Mukherjee J, Hawkes JJ, Wilkinson SJ. Optimization oflipid production for algal biodiesel in nitrogen stressed cellsof Dunaliella salina using FTIR analysis. J Chem TechnolBiotechnol 2013;88:1807e14.
[5] Liang Y, Sarkany N, Cui Y. Biomass and lipid productivities ofChlorella vulgaris under autotrophic, heterotrophic andmixotrophic growth conditions. Biotechnol Lett2009;31:1043e9.
[6] Bjornsson WJ, Nicol RW, Dickinson KE, McGinn PJ. Anaerobicdigestates are useful nutrient sources for microalgaecultivation: functional coupling of energy and biomassproduction. J Appl Phycol 2013;25:1523e8.
[7] Boyle NR, Morgan JA. Flux balance analysis of primarymetabolism in Chlamydomonas reinhardtii. BMC Syst Biol2009;3:4.
[8] Moon M, Kim CW, Park W-K, Yoo G, Choi Y-E, Yang J-W.Mixotrophic growth with acetate or volatile fatty acidsmaximizes growth and lipid production in Chlamydomonas
reinhardtii. Algal Res 2013;2:352e7.[9] Hunter-Cevera J, Boussiba S, Cuello J, Duke C, Efroymson R,
Golden S, et al. Sustainable development of algal biofuels inthe United States: committee on the sustainable
b i om a s s a n d b i o e n e r g y x x x ( 2 0 1 5 ) 1e1 4 13
Please cite this article in press as: Smith RT, et al., Synergistic carbon metabolism in a fast growing mixotrophic freshwatermicroalgal species Micractinium inermum, Biomass and Bioenergy (2015), http://dx.doi.org/10.1016/j.biombioe.2015.04.023
development of algal biofuels; Board on agriculture andnatural resources; Board on energy and environmentalsystems; Division on earth and life studies; Division onengineering and physical sciences; National research council.Washington, D.C: The National Academies Press; 2012.
[10] Pate R, Klise G, Wu B. Resource demand implications for USalgae biofuels production scale-up. Appl Energy2011;88:3377e88. http://dx.doi.org/10.1016/j.apenergy.2011.04.023.
[11] Chisti Y. Constraints to commercialization of algal fuels. JBiotechnol 2013;167:201e14.
[12] Lee YK. Algal Nutrition. Hetertrophic carbon nutrition. In:Richmond A, editor. Handb. Microalgal Cult. Biotechnol.Appl. Phycol. 1st ed. Oxford, UK: Blackwell Publishing Ltd;2004. p. 116.
[13] Endo H, Sansawa H, Nakajima K. Studies on Chlorella
regularis, heterotrophic fast-growing strain II. Mixotrophicgrowth in relation to light intensity and acetateconcentration. Plant Cell Physiol 1977;18:199e205.
[14] Kobayashi M, Kakizono T, Yamaguchi K, Nishio N, Nagai S.Growth and astaxanthin formation of Haematococcus pluvialis
in heterotrophic and mixotrophic conditions. J FermentBioeng 1992;74:17e20.
[15] Martinez F, Orus MI. Interactions between glucose andinorganic carbon metabolism in Chlorella vulgaris strain UAM101 1. Plant Physiol 1991;95:1150e5.
[16] Ogawa T, Aiba S. Bioenergetic analysis of mixotrophicgrowth in Chlorella vulgaris and Scenedesmus acutus.Biotechnol Bioeng 1981;23:1121e32.
[17] Lalibert�e G, de la Nouie J. Auto-, Hetero-, and mixotrophicgrowth of Chlamydomonas humicola (cmloroimiyckak) onacetate. J Phycol 1993;29:612e20.
[18] Chen Y, Wang Y, Sun Y, Zhang L, Li W. Highly efficientexpression of rabbit neutrophil peptide-1 gene in Chlorellaellipsoidea cells. Curr Genet 2001;39:365e70.
[19] Huss VAR, Frank C, Hartmann EC, Hirmer M, Kloboucek A,Seidel BM, et al. Biochemical Taxonomy and Molecularphylogeny of the genus Chlorella Sensu Lato (Chlorophyta). JPhycol 1999;35:587e98.
[20] Hoshina R, Fujiwara Y. Molecular characterization ofChlorella cultures of the National Institute for EnvironmentalStudies culture collection with description of Micractinium
inermum sp. nov., Didymogenes sphaerica sp. nov., andDidymogenes soliella sp. nov. (Chlorellaceae,Trebouxiophyceae). Phycol Res 2013;61:124e32.
[21] Bangert K. Photobioreactor modelling and development ofmethods for optimisation of microalgae biodieselproduction. University of Sheffield; 2013. Doctoral Thesis.
[22] Guillard R, Sieracki M. Counting cells in cultures with thelight Microscope. In: Andersen RA, editor. Algal Cult. Tech. ,San Francisco: Academic Press Inc; 2005. p. 281.
[23] Jeffrey S, Humphrey G. New spectrophotometric equationsfor determining chlorophylls a, b, c1 and c2 in higher plants,algae and natural populations. Biochem Physiol Pflanz1975;167:191e4.
[24] Hodson A, Cameron K, Boggild C, Irvine-Fynn T, Langford H,Pearce D, et al. The structure, biological activity andbiogeochemistry of cryoconite aggregates upon an Arcticvalley glacier: Longyearbreen Svalbard. J Glaciol2010;56:349e62.
[25] R Development Core Team. R: a language and environmentfor statistical computing. Vienna, Austria: R Foundation forStatistical Computing; 2005.
[26] Cheirsilp B, Torpee S. Enhanced growth and lipid productionof microalgae under mixotrophic culture condition: effect oflight intensity, glucose concentration and fed-batchcultivation. Bioresour Technol 2012;110:510e6.
[27] Perez-Garcia O, Escalante FME, de-Bashan LE, Bashan Y.Heterotrophic cultures of microalgae: metabolism andpotential products. Water Res 2011;45:11e36.
[28] Stadnichuk IN, Rakhimberdieva MG, Bolychevtseva YV,Yurina NP, Karapetyan NV, Selyakh IO. Inhibition by glucoseof chlorophyll a and phycocyanobilin biosynthesis in theunicellular red alga Galdieria partita at the stage ofcoproporphyrinogen III formation. Plant Sci 1998;136:11e23.
[29] Chiu S-Y, Kao C-Y, Chen C-H, Kuan T-C, Ong S-C, Lin C-S.Reduction of CO2 by a high-density culture of Chlorella sp. in asemicontinuous photobioreactor. Bioresour Technol2008;99:3389e96.
[30] Yang Y, Gao K. Effects of CO2 concentrations on thefreshwater microalgae, Chlamydomonas reinhardtii, Chlorellapyrenoidosa and Scenedesmus obliquus (Chlorophyta). J ApplPhycol 2003;15:379e89.
[31] Schmidt RA, Wiebe MG, Eriksen NT. Heterotrophic high cell-density fed-batch cultures of the phycocyanin-producing redalga Galdieria sulphuraria. Biotechnol Bioeng 2005;90:77e84.
[32] MacIntyre HL, Kana TM, Anning T, Geider RJ.Photoacclimation of photosynthesis irradiance responsecurves and photosynthetic pigments in microalgae andcyanobacteria. J Phycol 2002;38:17e38.
[33] Vernotte C, Picaud M, Kirilovsky D, Olive J, Ajlani G, Astier C.Changes in the photosynthetic apparatus in thecyanobacterium Synechocystis sp. PCC 6714 following light-to-dark and dark-to-light transitions. Photosynth Res1992;32:45e57.
[34] Qiao H, Wang G, Liu K, Gu W. Short-term effects of acetateand microaerobic conditions on photosynthesis andrespiration in Chlorella sorokiniana Gxnn 01 (chlorophyta)1. JPhycol 2012;48:992e1001.
[35] Dietz K-J, Heber U. Rate-limiting factors in leafphotosynthesis. I. Carbon fluxes in the calvin cycle. BiochimBiophys Acta BBA Bioenerg 1984;767:432e43.
[36] Sforza E, Cipriani R, Morosinotto T, Bertucco A,Giacometti GM. Excess CO2 supply inhibits mixotrophicgrowth of Chlorella protothecoides and Nannochloropsis salina.Bioresour Technol 2012;104:523e9.
[37] Richmond A. Biological principles of mass cultivation ofphotoautotrophic microalgae. In: Richmond A, Hu Q, editors.Handb. Of Microalgal Cult. Biotechnol. Appl. Phycol. 2nd ed.Oxford, UK: Blackwell Publishing Ltd; 2013. p. 173.
[38] Mouget J-L, Dakhama A, Lavoie MC, de la Noue J. Algalgrowth enhancement by bacteria: is consumption ofphotosynthetic oxygen involved? FEMS Microbiol Ecol1995;18:35e43.
[39] Torzillo G, Bernardini P, Masojıdek J. On-line monitoring ofchlorophyll fluorescence to Assess the extent ofphotoinhibition of photosynthesis induced by high oxygenconcentration and low temperature and its effect on theproductivity of outdoor cultures of Spirulina platensis
(Cyanobacteria). J Phycol 1998;34:504e10.
b i om a s s a n d b i o e n e r g y x x x ( 2 0 1 5 ) 1e1 414
Please cite this article in press as: Smith RT, et al., Synergistic carbon metabolism in a fast growing mixotrophic freshwatermicroalgal species Micractinium inermum, Biomass and Bioenergy (2015), http://dx.doi.org/10.1016/j.biombioe.2015.04.023
Copyright © 2022 FDOKUMEN