SYNDICATE - MOP Vaishnav College
69
VOLUME 17 ISSN 2278-8247 MARCH-2017 CONTENTS A Study on Self-Concept of Students Studying in 01 Colleges in Kanchipuram District – An empirical Study Dr. S. Subbulakshmi Impact of Globalization on Business Environment- 08 Challenges for Human Resource Management Prof. Dr. Malay Ghosh, Prof. Alpa Ghosh Employees Preference on Digital Wallet in Chennai City 13 Dr. P. Barani Kumari An Economical Impact among the Women Self-Help Group 19 through Micro- Credit in Commercial Banks in Tamilnadu Dr. Chitra, Ms. S.Niranjana Devi A Review on Corporate Social Responsibility with 33 Special Reference to Procter and Gamble Company, India Ms.P. Suganya Devi Measurement of Productivity in Non Banking Financial 39 Companies in Tamilnadu Dr. D. Venkadesh A Study on Human Resource Practices in Rane 50 Engine Valves Limited at Chennai Dr. K. Selvi Enhancement of Customer Service Quality in the Banking Sector 57 Dr.A.Sujatha , Ms.C.Chitra Published by M.O.P. VAISHNAV COLLEGE FOR WOMEN (AUTONOMOUS) CHENNAI-600 034 SYNDICATE The Journal of Management
-
Upload
khangminh22 -
Category
Documents
-
view
3 -
download
0
Transcript of SYNDICATE - MOP Vaishnav College

VOLUME 17 ISSN 2278-8247 MARCH-2017
CONTENTS
A Study on Self-Concept of Students Studying in 01
Colleges in Kanchipuram District – An empirical Study
Dr. S. Subbulakshmi
Impact of Globalization on Business Environment- 08
Challenges for Human Resource Management Prof. Dr. Malay Ghosh, Prof. Alpa Ghosh
Employees Preference on Digital Wallet in Chennai City 13 Dr. P. Barani Kumari
An Economical Impact among the Women Self-Help Group 19
through Micro- Credit in Commercial Banks in Tamilnadu
Dr. Chitra, Ms. S.Niranjana Devi
A Review on Corporate Social Responsibility with 33
Special Reference to Procter and Gamble Company, India
Ms.P. Suganya Devi
Measurement of Productivity in Non Banking Financial 39
Companies in Tamilnadu
Dr. D. Venkadesh
A Study on Human Resource Practices in Rane 50
Engine Valves Limited at Chennai
Dr. K. Selvi
Enhancement of Customer Service Quality in the Banking Sector 57
Dr.A.Sujatha , Ms.C.Chitra
Published by
M.O.P. VAISHNAV COLLEGE FOR WOMEN (AUTONOMOUS)
CHENNAI-600 034
SYNDICATE The Journal of Management

SYNDICATE - The Journal of Management
[ VOLUME 17, MARCH 2017 ISSN: 2278-8247 ]
EDITORIAL BOARD
Dr. Lalitha Balakrishnan Editor-in-Chief and Principal,
M.O.P. Vaishnav College for Women (Autonomous), Chennai, India
ADVISORY BOARD MEMBERS
Dr. Irene Samanta Dr. T. Mallikarjunappa Asst. Professor of International Marketing, Professor,
Piraeus University of Applied Sciences (TEI of Piraeus) Department of Business Administration
Greece Mangalore University, India
EDITORIAL BOARD MEMBERS
Dr. Fernandes Jeyashree Felix Dr. K.C. Sumangala Dean Academics and Head Associate Professor Department of Mathematics Department of Commerce (Honours)
M.O.P. Vaishnav College for Women M.O.P. Vaishnav College for Women
Dr. K.B. Priya Iyer Dr. Chitra Dey Associate Professor Asst. Professor Department of Computer Science Department of Business Administration M.O.P. Vaishnav College for Women M.O.P. Vaishnav College for Women
EDITORIAL OFFICE
DEPARTMENT OF BUSINESS ADMINISTRATION
M.O.P. Vaishnav College for Women( Autonomous ) #20, IV Lane, Nungambakkam High Road, Chennai 600 034 Tel: (044) 28330262, 28330677 Telefax: (044) 28330385
Website: www.mopvc.edu.in, Email: [email protected]

FROM THE EDITOR’S DESK
M.O.P. Vaishnav College, in its Silver Jubilee Year launched a Centre of
Excellence. It also laid emphasis on developing a research culture through projects
and publications.
Research comprises "creative work undertaken on a systematic basis in order to
increase the stock of knowledge, including knowledge of humans, culture and
society, and the use of this stock of knowledge to devise new applications".
At MOP research receives the desired impetus and the articles received are peer
reviewed before being published. This year the selected articles focus on Self-
Concept, Challenges for Human Resource Management, Employees
Preference, Women Self-Help Group, Corporate Social Responsibility and
Measurement of Productivity.
The Editorial Board is interested in new ideas, new expressions and innovative
research.
Dr. Lalitha Balakrishnan Editor-in-Chief and Principal
M.O.P. Vaishnav College for Women(Autonomous)
Chennai

SYNDICATE - The Journal of Management
Volume 17, March 2017, ISSN 2278-8247
1
A STUDY ON SELF CONCEPT OF STUDENTS STUDYING IN
COLLEGES IN KANCHIPURAM DISTRICT- AN EMPIRICAL STUDY
Dr.S.Subbulakshmi,
Associate Professor, P.G.Department of Commerce, S.D.N.B.Vaishnav College for Women
.
“The first step to improving anything, especially yourself, is to know where you are currently at”. -
Jerry Burckner
Abstract
Self Concept is the ability to monitor the feelings and emotions of self and others to discriminate
among them, and to use this information to guide the thinking process and actions. Thus, Self concept
is a broad term that covers collection of interpersonal and intrapersonal skillsSelf Concept is not
innate skills. They are learned abilities, essential for success. It includes self awareness, self
management, emotional management, self motivation, empathy and managing relationships.
Keywords:self-efficacy-emotional management-socialself-concept self-esteem and Managing
relationships.
Self is the picture of oneself in one’s own eyes. It is the image of the person as a whole, should be,
and might like to be. It means the perceptions, beliefs attitudes and feelings with the individual views
a part of the characteristic of him. person with a favourable conception of oneself due to experiences.
Self-concept in the way in which persons view themselves one’s own strength and weaknesses,
the way to feel about ourselves in relation to others in the social context all come under the board
heading of self-concept. So it is clear that self-related variables are associated with general
psychological variables. Therefore, the study of self-concept gains more and more importance
recently.
OBJECTIVES:
To study the personal profile of students in colleges in Kanchipuram District.
To study the factors associated with self-concept of Students in colleges in Kanchipuram
District.
To suggest ways and means to improve the self-concept among students in colleges
inKanchipuram District.
IMPORTANCE OF THE STUDY:
The study focused on identifying the phenomena selected to self-concept among students in colleges
in in Kanchipuram District.. It helps to estimated social relationship and knowing one’s own self. This
may help the educational institution to initiate some changes in social environment so as to increasing
the level of confidence among students in classroom. It helps to indicate the important construct in
bringing about quality in education.
RESEARCH METHODOLOGY:
Definition of the Population:Since the study is mainly related to knowand understand the concept
college students in and around Kanchipuram District. The sampling procedure followed in this study
is non-probability random sampling.

SYNDICATE - The Journal of Management
Volume 17, March 2017, ISSN 2278-8247
2
RESEARCH DESIGN:
The research design is ‘Emprical’in nature as the researcher has made attempts to describe
characteristics as it is.
RELIABILITY ANALYSIS :In statistical terms, reliability is based on the idea that individual or
set of items should produce results consistent with overall questionnaire. Cronbaeh’s alpha, α, is the
most common measure of scale reliability. The value of 0.7 to 0.8 is acceptable value for cronbeah’s
alpha. The reliability co-efficient for the items is 0.941 for the items of 31. It satisfies the acceptable
range of 0.7 and 0.8. Hence, the researcher proceeded with the framed questionnaire.
a. Sample Design:
For the purpose of the study the researcher has applied “random sampling Technique”
which is a method in non-probability sampling. Since the time and cost is the limiting factor
the study is confined to this techniques and study is conducted by the direct interview with
structured questionnaire.
b. Sample Size: A well-structured questionnaire was distributed to 110 students of 100 were
responded and these 100 are taken for the study.
c. Period of Study: The study was conducted in the month of November 2016.
DATA COLLECTION:
Primary Data:
The primary data is known as the data collected for the first time through field
survey.
Secondary Data:
Secondary data refers to the information or facts already collected.The related
information gathered from magazines, newspaper, books, project report and related websites
that formed the secondary data.
ANALYTICAL TOOLS:
The data were analyzed by using statistical tools. Out of various techniques of analysis,
following tools were used for the study. They are,
Percentage analysis
Likert scale analysis
Chi-Square analysis
kruskalwallis analysis
Factor analysis
Cluster analysis
LIMITATION OF THE STUDY:
The sample size of the study is limited to 100 respondents residing in Kanchipuram District..
So, the result may not be generalized to other places.

SYNDICATE - The Journal of Management
Volume 17, March 2017, ISSN 2278-8247
3
The attitude of students tend to change time to time so sometimes the present result may not
give the correct future picture.
The personal bias and prejudice of the respondents could have affected the result of the study.
A literature review discusses published information in a particular subject area, and
sometimes information in a particular subject area within a certain time period.
Ushakumari (2008) has noted that teacher effectiveness has been found as one of the major
characteristics of effective teaching. Justice to ones’ profession cannot be done until one has better
perception of effective teaching. Professor’s effectiveness plays an important role in the teaching-
learning process. An effective teacher must have current, thorough knowledge of the subject matter,
show interest in teaching, and have an enthusiasm for the subject.
Robbin, 2008: In this study looked at the success and failure of 11 American Presidents-from
Franklin Roosevelt to Bill clinton. They are evaluated on six qualities-communication, organistion,
political skill, vision, congnitive style, and emotional intelligence. The study reported that the key
quality that differentiated the successful (like Roosevelt, kenneds, and Reagan) from the unsuccessful
(like Johnson, Cartern and Nixon) was emotional intelligence.
Dimensions Of Self-Concept
Social Self-Concept: The social self-concept refers to how the individual believes he or she is seen
by others. It generally changes to 'match the person or group with which the individual is interacting.
Student’s-Effectiveness:Student’s effectiveness refers to different job skills acquired in the class
room, namely, confidence, command, adaptability, personal effectiveness and positive attitude in
learning their job skills.
Academic Problem Solving AndPerformance:Academic problem solving is defined as the ability
to use knowledge, facts and data to solve issues and problems that arise in the class room/ in the
institution.
By applying percentage analysis, following findings have been obtained.
74% of the respondents belong to the age group 18-22
67% of the respondents are UG graduates
20% each of the respondents belong to teaching, IT, manufacturing, marketing and
service sectors
53% of the respondents belong to a family income level of less than Rs.10000 pm
Specific Findings: by applying Likert scale analysis, the following results have been
obtained:The respondents given their first preferences as Feel good about work followed by Positive
attitude towards myself, Proud of ability, Handle the situations,Cope with work,Confident to handle
the job without constant assistance,Useful contribution, and the least for More scholastic ability.
By applying Chi Square analysis the following results have been obtained:Family Income
has influence on the respondent regarding the level of self-esteem.

SYNDICATE - The Journal of Management
Volume 17, March 2017, ISSN 2278-8247
4
By applying kruskalwallis analysis, the following results have been obtained:
a. Age has influence on the level of performance of social self factor
b. Age has no influence on the level of self efficacy factor
Factor Analysis: From the table, it is clear that the value of KMO i.e. 0.765 is higher than the
minimum value prescribed by Kaiser. This proves sample adequacy. Hence, the KMO supports factor
analysis. By seeing the value of Bartlett’s test, it is less than the value stated i.e. 0.05. Hence, from
this perspective also the factor analysis is feasible. The total variance of the 20 variables factors
exhibits 68.182% with 3 Eigen values. The factors from 1 to 3 are account for 39.524%, 18.497% and
10.161% of the varience. All the remaining factors are not significant.The table shows the extraction
of all the 20 variables, and how these are loaded on “THREE” factors. These three factors are named
and variables included in each factor are explained below:
Factor 1: Social Self Factor : The first factor consists of thirteen variables, it includes the
following,1.Peers expectation -0.953:2.Agreeable person – 0.900 : 3. Submissive tone – 0.897:
4.Alternative to select – 0.895: 5. Co-ordination – 0.889: 6.Emotional control – 0.856: 7.Quality of
interaction – 0.835 : 8. Comfortable person – 0.663 : 9. Developing skills – 0.660: 10. Core values –
0.572 : 11. Proud – 0.502: 12. Important person – 0.208: 13.Understanding – 0.035.The total variance
explained in this factor is 8.835. The first factor shall be named as “Social Self Factor”
Factor 2: Self Efficacy Factor:The second factor consists of three variables, which are listed below:
1.Senior’s expectation – 0.778, 2.Perception of others – 0.657 & Kind person – 0.086.The total
variance explained in this factor is 1.521. The second factor shall be named as “Self Efficacy Factor”
Factor 3: General Esteem Factor: The third factor consists of four variables which are listed below:
1.Friends on age – 0.723 : 2.Strength and weakness – 0.668 : 3.Positive attitude – 0.647 and 4. Parents
trust – 0.082. The total explained in this factor is 2.12. This factor shall be named as “General Self
Esteem Factor”.
Cluster Analysis:In this section, the attitude of students towards the predominant factors of self
concept that is, the three factors namely social self concept factor, teaching effectiveness factor,
general self esteem factors are classified into heterogeneous groups.
TABLE SHOWING THE CLASSIFICATION BASED ON THE FACTOR OF SOCIAL SELF
CONCEPT
Cluster
1 2 3
Peer’s expectation M-2.94 W1.24 S(5.00
Agreeable person S-2.71 W-1.92 W-1.17
Submissive tone S-1.46 W-1.61 S-2.00
Alternative to select S-2.54 W-1.54 S-2.00
Co-ordination M-2.20 W-1.24 S-4.50
Emotion control M-2.23 W-1.00 S-4.17

SYNDICATE - The Journal of Management
Volume 17, March 2017, ISSN 2278-8247
5
Quality of interaction M-3.03 W-1.64 S-4.00
Comfortable person S-4.11 W-1.80 M-3.00
Developing skills W-2.51 W- 2.14 S-5.00
Core value M-3.31 W-1.34 S-5.00
Proud M-2.40 W-1.58 S-4.17
Important person M-2.74 W-1.32 S-3.83
Understanding M-2.54 W-1.47 S-3.00
Conclusions are drawn on the basis of rank analysis.(S- Strong: M-Medium : W – Weak ).
INTERPRETATION: The above ranking analysis clearly reveals that group one students are
strongly influenced by four variables namely understanding, important person, proud, developing
skills.Group three students are strongly influenced by ten variables namely peer’s expectation,
understanding, important person, alternative to select, agreeable person, comfortable person, core
value, quality of interaction, co-ordination, submissive tone.
Frequency Loading of Clusters of Social Self Concept Factors:The respondents have been
categorized into three groups in the nature of Assertive Behaviour. They are given in the table below:
TABLE SHOWING FREQUENCY LOADING OF CLUSTERS OF SOCIAL SELF CONCEPT
Number of Cases in each Cluster
Cluster 1 35.000
2 59.000
3 6.000
Valid 100.000
Missing .000
INTERPRETATION:
35% of the students are categorized in Group I and are named as “socially adjustable pupil”,
and 6% are grouped into third category. They are named as “teaching efficacy pupil”.
TABLE SHOWING THE NATURE AND CLASSIFICATION BASED ON THE FACTOR OF SELF
EFFICACY
Cluster
1 2 3
Senior expectation WEAK (2.82) STRONG (3.00) STRONG(3.85)
Perception of others WEAK(1.66) STRONG(4.67) MEDIUM(2.48)
Kind person WEAK (1.81) STRONG(1.67) STRONG((4.22)
INTERPRETATION:The above ranking analysis clearly reveals that group two, the pupils are
strongly influenced by two variables namely senior expectation, and perception of others.Group three,
the pupilss are strongly influenced by two variables namely senrior expectation and kind person.

SYNDICATE - The Journal of Management
Volume 17, March 2017, ISSN 2278-8247
6
Frequency Loading of Clusters of Self Efficacy Factors: The respondents have been categorized
into three groups in the nature of Assertive Behaviour. They are given in the table below:
TABLE SHOWING FREQUENCY LOADING OF CLUSTERS OF SELF EFFICACY
Number of Cases in each Cluster
Cluster 1 67.000
2 6.000
3 27.000
Valid 100.000
Missing .000
INTERPRETATION:6% of the members are categorized in Group II and are named as
“Interactive pupil”, and 27% of pupils are grouped into third category. They are named as
“agreeable students”.
TABLE SHOWING THE CLASSIFICATION BASED ON THE FACTOR OF GENERAL SELF
ESTEEM
Cluster
1 2 3
Friends on age W(1.70) M(2.33) S(3.95)
Strength and weakness W(1.44) S(2.96) W(1.64)
Positive attitude W(1.44) S(3.79) W(1.64)
Parents trust W(1.41) M(2.92) S(3.05)
INTERPRETATION:
The above ranking analysis clearly reveals that group two students are strongly influenced by two
variables namely aware of strength and weakness, positive attitude.Group three, the students are
strongly influenced by two variables namely friends on age, parents trust.
Frequency Loading of Clusters of Self Esteem Factors:The respondents have been categorized into
three groups in the nature of Assertive Behaviour. They are given in the table below:
TABLE SHOWING FREQUENCY LOADING OF CLUSTERS OF SELF ESTEEM
Number of Cases in each Cluster
Cluster 1 54.000
2 24.000
3 22.000
Valid 100.000
Missing .000
INTERPRETATION:24% of the respondents are categorized in Group II and are grouped as “self
awareness pupil”, and 22% of respondents grouped into third category. They are named as
“talented pupil”.

SYNDICATE - The Journal of Management
Volume 17, March 2017, ISSN 2278-8247
7
SUGGESTIONS: Based on the study, it is found that the students should be mentally prepared for
accepting the situation and manner in which they can react. Here are some of the suggestions given to
improve one’s ownself.
Give self-appreciation whenever a job/task well done. And may also share it with friends and
peer groups. Justified praise is a good boost to morale.
Stand up for own beliefs and do not be pressured by others. It is advisable to be an assertive
person.
It is suggested that people should not be critical of themselves to others. Whilst it can be
useful to confide her concerns to someone she trust, telling the world is something else.
People should be kind to themselves.
Allow time for own-self each day. This may only be a few minutes, but it isimportant to be
quiet and to unwind. Follow the relaxation techniques available.
Everyone has problems, hence one should not think that their problems greater than others.
By being negative they may be isolated from others and may cut off from solutions to
problems.
CONCLUSION:Self-Concept is the “feeling of self-appreciation” and it is an indispensable emotion
for people to adapt to society and live their lives. Evaluating one’s ownself can be an effective method
for understanding their past and present circumstances. Self-Concept is complex, and it is difficult to
generalize the results from this study. However, it seems that social support, self-efficacy and coping
are important aspects regarding self-concept.
References
1. L.M.Prasad, Human Resource Management, Sultan Chand and Publications
2. J.Jayshanker, Human Resource Management, Margham Publications
3. L.M.Prasath, OrganisationalBehaviour, Sultan Chand and Publications
4. Journal Of Humanities And Social Science, Volume I, Issue 1,June 2009
5. The IUP Journal Of Soft Skills, Volume VIII, No.1,March 2014
6. The Journal Of OrganisationalBehaviour, January 2009
7. The Journal Of OrganisationalBehaviour,January 2014
8. Self-Esteem Development From Young Adulthood To Old Age: A Cohort-Sequential
Longitudinal Study, Journal Of Personality And Social Psychology, 2010, Vol. 98, No. 4,
645–658
9. Self-Esteem And Clarity Of The Self-Concept, Journal Of Personality And Social
Psychology. Vol 59(3), September 1990, 538-549
10. The Role Of Self-Esteem And Anxiety In Decision Making For Self Versus Others In
Relationships, Journal Of Behavioural Decision Making, Volume 18 Issue 2, Pages 125 – 144
11. Self-Esteem Development From Age 14 To 30 Years: A Longitudinal Study, Journal Of
Personality And Social Psychology, 2011, Vol. 101, No. 3, 607–619
12. A Study Of Self‐Esteem And Self‐Efficacy As Psychosocial Educational Outcomes: The Role
Of High School Experiences And Influences
13. Academic Self-Concept And Self-Efficacy: How Different Are They Really?, Educational
Psychology Review, Volume 15, Number 1 / March, 2003
14. www.ijcrm.com

SYNDICATE - The Journal of Management
Volume 17, March 2017, ISSN 2278-8247
8
IMPACT OF GLOBALIZATION ON BUSINESS ENVIRONMENT
“Challenges For Human Resource Management”
Prof. (Dr).Malay Ghosh ,Prof. AlpaGhosh
Associate Professor-IPER, Bhopal
Assistant Professor-BSSS, Bhopal
Abstract
“Companies must navigate the choppy waters of a complex global economy, and position themselves to
attract and retain the workers they will need on this journey.”
This paper talks about the firms facing several challenges from both the future workforce and from the
changing nature of work itself globally. As a result, HR managers will need to get ahead of the game by
understanding these major future demographic, technological and societal shifts, and then preparing
themselves accordingly.
Globalization is not just a recent phenomenon. Some analysts have argued that the world economy was just a
globalized 100 years ago as it is today. Yet the term is used since the 1980’s, reflecting technological
advances that have made it easier and quicker to complete international transactions, both trade and financial
flows. Globalization has emerged in the 21st century presents distinctive HRM challenges to businesses
especially those operating across national boundaries as multinational or global enterprises. Global business
is characterized by the free flow of human and financial resources. This accentuates the need to manage HR
effectively to gain competitive advantage in the global market place. At a political and economic level,
globalization is the process of denationalization of markets, politics and legal systems i.e. the use of the so-
called global economy. Globalization refers to an extension beyond national borders of the same market
forces that have operated for centuries at all levels of human economic activity (village markets, urban
industries, or financial centers). It means that world trade and financial markets are becoming more
integrated. At a business level, we talk of globalization when organization decides to take part in the
emerging global economy and establish themselves in foreign markets. First they will adapt their products or
services to the customer’s linguistic and cultural requirements. Then, they might take advantage of the
internet revolution and establish a virtual presence on the international market place with a multilingual
corporate website or even as an e-business.Sweeping demographic changes across both the developed and
developing world will place greater pressure on both the government and private sector to initiate and
implement creative solutions to educate, integrate and retain a rapidly changing and diverse working
population. With hundreds of millions of women predicted to pour into the global workforce in the coming
years, and temporary and part-time workers a significant and seemingly permanent fixture, companies need
to adapt further to a new breed of employee.
HR challenge: Adapting to a rapidly changing worker profile:-
When you add the issues of a multi-generational workforce and growing cultural diversity, it is no surprise
that people management is cited to be by far the most substantial challenge facing companies over the next
five to ten years Ageing populations across the globe will continue to pose a challenge for businesses. On the
one hand, experienced employees are departing the workforce, leaving a leadership void. On the other hand,
many older workers, particularly those in the US,Japan and other industrialized countries, plan to carry on

SYNDICATE - The Journal of Management
Volume 17, March 2017, ISSN 2278-8247
9
working well past the traditional retirement age. Many will simply need to continue earning, as social safety
nets, pensions and other benefits will no longer be adequate or available. But HR will need to establish more
targeted incentive structures to keep less committed older workers in the workforce. Companies will also
need to anticipate and assess which new skills and training older employees will require, particularly in the
realm of technology where they may feel less comfortable than many of their younger colleagues.
Preparing the world’s youth for the workplace will certainly present challenges. In countries with high youth
unemployment rates, there are increased concerns that many young people will leave the workforce
permanently, producing a lost generation. Meanwhile, the skills and education of the millennials who remain
in the workforce must always be relevant and attractive to employers. As we see below, governments,
companies and educational institutions will need to create solutions that reform the educational system, and
prepare the future workforce for employment opportunities. Companies have so far struggled to maximize
the potential of women, who are dramatically under-represented at the top of major companies. A mere 13
out of the largest 500 companies in the world by revenue had women CEOs in 2012, a proportion of just 2.6
percent. Nine of these CEOs were in the US, where, nevertheless, women occupied just 16.9 percent of
corporate board seats in Fortune 500 companies in 2013. In Southern Europe, in countries such as Greece,
Portugal and Spain, that figure is comfortably within single figures. The standard reason given for female
under-representation at the top of the business world is the fact that women often take time out of the
workplace to look after a family. However, around one in four American graduate women is now childless in
their mid-forties, reportedly rising to one in three in Germany. Clearly, other factors, such as the lack of
female role models and the challenges of breaking into a male-dominated club, also play a part. Whatever the
cause, the result is a waste of the talent that companies maintain is so difficult to find.
HR challenge: The range of skills that employees need have not necessarily been provided by
traditional educational systems. To complicate matters further, there is lack of standardization in
education, especially in a global context. As businesses expand and hire beyond borders, the need for HR to
scrutinize job qualifications carefully becomes ever more important. Major disparities exist between various
regions and institutions in individual countries, as well as between countries. The ability to understand these
differences will enable HR to make more informed hiring decisions. Through collaboration with other
functions of the organization, HR can increase its understanding of qualifications and skill sets to ensure that
hired employees are capable of executing their functions. Population decline, due to lower birth rates, along
with stagnant educational reform, have prompted many organizations to fear future skills shortages,
particularly in certain roles. Strategic vision and the ability to handle complexity were cited to be the most
difficult skills to find among senior executives, presumably also the reason why strategic roles are deemed so
problematic to fill. Companies are clearly struggling to recruit those with the apparently rare ability to guide
them through an unpredictable and competitive external environment. The lack of advanced soft skills
appears particularly acute in Asia Pacific, causing concern to the many global companies seeking a rapid
expansion in the region.
Retaining and engaging a changing workforce
As the demographic composition of the workforce changes, their motivations and expectations evolve too. It
is imperative that HR understands what is most valued by these workers. Is it compensation, or prestige, or
perhaps autonomy at work? In many cases, HR will have to adapt their incentives, benefits policies, and
retention strategies for workers that are not just driven by financial compensation. It is not enough simply to
recruit able staff. Companies have to make sure that their people are committed, productive, and do not leave
after a short period, incurring substantial turnover costs and wasting all previous training invested in them.

SYNDICATE - The Journal of Management
Volume 17, March 2017, ISSN 2278-8247
10
This will be no easy task. Much of the workforce is not engaged in their work. According to Gallup’s latest
142-country study on the global workforce, only 13 percent of workers worldwide are “engaged,” meaning
that they are psychologically committed to their jobs. The bulk of the working population—63 percent—are
“not engaged,” indicating that they lack motivation. A substantial minority—24 percent—are
“actively disengaged,” unhappy and unproductive and liable to spread negative attitudes to co-workers.76
Generation Y, as they are commonly known, are reputed to have low organizational loyalty and are eager
to make an impact. Even if these younger, skilled workers are committed, retaining them is a major challenge
and HR will have to explore varied retention techniques, adapted to the preferences of the relevant
individual.
Aligning technology best practices to global management strategy- In the last 20 years, new
communication technology, such as email, mobile phones and web and videoconferencing has not only
facilitated closer contact with clients in distant lands, it has allowed multinational companies to form cross-
border teams, where colleagues can communicate with each other constantly, despite not being located in the
same place. In short, technology has enabled the international expansion that companies seek.
HR challenge: Winning the war for talent
People migration, both cross-border and within countries, adds another layer of complexity to the labor
market. Governments play a big role in determining and controlling that flow of labor. However, as
organizations continue to expand globally and face skills shortages locally, many require a more mobile
workforce. Therefore, organizations and governments alike will seek to understand and gather data on how
migration patterns are affecting the composition of the labor market, and how educational attainments and
skill sets are shifting.
HR challenge: Hiring and retaining talent while lowering labor costs
Large labor-productivity gains over the past few decades have not been matched by comparable wage gains.
While both increased technology adoption and globalization contribute to this phenomenon, companies’
increased focus on maximizing shareholders’ value has also been a substantial factor. Furthermore, looser
labor laws and decreased union rates have decreased workers’ bargaining power. While this trend has been in
existence for a while, pressure across corporations to curb labor costs has only become more acute with the
latest global financial crisis.
Retention of talent will prove challenging, as employees feel that stellar performances are not being
rewarded appropriately. While their employers continue to have higher work expectations, employees’
efforts are not necessarily translating into compensation they deem to be satisfactory. This is creating a
challenge for HR as turnover rates increase. Finding and hiring talent will not prove any easier, as firms
continue to decrease their labor investment. On a day-to-day basis, workers may not be as motivated and
engaged. HR will have to continue to explore retention strategies and benefits models that focus on factors
beyond financial compensation.
Companies may often prefer to have flexible arrangements with employees and avoid costly employee
benefits by hiring non-traditional workers. However, developing and engaging the legions of part-time,
temporary and freelance workers at all levels of the company is a growing issue for companies. As we have
seen, many part-time staff, and most temporary staff, would rather be working on a more long-term footing.
To complicate matters, as a recent paper by Cappelli and Keller discusses, temporary workers often find
themselves in “triangular arrangements,” where it is unclear whether their organizational loyalties lie with

SYNDICATE - The Journal of Management
Volume 17, March 2017, ISSN 2278-8247
11
temporary agencies or the hiring organization. The costs of less engaged staff with lower organizational
loyalty—poor customer service, less attention to quality, little commitment to the company, and higher
levels of turnover—threaten to be more substantial than the savings incurred by resorting to flexible
employees.
Hence there are many challenges which are to be addressed at International geopolitical human resource
perspectives.
References
1. High Pay Centre, “Global CEO appointments: a very domestic issue”,
2013.(http://highpaycentre.org/files/CEO_mobility_final.pdf).
2. Catalyst, “Catalyst 2013 Census of Fortune 500: Still No Progress After Years of No
Progress”, Dec 10 2013. (http://www.catalyst.org/media/catalyst-2013-census-fortune-500-
still-no-progress-after-years-no-progress).
3. The Financial Times, “Quotas for female board members look like a toad too far,” Jan 9
2014. (http://www.ft.com/cms.
4. Pew Social Trends, “Childlessness Up Among All Women; Down Among Women with
Advanced Degrees,” Jun 25 2010. (http://www.pewsocialtrends.org/2010/06/25/childlessness-
up-among-all-women-down-among-women-with-advanceddegrees/).
5. The New York Times, “In Germany, a Tradition Falls, and Women Rise,” Jan 17
2010. (http://www.nytimes.com/2010/01/18/world/europe/18iht-
women.html?pagewanted=all).
6. The Financial Times, “Quotas for female board members.”
7. The Economist Intelligence Unit, “Plugging the skills gap,”
2012. (http://www.cfoinnovation.com/system/files/Plugging_the_Skills_Gap_EIU.pdf).
8. Heidrick& Struggles, “The global talent index report: The outlook to 2015,”
2011. (http://www.economistinsights.com/sites .pdf).
9. http://www.gttconnect.com/
10. Foreign Policy, “Chinese and Indian entrepreneurs are eating America’s lunch,” Dec 28
2010. (http://www.foreignpolicy.com/articles/2010/12/28/chinese
and_indian_entrepreneurs_are_eating_americas_lunch).
11. Silicon India News, “Infosys has trained 100,000 graduates at Mysore campus,” May 31
2012. (http://www.siliconindia.com/news/technology/Infosys-).
12. Gallup, “Worldwide, 13 per cent of employees are engaged at work,” Oct 8
2013. (http://www.gallup.com/poll/165269/worldwide-employees-engaged-work.aspx).
13. PwC, “Millennials at work: Reshaping the workplace,”
2011. (http://www.pwc.com/en_M1/m1/services/consulting/documents/millennials-at-
work.pdf)
14. The Economist, “Socialist workers: Is China’s labour market at a turning-point,” Jun 10
2010. “McKinsey, “Winning the $30 trillion decathlon: going for gold in emerging markets,”
McKinsey Quarterly, 2012. (http://www.mckinsey.com/features/30_trillion_decathlon).
15. M. Page, “Double-digit salary increases and high employee turnover forecast across China in
2014,” Dec 12
2013. (http://www.michaelpage.com.cn/ContentArticle/page/8703/title/Double-digit-salary-
increases-and-high-employee-turnoverforecast-across.html).

SYNDICATE - The Journal of Management
Volume 17, March 2017, ISSN 2278-8247
12
16. The Economist Intelligence Unit, “Reengaging with engagement,” ViewsWire,
2010. (http://viewswire.eiu.com/report_dl.asp?mode).
17. The Economist Intelligence Unit, “Values-based diversity: what it means and why it matters,”
2014. (http://www.successfactors.com/en_us/lp/values-based-diversity.html).
18. The Economist Intelligence Unit, “Managing virtual teams: taking a more strategic
approach,”
2009. (http://graphics.eiu.com/upload/eb/NEC_Managing_virtual_teams_WEB.pdf).
19. The Economist Intelligence Unit, “Competing across borders,” Apr
2012. (http://www.economistinsights.com/search/node/competing ).
20. See, for example, The Economist, “The DaimlerChrysler emulsion”, Jul 27 2000.
(http://www.economist.com/node/).
21. The Economist Intelligence Unit, “Up or out: next moves for the modern expatriate,”
2010. (http://graphics.eiu.com/upload/eb/LON).
22. The Huffington Post, “It’s time for paid family and medical leave to empower working
women and modernize the workplace,” Feb 5 2014.
23. The New York Times, “China passes a sweeping labor law,” Jun 30 2007.
24. P. Cappelli and J. Keller, “Classifying work in the new economy,” Academy of Management,
2013
25. Open Secrets blog, “Special interests battle over immigration reform,” Mar 4
2013. (https://www.opensecrets.org/news/2013/03/special-interests-weigh-in-on-immig.html).
26. Bhavani, T.A., Ashok Gulati and Devesh Roy. 2007. Structure of the Indian Food Processing
Industry: Towards Scaling Up and Consolidation. International Food Policy Research
Institute, New Delhi.
27. Gulati, Ashok. 2008. Fragmenting Bottom and Consolidating Top: India’s Changing Food
System and Implications for Small Holders, in India: Some aspects of Economic and Social
development (eds.)
28. S.MahendraDev and K.S. Babu. Academic Foundation, India. 2008. National Sample Survey
Organization. 2006. NSS Report No.492. Some Aspects of Operational Landholdings in
India, 2002-03.
29. National Sample Survey Organization. Ministry of Statistics and Program Implementation.
Government of India.
30. Planet Retail.2008. www.planetretail.net, accessed April 2008.
31. Reardon, Thomas and Ashok Gulati. 2008. The Rise of Supermarkets and their Development
Implications-the International Experience Relevant for India.
32. IFPRI Discussion Paper 00752. February 2008. IFPRI, Washington D.C. Available at
http://www.ifpri.org/pubs/dp/ifpridp00752.asp, accessed October 2008.
33. Srivastava, Ravi.2008. Prospects for Small Holding Agriculture in India presented at the
workshop titled Exploring Alternatives Futures for Agricultural Knowledge, Science and
Technology (KST) organized by National Council of Applied Economic Research and
International Food Policy Research Institute at India Habitat Centre, Amaltas Hall, New
Delhi. 01 July, 2008.
34. Trivedi, Divya. 2008. Food for thought. Business Line. New Delhi, 15 May 2008. Available at
http://www.thehindubusinessline.com/catalyst/2008/05/15/stories

SYNDICATE - The Journal of Management
Volume 17, March 2017, ISSN 2278-8247
13
EMPLOYEES PREFERENCE ON DIGITAL WALLET IN CHENNAI CITY
Dr. P.BaraniKumari
Assistant Professor, Department of Commerce
Sri KanyakaParameswari Arts&ScienceCollegefor Women.
Abstract:
A digital wallet allows users to make electronic commercial transactions swiftly and securely.
It functions much like a physical wallet. A digital wallet has both a software and information
component. The software provides security and encryption for personal information and for the actual
transaction. This study aims to understand customer preference on digital wallet, its impact and
satisfaction level among employees in Chennai city.
INTRODUCTION:
Back to history, mobile wallet is developed from a concept called “Digital Wallet”. It dated
back in 1996 when the founder of Digital Wallet, Sam Pitroda, who filed the patent in the United
States [see (Sam Pitroda Patents)]. He “professed that a digital wallet would consist of a liquid crystal
display not much bigger than a regular plastic bank card, which preferably a touch-sensitive screen
and simple user interface that lets the user flip through the digital wallet in the same manner he/she
flips through a leather wallet”. (Pitroda S., Desai M., 2010)
One view, expressed by Kevin Erickson (2013) - a technology blogger from Credera (a
technology consulting firm from the USA) is that mobile wallet tries to perform these following
features for single user (Erickson, 2013):
Display and store coupons or account offers from businesses which users subscribed or
engaged with
Identify real time discounts and offers from different business locations
Provide search engine and evaluation tool for restaurants and shops based on location
Act as payment tool with credit and debit cards
Organize receipts
Mobile wallet is a very young concept in India that has taken on consumer psyche rapidly.
Everyone is loving mobile wallets and embracing them with open arms. Today, mobile wallet is one
of the successful business ideas for start-ups. The evidence lies in the fact that it has surpassed credit
cards in terms of the number of users in just a fraction of time.The demonetization of Rs 500 and Rs
1000 currency notes has been working largely in the favor of digital wallet startups. India has seen a
phenomenal increase in the number of digital wallets and is slowly moving towards being a cashless
country. And with the transaction limit on digital wallets being increased to Rs 20,000, it just keeps
getting better. Here are the top 20 digital wallets in India:
1) Airtel Money
2) Citi Master Pass
3) Citrus Pay
4) Ezetap
5) Freecharge
6) HDFC PayZapp
7) ICICI Pockets
8) JioMoney
9) Juspay

SYNDICATE - The Journal of Management
Volume 17, March 2017, ISSN 2278-8247
14
10) LIME
11) Mobikwik
12) MomoeXpress
13) MoneyonMobile
14) Mswipe
15) Ola Money
16) Oxigen
17) PayMate
18) Paytm
19) PayUmoney
20) State Bank Buddy (SUMR.HR.COM)
LITERATURE REVIEW:
Jiangping Wan Ming Zeng, Lianyu Liang(2013) studies on usability impact factors of
electronic wallet-one card solution within college students includes the analysis of the current
situation within the electronic wallet-one card solution for college students, the analysis of be- havior
habit within using the electronic wallet-one card solution for college students, and sets up a
preliminary usability evaluation indicator system of electronic wallet-one card solution for college
students, and the factor analysis for us- ability evaluation indicator system through the questionnaire.
According the result of factor analysis, they set up an im- proved usability evaluation indicator system
of electronic wallet-one card solution for college students. The purpose of the study is to improve the
usability of electronic wallet-one card solution.
Dr Hem ShwetaRathore (2016) study tries to study the various factors that can affect a
consumer’s decision to adopt digital wallet as a mode of online payment. Apart from this, the study
also attempt to find out the various risks and challenges faced by users of digital wallet.
Ngoc Doan (2014) illustrates clearly that the adoption image of mobile wallet among consumers in
Finland is only at the beginning stages of the Innovation-Decision Process: Knowledge Stage and
Persuasion Stage. Only when there is effective solution for the burdens, there will be more consumers
start to use mobile wallet..
.
NEED FOR THE STUDY: Demonetization in India brought a vast change in customer purchase behaviour, spending
style etc., the cashless economy importance is insisted to everyone. Especially the working people
migrated from cash purchase to online purchase. Thus the need for the study is to identify the
customers purchase behavior through online and preference factors.
OBJECTIVE OF THE STUDY
1. To identify the customer preference on digital wallet usage.
2. To find the impact of customer preference and satisfaction on digital wallet usage.
DATA COLLECTION
Data for the study were collected as small part of a smaller study through self-administered
questionnaires from the employees in Chennai city. Convenience sampling method is used to collect
questionnaire. A total of 50questionnaires were hand–delivered to respondents. After two days the 50
questionnaire distributed were collected and all the 50 were usable.

SYNDICATE - The Journal of Management
Volume 17, March 2017, ISSN 2278-8247
15
ANALYSIS OF THE STUDY:
PERCENTAGE ANALYSIS
Basis %
Gender
Male 54
Female 46
Age
15-25 22
26-35 68
Above 35 10
Frequency of online Purchase
Once in a month 22
Once in fortnight 10
Once a week 38
2-3 times a week 14
Daily 16
The above table clearly states that 54% of respondents are male and 46% of them are female,
68% of their age falls between 26-30 years, 22% of them are between 15-25 years and 10% of the
respondents were above 35 years and 38% respondents made their purchase once in a week through
online, 22% of them buy once in a month, 16% of them uses online shopping daily, whereas 14% of
the respondents purchase 2-3 times in a week and 10% of them use once in fortnight.
MODE OF PAYMENT
Mode of payment Always Mostly Sometimes Rarely Never
a. Debit card -- -- 14 18 16
b. Credit card 42 4 34 10 10
c. Online banking 40 8 26 12 14
d. Digital wallet 10 40 18 28 4
18% of the respondents rarely use their mode of payment in Debit card, 42% of the
employees always prefer to use through credit card, 40% of them prefer to buy in online banking and
40% of the respondents mostly use their digital wallet for making payment on their purchase.
FREQUENCY OF DIGITAL WALLET USAGE
Frequency %
Once 68

SYNDICATE - The Journal of Management
Volume 17, March 2017, ISSN 2278-8247
16
Some times 12
Many times 10
Always 10
68% of the respondents have used digital wallet only once, 12% of the respondents use some
times, 10% of the respondents have used many times and the other 10% of the respondents use always
their digital wallet.
ONE – SAMPLE STATISTICS FOR CUSTOMER PREFERENCE ON DIGITAL WALLET
Variables
N Mean
Std.
Deviation
Std.
Error
Mean t
Sig.
(2-
tailed)
Rank
Nominal price 50 1.9 0.65 0.09 20.77 0.0000 1
Safety and security 50 2.32 0.79 0.11 20.67 0.0000 2
Usefulness of digital wallet 50 2.02 0.77 0.11 18.57 0.0000 3
Branded products availability 50 1.96 0.78 0.11 17.74 0.0000 4
Notification 50 2.04 0.83 0.12 17.34 0.0000 5
Discounts 50 1.98 0.84 0.12 16.57 0.0000 6
Variety 50 1.84 0.82 0.12 15.92 0.0000 7
Easy usage 50 1.92 0.88 0.12 15.48 0.0000 8
Utility innovation 50 1.8 0.88 0.12 14.45 0.0000 9
Pricing 50 1.68 0.84 0.12 14.08 0.0000 10
Convenience 50 1.74 0.88 0.12 14.04 0.0000 11
These t values are statistically significant at 5% level. Therefore the ranking can be done on
the basis of mean values as well as the t values. Hence it can be concluded that majority of the
respondents strongly prefer digital wallet due to its nominal price. They also prefer for safety and
security. The customers prefer the digital wallet because of its usefulness, branded product
availability, notification on discounts and variety of products make easy usage of utility innovation on
digital wallet. They also prefer for its valid pricing and convenience.
ONE WAY ANOVA TABLE BETWEEN GENDER AND PREFERENCE FACTORS FOR
DIGITAL WALLET
Preference Factors Sum of
Squares Df
Mean
Square F Sig.
Pricing Between Groups 3.55 1 3.55 5.439 0.024
Within Groups 31.33 48 0.653
Total 34.88 49
Nominal price Between Groups 1.102 1 1.102 2.728 0.105
Within Groups 19.398 48 0.404
Total 20.5 49
Convenience Between Groups 2.029 1 2.029 2.736 0.105

SYNDICATE - The Journal of Management
Volume 17, March 2017, ISSN 2278-8247
17
Within Groups 35.591 48 0.741
Total 37.62 49
Easy usage Between Groups 4.128 1 4.128 5.905 0.019
Within Groups 33.552 48 0.699
Total 37.68 49
Branded products
availability
Between Groups 1.949 1 1.949 3.345 0.074
Within Groups 27.971 48 0.583
Total 29.92 49
Security and safety Between Groups 0.149 1 0.149 0.233 0.632
Within Groups 30.731 48 0.64
Total 30.88 49
Utility of innovation Between Groups 0.931 1 0.931 1.205 0.278
Within Groups 37.069 48 0.772
Total 38 49
Usefulness of digital wallet Between Groups 0.964 1 0.964 1.651 0.205
Within Groups 28.016 48 0.584
Total 28.98 49
Discount offers Between Groups 1.009 1 1.009 1.426 0.238
Within Groups 33.971 48 0.708
Total 34.98 49
Variety of products Between Groups 0.008 1 0.008 0.012 0.913
Within Groups 32.712 48 0.681
Total 32.72 49
Notification of products Between Groups 0.001 1 0.001 0.001 0.979
Within Groups 33.919 48 0.707
Total 33.92 49
The P value for price factor is 0.024 and for easy usage 0.019. Thus it is inferred that Price of
the products in digital wallet and ease of use is found statistically significant at 5% level and strongly
preferred by the male and female employees.
PERCENTAGE ANALYSIS ON DIGITAL WALLET
Factors S.A A N DA S.DA
1. Satisfaction 72 4 12 2 10
2. continue of digital wallet 34 38 20 4 4
3. Digital wallet not safe and secure 22 24 36 14 4
4. Track transaction and use for other purpose 42 24 18 12 4
5. DWP may ask irrelevant questions 38 20 28 12 2
From the above table the 72% of the employees are highly satisfied with digital wallet, 38%
of the respondents prefer to continue their purchase through digital wallet, 36% feel neutral on digital
wallet not safe and secure, 42 % of them strongly believe that digital wallet service provider track the

SYNDICATE - The Journal of Management
Volume 17, March 2017, ISSN 2278-8247
18
customer transaction and they use for other purpose and 38% of them strongly accept that digital
wallet providers ask irrelevant questions.
CONCLUSION
The main purpose of the study is to identify the factors influencing Customer preference on
digital wallet; the respondents are attracted to their price and ease of use. The study also proves there
is an impact on these factors more over the customers are satisfied with the service provider and they
stay with such mode of purchase. The digital service provider has to take certain efforts in asking
irrelevant question to their customers during their purchase. To make digital wallet more effective the
fear on customers tracking should be removed from the minds of customers either providing some
awareness on safety and security
.
LIMITATIONS
The scope of this study is limited to employees. Only 50 samples were collected at using
convenient random sampling. The findings are thus limited in their ability to be projected Digital
wallet. There is no denying of the fact that because of socioeconomic background and different types
of customers there is a variation in the attitude of respondents.
References
1. Digitalwallet/Wikipedia
2. Dr Hem ShwetaRathore (2016) , Adoption of Digital Wallet By Consumers,
BVIMSR’s Journal of Management Research, Vol. 8 Issue - 1,
3. http://www.scirp.org/journal/ib
4. Jiangping Wan Ming Zeng, Lianyu Liang (2013), Empirical Study on Usability
Impact Factors of Electronic Wallet-One Card Solution within College Students,
iBusiness, 2013, 5, 77-85.
5. Ngoc Doan (2014), Consumer Adoption in Mobile Wallet-A Study of Consumers in
Finland Bachelor's thesis ,Bachelor of Business Administration (BBA) International
Business.
6. www.dqindia.com/top-6-mobile-wallets-in-india/6/
7. www.sumr.hr.com.

SYNDICATE - The Journal of Management
Volume 17, March 2017, ISSN 2278-8247
19
AN ECONOMICAL IMPACT AMONG THE WOMEN SELF HELP
GROUP THROUGH MICRO-CREDIT IN COMMERCIAL BANKS IN
TAMILNADU
Dr. Chitra,Ms.S.Niranjana Devi
Assistant Professor, PG& Research Department of Economics, Thiagarajar College, Madurai Kamaraj University,
Ph.D research Scholar ,PG &Research Department of Commerce,
MannarThirumalaiNaickarCollege ,Madurai
The innovative credit delivery system, namely micro-finance is a breakthrough in the world
of finance. It changes the life of the poor, especially women, not only by providing financial services
such as micro savings and micro insurance, but also imparting training in entrepreneurial
development. Over the past few decades, microfinance institutions and programmes all over the
world have adopted numerous innovative ways of providing credit to the economically poor
entrepreneurs and augmenting their savings. These include the provision of small loans to the poor,
especially in rural areas, at full-cost interest rates without collateral security and repayable in frequent
instalments. Borrowers are organized into groups, which reduces the risk of default. Moreover
effective mechanisms to disseminate valuable information on ways and means to improve the health,
establish legal rights, get sanitation and other relevant concerns of the poor have been found out.1
The term ‘micro-credit’ is perceived to be a Paradigm shift in the quality of delivery of finance to
micro-entrepreneurs. The old paradigm of micro-finance envisaged providing credit to the poor
basically residing in rural and semi urban areas at subsidized rates of interest through public or
government financial institutions. The new micro-finance system continues to target the rural and
urban poor household with emphasis on women borrowers, provision of finance for asset creation
and on the principle of ‘Borrower knows best’ (Kaladhar, 1997).
The poor, especially women, have traditionally not been recognized as credit-worthy
or savers of money and thus they are not perceived as a profitable market of credit. This
forces them to fall into the vicious cycle of everlasting high interest and high collateral loan from
money lenders. The sine quo non of any anti-poverty strategy is the irrepressible desire and innate
capacity of the poor to uplift their economic conditions.
1Christabell. P.J.,, “Women Empowerment through Capacity Building”, The Role of Micro-
Finance, University of Kerala, 2003. 2Kaladhar K., Micro Finance in India”, Economic and Political
Weekly”, October 18, 1997.

SYNDICATE - The Journal of Management
Volume 17, March 2017, ISSN 2278-8247
20
Therefore, a need arises for innovative credit delivery system that deviates from formal collateral
oriented lending institutions to informal structures. It has been felt all over the world today that
micro-finance can simultaneously help alleviation of poverty and empowerment of women.
STATEMENT OF THE PROBLEM
Since 1950, the Government of India has been trying various programmes to alleviate
poverty. Studies show that these programmes implemented through banking institutions, are not fully
successful in meeting their socio- economic objectives. The financial institutions here have not been
able to reach the poor households particularly women in the unorganised sector. Structural rigidities
and overheads lead to high cost in advancing small loans. Experience in implementing different anti-
poverty and other welfare programmes has shown that the key to success lies in starting appropriate
community-based organizations with their member’s participation at the gross-root level. Moreover,
the group approach is one of the effective ways to reduce poverty and difficulties of small
businessmen and agriculturists. Realizing this importance of Micro–Credit through commercial banks
in helping homemaking women’s upliftment, the researcher has made a sincere and humble attempt to
examine how far Micro–Credit has empowered them. The present study endeavors to analyse the
impact of Micro Credit through commercial banks on the members of Self Help Groups and offer
suggestions for the upliftment and empowerment of beneficiaries throughout Tamilnadu.
OBJECTIVES OF THE STUDY
The objectives of the proposed study are:
1. To analyse the systems of micro credit.
2. To gauge the impact of microcredit on the economic development of the beneficiaries.
3. To test the attitude of the members of the Self Help Groups with reference to the economic ,
social , psychological and political impacts and
4. To suggest ways and means for effective and efficient functioning of Self Help Groups in
Tamilnadu, India.
METHODOLOGY
Designing a suitable methodology and selection of suitable analytical tools are important for a
meaningful analysis of any research problem. This section of the thesis is devoted to the description of
the methodology which includes sampling procedure, period of study, collection of data and tools of
analysis.
Tamilnadu comprises of 30 districts. For the purpose of collecting primary data, district-wise
lists of beneficiaries have been obtained from the Project Office, District Rural Development Agency,
Programme Officer, Tamil Nadu Corporation for Development of Women Ltd., (TNCDW) and Non-
Government Organisations (NGOs) functioning inTamilnadu. 350 sample beneficiaries have
been selected at random from the all the districts proportionately.
The study is an analytical one and comprises both primary and secondary data. The secondary
data have been collected from publications, documents, annual reports, journals, magazines, books
and periodicals. Data at the district level have been collected from the records of Women
Development Department and MahalirThittam office in Tamilnadu

SYNDICATE - The Journal of Management
Volume 17, March 2017, ISSN 2278-8247
21
The selected respondents were contacted in person and the objectives of the study were
clearly explained to them and their co-operation was sought. The details regarding the general
categories of the sample respondents, their family characteristics, incomes, savings and the like
relating to the overall objectives of the study were collected from them through direct personal
interview method.
TOOLS OF ANALYSIS
In order to test the significant difference in the performance scores of different groups, based
on tenure of existence, literacy level of the leader of the group and the size of the membership, the
Kruskal-Wallis Test has been used.
12 R12
R22
Rk2
H = ------------ ( ------ + ------- + . . . . . . + -------- ) - 3(N+1)
N(N+1) n1 n2nk
Where
n1,n2,. . . nk are the number in each of k samples
N = n1+n2+ .... + nk and R1,R2, ... Rk are rank sums of each sample.
To study the social impact of micro credit on SHG members, the factors like the level of self-
confidence, behavioural changes and participation in social life have been taken into account.
With a view to finding out whether there is any significant difference in social conditions of
members between the period before and the period after joining the SHGs, the MC Nemar Test and
the Sign Test have been used.
MC Nemar Test
Before Membership After Membership
Do not favour Favour
Favour A B
Do not favour C D
(A - D - 1)2
2= ------------------ with d.f. = 1
(A + D)
Sign Test

SYNDICATE - The Journal of Management
Volume 17, March 2017, ISSN 2278-8247
22
n – 1
K = ---------- - 0.98 n
2
To study the economic impact of micro credit on SHG members and factors like value of
assets possessed, level of income earned by members, their expenditure pattern and their level of
savings before and after joining SHG have been considered.
To find whether there is any significant difference in the economic conditions before and
after joining the SHGs, the Sign Test has been used.
In order to analyse the perception of members on the impact of micro credit from SHGs, they
were asked to respond to 21 statements using Likert’s five point-scale starting from “Strongly Agree”
(5) to “Strongly Disagree”(1). These 21 statements have been grouped under the following four
categories:
i) Economic Impact
ii) Social Impact
iii) Psychological Impact and
iv) Political Impact
The perception scores have been classified into three groups:
(i) High perception: Scores above (Arithmetic Mean + Standard Deviation).
(ii) Moderate perception: Scores ranging from (Arithmetic Mean – Standard
Deviation) to (Arithmetic Mean + Standard Deviation); and
(iii) Low perception: Scores less than (Arithmetic Mean – Standard Deviation).
During the data collection, the data has been taken to reduce recall bias through cross check,
questions in interview schedule, the information furnished by the sample respondents may be
subjected to recall bias is the only limitation of this study.
MEASURE OF PERCEPTION ON IMPACT OF MICRO CREDIT:
In this study pertaining the members regarding the economic impact, social impact,
psychological impact and political impact created by the SHGs has been analysed with the help of a
scaling technique. For analysing each type of impact, the opinion of the members on five given
statements has been elicited on a five-point scale. By consolidating the scores obtained by every
sample member for each statement with the help of the five point scale viz SA – Strongly Agree (5),
A – Agree (4), NO- No opinion (3), D.A., Disagree (2) and S.D.A. – Strongly Disagree (1), the total
scores have been computed. The total scores secured by the sample 350 members show the
significance of each statement used to measure the economic impact, social impact, psychological
impact and political impact. The total scores for the four categories of impact shows the level of
significance of each category of impact from the standpoint of the sample members of the study.
Besides the total scores, the mean, median, quartiles and standard deviation also show the level of
perception of the respondents on various categories of the impact of the SHGs.
The perception of sample members on the four categories of impact such as economic impact,
social impact, psychological impact and political impact has been measured with the help of scores

SYNDICATE - The Journal of Management
Volume 17, March 2017, ISSN 2278-8247
23
allotted to five statements related to four categories of impact on a five point scale. The detailed
analyses of the statement, individual scores and total scores have been elucidated below.
PERCEPTION OF ECONOMIC IMPACT
Positive economic impact is the vital aspect of one’s development. The Self Help Groups
help their members to improve their economic conditions. The improvement in economic conditions
is seen through increase in savings, value of assets, quantum of borrowing and expenditure and
provision of employment opportunities.
The perception of the sample members on the economic impact has been ascertained by
taking into account the opinion of the members on the economic variables such as the capacity to
spend more, increase in value of assets, rise in income, improvement in the savings habit and
provision of employment opportunities.
Table 1 shows the opinion of 350 sample members on economic impact
Perception of Members AboutEconomical Impact
Sl.
No. Proposition S.A. A N O D.A. S.D.A.
Total
Scores
1.
Increase in the capital
after getting
microcredit
150
(42.90)
159
(45.40)
12
(3.40)
15
(4.30)
14
(4.00) 1466
2.
Increase in the
annual income after
getting microcredit
98
(28.00)
190
(54.30)
13
(3.70)
28
(8.00)
21
(6.00) 1366
3.
Increase in the
educational
expenditure after
getting microcredit
133
(38.00)
217
(62.00) -- -- -- 1533
4.
After getting
microcredit the
quality of food is
improved
71
(20.30)
207
(59.10)
31
(8.90) --
41
(11.70) 1317
5.
Increase in the
savings pattern after
getting microcredit
28
(8.00)
106
(30.30)
175
(50.00) --
41
(11.70) 1130
6.
After getting
microcredit the
productive asset is
increased
42
(12.00)
208
(59.40)
31
(8.90)
69
(19.70) -- 1273
7.
After getting
microcredit
availability of credit
source is increased
-- 134
(38.30)
94
(26.90)
122
(34.90) -- 1062
9147
Note: S.A- Strongly Agree, A – Agree, N.O. No Opinion, D.A. – Disagree,
S.D.A. Strongly Disagree.

SYNDICATE - The Journal of Management
Volume 17, March 2017, ISSN 2278-8247
24
It is found from Table 1 that the perception of members on the statement that the ‘Increase in the
educational expenditure after getting micro credit’ gets the maximum score followed by the statement
that ‘Increase in the capital after getting micro credit’. The statements that the ‘Increase in the annual
income after getting micro credit’, ‘After getting micro credit the quality of food is improved’, ‘After
getting micro credit the productive asset is increased’, ‘Increase in the savings pattern after getting
micro credit’ and ‘After getting microcredit availability of credit source is increased’ occupy the
third, fourth, fifth, sixth and seventh places respectively.
PERCEPTION ON SOCIAL IMPACT
SHGs create social awareness among the members. The perception on the social impact is
measured with the help of statements like social responsibility. Strength to protest against social
evils, power of decision-making on important matters, awareness about health and knowledge of
banking operations.
Table 2 shows the perception of members on the social impact of SHGs
TABLE 2
Perception of Members on Social Impact
Sl.
No. Statements S.A. A N O D.A. S.D.A. Total
Scores
1. Getting
Recognition in
domain
73
(20.90)
277
(79.10)
-- -- -- 1473
2. Getting
Recognition in the
society
31
(8.90)
319
(91.10)
-- -- -- 1431
3. Chance of
interaction with
outsiders
76
(21.70)
214
(61.10)
60
(17.10)
-- -- 1416
4. Improvement of
literacy / education
28
(8.00)
322
(92.00)
-- -- -- 1428
5. Improvement of
family welfare
awareness
28
(8.00)
255
(72.90)
67
(19.10)
-- -- 1361
6. Participation in
development
programmes
203
(58.00)
147
(42.00)
-- -- -- 1603
7. Improved quality of
life style after
getting the credit
32
(9.10)
144
(41.10)
111
(3.80)
63
(18.0)
-- 1195
9907
Note: S.A- Strongly Agree, A – Agree, N.O. No Opinion, D.A. – Disagree,
S.D.A. Strongly Disagree.

SYNDICATE - The Journal of Management
Volume 17, March 2017, ISSN 2278-8247
25
It is observed from Table 2 that the perception of the statement ‘Participation in
development programmes’ occupies the first place scoring the intensity value of 1603. The
statements such as ‘Getting Recognition in domain’, ‘Getting Recognition in the society’,
‘Improvement of literacy / education’, ‘Chance of interaction with outsiders’, ‘Improvement of
family welfare awareness’ and ‘The quality of life style after getting the credit’ occupy the second,
third, fourth, fifth, sixth and seventh places respectively.
PERCEPTION ON PSYCHOLOGICAL IMPACT
The SHG provides scope for development of the body and mind of an individual. The mind
accelerates the activities of the member and hence the psychological impact on the members has been
analysed. The psychological impact constitutes improving confidence, awareness on self-reliance,
societal status, awareness of cleanliness and improving literacy and communication skills.
Table 3 shows the perception of members on the psychological impact of members.
Perception of Members on Psychological Impact
Sl.
No. Statements S.A. A N O D.A S.D.A. Total
Scores
1. Getting decision
making power
28
(8.000
182
(52.00)
59
(16.90)
81
(23.10)
-- 1207
2. Improvement of
employment and
communication
skills
32
(9.10)
277
(79.10)
41
(11.70)
-- -- 1391
3. Creation of problem
solving capacity
28
(8.00)
221
(63.10)
73
(20.90)
28
(8.00)
-- 1299
4. Creation of
awareness for better
clean environment
32
(9.10)
178
(50.90)
64
(18.30)
16
(4.60)
60
(17.10)
1156
5053
Note: S.A- Strongly Agree, A – Agree, N.O. No Opinion, D.A. – Disagree,
S.D.A. Strongly Disagree.
It is illustrated from Table 3 that the perception of sample members of the statement that
‘Improvement of employment and communication skills’ occupies the first place with scores of
intensity value of 1391 followed by the statement such as ‘Creation of problem solving capacity’,
‘Getting decision making power’ and ‘Creation of awareness for better clean environment’ occupy the
second, third, and fourth places respectively.
OVERALL VIEW OF THE PERCEPTION SCORES
To ascertain the significance of the four categories of impact the average, median, first
quartile (Q1), third quartile (Q3) and Standard Deviation have been calculated.

SYNDICATE - The Journal of Management
Volume 17, March 2017, ISSN 2278-8247
26
Table 4 shows the perceptions of the respondents of the various kind of impact.
Details of Perception Scores of Respondents for Various Impact
Sl.No. Various Impact Mean C.V
1. Economic 26.13 3.10 11.86
2. Social 28.31 1.52 5.37
3. Psychological 14.32 2.56 17.88
4. Overall 68.76 5.48 7.97
It is evident from Table 4, that the perception of the sample members of social impact
occupies the first place (mean 28.31 and Standard Deviation 1.52) followed by perception of
psychological impact. The perception of economic impact and psychological impact occupies the
second and third place respectively. This indicates the positive motivation required for psychological
impact of the members of SHGs in Tamilnadu
EXTENT OF PERCEPTION OF VARIOUS IMPACTS
With a view to finding out the extent of the perception of the sample members of economic
impact, social impact, psychological impact, political impact and overall impact, the average scores
and standard deviation have been computed. The extent of perception falls under three categories
low, medium and high.
Low Below (Arithmetic Mean - Standard Deviation)
High above (Arithmetic Mean + Standard Deviation)
Medium from (Arithmetic Mean – Standard Deviation)
To (Arithmetic Mean + Standard Deviation)
The overview of the respondents’ perception scores of impact is depicted in Table 6.6.

SYNDICATE - The Journal of Management
Volume 17, March 2017, ISSN 2278-8247
27
Table: 5
Overview of Respondent’s Perception Scores for Various Impacts
Sl.N
o.
Various Impact Low Medium High
1. Economic impact 60
(17.14)
211
(60.29)
79
(22.57)
2. Social impact 28
(8.00)
221
(63.14)
101
(28.86)
3. Psychological impact 48
(13.71)
231
(66.00)
71
(20.29)
4. Overall impact 75
(21.43)
224
(64.00)
51
(14.57)
It is clear from Table 6 that the perception of a majority of sample members of economic
impact, social impact and psychological impact falls under the medium category. With regard to
overall impact 224 (64.00 per cent) members fall in the medium perception category, 51 (14.57 per
cent) fall in the high perception category and 75 (21.43 per cent) fall in the low perception category.
PERSONAL VARIABLES AND IMPACT
In order to find out the relationship between personal variables and the perception of impact,
the Kruskal Wallis one way ANOVA was test.
Age and Impact Perception Score
To test the null hypothesis that there is no significant difference in the perception scores of
impact among different groups of members classified according to age, the Kruskal Wallis Test has
been applied. The result of the test is depicted in Table 6
TABLE 6
Relationship Between Age and Perception Score - Kruskal Wallis Test
Sl.No. Category of Impact H value Level of
Significance
Result
1. Economic 17.53* 0.000 S
2. Social 18.09 * 0.000 S
3. Psychological 23.47* 0.000 S
4. Overall 19.22* 0.000 S
*Significant at 5 per cent level.S – Significant.

SYNDICATE - The Journal of Management
Volume 17, March 2017, ISSN 2278-8247
28
It could be observed from Table 6 that there is significant difference in the perception scores
of the sample members in respect of economic, social and psychological impacts. It indicates that age
influences the economic, social and psychological impacts. With regard to overall impact, the value
of level of significance is less than 0.05, the null hypothesis is rejected. Hence it is concluded that
significant difference exists in the perception scores among the groups according to age. It means that
age influences the overall perception scores of the members who have availed of micro credit.
Caste and Perception Scores of Impact
In order to test whether there is any relationship between the community and the perception
scores of impact, the Kruskal-Wallis test has been applied to verify the following null hypothesis.
There is no significant difference in perception scores of the impact among different groups of
members based on community. The results are shown in Table 7
TABLE 7
Relationship Between Caste and Perception Score –
Kruskal Wallis Test
Sl.No. Category of Impact “H” Value Level of
Significance
Result
1. Economic 13.79* 0.001 S
2. Social 2.19 0.334 NS
3. Psychological 103.76* 0.000 S
4. Overall 46.86* 0.000 S
*Significant at 5 per cent level.
S – Significant NS – Not Significant.
It is observed from Table 6.9 that there is a significant difference in perception scores among
different groups according to community for economic, psychological and overall impacts except
social impact. With regard to overall impact, the value of level of significance is less than 0.05, and
thus the null hypothesis is rejected. Hence it is concluded that the caste has an influence on the
perception of members on impact.
Marital Status and Perception Scores
In order to test the null hypothesis that there is no significant difference in the perception
scores among different groups based on marital status, the Kruskal – Wallis test has been used and the
resultes are presented in Table 8.

SYNDICATE - The Journal of Management
Volume 17, March 2017, ISSN 2278-8247
29
TABLE 8
Relationship between Marital Status and Perception Score - Kruskal Wallis Test
Sl.No. Category of Impact “H” Value Level of
Significance
Result
1. Economic 9.29 0.009 S
2. Social 4.32 0.115 NS
3. Psychological 38.41 0.000 S
4. Overall 13.30 0.001 S
*Significant at 5 per cent level. S – Significant NS – Not Significant.
It is depicted from Table 8 that there is a significant difference in perception scores among
different groups according to their marital status of the members for economic, psychological and
overall impacts except social impact. With regard to overall impact, the value of level of significance
is less than 0.05, which rejects the null hypothesis. Hence it can be concluded that the marital status
has an influence on the perception of members on impact.
Education and Perception Scores of Impact
In order to test whether there is any relationship between literacy level and perception scores
the following hypothesis has been framed. There is no significant difference in the perception scores
of impact among the different groups based on the level of literacy.
The results of the Kruskal-Wallis Test are shown in Table 9
TABLE 9
Relationship between Education and Perception Score
- Kruskal Wallis Test
Sl.No. Category of Impact “H” Value Level of
Significance
Result
1. Economic 71.24 0.000 S
2. Social 2.26 0.520 NS
3. Psychological 68.65 0.000 S
4. Overall 79.13 0.000 S
*Significant at 5 per cent level. S – Significant NS – Not Significant.
Table 9 portrays that there is a significant difference in perception scores among different
groups according to their educational status of the members for economic, psychological and overall
impact except social impact. With regard to overall, the value of level of significance is less than
0.05, the null hypothesis is rejected. Hence it is concluded that the educational status influences the
perception of members on impact.

SYNDICATE - The Journal of Management
Volume 17, March 2017, ISSN 2278-8247
30
CONCLUSIONS AND SUGGESTIONS
It is inferred that before joining SHGs only 34 (9.70 per cent) members had the positive
response whereas 332 (94.90 per cent) members have show positive response in helping neighbours
after joining them. This shows that association with SHGs induces helping tendency among the
members of SHGs in Tamilnadu. Regarding the McNemer test, it is found that the calculated values
of the chi-square for self-confidence are significant at 5 per cent level and the value of level of
significance is less than 0.05 resulting in the rejection of the null hypothesis. Hence it can be
concluded that there is significant difference in self-confidence among the sample members before
and after joining the SHGs in Tamilnadu It is understood that only 30 (8.60 per cent) members took
decision as to house building, education of children and buying of household articles by themselves
before joining SHGs while 334 (95.40 per cent) members have taken decision as regards the above.
It is revealed that only 26 (7.40 per cent) members took part in taking decision relating to
marriage of their girls before joining SHGs while 328 (93.70 per cent) have taken part in deciding it.
It is found that only 20 (5.70 per cent) members took part in taking decision relating to marriage of
their boys before joining SHGs while 332 (94.90 per cent) of them have taken role in decision
relating to it. It comes to light that before joining SHGs only 99 (28.30 per cent) did join in taking
decision relating to their children’s education while 325 (92.90 per cent) have shown positive
response after joining SHGs in taking decisions by themselves with regard to the children education.
It could be seen only 76 (25.3%) members showed positive response before joining SHGs while 248
(82.7%) have shown positive response after joining them.
It is observed that average a member saved Rs.3136.56 on an average annually before joining
SHG. After joining the SHG, this has increased to Rs.6116.60. The major agencies with which
savings were deposited are chit funds and commercial banks before and after joining the SHG. The
savings with banks has recorded an increase in savings after the formation of the SHGs. The
members of SHGs have also started depositing the savings with post offices.
It is found that 232 (66.28 per cent) sample members could save only up to
Rs.2000 before joining SHG whereas 98 (28.00 per cent) members could save up to Rs.2000 after
joining the SHGs. This shows an increase in the savings of the members.It is shown that the
employment of members which works out to 257 man days has increased to 355 man days a year after
becoming members of SHG. Thus 98 man days have increased because of their joining SHG. While
128 (49.80 per cent) man days of employment were generated by agriculture based activities before
they became members of SHGs, 162(45.64 per cent) man days have been generated after they became
as members of SHG.It is found that before becoming members SHG in the SHGs, 13.30 per cent of
the households had less than Rs.25000 a year whereas after becoming members of SHG there is no
household in that income category a year. This indicates that there is substantial increase in the
income of the households.
It is revealed that the expenditure of 17 (4.85 per cent) members is less than Rs.5000, whereas
none of the members falls under this category after joining SHGs. It also shows that the expenditure
of 45 (12.86 per cent) members was in the category of Rs.10001-15000 after they became members of
SHGs whereas 32 (9.15 per cent) members incurred has expenditure of Rs.10001-15000 and above
before becoming members of SHGs.
It is understood that the consumption expenditure per year for a member was Rs.4513.25
before becoming a member of SHG whereas it is Rs.9652.55 after becoming a member of SHG. It
also shows that the expenditure on food accounted for Rs.1172.85 (25.99 per cent) before their
becoming members of SHGs, while it was Rs.4155.14 (43.06 per cent) after their becoming members

SYNDICATE - The Journal of Management
Volume 17, March 2017, ISSN 2278-8247
31
of SHGs. The proportion of expenditure on clothing, education, health and festivals increased after
their becoming members of SHG’s, when compared to those of non-members of SHGs.
In the light of the above discussion and findings, the following suggestions are made:
It is suggested that the NGOs should be prevented from interfering with the SHG movement.
Steps should be taken to keep them as voluntary organizations. They should not be allowed to
use extraneous influences.
Savings by the members is one of the main indicators of economic development. So, the
banks and post offices should introduce attractive, user – friendly schemes to encourage the
saving habit among the members of SHG.
The SHG entrepreneurs face the problem of marketing their products. Arrangements should
be made to market the products through Public Distribution System (PDS) efficiently and
effectively.
SHG women are more poverty sticken and have experienced its effect in society. Since they
themselves fight against poverty by being members of SHG and move upwards from below
poverty line, in future, the poverty alleviation programmes can be implemented through
SHGs, They can monitor themselves effectively, with all enthusiasm and involvement.
A growing unhealthy competition is visible between MahalirThittam approved NGOs and
other SHGs promoted by NGOs in the study area. Such unhealthy competition must be
removed; otherwise it will spoil the entire concept of the programme. For this, the area or
villages can be clearly segregated and only one participation agency should be permitted in a
village.
Overlapping and dual memberships should be avoided and mobility should not be encouraged
among the SHG members between the groups.
The training system should link up with some kind of credit delivery mechanism whether
formal or informal. It is suggested that more number of groups should be linked with the
banks so that their credit support would be strengthened.
Institutional credit facility must be extended to women to develop their managerial skill for
prompt repayment consciousness.
Micro – Finance should be used to meet the immediate demand of the poor women – for
Health, Education or consumption purposes. This will improve the quality of their life and
will be ready to take active participation in economic activities.
Exposure visits to other successful groups can be organized to share the knowledge,
experience and expertise.
Annual plans for SHG activities should be done by the group consulting the NGOs. Group
leaders from different villages can meet monthly once and present the progress of their
groups.
Income generating activity should be based on available local resources and a reasonably
assured market with profits.
The NGOs can provide some common services to the Self – Help Groups for procurement of
raw materials, marketing etc.,

SYNDICATE - The Journal of Management
Volume 17, March 2017, ISSN 2278-8247
32
Among all the sectors, agricultural sector lacks behind in earning income. This sector can
engage them in contract farming and cultivate profitable crops..
Combined group activism with social participation may be encouraged through imparting
training and motivation to animators on the concepts like group cohesiveness, basic
maintenance of records and success stories of other groups.
The facilitators like NGOs, and banks should communicate information to startself
employment in the field which provides ample opportunities for income generation with the
locally available raw materials.
Though these groups have made a positive impact on SHG women, SHG members suffer from lack of
motivation, backward and forward linkages.
References
1. Christabell. P.J.,, “Women Empowerment through Capacity Building”, The Role of Micro-
Finance, University of Kerala, 2003.
2. Dunkley, Graham, People for Change: A Study of four CCA Projects in India Melbourne:
Department of Applied Economics, Victoria university of technology and community aid
Abroad/Freedom from hunger, 1993.
3. Morduch, J and Haley, B., Analysis of the effects of Microfinance on Poverty Reduction,
CIDA, Ottawa, 2001.
4. Murthy. R.K., Raju, K. and Kamath, A., Towards Women’s Empowerment and
PovertyReduction, Lessons from the participatory Impact Assessment of South Asian Poverty
alleviation programme in Andhra Pradesh, India, mimeo, 2005.
5. PandminiSengupta, The Study of Women in India, New-Delhi, Indian Book Company, 1974.
6. ArifHasan and MansoorRazaFrom Micro-finance to the Building of Local Institutions: The
Evolution of Micro-credit Programme of the OPP's Orangi CharitableTrust, Karachi,
Pakistan, Oxford University Press, OUP Catalogue. UK, 2012.
7. Samanta, R.K., Empowering Rural Women Issues and Opportunities and Approaches”,
Published by the Women Press, Delhi, 2005.
8. SamirendraNathDhar, Micro–Finance for Women, Northern Book Centre, New Delhi, 2005.
9. Shirvastava, Feminised Women Empowerment, Rawat Publications jupal and New Delhi,
2001.
10. Todd, Helen, Women at the Centre: Grameen Bank Borrowers after one Decade, Oxford:
West View Press, New Delhi, 1996.
11. Gangaiah, C, B. Nagaraja, Vasudevulu Naidu, C., “Impact of SHGs on Income and
Employment”, Kurukshetra, Vol.54, No.5, March 2006.
12. Goetz, A M and Sen Gupta, R., ‘Who takes the credit? Gender, Power and Control over loan
use in Rural Credit Programmes in Bangladesh”, World Development, Vol.24 (1), 1996.

SYNDICATE - The Journal of Management
Volume 17, March 2017, ISSN 2278-8247
33
A REVIEW ON CORPORATE SOCIAL RESPONSIBILITY WITH
SPECIAL REFERENCE TO PROCTER & GAMBLE COMPANY,
INDIA
Ms. P. Suganya Devi
Assistant Professor Department of Business Administration
Saveetha School of Law, Saveetha University
INTRODUCTION
In the years since the early 1990s, the call for what is termed “corporate social responsibility”
(CSR) has gained significant momentum in many countries. Businesses are said to have a
responsibility not only to generate economic returns for shareholders, but also to the natural
environment as well as “stakeholders,” including customers, employees, suppliers, creditors, and the
communities impacted by the company. We hear reference to the company’s “triple bottom line” to
measure performance for shareholders, environment and stakeholders. Everyone is talking about CSR:
government officials in many countries around the world, intergovernmental organizations such as the
United Nations and the European Union, non-governmental organizations (NGOs) which work to
better the condition of the poor or which work toward various environmental or social causes, and of
course companies, business leaders and business associations. Articles, books and seminars have
spread the call for CSR, and a cadre of consultants and experts has developed around the issue. Many
larger companies now publish a CSR report alongside the company annual report, employ a CSR
executive to advise the business at the highest level and prominently display the company’s CSR
credentials on the company website. Business schools have woven CSR into their academic programs.
Over the past 15 years, CSR has become an important theme.
OBJECTIVES OF THE STUDY
To identify the awareness level of firms towards CSR.
To find the factors that influences the consumers to prefer P&G brand products.
To study the CSR strategy used in P & G.
To analyse and evaluate the factors influencing CSR.
To suggest optimistic views on CSR in P & G products.
NEED OF THE STUDY
CSR strategy at P & G reviews tries to find the awareness and its product line with other competitors.
It provides the company’s background, operational & other important information provided by the
company, which would assist in taking decision for the right brand extension strategy.
LIMITATIONS OF THE STUDY
A huge skill gap between the NGOs and Corporate working when it comes to reporting,
documentation etc on part of NGOs , So, there’s limitation in getting quality reporting till the time
concerned NGO personnel reaches to required standard of skill and for this corporate needs to invest
good and dedicated 'Time' - which is again a limitation.

SYNDICATE - The Journal of Management
Volume 17, March 2017, ISSN 2278-8247
34
REVIEW OF LITERATURE
Topic: Consumer products in rural market areas – Brand loyalty in CSR.
Authors: Nandagopal, Ganesamoorthy&Chinnaiyan: 2003.
Abstract: The area of study was Erode district of Tamil Nadu and thesis of the sample taken was 50
respondents and simple random survey was conducted. He concluded that now day’s products are
flowing from rural to urban areas and urban to rural areas. Even premium brands are gaining wide
acceptance in the rural bastions. Increasing awareness has led to significant changes in buying
behavior and consumption habits. The urban market is getting increasingly competitive and saturated.
There is less scope for growth in the urban markets, especially for the already established categories.
Today, the rural market is blooming with increase in the disposable incomes of the households.
Topic: “Where the FMCG market is sizzling in CSR- A Study of Rural Markets”
Authors: Oza, Jamal & Goode: 2004.
Abstract: His study examined the rural consumer’s psyche for FMCG products. The survey was
conducted with a sample size of 200 in villages of Baroda. Convenience sampling was used. He
concluded that using easily available technology, strong local area knowledge, a short supply chain
and quality raw material regional players are giving big brands a run for their money. The regional
brands are making their aggressive presence in smaller towns by participation in melas and
exhibitions. They are giving distributors and retailers better margins in rural areas.
CORPORATE SOCIAL RESPONSIBILTY
The first understandings of CSR – “strategic CSR” – links the “responsibility” of business toward the
environment and stakeholders (beyond the legal and ethical minimums) to the company’s economic
well-being. In other words, in this version of CSR, companies should be interested in environmental
or stakeholder issues whenever those programs would simultaneously benefit the company. In this
way this view sees CSR as a complement to the main business objective of the corporation. The
company should look not only at its final products and services, but also at the way it creates its
product or service as well as the general way it engages in business. Then, in each area the company
should ask if it can make changes or engage in activities that will be better for the company and
produce better environmental or social results. It may be a new or redesigned product or service that is
more environmentally friendly, or it may mean taking up a cause or contributing aid with respect to a
particular environmental or social issue on the community, national or international level. It may be
pursued by the company alone or in partnership. In fact, it is becoming more and more common to
find partnerships between a company and a non-governmental organization (NGO) which is
active on the environmental or social cause. CSR: “Corporate social responsibility is a
commitment to improve community wellbeing through discretionary business practices and
contributions of corporate resources.” A number of possible benefits, including one or more of the
following: • Reducing costs (manufacturing, packaging, transportation); • Attracting and retaining
better employees; • Avoiding legal violations; • Improving relations with government; • Building a
better image for consumers (strengthening brand positioning and increasing sales); • Avoiding

SYNDICATE - The Journal of Management
Volume 17, March 2017, ISSN 2278-8247
35
boycotts and protests organized by NGOs; • Developing a market for a new (environmentally-
friendly) product or service.
COMPANY PROFILE – PROCTER & GAMBLE (P&G)
An American multinational American multinational consumer goods company headquartered
in downtown Cincinnati, Ohio, United States, founded by William Procter and James Gamble, both
from the United Kingdom, Its products include cleaning agents and personal care products. Before the
sale of Pringles to the Kellogg Company, its product line included foods and beverages. In 2014, P&G
recorded $83.1 billion in sales. On August 1, 2014, P&G announced it was streamlining the company,
dropping around 100 brands and concentrating on the remaining 65 brands, which produced 95% of
the company's profits. A.G. Lafley, the company's chairman, president, and CEO until October 31,
2015, said the future P&G would be "a much simpler, much less complex company of leading brands
that's easier to manage and operate".David Taylor became P&G CEO and president effective
November 1, 2015. As of July 1, 2016, the company structure has been categorized into ten categories
and six selling and market organizations. Categories are Fabric care, Home care, Grooming, Oral care,
Baby care, Feminine care, Family care, Personal health care, Hair care, Skin and personal care,
Selling and market organizations, Asia Pacific, Europe, Greater China, India, the Middle East, and
Africa (IMEA), South America&North America.
Most people don’t think about science and technology when we diaper our babies with Pampers, wash
our hair with Head & Shoulders, clean our clothes with Tide or Ariel, soften our fabrics with Downy
or Lenor, or care for our skin with Olay. But there is a remarkable, often surprising amount of science
in these products we use every day — science that has transformed our day-to-day lives even though
we don’t always see it. There are equally remarkable scientists behind these products — women and
men who are among the world’s foremost experts and who have dedicated their careers to
understanding us, head to toe, at every stage and every age, so they can bring amazing science into
our homes every day. Innovation is the lifeblood of P&G, a company that began with a bar of soap, a
box of candles, and a handshake between two men who believed everyday products could and should
be of the highest quality. Their belief inspires P&G people throughout the world still today, and it’s
one of the reasons we are consistently ranked as one of the most innovative companies in the world.
P&G CORPORATE SOCIAL RESPONSIBILITY ACTIVITIES
For more than 175 years, doing the right thing has been at the core of our purpose, values and
principles. That includes investing in the communities where we live, work and serve. We have a long
-standing history of giving back to the communities where we live and work. Health& Hygiene -
P&G are delivering programs that promote healthy behaviours that can prevent illness and improve
confidence for people in need. With hand washing, tooth brushing and personal hygiene instruction
combined with improved access to sanitation facilities, children and teens learn the value of healthy
hygiene habits and the positive resultsin adopting healthy behaviours. A number of our beauty care
brands have programs that provide their brand benefits to promote health and confidence. Brand &
Corporate Programs - The P&G Children's Safe Drinking Water Program (CSDW) uses an innovation
that P&G created to transform potentially deadly water into clean, drinkable water. To date, the
program has been implemented in more than 75 countries and has committed to delivering 15 billion
liters of clean drinking water by 2020. Pampers Vaccination Program - Pampers and UNICEF are
working to vaccinate women and children around the world from maternal and neonatal tetanus

SYNDICATE - The Journal of Management
Volume 17, March 2017, ISSN 2278-8247
36
(MNT). The program has reached consumers across Europe, resulting in the elimination of MNT from
15 countries through more than 300 million vaccine donations. Comforts of Home - P&G is providing
everyday essentials that help create the experience of home for families who can't afford them or who
have been displaced. We leverage the strength of partner organizations to deliver programs which
help address both short-term and long-term housing-related issues including those associated with
sanitation and water. Our employees team up as volunteers to build, clean and repair homes in
virtually every region where P&G conducts business. They also come together to assemble kits of
personal hygiene and/or home care products which are readied for delivery in immediate response to
disaster impacted areas. Disaster Relief - Our commitment to support victims after widespread
disasters is a natural expression of our Purpose to improve lives. Our response is anchored in product
donations and in the event of large-scale disasters, we have developed mobile relief units to provide
products and services directly to those in the most highly impacted areas. From our soap and personal
hygiene products to our laundry, diaper and cleaning products, our brands can help restore a sense of
normalcy to the disrupted lives of those caught in the aftermath of a disaster. Habitat for Humanity
International - P&G has partnered with Habitat for Humanity in their efforts to provide decent, safe
and affordable places to live for families in need by sponsoring home builds around the world.
Thousands of our employees come together to help build and clean homes for first-time owners
committed to provide a home for their families. We also provide P&G products through gift baskets to
first time owners along with education on how to care for their home.
Committed to responsible operations - Our policies and practices define the behaviour we expect
from our organization, employees and suppliers. We always seek to provide a clear perspective on our
operating practices while living up to our Purpose, Values and Principles. Animal Welfare and
Alternatives - At P&G, we believe that eliminating animal testing is the right thing to do. Learn more
about efforts to eliminate animal testing. California Transparency Act - Our policies and practices
define the behaviour we expect from our organization, employees and suppliers. We always seek to
provide a clear perspective on our operating practices while living up to our Purpose, Values and
Principles. Conflict Materials - We're committed to ensuring that we don't source conflict minerals
that fund armed groups in the Conflict Region. Human Rights Policy Statement - Effective April 21,
2014, P&G renewed its commitment to human rights through a single policy statement. Supplier
Sustainability Guidelines - We seek to uphold both the spirit and letter of the law and maintain high
ethical standards wherever we seek business. Our supplier sustainability guidelines outline the
expectations of our suppliers to ensure they uphold our high ethical standards in their own operations
and that of their partners.
SUGGESTIONS
“To look forward to improving and touching life in many aspects. CSR is not a business
undertaking, but it’s the responsibility that helps strengthen business partnership,” the
managing director noted.
Employees can be encouraged to volunteer and take part in the schemes, are inspired by the
company’s commitment to improve the commitment of the company for social affairs
The main scheme, like training programme, targets equipping women with new business
ideas enriching women employees to participate in CSR.
Special education-oriented project, could be been trained to provide learning classes to the
underprivileged, as well as to those with disabilities.
“Being a good corporate citizen not only strengthens the equity of brands, but also the total
company,” should be clearly understood by all the corporate firms.

SYNDICATE - The Journal of Management
Volume 17, March 2017, ISSN 2278-8247
37
CONCLUSION
This article begins with a discussion of the principal reasons why the role of companies in society has
become such a prominent issue in many countries today. The discussion then explores the definition
of CSR—as will be seen, exactly what constitutes a “socially responsible” corporation is by no means
clear. Many different conceptions of CSR can be found, especially in the US and many European
countries. CSR may appear to be an uncontroversial extension of the company’s role in society—after
all, few businesses would want to be known as “socially irresponsible.” India is the only nation with
mandatory CSR. It means we cannot learn from experience of others. Corporate thinks that anyone
can handle responsibility to execute CSR projects/activities whereas NGOs think they are the masters
of social development project. Value connection between Corporate and NGOs is missing so far.
Overhead expenditure should not exceed 5% of CSR budget. Therefore, it is difficult for small profit
generating companies to hire specialists for the job. Insufficient skilled, trained and efficient
professionals in market. At the same time corporate are not in hurry to make a professional team
within organization. Very thin line between activities under CSR and other compliances. I have
witnessed how corporate are showcasing activities like creation of water bodies as a CSR activity
whereas, the work was mandatory for the company
References
1. For a more complete discussion of these issues, see Martin Wolf, Why Globalization Works
(New Haven: Yale University Press, 2004), pp. 220-48; JagdishBhagwati, In Defense of
Globalization (Oxford: Oxford University Press, 2004), pp. 162-95; and John Micklethwait
and Adrian Wooldridge, The Company: A Short History of a Revolutionary Idea (New York:
Random House, Inc., 2003), pp. 175-79.
2. Philip Kotler and Nancy Lee, Corporate Social Responsibility: Doing the Most Good for
Your Company and Your Cause (Hoboken, New Jersey: John Wiley & Sons, 2005), pp. 3.
Kotler and Lee go on to define “community well-being” to include “human conditions as well
as environmental issues.” Ibid.
3. 10 Another list has been developed by Philip Kotler and Nancy Lee. Ibid., pp. 10-11.
4. 13 Kotler and Lee, Corporate Social Responsibility, p. 63.
5. 15 David Henderson, The Role of Business in the Modern World: Progress, Pressures and
Prospects for the Market Economy (Great Britain: The Institute of Economic Affairs, 2004),
p. 27; emphasis added.
6. 16 Stephen Davis, “Civil Society and Civil Economy: The Next Decade of Corporate
Governance,” Center for International Private Enterprise Economic Reform Feature service.
7. 19 Interfaith Center on Corporate Responsibility, “Corporate Governance Goals
andObjectives.” http://www.iccr.org/issues/corpgov/goalsobjectives.php. [October 25, 2005]
8. 20AsYouSow,“CorporateSocial Responsibility.” http://www.asyousow.org/csr/csrp.shtml
[July 14, 2007]
9. 33 David Vogel, The Market for Virtue: The Potential and Limits of Corporate Social
Responsibility (Washington, D.C.: The Brookings Institution, 2005).
10. 32 John Mueller, Capitalism, Democracy, and Ralph’s Pretty Good Grocery (Princeton:
Princeton University Press, 1999), p. 17.
11. 24 Clarence Page, “Some Companies Look to Combine Business with Social Conscience,”
The Online NewsHour. http://www.pbs.org/newshour/bb/entertainment/july-dec06/trade_12-

SYNDICATE - The Journal of Management
Volume 17, March 2017, ISSN 2278-8247
38
27.html [February 12, 2007]
12. 23 Kotler and Lee, Corporate Social Responsibility, p. 3. Indeed, the dust jacket states: “In
today’s world, it is no longer just acceptable that a corporation does well by doing good. It is
expected.”
13. 22 Jonathan P. Charkham, Keeping Better Company: Corporate Governance Ten Years On
(Oxford: Oxford University Press, 2005), p. 386.

SYNDICATE - The Journal of Management
Volume 17, March 2017, ISSN 2278-8247
39
MEASUREMENT OF PRODUCTIVITY IN NON BANKING
FINANCIAL COMPANIES IN TAMILNADU
Dr. D. Venkadesh
Assistant Professor & Research Advisor
PG & Research Department of Commerce
A.V.V.M. Sri Pushpam College (Autonomous), Thanjavur
Abstract
In recent times, non banking financial companies (NBFCs) have emerged as substantial
contributors to the Indian economic growth by supplementing the efforts of bank and other
development financial institutions. NBFCs play a key role in the direction of savings and investments.
On the basis of their legal status and their principal activities, the NBFCs have been classified as Loan
Company, Hire purchase finance company, Equipment leasing company, Investment Company and
Residuary non banking company. The scope of the NBFCs is fast growing with the multiplication of
financial services. Some of the NBFCs are also engaging in underwriting through subsidiary units,
and by offering allied financial services including stock broking, investment banking, asset
management and portfolio management. In this paper discussed to appraise the productivity of
selected NBFCs. Productivity is a vital indicator of economic performance of an economic system. In
fact, it is a mechanism for improving the material quality of life. Productivity is fundamental to
progress throughout the world. It is at the heart of economic growth and development, improvements
in standards of living and quality of life. In this paper mainly focused on branch productivity and
employee productivity of selected NBFCs.
INTRODUCTION
Non banking financial company is a company registered under the Companies Act, 1956 and
is engaged in the business of loans and advances, acquisition of shares, stock, bonds, debentures or
securities issued by government or local authority or other securities of like marketable nature,
leasing, hire-purchase, insurance business, chit business but does not include any institution whose
principal business is that of agriculture activity, industrial activity, sale/purchase/construction of
immovable property. A non banking institution which is a company and which has its principal
business of receiving deposits under any scheme or arrangement or any other manner, or lending in
any manner is also a non banking financial company.
Productivity is a vital indicator of economic performance of an economic system. In fact, it is
a mechanism for improving the material quality of life. Productivity is fundamental to progress
throughout the world. It is at the heart of economic growth and development, improvements in
standards of living and quality of life.
Productivity is commonly defined as a ratio of a volume measure of output to a measure of
input use. It also defined as the goods and services produced per unit of labour, capital or both. The
ratio of output to labour and capital is a total productivity measure. In simple words, productivity is
the output per unit of input employed. The basic formula of productivity is:

SYNDICATE - The Journal of Management
Volume 17, March 2017, ISSN 2278-8247
40
Total Output
Productivity = -----------------------------
Total Input
Productivity = Output per unit of input
Productivity measures the efficiency of the production system. Higher productivity means
producing more from a given amount of input or producing a given amount with minimum level of
inputs. In other words the more the output from one worker or one machine (or a piece of equipment)
per day per shift, the higher is the productivity. Higher productivity is not to be taken in sense of
higher workloads or faster machines alone but it is always elimination of waste of all type of labour
(time and skill), machine time, capital, and material management, etc.
STATEMENT OF THE PROBLEM
The following as the common problems faced by NBFCs. i. Stiff competition among NBFCs as
well as with banking sector; ii. Small balance sheet size resulting in high cost of funds and low asset
profile; iii. Prudential norms, especially, non performing assets; iv. Inadequate expertise in asset and
liability management; v. Lack of experience in lending and recoveries; and vi. The interest rates
charged by NBFCs for financial assistance are higher than those charged by commercial banks and
other organized financial institutions. The problems are common to all NBFCs. Still, there are some
NBFCs which are thriving well and keep on progressing. They develop their performance making
appreciable improvements in all parameters of business, such as, deposit mobilization, credit
deployment, income generation, control of expenses, low level of NPA, capital adequacy ratio,
comfortable liquidity, etc. There are also some NBFCs which are straggling a lot to make progress.
Hence it is attempted in this study to analyze the productivity performance of sample NBFCs in detail,
applying systematic analytical approach and find out the valid causes in order to bring out possible
remedial measures, so that NBFCs can prepare themselves to solve the problems and to make
continuous progress.
OBJECTIVES OF THE STUDY
The study covering a period of ten years from 2002-03 to 2011-12 has the following
objectives:
1. To analyze the Branch productivity of the selected NBFCs; and
2. To appraise the Employee productivity of the selected NBFCs
METHODOLOGY
Survey method has been followed for this study. Secondary information has been collected
through various sources. Data collected from secondary sources includes annual reports of selected
NBFCs, RBI reports and leading journals in the field of commerce and management and related
websites. In the course of the analysis in this study, the use of various accounting and statistical
techniques has been made. Ratio analysis, mean, standard deviation, coefficient variation and
ANOVA test have been applied.

SYNDICATE - The Journal of Management
Volume 17, March 2017, ISSN 2278-8247
41
SAMPLING
Stratified random sampling method has been followed for this study. The registered NBFCs
with RBI stratified into ‘NBFCs which accept deposits’ and ‘NBFCs which do not accept deposits’.
Two companies from ‘accepting deposits category’ and two companies from ‘not accepting deposits
category’ were selected for this study using the above sampling method. Thus four companies are
considered, they are Sundaram Finance Limited (SFL), Sriram City Union Finance Limited (SRFL),
Cholamandalam Investment and Finance Company Limited (CFL) and Darani Finance Limited
(DFL). First two companies have been registered with RBI under accepting deposits category and
other two companies have been registered with RBI under not accepting deposits category.
PRODUCTIVITY IN NBFCS
The concept and definition of productivity as applied in manufacturing industries cannot be
applied as such in NBFCs, because it is primarily a service industry. In the field of non banking
finance companies, the various products are: accounts, services for guarantees, various kinds of loans
like housing loan, car loan, etc. Identification and measurement of output in non banking finance
companies is a very difficult exercise, as it is not possible to bring various services to measure output.
However, non banking finance companies, being an important economic activity, cannot afford to
loose sight of the concept of productivity. Application of the concept in the Indian non banking
industry becomes all the more difficult, as it gets associated with such diverse aspects like operational
cost effectiveness, profitability, customer services and priority sector lending in rural and backward
regions. But it is a fact that non banking finance companies are the mirror of an economy. Therefore,
better functioning of NBFCs sector may lead to the overall improvement of the economy. In fact,
NBFCs act as a link between those who want to save and those who want to invest. So improvement
in the productivity of the non banking sector is very much needed. In case of NBFCs, difficulty is not
in applying the broader concept of productivity as ratio of output and input, but is in measuring output
in the form of services. The concept of productivity analysis in non banking sector may give
misleading results, if not used carefully. Productivity at the national level is dependent on various
factors like per capita income, saving habits and banking habits. In addition to these, there are
regional variations which affect the productivity of various players in the non banking field. So, in
order to have a reliable idea of productivity, it is necessary to analyze every segment, different sizes
of NBFCs and their region wise positioning. Productivity of selected NBFCs is analyzed in two
aspects, viz., i. Branch productivity, and ii. Employee productivity.
BRANCH PRODUCTIVITY OF NBFCS
While evaluating the results in terms of infrastructural facilities utilized by the NBFCs at
various locations and places, six indicators have been used. The following are the ratios employed in
this study to analyze the Branch productivity performance of the selected NBFCs. 1. Advances per
branch and 2. Deposits per branch
ADVANCES PER BRANCH
This ratio has been computed by dividing the amount of total advances by the number of
branches of the NBFCs. Advances per branch of selected NBFCs are presented in Table 1.
The following are the inferences derived from the analysis of the data provided in table 1.
The per branch productivity in granting advances in SFL shows the highest level in 2005-06
and it is the lowest in 2002-03 for the decade of the study. Only 4 out of 10 years of study, the ratio
shows more than the mean of Rs.1905.52 lakhs. The results are encouraging from 2008-09 as the
productivity figures show a rising trend. The number of branches of SFL has been increasing

SYNDICATE - The Journal of Management
Volume 17, March 2017, ISSN 2278-8247
42
throughout the decade from 122 in 2002-03 to 542 in 2011-12. The quantum of advances also has
shown a continuous positive growth throughout the decade of study. However the productivity ratio
has not set any trend of increase or decrease, but from 2008-09 it showed annual increase. The
performance in granting advances by SFL is encouraging and it must be continued to progress further.
The per branch advances ratio of SRFL shows an increasing trend from 2002-03 to 2005-06
and thereafter declined annually up to 2010-11 with a small increase in 2009-10. In 2011-12, the ratio
jumped up to Rs.1864.50 lakhs from the decade’s lowest ratio of Rs.5.67 lakhs in 2010-11. The sharp
increase is surprising. The SRFL has multiplied its advances in 2011-12 to Rs.1072087.65 lakhs by
more than 300 times of its advances of 2010-11 Rs.3162.84 lakhs. Though the increase in
theadvances is on the high side during the mid years of the decade, the shocking growth in 2011-12 is
glaringly visible from the given figures and this is reflected in the ratio. The SRFL has increased its
number of branches gradually from 161 in 2002-03 to 575 in 2011-12, through an annual positive
increase throughout the decade. The sharp increase in advances in 2011-12 is unfortunate, and such
growth will lead to many future problems in monitoring and recovery of advances. SRFL must avoid
such bulk increase in advances in future.
TABLE – 1
ADVANCES PER BRANCH
(In Lakhs)
Year SFL SRFL CFL DFL
2002-03 1358.54 13.48 278.70 43.35
2003-04 1881.33 18.05 329.17 43.54
2004-05 2337.08 30.32 225.57 50.33
2005-06 2518.14 52.70 15.37 55.67
2006-07 2346.72 46.68 11.96 23.48
2007-08 1520.54 30.41 16.69 69.11
2008-09 1492.77 6.29 54.13 78.61
2009-10 1668.82 14.60 98.08 108.00
2010-11 1854.78 5.67 100.64 69.23
2011-12 2076.51 1864.50 20.10 75.94
MEAN 1905.52 208.27 115.04 61.72
SD 382.41 552.29 113.27 22.44
CV (%) 20.07 265.18 98.46 36.36
Source: Compiled from annual reports of the NBFCs
TABLE – 1A
ANOVA of Advances per Branch
Source of
Variation Sum of Squares
Degrees of
Freedom Mean Square F
Between Groups 23797725.49 3 7932575.16 64.46455158
Within Groups 4645918.3 36 123053.29
Total 28443643.79 39

SYNDICATE - The Journal of Management
Volume 17, March 2017, ISSN 2278-8247
43
The advances per branch ratio of CFL have not set any upward or downward trend during the
decade of study. From 2005-06, the ratio has come down drastically up to 2007-08. Thereafter for
three years the ratio improved, but in the last year of the decade, the ratio again fall down to Rs.20.10
lakhs while the mean is Rs.115.04 lakhs for the decade. The advances portfolio of CFL has brought
down the quantum of advances sharply to mere Rs.1921.81 lakhs in 2005-06 from its previous year
figure of Rs.27068.07 lakhs. From 2006-07, the advances of CFL has grown annually up to 2010-11
(Rs.23750.50 lakhs), but the figures fall down to Rs.7536.30 lakhs in 2011-12. In case of number of
branches, it increased from 80 in 2002-03 to 230 in 2007-08. The number ofbranches sharplyreduced
to 140 in the following year, 2008-09. Thereafter the number of branches increased to 375 in 2011-12.
The varied levels of advances during the years of the decade is reflected in the ratio. CFL must take
steps to have definite advances policy to improve the portfolio and in expansion of branches, so that
the productivity of CFL register a continuous, but a consistant growth in future.
The productivity ratio of advances per branch in DFL has shown fluctuations throughout the
decade. The DFL had only 7 branches during the first 5 years of the decade. In the second half of the
decade DFL has only one branch. The quantum of advances shows more than the decade’s mean
during the first half of the decade. However, the quantum of advances has been brought down along
with the number of branches from 2007-08. During the end of the decade the advances have shown
some sign of the growth. DFL must have definite policy in lending and in expansion of branches so as
to compete in the competitive finance market of future years.
All the four NBFCs have comfortable productivity ratio of advances per branch in the last two
years of the decade of study. Except DFL, the other three NBFCs have increased their number of
branches 4 to 5 times in 10 years time. In case of quantum of advances, the figures show fluctuations
in 3 out of 4 NBFCs and in SFL, the advances have grown gradually throughout the decade with
positive annual growth. The sharp increase in advances in SRFL in 2011-12, the sharp decline in
advances in CFL 2005-06 have affected the gradual growth of the ratio in both the NBFCs. Except
SFL, the other three NBFCs need to have a strategic plan for improving their advances portfolio.
Relatively these NBFCs should be careful in increasing the number of branches without affecting the
productivity efficiency. In other words, the branch expansion must be done after studying the viability
for the branch with reference to the NBFC’s productivity ratio. A consistent gradual growth in the
ratio of advances per branch for every consecutive year of performance is to be ensured for every
progressive NBFC.
ANOVA
Hypothesis: There is no any significant difference in Advances per Branch of NBFCs under study.
Alternative Hypothesis: There is significant difference in Advances per Branch of NBFCs under study
The table value of F for degree of freedom 39 at 5 per cent level of significance is 9.28. Since
the calculated value of F (64.46) is greater than table value, the null hypothesis is rejected and
alternative hypothesis is accepted. It is concluded that there is a significance difference in the
Advances per branch of NBFCs under study.
DEPOSITS PER BRANCH
This ratio has been computed by dividing the amount of total deposits by the number of
branches of the NBFCs.The following points are the outcome of the study and analysis of the data
provided in the table 2.
An interesting trend is noticed in the productivity ratio of SFL, i.e, the ratio has set a
declining trend from 2002-03 to 2007-08 and thereafter it registered a growing trend up to the end of
the decade. In other words, during the first half of the decade, the ratio decreased annually and in the
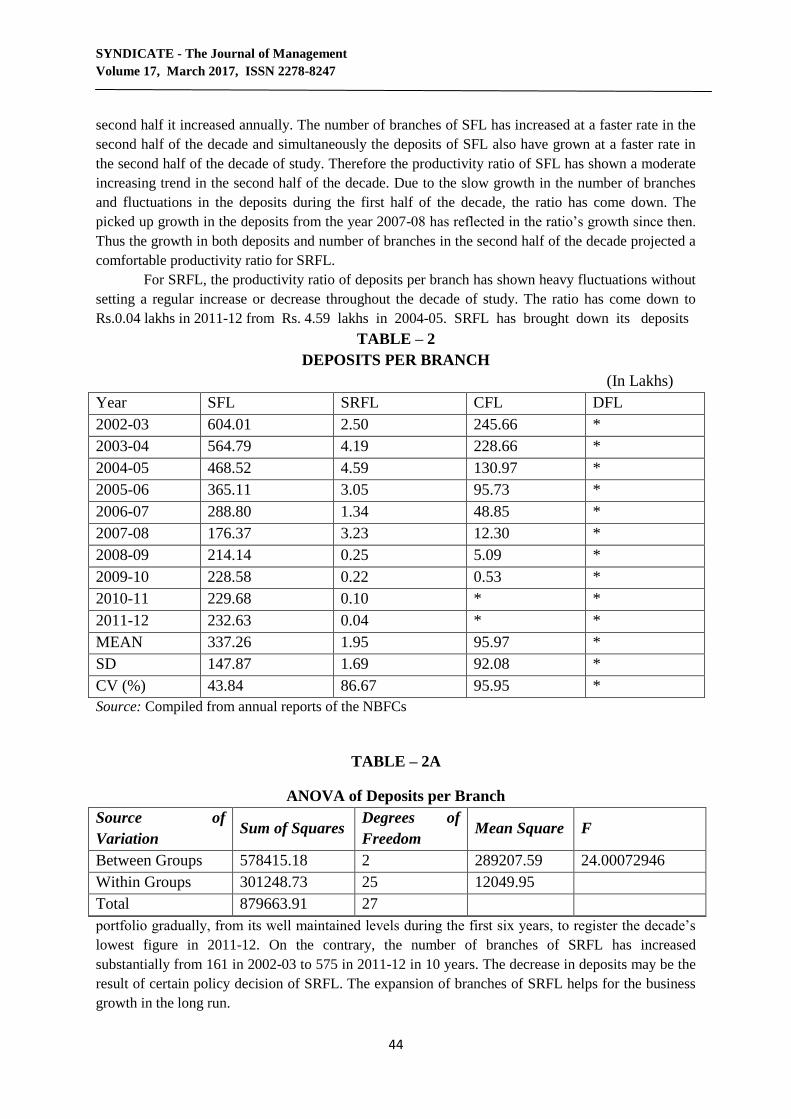
SYNDICATE - The Journal of Management
Volume 17, March 2017, ISSN 2278-8247
44
second half it increased annually. The number of branches of SFL has increased at a faster rate in the
second half of the decade and simultaneously the deposits of SFL also have grown at a faster rate in
the second half of the decade of study. Therefore the productivity ratio of SFL has shown a moderate
increasing trend in the second half of the decade. Due to the slow growth in the number of branches
and fluctuations in the deposits during the first half of the decade, the ratio has come down. The
picked up growth in the deposits from the year 2007-08 has reflected in the ratio’s growth since then.
Thus the growth in both deposits and number of branches in the second half of the decade projected a
comfortable productivity ratio for SRFL.
For SRFL, the productivity ratio of deposits per branch has shown heavy fluctuations without
setting a regular increase or decrease throughout the decade of study. The ratio has come down to
Rs.0.04 lakhs in 2011-12 from Rs. 4.59 lakhs in 2004-05. SRFL has brought down its deposits
TABLE – 2
DEPOSITS PER BRANCH
(In Lakhs)
Year SFL SRFL CFL DFL
2002-03 604.01 2.50 245.66 *
2003-04 564.79 4.19 228.66 *
2004-05 468.52 4.59 130.97 *
2005-06 365.11 3.05 95.73 *
2006-07 288.80 1.34 48.85 *
2007-08 176.37 3.23 12.30 *
2008-09 214.14 0.25 5.09 *
2009-10 228.58 0.22 0.53 *
2010-11 229.68 0.10 * *
2011-12 232.63 0.04 * *
MEAN 337.26 1.95 95.97 *
SD 147.87 1.69 92.08 *
CV (%) 43.84 86.67 95.95 *
Source: Compiled from annual reports of the NBFCs
TABLE – 2A
ANOVA of Deposits per Branch
Source of
Variation Sum of Squares
Degrees of
Freedom Mean Square F
Between Groups 578415.18 2 289207.59 24.00072946
Within Groups 301248.73 25 12049.95
Total 879663.91 27
portfolio gradually, from its well maintained levels during the first six years, to register the decade’s
lowest figure in 2011-12. On the contrary, the number of branches of SRFL has increased
substantially from 161 in 2002-03 to 575 in 2011-12 in 10 years. The decrease in deposits may be the
result of certain policy decision of SRFL. The expansion of branches of SRFL helps for the business
growth in the long run.

SYNDICATE - The Journal of Management
Volume 17, March 2017, ISSN 2278-8247
45
CFL is a non-deposit taking NBFC since 2010-11 prior to that, CFL was accepting deposits.
The productivity ratio has come down annually and becomes nil in 2010-11. CFL has gradually
stopped accepting deposits. Thus the quantum of deposits has been reduced to nil in 2010-11 and it
exhibits the intention of the NBFC to stop taking deposits from 2010-11. CFL can do a viable
business even though it is not accepting deposits. Thus in case of CFL, this productivity ratio is not
applicable.
DFL is non-deposit taking NBFC and so this productivity ratio of deposits per branch does
not apply.
CFL and DFL are non-deposit taking NBFCs. In case of SRFL, the NBFC has reduced its
deposits position to a least minimum (minimum of the decade) through an act of gradual reduction.
Therefore the ratio has come down to Rs.0.04 lakhs, proportionately a negligible ratio. Thus this
productivity ratio of deposits per branch is applicable to SFL only. In SFL, the ratio, though decreased
earlier, it increased from 2007-08. Thus productivity ratio of SFL is improving comfortably.
ANOVA
Hypothesis: There is no any significant difference in Deposits per branch of NBFCs under study.
Alternative Hypothesis: There is significant difference in Deposits per branch of NBFCs under study
The table value of F for degree of freedom 27 at 5 per cent level of significance is 3.39. Since
the calculated value of F (24) is greater than table value, the null hypothesis is rejected and alternative
hypothesis is accepted. It is concluded that there is a significance difference in the Deposits per
branch of NBFCs under study.
EMPLOYEES PRODUCTIVITY OF NBFCS
Human resource is the most important asset of an organization and non banking business is no
exception to it. But Indian NBFCs are known for their excessive staff strength, it affects their
productivity. In the present study, employee productivity of NBFCs has been evaluated by taking six
ratios in consideration. The following are the ratios employed in this study to analyze the productivity
performance of the selected NBFCs.1. Advances per employee and 2. Deposits per employee
ADVANCES PER EMPLOYEE
Making advances and recovering the interest and principal is one of the prime functions of the
financial institutions like NBFC. The ratio of advances per employee is an indicator used to gauge the
efficiency level of the personnel employed by the NBFCs. Advances per branch of selected NBFCs
are presented in Table 3.
The following are the inferences derived from the analysis of the data furnished in the table 3
regarding advances per employee.
The ratio of advances per employee of SFL has not registered continuous annual growth
throughout the decade of study. The increase in the ratio may be due to increase in advances and
reduction in employees and similarly, the decrease in the ratio may be due to decrease in advance and
increase in the number of employees. Further the increase or decrease in the ratio may also be
possible when both advances and the number of employees increase or decrease proportionately. SFL
has made continuous progress in its advances in all years of the decade. Similarly it has improved the
strength of the employees also. However the ratio, per employee advances, has shown fluctuations
during the mid years of the decade. This is due to the disproportionate annual increase either in
advances or in the number of employees. Analysis shows that SFL could do comfortable advances
operations without affecting its productivity.
Productivity ratio of advances per employee of SRFL is not encouraging, as the ratio shows
wide variations between Rs.1.36 lakhs in 2010-11 and Rs.291.96 lakhs in 2011-12 in 10 years period.
Increase and decrease of ratios are seen to be normal in all the 9 years from 2002-03, but in the last

SYNDICATE - The Journal of Management
Volume 17, March 2017, ISSN 2278-8247
46
year of the decade, the ratio increased abnormally to a shocking peak. The changes in the quantum of
advances during 9 years of the decade are normal and it shoot up with a surprise leap in 2011-12.
Though the number of employees increased over the years of the decade, the increase is at a faster rate
in the second half of the decade. The ratio of
TABLE – 3
ADVANCES PER EMPLOYEE (In Lakhs)
Year SFL SRFL CFL DFL
2002-03 126.42 9.60 74.82 5.42
2003-04 159.29 12.88 87.35 5.44
2004-05 184.63 20.07 60.02 6.29
2005-06 209.95 34.75 4.00 6.96
2006-07 195.70 36.82 1.94 3.04
2007-08 126.79 15.29 2.68 5.32
2008-09 124.47 2.15 7.34 6.05
2009-10 139.17 4.98 16.00 8.31
2010-11 154.66 1.36 22.05 5.33
2011-12 173.15 291.96 5.36 5.84
MEAN 159.42 42.99 28.16 5.80
SD 29.16 83.82 31.23 1.28
CV (%) 18.29 194.98 110.90 22.07
Source: Compiled from annual reports of the NBFCs
TABLE – 3A
ANOVA of Advances per Employee
Source of Variation Sum of Squares Degrees of
Freedom Mean Square F
Between Groups 141227.86 3 47075.95 19.14426944
Within Groups 88524.30 36 2459.01
Total 229752.16 39
advances per employee has been comfortable during first half, but it is not justifiable in 3 years from
2008-09 to 2010-11. The increase in advances in 2011-12 has made the ratio highest of the decade of
the study.
The productivity ratio of advances per employee of CFL has been more than twice that of the
mean of Rs.28.16 during the first three years of the decade. In 2005-06 and in subsequent years, the
ratio has been reduced drastically. Though an increase in the ratio is seen in 2009-10 and 2010-11, it
is less than the mean. CFL has reduced its advances drastically in 2005-06. In subsequent years, the
advances has grown annually up to 2010-11 and it is less than the mean. CFL has reduced its
advances drastically in 2005-06. In subsequent years, the advances has grown annually up to 2010-11
and it is reduced again in 2011-12. But in case of number of employees, it has been increasing every
year from 2002-03 to 2007-08. During the last three years, the increase in advances has increased the
ratio irrespective of the increase in the number of employees. The productivity of the employee of
CFL has come down and it must be reviewed by CFL seriously in order to improve the ratio in future
years.

SYNDICATE - The Journal of Management
Volume 17, March 2017, ISSN 2278-8247
47
The productivity ratio of advances per employee for DFL is almost constant around the mean
ratio of the decade Rs.5.80 lakhs, except in 2006-07 (Rs.3.04 lakhs). The advances has come down in
the second half of the decade and simultaneously the number of employees also has been reduced.
Thus DFL has taken care to maintain consistency in annual ratios of advances per employee. There
exists good scope to improve this productivity ratio gradually in future years if planned properly both
in expansion of advances portfolio and in personnel management.
Among the four NBFCs taken for study, SFL and DFL maintain the per employee advances
ratio around their respective mean ratio of the decade. In SRFL and CFL, the ratiosof the years of the
decade have shown variations widely from their respective mean ratio. SRFL and CFL must take
steps to maintain a comfortable ratio of advances per employee in future years, through proper credit
plan and manpower plan. A proper syncronisation of credit management and personnel management
will help all the NBFCs to ensure growing productivity ratios every year.
ANOVA
Hypothesis: There is no any significant difference in Advances per Employee of NBFCs under study.
Alternative Hypothesis: There is significant difference in Advances per Employee of NBFCs under
study
The table value of F for degree of freedom 39 at 5 per cent level of significance is 9.28. Since
the calculated value of F (19.14) is greater than table value, the null hypothesis is rejected and
alternative hypothesis is accepted. It is concluded that there is a significance difference in the
Advances per employee of NBFCs under study.
DEPOSITS PER EMPLOYEE
Deposits are one of the main sources of funds for the business acvity in any financial
organization and so is for NBFCs. Deposits per employee is the ratio that helps to evaluate the
productive capacity of each employee in the mobilization of deposits. This ratio may not be important
for those NBFCs which do not take deposits from the public and those NBFCs which give least
important to deposits. The sample NBFCs taken for this study have different approach to deposits.
The data regarding the ratio of deposit per employee is given table 4.
The following the inferences derived from the study and interpretation of the data provided in
table 4.
The per employee deposit ratio of SFL is around the mean size Rs.28.57 lakhs during the first
five years of the decade. In the next five years, the ratio has become less than the mean. The deposits
of SFL has fluctuated from 2002-03 to 2005-06 and thereafter it improved annually. In case of
number of employees, it increased annually throughout with a sharp increase in 2007-08 (90 per cent
over that of 2006-07). Though the deposits increased in 2007-08, the sharp increase in number of
employees in that year affected the ratio very much. However further increase in deposits along with
the adequate increase in the number of employees has helped the increase in the ratio. SFL must have
close follow up of this ratio and ensure its growth along with the growth of deposits.
The productivity ratio of per employee deposits of SRFL has not been comfortable throughout
the decade. The ratio has become negligible in the end years of the decade. The mean ratio itself is
very meager. SRFL reduced its deposits by 95 per cent in ten years. While the number of employees
increased by 18 times in ten years period. The decrease in deposits and increase in number of
employees led to the poor productivity ratio (0.01in 2011-12). Increased number of employees may be
utilized by SRFL for various financial activities other than deposits.
CFL is a non-deposit taking NBFC. The data of the table 5.8 states that CFL stopped
accepting deposits from 2010-11. Therefore the productivity ratio of deposits per employee has come
down at a faster rate

SYNDICATE - The Journal of Management
Volume 17, March 2017, ISSN 2278-8247
48
TABLE – 4
DEPOSITS PER EMPLOYEE
(In Lakhs)
Year SFL SRFL CFL DFL
2002-03 56.21 1.78 65.95 *
2003-04 47.82 2.99 60.68 *
2004-05 37.01 3.04 34.85 *
2005-06 30.44 2.01 24.88 *
2006-07 24.08 1.06 7.93 *
2007-08 14.71 1.62 1.98 *
2008-09 17.85 0.09 0.69 *
2009-10 19.06 0.07 0.09 *
2010-11 19.15 0.02 * *
2011-12 19.40 0.01 * *
MEAN 28.57 1.27 24.63 *
SD 13.42 1.14 25.20 *
CV (%) 46.97 89.76 102.31 *
Source: Compiled from annual reports of the NBFCs
TABLE – 4A
ANOVA of Deposits per Employee
Source of Variation Sum of Squares Degrees of
Freedom Mean Square F
Between Groups 3295.62 2 1647.81 5.239626061
Within Groups 7862.18 25 314.49
Total 11157.8 27
to become negligible in 2008-09, 2009-10 and nil from 2010-11. However the number of employees
of CFL has increased around 7 times in ten years. Baring one or two years of the decade, in all other
years, the number of employees has increased. The deposits per employee has no relevance for CFL
as it is identified as a non-deposit taking NBFC.
DFL is a non-deposit taking NBFC and hence the ratio of deposits per employee has no
relevance.
Out of four NBFCs taken as samples for the study, the ratio has relevance to SFL and SRFL
only. Out of these two NBFCs also, the ratio has relevance only in SFL as SRFL has reduced its
deposits drastically over the years of the decade. Thus out of four NBFCs, only SFL has
comfortable ratio of deposits per employee. In SFL also, the ratio has come down in the mid years and
later in the end of the decade, the deposits have grown to register a comfortable productivity ratio, in
spite of increase in number of employees. SFL must take adequate steps to improve deposits in
relation to the proportionate increase in the number of employees so as to ensure a good productivity
ratio.
ANOVA
Hypothesis: There is no any significant difference in Deposits per Employee of NBFCs under study.

SYNDICATE - The Journal of Management
Volume 17, March 2017, ISSN 2278-8247
49
Alternative Hypothesis: There is significant difference in Deposits per Employee of NBFCs under
study
The table value of F for degree of freedom 27 at 5 per cent level of significance is 3.39. Since
the calculated value of F (5.23) is greater than table value, the null hypothesis is rejected and
alternative hypothesis is accepted. It is concluded that there is a significance difference in the
Deposits per employee of NBFCs under study.
CONCLUSION
Branches of NBFCs and their employees play the major role in increasing the volume of
business. Therefore, in this paper, the productivity ratios have been derived relating the vital business
functions and functional results with their number of branches and employees of the NBFCs. These
ratios have been calculated to cover the essential financial activities of NBFCs, namely advances and
deposits. For the deposit taking NBFCs, the results of the analysis of per branch productivity ratios
indicate their comfortable productivity capacity in the areas of lending and earning income. The ratios
of non-deposit taking NBFCs also reveal that their level of productivity is satisfactory. Similarly, in
case of per employee business growth of the NBFCs under advances, the ratios have shown the
improved productivity of their respective employees. The results of the analysis indicate that the
NBFCs could manage to register positive ratios.
References
1. OECD Publications. Measuring productivity – OECD Manuel: measurement of
aggregate and industry-level productivity growth. 2001, p.11.
2. Kopleman, Richard E (1986), Managing Productivity Organizations. McGraw Hill Book
Company, New Delhi, p.3.
3. K. M. Anwarul Islam &MahbubaZaman (2013), An Empirical Study on Effect of
Productivity on Profitability in Some Selected Private Commercial Banks (PCBs) in
Bangladesh, International Journal of Economics and Finance; Vol. 5, No. 12; p.152.
4. Singh, Jagwant (1990), “Productivity in the Indian Banking,” A Thesis submitted to
Panjab University, Chandigarh, Jan. p.54.
SYNDICATE - The Journal of Management
Volume 17, March 2017, ISSN 2278-8247
50
A STUDY ON HUMAN RESOURCE PRACTICES IN RANE ENGINE
VALVES LIMITED AT CHENNAI
Dr. K. Selvi Assistant Professor, JBAS College for Women, Chennai
INTRODUCTION
A best “practice” in HR as a particular method, approach or practice of
managing people which has a positive impact on a company’s overall business performance by
improving employee satisfaction, employee motivation, and customer satisfaction and or bottom-line
business performance.
Human resources professionals find, hire and retain the best talent in the right positions within
companies, and recruiters and other HR professionals can follow these HRbest practices to keep their
candidates and new hires happy and productive. HR best practices keep both clients and employees
happy.
COMPANY PROFILE
The company was incorporated in 1920 as Rane Private Ltd, trading in automobiles & parts. In 1959
established Engine Valves Ltd, for manufacturing IC Engine valves.1960 Rane (Madras) Ltd
commenced manufacture of tierod ends, 1964 established Rane Brakes Linnings Ltd for
manufacturing friction materials, 1975 Rane (Madras) Ltd started steering gear manufacture, 1987
establishing Rane Power Steering Ltd, for power steering systems. In 1997 Rane TRW Steering
Systems Ltd was started. In 1989 Acquired Engine components limited to manufacture tappets &
camshafts and chilled iron castings. In 1995 three new JV companies formed, that is TWR Rane
Occupant Restraints Limited, RaneLuk Clutch Limited, and RaneNasteeh Limited.
1997 Engine Valves Ltd, Signs technology agreement then for engine valves. 1998 manufacture of
engine valves, guides, camshafts & tappets brought under one company. Viz. Rane Engine Valves
Limited (REVL).
REVIEW OF LITERATURE
In the organizations or firms, human resource management (HRM) practices
as a mediator between HRM strategy and HRM outcome. Sheppeck and Militello (2000) focus HRM
strategy into four groups: employment skill and work policies, supportive environment, performance
measurement and reinforcement and market organization whereby Guest (1997) divides in to three
categories: differentiated on innovation, focus on quality and cost-reduction. However, there are many
definitions in previously researches on HRM strategy, but all strategies used to achieve the same
organizational goal through HRM practices
Abang, May-Chiun and Maw (2009) two components of human resource
(HR) practices namely, training and information technology have direct impact on organizational
performance. In addition, Zaini, Nilufar and Syed (2009) four HRM practices showed that training

SYNDICATE - The Journal of Management
Volume 17, March 2017, ISSN 2278-8247
51
and development, team work, HR planning, and performance appraisal have positive and significant
influence on business performance. Altarawmneh and al-Kilani (2010) examine the impact of human
resource management (HRM) practices on employees’ turnover intentions. The results showed that
job analysis had a significant effect on employees’ turnover However, no statistical evidence was
found regarding the effects of other HRM practices on employees’ turnover intentions.
OBJECTIVES OF THE STUDY
To study on human resource practices prevailing in Rane engine valves
To study about the recruitment procedures and mode of training prevailing in the
organization.
To study about the performance evaluation system and employees recognition made in the
organization.
To provide suitable suggestions to improve the human resource practices in the organization
DATA ANALYSIS & INTERPRETATION
Opinion of the respondents towards awareness of HR practices followed in the organization.
Opinion
Number of Respondent
Percentage
Yes
85
74
No
30
26
Total
115
100
Interpretation: - From the table it is inferred that 74% of the respondents are aware of HR practices
followed in the organization, 26% of the respondents are not aware of HR practices followed in the
organization.
Opinion of the respondents regarding recruitment
Opinion Number of Respondent Percentage
Advertisement 25 22
Reference 75 65
Campus interview 15 13
Total 115 100
Interpretation: - From the above table it is observed that 22% of the respondents express that
advertisement is the main source of recruitment to select the right candidate, 65% of the respondents

SYNDICATE - The Journal of Management
Volume 17, March 2017, ISSN 2278-8247
52
expresses reference has the right mode, 13% of the respondentsexpress that campus interview is the
main source of recruitment to select the right candidate.
Opinion of the respondents towards performance feedback
Opinion Number of Respondent Percentage
Strongly agree 27 23
Agree 41 36
Neutral 26 23
Disagree 12 10
Strongly disagree 9 8
Total 115 100
Interpretation: - From the above table it is observed that 23% of the respondents strongly agree that
performance feedback helps to improve efficiency, 26% of the respondents agree, 23% of the
respondents are neutral in their opinion, 10% of the respondents disagree, 8% of the respondents
strongly disagree with performance feedback helps to improve efficiency.
Opinion of the respondents towards employee’s appraisal
Opinion Number of Respondent Percentage
Once in a year 80 70
Twice in a year 15 13
Monthly 20 17
Total 115 100
Interpretation: - From the table it is observed that 70% of the respondents express that employee’s
appraisal is conducted once in a yearinan organization, 13% of the respondents express that
employees appraisal is conducted twice in a yearin an organization, and 17% of the respondents
express that employees appraisal is conducted monthly in the organization.

SYNDICATE - The Journal of Management
Volume 17, March 2017, ISSN 2278-8247
53
Opinion of the respondents regarding performance appraisal
Opinion Number of Respondent Percentage
Highly satisfied 46 40
Satisfied 36 32
Neither satisfied nor dissatisfied 12 10
Dissatisfied 15 13
Highly dissatisfied 6 5
Total 115 100
Interpretation: - From the table it is inferred that 40% of the respondents are highly satisfied, 32% of
the respondents are satisfied, 10% of the respondents are neutral in their opinion, 13% of the
respondents are dissatisfied, 5% of the respondents are dissatisfied with performance appraisal
procedure were provided in the organization.
Opinions of the respondents towards management recogonize your work
Opinion Number of Respondent Percentage
Promotion 17 15
Open appreciation method 68 59
Bonus/incentive 30 26
Total 115 100
Interpretation: - From the above table it is observed that 15% of the respondents feel that their
management recognises their good work through promotion, 59% of the respondents feel that their
management recognises their good work through open apprecaition method, 26% of the respondents
feel that their management recognises their good work through bonus/ incentives provided in the
organization.
Opinion of the respondents towards employee evaluation system
Opinion Number of Respondent Percentage
Strongly agree 25 22
Agree 23 20

SYNDICATE - The Journal of Management
Volume 17, March 2017, ISSN 2278-8247
54
Neutral 42 37
Disagree 20 17
Strongly disagree 5 4
Total 115 100
Interpretation: -From the above table it is observed that 22% of the respondents strongly agree
thatemployee evaluation system links the individual performance to corporate goals, 20% of the
respondents agree, 37% of the respondents are neutral in their opinion, 17% of the respondents
disagree, 4% of the respondents strongly disagree that employee evaluation systemlinks the individual
performance to corporate goals.
CORRELATION ANALYSIS
AIM:
To find out the relationship between the satisfaction level regarding the performance appraisal
and the proper recognition given to the employees in an organization.
Dx dy dx2 dy
2 dxdy
4 -10 16 100 -40
9 8 81 64 72
0 0 0 0 0
-8 -16 64 256 128
S.No Satisfaction level
regarding performance
appraisal
(x)
Proper recognition
given to the employees
(y)
1 30 22
2 35 40
3 26 32
4 18 16
5 6 5

SYNDICATE - The Journal of Management
Volume 17, March 2017, ISSN 2278-8247
55
-20 -27 400 729 540
-15 -45 567 1149 700
Σdx = -15, Σdy = -45, Σdx2 =567, Σdy
2 = 1149, Σdxdy = 700
R = n Σdxdy – (Σdx) (Σdy) / √nΣdx2 – (Σdx)
2 √ nΣdy
2 - (Σdy)
2
R = 0.10
RESULT:
The calculated value is lesser than 1 so the relationship between the satisfactions level regarding the
performance appraisal and the proper recognition given to the employees in an organization are
moderately correlated.
FINDINGS
65% of the respondents were recruited through reference and 13% of the respondents were
recruited through campus interview.
74% of the respondents are aware of HR practices followed in the organization, 26% of the
respondents are not aware of HR practices followed in the organization.
26% of the respondents are attracted towards the job mostly by hours of work and based on
salary and 8 % of the respondents are attracted towards the job mostly by size / structure of an
organization.
56% of the respondents feel that individual training provided in the organisation helps to
improve employee performance and 4 % of the respondents feel that mentoring training
program training provided in the organization helps to improve employee performance.
43% of the respondents are strongly agree with appreciation factors provided in the
organization and 4 % of the respondents are strongly disagree with the appreciation factors
provided in the organization.
70% of the respondents said that employee appraisal conducted once in ayear and 17 % of the
respondents said that employee appraisal conducted monthly in the organization.
40% of the respondents are highly satisfied with the performance appraisal given in the
organisation and 5 % of the respondents are highly dissatisfied with the performance appraisal
given in the organization.
50% of the respondents are highly satisfied with continous improvement and 3% of the
respondents are highly dissatisfied with continous improvement in the organization.
39 % of the respondents are satisfied towards risk taking and 4% of the respondents are highly
dissatisfied towards risk taking
SUGGESTIONS
Rane Engine private limited provide excellent human resource practices to the employees. If the
administration is highly satisfied it can promote employees which will ensure better motivation
among the employees.
Some of the points which will better upgrade the human resource practices in Rane, which come
across this research, are as follows.

SYNDICATE - The Journal of Management
Volume 17, March 2017, ISSN 2278-8247
56
1. Special programs can be conducted for the effective communication to stimulate Awarness
among the employees in the organization.
2. The company may provide fresh or creative way to accomplish a task for communication
strategies for the welfare of the organization.
3. The participative management should enhance creativity of the employees.
4. The management can use activities like job rotation, job enrichment and job enlargement to
improve the performance of employees in the organization.
5. Some changes can be made to the working environment to provide facilities nedded by the
employees and it should be a place fit for them both physically and mentally.
6. For the betterment of the work, knowledge sharing can be recommended among the
employees.
7. Mentoring training programme can be more effective to increase the training and
development to the employees in the organization.
CONCLUSION
The study of human practices ion Rane Engine private limited has provide a lot of insights
in company’s human resource practices. By analyzing the summary of results it indicates that the
human resource practices followed by the organization is satisfactory and the employees want only
little improvement in those practices.The employees are also happy with the human resource practices
followed in organization at present.
References
1. C.R.Kothari- Research Methodology- new age international (p) ltd. Second Edition 2004
2. Ashwathappa.k-Human Resources and Personnel Management-Tata Mc Grew Hill-Third
Edition
3. The websites through which the data’s are collected are as follows.
4. http://www.empxtract.com/
5. http://www.emeraldinsight.com
6. http://www.Projectparadise.com
7. http://www.scribd.com
8. http://www.slideshare.com
9. http://www.authorstream.com
10. http://www.dijournal.com

SYNDICATE - The Journal of Management
Volume 17, March 2017, ISSN 2278-8247
57
ENHANCEMENT OF CUSTOMER SERVICE QUALITY IN THE
BANKING SECTOR
Dr.A.Sujatha,Ms.C.Chitra
Assistant Professor, CPA College, Bodinayaganur
Research Scholar, Bharathiyar University
Abstract
Banking sector being the backbone of the economy is facing rapid changes in the market such as new
technologies, economic uncertainties, fierce competition, more demanding customers and the
changing climate which lead to an unprecedented set of challenges. Customer is a vital for the
development of trade, industry and service sector particularly in financial services. The success of a
bank depends on the sum of total experiences the bank’s employees create for customers. The purpose
of this research was to identify the areas where the Service Quality improvements required by the
bankers in New Generation Banks and Foreign Banks in Chennai. Using stratified random sampling
technique, data was collected from 50 bankers of both banks and it was analysed using independent
sample t-test. The study shows that both the banks bankers required more improvement in some of the
areas for providing effective service delivery.
INTRODUCTION
With the diversification in the consumer needs, heightened competition, banking system has
transformed into a responsive service entity committed to serve the customer with care and anxiety.
As a part of bringing improvement in the customer service, various measures were taken by the banks,
Reserve Bank of India, lndian Banks Association and more significantly the initiatives of social
forums like Alllndia Bank Depositors' Association (Mumbai), Forum of Free Enterprise and many
such welfare centric organizations. Their involvement and role work like a systemic force to bring
qualitative transformation, offered recommendations and contributed to enhance quality of service.
Hence, a qualitative customer service is a prerequisite for developing a vibrant banking system.
Customer service has great significance in the banking industry. Any initiatives for betterment of
service needs a thorough understanding of the customer perceptions, their needs and changing
aptitude of consumers. The success of a bank depends on the sum of total experiences the bank’s
employees create for customers. In the whole process of enhancing customer service, the research was
made to identify the areas where the Service Quality improvements required by the bankers in New
Generation Banks and Foreign Banks in Chennai.
NEW GENERATION PRIVATE SECTOR BANKS
In the earlier stage all the banks in India were private banks, which were founded to cater to the
banking needs of the people. Narasimham Committee on financial sector reforms recommended the
establishment of new banks in India. Thereafter, RBI issued guidelines for setting up of new
privatebanks in India in January 1993. As per the guidelines, RBI granted licenses to 9 private sector
banks namely Bank of Punjab Limited (since merged with Centurian Bank), Centurian Bank of
Punjab (since merged with HDFC Bank), Development Credit Bank Limited, HDFC Bank Limited,

SYNDICATE - The Journal of Management
Volume 17, March 2017, ISSN 2278-8247
58
ICICI Bank Limited, IndusInd Bank Limited, Kotak Mahindra Bank Limited, Axis Bank (earlier UTI
Bank) and Yes Bank Limited. Housing Development Finance Corporation Limited became the first to
receive an “in principle” approval from the Reserve Bank of India to set up a bank in the private
sector.
FOREIGN BANKS
Foreign banks now constitute the largest segment of scheduled commercial banks in the
country. Totally there are 46 foreign banks operating in India Out of which 12 banks operating in
Chennai. The recent trend of the foreign banks and the private sector banks has working with
competitive spirit and providing better quality of services to the customers.
LITERATURE REVIEW
Mohammed Arifshaik(2014) in his study identified bankers perception of benefits and risks
associated with electronic banking facilities in Ethiopia. Bank employees were the primary source of
data and the data so collected was analyzed using mean score analysis. His findings revealed that
bankers perceive ‘a means to save time’ and ‘minimize inconvenience’ as the most and the least
advantage of electronic banking whereas ‘Need for expertise and training’ and ‘charge a high cost for
services’ are considered as the most and the least risk associated with electronic banking.
MadihaArshad, SaminaAslam(2011) in their study gauge the perceptions of employees, in both
Islamic banks and conventional banks, of Islamic products and services, the training and experience
gained in Islamic banking, and the potential of Islamic banking in Pakistan. The results revealed that
bankers in Islamic banks have more positive perceptions on the above issues. The bankers also
claimed that they require well-trained and skilled employees must be addressed critically by the
government, industry players and educationists for the sustainable growth of Islamic banking in
Pakistan
OBJECTIVES
The main objective of the study is toidentify the areas where the Service Quality improvements
required by the bankers in New Generation Banks and Foreign Banks in Chennai.
RESEARCH METHODOLOGY
To carry out the research work in a systematic way the following methodology has been used in the
current study. To get the detailed opinion from the bankers, the researcher has made a descriptive
research. Both primary and secondary data has been used for the research work. To collect the
primary data questionnaire has been prepared and the respondents are selected by using stratified
random sampling method. Questionnaire has been widely circulated among the bankers from different
banks for the data collection. Analysis of data has been done by constructing suitable tables and by
using other statistical techniques like mean, standard deviation and Independent sample t test. The
secondary data is collected from magazines, journals, books and websites.
HYPOTHESIS

SYNDICATE - The Journal of Management
Volume 17, March 2017, ISSN 2278-8247
59
Ho: There is no significant difference between New Generation banks and foreign banks with
respect to improvements required in the service quality.
H1: There is significant difference between New Generation banks and foreign banks with
respect to improvements required in the service quality.
Comparing the enhancement of customer service quality in New Generation Banks
(NGB) and Foreign Banks (FB) in Chennai city
The respondents’ demographic profile is presented in Table 1. A total of 50 bankers were involved in
this study.
1. Demographic profile of respondent
Variable Frequency Percent
Gender Male
Female
30
20
60%
40 %
Age Below 30 years
31-39 years
40-49 years
>=50 years
7
22
18
3
14%
44 %
36 %
6%
Highest education attained Diploma and below
Bachelor’s degree
Masters degree
Any other
1
16
32
1
2%
32%
64%
2%
Work Experience 1 to 5 yrs
6 to 10 yrs
More than 10 yrs
16
22
12
32%
44%
24%
Respondents per bank New Generation Banks
Foreign banks
35
15
70%
30%
The above table shows that 60% of them were male while the rest were female bankers. In addition,
of the 50 bankers surveyed, 14% were below or equal 30 years old, 44% were in the range of 30-39
years of age, and the rest were between 40 and 49 years old (36%) and above 50 years old (6%). Also,
1% bankers held at least a diploma level education, while the bankers who held undergraduate and
postgraduate degrees accounted for 32% and 64% respectively. 32% of employees having work
experience of 1 to 5 years, 44% were in the range of 6 to 10 years and 24% were more than 10 years.
In addition, 70% respondents in this study were from the New Generation banks while30% of the
respondents worked with the foreign banks.
An analysis of the improvements required by the bankers about the quality of services
delivered to the customers is depicted in tables. The respondents gave their opinion in Likert’s 5 point
scale which ranges from 5 to 1. The comparison is done through a parametric independent t test to
exactly ascertain the enhancement of customer service quality and the significance of t value is
considered at 5% level.
1) Core Banking Solutions
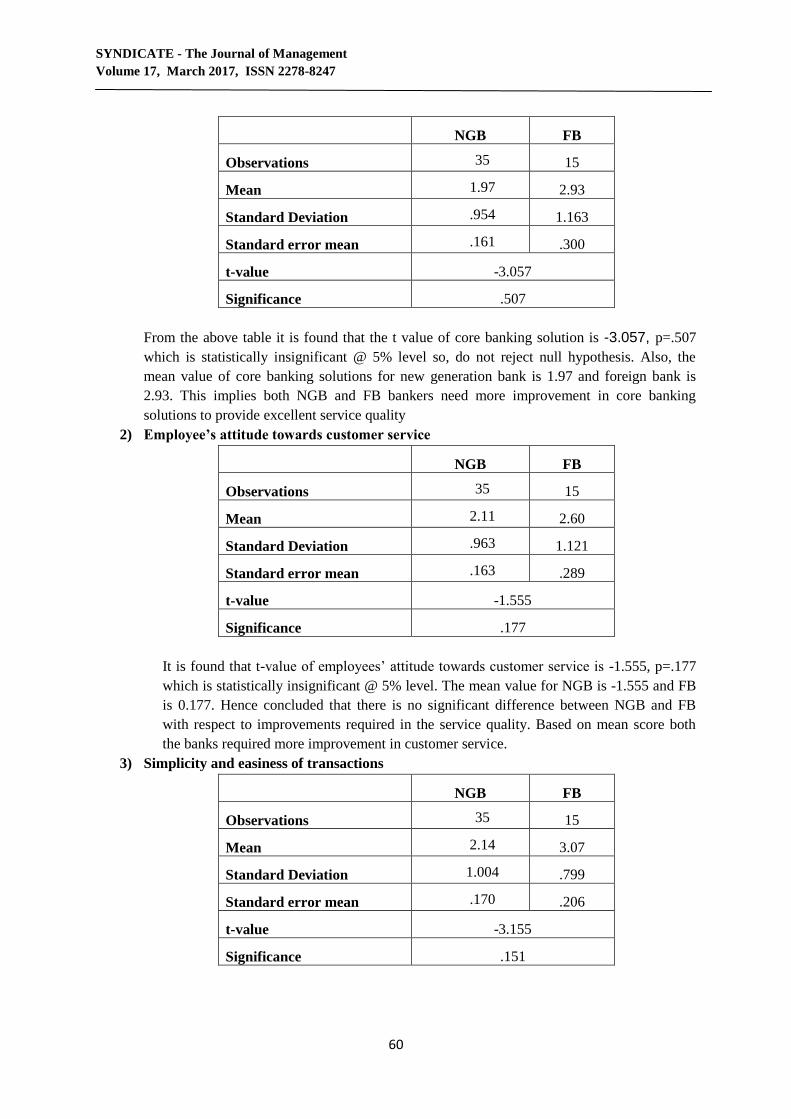
SYNDICATE - The Journal of Management
Volume 17, March 2017, ISSN 2278-8247
60
NGB FB
Observations 35 15
Mean 1.97 2.93
Standard Deviation .954 1.163
Standard error mean .161 .300
t-value -3.057
Significance .507
From the above table it is found that the t value of core banking solution is -3.057, p=.507
which is statistically insignificant @ 5% level so, do not reject null hypothesis. Also, the
mean value of core banking solutions for new generation bank is 1.97 and foreign bank is
2.93. This implies both NGB and FB bankers need more improvement in core banking
solutions to provide excellent service quality
2) Employee’s attitude towards customer service
NGB FB
Observations 35 15
Mean 2.11 2.60
Standard Deviation .963 1.121
Standard error mean .163 .289
t-value -1.555
Significance .177
It is found that t-value of employees’ attitude towards customer service is -1.555, p=.177
which is statistically insignificant @ 5% level. The mean value for NGB is -1.555 and FB
is 0.177. Hence concluded that there is no significant difference between NGB and FB
with respect to improvements required in the service quality. Based on mean score both
the banks required more improvement in customer service.
3) Simplicity and easiness of transactions
NGB FB
Observations 35 15
Mean 2.14 3.07
Standard Deviation 1.004 .799
Standard error mean .170 .206
t-value -3.155
Significance .151

SYNDICATE - The Journal of Management
Volume 17, March 2017, ISSN 2278-8247
61
Since P value is greater than 0.05 the null hypothesis is accepted @ 5% level of
significance. It implies that NGB and FB bankers differ in the simplicity and easiness of
transactions. In particular NGB (mean= 2.14) and FB (mean= 3.07) clearly indicated that
the FB need moderate improvement in simplicity and easiness of transactions where as
NGB need more improvement in making the transaction process easier.
4) Value Added Services
NGB FB
Observations 35 15
Mean 2.29 2.67
Standard Deviation 1.226 1.345
Standard error mean .207 .347
t-value -.978
Significance .367
In case of value added services, t-value is -.978, p=.367 which is statistically insignificant
at 5% level. The mean value for NGB is 2.29 and FB 2.67. It indicates that both the
bankers need more improvement in value added services to provide good quality of
services to customers.
5) Innovative services through advanced technology
NGB FB
Observations 35 15
Mean 2.20 3.67
Standard Deviation 1.183 1.047
Standard error mean .200 .270
t-value -4.151
Significance .427
The analysis revealed that the t-value of providing innovative services through advanced
technology is -4.151 and p=.427 which is statistically insignificant @ 5% level. The mean
value for NGB is 2.20 and FB is 3.67. It indicates that NGB bankers need more
innovations in providing services trough advanced technology when compared to foreign
banks.

SYNDICATE - The Journal of Management
Volume 17, March 2017, ISSN 2278-8247
62
6) Normal charges for services
NGB FB
Observations 35 15
Mean 2.31 3.13
Standard Deviation 1.157 .915
Standard error mean .196 .236
t-value -2.430
Significance .436
It is found that the t value of service charges to the customers is -2.430 and p=.436 is
statistically insignificant @ 5% level .The mean value of NGB is 2.31 and FB is 3.13 which
shows that both the bankers opine that the banks have to reduce the transaction cost to some
extent for providing effective services.
7) Working hours of the bank
NGB FB
Observations 35 15
Mean 2.23 2.93
Standard Deviation 1.114 1.486
Standard error mean .188 .384
t-value -1.850
Significance .067
The bankers revealed that the t value of working hours of the bank is -1.850, p=.067 which
is statistically insignificant @ 5% level. The mean value for NGB is 2.23 and FB is 2.93
which indicate that the bankers need more improvement in the working hours of the bank.
I.e.) the working hours of the bank have to be reduced.
8) Transparent and well defined system
NGB FB
Observations 35 15
Mean 2.09 2.27
Standard Deviation 1.040 1.223
Standard error mean .176 .316
t-value -.535
Significance .182
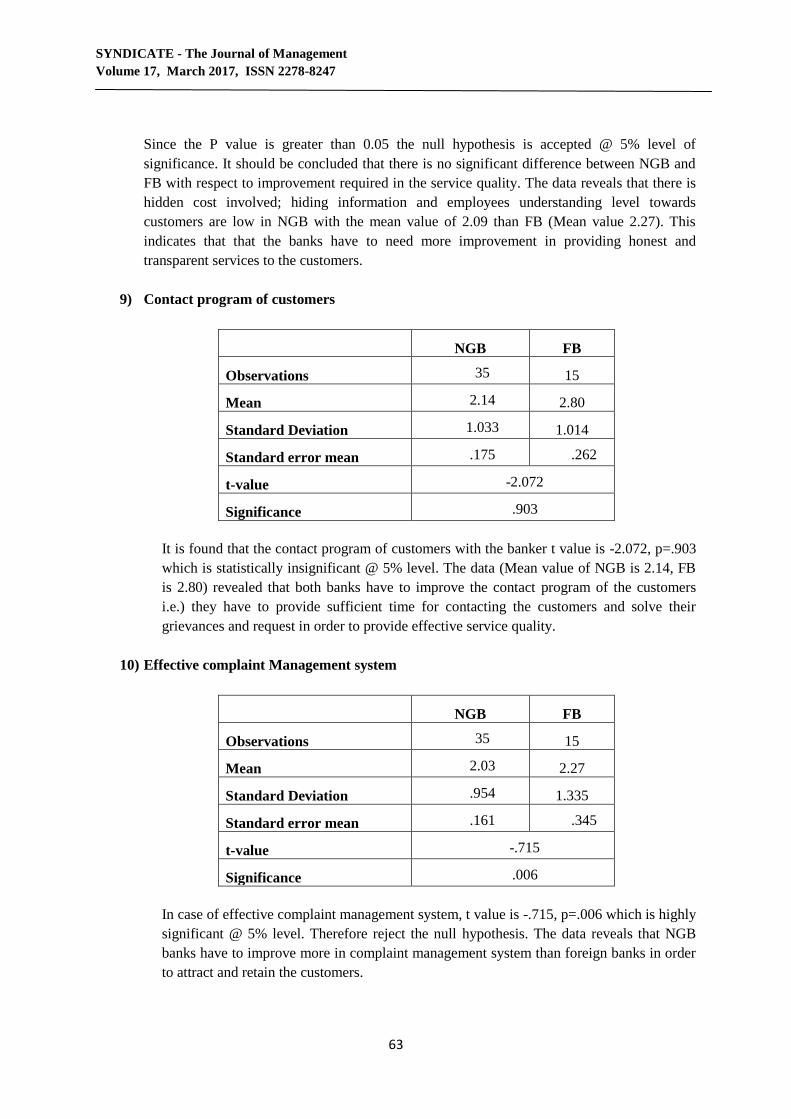
SYNDICATE - The Journal of Management
Volume 17, March 2017, ISSN 2278-8247
63
Since the P value is greater than 0.05 the null hypothesis is accepted @ 5% level of
significance. It should be concluded that there is no significant difference between NGB and
FB with respect to improvement required in the service quality. The data reveals that there is
hidden cost involved; hiding information and employees understanding level towards
customers are low in NGB with the mean value of 2.09 than FB (Mean value 2.27). This
indicates that that the banks have to need more improvement in providing honest and
transparent services to the customers.
9) Contact program of customers
NGB FB
Observations 35 15
Mean 2.14 2.80
Standard Deviation 1.033 1.014
Standard error mean .175 .262
t-value -2.072
Significance .903
It is found that the contact program of customers with the banker t value is -2.072, p=.903
which is statistically insignificant @ 5% level. The data (Mean value of NGB is 2.14, FB
is 2.80) revealed that both banks have to improve the contact program of the customers
i.e.) they have to provide sufficient time for contacting the customers and solve their
grievances and request in order to provide effective service quality.
10) Effective complaint Management system
NGB FB
Observations 35 15
Mean 2.03 2.27
Standard Deviation .954 1.335
Standard error mean .161 .345
t-value -.715
Significance .006
In case of effective complaint management system, t value is -.715, p=.006 which is highly
significant @ 5% level. Therefore reject the null hypothesis. The data reveals that NGB
banks have to improve more in complaint management system than foreign banks in order
to attract and retain the customers.

SYNDICATE - The Journal of Management
Volume 17, March 2017, ISSN 2278-8247
64
FINDINGS
From the overall analysis, both bankers need more improvement in providing effective customer
services regarding core banking solutions, employees’ attitude towards customer service,
simplicity and easiness of transaction, value added services, normal charges for services,
working hours of the bank, contact program of customers, transparent and well defined system,
effective complaint management system and innovative services through advanced technology.
Bankers’ suggestion to improve the bank services
Most bankers from different banks suggested that there should be more recruitment of staff. They
require more employees, especially young energetic staff to work. Also, Employees should be trained
on technical aspect and behavioural aspects, so that they can provide quick and efficient services to
the customers. Bankers also felt that they should have more presence across the nation, to
deliver uniform quality service to the customers. Some foreign banks are focussing only on higher
class customers; they should also concentrate on upper middle class. Increase in number of branches
and ATMs are suggested by some bankers.
CONCLUSION
In any service organization the quality of rendering service is considered as an important element in
order to meet the specific requirements of the customer. Customer value is an asset to any
organization. The success of the bank mainly depends upon the customer satisfaction. Hence in order
to retain the customer, the bank brings some improvement in providing good quality of service and
making it available at the right time for the customers. Modern technology and innovation are also
required in every aspect of banking system. From the overall analysis it is quite clear that both the
bankers required more improvement in some of the areas for providing effective service delivery.
References
1. Mohammed ArifShaikh(2014) " Ethiopian Banker’s Perception of Electronic Banking in
Ethiopia – A Case of Adama City”, International Journal of Scientific and Research
Publications, Volume 4, Issue 9, September 2014 ,PP 1-7
2. MadihaArshad, SaminaAslam, Amir Razi, Syed AtifAli(2011) “A COMPARATIVE
ANALYSIS OF BANKERS’ PERCEPTION ON ISLAMIC BANKING IN PAKISTAN”,
AmirRazi, et.al., Int. J. Eco. Res., 2011 2(4), 1-12 ISSN: 2229-6158
3. Carman, J.M. (1990). “Consumer perceptions of service quality: an assessment of the
SERVQUAL dimensions”, Journal of Retailing, 66(2), p. 27 – 45
4. Chiu, H.C. (2002). “A study on the cognitive and affective components of service quality”,
Total Quality Management, 13 (2), p. 265 – 274
5. Comm, C.L. & Dennis, F.X. (2000). “Assessing employee satisfaction in service firms: An
example in higher education”, Journal of Business and Economic Studies, 6(1), p. 43 – 53
6. Jabnoun, N. & Al-Tamimi, H.A.H. (2003). “Measuring perceived service quality at UAE
commercial banks”, International Journal of Quality & Reliability Management, 20 (4), p.
458 – 472
7. Johns, N., Avci, T. &Karatepe, O.M. (2004). “Measuring service quality of travel agents:
evidence from Northern Cyprus”, The Service Industries Journal, 24 (3), p. 82 – 100
8. Dr.A.Kalyanaraman, A.R.Sudhamani(2012) “ A comparative study on customer satisfaction
in public sector and private sector banks”, Banking Finance, vol XXV, No.9, pp-23-32

SYNDICATE - The Journal of Management (SJOM)
ISSN: 2278-8247
[Annual Peer Reviewed International Online Journal]
Call for Papers Deadline for Submission: 5th October 2017
Notification of Acceptance: 25th
November 2017
Camera ready Submission: 5th
December 2017
Manuscript Publication: 1stMarch 2018
NO PUBLICATION COST
Mode of submission: Submission through E-mail.
Syndicate: TheJournal of Management (SJOM)is an Open Access, Peer Reviewed published by M.O.P.
Vaishnav College for Women (Autonomous), Chennai, India;The SJOM International Journal aims to
provide an online publishing platform for the academia, management researchers, and management
students to publish their original works. Authors are invited to submit original manuscripts that identify,
extend, unify, test or apply scientific and multi-disciplinary knowledge concerned to the management
field.
The following types of papers are considered for publication:
1. Original research works in the above-mentioned fields
2. Surveys, opinions, abstracts and essays related to Operations research.
3. Few review papers will be published if the author had done considerable work in that area.
4. Case studies related to management domain.
RESEARCH AREAS
We are looking forward for strict compliance to the modern age standards in all fields. The topics
recommended by the journal can be considered in term of concepts, research, standards, and
implementations etc. unpublished papers, which are not under review and not considered for publication
in any other conference or journal in the following, but not limited to, topic areas.
Areas of Management
Management principles
Recent inventions in management
Company Management
Financial Management
Human Resources
Accounting
Marketing
Operations Management
Human Resource Management
Statistics
International Business
Information Technology
Environment
Risk Management
Globalization
Manuscripts should be in Times New Roman with 12pt, Single Spaced not exceeding 10 pages.
Submit your paperto [email protected]
Regards,
Editor in Chief
SJOM