Synchrotron radiation excited X-ray fluorescence microprobe trace element studies on spherules of...
12
μ-Synchrotron radiation excited X-ray fluorescence microprobe trace element studies on spherules of the Cretaceous/Tertiary boundary transitions of NE-Mexico and Haiti samples Utz Kramar a, ⁎ , Markus Harting b , Karen Rickers c,d , Doris Stüben a a Universität Karlsruhe (TH), Institut für Mineralogie und Geochemie, Kaiserstraβe 12, D-76128 Karlsruhe, Germany b Utrecht University, Department of Earthsciences, Budapestlaan 4, 3508 TA Utrecht, The Netherlands c Hamburger Synchrotronstrahlungslabor HASYLAB at Deutsches Elektronen-Synchrotron DESY, Notkestraβe 85, 22607 Hamburg, Germany d GeoForschungsZentrum Potsdam, Division 4.1, Telegrafenberg, 14473 Potsdam, Germany Received 27 March 2006; accepted 24 June 2007 Available online 4 July 2007 Abstract Synchrotron radiation, collimated to a μm scale was used for the determination of trace elements in micro-tektites and spherule material for the first time. The experimental set-up of the SXRF microprobe at beamline L at HASYLAB at DESY offers a suitable method for performing non-destructive in situ multi-element analysis focusing on spatial trace element distributions and mineral phases of the melted ejecta material from the Cretaceous/Tertiary boundary. The spatial distribution of trace elements was determined in melt inclusions as well as in phase transitions in selected parts of chlorite–smectite spherules and tektite glass material by using a beam with a diameter of 15 μm collimated with a glass capillary for line- and area scans as well as for single point measurements for elements with Z between 19 and 92. The analyzed spherules show alteration features but also zonation and carbonate inclusions, originating from the Chicxulub impact event. These initial results demonstrate the potential of μ-SXRF analysis for the discrimination of alteration and primary signals of the spherules and re-construction of their genetic evolution. It could be shown that the spherules represent a complex mixture of different materials from the subsurface at the Chicxulub impact site. © 2007 Elsevier B.V. All rights reserved. Keywords: μ-SXRF; Multi-elemental analysis; Spherule; Cretaceous/Tertiary boundary; Thin-section preparation 1. Introduction In geo- and environmental sciences the knowledge of spatial trace element distributions in solid materials is crucial for exam- ple for the determination of the formation conditions of minerals, fixation and release of toxic elements to the environment and the determination of source materials for example from tektites. Because of this the so-called microprobes have become in- creasingly important in geo- and environmental sciences. Several of these methods use charged particles for the exci- tation of X-rays like electron microprobe analysis (EPMA) and particle induced X-ray emission (PIXE). Both methods achieve μm sized spots with detection limits at the 100 pg/μg level for EPMA and at the 10 pg/μg level for PIXE (e.g. [1]). The high energy transfer of charged particles to a very small sample volume may complicate the analysis of volatile elements or can induce changes of valence states. Sensitivity is a nearly smooth function of the atomic number [2]. Secondary ion mass spectrometry (SIMS) and laser ablation inductively-coupled plasma mass spectrometry (LA-ICP/MS) are based on sputtering the sample followed by mass spectrom- etry. Using SIMS and LA-ICP/MS spot sizes of a few μm to some tens of μm and detection limits at the μg/g level are achieved. Sensitivities vary from element to element and quanti- fication is difficult because of matrix effects in the ion produc- tion process (e.g. [3]). SXRF microprobe techniques use photons for excitation. Spot sizes at the μm level and detection limits at the sub μg/g level are achieved. Spectrochimica Acta Part B 62 (2007) 824 – 835 www.elsevier.com/locate/sab ⁎ Corresponding author. E-mail address: [email protected] (U. Kramar). 0584-8547/$ - see front matter © 2007 Elsevier B.V. All rights reserved. doi:10.1016/j.sab.2007.06.012
Transcript of Synchrotron radiation excited X-ray fluorescence microprobe trace element studies on spherules of...
62 (2007) 824–835www.elsevier.com/locate/sab
Spectrochimica Acta Part B
μ-Synchrotron radiation excited X-ray fluorescence microprobetrace element studies on spherules of the Cretaceous/Tertiary
boundary transitions of NE-Mexico and Haiti samples
Utz Kramar a,⁎, Markus Harting b, Karen Rickers c,d, Doris Stüben a
a Universität Karlsruhe (TH), Institut für Mineralogie und Geochemie, Kaiserstraβe 12, D-76128 Karlsruhe, Germanyb Utrecht University, Department of Earthsciences, Budapestlaan 4, 3508 TA Utrecht, The Netherlands
c Hamburger Synchrotronstrahlungslabor HASYLAB at Deutsches Elektronen-Synchrotron DESY, Notkestraβe 85, 22607 Hamburg, Germanyd GeoForschungsZentrum Potsdam, Division 4.1, Telegrafenberg, 14473 Potsdam, Germany
Received 27 March 2006; accepted 24 June 2007Available online 4 July 2007
Abstract
Synchrotron radiation, collimated to a μm scale was used for the determination of trace elements in micro-tektites and spherule material forthe first time. The experimental set-up of the SXRF microprobe at beamline L at HASYLAB at DESY offers a suitable method for performingnon-destructive in situ multi-element analysis focusing on spatial trace element distributions and mineral phases of the melted ejecta materialfrom the Cretaceous/Tertiary boundary. The spatial distribution of trace elements was determined in melt inclusions as well as in phasetransitions in selected parts of chlorite–smectite spherules and tektite glass material by using a beam with a diameter of 15 μm collimated with aglass capillary for line- and area scans as well as for single point measurements for elements with Z between 19 and 92. The analyzed spherulesshow alteration features but also zonation and carbonate inclusions, originating from the Chicxulub impact event. These initial resultsdemonstrate the potential of μ-SXRF analysis for the discrimination of alteration and primary signals of the spherules and re-construction oftheir genetic evolution. It could be shown that the spherules represent a complex mixture of different materials from the subsurface at theChicxulub impact site.© 2007 Elsevier B.V. All rights reserved.
Keywords: μ-SXRF; Multi-elemental analysis; Spherule; Cretaceous/Tertiary boundary; Thin-section preparation
1. Introduction
In geo- and environmental sciences the knowledge of spatialtrace element distributions in solid materials is crucial for exam-ple for the determination of the formation conditions ofminerals,fixation and release of toxic elements to the environment and thedetermination of source materials for example from tektites.Because of this the so-called microprobes have become in-creasingly important in geo- and environmental sciences.
Several of these methods use charged particles for the exci-tation of X-rays like electron microprobe analysis (EPMA) andparticle induced X-ray emission (PIXE). Both methods achieveμm sized spots with detection limits at the 100 pg/μg level for
⁎ Corresponding author.E-mail address: [email protected] (U. Kramar).
0584-8547/$ - see front matter © 2007 Elsevier B.V. All rights reserved.doi:10.1016/j.sab.2007.06.012
EPMA and at the 10 pg/μg level for PIXE (e.g. [1]). The highenergy transfer of charged particles to a very small samplevolume may complicate the analysis of volatile elements or caninduce changes of valence states. Sensitivity is a nearly smoothfunction of the atomic number [2].
Secondary ion mass spectrometry (SIMS) and laser ablationinductively-coupled plasma mass spectrometry (LA-ICP/MS)are based on sputtering the sample followed by mass spectrom-etry. Using SIMS and LA-ICP/MS spot sizes of a few μm tosome tens of μm and detection limits at the μg/g level areachieved. Sensitivities vary from element to element and quanti-fication is difficult because of matrix effects in the ion produc-tion process (e.g. [3]).
SXRF microprobe techniques use photons for excitation.Spot sizes at the μm level and detection limits at the sub μg/glevel are achieved.
825U. Kramar et al. / Spectrochimica Acta Part B 62 (2007) 824–835
In this study synchrotron radiation, collimated to the μmscale is applied for the first time to determine trace elements inmicro-tektites and spherule materials.
In contrast to electron microprobe analyses the relative detec-tion limits of μ-SXRF are more than 100 times lower, and com-parable to those of LA-ICP/MS [4]. Contrary to LA-ICP/MS,where the analyte is evaporated, μ-SXRF is non-destructive andallows further investigations on the same sample material to bemade (e.g. major element determinations by electron microprobeor determinations of additional trace elements by LA-ICP/MS.).
Like in all XRF methods sensitivities are a smooth functionof the atomic number. The physics governing the interaction ofphotons with matter is well understood, therefore quantificationis relatively straightforward (e.g. [5]).
Since the first investigations on geoscientific material (e.g.[6,7]) by synchrotron radiation induced X-ray fluorescenceanalysis (SXRF) it has been developed to a helpful tool in earthsciences for non-destructive, space resolved quantitative ana-lysis of trace elements in the pg/μg range on a microscopic scale(e.g. [5,8,9]) of terrestrial [10–13]) as well as of extraterrestrialsample material [14,15]. Beamline L of the HamburgerSynchrotronstrahlungslabor at the Deutsches Elektronen-Syn-chrotron has been continuously used since 1994 for differentapplications of magmatic [16–23] and of sedimentary materials[20,24,25], as well as in experimental petrology [26–28]. In thisstudy μ-SXRFwas used for the determination of the spatial traceelement distributions in tektite material from the Cretaceous/Tertiary boundary transition (K/T boundary) to re-construct theirorigin in relation to the Chicxulub impact event (late Mesozoicto early Cenozoic). The occurrence of tektite layers some 8–10mbelow the K/T boundary, which possibly represent the originallayers, started a discussion that the Chicxulub impact may pre-date the K/T-boundary event by 300,000years [29,30].
2. Material, method and experimental set-up
2.1. Material and sample preparation
Spherule rich sediments were collected from the bedrock ofthe K/T-boundary transitions Bochil, Mesa-Juan Perez (detaileddescription in [31]) and Beloc (NE-Mexico and Haiti). Tektitematerial (Spherules) was collected from reworked Spherulelayers near the K/T boundary as well as from the original tektitelayer some 8–10m below the K/T boundary.
Samples were disaggregated, screened to the fractionsN2 mm, 2 mm to 500 μm, 500 to 200 μm, 200 to 50 μm, and50 to 20 μm (dry or wet using deionized water) and separatedmanually under the microscope. For disaggregation the Copper-(II)-sulfate treatment [32,33] was used. After disaggregationthe samples were rinsed 3 times with deionized water to removethe surface contamination from the copper sulfate. During thepreparation of the thin sections the spherules were cut andpolished. Therefore any possible surface contamination waseffectively removed. Since the synchrotron radiation with theset-up used penetrates the specimen at an angle of 45°, theradiation interacts with the matter of the sample along a cylinderof the beam diameter and a length depending on the radiation
energy at lower energies or with a length of d⁎√2 at highenergies (above ∼30keV). From this cylinder as well thecharacteristic X-rays as coherent and incoherent scattered X-rays reach the detector. The samples therefore have to be as thinas possible, in practice 80–110 μm to achieve the desired spatialresolution and lower limits of detection in the μg/g range.
As well as the short penetration depth of the beam in thesample, the advantages of very thin, self-supporting and doubly-polished thin sections are an easier positioning of grain bound-aries in the synchrotron beam and a considerable reduction ofbackground from scattered radiation (Rayleigh and Comptonscattering of the samplematrix). Since in quantitativeμ-SXRF thesample thickness has to be constant and known [34,35] theprocedure for preparing self-supporting thin sections was modi-fied to enable the preparation of slides with a constant thicknessbetween 50 and 110 μm from loose packed spherule materials. Tostabilize the fragile spherule material it was embedded in a resin(e.g. Araldite 2020 A/B®, Keorapox 439®, Epo-Tek®, LoctiteUV®, UHU®, TESA®), which was stabilized with quartz powderin order to minimize the hardness contrast of the embedding resinand the embedded material. This enables polished surfaces ongeological/paleontological materials of variable hardness to beprepared. The resin embedded spherules were then mounted onthe carrier glass using an acetone-removable glue.
In the first step the sample was shaped and polished on oneside and then removed for polishing of the other side. By using amodified resin there is no stability problem up to a thickness of60 μm. In an experimental attempt a minimum thickness of lessthan 11 μm for an unsupported thin section could be achieved.
After glueing and stabilizing of the sample using LoctiteUV®, the slides were polished by grinding the first layer in threesteps to a flat area by using 600, 800 and 1200 grain size(graining). In a final step a Logitech PM2a spinner with WG2polishing accessory and a 6 μm finish was used to generate asmooth and wave less surface which is necessary for quan-titative determinations by μ-SXRF. For subsequent major ele-ment determination (up to atomic number 11) by electronmicroprobe analysis, the sample has subsequently to be finishedusing 3, 1 and 1/4 μm grain sizes. After fixing the rear side on asecond sample carrier using UV-glue the first sample carrier isremoved mechanically. Now the rear side of the thin section ispolished as described, using the same grain sizes as mentionedabove. Partial damage of the sample material and the em-bedding matrix is possible due to raw grains of the coarsegrained polishing material. To avoid this effect it is necessary towork with the recommended, modified resin of adjusted hard-ness. The lapping of the second layer was stopped after opticalchecks of abraded sample material and changed to the LogitechPM2a polisher by using 6, 3, 1 up to 1/4 μm grain size for aminimum time of 25min each. The accurate processing of thesurface is essential, because this surface will be the bottom layerafter unfixing of the slide for the processing of the top layer.Cuts of spherule-rich rocks were also prepared as well asseparated spherule material. After polishing and removing thesample from the carrier glass using acetone of p.a. quality (pro-analysis grade), the polished side was fixed on the carrier glassusing UV-glue, the polishing procedure was repeated for the
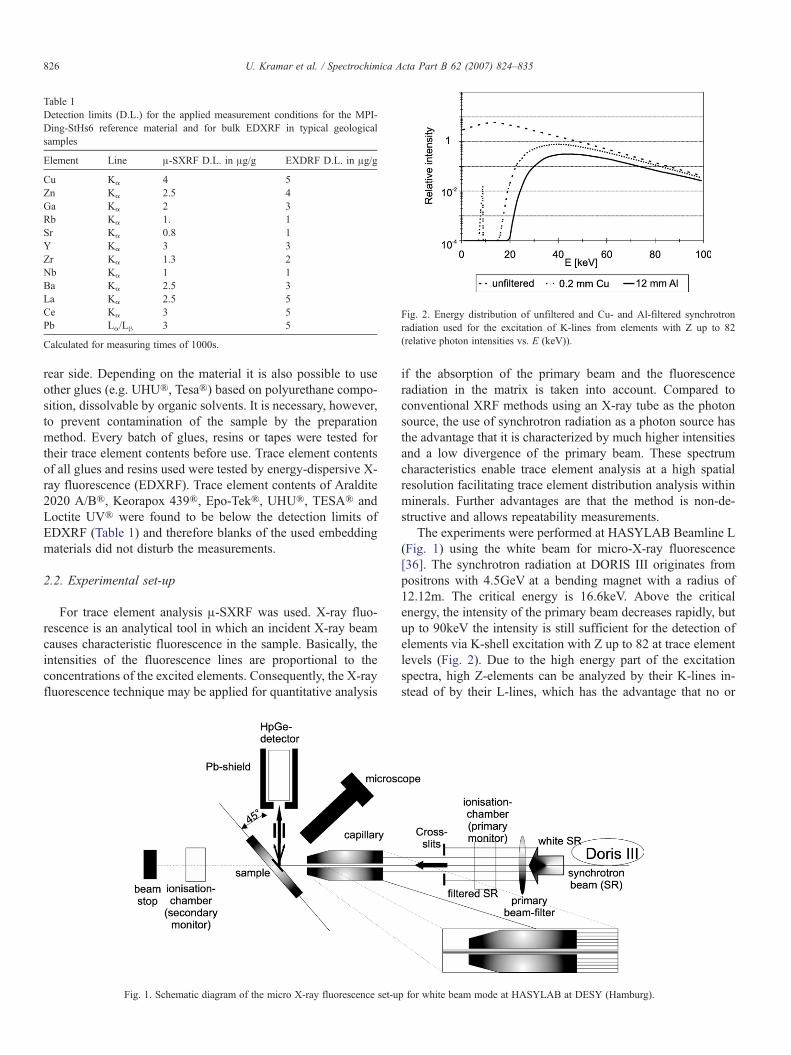
Table 1Detection limits (D.L.) for the applied measurement conditions for the MPI-Ding-StHs6 reference material and for bulk EDXRF in typical geologicalsamples
Element Line μ-SXRF D.L. in μg/g EXDRF D.L. in μg/g
Cu Kα 4 5Zn Kα 2.5 4Ga Kα 2 3Rb Kα 1. 1Sr Kα 0.8 1Y Kα 3 3Zr Kα 1.3 2Nb Kα 1 1Ba Kα 2.5 3La Kα 2.5 5Ce Kα 3 5Pb Lα/Lβ 3 5
Calculated for measuring times of 1000s.
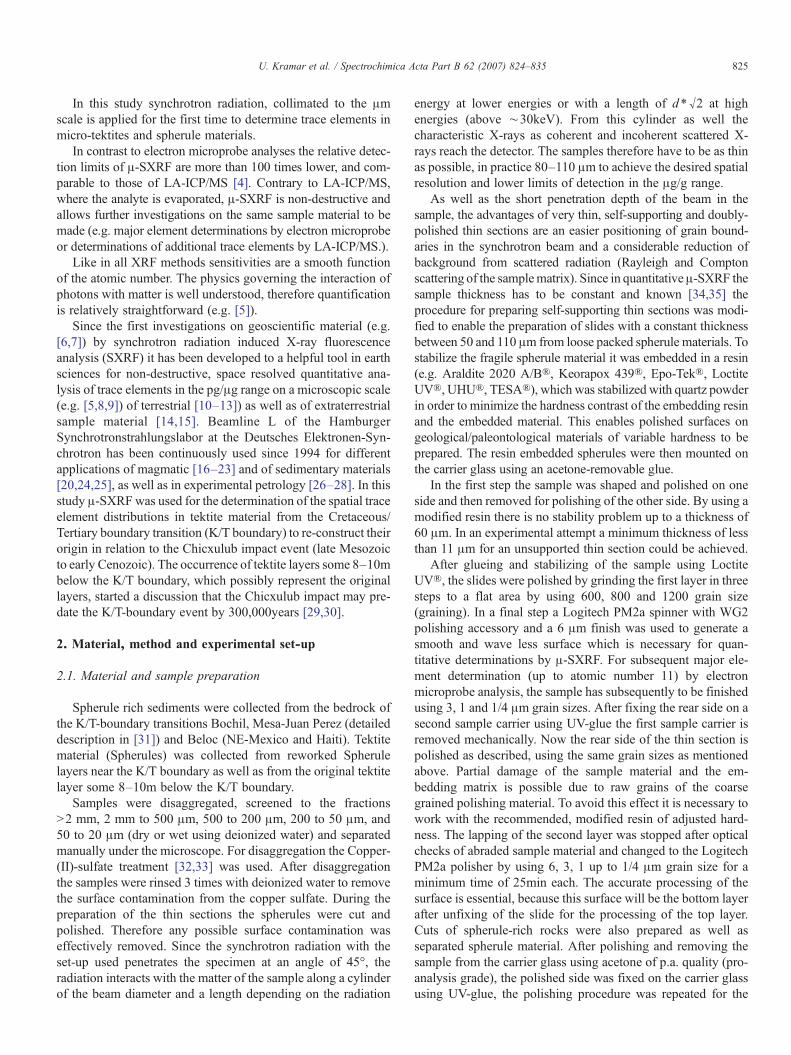
Fig. 2. Energy distribution of unfiltered and Cu- and Al-filtered synchrotronradiation used for the excitation of K-lines from elements with Z up to 82(relative photon intensities vs. E (keV)).
826 U. Kramar et al. / Spectrochimica Acta Part B 62 (2007) 824–835
rear side. Depending on the material it is also possible to useother glues (e.g. UHU®, Tesa®) based on polyurethane compo-sition, dissolvable by organic solvents. It is necessary, however,to prevent contamination of the sample by the preparationmethod. Every batch of glues, resins or tapes were tested fortheir trace element contents before use. Trace element contentsof all glues and resins used were tested by energy-dispersive X-ray fluorescence (EDXRF). Trace element contents of Araldite2020 A/B®, Keorapox 439®, Epo-Tek®, UHU®, TESA® andLoctite UV® were found to be below the detection limits ofEDXRF (Table 1) and therefore blanks of the used embeddingmaterials did not disturb the measurements.
2.2. Experimental set-up
For trace element analysis μ-SXRF was used. X-ray fluo-rescence is an analytical tool in which an incident X-ray beamcauses characteristic fluorescence in the sample. Basically, theintensities of the fluorescence lines are proportional to theconcentrations of the excited elements. Consequently, the X-rayfluorescence technique may be applied for quantitative analysis
Fig. 1. Schematic diagram of the micro X-ray fluorescence set-u
if the absorption of the primary beam and the fluorescenceradiation in the matrix is taken into account. Compared toconventional XRF methods using an X-ray tube as the photonsource, the use of synchrotron radiation as a photon source hasthe advantage that it is characterized by much higher intensitiesand a low divergence of the primary beam. These spectrumcharacteristics enable trace element analysis at a high spatialresolution facilitating trace element distribution analysis withinminerals. Further advantages are that the method is non-de-structive and allows repeatability measurements.
The experiments were performed at HASYLAB Beamline L(Fig. 1) using the white beam for micro-X-ray fluorescence[36]. The synchrotron radiation at DORIS III originates frompositrons with 4.5GeV at a bending magnet with a radius of12.12m. The critical energy is 16.6keV. Above the criticalenergy, the intensity of the primary beam decreases rapidly, butup to 90keV the intensity is still sufficient for the detection ofelements via K-shell excitation with Z up to 82 at trace elementlevels (Fig. 2). Due to the high energy part of the excitationspectra, high Z-elements can be analyzed by their K-lines in-stead of by their L-lines, which has the advantage that no or
p for white beam mode at HASYLAB at DESY (Hamburg).
827U. Kramar et al. / Spectrochimica Acta Part B 62 (2007) 824–835
reduced peak overlaps occur for example in the determination ofrare earth elements (REE). The incident beam was collimateddown to a diameter of 15 μm by using a cross-slit system and asubsequent collimating glass capillary. The low energy part ofthe excitation spectrum was reduced by the use of differentabsorbers (Cu 0.2 mm and Al 12 mm) in order to optimize theexcitation spectra with respect to peak/background ratios of thecharacteristic X-ray lines of the analyte and to reduce thedetector dead time. The energy spectrum of the white radiationand the Cu- and Al-filtered synchrotron radiation is shown inFig. 2. The fluorescence spectra of the samples were measuredusing an energy-dispersive Hp-Ge detector with an active areaof 30 mm2, 5 mm thickness, and an energy resolution of FWHM220eV at 5.9keV. The detector was arranged at an angle of 90°to the primary beam. Spectra accumulation times were 300s forsingle point measurements and between 150 and 300s per pixelfor area- and line-scan measurements.
2.3. Data evaluation
For a given intensity and energy distribution of the primarybeam the detected intensities of the X-ray lines of the differentelements mainly depend on the concentration of the respectiveelements, path length of the primary and secondary radiationwithin the sample, density and matrix composition of thesubstrate, the energy of the respective X-ray line and the de-tector efficiency at the given energy.
Due to the symmetrical angles between the sample surfaceand the incoming primary beam and the surface and the outgoingfluorescence radiation, respectively, the total measured intensityof the X-ray line can be described as follows (e.g. [37]):
I Eð Þ ¼Z x
0kiI0ciq e � l0þlið Þqxf gdx ð1Þ
with ki=proportionality constant for element i for fixedexcitation conditions, ρ=density of the substrate, μ0=mass
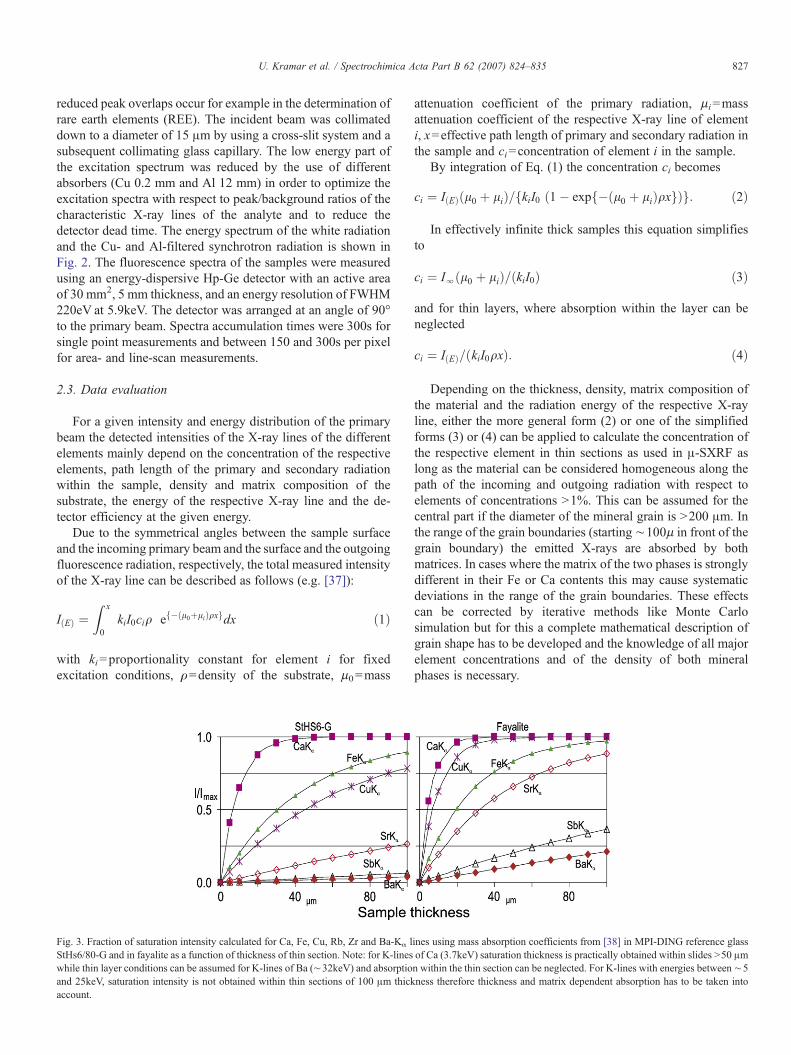
Fig. 3. Fraction of saturation intensity calculated for Ca, Fe, Cu, Rb, Zr and Ba-Kα lStHs6/80-G and in fayalite as a function of thickness of thin section. Note: for K-lineswhile thin layer conditions can be assumed for K-lines of Ba (∼32keV) and absorptioand 25keV, saturation intensity is not obtained within thin sections of 100 μm thickaccount.
attenuation coefficient of the primary radiation, μi=massattenuation coefficient of the respective X-ray line of elementi, x=effective path length of primary and secondary radiation inthe sample and ci=concentration of element i in the sample.
By integration of Eq. (1) the concentration ci becomes
ci ¼ I Eð Þ l0 þ lið Þ= kiI0 1� exp � l0 þ lið Þqxf gð Þf g: ð2Þ
In effectively infinite thick samples this equation simplifiesto
ci ¼ Il l0 þ lið Þ= kiI0ð Þ ð3Þ
and for thin layers, where absorption within the layer can beneglected
ci ¼ I Eð Þ= kiI0qxð Þ: ð4Þ
Depending on the thickness, density, matrix composition ofthe material and the radiation energy of the respective X-rayline, either the more general form (2) or one of the simplifiedforms (3) or (4) can be applied to calculate the concentration ofthe respective element in thin sections as used in μ-SXRF aslong as the material can be considered homogeneous along thepath of the incoming and outgoing radiation with respect toelements of concentrations N1%. This can be assumed for thecentral part if the diameter of the mineral grain is N200 μm. Inthe range of the grain boundaries (starting ∼100μ in front of thegrain boundary) the emitted X-rays are absorbed by bothmatrices. In cases where the matrix of the two phases is stronglydifferent in their Fe or Ca contents this may cause systematicdeviations in the range of the grain boundaries. These effectscan be corrected by iterative methods like Monte Carlosimulation but for this a complete mathematical description ofgrain shape has to be developed and the knowledge of all majorelement concentrations and of the density of both mineralphases is necessary.
ines using mass absorption coefficients from [38] in MPI-DING reference glassof Ca (3.7keV) saturation thickness is practically obtained within slides N50 μmn within the thin section can be neglected. For K-lines with energies between∼5ness therefore thickness and matrix dependent absorption has to be taken into
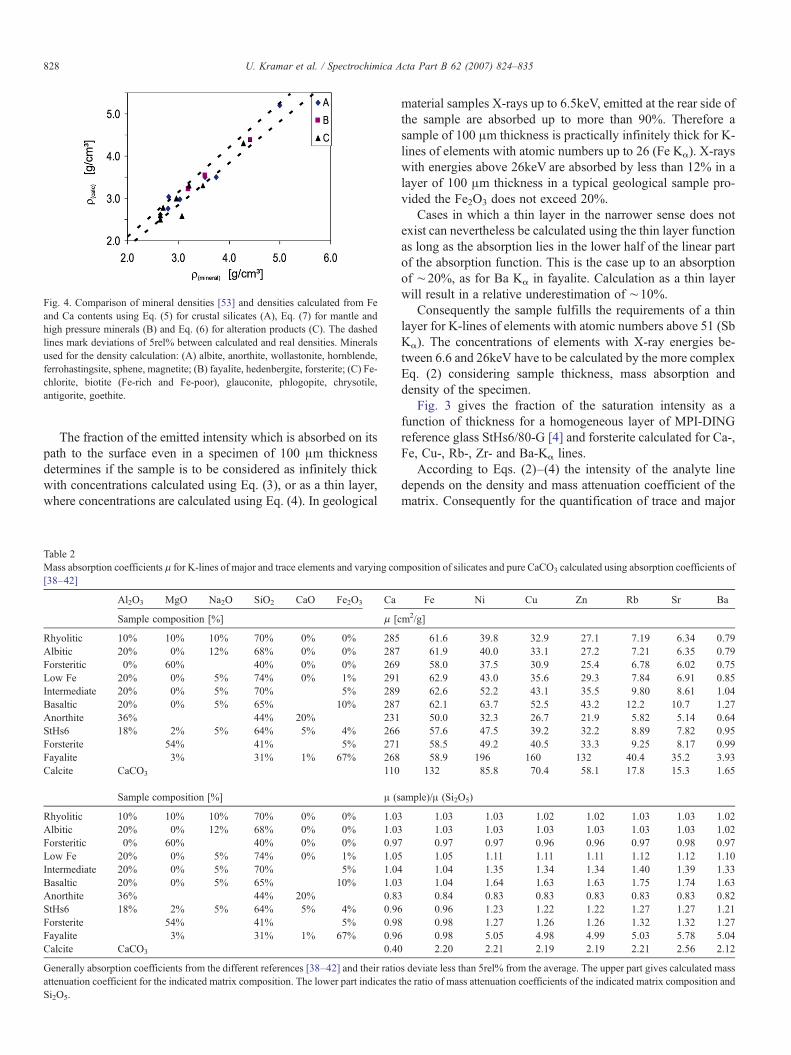
Fig. 4. Comparison of mineral densities [53] and densities calculated from Feand Ca contents using Eq. (5) for crustal silicates (A), Eq. (7) for mantle andhigh pressure minerals (B) and Eq. (6) for alteration products (C). The dashedlines mark deviations of 5rel% between calculated and real densities. Mineralsused for the density calculation: (A) albite, anorthite, wollastonite, hornblende,ferrohastingsite, sphene, magnetite; (B) fayalite, hedenbergite, forsterite; (C) Fe-chlorite, biotite (Fe-rich and Fe-poor), glauconite, phlogopite, chrysotile,antigorite, goethite.
828 U. Kramar et al. / Spectrochimica Acta Part B 62 (2007) 824–835
The fraction of the emitted intensity which is absorbed on itspath to the surface even in a specimen of 100 μm thicknessdetermines if the sample is to be considered as infinitely thickwith concentrations calculated using Eq. (3), or as a thin layer,where concentrations are calculated using Eq. (4). In geological
Table 2Mass absorption coefficients μ for K-lines of major and trace elements and varying co[38–42]
Al2O3 MgO Na2O SiO2 CaO Fe2O3 Ca
Sample composition [%] μ [c
Rhyolitic 10% 10% 10% 70% 0% 0% 285Albitic 20% 0% 12% 68% 0% 0% 287Forsteritic 0% 60% 40% 0% 0% 269Low Fe 20% 0% 5% 74% 0% 1% 291Intermediate 20% 0% 5% 70% 5% 289Basaltic 20% 0% 5% 65% 10% 287Anorthite 36% 44% 20% 231StHs6 18% 2% 5% 64% 5% 4% 266Forsterite 54% 41% 5% 271Fayalite 3% 31% 1% 67% 268Calcite CaCO3 110
Sample composition [%] μ (s
Rhyolitic 10% 10% 10% 70% 0% 0% 1.03Albitic 20% 0% 12% 68% 0% 0% 1.03Forsteritic 0% 60% 40% 0% 0% 0.97Low Fe 20% 0% 5% 74% 0% 1% 1.05Intermediate 20% 0% 5% 70% 5% 1.04Basaltic 20% 0% 5% 65% 10% 1.03Anorthite 36% 44% 20% 0.83StHs6 18% 2% 5% 64% 5% 4% 0.96Forsterite 54% 41% 5% 0.98Fayalite 3% 31% 1% 67% 0.96Calcite CaCO3 0.40
Generally absorption coefficients from the different references [38–42] and their ratioattenuation coefficient for the indicated matrix composition. The lower part indicatesSi2O5.
material samples X-rays up to 6.5keV, emitted at the rear side ofthe sample are absorbed up to more than 90%. Therefore asample of 100 μm thickness is practically infinitely thick for K-lines of elements with atomic numbers up to 26 (Fe Kα). X-rayswith energies above 26keV are absorbed by less than 12% in alayer of 100 μm thickness in a typical geological sample pro-vided the Fe2O3 does not exceed 20%.
Cases in which a thin layer in the narrower sense does notexist can nevertheless be calculated using the thin layer functionas long as the absorption lies in the lower half of the linear partof the absorption function. This is the case up to an absorptionof ∼20%, as for Ba Kα in fayalite. Calculation as a thin layerwill result in a relative underestimation of ∼10%.
Consequently the sample fulfills the requirements of a thinlayer for K-lines of elements with atomic numbers above 51 (SbKα). The concentrations of elements with X-ray energies be-tween 6.6 and 26keV have to be calculated by the more complexEq. (2) considering sample thickness, mass absorption anddensity of the specimen.
Fig. 3 gives the fraction of the saturation intensity as afunction of thickness for a homogeneous layer of MPI-DINGreference glass StHs6/80-G [4] and forsterite calculated for Ca-,Fe, Cu-, Rb-, Zr- and Ba-Kα lines.
According to Eqs. (2)–(4) the intensity of the analyte linedepends on the density and mass attenuation coefficient of thematrix. Consequently for the quantification of trace and major
mposition of silicates and pure CaCO3 calculated using absorption coefficients of
Fe Ni Cu Zn Rb Sr Ba
m2/g]
61.6 39.8 32.9 27.1 7.19 6.34 0.7961.9 40.0 33.1 27.2 7.21 6.35 0.7958.0 37.5 30.9 25.4 6.78 6.02 0.7562.9 43.0 35.6 29.3 7.84 6.91 0.8562.6 52.2 43.1 35.5 9.80 8.61 1.0462.1 63.7 52.5 43.2 12.2 10.7 1.2750.0 32.3 26.7 21.9 5.82 5.14 0.6457.6 47.5 39.2 32.2 8.89 7.82 0.9558.5 49.2 40.5 33.3 9.25 8.17 0.9958.9 196 160 132 40.4 35.2 3.93132 85.8 70.4 58.1 17.8 15.3 1.65
ample)/μ (Si2O5)
1.03 1.03 1.02 1.02 1.03 1.03 1.021.03 1.03 1.03 1.03 1.03 1.03 1.020.97 0.97 0.96 0.96 0.97 0.98 0.971.05 1.11 1.11 1.11 1.12 1.12 1.101.04 1.35 1.34 1.34 1.40 1.39 1.331.04 1.64 1.63 1.63 1.75 1.74 1.630.84 0.83 0.83 0.83 0.83 0.83 0.820.96 1.23 1.22 1.22 1.27 1.27 1.210.98 1.27 1.26 1.26 1.32 1.32 1.270.98 5.05 4.98 4.99 5.03 5.78 5.042.20 2.21 2.19 2.19 2.21 2.56 2.12
s deviate less than 5rel% from the average. The upper part gives calculated massthe ratio of mass attenuation coefficients of the indicated matrix composition and
829U. Kramar et al. / Spectrochimica Acta Part B 62 (2007) 824–835
elements in varying matrices the major element composition hasto be known or has to be determined for example by electronmicroprobe.
Silicate minerals consist of 40 to 50% oxygen, 16 to 53% Siand up to 25% Al or Mg. Therefore at least 56% of the matrix ofsilicate minerals remains constant. For energies above the Feabsorption edge mass absorption coefficients of Al and Mg areonly 20 respectively 35% lower than the mass absorptioncoefficient of Si, whereas the absorption coefficients of K, Caand Fe are higher by a factor 2.3 to 5.16. Therefore, in densegeological silicate samples variations of sample density andmass absorption coefficients for energies above 4keVare mainlycontrolled by the Fe, K and Ca content of the sample (Fig. 4).Thus, after optical inspection of the thin section by polarizationmicroscopy to determine the fractions of silicates, carbonates oroxides, that are present, an approach in accordance with Eq. (2)can be applied. This approach was also used to correct matrixeffect of the tektite material. Since the light elements cannot bedetermined by X-ray fluorescence under non-vacuum condi-tions, the mass absorption coefficients have to be estimated. Forthe silicate part of a sample the mass absorption coefficient ofSi2O5 is a good estimate for varying concentrations of theoxides Na2O, MgO, Al2O3 and SiO2 in a silicate. Even the massabsorption coefficients of K, Ca, Ti, Mn and Fe-free mineralse.g. albite, forsterite or quartz deviate by less than 5% from themass absorption coefficients of Si2O5, whereas even 1% ofFe2O3 increases the mass absorption coefficient by more than10% (Table 2). Nevertheless K, Ca, Ti and Fe can be determinedunder non-vacuum conditions with sufficient accuracy for thecalculation of the total mass absorption coefficients.
The trace element concentrations in spherule material weredetermined by a semi-empirical approach based on Eqs. (1), (2)and (3) using the mass absorption coefficients of Si2O5 for thelight element matrix and of K, Ca, Ti and Fe for the heavy partof the matrix. If Eqs. (2) and (3) are used, the density of thesample has to be known. The density range of most Fe-poorsilicate minerals is between 2.5 and 3.3. Beside the crystalstructure the density depends mainly on the concentrations ofthe heavier elements in the mineral. The density of a silicatematches almost exactly the mixing line of the respective Fe-freesilicate and Fe oxide or hydroxide as an end member (Fig. 4).Depending on the mineralogy the density can be estimated as
qsample ¼ qquartz þ c CaO½ �⁎ qcalcite � qquartz� �
=44þ c Fe2O3½ �⁎ qmaghemite � qquartz
� �=100 ð5Þ
for crustal silicates and
qsample ¼ qquartz þ c CaO½ �⁎ qcalcite � qquartz� �
=44þ c Fe2O3½ �⁎ qgoethite � qquartz
� � ð6Þfor alteration products and
qsample ¼ qforsterite þ c CaO½ �⁎ qcalcite � qforsteriteð Þþ c Fe2O3½ �⁎ qmaghemite � qforsterite
� � ð7Þfor high Mg bearing mantle minerals (olivine) and high pressureminerals.
Using these estimates the deviation from the density of thenatural minerals is less than 5% in most cases (Fig. 4).
Based on the intensities of Fe and Ca, variations of massattenuation coefficients and density were estimated for the re-spective location of the sample. The resulting attenuation coef-ficients and fractions of saturation thickness for the respectiveX-ray lines were used for the correction of matrix effects and theamount of the sample. The calibration curves were determinedfrom 100 μm thin sections of MPI-DING reference glassesKL2-G, StHs6/80-G, ML3B-G, BM90/21-G, T1-G and ATHO-G using the values given in [4].
Detection limits (Table 1) were calculated based on MPI-Ding-StHs6 standard sample/reference material using thefollowing equation:
D:L: ¼ m � 3 � sqrt 1000⁎RBckgr
� � ð8Þ
with
RBckgr ¼ countrate of background s�1½ �:m ¼ slope of calibration line lg=g s�1½ �:
The precision of the analytical results depend mainly on thecounting statistics, accuracy of the thickness and densityestimate of the thin section and of the accuracy of the ratiosof the mass absorption coefficients of the matrix elements andof the reference matrix Si2O5 for the different X-ray energiesused for the calculation. The ratios for pure matrix elementscalculated from different references [38–42] vary by 1 to 7rel%.Consequently for a contribution of an element up to 30% to thematrix the error resulting from mass absorption coefficient canbe expected to be smaller than 2% relatively. Therefore besidethe counting statistics the precision mainly depends onthickness variations and the deviation of the density estimatefrom the actual density. Both components are estimated tocontribute to the total standard deviation by 10% of the value.
3. Results and discussion
In unsupported thin sections of 100 μm thickness ofspherules and micro-tektites the elements Ca, Ti, Mn, Fe, Cu,Zn, As, Rb, Zr, Sr, Nb, Ba, La, Ce and Pb have been determinedsimultaneously using a filtered polychromatic beam and acollimating capillary with a spot size smaller than 15 × 21 μmfor line and area scans. It must nevertheless be taken intoaccount that the information about elements, emitting high X-ray energies, corresponds to the complete sample thickness(Fig. 3). For hard X-rays, this results in an analyzed cylindricalvolume of 15 μm diameter and 140 μm length equivalent to3⁎10−4mm3 or ∼1 μg.
Detection limits were determined from 100 μm thick thinsections of the MPI-DING reference samples StHs6/80G andATHO-G [4], applying the same measuring conditions as for themicro-tektites and spherules. In repetitive point measurementsof 300s each (3points) a precision of 1% to 5% was obtained forCu, Zn, Ga, Rb, Sr, Ba, La and Ce. The precision calculatedfrom the counting statistics is equivalent to the precision
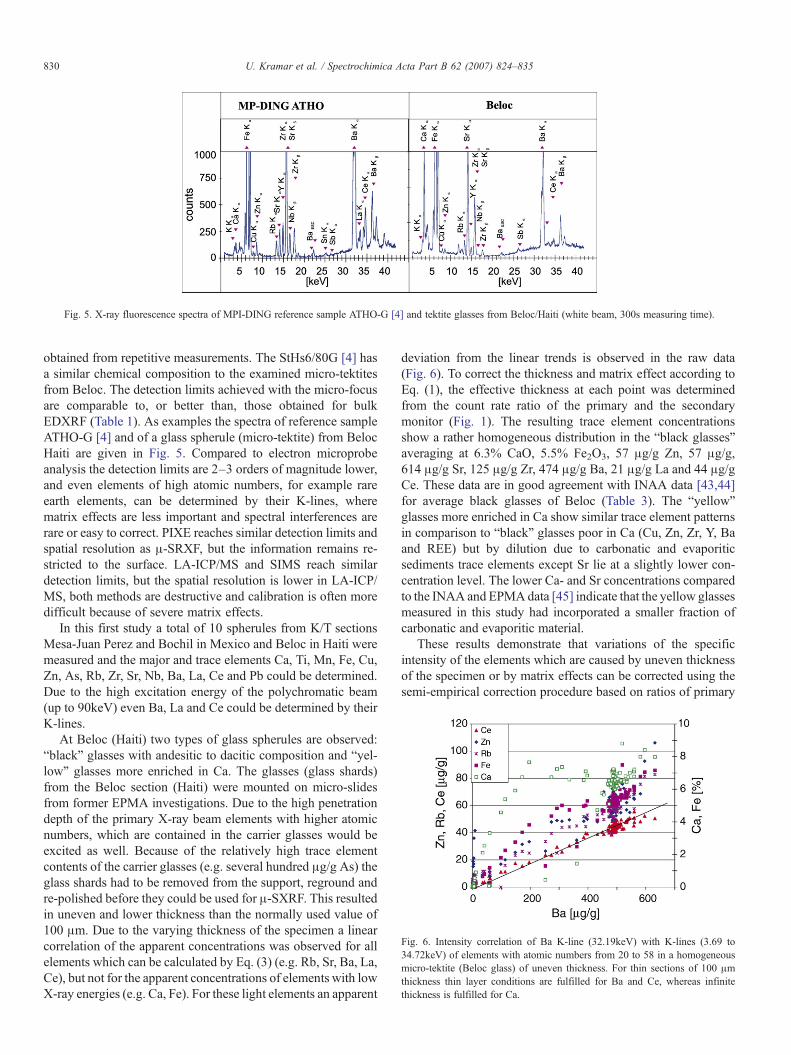
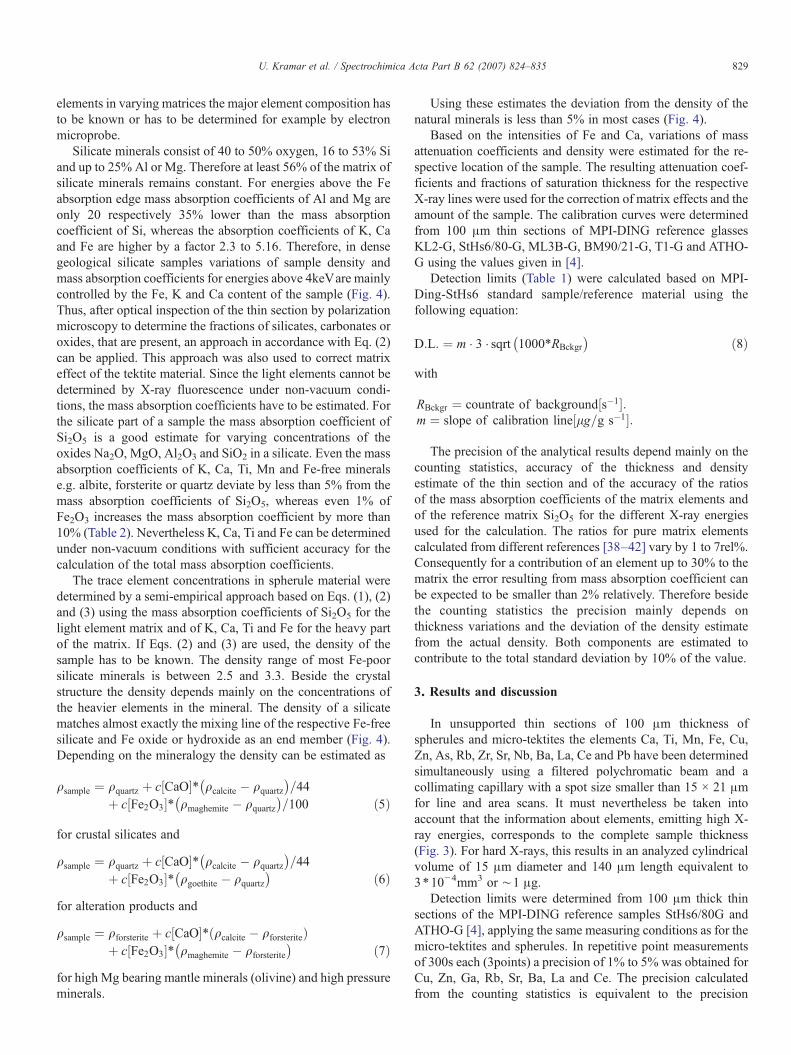
Fig. 5. X-ray fluorescence spectra of MPI-DING reference sample ATHO-G [4] and tektite glasses from Beloc/Haiti (white beam, 300s measuring time).
Fig. 6. Intensity correlation of Ba K-line (32.19keV) with K-lines (3.69 to34.72keV) of elements with atomic numbers from 20 to 58 in a homogeneousmicro-tektite (Beloc glass) of uneven thickness. For thin sections of 100 μmthickness thin layer conditions are fulfilled for Ba and Ce, whereas infinitethickness is fulfilled for Ca.
830 U. Kramar et al. / Spectrochimica Acta Part B 62 (2007) 824–835
obtained from repetitive measurements. The StHs6/80G [4] hasa similar chemical composition to the examined micro-tektitesfrom Beloc. The detection limits achieved with the micro-focusare comparable to, or better than, those obtained for bulkEDXRF (Table 1). As examples the spectra of reference sampleATHO-G [4] and of a glass spherule (micro-tektite) from BelocHaiti are given in Fig. 5. Compared to electron microprobeanalysis the detection limits are 2–3 orders of magnitude lower,and even elements of high atomic numbers, for example rareearth elements, can be determined by their K-lines, wherematrix effects are less important and spectral interferences arerare or easy to correct. PIXE reaches similar detection limits andspatial resolution as μ-SRXF, but the information remains re-stricted to the surface. LA-ICP/MS and SIMS reach similardetection limits, but the spatial resolution is lower in LA-ICP/MS, both methods are destructive and calibration is often moredifficult because of severe matrix effects.
In this first study a total of 10 spherules from K/T sectionsMesa-Juan Perez and Bochil in Mexico and Beloc in Haiti weremeasured and the major and trace elements Ca, Ti, Mn, Fe, Cu,Zn, As, Rb, Zr, Sr, Nb, Ba, La, Ce and Pb could be determined.Due to the high excitation energy of the polychromatic beam(up to 90keV) even Ba, La and Ce could be determined by theirK-lines.
At Beloc (Haiti) two types of glass spherules are observed:“black” glasses with andesitic to dacitic composition and “yel-low” glasses more enriched in Ca. The glasses (glass shards)from the Beloc section (Haiti) were mounted on micro-slidesfrom former EPMA investigations. Due to the high penetrationdepth of the primary X-ray beam elements with higher atomicnumbers, which are contained in the carrier glasses would beexcited as well. Because of the relatively high trace elementcontents of the carrier glasses (e.g. several hundred μg/g As) theglass shards had to be removed from the support, reground andre-polished before they could be used for μ-SXRF. This resultedin uneven and lower thickness than the normally used value of100 μm. Due to the varying thickness of the specimen a linearcorrelation of the apparent concentrations was observed for allelements which can be calculated by Eq. (3) (e.g. Rb, Sr, Ba, La,Ce), but not for the apparent concentrations of elements with lowX-ray energies (e.g. Ca, Fe). For these light elements an apparent
deviation from the linear trends is observed in the raw data(Fig. 6). To correct the thickness and matrix effect according toEq. (1), the effective thickness at each point was determinedfrom the count rate ratio of the primary and the secondarymonitor (Fig. 1). The resulting trace element concentrationsshow a rather homogeneous distribution in the “black glasses”averaging at 6.3% CaO, 5.5% Fe2O3, 57 μg/g Zn, 57 μg/g,614 μg/g Sr, 125 μg/g Zr, 474 μg/g Ba, 21 μg/g La and 44 μg/gCe. These data are in good agreement with INAA data [43,44]for average black glasses of Beloc (Table 3). The “yellow”glasses more enriched in Ca show similar trace element patternsin comparison to “black” glasses poor in Ca (Cu, Zn, Zr, Y, Baand REE) but by dilution due to carbonatic and evaporiticsediments trace elements except Sr lie at a slightly lower con-centration level. The lower Ca- and Sr concentrations comparedto the INAA and EPMAdata [45] indicate that the yellow glassesmeasured in this study had incorporated a smaller fraction ofcarbonatic and evaporitic material.
These results demonstrate that variations of the specificintensity of the elements which are caused by uneven thicknessof the specimen or by matrix effects can be corrected using thesemi-empirical correction procedure based on ratios of primary
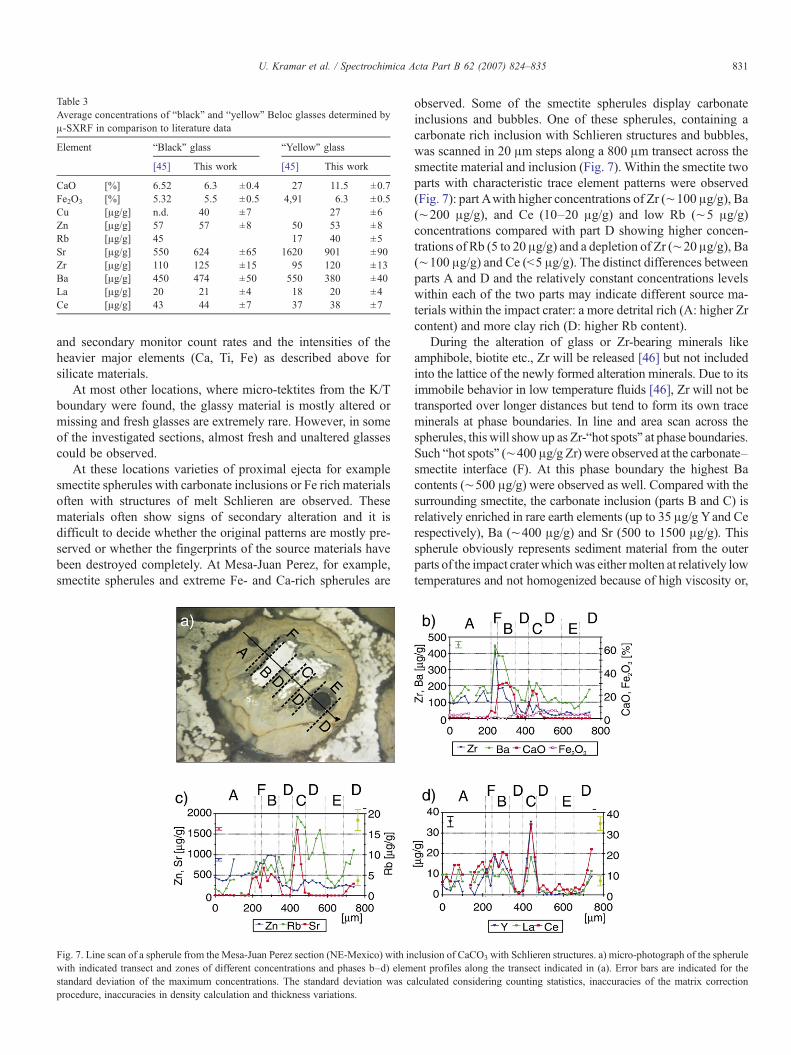
Table 3Average concentrations of “black” and “yellow” Beloc glasses determined byμ-SXRF in comparison to literature data
Element “Black” glass “Yellow” glass
[45] This work [45] This work
CaO [%] 6.52 6.3 ±0.4 27 11.5 ±0.7Fe2O3 [%] 5.32 5.5 ±0.5 4,91 6.3 ±0.5Cu [μg/g] n.d. 40 ±7 27 ±6Zn [μg/g] 57 57 ±8 50 53 ±8Rb [μg/g] 45 17 40 ±5Sr [μg/g] 550 624 ±65 1620 901 ±90Zr [μg/g] 110 125 ±15 95 120 ±13Ba [μg/g] 450 474 ±50 550 380 ±40La [μg/g] 20 21 ±4 18 20 ±4Ce [μg/g] 43 44 ±7 37 38 ±7
831U. Kramar et al. / Spectrochimica Acta Part B 62 (2007) 824–835
and secondary monitor count rates and the intensities of theheavier major elements (Ca, Ti, Fe) as described above forsilicate materials.
At most other locations, where micro-tektites from the K/Tboundary were found, the glassy material is mostly altered ormissing and fresh glasses are extremely rare. However, in someof the investigated sections, almost fresh and unaltered glassescould be observed.
At these locations varieties of proximal ejecta for examplesmectite spherules with carbonate inclusions or Fe rich materialsoften with structures of melt Schlieren are observed. Thesematerials often show signs of secondary alteration and it isdifficult to decide whether the original patterns are mostly pre-served or whether the fingerprints of the source materials havebeen destroyed completely. At Mesa-Juan Perez, for example,smectite spherules and extreme Fe- and Ca-rich spherules are
Fig. 7. Line scan of a spherule from the Mesa-Juan Perez section (NE-Mexico) with inwith indicated transect and zones of different concentrations and phases b–d) elemstandard deviation of the maximum concentrations. The standard deviation was cprocedure, inaccuracies in density calculation and thickness variations.
observed. Some of the smectite spherules display carbonateinclusions and bubbles. One of these spherules, containing acarbonate rich inclusion with Schlieren structures and bubbles,was scanned in 20 μm steps along a 800 μm transect across thesmectite material and inclusion (Fig. 7). Within the smectite twoparts with characteristic trace element patterns were observed(Fig. 7): part Awith higher concentrations of Zr (∼100 μg/g), Ba(∼200 μg/g), and Ce (10–20 μg/g) and low Rb (∼5 μg/g)concentrations compared with part D showing higher concen-trations of Rb (5 to 20 μg/g) and a depletion of Zr (∼20 μg/g), Ba(∼100 μg/g) and Ce (b5 μg/g). The distinct differences betweenparts A and D and the relatively constant concentrations levelswithin each of the two parts may indicate different source ma-terials within the impact crater: a more detrital rich (A: higher Zrcontent) and more clay rich (D: higher Rb content).
During the alteration of glass or Zr-bearing minerals likeamphibole, biotite etc., Zr will be released [46] but not includedinto the lattice of the newly formed alteration minerals. Due to itsimmobile behavior in low temperature fluids [46], Zr will not betransported over longer distances but tend to form its own traceminerals at phase boundaries. In line and area scan across thespherules, this will show up as Zr-“hot spots” at phase boundaries.Such “hot spots” (∼400 μg/g Zr) were observed at the carbonate–smectite interface (F). At this phase boundary the highest Bacontents (∼500 μg/g) were observed as well. Compared with thesurrounding smectite, the carbonate inclusion (parts B and C) isrelatively enriched in rare earth elements (up to 35 μg/g Yand Cerespectively), Ba (∼400 μg/g) and Sr (500 to 1500 μg/g). Thisspherule obviously represents sediment material from the outerparts of the impact craterwhichwas eithermolten at relatively lowtemperatures and not homogenized because of high viscosity or,
clusion of CaCO3 with Schlieren structures. a) micro-photograph of the spheruleent profiles along the transect indicated in (a). Error bars are indicated for thealculated considering counting statistics, inaccuracies of the matrix correction
832 U. Kramar et al. / Spectrochimica Acta Part B 62 (2007) 824–835
analogous to carbonatite formation, carbonate and silicate phasesseparated from a silicatic–carbonatic melt due to liquid immis-cibility during cooling down. The slow cooling rates which arenecessary for those phase separations and the different traceelement concentration levels of smectite parts A and D argueagainst the second type of formation. High Zn, Sr and REEcontents of the carbonate inclusion indicate a non-diageneticorigin but the enrichment ofBa and Sr observed on the carbonate–smectite interfaces argues for re-crystallization.
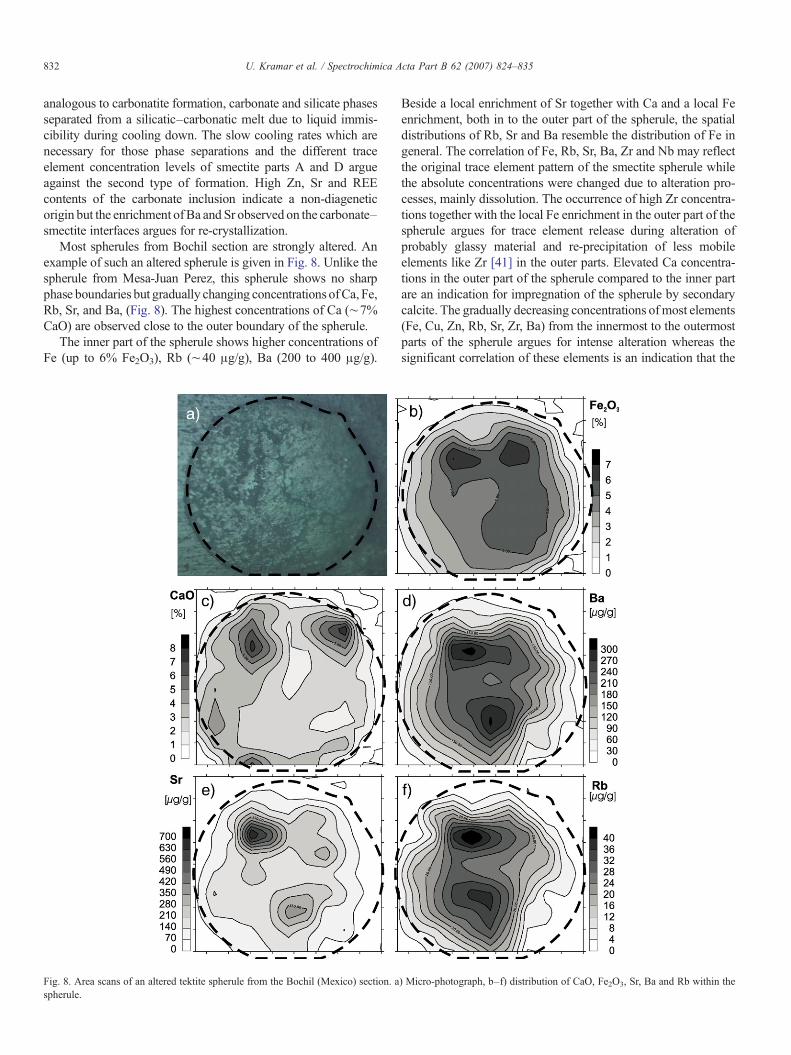
Most spherules from Bochil section are strongly altered. Anexample of such an altered spherule is given in Fig. 8. Unlike thespherule from Mesa-Juan Perez, this spherule shows no sharpphase boundaries but gradually changing concentrations ofCa, Fe,Rb, Sr, and Ba, (Fig. 8). The highest concentrations of Ca (∼7%CaO) are observed close to the outer boundary of the spherule.
The inner part of the spherule shows higher concentrations ofFe (up to 6% Fe2O3), Rb (∼40 μg/g), Ba (200 to 400 μg/g).
Fig. 8. Area scans of an altered tektite spherule from the Bochil (Mexico) section. aspherule.
Beside a local enrichment of Sr together with Ca and a local Feenrichment, both in to the outer part of the spherule, the spatialdistributions of Rb, Sr and Ba resemble the distribution of Fe ingeneral. The correlation of Fe, Rb, Sr, Ba, Zr and Nb may reflectthe original trace element pattern of the smectite spherule whilethe absolute concentrations were changed due to alteration pro-cesses, mainly dissolution. The occurrence of high Zr concentra-tions together with the local Fe enrichment in the outer part of thespherule argues for trace element release during alteration ofprobably glassy material and re-precipitation of less mobileelements like Zr [41] in the outer parts. Elevated Ca concentra-tions in the outer part of the spherule compared to the inner partare an indication for impregnation of the spherule by secondarycalcite. The gradually decreasing concentrations ofmost elements(Fe, Cu, Zn, Rb, Sr, Zr, Ba) from the innermost to the outermostparts of the spherule argues for intense alteration whereas thesignificant correlation of these elements is an indication that the
) Micro-photograph, b–f) distribution of CaO, Fe2O3, Sr, Ba and Rb within the
833U. Kramar et al. / Spectrochimica Acta Part B 62 (2007) 824–835
trace element ratios are partly preserved while the absoluteconcentrations have changed. The inner part may show relicts ofthe original trace element contents but generally this spherule isoverprinted by strong alteration, corrupting the primary signals.
4. Summary and conclusions
μ-SXRF is the only non-destructive micro-analytical methodwhich achieves the similar low detection limits as LA-ICP/MS.The high penetration depth of the X-rays used not only providesinformation from the surface of the sample but also from a depthup to several hundred μm. Because of this the method is lesssensitive to surface contamination than the other micro-ana-lytical methods. New focusing devices for X-rays (refractive X-ray lenses, polycapillaries) meanwhile allow smaller beam focidown to less than 100nm and the development of confocaloptics enables the analysis of a defined sample volume at thespot position instead of a cylinder with varying length de-pending on the X-ray energy of the analyte element and truenon-destructive 3-dimensional trace element analysis [47].Nevertheless the use of refractive lenses and poly capillariesis restricted to monochromatic excitation beams. TheoreticallyCRLs can be used at energies up to some hundred keV butdue to the low photon flux at high energies at bending magnetbeamlines practical applications are limited to excitationenergies of 30–50keV. In mineralogy and geology the rareearth elements (REE) are of high diagnostic importance. This isalso the case for the re-construction of the micro-tektite parentmaterials.
• For the determination by their K-lines of Ba and REE's asdiagnostic elements the excitation by a filtered white beam ismore effective than excitation by the lower energies of themonochromatic beam.
• On the other hand, disadvantages of using the white beam incomparison to monochromatic excitation are poorer detec-tion limits due to the higher background from scatteredradiation.
• Quantification of X-ray fluorescence spectra is most oftenbased on fundamental parameter procedures or on MonteCarlo simulation. For both methods the major elementalchemistry, sample geometry and density have to be knownexactly, which often is not the case. The semi-empiricalapproach, which was used in this paper to correct matrixeffects of mineralogical materials, is based on mass absorp-tion coefficients of heavy major elements, average silicatemass absorption coefficients and monitor count rate ratios. Inthe case of elements that are emitting X-ray energies, whichdo not fulfill the conditions for infinite thickness in thespecific thin section, the densities were corrected on the basisof the computed Fe and Ca concentrations. This reduces theeffect of density variations on the results to less than 5%. Theaccuracy which can be achieved using this approach is ofcourse not comparable to accuracies obtained by fundamen-tal parameters in bulk analysis e.g. for quality control, butsufficiently exact for the determination of trace elements ininhomogeneous geological materials. For the homogeneous
part of a mineral grain the uncertainty introduced by matrixand density variations is estimated to be better than 10rel%after correction. In trace element analysis the bigger uncer-tainty in most cases is the counting statistics. If all parametersare known the results obtained by using this semi-empiricalapproach have not the same accuracy but are comparable tothose obtained by fundamental parameters or Monte Carlosimulations. However, and this is the advantage, this semi-empirical method does not require the knowledge of thecomplete major element chemistry and of the density. Carehas to be taken in the region of grain boundaries, where theprimary beam and the outgoing radiation may penetratedifferent matrix materials with drastic differences in the massabsorption coefficients e.g. Fe-oxides in contact with sili-cates. In such regions matrix effects are not consideredadequately and the analytical data can only be considered assemi-quantitative, however the ratios of most trace elementconcentrations will not be affected. For the identification ofpossible source materials these elemental ratios are of muchhigher importance as the absolute values.
Spherules (micro-tektites) found in many K/T transitions areinterpreted as ejecta material of the Chicxulub impact event nearthe K/T boundary some 65million years ago [43,48–52]. How-ever, the origin of this tektite material and its chemical traceelement composition is mainly unknown and at the moment notwell studied. Space resolved trace element mapping by μ-SXRFenabled differentiation between altered and unaltered parts ofthe tektite spherules and the identification of the source rocks tobe made by comparing trace element distribution patterns(fingerprints) of possible source rocks and spherules. The ex-treme differences in the chemical composition of spherules fromdifferent localities could not be simply explained by weatheringof glass material from a homogeneous source.
• Glassy material for example of Beloc section (Haiti) ischaracterized by homogeneous trace element distributionpatterns but shows characteristic differences between Ca-richand Ca-poor glass. This is indicative of the mixing of dif-ferent source materials from the impact crater. Major andtrace element patterns indicate an origin from deeper crustmaterial and minor amounts of evaporitic components mixedinto the melt.
• Line and area scans from tektite material of Mesa-JuanPerez and Bochil section (Mexico) showed calcite inclu-sions, zonings or gradual changes of trace element contents.Based on the spatial trace element distribution some ofthese inclusions are indicative of primary material from theimpact crater (example of Mesa-Juan Perez, Fig. 7). Traceand major elements indicate a sedimentary source of thesespherules.
• Enrichments of Ca and other calcite related elements (Sr,Ba) in the outer parts of the micro-tektites represent im-pregnation by secondary calcite (e.g. Bochil, Fig. 8). Thesetypes of spherules are strongly overprinted by diagenesis.Nevertheless the original trace element ratios may be partlypreserved.
834 U. Kramar et al. / Spectrochimica Acta Part B 62 (2007) 824–835
Summarizing, the non-destructive determination of thespatial trace element distribution in micro-tektites on the μmscale by μ-SXRF enables differentiation between alterationrims, non-altered material and mixing of different source ma-terials. This makes of μ-SXRF an extremely valuable tool to re-construct the scenario of the K/T-boundary impact event.
Acknowledgements
This study was supported by the Deutsche Forschungsge-meinschaft (grants Stu 169/10-1-3). The sample material wasprovided by Gerta Keller and Wolfgang Stinnesbeck. We wouldalso like to thank very much Stefan Höhne for the selection ofspherule material of the Beloc section and the staff of theHASYLAB Synchrotron radiation facility for their assistanceand the HASYLAB for providing beamtime at beamline L aswell as Arndt Knöchel (Hamburg) for his encouragement toinvestigate our tektite material by μ-SXRF. We are grateful toManfred Gerken, Kristian Nikoloski and Stefan Unrein for theirhelp in thin section preparation and last but not the least ourthanks go to Dirk Munsel and Ian Ray for improving ourEnglish. The comments of two anonymous reviewers have beenalso very helpful to improve the manuscript.
References
[1] A. Denker, J. Opitz-Coutureau, J.L. Campbell, J.A. Maxwell, T. Hopman,High-energy PIXE: quantitative analysis, Nucl. Instrum. Methods, Sect. B219–220C (2004) 130.
[2] S.A.E. Johansson, J.L. Campbell, K.G.Malmqvist, Particle-InducedX-RayEmission Spectrometry (PIXE), Wiley, New York, 2005.
[3] P.J. Potts, J.F.W. Bowles, S.J.B. Reed, M.R. Cave (Eds.), MicroprobeTechniques in Earth Sciences, Chapman and Hall, London, 1995.
[4] K.P. Jochum, D.B. Dingwell, A. Rocholl, B. Stoll, A.W. Hofmann, et al.,The preparation and preliminary characterisation of eight geological MPI-DING reference glasses for in-situ microanalysis, Geostand. Newsl. 24(2000) 87–133.
[5] S.R. Sutton, M.L. Rivers, P.J. Eng, M. Neville, Applications ofsynchrotron X-ray microprobe analysis in geochemistry and cosmochem-istry, Eos, Trans. - Am. Geophys. Union 78 (1997) F789.
[6] A.V. Dubinin, I.I. Volkov, V.B. Baryshev, G.N. Kulipanov, X-rayfluorescence analysis by means of synchrotron radiation for rare-earthelements, yttrium, and barium in Pacific bottom sediments, Geochem. Int.23 (1986) 61–68.
[7] J.D. Frantz, H.K. Mao, Y.G. Zhang, Y. Wu, A.C. Thompson, J.H.Underwood, R.D. Giauque, K.W. Jones, M.L. Rivers, Analysis of fluidinclusion by X-ray fluorescence using synchrotron radiation, Chem. Geol.69 (1988) 235–244.
[8] J.V. Smith, M.L. Rivers, Synchrotron X-ray microanalysis, in: P.J. Potts,J.F.W. Bowles, S.J.B. Reed, M.R. Cave (Eds.), Microprobe Techniquesin Earth Sciences, Chapman & Hall, London, 1995, pp. 163–233.
[9] N. Allison, A.A. Fincii, S.R. Sutton, M. Newville, Strontium heterogeneityand speciation in coral aragonite: implications for the strontiumpaleothermometer, Geochim. Cosmochim. Acta 65 (2001) 1669–2976.
[10] C. Dalpé, D.R. Baker, S.R. Sutton, Synchrotron X-ray-fluorescence andlaser-ablation ICP-MS microprobes; useful instruments for analysis ofexperimental run-products, Can. Mineral. 33 (1995) 481–498.
[11] M.O. Figueiredo, T. Pereira da Silva, J.P. Veiga, P. Chevallier,Phosphatization of basaltic rocks from Sal Island, Cape Verde Archipel-ago: a microtopochemical approach using synchrotron radiation X-rayfluorescence, J. Phys. IV France 104 (2003) 399.
[12] M.J. Basto, Gold Assessment in Mics by XRF using synchrotron radiation,Chem. Geol. 124 (1995) 83–90.
[13] J. Rakovan, R. Reeder, Intercrystalline rare earth element distribution inapatite: surface structural influences on incorporation during growth,Geochim. Cosmochim. Acta 60 (1996) 4435–4445.
[14] A.H. Treiman, S.R. Sutton, Petrogenesis of the Zagami meteorite:inferences from synchrotron X-ray (SXRF) microprobe and electronmicroprobe analyses of pyroxenes, Geochem. Cosmochim. Acta 56 (1992)4059–4074.
[15] G.J. Flynn, S.R. Sutton, L.P. Keller, Synchrotron X-ray fluorescence traceelement measurements on interplanetary dust particles as a method to infertheir sources and interrelationships, Lunar Planet. Sci. XXXIII (2002) 1648.
[16] T. Umsonst, R. Emmermann, J. Lauterjung, W. Bach, S. Garbe, M. Radtke,A. Knöchel, K. Janssens, L. Vincze, F. Adams, REE determination in midocean ridge basalts from the East Pacific Rise — results from synchrotronradiation induced X-ray fluorescence (SYXRF), HASYLAB Ann. Rep.(1994) 989–990.
[17] W. Bach, E. Hegner, J. Erzinger, M. Satir, Chemical and isotope variationsalong the superfast spreading East Pacific Rise from 6 to 30° S, Contrib.Mineral. Petrol. 116 (1994) 365–380.
[18] M.J. Streck, F. Lechtenberg, P. Sachs, H.U. Schmincke, Trace elementconcentrations obtained by synchrotron-XRF spot analysis for mineralpartition coefficients of high-silica rhyolites, HASYLABAnn. Rep. (1995)945–946.
[19] A. Klügel, P.M. Sachs, F. Lechtenberg, H.U. Schmincke, Trace elementzoning in mantel xenoliths: first results of synchrotron X-ray fluorescenceanalysis (SYXRF), HASYLAB Ann. Rep. (1995) 947–948.
[20] P.M. Sachs, T.H. Hansteen, Pleistocene underplating and metasomatism ofthe lower continental crust: a xenolith study, J. Petrol. 41 (2000) 331–356.
[21] V.R. Troll, U.-H. Schmincke, REE mineral perrierite/chevkinite incomenditic magmas from Gran Canaria, Spain: a SYXRF-probe study,J. Petrol. 43 (2002) 243–270.
[22] B. Bühn, A.H. Rankin, M. Radtke, M. Haller, A. Knöchel, Burbankite, a(Sr, REE, Na, Ca)-carbonate in fluid inclusions from carbonatite-derivedfluids: identification and characterization using Laser Raman spectroscopy,SEM-EDX, and synchrotron micro-XRF analysis, Am. Mineral. 84 (1999)1117.
[23] K. Rickers, R. Thomas, W. Heinrich, Trace-element analysis of individualsynthetic and natural fluid inclusions with synchrotron radiation XRFusing fundamental parameter quantification, Eur. J. Mineral. 16 (2004)23–35.
[24] S. Hlawatsch, C.D. Garbe-Schönberg, F. Lechtenberg, A. Manceau, N.Tamura, D.A. Kulik, M. Kersten, Trace metal fluxes to ferromanganesenodules from the western Baltic Sea as a record for long-term environmentalchanges, Chem. Geol. 182 (2002) 697–709.
[25] J. Osán, S. Török, B. Alföldy, G. Falkenberg, Characterization ofanthropogenic sediment particles after a transboundary water pollutionof River Tisza using synchrotron radiation, Spectrochim. Acta Part B 59(2004) 701–708.
[26] J. Koepke, H. Behrens, Trace element diffusion in andesitic melts: anapplication of synchrotron X-ray fluorescence analysis, Geochim.Cosmochim. Acta 65 (2001) 1481–1498.
[27] J. Koepke, G. Falkenberg, K. Rickers, O. Diedrich, Trace elementdiffusion and element partitioning between garnet and andesite melt usingsynchrotron X-ray fluorescence microanalysis (m-SRXRF), Eur. J.Mineral. 15 (2003) 883–892.
[28] C. Schmidt, K. Rickers, In-situ determination of mineral solubilities influids using a hydrothermal diamond-anvil cell and SR-XRF: solubility ofAgCl in water, Am. Mineral. 88 (2003) 288–292.
[29] G. Keller, W. Stinnesbeck, T. Adatte, D. Stüben, Multiple impacts acrossthe Cretaceous–Tertiary boundary, Earth-Sci. Rev. 62 (2003) 327–363.
[30] M. Harting, Zum Kreide/Tertiär-Übergang in NE-Mexiko: GeochemischeCharakterisierung der Chicxulub-Impaktejekta. PhD Thesis UniversitätKarlsruhe, Fak. f. Bauingenieur-, Geo- und Umweltwissenschaften, 2004.
[31] D. Stüben, U. Kramar, M. Harting, W. Stinnesbeck, G. Keller, T. Adatte,High resolution geochemical record in Mexico during the Cretaceous–Tertiary transition, Geochim. Cosmochim. Acta 69 (2005) 2559–2579.
[32] G. Bourdon, Méthodé de dégagemet du microfossiles par acetolyse achaude, Compte Rendu de la Societé Géologique de France, Paris, 1962,pp. 267–268.
835U. Kramar et al. / Spectrochimica Acta Part B 62 (2007) 824–835
[33] T. Nötzold, Die Präparation von Gyrogoniten und kalkigen Charophyten-Oogonien aus festen Kalkgesteinen, Monatsber. Deutsch. Akad. Wiss.Berlin 7 (1965) 216–221 (Berlin).
[34] D.R. Bessette, Analyse und Quantifizierung geologischer Proben mitder Synchrotron-Röntgenfluoreszenz, Diss. Universität Hamburg,1999.
[35] R.S. Sutton, P.M. Bertsch, M. Newville, M. Rivers, A. Lanzirotti, P. Eng,Microfluorescence and microtomography analyses of heterogeneous earthand environmental material, in: P.A. Fenter, M.L. Rivers, N.C. Sturchio,S.R. Sutton (Eds.), Applications of Synchrotron Radiation in LowTemperature Geochemistry and Environmental Science, RiMG, vol. 49,2002, pp. 429–483.
[36] F. Lechtenberg, S. Garbe, J. Bauch, D.B. Dingwell, F. Freitag, M. Haller,H.U. Hansteen, P. Ippach, A. Knöchel, M. Radtke, C. Romano, P.M.Sachs, H.U. Schmincke, H.J. Ullrich, The X-ray fluorescence measure-ment place at beamline L of HASYLAB, J. Trace Microprobe Tech. 14(1996) 561–587.
[37] R. Jenkins, R.W. Gould, D. Gedcke, Quantitative X-ray Spectrometry,Marcel Dekker, New York, 1981.
[38] J. Leroux, T.P. Thinh, Revised Tables of X-ray Mass AttenuationCoefficients, CSC, Canada G1S 48N, 1977.
[39] C.T Chantler, K. Olsen, R.A. Dragoset, J. Chang, A.R. Kishore, S.A.Kotochigova, D.S. Zucker, X-Ray Form Factor, Attenuation and ScatteringTables (version 2.1). [Online] Available: http://physics.nist.gov/ffast[2007, January 12]. National Institute of Standards and Technology,Gaithersburg, MD. Originally published as Chantler, C.T., J. Phys. Chem.Ref. Data 29(4), 597–1048 (2000); and Chantler, C.T., J. Phys. Chem. Ref.Data 24, 71–643 (1995).
[40] R. Jenkins, J.L. de Vries, Practical X-ray Spectrometry, Macmillian CoLtd., London-Basingstoke, 1970.
[41] K.L. Williams, Introduction to X-ray Spectrometry, Allen and Unwin,1987.
[42] H. Hubbell, S.M. Seltzer, Tables of X-ray Mass Attenuation Coefficientsand Mass Energy-Absorption Coefficients, NISTIR, vol. 5632, 1996.
[43] D. Stüben,U.Kramar, Z. Berner, J.D. Eckhardt,W. Stinnesbeck,G. Keller, T.Adatte, K. Heide, Two anomalies of platinum group elements above theCretaceous–Tertiary boundary at Beloc, Haiti: geochemical context andconsequences for the impact scenario, GSA Spec. Pap. 365 (2002) 163–188.
[44] H. Sigurdsson, R.M. Leckie, G.D. Acton, Shipboard scientific party:Caribbean volcanism, Cretaceous/Tertiary impact, and ocean climatehistory: synthesis of Leg 165, Proc. Oc. Drill. Prog. Initial Reports:, 1997,pp. 377–400.
[45] H. Sigurdsson, Ph. Bonte, L. Turpin, M. Chaussidon, N. Metrich, M.Steinberg, Ph. Pradel, S. D'Hondt, Geochemical constraints on sourceregion of Cretaceous/Tertiary impact glasses, Nature 353 (1991) 839–842.
[46] B. Rasmussen, Zircon growth in very low grade metasedimentary rocks:evidence for zirconium mobility at ~ 250 °C, Contrib. Mineral. Petrol. 150(2005) 146–155.
[47] C.G. Schroer, M. Kuhlmann, U.T. Hunger, T.F. Günzler, O. Kurapova, S.Feste, B. Lengeler, M. Drakopoulos, A. Somogyi, A.S. Simionovici, A.Snigirev, I. Snigireva, Nanofocusing parabolic refractive X-ray lenses, inSynchrotron Radiation Instrumentation, T. Warwick.
[48] P. Agrinier, A. Deutsch, U. Schärer, I. Martinez, Fast back-reactions ofshock-released CO2 from carbonates: an experimental approach, Geochim.Cosmochim. Acta 65 (2001) 2615–2632.
[49] A.P. Jones, P. Claeys, S. Heuschkel, Impact melting of carbonates from theChicxulub, Lect. Notes Earth Sci. 91 (2000) 343–361.
[50] C. Koeberl, K.G. MacLeod (Eds.), Catastrophic Events and MassExtinctions: Impacts and beyond, Geol. Soc. Am. Spec. Pap., vol. 356,2002, pp. 1–746.
[51] B. Ivanov, A. Deutsch, The phase diagram of CaCO3 in relation to shockcompression and decomposition, Phys. Earth Planet. Inter. 129 (2002)131–143.
[52] B. Kettrup, A. Deutsch, M. Ostermann, P. Agrinier, Chicxulub impactites:geochemical clues to the precursor rocks, Meteor. Planet. Sci. 35 (2000)1229–1238.
[53] W.A. Deer, R.A. Howie, J. Zusman, An Introduction to the Rock FormingMinerals, 2nd ed., Longman, London, 1992.