Symposium-in-Print: UV Effects on Aquatic and Coastal Ecosystems-Mediated Modeling of the Impacts of...
13
Photochemistry and Photobiology, 2006, 82: 865–877 Symposium-in-Print: UV Effects on Aquatic and Coastal Ecosystems Mediated Modeling of the Impacts of Enhanced UV-B Radiation on Ecosystem Services Marjan van den Belt* 1 , Oscar A. Bianciotto 2 , Robert Costanza 3 , Serge Demers 4 , Susana Diaz 5 , Gustavo A. Ferreyra 4,6 , Evamaria W. Koch 7 , Fernando R. Momo 8 and Maria Vernet 9 1 Mediated Modeling Partners LLC, Charlotte, VT 2 Centro Austral de Investigaciones Cientı ´ficas (CADIC), Ushuaia, Argentina 3 Gund Institute for Ecological Economics, University of Vermont, Burlington, VT 4 Institut des sciences de la mer de Rimouski, Rimouski, Que ´ bec, Canada 5 Consejo Nacional de Investigaciones Cientı ´ficas y Te ´ chnicas, Ushuaia, Tierra del Fuego, Argentina 6 Instituto Anta ´ rtico Argentino, Buenos Aires, Argentina 7 Horn Point Laboratory, University of Maryland Center for Environmental Science, Cambridge, MD 8 Universidad Nacional de General Sarmiento, Instituto de Ciencias, Los Polvorines, Argentina 9 Integrative Oceanographic Division, Scripps Institution of Oceanography, University of California–San Diego, La Jolla, CA Received 19 October 2005; accepted 20 March 2006; published online 17 April 2006 DOI: 10.1562/2005-10-19-IR-722 ABSTRACT This article describes the use of group model building to facilitate interaction with stakeholders, synthesize research results and assist in the development of hypotheses about climate change at the global level in relation to UV-B radiation and ecosystem service valuation. The objective was to provide a platform for integration of the various research components within a multidisciplinary research project as a basis for in- teraction with stakeholders with backgrounds in areas other than science. An integrated summary of the scientific findings, along with stakeholder input, was intended to produce a bridge between science and policymaking. We used a mediated mod- eling approach that was implemented as a pilot project in Ushuaia, Argentina. The investigation was divided into two participatory workshops: data gathering and model eval- uation. Scientists and the local stakeholders supported the valuation of ecosystem services as a useful common denom- inator for integrating the various scientific results. The concept of economic impacts in aquatic and marsh systems was represented by values for ecosystem services altered by UV-B radiation. In addition, direct local socioeconomic impacts of enhanced UV-B radiation were modeled, using data from Ushuaia. We worked with 5 global latitudinal regions, focusing on net primary production and biomass for the marine system and on 3 plant species for the marsh system. Ecosystem service values were calculated for both sectors. The synthesis model reflects the conclusions from the literature and from experimental research at the global level. UV-B is not a significant stress for the marshes, relative to the potential impact of increases in the sea level. Enhanced UV-B favors microbial dynamics in marine systems that could cause a significant shift from primary producers to bacteria at the community level. In addition, synergetic effects of UV-B and certain pollutants potentiate the shift to heterotrophs. This may impact the oceanic carbon cycle by increasing the ratio of res- piratory to photosynthetic organisms in surface waters and, thus, the role of the ocean as a carbon sink for atmospheric CO 2 . In summary, although changes in the marine sector due to anthropogenic influences may affect global climate change, marshes are expected to primarily be affected by climate change. INTRODUCTION Mathematical modeling has historically been the province of experts (1). This is fine for addressing technical problems within a discipline. But when applied to policy questions, which inherently span several disciplines and involve stakeholders with nontechnical backgrounds, the modeling approach is severely limited. From a policymaking perspective, the models usually become quite com- plex and it is difficult to lucidly communicate results (much less the underlying logic of the models) to decision makers (2). Models derive their credibility from two distinct sources: the technical ability of the model to reproduce measured observations, and the degree of stakeholder buy-in of the assumptions and the model construction process. In scientific disciplines the model construc- tion process is often taken for granted. But in policy-relevant modeling it is often the most crucial source and requires special attention. Achievement of the necessary level of buy-in among the diverse stakeholders affected by a policy problem requires that the stakeholders participate in the modeling process, from defining the conceptual problem to analyzing scenarios. We focus on the participatory approach to research and model building and evaluate a collaboration between scientists and local stakeholders in which the impacts of enhanced UV-B radiation (290–320 nm) on eco- system services are examined. The emission of anthropogenic chlorofluorocarbons is causing the depletion of stratospheric ozone and resulting in an increased *To whom correspondence should be addressed: [email protected] (Marjan van den Belt) Ó 2006 American Society for Photobiology 0031-8655/06 865
-
Upload
independent -
Category
Documents
-
view
4 -
download
0
Transcript of Symposium-in-Print: UV Effects on Aquatic and Coastal Ecosystems-Mediated Modeling of the Impacts of...

Photochemistry and Photobiology, 2006, 82: 865–877
Symposium-in-Print: UV Effects on Aquatic and Coastal Ecosystems
Mediated Modeling of the Impacts of Enhanced UV-BRadiation on Ecosystem Services
Marjan van den Belt*1, Oscar A. Bianciotto2, Robert Costanza3, Serge Demers4, Susana Diaz5,Gustavo A. Ferreyra4,6, Evamaria W. Koch7, Fernando R. Momo8 and Maria Vernet9
1Mediated Modeling Partners LLC, Charlotte, VT2Centro Austral de Investigaciones Cientıficas (CADIC), Ushuaia, Argentina3Gund Institute for Ecological Economics, University of Vermont, Burlington, VT4Institut des sciences de la mer de Rimouski, Rimouski, Quebec, Canada5Consejo Nacional de Investigaciones Cientıficas y Technicas, Ushuaia, Tierra del Fuego, Argentina6Instituto Antartico Argentino, Buenos Aires, Argentina7Horn Point Laboratory, University of Maryland Center for Environmental Science, Cambridge, MD8Universidad Nacional de General Sarmiento, Instituto de Ciencias, Los Polvorines, Argentina9Integrative Oceanographic Division, Scripps Institution of Oceanography,University of California–San Diego, La Jolla, CA
Received 19 October 2005; accepted 20 March 2006; published online 17 April 2006 DOI: 10.1562/2005-10-19-IR-722
ABSTRACT
This article describes the use of group model building tofacilitate interaction with stakeholders, synthesize researchresults and assist in the development of hypotheses aboutclimate change at the global level in relation to UV-B radiationand ecosystem service valuation. The objective was to providea platform for integration of the various research componentswithin a multidisciplinary research project as a basis for in-teraction with stakeholders with backgrounds in areas otherthan science. An integrated summary of the scientific findings,along with stakeholder input, was intended to produce a bridgebetween science and policymaking. We used a mediated mod-eling approach that was implemented as a pilot project inUshuaia, Argentina. The investigation was divided into twoparticipatory workshops: data gathering and model eval-uation. Scientists and the local stakeholders supported thevaluation of ecosystem services as a useful common denom-inator for integrating the various scientific results. Theconcept of economic impacts in aquatic and marsh systemswas represented by values for ecosystem services altered byUV-B radiation. In addition, direct local socioeconomicimpacts of enhanced UV-B radiation were modeled, usingdata from Ushuaia. We worked with 5 global latitudinalregions, focusing on net primary production and biomass forthe marine system and on 3 plant species for the marsh system.Ecosystem service values were calculated for both sectors. Thesynthesis model reflects the conclusions from the literatureand from experimental research at the global level. UV-B isnot a significant stress for the marshes, relative to the potentialimpact of increases in the sea level. Enhanced UV-B favorsmicrobial dynamics in marine systems that could cause a
significant shift from primary producers to bacteria at thecommunity level. In addition, synergetic effects of UV-B andcertain pollutants potentiate the shift to heterotrophs. This mayimpact the oceanic carbon cycle by increasing the ratio of res-piratory to photosynthetic organisms in surface waters and,thus, the role of the ocean as a carbon sink for atmospheric CO2.In summary, although changes in the marine sector due toanthropogenic influences may affect global climate change,marshes are expected to primarily be affected by climate change.
INTRODUCTION
Mathematical modeling has historically been the province of
experts (1). This is fine for addressing technical problems within a
discipline. But when applied to policy questions, which inherently
span several disciplines and involve stakeholders with nontechnical
backgrounds, the modeling approach is severely limited. From a
policymaking perspective, the models usually become quite com-
plex and it is difficult to lucidly communicate results (much less
the underlying logic of the models) to decision makers (2). Models
derive their credibility from two distinct sources: the technical
ability of the model to reproduce measured observations, and the
degree of stakeholder buy-in of the assumptions and the model
construction process. In scientific disciplines the model construc-
tion process is often taken for granted. But in policy-relevant
modeling it is often the most crucial source and requires special
attention. Achievement of the necessary level of buy-in among the
diverse stakeholders affected by a policy problem requires that the
stakeholders participate in the modeling process, from defining
the conceptual problem to analyzing scenarios. We focus on the
participatory approach to research and model building and evaluate
a collaboration between scientists and local stakeholders in which
the impacts of enhanced UV-B radiation (290–320 nm) on eco-
system services are examined.
The emission of anthropogenic chlorofluorocarbons is causing
the depletion of stratospheric ozone and resulting in an increased
*To whom correspondence should be addressed: [email protected](Marjan van den Belt)
� 2006 American Society for Photobiology 0031-8655/06
865

transmission of UV-B through the atmosphere. The effects are
greatest at polar latitudes but they are also observed in the middle
latitudes. The problem will worsen before it improves in approxi-
mately 2050. Compared with visible light, UV-B is more energetic
and stimulates diverse photochemical reactions (3). Because of
ozone depletion in recent years, increased UV-B is an added stress
to natural ecosystems. The effects of UV-B on organisms are
mostly deleterious, because of damage to DNA and cellular pro-
teins that are involved in biochemical processes, and they affect
growth and reproduction. Understanding the effect of UV-B on
ecosystems involves knowledge of more than the effect of radiation
on individual species or at trophic levels, given that alteration of
system interactions can exacerbate, diminish or sometimes reverse
known physiological damage. What is known originates from
small-scale experiments (4). The role of these effects in large-scale
settings and whether they affect the services ecosystems provide to
humans are not known. We describe a modeling project in which
scientists and stakeholders worked together to produce a model that
addresses these questions. We discuss both the mediated model-
building process and the model that resulted from that process,
because of the importance of both factors. We spend significantly
more time on the process, however, because it is more unique.
One reason for using mediated modeling to address the socio-
economic impacts of UV-B radiation is that this type of modeling
is geared toward understanding the systems level relationships in-
volved in complex issues. The strength of this modeling approach
does not lie in precise prediction of future outcomes. Rather, it
provides a framework to understand the most important parts of the
problem by linking the known factors to our best available knowl-
edge and defining the unknown factors in a comprehensive way.
METHODS
Mediated modeling is a process of facilitated model building in whichstakeholders are involved in all aspects and steps (5–8). The stakeholdersdecide what goes into the model. They collaboratively construct the modeland therefore understand the value (and limitations) of the findings of modelsimulations. This process often helps structure the discussion and analysis ofa complex problem.
The goal of this component of the project was to construct a simulationmodel of the socioeconomic impacts of UV-B radiation. Mediatedmodeling was used as the method to construct a simulation model. Thestakeholders included scientists who were affiliated with the Inter-AmericanInstitute for Global Change (IAI) and had backgrounds in UV radiation,aquatic ecosystems (marine and marsh) and ecosystem modeling and localstakeholders who worked for the government or had backgrounds ineducation, the tourism industry or medicine. During the first mediatedmodeling workshop (duration, 4 days) a qualitative scoping model wasdeveloped and a list of data requirements to be gathered during the next fouryears was created. Three years later a second workshop was performed tofinish and evaluate the final model.
The socioeconomic impacts of UV-B radiation are difficult to pinpointbecause of the lack of established causal relationships. The nature of this typeof study prohibits an experimental design and control groups are hard tolocate. Historical observations and time-series data provide some insight buthave to be related to other trends.
We chose to apply the mediated modeling approach. The three stagessuggested by van den Belt (1) involve preparation, workshop participationand follow-up observation (Table 1).
Much of the focus of this research program was on latitudinal differencesand experiments were performed at several different locations in theAmericas. The selection of Ushuaia, Argentina, as the location fora collaboration with local stakeholders was based on two factors. First, itis in an area with large UV-B fluctuations and, because of the associatedsocial concerns and potential economic impacts, the UV-B problem is mostsevere. Second, a local research facility was willing to host the workshopsand play an instrumental role in stakeholder selection and management. The
group of participants was selected locally with conceptual guidance fromthe mediated modeler.
Because of the distance between the mediated modeler and the localparticipants, the introductory interviews were sent via email in the form ofa brief survey. The principle investigators (PIs) prepared and submitted thesurveys.
A preliminary model was developed on the basis of reports from theliterature and input from PIs and was brought to the first workshop. The finalmodel includes additional data from the literature, results from experimentsperformed within the IAI project and new ideas developed in the workshops.Concepts in the model were based on classical concepts in marsh and marineecology. New information acquired during our project on the effect of UV-B
was added as applicable (9–12). To quantify the ecological processes in themodel, an extensive literature search was done in order to obtain a range ofvalues that were applicable over a wide range of latitudes (4,13–16). All dataon the effect of UV-B on salt marshes in the model originated from the IAI
project, as this was the first time this topic was studied.In order to analyze the changes in UV-B radiation between 1970 and
2050, the planet was divided into five regions (Table 4). Worldwide totalcolumn ozone data obtained from satellites have only been available sincethe end of 1978. To calculate the total column ozone during 1970–1978,
satellite values from 1979 and trends from ground measurements were usedfor regions II to IV (17) and data for the polar regions (regions I and V) wereinferred from maps built during 1964–1980 on the basis of ground mea-surements (18). During 1979–2000 the ozone values were calculated from
satellite measurements (19). The regional values were obtained by averagingdata available for each 58 of latitude.
Seasonal trends were obtained making four groups of 3 months: (1)Summer southern hemisphere (winter northern hemisphere): Decemberthrough February; (2) autumn southern hemisphere (spring northern
hemisphere): March through May; (3) winter southern hemisphere (summernorthern hemisphere): June through August; and (4) spring southernhemisphere (autumn northern hemisphere): September through November.
Once the mean total column ozone was determined for the 5 regions andthe four seasons, UV irradiances under clear sky conditions for 2000 and1970 were calculated to obtain the geographic and seasonal mean points,using a Disort 8 Streams Radiative Transfer Code (20). Irradiances werecalculated on 15 January, 15 April, 15 July and 15 October at the followinglatitudes: 72.58S, 37.58S, 108S, 37.58N and 72.58N. In the equatorial region(lat 208S to lat 208N) the point at 108 was used as the mean point since thegeographic means (08) would give a regional maximum value rather thanmean values. Irradiances were calculated in 1 h intervals. Daily integratedirradiances were obtained by integrating hourly values.
To simplify the input into the model we calculated the integratedirradiances for 1970 and 2000 as explained above. The other years werecalculated using the radiation amplification factor (RAFs). The RAFs aresensitivity coefficients that relate the decreases in total column ozone in theatmosphere to increases in some measures of irradiance (21):
RAF ¼ lnðO3=O*3 Þ
lnðE*=EÞðEq: 1Þ
where O3 and O*3 are total column ozone 1 and 2 and E and E* are
irradiances corresponding to total column ozone 1 and 2. Then
Table 1. Generic MM approach and subactivities.
Stage Subactivities
1. Preparation 1.1 Identify stakeholders1.2 Set Participant group1.3 Conduct introductory interviews1.4 Prepare a preliminary model
2. Workshops 2.1 Introduction2.2 Problem definition2.3 Qualitative model building2.4 Quantitative model building2.5 Simulation
3. Follow-up 3.1 Tutorial3.2 Evaluation
866 Marjan van den Belt et al.

E* ¼ O3
O*3
!RAF
*E ðEq: 2Þ
The RAF varies with the solar zenith angle (SZA) and, in our case,wavelength. Paired values of ozone variation and daily integrated irradiancewere used to calculate the RAFs, corresponding to the SZA of the 5 regionsand 4 seasons, for each wavelength between 290 and 400 nm.
The irradiance for 1970 and the ozone for each year (5 regions and 4seasons) were used to calculate the daily integrated irradiance in the modelby means of (Eq. 2).
Past and future daily integrated irradiances. It is estimated that theozone level will remain near the values 2000 up to approximately 2011(22). For the model, we kept total column ozone and irradiance values from2000 through 2010 the same as those from 2000 (recovery will begin after2011). Models used to calculate future values show some disagreement inthe annual percentage of recovery. In general it can be assumed that therecovery will be linear and that ozone values similar to those in 1979 willoccur by 2050. The annual change per year (in DU) for each of the 5regions and 4 seasons was calculated as:
OzRSY ¼ OzRS2000 þ ½ðY � 2000Þ*ChRS� ðEq: 3Þ
where OzRSY is the total column ozone in year Y for region R and season S(Y ranges from 2010–2050), OzRS2000 is the total column ozone in 2000 forregion R and season S and ChRS is the annual change for region R andseason S. Irradiance is calculated with RAF for the period of 1970 through2000 (see above).
RESULTS AND DISCUSSION
Results are presented in two sections: (1) the workshops and model
construction process and (2) model behavior and scenarios. The
first section is the more unique aspect of the project. Data available
for calibrating and testing the model were extremely scarce: no
independent data exist to test the assumptions and data that went
into the model. We conclude that the model has strong credibility
because of stakeholder buy-in but further technical calibration is
needed.
Workshops and the model construction process
First workshop. The first workshop was held in November 2000 in
Ushuaia and lasted for 4 full days (Table 2). The workshop was
hosted by Centro Austral de Investigaciones Cientificas (CADIC),
which is a research center of the National Research Council of
Argentina. A representative from CADIC was instrumental in and
responsible for identifying and inviting the local stakeholders.
Approximately 10 local stakeholders attended the first meeting.
Representatives from the tourism industry, an ophthalmologist,
a dermatologist, educators, persons from the local government,
employees from the fisheries industry, meteorologists and several
CADIC technicians attended. PIs involved in UV radiation and UV
effects on marshes and marine systems traveled from Canada, the
United States and Argentina to attend this workshop. The group
provided strong input to achieve the objectives of the project. The
local stakeholders presented input from a broad social perspective.
However, representation by educators and employees of the
fisheries industry was not as strong as initially intended.
On day 1 the goal of the workshop was restated, a 10 min
exercise to learn participants’ names was done and the 4 building
blocks of the software (STELLA) were introduced. The first day
continued with the formulation of questions the model should
answer (Table 3).
The preliminary model was presented to give the participants an
idea of how a model might start to evolve. It is common for a group
to reject a preliminary model; however, this group decided that the
preliminary model provided a reasonable starting point. Although
this decision saved time it was harder for the group to ‘‘gain
ownership’’ of the model. This manifested itself in the way
participants concentrated on their respective specialties rather than
on focusing on the system as a whole.
The qualitative model structure that developed over the course
of almost 3 days was the basis for a conceptual discussion on days
2 and 3. The time scale was set from 1970 to 2050. The first year
(1970) is considered to be in the era before ozone depletion began
(on the basis of factors such as ozone layer thickness and UV-B
levels). The end point, 2050, is estimated to be the point at which
ozone levels return to natural levels; if there is no addition of
ozone-destructive compounds, the ozone layer is expected to return
to the values before ozone depletion by 2050. The effect of the
Montreal protocol (i.e. partial recovery) is expected much earlier.
The time step was originally set at seasons. In later stages of model
development it was observed that the model time step needed to be
changed to a monthly time step in order for seasonal effects to be
graphically visible. The spatial scale issues are described in Table
4. Five main regions were identified. Within the regions, the space
was treated as homogeneous.
The group decided to move the scope of the model beyond the
data being gathered at the time by monitoring findings from
the literature (23,24), field data and experimental approaches (10).
The group pushed the model into unknown scenarios and generated
future research questions within a broad context (Tables 5–7).
During day 4 of the workshop available data and information
were entered into the model. In addition, the requirements for data
gathering during the next 2 years were developed. An example of
the data needed from the socioeconomic model sector is presented
in Table 8. The list of data requirements for the model was quite
extensive. Much of the data were initially thought to be readily
available. The workshop closed with a re-evaluation of the
Table 2. Schedule for the first workshop.
Workshop day Workshop activity
Day 1 Introduction, software, problem definitionand model sectors
Days 2 and 3 Qualitative model, feedback loops and time lagsDay 4 Insert quantitative data readily available, define
data to be gathered and evaluate problemdefinition
Table 3. Questions the model should address, as developed during theworkshop in November 2000 in Ushuaia, Argentina.
1. What are the direct and indirect socioeconomic impacts of UV-Bradiation?
2. Can we define a synergy or feedback mechanism between differentsectors represented in the model; ecosystems (marshes/marinesystems), education, tourism?
3. Does the response of UV-B on human health and ecosystem healthchange with temporal and spatial scale?
4. How does the time lag between CFC release and recovering ofthe ozone layer and ecosystem responses and human healtheffects manifest itself?
5. What is the influence of existing policies on local and globallevel? Are there solutions?
6. Does global warming need to be in the model and if so, can globalwarming be represented by temperature only?
Photochemistry and Photobiology, 2006, 82 867

definition of the original problem and ‘‘the questions the model
should answer.’’
Several questions were developed at the start of the workshop
(Table 3) and evaluated at the end of the workshop. The first
question was as follows: What are the direct and indirectsocioeconomic impacts of UV-B radiation? The first workshop
occurred right after the ‘‘hole in the ozone layer’’ (in the Antarctic
region) had moved over Tierra del Fuego (mid-November 2000).
This event was given a lot of attention in the media and the
uncertainty surrounding this issue caused a general sense of fear.
There were some indications that tourists were canceling planned
travel to Ushuaia out of fear about UV-B radiation. The tourist
sector was very concerned about the local economic impact and
affect on employment levels.
The dermatologist and ophthalmologist in the group provided
support for possible damage by UV-B to health, namely damage to
eyes and skin and (arguably) suppression of the immune system. A
distinction was made between short-term impacts due to peaks in
UV-B radiation and long-term trends due to a gradual increase in
UV-B radiation. Because of the recent peak events, the emphasis of
the first workshop was on how to accommodate for the peak UV-B
events in the model.
A local fisherman suspected a negative impact of UV-B on fish
populations. In addition, fishermen are a subgroup of the local
population that spends a lot of time outdoors and is subject to and
often aware of UV-B radiation. The cost of sunscreen to protect the
skin from UV-B radiation was considered to be high.
The second question was as follows: Can we define a synergy orfeedback mechanism between different sectors represented in themodel, such as ecosystems (marshes/marine systems), educationand tourism? Ecosystem services were discussed in relation to the
marine and marsh systems. In the marine sector the synergy
between contamination and UV-B was on the research agenda. For
the marsh sector the need for research about the connection
between UV-B and increases in the sea level and adjacent plant
communities was discussed. Global climate change issues seemed
to be the common denominator for marsh and marine issues,
although from a different perspective. Although UV-B may have
a direct negative impact on marine primary production (25–28),
marshes are more affected by climate change in terms of increases
in the sea level (29) or El Nino effects (9).
Apart from the initial direct fear expressed during the first
meeting that increased UV-B levels would deter tourism, the group
did not identify synergetic or negative socioeconomic impacts of
UV-B on the marine or marsh sectors. The direct impacts of
increased UV-B levels on the local economy through tourism and
health remained the focus of the socioeconomic interests.
The third question was as follows: Does the response of UV-Bon human health and ecosystem health change with temporal and
spatial scale? Is it possible to study global long-term trends by
extrapolating from local characteristics and short-term events, such
as UV-B peaks? Rather than choosing between short-term and
local effects or long-term global effects, the group tried to
accommodate both approaches and reflect on how they are
interrelated, using time lags as connectors. For example, there
are concerns that the thinning of the ozone layer in the Antarctic
will have an impact in the Arctic after a time lag.
The radiation experts agreed that a general global change of 4%
over 10 years in ozone depletion was observed. This number is
different for high latitudes and low latitudes and there are strong
seasonal influences. The UV-B peaks occur on a scale of hours or
even minutes. It was decided to model UV-B radiation during
springtime in the southern hemisphere with a time step of 1 month
to simulate UV-B peaks probabilistically for each of the months.
The compromise was to include peaks and still have a long-term
focus. The model was to run for 80 years (1970–2050) in order to
simulate the possible recovery of the ozone layer expected because
of the Montreal Protocol (17).
The fourth question was as follows: How does the time lagbetween chlorofluorocarbon (CFC) release and recovery of the
ozone layer, ecosystem responses and human health effects
manifest themselves? Do the predicted ozone recovery scenarios,
as envisioned by the Montreal Protocol, seem to materialize? It was
determined that the model would be based on two basic simulation
scenarios, one with and one without successful CFC reduction
expected because of the Montreal Protocol. Initially, responses
Table 4. Global coverage in 5 latitudinal regions.
Region Latitude
I. Antarctic 90–558 SouthII. Southern temperate 55–208 South
III. Tropical 20–208 NorthIV. Northern temperate 20–558 NorthV. Arctic 55–908 North
Table 5. Questions for future marsh research.
1. Does the impact of sea level rise override the impact of UV-Bon marshes?
2. Does UV-B have an indirect effect on Juncus and Spartina via thedecline of Salicornia and its capacity to regulate disturbances?
3. Is the production of seeds of Salicornia negatively affected by UV-B?4. Is the shift from Salicornia to Puccinelia in Tierra del Fuego due to
a UV-B impact or due to a change in sea level?5. Is the wind a limiting factor to Salicornia growth in Tierra del Fuego?
Table 6. Questions for future marine research.
1. How do ecosystems in the Americas respond to natural and enhancedlevels of UV-B due to ozone depletion?
2. Are systems sensitive to and/or is a recovery a function ofUVR gradients?
3. Are low-latitude systems more affected than high-latitude onesbecause of their exposure to higher natural levels of UV-B?Alternatively, do high-latitude systems have a higher capacity ofrecovery (resilience) than low latitude ones because of theiradaptation to extreme environmental stress?
4. May the grazing rate depression (produced by UV-B) compensatethe primary production depression caused by UV-B?
5. Is there a significant effect of UV-B on the nutrient recycling inmarine system?
6. Have photochemical reactions of UV-B with pollutants synergeticeffects on primary and secondary producers?
7. Have food production variations caused by UV-B had a significanteffect on the socio-economic system?
Table 7. Comments and a question for future research on UV-B.
1. UV-B is the starting point and is not generated by dynamic behaviorat this point.
2. Adjustment of ozone level will be treated exogenously in the model.3. How do we introduce cloud cover in a statistical way?
868 Marjan van den Belt et al.
were thought to be linear; however, the further this group got into
the discussion about different latitudes and climate change issues,
the clearer it became that the role of ozone and UV radiation in
climate change is not well understood. There may be several
nonlinear aspects at play.
The fifth question was as follows: What is the influence ofexisting policies at the local and global level? Are there solutions?
The group determined that intergovernmental agencies (such as
those responsible for the Montreal Protocol and similar conven-
tions) are responsible for placing limits on ozone-depleting
substances and expressed a need for research in support of this
topic. At a local level, the group discussed efforts, in the form
of monitoring and education, that are geared toward prevention.
It was noted that policy action mainly focuses on mitigation of
impacts rather than on prevention. The mitigation of impacts,
especially those on human health, were considered to be a more
important need at the beginning of the program. By 2003, certain
local prevention initiatives were in place. One medical professional
commented on the low number of acute sun-related problems in
her practice and concluded that either people were protecting
themselves (prevention) or have become indifferent to sun-related
problems (no action).
The sixth question was as follows: Does global warming need tobe in the model and, if so, can global warming be represented by
temperature only? Currently, the level of UV-B in the northern and
southern hemispheres is different but it is expected that, when
global warming and other effects are more widespread, the
problems in the two hemispheres may become similar, after a
time lag.
By the fourth day of the first workshop, each of the PIs had a list
of questions. Some research questions were already planned and
the group could expect some answers by the end of the program.
Other questions required literature research. Finally, some ques-
tions were generated by the model structure and were included as
a basis for new hypotheses (e.g. in an ideal funding situation, what
would you want to research?) On the other hand, the local
stakeholders generated a very practical list of data to gather (Table
8). In general, local stakeholders were interested in gathering
socioeconomic data.
Between meetings. In April 2003 the PIs met in Chascom�us,
Argentina. The status of the model was evaluated in view of the
additional data gathered at the time and the results from ongoing
experiments. The PIs decided to emphasize the use the model
as a tool to synthesize the research and to expand the findings
obtained from experiments to a global scale. As a mid-course
change of direction, this approach enhanced the scientific
component of the study. The gathering of data to complete and
enhance the socioeconomic sector of the model had not been as
successful as anticipated during the first workshop. The relation-
ship between the local stakeholders and the modeler remained
indirect, with a local PI serving as intermediary.
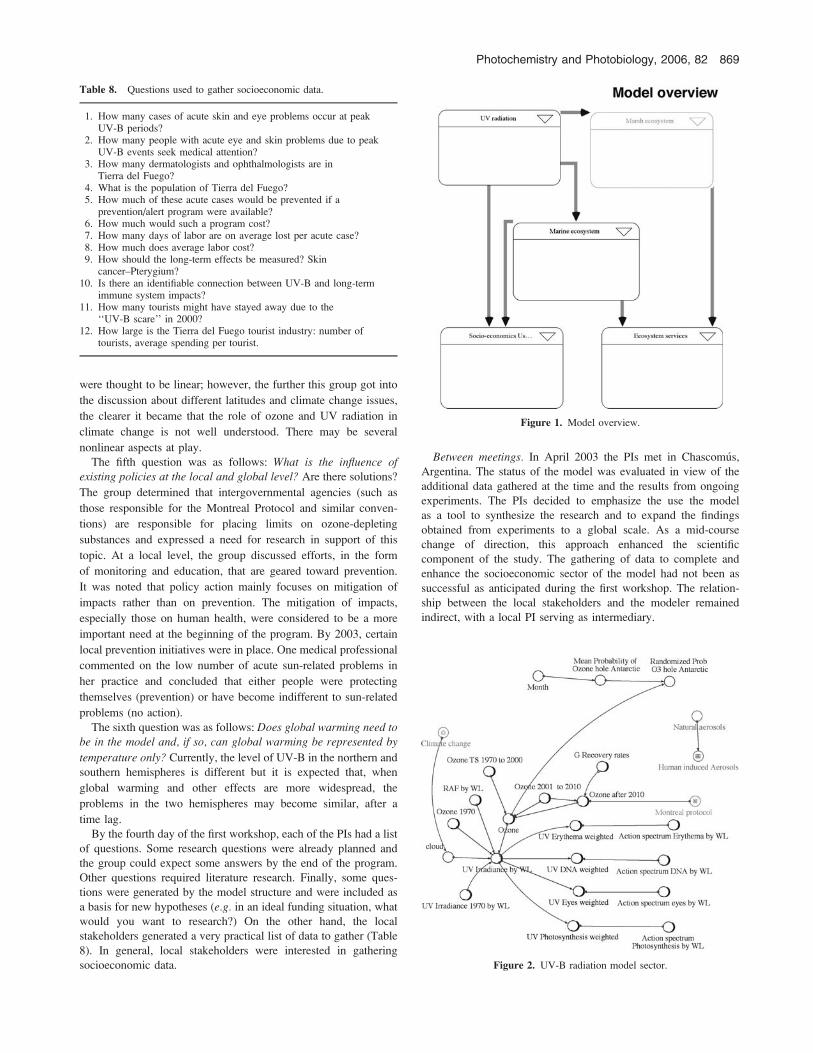
Table 8. Questions used to gather socioeconomic data.
1. How many cases of acute skin and eye problems occur at peakUV-B periods?
2. How many people with acute eye and skin problems due to peakUV-B events seek medical attention?
3. How many dermatologists and ophthalmologists are inTierra del Fuego?
4. What is the population of Tierra del Fuego?5. How much of these acute cases would be prevented if a
prevention/alert program were available?6. How much would such a program cost?7. How many days of labor are on average lost per acute case?8. How much does average labor cost?9. How should the long-term effects be measured? Skin
cancer–Pterygium?10. Is there an identifiable connection between UV-B and long-term
immune system impacts?11. How many tourists might have stayed away due to the
‘‘UV-B scare’’ in 2000?12. How large is the Tierra del Fuego tourist industry: number of
tourists, average spending per tourist.
Figure 2. UV-B radiation model sector.
Figure 1. Model overview.
Photochemistry and Photobiology, 2006, 82 869

Subsequent visits of the modeler to the University of Quebec
and to Horn Point Lab (HPL) at the University of Maryland Center
for Environmental Science allowed for integration of new data to
the marine and marsh systems. The major input of socioeconomic
data was based on stakeholder participation at the meetings.
Limited access to additional socioeconomic data is attributed to
a lack of a more formal structure for data gathering. Local pro-
fessional stakeholders had data available that would have been
valuable if organized in a statistically valid manner. In hindsight,
additional funding would have been needed to collect, organize and
analyze health data. Although limited additional funds were spent
on data gathering efforts, it was not sufficient to cover all needs.
Additionally, a midterm meeting specifically designated toward
data gathering would have been helpful.
Second workshop. In March 2004 a second meeting took place
in Ushuaia. The model was shown, feedback was provided, limited
scenarios were presented and the questions the model was
addressing were revisited.
The participating PIs were the same as in the first meeting,
except for one crucial PI who had a family emergency. Fewer local
stakeholders participated in the second meeting. However, one
particular local stakeholder became very active in getting the input
of additional stakeholders to fill in the gap. A more consistent local
coordination of stakeholders is advisable for future collaborations.
Figure 3. Marine model sector resulting from the first workshop.
Figure 4. Marine sector model structure after simplification.
870 Marjan van den Belt et al.

A project managed over long distances needs a dedicated local
manager or a more active connection with local participants; that is,
local participants must be contacted more often and someone with
local access must function as a local counterpart. External factors,
such as the national economic situation, can also temporarily pull
interests away from UV-B issues toward other concerns.
Several important changes in the modeling approach were
recommended during the second workshop. The negative influence
of UV-B on tourism that had been anticipated during the first
meeting had not happened. In fact, the tourist sector was thriving
as never before, because of a favorable monetary exchange rate.
Peaks in UV-B radiation as a health concern for the local
population had decreased in importance. The workshop partic-
ipants reiterated their interest in long-term trends and impacts of
UV-B. Because long-term studies about the impact of UV-B on
skin, eyes and the immune system are often controversial, the
Figure 5. Marsh model sector structure.
Figure 6. Ecosystem service values sector.
Photochemistry and Photobiology, 2006, 82 871

socioeconomic sector of the model became more speculative.
Furthermore, reduced input from stakeholders into the model had
a negative impact on this sector. The local socioeconomic com-
ponent did not gain additional substance and remained a reflec-
tion of conceptual thinking and back-of-the-envelope calculations
and estimations.
Model construction. The original intent of the mediated
modeling component was to function as a bridge between local
stakeholders and scientists in order to extend the research in
a practical frame and attempt to make it usable for professionals
and policy makers. Ushuaia was chosen as a pilot area because
UV-B issues were on the public’s mind in 2000. The shift in
emphasis from local issues to global issues was discussed.
The conceptual model structure that resulted from the first
meeting was relatively well accepted by the group and encom-
passed much good thinking and discussion. The final version of the
model was modified in some areas to account for existing data and
to capture the most basic concepts (available at: http://www.
mediated-modeling.com or http://www.iai.int/ [the IAI Web site]).
A brief description of the model that ultimately resulted from the
workshop process follows.
The model was built with STELLA (High Performance Systems
Inc.). This software is well suited for systems dynamics studies.
It uses four basic iconic building blocks: stocks, flows, auxiliary
variables and connectors, which are identified in the model
structures as rectangles, valves, circles and arrows, respectively.
Figure 1 provides an overview of the model. The model contains
five main ‘‘sectors’’: UV radiation, which calculates the amount of
UV-B radiation reaching the surface of each of the five latitudinal
zones each month; marsh and marine ecosystems, which calculate
the responses of these ecosystems in each latitudinal zone to the
radiational forcings for each month; ecosystem services, which
calculates the impacts on a range of ecosystem services of the
changes in marsh and marine systems in each latitudinal zone
for each month; and socioeconomic impacts, which calculates the
tourism and health impacts (for Ushuaia in this example).
Figure 2 shows the UV radiation sector of the model. Irradiances
in regions I and V present large latitudinal variations due to dif-
Figure 7. Socioeconomic sector for Tierra del Fuego.
872 Marjan van den Belt et al.

ferences in ozone depletion and SZA variability, whereas the
gradient is much smaller in the other regions.
This model sector simulates trends in UV-B irradiation, using
data on monthly ozone levels and the action spectrum for
photosynthesis, DNA damage, erythema characteristics and impact
on eyes. There are two future scenarios: one with and one without
recovery of ozone level by 2050. The irradiation peaks are
simulated probabilistically. Action spectra for UV-B effects on
photosynthesis (30), for erythema characteristics, for DNA damage
and for the impact on eyes are used as weighting factors. The
respective UV-B-weighted parameters are used in the other model
sectors. The equation for UV-B irradiance per wavelength (WL) is:
�½Ozone 1970ðArcticÞ=OzoneðArcticÞ�*EXP½RAF by WLðArctic;High 310Þ�g
*UV Irradiance 1970 by WLðArctic;High 310Þ*cloud
Figure 3 shows the marine model sector that resulted from the
first workshop. The original goal was to model how the impacts of
a change in community structure due to UVB would cascade to the
bottom of the food chain. The present structure, shown in Fig. 4,
was considered to better represent one of the main scientific
conclusions of this group: the synergistic effect between certain
pollutants and UV-B (31,32). The model addresses the possible
consequences of these findings for the global CO2 budget. The
model expresses possible consequences of changes by UV-B
effects in terms of ecosystem service values, based on the findings
of Costanza et al. (33).
Figure 5 shows the marsh sector, with an emphasis on Juncus,
Spartina and Salicornia species as representative marsh plants.
Salicornia is mainly affected by UV-B because its actively
growing cells (the meristems) are apical, whereas the meristems
of Juncus and Spartina are at the base of the plant and are therefore
relatively protected against the influence of UV-B by the canopy
(9). Since the area covered by Salicornia in the subAntarctic
region, where the UV-B fluctuations are most severe, is relatively
small compared with the area covered by Juncus and Spartinaelsewhere, the model does not show significant impacts of UV-
B on marshes. This may be an inaccurate general assumption,
considering that Salicornia’s specific function in the marsh
community may be underestimated in other regions.
Figure 6 shows the ecosystem service values of the marine and
marsh systems. For the marine sector the ecosystem services are
based on net primary production (NPP) and values are extracted
from the report by Costanza et al. (34). The investigators attempted
to calculate new values for marsh ecosystem services and
determined additional uses and economic activities for marshes.
All values are estimates (9).
Ecosystem services are a constructive way to link different
ecosystems and their contributions to human welfare. However,
the understanding of ecosystem services in dynamic terms is, in
general, still in its infancy and requires much further research (36).
This model sector allowed us to sum up all the impacts of UV-B
for the marsh and marine systems and express these impacts in
dollar terms.
Figure 7 shows the socioeconomic sector for Ushuaia. Acute
and chronic impacts of UV-B radiation are translated into possible
lost labor. The main approach was to prevent impacts through
education to promote protection and it was modeled on the basis
of the time lag of ozone recovery. A feedback loop to further the
reduction of ozone-depleting substances was discussed but not
modeled. No good data are presently available to calibrate this
sector and the model structure remains speculative.
Figure 8. Main navigation screen.
Photochemistry and Photobiology, 2006, 82 873

Figure 9. UV-B output screen.
Figure 10. Cumulative net primary production (NPP) in the Antarcticregion (lat 90–558S) under three scenarios: (1) without pollutants and withthe Montreal Protocol scenario evolving as anticipated; (2) with pollutantsand the Montreal Protocol evolving as anticipated and (3) with pollutantsand ozone levels not recovering according to the Montreal Protocolpredictions. Data are specified in grams carbon per square meter per month.
Figure 11. Cumulative net primary production (NPP) in the tropical region(lat 208 S to lat 208 N) under three scenarios: (1) without pollutants and withthe Montreal Protocol scenario evolving as anticipated; (2) with pollutantsand the Montreal Protocol evolving as anticipated and (3) with pollutantsand ozone levels not recovering according to the Montreal Protocolpredictions. Data are specified in grams carbon per square meter per month.
874 Marjan van den Belt et al.

A comparison of the two ecosystems considered in the model
revealed that, although changes in the marine sector due to
anthropogenic influences may affect global climate change,
marshes are expected to primarily be affected by climate change.
Marsh ecosystem service value is partly derived from disturbance
regulation. Marshes cover relatively smaller areas than oceans but
have a high ecosystem service value per hectare. The value of
marine ecosystem services is lower per hectare but the area is so
vast that the global value for the marine area arguably comes out
higher than for global marshes.
Model behavior and scenarios
The modeling effort was an exercise to synthesize data and to
obtain knowledge and new research findings. Even though the
model is based on data, during model building we emphasized
reasoning of the scientists and stakeholders and de-emphasized
present knowledge based on published data. This approach makes
the model’s scientific output less reliable but an ideal tool to
generate new hypotheses. Thus, the two sections evaluating
modeling behavior and possible scenarios are based on qualitative,
not quantitative, considerations. Furthermore, because of the lack
of calibration data the model represents more the implications of
the shared assumptions of the participants than it does a technically
calibrated description of the system’s behavior. In other words,
the model’s credibility (at this stage) is derived more from the
buy-in of stakeholders than from good fit with observed data.
Model behavior. We describe here the general behavior of the
model, some of the major uncertainties and some of the ways the
stakeholders wished to exercise it to derive answers to their
questions. To accomplish this we will go through each of the
output screens that were designed for each of the model’s sectors
and briefly describe how they were set up and what they show.
On all of these figures, ‘‘buttons’’ are shown, which take one
to the area of the model indicated on the button. ‘‘Sliders,’’
‘‘switches’’ and ‘‘knobs’’ are also shown, which allow the user to
change the value of the parameter shown.
Figure 8 shows the home navigation screen that explains the
main sectors of the model and provides buttons to navigate to each
sector. For example, if one clicked on the button labeled ‘‘UV-B
radiation’’ in Fig. 8 one would go to Fig. 9, which shows the output
screen for that sector. Figure 9 shows a switch for turning on or off
the Montreal Protocol, a slider (not yet implemented) for setting the
level of human induced aerosols and a knob for adjusting the level
of UV radiation. The graph shows the level of ozone in the
Antarctic latitude zone, along with the level of UV at the surface
weighted by its impact on erythema. Many other graphs are
accessible by clicking on the tab in the lower left corner of the
graph. The time scale is in months on these graphs, going from 1
(in 1970) to 940 (in 2050, 80 years later).
Scenarios. Although the combinations of parameters to design
alternative scenarios are numerous, the following scenarios best
illustrate the conclusions of the marine system.
Consider the monthly value of ecosystem services of the marine
area in the Antarctic and tropical regions under a scenario (1)
without pollutants and with the effects of the Montreal Protocol
evolving as anticipated, (2) with pollutants and the effects of the
Montreal Protocol evolving as anticipated and (3) with pollutants
and ozone levels not recovering according to Montreal Protocol
predictions. Projected cumulative NNP in the Antarctic and
tropical regions under identical scenarios shows that the effect of
pollutants is more damaging than the effect of increased UV-B due
to ozone depletion (Figs. 10 and 11). Phytoplankton can acclimate
to UV-B levels corresponding to 60% ozone depletion under
conditions of mixing in the water column (11,31,36), thus
maintaining high biomass and primary production. This is
observed at all latitudes (10). Acclimation is achieved by changes
in community structure, in which resistant species become domi-
nant. High abundance of UV-absorbing compounds and photo-
protective carotenoids characterize UV-B–resistant species (37).
The impact of pollutants is equally strong in both regions
but the synergetic impact of UV-B is felt more strongly in the
Antarctic. In the 2050 the ecosystem service value lost 20%
between scenario 1 and 3 in the Antarctic and 3% in the tropical
region.
The cumulative monthly value of ecosystem services of the
global marsh area are calculated under a scenario of (1) no UV-B
impact and no sea level rise, (2) UV-B impact and no sea level rise
and (3) a sea level rise impact (Fig. 12). Increased sea level is the
primary factor diminishing ecosystem services, because the most
common marsh plants (Juncus and Spartina species) are not
sensitive to UV-B radiation (9). The third species considered is
UV-B sensitive. However, Salicornia is not abundant in the
Antarctic region, which has the largest variation in UV-B radiation.
In both ecosystems the largest impact on the modeled variables
chosen to represent ecosystem services values was due to factors
not related to UV-B impacts. Plants, both in the ocean and in
marshes, can acclimate in order to minimize UV-B damage. As
UV-B has been a major stress factor during the evolution of or-
ganisms, plant communities seem to be able to adapt successfully
to increased radiation as to maintain intact ecosystem function.
CONCLUSIONS
The model includes several synthesis results from the mesocosm
studies (39). During the first workshop recommendations were
geared toward an increase in information provision and education
about mitigation options, because of the importance of short-term
challenges recognized by the local stakeholders in Ushuaia.
The scientists advocated investment in basic research, because
many pieces of the puzzle are still missing and cannot be resolved
within the scope of this program. The group agreed that a
Figure 12. The cumulative monthly value of ecosystem services of theglobal marsh area under a scenario of (1) no UV-B impact and no increasein sea level, (2) UV-B impact and no increase in sea level and (3) anincrease in sea level. Data are specified in US dollars.
Photochemistry and Photobiology, 2006, 82 875
strengthening of the links between research, education and policy
should be sought.
In the final meeting short-term effects were less of an issue and
the short-term challenges and long-range issues were of more
interest. The focus of the PIs had moved toward climate change
issues, with UV-B as one additive stressor (or possibly a
moderating factor). The importance of relating UV-B effects in
a context of other global change variables became apparent.
The ecosystem service value of marshes is high per unit area but
the area of marshes is relatively small. The marine area is large
with a much lower value per unit area for ecosystem services.
However, there may be significant value impacts that warrant more
research into the dynamics of global climate change and ecosystem
services on both ecosystems. Group model building may continue
to be helpful in assisting interdisciplinary groups to think about
these complex interrelated issues.
The synthesis model reflects the conclusion for the marshes
that UV-B on a global scale is not a significant stress relative
to potential impact of increases in the sea level (9). Marshes are
thus affected by global change.
The synthesis model reflects the conclusion of the marine group
that a potential impact of a systemic order at a global level may
be present. Enhanced UV-B could cause a shift from primary
producers to bacteria at the community level. This may impact the
global carbon cycle. The effect is increased in the presence of
certain pollutants. Enhanced UV-B effects affect global change by
potentially affecting CO2 levels in oceanic surface waters.
Acknowledgements—This work was funded by the Inter-American Insti-tute for Global Change Research (contract CRN-026). This project wouldnot have happened with local participants in Ushuaia who volunteeredtheir time, including Miguel Isla, Osvaldo Barturen, Gabriel Karamanian,Sergio Luppo, Nemesio San Roman, Monica Couly, Stella Domınguez,Sonia Perez, Gloria Pereda, Graciela Ramacciotti, Marcelo Dragan, AnaGamboa and Luis Pinedo. Cecile Devigne (ISMER) and Bill Severn(HPL) were invaluable in gathering data.
REFERENCES
1. Van den Belt, M. (2004) Mediated Modeling: A System DynamicsApproach to Environmental Consensus Building. Island Press,Washington, DC.
2. Costanza, R. and M. Ruth (1998) Using dynamic modeling to scopeenvironmental problems and build consensus. Environ. Manag. 22,185–195.
3. Whitehead, R. F., S. J. de Mora and S. Demers (2000) Enhanced UVradiation—A new problem for the marine environment. In The Effectsof UV Radiation in the Marine Enviroment (Edited by S. de Mora,S. Demers and M. Vernet), pp. 1–34. Cambridge EnvironmentalChemistry Series 10. Cambridge University Press, Cambridge.
4. de Mora, S., S. Demers and M. Vernet (2000) In The Effects of UVRadiation in the Marine Enviroment (Edited by S. de Mora, S. Demersand M. Vernet), pp. 324. Cambridge Environmental Chemistry Series10. Cambridge University Press, Cambridge.
5. Van den Belt, M., L. Deutch and A. Jansson (1996) Integratedecological economics modeling as a consensus-building tool. InConference Proceedings. European Society for Ecological Economics,Paris, France, 24 May 1996, pp 336–360.
6. Van den Belt, M., P. Antunes and R. Santos (1997) Mediatedmodeling: A tool for stakeholder involvement in environmentaldecision making. In Proceedings of the Algarve Coastal ZoneConference, Algarve, Portugal, 10–12 July, 1997.
7. Van den Belt, M., L. Deutch and A. Jansson (1998) A consensus-basedsimulation model for management in the Patagonia coastal zone. Ecol.Model. 110, 79–103.
8. Van den Belt, M. (1998) Mediated Modeling Project; An integratedscoping model of the Upper Fox River Basin, University of Wisconsin,Green Bay.
9. Costa, C., Y. Detres, O. Bianciotto, L. Pinedo, E. W. Koch andM. Bertiller (2006) Effect of UVB on salt marsh vegetation: Trends ofthe genus Salicornia along the Americas. Photochem. Photobiol. 82,878–886.
10. Roy, S., B. Mohovic, S. M. F. Gianesalla, I. Schloss, M. Ferrario and S.Demers (2006) Effects of enhanced UV-B on pigment-basedphytoplankton biomass and composition of mesocosm-enclosed naturalmarine communities from three latitudes. Photochem. Photobiol. 82,909–922.
11. Ferreyra, G. A., B. Mostajir, I. R. Schloss, K. Chatila, M. E. Ferrario,P. Sargian, S. Roy, J. Prod’homme and S. Demers (2006) Ultraviolet Bradiation effects on the structure and function of lower tropic levels ofthe marine planktonic food web. Photochem. Photobiol. 82, 887–897.
12. Pelletier, E., P. Sargian, J. Payet and S. Demers (2006) Ecotoxico-logical effects of combined UVB and organic contaminants in coastalwaters: A review. Photochem. Photobiol. 82, 981–993.
13. Wetzel, R. G., P. G. Hatcher and T. S. Bianchi (1995) Naturalphotolysis by ultraviolet irradiance of recalcitrant dissolved organicmatter to simple substrates for rapid bacterial metabolism. Limnol.Oceanogr. 40, 1369–1380.
14. Whitehead, R. F., S. De Mora, S. Demers, M. Gosselin, P. Monfort andB. Mostajir (2000) Interactions of ultraviolet-B radiation, mixing,and biological activity on photobleaching of natural chromophoricdissolved organic matter: A mesocosm study. Limnol. Oceanogr. 45,278–291.
15. Hester, M. W., I. A. Mendelssohn and K. L. Mckee. 2001. Species andpopulation variation to salinity stress in Panicum hemitomon, Spartinapatens, and Spartina alterniflora: Morphological and physiologicalconstraints. Environ. Exp. Bot. 46, 277–297.
16. Bianciotto, O. A., L. B. Pinedo, N. A. San Roman, A. Y. Blessio andM. B. Collantes (2003) The effect of natural UV-B radiation ona perennial Salicornia salt-marsh in Bahia San Sebastian, Tierra delFuego, Argentina: A 3-year field study. J. Photochem. Photobiol. BBiol. 70, 177–185.
17. WMO (1999) Scientific Assessment of Ozone Depletion: 1998 (Editedby D. L. Albritton, R. T. Watson and P. J. Aucamp). United NationsEnvironment Program, World Meteorological Organization. GlobalOzone Research and Monitoring Project. WMO/UNEP, Nairobi.
18. Bojkov, R. D. and V. E. Fioletov (1995) Estimating global ozone char-acteristics during the last 30 years. J. Geophys. Res. 100, 16 537–16 551.
19. Mc Peters, R. and E. Beach (2004) TOMS Nimbus-7, Meteor-3 andEarthProbe. NASA/GSFC, version 8. Available at: http://toms.gsfc.nasa.gov. Accessed on 23 March 2006.
20. Stamnes, K., S. C. Tsay, W. Wiscombe and K. Jayaweera (1988)Numerically stable algorithm for discrete-ordinate-method radiativetransfer in multiple scattering and emitting layered media, Appl. Opt.27, 2502–2509.
21. Booth, C. R. and S. Madronich (1994) Radiation amplification factors:Improved formulation accounts for large increase in ultraviolet radia-tion associated with Antarctic ozone depletion. The United StatesNational Science Foundation’s Polar Network for monitoring ultravioletradiation. In Ultraviolet Radiation in Antarctica Measurements andBiological Effects (Edited by C. S. Weiler and P. A. Penhale), pp. 17–37.Antarctic Research Series 62. American Geophysical Union, Wash-ington, DC.
22. WMO (2003) Scientific Assessment of Ozone Depletion: 2002 (Editedby D. L. Albritton, R. T. Watson and P. J. Aucamp). United NationsEnvironment Program, World Meteorological Organization. GlobalOzone Research and Monitoring Project, WMO/UNEP, Nairobi.
23. Dıaz, S., C. Camilion, G. Deferrari, H. Fuenzalida, R. Armstrong, C.Booth, A. Paladini, S. Cabrera, C. Casiccia, C. Lovengreen, J. Pedroni,A. Rosales, H. Zagarese and M. Vernet (2006) Ozone and UV radiationover southern South America: Climatology and anomalies. Photochem.Photobiol. 82, 834–843.
24. Dıaz, S., C. Camilion, J. Escobar, G. Deferrari, S. Roy, K. Lacoste, S.Demers, C. Belzile, G. Ferreyra, S. Gianesella, M. Gosselin, C. Nozais,E. Pelletier, I. Schloss and M. Vernet (2006) Simulation of ozonedepletion using ambient irradiance supplemented with UV lamps.Photochem. Photobiol. 82, 857–864.
25. Cullen J. J. and M. P. Lesser (1991) Inhibition of photosynthesis byultraviolet radiation as a function of dose and dosage rate: Results fora marine diatom. Mar. Biol. 111, 183–1909.
26. Smith R. C., B. B. Prezelin, K. S. Baker, R. R. Bidigare, N. P. Boucher,T. Coley, D. Karentz, S. McIntyre, H. A. Matlick, D. Menzies, M.
876 Marjan van den Belt et al.

Ondrusek, Z. Wan and K. J. Waters (1992) Ozone depletion:
Ultraviolet radiation and phytoplankton biology in Antarctic waters.
Science 255, 952–958.27. Vincent W. F. and S. Roy (1993) Solar ultraviolet-B radiation and
aquatic primary production: Damage, protection and recovery.
Environ. Res. 1, 1–12.28. Bergmann T., T. L. Richardson, H. W. Paerl, J.-L. Pinckney and O.
Schofield (2002) Synergy of light and nutrients on the photosynthetic
efficiency of phytoplankton populations from the Neuse River Estuary,
North Carolina. J. Plankton. Res. 24, 923–933.29. Stevenson, J. C., M. S. Kearney and E. W. Koch (2002) Impacts of Sea
Level Rise on tidal wetlands and shallow water habitats: A case study
from Chesapeake Bay. Am. Fish. Soc. Symp. 32, 23–36.30. Helbling, E. W., V. Villafane, M. E. Ferrario and O. Holm-Hansen
(1992) Impact of natural ultraviolet radiation on rates of photosynthesis
and on specific marine phytoplankton species. Mar. Ecol. Progr. Ser.80, 89–100.
31. Sargian, P., B. Mostajir, K. Chatila, G. A. Ferreyra, E. Pelletier and S.Demers (2005) Non-synergistic effects of water-soluble crude oil and
enhanced ultraviolet-B radiation on a natural plankton assemblage.
Mar. Ecol. Prog. Ser. 294, 63–77.32. Sargian, P., E. Pelletier, B. Mostajir, G. A. Ferreyra and S. Demers
(2005) TBT toxicity on a natural planktonic assemblage exposed
to enhanced ultraviolet-B radiation. Aquat. Toxicol. (Amst.) 73, 299–314.
33. Costanza, R., R. d’Arge, R. de Groot, S. Farber, M. Grasso, B. Hannon,S. Naeem, K. Limburg, J. Paruelo, R. V. O’Neill, R. Raskin, P. Suttonand M. J. van den Belt (1997) The value of the world’s ecosystemservices and natural capital. Nature 387, 253–260.
34. Costanza, R., F. Andrade, P. Antunes, M. van den Belt, D. Boersma, D.Boesch, F. Catarino, S. Hanna, K. Limburg, B. Low, M. Molitor, J.Pereira, S. Rayner, R. Santos, J. Wilson and M. Young (1998) Principlesfor sustainable governance of the oceans. Science 281, 198–199.
35. Boumans, R., R. Costanza, J. Farley, M. A. Wilson, R. Portela, J.Rotmans, F. Villa and M. Grasso (2002) Modeling the dynamics of theintegrated earth system and the value of global ecosystem servicesusing the GUMBO model. Ecol. Econ. 41, 529–560.
36. Hernando, M., I. Schloss, S. Roy and G. Ferreyra (2006) Photo-acclimation to long-term ultraviolet radiation exposure of natural sub-Antarctic phytoplankton communities: Fixed surface incubationsversus mixed mesocosms. Photochem. Photobiol. 82, 923–935.
37. Mohovic, B., S. M. F. Gianesella, I. Laurion and S. Roy (2006)Ultraviolet-B-photoprotection efficiency of mesocosm-enclosed naturalphytoplankton communities from different latitudes: Rimouski (Can-ada) and Ubatuba (Brazil). Photochem. Photobiol. 82, 952–961.
38. Belzile, C., S. Demers, G. A. Ferreyra, I. Schloss, C. Nozais, K.Lacoste, B. Mostajir, S. Roy, M. Gosselin, E. Pelletier, S. Gianesella,S. Diaz and M. Vernet (2006) UV effects on marine planktonic foodwebs: A synthesis of results from mesocosm studies. Photochem.Photobiol. 82, 850–856.
Photochemistry and Photobiology, 2006, 82 877