Sustainable Business Models in Tourism - MDPI
288
Sustainable Business Models in Tourism Printed Edition of the Special Issue Published in Sustainability www.mdpi.com/journal/sustainability Adam R. Szromek Edited by
-
Upload
khangminh22 -
Category
Documents
-
view
0 -
download
0
Transcript of Sustainable Business Models in Tourism - MDPI

Sustainable Business Models in Tourism
• Adam R. Szrom
ek
Sustainable Business Models in Tourism
Printed Edition of the Special Issue Published in Sustainability
www.mdpi.com/journal/sustainability
Adam R. SzromekEdited by

Sustainable Business Models in Tourism


Sustainable Business Models in Tourism
Editor
Adam R. Szromek
MDPI • Basel • Beijing • Wuhan • Barcelona • Belgrade • Manchester • Tokyo • Cluj • Tianjin

Editor
Adam R. Szromek
Silesian University of
Technology
Poland
Editorial Office
MDPI
St. Alban-Anlage 66
4052 Basel, Switzerland
This is a reprint of articles from the Special Issue published online in the open access journal
Sustainability (ISSN 2071-1050) (available at: https://www.mdpi.com/journal/sustainability/
special issues/Sustainable Business Models Tourism).
For citation purposes, cite each article independently as indicated on the article page online and as
indicated below:
LastName, A.A.; LastName, B.B.; LastName, C.C. Article Title. Journal Name Year, Volume Number,
Page Range.
ISBN 978-3-0365-0888-7 (Hbk)
ISBN 978-3-0365-0889-4 (PDF)
The book was prepared for the implementation of a research project ‘A business model for health
resort enterprises’ No. 2017/25/B/HS4/00301, supervised and financed by the National Science
Center in Poland.
© 2021 by the authors. Articles in this book are Open Access and distributed under the Creative
Commons Attribution (CC BY) license, which allows users to download, copy and build upon
published articles, as long as the author and publisher are properly credited, which ensures maximum
dissemination and a wider impact of our publications.
The book as a whole is distributed by MDPI under the terms and conditions of the Creative Commons
license CC BY-NC-ND.

Contents
About the Editor . . . . . . . . . . . . . . . . . . . . . . . . . . . . . . . . . . . . . . . . . . . . . . vii
Preface to ”Sustainable Business Models in Tourism” . . . . . . . . . . . . . . . . . . . . . . . . ix
Adam R. Szromek
Model of Business Relations in Spa Tourism Enterprises and Their Business EnvironmentReprinted from: Sustainability 2020, 12, 4941, doi:10.3390/su12124941 . . . . . . . . . . . . . . . . 1
Richard W. Butler and Adam R. Szromek
Incorporating the Value Proposition for Society with Business Models of Health Tourism EnterprisesReprinted from: Sustainability 2019, 11, 6711, doi:10.3390/su11236711 . . . . . . . . . . . . . . . . 21
Zygmunt Kruczek and Adam R. Szromek
The Identification of Values in Business Models of Tourism Enterprises in the Context of thePhenomenon of OvertourismReprinted from: Sustainability 2020, 12, 1457, doi:10.3390/su12041457 . . . . . . . . . . . . . . . . 41
Jan Derco, Piotr Romaniuk and Michal Cehlar
Economic Impact of the Health Insurance System on Slovak Medical Spas and MineralSpring SpasReprinted from: Sustainability 2020, 12, 3384, doi:10.3390/su12083384 . . . . . . . . . . . . . . . . 53
Agnieszka Niezgoda and Klaudyna Kowalska
Sharing Economy and Lifestyle Changes, as Exemplified by the Tourism MarketReprinted from: Sustainability 2020, 12, 5351, doi:10.3390/su12135351 . . . . . . . . . . . . . . . . 65
Mateusz Naramski and Krzysztof Herman
The Development of Mobile Tourism in the Upper Silesian Metropolitan Area of PolandReprinted from: Sustainability 2020, 12, 44, doi:10.3390/su12010044 . . . . . . . . . . . . . . . . . 85
Adam R. Szromek, Beata Hysa and Aneta Karasek
The Perception of Overtourism from the Perspective of Different GenerationsReprinted from: Sustainability 2019, 11, 7151, doi:10.3390/su11247151 . . . . . . . . . . . . . . . . 107
Anna Adamus-Matuszynska, Piotr Dzik, Jerzy Michnik and Grzegorz Polok
Visual Component of Destination Brands as a Tool for Communicating Sustainable TourismOffersReprinted from: Sustainability 2021, 13, 731, doi:10.3390/su13020731 . . . . . . . . . . . . . . . . 127
Marek Jozwiak and Patrycja Sieg
Tourism Development in Post-Industrial Facilities as a Regional Business ModelReprinted from: Sustainability 2021, 13, 2028, doi:10.3390/su13042028 . . . . . . . . . . . . . . . . 145
Mateusz Naramski
The Application of ICT and Smart Technologies in Polish Museums—Towards Smart TourismReprinted from: Sustainability 2020, 12, 9287, doi:10.3390/su12219287 . . . . . . . . . . . . . . . . 161
Adam R. Szromek
An Analytical Model of Tourist Destination Development and Characteristics of theDevelopment Stages: Example of the Island of BornholmReprinted from: Sustainability 2019, 11, 6989, doi:10.3390/su11246989 . . . . . . . . . . . . . . . . 189
v

Michał Zemła
Winter Sports Resorts and Natural Environment—Systematic Literature Review PresentingInteractions between ThemReprinted from: Sustainability 2021, 13, 636, doi:10.3390/su13020636 . . . . . . . . . . . . . . . . 205
Piotr Olesniewicz, Sławomir Pytel, Julita Markiewicz-Patkowska, Adam R. Szromek and
Sona Jandova
A Model of the Sustainable Management of the Natural Environment in National Parks—ACase Study of National Parks in PolandReprinted from: Sustainability 2020, 12, 2704, doi:10.3390/su12072704 . . . . . . . . . . . . . . . . 223
Yusuke Kitamura, Yuki Ichisugi, Selim Karkour and Norihiro Itsubo
Carbon Footprint Evaluation Based on Tourist Consumption toward Sustainable Tourismin JapanReprinted from: Sustainability 2020, 12, 2219, doi:10.3390/su12062219 . . . . . . . . . . . . . . . . 251
vi

About the Editor
Adam R. Szromek is a Full Professor of Social Science in Tourism Management. He is a Professor
of Management at the Silesian University of Technology in Poland and a member of the Commission
on Management Sciences at the Polish Academy of Sciences.
His research interests focus on heritage tourism and health tourism, with special attention to spa
tourism management and business models in spa enterprises.
Professor Szromek’s research has appeared in the Tourism Management, American Journal of
Tourism Management, Health Policy, Health Services Research, Sustainability, Studies in Physical
Culture and Tourism, and Human Resources for Health.
vii


Preface to ”Sustainable Business Models in Tourism”
The progressing transformation of tourist and healing activities, in the scope of the broadly
understood organizational and market processes, reveals, at the same time, that the tools for operating
this activity are outdated. The functioning of an enterprise deprived of reliable strategic tools in a
turbulent environment is becoming more and more difficult, and the lack of response to the reported
market needs may even lead to a crisis.
Sustainable development, in its broader perspective, is another aspect necessary to include in
contemporary business models. A tourist and spa company cannot ignore its own environmental
impact, or fail to see the consequences of its activities.
It is necessary to offer managers modern management tools that cover the broadest possible
scope of integration of the elements of the conducted business activities, at the same time adjusted to
the specificity of the market and needs of the natural environment in which the enterprises managed
by them operate.
I invite you to read my book on business models in tourism, in the context of considering the
principles of sustainable development. This book, formulated in the light of the presented needs, aims
to use the concept of business models and sustainability business models in the context of a tourism
enterprise, adapted to the existing conditions of tourist and spa activities. We are also presenting
exemplifications of business models and other management methods used in tourism activities.
The book was prepared for the implementation of a research project ‘A business model for health
resort enterprises’ No. 2017/25/B/HS4/00301, supervised and financed by the National Science
Center in Poland.
I sincerely thank all the authors of the following chapters, my team, and invited guest authors.
I especially want to thank Professor Richard W. Butler for his friendship and mentoring.
Adam R. Szromek
Editor
ix


sustainability
Article
Model of Business Relations in Spa TourismEnterprises and Their Business Environment
Adam R. Szromek
Department of Organization and Management, Institute of Economy and Informatics, Silesian University ofTechnology, Akademicka 2A, 44-100 Gliwice, Poland; [email protected]; Tel.: +48-32-277-7336
Received: 29 May 2020; Accepted: 15 June 2020; Published: 17 June 2020
Abstract: Sustainable tourism, carried out on spa tourism enterprises, is a key issue that requiresthe combination of the implementation of economic goals of business activity and, at the sametime, the limitation of negative influences on the tourist areas, which are valuable from the point ofnature. The main objective of this article and, at the same time, the objective of theoretical–cognitiveand empirical research, is to find links and mutual relations between the entities carrying out touristand therapeutic activity in health resorts in a model approach, taking into account sustainable tourismelements. The implementation of the goal will be carried out on the basis of empirical studies,covering business models of 17 of the largest health resorts in Poland. The article describes relationsoccurring in the health resort environment and defines a model of relations between health resortenterprises and other entities functioning within this sector. The network approach of the studiedissue is analyzed from the point of view of relations found in the complementary cooperation ofentities, among which one is ready to implement the benefit and others express their need for the saidbenefit and are willing to be its recipients. The network relation of the second type, where the entitiescombine their forces to meet a common goal, is presented in the form of exemplification of the healthresort enterprise network in the Polish market.
Keywords: sustainability; business model; spa tourism; business environment
1. Introduction
Sustainable tourism, carried out in health resort areas, is a key research issue, having, at the sametime, important practical effects. The necessity of combining the economic objectives of businessactivity and limiting its negative influence on health resort resources seems to be very difficult, if notcontradictory. The complexity of the issue is further enhanced by the necessity to implement theseobjectives within the whole sector or its part. While the attempt to balance the activity within itsown business model is possible to capture and regulate, the cooperation between particular entities ofthis market within the same proecological or cultural objectives can be more difficult [1]. However,this requires the analysis of mutual relations between a health resort enterprise and other entitiesfunctioning on the market. The contemporary approach to mutual relations to achieve synergy [2]cannot be based solely on quantitative criteria, especially in the area of price, but also on qualitativecriteria, especially in terms of sustainable economic and social goals [1].
The main objective of this article and, at the same time, the objective of theoretical–cognitiveand empirical research, is to find links and mutual relations between the entities carrying out touristand therapeutic activity in health resorts in a model approach, taking into account sustainable tourismelements. Identification of relationships between dependent entities operating on the spa tourismmarket, as part of one business model or linked business models, will help managers of spa companiesto look at the structure of market connections from a broader perspective. This approach to mutualbusiness relations will enable individualized optimization of economic activities aimed at finding
Sustainability 2020, 12, 4941; doi:10.3390/su12124941 www.mdpi.com/journal/sustainability1

Sustainability 2020, 12, 4941
sustainable solutions, in terms of costs and material savings, shortening delivery times, and changingthe chain of relationships.
The general objective defined above is divided into two more specific cognitive objectives. The firstspecific objective is of theoretical and cognitive nature and is directed towards the identification offunctioning mechanisms of health resort enterprises. The second objective (of empirical type) concernsthe identification of the relationship between the health resort enterprises and their environment.The implementation of this objective requires its own research that covers the analysis of businessmodels of health resort enterprises. After obtaining the research results, the four-factor approach todesign space analysis [3] is used, and the conclusions are presented.
The network approach of the studied issue is analyzed from the point of view of relations foundin the complementary cooperation of entities, among which one is ready to implement a benefitand others express their need for the said benefit and are willing to be its recipients. The networkrelation of the second type [4], where the entities combine their forces to meet a common goal,is presented in the form of exemplification of the health resort enterprise network in the Polish market.
2. Literature Review
The Global Sustainable Tourism Council (GSTC) [5] has developed criteria that are arranged in fourpillars: sustainable management, socioeconomic impacts, cultural impacts, and environmental impacts(including consumption of resources, reducing pollution, and conserving biodiversity and landscapes).When discussing sustainable management, it was emphasized how important the modeling of businessis, which fosters the protection of culture and the natural environment. In this aspect, the spaareas are very sensitive, meaning areas valuable from the point of nature, with health resourcesand health properties of the climate, where the infrastructure allowing for the implementation of touristand therapeutic functions is located. Mutual relations between entities of the spa sector should be basedon the responsibility to protect natural resources and local culture. Otherwise, the changes caused byovertourism can degrade the spa area and limit its tourist and therapeutic functions. Therefore, what iscrucial is the proper formulation of relations between the health resort enterprise and its environment(suppliers, recipients, spa communes, partners, competition), taking into account practices protectingthe health resort areas.
The health resort is a specific tourist and therapeutic entity, with various forms and tasksimplemented in the health resorts for patients and spa tourists. This is not an easy area of activitiesto be defined, both by theoreticians and by practitioners, as the enterprise functioning in such anarea implements both tasks, falling within the scope of tourism (within the private sector) and publichealth (within the public sector). The structure of Polish health resorts, carried out in the form ofhealth resort facilities, covers such types of constituent entities as spas, spa hospitals (with associatedcatering facilities), as well as spa centers for children, spa clinics, and natural therapy centers renderingmedical services [6]. However, apart from the spa enterprises in the health sector, there are also otherdependent social and economic entities for which the enterprise can be a service provider, a recipientof medical raw materials, a beneficiary of contracts, and even the main provider of health policies.The importance and extensiveness of the roles in the specific relations require the standardization ofthe structure of links between these entities in the form of a business relations model, where the startingpoint is the health resort business model.
2.1. Responsiveness of Enterprise to the Change of Business Environment
Business modeling is a crucial organizational process for every enterprise. Its result is, in general,the model describing processes taking place in the business activity, as well as their link withthe environment influencing the enterprise. Therefore, a business model is the characteristics ofthe described business [7] or a description of relations between components in an organization thatresult in the creation of value for the organization [8]. A business model is also a visual depictionof an organization’s functioning logic, its elements, or ventures in the form of appropriately named,
2

Sustainability 2020, 12, 4941
interlinked elements of a template that—once populated with content—ensure logical understandingof the process of functioning, survival, and development of an organization [9]. However, anotherdefinition of a business model indicates that it is a conceptual tool, containing a set of elements and theirrelations with defined objectives, allowing us to expose the company’s business logic. At the same time,it is a description of values that the enterprise is able to provide to market segments of the organization,along with its network relations with partners, to create value [10–12]. The idea of a business model as atool is also promoted by D. Teece [13,14], who perceives it as a tool describing the design or architectureof creation, supply, or value-capturing mechanisms. S. Prendeville and N. Bocken [15] describethe business model as a conceptual tool, describing the activities that refer to business transactionsbetween customers, partners, and suppliers, as well as the organization and their participationin the development and capturing of value.
The creators of the CANVAS business model structure, A. Osterwalder and Y. Pigneur [3], proposeda complex approach to create business models. They named six techniques of designing businessmodels that can be treated as managerial tools. At the same time, they revealed six perspectives ofcreating models: (1) customer’s inspiration, (2) creation of ideas, (3) visual thinking, (4) creation ofprototypes, (5) storytelling, and (6) scenarios. As a consequence, a nine-element template of a businessmodel named CANVAS was designed. These nine interconnected elements influencing one anotherare customer segments, value proposals, distribution channels, customer relations, revenue streams,key resources, key activities, key partners, and costs structure. Some of them strongly depend onthe environment, which significantly influences the shape of such elements as key customer relationsand partner relations in the environment and recipients’ segments or distribution channels and keyresources, as well as key activities.
The developments of the Board of Innovation [16], which has presented multiple innovativesolutions and examples of business models for numerous industries, can be very helpful. The Boardof Innovation explains that the innovation programs can be defined as the activity that influencesand introduces innovations to a company’s strategy. One of the dimensions is the scope of innovationinfluence intensity, and the second is the opportunities that the organization has. Therefore, the Boardof Innovation has developed a modern manner of presenting mutual interactions taking place betweenthe enterprise and its environment, as well as other participants of the same sector. The presentation ofthese relations can foster the correctness of formulating a business model of an enterprise functioningin a turbulent environment.
It seems that this is a very important remark, as, so far, the research has been more focusedon the internal relations of the enterprise and rarely on external relations. It must be noted,however, that the enterprise is functioning in a specific environment that influences the enterpriseand changes due to the business activity of the enterprises functioning in them. K. Obłój [17] paysattention to the fact that strategic decision-making requires strategic analysis of the environmentand the analysis of the organization. The analysis of the environment and understanding of the presentchallenges, opportunities, and threats requires us to look at the environment of the company and thencarry out a more indepth analysis of the industry and strategic group within which the companycompetes. Intrasectoral competitiveness of competition, complemented with the influence of suppliers,recipients, substitutes, and new market participants (new products), allows us to start a discussionon the competitiveness of the enterprise. However, such an analysis does not provide a full scope ofinformation on the dynamics of the changes taking place. Meanwhile, establishing a business modelrequires such analysis not only in the context of one enterprise but also the whole sector within whichthe enterprise is functioning.
It must be noted that the literature presents such intrasectoral relations influencing the shape ofthe enterprise business model. According to B. Nogalski [18], it is the sector that forces the manner ofcarrying out business activity on the enterprise. It applies to the configuration of resources, activities,as well as offered products and services that ensure the creation of value for customers and the generationof profit for enterprise owners. The redefinition of a business model (also defined as strategic
3

Sustainability 2020, 12, 4941
regeneration) is a process that should ensure that the enterprise matches the external conditions,thanks to reorganization, diversification, divestment, change of technology or business activity, and/orre-engineering of operational processes or product portfolios. According to M. Porter [19], the sector is apart of industry grouping enterprises manufacturing products or providing services of similar purpose(substitutes) and selling them on the same geographical market. Meanwhile, K. Obłój [17] emphasizedthe complexity and dynamics of the environment, understood not only from the perspective ofmarket and industry but also as a complex system of numerous trends, events, and markets creatingthe context for a company’s function (meaning environment). The dynamics of changes in an enterprise’senvironment dictate the pace of the changes in the enterprise.
A. Osterwalder and Y. Pigneur [3] have suggested approaching the environment analysis as adesign space to see the context where the new or changed business model should function. Therefore,they proposed to base the environment analysis on four factors, that is on (1) forces influencingthe market, (2) forces present in the industry, (3) the most important trends, and (4) macroeconomic forces.The forces influencing the market are characterized by way of market segments, needs and expectations,market problems, costs of change, and by way of revenue attractiveness. The forces influencingthe industry are suppliers and other elements of the value chain, stakeholders, present and prospectivecompetitors, and substitution products and services. The key trends are characterized by way oftechnological, regulatory, social, and cultural trends, as well as social and economic trends. The fourthcategory, meaning macroeconomic forces, is analyzed through global market conditions, capitalmarkets, economic infrastructure, as well as goods and other resources.
The approach proposed by A. Osterwalder and Y. Pigneur is similar to the concept of the integratedmodel (process) of management that treats the enterprise as a whole and not as a set of various functionsand presents a new manner of organizing its future, with the use of the term of a system, as wellas system properties and relations [20]. It is not a common approach, and due to the type ofmanagers’ reactivity, four models of proceeding [18] towards the new situation of the enterprise can bedistinguished. The first model is the so-called passive enterprise, where no reaction to the occurringsituation can be observed. It results from both the lack of knowledge of the changes taking place,as well as from the lack of faith in their stability, and the expectation that the situation will changeback. The consequences of such a type of activity are the loss of competitiveness, greater distance fromthe position of leader, or even bankruptcy.
The second model is the so-called reactive enterprise, where the reaction to the changes takingplace in the environment can be observed, but these are often delayed reactions resulting from aspecific forced change (such as a change of law or market changes). The third type is the so-calledproactive enterprise, where the future is predicted, and even trend forecasts are prepared, meaning itsreaction to change is the fastest. However, all types of enterprises, be it passive, reactive, or proactive,depend on changes in the environment. The fourth type differs from the previous weak reactionsto the environment as it independently shapes its environment with the use of its own resources.These are active enterprises, which are the leaders when it comes to market participation, political links,or innovation [18].
2.2. Interorganizational Relations
A modern creation of mutual relations between enterprises functioning on a specific market is oftenbased on building an interorganizational network. H. Håkansson and D. Ford [21] claimed that the termsrelation and network has become inseparable in the business dialect between enterprise managers.C.M. Hall [22] defines network as an interorganizational cooperation agreement. In subsequent works,he cited the advantages and disadvantages of using such a cooperation concept. Even though he statedthat using economic and business solutions cannot be applied in the case of complex sectors withvaried structures [23], he still considered network cooperation to be of greater effectiveness, quality,and end value offered to the customer.
4

Sustainability 2020, 12, 4941
In the literature, one can also stumble upon network participant typology [24]. The participants(also defined as network actors) take on specific roles, characterizing their functions in the network.One of the roles is the role of an architect, who establishes the initial network and is the creator ofmechanisms responsible for its durability, establishing cooperation rules and the roles of specificnetwork participants. Another role is the role of a watchman, who acts as a mediator in case of conflictand misunderstanding. There is also a broker who coordinates the whole enterprise.
Their mutual market relations can vary. Literature [25] names the following:
• Bureaucratic relations, where the linking elements are orders adopted and binding standardsand procedures;
• Economic relations, where the linking elements are material and financial transactions;• Operational relations, where the links between the entities are common activities, collective
decision-making, and use of shared resources;• Cultural relations, where the relationship is based on shared values and a community of
opportunities and threats;• Information relations based on access to, exchange, and sharing of information in the process of
establishing the relationship.
Characteristic features of the network are dominating hubs, and their status results from the relationsbetween the remaining network actors. D. Delporte-Vermeiren, P. Vervest, and E. Van Heck [26] indicatedthat the description of specific network hubs should take place from the point of view of relations that canbe noted between its participants (actors). The quantification of these relations is three points of view:a consistency perspective (defined as the number, variety, and density of relations between the hubs),a combination potential perspective (meaning the size and variety of network peaks), and an activationmanner perspective (defining the scope of creation of new relations between the network actors) [25].One must remember, however, that the relations in the networks are often based on the cooperationagreement, but not every actor is directly linked with other network participants. In such a case, we aredealing with indirect links [27].
Entities functioning on a specific market (also, spa markets) can be subject to the networkingprocess. This is made possible thanks to the characteristics of network hubs, that is the abilityto establish mutual relations based on knowledge and resource flows, mutual legal and capitalindependence, the freedom to make a decision to enter or leave the network, activities synergy,possibility to implement both shared and individual objectives, the possibility of modular interaction,the ability to learn from other network actors and to use innovation through teamwork, mutualcommunication, and complementary character, as well as the ability to enter into risky relations [28].However, it is worth noting that if the network is created by independent entities, then it can be difficultor even impossible to manage [29]. Therefore, quite often, the process stops at its coordination stage,even though this is also not a widely accepted opinion [30,31]. Irrespective of the adopted terminology,the manner in which the cooperation within the network is carried out and its effectiveness depend onmanagerial, steering, executive, and coordinating activities [32].
Network coordination is a dynamics of sorts that takes place in interorganizational networkslinking various entities, such as public and private entities and natural persons [33]. The literaturenames four approaches to network governance [34]. These are such issues as good/corporate governance,new public management/market governance, multilevel governance/intergovernmental relations, and networkgovernance. Coordination in an interorganizational network is a complex process, as it dependson the interaction between, quite often, different entities of varied strategic goals that are in asituation where they need to coordinate their activities by taking into account the objectives of othernetwork participants.
P. Perri et al. [35] noticed that the coordination depends on such factors as network symmetry,internal structure, institutional form, adopted and dominating styles of learning, type of businessactivity, and tasks implemented within the network. The factors threatening network stability are
5

Sustainability 2020, 12, 4941
the lack of trust, too great a dependence on partners’ activities, high complexity, and difficulty ofprocesses implemented together with partners, different levels of absorption abilities concerningcompetences and skills [33].
An interesting approach to roles within the network is presented by J. Child and D. Faulkener [36],who identify dominated networks with a significant asymmetry of forces (they named them kingdoms)and partners’ agreements with equal positions (republics) In the dominated networks, the natureof threats for the cooperation depends on the position occupied by a given entity—central orperipheral. For the latter, the threats are excessive dependency on partners and the risk of lossof independence [37], the risk of unequal use of opportunities offered by networks [38], and the risk ofloss of flexibility at the individual level [39]. In the case of peer-to-peer networks, there is a risk ofopportunism [38], stagnation in unfavorable relations, hindered forecasting of network development,and lower management control [39].
J. Lichtarski [4] proposed to divide the cooperation relations into two types: A and B. The first-typerelations (A) are present when the cooperation is based on mutual complementation of entities—oneis able to render a service, and the other expresses a demand for such service and is willing tobe its recipient. The second-type relations (B) take place when two entities combine their forces(shared activities and shared resources) to achieve a common goal. In this work, the emphasis is put,in the majority, on the first-type relation (A), while type B is characterized by the use of the identifiedexample of a spa enterprise network.
2.3. Public Law Networks in Health Resort Enterprise
It can be noted that on the health resort services market, entities belonging to the private, public,and sometimes also to nongovernmental sectors can be found. In such a case, the network will becharacterized by the features of the cooperation network being built, taking into account the publiclaw network. Such networks abstain from traditional separation of the public sphere from the privatesphere, focusing its activities on the size of actors in the network and their engagement in orderto achieve common goals [40]. On the spa market, one can observe mutual relations between spaenterprises, self-government units (the spa commune representing the local community), as wellas suppliers and institutional recipients of spa services and research institutions (in the domain ofmedicine). The literature analysis indicated that the public law relations, observed within the network,have the following characteristics [41]:
• they are created by independent entities, where at least one is subject to public law;• their objective is the shared implementation of public interest (it is also possible to generate profit
by private entities);• there are learning processes, based on a mutual adaptation of network participants to one another;• their participants are independent entities that voluntarily participate in the network;• relational rent is proof of the effectiveness of the implementation of tasks of public character.
It must be noted that networks established within the spa business are of a mixed character,covering both public and private entities. The motivation of the latter to join the network is to generategreater profits. The public entities, on the other hand, implement, first of all, public interest goals(in this case, objectives of the public health). Therefore, it is important to adopt an approach combiningthe perspective of private networks (cooperation networks from the point of view of entrepreneurs)with the perspective of public networks.
S. Goldsmith and W.D. Eggers [42] pointed out the features differentiating these approaches.They applied both to the goal and to the importance of relational rent in the carried-out business,as well as to the cooperation effect or the cooperation horizon, the implementation goals and mutualtrust. Thus, when it comes to the purpose of the activity, public networks are oriented towardsthe implementation of public interest, while, in private networks, the individual interest isthe dominating one. Relational rent in public networks is the effectiveness measure, while for private
6

Sustainability 2020, 12, 4941
networks, it is a source of competitive advantage. This also determines the shape of the cooperationeffect, which, in public networks, is more difficult to define than in the case of private networks.What unites these two types of networks is the declared importance of trust, which in private networks,more often than not, is limited, as well as the long-term time horizon of activity and objectiveimplementation, where private networks quite often agree to the implementation of short-termobjectives. Within the objectives of particular entities belonging to a public network, a low level ofcompatibility can be observed, as opposed to private networks.
The research carried out by D. Dredge [43] indicates that the network approach, in the case oftourism, is characterized by four advantages. The networks take into account the variety of solutionsin tourism, and that these problems are often solved by different communities. The network approachrecognizes the fuzzy division of tasks between the private and public sectors and allows them to viewtourism as multidimensional space, well-fitted into the rules of shared interest of these two groups.Networks make it possible for various levels of political support for various problems to be present,which, at the same time, differentiate the levels of attention paid to different problems. Networkstakeholders can also be participants of other networks, and thus the level of their influence, roles,interactions, and functions in the network can change.
In the process of coordination of networks in tourism, three basic models of conduct can beidentified [44]. It can be a network managed by a self-governing unit (e.g., council, government),a network managed by their participants (self-coordinating), or a network managed by a localtourist organization, although, in the case of health resorts, the dominant health insurer can be aninformal coordinator.
The Good Governance Advisory Group [45] indicates that good coordination depends, firstof all, on the actors of the network and groups associated with the network, their aspirations,and shared values, as well as the decisions made within the responsibility, transparency, participation,communication, knowledge sharing, efficiency, and fairness. The local tourist network coordinationeffectiveness in achieving goals depends on the effectiveness of structures and institutional processes,relation resources, and available skills [46–48].
In case of sustainable tourism carried out by health resorts, coordination of mutual intrasectoralrelations, directed towards the protection of natural resources at the same time as maintaining the rightto carry out one’s business, is one of the most difficult issues when it comes to determining the sharedvalues of entities belonging to that network.
3. Materials and Methods
The analysis of relations between the entities functioning on the spa services market requiredboth theoretical and empirical studies. The theoretical research allowed us to identify the rules ofthe function of health resort enterprises. It allowed us to identify basic processes of value proposalcreation for the customer and value captured by the enterprise. In turn, the empirical research allowedthe analysis of the health resort enterprise environment and their mutual business relations. It must,however, be specified that the analysis was not aimed to assess these relations. It served only to showthe structure of mutual relations between entities on the spa services market.
The research directed towards the analysis of health resort enterprise business processes and theirrelations with other entities functioning within this market was carried out in 2018 in 17 of the largestspa enterprises in Poland. The research was carried out by way of indepth interviews with enterprisemanagers carrying out tourist and therapeutic activities. In the research, a survey questionnaire thatcharacterized the business model structure and market relations was used. The enterprises underanalysis were selected from the list of health resort facilities developed and shared by the Ministry ofHealth by the Republic of Poland. The selection criteria were the largest health resort facilities, having,in total, 33% share on the health resort market in Poland, carrying out their activity in 95 facilities(spa and spa hospitals), and constituting 36% of all such facilities in Poland.
7

Sustainability 2020, 12, 4941
The designed survey questionnaire consisted of 26 items divided by two topics—business modelswith market relations and health resorts business activity. In the first part of the questionnaire,18 questions were posed, characterizing the business model structure, considering the CANVASnine-element model ((1) customers’ segment, being the axis of each business model; (2) proposals ofvalues for selected customers’ segments; (3) communication channels between the defined elements;(4) relations with customers; (5) revenue streams; (6) key resources, (7) key activities; (8) key partners;(9) cost structure, meaning all the costs related to the execution of the defined business model)and intrasectoral relations. The second pool of questions was concerned with issues associated withthe tourist and health resort business activities carried out and market relations resulting from theseactivities. This made it possible to describe the health resort environment and to visualize the relationsoccurring in the health resort environment and other entities functioning within this market.
4. Results and Discussion
The theoretical research carried out within the literature of the subject and documents governingthe rules of providing health resort services and health tourism services in health resort enterprises,as well as empirical studies over the business model of 17 of the largest health tourism enterprisesin Poland point to a complex structure of mutual market relations. It is associated mostly withthe complexity of the process of providing value for patients. This complexity results from the necessityto reconcile both social goals within the public health initiatives implemented by the spa treatmentand economic goals. An important partner of health resort enterprises is usually the national healthinsurer, which is the key service purchaser. This complexity also results from spa product creationprocess complexity that can be based on multiple therapeutic raw materials that depend on health resortlocalization (mineral water, brines, thermal springs, peat, seawater, salt, and therapeutic properties ofthe climate). The complexity of spa products is enhanced by its mixed service nature, covering bothtreatment and tourist services, as well as hotels, transport, catering, and even cosmetic services.
4.1. Using the Business Model and Characteristics of Selected Model Elements
The empirical studies allowed us to not only to assess the key relations with customers and partnersin the environment and recipients’ segments, but also the usability of business models associated withthe forces of influence of the environment.
The observations made during indepth interviews with health resort enterprise managers indicatedthat the managers of 5 out of the 17 studied spa enterprises declared that they know and use businessmodels when running their health resort business. However, when the research was deepenedin this scope, it turned out that the actual knowledge of business models was scarce and, in general,it referred to their abstract understanding, but without textual or graphic representation, of linkedmodel architecture structures or services that the enterprise was offering. Nonetheless, every thirdmanager taking part in the study had a description concerning particular elements of the businessbeing carried out. In general, the components that underwent modeling were key activities, marketsegments, communication channels, and customer relations. However, no concise characteristics ofbusiness model components were observed; for example, in the form of a detailed description of valueproposals for the customer.
The interviews carried out in health resort enterprises proved that, currently, three main segmentsof recipients of spa services can be identified. Managers of health resort facilities named primarily:
• the segment of institutional recipients (contract);• the segment of individual recipients (commercial);• the segment of business recipients.
The first—segment of institutional recipients (also known as contract recipients)—is a group of leadinghealth and social insurers, including National Health Fund (NFZ), Social Insurance Institution (ZUS),Farmers’ Social Security Fund (KRUS), and State Fund for Rehabilitation of People with Disabilities
8

Sustainability 2020, 12, 4941
(PFRON). These insurers sign contracts for health resort services. Beneficiaries of such servicesare persons insured by these funds, who, once such a need is requested and justified by a generalpractitioner and then by a balneologist, receive such services in a specified order. A characteristicfeature of this market segment is the fact that a direct recipient of health resort services is not the directpayer of the acquired services. It means that the institutional recipient, when acquiring the package ofhealth resort services, does not benefit from it but becomes a holder of such a service.
As it results from the interviews carried out on health resort facilities, from the perspective ofhealth resorts, contracts with insurers are characterized by a low level of profitability due to the adoptedcontracting criteria. In general, what is decisive is the low price of services, which determines the lowattractiveness of stay and limited selection of offered natural therapy treatments. However, the lowprofitability of contracts does not limit the willingness to win them as, in general, revenues generatedthanks to these contracts cover the day-to-day operating costs and ensure stability and possibility ofcarrying out business activity in other sectors. The source of additional revenue is servicing the secondsegment of health resort service recipients, being the individual recipients. This is a segment of patientsthat pay for the stay in the health resort themselves.
The research also indicated that contract and individual recipient groups are key market segmentsof Polish spa enterprises. Contract patients constitute, on average, 69.9% ± 13.5% of servicedbeneficiaries, 23.2% ± 11.9% are national individual patients, and 7.5% ± 7.9% are foreign patients(due to the fact that they pay for their stay themselves, they are classified as individual customers).
Some health resort enterprises generate the greatest profitability from the segment of businessrecipients. These stays, however, are incidental. This is the most complex segment as it covers stays ofvarying nature—from corporate team building and recreational trips for employees of a particularfacility to industry conferences and special tourist or sports events.
The most important sources of revenue of health resort enterprises are the revenue on hotel activity(accommodation) and treatment services in the form of balneology and physical medicine treatments.Next, categories of revenue cover gastronomy and sale of resources, being at the enterprise’s disposal,and then the rental of the premises. The revenues from spa and wellness services and activities ofthe health resort clinic come next. This structure of revenue sources indicates how important it is for aspa company to maintain lasting relationships with clients in the individual market segments.
Maintaining good relations with loyal customers is one of the basic tasks of every entrepreneur,as it is the level of these relations that quite often decides the profitability and survival of the enterpriseon the market. This is also the case for health resorts, although not every patient is treated the same.This results from the fact that contract patients cannot influence the price of offered services (includingthe service quality) as the direct payer of the benefits is the insurer (who is, in general, guided bythe price criterion). Since the return of the contract patient to the facility also does not depend on them,the relations between the personnel and the contract patients are of lesser importance for the serviceproviders in the enterprise than the relations with individual and business customers.
Segments of individual and business customers are the target ones in terms of building positiverelations, as this relation should result in the return of the customer to the facility, or at least in positivefeedback on the received services via word-of-mouth marketing among potential patients, carried outby the current patients.
The analysis of health resort enterprise activities indicated that the main partners of health resortenterprises are entities, the cooperation with which provides the enterprise with value to capture.The state health and social insurers are of greatest importance, as they make it possible for health resortfacilities to make profits on contract implementation. Travel agencies also benefit from individualcustomers traveling to reach the health resort enterprises.
Just as important as a partner is the spa commune, meaning the self-government administeringthe health resort, which is responsible for the maintenance of health resort status and caring forthe quality of health resort assets (e.g., parks, pump rooms, graduation towers). The communeauthorities influence the attractiveness of the health resort as a place of health resort treatment
9

Sustainability 2020, 12, 4941
and an area of tourist attractions, which is also important for the perception of the health resort offerand the reception of the whole treatment. It is such an important partner that its importance exceedsthe importance of key suppliers.
The role of key partners is also played by the suppliers of natural resources, competitors,with whom they cooperate on the basis of competition, outsourcing companies, and advertisingagencies. In one facility, it was stated that volunteers are also important partners.
4.2. The Four-Factor Approach to Design Space Analysis of Business Model
Using the four-factor approach to design space analysis of A. Osterwalder and Y. Pigneur [3],in the analysis of the health resort enterprise environment, the following forces were subject toassessment: (1) forces influencing the market, (2) forces present in the industry, (3) the most importanttrends, and (4) general economic forces (Figure 1).
Figure 1. Environmental impact forces on the business model of a spa enterprise. Source: own study.
4.2.1. Key Trends of Health Resort Market
The first group of factors of the environment that influences health resort enterprises, whichwill be subject to characterization, are key market trends, within which the market segments,needs and expectations, market problems, changes costs, and revenue attractiveness were identified.
10

Sustainability 2020, 12, 4941
New trends that emerged in the health resort market are the factors that have allowed for the rebirthof health resort business activity in the past two decades. Nevertheless, this category is also associatedwith problematic factors for the whole community.
In this category, several main problems can be named. One of them is demographic changes,especially the aging of society and the associated low fertility rates. It is an extremely crucial factorthat influences the offer of Polish spas. Statistics indicate that Poland has one of the lowest fertilityrates (1.3) [49]. It also means that the natural generation renewal cannot be observed and that Polishsociety, or rather European society, is aging at a fast rate. There are a growing number of peopleof a postworking age, as compared with the number of people of working and preworking ages.These changes also result in greater demand for services associated with the needs requested bythe segment of the elderly. These are mostly services associated with health and physical conditions,as well as all forms of spending free time with people of similar characteristics (e.g., seniors, widowersand widows, lonely people).
The influence of the named changes on the market of health resort services is significant as these areseniors who are the main group of recipients of these services, and the forecasted increase in the numberof elderly should translate into the increase of the number of beds available in health resorts [50].It is not, however, obvious, as the example of privatization of multiple health resorts indicates thatpolitical activity may squander the development opportunity of a promising market.
Nevertheless, it must be remembered that, along with the aging of Polish society, the changeof trends concerning the care of one’s body among younger generations must be noted. Therefore,the growth rate for the demand for health services can be greater than the growth of the number ofelderly in society.
The second factor is the social and cultural changes that, in the context of public health, take onthe characteristics of a healthy lifestyle trend. A manifestation of such attitudes is the more and morefrequent rejection of mass products and looking for those created for individual needs. More and moreoften, it is not the price that is the basic criterion when it comes to making a decision to buy therapeuticgoods and services, but the effectiveness and durability of the therapy effect. The increase in societyrevenues has made it possible to increase the standard of living of the poorest people. Along withgrowing revenues, the demand for services meeting higher-order needs also increases. The therapeutictreatment, although it refers to human health, is not a so-called bare necessity. It is a complementationof hospitalization, therapy carried out by general practitioner or specialist, and sometimes it has anentirely prophylactic character, as a manner of health prevention.
The healthy lifestyle trend is also manifested in the growing popularity of sports facilitiesand initiatives on the side of local self-government to build open-air gyms financed by way ofparticipatory budgets. What can also be observed is the growing number of spa and wellnesscenters (especially in health resorts), as well as shops with so-called organic food. More and moreoften, consumers are choosing more expensive products of higher quality that better meetthe demand of society.
Another factor is economic changes linked with the marketization of health resort businessactivity and changes in ownership. The reform of state health care facilities, including health resortfacilities, carried out in Poland in the 1990s, resulted in a radical change in the situation of theseentities. State health resort enterprises, so far fully financed from the state budget, were facedwith the necessity of independent fund-raising to finance their activity. The health resort serviceswere still financed from social funds but were acquired on the basis of tenders, where the criterionwas the lowest price. This resulted in a decrease in the quality of health resort services (the qualityof accommodation, catering) and, at the same time, limited the availability of treatment financed bythe state. This phenomenon resulted in a new segment of recipients of health resort services, beingpatients agreeing to undergo fully-paid therapy.
The ownership changes mentioned before, which took place in the years 2005–2016 in the health resortsector, resulted in the almost complete resale of state health resort companies. Part of the sold enterprises
11

Sustainability 2020, 12, 4941
became the property of other state companies, becoming their additional activity. As a consequence ofthe marketization of health resort enterprises, the willingness to implement social goals decreased foreconomic goals, as currently in health resort facilities, it is more profitable to accommodate patients whopay for their stay themselves than patients referred for therapy by the insurers.
Another factor that influences the business relations model in health resorts is health programsfinanced by the local government units and government, as well as government policy associatedwith the preventive medicine of Poles. All activities promoting a healthy lifestyle can raise awarenesson preventive medicine and reduce the possibility of premature death. Contact with nature in anatural environment and staying away from work and everyday life is one of the best ways to combatmodern-age diseases.
One of the most important influencing factors is the observed trends of biological and spiritualrenewal (spa and wellness). More and more often, offering therapy that combines a stay at a spa has aspecific mental impact that can be observed. These are services covering complex activities in the scopeof individual needs of the patient, not only in the sphere of treatment but also in the sphere of relaxationdirected towards psycho–physical balance. Rest in a place that fosters relaxation is complementedwith cosmetic services, rehabilitation, and relaxation classes (especially relaxation techniques havingtheir sources in Eastern cultures).
The influence of these trends on the model of mutual relations between the entities of this sectorcan be linked with the necessity to propose additional offers in health resort enterprises in the scopeof services improving the mental state of the patients (spiritual exercises, relaxation techniques,and cosmetic services). Even though these are not services directly linked with health resort treatment,it is perhaps worth considering the so-called hybrid therapies complementing traditional health resorttherapy, with services regulating psychological and physical balance.
4.2.2. Forces of the Health Resort Industry
In the case of forces of the health resort industry, an important element influencing the relationsin health resort enterprises is the influence of state health and social insurers, meaning the NationalHealth Fund (NFZ), the Social Insurance Institution (ZUS), the Farmers’ Social Security Fund (KRUS),and the State Fund for Rehabilitation of People with Disabilities (PFRON). The strength of theirinfluence results from their role as an administrator of funds, having their source in the state budget.These are, in general, the main recipients of health resort services in Polish health resorts. They playthe role of a payer for the health resort services on behalf of the patient, as the contributions paid bythe patient to the state budget are administered by the insurers who, when the need to use the healthresort therapy arises, cover the costs of the patient’s stay in part or in whole.
It can, therefore, be stated that even though state insurers are not the direct beneficiaries of healthresort services, often they act as a payer and contractor, ordering the benefits by being in direct contactwith health resort enterprises. It is worth emphasizing that the maintenance of traditional balneologyand rehabilitation medicine is possible mainly thanks to the contracts signed with state insurers, as this isstill the main source of financing of natural therapy treatments and stays in spas and spa hospitals.
Another group of key contractors of health resort enterprises is the suppliers of natural medicalraw materials and the medical employees responsible for therapy at the facility. It must be stated thatboth the suppliers and medical services can form a part of the health resort facility, yet in the majorityof cases, these are separate economic entities, with whom constant cooperation is concluded. Theseentities, for example, deliver peat, brines, and mineral waters or provide specific therapeutic services(for example, physical exercises in the pool). As such, they play the role of one of the key partners ofthe health resort enterprise.
Another factor that influences the industry forces is the spa commune and its administration.This results from the fact that, in Polish law, a health resort is a territorial area being administeredby local authorities. This is the spa commune that submits the request to the state to be grantedthe status of a health resort, as well as creating and financing the health resort survey that is the basis
12

Sustainability 2020, 12, 4941
of the request to be granted such a status. The spa commune is also responsible for determiningand supervising the health resort spheres, taking care of health resort assets (health resort park,graduation towers, pump rooms), and collecting local tax from the guests coming to the healthresort (tourists and patients). The spa commune administration is responsible for many controland coordination obligations, associated with the implementation of the provisions of the Act of28 July 2005, on health resort treatment, health resorts and areas of health resort protection, and spacommunes (Journal of Laws 2005, no. 167, item 1399 [6]).
Influence on the health resort sector is also associated with the presence of health resort competitors.These are not only entities providing substitution services, but also direct competition in the industry,meaning other health resort facilities functioning in the same or neighboring health resort.
Even though the approach to the described model is universal—applying, in general, to healthresort enterprises and not to a specific enterprise—one must also take into account this competitivesurrounding. The entities rendering the same or similar services in the same or neighboring area canundertake varied forms of cooperation (cooperation, competition) or focus on their own specializationand attempt to differentiate themself from the competition.
In some health resorts, it can be noticed that one health resort or a complex of health resorts withone management dominates, and, in some cases, the market is divided between scarce entities of asimilar influence. There are also such health resorts areas where only one health resort is present(that does not have a direct competition). The influence of the competition on the business model of aspecific entity in each of these cases will be different and must be analyzed separately.
One of the substitution competitors is facilities and centers offering spa and wellness services,meaning services within the health and wellness-oriented stays. These facilities aim to integratethe physical, psychological, and spiritual spheres of a person using these services in order to achieve abalance in the natural and social environments [51].
Due to the implemented business activity profile, these facilities do not use health resort therapy(balneology and rehabilitation) and more often reach for unconventional therapeutic methods, in general,complementing the health resort offer.
A direct competitor of the health resort facilities is also the tourist facilities located in the healthresort as they render similar services as the health resort enterprises. They do not have a naturaltherapy base, but they use the available therapy services with the cooperation of the health resort.
4.2.3. Forces of the Health Resort Market
The health resort market, being a part of a healthcare market, has varied forces of influence onthe business model associated with segments of recipients and the needs voiced by them. The healthresort market is based on the need to restore or maintain the health of the patients, but its main partsare also nonmedical services rendered for the guests staying in the health resorts for various specificpurposes. These services benefit the health and recreational (tourist) objectives, as well those associatedwith the specific specialization of the health resort product.
One of the needs voiced in health resorts and spa and wellness facilities is the need for hybridtherapy (covering with its scope the body and soul). This therapy has already been mentioned whendiscussing the present therapeutic trends. It is a form of health resort product that combines therapyinfluencing the body with treatments referring to the mental and spiritual states of the person visitingthe facility. Therapeutic treatments concerning the body are mostly rehabilitation and balneology.Treatments concerning the mental and spiritual states can cover many forms of more or less intensiveinfluence (e.g., visits to salt grottos, consultation or psychotherapy, meditation exercises, relaxationtechniques, and prayers).
Some needs of the patients result from their desire to live their lives in good psycho–physicalconditions. Thus, their needs are not based on the current situation, but rather take into considerationthe distant future. Therefore, they have a preventative character, with reference to old age. Other needsresult from the desire to extend the health resort therapy at home by continuing some therapeutic
13
Sustainability 2020, 12, 4941
methods. It is strictly associated with another task of the health resort therapy, where, apart fromtreatments, they should provide health education.
All the mentioned human needs are supported by the philosophy that states that human health isthe most precious physical good that a man can have and that it is not constant. Therefore, it requirescare in order to be maintained as long as possible. Along with the needs that emerge on the healthresort market, it is also worth attempting to identify basic market segments. Apart from the alreadymentioned division of recipients (institutional, individual, and business), other divisions can also beidentified. They most often result from the age criteria, dividing recipients of services into seniors(65+) and other patients (younger than 65 years old). Still, this division, although necessary, is alsoinsufficient, as, within the identified age groups, subgroups with varied characteristics can be named.Taking into account the changes in the offer directed towards younger market segments, the agecriterion should be made more specific. It is, therefore, proposed to distinguish the recipients ofhealth resort services, also taking into account the typology criterion, which is associated, for example,with the manner of how the treatment is financed, what the objective of the stay is, and if the patientneeds to make use of specialist programs.
The first criterion of segmentation should be the age of patients (for example, 65 +) as, in the timesof aging society, this group of recipients will significantly increase the market potential. However,when it comes to the remaining part of the society (up to the age of 65), it is worth identifying additionalsegments of specific needs. One such market segment is, undoubtedly, the segment of childrenand youth (up to the age of 18), for whom special offers and even health resorts’ profiles are prepared(an example of a children’s health resort is Rabka Zdrój). Another age segment consists of patientsover 40 years old, who, during and after their intensive career or as a result of everyday hardships, feelthe need to rest in a place where one can regenerate.
One of the basic methods of dividing patients, apart from age, is the already described divisioninto individual patients (who pay for the stay themselves) and contract patients (institutional ones),meaning beneficiaries of health resort treatments paid by the insurer. A subgroup of patients thatpay for their stay themselves, although less numerous than the group of contract patients, is the mostprofitable group. This group encompasses foreign patients. What is characteristic for this group ofrecipients is the fact that they are the decision-makers when it comes to the place, time, and durationof the treatment. This is not the case for the contract subgroup, which goes to the place of treatmentindicated by the insurer and balneologist for a specific period (21 days) and at the time dictated bythe insurer (in general, taking into account the queue managed by the insurer).
Another division is focused on the segment of tourists, who are not accommodatedin the spas and spa hospitals, but elsewhere (guest houses, hotels, family), but they use the treatmentsoffered by the natural therapy facility under the supervision of balneologists. Such a stay can coverboth the treatments financed by the health insurer (within outpatient treatment), as well as treatmentsfinanced independently by their beneficiary. This group is neither subject to the health resort regimenor to medical and nurses’ supervision in the place of accommodation.
It is worth mentioning that there are two other main segments of recipients. First is the segmentof women using beauty and relaxation treatments. In this case, the health resort therapy serves mostlytreatments of cosmetic and relaxation purposes and, by the way, also health purposes. There is noinconsistency with the objective of health resort function, as many treatments offered by natural therapyfacilities are also treatments not only with health properties but also influencing body care (pearl baths,brine baths).
Another group of recipients is the segment concerning the needs of businessmen, both in the aspectof entrepreneurs, managers, as well as authorities, who, burdened with stress, feel the need for antistresstherapy. In this segment, employees can also be found, where, as a reward for their work, they are sentto relax in a health resort.
One can name many other segments of the health resort market of lesser importance and influenceon the business model. These can be individual or group recipients for whom a special offer
14

Sustainability 2020, 12, 4941
was prepared, for example, a stay for mental support groups within health resort therapy (for warveterans, pregnant women, mothers with children) or training camps for biological renewal.
4.2.4. General Economic Forces
The influence of the forces discussed so far (industry, market, and trends) can be complementedwith general economic influence concerning the remaining aspects of the environment. In this case,factors and phenomena that can influence the business model structure were taken into account.One such factor is undoubtedly the HR situation in healthcare and, especially, the lack of specialistdoctors [52]. The lack of necessary medical staff can decrease the quality of services and, in some cases,even limit the ability to render health resort services. In a spa business at a health resort, it is necessaryto have specialization in balneology and rehabilitation.
In addition, worth noticing is the phenomenon of health resort treatment regress globally. There isa limited number of state health care systems that consider health resort treatment to be an integralpart of it (as is the case in Poland [6]). In the majority of countries, traditional balneology treatmentsare often an element complementing the stay in spa cities and facilities and even on mobile healthresorts (ships) [53]. This is not the case in Europe, where traditional health resort treatment, based onminerals and health properties of the climate, is still developing [54], expanding the scope of benefits.
An important factor is the development of health resort infrastructure and nonhealth resortinfrastructure (communication, transport, buildings). It concerns the availability of health resortservices, which are specific services offered only in health resorts, that need to be accessed individuallyto make use of the therapy. This is a factor that has both positive and negative influences on the healthresorts: the development of infrastructure positively influences the business, but it is not alwaysbeneficial for the natural environment. At the same time, quite often, this factor becomes an obstacleassociated with the excess of infrastructure and excess of critical levels of capacity and tourist absorptionof the spa area, after which health resort degradation and the degradation of tourist and health functionstake place [55].
The increase of revenues, especially in the group of the poorest, opens new possibilities forthe health resorts. These are health resorts that are often a place of relaxation and treatment forthose with the lowest income (retirement pension and pension holders, unemployed), as they canmake use of accommodation that is financed from public funds. It is also quite often a challenge,as this segment is often not aware of the possibility of making use of the, so far, unattainable healthbenefits and holiday services. Additional revenues also mean the extension of the scope and numberof communication channels with potential patients (for example, the Internet). It undoubtedly has aninfluence on business processes, especially in the scope of segments, channels, and streams of revenue.
The last factor of influence on health resort activity is the law that governs the functioning ofhealth resorts and, in general, the functioning of tourist enterprises and areas. This is, however, an issuethat varies depending on a country.
The performed analysis of health resort enterprises and their environment has made itpossible to characterize the mechanisms and business relations concerning the health resort sector.The complementation of the analyses is the graphic model of business relations in the health resortenvironment. In the scope of relations of the first type, where the cooperation model is present,being about entities that complement one another, the business relations model was presentedin the form developed by the Board of Innovation [16]. It can be seen in Figure 2.
15

Sustainability 2020, 12, 4941
Figure 2. Model of health resort enterprise relations in its environment. Source: own study.
The relations shown in Figure 2 are based on the business objectives of particular entities,but it is also worth indicating their links with the objectives of sustainable tourism. In modern times,it becomes necessary to develop sustainable policy in the scope of implementation of sustainabledevelopment rules. In the case of health resorts, these rules should be defined separately for internalrelations of business model elements and separately for external relations focusing on local cooperation.The internal sustainable policy should take into account as criteria proposed by the Global SustainableTourism Council (GSTC) [5] in the scope of proecological behaviors, in particular, concerning economicuse of natural resources (both used for health resort treatment and for other purposes) and reductionof pollution (gas emission, transport, water, and electric energy), as well as combating the resultsof overtourism, overpopulation, and excess infrastructure. The internal sustainable policy shouldalso cover the education of behaviors that protect the natural environment and local culture, directedtowards the recipients of health resort services. It is one of the missions of socioeconomic entities,carried out to increase the responsibility for the health resort and cultural resources of the communebeing visited, and for the place where the patient functions every day.
The external sustainable policy should be based on providing information on the implemented practiceswithin the internal sustainable policy, encouraging people to undertake and maintain proecological behaviorsamong suppliers and contractors, and even among competitors.
16

Sustainability 2020, 12, 4941
During field research, carried out in Polish health resorts, what was also identified werethe interorganizational networks of the second type, where the entities combine forces within ajoint effort and resource sharing in order to achieve a common goal. Several such networks wereidentified among Polish health resort enterprises. The greatest network is composed of several healthresorts named Polska Grupa Uzdrowisk (PGU) (Poland, Wrocław, 2-8 W. Sikorskiego Street) [56]. It is acompany established on the basis of business relations of five health resort enterprises: UzdrowiskoCieplice Grupa PGU, Uzdrowisko Połczyn Grupa PGU, Uzdrowisko Swieradów-Czerniawa GrupaPGU, Uzdrowiska Kłodzkie Grupa PGU, and Interferie Medical Spa. The owner of this network isKGHM Polska Miedz I Fundusz Inwestycyjny Zamkniety Aktywów Niepublicznych (First ClosedInvestment Fund of Non-Public Assets) (Poland, Lublin, 48 M. Skodowskiej-Curie Street), whichfocuses its activity on protecting health in health resorts and on promoting leisure activity. Accordingto the information of the owner of KGHM TFI, the long-term strategy of the development of PGU [56],adopted at the beginning of 2015, resulted in an increase in the financial results of health resortcompanies belonging to PGU. This is due to the adopted investment policy that assumes a constantincrease of hotel infrastructure standard and the standard of treatment equipment, as well as due tothe development policy associated with extending the institutional contracts and effective winning ofcustomers from the country and abroad, who pay for their stays themselves.
The interorganizational network of this type is based on slightly different relations than the onespresent in Figure 2. Therefore, it will be a subject for further studies. This is also an area that the authorconsiders to be a base for further analyses, this time of an interorganizational nature, based on the rulesof competition of competitors functioning in separate territories.
5. Summary
Research conducted with the managers of the largest spa tourism facilities in Poland has shownthat business relationships are mainly built there with three groups of entities. The first group consistsof clients from three market segments with different impacts on corporate income. These relationshipsdepend on whether the recipient is also a payer of spa services or only the beneficiary of servicesfinanced by the insurer. Secondly, relationships are built with the closest contractors (e.g., suppliers ofmedicinal raw materials, centers that perform spa treatments, or catering outlets). The third entity tobuild relationships with is local government units that affect the perception of the spa area by tourists;in crisis situations, they become the main disposer of spa treatment facilities.
It is worth noting that the environment of health resorts is characterized by multiple factorsinfluencing the structural elements of their business models and relations taking place in theseenvironments. It is, in particular, linked with the presented social influences in the form ofchanging expectations of recipients of health resort services, the trend of healthy lifestyles, relaxation,and destressing, as well as the influence of competition and insurers and even changes taking placein the economy. Each of the discussed factors influences enterprise activity, even though the force ofinfluence may differ. The analysis of mutual relations of health resort enterprises and the interdependententities makes it possible to order the processes and to modify the mutual relations in a situationwhen it is necessary to adapt to changes in the environment. It can, therefore, increase the abilityof the enterprise to benefit from changes taking place in the environment and to flexibly introducechanges to its function in relation to the environment.
The considerations concerning the forces of influence of the health resort environment and elementscomprising health resort enterprise business models are characteristic of the business relations modelon this market. An important issue resulting from the business relations presented here is the separationof sustainable policy that covers the introduction and maintenance of proecological and proculturalactivities in the health resort area. The author hopes that the health resort enterprises will adoptthe sustainable business and natural environment policies for mutual benefits and that they willencourage such practices among their contractors and recipients.
17

Sustainability 2020, 12, 4941
It should also be admitted that due to the complexity of the research problem, the weakness ofthe research is the lack of possibility to develop precise guidelines for spa companies. Each enterpriseshould take into account individual assumptions for modeling relations with the environmentand indicate which business relations are key from its own perspective. Individual criteria for assessingmarket relations will be an important element of the strategy of each enterprise.
It is worth considering what these criteria will be. Economic perturbations and the crisis associatedwith the spread of the SARS-CoV-2 virus at the beginning of 2020 [57–59] have shown how importantrelationships between cooperating companies in the same market are. Entrepreneurs have recognizedthat the sustainability of mutual relations may be the only chance to survive the global crisis, especiallyin tourism.
This view of the research problem undertaken in the article suggests that intrasectoral relationshipsshould also be based on building mutual trust, especially in crisis situations. The business models ofspa companies should develop relationships with clients and entities with whom they cooperate onthe market, but also with the state, through cooperation with local government units. An eloquentexample is the situation during the COVID-19 pandemic, when all Polish spa tourism enterprisesbecame a reserved resource in the event of overcrowding of hospitals. Despite the dismissal of the threatof overcrowding in hospitals where coronavirus patients were treated, places in Polish spa facilitieswere used for health prevention and quarantined persons. It seems that such practices in the futuremay be a good solution for maintaining health safety and should be a topic more often undertakenin future research.
Funding: This research received funding from the National Science Center in Poland.
Acknowledgments: This paper was published as part of the research project “A business model for health resortenterprises” No. 2017/25/B/HS4/00301, supervised and financed by the National Science Center in Poland and as partof statutory research ROZ 1: 13/010/BK_20/0042 at the Silesian University of Technology, Faculty of Organizationand Management.
Conflicts of Interest: The author declares no conflict of interest. The funders had no role in the design of the study;in the collection, analyses, or interpretation of data; in the writing of the manuscript, or in the decision to publishthe results.
References
1. Butler, R.W.; Szromek, A.R. Incorporating the Value Proposition for Society with Business Models of HealthTourism Enterprises. Sustainability 2019, 11, 6711. [CrossRef]
2. Khair, Q.; Saeed, M.M. Different ways of synergistic effects of human resource management (HRM) practiceson organizational performance: A method of 2 + 2 = 5. Afr. J. Bus. Manag. 2011, 5, 8610–8616.
3. Osterwalder, A.; Pigneur, Y. Business Model Generation: A Handbook for Visionaries, Game Changers,and Challengers, Paperback; John Wiley and Sons: Hoboken, NJ, USA, 2010; pp. 204–214.
4. Lichtarski, J. Współpraca przedsiebiorstwa z innymi podmiotami gospodarczymi. In Podstawy Nauki oPrzedsiebiorstwie; Lichtarski, J., Ed.; AE we Wrocławiu: Wrocław, Poland, 2007; pp. 420–421.
5. GSTC, Global Sustainable Tourism Cuncil. GSTC Criteria for Hotels. GSTC Criteria for Tour Operators.GSTC Criteria for Destinations. 2019. Available online: http://www.gstcouncil.org/gstc-criteria/ (accessed on1 August 2019).
6. Journal of Laws, The Act of 28 July 2005 on spa treatment, spas and spa protection areas, and on spamunicipalities (Dz.U. 2005 r. Nr 167, poz. 1399).
7. Magretta, J. Why Business Models Matter? Harvard Business Review, 1 May 2002; 86–92.8. Battistella, C.; Toni, A.; Zan, G.; Pessot, E. Cultivating business model agility through focused capabilities:
Amultiple case study. J. Bus. Res. 2017, 73, 65–82. [CrossRef]9. Wit, B. Ekologistyka w Systemie Zarzadzania Odpadami Niebezpiecznymi; Towarzystwo Naukowe Organizacji i
Kierowania. Stowarzyszenie Wyzszej Uzytecznosci Dom Organizatora: Torun, Poland, 2016; p. 138.10. Oskam, I.; Bossink, B.; Man, A.P. The interaction between network ties and business modeling: Case studies
of sustainability-oriented innovations. J. Clean. Prod. 2018, 177, 555–566. [CrossRef]
18

Sustainability 2020, 12, 4941
11. Tong, X.; Tao, D.; Lifset, R. Varieties of business models for post-consumer recycling in China. J. Clean. Prod.2018, 170, 665–673. [CrossRef]
12. Rossignoli, F.; Lionzo, A. Network impact on business models for sustainability: Case study in the energysector. J. Clean. Prod. 2018, 182, 694–704. [CrossRef]
13. Teece, D. Business models and dynamic capabilities. Long Range Plan. 2017, 51, 40–49. [CrossRef]14. Foss, N.J.; Saebi, T. Business models and business model innovation: Between wicked and paradigmatic
problems. Long Range Plan. 2018, 51, 9–21. [CrossRef]15. Prendeville, S.; Bocken, N. Sustainable Business Models through Service Design. Procedia Manuf. 2017, 8,
292–299. [CrossRef]16. Board of Innovation, THE INNOVATION MATRIX; 15 Companies You Should Copy. Business Models
Visualized by @boardofinno; 50+ Business Models You Should Copy Today, Board of Innovation. Availableonline: www.boardofinnovation.com (accessed on 19 October 2018).
17. Obłój, K. Strategia Organizacji; PWE: Warszawa, Poland, 2001; p. 12.18. Nogalski, B. Modele biznesu jako narzedzia reorientacji strategicznej przedsiebiorstw. Master Bus. Adm.
2009, 17, 3–14.19. Porter, M. Strategia konkurencji. Metody analizy sektorów i konkurentów; PWE: Warszawa, Poland, 2000; p. 23.20. Penc, J. Decyzje i Zmiany w Organizacji; Difin: Warszawa, Poland, 2007; p. 72.21. Håkansson, H.; Ford, D. How should companies interact in business networks? J. Bus. Res. 2002, 55, 133–139.
[CrossRef]22. Hall, C.M. Rethinking collaboration and partnership: A public policy perspective. J. Sustain. Tour. 1999, 7,
274–289. [CrossRef]23. Hall, C.M.; Page, S.J. Progress in tourism management: From the geography of tourism to geographies of
tourism—A review. Tour. Manag. 2009, 30, 3–16. [CrossRef]24. Stabryłwa, A.; Wawak, S. Metody Badania i Modele Rozwoju Organizacji, Encyklopedia Zarzadzania; Mfiles.pl:
Kraków, Poland, 2012.25. Strategor. Zarzadzanie Firma. Strategie, Struktury, Decyzje, Tozsamosc; PWE: Warszawa, Poland, 1995; p. 392.26. Delporte-Vermeiren, D.; Vervest, P.; Van Heck, E. In search of margin for business networks: The European
patent o_ce. Eur. Manag. J. 2004, 22, 167–182. [CrossRef]27. Gomes-Cassers, B. Group versus group: How alliance networks compete. Harv. Bus. Rev. 1994, 72, 62–66.28. Czakon, W. Dynamika Wiezi Miedzyorganizacyjnych Przedsiebiorstwa; Uniwersytet Ekonomiczny w Katowicach:
Katowice, Poland, 2007; p. 163.29. Parvinen, P.; Lukkari, P. Changing Healthcare Networks—Orchestrating Needed but Impossible? 2007.
Available online: www.impgroup.org/uploads/papers/5922.pdf (accessed on 20 April 2017).30. Bryant, J. The Six Dilemmas of Collaboration. Interorganisational Relationships as Drama; John Wiley & Sons:
West Sussex, UK, 2003; pp. 187–207.31. Möller, K.; Svahn, S. Managing Strategic Nets: A Capability Perspective. Mark. Theory 2003, 3, 201–226.
[CrossRef]32. Kale, P.; Dyer, J.H.; Singh, H. Alliance capability, stock market response and long-term alliance success:
The role of the alliance function. Strat. Manag. J. 2002, 23, 747–767. [CrossRef]33. Powell, W.W.; Koput, K.W.; Smith-Doerr, L. Interorganizational collaboration and the locus of innovation:
Networks of learning in biotechnology. Adm. Sci. Q. 1996, 41, 116–145. [CrossRef]34. Klijn, E.H. Governance and Governance Networks in Europe. An Assessment of Ten Years of Research on
the Theme. Public Manag. Rev. 2008, 10, 505–525. [CrossRef]35. Perri, P.; Goodwin, N.; Peck, E.; Freeman, T. Managing Networks of Twenty-First Century Organizations;
Palgrave Macmillan: Hampshire, UK, 2006; pp. 31–32.36. Child, J.; Faulkner, D. Strategies of Co-operation. Managing Alliances, Networks and Joint Venture;
Oxford University Press: Oxford, UK, 1998; p. 120.37. Dryl, T. Organizacja sieciowa. In Koncepcje Zarzadzania. Podrecznik Akademicki; Czerska, M., Szpitter, A., Eds.;
C.H. Beck: Warszawa, Poland, 2010; p. 256.38. Stanczyk-Hugiet, E.; Sus, A. Konsekwencje przynaleznosci do sieci. In Sieci Miedzyorganizacyjne. Współczesne
Wyzwanie dla Teorii i Praktyki Zarzadzania; Niemczyk, J., Stanczyk-Hugiet, E., Jasinski, B., Eds.; C.H. Beck:Warszawa, Poland, 2012; pp. 92–94.
19

Sustainability 2020, 12, 4941
39. Sroka, W. Korzysci i zagrozenia uczestnictwa w sieci aliansów—Analiza porównawcza. Przeglad Organ.2010, 1, 29–30. [CrossRef]
40. Kjaer, A.M. Rzadzenie; Wyd. Sic!: Warszawa, Poland, 2007; p. 13.41. Niemczyk, J.; Stanczyk-Hugiet, E.; Jasinski, B. (Eds.) Sieci Miedzyorganizacyjne, Współczesne Wyzwanie dla
Teorii i Praktyki Zarzadzania; C.H. Beck: Warszawa, Poland, 2012; p. 181.42. Goldsmith, S.; Eggers, W.D. Governing by Network; Brooking Institution Press: Washington, DC, USA, 2004.43. Dredge, D. Policy networks and the local organization of tourism. Tour. Manag. 2006, 27, 269–280. [CrossRef]44. Dredge, D. Local tourism governance: A comparison of three network approaches. J. Sustain. Tour. 2010, 18,
7–28.45. Good Governance Advisory Group. Good Governance Guide: The Principles of Good Government within Local
Government; The Municipal Association of Victoria: Melbourne, Australia, 2004.46. Bell, S. “Appropriate” policy knowledge, and institutional and governance implications. Aust. J. Public Adm.
2004, 63, 22–28. [CrossRef]47. Halley, P. Transforming governance: Challenges of institutional adaptation and a new politics of space.
Eur. Plan. J. 2006, 14, 299–320. [CrossRef]48. White, L. Effective governance through complexity thinking and management science. Syst. Res. Behav. Sci.
2001, 18, 241–257. [CrossRef]49. Szromek, A.R. Changes in the management model of health care institutions in health resorts in the context
of social and economic changes in the years 1989–2018. Health Prim. Care 2018, 2. [CrossRef]50. Szromek, A.R. Działalnosc Turystyczno-Lecznicza Zakładów Lecznictwa Uzdrowiskowego. Transformacja Działalnosci
Przedsiebiorstw Uzdrowiskowych w Latach 1989–2010; Proksenia: Kraków, Poland, 2011; pp. 69–83.51. Myers, J.; Sweeney, T.; Witmer, J. The Wheel of Wellness counseling for wellness: A holistic model for
treatment planning. J. Couns. Dev. 2000, 78, 251–266. [CrossRef]52. Krajewski-Siuda, K.; Szromek, A.R.; Romaniuk, P. Emigration preferences and plans among medical students
in Poland. Hum. Resour. Health Springer 2011, 10, 8–12. [CrossRef]53. Spivack, S.E. Health spa development in the US: A burgeoning component of sport tourism. J. Vacat. Mark.
1998, 4, 65–77. [CrossRef]54. Somkeatkun, W.; Wongsurawat, W. Perceptions of the Spa Industry: An Importance Performance Analysis.
J. Qual. Assur. Hosp. Tour. 2017, 18, 416–436. [CrossRef]55. Butler, R.W. The Concept of the Tourism Area Cycle Evolution: Implications for Management of Resources.
Can. Geogr. 1980, 24, 5–12. [CrossRef]56. Polska Grupa Uzdrowisk. Polska Grupa Uzdrowisk w Trendzie Wzrostowym. Available online: http:
//tfi.kghm.pl/polska-grupa-uzdrowisk-w-trendzie-wzrostowym/ (accessed on 16 July 2018).57. Sigala, M. Tourism and COVID-19: Impacts and implications for advancing and resetting industry
and research. J. Bus. Res. 2020. [CrossRef]58. Naeen, M.; Che Suraya, Z. Religious tourism and mass religious gatherings—The potential link in the spread
of COVID-19. Current perspective and future implications. Travel Med. Infect. Dis. 2020, 101786. [CrossRef]59. Zenker, S.; Kock, F. The coronavirus pandemic—A critical discussion of a tourism research agenda.
Tour. Manag. 2020, 81, 104164. [CrossRef] [PubMed]
© 2020 by the author. Licensee MDPI, Basel, Switzerland. This article is an open accessarticle distributed under the terms and conditions of the Creative Commons Attribution(CC BY) license (http://creativecommons.org/licenses/by/4.0/).
20
sustainability
Article
Incorporating the Value Proposition for Society withBusiness Models of Health Tourism Enterprises
Richard W. Butler 1 and Adam R. Szromek 2,*
1 Department of Hospitality and Tourism Management, University of Strathclyde, 16 Richmond Street,Glasgow G1 1XQ, Scotland, UK; [email protected]
2 Department of Organization and Management, Institute of Economy and Informatics, Silesian University ofTechnology, Akademicka 2A, 44-100 Gliwice, Poland
* Correspondence: [email protected]; Tel.: +48-32-277-7336
Received: 12 November 2019; Accepted: 25 November 2019; Published: 27 November 2019
Abstract: This article discusses the need to expand the concept of the value proposition, in order thatthis business model component includes the value for a customer, the value captured by the enterprise,and the value for the community, as well as benefits for the natural environment. The objective ofthe article is to identify sustainable development components that have been proposed for touristenterprises in the research literature. The article proposes actions to complement existing touristenterprises business models in order to give them the characteristics of a sustainable businessmodel and to implement practices of value creation for the community. The research notes that thevalue captured by an enterprise determines the level of implementation of its economic objectivesresulting from the value creation for the customer and implementation of social objectives (includingpro-ecologic ones). The revenues of an enterprise depend, first of all, on meeting the expectations ofthe customer, meaning that they depend on the value proposition for the customer, and their volumewill allow researchers to determine the possibility of creating value for the community. The expectedtendency to create value for the community is argued to be proportional to the effectiveness ofcustomer value influence, less the value captured by the enterprise. After an initial review of relevantliterature, attention is focused on health tourism enterprises and how these principals can be appliedin that context.
Keywords: sustainability; health resorts; spa tourism; business model
1. Introduction
The 19th and 20th centuries brought about progress in the form of intense industrialization.Impressive inventions, achievements, and solutions in the field of technology were the result of industrialdevelopment, but inevitably, technological development resulted not only in increased amenities forhumanity, but also often impacted negatively upon the natural environment. This degradation hasbeen observed for decades, for example in the levels of pollution and rises in global temperature andhas raised social awareness of the consequences of industrialization and the costs the future generationswill have to bear.
Modern enterprises, often still based on the consumption of natural resources and thus interferingin the environment in an indirect way, need to participate in the process of restoring natural resources orat least undertaking activities that reduce any degradation. However, for such revitalization activitiesto be carried out consistently and effectively, they need to be included in the basic structure of businessprocesses. This argument applies equally to tourist enterprises and the article proceeds by reviewingthe sustainable development literature to identify key elements that need to become essential elementsin business models and processes.
Sustainability 2019, 11, 6711; doi:10.3390/su11236711 www.mdpi.com/journal/sustainability21

Sustainability 2019, 11, 6711
The above goal was achieved through theoretical and empirical research. The source of theelements of sustainable tourism proposed and discussed in the article include literature studies,documents of agencies working for sustainable development, and qualitative research of authors,carried out in the 17 largest spa tourism enterprises in Poland. The main contribution of the presentedresearch is to identify elements of sustainable tourism that are necessary in the current situation. Theproposed solutions have been formulated to support managers of spa enterprises, both for achievingtheir competitive advantage as well as for protecting the natural environment and the culture ofresidents of tourist destinations.
2. Literature Review
2.1. Health Tourism and Health Resort Enterprises in Poland
Goodrich and Goodrich [1] define health tourism as an attempt to attract tourists through touristfacilities or areas in order to provide them with above-standard services (i.e., healthcare and providingappropriate equipment). Thus, health tourism contains a composition of three elements: A trip awayfrom home, health as the main motivation for arrival, and a stay in holiday destinations (especially inspas) [2].
One of the forms of health tourism is tourism carried out in health resorts. Spa tourism is a stay ina spa, aimed at maintaining or improving the current state of health by isolating oneself from harmfulfactors of everyday life, and by physical and mental rest, using spa treatment methods and other formsof beneficial effects on health. In Poland and in many other European countries, health resorts arewhere therapeutic services (in the field of balneology and physical medicine) are provided as part of atourist stay. It is also a tourist form, which is closest to the idea of sustainable development, due to theclose relationship with the impact of the natural environment on tourists [3].
The history of health tourism organized in Poland had variable directions. In the second half ofthe 20th century, the predominant (and quite often the only) goal of health resort facilities was thesocial objective concerning the implementation of the state health promotion initiatives, which waspossible because the health resort services were fully financed by the state budget [3,4]. However,the economic transformation in 1989 (associated with the fall of communism in Eastern Europeancountries) led to the transformation of the state spa sector into private spa tourism companies [5].
These transformations, both in the national health system as well as changes in the ownershipstructure of health resort enterprises, made it necessary to change the way in which their activity wasperceived. Polish health resort enterprises became, first of all, profit-oriented entities and only laterbecame entities that worked to implement goals of implementing the state health policy [6].
In addition, Van Tubergen and Van Der Linden [7] and Erfurt-Cooper and Cooper [8] note that thecurrent spa activity goes beyond the use of bathing in thermal waters for therapeutic purposes. This isnoticeable in the spa tourism market in the form of various types of tourist and non-tourist services.The value for the costumer that a spa company provides is not only standard treatment and prophylaxis(massages, hydrotherapy, physical exercises, and fitness), but also personalized health and fitnessprograms, cosmetics and care treatments, hairdressing, and manicure and pedicure services. Thus, thevalue proposition for the customer is expanding, as well as the value captured by the company.
2.2. Overview of Business Model Concept
A business model is a characteristic of the business being described in the form of a story thatexplains how the enterprise works [9] and, at the same time, a description of relations betweencomponents in an organization that result in creation of value for the organization [10]. In manycases, the business model is a tool used to run the business [11]. The literature also describes thebusiness model as a conceptual tool that contains a set of elements and their relationships and allowsexpressing the business logic of a specific firm. [12]. At the same time, it is a description of values thatthe enterprise is able to provide to market segments, and a description of the organization, along with
22

Sustainability 2019, 11, 6711
network relations with partners to also create value. Teece [11] also sees it as a tool that can be used inpractice for the purpose of design or description of the architecture of the creation, supply, and valuecapturing mechanisms of a business. The core of the business model is in defining the way in whichthe enterprise captures value for customers, entices them to pay for this value, and converts payablesinto profits.
Prendeville and Bocken [13] also view a business model in terms of a tool, using it to orderbusiness transactions between customers, partners, and suppliers and the organization, and theirparticipation in the development and capturing of value.
Al.-Debei et al. [14] propose the business model as an abstract concept, where it is a textualor graphic representation of the interrelated structures of the model’s architecture prepared by theorganization, along with all the products and services that the organization has on offer and that areessential to achieving its aims.
One of the most comprehensive definitions was prepared by Wit [15], who states that the essence ofa business model is the visual depiction of an organization’s functioning logic, its elements, or venturesin the form of appropriately named, interlinked elements of a template that—once populated withcontent—ensure the logical understanding of the process of functioning, survival, and development ofthe organization.
The literature provides numerous other ways of defining business models, including thoselisted below:
• The CANVAS model [12], which takes into account nine interconnected and interacting businesscomponents that describe both the key processes and their interrelations.
• Cube business model [16–18] is a concept that establishes business model components in theform of a cube, selecting particular components in such a way to eliminate unnecessary ones andpromote the crucial ones; the value proposal is thus created on the basis of a value chain with keyand supporting functions
• Value network [19] is a methodology of modeling the business model that visualizes the businessactivities and sets of relations of the whole system from a dynamic perspective; it contains uniqueanalysis methods, as well as integrating with other modeling tools, dealing with elements such asprocesses, social networks analysis, and system dynamics;
• e3-value [20] is an interdisciplinary approach based on studying an innovative idea by a thoroughunderstanding of that idea and assessment of its potential profitability; this methodology uses anengineering approach with the use of terms and terminology sourced from economics, marketing,and axiology; it shows how to model business processes and to improve the business in complexvalue constellations of multiple entities that are common in e-commerce;
• Possession-ownership-availability (POA) [21] is a method used to model business processesfocusing on providing value appropriate for Enterprise Resource Planning (ERP) systemsand IT system designing; POA model defines specific roles in business process and describesvalue provision;
• Other alternative business model frameworks include lean startup (lean canvas) [22], four-factorSeizing the Whitespace by Johnson [23,24], a five-element template by Afuah [25] (VARIM—Value,Adaptability, Rareness, Inimitability, Monetization), a six-element template in the form of a circle(Business Model Institute) [26], six-factor Open Innovation by Chesbrough [27,28], six-elementtemplate by Seidenstricker, Scheuerle, Linder [29], six-element model of key values by McGrath [30],a seven-block template by Lindgren (Value proposition, Target users and customer, Value chain,Competences, Network, Relations(s), Value formula Profit formula [16,17], a 10-element template byDoleski [31] (Normative Framework, Value, Strategy, Customer, Market, Revenue, Enablers, Processes,Partners, Finance), a 13-element model of social business [32], and others.
The literature on this subject provides a varied division of the business model into specificcomponents and proposes a varied model architecture. It is impossible to provide one universal
23

Sustainability 2019, 11, 6711
division. The most popular concept of the business model division into components is the oneproposed by Osterwalder and Pigneur [12], who identified nine model components. Apart from valueproposition, it contains market segments, distribution channels, relationships with the customers,revenue streams, key resources, key activities, key partnership, and costs structure. It is worth notingthat one element that is found in almost all models is the proposed value, around which other modelcomponents are integrated. The value proposition is a major reason that customers prefer the offer of agiven company as well; it is a solution to problems of customers and an element ensuring satisfactionof their needs. In the marketing context, the value proposition can be compared with the core of touristproduct, meaning the core of the benefit that a tourist gains by using a specific tourist service [33]. Inthe scientific literature, the concept of customer value is identified with the concept of Porter’s valuechain [34]. However, this is not the only value generated by business activity, because the value capturedby the enterprise is also important for managers.
2.3. Business Models Used by Tourist Enterprises
The nature and presence of business models in tourist enterprises still seem to be insufficientlyresearched. Due to the recent increasing popularity of this concept, its essence is still being modifiedand developed. However, with the emergence of special versions of the models, their limitations mustbe taken into account. A review of the tourist literature reveals that research on business models wasalmost exclusively limited to specific types of tourist activities [35,36]. An example is the researchcarried out in spa tourism [37]. Their results are generally positive, as they noted that the use ofbusiness models in the analyzed enterprises was incidental and fragmentary, and that the knowledgein this field referred to abstract understanding of business models, without the ability to present theinterrelated architecture structures of the model with the use of text or graphics.
Another interesting scientific publication is the article by Reinhold et al. [38] on the subject of atypology of business models for destination management organizations. The authors identify fourdistinct ideal types of DMO (destination management organizations) business models (these are thedestination factory, destination service center, value orchestrator, and value enabler).
It is also worth paying attention to the important article Reinhold, Beritelli, and Grünig [39],in which the authors identify a minimal consensus and dominant approach to conceptualizing thebusiness model concept in tourism studies. The article reveals a strong preference for small-n casestudy research designs.
One of the key publications on sustainable business models is the article by Joyce and Paquin [40].They note (after Collins and Porras [41]) that for sustainability-oriented companies, creating socialvalue is likely a clear part of their mission. They present the triple-layer business model canvas tool,which contributes to sustainable business model research by providing a design tool, which structuressustainability issues in business model innovation. Their research extends the original business modelcanvas by adding two layers: An environmental layer based on a lifecycle perspective and a social layerbased on a stakeholder perspective. Boons and Lüdeke-Freund [42] find that research on sustainableinnovation has tended to neglect the way in which firms need to combine a value proposition, theorganization of the upstream and downstream value chain, and a financial model, in order to bringsustainability innovations to the market. They note that the current literature does not offer a generalconceptual definition of sustainable business models. Therefore, they sketch the outline of a researchagenda by formulating a number of guiding questions. Among them, they formulate a concept socialprofit equation and conclude, "sustainable business models enable social entrepreneurs to create socialvalue and maximize social profit; of significance is the business models’ ability to act as market devicethat helps in creating and further developing markets for innovations with a social purpose" (p. 17).
There is also a study on the value proposition in the form of a business model for cultural heritagetourist enterprises [43,44] and attempts to apply CANVAS with regard to entities operating in themarket of health tourism [35].
24

Sustainability 2019, 11, 6711
Also noteworthy is the template proposed by Threebility—Tools for Sustainable Innovation asThe Sustainable Business Model Canvas [45]. This template proposes an approach to the issue ofgenerated value through the following questions:
• Which problem do we solve and which value do we create?• What is the function and form of our product or service?• Can we solve our customers‘ problems more sustainably?• Can we transform sustainability into customer value?• Is ownership necessary or is the product as a service model applicable?• Can we extend the product life cycle? [45]
A majority of the analyzed research works focuses on particular components of business models,but only rarely focuses on the whole model. One can refer to the works of Bodenau [46], Cranmer,Jung, and Dieck [47], as well as Havemo [48] and Prebenseni Dahl [49], which have discussed the topicof the value proposition for a tourist.
In a related area, the work of Mantaguti and Mingotto [50] tackled the subject of relations withcustomers in the tourist market and Miguéns, Baggio, and Costa [51], as well as Inversini, Xiang, andFesenmaier [52] discussed customer relations in social media in the business context.
Diaconu and Dutu [53] also paid attention to the evolution of the hotel industry towards innovativebusiness models, while Langviniene and DaunoraviÞinjtì [54] listed a number of factors that need to betaken into account when creating a business model that would be successful in the hospitality industry.Overall, compared to the very extensive literature on the nature, structure, and application of businessmodels in general, the literature on business models used by tourism enterprises is still limited andvery few papers indeed deal specifically with sustainability issues in a tourism business model context.
2.4. Sustainable Business Models in Tourism
Threats generated by tourism, and in particular the burdens caused by overtourism, affect boththe area of tourist destinations and residents [55]. Since 2002, one can notice in the literature a specificset of business models [56]. These are sustainable business models, defined as a set of componentswhere the interactions between these components and the stakeholders create, provide, capture, andlist a sustainable value for many stakeholders [57]. It is, therefore, a recent development to includesustainable development principles in the company’s value logic and the logic of value creation by anenterprise [58,59]. Sustainable business models can be a source of competitive advantage and economicbenefits, by taking into account the sustainable value proposal in business model [60].
One of the key research works on this subject is an article by Nosratabadi et al. [55], who analyzedworks from various thematic areas, concluding, that since 2016, “Environmental Science (18.6%)”,“Business, Management, and Accounting (16.4%)”, “Social Science (14.4%)”, and “Engineering (12.3%)”are the fields in which the majority of uses of the concept of sustainable development were found.Analysis of works published in the years 2007–2018 reveals that the incorporation of sustainabledevelopment principles in business models is the topic discussed most often by researchers from theUS, Great Britain, and China, with American researchers discussing this issue twice as often as theBritish and Chinese.
Among the 14 thematic areas analyzed by Nosratabadi et al. [55] was the issue of the hospitalityindustry. They noticed that studies on the sustainable development elements in business models in thehospitality industry were in the initial stage. A majority of the analyzed research projects examinedthe level of sustainable development in hotels but stopped at the stage of current status diagnosis.No solutions for the further development of sustainable business models for this industry as a wholewere provided.
Research on business models, analyzed in the context of sustainable development, allowed theintroduction of the subject of transforming the enterprise business model into a sustainable one. In the
25

Sustainability 2019, 11, 6711
last decade, one can notice both research discussing this issue, as well as policy and strategy documentsof organizations that transform such solutions into specific proposals.
One such work is the article by Boons and Lüdeke-Freund [42], who identified four features thatlead to the introduction of sustainable development rules in the element of the business model.
One is the extension of the value proposition in the business model. The value propositionprovides measurable ecological and/or social values in concert with economic value (being based onsocio-economic dialogue concerning the balance of economic, ecological, and social needs) reflectingthe fact that such values are temporally and spatially determined).
The second feature relates to expanding the responsibility for the natural environment. The supplychain involves suppliers who take responsibility towards their own, as well as the focal company’sstakeholders. The company does not shift its own socio-ecological burdens to its suppliers, but activelyengages suppliers into sustainable supply chain management.
The third feature is cooperation with consumers, whereby the organization–customerinterface motivates customers to take responsibility for their consumption, as well as the focalcompany’s stakeholders.
The last feature is the division of costs and benefits resulting from the ecologic activity. Thefinancial model reflects an appropriate distribution of economic costs and benefits among actorsinvolved in the business model and accounts for the company’s ecological and social impacts.
The implementation of the above elements is often associated with obstacles. In the literature, onecan find many signs of such limitations. One example would be an attempt to influence the suppliersor to divide the financial burden of business changes [61].
Nosratabadi et al. [55] developed four approaches to designing a sustainable business model.These are:
• Designing a sustainable value proposition (values are achieved taking into account sustainabledevelopment practices);
• Designing sustainable value creation (value is achieved involving all stakeholders, including thecommunity and natural environment);
• Designing sustainable value delivering (value is also provided in a sustainable manner);• Generating sustainable partnership networks for creating and delivering such sustainable value,
which simultaneously can meet the social, environmental, and economic benefits.
This proposed approach to creating a sustainable business model requires the establishmentof numerous relationships. It applies not only to relations with customers, but also to creatingpartnerships with all involved stakeholders. Norris and West [62], and later Grefen [63], identifiedseveral market relations:
• B2C (Business-to-Customer), meaning a relation aimed at winning over individual customers byfocusing the relationship on the direct recipient.
• B2B (Business-to-Business), meaning focusing the relationship development in the enterprise onother enterprises by focusing on group recipients (including wholesalers, contract recipients, andstate recipients).
• B2A (Business-to-Administration), meaning using the transactions between the entrepreneurs andpublic administration bodies as a basis.
• C2B (Customer-to-Business), a relationship sometimes referred to as M-commerce (Mobile Commerce),in which the access to wireless devices is used, making it possible to carry out the transaction. Itis a relationship based on the opportunity to make purchase offers to which the manufacturerscan respond.
• C2C (Customer-to-Customer), meaning targeting the activities to the possibility of direct exchangeof goods between the consumers.
• C2A (Customer-to-Administration), a relation between consumers and public administration.
26

Sustainability 2019, 11, 6711
• P2P (Peer-to-Peer) is the use of Internet in such a way as to make the direct exchange of datapossible without the need to send them through the main server;
• B2R (Business-to-Reseller), is a relationship where the relational entities are entrepreneursand resellers;
• G2B and G2C, where the government is one of the parties to the relationships with entrepreneursand customers.
Creating relations in terms of a sustainable business model needs one more relation. This is a B2Srelation, meaning Business-to-Society, whereby society becomes the beneficiary of values generated bythe business, influencing the natural environment and the community. It is, therefore, an addition to theB2C relation, in which the beneficiary is the entity (individual customer) and not society. In practicalterms, the values would not be the results of the manufactured goods and services, but the benefits ofthe practiced rules, programs, and investments limiting the dysfunctional activities and/or abolishingthe degradation of natural resources. These would include all types of programs or campaigns forsustainable development in which the particular enterprise participates.
A very important statement in the discussion on the application of sustainable development rulesthat can be applied to tourism is the article by Siakwah, Musavengane, and Leonard [64], which is areference to the sustainable development goals (SDG) and tasks that the tourism can implement inthis context. The United Nations Development Program [65] promotes the sustainable developmentgoals (SDGs), which represent a universal call to action to end poverty, protect the planet, and ensurethat all people enjoy peace and prosperity. These 17 goals build on the successes of the millenniumdevelopment goals, while including new areas, such as climate change, economic inequality, innovation,sustainable consumption, peace, and justice.
One of these objectives can be implemented within health tourism, as its aim is to ensure healthylives and the promotion of wellbeing for all at all ages. As a consequence, good health and wellbeingcan help achieve sustainable livelihoods.
Another important source of sustainable activities is the Global Sustainable Tourism Council(GSTC) criteria [66], which include four pillars: Sustainable management, socioeconomic impacts,cultural impacts, and environmental impacts (including consumption of resources, reducing pollution,and conserving biodiversity and landscapes). The GSTC criteria, formulated separately for hotels,tour operators, and tourist destinations, were established on the basis of numerous pro-ecologicalactivities and experiences carried out in this context around the world, and take into account guidelinesand standards concerning sustainable tourism from every continent. It is impossible to cite them allhere, but it is appropriate to note that they were developed taking into account environmental, social,cultural, economic, quality, human rights, health, safety, risk, and crisis management issues and thatthey can support overall development.
The criteria are divided into four sections:
• Demonstrating effective sustainable management,• Maximizing social and economic benefits to the local community and minimizing negative impacts,• Maximizing benefits to cultural heritage and minimizing negative impacts,• Maximizing benefits to the environment and minimizing negative impacts.
They were developed to ensure common global understanding of “sustainable tourism” andrepresent a minimum level to which every tourist enterprise should strive. The criteria indicate whatneeds to be done in terms of the achievement of sustainable tourism, but not how to implement it.The performance indicators complement those criteria and allow the determination of the level ofimplementation of set goals. In Table 1, the solutions proposed by the Council for the GSTC HotelCriteria (Version 3, 21 December 2016) are presented.
27

Sustainability 2019, 11, 6711
Ta
ble
1.
Glo
balS
usta
inab
leTo
uris
mC
ounc
il(G
STC
)hot
elcr
iter
ia(V
ersi
on3,
21D
ecem
ber
2016
).
Dem
on
stra
teEff
ect
ive
Su
stain
ab
leM
an
ag
em
en
t
Maxim
ize
So
cial
an
dE
con
om
icB
en
efi
tsto
the
Lo
cal
Co
mm
un
ity
an
dM
inim
ize
Neg
ati
ve
Imp
act
s
Maxim
ize
Ben
efi
tsto
Cu
ltu
ral
Heri
tag
ean
dM
inim
ize
Neg
ati
ve
Imp
act
s
Maxim
ize
Ben
efi
tsto
the
En
vir
on
men
tan
dM
inim
ize
Neg
ati
ve
Imp
act
s
A1.
Su
stain
ab
ilit
ym
an
ag
em
en
tsy
stem
B1.
Co
mm
un
ity
sup
po
rtC
1.
Cu
ltu
ral
inte
ract
ion
sD
1.
Co
nse
rvin
gre
sou
rces
The
orga
niza
tion
has
impl
emen
ted
alo
ng-t
erm
sust
aina
bilit
ym
anag
emen
tsy
stem
that
issu
itab
leto
its
size
and
scop
e,ad
dres
ses
envi
ronm
enta
l,so
cial
,cu
ltur
al,e
cono
mic
,qua
lity,
hum
anri
ghts
,hea
lth,
safe
ty,r
isk,
and
cris
ism
anag
emen
tiss
ues
and
driv
esco
ntin
uous
impr
ovem
ent.
The
orga
niza
tion
acti
vely
supp
orts
init
iati
ves
for
loca
linf
rast
ruct
ure
and
soci
alco
mm
unit
yde
velo
pmen
t.Ex
ampl
esof
init
iati
ves
incl
ude
educ
atio
n,tr
aini
ng,h
ealt
han
dsa
nita
tion
and
proj
ects
whi
chad
dres
sth
eim
pact
sof
clim
ate
chan
ge.
The
orga
niza
tion
follo
ws
good
prac
tice
and
loca
llyag
reed
guid
ance
for
the
man
agem
enta
ndpr
omot
ion
ofvi
sits
toin
dige
nous
com
mun
itie
san
dcu
ltur
ally
orhi
stor
ical
lyse
nsit
ive
site
sin
orde
rto
min
imiz
ead
vers
eim
pact
san
dm
axim
ize
loca
lben
efits
and
visi
tor
fulfi
llmen
t.
The
crit
erio
nin
clud
es:
•En
viro
nmen
tally
pref
erab
lepu
rcha
sing
,•
Effici
entp
urch
asin
g,•
Ener
gyco
nser
vati
on,
•W
ater
cons
erva
tion
.
A2.
Leg
al
com
pli
an
ceB
2.
Lo
cal
em
plo
ym
en
tC
2.
Pro
tect
ing
cult
ura
lh
eri
tag
eD
2.
Red
uci
ng
po
llu
tio
n
The
orga
niza
tion
isin
com
plia
nce
wit
hal
lapp
licab
lelo
cal,
nati
onal
,and
inte
rnat
iona
lleg
isla
tion
and
regu
latio
nsin
clud
ing,
amon
got
hers
,hea
lth,
safe
ty,
labo
ran
den
viro
nmen
tala
spec
ts.
Loca
lres
iden
tsar
egi
ven
equa
lop
port
unit
ies
for
empl
oym
enta
ndad
vanc
emen
t,in
clud
ing
inm
anag
emen
tpos
itio
ns.
The
orga
niza
tion
cont
ribu
tes
toth
epr
otec
tion
,pre
serv
atio
nan
den
hanc
emen
tofl
ocal
prop
erti
es,s
ites
and
trad
itio
nsof
hist
oric
al,
arch
aeol
ogic
al,c
ultu
ral,
and
spir
itua
lsi
gnifi
canc
ean
ddo
esno
tim
pede
acce
ssto
them
bylo
calr
esid
ents
.
The
crit
erio
nin
clud
es:
•G
reen
hous
ega
sem
issi
ons
•Tr
ansp
ort(
redu
cing
tran
spor
tatio
nre
quir
emen
ts),
•W
aste
wat
er,
•So
lidw
aste
,•
Har
mfu
lsub
stan
ces,
•M
inim
ize
pollu
tion
.
A3.
Rep
ort
ing
an
dco
mm
un
icati
on
B3.
Lo
cal
pu
rch
asi
ng
C3.
Pre
sen
tin
gcu
ltu
rean
dh
eri
tag
eD
3.
Co
nse
rvin
gb
iod
ivers
ity,
eco
syst
em
s,an
dla
nd
scap
es
The
orga
niza
tion
com
mun
icat
esit
ssu
stai
nabi
lity
polic
y,ac
tion
s,an
dpe
rfor
man
ceto
stak
ehol
ders
,inc
ludi
ngcu
stom
ers,
and
seek
sto
enga
geth
eir
supp
ort.
Whe
npu
rcha
sing
and
offer
ing
good
san
dse
rvic
es,t
heor
gani
zati
ongi
ves
prio
rity
tolo
cala
ndfa
ir-t
rade
supp
liers
whe
neve
rth
ese
are
avai
labl
ean
dof
suffi
cien
tqua
lity.
The
orga
niza
tion
valu
esan
din
corp
orat
esau
then
tic
elem
ents
oftr
adit
iona
land
cont
empo
rary
loca
lcu
ltur
ein
its
oper
atio
ns,d
esig
n,de
cora
tion
,cui
sine
,or
shop
s,w
hile
resp
ecti
ngth
ein
telle
ctua
lpro
pert
yri
ghts
oflo
calc
omm
unit
ies.
The
crit
erio
nin
clud
es:
•Bi
odiv
ersi
tyco
nser
vati
on,
•In
vasi
vesp
ecie
s,•
Vis
its
tona
tura
lsit
es,
•W
ildlif
ein
tera
ctio
ns,
•A
nim
alw
elfa
re,
•W
ildlif
eha
rves
ting
and
trad
e,
28

Sustainability 2019, 11, 6711
Ta
ble
1.
Con
t.
Dem
on
stra
teEff
ect
ive
Su
stain
ab
leM
an
ag
em
en
t
Maxim
ize
So
cial
an
dE
con
om
icB
en
efi
tsto
the
Lo
cal
Co
mm
un
ity
an
dM
inim
ize
Neg
ati
ve
Imp
act
s
Maxim
ize
Ben
efi
tsto
Cu
ltu
ral
Heri
tag
ean
dM
inim
ize
Neg
ati
ve
Imp
act
s
Maxim
ize
Ben
efi
tsto
the
En
vir
on
men
tan
dM
inim
ize
Neg
ati
ve
Imp
act
s
A4.
Staff
en
gag
em
en
tB
4.
Lo
cal
en
trep
ren
eu
rsC
4.
Art
efa
cts
Staff
are
enga
ged
wit
hde
velo
pmen
tan
dim
plem
enta
tion
ofth
esu
stai
nabi
lity
man
agem
ents
yste
man
dre
ceiv
epe
riod
icgu
idan
cean
dtr
aini
ngre
gard
ing
thei
rro
les
and
resp
onsi
bilit
ies
init
sde
liver
y.
The
orga
niza
tion
supp
orts
loca
len
trep
rene
urs
inth
ede
velo
pmen
tand
sale
ofsu
stai
nabl
epr
oduc
tsan
dse
rvic
esth
atar
eba
sed
onth
ear
ea’s
natu
re,h
isto
ry,a
ndcu
ltur
e.
His
tori
cala
ndar
chae
olog
ical
arte
fact
sar
eno
tsol
d,tr
aded
,or
disp
laye
d,ex
cept
aspe
rmit
ted
bylo
cala
ndin
tern
atio
nall
aw.
A5.
Cu
sto
mer
exp
eri
en
ceB
5.
Exp
loit
ati
on
an
dh
ara
ssm
en
t
Cus
tom
ersa
tisfa
ctio
n,in
clud
ing
aspe
cts
ofsu
stai
nabi
lity,
ism
onit
ored
and
corr
ecti
veac
tion
take
n.
The
orga
niza
tion
has
impl
emen
ted
apo
licy
agai
nstc
omm
erci
al,s
exua
lor
any
othe
rfo
rmof
expl
oita
tion
orha
rass
men
t.
--
A6.
Acc
ura
tep
rom
oti
on
B6.
Eq
ual
op
po
rtu
nit
yPr
omot
iona
lmat
eria
lsan
dm
arke
ting
com
mun
icat
ions
are
accu
rate
and
tran
spar
entw
ith
rega
rdto
the
orga
niza
tion
and
its
prod
ucts
and
serv
ices
,inc
ludi
ngsu
stai
nabi
lity
clai
ms.
They
dono
tpro
mis
em
ore
than
isbe
ing
deliv
ered
.
The
orga
niza
tion
offer
sem
ploy
men
top
port
unit
ies,
incl
udin
gin
man
agem
entp
osit
ions
,wit
hout
disc
rim
inat
ion
byge
nder
,rac
e,re
ligio
n,di
sabi
lity
orin
othe
rw
ays.
--
A7.
Bu
ild
ing
san
din
frast
ruct
ure
B7.
Dece
nt
wo
rk
Plan
ning
,sit
ing,
desi
gn,c
onst
ruct
ion,
reno
vatio
n,op
erat
ion
and
dem
oliti
onof
build
ings
and
infr
astr
uctu
re.
Labo
rri
ghts
are
resp
ecte
d,a
safe
and
secu
rew
orki
ngen
viro
nmen
tis
prov
ided
,and
empl
oyee
sar
epa
idat
leas
taliv
ing
wag
e.Em
ploy
ees
are
offer
edre
gula
rtr
aini
ng,e
xper
ienc
e,an
dop
port
unit
ies
for
adva
ncem
ent.
--
29

Sustainability 2019, 11, 6711
Ta
ble
1.
Con
t.
Dem
on
stra
teEff
ect
ive
Su
stain
ab
leM
an
ag
em
en
t
Maxim
ize
So
cial
an
dE
con
om
icB
en
efi
tsto
the
Lo
cal
Co
mm
un
ity
an
dM
inim
ize
Neg
ati
ve
Imp
act
s
Maxim
ize
Ben
efi
tsto
Cu
ltu
ral
Heri
tag
ean
dM
inim
ize
Neg
ati
ve
Imp
act
s
Maxim
ize
Ben
efi
tsto
the
En
vir
on
men
tan
dM
inim
ize
Neg
ati
ve
Imp
act
s
A8.
Lan
dw
ate
ran
dp
rop
ert
yri
gh
tsB
8.
Co
mm
un
ity
serv
ices
Acq
uisi
tion
byth
eor
gani
zati
onof
land
and
wat
erri
ghts
and
ofpr
oper
tyis
lega
l,co
mpl
ies
wit
hlo
calc
omm
unal
and
indi
geno
usri
ghts
,inc
ludi
ngth
eir
free
,pr
ior,
and
info
rmed
cons
ent,
and
does
notr
equi
rein
volu
ntar
yre
sett
lem
ent.
The
activ
ities
ofth
eor
gani
zatio
ndo
not
jeop
ardi
zeth
epr
ovis
ion
ofba
sic
serv
ices
,suc
has
food
,wat
er,e
nerg
y,he
alth
care
,or
sani
tatio
n,to
neig
hbor
ing
com
mun
itie
s.
--
A9.
Info
rmati
on
an
din
terp
reta
tio
nB
9.
Lo
cal
liv
eli
ho
od
sT
heor
gani
zati
onpr
ovid
esin
form
atio
nab
outa
ndin
terp
reta
tion
ofth
ena
tura
lsu
rrou
ndin
gs,l
ocal
cultu
re,a
ndcu
ltura
lhe
rita
ge,a
sw
ella
san
expl
anat
ion
ofap
prop
riat
ebe
havi
orw
hile
visi
ting
.
The
activ
ities
ofth
eor
gani
zatio
ndo
not
adve
rsel
yaff
ectl
ocal
acce
ssto
livel
ihoo
ds,i
nclu
ding
land
and
aqua
tic
reso
urce
use,
righ
ts-o
f-w
ay,t
rans
port
,an
dho
usin
g.
--
Sour
ce:[
66].
30

Sustainability 2019, 11, 6711
The analysis of threats resulting from the ongoing dysfunctions of a business can be carried out ina highly customized manner, which varies depending on the nature of the determined influence. Onecan, however, note several topics that the literature proposes in the course of research and analysis.Some of them refer, in particular, to tourism activities. Liu [59], for example, proposed viewing thesustainable tourism issues from the perspective of six categories:
1. The role of tourism demand,2. The nature of tourism resources,3. The imperative of intra-generational equity,4. The role of tourism in promoting sociocultural progress,5. The measurement of sustainability,6. Forms of sustainable development.
In 2018, these proposed solutions were corrected and supplemented. The provisions of the CapeTown Declaration on Responsible Tourism of 2018 [67] considered the objectives of sustainable tourismto be about minimizing negative economic, environmental, and social impacts; generating greatereconomic benefits for local people and enhancing the wellbeing of host communities (improvingworking conditions and access to the industry); involving local people in decisions that affected theirlives and life chances; making positive contributions to the conservation of natural and cultural heritageand to the maintenance of the world’s diversity; providing more enjoyable experiences for touriststhrough more meaningful connections with local people, as well as a greater understanding of localcultural, social, and environmental issues; providing access for physically challenged people; andstrengthening individual culturally sensitivity by encouraging respect between tourists and hosts andbuilding local pride and confidence.
3. Materials and Methods in the Context of Health Tourism Enterprises
To make an analysis of the value proposition that health tourism enterprises in particular currentlyprovide, in-depth interviews were carried out among managers of 17 such enterprises in Poland in2018. The objective of this research was to determine the applicability of various business modelsand determine the content of their components, in particular the value proposition in one aspect ofhealth tourism, namely in spa tourism enterprises in Poland. This was undertaken on the basis of theCANVAS business model structure [12] discussed earlier.
The enterprises under analysis were selected from the list of health resort facilities developedand shared by the Ministry of Health by the Republic of Poland. The selection criteria were thelargest health resorts that had a market share amounting to at least 33% of the overall health resortmarket in Poland. In the research, a survey questionnaire was used based on the business modelstructure. This research tool was developed according to the assumptions of the interview scenario.The basic idea was to allow some issues to be examined in more depth if necessary. It was therefore asemi-structured study.
The survey questionnaire contained 26 items, divided by topic (and is included in the annex tothe paper). In the first part of the questionnaire, 18 questions were posed, characterizing the businessmodel structure and each of the studied components. The second pool of questions concerned issuesassociated with the tourist and health resort business activity carried out and the sources of theirfinancing. The survey questionnaire included many issues falling within the broad topic of businessmodels, but consistent with the specific focus of this article, detailed considerations took into accountonly selected results of these studies. The authors focused exclusively on the value proposition in thebusiness model, in particular the empirical research concerned only customer value and the valuecaptured by the company. Conducting empirical research focused on these two categories of values.However, in the course of the literature research and review of the values generated by the surveyedenterprises, a third value emerged—this is a value that a tourist enterprise generates for society, bothlocally and globally.
31

Sustainability 2019, 11, 6711
In the statistical analysis of the obtained empirical data, both descriptive analysis as well asan advanced multi-dimension method were used. In this article, only one component is discussed,therefore the presentation of results is limited to quantification with the use of structure measurementsubject to weighting. Analysis of the significance of specific model components was made by the useof a substantive feature indicator (Φ), that was developed on the basis of the structure indicator thatlater was subject to weighting with the use of ranks assigned by the managers to particular features.
4. Results of Research
The research revealed managers of almost one-third of the tourist enterprises declared that theyknew and use business models when carrying out health resort operations (29.4%). The in-depthnature of the research concluded that the actual knowledge of business models in these enterprises wassmaller than initially self-declared. A majority of managers declaring knowledge of business modelshad an abstract form in mind, without any text or graphics that represented the links between modelarchitecture components.
In addition, no attempt was made to formally integrate all business model components on thebasis of business model concepts found in literature. Only scarce attempts to integrate selected businessmodel components were noted. It can be stated that the use of business models in analyzed enterprisestherefore is incidental and fragmentary.
However, it was found that the enterprises examined held other documents that described thebusiness activity, and these included the articles of association, rules, operational plans, investmentbusiness plans, and company strategies. Almost all of the enterprises had developed strategy forrunning their own business. It cannot be concluded, therefore, that no business models were found inthe studied health tourism enterprises, as usually managers of these entities operated in a definedmanner of activities organization in the form of procedure sets, key objectives, and plans for businessactivity at particular levels of management or within specific levels of functioning. However, this isnot a complete business model, but a fragmentary elaboration on selected areas of the business activitybeing carried out.
When analyzing the value proposition that the health resort enterprises provide, every managerwas asked to determine the value for the customer and value captured by the enterprise and then toindicate the three most important ones.
Enterprise managers identified the treatment effect; that is, the maintenance or improvement ofthe health of the patient to be the key benefit for the customer (Φ = 1.000). Further indicated valuesincluded achieving the relaxing services effect, that is de-stressing of the patient, a sense of beauty,beauty improvement, a loss of body mass, an improvement of fitness and sport results (Φ = 0.824),and a stay in comfortable conditions that is in a place of therapeutic climate properties (Φ = 0.824).Quite high rated also was the socialization between the tourist and other patients (Φ = 0.706), and aslightly higher rating was observed in case of the possibility to stay away from routine (Φ = 0.647).Other indicated values for the consumer had lower significance ratings:
• Cognitive, cultural, and religious impressions obtained through various forms of culture (additionalservices) (Φ = 0.471),
• Cognitive experiences and physical effort through tourism (tourist services) (Φ = 0.353),• Adventure, entertainment, trip, fulfilling holidays (Φ = 0.353).
In the scope of values captured by the enterprises, the financial benefits dominated among theresponses given. Managers taking part in the research sought primarily to make a profit from theirbusiness activity. An increase in profit was the objective indicated the most often placing it at the top ofthe list of leading objectives of the business activity (Φ = 1.000). Almost as important were the increaseof services sale (Φ = 0.970) and increase in the numbers of commercial customers (those who pay fortheir stay independently) (Φ = 0.970). Other values were significantly less popular, for example the
32

Sustainability 2019, 11, 6711
increase of contracts with insurers was rated at Φ = 0.626. The remaining preferred benefits for theenterprise are presented in Table 2.
Table 2. Enterprise values from the health resort operations.
Value for the Enterprise Presented in the Form of Objectives Resultingfrom the Health Resort Activity
Φ
Increase of profit 1.000Increasing the number of commercial customers 0.970
Increase of sale 0.970Increasing the contracts with insurers 0.626
Increasing the number of beds/facilities 0.596Increasing the assets of the enterprise 0.548
Survival of the enterprise 0.430
Source: Based on own study.
Therefore, the analysis of benefits expected from the business activity of these health resortsconfirms a strong dominance of objectives directed towards profit by the enterprise managers, and anincrease in the number of commercial customers (see additional details in [35]). Disappointingly, noactivities that would benefit the local community were observed among the priorities.
During interviews with managers of spa companies, it was revealed that their business models donot take into account values for society. Managers undertake optimization actions aimed at eliminatingwaste of medicinal raw materials. However, this is not an element of the business model (eveninformally), but a business practice focused on limiting losses.
Therefore, key actions taken by managers of spa enterprises were analyzed. The actions of spaenterprises rated highest by managers (conducted in the scope of their basic activities) are mainlyservices related to accommodation (Φ = 1,000), natural therapy treatments (Φ = 1,000), catering services(Φ = 0.769), programming of treatments (Φ = 0.769), help of a dietitian, psychologist, and otherspecialists (Φ = 0.646), and spa clinic services (Φ = 0.631). In assessing the significance of individualactivities (priority and additional) in spa enterprises, much lower scores were received for activitiesthat could be described as investments in the development of society. These were conducting classesin health education (Φ = 0.600), organizing cultural events (Φ = 0.449), and conducting research anddevelopment activities (Φ = 0.415). Most often, such activities were described as additional, ratherthan a priority.
The low awareness of managers regarding the value that an enterprise should generate for societyis also an important argument for formulating a proposal for introducing such value for society intobusiness models.
5. Discussion of a Sustainable Tourism Business Model
Based on the research results cited above, it is clear that the issue of considering activities basedon sustainable development principles does not currently fall within the priorities of health resorttourism enterprises. The result is that there is not only the need to raise awareness of the managersabout these issues, but also to give them inspiration and provide examples of the potential practicalimplementation of sustainable tourism principles in the health resort.
Managers need to be referred to the practice of creating sustainable business models of tourismenterprises. It seems that what would be logical in this case would be to start with the value propositioncomponent and then to expand this key business model component through subsequent integratedcomponents of business activity leading to a more sustainable tourist operation.
An extremely important change concerning current manager practice would be a change in theunderstanding of the value proposal. In the overall value proposal, such elements as a value proposalfor the tourist, values captured by the enterprise, as well as a value proposal for the community (such
33

Sustainability 2019, 11, 6711
as natural environment protection) should be included. Therefore, it seems appropriate to divide thecomponent defining the value proposal into these three categories.
The value proposal for the customer in the context of the sustainable development goals requiresa definition of the benefits that a tourist will gain by having appropriate contact with nature and thecultural heritage of the local community in a favorable atmosphere with the local community and incomfortable conditions of tourist infrastructure. These are, therefore, elements that, once ensured forthe guest, will make the realization of their goals possible. Due to their differentiation and sometimeseven contradictory nature, it is impossible to identify universal elements of these components for everytourist enterprise because they can involve can implement recreational purposes, cognitive purposes,health purposes, and entertainment purposes, and sometimes even extreme experiences (such as stayjust behind a front line during armed conflict or space travel). It seems, however, that the core of thebenefits elements, resulting from sustainable tourism, is the improvement of tourist awareness on howprecious the natural environment and the community and its cultural heritage are.
The value captured by an enterprise is not only about making a profit or increasing the scope ofthe targeted market, but also about other benefits resulting from the business activity being carried out.It is worth emphasizing, in this context, the ability to create a local tourist product, ensure satisfactionwith providing services meeting the expectations of tourists, as well as contributing to the economicdevelopment of the local community and supporting its cultural heritage.
The value for the community includes the benefits of the business activity carried out by theenterprise that the local community receives in the economic, cultural, and ecological context. Thesebenefits are, in general, those resulting from solving or alleviating current social problems, at both localand global levels. A crucial and easily discernible benefit for the local community would be a decreasein unemployment through the establishment of additional jobs. It could also reflect an emphasis onthe identity of the region by way of organizing an exhibition of regional craft production and also byincreasing the comfort of the stay and ease of travel, for example by reducing congestion of traffic. Lessdiscernible benefits from pro-ecology activity could take the form of introducing regulations on waterand energy saving, limiting traffic emissions, and encouraging suppliers to join programs limiting thedegradation of natural environment.
A complete definition of value for all three groups of elements allows the determination of thesubsequent model components. Taking into account the division of components used by Osterwalderand Pingeur [12], these will be key activities, meaning those activities that must be undertaken toachieve complex benefits. This, in turn, will also determine the selection of key partners in both thecloser and more distant environments, the necessary resources, and the cost streams resulting from thevalue creation.
The values for the customers will also depend on such components as the serviced market segment;distribution channels; relationships with the customers; and even revenue streams. In turn, values forthe community can strongly influence the selection and formulation of key activities undertaken by theenterprise in their policy of partner (especially suppliers) selection, the use of natural resources, andtheir cost streams, as well as the relationship with their customers in terms of pro-ecology behaviorsand pro-community behaviors involving the local community.
The influence of social values on the revenue streams is long-term nature in nature. The timeneeded for the improvement of air quality or the regeneration of local culture will depend on theintensity and level of engagement in the introduction of sustainable tourism practices among allfacilities in a defined area.
It must be noted, however, that the creation of these values (for the customers and the community)without reference to the value for the enterprise is impossible. The value captured by the enterprisedetermines the level of implementation of economic objectives resulting from the value creation for thecustomer and the implementation of social objectives (including pro-ecologic ones). The revenues ofan enterprise depend, first of all, on the fact that the expectations of the customer are met, meaning
34

Sustainability 2019, 11, 6711
they depend on the value proposition for the customer, and their volume will allow the determinationof the possibility of creating value for the community (Figure 1).
Figure 1. Value proposition of tourist tourism enterprises; source: Own study.
Figure 1 shows the postulated values that tourism companies should consider in their businessmodel. The first two categories of values result from the analysis of the literature on businessmodels and the empirical research conducted. Values for society were identified in the course of theliterature research and include criteria developed by GSTC [66] and analysis of key activities in touristbusiness models.
When analyzing possible market scenarios, it can be expected that the tendency to create value forthe community will be proportional to the effectiveness of customer value influence, less the valuecaptured by the enterprise (1).
Asv ≈ Ecv − Cev, (1)
where
Asv—acceptance to create value for society;Ecv—effectiveness of customer value impact;Cev—value captured by the enterprise.
The priority of the enterprise traditionally has been the economic goals, not the implementationof social goals. Thus, the social activity can be financed only if the enterprise makes profits that meetthe expectations of the owners. At the same time, abstaining from pro-social activity tends to be oneof the first decisions in a situation when it is necessary to carry out remedial restructuring caused bycreation of maladjusted values (or inadequate proportion of each of the three value types). The valueproposition for the community is, therefore, a value that depends to a great degree on the success ofpropositions of other types of values created in any business model.
The limitations of the conducted research mainly relate to the scope of analyzed values generatedby the tourist enterprises. The article analyzes customer values and values captured from the companiessurveyed. Only the subsequent in-depth interviews revealed the need to formulate values for society.Therefore, further research should focus on the priorities in terms of the value generated by the touristenterprise for the community. Another limitation of the presented research is the need to generalize
35

Sustainability 2019, 11, 6711
the postulated activities so that they can be applied to various types of tourist activities. In the case oftourist enterprises in which transport will be the dominant activity, the postulated values may havedifferent priorities than those for enterprises in which accommodation services dominate.
6. Conclusions
The research discussed here demonstrates that the values created by the health tourism enterprisesexamined do not include benefits for the community. Instead, among the current priorities are benefitsfor the tourists and the enterprise itself. Subsequent research should determine why this is the case andif it is correct to assume that the tendency of an enterprise to carry out social objectives is associated withmeeting the economic goals of that enterprise that result directly from providing value to the customer.
The analysis of literature and of selected program documents of organizations and conferencesindicated the presence of a number of proposals for implementing rules associated with achievingsustainable development in tourist enterprises. Such key sets of rules could be the criteria and proposalsfor two documents. The first one is the Global Sustainable Tourism Council criteria [61] which apply tohotels, tour operators, and tourist destinations, and constitute a unique inspiration for entrepreneursof tourist industry. The second document is the Cape Town Declaration on Responsible Tourism of2018 [67] that provides directions on activities necessary to be undertaken by those entrepreneurs thataim to co-create a responsible tourist economy.
A key element of creating a community that undertakes activities associated with responsibletourist businesses is that such a community is taking into account actions and objectives associatedwith sustainable tourism, and applying these principles as laid out in its basic policy or strategyand similarly that all involved businesses are following an appropriate business model that is alsoestablished on the basis of sustainable development principles. This research has demonstrated thefragmentary knowledge of those managers surveyed with respect to the business model concept,and also revealed potential opportunities for implementing the sustainable business principles byincorporating them into the business model priorities. The approach proposed here is one by which theproposals for the created values are divided into three groups. In such an approach, complementingthe values gained by the customer and values captured by the enterprise combined with the gain inoverall social values can foster greater effectiveness in the undertaking of sustainable activities.
Author Contributions: A.R.S. prepared the following elements of the article: The methodology, introduction,and conclusions, and conduct of research. R.W.B. developed the final contents of the article and proofread andrevised it.
Funding: This research received funding by the National Science Center in Poland.
Acknowledgments: This paper was published as part of the research project ‘A business model for health resortenterprises’ No. 2017/25/B/HS4/00301, supervised and financed by the National Science Center in Poland and aspart of statutory research No. 13/990/BK_19/0138 at the Silesian University of Technology, Faculty of Organizationand Management.
Conflicts of Interest: The authors declare no conflict of interest. The funders had no role in the design of thestudy; in the collection, analyses, or interpretation of data; in the writing of the manuscript, or in the decision topublish the results.
References
1. Goodrich, J.; Goodrich, G. Health-care Tourism: An Exploratory Study. Tour. Manag. 1987, 8, 217–222.[CrossRef]
2. Bushell, R.; Sheldon, P.J. (Eds.) Wellness and Tourism: Mind, Body, Spirit, Place; Cognizant CommunicationCorporation: New York, NY, USA, 2009; p. 8.
3. Health Resort Treatment. Health Resorts, Health Resort Protection Areas and Health Resort Communes.J. Laws 2005, 167, 1399.
4. Szromek, A.R. Changes in the management model of health care institutions in health resorts in the contextof social and economic changes in the years 1989–2018. Health Prim. Care 2018, 2, 1–2. [CrossRef]
36

Sustainability 2019, 11, 6711
5. Szromek, A.R.; Romaniuk, P.; Hadzik, A. The privatization of spa companies in Poland—An evaluation ofpolicy assumptions and implementation. Health Policy & Services category. Health Policy 2016, 120, 362–368.
6. Kapczynski, A.; Szromek, A.R. Hypotheses Concerning the Development of Polish Spas in the Years1949–2006. Tour. Manag. 2008, 29, 1035–1037. [CrossRef]
7. Van Tubergen, A.; Van Der Linden, S. A brief history of spa therapy. Ann. Rheum. Dis. 2002, 61, 273–275.[CrossRef] [PubMed]
8. Erfurt-Cooper, P.; Cooper, M. Health and Wellness Tourism Spas and Hot Springs; Channel View Publication:Toronto, ON, Canada, 2009; p. 4.
9. Magretta, J. Why business models matter? Harv. Bus. Rev. 2002, 80, 86–92. [PubMed]10. Battistella, C.; Toni, A.; Zan, G.; Pessot, E. Cultivating business model agility through focused capabilities:
A multiple case study. J. Bus. Res. 2017, 73, 65–82. [CrossRef]11. Teece, D. Business models and dynamic capabilities. Long Range Plan. 2018, 51, 40–49. [CrossRef]12. Osterwalder, A.; Pigneur, Y. Business Model Generation: A Handbook for Visionaries, Game Changers, and
Challengers; John Wiley & Sons: Hoboken, NJ, USA, 2010; p. 59.13. Prendeville, S.; Bocken, N. Sustainable Business Models through Service Design. Procedia Manuf. 2017, 8,
292–299. [CrossRef]14. Al-Debei, M.; El-Haddadeh, R.; Avison, D. Defining the Business Model in the New World of Digital Business.
In Proceedings of the Fourteenth Americas Conference on Information Systems, Toronto, ON, Canada,14–17 August 2008.
15. Wit, B. Ekologistyka w Systemie Zarzadzania Odpadami Niebezpiecznymi, Towarzystwo Naukowe Organizacji iKierowania; Stowarzyszenie Wyzszej Uzytecznosci Dom Organizatora: Torun, Poland, 2016; p. 138.
16. Lindgren, P. Business Model Innovation Leadership: How Do SME’s Strategically Lead Business ModelInnovation? Int. J. Bus. Manag. 2012, 7, 53–66. [CrossRef]
17. VDMbee Platform. VDML Roots: Business Model. Available online: https://www.vdmbee.com/2014/07/vdml-roots-business-model/ (accessed on 1 August 2019).
18. Lindgren, P.; Rasmussen, O.H. The Business Model Cube. J. Multi Bus. Model Innov. Technol. 2013, 1, 135–182.19. Allee, V.; Schwabe, O.; Krause Babb, M. Innovation at the Intersection of Business and Technology. In Value
Networks and the True Nature of Collaboration; Meghan-Kiffer Press: Tampa, FL, USA, 2011; p. 33.20. Gordijn, J.; Akkermans, H. Value based requirements engineering: Exploring innovative e-commerce ideas.
Requir. Eng. J. 2010, 8, 114–134.21. Scheller, C.V.; Hruby, P. Modeling, Services and Intellectual Property Rights Using POA (Possession,
Ownership, Availability). In Proceedings of the 5th International Workshop on Value Modeling and BusinessOntologies, Gent, The Netherlands, 7–8 February 2010.
22. Maurya, A. Iteracja od planu A do planu, który da Ci sukces. In Metoda Running LEAN; Helion, wyd. II:Gliwice, Poland, 2013; p. 47.
23. Johnson, M.W.; Christensen, C.M.; Kagermann, H. Reinventing Your Business Model. Harv. Bus. Rev. 2008,86, 50–59.
24. Johnson, M.W. Seizing the White Space: Business Model Innovation for Growth and Renewal; Harvard BusinessReview Press: Brighton, NY, USA, 2010; pp. 113–173.
25. Afuah, A. Business Model Innovation: Concepts, Analysis, and Cases; Routledge-Taylor & Francis Ltd.: Abingdon,UK, 2014; p. 12.
26. Muehlhausen, J. Business Models for Dummies; John Wiley & Sons: Hoboken, NJ, USA, 2013; p. 80.27. Chesbrough, H.W. Open Business Models: How to Thrive in the New Innovation Landscape; Harvard Business
Review Press: Brighton, NY, USA, 2016; pp. 1–272.28. Westa, J.; Salterb, A.; Vanhaverbekecef, W.; Chesbrough, H. Open Innovation: The Next Decade. Res. Policy
2014, 43, 805–811. [CrossRef]29. Seidenstricker, S.; Scheuerle, S.; Linder, C. Business Model Prototyping—Using the Morphological Analysis
to Develop New Business Models. Procedia Soc. Behav. Sci. 2014, 148, 102–109. [CrossRef]30. McGrath, R. Business Models: A Discovery Driven Approach. Long Range Plan. 2010, 43, 247–261. [CrossRef]31. Doleski, O.D. Integrated Business Model: Applying the St. Gallen Management Concept to Business Models;
Springer Fachmedien Wiesbaden: Wiesbaden, Germany, 2015.32. Michelini, L. Social Innovation and New Business Models. Creating Shared Value in Low-Income Markets; Springer:
New York, NY, USA, 2012; p. 30.
37
Sustainability 2019, 11, 6711
33. Szromek, A.R. Propozycja wartosci dla klienta przedsiebiorstwa uzdrowiskowego. Folia Tur. ProkseniaKraków 2018, 47, 9–25. [CrossRef]
34. Porter, M. Competitive Advantage; Free Press: New York, NY, USA, 1985; Volume 61.35. Bojar, E.; Wit, B. Triple Bottom Line w szablonie modelu biznesu A. Osterwaldera i Y. Pigneura w perspektywie
interesariuszy. Zeszyty Naukowe Politechniki Slaskiej, Organizacja i Zarzadzanie 2016, 99, 37–53.36. Souto, J. Business model innovation and business concept innovation as the context of incremental innovation
and radical innovation. Tour. Manag. 2015, 51, 142–155. [CrossRef]37. Naramski, M.; Szromek, A.R. A Business Model in Spa Tourism Enterprises: Case Study from Poland.
Sustainable Tourism—Ways to Counteract the Negative Effects of Overtourism at Tourist Attractions andDestinations. Sustainability 2019, 11, 2880.
38. Reinhold, S.; Beritelli, P.; Grünig, R. A business model typology for destination management organizations.Tour. Rev. 2019, 74, 1135–1152. [CrossRef]
39. Reinhold, S.; Zach, F.; Krizaj, D. Business models in tourism—state of the art. Tour. Rev. 2019, 74, 1120–1134.[CrossRef]
40. Joyce, A.; Paquin, R.L. The triple layered business model canvas: A tool to design more sustainable businessmodels. J. Clean. Prod. 2016, 135, 1–13. [CrossRef]
41. Collins, J.C.; Porras, J.I. Building your company’s vision. Harv. Bus. Rev. 1996, 74, 65–76.42. Boons, F.; Lüdeke-Freund, F. Business models for sustainable innovation: State of the art and steps towards a
research agenda. J. Clean. Prod. 2013, 45, 9–19. [CrossRef]43. Herman, K.; Szromek, A.R. Przedsiebiorstwo turystyczne w ujeciu modelowym. In Model Biznesu w
Przedsiebiorstwie Turystyki Dziedzictwa Przemysłowego; Wyd. Pol.Sl: Gliwice, Poland, 2018; pp. 180–202.44. Herman, K.; Szromek, A.R. A Business Creation in Post-Industrial Tourism Objects: Case of the Industrial
Monuments Route. Sustainability 2019, 11, 1451.45. Threebility—Tools for Sustainable Innovation. The Sustainable Business Model Canvas. Available online:
https://www.threebility.com/sustainable-business-model-canvas (accessed on 21 November 2019).46. Bodenau, A. Innovative Value of Sustainable Tourism Practices. In Innovation and Value Creation in
Experience Based Tourism. In Proceedings of the 22nd Nordic Symposium in Tourism and HospitalityResearch, Bodø, Lofoten, Norway, 24–27 September 2013; University of Nordland: Nordland, Norway, 2013;pp. 23–25.
47. Cranmer, E.; Jung, T.; Dieck, M.C.T. The Value of Augmented Reality from a Business Model Perspective,e-Review of Tourism Research. 2017. Available online: https://ertr.tamu.edu/ (accessed on 1 August 2019).
48. Havemo, E. A visual perspective on value creation: Exploring patterns in business model diagrams. Eur.Manag. J. 2018, 36, 441–452. [CrossRef]
49. Prebensen, N.; Dahl, J. Value co-creation significance of tourist resources. Ann. Tour. Res. 2013, 42, 240–261.[CrossRef]
50. Mantaguti, F.; Mingotto, E. Innovative business models within niche tourist markets: Shared identity,authenticity and flexible networks. The case of three Italian SMEs. J. Tour. Res. 2016, 6, 9–10.
51. Miguéns, J.; Baggio, R.; Costa, C. Social media and Tourism Destinations: TripAdvisor Case Study, Advancesin Tourism Research. Adv. Tour. Res. 2008, 26, 1–6.
52. Inversini, A.; Xiang, Z.; Fesenmaier, D.R. New Media in Travel and Tourism Communication: Toward a NewParadigm. Available online: https://inversini.files.wordpress.com/008/01/27_cont_9783110266535_inversini_xiang_fesenmaier1.pdf (accessed on 1 August 2019).
53. Diaconu, M.; Dutu, A. Business model in the hospitality industry, from traditional to open innovation. Sci.Bull. Econ. Sci. 2017, 16, 3–10.
54. Langviniene, N.; Daunoraviþinjto, I. Factors influencing the success of business model in the hospitalityservice industry. Procedia Soc. Behav. Sci. 2015, 213, 908. [CrossRef]
55. Dodds, R.; Butler, R.W. Overtourism. Issues, realities and solutions. Gruyter Stud. Tour. 2019, 1, 1–22.56. Nosratabadi, S.; Mosavi, A.; Shamshirband, S.; Zavadskas, E.K.; Rakotonirainy, A.; Wing Chau, K. Sustainable
Business Models: A Review. Sustainability 2019, 11, 1663. [CrossRef]57. Geissdoerfer, M.; Bocken, N.M.; Hultink, E.J. Design thinking to enhance the sustainable business modelling
process—A workshop based on a value mapping process. J. Clean. Prod. 2016, 135, 1218–1232. [CrossRef]58. Abdelkafi, N.; Täuscher, K. Business models for sustainability from a system dynamics perspective. Organ.
Environ. 2016, 29, 74–96. [CrossRef]
38

Sustainability 2019, 11, 6711
59. Liu, Z. Sustainable Tourism Development: A Critique. J. Sustain. Tour. 2003, 11, 459–475. [CrossRef]60. Porter, M.E.; Kramer, M.R. The big idea: Creating shared value. Harv. Bus. Rev. 2011, 89, 62–77.61. Luo, J.M.; Lam, C.F.; Ye, B.H. Barriers for the Sustainable Development of Entertainment Tourism in Macau.
Sustainability 2019, 11, 2145. [CrossRef]62. Norris, M.; West, S. E-biznes, Wydawnictwa Komunikacji i Łacznosci; Wydawnictwa Komunikacji i Łacznosci sp.
z o.o.: Warszawa, Poland, 2001; p. 179.63. Grefen, P. Mastering e-Business; Routledge–Taylor & Francis Ltd.: Abingdon, UK, 2010; Volume 1, pp. 16–32.64. Siakwah, P.; Musavengane, R.; Leonard, L. Tourism Governance and Attainment of the Sustainable
Development Goals in Africa. Tour. Plan. Dev. 2019, 5, 1–29. [CrossRef]65. United Nations. The United Nations Development Programme. 2016. Available online: http://www.undp.
org/content/undp/en/home/sustainable-development-goals.html (accessed on 1 August 2019).66. Global Sustainable Tourism Council. GSTC Criteria for Hotels. GSTC Criteria for Tour Operators. GSTC
Criteria for Destinations. 2019. Available online: http://www.gstcouncil.org/gstc-criteria/ (accessed on1 August 2019).
67. Cape Town Declaration on Responsible Tourism. The Cape Town Conference on Responsible Tourism inDestinations. Responsible Tourism Partnership and Western Cape Tourism. Cape Town. 2018. Availableonline: https://responsibletourismpartnership.org/cape-town-declaration-on-responsible-tourism/ (accessedon 1 August 2019).
© 2019 by the authors. Licensee MDPI, Basel, Switzerland. This article is an open accessarticle distributed under the terms and conditions of the Creative Commons Attribution(CC BY) license (http://creativecommons.org/licenses/by/4.0/).
39


sustainability
Article
The Identification of Values in Business Models ofTourism Enterprises in the Context of thePhenomenon of Overtourism
Zygmunt Kruczek 1,* and Adam R. Szromek 2
1 Department of Tourism Geography and Ecology, University School of Physical Education,Al. Jana Pawła II 78, 31-571 Kraków, Poland
2 Department of Organization and Management, Institute of Economy and Informatics,Silesian University of Technology, Akademicka 2A, 44-100 Gliwice, Poland; [email protected]
* Correspondence: [email protected]; Tel.: +48-602-758-513
Received: 8 February 2020; Accepted: 14 February 2020; Published: 15 February 2020
Abstract: This article presents considerations on business models, overtourism, and sustainabledevelopment on an example of the most important Polish tourist destination, which is Krakow. Thepurpose of the article is to identify the values generated and captured by tourist enterprises in thecontext of the occurrence of a specific level of overtourism. The authors have attempted to identifythe values of sustainable tourism declared by entrepreneurs, referring to the companies providingservices as well as tourists and the local community. The research, conducted on a sample of 518respondents including 371 residents and 147 entrepreneurs, not only allowed us to determine theattitudes of Krakow inhabitants toward the phenomenon of overtourism related to the Doxey modelof irritation, but also to assess the impact of having/using a business model based on the acceptanceof principles in sustainable tourism development. A comparison of the results obtained betweenenterprises declaring having and not having a business model indicates a great similarity in terms ofdeclared value propositions.
Keywords: sustainability; overtourism; business model; Doxey model; Krakow
1. Introduction
The negative impact of tourist activities in the area of tourist destinations is one of the keyproblems of modern tourism. Balancing the expectations of tourists and residents not only becomesthe task of local authorities in a tourist destination, but also that of the entrepreneurs conducting theseactivities. The literature proves that the enterprise’s use of a tool in the form of a business modelstreamlines and organizes their operations. It allows, among others, for mistakes to be avoided inthe form of the omission of actions necessary to achieve market success. In recent years, care for thenatural environment and the local culture of inhabitants has become one of these tasks. However,these elements are rarely included in the business models of modern enterprises.
The purpose of the article is to identify the values generated and captured by tourist enterprisesin the context of the occurrence of a specific level of overtourism on the example of the historic cityof Krakow. The paper is based on research conducted in 2019 among the inhabitants and tourismentrepreneurs of this tourist city. Although Krakow, as the most recognizable tourist destinationin Poland and Central Europe, shows signs of an excessive concentration of visitors, the level oftourist traffic load here is rather moderate, excessively burdening its inhabitants only in the historicalcenter. The key values of tourist business conducted by entrepreneurs can be referred to two groups ofcompanies: those with a formal business model and those not having such a model. The respondents’business responses not only concern the values generated for the enterprise, but also for tourists andthe local community, and are referred to in the city’s sustainable tourism development policy.
Sustainability 2020, 12, 1457; doi:10.3390/su12041457 www.mdpi.com/journal/sustainability41

Sustainability 2020, 12, 1457
2. Literature Review
2.1. Sustainable Business Models
One of the modern strategic tools in managing an enterprise or any other organization is thebusiness model. The evolution of this tool is evident in the variety of definitions used to describe it,especially in the 21st century, where it was initially referred to as an abstract concept or a descriptionof relationships or ongoing processes. However, literature has been dominated by the tool importanceof business models. According to the definition of Osterwalder and Pigneur [1], it is a conceptual toolcontaining a set of elements and their relationship with set goals, allowing the company’s businesslogic to be exposed. It is a description of the value that an enterprise is able to provide to marketsegments and a description of the organization itself, along with its network connections with partnersin order to create value. Teece [2] sees it as a practical application in designing or describing thearchitecture of mechanisms for creating, delivering, and capturing value. Prendeville and Bocken [3]refer to it as ordering business transactions between customers, partners, and suppliers as well as theorganization, and their participation in creating and capturing value. Margaretta defines the businessmodel as a characteristic of the described business in the form of a story explaining how the enterpriseoperates [4]. Often, it is also a description of the ongoing relationships between the components in theorganization that lead to the creation and capture of its value [5].
Al-Debei et al. [6] portray business models in the form of an abstract textual or graphicrepresentation of related model architecture structures developed by the organization, and all productsand services that the organization proposes, and that are needed to achieve the goal.
The affordability and versatility of business models have led to the fact that, for two decades, theuse of business models has been observed to expand not only to further industries (including businessmodels of industrial, food, tourist, energy, etc. enterprises), but also to the specific dimensions ofongoing processes, taking into account the needs of a changing business environment. An example ofsuch a specific model is its form, dedicated to enterprises wishing to implement the assumptions ofsustainable development. Geissdoerfer [7] defines sustainable business models as a set of elementsin which the interrelationships between these elements and their interactions with stakeholderscreate, deliver, capture, and exchange sustainable value for many stakeholders. Abdelkafi andTäuscher [8] see sustainable business models as a tool to integrate sustainable development principlesinto the company’s value logic and the logic of value creation by the enterprise. Entering sustainabledevelopment principles into business operations can help protect the environment, but, as Porter andKramer [9] state, can also be a source of competitive advantage and economic benefits for the enterprise.
Nosratabadi et al. [10] reviewed the work from various thematic areas. An interesting fact canalso be seen in the literature analysis after 2007. The context of sustainable development in businessmodels is most often taken up in the work of scientists from the United States and Great Britain aswell as in China, with Americans taking up this topic in their research twice as often as the British andalmost three times more often than the Chinese.
However, it should be noted that the adaptation of activities and solutions related to sustainabledevelopment is not only the direct impact of enterprises on the environment, but also on the immediatebusiness environment (contractors, customers, recipients). Therefore, the implementation of sustainabledevelopment elements is often associated with obstacles.
The findings of the Cape Town Declaration on Responsible Tourism from 2018 [11] include theobjectives of sustainable tourism. Another example relating to business models in tourism is the studyof Peric and Wise [12], which is a holistic and in-depth analysis of how sports tourism experiences aredelivered by looking at two existing case studies in Istria (Croatia). An important source of sustainabledevelopment activities in tourism are the Global Sustainable Tourism Council (GSTC) Criteria [13],which were developed for the implementation of “sustainable tourism” in the tourist company.
42

Sustainability 2020, 12, 1457
2.2. Value for the Customer, Enterprise, and Society
From the perspective of many approaches to the structure of the business model, the place androle of one of them is extremely significant: the element of value proposition for the customer. Thiselement appears in almost all concepts, regardless of the number of components and the way they aregrouped. However, considering that the value proposition is something, without which an enterpriseloses the basic sense of functioning, and thus a set of products and services that generate value for aparticular customer segment, the universality of its occurrence is understandable.
Customer value is a very broad concept. The cited definition of Osterwalder and Pigneur [1]defines it as a set of products and services that generate value for a particular customer segment aswell as the reason why customers prefer the offer of a given company over the offer of its competitors.They also add that it is a value that solves customer problems or meets their needs. However, customervalue is often complemented by business value, which is what the enterprise captures as part of itsown business. Most often it is profit and other intangible assets.
As part of their business, tourism businesses also generate other values that are not related towhat the customer or the enterprise itself gains [14]. This value is the social value of the business,determined by the tendency to pursue social goals in the form of activities and services that go beyondtourism. This may be, for example, therapeutic treatment provided as part of spa tourism or medicalservices provided as part of medical tourism, or activities that protect the natural environment andindigenous culture through the implementation of sustainable tourism [15]. However, it should benoted that the structure of these three categories of values is likely to change as soon as a certain levelof tourist traffic load is reached. Therefore, in the second part of this article, efforts were made tosimultaneously examine the value structure generated by the tourist enterprise and determine thelevel of burden on residents with the presence of tourists.
2.3. Overtourism and How to Measure it
One of the important problems of modern tourism is overtourism (i.e., the overload of touristtraffic on tourist destinations and the measurement of this load). Tourism space has its limitationsresulting from the size of the usable area and its response to tourism traffic [16]. An important problemis determining the permissible volume of traffic, exceeding which could be considered excessive. Inrelation to cities and large tourist centers that are struggling with the invasion of tourists, indicatorsof the optimal level of sociopsychological capacity have been proposed [17]. In a very short time,the term overtourism has become a descriptor of the negative impact of tourism and refers to theproblem of excess tourists in many cities. The discussion around overtourism has drawn attention tothe negative consequences of unlimited tourism growth and also pointed out directions of restrictionsand voluntary compromises aimed at effectively preventing growing problems [18].
The literature mentions other issues that are related or similar to overtourism. An exampleis the publication by Torres Outón [19], Jover, and Diaz-Parra [20], which refers to gentrificationand touristification. For the sake of completeness, it is worth adding that the phenomenon oftouristification includes processes caused by excessive tourist traffic that contribute to the destructionof the socio-cultural tissue of the city: they break down social networks and neighborhoods anderode local identities that are supplanted by marketing activities targeted at tourists [21]. Regardingthe second concept, gentrification is a process of changing the character of a neighborhood throughthe influx of more affluent residents and businesses. Gentrification often shifts a neighborhood’sracial/ethnic composition and average household income by developing new, more expensive housing,businesses, and improved resources [22].
It is very difficult to determine the assessment of the social effects of the influx of tourists. Thelevel of tolerance of inhabitants toward the influx of tourists varies depending on local and privateinterests [23,24]. An important tool is the analysis of the limits of acceptable change (LAC) [25,26].However, it should be noted that residents’ tolerance for social difficulties may be greater due toeconomic benefits [27].
43

Sustainability 2020, 12, 1457
There are various ways of solving this issue, besides limiting the number of visitors. This mayinclude:
• increasing the tourist capacity of reception areas, and• making a variety of tourism forms and to build correct relationships between stakeholders who
are involved in tourism [28–30].
The tool for measuring the residents’ response to the occurrence of tourism traffic is themethodology proposed by Doxey [16,31], which has been used for over four decades. The literaturealso presents other methods of assessing the intensity of tourist traffic (e.g., with the help of theBaretje-Defert, Defert, Charvat and Schneider indicators) as well as accommodation density indicatorsand the use of accommodation potential and tourist enterprises (in all enterprises) [31–34]. Conceptsthat include measuring the capacity and tourist absorption of the area [35–37] or analyzing thedevelopment of the area through the typology of tourists visiting the area [38,39] are also often used.
However, the simplicity of the Doxey index means that it is still used. An example of this is theresearch into assessing the attitudes of locals toward tourists and tourism in Dubai, a city of rapiddevelopment in the tourism industry in the Middle East [40]. Their research indicates that the tourismindustry in this city can continue to grow without becoming antagonistic with the inhabitants. Similarresearch on the socio-cultural influences of tourism development have been conducted in Hungary’sLake Balaton [41] and the island of Mauritius [42].
Doxey [33,34] assumes that the emergence of negative attitudes of inhabitants toward touristsis the result of exceeding the limits of the social carrying capacity (i.e., the ability to accept changes).Describing ongoing changes in the attitudes of inhabitants in four successive levels. The first levelis euphoria, a phase in which residents experience enthusiasm and joy at the appearance of tourists.Satisfaction with this fact is reciprocal, as tourists enjoy a joyful reception and residents receive income.The second phase is apathy (i.e., stabilization of emotions toward tourists). Tourist traffic is becomingsomething ordinary and a tourist is an obvious element of earning of residents. In the third phase,which is irritation, an approximation of the volume of tourist traffic approaches the saturation pointwith tourists. This generally results in infrastructure development. In the fourth phase, antagonism,the tourist is perceived as the source of all that is bad. In place of courtesy, abuse and even fraud areincreasingly creeping into relationships with tourists. The last phase, although not named by Doxey, isa permanent change of the area and its inhabitants, and often also the loss of tourist function.
3. Materials and Methods
The purpose of the article was to identify the values generated by tourist enterprises in the contextof the occurrence of a specific level of overtourism using the example of the historic city of Krakow.To achieve this goal, empirical research was conducted among randomly selected inhabitants andentrepreneurs conducting business activities related to tourism in Krakow, Poland (i.e., in one of thecities most visited by tourists in Central Europe).
In 2019, Krakow had 780 thousand inhabitants and its administrative division included four maindistricts (i.e. Podgórze, Nowa Huta, Old Town, and Krowodrza) [43]. The most interesting areasfor tourists is the Old Town, covering the urban layout of the historic old town with the royal castle(Wawel), the former Jewish district of Kazimierz, churches, and numerous museums where mainlyhotels, apartments, restaurants, clubs, theatres, etc. are located. This district has the largest touristcrowds and there has been a rapid increase in the short-term tourist rental offers, causing gentrification.
Krakow is one of the most popular Polish tourist destinations. It belonged to the United NationsEducational, Scientific and Cultural Organization (UNESCO) Creative Cities Network in 2013, and theEuropean Capital of Gastronomic Culture in 2019. The proof of the high significance of the problemof overtourism in Krakow is the development of a general Sustainable Tourism Policy Program for2021–2028, under the patronage of the City of Krakow [44]. In 2019, Krakow was visited by as many as14 million people, who spent almost PLN 7.5 billion during their stay in Krakow. The GDP generated
44

Sustainability 2020, 12, 1457
by the tourist industry in Krakow is over 8% of the city’s total GDP [43]. The pace of changes isalso indicated by statistical data. The volume of tourist activity in Krakow has doubled in the lastdecade [45]. Tourism in Krakow generates 29,000 jobs [44,46], and tourist arrivals from abroad toPoland in 2014–2019 increased by one third (from 12.5 to 19.5 million tourists) [47,48].
The research tool used in the study was a research questionnaire made available to 518 respondentsincluding 371 randomly selected residents of Krakow and 147 entrepreneurs operating in Krakow.A permanent feature for all respondents was permanent residence in one of the four main districtsof Krakow or tourist activity there. The research questionnaire contained nine questions with anextensive structure. The first part of the questionnaire included questions that first classified therespondent to a specific group of respondents (residents/entrepreneurs), and then to a subgroup. Inthe case of entrepreneurs, subgroups were created by the criterion used, which was the generic scopeof the business (hospitality, gastronomy, other tourist services), while in the case of city residents, therespondents were classified into a subgroup related to local origin and the relationship of professionalwork with tourism. The second part of the research questionnaire included questions aimed at assessingthe impact of tourist traffic in Krakow on the daily lives of city residents and people conducting businessactivity there as well as the proposal of value in the business models of enterprises operating there.
The analysis of the answers obtained was made using the methodology proposed by Doxey byenabling respondents to choose one of five answers that most accurately determined their attitudeto tourists. Table 1 presents the method of determining the level of tourism impact on residentsand entrepreneurs, in which specific opinions were assigned an appropriate level of tourism load.The Doxey model was also supplemented with an extreme attitude, which expresses the completedegradation of the tourism (decline stage).
Table 1. Assigning standardized opinions to individual stages of development in tourist traffic load inthe Doxey concept.
Doxey IndexOpinion Characterizing the Residents’ and Entrepreneurs’ Specific
Attitude
Stage I: Euphoria I am glad that tourists come here, because it means income for the city, newcontacts, jobs, prestige ...
Stage II: Apathy It is obvious that tourists come to us. It doesn’t impress me. We have to showhospitality ...
Stage III: Irritation Unfortunately, I see more negative than positive sides to tourists coming to mycity. It is no longer the same city it used to be ...
Stage IV: AntagonismCurrently, tourists mainly mean problems. There are too many of them, whichreduces the quality of life for inhabitants. Something needs to be done about it,
e.g. introduce restrictions ...
Stage V: Decline I cannot tolerate tourists in my surroundings!
Source: Based on own study.
However, the respondents were asked to rate the load on a scale of 0–10. The collected data weresubjected to statistical analysis [49]. The level of the significance of differences between the obtainedaverage values was also studied (Mann–Whitney test was used) [50], taking into account significanceat the level of α ≤ 0.05.
4. Results of Research
Empirical research was conducted on a sample of 518 respondents including 371 city residents(71.6%) and 147 entrepreneurs conducting business activity in the analyzed tourist destination (28.4%).Among the entrepreneurs participating in the research, every fifth provided hotel services (19.9%) and7.8% of the surveyed companies provided catering services. Entrepreneurs providing other tourist
45

Sustainability 2020, 12, 1457
services than those above-mentioned were the dominant group (72.3%). The age structure of theresident respondents indicates the dominance of people over 35 (51.0%). More often than every thirdrespondent (35.6%) was 36–55 years old, while every seventh was more than 55 years old.
More often than every second respondent (56.6%) declared being of Krakow origin. It is alsoknown that the majority of the surveyed residents were active in the field of tourism (51.0%).
4.1. Quantitative Analysis Results
Quantitative analysis of the tourist traffic load showed that the load expressed on a scale of 0–10was assessed at the level of optimal load (i.e., oscillating around an average rating of 5 (xAv = 5.49 ±2.81; Me = 5)). However, this is the average result from the ratings of four individual districts. Asexpected, the distribution of loads in individual districts is not even. One of the districts showed anoptimal load, while the others were either overloaded with tourism (Old Town xAv = 7.43 ± 2.4; Me =8) or showed an underload of tourists such as in Krowodrza and Nowa Huta, where tourists are stillexpected there to a larger extent than before (Me = 4).
By not focusing the respondents’ attention on the rated district, but on the whole city, a muchhigher average result (xAv = 7.57 ± 1.97; Me = 8) was obtained than in the case of the average result forthe ratings of individual districts (xAv = 5.49 ± 2.81; Me = 5). This means that respondents rated thecity’s load based on the load perceived in the most tourist-borne district of this destination (Old Town).
Therefore, analyzing the results obtained for the whole city, it can be concluded that Krakow isstruggling with an excessive number of tourists, but to a moderate degree. Assuming that the touristtraffic load within the 0–5 limits is also a load not exceeding the level of critical capacity and touristabsorption, it can be stated that the limit of tourist capacity has been exceeded in Krakow. However, itdoes not seem to be a level that degrades the tourist function of the city, but the level of load is rathermoderate or sometimes excessively burdensome for its inhabitants.
The origin of respondents from the city or outside the city had no effect on the expressed attitudetoward tourists or the assessment of the city’s tourist traffic load (p > 0.05). The fact of whether therespondent was employed in tourism or outside tourist activities had an impact on the attitude towardtourists (p < 0.001), which seems to be understandable, but also had an impact on the assessment of thetourist traffic load in the city (p < 0.001).
In the case of differences between the ratings of residents and entrepreneurs conducting theirtourist activities in the city, significantly different notes can be seen in all of the analyzed variables.While entrepreneurs showed a lower comfort of doing business in the city than residents (p = 0.029), inthe case of tourists, entrepreneurs had significantly higher scores than the residents (p < 0.001).
As far as the tourist traffic load in the city is concerned, it is worth noting that residents had asignificantly higher load than entrepreneurs (p < 0.001). Considering the fact that entrepreneurs earnincome from tourism, while among the residents, only every second was associated with tourism, theobtained result is understandable.
4.2. Qualitative Analysis Results
The obtained results regarding the ratio of residents to arriving tourists were verified using themodel of changes in attitudes of inhabitants toward tourists, according to the Doxey concept. For thispurpose, residents were asked to indicate the attitude that characterized their relationship towardtourists, according to the classification presented earlier in Table 1.
In terms of assessment in individual districts, the answers of the majority of inhabitants in theKrakow districts surveyed indicated the first two phases of the Doxey model (i.e., euphoria and apathy).By almost the same percentage of respondents, which was about 40% (the difference between thepercentage of people indicating these two phases generally only reached Δ = 2–5%). The Old Town,being the most burdened with tourists, is unique in this respect, where euphoria is strongly indicated,but, at the same time, had the highest percentage of people who described their attitude as antagonism(13.6%).
46

Sustainability 2020, 12, 1457
However, the overall result obtained was an average assessment, taking into account the ratings ofentrepreneurs and residents. An in-depth analysis of the results obtained indicates that these opinionsdid not coincide. While every third city inhabitant indicated the attitude of euphoria, expressed by theopinion: I am glad that tourists come here, because it means income for the city, new contacts, jobs, prestige... (33.8%), among the entrepreneurs, this attitude was shown by twice as many respondents (71.9%).Among the residents, the attitude of conflict with tourists was expressed by 9.4% of people, whileamong the entrepreneurs, it was only 2.1%. The structure of the residents’ and entrepreneurs’ attitudesis presented in Table 2.
Table 2. The structure of the residents’ and entrepreneurs’ attitudes toward tourists in accordance withthe Doxey concept.
Doxey Index [%] Inhabitants Entrepreneurs In General
Stage I: Euphoria 33.8% 71.9% 42.5%
Stage II: Apathy 36.9% 14.6% 31.7%
Stage III: Irritation 20.0% 10.4% 17.8%
Stage IV: Antagonism 9.4% 2.1% 7.7%
Stage V: Decline 0.0% 1.0% 0.2%
Source: Based on own study.
4.3. Tourist Traffic Load Depending on the Use of the Business Model
The analysis of the obtained results was also conducted in the direction of identifying differencesbetween entrepreneurs using the business model and those who did not use it. Although thedifferences between the percentages of entrepreneurs with specific attitudes in both groups of analyzedentrepreneurs were not statistically significant, some differences were clearly noticeable. Entrepreneursnot using the formal business model more often showed euphoria from the presence of tourists (66.04%⇔ 78.05%), but the attitude of apathy and irritation was more often shown by entrepreneurs using thebusiness model (Table 3).
Table 3. Results of average ratings expressed according to the Doxey model.
Doxey modelEntrepreneurs
with A BusinessModel
Significance Level(p)
Entrepreneurs withoutA Business Model
In General
Euphoria 66.04% 0.2756 78.05% 71.28%
Apathy 18.87% 0.6814 9.76% 14.89%
Irritation 11.32% 0.0704 7.32% 9.57%
Antagonism 1.89% 0.9604 2.44% 2.13%
Decline 1.89% 0.9604 2.44% 1.06%
Source: own work.
4.4. Declared Value Proposition in Business Models
Entrepreneurs were also asked about the value proposition for customers, the enterprise, andsociety. These values were declared by both those who used the business model and those who did notknow the business models (Table 4).
47

Sustainability 2020, 12, 1457
Table 4. Comparison of the attitudes of residents and entrepreneurs of the main districts of Krakow.
VALUE FOR TOURISTS [%]
Interaction with family members, friends as well as encountered tourists and residents 68.09%
Enabling tourists to rest by meeting their needs (accommodation, catering etc.)(accommodation and catering services) 63.83%
Providing cognitive, cultural, religious experiences., etc. by providing tourists with theopportunity to commune with forms of culture and art (tourist services) 58.51%
Achieving recreation effects (health, relaxation, beauty, better looks, sport results, etc.)(recreational and spa services) 52.13%
Staying away from the everyday routine 27.66%
Other 2.13%
VALUE FOR ENTREPRENEURS [%]
Satisfaction with playing an important role in the chain of creating the tourist offer of thecity, region, and country 88.30%
The opportunity to develop and invest in one’s own business 79.79%
Cooperation with suppliers and a team of colleagues 47.87%
Obtaining income to support the company 25.53%
Satisfaction of tourists from a feeling of meeting their needs 19.15%
Other 3.19%
VALUE FOR THE COMMUNITY [%]
Carrying out preventive actions against excessive tourist traffic loads (reduction inpollution). 72.34%
Supporting the city by paying public levies (taxes etc.), creating jobs 35.11%
Playing an important social role in the city’s economy 28.72%
Selection of ecological contractors (without plastic, old technologies, etc.) 20.21%
Introduction of rules for the provision of services limiting tourist dysfunctions (disputes,noise) 11.70%
Other 7.45%
Source: own work.
In the case of customer value, more than half of the entrepreneurs (>50%) appreciated valuessuch as:
• The ability to interact with family members, friends as well as encountered tourists and residents;• Enabling tourists to rest by meeting their needs (accommodation, catering, etc.);• Providing cognitive, cultural, religious experiences, etc. by providing tourists with the opportunity
to commune with forms of culture and art; and• Achieving recreation effects (health, relaxation, beauty, better looks, sport results, etc.).• Among the most appreciated values captured by enterprises are:• Satisfaction with playing an important role in the chain of creating the tourist offers of the city,
region, and country, and• The opportunity to develop and invest in one’s own business.
The key social value indicated by entrepreneurs was conducting preventive measures againstexcessive tourist traffic loads (reduction of pollution). This is due to the significant air pollutionin Krakow.
48

Sustainability 2020, 12, 1457
5. Conclusions
A comparison of the results obtained between enterprises declaring having and not having abusiness model indicates a great similarity in terms of the declared value propositions. However, threecases of significant differences between entrepreneurs were noticed.
The first of the differences was observed in the case of enterprise value (in terms of satisfactionwith playing an important role in the chain of creating the tourist offer of the city, region, and country).Entrepreneurs with a business model more often declared satisfaction with this role, which was 62.26%of entrepreneurs, compared to 53.66% of entrepreneurs without a business model. It is, therefore,significant evidence that the awareness of the role in the economy of the area goes hand in hand withthe awareness of the advantages of having structured business principles.
The next two differences relate to values for society, but this time the results are not clear.Entrepreneurs who do not use the business model (58.54%) see more value from playing an importantsocial role in the city’s economy than those who have such a model (39.62%). Over half of entrepreneurswith a business model saw their own role in the city’s economy.
However, the introduction of the principles of providing services limiting tourist dysfunctions(disputes, noise, etc.) in an enterprise was more often declared by entrepreneurs who did not usea business model (85.37%), than those who had such a tool (75.47%). This time, the issue of greaterawareness of social impact did not accompany the use of the business model in conducting business.
Among other conclusions, it is worth quoting those that resulted from the obvious subjectivity ofperception of the phenomenon of the presence of tourists in the city. While residents more often stressedthe annoyance of tourism than entrepreneurs, the benefits of tourism in the city were more oftenappreciated by entrepreneurs. However, it seems reasonable to observe the percentage of entrepreneurswho poorly assessed the presence of tourists in the city and the residents who well assessed the impactof tourists.
One of the very important elements of this research was also noticing the diversity of perceivedloads in individual city districts. While a moderate tourist traffic load was observed in the city, theinhabitants and entrepreneurs of individual districts showed different opinions on this subject. Whilethe main tourist district of the city had an excessive load reaching 8 on the scale of quantified load(1 ÷ 10), the other district only had a value of 4 and might mean an ability to take more tourists.
An important solution in the business models of enterprises operating in areas with a significantintensity of tourist traffic should become elements limiting the negative effects of tourist visits, andactivities aimed at raising the awareness of guests brought in with their impact on the visited area.Appropriate education of tourists carried out by tourist enterprises may reduce the antagonisms on thepart of the inhabitants, and thus extend the ability of entrepreneurs to benefit from tourism. Anotherimportant solution may be including the local community in the business models of tourism enterprisesamong key partners, and, at the same time, conducting activities supporting residents. However, itis not about increasing the financial (including tax) burden on enterprises, but about increasing theintensity of activities protecting inhabitants against tourism dysfunctions as well as strengthening thesurvival of indigenous cultural elements.
However, the proposed solutions should be sustainable through a permanent place in thebusiness models, and at the same time, should be oriented toward the implementation of sustainabledevelopment, making these models sustainable.
An issue that may determine future research is to determine the strength and direction of therelationship between the three values in business models. These are the value proposition for thecustomer, the values captured by enterprises, and the value proposition for society. It is also importantto identify the measurable reasons for restricting tourism activities to avoid the negative consequencesof excessive tourist traffic.
Author Contributions: Conceptualization, A.R.S. and Z.K.; methodology, A.R.S. and Z.K.; software, A.R.S. andZ.K.; validation, A.R.S. and Z.K.; formal analysis, A.R.S. and Z.K.; investigation, A.R.S. and Z.K.; resources, A.R.S.and Z.K.; data curation, A.R.S. and Z.K.; writing—original draft preparation, A.R.S. and Z.K.; writing—review
49

Sustainability 2020, 12, 1457
and editing, A.R.S.; visualization, A.R.S. and Z.K.; supervision, A.R.S. and Z.K.; project administration, A.R.S.;funding acquisition, A.R.S. All authors have read and agreed to the published version of the manuscript.
Funding: This research received funding by the National Science Center in Poland.
Acknowledgments: This paper was published as part of the research project ‘A business model for health resortenterprises’, No. 2017/25/B/HS4/00301 that was supervised and financed by the National Science Center in Poland,and as part of statutory research ROZ 1: BK-235/ROZ-1/2020 (13/010/BK_20/0042) at the Silesian University ofTechnology, Faculty of Organization and Management.
Conflicts of Interest: The authors declare no conflicts of interest. The funders had no role in the design of thestudy; in the collection, analyses, or interpretation of data; in the writing of the manuscript, or in the decision topublish the results.
References
1. Osterwalder, A.; Pigneur, Y. Business Model Generation: A Handbook for Visionaries, Game Changers, andChallengers; John Wiley and Sons: Hoboken, NJ, USA, 2010; p. 59.
2. Teece, D. Business models and dynamic capabilities. Long Range Plan. 2018, 51, 40–49. [CrossRef]3. Prendeville, S.; Bocken, N. Sustainable Business Models through Service Design. Procedia Manuf. 2017, 8,
292–299. [CrossRef]4. Magretta, J. Why business models matter. Harv. Bus. Rev. 2002, 80, 86–92.5. Battistella, C.; Toni, A.; Zan, G.; Pessot, E. Cultivating business model agility through focused capabilities:
Amultiple case study. J. Bus. Res. 2017, 73, 65–82. [CrossRef]6. Al-Debei, M.; El-Haddadeh, R.; Avison, D. Defining the Business Model in the New World of Digital Business.
In Proceedings of the Fourteenth Americas Conference on Information Systems, Toronto, ON, Canada, 14–17August 2008.
7. Geissdoerfer, M.; Bocken, N.M.; Hultink, E.J. Design thinking to enhance the sustainable business modellingprocess—A workshop based on a value mapping process. J. Clean. Prod. 2016, 135, 1218–1232. [CrossRef]
8. Abdelkafi, N.; Täuscher, K. Business models for sustainability from a system dynamics perspective. Organ.Environ. 2016, 29, 74–96. [CrossRef]
9. Porter, M.E.; Kramer, M.R. The big idea: Creating shared value. Harv. Bus. Rev. 2011, 89, 62–77.10. Nosratabadi, S.; Mosavi, A.; Shamshirband, S.; Zavadskas, E.K.; Rakotonirainy, A.; Wing Chau, K. Sustainable
Business Models: A Review. Sustainability 2019, 11, 1663. [CrossRef]11. Cape Town Declaration on Responsible Tourism. Available online: https://responsibletourismpartnership.
org/cape-town-declaration-on-responsible-tourism/ (accessed on 1 August 2019).12. Peric, M.; Wise, N. Understanding the delivery of experience: Conceptualising business models and sports
tourism, assessing two case studies in Istria, Croatia. Local Econ. J. Local Econ. Policy Unit 2015, 30, 1000–1016.[CrossRef]
13. Global Sustainable Tourism Cuncil, GSTC Criteria for Hotels. GSTC Criteria for tour operators. GSTCCriteria for destinations. 2019. Available online: http://www.gstcouncil.org/gstc-criteria/ (accessed on 1August 2019).
14. Butler, R.W.; Szromek, A.R. Incorporating the Value Proposition for Society with Business Models of HealthTourism Enterprises. Sustainability 2019, 11, 6711. [CrossRef]
15. Herman, K.; Szromek, A.R. A Business Creation in Post-Industrial Tourism Objects: Case of the IndustrialMonuments Route. Sustainability 2019, 11, 1451.
16. Szromek, A. Wskazniki Funkcji Turystycznych. Koncepcja Wskaznika Funkcji Turystycznej i Uzdrowiskowej; Wyd.Politechniki Slaskiej: Gliwice, Poland, 2012.
17. Russo, A.P. The “Vicious Circle” of Tourism Development in Heritage Cities. Ann. Tour. Res. 2002, 29,165–182. [CrossRef]
18. Russo, A.P.; Scarnato, A. Barcelona in common: A new urban regime for the 21st-century tourist city? J.Urban Aff. 2018, 40, 1–20. [CrossRef]
19. Outón, S.M.T. Gentrification, touristification and revitalization of the Monumental Zone of Pontevedra,Spain. Int. J. Tour. Cities 2019, 2/5, 109–124. [CrossRef]
20. Jover, J.; Díaz-Parra, I. Gentrification, transnational gentrification and touristification in Seville, Spain. UrbanStud. 2019. [CrossRef]
50

Sustainability 2020, 12, 1457
21. Kubicki, P. Wpływ studentyfikacji i turystyfikacji na społeczno-kulturowa przestrzen miasta. Miasto. Pamieci Przyszłosc 2017, 2, 63–73. [CrossRef]
22. Health Effects of Gentrification. Centers for Disease Control. Available online: https://www.cdc.gov/healthyplaces/healthtopics/gentrification.htm (accessed on 11 February 2020).
23. McCool, S.F.; Lime, D.W. Tourism Carrying Capacity: Tempting Fantasy or Useful Reality? J. Sustain. Tour.2001, 9, 372–388. [CrossRef]
24. Saveriades, A. Establishing the social tourism carrying capacity for the tourist resorts of the east coast of theRepublic of Cyprus. Tour. Manag. 2000, 21, 147–156. [CrossRef]
25. Lucas, R.C.; Stankey, G.H. Role of Research in Applying the Limits of Acceptable Change System. InProceedings of the Southern Recreation Research Conference, Myrtle Beach, SC, USA, 28 February–1 March1985; pp. 1–15.
26. Frauman, E.; Banks, S. Gateway community resident perceptions of tourism development: IncorporatingImportance-Performance Analysis into a Limits of Acceptable Change framework. Tour. Manag. 2011, 32,128–140. [CrossRef]
27. Nijs, V. Resident Attitudes towards Tourism; Testing the Resident Empowerment through Tourism Scale(RETS) in Bruges. Master’s Thesis, MODUL University, Vienna, Austria, 2017.
28. Overtourism? Understanding and Managing Urban Tourism Growth beyond Perceptions; UNWTO: Madrid, Spain,2018; Available online: https://www.e-unwto.org/doi/pdf/10.18111/9789284420070 (accessed on 20 November2019).
29. Pearce, P.L. Limiting overtourism the desirable new behaviours of the smart tourist. In Proceedings of theTourism Intelligence Forum (t-Forum) Global Exchange Conference 2018, Palma de Mallorca, Spain, 11–13March 2018.
30. Bianchi, R.V. The ‘Critical Turn’ in Tourism Studies: A Radical Critique. Tour. Geogr. 2009, 11, 484–504.[CrossRef]
31. Baretje, R.; Defert, P. Aspects Economiques du Tourisme. Rev. Géographie Alp. 1973, 61-2, 319–320.32. Defert, P. Le Taut de Fonction Touristique: Mise au point et critique. Cah. Tour. 1967, C-13, 33.33. Doxey, G. A causation theory of visitor–resident irritants, methodology and research inferences. The impact
of tourism. In Proceedings of the Sixth Annual Conference Proceedings of the Travel Research Association,San Diego, CA, USA, 8–11 September 1975.
34. Doxey, G.V. When enough’s enough: The natives are restless in Old Niagara. Herit. Can. 1976, 2, 26–27.35. Butler, R.W. The concept of a tourist area cycle of evolution: Implications for management of resources. Can.
Geogr. 1980, 24, 5–12. [CrossRef]36. Butler, R.W. The resort cycle two decades on. In Reflections on Experience; Faulkner, B., Laws, E., Morcado, G.,
Eds.; Cassell: London, UK, 2000; pp. 284–299.37. Butler, R.W. Tourism Area life Cycle. In Contemporary Tourism Reviews; Goodfellow Publishers Limited:
Oxford, UK, 2011; pp. 7–21.38. Plog, S.C. Why Destination Areas Rise and Fall in Popularity. The Cornell Hotel and Restaurant
Administration Quarterly. Cornell Hotel Restaur. Adm. Q. 1974, 14, 55–58. [CrossRef]39. Plog, S.C. Why Destination Areas Rise and Fall in Popularity. The Cornell Hotel and Restaurant
Administration Quarterly. Cornell Hotel Restaur. Adm. Q. 2001, 42, 13–24. [CrossRef]40. Zaidan, E.; Kovacs, J. Resident attitudes towards tourism and tourism growth: A case Study from the Middle
East, Dubai in United Arab Emirates. Eur. J. Sustain. Dev. 2017, 6, 291–307. [CrossRef]41. Ratz, T. Residents’ perceptions of the socio-cultural impact of tourism at lake Balaton, Hungary. In Tourism
and Sustainable Community Development; Richard, G., Hall, D., Eds.; Routledge: London, UK, 2003.42. Soper, A.K. Developing Mauritianness: National Identity, Cultural Heritage Values and Tourism. J. Heritage
Tour. 2007, 2, 94–109. [CrossRef]43. CSO, Central Statistical Office. 2019. Available online: https://stat.gov.pl/ (accessed on 23 October 2019).44. Krakow City Hall. Sustainable Tourism Policy Cracow for the Years 2021–2028; Tourism Department: Krakow,
Poland, 2020.45. Kruczek, Z.; Mazanek, L. Krakow as a Tourist Metropolitan Area. Impact of Tourism on the Economy of the
City. Studia Peregietica 2019, 26. [CrossRef]46. Banaszkiewicz, M. A dissonant heritage site visited. The case of Nowa Huta in Kraków. J. Tour. Cult. Chang.
2017, 15, 185–197. [CrossRef]
51

Sustainability 2020, 12, 1457
47. Tourist Potential and its Exploitation in the Years 2014–2018—Regional Approach; GUS Statistical Office: Rzeszów,Poland, 2019.
48. Greenacre, M.; Hastie, T. The Geometric Interpretation of Correspondence Analysis. J. Am. Stat. Assoc. 1987,82, 437–447. [CrossRef]
49. Stanisz, A. Biostatystyka; Wyd. Uniwersytetu Jagiellonskiego: Kraków, Poland, 2005; pp. 109–409.50. Kendall, M.G. Multivariete Analysis; Charles Griffin: London, UK, 1975; pp. 3–198.
© 2020 by the authors. Licensee MDPI, Basel, Switzerland. This article is an open accessarticle distributed under the terms and conditions of the Creative Commons Attribution(CC BY) license (http://creativecommons.org/licenses/by/4.0/).
52

sustainability
Article
Economic Impact of the Health Insurance System onSlovak Medical Spas and Mineral Spring Spas
Ján Derco 1,*, Piotr Romaniuk 2 and Michal Cehlár 3
1 Faculty of Mining, Ecology, Process Control and Geotechnologies, Technical University of Kosice,Nemcovej 32, 042 00 Kosice, Slovakia
2 Department of Health Policy, School of Health Sciences in Bytom, Medical University of Silesia in Katowice,Ul. Piekarska 18, 41-902 Bytom, Poland; [email protected]
3 Faculty of Mining, Ecology, Process Control and Geotechnologies, Technical University of Kosice, Letna 9,042 00 Kosice, Slovakia; [email protected]
* Correspondence: [email protected]; Tel.: +421-055-602-2443
Received: 15 March 2020; Accepted: 18 April 2020; Published: 21 April 2020
Abstract: The article deals with the financing of spa undertakings through the health insurancesystem. The analysis is based on the financial statements of 28 spa undertakings operating in theSlovak Republic, their contracts with the individual health insurance companies and secondary datasources (accommodation statistics of these undertakings, the number of medical stays paid by clientsthemselves and of those covered by public health insurance, the spa treatment expenditure of thehealth insurance companies, the percentage of this expenditure out of the total expenditure spent bythe health insurance companies on health care). The still significant percentage of revenues from thehealth insurance companies out of the total revenues of spa undertakings shows the prevalence ofthe medical nature of spa care. At the same time, it reflects the current tax measures related to thespa industry and shows that the introduction of a recreation allowance might influence the futuredevelopment of spa care.
Keywords: health insurance; health tourism; medical spas; spa tourism; state support
1. Introduction
In the 20th century, the ownership of spa undertakings and the manner of financing spa carechanged twice in the Slovak Republic. The first fundamental social and economic changes occurredafter World War II. It has been noted that “these changes radically changed the quantitative andqualitative parameters of Slovak spas. The traditional picture of spa life as a leisure time and a way ofsocial and cultural enjoyment was ideologically unacceptable for communists. With the rise of statecentralization, regulated economy and state-owned health and social services, a significant reductionof the spa network took place” [1]. Act No. 125/1948 on the nationalization of natural healing springsand on the incorporation and management of confiscated property of 1948 was crucial for the fate ofSlovak spas. Thus, the State acquired the exclusive right to dispose of the healing springs and the titleto the property of the spas. The Act was also the first step towards the inclusion of the spa industry in aunified health system, excluding its economic use and inbound tourism [2]. Finally, the nationalizationprocess resulted in all spa facilities being run by the single operator—the Czechoslovak State Spas [3].Notably, “after the nationalization of spas and springs in 1948, the ratio between patients sent fortreatment by the national insurance company and private spa guests (self-payers) began to changesignificantly. In 1948, policyholders (state-insured patients) accounted for only about 15% of all spaguests. In 1953, the ratio was already reversed—85% accounted for policyholders and only 15% forprivate spa guests—self-payers. In 1954, only 244 domestic and 53 foreign clients received treatment atthe spas managed by the Main Administration of Specialized Medical Institutes, Spas and Springs at
Sustainability 2020, 12, 3384; doi:10.3390/su12083384 www.mdpi.com/journal/sustainability53

Sustainability 2020, 12, 3384
their own expense. Although the number of beds reserved for self-payers had been growing since1955, the percentage of spa clients who paid for their stays themselves was less than 2%. In these earlyyears, the importance of spas as recreation and tourism centers was underestimated. New constructionbegan in the 1960s of the 20th century, but not everywhere and not at the same time” [4].
The second significant change of the Slovak spas was their economic transformation duringthe changed political and social conditions that developed after 1990. According to the originalplans, the restructuring of the state-owned Slovak medical spas was intended to create 14 joint-stockcompanies with 51% state participation, 5% was earmarked for voucher privatization, 5% intendedfor the municipalities in whose territories the spas were located, 3% for restitutions and 36% forpublic auction [5]. As the spa industry was considered to be one of the most lucrative and promisingeconomic sectors within the Slovak economy, there was a lot of interest in its privatization. As a result,the original privatization plan was changed [6]. The municipal shareholdings rose to 10% and theshareholding intended to be sold within a public tender was increased to 51%. On the other hand,the shareholding allocated to the National Property Fund of the Slovak Republic decreased to 20–34%(state-owned shareholdings) [5]. The privatization of the spa undertakings was expected to help restoredilapidated buildings, improve services, invest in the renewal of healing springs and bring an influx offoreign clients [6]. For most of the spas, this process took place in the period of 1995–1997 [1]. The waythe privatization was carried out [7] was questioned and criticized by the public. Responses to thiscriticism led to the transformation of the state-owned undertakings into newly formed joint-stockcompanies whose statutes guaranteed the preservation of the medical character of the spas. For thispurpose, the state-owned General Health Insurance Company (Všeobecná zdravotná poist’ovna)retained minority shareholdings in the spa undertakings. The privatization of the Slovak medical spaswas accompanied by legislative reforms affecting the Slovak spa industry and spa care [6].
The other changes that affected spa care were (1) the emergence of the health insurance market inthe early 1990s and (2) the changeover in the spa care financing from the state to the health insurancecompanies in 2004. The health insurance system started to operate based on Act No. 7/1993 Coll. on theestablishment of the National Insurance Company and on the financing of health, sickness and pensioninsurance. The Act led to the establishment of a single insurance company on 1 January 1993, whichwas the holder of compulsory health, sickness and pension insurance. The incompatibility of all threesystems led to problems. The lack of finances in the health sector was, inter alia, caused by the fact thatthe state was not able to fully comply with its obligations to pay insurance for a large economicallypassive/inactive population. This subsequently created a problem of insufficient financing of healthcare. Due to these and other reasons, the National Insurance Company ceased to exist, and both theSocial Insurance Agency responsible for the sickness and pension insurance system and the state-ownedhealth insurance company (Všeobecná zdravotná poist’ovna) were established on 1 January 1995.Pursuant to Section 49 of Act No. 274/1994 Coll. on the Social Insurance Agency, spa care was coveredby a special Social Insurance Agency account into which money was paid by the state. Under ActNo. 273/1994 Coll., private health insurance companies could also be established from 1 January 1995.The health insurance market has stabilized gradually; there is currently only one state-owned healthinsurance company (Všeobecná zdravotná poist’ovna), and there are two private health insurancecompanies (Dôvera and Union) [6,8]. The Social Insurance Agency significantly reduced the purchaseof ‘spa vouchers’ and the expenditures related to spa care. Therefore, the responsibility to pay for spacare was transferred from the Social Insurance Agency to the health insurance companies in 2004.
“Natural Curative Spas are medical facilities where healthcare is provided to stabilise the stateof health, regeneration of health or prevention of diseases and which use natural healing wateror weather conditions suitable for treating recognised under Act 538/2005 Coll. to provide healthcare” [9]. “Spa care indicated for health reasons is fully (category A) or partially (category B) coveredby public health insurance. The indications and length of medical stays (21–28 days) are set forth inAct No. 577/2004 on the Scope of Health Care Covered by Public Health Insurance and on Paymentsfor Services related to the Provision of Health Care” [10]. In the case of medical spa stays under
54

Sustainability 2020, 12, 3384
Category A, the insurance companies reimburse the costs of accommodation, catering services andspa care. However, clients have the option to pay for a higher standard of these services. The clientsonly pay a statutorily prescribed charge (€1.70 per night) and a local accommodation tax. In thecase of indications of Category B, the insurance companies only reimburse the costs of health care(medical examination including diagnostic services, three treatment procedures per day on averageand the administration of medicines in the case of acute diseases or deterioration of the state of health).Accommodation and catering services are chosen and paid by the clients themselves [11]. The financialstability of these undertakings is based on the balance between medical products covered by publichealth insurance and medical and wellness products reimbursed by patients [10]. Qualifying patientinto Category A or B is dependent on the disease being treated, as specified in the Appendix 6 to ActNo. 577/2004 on the Scope of Health Care Covered by Public Health Insurance and on Payments forServices related to the Provision of Health Care.
Regulation of prices related to spa care by health insurance companies does not take into accountthe needs of spa businesses but mainly the needs of insurance companies. In Slovakia [11–15], the CzechRepublic [14,16] and Poland [17–23], spa therapy is an integral part of the public health system, butmedical facilities providing these services also act as tourist establishments. The uncertainty offinancing products with strong medical backgrounds have forced businesses to look for new productsto be offered in this sector, the financing of which would not be bound only to public finances. Shortstays marketed as wellness, medical wellness or relaxation include activities aimed at improvingmental and physical conditions, as these treatments are not specifically used for the treatment ofconcrete diseases. Its funding is not regulated and prices reflect actual costs [9].
Smith and Puczkó [24] described regional and cultural differences in understandings of Europeanhealth and wellness tourism in Northern, Western, Southern, Central and Eastern Europe. It is difficultto compare medical services provided in the Slovak spas with those of other destinations [25–35]. Thisis due to the different legislative framework in each country. There is also variance in the level ofsocial or health care coverage. The issues of the spas’ orientation towards the target clientele accordingto the analyzed forms of reimbursement, the dependence of their financing on the health insurancesystem and the percentage of such financing (plus other factors mentioned in this article) are crucialin any legislative changes and discussion about them. An example of this is the crisis situation inthe Czech Republic in 2013 after the adoption of a restrictive indication list, which shortened thelength of spa stays for certain diagnoses, reduced re-stays, introduced regulatory fees and canceled thereimbursement of stay costs for certain diagnoses from public health insurance [32,35]. The currentlegislative framework for this kind of business imposes strict requirements not only on the materialand technical equipment and staff of natural medical spas, but also on the use and protection of naturalhealing springs, their monitoring, recognition of climatic conditions suitable for treatment and theirprotection, the protection of the spa area and spa environment requirements. Meeting these criteriarequires resources to cover costs which are not expended by hotels focused solely on the wellnesssegment. This aspect should be taken into account when assessing the competitiveness of spa facilitiesand non-medical facilities. At the same time, however, the issue of financing these undertakings isimportant not only for the undertakings themselves and for the local economy built on the use ofnatural healing springs in spa facilities, but also in terms of the aforementioned environmental aspectsand a sustainable spa care concept.
The aims of this article are:
1. to analyze the development and changes of financial conditions related to spa treatment inSlovakia in years 2006–2018. We also analyze the percentage of medical spa care expenditurecompared to the total health care expenditure of the health insurance companies.
2. to determine the proportion/importance of the medical segment covered by public health insurancein relation to the segment of self-payers seeking wellness or medical wellness (care under medicalsupervision with the use of natural healing springs for balneotherapy).
55

Sustainability 2020, 12, 3384
3. to analyze correlations between revenues of spas and after-tax profits of spas with the factorsdetermining their infrastructural and financial environment.
2. Materials and Methods
Mainil et al. [36] states that “distinguishing the size of each of the markets in health tourism(i.e., medical, wellness and spa tourism) in the EU is difficult due to the limited and fragmented dataavailable and the wide (and often overlapping) scope of the definitions used by different sourcesand statistical bureaus”. This analysis is based on secondary data sources [37–51]. The data on theamount of financially recognized services paid out of public health insurance to natural medical spasand the percentage of this expenditure out of the total expenditure spent by the health insurancecompanies on health care are sourced from the Reports on the state of public health insurance for2005–2018, as published by the Health Care Surveillance Authority [52–65]. The current amount ofreimbursements is obtained from the contracts between the individual health insurance companiesand the spa undertakings. The accommodation statistics contain data from Monthly AccommodationFacility Activities Reports to be submitted by the accommodation facilities to the Statistical Office ofthe Slovak Republic. The National Health Information Centre collects client data through CompletedSpa Treatment Reports and the Annual Report on Natural Medical Spas.
The data on revenues (from the sale of services and goods) and after-tax profits of 28 naturalmedical spas operating in the Slovak Republic have been obtained from the public register of financialstatements (http://www.registeruz.sk/cruzpublic/domain/accountingentity/simplesearch), which hasbeen publishing the financial statements of companies since 2013. For the purpose of statistical analyses,we applied descriptive statistical methods as well as the Shapiro-Wilk test to verify the normality ofdistribution of data. Since non-normal distribution had been observed in most cases, the correlationanalyses were performed using non-parametric methods, namely Spearman’s correlation test [31] andKendall’s tau test. All statistical analyses were performed using Statistic aver. 13.3 software (TIBCO,Palo Alto, CA, USA).
3. Results
Table 1 provides basic information on the financing of medical spa treatment by public healthinsurance in Slovakia in the years 2006–2018, along with data on total revenues of the spa companiesfor the years 2013–2018 and their profits in the same period. From the presented data, we can observethat in 2006–2018, the amount of expenditure of insurance companies on medical spa treatment grewon a year-over-year basis, with the exception of the years 2012, where the amount was comparable tothe previous year, and 2014, where a decrease appeared compared to 2013. The growth in nominalexpenditure however did not directly translate into the increase of the share of spending on spatreatment in the total expenditure of health insurance companies. In the reporting period, this shareaccounted for 0.88–1.5% of total expenditure, presenting an upward trend up to 2011, but decreasingin the following years, despite general increase in nominal expenditure. The total revenues of spacompanies in a given period generally showed a growing trend, while the share of income gainedfrom insurance companies in their total revenues, after a decrease between 2013 and 2014, generallyremained at a similar level, with some slight fluctuations between years. A similar situation tendsto appear in terms of spa companies’ profits, which do not show a clear trend, although losses onlyappeared once instead of profits, and profits generally appeared to be visibly higher in 2018 comparedto in previous years.
To verify what the possible determinants of spa companies’ financial results are, we decided toapply correlation tests comparing companies’ revenues and profits with a set of factors potentiallydetermining them. Results are presented in Table 2.
56

Sustainability 2020, 12, 3384
Table 1. Services of spa undertakings financially recognized by the health insurance companies(EUR) and their percentage in the total health care expenditures of the health insurance companies in2006–2018, revenues (from the sale of services and goods) and profits/losses of spa undertakings (EUR)in 2013–2018.
2006 2007 2008 2009 2010 2011 2012
Public health insurance expenditure onmedical spa treatment 16,698,883 25,546,905 36,240,453 42,156,543 44,680,727 49,241,510 46,429,978
Percentage of medical spa treatmentexpenditure out of the total expenditure
of the health insurance companies0.88 1.04 1.23 1.31 1.35 1.50 1.38
2013 2014 2015 2016 2017 2018Public health insurance expenditure on
medical spa treatment 49,524,141 47,867,905 48,924,934 52,365,195 52,887,253 56,112,848
Percentage of medical spa treatmentexpenditure out of the total expenditure
of the health insurance companies1.39 1.25 1.23 1.24 1.00 1.25
Revenues of spa undertakings in2013–2018 139,655,694 146,578,286 146,347,229 156,236,005 162,570,995 169,661,551
Percentage of reimbursements from thehealth insurance companies in the
revenues of spa undertakings35.46 32.66 33.43 33.52 32.53 33.07
After-tax profits of spa undertakings in2013–2018 4,866,307 4,092,029 5,830,157 −2,403,112 5,687,645 6,114,908
Source: [52–65], The data on revenues (from the sale of services and goods) and after-tax profits of spa undertakingshave been obtained from the public register of financial statements (http://www.registeruz.sk/cruzpublic/domain/accountingentity/simplesearch).
Table 2. Spearman’s and Kendall’s tests comparing companies’ after-tax profits and revenues with aset of factors potentially determining them.
Kendall’s Tau Profits Revenues
Numbers of beds −0.333333 −0.600000Number of domestic visitors 0.066667 0.600000
Number of which medical stays reimbursed by the insurance company 0.066667 0.866667Number of which medical stays reimbursed by the patient 0.466667 0.733333
Number of nights spent at spa companies by domestic visitors 0.200000 0.733333Number of foreign visitors −0.333333 −0.333333
Number of medical stays reimbursed by the insurance company −0.466667 −0.200000Number of medical stays reimbursed by the patient −0.333333 −0.333333
Number of nights spent at spa companies by foreign visitors −0.333333 −0.866667Total number of visitors 0.066667 0.600000
Total number of nights spent at spa companies 0.066667 0.866667Number of medical stays in spa facilities 0.333333 0.600000
Public health insurance expenditure on medical spa treatment (EUR) 0.333333 0.600000Total healthcare expenditures financially recognized by the health insurance companies (EUR) 0.333333 0.866667The percentage of medical spa care expenditure out of the total health care expenditure of the
health insurance companies −0.200000 −0.200000
Gross Domestic Product of Slovakia at current prices (nominal GDP) (Million EUR) 0.333333 0.866667
Spearman’s Test Profits Revenues
Numbers of beds −0.371429 −0.657143Number of domestic visitors 0.028571 0.771429
Number of medical stays reimbursed by the insurance company 0.142857 0.942857Number of medical stays reimbursed by the patient 0.542857 0.828571
Number of nights spent at spa companies by domestic visitors 0.314286 0.885714Number of foreign visitors −0.600000 −0.428571
Number of medical stays reimbursed by the insurance company −0.657143 −0.257143Number of medical stays reimbursed by the patient −0.485714 −0.485714
Number of nights spent at spa companies by foreign visitors −0.485714 −0.942857Total number of visitors 0.028571 0.771429
Total number of nights spent at spa companies 0.142857 0.942857Number of medical stays in spa facilities 0.428571 0.771429
Public health insurance expenditure on medical spa treatment (EUR) 0.428571 0.771429Total healthcare expenditure financially recognized by the health insurance companies (EUR) 0.485714 0.942857The percentage of medical spa care expenditure out of the total health care expenditures of the
health insurance companies −0.257143 −0.257143
Gross Domestic Product of Slovakia at current prices (nominal GDP) (Million EUR) 0.485714 0.942857
Source: processed by P.R.
57

Sustainability 2020, 12, 3384
Both Spearman’s and Kendall’s tests showed similar results, despite some slight differences inexact values of the correlation coefficient. We found that both revenues and profits are negativelyand with a moderate or weak strength correlated with the global number of beds in spa companies,which may be interpreted as a symptom of the restructuring processes taking place in the companiesand their efforts to optimize infrastructure. Similarly, a negative correlation appears in the case ofthe number of foreign visitors to spa companies operating in Slovakia. This correlation generallyappears to be weak, although a stronger one has been shown by the Spearman’s test in the case ofafter-tax profits. On the other hand, an interesting fact has been observed in relation to the generalnumber of visitors and the number of domestic visitors to spa companies. In both cases a positivecorrelation exists, both with regard to revenues and profits. However, for revenues, this correlationis relatively strong and statistically significant when it comes to the numbers given in categories ofreimbursed and self-paid stays, while in the case of profits, it appears to be positive but extremelyweak. Interestingly, it is stronger, moderate in a general manner, although not statistically significant,for stays self-paid by patients. The dependence on public resources as a main source of income seemsto be reflected by the correlation that appears in the case of total public expenditure on health care.Interestingly, this correlation is higher for general expenditure than for the part intended for spatreatment. Moreover, correlation with the factor showing the share of expenditure on spa treatment ingeneral health expenditure appears to be negative and weak at the same time, while the value of thecorrelation coefficient with Slovak GDP takes the same values as in the case of correlation with generalhealth expenditure.
4. Discussion
In our study, we observed several interesting facts regarding the operation of spa companies inSlovakia. Correlation analyses may lead to an interpretation that companies in general are becomingmore dependent on domestic clients rather than on foreign ones, and that the revenues comingfrom public health insurance play a crucial and probably a growing role as their source of income.Profitability of the stays remains at a low level, being at the same time visibly higher in the case ofself-paid patients. These observations seem to be confirmed by general data regarding development ofthe spa sector in Slovakia. In 2018, 28 Slovak natural medical spas operated 77 accommodation facilities.The total number of clients reached 311,963, of which 248,413 were domestic and 63,550 foreign clients.Out of this number, 72,702 domestic policyholders and 197 foreign policyholders received medical spatreatment paid for by a health insurance company. Another 73,128 domestic clients and 33,186 foreignclients received medical spa treatment paid by the patients themselves. Spa treatment is most oftenindicated for a group of musculoskeletal disorders—Vertebrogenic syndrome with transient painfulspine disorders, post-traumatic conditions or conditions after musculoskeletal operations (mainlyrelated to the following diagnoses: M40–M54 Spine and back diseases, M17 Gonarthrosis—arthrosis ofthe knee joint and M16 Coxarthrosis—arthrosis of the hip joint). The next most common reasons fortreatment are non-tuberculous respiratory diseases and circulatory system diseases [66]. The remainingclients are accompanying persons (spouse of the client, mother with a child on medical stay, guidefor the disabled) or guests who buy non-medical wellness products (such as weekend wellness staysincluding access to the aqua park, saunas or steam baths, but without a prescription for traditionalbalneological procedures provided by a specialist).
The rate of occupancy of permanent beds in the spa undertakings reached 66.3%. The averagenumber of overnights spent by domestic visitors was 9.4 and of those spent by foreign visitors was 7.2.When comparing these data with the data for 2005–2017 [10,37,38], it can be stated that: (1) an increasein the total number of clients occurred; (2) an increase in the number of medical stays of domesticclients covered by public health insurance (in 2018) or of those who paid themselves for their stays(in 2016–2018) occurred, (3) the number of foreign visitors has stabilized since 2009, (4) the traditionalexploitation of natural healing springs for treatment, its connection to the public health insurancesystem and the level of spa treatments resulted in an increasing prevalence of medical stays (according
58

Sustainability 2020, 12, 3384
to data on the total number of clients and the number of clients who received medical spa treatment).In 2006–2018, the amount of financially recognized services performed by spa undertakings grewon a year-over-year basis, with the exception of the years 2012 and 2014. In the reporting period,the percentage of this expenditure out of the total health care expenditure of the health insurancecompanies accounted for 0.88–1.5%. A noteworthy fact is that the share of expenditure on spa servicesin the case of Slovak health insurance generally appears to be higher than for in neighbouring Poland,where after implementation of the health insurance in 1999, it remains at relatively stable level ofcirca 1% [67,68]. Despite this fact, the Association of Slovak Spas proposes that the percentage of spacare expenditures be increased. This proposal seems to be well grounded in data regarding financialoperation of spa companies, where the increase of stays and income not necessarily translates intobetter financial stability and profitability, as shown in our study, especially by the negative correlationbetween the share of spa treatment expenditure out of general health expenditure for health insurance.It is likely that the revenues and income of spa companies reflect the general condition of the Slovakeconomy, and thus its influence on health care financing, rather than any changes in policy of insurancecompanies regarding spa treatment. This observation is similar to that in Poland, where the expenditureare is perceived as being insufficient to sustain financial stability of the spa companies, despite thenominal increase in expenditure [69].
The share of reimbursements from the health insurance companies in 2013–2018 accounted forapproximately one third of the revenues of spa undertakings. The losses reported in the spa sectorin 2016 were due to the poor economic performance of one spa, which is currently being restructured.The impact of restrictive measures of the health insurance companies on the economy of the individualspa companies is mainly reflected in the amount of reimbursement provided by the health insurancecompanies per patient (treatment day). The amount of reimbursements by the health insurancecompanies per treatment day for indication group A ranges between €32.50 and €50.50, and forindication group B it ranges between €20.00 and €24.30. The current situation is a natural consequenceof the health insurance companies giving their preference to reimbursements for medicines, outpatientcare and institutional care in hospitals. The solution is the currently adopted state support foraccommodation facilities, including spa undertakings (in the segments of medical stays not covered bypublic health insurance, medical stays for indication group B, stays designated as medical wellness orwellness paid by self-payers), investments into the reconstruction and modernization of buildings,better promotion in the countries that are the main source markets (Czech Republic, Germany, Israel,Poland, Russia and Austria). For Europe, Directive 2011/24/EU on the application of patients’ rightsin cross-border healthcare regulates patients’ rights for reimbursement in cross-border health careand has an important impact on the mobility of medical tourists. Four Slovak spa facilities hold theinternational European quality certificate EuropeSpa med. This certification is of particular importanceif the spas wish to provide spa care to foreigners to a larger extent.
The state support for accommodation facilities, including spa undertakings, is based on fourinstruments. (1) Decreasing the value-added tax [70] on accommodation services from 20% to 10% as of1 January 2019. (2) At the same time, as of 1 January 2019, an entity employing more than 49 employeesis obliged to provide a recreation allowance. Employees, whose employment relationship with theemployer lasts for at least 24 consecutive months, may apply for a recreation allowance from theemployer. The employer is obliged to pay the employee a recreation allowance in the amount of 55%of the recreation expenses, but not more than €275 per calendar year. Eligible recreation expenses areexpenses demonstrably incurred by the employee on tourism services related to accommodation for atleast two nights in the Slovak Republic. The employer is obliged to contribute not only to the recreationof the employee, but also to the recreation of the spouse and the child of the employee and otherpersons living in a common household with the employee, provided that they are on holiday togetherwith the employee. From the employee’s point of view, recreation allowances provided to the employeeby his/her employer are exempt from income tax, while the employee and employer do not payany health and social insurance contributions on such allowances. For employers (including natural
59

Sustainability 2020, 12, 3384
persons with income from business and other self-employment activities), recreation allowances are atax-deductible expense according to Act No. 595/2003 Coll. on Income Tax, which reduces their incometax base. This support could increase the percentage of short-term wellness stays in the following years.(3) Demonstrably paid reimbursements related to spa care incurred in natural medical spas shall, from1 January 2018, be deemed a non-taxable part of a natural person’s tax base. The non-taxable part ofthe tax base for spa care may include payments for spa treatments provided, including payments formeals and accommodation made by the taxpayer and which are not paid to the natural person fromother sources, e.g., paid out of public health insurance or by the employer as a recreation allowance,while the duration of the stay in the spa is not decisive. The non-taxable part of the tax base for spacare may be applied by a natural person as evidenced by proof of payment, but cannot be more than€50 per year for each person for whom the non-taxable part of the tax base is applied (spouse andchild). (4) At the same time, more favorable tax treatment is given to reconstruction and modernizationworks on buildings which are located in the spa area, are used for spa care, and are part of a naturalmedical spa. From a tax perspective, they are treated as other assets that are depreciated separatelyfrom the building (which are currently depreciated over a period of 40 years) and are included in thedepreciation group with a depreciation period of 6 years.
The limiting factor of this study is the fact that it does not take into account the impact ofgovernmental instruments furthering domestic and spa tourism. The assessment of medicallyrecognized services submitted by natural medical spas for settlement (and checked in the healthinsurance information system) may result in more accurate results. At the same time, further researchshould focus on the cost-benefit analysis of the costs of additional pharmacological treatment andreimbursements to physiotherapeutic rehabilitation clinics and departments in the event that spatreatment expenditure is reduced by health insurance companies. As such, further research is stillrequired in this field.
5. Conclusions
Financial resources for spa treatment coming from public health insurance generally showeda growing trend in years 2006–2018. Nonetheless, the share of expenditure on spa treatment out ofgeneral expenditure on health services, after an increase between the years 2006–2011, did not showany clear trend in the following years, appearing in a scale between 1 and 1.39% in the second partof the investigated period. Public health insurance appears to be the dominant source of incomefor spa companies operating in Slovakia, having the biggest influence on its revenues. Self-payingpatients in turn seem to be more profitable for spa companies. A decreasing role of foreign patients ingenerating income for spa companies appears in the investigated period. The possibility of attractingforeign visitors seems not to be taken advantage of by the companies in a scale adequate to itspotential. Revenues of spa companies in Slovakia show the highest correlation with domestic visitors’medical stays paid by health insurance, as well as with general health expenditures of health insurancecompanies and GDP of the Slovak Republic. The revenues therefore reflect the general condition ofthe Slovak economy and its influence on health care financing rather than any changes in policy ofinsurance companies regarding spa treatment. The level of financing spa treatment by health insuranceis being perceived as being too low, which is confirmed by visibly weak correlations between spacompanies’ after-tax profits and medical stays covered by health insurance, as well as general spendingof health insurance funds on spa treatment.
Author Contributions: Conceptualization, J.D. and P.R.; Methodology, J.D. and P.R.; Software, P.R.; Validation,J.D. and P.R.; Formal Analysis, P.R.; Investigation, J.D. and P.R.; Resources, J.D. and P.R.; Data Curation, J.D.and P.R.; Writing—Original Draft Preparation, J.D., P.R. and M.C.; Writing—Review and Editing, J.D. and P.R.;Visualization, J.D. and P.R.; Supervision, J.D. and P.R.; Project Administration, M.C.; Funding Acquisition, M.C.All authors have read and agreed to the published version of the manuscript.
Funding: The article was publishing as a part and with financial support of the Scientific Grant Agency of theMinistry of Education, Science, Research and Sport of the Slovak Republic and the Slovak Academy of SciencesNo. VEGA 1/0515/18 “The decision-making model of process of evaluating raw material policy of regions”.
60

Sustainability 2020, 12, 3384
Conflicts of Interest: The authors declare no conflict of interest. The funders had no role in the design of thestudy; in the collection, analyses, or interpretation of data; in the writing of the manuscript, or in the decision topublish the results.
References
1. Kasagranda, A.; Gurnák, D. Spa and Wellness Tourism in Slovakia (A Geographical Analysis). Czech J. Tour.2017, 6, 27–53. [CrossRef]
2. Fialová, D.; Orosz, Ö. Vývoj lázenství na území dnešního Slovenska (v období od konce 16. století do soucasnosti)[Development of spa industry in the territory of present-day Slovakia (from the end of the 16th century to thepresent)]. Klaudyán: Internetový Casopis Pro Hist. Geogr. A Enviromentální Dejiny 2012, 8–9, 94–106.
3. Kraftová, I.; Masuyama, Y.; Mateja, Z.; Kornfeldová, M. Spolecenská odpovednost v lázenství: Shody círozdíly? (Komparativní studie céskeho a Japonského prostredí) [Corporate social responsibility in spaindustry: Equalities or differences? (comparative study of Czech and Japanese environment)]. E+M Ekon. AManag. 2011, 14, 123–136.
4. Mulík, J. Dejiny kúpel’ov a kúpel’níctva na Slovensku [History of spas and spa industry in Slovakia], 1st ed.; Osveta:Martin, Czechoslovakia, 1981; p. 187.
5. Eliašová, D. Slovenské kúpel’níctvo v 20. Storocí [Slovak spas in the 20th century], 1st ed.; Ekonóm: Bratislava,Slovakia, 2009; p. 201.
6. Kmeco, L’. Development of the Spa Industry and Its Legislation in Slovakia since 1989. Studia Tur. 2019, 10, 37–49.7. Williams, A.M.; Baláž, V. Privatisation and the development of tourism in the Czech Republic and Slovakia:
property rights, firm performance, and recombinant property. Environ. Plan. A 2000, 32, 715–734. [CrossRef]8. Nemec, J.; Lawson, C. Health policy in Slovakia and the outcomes of health care reforms: 1989–2003. J. Comp.
Policy Anal. Res. Pract. 2005, 7, 49–71. [CrossRef]9. Derco, J. The Slovak spas in the light of the health care system. Tour. Plan. Dev. 2014, 11, 243–252. [CrossRef]10. Derco, J.; Pavlisinova, D. Financial position of medical spas–the case of Slovakia. Tour. Econ. 2017, 23,
867–873. [CrossRef]11. Derco, J. Impact of health care funding on financial position of Slovak medical spas. Turiz. Međunarodni
Znan. Strucni Casopis 2017, 65, 376–380.12. Holub, D.; Magurová, H.; Kropaj, M. Legislation of spa industry as a part of tourism in the Slovak Republic.
In Právo v Podnikání Vybraných Clenských Státu Evropské Unie, 1st ed.; Štepánková, K., Ed.; TROAS Ltd.:Prague, Czech Republic, 2017; Volume 9, pp. 78–84.
13. Kerekeš, J. Kúpel’níctvo a jeho Význam v Turizme [Spa industry and its importance in tourism], 1st ed.; WeltprintLtd.: Bratislava, Slovakia, 2018; p. 285.
14. Kotikova, H.; Schwartzhoffova, E. Health and spa tourism in the Czech and Slovak Republics. In Medicaltourism: The Ethics, Regulation, and Marketing of Health Mobility, 1st ed.; Hall, C.M., Ed.; Routledge: Abingdon,UK, 2013; pp. 109–122. [CrossRef]
15. Marceková, R.; Pompurová, K.; Gúcik, M. Zdravotný Cestovný Ruch [Health tourism], 1st ed.; Belianum MatejBel University Press: Banská Bystrica, Slovakia, 2015; p. 168.
16. Vystoupil, J.; Šauer, M.; Bobková, M. Spa, Spa Tourism and Wellness Tourism in the Czech Republic. Czech J.Tour. 2017, 6, 5–26. [CrossRef]
17. Dryglas, D.; Rózycki, P. Profile of tourists visiting European spa resorts: a case study of Poland. J. Policy Res.Tour. Leis. Events 2017, 9, 298–317. [CrossRef]
18. Dryglas, D.; Salamaga, M. Segmentation by push motives in health tourism destinations: A case study ofPolish spa resorts. J. Destin. Mark. Manag. 2018, 9, 234–246. [CrossRef]
19. Dryglas, D.; Salamaga, M. Applying destination attribute segmentation to health tourists: A case study ofPolish spa resorts. J. Travel Tour. Mark. 2017, 34, 503–514. [CrossRef]
20. Kapczynski, A.; Szromek, A.R. Hypotheses concerning the development of polish spas in the years 1949–2006.Tour. Manag. 2008, 29, 1035–1037. [CrossRef]
21. Szromek, A.R.; Wybranczyk, K. Proposal of Value for Customer of Spas: Expectations of Spa Patients andTourist in Polish Spas. Sustainability 2019, 11, 3598. [CrossRef]
22. Szromek, A.R.; Naramski, M. A Business Model in Spa Tourism Enterprises: Case Study from Poland.Sustainability 2019, 11, 2880. [CrossRef]
61

Sustainability 2020, 12, 3384
23. Szromek, A.R.; Romaniuk, P.; Hadzik, A. The privatization of spa companies in Poland - an evaluation ofpolicy assumptions and implementation. Health Policy 2016, 120, 362–368. [CrossRef]
24. Smith, M.; Puczkó, L. Taking your life into your own hands? New trends in European health tourism.Tour. Recreat. Res. 2010, 35, 161–172. [CrossRef]
25. Gustavo, N.S. A 21st-century approach to health tourism spas: The case of Portugal. J. Hosp. Tour. Manag.2010, 17, 127–135. [CrossRef]
26. Vilar Rodriguez, M.; Lindoso Tato, E. From the belle epoque to the new era of spa tourism: spas in Spain inhistorical perspective (1874–2016). AYER 2019, 114, 23–64.
27. Smith, M. Baltic health tourism: Uniqueness and commonalities. Scand. J. Hosp. Tour. 2015, 15, 357–379. [CrossRef]28. Matlovicová, K.; Šimcík, D. Spa and Wellness Tourism in Estonia. Geogr. Cassoviensis 2010, 4, 108–113.29. Snoj, B.; Mumel, D. The measurement of perceived differences in service quality—The case of health spas in
Slovenia. J. Vacat. Mark. 2002, 8, 362–379. [CrossRef]30. Nikoli, G.; Lazakidou, A. A review of thermal tourism in Europe and Greece. Turiz. Međunarodni Znan.
Strucni Casopis 2019, 67, 318–322.31. Vrkljan, S.; Hendija, Z. Business performance of health tourism service providers in the Republic of Croatia.
Acta Clin. Croat. 2016, 55, 79–85. [CrossRef] [PubMed]32. Trnka, S. Efficacious holidays: The therapeutic dimensions of pleasure and discipline in Czech respiratory
spas. Med Anthropol. Q. 2018, 32, 42–58. [CrossRef]33. Pforr, C.; Locher, C. The German spa and health resort industry in the light of health care system reforms.
J. Travel Tour. Mark. 2012, 29, 298–312. [CrossRef]34. Hofer, S.; Honegger, F.; Hubeli, J. Health tourism: definition focused on the Swiss market and conceptualisation
of health(i)ness. J. Health Organ. Manag. 2012, 26, 60–80. [CrossRef]35. Vavrecková, E.; Stuchlíková, J.; Dluhošová, R. The Results of the Development of Balneal Care Provision and
the State of the Czech Spa Industry in Connection with the Changes in Legislation. Czech J. Tour. 2017, 6,93–104. [CrossRef]
36. Mainil, T.; Eijgelaar, E.; Klijs, J.; Nawijn, J.; Peeters, P. Research for TRAN Committee—Health Tourism in the EU:A General Investigation, 1st ed.; European Parliament, Policy Department for Structural and Cohesion Policies:Brussels, Belgium, 2017; p. 27.
37. Spa Tourism 2018—Accommodation Statistics of Tourism in Slovakia. Available online: https://www.mindop.sk/ministerstvo-1/cestovny-ruch-7/statistika/kupelny-cestovny-ruch (accessed on 5 December 2019).
38. Health Statistics Yearbook of the Slovak Republic 2018. Available online: http://www.nczisk.sk/Statisticke_vystupy/Zdravotnicka_rocenka/Pages/default.aspx (accessed on 5 December 2019).
39. Health Statistics Yearbook of the Slovak Republic 2017. Available online: http://www.nczisk.sk/Statisticke_vystupy/Zdravotnicka_rocenka/Pages/Archiv.aspx (accessed on 5 December 2019).
40. Health Statistics Yearbook of the Slovak Republic 2016. Available online: http://www.nczisk.sk/Statisticke_vystupy/Zdravotnicka_rocenka/Pages/Archiv.aspx (accessed on 5 December 2019).
41. Health Statistics Yearbook of the Slovak Republic 2015. Available online: http://www.nczisk.sk/Statisticke_vystupy/Zdravotnicka_rocenka/Pages/Archiv.aspx (accessed on 5 December 2019).
42. Health Statistics Yearbook of the Slovak Republic 2014. Available online: http://www.nczisk.sk/Statisticke_vystupy/Zdravotnicka_rocenka/Pages/Archiv.aspx (accessed on 5 December 2019).
43. Health Statistics Yearbook of the Slovak Republic 2013. Available online: http://www.nczisk.sk/Statisticke_vystupy/Zdravotnicka_rocenka/Pages/Archiv.aspx (accessed on 5 December 2019).
44. Health Statistics Yearbook of the Slovak Republic 2012. Available online: http://www.nczisk.sk/Statisticke_vystupy/Zdravotnicka_rocenka/Pages/Archiv.aspx (accessed on 5 December 2019).
45. Health Statistics Yearbook of the Slovak Republic 2011. Available online: http://www.nczisk.sk/Statisticke_vystupy/Zdravotnicka_rocenka/Pages/Archiv.aspx (accessed on 5 December 2019).
46. Health Statistics Yearbook of the Slovak Republic 2010. Available online: http://www.nczisk.sk/Statisticke_vystupy/Zdravotnicka_rocenka/Pages/Archiv.aspx (accessed on 5 December 2019).
47. Health Statistics Yearbook of the Slovak Republic 2009. Available online: http://www.nczisk.sk/Statisticke_vystupy/Zdravotnicka_rocenka/Pages/Archiv.aspx (accessed on 5 December 2019).
48. Health Statistics Yearbook of the Slovak Republic 2008. Available online: http://www.nczisk.sk/Statisticke_vystupy/Zdravotnicka_rocenka/Pages/Archiv.aspx (accessed on 5 December 2019).
62

Sustainability 2020, 12, 3384
49. Health Statistics Yearbook of the Slovak Republic 2007. Available online: http://www.nczisk.sk/Statisticke_vystupy/Zdravotnicka_rocenka/Pages/Archiv.aspx (accessed on 5 December 2019).
50. Health Statistics Yearbook of the Slovak Republic 2006. Available online: http://www.nczisk.sk/Statisticke_vystupy/Zdravotnicka_rocenka/Pages/Archiv.aspx (accessed on 5 December 2019).
51. Health Statistics Yearbook of the Slovak Republic 2005. Available online: http://www.nczisk.sk/Statisticke_vystupy/Zdravotnicka_rocenka/Pages/Archiv.aspx (accessed on 5 December 2019).
52. Report on the State of Public Health Insurance for 2018. Available online: http://www.udzs-sk.sk/web/sk/spravy (accessed on 5 December 2019).
53. Report on the State of Public Health Insurance for 2017. Available online: http://www.udzs-sk.sk/web/sk/spravy (accessed on 5 December 2019).
54. Report on the State of Public Health Insurance for 2016. Available online: http://www.udzs-sk.sk/web/sk/spravy (accessed on 5 December 2019).
55. Report on the State of Public Health Insurance for 2015. Available online: http://www.udzs-sk.sk/web/sk/spravy (accessed on 5 December 2019).
56. Report on the State of Public Health Insurance for 2014. Available online: http://www.udzs-sk.sk/web/sk/spravy (accessed on 5 December 2019).
57. Report on the State of Public Health Insurance for 2013. Available online: http://www.udzs-sk.sk/web/sk/spravy (accessed on 5 December 2019).
58. Report on the State of Public Health insurance for 2012. Available online: http://www.udzs-sk.sk/web/sk/spravy (accessed on 5 December 2019).
59. Report on the State of Public Health Insurance for 2011. Available online: http://www.udzs-sk.sk/web/sk/spravy (accessed on 5 December 2019).
60. Report on the State of Public Health Insurance for 2010. Available online: http://www.udzs-sk.sk/web/sk/spravy (accessed on 5 December 2019).
61. Report on the State of Public Health Insurance for 2009. Available online: http://www.udzs-sk.sk/web/sk/spravy (accessed on 5 December 2019).
62. Report on the State of Public Health Insurance for 2008. Available online: http://www.udzs-sk.sk/web/sk/spravy (accessed on 5 December 2019).
63. Report on the State of Public Health Insurance for 2007. Available online: http://www.udzs-sk.sk/web/sk/spravy (accessed on 5 December 2019).
64. Report on the State of Public Health Insurance for 2006. Available online: http://www.udzs-sk.sk/web/sk/spravy (accessed on 5 December 2019).
65. Report on the State of Public Health Insurance for 2005. Available online: http://www.udzs-sk.sk/web/sk/spravy (accessed on 5 December 2019).
66. Spa Care in the Slovak Republic in 2018. Available online: http://www.nczisk.sk/statisticke_vystupy/tematicke_statisticke_vystupy/Kupelna_starostlivost/Pages/default.aspx (accessed on 5 April 2020).
67. Suchecka, J.; Jaworska, R. Finansowanie Publiczne i Realizacja swiadczen lecznictwa uzdrowiskowego wPolsce w latach 2003–2014 [The Public Financing and Implementation of Health Resort Services in Poland inthe years 2003–2013]. Probl. Zarzadzania 2015, 13, 216–230. [CrossRef]
68. Romaniuk, P.; Holecki, T. Finansowanie swiadczen uzdrowiskowych w Polsce [Financing of spa services inPoland]. In Rola Uzdrowisk i Przedsiebiorstw Uzdrowiskowych w Turystyce i Lecznictwie Uzdrowiskowym, 1st ed.;Szromek, A.R., Ed.; Proksenia: Kraków, Poland, 2014; pp. 177–192.
69. Szromek, A.R.; Romaniuk, P. Ubezpieczenie uzdrowiskowe kuracjuszy—Trzy propozycje rozwiazansystemowych w ramach ubezpieczenia zdrowotnego [Spa insurance for patients—Three proposals forsystem solutions as part of health insurance]. In Uzdrowiska i ich funkcja turystyczno-lecznicza, 1st ed.;Szromek, A.R., Ed.; Proksenia: Kraków, Poland, 2012; pp. 275–296.
70. Pavliková, L’.; Bánociová, A.; Jakubíková, E. The Practical Application of Value Added Tax in the SlovakRepublic in the Spa Facilities. Procedia Econ. Financ. 2014, 15, 192–199. [CrossRef]
© 2020 by the authors. Licensee MDPI, Basel, Switzerland. This article is an open accessarticle distributed under the terms and conditions of the Creative Commons Attribution(CC BY) license (http://creativecommons.org/licenses/by/4.0/).
63


sustainability
Article
Sharing Economy and Lifestyle Changes, asExemplified by the Tourism Market
Agnieszka Niezgoda and Klaudyna Kowalska *
Department of International Economics, Institute of International Business and Economics,Poznan University of Economics and Business, Al. Niepodległosci 10, 61-875 Poznan, Poland;[email protected]* Correspondence: [email protected]
Received: 30 April 2020; Accepted: 29 June 2020; Published: 2 July 2020
Abstract: The aim of the article is to analyze the relationship between lifestyle changes and willingnessto use sharing economy services in tourism, including peer-to-peer accommodation. On the one hand,knowledge of lifestyle changes can help adapt the product offer to the requirements of consumers.On the other hand, products that consumers use can reflect lifestyle changes. The followingclassification of motivations for sharing economy activity selection resulting from the subjects’ lifestyleshas been proposed: personal motivations—related to economic advantages; social (conformist)motivations—resulting from the need to fit in with others; and ideological motivation—resulting fromthe understanding of the processes of natural environment degradation and excessive consumption.In order to gather opinions and to understand behaviors, attitudes, and preferences regarding sharingeconomy activities (i.e., the sharing of transportation, food, clothes, equipment, and accommodation),the focus group interview method was used (6 groups, 5–8 participants each). Discussions wereconducted separately for two populations: young with time (YT) and older rich (OR). The studydemonstrates lifestyle changes between the generations. YT actions are the consequence of personaland ideological motivations. OR have lifestyles that result from personal and conformist motivations.Neither population sees a relationship between participating in the sharing economy and caring forthe environment and preventing excessive consumption.
Keywords: consumer behavior; lifestyle; sharing economy; peer-to-peer accommodation;tourism market
1. Introduction
The growing importance of the sharing economy is a consequence of many simultaneous changes:the global economic crisis, growing concerns about sustainable consumption, the development ofinformation and communication technologies (ICTs), a tendency towards reurbanization, changes inconsumers’ behaviors, and increasingly widespread initiatives related to social entrepreneurship [1–5].Despite the lack of empirical evidence, the rise of the sharing economy and the 2008 financial crisis areoften linked [5,6]. As a result of the crisis, discussions of sustainable development, including sustainableconsumption, have intensified. In recent years, interest in the sharing economy has increased. The neweconomic situation has led to a reassessment of consumption patterns, including spending habits andthe value attached to ownership [6–8], thus making it necessary to rethink the changes in previouslyexisting behaviors resulting from one’s lifestyle. The sharing economy has provided useful businessmodels for consumers who engage in anti-consumption lifestyles, because a number of consumers seeparticipation in the sharing economy as an alternative to ownership [9] (pp. 1422–1423).
Sustainability 2020, 12, 5351; doi:10.3390/su12135351 www.mdpi.com/journal/sustainability65

Sustainability 2020, 12, 5351
Lifestyle is considered by many authors as one of the factors in consumer behavior [10–13]. In thetourist market, lifestyle can affect tourists’ behaviors and determine the choices they make regarding,e.g., how they travel and what services they use [14–17]. It is natural for people to constantly pursue ahigher standard of living [18]. This pursuit can be manifested by the wish to constantly improve one’seconomic standing, but may involve non-financial aspects of life as well. Consumers create tendenciesand are incredibly demanding about what they want and do not want. Tourists as consumers seekproducts that can adapt to their lifestyle [13]. Knowledge of lifestyle changes can help adapt theproduct offer to the requirements of consumers. At the same time, products that consumers usecan reflect lifestyle changes. The idea of sharing is important, mainly in the context of satisfyingunlimited needs under conditions of limited resources. The sharing economy is seen as a way to reachsustainability [19] (p. 19). It may be considered a sustainable business model [20] that will changeconsumers’ relationship to objects and other components of a materialistic lifestyle [5]. Consumers areincreasingly aware of environmental, economic, and social issues. Their growing concern for theenvironment may lead to more rational purchasing decisions [21,22] and prompt them to search forproviders with a sustainable business model. Consumers’ lifestyles and values are changing, andconsumer behavior patterns are changing with them [13,21,23]. This also applies to leisure time andthe ways it is managed, including the choice of accommodation during travel [16,23,24]. Changes inlifestyle could reduce the excessive consumption of goods, and promote more responsible consumerbehaviors [5] and more sustainable business models.
The objective of the article is to analyze the relationship between lifestyle changes and readiness touse peer-to-peer accommodation services, which are part of the sharing economy. In order to achievethis objective, it was first necessary to analyze this relationship in a broader context, by assessingconsumers’ sense of responsibility for the use of resources, and their engagement in sharing economyactivities, involving the sharing of transportation, food, clothes, and equipment. The key issue for thestudy was the focus on the behavioral aspect of respondents’ attitudes. Once the respondents’ generalattitude towards the sharing economy was known, it was possible to examine their hidden motivesresulting from lifestyle changes in the context of travel patterns and accommodation. Therefore, aswell as respondents’ declarations of whether they performed certain actions, their motivations behindchoosing (or not choosing) peer-to-peer accommodation and other sharing economy activities wasexamined. The paper is based on the authors’ own classification of motivations (personal, social,and ideological), with an attempt to verify these motivations based on qualitative research in sixfocus groups.
The systematic literature review in the article contributes to a clearer understanding of lifestylechanges in the context of the sharing economy. The review was carried out with a view to identifyingexisting research directions in this field. While an abundant literature covers tourists’ motivations forparticipating in the sharing economy [1,2,23–29], researchers have paid less attention to these tourists’lifestyles [28], and more importantly, to how lifestyle influences their behavior in the context of thesharing economy. This paper contributes to a better understanding of the lifestyle changes associatedwith behaviors, attitudes, and preferences regarding sharing economy initiatives. In addition, thequalitative study enabled a thorough analysis of hidden motives resulting from the subjects’ lifestyleand the gap between lifestyle changes and the use of peer-to-peer accommodation, which, to thebest of the authors’ knowledge, has not been covered in any previous research. The study revealsdifferences between generations in terms of: (1) lifestyle and a sense of responsibility for the useof resources; (2) lifestyle and motivations for participating in sharing economy activities, includingthe sharing of transportation, food, clothes, and equipment; (3) lifestyle and motivations for thespecific organization of travel and use of peer-to-peer accommodation. The focus group study offers abetter understanding of the role of lifestyle changes in the sharing economy and the popularizationof sustainable business models. The results contribute to the literature on peer-to-peer services byincluding a lifestyle perspective, allow the establishment of an informational background, offer a
66

Sustainability 2020, 12, 5351
starting point for further quantitative research in this field, and provide some guidelines for tourismcompanies with sustainable business models.
2. Systematic Literature Review—Lifestyle, Sharing Economy and Peer-to-Peer Accommodation
Lifestyle is a term which is often used in conjunction (or sometimes even replaced) with termssuch as “the way, quality and standard of living”, “patterns of behavior”, “values”, and “attitudes”.In the literature, one can find various attempts to define this term, as it falls within the scope of interestof scholars from the fields of economics, psychology, sociology, pedagogy, and medicine [10]. As aresult, there is no single commonly accepted definition of lifestyle.
Lifestyle includes observable behaviors and non-observable values [10,30]. According to scholars,lifestyle is a method of market segmentation; they have emphasized, however, that it has neverbeen accepted as the dominant method [14]. Lifestyle is intrinsically associated with psychographicmethods of market segmentation. In literature, there have been many attempts to determine thelifestyle characteristic for societies in developed countries, so as to make it easier to profile marketsegments, develop the concept of market position, develop advertisements, etc. Lifestyle comprisesbehaviors, knowledge, and attitudes—both what people do and what they feel. It is a complex andevolving category, which can include both differences and similarities, due to the multi-directionaltransmission of cultural values [31]. Although it is hard to find a single, all-encompassing definition oflifestyle, the fact that lifestyle in developed countries undergoes transformations is commonly acceptedin literature [13].
From the perspective of this article, it is worth considering whether analyses of lifestyle refer toattitudes and values opposing consumption, and to the sharing economy. Tourism is associated withthe way people spend their time and with personal preferences; therefore, one might assume thatchoices people make concerning tourist services can be the consequence of a specific lifestyle.
2.1. Lifestyle Changes and the Sharing Economy
Educational campaigns for rational and healthy living contribute to the rationalization of someareas of consumption [32], including the way people satisfy their need to relax, as well as otherneeds that involve tourist activities. Excessive mass consumption is increasingly rejected in favorof sustainable consumption and de-consumption, i.e., the conscious limitation of consumption to arational size [4,33–35], which can be observed especially in groups of young, educated individualswho use digital media and technology [3,36]. Furthermore, consumers are becoming more rational,responsible, and aware when it comes to issues related to environment protection [37] and are aimingat sustainable consumption. On the other hand, consumers are exposed to constant pressure relatedto the artificial stimulation of certain needs, mainly through aggressive advertising, which leads tothe so-called Diderot effect, whereby people pursue their ideal of a good life through the purchase ofparticular consumer goods, purchasing more than one actually needs [38]. Thus, consumers’ behavioris becoming clearly inconsistent—they aim at limiting consumption, but at the same time they buy more,because they want to satisfy all their needs [3]. The concept of the sharing economy can be seen as anattempt to reconcile the two perspectives (i.e., simultaneously using products and limiting purchases).
67

Sustainability 2020, 12, 5351
The sharing economy—which is essentially about better management of underused assets—hasbecome one of the leading economic trends in the 2010s. It is an economic and technological idea thatcan be perceived as an umbrella term for changes occurring within modern technologies and includingcollaborative consumption [39]. Collaborative consumption endorses sharing the consumption ofgoods and services through online platforms [39] and can include the following activities: traditionalsharing, bartering, lending, trading, renting, gifting, and swapping, providing benefits related toaccessing products and services rather than owning them [7,39–41].
The growth of the sharing economy in tourism, driven by the global economic crisis,the development of modern technologies, environmental factors (de-consumption, sustainableconsumption), and the increased significance of authenticity and sense of community [1–3,7,16,42–44]has led to the emergence of many businesses that enable and coordinate the direct exchange of productsand services between individuals (consumers). In tourism, examples of the sharing economy can befound in the following fields [45,46]: (1) accommodation services—in the form of short-term rentalof entire houses, flats, or rooms, where both guests and hosts are registered users of a platform,or in the form of home-swapping; (2) transport services—in the form of ride-sharing, as a way ofgetting from home to a tourist destination (long-distance travel, instead of a train or bus) or movingaround as part of the tourist experience (short-distance travel as an alternative to public transport ortaxis); (3) catering services—meal-sharing, carried out mainly in private houses in the tourist area;(4) tourist guide services—where the function of a tour guide is performed by residents of a giventourist area. The sharing economy concept is associated with certain behaviors of tourists that maymanifest themselves as a result of lifestyle changes across generations. Therefore, the relationshipbetween these constructs should be traced in the literature.
A review of articles on the sharing economy and peer-to-peer accommodation reveals a numberof qualitative and quantitative studies directly or indirectly related to the subject of lifestyle. As shownin Table 1, the covered lifestyle contexts included lifestyle in an intercultural context [47]; lifestyle asa driver, result, or part of the sharing economy (or related consumption patterns) [4,5,9,16,48–50];lifestyle threatened by the sharing economy [51]; description of the lifestyles of sharing economyusers [52]; sustainable lifestyle [53]; and lifestyle as a direction in research on the sharing economy [54].In some papers, no direct link between lifestyle and the sharing economy was found [47,50,52], but mostincluded cases of sharing economy accommodation [9,16,47–49,51,52].
The analysis shows that lifestyle has an impact on the behaviors associated with the sharingeconomy and peer-to-peer accommodation, but that the relationship can also work in the oppositedirection. The various opportunities offered by the sharing economy may influence consumers’behaviors and changes in their lifestyles. Contemporary tourists try to avoid the tourism industry bymaking long-term lifestyle changes and seek authenticity by interacting with locals. Therefore, tourismis not just an industry, it is also negotiated between private individuals, with or without intermediaries,which calls for a rethinking of the concept of “tourism” [17] (p. 297).
68

Sustainability 2020, 12, 5351
Ta
ble
1.
Res
earc
hon
lifes
tyle
and
the
shar
ing
econ
omy
inco
relit
erat
ure
(Web
ofSc
ienc
e).
Aim
Me
tho
dO
ve
rall
Re
sult
sL
ife
sty
leC
on
tex
tA
ctiv
ity
Ty
pe
Sh
ari
ng
Eco
no
my
–L
ife
sty
leL
ink
sS
tud
y
The
stud
yin
vest
igat
edw
este
rnA
irbn
bho
sts’
expe
rien
ces
wit
hC
hine
seou
tbou
ndto
uris
ts(p
.288
).
Four
-sta
gean
alys
isof
host
s’co
mm
ents
.C
o-oc
curr
ence
anal
ysis
usin
gth
eG
ephi
soft
war
e
The
rese
arch
high
light
edth
ero
leth
atcu
ltur
aldiff
eren
ces
and
trad
itio
npl
ayin
gues
t–ho
sten
coun
ters
,and
offer
eda
theo
retic
alfr
amew
ork
onin
ter-
cult
ural
host
–gue
stre
lati
onsh
ipth
atpr
ovid
esan
initi
alun
ders
tand
ing
ofth
isph
enom
enon
.
Life
styl
ein
anin
terc
ultu
ral
cont
ext:
wes
tern
host
s–C
hine
segu
ests
Peer
-to-
peer
acco
mm
odat
ion
Not
dire
ctly
indi
cate
d.D
iffer
ence
sin
the
repr
esen
ted
lifes
tyle
sca
naff
ectt
heex
peri
ence
sof
both
host
san
dgu
ests
inca
seof
peer
-to-
peer
acco
mm
odat
ion.
[47]
The
stud
yex
amin
edth
enu
ance
dst
yles
ofco
llabo
rati
veco
nsum
ptio
nin
rela
tion
tom
arke
t-m
edia
ted
acce
sspr
acti
ces
and
soci
ally
med
iate
dsh
arin
gpr
acti
ces
(p.6
92).
Obs
erva
tion
,et
hnog
raph
icin
terv
iew
s,an
da
netn
ogra
phic
stud
y
The
rese
arch
iden
tifie
dth
ree
styl
esof
colla
bora
tive
cons
umpt
ion:
com
mun
al(p
ro-s
ocia
l),c
onsu
mer
ist
(com
mer
cial
),an
dop
port
unis
tic
(exp
loit
ativ
e).
Life
styl
eas
part
ofco
llabo
rati
veco
nsum
ptio
nst
yles
Rid
esha
ring
Con
veni
enta
ndtr
endy
lifes
tyle
asa
fact
orin
fluen
cing
the
cons
umer
istc
olla
bora
tive
cons
umpt
ion
styl
ein
ride
shar
ing.
[4]
The
stud
yre
-est
ablis
hed
the
role
ofth
eA
irbn
bpl
atfo
rmin
cont
empo
rary
tour
istd
esti
nati
onm
anag
emen
t(p.
458)
.
Cri
tica
lapp
roac
hto
regu
lato
rym
easu
res
The
findi
ngs
indi
cate
dth
atre
stri
ctio
nson
Air
bnb
are
ofte
nun
foun
ded.
This
isdu
eto
prec
once
ptio
nsre
gard
ing
the
impa
cton
trad
itio
nalh
otel
san
dth
epr
eser
vati
onof
loca
llif
esty
les,
rath
erth
ansp
ecifi
can
dob
ject
ive
mea
sure
men
tsof
impa
ct.
Loca
llif
esty
leat
risk
due
toth
esh
arin
gec
onom
y
Shor
t-te
rmre
ntal
acco
mm
odat
ion
The
shar
ing
econ
omy
isfa
lsel
yse
enas
ath
reat
toth
elo
cal
lifes
tyle
.Loc
alid
enti
tyan
dlif
esty
lesh
ould
bepr
otec
ted
from
unre
gula
ted
shar
ing
econ
omy
deve
lopm
ent.
[51]
69

Sustainability 2020, 12, 5351
Ta
ble
1.
Con
t.
Aim
Me
tho
dO
ve
rall
Re
sult
sL
ife
sty
leC
on
tex
tA
ctiv
ity
Ty
pe
Sh
ari
ng
Eco
no
my
–L
ife
sty
leL
ink
sS
tud
y
The
stud
yde
scri
bed
anti
-con
sum
ptio
nlif
esty
les
and
the
impa
ctof
such
lifes
tyle
son
the
acce
ptan
ceof
com
mer
cial
shar
ing
syst
ems
(CSS
)(p.
1422
).
Stru
ctur
aleq
uati
onm
odel
ing
(SEM
)
The
findi
ngs
indi
cate
dth
atan
ti-c
onsu
mpt
ion
lifes
tyle
sco
nsis
tof
frug
alit
y,vo
lunt
ary
sim
plic
ity,
envi
ronm
enta
lpro
tect
ion,
smal
llu
xury
and
tigh
twad
ism
,and
that
they
diff
eren
tly
influ
ence
cons
umer
s’be
havi
ors
wit
hre
spec
tto
usin
gco
mm
erci
alsh
arin
gsy
stem
s.
Life
styl
eas
am
ajor
driv
erof
com
mer
cial
shar
ing
syst
emus
e
Car
and
acco
mm
odat
ion
shar
ing
serv
ices
The
use
ofco
mm
erci
alsh
arin
gsy
stem
sre
sult
sfr
omdiff
eren
tan
ti-c
onsu
mpt
ion
lifes
tyle
s.Li
fest
yle
tren
dsof
redu
cing
cons
umpt
ion
have
emer
ged
with
the
grow
thof
the
shar
ing
econ
omy.
[9]
This
pape
rpr
esen
ted
the
resu
lts
ofan
in-d
epth
stud
yin
toIt
alia
nho
me-
swap
pers
and
disc
usse
dth
eir
soci
o-ec
onom
icpr
ofile
s,m
otiv
atio
ns,
and
lifes
tyle
s(p
.202
).
Self
-adm
inis
tere
don
line
surv
ey
The
findi
ngs
indi
cate
dth
atho
me-
swap
ping
isan
alte
rnat
ive
form
ofto
uris
mw
hich
requ
ires
trus
t,op
en-m
inde
dnes
s,in
vent
iven
ess,
enth
usia
sm,a
ndfle
xibi
lity.
Wel
l-de
fined
lifes
tyle
sas
adr
iver
ofho
me-
swap
ping
Hom
e-sw
appi
ng
Inth
eca
seof
the
shar
ing
econ
omy
(hom
e-sw
appi
ng),
ther
eis
anov
erla
pw
ith
othe
rso
cial
prac
tices
pres
enta
mon
gni
che
cons
umer
sw
hoar
em
ore
conc
erne
dab
outt
heen
viro
nmen
tand
mor
ew
illin
gto
resp
ond
toth
ese
conc
erns
bych
angi
ngth
eiro
wn
lifes
tyle
and
cons
umpt
ion
prac
tice
s.
[16]
The
stud
yde
velo
ped
am
etho
dto
unde
rsta
ndus
ers’
lifes
tyle
sba
sed
onth
eir
inte
ract
ions
wit
hso
cial
netw
orks
(p.1
).
OW
A(o
rder
edw
eigh
ted
aver
agin
g)an
dhi
erar
chic
alcl
uste
ring
The
sele
cted
part
ition
for
the
Air
bnb
case
defin
eda
seto
fsev
encl
uste
rs.
Six
ofth
emre
pres
ente
da
diff
eren
tlif
esty
le.
Qua
litat
ive
desc
ript
ion
oflif
esty
le
Din
ing
inpe
er-t
o-pe
erac
com
mod
atio
n(A
irbn
b)
Not
dire
ctly
indi
cate
d.T
heva
riou
slif
esty
lede
scri
ptio
nsw
ere
dete
rmin
edba
sed
onch
arac
teri
stic
sob
tain
edfr
omco
mm
ents
from
Air
bnb
acco
mm
odat
ion
user
s.
[52]
70

Sustainability 2020, 12, 5351
Ta
ble
1.
Con
t.
Aim
Me
tho
dO
ve
rall
Re
sult
sL
ife
sty
leC
on
tex
tA
ctiv
ity
Ty
pe
Sh
ari
ng
Eco
no
my
–L
ife
sty
leL
ink
sS
tud
y
The
stud
yin
vest
igat
edho
wth
esh
arin
gec
onom
yen
able
sa
digi
talp
latf
orm
toim
pact
the
way
oflif
eof
Air
bnb
host
s(p
.79
4).
In-d
epth
and
sem
i-st
ruct
ured
inte
rvie
ws
This
shif
tin
the
shar
ing
econ
omy
due
tofin
anci
alim
pera
tive
ssh
ows
how
muc
hth
isfie
ldha
sbe
enpr
omot
ing
the
crea
tion
ofne
wdi
gita
lmon
opol
ies
and
the
perm
anen
ceof
labo
rpr
ecar
ious
ness
scen
ario
s.Pe
ople
subj
ect
them
selv
esto
new
form
sof
prod
ucti
onth
atca
pita
lize
onth
eir
own
inti
mac
y.
Life
styl
ech
ange
sas
are
sult
ofbe
ing
anA
irbn
bho
st
Peer
-to-
peer
acco
mm
odat
ion
Tran
sfor
min
gth
eho
me
into
aco
mm
erci
alsp
ace
forc
esho
sts
toad
optn
ewso
cial
beha
vior
s,an
dto
acqu
ire
ane
wlif
esty
le.
The
cont
ribu
tion
ofho
stin
gin
the
shar
ing
econ
omy
isto
chal
leng
etr
adit
iona
lsoc
ial
valu
es.
[48]
The
stud
yex
plor
edth
efa
ctor
sin
fluen
cing
cons
umer
adop
tion
ofA
irbn
b.
Onl
ine
surv
ey
Perf
orm
ance
expe
ctan
cy,s
ocia
lin
fluen
ce,h
edon
icm
otiv
atio
n,an
dpr
ice
valu
ear
esi
gnifi
cant
pred
icto
rsof
inte
ntio
nto
use
Air
bnb.
Con
sum
ers’
trus
tis
posi
tive
lyre
late
dto
perf
orm
ance
expe
ctan
cy.
Con
sum
ers’
cros
s-cu
ltur
alex
peri
ence
mod
erat
esth
ere
lati
onsh
ipbe
twee
npe
rfor
man
ceex
pect
ancy
and
beha
vior
inte
ntio
n,an
dco
nsum
ers’
extr
over
sion
.C
hang
e-se
ekin
gte
nden
cym
oder
ates
the
rela
tion
ship
betw
een
hedo
nic
mot
ivat
ion
and
beha
vior
inte
ntio
n.
“Air
bnb”
asa
new
lifes
tyle
Shor
t-te
rmre
ntal
acco
mm
odat
ion
The
shar
ing
econ
omy
appe
als
toth
ose
seek
ing
chan
ge.
Cha
nge-
seek
ing
refe
rsto
the
dem
and
for
stim
ulit
hata
pers
onne
eds
toke
epon
esel
fin
the
best
cond
itio
n.It
isa
curi
osit
y-m
otiv
ated
and
vari
ety-
seek
ing
beha
vior
.Si
nce
Air
bnb
prov
ides
alo
tof
lodg
ing
type
s,ch
ange
seek
ers
are
mor
elik
ely
toen
joy
this
feat
ure.
[49]
The
stud
yid
enti
fied
ane
wco
nsum
erm
ater
ialis
mw
ithi
nth
esh
arin
gec
onom
y(p
.1).
Surv
eys
colle
cted
duri
ngva
riou
sev
ents
Trad
itio
nalm
ater
ialis
m,i
.e.,
the
owne
rshi
pan
dac
cum
ulat
ion
ofgo
ods,
islo
sing
its
impo
rtan
cein
favo
rof
new
mat
eria
lism
.M
ater
ialis
mis
evol
ving
from
am
ere
stat
icac
cum
ulat
ion
ofgo
ods
tow
ards
ahy
brid
mod
el(p
rope
rty
and
the
enjo
ymen
tofg
oods
coex
ist
wit
hth
een
joym
ento
fexp
erie
nce)
.
New
mat
eria
lism
asa
lifes
tyle
Shar
ing
econ
omy
inge
nera
l
The
shar
ing
econ
omy
can
bea
busi
ness
mod
elth
atw
illch
ange
cons
umer
s’re
lati
onsh
ipto
obje
cts
and
the
mat
eria
listic
lifes
tyle
.Cha
nges
inlif
esty
les
caus
edby
the
econ
omic
cris
isco
uld
lead
toa
redu
ctio
nin
the
exce
ssiv
eco
nsum
ptio
nof
good
san
dpr
omot
em
ore
resp
onsi
ble
cons
umer
beha
vior
.
[5]
71

Sustainability 2020, 12, 5351
Ta
ble
1.
Con
t.
Aim
Me
tho
dO
ve
rall
Re
sult
sL
ife
sty
leC
on
tex
tA
ctiv
ity
Ty
pe
Sh
ari
ng
Eco
no
my
–L
ife
sty
leL
ink
sS
tud
y
The
stud
yin
vest
igat
edth
ere
adin
ess
ofth
eyo
ung
gene
rati
onto
face
the
chal
leng
eof
chan
ging
thei
rlif
esty
leba
sed
onun
limit
edco
nsum
ptio
nto
war
dson
eth
atw
illta
kesu
stai
nabi
lity
into
acco
unta
sa
basi
sfo
rco
nsum
erbe
havi
or(p
.179
).
CA
WI
(Com
pute
r-A
ssis
ted
Web
Inte
rvie
w)
met
hod
and
onlin
ein
terv
iew
s
The
qual
ity
oflif
e,in
the
cont
exto
fre
spon
sibl
ede
velo
pmen
t,re
quir
esa
chan
gein
the
way
ofth
inki
ngan
dph
iloso
phy
oflif
e,re
cogn
itio
nof
new
valu
esan
dlif
esty
les,
and
diff
eren
tsha
ping
ofliv
ing
cond
itio
ns.T
his
incl
udes
chan
ging
cons
umer
habi
ts,w
hich
wou
ldco
ntri
bute
toch
angi
nglif
esty
les
and
thus
redu
cing
envi
ronm
enta
lda
mag
e.
Life
styl
ere
sults
from
cons
umpt
ion
patt
erns
Free
gani
sm(t
here
use
offo
odth
atha
sbe
enth
row
naw
ayor
isto
beth
row
naw
ay)
Not
dire
ctly
indi
cate
d.Li
fest
yle
resu
lts
from
cons
umer
beha
vior
.The
met
hod
ofco
nsum
ptio
nan
dst
rivi
ngfo
rit
sra
tion
aldi
men
sion
cont
ribu
teto
chan
ging
cons
umer
habi
tsan
dlif
esty
le,a
ndto
redu
cing
envi
ronm
enta
ldam
age.
The
shar
ing
econ
omy
can
beth
eso
luti
on.
[50]
The
stud
yin
vest
igat
edho
wtr
usta
ndre
gula
tion
shap
ere
lati
ons
betw
een
prov
ider
san
dco
nsum
ers
inth
esh
arin
gec
onom
y(p
.1).
Lite
ratu
rere
view
Mos
tsha
ring
econ
omy
rese
arch
isno
tfoc
used
onsu
stai
nabi
lity.
Som
ear
eas
ofth
esh
arin
gec
onom
yar
eco
nduc
ive
tosu
stai
nabl
ede
velo
pmen
t,ot
hers
are
cond
uciv
eto
soci
alco
hesi
onan
dul
tim
atel
ybu
ildso
cial
capi
tal,
whi
lest
illot
hers
focu
son
com
fort
and
lifes
tyle
.
Sust
aina
ble
lifes
tyle
Shar
ing
econ
omy
inge
nera
l
Ado
ptin
ga
sust
aina
ble
lifes
tyle
can
redu
ceth
eex
ploi
tati
onof
natu
ral
reso
urce
s.T
hesh
arin
gec
onom
yis
part
ofa
sust
aina
ble
lifes
tyle
—it
offer
san
dsh
ares
unde
ruti
lized
reso
urce
s.
[53]
The
stud
yun
cove
red
the
theo
reti
cal
foun
dati
ons
and
key
them
esun
derl
ying
the
shar
ing
econ
omy.
Syst
emat
iclit
erat
ure
revi
ew
Ther
ear
eth
ree
dist
inct
area
sw
ithin
the
shar
ing
econ
omy
liter
atur
ean
dtw
oar
eas
spec
ific
toto
uris
man
dho
spit
alit
y:th
esh
arin
gec
onom
y’s
impa
cton
dest
inat
ions
and
tour
ism
serv
ices
,and
the
shar
ing
econ
omy’
sim
pact
onto
uris
ts.F
ive
rese
arch
stre
ams
wer
eid
enti
fied:
lifes
tyle
and
soci
alm
ovem
ent,
cons
umpt
ion,
shar
ing,
trus
t,an
din
nova
tion
.
Life
styl
eas
one
ofth
ere
sear
chst
ream
s
Shar
ing
econ
omy
inge
nera
l
The
shar
ing
econ
omy
has
ast
rong
inte
llect
ualt
radi
tion
inth
elif
esty
lean
dso
cial
mov
emen
tfiel
d,co
nsum
ptio
npr
acti
ces,
and
the
shar
ing
para
digm
.Lif
esty
leis
apr
imar
ym
eans
tofo
ster
soci
alch
ange
.
[54]
Sour
ce:A
utho
rs’o
wn
wor
k.
72

Sustainability 2020, 12, 5351
2.2. Motivations for Activities Pertaining to the Sharing Economy
In the sharing economy, the traditional concept of renting or sharing has changed and becomemore efficient, intelligent, and human-centered [55,56], and this does not mean that users do not buyanything, just that they do not have to buy everything [55] (p.87). Relinquishing the former attachmentto ownership and replacing it with temporary access to underused assets can be motivated by manyfactors. The most common motivations for participating in the sharing economy in tourism are financialones, including savings and lower transaction costs [1,2,23–27], and non-financial ones, related to carefor the environment, social responsibility, enjoyment, and meeting new people [7,23,24,39]. In theexisting studies on motivations for using peer-to-peer accommodation, various groups of factors weretaken into consideration (see Table 2), but in most, economic and social factors were the strongest.
Table 2. Motivation for peer-to-peer accommodation use.
Variable Study
Cost savings, familiarity, trust, utility [2]
Social appeal, economic appeal [24]
Enjoyment, perceived network effect [56]
Enjoyment, monetary benefits, accommodation amenities [27]
Enjoyment, independence through ownership, modern lifestyle, social experience [28]
Interaction, home benefits, novelty, sharing economy ethos, local authenticity [29]
Source: Authors’ own work.
The behavior of some sharing economy consumers is economically motivated, while for others itis driven by social and environmental factors. Decisions related to tourism and leisure are affected by asystem of beliefs comprising a certain mindset. Many lifestyle-related factors influence the intentionof consumers to use the sharing economy and their eventual behavior (see Figure 1). Therefore, forthe purpose of the analysis, the authors categorized motivations in accordance with the representedlifestyle. The selection of sharing economy services can result from the following motivations:
habits
moral standards
attitudes
values
quality of life
way of life
Personal
motivations
Social (conformist)
motivations
Ideological
motivations
economic advantages
savings
fashion
acceptance
reference group
public opinion leaders
environment degradation
overconsumption
care for environment
INTENTION
BEHAVIOR
sharing economy
participation
peer-to-peer
accommodation use
LIFESTYLE
Figure 1. The impact of lifestyle on the intention to participate in the sharing economy and to usepeer-to-peer accommodation. Source: Authors’ own work.
(1) Personal motivations, related to economic advantages and potential financial savings.Tourists choose sharing economy activities because it is more financially reasonable for them and theirfamilies, and allows them to visit many interesting places at a lower cost than in the case of regularhotel accommodation or transportation.
73

Sustainability 2020, 12, 5351
(2) Social (conformist) motivations. They result from the need to fit in with others, as well asfrom acceptance of the shifts and processes taking place in contemporary society, e.g., increasingenvironmental awareness. These motivations can be the result of pressure from the society, referencegroups, public opinion leaders, as well as (or maybe primarily) producers and service providers.Potential consumers are influenced by them due to their own beliefs or the need to conform to thesociety in which they function. The selection of sharing economy services can result from a wish tofollow leaders or from a short-lived trend for traveling “off the beaten path” and interacting withthe locals.
(3) Ideological motivations. These motivations result from their awareness of processes suchas natural environment degradation and excessive consumption, as well as their genuine desire toprevent these processes out of care for the future. In those motivations one can find the strongestmanifestation of increased environmental awareness and opposition to excessive consumption.
Increased social development means that more and more people may want not only to improvetheir own living conditions, but also to look for authentic experiences, protect the environment, andtake care of the future of the Earth, all of which can lead to participation in the sharing economy.Consumers are becoming aware of the relationship between their behavior and other aspects of socialand economic life. They discover that their shopping decisions can affect the environment in whichthey live, thus impacting the quality of both their own life and the life of the entire society and thecommunities they visit.
3. Materials and Methods
In the study, both secondary and primary sources of data were used. First, a review of relevantliterature on lifestyle, the sharing economy, and peer-to-peer accommodation was conducted (presentedabove). It included scientific articles indexed in Web of Science databases, published in the last 10 years,since 2010 (last updated: 7 March 2020). The articles were searched according to the following searchterms: “sharing economy and lifestyle”, “peer-to-peer accommodation and lifestyle”, and “Airbnb andlifestyle”. A total of 43 results were found. After the removal of duplicates and a preliminary analysisof abstracts, 12 papers were included in the detailed content analysis (Appendix A). The literaturereview was supplemented by articles related to the subject of the study, but not included in the Web ofScience database. The literature review was performed to establish a link between lifestyle and thesharing economy and motivations for peer-to-peer accommodation selection, and to provide a basisfor empirical research.
The empirical part of the study was devoted to the relationship between lifestyle changes andwillingness to use sharing economy services, with an emphasis on accommodation. The aim was toanswer the question: which motivations resulting from the respondents’ lifestyle affect their willingnessto use peer-to-peer accommodation? In order to achieve this, it was first necessary to analyze thisrelationship in a broader context, i.e., by assessing respondents’ sense of responsibility for the useof resources, importance of sustainability in individual actions, and motives for engaging in sharingeconomy activities such as transportation, food, and equipment sharing, or clothes swapping. In orderto gather opinions and to understand behaviors, attitudes, and preferences regarding the use of sharingeconomy services, the focus group interview method was used. This method is particularly helpful foran exploratory investigation of new phenomena [57]. The study was carried out in 6 groups, with5–8 participants each.
The most important factors differentiating motivations for choosing particular accommodationtypes are age, educational level, and household income [18]. Therefore, the study was carried outin two relevant populations, with 3 groups per population. One population consisted of youngpeople—students, with low incomes, relatively abundant free time, and no life responsibilities (youngwith time, YT). Previous studies reported that young people in Poland are educated in the spirit ofenvironmental awareness and concern for the natural environment. A moderate stability of behaviorand inclination towards de-consumption was observed in this population [58]. The other population
74

Sustainability 2020, 12, 5351
consisted of subjects with higher incomes, aged between 40 and 50, with a wealth of life experience, whodemonstrate their genuine attitudes through autonomous, financially unlimited shopping decisions(older rich, OR). One might assume that the latter group manifests their lifestyle preferences throughtheir shopping decisions.
Group discussions were carried out separately for the two populations (3 groups per population),which made it possible to seek differences and similarities between the behaviors of respondents whodiffered in terms of age and financial status. The key issue for the study was the focus on the behavioralaspect of respondents’ attitudes. Therefore, as well as their declarations about whether they performedcertain actions, the authors examined respondents’ motivations behind choosing (or not choosing)sharing economy activities.
In the first part of the group discussions, general questions were asked in order to determinerespondents’ lifestyles and their openness towards the sharing economy. Understanding the generalattitude of the respondents made it possible to examine hidden motives resulting from lifestyle changesin the context of tourism. Then, the discussion focused on the motivations for selecting sharingeconomy services (the sharing of transportation, food, clothes, equipment, accommodation), resultingfrom the subjects’ lifestyles. Group discussions were not structured in nature, and the role of themoderator was simply to direct the conversation. The interviews were carried out in June 2019, thentranscribed and coded; this was followed by a synthesis of the collected material.
4. Results of the Empirical Study
4.1. Global Waste of Resources
Since the sharing economy is essentially based on concern for the proper utilization of assets, thefirst part of the study was devoted to the subject of global waste of resources. All studied groupsin the YT population pointed out that food waste is a very serious problem. It was also noted thatthis problem is present at all levels—in single households, local communities, and entire countries.In one of the groups, a direct remark concerning hotels was made—it was pointed out that “throwingaway food in hotels” is a great problem. The YT population clearly indicated that the most importantmotivation to limit waste is concern for other, poorer countries. This indicated an ideological motivation.Regarding food waste, some respondents said it should be avoided as it is uneconomical for households(personal motivations).
In the OR group, the problem of wasting resources was only mentioned in the context of anincreased amount of rubbish, particularly plastics. Motivation to prevent the waste of resources wasnot observed in any of the OR groups. In the YT population, the problem of the growing amount ofrubbish was considered one of the most burning issues in the contemporary world. In two groups, theproblem of plastics was mentioned. Smog and environmental pollution were listed as other seriousthreats. In the OR population, the problem of smog in Poland was also pointed out. Both YT and ORrespondents indicated personal motivations as a reason to counteract these problems. Smog damageshealth, and everyone is to blame for it—individual citizens (who “do not care what goes throughtheir chimneys”), as well as local, national, and European authorities. Both studied populations (YTand OR) agreed that the problem of rubbish is severe, and that sorting is essential. However, the YTpopulation was willing to stop buying expensive products in fancy packaging, while the OR populationcould not give up this luxury. To sum up, the YT population indicated more environmental threats,e.g., large-scale farming, littering in forests, and excessive logging. In unstructured interviews, ORsubjects did not point out these problems. This suggests that the lifestyle of the YT population resultsfrom pro-environmental changes. This part of the study was fundamental for the subsequent analysisof lifestyle changes.
75

Sustainability 2020, 12, 5351
4.2. Engaging in the Sharing Economy—Transportation, Food, Clothes, and Equipment
A discussion was initiated regarding the possibilities for engaging in the sharing economy.Young people from the YT group were willing to use shared urban means of transport (bicycles,scooters). Respondents said that it is “cheaper” and “more convenient”. In other words, personalmotivations prevailed. In the OR population, respondents were not interested in using such meansof transport in their place of residence. Most subjects lived in single-family houses in the suburbsand used private cars for transport. One person pointed out that such means of transport are moreattractive and fun, and that he used them on holidays. This is confirmed by studies which found thatpeople demonstrate so-called chameleon behavior—during one trip, a tourist can play many roles,e.g., choosing very cheap accommodation and expensive means of transport, saving money on food,and at the same time buying very expensive clothing [59]. Only the YT population admitted to usingthe Uber service, and only in the YT population was it said that this is good for the environment.Therefore, ideological motivations were present.
In the analysis of lifestyle changes, the attitude towards “healthy eating” was an important issue.The results regarding this topic are quite astonishing. In all OR groups, the subjects emphasized theneed to lead a healthy lifestyle. All women recommended “healthy eating”, and their motivationswere of a personal and conformist character. In the younger YT group, there were no clear declarationsthat “healthy eating is better”—quite the opposite. Several people emphasized that “everyone is free tochoose and eat what they want”, and even made statements like “I like junk food a lot”. The wealthierOR respondents said they read labels out of concern for their own health (personal motivation), whilethe YT groups admitted to paying no attention to such information.
Another subject discussed was the so-called “breakfast markets”, an alternative to preparingmeals at home, which may be considered part of the sharing economy. The YT groups demonstratedwillingness to try out this option “out of curiosity”. The OR groups elaborated on this subject.Respondents thought that such initiatives were “extremely attractive for tourists”. One personparticipated in the organization of such an event for charity, and was proud they had a chance to helpothers. Therefore, one might observe ideological motivations associated with concern for others.
Another topic of discussion was clothes swapping. In the OR group, it was pointed out that this isa way to “get rid of clothes”—the respondents did not undertake similar actions to help others or theenvironment. The YT groups presented an entirely different attitude—they admitted to participatingin such swaps or buying clothes in second-hand shops. The following motivations were listed: savingmoney, a desire to have original clothing, and doing something for the environment (economic,personal, and ideological motivations). Respondents in one of the YT groups pointed out a seriousproblem of the excessive production of clothing by chain stores. In the OR group, the discussion of theproblem of buying new clothing led to the conclusion that “one should follow trends”, i.e., conformistattitudes were manifested. None of the OR respondents admitted to wearing second-hand clothes, asopposed to the young YT subjects.
Lifestyle changes can also be observed in attitudes towards wearing natural fur and leather goods.Wealthy OR respondents noticed the problem associated with fur-bearing animals, but emphasizedthat they “would not give up wearing leather shoes and bags”. The YT groups clearly stated thatwearing leather goods contradicts the modern lifestyle.
The analysis of the sharing economy also included the rental of various pieces of equipment orappliances. Responses in the two populations differed. The OR population did not see the need to useother people’s equipment—they actually made it very clear that their status was related to buyingthings. Furthermore, as a result of conformist motivations, they demonstrated consumerist attitudes,e.g., replacing kitchen appliances, cars or pieces of furniture regardless of their condition—just to showoff their status and be fashionable. There was also a discussion of “how good you look when you buya new boat”. In two YT groups, different attitudes were manifested. Several subjects made argumentsthat renting equipment is a good and useful habit, and that their families cultivated such a habit withtheir neighbors, with no cash involved. There was even an opinion that “in the countryside, you would
76

Sustainability 2020, 12, 5351
buy one machine for three farms, and you use it in turn”. However, in this group, some also manifestedconcern and a lack of trust when lending one’s own equipment to others, which seems quite surprisingin the case of young people. Differences between small towns and large cities were pointed out: in thelatter, the level of trust is considerably lower, as people do not know one another. Such an attitudecan also result from Polish historical heritage, which has led to a significant decrease in the level ofsocial trust. What Poles experienced caused a certain social and cultural trauma (probably passed fromgeneration to generation), which undoubtedly led to the emergence of the “crisis syndrome” and lackof trust [60].
4.3. Travel Patterns, Peer-to-Peer Accommodation
The above problems were fundamental for the analysis of lifestyle changes. The next part ofthe study mainly focused on the influence of these changes on the way people travel, including thechoice of peer-to-peer accommodation. In all OR groups, the respondents admitted to using the Airbnbplatform. They emphasized that they choose places with a high standard of services. The respondentsused this service, as it is more economical and provides an option to stay with a larger group of friendsor acquaintances. The subjects pointed out that access to kitchen facilities is important, because they canmake “healthy food” any time they want. This reinforces the view that wealthier people follow certaindiets, and that they are motivated by personal benefits. In this population, the subjects expressedcriticism towards large hotels, unattractive for wealthier people who traveled a lot. There is also a needto stand out, resulting from trends and the influence of social groups. It is not “cool” to travel to popularholiday destinations. It can be concluded that the selection of peer-to-peer accommodation resultsfrom personal and conformist motivations. In the OR group, using shared accommodation was notmentioned as an activity leading to the protection of resources. Respondents from the YT populationmade similar observations regarding the use of such services: “It is not about the environment; it isabout money. It is budget-friendly”. Therefore, in this population, personal motivations prevailed.Other important benefits of using Airbnb or Couchsurfing were also observed in this group: “We canlive in one flat with a local person, we can learn more and have a free tour guide”.
The discussion indicated that YT respondents are more open to new experiences and trying outnew solutions. In one group, staying at a luxurious “all-inclusive” hotel was mentioned as somethingnew. For people who are used to organizing trips on their own, staying at such hotels is attractive.According to the subjects “you do not have to follow the trends”. It is an example of the lack of aconformist approach. The topic of cleaning house, both at home and on holidays, was also discussed.None of the populations had any problem with using professional cleaning services. In the OR group,criticism of absolute reliance on professionals was expressed. Wealthy people noticed that it impairedthe independence of their own, almost adult children. It was pointed out that even on holidays, it is“not good” if the children do not have a habit of cleaning up after themselves, and that they should beincluded in daily chores. According to the respondents, peer-to-peer accommodation can “teach youreal life”. In the YT groups there were opinions voiced that “hiring cleaning staff is nothing unusual”.There were economic motivations: a respondent claimed that “if I make more money per hour in myjob than I pay the cleaning person, it makes more sense economically”.
The discussion of changes in attitudes towards tourist trips was concluded with a question aboutwhich is better: a package holiday or an independently organized trip. In the groups of wealthysubjects, it was pointed out that typical package holidays are not “trendy”. Only one person praisedsuch holidays, but this was because it had been a new experience for them. Other people wanted to beperceived as “travelers”, and organizing one’s travels independently was seen as manifestation of thisstatus. Detailed questions demonstrated that travel, for the OR groups, was not entirely independent.In three groups, local guides were booked; in one, an agency was used for organizing accommodation,and in another for booking transport.
In the YT population, all groups of respondents said that trips organized independently andindividually are “definitely” preferable. The following advantages were mentioned: “we are not
77

Sustainability 2020, 12, 5351
dependent on anybody”, “we can adjust the budget to our possibilities”, “we can plan everythingon our own”, and “we decide how much time we want to spend there”. In these groups, it was alsonoted, though, that package holidays may at times be more attractive in terms of pricing and offer.The main motivation for organizing one’s holidays individually was conformist for the OR population,and personal for the YT population. No ideological motivations were present in the discussion.
5. Discussion and Conclusions
Decisions of how to use tourist services can result from specific lifestyles and lifestyle changes.For the purpose of the article, the authors divided motivations for the selection of accommodationservices and other collaborative consumption activities into personal, conformist, and ideological.The study was conducted in two populations of respondents: (1) young, with a lot of free time andlimited income, and (2) wealthy, aged between 40 and 50, with rich life experience; and demonstratedlifestyle changes between the generations. The findings are as follows: (1) Subjects from the YTpopulation are more aware of environmental threats and are more concerned about the environment.Their actions result not only from personal motivations (financial savings) but also ideological ones.The YT subjects are also interested in participating in sharing economy activities: they are more willingto use shared means of transport, participate in clothing swaps, and rent equipment and appliancesthan the OR subjects. (2) The OR population leads a lifestyle that is mainly based on personal (oftenconformist) motivations, which result from the influence of social groups. They aim at staying healthyand lead a so-called “healthy lifestyle”. Subjects from the YT population do not express too muchinterest in healthy eating and reading labels, while the subjects from the OR group do. (3) All groupsof respondents prefer independent travel, but for different reasons. Young people seek interactionwith the local community, while older and wealthier people who have already traveled a lot want toshow off as “travelers”, not “tourists”. Their decisions are also affected by social judgment. (4) Whenit comes to using peer-to-peer accommodation, YT respondents are more open to new experiencesand trying out new solutions. OR respondents are driven to use these types of services because ofpersonal economic benefits and convenience. (5) Neither population recognizes a relationship betweenparticipating in the sharing economy on the one hand, and caring for the environment and preventingexcessive consumption on the other. The final classification of motivations in both groups is presentedin Table 3.
Several conclusions can be drawn based on these findings:
1. The lack of a relationship between participation in the sharing economy and care for theenvironment is in contrast with some studies on motives for participating in the sharing economyin tourism and using peer-to-peer accommodation [16,24,61]. This could indicate that sharingeconomy business models may not be seen by consumers as sustainable or environmentallyfriendly. However, this finding does correspond to the economically and socially motivatedbehaviors reported in previous studies. Therefore, more attention should be paid to sustainabilityissues. Although the sharing economy model was conceived as an answer to over-consumptionand the waste of resources, in reality, consumers pay more attention to financial and social benefits.By participating in sharing economy activities, they tend to contribute to reducing resource use inan unconscious and unintentional way.
2. The results may be useful for companies that would like to operate according to a sustainablebusiness model, which includes creating value for the customer in accordance with the principlesof sustainable development. When constructing their own business models, companies shouldconsider the overall lifestyle changes that characterize both groups of respondents (potentialcustomers) and the importance of new customers’ preferences. These preferences should be takeninto account in the creation of extended and potential components of business models, which maygive a competitive advantage to traditional businesses in the tourism market (accommodation,transport, catering).
78

Sustainability 2020, 12, 5351
3. The study shows differences between the two generations in terms of lifestyle, sense ofresponsibility for the use of resources, and motivations for participating in the sharing economyand for the specific organization of travel and use of peer-to-peer accommodation. In planningactivities to promote sustainable consumption and sustainable business models, one should takethese differences into account and highlight diverse lifestyle aspects in messages to both groups.
4. The study was exploratory in nature and only included Polish respondents, but it should benoted that in the era of globalization, the needs and preferences of consumers may not necessarilydiffer between countries. People from both surveyed segments, YT and OR, can model theirlifestyles on those found in other countries due to the frequency of travel and possibilities ofcommunication using new technologies.
Table 3. Respondents’ motivations for sharing economy activities.
ActivitiesMotivations
YT OR
Prevention of wasting resources Ideological,personal None
Fighting with environment pollution Personal,ideological Personal
Healthy eating None Personal,conformist
Attending “breakfast markets” Personal Personal,ideological
Using means of transport associated with the sharing economy Personal,ideological Personal
Swapping clothes Personal,ideological None
Renting equipment Personal,ideological None
Using peer-to-peer accommodation Personal Personal,conformist
Individual organization of holidays Personal Conformist
Source: Author’s own work. Abbreviations: YT, young with time; OR, older rich.
The authors are aware that the selected research method does not produce representative resultsand entire populations may not be assessed based on the data acquired in this manner. Nonetheless, thesubject of consumers’ behaviors required a qualitative data collection method to explain the discussedtopic in more detail (e.g., to establish an informational background, propose ideas, detect needs,formulate hypotheses, etc.). Due to the broad scope of the problem and the preliminary character ofthe analysis, the study was strictly exploratory.
The study was conducted in two populations of respondents, differing in terms of their age andincome. One must take into account that sociological analyses also suggest other qualities that may beused to differentiate segments of buyers. It was shown that the studied YT and OR populations aresignificantly different in terms of the presented lifestyles and motivations for participating in activitiespertaining to the sharing economy, including the organization of holidays and choosing accommodation.Quantitative studies should be carried out in the future to verify whether the presented motivations areconsistent with the observations made in the studied populations. Another potential research subjectwould be the analysis of why young Poles tend to be distrustful, especially since previous studieslisted young people as the most eager to use sharing economy services (also in tourism) [2,62–64].
79

Sustainability 2020, 12, 5351
Author Contributions: Conceptualization, A.N. and K.K.; Methodology, A.N. and K.K.; Supervision, A.N. andK.K.; Visualization, A.N. and K.K.; Writing—original draft, A.N. and K.K.; Writing—review and editing, A.N. andK.K. All authors have read and agreed to the published version of the manuscript.
Funding: This research received no external funding.
Conflicts of Interest: The authors declare no conflict of interest.
Appendix A
List of papers included in the systematic literature review (Web of Science)
1. Cheng, M.; Zhang, G. When Western hosts meet Eastern guests: Airbnb hosts’ experience withChinese outbound tourists. Ann. Tour. Res. 2019, 75, 288–303.
2. Guyader, H. No one rides for free! Three styles of collaborative consumption. J. Serv. Mark. 2018,32, 692–714.
3. Avdimiotis, S.; Poulaki, I. Airbnb impact and regulation issues through destination life cycleconcept. Int. J. Cult. Tour. Hosp. Res. 2019, 13, 458–472.
4. Lee, H.J. The effect of anti-consumption lifestyle on consumer’s attitude and purchase intentiontoward commercial sharing systems. Asia Pacific J. Mark. Logist. 2019, 31, 1422–1441.
5. Forno, F.; Garibaldi, R. Sharing Economy in Travel and Tourism: The Case of Home-Swapping inItaly. J. Qual. Assur. Hosp. Tour. 2015, 16, 202–220.
6. Nguyen, J.; Armisen, A.; Sánchez-Hernández, G.; Casabayó, M.; Agell, N. An OWA-basedhierarchical clustering approach to understanding users’ lifestyles. Knowledge-Based Syst. 2020,190, 1–26.
7. Saturnino, R.; Sousa, H. Hosting as a Lifestyle: The Case of Airbnb Digital Platform and LisbonHosts. Partecip. E Conflitto 2019, 12, 794–818.
8. Min, W.; Lu, L. Who Wants to Live Like a Local?: An Analysis of Determinants of Consumers’Intention to Choose AirBNB. In Proceedings of the 2017 International Conference on ManagementScience and Engineering (ICMSE); IEEE, 2017; pp. 642–651.
9. Alonso-Almeida, M. del M.; Perramon, J.; Bagur-Femenías, L. Shedding light on sharingECONOMY and new materialist consumption: An empirical approach. J. Retail. Consum. Serv.2020, 52, 1–9.
10. Gierszewska, G.; Seretny, M. Sustainable Behavior—The Need of Change in Consumer andBusiness Attitudes and Behavior. Found. Manag. 2019, 11, 197–208.
11. Penz, E.; Hartl, B.; Hofmann, E. Collectively Building a Sustainable Sharing Economy Based onTrust and Regulation. Sustainability 2018, 10, 1–6.
12. Cheng, M. Current sharing economy media discourse in tourism. Ann. Tour. Res. 2016,60, 111–114.
References
1. Bardhi, F.; Eckhardt, G.M. Access-Based Consumption: The Case of Car Sharing. J. Consum. Res. 2012, 39,881–898. [CrossRef]
2. Möhlmann, M. Collaborative consumption: Determinants of satisfaction and the likelihood of using a sharingeconomy option again. J. Consum. Behav. 2015, 14, 193–207. [CrossRef]
3. Skalska, T.; Markiewicz, E.; Pedzierski, M. Konsumpcja kolaboratywna w obszarze turystyki. Próbaprezentacji stanu zjawiska na rynku polskim. Folia Tur. 2016, 41, 165–190.
4. Guyader, H. No one rides for free! Three styles of collaborative consumption. J. Serv. Mark. 2018, 32, 692–714.[CrossRef]
5. del Alonso-Almeida, M.M.; Perramon, J.; Bagur-Femenías, L. Shedding light on sharing ECONOMY andnew materialist consumption: An empirical approach. J. Retail. Consum. Serv. 2020, 52, 101900. [CrossRef]
6. Böcker, L.; Meelen, T. Sharing for people, planet or profit? Analysing motivations for intended sharingeconomy participation. Environ. Innov. Soc. Transit. 2017, 23, 28–39. [CrossRef]
80

Sustainability 2020, 12, 5351
7. Belk, R. You are what you can access: Sharing and collaborative consumption online. J. Bus. Res. 2014, 67,1595–1600. [CrossRef]
8. Gansky, L. The Mesh—Why the Future of Business Is Sharing; Penguin: London, UK, 2010; ISBN 9780874216561.9. Lee, H.J. The effect of anti-consumption lifestyle on consumer’s attitude and purchase intention toward
commercial sharing systems. Asia Pac. J. Mark. Logist. 2019, 31, 1422–1441. [CrossRef]10. Sobotko, E. Lifestyles in Modern Society and their Impact on the Market Behaviour of the Young Consumers.
Ekon. Wrocław Econ. Rev. 2017, 23, 71–83.11. Patrzałek, W. The Determinants of Young Consumer’s Lifestyle. Mark. i Zarz. 2017, 2, 63–71.12. Mihajlovic, I.; Koncul, N. Changes in consumer behaviour—The challenges for providers of tourist services
in the destination. Econ. Res. Istraz. 2016, 29, 914–937. [CrossRef]13. Sarmento, E.; Loureiro, S.; Martins, R. Foodservice tendencies and tourists’ lifestyle: New trends in tourism.
Rev. Tur. Desenvolv. 2017, 1, 2265–2277.14. Chon, K.S.; Pizam, A.; Mansfeld, Y. Consumer Behavior in Travel and Tourism; Routledge: London, UK, 2012.15. Meyer, B. Consumer Behaviours on the Tourism Market. Econ. Probl. Tour. 2014, 4, 135–148.16. Forno, F.; Garibaldi, R. Sharing Economy in Travel and Tourism: The Case of Home-Swapping in Italy.
J. Qual. Assur. Hosp. Tour. 2015, 16, 202–220. [CrossRef]17. Kannisto, P. Travelling like locals: Market resistance in long-term travel. Tour. Manag. 2018, 67, 297–306.
[CrossRef]18. Rivero, M.S.; Rangel, C.R.; Caldito, L.A. Analysis of spa tourist motivations: A segmentation approach based
on discriminant analysis. Enl. Tour. A Pathmaking J. 2016, 6, 19–43.19. Nosratabadi, S.; Mosavi, A.; Shamshirband, S.; Kazimieras Zavadskas, E.; Rakotonirainy, A.; Chau, K.W.
Sustainable Business Models: A Review. Sustainability 2019, 11, 1663. [CrossRef]20. Daunoriene, A.; Drakšaite, A.; Snieška, V.; Valodkiene, G. Evaluating Sustainability of Sharing Economy
Business Models. Procedia Soc. Behav. Sci. 2015, 213, 836–841. [CrossRef]21. Hojnik, J.; Ruzzier, M.; Ruzzier, M.K. Transition towards sustainability: Adoption of eco-products among
consumers. Sustainability 2019, 11, 4308. [CrossRef]22. Popovic, I.; Bossink, B.A.G.; van der Sijde, P.C. Factors influencing consumers’ decision to purchase food in
environmentally friendly packaging: What do we know and where do we go from here? Sustainability 2019,11, 7197. [CrossRef]
23. Tussyadiah, I.P.; Pesonen, J. Impacts of Peer-to-Peer Accommodation Use on Travel Patterns. J. Travel Res.2016, 55, 1022–1040. [CrossRef]
24. Tussyadiah, I.P.; Pesonen, J. Drivers and barriers of peer-to-peer accommodation stay—An exploratory studywith American and Finnish travellers. Curr. Issues Tour. 2018, 21, 703–720. [CrossRef]
25. Balck, B.; Cracau, D. Empirical analysis of customer motives in the shareconomy: A cross-sectoral comparison.Working Paper Series, University of Magdeburg. 2015. Available online: www.fww.ovgu.de/fww_media/femm/femm_2015/2015_02-EGOTEC-pfuspggp6m5tm4cr9hkm6h00i1.pdf (accessed on 10 April 2020).
26. Karlsson, L.; Dolnicar, S. Someone’s been sleeping in my bed. Ann. Tour. Res. 2016, 58, 159–162. [CrossRef]27. Tussyadiah, I.P. Factors of satisfaction and intention to use peer-to-peer accommodation. Int. J. Hosp. Manag.
2016, 55, 70–80. [CrossRef]28. Hawlitschek, F.; Teubner, T.; Gimpel, H. Understanding the Sharing Economy—Drivers and Impediments
for Participation in Peer-to-Peer Rental. In Proceedings of the 49th Hawaii International Conference onSystem Sciences (HICSS), Koloa, HI, USA, 5–8 January 2016; Volume 4801, pp. 4782–4791.
29. Guttentag, D.; Smith, S.; Potwarka, L.; Havitz, M. Why Tourists Choose Airbnb: A Motivation-BasedSegmentation Study. J. Travel Res. 2018, 57, 342–359. [CrossRef]
30. Antonides, G.; Van Raaij, W.F. Consumer Behaviour. A European Perspective; PWN: Warsaw, Poland, 1999.31. Mazurek-Łopacinska, K.; Sobocinska, M. Virtualization of Marketing Communication in the Context of
Population and Lifestyle Changes. Zesz. Nauk. Uniw. Szczecinskiego. Probl. Zarzadzania Finans. Mark. 2015,39, 143–154. [CrossRef]
32. Lim, E.; Arita, S.; Joung, S. Advancing sustainable consumption in Korea and Japan-from re-orientation ofconsumer behavior to civic actions. Sustainability 2019, 11, 6683. [CrossRef]
33. Bywalec, C. Consumption in Economic Theory and Practice; PWN: Warsaw, Poland, 2007.34. Mróz, B. Consumerism vs. sustainability: The emergence of new consumer trends in Poland. Int. J. Econ.
Policy Emerg. Econ. 2010, 3, 1–15. [CrossRef]
81
Sustainability 2020, 12, 5351
35. Kadic-Maglajlic, S.; Arslanagic-Kalajdzic, M.; Micevski, M.; Dlacic, J.; Zabkar, V. Being engaged is a goodthing: Understanding sustainable consumption behavior among young adults. J. Bus. Res. 2019, 104, 644–654.[CrossRef]
36. Zalega, T. Sustainable Consumption in Consumer. Stud. Ekon. Zesz. Nauk. Uniw. Ekon. Katow. 2019, 82–107.37. Ting, C.T.; Hsieh, C.M.; Chang, H.P.; Chen, H.S. Environmental consciousness and green customer behavior:
The moderating roles of incentive mechanisms. Sustainability 2019, 11, 819. [CrossRef]38. Lorenzen, J.A. Diderot Effect. In The Wiley Blackwell Encyclopedia of Consumption and Consumer Studies;
John Wiley & Sons: New York, NY, USA, 2015.39. Hamari, J.; Sjöklint, M.; Ukkonen, A. The sharing economy: Why people participate in collaborative
consumption. J. Assoc. Inf. Sci. Technol. 2016, 67, 2047–2059. [CrossRef]40. Botsman, R.; Rogers, R. What’s Mine Is Yours: The rise of Collaborative Consumption; HarperCollins: New York,
NY, USA, 2010; ISBN 978-0-06-196354-4.41. Barnes, S.J.; Mattsson, J. Understanding current and future issues in collaborative consumption: A four-stage
Delphi study. Technol. Forecast. Soc. Chang. 2016, 104, 200–211. [CrossRef]42. Akbar, Y.H.; Tracogna, A. The sharing economy and the future of the hotel industry: Transaction cost theory
and platform economics. Int. J. Hosp. Manag. 2018, 71, 91–101. [CrossRef]43. Germann Molz, J. Social networking technologies and the moral economy of alternative tourism: The case of
couchsurfing.org. Ann. Tour. Res. 2013, 43, 210–230. [CrossRef]44. Liang, L.J.; Choi, H.C.; Joppe, M. Understanding repurchase intention of Airbnb consumers: Perceived
authenticity, electronic word-of-mouth, and price sensitivity. J. Travel Tour. Mark. 2018, 35, 73–89. [CrossRef]45. Dredge, D.; Gyimóthy, S. The collaborative economy and tourism: Critical perspectives, questionable claims
and silenced voices. Tour. Recreat. Res. 2015, 40, 286–302.46. Heo, C.Y. Sharing economy and prospects in tourism research. Ann. Tour. Res. 2016, 58, 166–170. [CrossRef]47. Cheng, M.; Zhang, G. When Western hosts meet Eastern guests: Airbnb hosts’ experience with Chinese
outbound tourists. Ann. Tour. Res. 2019, 75, 288–303. [CrossRef]48. Saturnino, R.; Sousa, H. Hosting as a Lifestyle: The Case of Airbnb Digital Platform and Lisbon Hosts.
Partecip. Confl. 2019, 12, 794–818.49. Min, W.; Lu, L. Who Wants to Live Like a Local?: An Analysis of Determinants of Consumers’ Intention to
Choose AirBNB. In Proceedings of the 2017 IEEE International Conference on Management Science andEngineering (ICMSE), Guilin, China, 18–20 August 2017; pp. 642–651.
50. Gierszewska, G.; Seretny, M. Sustainable Behavior—The Need of Change in Consumer and Business Attitudesand Behavior. Found. Manag. 2019, 11, 197–208. [CrossRef]
51. Avdimiotis, S.; Poulaki, I. Airbnb impact and regulation issues through destination life cycle concept. Int. J.Cult. Tour. Hosp. Res. 2019, 13, 458–472. [CrossRef]
52. Nguyen, J.; Armisen, A.; Sánchez-Hernández, G.; Casabayó, M.; Agell, N. An OWA-based hierarchicalclustering approach to understanding users’ lifestyles. Knowl. Based Syst. 2020, 190, 1–26. [CrossRef]
53. Penz, E.; Hartl, B.; Hofmann, E. Collectively Building a Sustainable Sharing Economy Based on Trust andRegulation. Sustainability 2018, 10, 3754. [CrossRef]
54. Cheng, M. Sharing economy: A review and agenda for future research. Int. J. Hosp. Manag. 2016, 57, 60–70.[CrossRef]
55. Palos-Sanchez, P.R.; Correia, M.B. The collaborative economy based analysis of demand: Study of airbnbcase in Spain and Portugal. J. Theor. Appl. Electron. Commer. Res. 2018, 13, 85–98. [CrossRef]
56. Sung, E.; Kim, H.; Lee, D. Why do people consume and provide sharing economy accommodation?-Asustainability perspective. Sustainability 2018, 10, 2072. [CrossRef]
57. Mansourian, Y. Exploratory nature of, and uncertainty tolerance in, qualitative research. New Libr. World2008, 109, 273–286. [CrossRef]
58. Niezgoda, A.; Markiewicz, E. Lifestyle and Ecological Awareness of Consumers in the TouristMarket—Relations, Conditions and Problems. Ekon. Wroc. Econ. Rev. 2017, 23, 49–62.
59. Niezgoda, A. Wpływ mody na rozwój turystyki. In Współczesne Uwarunkowania i Problemy Rozwoju Turystyki;Pawlusinski, R., Ed.; Instytut Geografii i Gospodarki Przestrzennej Uniwersytet Jagiellonski w Krakowie:Kraków, Poland, 2013; pp. 85–92.
60. Sztompka, P. Zaufanie. Fundament Społeczenstwa; Znak: Kraków, Poland, 2007.
82

Sustainability 2020, 12, 5351
61. Tussyadiah, I.P. An Exploratory Study on Drivers and Deterrents of Collaborative Consumption in Travel.In Proceedings of the Information and Communication Technologies in Tourism 2015, Lugano, Switzerland,3–6 February 2015; Tussyadiah, I., Inversini, A., Eds.; Springer: Cham, Switzerland, 2015; pp. 817–830.
62. Owyang, J.; Tran, C.; Silva, C. The Collaborative Economy: Products, Services, and Market Relationships HaveChanged as Sharing Startups Impact Business Models. To Avoid Disruption, Companies Must Adopt the CollaborativeEconomy Value Chain; Altimeter: San Mateo, UK, 2013.
63. Rostek, A.; Zalega, T. Konsumpcja kolaboratywna wsród młodych polskich i amerykanskich konsumentów(cz. 1). Mark. Rynek 2015, 5, 11–19.
64. Skalska, T. Sharing economy in the tourism market: Opportunities and threats. Kwart. Nauk. Uczel. Vistula2017, 4, 248–260.
© 2020 by the authors. Licensee MDPI, Basel, Switzerland. This article is an open accessarticle distributed under the terms and conditions of the Creative Commons Attribution(CC BY) license (http://creativecommons.org/licenses/by/4.0/).
83


sustainability
Article
The Development of Mobile Tourism in the UpperSilesian Metropolitan Area of Poland
Mateusz Naramski * and Krzysztof Herman
Department of Organization and Management, Institute of Economy and Informatics, Silesian University ofTechnology, Akademicka 2A, 44-100 Gliwice, Poland; [email protected]* Correspondence: [email protected]; Tel.: +48-32-277-7336
Received: 14 November 2019; Accepted: 10 December 2019; Published: 19 December 2019
Abstract: Smart tourism is a concept that is becoming more and more popular worldwide in moderntourism. It is a tourism orientated part of the smart city concept, which can also be treated as aspecific type of business model. Support and presence of tourist attractions for smartphone usersthrough various apps is one of the first technological stages in the process of adapting this conceptin a touristic region. Therefore, the paper’s aim was to observe and measure the development oftouristic sites’ presence in mobile applications, in a developing touristic region. In order to do so,we compared data obtained from mobile applications in the years 2015 and 2019. The selected appscontain databases of touristic sites and allow tourists to search for attractions, hotels and restaurants.The comparison showed quantitative changes in the number of those types of objects found by mobileapps in the Upper Silesian metropolitan area, picturing the development and use of those apps in thisgiven region.
Keywords: m-tourism; mobile applications; sustainability in tourism; smart tourism; sustainablebusiness models
1. Introduction
Modern day tourism has been growing rapidly all over the world. This is due to the increasein income and quality of global society life [1]. In addition, the number of modern technologies thatare used to support tourism and tourist attractions is growing. Especially interesting are mobileapplications that include records regarding tourist infrastructure in a region. In most cases, those appscan be co-created by tourists and the entries are based on their experiences.
Mobile applications can be seen as the easiest technological solutions to adopt, which can improvetourism in a region. There are many already existing services that contain databases of touristic pointsof interest. Therefore, a region that transforms into a tourist destination does not need to develop itsown platform, but rather start by marking its presence in those databases. Those allow visitors to searchfor attractions, hotels and restaurants. This makes tourists aware of their surroundings in a givenarea. As we later discuss, most of such applications not only allow users to search for touristic objects,but they can also be reviewed. This changes the classical model of a touristic product and puts theconsumers into the role of co-producers. Those reviews are perceived as a powerful source of impacton other tourists, who orientate themselves based on such reviews, and see them as the most reliablesource of information. Adopting mobile tourism (m-tourism) is also one of the main pillars of thesmart tourism concept, which has become more and more popular. As a result, tourists expect certaindestinations to support a proper technological infrastructure and also be able to use mobile solutions,not only for searching attractions but also for booking hotels, finding restaurants, sharing experiencesand reviews. Destinations that adapt to those demands are more likely to be chosen by the part ofpotential tourists who only rely on such internet-based solutions for trip planning or by those who willprefer such destinations over those that did not adapt to the smart tourism concept. This implies that
Sustainability 2020, 12, 44; doi:10.3390/su12010044 www.mdpi.com/journal/sustainability85

Sustainability 2020, 12, 44
m-tourism presence and support become a necessity in almost every touristic region, especially inthe developing ones that aspire to become a well-recognized and desired destination (especially bytourists out of a given country, who discovered it by themselves and had no opportunity to getrecommendations from the local community that is familiar with it). The Upper Silesian metropolitanarea in Poland is a good example of such a region. Since the 1990s, the once known for heavy industryarea, has started to transform into a post-industrial region. This has left the region with a lot of heritage,both in the form of cultural and industrial monuments. Many former mines, factories, and otherfacilities have become museums, restaurants, galleries and other tourist attractions, where culturalheritage is presented and preserved, making it also a sustainability issue.
The idea of sustainable development emphasizes finding a use for material and non-materialvalues that are socially important and would be lost if no other action was taken [2]. Heritage tourismfits well into this category since it allows artifacts, old technology and culture to be saved from thepast, which would otherwise perish because there are no other applications for it that would generatesufficient income to sustain it [3]. Therefore, the process of transformation from a former industrialfacility to a touristic site that conserves heritage is a sustainability issue and can be well explainedthrough the perspective of business models [2]. Such an approach can be applied to single entitiesfrom various branches of tourism [4,5], but also to a set of touristic sites that try to improve in theirefforts to reach sustainable development, through cooperation and trust-building [6]. In the widestperspective, part of the sustainable development goals of a touristic region could be achieved througha business model applied to whole cities or metropolis. Such an approach can be found in the conceptof smart tourism, which utilizes technology to reach its goals and is the tourism-orientated part of thesmart city concept (with falls into the category of sustainable business models) [7,8].
In Upper Silesia, there are two industrial heritage sites that have been inscribed on the WorldHeritage Site’s list by UNESCO—with one of them quite recently in 2017 [9]. This illustrates well thatthe Upper Silesian transformation into a worldwide known and recognizable touristic destination isstill in process and makes a good case for studying how smart technology use develops and is appliedto support such transformation, illustrating the early stages of the smart tourism concept application.
Therefore, the paper’s aim was to observe and measure how the presence of touristic sites from theSilesian region develops in mobile applications. In our work, we focus on 14 mobile applications thatare used to find tourist attractions, hotels and restaurants. It is based on research that was conductedin 2015 [10], and now we compare the result of that research with data collected in 2019. The paper isdivided into two sections. In the first one, we focus on a literature review on digital technology use intourism, smart tourism concepts and business models in tourism. In the second part, we examine thefunctionality of selected mobile applications and we compare the results with previous ones. The areawe refer to in our research is the Silesian Voivodeship in the southern part of Poland.
2. Literature Review
2.1. The Role of Modern Technology in Sustainable Tourism
Tourism is one of the most significant world markets. The UNWTO report [11] indicates that in2017, international tourist arrivals increased by 6% in comparison to the previous year. As a result,it can be seen that tourism is constantly evolving. Development is visible in all fields of tourism. It isespecially evident in the area of digital technologies. Mobile apps, interactive museums, virtual andaugmented reality are only a few examples of modern technology that emerged in recent years.To understand what modern technology really is, it is important to discuss both terms.
Technology may be defined as a composition of two primary components—the physical one,which contains products, technics, and processes, and the second one, which is information that containsthe know-how, marketing, and quality control [12]. The term “modern” is commonly understood aseverything that nowadays is in use and is also frequently associated with any electronic elements. Thispoint of view is confirmed by the Cambridge Dictionary (available online). In connection with those
86

Sustainability 2020, 12, 44
definitions, modern technology can be understood as a set of components (joined together physicallyand by information) that are used nowadays and can be used interchangeably with digital technologies.
Modern technologies have found an application in all life areas in the modern world. It iseasy to find examples in medicine, enginery, psychology or military science. Digital technologiesare used in tourism as well. As an example, one can name the reservation system. The popularityof the CRS (computer reservation system) has been growing since the 1990s. Its basic function isto store information about all available service providers and to transfer such data between users.In comparison with traditional models of reservation, CRS significantly increases the rate of service salesby eliminating the physical distance between the producer and the consumer [13]. To name anotherexample, the tour-guide system is a commonly known one. It is used in many tourist attractions andfrequently is associated with recordings. Digital technologies have increased their functionality. Thetechnology was expanded by touchscreens, video projections, the Internet and even GPS systems. Forthis reason, the guide end-user system provides few capabilities such as access to extended information,the possibility to send and receive messages or access to interactive services [14].
A new way of using “commonly known” technology is Smart CCTV (closed-circuit television).This technology significantly extends the functionality of CCTV and, in addition to the securityfunction, enables to recognize the behavior of tourists and, as a consequence, better planning of tourismspace [15,16]. Another idea is the beacon technology which is used to deliver extended informationabout exhibits by short-range signal transmitters [17]. In the context of modern technologies in tourism,augmented reality (AR) and virtual reality (VR) are frequently pointed out. These two technologiesoffer some benefits to human experience. The major advantages of VR are personalization, interactivity,and full immersion which have a significant influence on explaining the main phenomena [18].AR, although it works differently (do not create reality, only adds some virtual objects to availablespace), has a similar effect to explaining the main phenomena.
An example of technology that suggests itself in the described context are mobile applications.Mobile technologies are correlated with the growing use of smart phones, that have been popularizedand made known by Apple’s iPhone. Their App Store, soon followed by the Google Play Store,started in 2008 [19]. In 2011, it was one of the fastest-growing media outlets in the history of consumertechnology [20]. Since that time, the mobile market has considerably increased and today it can nolonger be seen as a curiosity, but as a major part of life and business. Take the Gartner report [21] forinstance: mobile apps are projected to have the most impact on business success by 2020. Withoutdoubt, smartphones and mobile applications are an important part of everyday life also in touristactivity. In Poland, above 58% of smartphone users have been using them to book hotels, planes ormake car reservations [22]. One of the most popular mobile platforms: Trip Advisor has over 490billion users every month. On the basis of the above data, it is possible to predict that the market ofsmartphones and mobile applications will grow and it is necessary to examine its dynamics. Moreover,those technologies are directly connected with the idea of smart tourism.
A study published in 2018 focused on how tourists’ risk perception affects their use of mobiledevices, and the results suggest that there is no single digital tourist profile. Risk perception by touristswho use mobile devices is an important sustainability factor, because it is shaping their experience,through its influence on tourist behavior and satisfaction with a service. Tourist destinations shouldinclude a smart tourism policy in their efforts to promote a destination and it is suggested to includethe perception of risk. The referred research shows that there is a dependence between mobile devicedependence and its usefulness, but also that privacy risk has a major negative impact on the touristexperience (yet it does not affect future use of mobile devices and their perceived utilitarian value) [23].This is crucial since the tourist experience is believed to be the essence of modern tourism [24], and it isalso considered to become increasingly impactful on value co-creation [25].
Nowadays, the use of mobile devices like smartphones, tablets, etc., is so broadly spread thatthey have become a standard resource, also used by tourists to search for experiences, places andattractions. This behavior influences both the way information reaches tourists and the way they
87

Sustainability 2020, 12, 44
are acting during a holiday [26,27]. A modern tourist business should be aware of this and respondthrough its management to the elements that shape tourist behavior regarding this medium, not onlyby single actions but by incorporating it into its business model [23].
In modern tourism, the use of technology and mobile phones in particular, puts tourists into therole of co-producers of tourist experiences [28–30]. Tourist destinations that emphasize on introducingsmart tourism are dependent on technology, making the attractions available and appealing to touriststrough this media, but also allowing them to co-shape the product by reviewing it, sharing opinions,recommendations, etc.
Those shared opinions, recommendations, ratings, etc., have also another meaning for a touristdestination. All tourist areas, no matter the size (from villages, cities, regions or countries) are (or at leastshould be) monitoring and constantly improving the destinations’ image and attractiveness [31]. Thistopic was in the scope of researchers for decades [32]. The sources of factors that affect the formationand change of a tourist destination image can be divided into three groups: organic (originating andtransmitted by individuals), induced (coming from the entities that promote a region) or autonomous(not related to the previous two) [33,34].
The first group contains all activities of word of mouth marketing, like sharing informationwith friends, family, and work colleagues, and is best known under its informal name: grapevine.In modern days, this form of creating opinions about destinations is therefore, also building or ruiningits image, and becomes expanded by technology. User-generated content that includes opinions orrecommendations that are shared over social media, websites, services, apps, etc., is an electronic formof word of mouth marketing (eWoM) [35]. Thanks to the constant development of technology andincreasing meaning, and use and application of electronic media by tourists, the eWoM has undergonemany changes in the course of the last 10 years from online guides and blogs to portals and mobileapps, that are now the most widely used medium for online tourist reviews [36]. Those can be used byresearchers, as E. Marine-Roig has shown [35], to examine a well-known tourist destinations’ image,that emerges from online reviews. The same data can be useful for local administration, promoters of atourist region and entrepreneurs, in terms of gathering feedback about their single product or aboutthe whole destination in general and its image.
This implies that in order to meet the requirements of modern tourists, a region that aspirates todevelop an advanced tourist function should undertake actions that will ensure its presence in thosewidely used social apps and services. After this is achieved, the feedback from online tourist reviewsoffers a plenteous source of information that is easily accessible (compared to conducting reviews,surveys, etc.), and can be used for creating sustainable development plans which can incorporatesolutions for current, environmental, civil, juridical and touristic problems found in a region.
Online reviews in tourism and hospitality are perceived as a significant factor that nowadaysstrongly impacts the decision-making process of a consumer [25,37–40]. Those sources are evenconsidered to be seen by customers as more reliable and believable than information coming fromthird party and product vendors [41–43]. As mentioned before, this puts the customers in the role ofco-creators of a tourist experience but also makes those reviews valuable information sources for theservice provides [44,45]. Therefore, one can say that the role of online reviews and ICT’s (Informationand Communication Technologies) in tourism are bilateral and conjunctive; on the one hand, they arean information source for potential tourists that make decisions based on that information, and onthe other hand, during and after the consumption of a touristic product, they are used for sharingexperiences, opinions, and recommendations [46]. Due to the above, ICT is frequently an inseparableelement of business models in tourism enterprises.
2.2. Business Models in Tourism
Business models are a popular issue among researchers. The phrase “business model” as keywordsin ScienceDirect returns over 350,000 research articles. This popularity is due to a few factors. The firstone is the practical dimension. A good created business model is frequently indicated as one of the
88

Sustainability 2020, 12, 44
most important factors of success in business [47]. The second factor is cognitive value. Analyzingexisting business models allows to recognize the strengths and weaknesses of an organization, and italso allows to identify trends in business and indicate success factors. The third is the number of toolsfor creating the business model.
Such great interest in the issues of business models is also caused by the disagreement regardingthe definition of the business model. It is understood differently, depending on the researcher’sscientific discipline. The literature review allows us to assume that the business models are understoodin two ways. The first one is a synthetic description of the company’s operation. J. Magretta is one ofthe scholars who follows this approach and who explains the business model as a story that explainshow enterprises work [48]. The second way is to understand the business model as a tool to createvalue for customers. It is mentioned by D. Teece, who describes the business model as a tool to designthe mechanism of creating, describing and capturing value for customers [49]. Regardless of theapproach to the characteristics of business models, numerous researchers agree that it consists of severalcomponents. Researches conducted by M. Morris et al. [50] and Shafer et al. [51] refer to this. The firstteam analyzed 19 perspectives on business model components. As a result, these researchers preparedsix questions that describe a business model, and based on the answers, six major components of abusiness model could be created: factors related to offering (how the value is created), market factors,internal capability factors, competitive strategy factors, economic factors, and growth/exit factor.The second team analyzed 12 definitions of business models and specified 42 different components(unique building blocks or elements) that make a business model. In that research, they organizedall ideas into four categories based on their similarity: strategic choices, create value, value network,and capture value.
One of the most popular conceptions is the business model CANVAS. The idea was developedand disseminated by A. Osterwalder and Y. Pigneur [52]. They include a framework based on nineelements: customer segments, value propositions, channels, customer relationships, revenue streams,key resources, key activities, key partners, and cost structure. These nine elements are widely used asa tool to create new business models and describe existing ones. Another example is the Cube businessmodel. It consists of seven blocks: value proposition, users and customers, value chain, competences,networks, relations and value formula [53]. Another example is the proposal of M. Johnson et al. [54].It contains four elements of a “Successful Business Model”: value proposition for the client, profitformula, key resources, and key processes. Literature analysis shows significant differences in thecomponents of business models. However, one element is common. It is the value that the companyoffers to its clients.
Business models described in the context of providing tourist services often refer to moderntechnologies. E. Cranmer et al. [55] point out the possibility of creating value by using augmentedreality (AR). This technology gives the opportunity to present collections to which access is difficult(e.g., delicate exhibits). Researchers also describe the possibility of sharing such a tool by manyentities, whereby the belonging of many museums to a common network allows them to createvirtual exhibitions, extending the presented heritage with exhibits or collections owned by other units.Thanks to AR, exhibits can be better protected and made available to tourists and other entities inthe form of models without the risk of damage. Therefore, digital technologies enable the creationof a joint virtual exhibition, extending the heritage presented by exhibits or owned collections byvalues owned by other units. In the opinion of C. Ciurea and F. G. Filip [56], virtual exhibitions arealso an excellent opportunity to correlate museum collections located in various cultural units suchas museums, libraries, archives, and galleries. The combination of these units, although only virtual,causes a real increase in the number of visitors and in the revenue stream.
N. Langvould and I. Daunoraviþinjtơ [57], in a publication on factors that influence the success ofa business model in the hospitality service industry, show that technology is one of the most importantfactors because it can reduce the cost of business. In addition, technology has a strong relationship with
89

Sustainability 2020, 12, 44
other factors, which include internal and external marketing, relationship management, innovation,value proposition, and employee competencies.
The fundamental importance of modern technologies in creating business models was noted byM. Diacon and A. Dutu [58]. Those researchers claim that the development of new technologies hasbecome a way to achieve success because it offers the possibility of expanding distribution channels,shortens the time of booking processing and creates a network of organizations involved in maintainingthe value chain.
F. Mantaguti and E. Mingotto [59] show that knowledge is important in business models. Especially,it applies to knowledge generated by stakeholders, such as public institutions, local governments,business partners and even volunteers. Organizations using such knowledge effectively can becomeflexible enterprises, where entrepreneurs and their employees are in some sense creative agents,for whom customer relations are a priority. Modern technologies are used to gather and processknowledge because of their generality.
Modern technologies, their development and the attractiveness of their use, have caused businessmodels to evolve. One of the directions of this development is the Smart Tourism concept.
2.3. Smart Tourism
Smart tourism is quite a new idea. The basis of it can be found in Web 2.0 conception. The termhas been widely used to describe the role of technologies for modern tourists. Tourists are no longerpassive but active [60]. They co-create tourist services through the opinions they leave on the Internet.In connection with this, a lot of companies have been obligated to change their products or eventheir business models. The idea of co-creating services seems tempting also for managers of touristattractions. The era of m-tourism 2.0 has begun. This conception, described by Beça [60], enables usersto get access to extended information that may help enrich their experience, provide their own opinionsand get feedback or update some information in the future. This holistic approach is the basis of thesmart tourism idea. Smart tourism may be defined as the integrated efforts of entities in destinationto collect, aggregate and use data that could be transformed into on-site experiences and businessvalue-propositions [61]. It seems reasonable to assume that it is the future of tourism. Big data, as atotal experience of tourists, tourism attractions, government, tourist companies or even residents,could be used to create better touristic products.
The topic of sustainability in tourism roots back to the 1960s, when global tourism entered a rapidgrowth [62], and it was a response to negative effects in regions overblown by tourists, like inflation,increasing crime rate, rising housing prices, negative influence on local society (especially children)and higher number of strangers in previously sheltered neighborhoods [63]. The primal sustainablesolutions for establishing sustainability in tourism reached out to the (back then) most influentialmethods, but technology was left out and not perceived as a key aspect in this matter [63]. As alreadymentioned before, over the last decades, things have changed dramatically, and now the use of moderntechnology is an inevitable part of tourism, which should be used for the benefits of sustainabledevelopment. D. Kim and S. Kim [64] researched the role of technology in achieving sustainable tourismby conducting a complex review of papers, news, mobile apps, and patents. The conclusion drawnfrom their research shows that the impact of mobile technology on sustainability is hard to measuredirectly, but can be deduced quantitively from frameworks already established in literature, since theenvironmental effects of tourism and cultural heritage, as well as ICT’s role in creating smart citycommunities, are all subjects of sustainable tourism discussions [65–68]. Mobile applications enhancethe social capital by offering resources for tourist to tourist relations and the instant communication thatcan take place through them can be used by the transactors to share value and build cultural capital.Those among others positively affect sustainability. Furthermore, ICTs can be used to obtain big data,and perform large scale measurements and analysis, sometimes even in real-time. This allows them totrack environmental impacts, support decision making and accelerate the introduction of new policies.
90

Sustainability 2020, 12, 44
In the area of business models in tourism, special attention is paid to innovations in valuepropositions in business models, such as the use of new technologies. They significantly extend thevalue that companies can offer to their customers. Noteworthy is the recently popular concept of SmartTourism [61], which is based on transforming huge amounts of data obtained through an application(usually mobile) into a value proposition for the client. In tourism, VR technology is increasingly beingused, which makes it possible to get to know a space that is inaccessible to a client. This is emphasizedby E. Crammer [55], who points out that, on the one hand, it may diversify the offer of a venture,and on the other hand, it contributes to increasing the competitiveness of that venture and increasesits profits.
Smart tourism is a subset of the smart city concept in which the main idea is to connect people,business processes and systems, government and other entities together, with the main goal ofimproving the life quality of all citizens [7]. In other words, a smart city concept is essentially abusiness model of a city that is oriented at reaching specific goals with the use of innovative systemsand processes. Smart city concepts focus on ICTs, platforms that allow engaging stakeholders,data generation and analysis coming from big data and open data sources [8]. This concept alsofocuses on human capital and information management [68–72]. This meaning, it is oriented at usingemployees’ skills to produce desired outcomes. Smart tourism is the outcome of applying a smartcity concept in a tourist destination, so that some of the developed solutions can enhance touristexperience, by automating some of the processes or improving their efficiency [73,74]. Therefore,smart tourism provides an interface between the visitor and the destination, allowing them to meettheir needs [7]. Moreover, smart tourism requires the use of innovative solutions, that cover all mainareas of sustainability (environmental, sociocultural, economic) while spreading cultural heritage totourists [7,69].
According to some authors [7], destinations that apply the smart tourism concept incorporatethree components:
1. Cloud services—those provide access to technological solutions in the form of applications,software, and data [75].
2. Internet of things—it is responsible for control and automation in providing destinations withinformation management and analysis [75].
3. End-user Internet Service System—they are designed to provide users (tourists) with applications(and sometimes equipment) that allow access to tourist-oriented services (booking, payment,internet access, finding destinations and attractions, etc.).
Those means serve to accomplish one of the main goals of smart tourism, that is—to create andmanage tourist experiences [76]. Thanks to this, it is possible for multiple tourists to draw different,individual experiences from the same product offered by a destination [77].
In the light of all findings from various studies shown above, one can conclude that the smarttourism concept is virtually a necessity in destinations that aspire to become a tourist region or try tomaintain such function. Modern tourists expect to find information about destinations, attractions,hotels, restaurants and locally available experiences, in apps, social media and other web-orientedservices. They also expect to find a proper ICT infrastructure on-site, so they can continuously use thoseservices, not only to find new places and activities but also to share those experiences with friends,family and other tourists, as well as for booking and regulating payments. Upon returning home,they want to review and recommend (or advise against) certain places or service providers. Moreover,those opinions are more likely to be taken into consideration by potential tourists, than content fromother sources (advertisements, service providers, third party reviews). This does not only concern theyoung and middle age, technology-oriented tourists. As a recent study from Spain [78] has shown,the line of age in which tourists use apps has shifted, and senior citizens are a substantial tourist groupthat uses ICT technologies, mainly in the pre-travel phase, to book accommodation and transportation,and to locate and search for services and products.
91

Sustainability 2020, 12, 44
Smart tourism was mainly studied from the perspective of the advantages that it can offer. However,there are also some risks that one should consider. Among those risks one can name [61,79–83]:
1. Information safety—this includes all sensitive information validations, like payment and location,information, but also storing of digital footprints left by unaware users.
2. Risk of losing tourists intimidated or unfamiliar with smart technology. Individuals who knowthat a destination is heavily oriented on smart technologies in tourist services, and do not usethem or do not do it with comfort and confidence, might refrain from using such apps or evencancel the trip. This also poses a risk and fear of losing, damaging or misusing those devices.
3. Risk of losing tourists who are well familiar with modern technology, but get dependent on them,so they make it impossible for tourists to enjoy their travels (fully and uninterrupted).
Even if the chances for some of those events in the first point are very small, the fear of them takingplace may place some tourists into feeling discomfort and discourage them from traveling. Theseissues should also be taken into consideration by smart tourism destinations (local administration,service providers, app designers, etc.) and use appropriate means to avert those negative effects.
3. Research Details
In 2015, one of the authors [10] conducted an analysis of six mobile tourist apps, that were designedoverseas, offer an interface in English and are dedicated for the global market. Those applications were:Tripadvisor, TripCase, WorldMate, TouristEye, Gogobot, and EloMaps. During the referenced research threePolish apps, dedicated only for domestic tourists, were also analyzed: Polska Niezwykła, Polskie Szlaki,and wyjade.pl. Choosing these two types of apps allowed to compare the number of hotels, restaurantsand tourist attractions fond by apps dedicated both to domestic and foreign tourists. Taking appsinto account that are dedicated to foreign tourists seems particularly important when one considersthat according to the Central Statistical Office’s (CSO) [83] data, almost every fifth (20.89%) tourist inPoland is a foreigner. The same statistic also says that visitors from other countries make almost aquarter (24.48%) of all hotel guests in Poland.
Some of the mentioned applications no longer operate on the market as for the day of thispublication, and some of them were changed to follow a new business model, offering a differentfunctionality compared to 2015. In this research, we collected data from all previously mentionedapplications that still operate on the market and from four new ones that have gained popularityduring the last four years. The additional apps were: Airbnb, Booking.com, Foursquare, and Triposo. Thecriteria for choosing these apps were the same as during the previous research—a high position inthe Google Play store when searching for phrases like: tourist guide, trip planner, tourist application.Google ranks its apps higher according to the bigger the user count and user rating, and the better thematch with the searched phrase. The subject for the analysis was: the number of hotels, restaurantsand tourist attractions found by each app (not all of them allow to search for all three types of objects)in selected cities: Katowice, Chorzów, Bytom, Zabrze, and Gliwice. Those towns have been selectedbecause they were the most visited cities in Silesian Voivodeship during the years 2013 to 2015 (annuallyapproximately 50% of all tourists in this Voivodeship visited these towns) [84]. Table 1 shows which ofthe given functions (searching for hotels, restaurants and tourist attractions) were available in 2015and/or still in 2019, and also how some of the functionality has changed in this time period.
Two of the analyzed applications changed their names over the course of four years (from 2015 to2019). Gogobot has become Trip by Skyscanner, but the available functions did not change. The secondapplication that was renamed is Guides by Lonely Planet (former TouristEye). Originally, TouristEyeallowed, just as similar services do, to search for restaurants and tourist attractions in selected usercities. Nowadays, the business model of this app has changed and it offers access to comprehensiveguides through selected cities popular among tourists all over the world (in the case of Poland, as for2019, there were two guides available through Warsaw and Cracow). Two from the nine apps thatwere analyzed back in 2015 expired and are no longer available, those are EloMaps and WorldMate.
92

Sustainability 2020, 12, 44
Only three of the services allow to search for all three types of objects (hotels, restaurants and touristattractions). The presented changes in availability, functionality, and business models show how proneto change and dynamic the application market is. Almost half (5 out of 9) of the previously analyzedapplications has undergone no major changes. This dynamic should also affect the development ofeach app, especially regarding the size of databases that are available for the users. Thus, the nextstage of the research was to analyze the amount of tourist objects found by each application.
Table 1. Comparison of available search functionality in mobile applications.
ApplicationHotels Restaurants Tourist Attractions
2015 2019 2015 2019 2015 2019
Airbnb N√
N � N �
Booking.com N√
N � N �
EloMaps � E � E√
EFoursquare N � N
√N
√Gogobot/Trip by Skyscanner*1 √ √ √ √ √ √
Polska Niezwykła � � � �√ √
Polskie Szlaki � � � �√ √
TouristEye/Guides by Lonely Planet*1 � �√
�*2 √�*2
Tripadvisor√ √ √ √ √ √
TripCase√ √ √
�*2 � �
Triposo N√
N√
N√
WorldMate√
E � E � Ewyjade.pl
√ √ √ √ √ √Explanations:
√—function available; �—function not available; E—end of operation; N—no data from 2015,
the application was taken into consideration only in current research; *1—the name of the application was changedbetween 2015 and 2019; *2—the business model has changed, resulting in the function being no longer available(Source: Own research).
4. Results
Before analyzing the actual results obtained from mobile applications it is worth to delve intothe characteristics of tourism in the Silesian region. Table 2 contains selected statistical indicatorsprovided by the Polish Central Statistical Office (CSO) for the years 2014–2018, for tourism in theSilesian Voivodeship. One can notice that both the Schneider and Charvat Indexes have been constantlyrising during the last five years, indicating that the number of tourists in Silesia has been constantlygrowing in this period of time. The growth was also noted by the indicator of tourist traffic density.It is also worth noting that even if the index of accommodation establishments per 100 km2 rose,the tourist accommodation development rate has also risen. This might be interpreted as a sign thatthe accommodation base develops slower than the tourist traffic in this region. It is also interesting thateven if tourism traffic seems to be growing, the number of catering units per every 100 km2 in 2018 waslower than in the previous four years. Since the whole Voivodeship has an area of 12,333 km2, it meansthat the total number of catering units has sunk by around 280. This took place, even though the totalnumber of tourists visiting the Silesian region has been rising significantly since 2013, as presented inthe graph in Figure 1.
As mentioned before, Upper Silesia is developing as an industrial heritage touristic region. Thisreflects on the number of objects inscribed on the register of monuments, that has been constantlygrowing over the course of the last five years. It is also worth mentioning that in 2006, the IndustrialMonuments Route (IMR) of Upper Silesia was created, and since 2010, the creators (Marshals Office)organize an annual event called Industriada. It is described as a holiday of the route, during whichevery site on the route (42 as for 2019) organizes special events (concerts, free tours, educationalpresentations, etc.). The number of visitors during each Industriada has been growing every year, and in2018 it tippled in comparison to the first edition. In Figure 2, we present a graph that illustrates thegrowing number of Industriada participants. One might say that this is the indisputable proof of UpperSilesia developing as an industrial heritage tourist region.
93

Sustainability 2020, 12, 44
Table 2. Selected indicators regarding tourism in Silesian Voivodeship.
IndicatorYear
2014 2015 2016 2017 2018
Baretje’s Index(bed places per 100 inhabitants) 1.0 1.0 1.0 1.0 1.1
Schneider Index (tourists per100 inhabitants) 43.9 46.9 50.8 57.0 61.9
Charvat Index(nights spent per 100 inhabitants) 102.1 108.0 115.4 127.6 139.1
Tourist accommodation development rate(tourists in comparison to bed places) 44.8 46.8 51.7 55.0 57.2
Indicator of density of tourist traffic(tourists per 1 km2) 163.6 174.1 187.9 210.5 227.8
Indicator of density of touristaccommodation establishments
(bed places per 1 km2)3.6 3.7 3.6 3.8 4.0
Number of tourist accommodationestablishments per 100 km2 5.2 5.1 4.9 5.2 5.4
Museum visitors per 1000 population 309.9 351.5 316.4 355.7 333.3Objects inscribed on the register of
monuments per 100 km2 of area 31.1 31.9 32.0 33.1 34.6
Catering units per 100 km2 of area 13.1 14.3 14.3 13.6 12.0
(Source: [85–89]).
4558 4584 4632 4557 46904946
5267
58106315
4000
4500
5000
5500
6000
6500
2010 2011 2012 2013 2014 2015 2016 2017 2018
Thou
sand
s of
tour
ists
Year
Figure 1. Overnight stays of tourists in Silesia, in 2010 to 2018 (Source: [85–89]).
29
5462
75 77 77 8090
100
20
40
60
80
100
120
2010 2011 2012 2013 2014 2015 2016 2017 2018
Thou
sand
s of
vis
itors
Year
Figure 2. Number of tourists attending Industriada every year since it was started in 2010 (Source: [90]).
The first of the analyzed functions of mobile tourist applications was the number of accommodationfacilities found in selected cities. Out of the 13 applications studied, eight offer or have offered this
94

Sustainability 2020, 12, 44
function (the WorldMate application is no longer maintained by its authors and its activity has beenterminated). Table 3 shows the results obtained from every application.
Table 3. The number of accommodation facilities found by each application.
City
Application Name
Tripadvisor Tripcase WorldmateGogobot/Trip by
Skyscannerwyjade.pl Triposo Booking.com Airbnb
Year Year Year Year Year Year Year Year2015 2019 2015 2019 2015 2019 2015 2019 2015 2019 2015 2019 2015 2019 2015 2019
Katowice 23 112 25 29 12
−*1
17 151 0 0
-
100
-
352
-
318Chorzów 3 11 5 6 2 2 9 0 0 −*2 22 37
Zabrze 5 19 5 12 1 3 10 0 0 7 30 23Gliwice 8 35 11 13 2 3 20 0 0 17 58 66Bytom 3 16 6 5 0 0 4 0 0 12 38 36Sum 42 193 52 65 17 - 25 194 0 0 - 136 - 500 - 480
Difference 151 13 - 169 0 - - -Change in
percent 359.52% 25.00% - 676.00% - - - -
*1—end of market operation; *2—this location is not supported by the app, the results for Katowice contain alsoobjects from Chorzów (Source: Own research).
The last three applications presented in Table 1 (Triposo, Booking.com, and Airbnb) were onlyincluded in the current research, so in their case, the authors did not have data from 2015. The sum ofaccommodation facilities for applications that have been operating for the last four years has increased(Tripadvisor, 359.52%; TripCase, 25.00% and Trip by Skyscanner, 676.00%). Despite the long periodbetween measurements, the application wyjade.pl still does not have in its database a single object ofthe chosen type, for any of the largest cities of the Upper Silesian Industrial District (although theapplication provides such functionality).
Portals created solely to search for accommodation facilities (Triposo, Booking.com, and Airbnb)returned several times more results than the applications analyzed in 2015 that offer searching forvarious types of objects. It should also be noted that for all applications, the number of accommodationfacilities found in Katowice was many times higher than in other city.
Figure 3 presents a graph comparing the number of accommodation facilities found by each appin 2015 and 2019.
42 52
17 25 0 0 0 0
193
65
0
194
0
136
500
480
0
100
200
300
400
500
600
Trip
advi
sor
Trip
Cas
e
Wor
ldM
ate
Gog
obot
/ Tr
ip b
ySk
ysca
ner
wyj
ade.
pl
Trip
oso
Book
ing.
com
Air
bnb
2015 2019
Figure 3. The number of accommodation facilities in selected cities by each application in 2015 and2019 (Source: Own research).
95

Sustainability 2020, 12, 44
One can notice that for most of the studied applications, the results have changed significantlycompared to the figures recorded in 2015. The exception is TripCase, where the latest results increasedby only 25% compared to the results from four years ago. All of the previously studied applicationsalso obtained significantly lower results (not exceeding 200 records) compared to newer applicationsdedicated only for searching accommodation (booking.com and Airbnb), which have found about 500accommodation facilities. It should be emphasized here that the number of accommodation facilities inthe largest cities of Upper Silesia found by Tripadvisor (one of the most popular tourist applications in theworld) is also not as large as in the other two applications. This can be an area for improvement amongSilesian hoteliers, giving the opportunity to reach potential customers who use only one application tomeet all their basic needs. The results from other applications clearly show that the number of hotels inthe cities selected for the study has increased (as far as it goes to their presence in mobile applications),but the databases of many applications still do not include a significant proportion of existing facilities.The data from CSO also reflects that the accommodation base in Silesia has been growing, so the clearincrease of those facilities’ presence in mobile apps might be caused by the rapidly growing number oftourists visiting this region.
The second of the analyzed quantities was the number of gastronomic establishments found bymobile tourist applications. Out of the 14 services taken into consideration in this study, seven offerthis feature. Table 4 presents the results obtained in 2015 and 2019 by each application.
It can be noticed that within those four years between the described researches, the databaseof gastronomic establishments in the application wyjade.pl has not changed and still did not containa single object in the cities selected for the study. As mentioned earlier, the Guides by Lonely Planetapplication was created on the basis of the former TouristEye service, and its business model changed.Thus, it was impossible to compare the results from 2015 and 2019 in this application. It was similar inthe case of TripCase, which was remodeled into a flight search engine. In the case of applications thatretained their original functions (Tripadvisor and Trip by Skyscanner), there was a clear increase in thenumber of gastronomic establishments included in the databases of each service. During the research,Tripadvisor found a total of 694 objects of this type in selected cities. This is an increase by almost129% compared to 2015 and, at the same time, the highest result among all applications included inthis research. The relatively largest increase in the gastronomic establishments was observed for theTrip by Skyscanner application (from 13 to 381, which gives an increase of over 2380% compared to2015). Figure 4 presents a graph comparing the number of gastronomic establishments found by eachapplication in 2015 and 2019.
It can be seen that over the past four years there has been a development of mobile touristapplications regarding extending databases covering gastronomic establishments. Applications thatdid not contain a large number of records in 2015 (TripCase and TouristEye) changed their businessmodel and focused on other functionalities. The exception is the portal wyjade.pl, which, despiteproviding the search function of gastronomic establishments, still does not have any facilities in itsdatabase located in major cities of the Upper Silesian metropolitan area. These results, in juxtapositionwith the statistical data from CSO, show that despite the decrease in the total number of catering unitsin Silesian Voivodeship, their presence in mobile apps has been growing, even if not uniformly in everycase. This might also be an indication that the number of restaurants in the metropolitan area has beengrowing, but it did not affect the overall statistic for the whole Voivodeship, which noted a downfall inthis matter.
The last of the analyzed aspects of mobile tourist applications was the number of tourist attractionsfound by them. Out of all 14 applications included in the current and previous study, nine have or hadsuch a function. The only application whose developers terminated it was EloMaps. As mentionedearlier, the TouristEye application has been remodeled into a set of guides through selected cities,in which none of the cities selected for this study were included. Two new applications have beenincluded into the current study, due to their development and high positioning in 2019. These areTriposo and Foursquare. The number of tourist attractions found by each application is shown in Table 5.
96

Sustainability 2020, 12, 44
304
16 7 13 0 0 0
694
0 0
381
0
333
147
0100200300400500600700800
Trip
advi
sor
Trip
Cas
e
Tour
istE
ye /
Gui
des
by L
onel
y Pl
anet
Gog
obot
/ Tr
ip b
ySk
ysca
ner
wyj
ade.
pl
Trip
oso
Four
squa
re
2015 2019
Figure 4. The number of gastronomic establishments found in all selected cities by each application in2015 and 2019 (Source: Own research).
Since 2015, a significant increase in the number of tourist facilities has been observed in allapplications that continued to operate in 2019. The highest number of attractions is contained in thePolska Niezwykła application’s database (421 facilities in selected cities). In this application, the largestnominal change in the number of objects was noted. It took place in the course of the last 4 years and152 new objects were added. Regrettably, this application is available only in Polish, which makes itdifficult for foreigners to use. Triposo has the largest number of objects in an application available toforeigners, which has 201 records in its database (therefore, it is not even half of the objects listed inPolska Niezwykła). Figure 5 presents a graph comparing the number of tourist attractions found by eachapplication in 2015 and 2019.
It can be noted that in the case of the wyjade.pl application, the increase in the number of touristfacilities noted in 2019 is still insufficient compared to competing platforms. Domestic tourists usingPolska Niezwykła have access to a much larger database of attractions. For foreign tourists, using theTrip by Scaner application also seems to be the least favorable option, knowing that Tripadvisor has adatabase almost four times larger, and Triposo five times as big. The CSO data suggests that the increasein mobile app records regarding tourist attractions might also be caused by the significant rise in thenumber of tourists that started in 2014 (just like in the case of hotel records). This is even more evidentwhen one considers that the increase in the number of monuments in Silesia is nowhere near to theproportion of the attraction database growth (the number of monuments has changed only by 11%).This development in mobile app use was probably also not caused by an increase in museum interestsince the number of visitors over the last five years followed no clear trend. The obtained data can bealso investigated from the perspective of the share of each city in the total results found. The averagenumber of hotels, restaurants and tourist attractions in all of the analyzed applications was calculatedfor each city. Figure 6 presents a graph illustrating the share of individual cities in the overall averagevalues for each category.
97

Sustainability 2020, 12, 44
Ta
ble
4.
The
num
ber
ofga
stro
nom
ices
tabl
ishm
ents
foun
dby
each
appl
icat
ion.
Cit
y
Ap
pli
cati
on
Na
me
Tri
pa
dv
iso
rT
rip
case
To
uri
stE
ye/G
uid
es
by
Lo
ne
lyP
lan
et
Go
go
bo
t/T
rip
by
Sk
ysc
an
ne
rw
yja
de
.pl
Tri
po
soF
ou
rsq
ua
re
Ye
ar
Ye
ar
Ye
ar
Ye
ar
Ye
ar
Ye
ar
Ye
ar
20
15
20
19
20
15
20
19
20
15
20
19
20
15
20
19
20
15
20
19
20
15
20
19
20
15
20
19
Kat
owic
e16
738
87
−*1
6
−*2
1020
00
0
-
200
-
63C
horz
ów32
631
03
440
00
13Z
abrz
e24
560
00
460
00
11G
liwic
e64
137
61
075
00
8353
Byto
m17
501
00
160
050
7Su
m30
469
416
07
-13
381
00
-33
3-
147
Diff
eren
ce39
0-
-36
8-
--
Cha
nge
inpe
rcen
t12
8.29
%-
-28
30.7
7%-
--
*1—
the
busi
ness
mod
elw
asch
ange
d,th
eap
pis
desi
gnat
edno
wfo
rbo
okin
gfli
ghts
;*2—
the
busi
ness
mod
elw
asch
ange
d,th
eap
pco
ntai
nsno
won
lyco
mpl
exgu
ides
thro
ugh
sele
cted
citi
es(S
ourc
e:O
wn
rese
arch
).
Ta
ble
5.
Num
ber
ofto
uris
tatt
ract
ions
foun
dby
agi
ven
appl
icat
ion.
Cit
y
Ap
pli
cati
on
Nam
e
Tri
pad
vis
or
To
uri
stE
ye/G
uid
es
by
Lo
nely
Pla
net
Go
go
bo
t/T
rip
by
Psc
an
ner
Elo
Map
sP
ols
ka
Nie
zw
yk
łaP
ols
kie
Szla
ki
wy
jad
e.p
lT
rip
oso
Fo
urs
qu
are
Year
Year
Year
Year
Year
Year
Year
Year
Year
2015
2019
2015
2019
2015
2019
2015
2019
2015
2019
2015
2019
2015
2019
2015
2019
2015
2019
Kat
owic
e14
6211
−*1
327
17
−*2
112
166
1835
35
-
98
-
50C
horz
ów6
200
09
336
3811
160
3−*
311
Zab
rze
520
00
10
2431
1114
13
348
Gliw
ice
934
50
412
5810
813
220
330
17By
tom
318
00
00
3978
234
00
394
Sum
3715
416
-3
4132
-26
942
155
121
414
-20
1-
68D
iffer
ence
117
-38
-15
266
10-
-C
hang
ein
perc
ent
316.
22%
-12
66.6
7%-
56.5
1%12
0.00
%25
0.00
%-
-
*1—
chan
gein
busi
ness
mod
el,t
heap
plic
atio
noff
ers
only
com
preh
ensi
vegu
ides
thro
ugh
sele
cted
citie
s;*2
—en
dof
mar
keto
pera
tion;
*3—
this
loca
tion
isno
tsup
port
edby
the
app,
the
resu
lts
for
Kat
owic
eco
ntai
nal
soob
ject
sfr
omC
horz
ów(S
ourc
e:O
wn
rese
arch
).
98

Sustainability 2020, 12, 44
37 16 3
269
55
4 0 0
154
0
41
0
421
121
14
201
68
0
100
200
300
400
500Tr
ipad
viso
r
Tour
istE
ye /
Gui
des
by L
onel
y Pl
anet
Gog
obot
/ Tr
ip b
ySk
ysca
ner
EloM
aps
Pols
ka N
iezw
yka
Pols
kie
szla
ki
wyj
ade.
pl
Trip
oso
Four
squa
re
2015 2019
Figure 5. The number of tourist attractions found in all selected cities by each application in 2015 and2019 (Source: Own research).
67.1
2%
54.73%
41.86%
6.27
%
7.72
%
10.6
9%
6.38
%
7.27
%
10.4
9%
13.2
1% 22.3
8%
20.6
0%
7.02
%
7.91
% 16.3
5%
0.00%
20.00%
40.00%
60.00%
80.00%
100.00%
Hotels Restaurants Tourist attractions
Katowice Chorzów Zabrze Gliwice Bytom
Figure 6. The percentage share of the average number of hotels, gastronomic establishments and touristattractions found in individual cities (Source: Own research).
The presented data shows that the largest share of objects found in each category falls on Katowice.The second destination for which the analyzed applications found the most results was Gliwice.In other cities, the results in each category were similar. This shows that tourists visiting the UpperSilesian Industrial District using mobile applications will find, primarily, attractions, accommodationand restaurants in the capital of the Silesian Voivodeship.
5. Discussion
Based on the research results presented, several observations can be made. The first one is to notethe high dynamics of the mobile application market targeted at tourists. Over the past four years,out of 14 applications analyzed, two ended their activities (EloMaps and Worldmate), and another twowere transformed to fulfill a new, different function (TouristEye and TripCase). In addition, three ofthem (Airbnb, Booking, Triposo), did not function or did not gain their nowadays popularity back in
99

Sustainability 2020, 12, 44
2015. This shows how dynamically the business models in tourism change, and adapt to changingconditions on the market.
For every functionality that was unchanged during the four year research period, some level ofdevelopment was noted; hotel, restaurant, and tourist attraction databases contain more records thanin the past (in many cases multiple increases).
In addition, it seems interesting that one of the most popular tourist applications in the world,TripAdvisor, offering comprehensive functionality of finding all three types of facilities, has relativelyseen a small number of accommodation facilities in its database (compared to Booking.com and Airbnb).One can make a recommendation here to take action in this matter and undertake some programs thatencourage Silesian hoteliers to post their facilities on this site.
In terms of the number of tourist attractions found, Polska Niezwykła leaves all other servicesbehind (more than twice as many objects as in any other application). Unfortunately, this rich collectionof entries is currently only available in the Polish language. It can be assumed that if the developersof this application added an interface and descriptions in English, it would effectively increase thegroup of its users, and at the same time, it would allow for more effective use of the tourist potential ofSilesian region.
Generally speaking, the presented results show that significant development took place in theregion of Upper Silesia in terms of adopting mobile technologies in tourism (or at least by marking thepresence of the most important points of interest for tourists in existing services). As it goes for therestaurants and hotels, those are private businesses. One can expect that when more attractions willbe present in apps for foreigners, the demand for those private services will increase and drive themanagers and owners into advertising their businesses more extensively in apps for English speakers;hence, their presence in the most popular apps should grow. However, as mentioned before, this anexpected outcome of increasing the number of tourist attractions available through mobile apps. Sincea large portion of these are part of the public sector (government, voivodeship, town hall, etc.) it laysin its competence to develop programs that would support and encourage these entities to mark theirpresence in mobile applications—as part of nowadays very intensively executed promotional programsfor the voivodeship. Achieving a stage where a significant number of touristic sites are available forsmartphone users, both domestic and foreigner tourists, would be the first step in adopting the smarttourism concept in the Silesian metropolis, and more elements of it could consistently be added.
The development of tourists’ uses of mobile apps and extend in their database records can beexplained by the increasing number of tourists visiting Silesia. Since 2013, the number of touristovernight stays has been constantly growing (from 4.6 M to 6.3 M in 2018). This shows that both thecampaigns promoting Silesia as a touristic region and the start of adapting industrial heritage intotouristic assets (since the IMR was created) have brought measurable effects. Upper Silesia, with itsIndustrial Monuments Route and sites on the UNESCO List, is heading in the direction of becoming aninternational industrial heritage tourism region, following the example of Ruhr region in Germany.
In terms of sustainable development of the Silesian region, the findings show that there is stilla lot of space for improvements. The large disproportions between results from domestic apps andthose for English-speaking users, that allow to find tourist attractions, indicate that the managers oftouristic sites in Silesia might not be fully aware of the interconnections between all entities in a region,their role in international tourism, and how it is important for achieving sustainable developmentgoals for the region, as well as for preserving heritage that is the core that attracts tourists to theirbusiness. They rather take the individual perspective, focusing on present customers and not on whatcauses them to be there, ignoring the big picture. This indication lays a path for further research in thisarea, and it might be beneficial for decision-making authorities to know the motivation of touristic sitesrunners and their awareness of their role in sustainable tourism. In the area of night’s lodging andgastronomy, things look differently. The results from international apps showed that their databasesare better suited for tourists from any part of the world.
100

Sustainability 2020, 12, 44
The overall increase in database records shows the increasing interest in mobile apps amongtourists and their meaning for them. This can be also interpreted as proof that mobile apps are not justa temporary phenomenon, but rather, they have become a permanent element of it. Therefore, theyshould be taken into consideration while making sustainable development plans for touristic sites andregions, i.e., by incorporating the smart tourism concept. This also implies that businesses that focuson supporting mobile solutions, and advertise themselves in them, incorporate these technologies intotheir business models. When a model like this proves to be successful, it is expected that it will bereplicated and applied by other entities, and the readiness to adopt the smart tourism concept in Silesiashould continue to increase.
The research also showed that there is a large disproportion between the number of touristicsites figuring in mobile apps in Katowice and all other cities. This is mostly due to the fact thatKatowice is the capital of the Silesian Voivodeship, and acts as a communication node for this southernpart of Poland, as many national and international train connections and flights start or end in thiscity. Therefore, the portion of temporary international visitors is much higher in this city, and thedemand for an offer for global customers is higher. It would be in the spirit of sustainability if futuredevelopment plans for this region would include projects for better communication and promotionof attractions in neighboring cities, that are based on cultural heritage, in order to provide sufficientinterest in it so they do not become a subject of degradation.
6. Concluding Insights and Future Research
There are some limitations to this research. First of all, it was concerning only one region, with aspecific type of tourism standing out—industrial heritage tourism. The touristic function in this regionis still developing, as it is a former heavy industry district, where the transformation to a post-industrialeconomy is still in progress. Things might be very different in other parts of the country, where tourismhas been developing for much longer (i.e., the city of Cracow, Warsaw, etc.). Furthermore, we limitedour research to a certain part of the whole voivodeship. We focused on the Upper Silesian Metropolitanarea since it is the main region where industrial tourism occurs. The statistical data provided by theCSO, as well as results that concern the whole voivodeship, can distort the real picture of industrialheritage tourism in this area since the southern part of Silesia has few characteristic features: it sharesborders with the Czech Republic and it has many mountain resorts in the Beskids area. Moreover,the north part of the Silesian Voivodeship is a significant religious center in Czestochowa. Thesefeatures draw different types of tourists to this region, other than industrial heritage tourists, making ithard to distinguish which type of tourism had more impact on certain effects or touristic indicators.Therefore, one can consider the fact that we focused on a specific type of tourism as another limitingfactor. Industrial heritage that is used in tourism already is mainly concentrated in selected parts ofthe world or a country. In Europe, it can be mainly found in southern Poland, north-west Germany,some regions in France, Belgium, and various parts of the UK. Therefore the results and conclusionsthat we draw can be especially useful for those regions, or for regions that have the potential to becomean industrial heritage region (like, for example, parts of Ukraine or Russia). Another limitation is thatin our research, we focused mainly on one element of smart tourism, which is m-tourism, by selectingthe most popular international and domestic touristic applications for smartphones. This did notinclude other types of applications that might be utilized in tourist attractions (like general VR, AR, QRcode apps, etc.), or technologies that are offered or are supported by mobile devices (tracking, trafficanalysis or gathering of big data).
Further analogous research carried out at a similar time interval (or shorter, e.g., annually) wouldallow a more accurate understanding of the phenomenon of m-tourism development in the Silesianregion and the use of modern technologies by local tourism service providers. There is also a need toresearch and assess the readiness of the entire region to adopt the smart tourism concept regardingtechnical infrastructure, available systems, the degree to which ICTs and other technologies are alreadyin use in Silesian tourist sites, and the willingness of public and private tourist sites to participate and
101

Sustainability 2020, 12, 44
adopt this approach. Such findings, combined with previous ones, could potentially be used to build aframerate, a model or a set of guidelines for cities, metropolitan areas or regions that could make theprocess of becoming a smart tourism destination more efficient and effective.
The obtained results could also be used for other types of research. First of all, future research inthe Silesian Region could focus on comparing statistical data gathered over the last years with data fromother, more developed touristic regions. Such comparison would allow one to assess the developmentrate in comparison to other regions and find potential areas of improvement, avoiding mistakes orapplying solutions for issues that have already been solved elsewhere. Secondly, the data could beused to compare it with results from other regions that are, at the same or earlier, at the touristicdevelopment stage, in order to identify development trends and patterns that are characteristic forthem. Having such a reference point, future destinations could use it for benchmarking and monitoringtheir own development.
The conclusion that can be drawn from the obtained results, and that would apply to many othertouristic regions, is that since a large portion of heritage all over the world is financed and governed bythe public sector, it lacks elasticity in adapting to change and new conditions (more tourists overalland a bigger demand for foreigner orientated services). Our results show that the response to theincreasing number of tourists visiting the analyzed region was much more intense from the privatesector (hotels and restaurants) than the public one (the majority of tourist attractions based on heritageare governed by the state or city). This reveals itself when one notices that the changes in databaserecords regarding tourist attractions for international travelers are much smaller in comparison withhotel and gastronomy records. Meaning that, in the course of the last four years, many hotels andrestaurant owners added their objects into the databases of global-ranged apps, responding to thedemand of international tourists, while most of the tourist attractions are still mainly findable in appsdedicated only for Polish speaking users.
Other regions and local authorities can learn from the Silesian case, and while formulatingdevelopment plans they should focus on two things. The first one is to use tourism as part ofsustainable development that protects and preserves heritage in its most possible unchanged form forfuture generations; keeping in mind that smart tourism is not a temporary trend but rather the futureform of tourism. Therefore, the future success of a tourist destination and its heritage faith depends onhow fast and well a region can adopt this concept. The second thing is that while adopting the smarttourism concept, one should mainly concentrate on the public sector, which is more inertive to changebecause it functions and is financed differently than private entities, which need to adapt immediatelyto the changes in supply and demand and will do it by themselves.
Author Contributions: M.N. reviewed the literature in terms of smart tourism and mobile technologies, developedthe methodology, co-developed the introduction and conclusions, developed and conducted the research, as wellprepared the final contents of the article and proofread, K.H. reviewed the literature in terms of business modelsin tourism, smart tourism, and mobile technologies, as well as co-developed the introduction and conclusions.All authors have read and agreed to the published version of the manuscript.
Funding: This research received funding by the Ministry of Science and Higher Education in Poland.
Acknowledgments: This paper was published as part of the research project ‘Modern technologies in thefunctioning of industrial tourism enterprises’ No. 13/010/BKM19/0038, financed by the Ministry of Science andHigher Education in Poland.
Conflicts of Interest: The authors declare no conflict of interest. The funders had no role in the design of thestudy; in the collection, analyses, or interpretation of data; in the writing of the manuscript, or in the decision topublish the results.
References
1. Gintinga, N.; Wahid, J. Exploring Identity’s Aspect of Continuity of Urban Heritage Tourism. Procedia Soc.Behav. Sci. 2015, 202, 234–241. [CrossRef]
2. Szromek, A.R.; Herman, K. A Business Creation in Post-Industrial Tourism Objects: Case of the IndustrialMonuments Route. Sustainability 2019, 11, 1451. [CrossRef]
102

Sustainability 2020, 12, 44
3. Szromek, A.R.; Naramski, M. Measuring Trust in Business Relations between Tourist Facilities on OneThematic Route. Sustainability 2019, 11, 3935. [CrossRef]
4. Szromek, A.R.; Naramski, M. A business Model in Spa Tourism Enterprises: Case Study from Poland.Sustainability 2019, 11, 2880. [CrossRef]
5. Szromek, A.R.; Wybranczyk, K. Proposal of Value for Customers of Spas: Expectations of Spa Patients andTourists in Polish Spas. Sustainability 2019, 11, 3598. [CrossRef]
6. Naramski, M.; Szromek, A.R. Configuring a Trust-based Inter-organizational Cooperation Network forPost-industrial Tourist Organizations on a Tourist Route. Sustainability 2019, 11, 3542. [CrossRef]
7. Khan, M.; Woo, M.; Nam, K.; Chathoth, P. Smart City and Smart Tourism: A case of Dubai. Sustainability2017, 9, 2279. [CrossRef]
8. Berrone, P.; Ricart, J.; Carrasco, C. The open kimono: Toward a general framework for open data initiativesin cities. Calif. Manag. Rev. 2016, 59, 39–70. [CrossRef]
9. World Heritage Site List. Available online: https://whc.unesco.org/en/list/ (accessed on 7 November 2019).10. Naramski, M. Promocja slaskich obiektów turystycznych za posrednictwem aplikacji mobilnych. In Nowe
Media I Technologie W Komunikacji Marketingowej—Obszary Zastosowan I Kierunki Badan; Głuchowski, J.,Spyra, Z., Maciag, J., Eds.; University of Economics in Katowice: Katowice, Poland, 2015; pp. 199–210.
11. UNWTO Annual Report 2017. Available online: https://www.e-unwto.org/doi/pdf/10.18111/9789284419807(accessed on 1 July 2018).
12. Kumar, V.; Kumar, U.; Persaud, A. Building Technological Capability through Importing Technology:The Case of Indonesian Manufacturing Industry. J. Technol. Transf. 1999, 24, 81–96. [CrossRef]
13. Schulz, A. The Role of Global Computer Reservation Systems in the Travel Industry Today and in the Future.Electron. Mark. 1996, 6, 17–20.
14. Davies, N.; Cheverst, K.; Mitchell, K.; Efrat, A. Using and Determining Location in a context-Sensitive TourGuide. Computer 2001, 34, 35–41. [CrossRef]
15. Beaumont, E. Using CCTV to study visitors in The New Art Gallery, Walsall, UK. Surveill. Soc. 2002, 3,251–269. [CrossRef]
16. Nerngchamnong, K.; Kaviya, S.; Fujii, Y. World Heritage City Surveillance System by a Smart CCTV.Syst. Procedia Eng. 2011, 8, 321–327. [CrossRef]
17. Choi, H.; Kim, S. A content service deployment plan for metaverse museum exhibitions—Centering on thecombination of beacons and HMDs. Int. J. Inf. Manag. 2017, 37, 1519–1527. [CrossRef]
18. Tussyadiah, I.; Dan, W.; Jung, T.; Dieck, M. Virtual reality, presence, and attitude change: Empirical evidencefrom tourism. Tour. Manag. 2018, 66, 140–154. [CrossRef]
19. Mortiz, C. Mobile Application Development in the Tourism Industry and its Impact on On-Site TravelBehavior. Bachelor’s Thesis, Vienna University, Vienna, Austria, 2015.
20. Kennedy-Eden, H.; Gretzel, U. A taxonomy of mobile applications in tourism. e-Rev. Tour. Res. 2012, 10,47–50.
21. Gatner Report. Available online: https://www.gartner.com/en/newsroom/press-releases/2019-04-04-gartner-says-the-future-of-app-development-is-multiex (accessed on 30 September 2019).
22. SpicyMobile 2019. Available online: https://spicymobile.pl/assets/doc/Turysci_2019.pdf (accessed on30 September 2019).
23. González-Reverté, F.; Díaz-Luque, P.; Gomis-López, K.M.; Morales-Pérez, S. Tourists’ Risk Perception andthe Use of Mobile Devices in Beach Tourism Destinations. Sustainability 2018, 10, 413. [CrossRef]
24. Cheung, C.M.; Thadani, D.R. The impact of electronic word-of-mouth communication: A literature analysisand integrative model. Decis. Support Syst. 2012, 54, 461–470. [CrossRef]
25. Hlee, S.; Lee, H.; Koo, C. Hospitality and Tourism Online Review Research: A systematic Analysis andHeuristic-Systematic Model. Sustainability 2018, 10, 1141. [CrossRef]
26. Porter, M.E.; Heppelmann, J.E. How smart, connected products are transforming competition. Harv. Bus. Rev.2014, 92, 64–88.
27. Koo, C.; Ricci, F.; Cobanoglu, C.; Okumus, F. Special issue on smart, connected hospitality and tourism.Inf. Syst. Front. 2017, 20, 699–703. [CrossRef]
28. Gretzel, U.; Fesenmaier, D.R.; O’Leary, J.T. The transformation of consumer behavior. In Tourism BusinessFrontiers; Buhalis, D., Costa, C., Eds.; Elsevier: Oxford, UK, 2006; pp. 9–18.
103

Sustainability 2020, 12, 44
29. Lamsfus, C.; Wang, D.; Alzua-Sorzabal, A.; Xiang, Z. Going mobile: Defining context for on-the-go travelers.J. Travel Res. 2015, 54, 691–701. [CrossRef]
30. Wang, D.; Park, S.; Fesenmaier, D.R. The Role of Smartphones in Mediating the Touristic Experience.J. Travel Res. 2012, 51, 371–387. [CrossRef]
31. Ritchie, J.R.B.; Crouch, G.I. The competitive destination: A sustainability perspective. Tour. Manag. 2000, 21,1–7.
32. Stepchenkova, S.; Mills, J.E. Destination image: A meta-analysis of 2000–2007 research. J. Hosp. Mark. Manag.2010, 19, 575–609. [CrossRef]
33. Gartner, W.C. Image formation process. J. Travel Tour. Mark. 1993, 2, 191–215. [CrossRef]34. Marine-Roig, E.; Ferrer-Rosell, B. Measuring the gap between projected and perceived destination images of
Catalonia using compositional analysis. Tour. Manag. 2018, 68, 236–249. [CrossRef]35. Marine-Roig, E. Destination Image Analytics Through Traveller-Generated Content. Sustainability 2019, 11, 3392.
[CrossRef]36. Gretzel, U.; Yoo, K.H. Use and impact of online travel reviews. In Information and Communication Technologies
in Tourism 2008; O’Connor, P., Höpken, W., Gretzel, U., Eds.; Springer: Vienna, Austria, 2008; pp. 35–46.37. Litvin, S.W.; Goldsmith, R.E.; Pan, B. Electronic word-of-mouth in hospitality and tourism management.
Tour. Manag. 2008, 29, 458–468. [CrossRef]38. Liu, Z.; Park, S. What makes a useful online review? Implication for travel product websites. Tour. Manag.
2015, 47, 140–151. [CrossRef]39. Marchiori, E.; Cantoni, L. The role of prior experience in the perception of a tourism destination in
user-generated content. J. Destin. Mark. Manag. 2015, 4, 194–201. [CrossRef]40. Wu, L.; Shen, H.; Fan, A.; Mattila, A.S. The impact of language style on consumers’ reactions to online
reviews. Tour. Manag. 2017, 59, 590–596. [CrossRef]41. Hlee, S.; Lee, J.; Yang, S.B.; Koo, C. An Empirical Examination of Online Restaurant Reviews (Yelp. Com):
Moderating Roles of Restaurant Type and Self-image Disclosure. In Information and Communication Technologiesin Tourism; Springer: Cham, Switzerland, 2016; pp. 339–353.
42. Shin, S.; Chung, N.; Kang, D.; Koo, C. A Test of the Psychological Distance Effect for Online Travel ReviewsBased on Construal-Level Theory. Asia Pac. J. Inf. Syst. 2017, 27, 216–232. [CrossRef]
43. Yang, S.B.; Shin, S.H.; Joun, Y.; Koo, C. Exploring the comparative importance of online hotel reviews’heuristic attributes in review helpfulness: A conjoint analysis approach. J. Travel Tour. Mark. 2017, 34,963–985. [CrossRef]
44. Shaw, G.; Bailey, A.; Williams, A. Aspects of service-dominant logic and its implications for tourismmanagement: Examples from the hotel industry. Tour. Manag. 2011, 32, 207–214. [CrossRef]
45. Wang, Y.; Fesenmaier, D.R. Towards understanding members’ general participation in and active contributionto an online travel community. Tour. Manag. 2004, 25, 709–722. [CrossRef]
46. Ho, C.T.B.; Gebsombut, N. Communication Factors Affecting Tourist Adoption of Social Network Sites.Sustainability 2019, 11, 4198. [CrossRef]
47. Muraya, A. Running Lean: Iterate from Plan A to a Plan That Works; O’Reilly Media: Sevastopol, CA, USA, 2012.48. Magretta, J. Why business models matter? Harv. Bus. Rev. 2002, 80, 86–92.49. Teece, D. Business models and dynamic capabilities. Long Range Plan. 2017, 51, 1–10. [CrossRef]50. Morris, M. The entrepreneur’s business model: Toward a unified perspective. J. Bus. Res. 2005, 58, 726–735.
[CrossRef]51. Shafer, S.; Smith, H.J.; Linder, J. The power of business models. Bus. Horiz. 2005, 48, 199–207. [CrossRef]52. Osterwalder, A.; Pigneur, Y. Business Model Generation: A Handbook for Visionaries, Game Changers, and
Challengers; Wiley: Hoboken, NJ, USA, 2010.53. Lindgren, P.; Rasmussen, O.H. The Business Model Cube. J. Multi Bus. Model Innov. Technol. River Publ. 2013,
1, 135–182.54. Johnson, M.W.; Christensen, C.M.; Kagermann, H. Reinventing your business model. Harv. Bus. Rev. 2008,
86, 57–68.55. Cranmer, E.; Jung, T.; Dieck, M.C.T. The Value of Augmented Reality from a Business Model perspective.
e-Rev. Tour. Res. 2017, 8, 1–4.56. Ciurea, C.; Filip, F.G. Validation of a Business Model for Cultural Heritage Institutions. Inform. Econ. 2015,
19, 46–56. [CrossRef]
104

Sustainability 2020, 12, 44
57. Langviniene, N.; Daunoraviþinjtơ, I. Factors influencing the success of business model in the hospitalityservice industry. Procedia Soc. Behav. Sci. 2015, 213, 902–910. [CrossRef]
58. Diaconu, M.; Dutu, A. Business model in the hospitality industry, from traditional to open innovation. Sci.Bull. Econ. Sci. 2014, 16, 3–10.
59. Mantaguti, F.; Mingotto, E. Innovative business models within niche tourist markets: Shared identity,authenticity and flexibile networks. The case of three Italian SMEs. J. Tour. Res. 2016, 6, 9–10.
60. Beça, P.; Raposo, R. m-Tourism 2.0: A Concept Where Mobile Tourism Meets Participatory Culture.e-Rev. Tour. Res. 2011, 2, 30–35.
61. Gretzel, U.; Sigala, M.; Xiang, Z.; Koo, C. Smart tourism: Foundations and developments. Electron. Mark.2015, 25, 179–188. [CrossRef]
62. Saarinen, J. Critical sustainability: Setting the limits to growth and responsibility in tourism. Sustainability2014, 6, 1–17. [CrossRef]
63. Moscardo, G.; Murphy, L. There is no such thing as sustainable tourism: Re-conceptualizing tourism as atool for sustainability. Sustainability 2014, 6, 2538–2561. [CrossRef]
64. Kim, D.; Kim, S. The role of Mobile Technology in Tourism: Patents, Articles, News, and Mobile Tour AppReviews. Sustainability 2017, 9, 2082. [CrossRef]
65. Mithat Üner, M.; Güven, F.; Tamer Cavusgil, S. Bundling of telecom offerings: An empirical investigation inthe Turkish market. Telecommun. Policy 2015, 39, 53–64. [CrossRef]
66. Trinh, T.T.; Ryan, C. Heritage and cultural tourism: The role of the aesthetic when visiting Mỹ Sơn and chammuseum, vietnam. Curr. Issues Tour. 2016, 19, 564–589. [CrossRef]
67. McKercher, B.; Ho, P.S.Y.; du Cros, H. Relationship between tourism and cultural heritage management:Evidence from hong kong. Tour. Manag. 2005, 26, 539–548. [CrossRef]
68. Du Cros, H. A new model to assist in planning for sustainable cultural heritage tourism. Int. J. Tour. Res.2001, 3, 165–170. [CrossRef]
69. Gomez-Oliva, A.; Alvardo-Uribe, J.; Parra-Merono, M.C.; Jara, A.J. Transforming Communication Channelsto the Co-Creation and Diffusion of Intangible Heritage in Smart Tourism Destination: Creation and Testingin Cetui (Spain). Sustainability 2019, 11, 3848. [CrossRef]
70. Fermenia-Serra, F.; Beuhofer, B.; Ivars Baidal, J. Towards a conceptualization of smart tourists and their rolewithin the smart destination scenario. Servic. Ind. J. 2019, 39, 109–113. [CrossRef]
71. Bakıcı, T.; Almirall, E.; Wareham, J. A smart city initiative: The case of Barcelona. J. Knowl. Econ. 2013, 4,135–148. [CrossRef]
72. Storper, M.; Scott, A.J. Rethinking human capital, creativity and urban growth. J. Econ. Geogr. 2009, 9,147–167. [CrossRef]
73. Buhalis, D.; Amaranggana, A. Smart tourism destinations. Inf. Commun. Technol. Tour. 2014, 1, 553–564.74. Gretzel, U. Intelligent systems in tourism: A social science perspective. Ann. Tour. Res. 2011, 38, 757–779.
[CrossRef]75. DeEsteban Curiel, J.; Delgado Jalón, M.L.; Rodríguez Herráez, B.; Antonovica, A. Smart Tourism Destination
in Madrid. In Sustainable Smart Cities; Peris-Ortiz, M., Bennett, D., Pérez-Bustamante Yábar, D., Eds.;Innovation, Technology, and Knowledge Management; Springer: Berlin, Germany, 2017.
76. Koo, C.; Shin, S.; Gretzel, U.; Hunter, W.C.; Chung, N. Conceptualization of Smart Tourism DestinationCompetitiveness. Asia Pac. J. Inf. Syst. 2016, 26, 561–576. [CrossRef]
77. Lamsfus, C.; Martín, D.; Alzua-Sorzabal, A.; Torres-Manzanera, E. Smart Tourism Destinations: An ExtendedConception of Smart Cities Focusing on Human Mobility. In Information and Communication Technologies inTourism; Springer: Berlin, Germany, 2015; pp. 363–375.
78. Ramos-Soler, I.; Martinez-Sala, A.; Campillo-Alhama, C. ICT and the Sustainability of World Heritage Sites.Analysis of Senior Citizens’ Use of Tourism Apps. Sustainability 2019, 11, 3203. [CrossRef]
79. Pradhan, M.K.; Oh, J.; Lee, H. Understanding Travellers’ Behaviour for Sustainable Smart Tourism:A Technology Readiness Perspective. Sustainability 2018, 10, 4259. [CrossRef]
80. Buhalis, D.; Amaranggana, A. Smart tourism destinations enhancing tourism experience throughpersonalisation of services. In Information and Communication Technologies in Tourism 2015; Springer: Berlin,Germany, 2015; pp. 377–389.
81. Huang, C.D.; Goo, J.; Nam, K.; Yoo, C.W. Smart tourism technologies in travel planning: The role ofexploration and exploitation. Inf. Manag. 2017, 54, 757–770. [CrossRef]
105

Sustainability 2020, 12, 44
82. Kwon, H.S.; Chidambaram, L. A test of the technology acceptance model: The case of cellular telephoneadoption. In Proceedings of the 33rd Annual Hawaii International Conference on System Sciences, Maui, HI,USA, 4–7 January 2000; IEEE: Piscataway, NJ, USA, 2000.
83. Wolfe, H.B. The Insecurity of Mobile Phones. In Proceedings of the Informing Science & InformationTechnology Education Conference, Cassino, Italy, 19–24 June 2010; pp. 119–131.
84. Główny Urzad Statystyczny: Turysci w bazie noclegowej. Grudzien 2018 roku. Available online: https://stat.gov.pl/download/gfx/portalinformacyjny/pl/defaultaktualnosci/5494/5/79/1/kts_turysci_12m_2018.xlsx (accessed on26 August 2019).
85. Tourism in 2014, Statistical Information and Elaborations, Central Statistical Office, Warsaw 2015. Availableonline: https://stat.gov.pl/files/gfx/portalinformacyjny/pl/defaultaktualnosci/5494/1/12/1/kts_turystyka_w_2014.pdf (accessed on 28 November 2019).
86. Tourism in 2015, Statistical Information and Elaborations, Central Statistical Office, Warsaw 2016. Availableonline: https://stat.gov.pl/files/gfx/portalinformacyjny/pl/defaultaktualnosci/5494/1/13/1/turystyka_w_2015.pdf (accessed on 28 November 2019).
87. Tourism in 2016, Statistical Information and Elaborations, Central Statistical Office, Warsaw 2017. Availableonline: https://stat.gov.pl/files/gfx/portalinformacyjny/pl/defaultaktualnosci/5494/1/14/1/turystyka_w_2016_zmieniona_07-11-2017.pdf (accessed on 28 November 2019).
88. Tourism in 2017, Statistical Information and Elaborations, Central Statistical Office, Warsaw 2018. Availableonline: https://stat.gov.pl/files/gfx/portalinformacyjny/pl/defaultaktualnosci/5494/1/15/1/turystyka_w_2017.pdf (accessed on 28 November 2019).
89. Tourism in 2019, Statistical Information and Elaborations, Central Statistical Office, Warsaw 2019. Availableonline: https://stat.gov.pl/files/gfx/portalinformacyjny/pl/defaultaktualnosci/5494/1/16/1/turystyka_w_2018_r.pdf (accessed on 28 November 2019).
90. Industraiada Website. Available online: http://industriada.pl/archiwum/ (accessed on 28 November 2019).
© 2019 by the authors. Licensee MDPI, Basel, Switzerland. This article is an open accessarticle distributed under the terms and conditions of the Creative Commons Attribution(CC BY) license (http://creativecommons.org/licenses/by/4.0/).
106

sustainability
Article
The Perception of Overtourism from the Perspectiveof Different Generations
Adam R. Szromek 1, Beata Hysa 1,* and Aneta Karasek 2
1 Department of Organization and Management, Institute of Economy and Informatics, Silesian Universityof Technology, Akademicka 2A, 44-100 Gliwice, Poland; [email protected]
2 Faculty of Economics, Maria Curie-Sklodowska University, Plac Marii Skłodowskiej-Curie 5,20-031 Lublin, Poland; [email protected]
* Correspondence: [email protected]; Tel.: +48-32-277-7336
Received: 15 November 2019; Accepted: 11 December 2019; Published: 13 December 2019
Abstract: The problem of overtourism, i.e., tourist congestion in visited places, and the negativeimpacts of tourists on the environment and residents, are increasingly noticeable with the increasein popularity of tourism. In addition, human impact on the environment is often negative in relationto the assumptions of the concept of sustainable development. However, the attitude of tourists tothe problem of overtourism may vary depending on their ages, because, as in every aspect of life, thereare intergenerational differences arising from the political, economic or technological developmentof the times in which a given generation grew up. The main purpose of the article is to examinethe public awareness of the phenomenon of overtourism in the context of intergenerational differences,as well as to determine the impact of tourists on the places visited and the local community. The studywas conducted on a sample of 386 respondents representing the X, Y, and Z generations. The studyresults showed that there is awareness among all generations of respondents about the problemof overtourism, although indifference to this phenomenon was demonstrated by the youngestrespondents (Z generation). The respondents also agreed on individual elements of their ownimpact on the environment and residents, but with different determinations. The article ends withrecommendations on the introduction of various management practices that should be implementedin order to make tourism more responsible and sustainable in the future. It is proposed that a roadmap should be compiled at the local level for sustainable tourism development.
Keywords: sustainable development; overtourism; Generation X; Generation Y; Generation Z
1. Introduction
The world’s population is constantly growing, as is the number of tourists. The dynamism oftourism development in the world is due to, in particular, the industrial revolution, i.e., it is associatedwith the development of transport, speed of movement and the increase in wealth of individualcountries and their inhabitants. This translates into an increase in the number of people who canafford to travel more frequently. In 2018, international tourist travel amounted to 1.4 billion people,while 710 million tourists come to Europe [1]. Along with the increase in the popularity of tourism,the problem appears with tourist congestion in visited places and the negative impact of touristson the environment and residents. The tourism economy is one of the main contemporary sourcesof organized human impact on the landscape. However, this impact is often negative and interfereswith the idea of sustainable development. Therefore, there is a tendency to implement the concept ofsustainable development in tourism. According to the World Tourism Organization (UNWTO), we callsustainable tourism the kind that fully takes into account its current and future economic, social, andenvironmental impact, meeting the needs of visitors, industry, the environment, and host communities.The basis of this concept is, therefore, to achieve a balance between the needs of tourists, the natural
Sustainability 2019, 11, 7151; doi:10.3390/su11247151 www.mdpi.com/journal/sustainability107

Sustainability 2019, 11, 7151
environment, and local communities. While the objectives of tourists, entrepreneurs, local authorities,and residents converge at the initial stages of tourism development in a defined area, conflictsincrease with the expansion of tourism. One such conflict is the situation in which the expectations oftourists collide with the expectations of residents dissatisfied with the burdensome intensity of touristtraffic [2]. Hence, the main objective of the World Tourism Organization’s 2030 agenda is to increasethe level of sustainability knowledge and inspire the sector to take the necessary measures to acceleratethe transition towards more sustainable tourism [3], which affects the sustainable development ofindividual countries. Therefore, it becomes important to explore the problem of excessive tourism(overtourism), because, although this concept increasingly appears in both media [4,5] and scientificdiscourse [6–8], in many countries this phenomenon is poorly known [9]. In particular, the awarenessof tourists themselves as to their negative impact on the environment and residents seems to be poor.For example, when analysing the number of Internet searches for the term “overtourism” on a weeklybasis in Poland in the period from November 2018 to October 2019, it can be seen that the maximumnoted was only eighty [10]. It is also assumed that low social awareness in this area is probablynot the same in all age groups of tourists. In this regard, it seems interesting to deepen scientificresearch on the phenomenon of overtourism in relation to specific age groups, or rather generations.The observed differences between generations result from the political and economic situation, andtechnological development in the times when a given generation grew up [11–13]. That is why theyare often characterized by different tastes, dress styles, behaviours, musical preferences, approachto work, and even to travel. Moreover, the age-based classification of the population is often usedin the segmentation of the tourism market. Determining the characteristics of the target group allowsfor a better adaptation of the product to the needs and capabilities of the customer—tourist. What ismore, there are intergenerational differences in the motives for undertaking tourist trips, preferencesstay in tourist destinations or harmfulness of tourists’ impact on the environment. Four generations aredistinguished in social sciences [11–13]: Baby Boomers, Generation X, Generation Y, and Generation Z,as well as the youngest Generation Alpha (born after 2010).
Therefore, it seems reasonable to conduct a study diagnosing the phenomenon of overtourismin the context of the awareness of different generations. Therefore, the purpose of the article is to assessthe awareness of tourists of different generations in the field of the phenomenon of overtourism, andto learn about their knowledge of their personal impact on visited places and the local community.
2. Literature Review
2.1. Sustainable Development and Sustainable Tourism
Achieving sustainable development goals requires ensuring the coherence of three key elements:economic growth, social inclusion, and environmental protection, which is important for achievingthe well-being of individuals and entire societies. In August 2015, 193 UN (United Nations) memberstates reached a compromise on the final document of the new agenda “Transforming our world:Agenda for Sustainable Development—2030”, which contains 17 goals and 169 tasks. Sustainabledevelopment requires action on many levels and entails the implementation of regulations in particularareas. Enterprises, thanks to the implementation of more inclusive and sustainable business models,can, among others, increase their business efficiency and risk management [3] (p. 13). On the otherhand, the implementation of the Sustainable Development Goals (SDG) into the enterprise’s operationscan improve the sector’s competitiveness [14]. In many countries, tourism is an important sector ofthe economy, which brings financial benefits for the state, the region, and the local community. In theworld, the largest financial revenues from tourism were noted in Europe (USD 570 billion), as well asAsia and the Pacific region (USD 435 billion) in 2018. [1]. In the European Union (EU), the numberof overnight stays at tourist accommodation establishments has been steadily increasing since 2009and reached 3254.3 million in 2017, with the share of overnight stays provided to foreign touristsincreasing by 49.2% [2], while 2018 global earnings amounted to 1.7 trillion [1]. More than half of
108

Sustainability 2019, 11, 7151
EU residents’ overnight stays (55.2%) were spent in rented accommodation [15]. Therefore, hotelsor similar places need qualified staff to provide tourists with accommodation and other touristservices. In 2016, over 13 million people were employed in the tourism industry in EU countries [15].Consequently, employment in tourism translates into macroeconomic indicators for the region.In the EU, 21 of 30 regions with the highest tourism intensity have an unemployment rate belowthe national average [16]. The data presented above indicates a number of financial benefits, which areobtained by destinations eagerly visited by tourists.
Analyzing the number of tourists, we can see their steady increase since 2009. In 2018, internationaltourist arrivals increased by 5% and reached 1.4 billion people. [1]. Europe was visited by the largestnumber of tourists (710 million), while the largest increase in the number of tourists was notedin Asia–Pacific and Africa (7%) [1]. In 2017, more than half (58%) of the total nights spent bynonresidents in the EU were spent in Spain, the United Kingdom, Italy, and France [15]. In turn, 62%of EU residents made at least one personal trip in 2017, while Finns did it the most often (91.3%) [15].Analysing European statistics, Poland stands out the most, as in 2018 it was visited by 19.6 milliontourists [2]. In this country, one can observe a continuous increase in the number of accommodationfacilities provided to tourists. In Poland, in the first half of 2019, compared to the first half of 2018, therewas a visible increase in the total number of tourists using an accommodation facility by 6.1%, as well asthe number of overnight stays by 6.5% [16]. At the same time, there was an increase noted in the numberof foreign tourists by 4.5% and the number of nights spent by them by 5.1% [16]. However, the averageshare of overnight stays provided to foreign tourists in the total number of overnight stays for the EUwas 49.2%, while for Poland it was only 19.9% [2], which was the second-lowest share of touristsamong the surveyed countries. This indicates that the interest of tourists in Poland is growing, despitethe fact that now there is a low level of foreign tourists' participation. Therefore, it is necessary toexplore the problem of overtourism in Poland, because that phenomenon will increase in strength.Analysing the data of tourism intensity, one can observe a large variation in the scope of guest nightsspent in tourist accommodation establishments per inhabitant. Among European countries in 2017,the highest rate was recorded in the following countries: Malta (20.8), Croatia (20.7), Cyprus (19.6), andAustria (13.8), while there was an average of 6.1 guest nights throughout the EU [15]. The presenteddata indicates that the number of tourists is constantly increasing, which causes high tourist traffic onaccess routes, in public transport, as well as in the places visited. Moreover, estimates indicate thatin 2030, 1.8 billion tourists in the world will cross borders [9]. In 2017, 62% of EU residents made atleast one personal trip [15]. Therefore, in order to ensure sustainable development, it is necessary totake action in the field of sustainable tourism.
The 2030 agenda aims to inspire industries to take measures to maintain sustainable development,including in the area of tourism. This is reflected in Goal 8, “Decent Work and Economic Growth”;Goal 12, “Responsible Consumption and Production”; and Goal 17, “Partnerships for the Goals”.Moreover, task 8.9 was formulated stating that, by 2030, policies should be developed and implementedto promote sustainable tourism that creates jobs, and promotes local culture and products. In orderto measure the degree of implementation of this measure, an indicator has been developed, whichis calculated as a percentage of tourism in relation to GDP. The value of this indicator in 2017, bothon a global scale and in Poland, was 0.1%, and its value increased compared to the previous year [15].
Unfortunately, with the expansion of tourist traffic, incidents related to its burden on the naturaland cultural environments of tourist areas are increasingly observed. To support sustainable tourismdevelopment practices, the World Tourism Organization and the United Nations have developeda Development Program. In it, they recommend that donor countries need to pay special attention tothe challenges and needs of developing countries, and that tourism decision-makers in developingcountries can attract more funding if their tourism activities focus on those areas that are most relevantfor donor countries [3]. In order to ensure sustainable development, it is necessary to identify factorsaffecting the sustainable development of tourism in the context of a given location. Local authoritiesshould support entrepreneurs and provide financial support so that they will be able to develop
109

Sustainability 2019, 11, 7151
business models that foster inclusive green growth—in particular in those areas where voluntary actionis not sufficient to achieve the SDGs [3]. In order to manage tourist traffic and preserve sustainability,a number of different actions are proposed. Actions are proposed to minimize the anthropogenicimpact on the environment and to protect the natural environment and culture [17,18]. In turn,other recommendations were formulated to ensure the sustainable development of entertainmenttourism [19].
It becomes necessary to conduct research in the field of sustainability in tourism, which isemphasized in the literature [20]. In particular, research on tourists’ awareness of their impacton sustainable development appears to be important. Sustainable tourism has been described astourism “that takes full account of the current and future economic, social, and environmental impacts,addressing the needs of the visitors, the industry, the environment, and host communities” [9].It indicates that attention should be focused on time, type of influence and various stakeholders.The group of stakeholders is diverse, as it includes both residents and visitors, for whom the expectedbenefits of tourism are different. Tourists expect access to tourist attractions and amenities for them,while residents demand respect for their rights regarding access to urban infrastructure, public services,and improvement of quality of life.
It should be emphasized that stakeholders have different levels of awareness about the economicbenefits of sustainability. This is confirmed by the results of research that showed that the perceptionsof the sustainability of the stakeholders involved in rural tourism development were very different [20].Moreover, tourism enterprises often lack awareness of how efforts and investment in sustainablebusiness operations can also significantly boost competitiveness and profitability, while increasingcustomer and host community satisfaction [3].
The basic prerequisite to undertake research and to formulate the research problem is the significantincrease in the number of tourists, noticeable for years, and the continuous growth of the tourism sector(as estimated by the World Tourism Organization (UNWTO)) by 3.3% annually until 2030 [9] (p. 4).Tourists visit areas of natural and cultural interest, as well as for entertainment. More and more touristsvisit residential areas [18], while entertainment attractions are located in many places to encouragetourists to travel and provide them with joy [20]. The increase in the number of visiting tourists, aswell as the development of spending time, will have an effect on other sectors of the economy andenterprises. Moreover, adverse climate change, environmental degradation, population growth, andthe growing awareness of buyers about their chosen solutions means that a new approach is needed tobuild a sustainable and disaster-proof future strategy for society and all organizations. Therefore, it isnecessary to take actions, in the field of sustainable tourism development. Such actions were taken, forexample, by the Global Sustainable Tourism Council (GSTC), whereby it developed criteria/standardsfor sustainable development in tourism. These criteria are organized into four pillars [19]:
• sustainable management;• socio-economic effects;• impact on culture;• environmental impact (including resource consumption, pollution reduction, and preservation of
biodiversity and landscapes).
For this purpose, it is necessary to examine the level of public awareness of its impact on ensuringsustainable development. This becomes important because of the impact that stakeholders havein economic, social, and environmental terms in a given area[21]. The divergent needs of touristsand residents cause a conflict of interest in the area of tourism, in particular in terms of theirimpact on the economy, society, and the environment. It is emphasized that sustainable tourismand overtourism are an important context that affects the right to travel and the right to live [18].Certainly, a discussion is needed on how to achieve sustainable development, in particular in the areaof growing tourist traffic.
110
Sustainability 2019, 11, 7151
2.2. Overtourism
The notion of overtourism in literature appeared relatively recently, which is why in manylanguages there is not yet a shaped translation of this concept. However, the presence ofthis phenomenon is often observed in the media, which reports on the problems of congestionand the negative impact of tourists on the environment, and on inhabitants in popular touristdestinations [3,4,22,23]. Although the term has only appeared in scientific publications only since2017 [24], this does not mean that this problem has not been raised before. In the 1970s, special indicatorswere developed to determine the optimal size of tourist traffic for various regions: an absorptionindicator, a capacity indicator, and a flow indicator [25]. We also see the beginnings of measuringchanges in residents’ attitudes towards tourists in the work of Doxey [26], who lists four phases:euphoria, apathy, annoyance, and antagonism. However, in 1980, Butler [27], in the concept ofthe tourism area life cycle (TALC) points out that tourist destinations negatively feel the consequencesof their success. Although the term ‘overtourism’ was not used at that time, previous publicationsclearly revealed the potentially negative effects of the rapidly growing tourism sector. The TALCconcept already contains elements that quantify overtourism, by using the terms ‘tourism capacity’ and‘absorbency’. Four decades later, the same author tackles the topic of overtourism to its full extent [28].
The World Tourism Organization (UNWTO) defines overtourism as: “the impact of tourismon a destination, or parts thereof, that excessively influences the perceived quality of life of citizensand/or quality of visitors’ experiences in a negative way” [3]. In contrast, the EU [24] in its research onovertourism describes this phenomenon as: “the situation, in which the impact of tourism, at certaintimes and in certain locations, exceeds physical, ecological, social, economic, psychological, and/orpolitical capacity thresholds”. The definition of the phenomenon of excessive movement aroundthe world, with the following references to literature, both historical and current research, is discussedextensively by Kruczek [29].
Currently, according to recent studies [30–32], excessive tourism causes, among other issues,alienation of residents, a worsening of the tourist experience by visitors, an overload of infrastructure,damage to the natural environment, and a threat to culture and heritage. Every year, the number ofcities in the world, such as Venice, Barcelona, Dubrovnik, Amsterdam, Berlin, Prague, Hong Kong,Rio de Janeiro, Shanghai, Palma de Mallorca, and Lisbon [33]; or in Poland, such as Zakopane andKraków [34], that struggle with the problem of excessive tourist traffic, increases.
There are three dimensions to the negative impact of overtourism [24] (pp. 87–88): environmental,economic, and social. The consequences of excessive tourism for the natural environment primarilyinclude overpopulation and devastation in places attractive to tourists, including natural, historical,and architectural places, a strong or noticeable contribution to water, land and air pollution, andproblems with solid waste removal [24] (pp. 87–88). In places, where the number of tourists increasessignificantly, there is a greater economic dependence on tourism, including the strong impact ofseasonality and degradation of other sectors or types of employment. Beyond the problems concerningthe negative impact of overtourism on the environment and the economy of individual cities, the socialdimension is also significant. The growing number of tourists causes many burdens and inconveniencesfor the local community. It is observed that adaptation to tourists occurs first, and then to residents [8].Therefore, the implementation of stricter regulations for tourists is recommended to ensure inhabitable,tourist-friendly cities [35].
In particular, the young generation can be a big problem for the local community, becausetheir way of spending time disturbs the peace in tourist destinations. Young people are eager fornew experiences—for many of them traveling is the goal of life, their passion. The social effectsof overtourism are also the worsening of (perceived) security, due to increased crime and violence,problems related to uncivilized behavior, alcohol consumption, prostitution, gambling, and drugtrafficking. It also leads to possible misunderstandings or hostility (e.g., social conflicts and protests) [24](pp. 87–88). In addition, it can also weaken local cultural traditions, moral values, and standards,leading to a loss of community spirit and pride, as well as a loss of the given country’s cultural identity.
111

Sustainability 2019, 11, 7151
Cities recognize the problem of overtourism and are looking for different solutions [2,4,5,7,8,36].There is a lively discussion regarding the rights of tourists and residents [37]. Politicians, city managers,and scientists are wondering how to solve the problem of tourist congestion [38] having a negativeimpact on the local community and the environment [22].
Various kinds of strategies and countermeasures are adopted. For example, the following canbe mentioned [9] (p. 10): promoting the temporary dispersion of visitors, stimulating the creation ofnew routes and attractions for visitors, communication, and the involvement of local stakeholdersand visitors. Solutions are being implemented for the adaptation of tourism practices, increasingthe capacity of existing systems, and improving residents’ perceptions of tourism, also by means of“smart” technological solutions [8]. It is also worth providing local communities with the opportunityto enjoy tourist attractions and create places that benefit both the residents and visitors.
In turn, EU recommendations [24] (pp. 87–88) contain, among other items, such guidelines asconducting more systematic research on the issue of excessive tourism in rural areas, coasts, andislands, as well as natural and cultural heritage; initiating debates on tourism development; andmanagement of economy sharing platforms, such as Airbnb [39]. Moreover, more attention was paidto the qualitative elements of tourism development (profitability, local employment, fair pay rates) andnot just the increase in the number of tourists. An important aspect is also supporting the monitoring ofthe “moods” of tourists, hosts, and (other) residents to earlier notice psychological and social problemsduring the excessive development of tourist traffic. Moreover, managers in tourist cities should collectdata on the stay duration, expenditure, and/or intention to act, in order to identify profitable marketsthat are more economically, socially and environmentally resilient [6].
The problem of excessive tourism can also be solved by striving to develop sustainable tourismdestinations, in this way balancing the equality of the right to travel with the rights of residents.This requires the involvement and cooperation of a wide range of stakeholders, thanks to which it ispossible to implement tourism planning and management measures that will be accepted by everyone.An example is the Paris Agreement on Climate Change, which helped mobilize individuals, industries,governments, and other organizations to cooperate, in order to reduce greenhouse gas emissions [14].However, to adopt some general principles and assumptions, it is necessary to thoroughly investigateand describe this phenomenon.
2.3. Travel by Generations
Assuming that the generation is an identifiable group of people, who share similar birth timesand experience of important events at development stages, one can now point to four generations ofpeople indicated in the scientific literature, ([11,13,40], ([41] p.234), ([42] p.307), [43]) those active andphysically fit enough to enjoy tourist trips [44]. Namely, they are [43]:
• Baby Boomers (BB)—born in 1945–1964, the so-called generation of the baby boom andeconomic boom;
• Generation X—born in 1965–1980, growing up during the economic crisis of the 1970s;• Generation Y (Millennials)—born in 1981–1994, brought up in the era of globalization and universal
access to the Internet;• Generation Z—born after 1995, which uses modern information and communication technology
for everything.
The next generation after Z is the Alpha Generation (born after 2010). It is a group of childrenaged nine years and younger, so they are not considered in the elaborated study.
The Baby Boomers generation nowadays is taking an increasingly active part in recreationalactivities, such as hiking, diving, surfing, climbing, and traveling to various places around the world.The growing mobility of this generation is associated with their well-established social position,financial possibilities, and having more free time because their adult children have started their ownfamilies. The eldest of this generation are already retired and those who are still working need more
112

Sustainability 2019, 11, 7151
time to relax and relieve stress. The needs and interests of the baby-boom generation are changingbecause this generation has become healthier and wealthier than in previous years [45]. As the Naidooresearch [46] shows, the main motivators in making tourist trips of this generation are taking pleasureand joy from traveling, soothing stress and tension, relaxation, the need for change and novelties, as wellas the an appreciation of the attractiveness of the physical environment, and caring for better health.
Generation X are people born in 1965–1977, who are currently 37–49 years old, and who grewup and entered adult life in Poland during the restructuring of the economy. Inflation, increasedunemployment and employment instability forced them to accept temporary contracts and accept jobsbelow their qualifications. The times in which they had to start their careers made them entrepreneurialpeople, but also exacerbated the atmosphere of uncertainty and fear associated with the possibilityof losing their jobs. However, as mature people, they are most often the owners of large enterprises,as well as supervisors and teachers for Generations Y and Z. Similarly, in the United States, GenerationX is described as born in bad economic conditions [47], and their attitudes and beliefs were shapedby the first war in Iraq [47], the climate of school shootings, reality shows [48] and HIV epidemics.Family is first for this generation, which is why they plan trips with the family and children tothe sea, mountains, or lakes. They also often visit popular cities, where you can find interestingmonuments or rich history. When choosing to travel abroad, they usually look for quiet, recreationalplaces, or interesting cultural monuments. Despite the fact that people from this generation were bornin analogue times, they fit perfectly into the modern digital world and modern technologies, which iswhy they willingly use the Internet when planning and booking their tourist trips.
The phenomenon that shaped Generation Y (Millennials) was globalization, which causedthe blurring of barriers between countries, internationalization of enterprises, merging cultures,and increasing access to products and services from around the world. Double earnings of parentshave become a standard, guaranteeing good conditions for the personal development of their children.Respect for ethics, multiculturalism, awareness of social problems, and the possibility of usinginformation and communication technology are of great importance for this generation. This generationis extremely mobile, willingly travels, moves from one place to another, and the decision to emigrate isready to be made quickly and not necessarily for economic reasons. The circle of friends of this generationis not limited to people living in one place, but they have friends all over the world. Their main valuesare independence, ambition, creativity, innovation, and development. Representatives of Generation Ytravel more than their predecessors, they visit and explore a greater number of destinations, spend morewhile traveling and are eager for interesting experiences and information [46,49]. Moreover, as researchby Debski [50] and Xiang, Magnini, Fesenmaier [31] indicate, people from Generation Y show a strongneed to use the opportunities generated by the Internet and social media while planning and sharingtheir experiences during and after the journey. Research by Santos, Veiga, and Aguas [51] showsthat Millennials are an increasingly important and larger group in tourism, which is also associatedwith their great need to travel. Moreover, they highly value travel comfort and follow a variety ofadventures, seek unique experiences, and do not just expect passive recreation. Generation Y touristsare increasingly avoiding mass tourism, wanting to be seen as travelers rather than tourists [51].This is associated with greater independence in planning trips and also with their concerns aboutthe environment [52]. In comparison with Baby Boomers and Generation X, Generation Y is muchmore active when it comes to planning travel trips or booking accommodation through the Internet(dedicated websites, e.g., booking.com), or using social media (such as TripAdvisor) [53].
Despite that the representatives of Generation Z have many features in common withrepresentatives of Generation Y, there is agreement among researchers [12,44,54] of this generation,that although some features are more visible in them, they are significantly different in many respects.Generation Z is a generation open to the world and novelties, not only technological but also thoserelated to exploring new places. This is a multitasking generation, where social media is their mainform of communication. A characteristic feature of this category is often the preference for virtualrelationships, rather than establishing real interpersonal relationships. People from Generation Z are
113

Sustainability 2019, 11, 7151
very open to the world and willingly undertake various forms of tourist activity, although they oftenlack financial resources because they are not yet professionally employed and are dependent on theirparents. Therefore, due to financial restrictions, this group dominates domestic recreation, with familyor friends. A survey conducted by Expedia Group Media Solutions in 11 different countries in 2017and 2018 revealed that representatives of Generation Z most often travel to rest (59%), visit family(41%), take part in special events (26%), or for entertainment purposes (21%). The analysis of ExpediaGroup Media Solutions also shows that 84% of people from Generation Z think that social media playsan important role when planning travel. On social networks, they look for promotions, among otherthings, as well as getting inspiration to travel by viewing photos and videos published by friends orexperts. It is also worth noting that as many as 66% of the representatives of Generation Z during tripplanning are not committed to a specific destination and are open to inspiration regarding the holidayspot and the place of departure (74%).
3. Materials and Methods
In order to get the answer to the research questions posed in the article, it was necessary to conductempirical research among people from different generations, where the division of society into differentgroups was made on the basis of literature analysis. The main criterion for dividing the respondentswas the generation the respondent came from. They were determined based on the respondent’syear of birth. The sample was stratified random sampling in Poland. However, the respondents hadto have one consistent feature, which was experienced in the field of tourist trips. A pre-test wasconducted and some adjustments were made before sending the questionnaire. The invitation tothe survey was distributed by 424 emails in October 2019. In order to reach people of different ages(generational layers), who have undertaken tourism activity in recent years, emails with the link havebeen shared on discussion forums and travel groups on social media.
The research questionnaire contained seven questions, two of which had an extensive structure,including testing the agreement of respondents with the opinions presented on the occurrence ofovertourism and their own impact on the tourist area. The choice of questions was deliberate,as they were to indicate selected phenomena that resulted in the occurrence of overtourism in touristdestinations. In several cases, the question was repeated in the opposite context to verify the reliabilityof the answers given. Thanks to the Likert scale used, it was possible to choose one of five responsevariants, arranged symmetrically, in terms of positive or negative reference to the issue being addressed.The choice of an intermediate answer meant a neutral attitude to the issue under review, or no opinionon a given topic. The obtained responses were quantified in such a way that a positive attitudetowards a particular phenomenon was assessed by a value of 2 or 1 when the positive response wassupported only partially. In the case of a negative rating, the grade awarded was −2, unless it waspartially negative, then the grade −1 was allocated. The neutral grade was awarded with a value of 0.Meanwhile, the average rating of a given response variant higher than zero means a positive attitude ofall respondents to the issue. A negative average value indicated a negative attitude of all respondentsto a given opinion. This made it possible to compare the responses given by nonparametric statisticaltests in individual groups designated by generational identification. The main questions were followedby a record specifying their gender, age, and education, as well as tourist experience, differentiated bythe length and frequency of tourist trips.
After the initial selection of collected questionnaires, 396 respondents were qualified forfurther analysis, which exceeded the minimum random sample size estimated at 386 questionnaires(for the assumed maximum statistical error rate of the sample of ±5% and the confidence level p = 0.95).
The elaboration of the collected data involved the performance of statistical analysis, of bothone-dimensional (in the form of classical or positional descriptive analysis) and two-dimensional(in the form of analysis of the relationships of pairs of tested features) natures, and evenin a multidimensional dimension, by means of correspondence analysis [55]. In some cases, the level ofsignificance of differences between the obtained average values was also studied. For comparison of two
114

Sustainability 2019, 11, 7151
groups of variables with a distribution different than normal, the U (Mann–Whitney) test was used [56].The significance of differences between structure indicators was verified with the Chi-squared test.When verifying statistical hypotheses, the statistical tests were used, taking into account significanceat the level of α ≤ 0.05. In the interdependence analysis, Pearson’s linear correlation coefficients andt-Student significance test for the correlation coefficient were used [57].
Correspondence analysis is a method of multivariate qualitative analysis, using a two-dimensionalcomparison of many variables by using their taxonomic distances. The results of correspondenceanalysis are presented in two-dimensional drawings of mutual relations of the qualitativeresponses obtained.
4. Results of Research
The survey involved 386 respondents, among whom 59.8% were women and 40.2% men.Taking into account the criterion of division of the respondents according to generations, the surveysample included 58.8% of people from Generation Z, 21.5% of people from Generation Y and 19.7% ofpeople from Generation X. The BB generation also took part in the study. However, it was not possibleto obtain sufficient numbers of this group of respondents (<30). This is not a sufficient representationof the respondents on the basis of which it is possible to infer, therefore this generation was omittedin further analyses. Table 1 gives the structure of the respondents. It already covers only threegenerations. Undoubtedly, this is one of the limitations of the presented study, which is why it willbe undertaken in subsequent studies of the authors. Among the respondents, well-educated peoplepredominated—over 60% of people had at least post-secondary education (first-degree graduates).High school graduates constituted 38.6% of respondents (Table 1).
Table 1. Structure of respondents.
Generations [%] Length of Tourist Trips [%]
X 19.7% no rule 33.6%Y 21.5% 1–3 days 27.0%Z 58.8% 4–6 days 26.5%
one week > 12.9%
Level of Education [%] Frequency of Tourist Trips [%]
Basic/Junior high 1.0% less than once a year 15.4%Secondary 38.6% once a year on average 28.3%Higher I 27.5% several times a year 56.3%Higher II 30.8%
Postgraduate 1.0%PhD 1.0%
Gender ofRespondents
[%] Knowledge about Overtourism [%]
Woman 59.8% Yes, I met this phenomenon personally 67.7%Man 40.2% I heard about it from the media/friends 20.7%
No, I've never encountered it 11.1%
Source: based on own study.
The surveyed people showed a very diverse length of tourist trips including at least one night.More than every fourth respondent usually decided on 1–3 days’ weekend trips (27.0%) or trips lasting4–6 days (26.5%). In terms of the frequency of trips, the overwhelming majority (56.3%) go severaltimes a year, and every fourth (28.3%) at least once a year. Every third respondent (33.6%) undertooktrips of varying lengths.
115

Sustainability 2019, 11, 7151
Respondents were asked about knowledge on overtourism. Nine out of ten respondents (88.4%)stated that they knew of this phenomenon. However, every fifth respondent (20.7%) heard about thisfrom the media or from friends, while 67.7% of people came across this phenomenon directly.
Analyzing the responses of the respondents in general (without a generational breakdown) tothe questions in which the respondents had to agree or disagree with the opinions presented to them,one can indicate the opinions for which a high degree of agreement has been noticed, as well as severalof those to which the respondents disagreed. These opinions can be ranked according to the decreasingdegree of agreement of the respondents. This is the following order:
• During the trip, I do not litter the environment, I do not make noise, and I turn off electrical devices whenleaving the hotel room (average rating is 1.48 ± 0.78);
• I always behave in a civilized way, no matter where I am (the average rating is 1.48 ± 0.80);• During the trip, I use natural resources in the same way as in my home (the average rating is 1.08 ± 1.00);• My presence in a tourist location means only benefits for residents (the average rating is 0.26 ± 1.00);• I pay for the holiday, so I can use the local amenities however and whenever I want (average rating is
0.06 ± 1.28);• To be honest, it is not my concern–I want to relax when I feel like it (average rating is 0.04 ± 1.39);• This is an exaggeration–in my opinion, the negative impact of tourists is exaggerated (the average rating
is −0.30 ± 1.04);• During the trip, I sometimes use more water for washing and more electricity than at home (the average
rating is −0.51 ± 1.29);• I believe that during a tourist trip I am free to do more, I am on holiday after all (average score is
−0.61 ± 1.30);• I do not intend to deal with what the residents think about my presence and behavior (average score is
−0.76 ± 1.16).
According to the adopted methodology for assessing individual issues, the followingintergenerational differences can be noticed:
• Indifference to the phenomenon of overtourism was demonstrated by the youngest respondents(Z generation). Their results of agreement with the opinion that overtourism is not their concernare similar and positive, which means that they generally agree with this opinion. Intermediategroups of respondents (X and Y generations) do not agree with indifference to this phenomenon.Comparative analysis between the generations confirmed that there is a statistically significantdifference between the average ratings of the X and Z generations (p < 0.001) and Y and Z(p = 0.020).
• In general, all respondents agree that tourist visits are associated with benefits for residents.Generation Y agrees with this statement much more often than people from other generations,in which there is a greater tendency to an intermediate response (difficult to say/I do not know).
• In the case of opinions that the popularity of the phenomenon of overtourism results fromexaggerating its real significance, the responses are unambiguous. All generations negativelyrefer to this statement, which means that in generations X, Y, and Z the problem of overtourism isperceived as serious.
• The distribution of responses on the subject of higher water and electricity consumption duringtourist stays is interesting. The respondents from all generations disagree with this opinion,while it is twice as emphatic in Generation X than in the Y and Z generations, which show greatsimilarity in this respect (p = 0.767).
• The opinion on whether during the tourist trip the respondents were allowed more than in everydaylife did not gain approval. In general, the ratings obtained were negative, and in Generation X,strong opposition to this opinion was more frequently expressed (−1.14 ± 1.08).
116

Sustainability 2019, 11, 7151
• A material factor related to the opinion that a tourist has the right to use the destination freely,since they pay for it, did not gain the approval of the X and Y generations, while the people ofGeneration Z rather agree with this view (0.41 ± 1.17).
• For all generations of tourists, the opinion of residents on their behavior in the destination turnsout to be important. This is indicated by average ratings in all groups, with higher averages againin generations X and Y.
• The above result seems to be consistent with what was obtained in the study on the responsesof respondents from different generations on their opinions about their manners during the trip.All generations agree that their civilized behavior does not depend on where they are, andtherefore is identical in a holiday spot and the home environment.
• In the next question, in order to control the reliability of responding, one of the previously askedquestions was repeated (but in the opposite context). It was a question about similar consumptionof natural resources at home and during a tourist trip. The answers obtained confirm the reliabilityof the research tool, because the average scores are very similar to those given when asked aboutwater and electricity consumption. Of course, the results were positive this time, because theywere put in a positive context.
• The respondents generally strongly agreed with the statement that they do not litterthe environment, do not make noise, and turn off electrical devices while leaving the hotelroom. What is noticeable here is the fact that the frequency of confirming this opinion decreaseswith the increasingly lower age of respondents (Table 2).
Table 2. Results of average agreement assessments of respondents from different generations withthe opinions presented.
What do You Think About Your Own Impact on the Inhabitants’ Environmentand the Environment in the Visited Tourist Destinations? Generations
X Y Z
Mean ± Standard Deviation (Median)
To be honest, it is not my concern—I want to relax when I feel like it 0.49 ± 1.44 −0.13 ± 1.33 0.27 ± 1.34My presence in a tourist location means only benefits for residents 0.16 ± 1.09 0.45 ± 0.86 0.21 ± 1.01This is an exaggeration—in my opinion, the negative impact of tourists is exaggerated −0.5 ± 1.11 −0.44 ± 1.04 −0.24 ± 0.96During the trip, I sometimes use more water for washing and more electricity than at home −0.85 ± 1.21 −0.47 ± 1.16 −0.47 ± 1.32I believe that during a tourist trip I am free to do more, I am on holiday after all −1.14 ± 1.08 −0.88 ± 1.21 −0.36 ± 1.33I pay for rest, so I can use the local amenities whenever I want and when I want −0.65 ± 1.18 −0.36 ± 1.25 0.41 ± 1.17I do not intend to deal with what the residents think about my presence and behavior −1.14 ± 1.01 −0.96 ± 1.01 −0.58 ± 1.21I always behave in a civilized way, no matter where I am 1.58 ± 0.73 1.49 ± 0.79 1.45 ± 0.85During the trip, I use natural resources in the same way as in my home 1.27 ± 0.99 1.06 ± 0.94 1.05 ± 1.02During the trip, I do not litter the environment, I do not make noise, and I turn offelectrical devices when leaving the hotel room 1.58 ± 0.69 1.52 ± 0.74 1.43 ± 0.84
Source: own work.
A comparative analysis in terms of average ratings of individual generations proves manypreviously observed similarities between generations, but also a lot of differences, determinedon the basis of a nonparametric test of the significance of differences between means (Table 3). The mostsignificant differences between individual pairs of generations were observed in the case of X and Zpairs (p < 0.001). In many cases, these generations expressed opposite opinions, such as in the case ofindifference to their own impact on the tourist area, or regarding the requirements for the destinationin which they leave their money. Or they had similar opinions, but with radically different firmness, asin the case of allowing oneself more when on holiday, or indifference to the opinions of residents abouttheir behavior.
117

Sustainability 2019, 11, 7151
Table 3. The results of the nonparametric test of the significance of differences between average ratingsfor agreement with opinions in individual generations.
Opinion on Own Impact on the Tourist Area and ResidentsLevel of Significance of Differences
between Generations
XZ XY YZ
To be honest, it is not my concern—I want to relax when I feel like it 0.001 0.088 0.020My presence in a tourist location means only benefits for residents 0.854 0.093 0.043This is an exaggeration—in my opinion, the negative impact of tourists is exaggerated 0.034 0.685 0.076During the trip, I sometimes use more water for washing and more electricity than at home 0.027 0.026 0.767I believe that during a tourist trip I am free to do more, I am on holiday after all 0.001 0.142 0.002I pay for rest, so I can use the local amenities whenever I want and when I want 0.001 0.147 0.001I do not intend to deal with what the residents think about my presence and behavior 0.001 0.209 0.019I always behave in a civilized way, no matter where I am 0.221 0.371 0.839During the trip, I use natural resources in the same way as in my home 0.054 0.041 0.805During the trip, I do not litter the environment, I do not make noise, and I turn offelectrical devices when leaving the hotel room 0.218 0.557 0.553
Source: based on own study.
In terms of similarities, the fewest discrepancies can be seen between the X and Y generations–thereare just two results indicating significant differences between opinions in these generations. The firstrelates to higher consumption of water and electricity during a tourist trip than at home (p = 0.026),while the second concerns the control question, i.e., the opinion that during a tourist trip they usenatural resources in the same way as in their own environment (p = 0.041). The generation thatdisagrees less with the opinion that it consumes more water and electricity, as well as agrees less withusing natural resources in the same way, is Generation Y.
The impact of individual generations on the area of tourist destinations and residents is similar,although with a varied impact. Representatives of all generations strongly indicate that their presencehas an impact on the economic situation of residents. Other indications are no longer that significant(Table 4).
Table 4. The assessment of respondents’ own impact on residents and tourist destinations.
I Think that My Presence in A Tourist Destination May Affect: Generations
X Y Z
Mean ± Standard Deviation (Median)
Economic situation of residents (living costs, income) 1.37 ± 0.66 1.33 ± 0.79 1.14 ± 0.95State of relations of residents (family/neighborly/friendly) 0.6 ± 0.74 0.51 ± 0.79 0.41 ± 0.85Communication possibilities (moving, parking) −0.18 ± 1.03 −0.22 ± 1.02 −0.22 ± 1.18Comfort of recreation for residents in their free time −0.07 ± 1.02 −0.13 ± 1.01 0.01 ± 1.13Religious practices and access to culture by local people 0.25 ± 0.81 0.19 ± 0.73 0.19 ± 0.88Satisfaction of residents with professional life 0.92 ± 0.81 0.76 ± 0.77 0.88 ± 0.83Residents’ access to social infrastructure 0.49 ± 0.92 0.44 ± 0.95 0.46 ± 1.06Sense of security on the streets 0.42 ± 0.82 0.27 ± 0.92 0.25 ± 1.02Sense of pride of residents for belonging to the city 0.76 ± 0.76 0.79 ± 0.77 0.83 ± 0.90Condition of the natural environment in the town 0.01 ± 1.06 0.14 ± 1.05 0.09 ± 1.12
Source: own work.
Generation X, in addition to economic impact, notices its own impact on the satisfaction ofresidents with professional life (0.92 ± 0.81) and residents’ sense of pride in belonging to the city(0.76± 0.76). They also perceive their own impact on residents’ family, neighborly, and friendly relations(0.6 ± 0.74). This group of respondents generally did not show clear or even moderate oppositionto the indicated elements of influence. If they disagreed with them, they usually described somefactors as indifferent. Such a situation occurred in the case of their impact on the natural environment(0.01 ± 1.06), or the comfort and relaxation of residents on days off (−0.07 ± 1.02).
118

Sustainability 2019, 11, 7151
In the case of people from Generation Y, the strongest impact is similarly observed in the caseof economic impact on residents (1.33 ± 0.79). A much lower, but clear impact, is seen in the case ofa sense of pride in the resident’s belonging to the tourist destination community (0.76 ± 0.77) andthe impact on the satisfaction of residents with professional life (0.79 ± 0.77). Similarly, in the case ofGeneration X, likewise Generation Y generally does not expressly disagree with the opinions, but isneutral on the same factors as Generation X.
Generation Z also indicated its own economic impact, i.e., impact on living costs and income(1.14 ± 0.95). Similarly to all the analyzed generations, in Generation Z, there is seen to be an impacton the residents’ satisfaction with their professional work (0.88 ± 0.83) and a sense of pride withbelonging to a destination (0.83 ± 0.90).
Summing up the results from particular generations, it is worth noting that, in general, respondentspointed to the same elements of their own impact, but with a different firmness. Generations X, Y, andZ are very similar in their indications and intensity of impact. In addition, average extreme values(both the highest and the lowest) are seen in Generation Z.
The analysis of correspondence made in relation to the collected data allowed confirmation ofseveral previously presented conclusions. The first of two visualizations (Figure 1) presents a set ofvariables covering the diversity of respondents by the generations they represent, their gender, level ofeducation, and tourist experience expressed in the length and frequency of tourist trips.
Figure 1. Correspondence analysis results—statement I. Source: own study.
Figure 1 shows a clear separation of the locations of the Z generations from the generations X andY, which are almost identical in their behavior. People from the older generation more often indicatedthat they had never heard of the phenomenon of overtourism, although the questionnaire explainedthe definition of this phenomenon and examples of behavior that could express it. Other generationsmore often showed the recognition of such a phenomenon (in the media or in person). Experiencein overtourism did not depend on the gender of the subjects or the length of trips.
The next set, obtained on the basis of correspondence analysis (Figure 2), again proves discrepanciesin the responses given by generations. Generations X, Y, and Z show, in this respect, both greatertourist activities expressed in the length and frequency of tourist trips undertaken, but also knowledgeof overtourism. Generation Z recognizes the phenomenon of overtourism in the media more oftenthan generation Y and Z. People from Generation X most often have personal experience in this field.
119

Sustainability 2019, 11, 7151
Figure 2. Correspondence analysis results—statement II. Source: own study.
5. Discussion and Conclusions
There are significant implications drawn from this study. The study showed that respondents mostoften take short trips lasting 1–3 days (27%) and 4–6 days (26.5%), which confirms the data collected byEurostat, where [58] short trips dominated among the respondents (50.2%). The conducted researchindicates that Generation Z is indifferent to the phenomenon of overtourism, based on which it can beconcluded that they do not pay attention to the needs of others. This is confirmed by the research offocus groups, on the basis of which it can be stated that the main purpose of the respondents’ travel wastheir own hedonistic experiences. This may indicate selfish behavior towards the residents of a givendestination [59]. However, the authors suggested that with natural environments potentially offeringa playground for the hedonistic experience, sustainability needs to be fully embedded in the destinationmanagement, with the preservation of natural environments becoming the central factor to attractingpotential consumers [59]. The approval of the X and Y generations has not gained the opinionthat the tourist has the right to use the destination freely, as they pay for it, and representatives ofGeneration Z rather agree with this view. Knowledge of these discrepancies in opinions may affectthe choice of solutions used in destinations with the aim of solving the problem of overtourism.High demand causes, in many destinations, prices in bars and restaurants to increase, which makesservices less available to the local community and some customers. Moreover, bars are closed down,so that hotels and apartments can be built in their place, which means that 18% of residents considerchanging their place of residence [60]. Some of the destinations are considering implementing solutionsaimed at attracting high-income tourists. However, this could lead to widening social inequalities.Therefore, it is necessary to develop solutions that ensure equal access to destinations for tourists withdifferent incomes.. In turn, subsequent generations disagreed with this opinion, but it was twice asfirm in Generation X than in the case of generations Y and Z. Natural resources are limited; therefore,according to UNWTO directives [3] or the GSTC criteria [19], tourists’ awareness should be raised andrules for the use of natural resources should be established. This will require a redefinition of tourism,in order to place the rights of local communities above the rights of tourists for holidays and the rightsof tourism corporates to make profits [61]. You can use information technology (IT) and social media(SM) solutions, which are being increasingly used by representatives of the young generation [45].
Tourism is a driving force for other sectors of the economy. It is developing very dynamicallyand brings great financial benefits to various stakeholders. However, apart from the obvious benefits,the tourism industry also has a harmful effect on the natural environment and the local community.As already mentioned, this phenomenon is called overtourism. The negative impact of overtourism can
120

Sustainability 2019, 11, 7151
be considered in three dimensions [24] (pp. 87–88): environmental, economic, and social. These includeoverpopulation and devastation in places attractive for tourists, destruction of the natural environment,strong seasonal influence, and an increase in the economic dependence of a given city on tourism, as wellas the creation of many burdens and inconveniences for the local community. In particular, the younggeneration of tourists can be a big problem for the local community, because the way they spendtheir time disturbs peace in tourist destinations and can cause increased crime or problems related touncivilized behavior. Overtourism is therefore, a significant barrier to ensure sustainable development.
The results of the conducted research indicate that nine out of ten respondents knew the meaningof the word overtourism and have met it. However, indifference to this phenomenon was indicated bythe youngest respondents (Generation Z). Respondents of Generation X and Generation Y showedthe least indifference to the problem of overtourism. The respondents also agreed on individualelements of their own impact on the environment and residents, but with different firmness.
Obtaining research results enabled the preparation of managerial and theoretical implications.Recommendations have been prepared for solving the problem of overtourism in economic,environmental and social aspects.
Residents of tourist areas gain economic benefits from tourism; however, the excess of touristtraffic causes conflicts in the social background, therefore, it is necessary to examine the expectations ofresidents to be able to see psychological, social, economic, or environmental problems. Doxey’s [26] orButler’s [27] research on this subject is a good example of this. It is recommended to create a spacefor discussion, where stakeholders representing different generations would have the opportunityto exchange opinions on sustainable tourism, which would contribute to acquiring new knowledge,increasing their level of awareness in the field of overtourism, and developing various solutions to helpsolve this problem [19,32]. It is necessary to support this process by local authorities in order to takeaction to counteract the negative impact of tourism on the local community. It is worth having residentsparticipate in it, which will help create optimal solutions. Moreover, it should also be discussed onforums to help engage Generation Z in discussions, for which social media is important, and appreciategroup (crowd-related) problem-solving. This would help to compile strategic documents that wouldindicate goals and propose solutions in the field of solving the problem of overtourism.
Local authorities should monitor tourist traffic and collect data, including qualitative data, in termsof customer expectations and types of activity, which would allow the creation of road maps forsustainable tourism development. This could include, among other matters, encouraging the extensionof stays; expanding the possibilities of spending time; and creating new attractions located in lesspopulated areas, which could be less burdensome for residents. It is worth implementing initiativesthat would support local businesses run by residents.
In order to counteract the negative impact of overtourism on the environment, it is proposedto implement smart technologies that would monitor the level of traffic in the city and preventovercrowding in places attractive to tourists. It is also worth using SM to provide informationencouraging tourists to respect local culture and the environment, as well as informing them ofthe negative effects of not respecting these principles. In order to minimize the negative impact ofovertourism on the environment, acceptable levels of tourists’ impact on tourist attractions can bedefined through a participatory process involving all interested parties. This will make it easier forlocal communities to reap the benefits, create shared experiences of the city for visitors and residents,and help communicate with residents.
The presented article has its limitations, which is the limited territorial scope of research, as wellas the limited number of respondents representing the BB generation. Therefore this generation wasexcluded from statistical analyses. The small sample of the BB population is most likely due to the waythe questionnaire is delivered. The BB generation uses less modern technology, social networkingsites, and forums. In order to examine this group of people, it should be considered to use face-to-faceinterviews based on a questionnaire in different tourist destinations.
121

Sustainability 2019, 11, 7151
In further research, the authors will examine the generational awareness of overtourismin other countries and make international comparisons. The authors plan to conduct further studiesin cooperation with tourist resorts. This will enable to use the recommendations contained in the article.In particular, to increase the awareness level of generation Z, decision-makers should considerusing IT technologies and social media, which are natural communication tools for this generation.Another intention of the authors is also to obtain the opinion of the BB generation, therefore the way ofdistributing the questionnaire will be changed from online to offline.
Author Contributions: A.R.S. prepared the following elements of the article: the methodology, conduct of research,analysis of data, developed research results. B.H. created the review of literature, developed the final contents ofthe article and proofread. A.K. co-created the review of literature, conclusions and conducted the research.
Funding: This research received funding from the National Science Center in Poland.
Acknowledgments: This paper was published as part of the research project ‘A business model for health resortenterprises’ No. 2017/25/B/HS4/00301, supervised and financed by the National Science Center in Poland and aspart of statutory research No. 13/990/BK_19/0138 at the Silesian University of Technology, Faculty of Organizationand Management.
Conflicts of Interest: The authors declare no conflicts of interest. The funders had no role in the design ofthe study; in the collection, analyses, or interpretation of data; in the writing of the manuscript; or in the decisionto publish the results.
References
1. World Tourism Organization, International Tourism Highlights 2019 Edition. UNWTO, Madrid.Available online: https://www.e-unwto.org/doi/book/10.18111/9789284421152 (accessed on 20 October 2019).
2. Turystyka w UE, GUS. Available online: https://stat.gov.pl/obszary-tematyczne/kultura-turystyka-sport/turystyka/turystyka-w-unii-europejskiej-dane-za-2017-rok,11,4.html (accessed on 20 October 2019).
3. World Tourism Organization and United Nations Development Programme Tourism and the SustainableDevelopment Goals—Journey to 2030, Highlights, UNWTO, 2017, Madrid. Available online:https://www.e-unwto.org/doi/pdf/10.18111/9789284419401 (accessed on 20 October 2019).
4. Dickinson, G. A timeline of overtourism: Key moments in global battle between locals and travelers,The Telegraph, 21 August 2019. Available online: https://www.telegraph.co.uk/travel/news/timeline-action-against-overtourism/ (accessed on 10 October 2019).
5. Portal Samorzadowy. Available online: https://www.portalsamorzadowy.pl/wydarzenia-lokalne/miasta-nie-potrzebuja-turystow-szaranczy,133542.html (accessed on 20 October 2019).
6. Oklevik, O.; Gössling, S.; Hall, C.M.; Kristian, J. Overtourism, optimisation, and destination performanceindicators: A case study of activities in Fjord Norway. J. Sustain. Tour. 2019. [CrossRef]
7. Panayiotopoulos, A.; Pisano, C. Overtourism Dystopias and Socialist Utopias: Towards an Urban Armaturefor Dubrovnik. Tour. Plan. Dev. 2019, 16, 393–410. [CrossRef]
8. Pechlaner, H.; Innerhofer, E.; Erschbamer, G. (Eds.) Overtourism: Tourism Management and Solutions; Series:Contemporary Geographies of Leisure, Tourism and Mobility; Routledge: Abingdon, UK, 2019.
9. ‘Overtourism’?—Understanding and Managing Urban Tourism Growth beyond Perceptions |World TourismOrganization. Available online: www.e-unwto.org (accessed on 25 October 2019).
10. Google Website. 2019. Available online: https://trends.google.pl/trends/explore?q=Overtourism (accessed on30 October 2019).
11. Dolot, A. The Characteristics of Generation, Z; E-mentor, Warsaw School of Economics: Warszawa, Poland, 2018.12. Grencíková, A.; Vojtovic, S. Relationship of generations X, Y, Z with new communication technology.
Probl. Perspect. Manag. 2017, 15, 558–564. [CrossRef]13. Hysa, A. Zarzadzanie róznorodnoscia pokoleniowa. Zeszyty naukowe Politechniki Slaskiej 2016, 97, 385–398.14. Erickson, L.; Robinson, J.; Cutsor, J.; Brase, G. Sustainable Development. In Solar Powered Infrastructure for
Electric Vehicles: A Sustainable Development; Erickson, L., Robinson, J., Brase, G., Cutsor, J., Eds.; Taylor andFrancis Group: Abingdon, UK, 2016.
15. Eurostat Statistic. Available online: https://ec.europa.eu/eurostat/statistics-explained/index.php?title=Tourism_industries_-_employment]Source:Eurostat (accessed on 20 October 2019).
122

Sustainability 2019, 11, 7151
16. GUS. 2019. Available online: https://stat.gov.pl/obszary-tematyczne/kultura-turystyka-sport/turystyka/baza-noclegowa-wedlug-stanu-w-dniu-31-lipca-2019-r-i-jej-wykorzystanie-w-pierwszym-polroczu-2019-roku,4,16.html (accessed on 20 October 2019).
17. Kuznetsov Viktor, S. An integrated approach to tourism development in protected natural areas. Arct. North.2016. [CrossRef]
18. Luo, J.M.; Lam, C.F.; Haobin Ye, B. Barriers for the Sustainable Development of Entertainment Tourismin Macau. Sustainability 2019, 11, 2145. [CrossRef]
19. Global Sustainable Tourism Council. GSTC Criteria for hotels. GSTC Criteria for tour operators. GSTC Criteriafor destinations. Available online: http://www.gstcouncil.org/gstc-criteria/ (accessed on 14 August 2019).
20. Perkumiene, D.; Pranskuniene, R. Overtourism: Between the Right to Travel and Residents’ Rights.Sustainability 2019, 11, 2138. [CrossRef]
21. Hatipoglu, B.; Alvarez, M.D.; Ertuna, B. Barriers to stakeholder involvement in the planning of sustainabletourism: The case of the Thrace region in Turkey. J. Clean. Prod. 2016, 111, 306–317. [CrossRef]
22. Wu, L. How Cities Around The World Are Fighting Overtourism. 2019. Available online: ttps://www.forbes.com/sites/lesliewu/2019/05/26/how-cities-around-the-world-are-fighting-overtourism/#20f554db212a(accessed on 20 October 2019).
23. McKinsey & Company, & World Travel & Tourism Council. Coping with success: Managing overcrowdingin tourism destination. 2017. Available online: https://www.wttc.org/-/media/files/reports/policy-research/copingwith-success---managing-overcrowding-in-tourism-destinations-2017.pdf (accessed on 20 October 2019).
24. Peeters, P.; Gössling, S.; Klijs, J.; Milano, C.; Novelli, M.; Dijkmans, C.H.S.; Eijgelaar, E.; Hartman, S. Researchfor TRAN Committee—Overtourism: Impact and Possible Policy Responses; Policy Department for Structural andCohesion Policies Directorate-General for Internal Policies: Brussels, Belgium, 2018.
25. Kruczek, Z. Ways to Counteract the Negative Effects of Overtourism at Tourist Attractions and Destinations.In Annales—Universitatis Mariae Curie-Sklodowska, Sectio B, VOL. LXXIV; University School of PhysicalEducation: Kraków, Poland, 2019; pp. 45–57.
26. Doxey, G.V. A causation theory of visitor/resident irritants: Methodology and research inferences.In Proceedings of the Travel Research Association 6th Annual Conference, San Diego, CA, USA,8–11 September 1975; pp. 195–198.
27. Butler, R.W. The concept of tourism area cycle of evolution: Implications for management of resources.Can. Geogr. 1980, 24, 5–12. [CrossRef]
28. Dodds, R.; Butler, R.W. Overtourism. Issues, Realitis and Solutions. In De Gruyter Studies in Tourism 1;Walter de Gruyter: Berlin, Germany, 2019; pp. 1–22.
29. Kruczek, Z. “Overtourism”—around the definition, Encyclopedia, 2019, v1. Available online: https://encyclopedia.pub/163 (accessed on 20 October 2019).
30. Coping with success managing overcrowding in tourism destinations, 2017, McKinsey & Company & WorldTravel & Tourism Council. Available online: https://www.wttc.org/-/media/files/reports/policy-research/coping-with-success---managing-overcrowding-in-tourism-destinations-2017.pdf (accessed on 20 October 2019).
31. Xiang, Z.; Magnini, V.P.; Fesenmaier, D.R. Information Technology and Consumer Behaviour in Traveland Tourism: Insights from Travel Planning Using the Internet. J. Retail. Consum. Serv. 2015, 22, 244–249.[CrossRef]
32. Expedia Group Media Solutions survey, “Multi-generational travel trends. Travel habits and behavioursof Generation Z, Millennials, Generation X, and Baby Boomers”. Available online: https://info.advertising.expedia.com/british-travel-and-tourism-trends-research (accessed on 10 October 2019).
33. Globetrender Website. Available online: https://globetrender.com/2019/05/11/overtourism-crisis/ (accessed on10 October 2019).
34. Zmyslony, P.; Kowalczyk-Anioł, J. Urban tourism hypertrophy: who should deal with it? The case of Krakow(Poland). Int. J. Tour. Cities 2019. [CrossRef]
35. González, A.T. Venice: the problem of overtourism and the impact of cruises. Investig. Reg.—J. Reg. Res.2018, 42, 35–51.
36. Benner, M. From overtourism to sustainability: A research agenda for qualitative tourism developmentin the Adriatic. German J. Econ. Geogr. 2019, 92213, 1–18.
37. Butler, R.W.; Szromek, A.R. Incorporating the Value Proposition for Society with Business Models of HealthTourism Enterprises. Sustainability 2019, 11, 6711. [CrossRef]
123

Sustainability 2019, 11, 7151
38. World Tourism Organization. Making Tourism More Sustainable—A Guide for Policy Makers; UNEP andUNWTO: Madrid, Spain, 2005; pp. 11–12. Available online: http://www.unep.fr/shared/publications/pdf/DTIx0592xPA-TourismPolicyEN.pdf (accessed on 10 October 2019).
39. Milano, C.; Novelli, M.; Joseph, M. Overtourism and Tourismphobia: A Journey through Four Decades ofTourism Development, Planning and Local Concerns. Tour. Plan. Dev. 2019, 14, 353–357. [CrossRef]
40. Smola, K.W.; Sutton, C.D. Generational differences: Revisiting generational work values for the newmillennium. J. Organ. Behav. 2002, 23, 363–382. [CrossRef]
41. Smolbik-Jeczmien, A. Rozwój kariery zawodowej przedstawicieli pokolenia X i Y w warunkach gospodarkiopartej na wiedzy. Nierównosci Społeczne a Wzrost Gospodarczy 2013, 36, 228–238.
42. Mazur-Wierzbicka, E. Kompetencje pokolenia Y—wybrane aspekty, Studia i prace Wydziału Nauk Ekonomicznychi Zarzadzania Nr 39, t. 3; Wydawnictwo Naukowe Uniwersytetu Szczecinskiego: Szczecin, Poland, 2015;pp. 307–320.
43. McCrindle, M. The ABC of XYZ: Understanding the Global Generations Kindle Edition; McCrindle Research PtyLtd.: Sydney NSW, Australia, 2014.
44. Lyons, S.T.; Schweitzer, L.; Ng Eddy, S.W. How have careers changed? An investigation of changing careerpatterns across four generations. J. Manag. Psychol. 2015, 30, 8–22. [CrossRef]
45. Ruth, N.; Bolton, A.; Parasuraman, A.; Hoefnagels, A.; Migchels, N.; Kabadayi, S.; Gruber, T.; Loureiro, Y.K.;Solnet, D. Understanding Generation Y and Their Use of Social Media: A Review and Research Agenda.J. Serv. Manag. 2013, 24, 245–267.
46. Naidooa, P.; Ramseook-Munhurrunb, P.; Seebaluckc, N.V.; Janvierd Procedia, S. Investigating the Motivationof Baby Boomers for Adventure Tourism. Soc. Behav. Sci. 2015, 175, 244–251. [CrossRef]
47. Zabel, K.L.; Benjamin, B.J.; Biermeier-Hanson, B.B.J.; Baltes Early, B.J.; Shepard, A. Generational Differencesin Work Ethic: Fact or Fiction? J. Bus. Psychol. Sci. Bus. Media 2016. [CrossRef]
48. Kupperschmidt, B.R. Multigeneration employees: Strategies for effective management. Health Care Manag.2000, 19, 65–76. [CrossRef]
49. Vukic, M.; Kuzmanovic, M.; Kostnic Stankovic, M. Understanding the Heterogeneity of Generation Y’sPreferences for Travelling: A Conjoint Analysis Approach. Int. J. Tour. Res. 2015, 17, 482–491. [CrossRef]
50. Debski, M.; Krawczyk, A.; Dworak, D. Wzory zachowan turystycznych przedstawicieli Pokolenia Y. In Studiai Prace Kolegium Zarzadzania Finansów, Zeszyt Naukowy 172; Uniwersytet Warszawski: Warsaw, Poland, 2019;pp. 9–27.
51. Santos, M.C.; Veiga, C.; Aguas, P. Tourism Services: Facing the Challenge of new Tourist Profiles. Worldw. Hosp.Tour. Themes 2016, 8, 654–669. [CrossRef]
52. Leask, A.; Fyall, A.; Byron, P. Generation Y: An Agenda for Future Visitor Attraction Research. Int. J. Tour. Res.2014, 16, 462–471. [CrossRef]
53. Sun, S.; Nang Fong, L.H.; Law, R.; Luk, C. An Investigation of Gen-Y’s Online Hotel Information Search:The Case of Hong Kong. Asia Pac. J. Tour. Res. 2016, 21, 443–456. [CrossRef]
54. Huang, Y.-C.; Petrick James, F. Generation Y’s Travel Behaviours: a comparison with Baby Boomers andGeneration X. In Tourism and Generation Y; Beckendorff, P., Moscardo, G., Pendergast, D., Eds.; CABI:Wallingford, UK, 2010; pp. 27–37.
55. Greenacre, M.; Hastie, T. The Geometric Interpretation of Correspondence Analysis. J. Am. Stat. Assoc. 1987,82, 437–447. [CrossRef]
56. Stanisz, A. (Ed.) Biostatystyka; Wyd. Uniwersytetu Jagiellonskiego: Kraków, Poland, 2005; pp. 109–409.57. Kendall, M.G. Multivariete Analysis; Charles Griffin: London, UK, 1975; pp. 3–198.58. Eurostat. 2019. Available online: https://ec.europa.eu/eurostat/statistics-explained/index.php/Tourism_
statistics#Tourism_expenditure:_highest_spending_by_German_residents (accessed on 15 October 2019).59. Hanna, P.; Font, X.; Scarles, C.; Weeden, C. Harrison Ch: Tourist destination marketing: From sustainability
myopia to memorableexperiences. J. Destin. Mark. Manag. 2018, 9, 36–43. [CrossRef]
124

Sustainability 2019, 11, 7151
60. Smith, M.K.; Sziva, I.P.; Olt, G. Overtourism and Resident Resistance in Budapest. Tour. Plan. Dev. 2019, 16,376–392. [CrossRef]
61. Higgins-Desbiolles, F.; Carnicelli, S.; Krolikowski, C.; Wijesinghe, G.; Boluk, K. Degrowing tourism: rethinkingtourism. J. Sustain. 2019. [CrossRef]
© 2019 by the authors. Licensee MDPI, Basel, Switzerland. This article is an open accessarticle distributed under the terms and conditions of the Creative Commons Attribution(CC BY) license (http://creativecommons.org/licenses/by/4.0/).
125


sustainability
Article
Visual Component of Destination Brands as a Tool forCommunicating Sustainable Tourism Offers
Anna Adamus-Matuszynska 1, Piotr Dzik 2, Jerzy Michnik 3,* and Grzegorz Polok 1
����������������
Citation: Adamus-Matuszynska, A.;
Dzik, P.; Michnik, J.; Polok, G. Visual
Component of Destination Brands as
a Tool for Communicating
Sustainable Tourism Offers.
Sustainability 2021, 13, 731.
https://doi.org/10.3390/su13020731
Received: 14 November 2020
Accepted: 9 January 2021
Published: 13 January 2021
Publisher’s Note: MDPI stays neutral
with regard to jurisdictional claims in
published maps and institutional affil-
iations.
Copyright: © 2021 by the authors.
Licensee MDPI, Basel, Switzerland.
This article is an open access article
distributed under the terms and
conditions of the Creative Commons
Attribution (CC BY) license (https://
creativecommons.org/licenses/by/
4.0/).
1 Department of Market and Marketing Research, University of Economics in Katowice, 40-287 Katowice,Poland; [email protected] (A.A.-M.); [email protected] (G.P.)
2 Faculty of Design, Academy of Fine Arts in Katowice, 40-074 Katowice, Poland; [email protected] Department of Operations Research, University of Economics in Katowice, 40-287 Katowice, Poland* Correspondence: [email protected]
Abstract: The starting point of the presented research is the theory of destination marketing, in which theconcept of destination branding is the key element. Destination branding models include the idea of visualbrand identity, which includes the logo as a crucial element. Since the 1980s, the concept of sustainabledevelopment has shaped the society and global economy, including tourism. Tourists are increasinglyguided by the analysis of the tourist area in terms of the importance of nature and the possibility ofspending free time responsibly. They look for a sustainable tourist offer. Therefore, the aim of this workis to evaluate the tourist offers of Polish territorial units in terms of visual message—logo and its content,and to examine whether they comprise design components that reveal the sustainable development of thedestination. The research method was content analysis of promotional signs. Sustainable development intourism focuses on three pillars: nature, responsible tourist activity, and the historical remains protectedin a sustainable way. The authors search for such images in the logos. In the conclusion, the authorssummarize that elements of nature and historical heritage are strongly present in the logos, which doesnot mean that the tourist offer is a balanced offer.
Keywords: destination branding; sustainable tourism; visual identity
1. Introduction
The visual components of the destinations’ brands—signatures of towns and counties(in Polish language—poviats)—were the subjects of the presented research. The authorsexamined obtainable logos and slogans (obtainable here means practiced in destinationbranding at the time of the query (from January to the end of June 2020)). The study triesto answer the following research questions:
1. What does the destination’s signature communicate the potential tourists?2. How many of these narratives communicate the sustainable development of tourist
destinations?3. How is sustainable tourism communicated in promotional signatures?
The novelty of the presented research consists of three related elements. First, theuse of a visual analysis method by analyzing the presence of design components whichare closely connected with sustainability. In social research, visual methods raise method-ological questions [1,2], and although they are used in tourism analysis [3], they still raisedoubts in academia. The authors indicate, however, that the subject of research (logo) itselfprovokes the use of visual analysis, and the method would have to be appropriate—at thesame time—for quantitative and qualitative analyses. Secondly, the study also enrichesresearch on destination branding by conducting analyses of Poland as a case study andthirdly applying an interdisciplinary approach—both elements are rare in the literature [4].The authors endeavored to investigate the relationship between destination branding and
Sustainability 2021, 13, 731. https://doi.org/10.3390/su13020731 https://www.mdpi.com/journal/sustainability
127

Sustainability 2021, 13, 731
sustainability in the visual presentation of the Polish logos. Such an effort has been suc-cessfully undertaken in other researches [5], which indicates the theoretical and practicalusefulness of such interdisciplinary approaches.
Three main concepts were the starting points for the study: (1) destination brandingas a theory of tourist promotion of a place, (2) semiotics and visual semiotics [6] as themethodology of research and (3) sustainable tourism as an industry which ensures thedevelopment of local community and natural environment and promotes human welfareand public participation in decision-making [7]. The research mostly focuses on theanalysis of visual components of the destination brands. The signature is a visual elementof the brand consisting of a logo, slogan and other additional elements such as fonts.It is the structured relationship between a logotype, brandmark, and tagline [8] thatin graphic design theory is understood as precisely defined relationships among theseelements in terms of proportion, placement, distance, colour, typeface, background control,and non-distortion (misused). As Healey stresses, the conventional solution of symbolplus wordmark is the most common form for a logo, which is expected to have formand colours [9]. The other researchers have stressed that a logo also contains additionalelements such as shape [10–12] (The authors decided not to take into account the shape(form) of the analyzed logos. There are studies showing that the shape of the logo affectsthe effectiveness of its impact [10,11]; such attempts were also made in Poland [12]. Therewas also an attempt at such an analysis with regard to sustainability [13]. However, thereare methodological concerns to these studies: they took place in controlled, laboratoryconditions, and not in a natural environment, they manipulated the shape and form of thelogo (e.g., names were removed, fonts were changed), fictitious logos were used, and thestudy groups were deliberately selected, not random.).
The aim of this work is to get knowledge about the content of promotional visual signs(signatures) which try to promote the sustainable development of a destination and at thesame time, sustainable tourism. To reach such a goal, in the process of examination, thesymbols of sustainability in the destination’s signatures were searched for by analysing them,using content analysis as the research method. The authors try to fill the gap in research ondestination branding by exploring the issue of what a signature communicates to the audience,considering only one of the contemporary perspectives, such as sustainability.
Knowledge obtained from the study has two aspects: (1) theoretical—the researchis aimed to improve the destination branding theory with the communication functionsof the visual content of signatures and (2) practical, by indicating the applied guidanceresulting from this concept.
Content analysis as a qualitative research method was chosen because it allows for theanalysis of logos and slogans contained in the promotional signs. Secondly, considering thetheory of destination branding, one may assume that a creator of the territorial signatureswants to disclose some properties important for a place, and he/she chooses such elementswhich may symbolize the most crucial and typical features of the destination and itscommunity. The results of the research may put a new perspective on understandingthe signature’s significance in destination branding. The content analysis method of theresearch is valued in such an examination because it helps to recognise what the senders(in the case of destination signatures they are local government units—LGU) want tocommunicate to the receivers—tourists and residents [14].
During the research process, the authors met a practical problem. It was difficult toseparate the creator of the signature (an author of the logo and slogan) from the sender (atransmitter of the message contained in the signature). The term ‘creator’ is understood as thegraphic designer who carries out a task delegated by the competent administrative authority.The sender is the LGU commissioning a logo for marketing purposes. Therefore, there areconsequences that affect the content of the logo. The authors in the previous research [15]concluded that there are three ways to build the visual system of a place in Poland:
128

Sustainability 2021, 13, 731
(1) Signs are created in offices, i.e., they are made by officials.(2) The client (in that case the LGU) specifies the requirements for the content of the logo
in details, what limits the creativity of the graphic designer.(3) The signs are subject to stakeholders’ consultation processes (e.g., citizens) that influ-
ence the content of the signatures.
Such a variety of signature creation methods has consequences in their content. Someof them express what governors of the territory wish to disclose, some present featureswhich are expected by the governors of the place, however they do not necessarily reflectthe specificity (genius loci of the place) of a given destination, and some are created in a long,complex, and relational process [15,16] which has an impact on identity or description ofthe promoted place.
The literature dealing with the functions of visual identification in tourism promotionis limited [17–19], and based mainly on case studies [3].
The present study enriches the existing literature by the semiotic analysis of signatures,with a special interest in symbols of sustainability, marked by the visual identification ofplaces which are aimed to promote tourism in a particular destination. The main objectiveof the research is therefore to describe the content of the signatures and indicate to whatextent this content communicates the sustainable development of a tourist destination.Choosing from the rich literature about the symbols of sustainability, the authors are awareof the limitation of participants’ observations. Considering such a subjective point of view,the researchers wanted to understand the logo phenomena genuinely and in such a waythat has an impact on recognizing visual phenomena significance in destination branding.
When examining visual signs, the authors treat them as objects inseparably linked withthe entities commissioning the logo creation (officials), and the direct authors, i.e., graphicdesigners. The research follows a humanistic mode of inquiry developed specificallyto address socially constructed phenomena [20] that assumes that the logo (a subject) isstrongly associated with the entity that created it (the author). Taking into account theabove assumptions, one may conclude that signatures communicate official images of theplaces, but not the characteristics of the community and the destination itself, which theyare supposed to represent. Considering the concept of reception, it is presumed in thepresented research that the participants in a social action are the judges of rationality (inthe case of logo design they are local governments who are senders) whose judgement islocal and necessarily relative. The audience (i.e., prospective tourists in that case) seeks amore universal rational explanation of the signatures’ content and meaning [21] (p. 172).
The structure of the article is as follows:
• Theoretical framework• Materials and methods• Results• Conclusions, including theoretical implications, managerial implications, limitations
and future research.
2. Theoretical Framework
2.1. From Destination Marketing to Destination’s Logo
Destination marketing is a relatively new subject in the professional tourism literature(Pike suggests the following definition of destination marketing: ... the process of match-ing destination resources with environment opportunities, with the wider interests of society inmind [22] (p. 27). For definitions see also [23].) The first research papers appeared in the 70s,but considerable development occurred at the beginning of the 21st century [24]. The con-cept of destination branding is even newer—the scientific studies began after 2000 [4,25,26].The first scientific conference on this topic was held in 2005 [22]. However, since then,destination branding has become a legitimate theoretical concept in scientific tourismresearch. Studies in this field indicate the multidisciplinary nature of the ‘destinations’phenomenon [27]. It should be added that destination marketing adopts many conceptsfrom so-called ‘universal marketing’. One of them is the idea of brand identity [28,29], and
129

Sustainability 2021, 13, 731
brand identity development, which is understood as the vision of how the destinationshould be perceived in the marketplace [18,30]. Many previous studies suggested that theabovementioned idea—brand identity—is the key ingredient of a brand [8,31], and—asa consequence—destination brand identity in tourism [30,32–36]. As Zavattaro clearlystates: Identity is what brand managers shape and put out to stakeholders via communicationstools, landscape design, and other elements of place making [37] (p. 29). All above cited studiesindicate that the tangible component of the brand’s identity is its visual identity, as AlinaWheeler states: Brand identity fuels recognition, amplifies differentiation, and makes big ideas andmeaning accessible [8] (p. 4). Many studies highlight that brand identity is a prerequisite forsuccessful marketing communication in business as well as in the public sector [38,39]. Thisalso applies to destination brands [40]. An indispensable condition for reliable marketingcommunication is a coherent identification of the sender—in the case of destination, it isa city, town, community, region, etc., which is why the visual signs (signatures) have acrucial impact. The place brand communicates the particular attributes of that place, andthus it gives the destination its specific meaning [41].
The authors consider a destination the basic analytical unit [22], and try to analysethe logos of destinations considering destination marketing and branding as legitimateresearch fields. Destination is a geographical space in which a cluster of tourism resourcesexists, and the tourists actively take advantage of them [18]. In order for this destinationto become a tourist attraction, it is necessary to match these resources with the interestsof tourists, which is carried out by marketing [18]. However, in view of the multitudeof marketing activities, including destination marketing, both in theory and in practice,the need to build a destination brand is emphasized as a unique combination of productcharacteristics and added values [m]. The comprehensive definition of the destinationbrand, from both the buyer and seller perspective, is proposed by Blain, Levy, Ritchie [42](p. 337). This definition incorporates the visual identity of the destination brand:
Destination branding is the set of marketing activities that (1) support the creation of aname, symbol, logo, word mark or other graphics that readily identifies and differentiates adestination; that (2) consistently convey the expectation of a memorable travel experiencethat is uniquely associated with the destination; that (3) serve to consolidate and reinforcethe emotional connection between the visitor and the destination; and that (4) reduceconsumer search costs and perceived risk. Collectively, these activities serve to create adestination image that positively influences consumer destination choice.
It must be stressed that destination branding is more complex than product or corpo-rate branding, which is why it is so difficult to define a brand message [43]. The process ofbrand building depends on the destination marketing phases which run in parallel withthe brand building process. The content of the destination brand depends on the identityof the place (genius loci) and any kind of symbols important to local stakeholders who aremore or less actively involved in the destination branding process. Taking into account theliterature on the subject matter and the cited definitions, the authors propose their ownanalytical model, which is concentrated on the sender’s perspective (Figure 1).
130

Sustainability 2021, 13, 731
Figure 1. Conceptual model of destination as a marketing invention.
Previous researches of the authors [15,44] illustrate that identity is a key componentdetermining destination marketing and branding. However, examination of the visualidentification of places is relatively rare, grounded primarily in single case studies, and theconclusions are not coherent enough [45–48]. Assuming that identity affects the image andattitudes of tourists towards the destination [22], it seems important to examine the contentof identity and—especially—visual identity as significant components of destination brandidentity. Following the analysis of Echtner [49], visual signs practiced in the tourismindustry not only denote, but also connote the place identity. The author states [49] (p. 49):
That which is a sign (namely, the associative total of a concept and an image) in the firstsystem [i.e., denotative], becomes a mere signifier in the second. Part of the semiologicalenterprise becomes moving beyond the denotated sign system to the mythical level. Such alayered view of semiotics has particular relevance to the analysis of tourism’s significationsystems, with their emphasis on denotation, myth and fantasy.
To sum up, the research approach can be operationalized as an attempt to gain aprofounder understanding the connotative meanings hidden under the denotative surface.Visual identity of destination denotates what creators want to reveal and at the same time itconnotates, in the light of culturally accepted codes, a particular meaning of the iconic signwhich is expected by the authors as a visual form of identity [50] (p. 248). As Eco stresses,the iconic sign refers not to the subject itself, but to its perceptual schema [50] (p. 136). Asignature is an iconographic code which connotes the cultural symbols of the destination.Therefore, in such a way, a logo or/and slogan might become an iconic sign that can bereproduced, quoted, or transmitted to the recipients (tourists and residents).
Many logos of Polish destinations refer to the substance (Ger. Substanz), and displaywhat the city/community has to offer to the tourists [51]. It should be added that fromthe studies on the Polish cases [15,52] two additional conclusions follow: (1) the logos of
131

Sustainability 2021, 13, 731
local government units are also destinations’ logos (creation of separate tourist brandsoccurs rarely) and (2) these logos are closer to illustrations for clarification than symbolsof reality. Logos are stories, illustrations, and narratives, which make them easier tointerpret. Studying the logo as a narrative enables extensive content analysis. The logo is astory [51], and thus it is a bearer of history, legends, tales about a place and its inhabitants(community).
2.2. From Sustainability to Sustainable Tourism
There is a systematically growing concern regarding sustainability and sustainabledevelopment both in research and business practice. The term sustainable tourism occurredwhen it was recognised that tourism should be developed in a sustainable manner [53].Since tourism has a crucial impact on economy, society, and culture, this industry can be avital factor of sustainability [54].
Tourism can be analysed as an economic activity as well as an element of sustainabledevelopment of the particular territory [55]. Sustainable development as an idea emergedin the early 90s when “Journal of Sustainable Tourism” appeared [56].
There are many definitions of sustainable tourism which vary depending on themethodological approach adopted. The concept of sustainable tourism can be interpretedas a process of tourism development [57] and/or an outcome of tourism development [58].In the classic textbook “Global Tourism”, sustainable tourism is a component of sustainabledevelopment, which consists of seven main dimensions: resource management, economicactivity, social obligation, aesthetic appeal, ecological parameters, biological diversity, andbasic life support system [59] (p. 178–179). The World Tourism Organization definessustainable tourism as tourism which leads to the management of all resources in such a way thateconomic, social, and aesthetic needs can be filled while maintaining cultural integrity, essentialecological processes, biological diversity and life support systems [60]. As Faulkner [61] stresses,sustainable tourism development is a form of tourism which protects and improves thenatural and cultural assets of the destination, the resident population quality of life, satisfiesthe tourists market, achieves a return on tourist operators, and achieves equity in thedistribution of costs and benefits of tourism between current and future generations.
Considering the above approaches to sustainable tourism, it is noticeable that gov-ernance is the key element for implementing sustainable tourism [62]. Major changes inthe governance of a place started at the beginning of globalisation and in many countries,especially after the transition from centralised to democratic countries, when marketingtools started to be introduced by self-government units to promote regions and towns astourist attractions [63]. Place branding is implemented today as a governance strategyof local government units for creating better environmental, social, and economic condi-tions [41]. As stated in the literature, the Destination Marketing Organisations (DMO)play a significant role in the sustainable management of tourism destinations [22]. Here, itshould be stressed that there is a difference between place and destination branding. Thefirst kind of branding targets all stakeholders while the second one targets tourists andresidents [14].
Despite the significance of sustainability, both inside and outside of the tourismindustry, tourism is less sustainable than ever [64]. Undoubtedly public and commer-cial interest in environmental issues and their implications did lead to an expansion inthe scope of marketing to appropriate concerns over the sustainability of resources andconsumption [65–70].
The need for a response to tourist demands and local community expectations isclearly significant for tourism as it faces increased challenges with respect to sustainabilityand its contribution to society and destination economies [71]. There are many indicatorswhich may measure the sustainability of the destination [72]. Examples include [73]:
- resource use- waste pollution- local production
132

Sustainability 2021, 13, 731
- access to basic human needs- access to facilities- freedom from violence and oppression- access to the decision-making process- diversity of natural and cultural life.
Generally, there are three main dimensions of sustainability: environmental, economicand sociocultural [74,75]. However, there are many indicators that reveal the degreeof sustainable tourism [76]. Taking into account the recommendations of sustainabledevelopment indicated by the United Nations [77], four main dimensions of sustainabilityshould be indicated: economic, environmental, cultural, and locality (the socioculturaldimension has been divided into two: cultural and locality).
For the purposes of the research, the authors followed the sustainable tourism issuescreated by Tanguay et al. [76] who also pointed out the indicators suitable to each of theissues. The issues were divided into four categories and to each of them the visual symbolswere examined in destinations’ logos.
3. Materials and Methods
An image, which could be photography, pictures, or graphics, is a part of contem-porary social life. Therefore, contemporary social sciences increasingly study images toexamine them as evidence of social illusions or hope [78]. This means that brands, in-cluding destination brands, are part of the cultural landscape, and the above-mentioneddefinitions of destination brand indicate that an important component of the brand is itsvisual identity [79].
The authors were aware of the imperfect option to make a shift from the case studiesanalysis to quantitative research. Therefore, all Polish town and county’s logos that wereused in the public space at the time of scrutiny, have been reviewed. It turned out that ofthe 380 Polish towns and counties, 183 of them used signatures in marketing practice. Allwere analysed through the use of the content analysis research method.
Content analysis is a valid research method in place branding [80,81]. Govers, Go,and Kumar suggest that in destination research “The 3-Gap Destination Image FormationModel” is applicable. As they suggest, there is a strategic gap between the projectedtourism destination image and the perceived tourism experience. However, to investigateand assess such a gap, one needs to analyse the situation from both sides, i.e., supplyand demand [82]. In the presented research the authors examine the tourist destinationpromoters.
In the case of the graphic symbol analysis practiced in promotion, the research processconsists of four stages [83] (pp. 56–66):
1. finding images—destination logos were found on official webpages, social media,and in other promotional authorised publications;
2. formulating categories for coding—coding means attaching a set of descriptive labels(or categories) to the images [83] (p.58);
3. coding the images—applying distinguished categories to destination logos;4. analysing the results—formulating conclusions and discussion of the questions.
Visual content analysis is associated with many theoretical and practical complications,especially with reliability, replicability, accuracy and methods of sample selection forresearch. Referring to these issues, the authors followed the process of reliability assessmentprepared by Neuendorf [84]: development of the coding scheme, practice coding, pilotreliability (it was done during previous researches of the authors), actual coding dataand testing a sub-sample of units. The issue of repeatability and accuracy is relatedto the selection of the sample, which is why the authors decided to work with the fullpopulation of poviats and cities with poviat status in Poland. Such research may berepeated; the only difficulty may be changes of an administrative nature (e.g., establishmentor liquidation of a poviat as an administration unit). The authors tried to accurately describe
133

Sustainability 2021, 13, 731
the research procedure, creating categories for coding and the coding process. It seemsthat the descriptions and examples contained in the article allow for the reconstructionof the research. The authors are aware of the limitations of the used research method,because it is not appropriate for research focused on the reception process [69]. However,as shown by other studies, the actions undertaken by authorities in charge of tourismhave a fundamental impact on the creation of the identity and image of the destinationbrand [85].
4. Results
Taking into account the characteristics of sustainable tourism, the following symbolshave been considered for analysis: graphical (logo), verbal (slogan), or a unification of bothlogo and slogan called a ‘slogo’ [86].
In the first stage—finding images—the authors decided to analyse the signatures of Polishtowns and counties. That is why all such units were scrutinized: 66 towns and 314 counties(The administrative division of Poland is three-tier and includes: 16 voivodships (regions),380 poviats (including 314 country [rural] poviats and 66 city-poviats) and 2477 communes).Searching on the internet, looking for documents, doing interviews with officials, and travellingacross Poland, 190 signatures were collected (see Table 1). All of them were examined toverify the symbols communicating the destination as a place of sustainable development.Using a qualitative thematic coding methodology, a categorical framework for studying logosclassification was created.
Table 1. Number of local government units (LGU) analysed.
Analysed Units TotalNumber of LGUs Practiced
Signatures in PromotionNumber of LGUs Practiced Signatures
Symbolized Sustainability of the Destination
1. Number ofanalysed units 380 190 183
2. Counties 314 134 129
3. Towns 66 56 54
Coding is the stage in the examination process that moves from the collected data toabstract categories [87]. In the process of qualitative research, codes emerge directly fromthe research [87] (p. 95). In the presented study, key words were developed on the basis ofthe literature on sustainable tourism [49,88–90], but graphics intended to be visual symbolsof these concepts emerged during the coding process as an outcome of this process. Thestrategy of the coding process involved image-by-image coding. For example, the image offlying birds was a symbol of nature in a destination. Then the collected codes were orderedaccording to previously worked out coding categories to present the data in the form ofstatistics.
Categories which represented sustainability of the tourist destination chosen to codethe logo’s content were as follows:
1. Economic sustainability:
- local business- guidelines for training and certification- sustainable tourist behaviour promotion- products diversity- ethical marketing
2. Ecologial sustainability:
- ecological processes,- biological diversity- biological resources- symbols of nature
134

Sustainability 2021, 13, 731
3. Cultural sustainability:
- cultural symbols- heritage- cultural diversity
4. Local sustainability
- local human capacity- local community symbols- indigenous people and traditional skills and jobs.
Since the year 2010, voivodship development strategies have perceived sustainabilityas the purpose of regional growth, but formerly the idea of environmental protection wasdeveloped in such strategies. That’s why, up to that year, the idea of sustainable tourismhad not been implemented in any of the documents.
The process of coding, classifying and assigning to individual categories was carriedout by the authors of the article in accordance with their knowledge, experience in logoresearches, and defined codes.
A total of 352 items have been classified; their number is greater than the number ofunits, because some signatures, due to their complexity and multielement nature, wereclassified in several items (cf. e.g., Sulecin County). The most common sustainabilitysymbols come from the cultural sustainability category, symbols of ecological sustainabilityare the second category practiced in visual promotion, the third one is local sustainability,and economic sustainability visual signs are the least popular in such LGUs activities.As Table 2 shows, the most often are symbols of nature represented, followed closelyby symbols of the past culture (heritage). The other signatures contain very diversecontent. However, it should be emphasized that those related to local culture, localcommunity, and local business are the most frequently used. What needs attention is avery poor representation of economic sustainability visual symbols. It seems that cities andcounties do not communicate in their logos any signs connected with economic activitiessupporting sustainable development. Examples of signatures in categories of sustainabilityare presented in Table 3.
Table 2. Categories symbolising sustainability in signatures of towns and counties.
No. Symbols of Sustainability—CategoriesThe Number of Signatures ContainingElements of the Given Sustainability
Percentage of AnalysedItems
Economic sustainability
1. Local business 23 6.5%
2. Guidelines for training and certification 1 0.3%
3. Sustainable tourist behaviour promotion 3 0.9%
4. Products diversity 5 1.4%
5. Ethical marketing and promotion 2 0.6%
34 9.7%
Ecological sustainability
6. Ecological processes 1 0.3%
7. Biological diversity 6 1.7%
8. Biological resources 19 5.4%
9. Symbols of nature 74 21%
10. Ecological tips for tourists 5 1.4%
105 29.8%
Cultural sustainability
11. Cultural symbols 16 4.5%
12. Heritage of the place 71 20.2%
135

Sustainability 2021, 13, 731
Table 2. Cont.
No. Symbols of Sustainability—CategoriesThe Number of Signatures ContainingElements of the Given Sustainability
Percentage of AnalysedItems
13. Cultural diversity 8 2.3%
14. Social consultation 6 1.7%
15. Local culture, local identity 23 6.5%
124 35.2%
Local sustainability
16. Local human capacity 41 11.6%
17. Local community symbols 29 8.2%
18. Indigenous people 3 0.9%
19. Local traditional skills and jobs 8 2.3%
20. Representative of the local community 8 2.3%
Total 352 100%
Table 3. Examples of signatures and their sustainably content.
Sustainability Categories Signature Remarks
Economic sustainability
The signature of Łódz
This signature has been chosen for the ‘guidelines for trainingand certification’ category. It promotes modern fonts
referring to the Władysław Strzeminski idea of a universalalphabet [91], who is one of the most famous artists living in
this city. With the slogan ‘kreuje’, what means ‘creates’,promotes the value of sustainable development, which is
creating favourable conditions for development whilemaintaining the values of the past.
Ecological sustainability
Chełmski poviat.
This signature has been chosen for the ‘biological resources’category.
The picture promotes the places referring to the birds (storks)one can observe in this poviat.
Cultural sustainabilitySiewierz community
This signature has been chosen for the ‘cultural diversity’category.
The logo discloses the characteristics of the community(nature, renaissance castle and local product—“Siewierz
bread”) and slogan adds stresses typical features ofsustainability, and slow life, it states: “No Hurry”.
Local sustainability
Koninski poviat
This signature has been chosen for the ‘local communitysymbols’ and ‘indigenous people’ categories.
It discloses a horse as a region symbol, which itself isconnected with the nature and the slogan states: “energy ofgenerations”, what specifies a feature of the citizens living
there.
In the case of a tourist offer addressed to customers from outside Poland, there is adifficulty with translation or foreign language versions of promotional slogans originallycreated in Polish (The authors would like to mention here that they conduct a research
136

Sustainability 2021, 13, 731
project on territorial branding in Poland and maintain regular contacts with LGU’s allover Poland what allows them to make such a general conclusion). Although Poland is arelatively large market for inbound tourism [92], in the case of marketing communication,the most common solution is a literal translation of the slogans from the native languageinto foreign one. There are translations that are linguistically questionable (for example“Chorzów—puts in motion”), but this does not affect the authors’ conclusions about theslogans. Untranslatable word games or puns are very rare, in such cases, promotionalmaterials, descriptions, or additional explanations are used to explain the meaning of theslogans. Such an approach, i.e., a literal translation of a slogan in Polish into e.g., English,is justified by the following premises—tourist traffic in Poland is dominated by domestictourists (80% of overnight stays), and foreign tourists’ expenses per capita are almost twiceas high as Polish tourists [92].
The Table 4 contains information about the slogans of regional capitals in Poland. It comesfrom the official identification systems that the authors received from the relevant offices.
Table 4. Slogans used by the capitals of Polish regions (voivodships).
No. Capital of the Region Slogo (Tagline) Remarks
1. Wrocław (Dolnoslaskie) The meeting place Literal translation from Polish, general tagline
2.1.
Bydgoszcz (In two regions:Kujawsko-Pomorskie and Lubuskie, the regionaladministration is, respectively, divided between
two cities: Bydgoszcz and Torun as well asGorzów and Zielona Góra)
(Kujawsko-Pomorskie)
Be our guest Literal translation from Polish, general tagline
2.2. Torun (Kujawsko-Pomorskie) No tagline The city uses a brand code built around the ideaof gothic architecture.
3. Lublin (Lubelskie) City of inspiration Literal translation from Polish, general tagline
4.1. Gorzów (Lubuskie) Haven Literal translation from Polish, general tagline
4.2. Zielona Góra (Lubuskie) No tagline
5. Łódz (Łódzkie) Creates Literal translation from Polish, general tagline
6. Kraków (Małopolskie) No tagline
7. Warszawa (Mazowieckie) Fall in love with Warsaw Literal translation from Polish, general tagline
8. Opole (Opolskie) “Przebojowe”“Hit”, i.e., popular, known, liked. It refers to the
Polish song festivals. The logo can be usedwithout a tagline
9. Rzeszów (Podkarpackie) Capital of innovation Literal translation from Polish, general tagline
10. Białystok (Podlaskie) No tagline Until the end of 2019, the slogan “RisingBiałystok” was used
11. Gdansk (Pomorskie) City of freedom Literal translation from Polish, general tagline
12. Katowice (Slaskie) For a change Literal translation from Polish, general tagline
13. Kielce (Swietokrzyskie) No tagline The work on a new visual identification isunderway, to be completed in 2021.
14. Olsztyn (Warminsko-Mazurskie) “O!gród z natury”Slogan only in Polish, untranslatable due to the
play on words: garden and ‘castle’(archaic—city) and the use of a diacritical sign.
15. Poznan (Wielkopolskie) No tagline
16. Szczecin (Zachodniopomorskie) Floating garden Tagline in English only
5. Conclusions
Half of the surveyed local government units use visual signs, such as the logos in theirpromotional activities, and most of them communicate symbols representing the values ofsustainable development. The quantitative analysis shows that local governments denotatemostly nature and cultural heritage in visual messages addressed to visitors and residents.
137

Sustainability 2021, 13, 731
Therefore, every fifth LGU recognizes nature as a symbol that denotes destination. Fewerdestinations reveal their cultural past in visual signs, which means that the nature andtraditional culture are expected to be recognised by the recipients of LGU visual messages.The local government units are also relatively attached to local values, which are presentedin promotional signs. Especially important, disclosed by 10% of LGUs, is local humancapacity.
5.1. Theoretical Implications
The paper contributes to an understanding of logos functions in promoting sustainabletourism. LGUs, revealing the elements of sustainable development, consciously communi-cate features of a given destination associated with elements of sustainable development.They present themselves to the visitors as places friendly to sustainable development,caring for natural and historical heritage. However, it should be emphasised that ethicaland economic categories, which are the principal features of sustainability, are marginallypresented in the examined signatures.
When analysing the logo content of the Polish cities and counties, and consideringa semiotic analysis, it should be emphasized that although nature and culture, which areimportant elements of sustainable development, are strongly represented, the connotationwill be different. The iconic symbols of nature and traditional cultural objects, in the lightof the contemporary expectations of the audience, would rather connote tradition, the past,and even conservatism.
Sustainable development, including sustainable tourism, is a symbol of the present,postmodernity, and in essence, is an idea directed towards the sustainable future. ThePolish destinations’ signatures do not have such features. Therefore, the denotation isdifferent from the connotation of these messages. The recipient receives the image of atraditional country that cares about nature and culture, but cannot identify the relationshipbetween the Polish culture and nature with the economy, which, in accordance with theconcept of sustainable development, should reveal symbols that allow us to think about afuture reality similar to the current one. It is known from the researches that tourism hasalready shifted from traditional tourism to sustainable tourism and tourists might expectsymbols clearly connected with economic and local sustainability, which in the examinedsignatures are poorly represented.
Indication, through consistent visual identification, of the sustainable type of a touristoffer has, from the point of view of DMO, at least two features:
1. Such visual identification may build relationships with the local (host) community.2. It also may perform a sort of selective role in target markets.
From the communication point of view, the second feature is more important. The formof the offer itself automatically selects interested visitors for those looking for sustainableoffers and not. The form of the message itself can tell who the desired customer is.
5.2. Managerial Implications
Research has shown that several sustainability indicators are significantly more nu-merous than others. They are symbols of nature (74), heritage of place (71), and localhuman capacity (41). It is commonly accepted that there are two primary goals in creatingand managing a brand identity—description and distinction [93]. If so, many signs referto the same symbols; distinguishing them can be difficult as they do not fulfill one of thebasic marketing functions. Other studies, at least in the case of Poland, also indicate thatthe visual content is relatively poor and more or less literally represent things such as thesun, water, and greenery [94].
5.3. Discussion and Limitations
Although the authors made every effort to gather all signatures, the collected signaturedatabase is still incomplete. For example, there are logos that can be found on websites,but the lack of documentation makes it impossible to qualify (authors have found at least
138

Sustainability 2021, 13, 731
three such cases). The second reason why the database is incomplete is the variabilityof logos practiced in the management of cities and regions in Poland. Signatures arewithdrawn, modified, or replaced by new ones, without official announcement. The imageof the place presented by the signatures could change if you take into account the so-calledinvestment signatures (e.g., logos created to encourage investors to invest in a particularplace). However, this requires separate data collection methods as the sources are notwidely available.
Another difficulty that limits the presented research is related to the relationshipbetween the destination signature and the logo of the office (LGU administration of thisdestination) that holds the power in that destination. Moreover, there is also the difficultyof implementing visual identity for a particular destination. The process of developmentand implementation is very long, and the multitude of management procedures resultingfrom national law make it difficult. Multiple identification breaks down the uniformity ofthe brand, an issue noticed also by other researchers [51].
There is a question about the impact of logos and slogans on tourist’s perception.Do they influence tourists’ decisions, and if so—how effectively? Since the paper doesnot concern research on the reception of advertising messages, one can only indicate thedirection of further research. Firstly, there are extensive analyses of territorial promotionalslogans in Poland, which enable comparative research [95,96]. Secondly, practitionersemphasize the importance of the quality of slogans. Steve Cone, for example, emphasizesthat official tourist slogans are “shallow and boring” [97]. Thirdly, this quality shouldbe assessed not only in terms of logo content, but also the form, i.e., the impact on thereception of such elements as: shape, colour, fonts or unusual graphic solutions in theslogan (vide Szczecin “Floating garden”). As Gałkowski stresses [98] “The effectiveness ofa slogan consists of a number of factors, also nonformal and nonintentional. The success ofits use also depends on the cultural conditions”.
Therefore, the additional question arises of how to promote tourism when there is nouniformity in legal regulations and in governing the destination. For example, there aretwo types of communication: (1) formal—official communication practiced by a given LGU,which informs what activities in the field of sustainable development a town or regionundertakes, and what the attitudes of the inhabitants toward sustainable tourism are, and(2) advertising communication that uses rhetorical artifices, which often allow for freeinterpretation of the message. This freedom in reading the content of the signatures as avisual identity is limited and even imposed by the verbal text—a slogan that specifies whatthe signature is about. As Eco wrote, there can be either concordance or incompatibility [50].An image with a significant aesthetic function is accompanied by a slogan with an emotivefunction, or an image with a metaphorical structure is accompanied by a slogan with ametonymic structure. There could be a very business-like logo, but the slogan contradictsits content, as an example.
The results reported here add to the existing literature in the field data which showhow signatures may promote a particular idea, in this case sustainable tourism. However,the results show that what is communicated in the signature content may have a completelydifferent meaning for the recipient of the message. Natural, historical or cultural symbolsdo not imply that a destination is oriented towards sustainable tourism. According tothe semiotics, the denotation of a sign may connote the opposite meaning. The fact thatnature is promoted in the logo does not mean that it is properly protected in the promotedterritory. Showing cultural goods in the visual promotion of the destination does not meanthat they are valuable in the life of the local community.
5.4. Future Research
Further research should concern the recipient’s perspective. Knowing the contentof signatures covering sustainable symbols does not mean that this content is perceivedby recipients. The researches presented so far [3,99,100] mainly focused on case studies,including in the case of Poland.
139

Sustainability 2021, 13, 731
Understanding tourists’ perception as to whether a particular destination supportssustainability is critical, especially today, during the COVID-19 pandemic [101]. However,such an issue is the subject of comprehensive research focused on the audience.
An important research direction may be the analysis of the inhabitants’ identificationwith the values of sustainable development. It can be assumed that the stronger theidentification with these values, the stronger the acceptance of the visual expression of thespecificity of a place as attractive due to these values.
Author Contributions: Conceptualization, P.D. and A.A.-M.; methodology, A.A.-M.; validation, J.M.and G.P.; formal analysis, J.M. and P.D; resources, P.D.; data curation, P.D.; writing—original draftpreparation, A.A.-M.; writing—review and editing, J.M.; visualization, J.M.; supervision, G.P.; projectadministration, G.P.; funding acquisition, A.A.-M. All authors have read and agreed to the publishedversion of the manuscript.
Funding: This research received no external funding.
Institutional Review Board Statement: not applicable.
Informed Consent Statement: not applicable.
Data Availability Statement: Data available in a publicly accessible repository that does not issue DOIs.
Conflicts of Interest: The authors declare no conflict of interest.
References
1. Pauwels, L. Urban Communication Research|Visually Researching and Communicating the City: A Systematic Assessment ofMethods and Resources. Int. J. Commun. 2016, 10, 22.
2. Pauwels, L. Conceptualising the ‘Visual Essay’ as a Way of Generating and Imparting Sociological Insight: Issues, Formats andRealisations. Sociol. Res. Online 2012, 17, 76–86. [CrossRef]
3. Burns, P.M.; Palmer, C.; Lester, J.-A.M. (Eds.) Tourism and Visual Culture, 1st ed.; CABI: Oxfordshire, UK; Cambridge, MA, USA,2010; ISBN 978-1-84593-609-9.
4. Ruiz-Real, J.L.; Uribe-Toril, J.; Gázquez-Abad, J.C. Destination branding: Opportunities and new challenges. J. Destin. Mark.Manag. 2020, 17, 100453. [CrossRef]
5. Paganoni, M. City Branding and New Media: Linguistic Perspectives, Discursive Strategies and Multimodality; Palgrave Macmillan:London, UK, 2015; ISBN 978-1-137-38795-0.
6. Dunleavy, D. Visual Semiotics Theory: Introduction to the Science of Signs. In Handbook of Visual Communication. Theory, Methods,and Media; Josephson, S., Kelly, J.D., Smith, K., Eds.; Routledge: Abingdon, UK, 2020; pp. 155–170.
7. Bramwell, B. Theoretical activity in sustainable tourism research. Ann. Tour. Res. 2015, 54, 204–218. [CrossRef]8. Wheeler, A. Designing Brand Identity: An Essential Guide for the Whole Branding Team, 5th ed.; Wiley: Hoboken, NJ, USA, 2017;
ISBN 978-1-118-98082-8.9. Healey, M. Deconstructing Logo Design: 300+ International Logos Analysed and Explained by Matthew Healey; Rotovision: Brighton,
UK, 2010.10. Henderson, P.W.; Cote, J.A. Guidelines for Selecting or Modifying Logos. J. Mark. 1998, 62, 14–30. [CrossRef]11. Van Der Lans, R.; Cote, J.A.; Cole, C.A.; Leong, S.M.; Smidts, A.; Henderson, P.W.; Bluemelhuber, C.; Bottomley, P.A.; Doyle, J.R.;
Fedorikhin, A.; et al. Cross-National Logo Evaluation Analysis: An Individual-Level Approach. Mark. Sci. 2009, 28, 968–985.[CrossRef]
12. Walas, B. Znaczenie Logo Miast w Rozpoznawalnosci Miejsca Docelowego. Studia Oeconomica Posnaniensia 2014, 2, 264.13. Xu, L.; Yu, F.; Ding, X. Circular-Looking Makes Green-Buying: How Brand Logo Shapes Influence Green Consumption.
Sustainability 2020, 12, 1791. [CrossRef]14. Zenker, S.; Braun, E.; Petersen, S. Branding the destination versus the place: The effects of brand complexity and identification for
residents and visitors. Tour. Manag. 2017, 58, 15–27. [CrossRef]15. Adamus-Matuszynska, A.; Dzik, P. Tozsamosc Wizualna Polskich Województw, Miast i Powiatów. Identyfikacja, Prezentacja, Znaczenie;
Wydawnictwo Adam Marszałek: Torun, Poland, 2017; ISBN 978-83-8019-602-5.16. Johnston, K.A. Community Engagement: Exploring a Relational Approach to Consultation and Collaborative Practice in Australia.
J. Promot. Manag. 2010, 16, 217–234. [CrossRef]17. Pike, S. Destination brand positions of a competitive set of near-home destinations. Tour. Manag. 2009, 30, 857–866. [CrossRef]18. Pike, S.; Page, S.J. Destination Marketing Organizations and destination marketing: A narrative analysis of the literature.
Tour. Manag. 2014, 41, 202–227. [CrossRef]19. Belkadi, E. City Branding: Proposal of an Observation and Analysis Grid. In Strategic Innovative Marketing and Tourism; Springer:
Cham, Switzerland, 2020; pp. 121–128. ISBN 978-3-030-36125-9.
140

Sustainability 2021, 13, 731
20. Hirschman, E.C. Humanistic Inquiry in Marketing Research: Philosophy, Method, and Criteria. J. Mark. Res. 1986, 23, 237.[CrossRef]
21. Pizzorno, A. Rationality and recognition. In Approaches and Methodologies in the Social Sciences: A Pluralist Perspective; Della Porta,D., Keating, M., Eds.; Cambridge University Press: Cambridge, UK, 2008; pp. 162–174. ISBN 978-0-521-88322-1.
22. Pike, S. Destination Marketing: An Integrated Marketing Communication Approach; Routledge: Abingdon, UK, 2008; ISBN 978-0-7506-8649-5.
23. Leiper, N. The framework of tourism: Towards a definition of tourism, tourist, and the tourist industry. Ann. Tour. Res. 1979,6, 390–407. [CrossRef]
24. Morrison, A.M. Destination Management and Destination Marketing: The Platform for Excellence in Tourism Destinations.Tour. Rev. 2013, 28, 6–9.
25. Morgan, N.; Pritchard, A.; Pride, R. (Eds.) Destination Branding: Creating the Unique Destination Proposition; Routledge: Abingdon,UK, 2004; ISBN 978-0-7506-5969-7.
26. Kasapi, I.; Cela, A. Destination Branding: A Review of the City Branding Literature. Mediterr. J. Soc. Sci. 2017, 8, 129–142.[CrossRef]
27. Hankinson, G. The management of destination brands: Five guiding principles based on recent developments in corporatebranding theory. J. Brand Manag. 2007, 14, 240–254. [CrossRef]
28. Pike, S. Tourism destination branding complexity. J. Prod. Brand Manag. 2005, 14, 258–259. [CrossRef]29. Morgan, N.; Pritchard, A. Meeting the destination branding challenge. In Destination Branding: Creating the Unique Destination
Proposition; Morgan, N., Pritchard, A., Pride, R., Eds.; Routledge: Abingdon, UK, 2004; pp. 59–78. ISBN 978-0-7506-5969-7.30. Cai, L.A. Cooperative branding for rural destinations. Ann. Tour. Res. 2002, 29, 720–742. [CrossRef]31. Kapferer, J.-N. The New Strategic Brand Management: Advanced Insights and Strategic Thinking; Kogan Page: London, UK; Philadel-
phia, PA, USA, 2008; ISBN 978-0-7494-6515-5.32. Balakrishnan, M.S. Strategic branding of destinations: A framework. Eur. J. Mark. 2009, 43, 611–629. [CrossRef]33. Florek, M. Podstawy Marketingu Terytorialnego; Wydawnictwo Uniwersytetu Ekonomicznego w Poznaniu: Poznan, Poland, 2013;
ISBN 978-83-7417-727-6.34. Nandan, S. An exploration of the brand identity–brand image linkage: A communications perspective. J. Brand Manag. 2005,
12, 264–278. [CrossRef]35. Konecnik Ruzzier, M. Country brand and identity issues: Slovenia. In Destination Brands; Morgan, N., Pritchard, A., Pride, R., Eds.;
Routledge: Abingdon, UK, 2012; ISBN 978-1-136-34663-7.36. Çınar, K. Customer Based Brand Equity Models in Hotel Industry: A Literature Review. In Strategic Innovative Marketing and
Tourism; Springer: Berlin, Germany, 2020; pp. 281–288. ISBN 978-3-030-36125-9.37. Zavattaro, S. Place Branding through Phases of the Image: Balancing Image and Substance. Palgrave Macmillan: New York, NY,
USA, 2014; ISBN 978-1-137-39443-9.38. Pasquier, M.; Villeneuve, J.-P. Marketing Management and Communications in the Public Sector; Routledge: Abingdon, UK, 2012;
ISBN 978-1-136-50459-4.39. Percy, L. Strategic Integrated Marketing Communication: Theory and Practice; Routledge: Abingdon, UK, 2008; ISBN 978-0-7506-7980-
0.40. Marczak, M. Branding as an Essential Element of the of Destination Management Process Using the Example of Selected States.
Manag. Sci. Nauk. Zarzadzaniu 2018, 23, 29–40. [CrossRef]41. Kiryluk, H.; Glinska, E.; Barkun, Y. Benefits and barriers to cooperation in the process of building a place’s brand: Perspective of
tourist region stakeholders in Poland. Oeconomia Copernic. 2020, 11, 289–307. [CrossRef]42. Blain, C.; Levy, S.E.; Ritchie, J.R.B. Destination Branding: Insights and Practices from Destination Management Organizations.
J. Travel Res. 2005, 43, 328–338. [CrossRef]43. Sartori, A.; Mottironi, C.; Corigliano, M.A. Tourist destination brand equity and internal stakeholders: An Empirical Research.
J. Vacat. Mark. 2012, 18, 327–340. [CrossRef]44. Adamus-Matuszynska, A.; Dzik, P. Measurement of Local Government Unit Marketing Orientation. Studia Ekon. 2017,
336, 172–182.45. Konecnik Ruzzier, M.; Petek, N. Country Brand I Feel Slovenia:First Response from Locals. Econ. Res. Ekon. Istraživanja 2012,
25, 465–484. [CrossRef]46. Francesconi, S. Reading Tourism Texts: A Multimodal Analysis; Channel View Publications: Bristol, UK, 2014; ISBN 978-1-84541-428-
3.47. Barisic, P.; Blazevic, Z. Visual Identity Components of Tourist Destination. World Acad. Sci. Eng. Technol. Int. J. Soc. Behav. Educ.
Econ. Manag. Eng. 2014, 8. [CrossRef]48. Kladou, S.; Kavaratzis, M.; Rigopoulou, I.; Salonika, E. The role of brand elements in destination branding. J. Destin. Mark. Manag.
2017, 6, 426–435. [CrossRef]49. Echtner, C.M. The semiotic paradigm: Implications for tourism research. Tour. Manag. 1999, 20, 47–57. [CrossRef]50. Eco, U. La Struttura Assente: La Ricerca Semiotica e il Metodo Strutturale; Casa Editrice Valentino Bompiani & C.: Milano, Italy, 2016.
(In Polish)51. Beyrow, M.; Vogt, C. Städte und Ihre Zeichen: Identität, Strategie, Logo; Avedition: Stuttgart, Germany, 2014; ISBN 978-3-89986-202-7.
141

Sustainability 2021, 13, 731
52. Kozak, M. Turystyka i Polityka Turystyczna a Rozwój: Miedzy Starym a Nowym Paradygmatem; Wydawnictwo Naukowe Scholar:Warsaw, Poland, 2009.
53. Lee, K.F. Sustainable tourism destinations: The importance of cleaner production. J. Clean. Prod. 2001, 9, 313–323. [CrossRef]54. Nguyen, T.Q.T.; Young, T.; Johnson, P.; Wearing, S. Conceptualising networks in sustainable tourism development.
Tour. Manag. Perspect. 2019, 32, 100575. [CrossRef]55. Sharpley, R. Tourism and Sustainable Development: Exploring the Theoretical Divide. J. Sustain. Tour. 2000, 8, 1–19. [CrossRef]56. Bramwell, B.; Higham, J.; Lane, B.; Miller, G. Twenty-five years of sustainable tourism and the Journal of Sustainable Tourism:
Looking back and moving forward. J. Sustain. Tour. 2017, 25, 1–9. [CrossRef]57. Williams, A.M. Mobilities and sustainable tourism: Path-creating or path-dependent relationships? J. Sustain. Tour. 2013,
21, 511–531. [CrossRef]58. Berno, T.; Bricker, K. Sustainable Tourism Development: The Long Road from Theory to Practice. Int. J. Econ. Dev. 2001, 3, 1–18.59. Murphy, P.E.; Price, G.G. Chapter 9—Tourism and sustainable development. In Global Tourism (Third Edition); Theobald, W.F., Ed.;
Butterworth-Heinemann: Boston, MA, USA, 2005; pp. 167–193. ISBN 978-0-7506-7789-9.60. World Tourism Organization (UNWTO) (Ed.) UNWTO Tourism Highlights, 2002 Edition; World Tourism Organization (UNWTO):
Madrid, Spain, 2002; ISBN 978-92-844-0687-6.61. Faulkner, B. Chapter 15. Destination Australia: A Reseach Agenda for 2002 and Beyond; Channel View Publications: Bristol, UK, 2003;
pp. 341–357. ISBN 978-1-873150-49-8.62. Bramwell, B.; Lane, B. Critical research on the governance of tourism and sustainability. J. Sustain. Tour. 2011, 19, 411–421.
[CrossRef]63. Bramwell, B.; Meyer, D. Power and tourism policy relations in transition. Ann. Tour. Res. 2007, 34, 766–788. [CrossRef]64. Hall, C.M. A typology of governance and its implications for tourism policy analysis. J. Sustain. Tour. 2011, 19, 437–457. [CrossRef]65. Peattie, K. Green Marketing; Pitman: New York, NY, USA, 1992; ISBN 978-0-7121-0843-0.66. Coddington, W.; Florian, P. Environmental Marketing: Positive Strategies for Reaching the Green Consumer; McGraw-Hill: New York,
NY, USA, 1993; ISBN 978-0-07-011599-6.67. van Dam, Y.K.; Apeldoorn, P.A.C. Sustainable Marketing. J. Macromarketing 1996, 16, 45–56.68. Crane, A. Marketing and the Natural Environment: What Role for Morality? J. Macromarketing 2016. [CrossRef]69. Dolan, P. The Sustainability of “Sustainable Consumption. ” J. Macromarketing 2002, 22, 170–181. [CrossRef]70. Hunt, S.D. Toward the Institutionalization of Macromarketing: Sustainable Enterprise, Sustainable Marketing, Sustainable
Development, and the Sustainable Society. J. Macromarketing 2012, 32, 404–411. [CrossRef]71. Hall, C. Tourism and Social Marketing; Routledge: Abingdon, UK, 2014; ISBN 978-0-415-57665-9.72. Mowforth, M.; Munt, I. Tourism and Sustainability: Development, Globalisation and New Tourism in the Third World, 3rd ed.; Routledge:
London, UK; New York, NY, USA, 2008; ISBN 978-0-415-41403-6.73. Conaghan, D.; Hanrahan, J.; McLoughlin, E. The Sustainable Management of a Tourism Destination in Ireland: A Focus on
County Clare. Adv. Hosp. Tour. Res. 2015, 3, 62–87.74. Ooi, N.; Laing, J.H. Backpacker tourism: Sustainable and purposeful? Investigating the overlap between backpacker tourism and
volunteer tourism motivations. J. Sustain. Tour. 2010, 18, 191–206. [CrossRef]75. Aydın, B.; Alvarez, M.D. Understanding the Tourists’ Perspective of Sustainability in Cultural Tourist Destinations. Sustainability
2020, 12, 8846. [CrossRef]76. Tanguay, G.; Rajaonson, J.; Therrien, M.-C. Sustainable Tourism Indicators: Selection Criteria for Policy Implementation and
Scientific Recognition. J. Sustain. Tour. 2012, 21. [CrossRef]77. Agenda 21 for the Travel & Tourism Industry. 1997. Available online: https://www.e-unwto.org/doi/book/10.18111/978928440
3714 (accessed on 10 January 2021).78. Magala, S. Antropologia wizualna. In Badania Jakosciowe. Podejscia i Teorie; Jemielniak, D., Ed.; Wydawnictwo Naukowe PWN:
Warsaw, Poland, 2012.79. Schroeder, J.; Salzer-Morling, M.S. Introduction: The Cultural Codes of Branding. In Brand Culture; Schroeder, J., Salzer-Morling,
M.S., Eds.; Routledge: Abingdon, UK, 2006; ISBN 978-0-203-00244-5.80. Govers, R.; Go, F. Place Branding: Glocal, Virtual and Physical Identities, Constructed, Imagined and Experienced; Palgrave Macmillan
UK: London, UK, 2009; ISBN 978-0-230-23073-6.81. Hashim, A.R. Urban design and the entrepreneurial city: Place branding theory and methods. In Advertising and Branding:
Concepts, Methodologies, Tools, and Applications; IGI Global: Hershey, PA, USA, 2017; pp. 204–227.82. Govers, R.; Go, F.M.; Kumar, K. Promoting Tourism Destination Image. J. Travel Res. 2007, 46, 15–23. [CrossRef]83. Rose, G. Visual Methodologies: An Introduction to Researching with Visual Materials; SAGE: Thousand Oaks, CA, USA, 2016;
ISBN 978-1-4739-6791-5.84. Neuendorf, K.A. Reliability for Content Analysis. In Media Messages and Public Health: A Decisions Approach to Content Anal-
ysis; Jordan, A., Kunkel, D., Manganello, J., Fishbein, M., Eds.; Routledge Taylor & Francis Group: Abingdon, UK, 2008;ISBN 978-0-203-88734-9.
85. Dymond, S.J. Indicators of Sustainable Tourism in New Zealand: A Local Government Perspective. J. Sustain. Tour. 1997,5, 279–293. [CrossRef]
86. Kochan, M. Slogany w Reklamie i Polityce; Trio: Warsaw, Poland, 2005; ISBN 978-83-88542-35-0.
142

Sustainability 2021, 13, 731
87. Glinka, B.; Hensel, P. Teoria ugruntowana. In Badania Jakosciowe. PODEJSCIA i Teorie; Jemielniak, D., Ed.; Wydawnictwo NaukowePWN: Warsaw, Poland, 2012.
88. Shafiee, S.; Rajabzadeh Ghatari, A.; Hasanzadeh, A.; Jahanyan, S. Developing a model for sustainable smart tourism destinations:A systematic review. Tour. Manag. Perspect. 2019, 31, 287–300. [CrossRef]
89. Lane, B. Will sustainable tourism research be sustainable in the future? An opinion piece. Tour. Manag. Perspect. 2018, 25, 161–164.[CrossRef]
90. Northcote, J.; Macbeth, J. Conceptualizing Yield: Sustainable Tourism Management. Ann. Tour. Res. 2006, 33, 199–220. [CrossRef]91. Szydłowska, A.; MIsiak, M. Paneuropa, Kometa, Hel: Szkice z Historii Projektowania Liter w Polsce; Karakter: Kraków, Poland, 2015.92. Czernicki, Ł.; Kukołowicz, P. Maciej Miniszewski. In Branza Turystycznaw Polsce. Obraz Sprzed Pandemii; Polski Instytut
Ekonomiczny: Warszawa, Poland, 2020.93. Mollerup, P. Marks of Excellence: The Development and Taxonomy of Trademarks Revised and Expanded Edition, 2nd ed.; Phaidon Press:
London, UK, 2013; ISBN 978-0-7148-6474-7.94. Adamus-Matuszynska, A.; Dzik, P. Logo w Komunikacji Marketingowej Samorzadu Terytorialnego. Mark. Rynek 2017, 10, 26–42.95. Jedrzejczak, B. Słownik Sloganów Reklamujacych Polskie Marki Terytorialne; Wydawnictwo Uniwersytetu Gdanskiego: Gdansk,
Poland, 2018; Volume 1.96. Jedrzejczak, B. Jezykowe Srodki Perswazji w Sloganach Reklamujacych Polskie Marki Terytorialne Na Przykładzie Haseł Promujacych
Polske, Województwa i Miasta Wojewódzkie; Wydawnictwo Uniwersytetu Gdanskiego: Gdansk, Poland, 2020.97. Cone, S. Superslogany. Słowa, Które Zdobywaja Klientów i Zwolenników, a Nawet Zmieniaja Bieg Historii; Wolters Kluwer Polska:
Warsaw, Poland, 2010.98. Gałkowski, A. Hasła Reklamowe Miast Polskich w Kontekscie Urbonomicznym. Rozprawy Komisji Jezykowej ŁTN 2014, 67–79.
Available online: http://cejsh.icm.edu.pl/cejsh/element/bwmeta1.element.desklight-3082afe9-1b8c-4b32-9bd8-bda19da835fa(accessed on 5 January 2021).
99. Van, H.T.; Huu, A.T.; Ushakov, D. Destination Branding as a Tool for Sustainable Tourism Development (The Case of Bangkok,Thailand). Adv. Sci. Lett. 2018, 24, 6339–6342. [CrossRef]
100. Florek, M.; Insch, A.; Gnoth, J. City Council websites as a means of place brand identity communication. Place Brand. 2006,2, 276–296. [CrossRef]
101. Lima Santos, L.; Cardoso, L.; Araújo-Vila, N.; Fraiz-Brea, J.A. Sustainability Perceptions in Tourism and Hospitality: A Mixed-Method Bibliometric Approach. Sustainability 2020, 12, 8852. [CrossRef]
143


sustainability
Article
Tourism Development in Post-Industrial Facilities as a RegionalBusiness Model
Marek Józwiak * and Patrycja Sieg
����������������
Citation: Józwiak, M.; Sieg, P.
Tourism Development in
Post-Industrial Facilities as a Regional
Business Model. Sustainability 2021,
13, 2028. https://doi.org/10.3390/
su13042028
Academic Editors: Marc A. Rosen
and Adam R. Szromek
Received: 21 December 2020
Accepted: 5 February 2021
Published: 13 February 2021
Publisher’s Note: MDPI stays neutral
with regard to jurisdictional claims in
published maps and institutional affil-
iations.
Copyright: © 2021 by the authors.
Licensee MDPI, Basel, Switzerland.
This article is an open access article
distributed under the terms and
conditions of the Creative Commons
Attribution (CC BY) license (https://
creativecommons.org/licenses/by/
4.0/).
Department of Organizational Innovation Management, Faculty of Management, UTP University of Science andTechnology in Bydgoszcz, 430 Fordonska St, 85-790 Bydgoszcz, Poland; [email protected]* Correspondence: [email protected]
Abstract: In the article presented, the authors have attempted to define the development of post-industrial facilities, on the example of a thematic trail located in Bydgoszcz, as well as to assess theimpact of this route on the city’s attractiveness. The TeH2O thematic trail is an example of a businessmodel that utilizes post-industrial facilities for the development of a business partnership betweenthe route facilities, the objects located in the vicinity, as well as the route participants. The articlediscusses the use of post-industrial facilities for tourist purposes and the legal aspects associated withthe process of transforming such facilities. This paper presents the results of a research carried outon two groups of respondents, i.e., the residents of the city of Bydgoszcz and the tourists who havevisited or are about to visit the city of Bydgoszcz. As a result of the research carried out, it has beenfound that the thematic trail examined affects the attractiveness of the city of Bydgoszcz. Both therespondents from the city of Bydgoszcz as well as the tourists visiting the city acknowledged it. TheTeH2O thematic trail is more popular among the inhabitants of Bydgoszcz than among the visitors.
Keywords: business models; industrial tourism; post-industrial facilities; TeH2O Industrial ThemedTrail
1. Introduction
Industrialization of Europe contributed to the formation of generations. Such in-ventions as the steam engine, electricity, and medical progress have shaped the worldto its present state, which we know today. Nevertheless, the rather rapid and intensiveeconomic and industrial growth as well as the exploitation of natural resources contributedto changes in many areas and infrastructure, turning them into degraded, desolate land,impacting the natural environment significantly. The landscapes of natural regions hadbeen completely changed, and the remains of the industrial period became a difficultproblem to solve.
Owing to the development of industrial tourism, and above all, sustainable tourism,post-industrial facilities get new life [1]. The idea of sustainable development replacesthe emphasis on finding a perfect solution with the use of tangible and intangible values,which is important from the perspective of social life and would be lost if no activitieshave been undertaken [2]. Therefore, the process of changing post-industrial buildings intotourist facilities, including tourist trails, is related to the design of sustainable developmentmodels as well as business models [3].
An increased interest in industrial tourism has been noticed in the past decade. Thistrend is seen both in Europe and Poland. Industrial tourism becomes one of the best formsof promoting the tourist and cultural potential of a specific region, area, or city [4].
The purpose of this article is to determine the development of post-industrial facilitiesbased on the TeH2O Industrial Themed Trail in Bydgoszcz serving as an example ofindustrial tourism and its impact on city attractiveness. It additionally indicates a businessmodel that is based on resource utilization, in the form of industrial tourist trail landmarks.
Sustainability 2021, 13, 2028. https://doi.org/10.3390/su13042028 https://www.mdpi.com/journal/sustainability
145

Sustainability 2021, 13, 2028
In order to achieve these goals, it was necessary to conduct an analysis of the state ofknowledge, the technology and the terminology related to development of post-industrialfacilities, as to explain the role they play in contemporary tourism and discuss the topic ofbusiness models. The most important issue was to conduct a survey among the Bydgoszczresidents and visitors, in order to determine the impact that the development of post-industrial buildings has on the city’s attractiveness.
Development of post-industrial facilities for the purposes of industrial tourism be-comes increasingly popular. Such activity allows for the protection of historic landmarks,equipping them with new roles, providing creative impact on the life of local residents, andfacilitating development of new business models. All the advantages arising from heritagesite revitalization contribute to the increasing number of industrial tourism advocates.Through their educational, historical, and creative character these sites become increasinglyattractive to present-day tourists. One additional advantage of developed post-industrialfacilities is the fact that they promote the locations, in which they are featured. In this way,they make the current industrial cities more interesting [5]. A similar process can be seenin Bydgoszcz, where owing to the presence of the TeH2O Water, Industry and Craft Trail,the city’s tourist attractiveness has considerably increased. The trail mentioned attracts agrowing number of tourists from outside the city, who are interested in industrial tourism.Developed post-industrial facilities also provide important information about the regionwhich they represent, raising interest among their visitors.
The trail’s full name is the TeH2O Water, Industry and Craft Trail. For the purposeof this article, the authors will also use other names in reference to the trail: TeH2OTrail, TeH2O Industrial Thematic Trail in Bydgoszcz, TeH2O Thematic Trail, TeH2O Water,Industry and Craft Trail.
The TeH2O Water, Industry and Craft Trail in Bydgoszcz encompasses the followingcity heritage sites: The Exploseum, the Granaries on the Brda River, the Mill Island, theBydgoszcz Canal, the Museum of Soap and the Dirt History, Water Tower, the Museumof Photography, the Bydgoszcz Beer Brewery, the “Pod Łabedziem” Pharmacy, the Wa-ter Supply Pump Hall, the Bookbinding Workshop, the Former municipal gas works,Woodworking Factory, the “Lemara” Barge, the Museum of the Bydgoszcz Canal [6].
The TeH2O thematic trail was established as a result of the SHIFT-X project co-financedby the European Regional Development Fund and joined by the city of Bydgoszcz. TheBydgoszcz City Hall is thus the originator and the founder of the TeH2O Trail. Since 2016,the trail has been administered by the Leon Wyczółkowski District Museum, with only oneperson employed at the Department of Education and Promotion as the route coordinator.
The person responsible for the operation of the trail on behalf of the Leon WyczółkowskiDistrict Museum is the Coordinator of the TeH2O Water, Industry and Craft Trail in Byd-goszcz. The coordinator’s main tasks include, inter alia, the following [7]:
• Representation of the entities operating as part of the trial in contacts with thirdparties;
• Promotion and provision of information about the trail offer on behalf of all partners,development and implementation of promotional activities;
• Implementation of all activities within the trial structure, i.e., communication betweenentities, development of a permanent offer as well as the issues related to customerservice and tourism-related infrastructure, etc.
One important element of the trail’s functioning entails its support for the BydgoszczCity Hall, which makes annual budget decisions and can issue recommendations forthe Leon Wyczółkowski Distric Muesum regarding the functioning of the TeH2O Trail.The functioning of the trail is also assisted by the Bydgoszcz Information Center andthe Kujawsko-Pomorska Organizacja Turystyczna (a tourist organization). The resultsof the survey conducted enrich the literature on sustainable industrial tourism and ondevelopment of post-industrial facilities in the context of creating business models. Inaddition, they serve as a recommendation for conduction of further quantitative researchin this field. They provide good practice knowledge for the development of new tourist
146

Sustainability 2021, 13, 2028
products—tourist trails based on post-industrial facilities, serving as a foundation for abusiness model.
2. Literature Review
2.1. Utilization of Post-Industrial Facilities and Industrial Tourism
Technological progress has significant impact on the way some things, goods, andarticles of everyday use are made. Development of humanity, from the beginning ofits existence, has influenced new discoveries and inventions. A huge part of it was sosignificant, that it resulted in the changes in the structure and organization of industry.These sites and—first of all—the post-industrial facilities in our surroundings have beenidentified for a relatively short time. They primarily pertain to city centers, which in thepast two centuries had served as industrial centers. Nowadays they serve as relics of theindustrial period, unique reminders, and historical witnesses of the bygone era [8].
These areas or facilities, which ceased to operate as production plants or do notfulfill their other auxiliary functions associated with production, along with the areasof unfinished industrial projects, are called post-industrial areas or brownfield lands [9].Many post-industrial objects result from industrial revolutions, but they are also related topolitical system changes, business bankruptcies, as well as development of technology andscience [10,11].
Depending on the time of development of post-industrial areas, these locations, bothin Poland and Europe, had certain common features. During the 1930s, post-industrial fa-cilities were located in city centers or on their outskirts, but also in close proximity to rivers.In the following decades (i.e., the 1960s and 1970s), along with the technological progress,post-industrial facilities were situated in the vicinity of railroads or thoroughfares [12].
Both in Poland and Europe construction of many post-industrial facilities was deter-mined by such factors as reduced coal mining and implementation of environmentallyfriendly solutions. It led to the restructuring of industry, which was losing its status. Theseactivities resulted in profitability declines or even business closures experienced by manyenterprises [10,13].
Many countries faced the problem of post-industrial facilities, not being sure how totreat them—as a burden, which should be discarded as soon as possible or as somethinguseful, bringing benefits in the future. Many post-industrial facilities completely disap-peared, or their purpose was suddenly changed. Frequently, due to hasty decisions, it hadnegative impact, causing irreversible long-term changes [14,15].
Tourism plays an increasingly important role in the economy, social activity, andthe culture. According to the report published by the World Travel & Tourism Council,the tourism industry generates 10.3% of the global GDP, which translates to 8.9 billionAmerican dollars [16].
One of the reasons for post-industrial area utilization in tourism has contributedto the development of industrial tourism. It targets traveling, in which destination isdetermined by the cultural value of specific sites. This type of tourism encompasses notonly heritage sites, but also contemporary landmarks. Revitalized post-industrial facilitiesblend in perfectly with the latest trends of today’s travelers who visit and search for newcultural experiences. Constant growth and promotion of industrial tourism is one ofthe priorities in the Polish tourism economy; it results from the fact that post-industrialfacilities can play an important role in tourism as revitalized objects. Attention shouldprimarily be paid to the way these facilities are developed in terms of attractiveness,education, and entertainment. Such activities allow the degraded, abandoned areas tobreathe a new life into towns and regions, thus contributing to the development of societyand improvement of culture. It has a positive impact on the locations and the level oftheir residents’ satisfaction. These activities are part of sustainable development and havepositive impact on the creation of new business models on the part of the organizationsoperating in the tourism industry [11,17–20].
147

Sustainability 2021, 13, 2028
2.2. The Process of Post-Industrial Facility Restructuring in the Light of the Law
The problem of post-industrial facility and area development can be recognized as acommon issue. Such areas and objects can frequently be distinguished by the attractivelocation and infrastructure, preserved at varying levels. Studies and analyses have led tothe development of practical tools, which are focused on post-industrial area restructuring.These tools include proper organizational structures, legal regulations, procedures, andmodel projects [14,21,22].
The solutions implemented proved to be necessary for ensuring reasonable, compliantwith the principle of sustainable development, implementation of the activities carried outin these areas, which places emphasis—first of all—on natural protection and fulfilment ofthe present generations’ aspirations, keeping in mind the future generations, through effi-cient utilization of natural resources, e.g., energy savings and reduction of environmentalpollution [23,24].
Under the Polish law, the first document regulating the issues related to brownfieldland is the government program for post-industrial areas, passed by the Council of Min-isters on 27 April 2004. The program mainly aimed to determine the conditions andmechanisms used for the development of post-industrial areas, maintaining the principlesof sustainable development [25,26].
The act on revitalization (Journal of Laws 2015, art. 1777), which was passed on 9October 2015 is the first Polish regulation focused on this issue. Brownfield land andpost-industrial facilities were incorporated into revitalization areas. It results from the factthat development thereof will contribute to the prevention of negative social phenomena.Economic phenomena include the fact that local business is in bad shape and the quality ofenvironment poses serious threats to people [27].
Analyzing the legal acts that are currently in force in Poland, it can be concludedthat revitalization activity in post-industrial areas requires specific conditions. One ofthe most important conditions entails assurance that a post-industrial area, as a result ofrestructuring, solves the social problems mentioned in art. 9 sec. 1 items 1–4 of the act onrevitalization [27].
2.3. Utilization of Business Models
Business models have been known in foreign and Polish literature on the subjectfor more than several decades [28,29]. The significance of business models in contempo-rary business can be characterized by the clear difference existing between managementpractitioners and theoreticians [30].
In Polish literature, different definitions of business model can be found [31]. T.Falencikowski characterizes business model as a “relatively isolated, compound conceptualobject, describing the running of business through articulation of the logic of creating valuesfor customer and interception of part of this value for an enterprise” [32]. P. Timmers, on theother hand, defines business model as product, service, and information flow architecture,including a description of the various business actors; and a description of the sources ofrevenues [33]. D. Teece claims that business model is a tool used to design a mechanismfor creation, delivery, and value capturing for customer purposes [34].
One of the main tasks of business models entails description of business, explaininghow a given company works and the ways to develop competitive advantage on themarket [35]. It additionally describes the relations between the organization’s componentsleading to the creation and capture of its value [36]. Business models are flexible and haveto be adjusted to the changes that take place in markets, the innovations, and the legalframeworks. Business model is regarded as a way of building business and adding valuefor its customers [37].
Business models are complex—they consist of many models, which incorporate arange of activities in an organization, starting from the organization as a whole, and endingwith models of individual business units, products, or processes [38–40].
148
Sustainability 2021, 13, 2028
It should be noted that in the source literature, business models for regional productsconsist of entry and exit conditions, quality standards, and mechanisms for control andimprovement. They additionally should clearly identify the social, image-related andfinancial benefits, specifying their financing [41].
Currently, one of the most serious threats resulting from tourism is the burdens causedby overtourism. Creation of business models, which combine sustainable developmentand value for businesses is therefore important [42]. Such business models can constitutea significant source of competitive advantage, generating many economic benefits [36].Nowadays, owing to their affordability and versatility, business models are used in anincreasingly higher number of industries, i.e., in industrial, food, tourist, energy, and otherenterprises [43].
Development of new business models in tourism allows for the generation and maxi-mization of profits [44]. One reason for this is the development of information technology,which owing to its mobility can transform the tourism market not only in Poland, butalso globally. Moreover, the information technology progress has contributed to increasedcompetitiveness of the companies operating on the tourist market [45].
Companies operating in the tourism industry, wanting to create a business model,should keep in mind that it is supposed to reflect the mechanisms of the activities thatcontribute to the achievement of their targets [46]. One important aspect is the ability tomodify business models. Frequently, this ability is perceived as a precondition for dealingwith changes that can result from the surrounding as a consequence of an economic declineor due to the permanent transitions of the market in terms of supply and demand [47].
2.4. Industrial Tourist Trail as a Model of Sustainable Tourism
Utilization of post-industrial facilities is part of sustainable tourism. According tothe European Commission, sustainable tourism is tourism that is economically and so-cially profitable, not affecting the environment and the local culture [48]. The conceptof sustainable tourism was developed along with the implementation of sustainable de-velopment [49,50]. During the conference dedicated to sustainable tourism in 1995, theCharter for Suitable Tourism was adopted, which was accepted by the biggest internationalorganizations, such as the World Tourism Organization, the United Nations EnvironmentProgram, UNECSO, and the European Commission [51].
Sustainable tourism became part of the New Urban Agenda as one of the sectors thatcan have significant impact on the development of urban economy and the creation ofnew, high quality jobs. The significant growth of industrial tourism can be associated withvarious activities that not only are focused on tourist traffic stimulation, but above all havea positive impact on the economy, the life of the local people, helping avoid the negativeeffects of overtourism in urban space, paving the path toward sustainable developmentof tourist initiatives, which is beneficial for both the tourists and the residents [52]. Cre-ation of themed tourist trails incorporating post-industrial facilities, is therefore a positiveundertaking, from the perspective of sustainable tourism and economy.
The idea of themed trails emerged from the dynamic development of industrialtourism, which utilizes brownfield land and post-industrial facilities [53]. One of thebiggest themed trails operating across Europe is the European Route of Industrial Heritage(ERIH). In Poland, there are ten trails of this type, which are part of the European Route ofIndustrial Heritage [54,55].
It should be noted that the ERIH does not encompass all the trails. We should thereforepay special attention to the trails that are not part of this European giant with regard to thepost-industrial facility aspect, the cultural trails in Poland can be divided into two types.The first type comprises trails with post-industrial facilities featuring several industrialheritage landmarks. Another type consists of industrial trails dedicated fully to industrialheritage. Currently, in Poland, there are about 600 cultural trails, 7% of which are industrialtrails [56]. The TeH2O Water, Industry and Craft Trail in Bydgoszcz belongs in this groupof trials.
149

Sustainability 2021, 13, 2028
The intertwining of history, industry, and environmental protection gave rise to thedevelopment of a regional business model. The TeH2O Water, Industry and Craft Trail inBydgoszcz combines public buildings with private property. A business partnership existsbetween the tourist route facilities and the numerous facilities within the infrastructuresurrounding the route. This, among others, promotes the trial and results in the improve-ment of the functioning of the local economy. The trail is multi-productive, which meansthat tourists can use many products or services. Such a combination improves the localeconomy and promotes the trail. Existence of business partnership fosters the competitiveadvantage of the tourist region and facilitates the development of enterprises that are ableto cooperate within such a network. Owing to the development of the business model, theeffectiveness of advertisement and promotion cost minimization, in relation to the trailobjects and locations, has improved. Access to information on the building of a positionin the market improved, along with the ability to make decisions faster. Development ofa business model that brings together post-industrial facilities enabled funding from thepreviously mentioned international SHIFT-X project co-financed by the European RegionalDevelopment Fund. A network of entrepreneurs emerges around the trail. The building ofa business model facilitated acquisition of new knowledge-sharing skills pertaining to theability of finding best solutions in case of problems. The business model also increased theinnovation capacity of the trail participants. As a result, it is possible to create innovativeindustrial heritage products. The products associated with the business model developedinclude, among others: organization and coordination of tourist services (sightseeing,organization of tours), the monitoring of the route and facility markings, promotion of thetrail and its facilities, updating and distribution of information about the trail, distributionof various materials about the trail, initiation and coordination of thematic products fortourists, sale of own services, etc. The TeH2O thematic trail addresses its offer both to theinhabitants of Bydgoszcz and the tourists, the passers-by who decided to visit the city.The customers who have decided to take advantage of the thematic trail offer can, firstof all, learn about the people and the events in the industrial heyday of Bydgoszcz. Thevisitors can additionally take advantage of the following: a single entry ticket to manyfacilities, a system of discounts (e.g., for workshops) for the recipients visiting more thanone facility, discounts on the services provided by the facilities/entities in the vicinity ofthe trail, co-creation of offers for business (company meetings, integration events, etc.,).TeH2O thematic trail intends to acquire new partners in the coming years (new facilitieson the route, new facilities/accompanying entities), but above all, to acquire new keyforeign partners for the development. Development of an offer for new groups of recipients(foreign tourists) is one of the key elements of a long-term strategy. The developmentstrategy additionally includes continuous emergence of new products offered as part ofthe trail [7,43,57,58]. It is worth adding, that some regions were not very popular amongtourists, but their inclusion in the trail has become one of the main development factors forthose locations.
3. Materials and Methods
The study used both secondary and primary data sources. The first part of the researchentailed a survey carried out via free online questionnaire tools. The target survey groupinvolved two sets of respondents—the residents of the city of Bydgoszcz and the touristsvisiting Bydgoszcz.
The subject scope of the study encompassed Bydgoszcz as a tourist destination, inparticular the TeH2O Water, Industry and Craft Trail. The time frame was 2015–2019. Thestudy of primary sources was carried out in 2019.
The questionnaire was made available on social media—i.e., Facebook, associatingthe biggest group of Bydgoszcz residents, as well as on theme groups addressing tourismand sightseeing. The Facebook groups—My (Our) Bydgoszcz, Bydgoszcz Fordon, Byd-goszczanie, Bydgoszczanki, Tourism, Must-See Historic Sites, and various groups associ-ated with specific neighborhoods of the city.
150

Sustainability 2021, 13, 2028
The study entailed a non-random sample selection, i.e., the purposeful selectionmethod was used. The research was divided into two parts. The first part involved asurvey carried out among the residents of Bydgoszcz, whereas the second part involved asurvey carried out among the tourists visiting Bydgoszcz. The survey time range was setat one month. After the data collection stage was completed, the authors acknowledgedthe number of the survey questionnaires received as appropriate for the first part of theanalysis and enabling verification of the research assumptions. During the data reductionstage, none of the questionnaires received was rejected. Total of 212 people took part inthe first part of the study. In the second part of the study, the population was 208 persons.The total number of the respondents was thus estimated at 420 persons. Table 1 shows thestructure of the research sample.
Table 1. Research sample.
Gender Bydgoszcz Residents Bydgoszcz Visitors
Female 147 112Male 65 96Total 212 208
The questionnaire consisted of 16 questions. Ultimately, the questionnaire includedan imprint with questions about gender, age, education, and employment status. In thecategory of closed questions, the authors offered multiple selections of answers and afrequency scale of certain phenomena. The questionnaire concerned the assessment of thecity’s tourist attractiveness and industrial tourism, taking into consideration the assessmentof a number of aspects related to the examined TeH2O Water, Industry and Craft Trail inBydgoszcz.
Analysis of the questionnaire results was preceded by a description of Bydgoszcztourism. Figure 1 presents the statistical indexes of the tourist traffic in Bydgoszcz. Theinformation on to the number of tourists visiting Bydgoszcz was published by the Byd-goszcz Information Center [20,59–62]. The number of tourists in Bydgoszcz over the pastfive years was increasing systematically. Such factors as improvement of the hotel servicequality as well as the increased number of beds and tourist facilities have most likelycontributed to the growing number of tourists. Additionally, in the period described, newflights were added to the schedule of the Bydgoszcz Airport, thus affecting the increasednumber of the tourists coming from abroad.
Figure 1. Number of tourists visiting Bydgoszcz in 2015–2019.
151

Sustainability 2021, 13, 2028
The survey participants represented various employment groups and different levelsof education. Table 2 shows the sample structure in employment distribution. Among therespondents from Bydgoszcz, the biggest group comprised white-collar (office) workers,whereas the unemployed constituted the smallest group.
Table 2. Structure of the sample acc. to: employment groups of those polled.
Professional StatusBydgoszczResidents
% ShareBydgoszcz
Visitors% Share
Office worker 112 52.8 44 21.2Manual worker 33 15.6 41 19.7
Student 16 7.5 64 30.8Pensioner 23 10.8 19 9.1
Unemployed 8 3.8 12 5.8Entrepreneur 20 9.5 28 13.5
The most diverse group of the surveyed consisted of the tourists visiting Bydgoszcz.The biggest groups included students, white-collar workers, and blue-collar (manual)workers. Just like in the case of residents, the unemployed constituted the smallest group.The survey result comparison is presented in Table 2.
The greatest share of the surveyed, in age distribution, i.e., both the residents ofBydgoszcz and the visitors, was the group of people aged 21 to 30. The results are shownin Table 3. Because of the educational nature of post-industrial tourism, the authorsconsidered the large share of this group purposeful and appropriate for the assessment ofthe phenomenon under examination.
Table 3. Sample structure in age distribution.
AgeBydgoszczResidents
% ShareBydgoszcz
Visitors% Share
Under 20 11 5.2 14 6.721–30 60 28.3 110 52.931–40 55 25.9 35 16.841–50 42 19.8 25 1251+ 44 20.8 24 11.6
The next stage of the study entailed an in-depth interview with the Coordinator of theTeH2O Water, Industry and Craft Trail in Bydgoszcz. Because of spread of the COVID-19pandemic, the interview was carried out remotely. At the request of the Coordinator ofthe TeH2O Water, Industry and Craft Trail, all questions were sent by e-mail. The authorsof the study also used secondary sources, most important of which was the report on thetourist traffic in Bydgoszcz in 2015–2019, prepared by Leszek Wozniak and the BydgoszczInformation Center and made available by the City of Bydgoszcz—Bydgoszcz InformationCenter.
4. Empirical Study Results
The non-resident (visitor) respondents were asked if they have visited the city orplan to do so in the coming year. Based on the study, it has been found that 177 surveyparticipants (85%) had visited the city of Bydgoszcz. Whereas 93 survey participants (4.7%)intended to do so, and 75 (36.1%) did not express their opinion on this matter.
Additionally, they were asked about the purpose of their trips to Bydgoszcz. Figure 2presents their answers.
The respondents from the city of Bydgoszcz stated that the city is touristically attrac-tive. Such an opinion was expressed by 97 respondents (45.8%). The visiting respondentsshared a similar opinion. This opinion was expressed by 81 respondents (38.9%). Table 4
152

Sustainability 2021, 13, 2028
presents the detailed results of the Bydgoszcz tourist attractiveness assessment expressedby the respondents.
Figure 2. Purpose of trip to Bydgoszcz.
Table 4. Assessment of the city of Bydgoszcz tourist attractiveness.
AssessmentBydgoszczResidents
% ShareBydgoszcz
Visitors% Share
Yes 97 45.8 81 38.9
Rather yes 61 28.8 84 40.4
No 29 11.7 12 14.9
Hard to tell 25 13.7 31 5.8
Size 212 - 208 -
Average 1.556604 - 1.899038 -
Standard deviation 1.049308 - 1.009328 -
SEM mean 0.072067 - 0.069984 -
During the research, the respondents were asked about the knowledge of the TeH2Oindustrial trial. Out of the city of Bydgoszcz inhabitants, as many as 60.4%, i.e., 128 respon-dents, stated that they have heard about this route, while 34.9%, i.e., 71 respondents, werenot familiar with what the trial analyzed was, and 4.7%, i.e., 10 respondents, were unableto indicate any answer. The results were similar in the case of the question addressingthe fact of visiting an industrial trial object. These results are as follows: 60.4%, i.e., 128resident respondents had visited a trail facility, 23.1%, i.e., 49 respondents, had not, while16.5%, i.e., 35 respondents, were unable to indicate whether they had visited any of thefacilities of the industrial trial.
The visiting (non-resident) respondents’ answers to same question were as follows:72.6% have never heard about the TeH2O Industrial Trail, 16.8% are familiar with it, and10.6% did not provide any answer. The visitors’ answers to the question regarding visitingany of the sites on the Industrial Trail can be summarized as follows: 54.8% have not visited
153

Sustainability 2021, 13, 2028
any of the sites, 13.9% visited one of the sites, and as much as 31.3% were not able to stateif they have visited any of the sites.
The surveyed were asked to provide their opinion on the share of the TeH2O IndustrialTrail in the assessment of the city’s attractiveness. The answers provided ranged from 1 to6, where 1 indicated the smallest share and 6 the greatest. Table 5 presents the assessmentresults for both groups of the respondents.
The respondents were then asked about their assessment of industrial tourism. Theywere to mark their opinion of industrial tourism on a 5-point scale, where 1 meant com-pletely unattractive, and 5 very attractive. The full range of the answers provided is shownin Table 6.
Table 5. Assessment of the TeH2O trial’s role in the perception of the city of Bydgoszcz attractiveness(6 is the highest and 1 is the lowest).
AssessmentBydgoszczResidents
% ShareBydgoszcz
Visitors% Share
1 2 1.1 2 0.82 4 2.1 2 0.83 30 14.2 6 3.14 52 24.7 35 16.75 67 31.6 96 46.56 57 26.3 67 32.1
Table 6. Assessment of industrial tourisms attractiveness (5 is the highest, 1 is the lowest).
AssessmentBydgoszczResidents
% ShareBydgoszcz
Visitors% Share
1 2 1.1 2 1
2 13 5.8 15 7.2
3 31 14.2 47 22.6
4 91 43.2 47 22.6
5 75 35.7 97 46.6
Size 212 - 208 -
Average 4.056604 - 4.047308 -
Standard deviation 0.911539 - 1.033398 -
SEM mean 0.062604 - 0.071653 -
The figure below (Figure 3) shows assessment of the development of post-industrialfacilities on the TeH2O Trail.
The questions contained in the in-depth interview addressed assessment of the city’sattractiveness, its industrial tourism and the share of the Water, Industry and Craft Trailin this scope. Other issues that were discussed included the establishment of the TeH2OTrail as well as the source of and the purpose behind this undertaking. Information on theattendance, the marketing strategies and the economy was included as well.
154

Sustainability 2021, 13, 2028
Figure 3. Assessment of the development of post-industrial facilities on the TeH2O Trail.
In the coordinator’s opinion, based on the survey answers obtained, the city’s attrac-tiveness has significantly increased when it began to be associated with the TeH2O Water,Industry and Craft Trail. The residents’ awareness of the industrial value of Bydgoszczwas very important as well. Development of post-industrial facilities for tourist purposeshas breathed new life into those sites, allowing the history of these sites to be presented,thus reaching a wide group of its offer recipients. The Coordinator of the TeH2O Water, In-dustry and Craft Trail stated that industrial tourism is a perfect answer to the tourists’ everincreasing demand for new experiences. It mainly results from the fact that such tourismcombines the function of sightseeing with the knowledge of the world, the familiarizationwith technology and production processes, as well as the history of these sites, facilities,and societies. Some of the reasons that led to the establishment of the Trail include theneed for protection and promotion of the industrial heritage of Bydgoszcz, the strive forincreased awareness among the residents and the administrators of post-industrial facilities.The Coordinator of the TeH2O Water, Industry and Craft Trail also stated that the idea ofthe TeH2O Trail is based on the assumption that technology does not exist without the man.The Coordinator mentioned that annually the Trail reports about 100–150,000 entries, witha steady growth in the trend. She also emphasized the difficulty in the estimation of thenumber of the people who are aware of the Trial’s existence and choose recreation on theMłynska Island or the Bydgoszcz Canal. The city’s residents account for a significant shareamong the Trail visitors.
5. Discussion and Conclusions
The article presents an example of restructured areas and facilities affected by pastindustrial activity. The laws and regulations in force allow restructuring of post-industrialfacilities for tourism-related purposes. It should be mentioned, however, that every post-industrial area exhibits different features, which result from many variables, e.g., thetype of the industrial activity conducted in the past, its location, the society’s needs, thedegradation level of the facility, and/or the area and the surrounding environment, theadministrative authority’s prospects, as well as the feasibility of investment plans.
The authors described the laws and regulations pertaining to the changes indicated aswell as examples of development, in relation to the facilities and areas that meet specific
155

Sustainability 2021, 13, 2028
social problems. The current state of this issue in Poland has been presented as well. Otherkey topics include description of post-industrial area utilization for tourism purposes andthe role of industrial tourist trails as an example of business model.
The study and the literature analysis allowed the research objective to be achieved.Development of post-industrial facilities for tourist purposes is an attractive form oftourism, which results from the information obtained via numerous references, statistics,and the research addressing topic. More than 60% of the respondents residing in Bydgoszczhave visited the post-industrial facilities located on the TeH2O Trail. Their assessmentof the attractiveness this type of tourism offers, 43% of the surveyed selected answers4/5, and 36% of the respondents selected answer 5, where on the 5-point scale, 1 meantcompletely unattractive, and 5 very attractive. The non-resident respondents have alsovisited the TeH2O Industrial Trail sites, but only at a 13.9% rate.
The method of post-industrial object development on the TeH2O Water, Industry andCraft Trail in Bydgoszcz has been assessed as well. Also in this case vast majority’s opinionwas positive. The respondents assessed that it is an example of a very interesting post-industrial area utilization; this opinion was expressed by 26% of the resident respondentsand 50.6% of the non-resident (visiting) respondents. Moreover, 41% of the respondentsfrom Bydgoszcz answered that the Trial embodies an interesting form of post-industrialfacility development. Conversely, 25.6% of the non-resident respondents recognize thatthe Trial constitutes a perfect combination of technology, history, and spatial development.The development of industrial tourism had also a positive impact on the improvement ofthe environment. Thematic routes are a perfect example of how post-industrial facilitiescan be used in a sustainable way, which fits with the canons of sustainable tourism.
The authors of the article did not find results similar to the research conducted. Theauthors searched such databases as: Google Scholar, BazEkon, Scopus, etc. No similarpublications addressing to the research field that would allow comparison of the resultswith the hypothesis and objectives set at the beginning of the study have been found. Thelack of similar studies may result from the fact that industrial tourism, and in particulartourist routes, have only gained popularity in the recent years. It is therefore necessary toindicate the need for research in this area.
The research conducted in 2018 by Zawadka et al. [63] on the popularity of thetourist routes located in the rural areas of the Podlasie and Masovian voivodeships showsfamiliarity and the popularity of this type of tourist routes is low. The most famous trail isthe Chopin Trail (Chopin’s Mazovia). The authors indicate that, on average, over half ofthe respondents were not aware of the existence of the routes analyzed. These routes areknown to the persons residing in the vicinity of those objects. The lack of familiarity withthe routes analyzed may result from poorly implemented promotional activities that wereaimed at popularization of such tourist attractions.
A research conducted by Krzysztof Widawski et al. [55] on the tourist attractivenessof the objects making up the Land Flowing with Milk and Honey trail indicates that onlyone of the 22 sites analyzed is of low attractiveness.
Nevertheless, the research carried out by the above-mentioned authors does notspecify how the thematic routes examined affect the attractiveness of the places in whichthey are located. It is therefore important to take the problem identified in the research intoaccount.
Based on the research carried out and the authors’ observations, several conclusionscan be drawn:
1. Development of post-industrial facilities for the purpose of industrial tourism hasbecome an increasingly popular solution, aimed at attracting a growing number ofrecipients. The research allowed a conclusion that development of post-industrial fa-cilities significantly improves city attractiveness, thus contributing to the promotionalactivities of these cities and regions. As such, the cities that had once been known fortheir industry, later degraded and forgotten, now can rebuild their identity and showtheir history.
156

Sustainability 2021, 13, 2028
2. The TeH2O Water, Industry and Craft Trail in Bydgoszcz has had considerable impacton the increase of the city’s attractiveness. The Trail has become a tourist destinationfor both the residents of the city of Bydgoszcz and the visitors. Owing to the inflowof tourists in the past years, the TeH2O Trail can be popularized both domestically aswell as in Europe.
3. The TeH2O Water, Industry and Craft Trail in Bydgoszcz offers great potential forthe region, which when properly utilized can bring measurable benefits. Among thebenefits arising from the TeH2O Trail there are economic advantages, including theprofits generated by specific landmarks located on the Trail as well as the generalhospitality of the services situated in the proximity of the Trail, i.e., hotels, restaurants,souvenir shops, etc., prevail. It should be noted that industrial tourist trails improvethe competitive position of any region. They also strengthen the social, economic,cultural, and spatial ties within their area.
4. This significant increase in the popularity of industrial tourism in Poland requiresproper adjustment of the industrial heritage and the sightseeing packages are pre-sented. It is important that such offers are addressed to individual tourists, groups oftourists, and tour operators. It is also necessary to develop a clear, easily availablelandmark information system that would provide details on the sites to be visitedand the themed trails operating in Poland. Moreover, such landmarks should bebetter promoted in mass media. This problem can thus be solved by the developmentof a business model that would entail utilization of resources, i.e., the componentscomprising a themed trail, via an online service, which would serve as a tool allowingthe tourists to create their own itinerary, adjusted to their needs and providing manyother functionalities.
5. According to the studies conducted by the authors, the TeH2O Industrial Trail isbetter known among the residents of the city of Bydgoszcz than the visitors (non-residents). This may result from the fact that the Trail is insufficiently advertisedoutside Bydgoszcz. It also should be mentioned that many people visiting sites of theTeH2O Industrial Trail were not aware that specific landmarks are part of this Trail.
The city of Bydgoszcz is a place where industrial history plays a very important role.Many post-industrial buildings can be found there which set the city’s rhythm. This isone of the reasons why the authors of the article engaged in the topic of business modelspreserving the historical value of the city. The design of such models, which are basedon post-industrial facility development, is a perfect example of activities that are aimedat monument protection and simultaneous creation of business ties between the trailparticipants.
The authors of this article are aware that the study does not provide representative re-sults and the data received cannot be generalized onto the entire population. Nevertheless,the results of this study can serve as a foundation for in-depth research in this field.
It thus rightly concluded that development of post-industrial facilities for tourism pur-poses, by establishment of a themed tourist route, such as the TeH2O Water, Industry andCraft Trail in Bydgoszcz for instance, is a just, needed, and attractive solution. Utilizationof post-industrial facilities generates measurable benefits, not only in economic or social,but also in ecological terms.
Author Contributions: Methodology M.J. and P.S.; writing—original draft M.J. and P.S.; writing—review and editing M.J. All authors have read and agreed to the published version of the manuscript.
Funding: This research received no external funding.
Institutional Review Board Statement: Not applicable.
Informed Consent Statement: Not applicable.
Data Availability Statement: Data available in a publicly accessible repository that does not issueDOIs.
157

Sustainability 2021, 13, 2028
Acknowledgments: The authors of the article would like to thank the head of the Departmentof Organizational Innovation Management—Habil. Iwona Posadzinska, associate professor, forsupport and assistance in the preparation of the article. The authors of the article would like to thankPuchowska, The Coordinator of the TeH2O Water, Industry and Craft Trail for participation in aninterview in these difficult times of the COVID-19 pandemic.
Conflicts of Interest: The authors declare no conflict of interest.
References
1. Sala, K. Praktyczne wykorzystanie i współczesne znaczenie obiektów poprzemysłowych w Polsce na przykładzie hoteli loftowych.Pr. Kom. Geogr. Przem. Pol. Tow. Geogr. 2020, 34, 167–178. [CrossRef]
2. Szromek, A.R.; Herman, K. A business creation in post-industrial tourism objects: Case of the industrial monuments route.Sustainability 2019, 11, 1451. [CrossRef]
3. Naramski, M.; Herman, K. The development of mobile tourism in the upper silesian metropolitan area of Poland. Sustainability2020, 12, 44. [CrossRef]
4. Bujok, P.; Klempa, M.; Jelínek, J.; Porzer, M.; Rodríguez Gonzalez, M.A.G. Industrial tourism in the context of the industrialheritage. Geoj. Tour. Geosites 2015, 15, 81–93.
5. Martinat, S.; Navratil, J.; Hollander, J.B.; Trojan, J.; Klapka, P.; Klusacek, P.; Kalok, D. Re-reuse of regenerated brownfields: Lessonsfrom an Eastern European post-industrial city. J. Clean. Prod. 2018, 188, 536–545. [CrossRef]
6. Szlak Wody Przemysłu i Rzemiosła TeH2O w Bydgoszczy—Przewodnik, 2015. Available online: https://issuu.com/visitbydgoszcz/docs/przewodnik_teh2o.compressed (accessed on 14 December 2020). (In Polish)
7. Locativo Sp. z o.o. Koncepcja Zarzadzania Dziedzictwem Poprzez Utworzenie Szlaku Kulturowego o Tematyce Przemysłowej: Czesc 3;Zarzadzanie Szlakiem: Kraków, Poland, 2014. (In Polish)
8. Lamparska, M. Post-mining tourism in Upper Silesia and Czech-Moravian country. J. Geogr. Politics Soc. 2019, 9, 57–68. [CrossRef]9. Domanski, B. Restrukturyzacja terenów poprzemysłowych w miastach. In Rewitalizacja, Rehabilitacja i Restrukturyzacja—Odnowa
Miast; Instytut Gospodarki Przestrzennej i Komunalnej: Krakow, Poland, 2000; ISBN 8386847905. (In Polish)10. Denis, M. Tereny poprzemysłowe w dobie zrównowazonego rozwoju. Stud. Miej. 2017, 26, 25–37. [CrossRef]11. Samuil, I.; Caramidaru, I.; Ionica, A. The Emergence of Industrial Tourism in Post-Mining Closure Areas—Project Management
Models and Local Practices. MATEC Web Conf. 2020, 305, 00077. [CrossRef]12. Alexandrescu, F.; Martinát, S.; Klusácek, P.; Bartke, S. The Path from Passivity Toward Entrepreneurship. Organ. Environ. 2014, 27,
181–201. [CrossRef]13. Glumac, B.; Han, Q.; Schaefer, W.F. Actors’ Preferences in the Redevelopment of Brownfield: Latent Class Model. J. Urban Plan.
Dev. 2015, 141, 04014017. [CrossRef]14. Gasidło, K. Przekształcenia terenów poprzemysłowych—Efekty i perspektywy badan i działan. Probl. Ekol. 2008, R. 12, 76–80.15. Pardo Abad, C.J. The post-industrial landscapes of Riotinto and Almadén, Spain: Scenic value, heritage and sustainable tourism.
J. Herit. Tour. 2017, 12, 331–346. [CrossRef]16. World Travel. Tourism Council Travel and Tourism. Global Economic Impact & Trends. 2020. Available online: https://wttc.org/
Research/Economic-Impact/moduleId/1445/itemId/91/controller/DownloadRequest/action/QuickDownload (accessed on14 December 2020).
17. Klempa, M.; Bujok, P.; Porzer, M.; Skupien, P. Industrial complexes and their role in industrial tourism—Example of conversion.Geosci. Eng. 2016, 62, 45–50. [CrossRef]
18. Xie, P.F. A life cycle model of industrial heritage development. Ann. Tour. Res. 2015, 55, 141–154. [CrossRef]19. Staszewska, A.; Zemła, M. The Industrial Monuments Route of the Silesian Voivodeship as an example of the regional tourism
product enhancing tourism competitiveness of the region. Czech. J. Tour. 2013, 2, 37–53. [CrossRef]20. Wozniak, L.; Brudnicki, R. Badanie Ruchu Turystycznego w Bydgoszczy w 2019 Roku; Bydgoskie Centrum Informacji: Bydgoszcz,
Poland, 2019. Available online: https://visitbydgoszcz.pl/images/do_pobrania/badania/Turystyka_w_Bydgoszczy_w_roku_2019.pdf (accessed on 14 December 2020). (In Polish)
21. Venu, V.; Goodwin, H. The Kerala Declaration on responsible tourism. In Proceedings of the Incredible India, Second InternationalConference on Responsible Tourism in Destinations, Kochi, India, 21–24 March 2008.
22. Franklin, A.; Kovách, I.; Csurgó, B. Governing Social Innovation: Exploring the Role of ‘Discretionary Practice’ in the Negotiationof Shared Spaces of Community Food Growing. Sociol. Rural. 2017, 57, 439–458. [CrossRef]
23. Buiok, P.; Rodrigez, M.A.; Klempa, M.; Ielinek, Y.; Porzer, M. Industrial Tourism and the Sustainability of the Development ofTourism Business. Tour. Educ. Stud. Pract. 2014, 3, 88–97. [CrossRef]
24. Hwang, D.; Stewart, W.P.; Ko, D. Community Behavior and Sustainable Rural Tourism Development. J. Travel Res. 2012, 51,328–341. [CrossRef]
25. Maciejewska, A.; Turek, A. Rewitalizacja i jej znaczenie w kontekscie realizacji polityki przestrzennej na terenie województwamazowieckiego. Maz. Stud. Reg. 2018, 71–89. [CrossRef]
26. Rall, E.L.; Haase, D. Creative intervention in a dynamic city: A sustainability assessment of an interim use strategy for brownfieldsin Leipzig, Germany. Landsc. Urban Plan. 2011, 100, 189–201. [CrossRef]
158

Sustainability 2021, 13, 2028
27. Dziennik Ustaw Rzeczypospolitej Polskiej. Ustawa z Dnia 9 Pazdziernika 2015 r. o Rewitalizacji; SEJM: Warsaw, Poland, 2015; pp.1–20. (In Polish)
28. Amit, R.; Zott, C. Value creation in E-business. Strateg. Manag. J. 2001, 22, 493–520. [CrossRef]29. Micieta, B.; Binasová, V.; Kasajová, M.; Howaniec, H. Business Model Canvas as a Tool of Manager 4.0. Zesz. Nauk. Wyzszej Szk.
Humanit. Zarzadzanie 2020, 21, 51–64. [CrossRef]30. Mazurek, J.; Kułakowski, K. Satisfaction of the condition of order preservation: A simulation study. Oper. Res. Decis. 2020, 30,
77–89. [CrossRef]31. Malara, Z.; Paweł, Z. Information Gap in Value Propositions of Business Models of Language Schools. Oper. Res. Decis. 2020, 30,
59–76. [CrossRef]32. Falencikowski, T. Strategia a model biznesu—Pi róznice. Pr. Nauk. Uniw. Ekon. Wrocławiu 2012, 260, 80–93.33. Timmers, P. Business Models for Electronic Markets. Electron. Mark. 1998, 8, 3–8. [CrossRef]34. Teece, D.J. Business models and dynamic capabilities. Long Range Plan. 2018, 51, 40–49. [CrossRef]35. Bite, P.; Konczos-Szombathelyi, M. Employer branding concept for small-and medium-sized family firms. J. Int. Stud. 2020, 13,
143–160. [CrossRef] [PubMed]36. Butler, R.W.; Szromek, A.R. Incorporating the value proposition for society with business models of health tourism enterprises.
Sustainability 2019, 11, 6711. [CrossRef]37. Han, J.; Heshmati, A.; Rashidghalam, M. Circular economy business models with a focus on servitization. Sustainability 2020, 12,
8799. [CrossRef]38. Maciag, J. Modele biznesowe oparte na standardach jakosci na przykładzie regionalnych szlaków turystyki kulinarnej. Stud.
Ekon. Uniw. Ekon. Katowicach. Zarzadzanie 2015, 4, 45–64.39. Niedbała, G.; Jeczmyk, A.; Steppa, R.; Uglis, J. Linking of Traditional Food and Tourism. The Best Pork of Wielkopolska—Culinary
Tourist Trail: A Case Study. Sustainability 2020, 12, 5344. [CrossRef]40. Kleinhempel, S.; Nitchi, S.I.; Rusu, L. Business Process Management in Service-Oriented Companies. Inform. Econ. 2010, 14,
189–198.41. Meyer-Cech, K. Regional Cooperation in Rural Theme Trails. In Rural Tourism and Sustainable Business; Channel View Publications:
Bristol, UK, 2005; pp. 137–148.42. Dymitrowski, A. Investigations on business model innovation and company’s development. Ekon. Prawo. Econ. Law 2020, 19,
233–247. [CrossRef]43. Kruczek, Z.; Szromek, A.R. The identification of values in business models of tourism enterprises in the context of the phenomenon
of overtourism. Sustainability 2020, 12, 1457. [CrossRef]44. Mazurek-Łopacinska, K. Sprzedaz wielokanałowa (omnichannel) w kształtowaniu procesu dystrybucji na rynku konsumpcyjnym.
Przeglad Organ. 2020, 5, 3–10. [CrossRef]45. Buhalis, D. E-Tourism: Information Technology for Strategic Tourism Management; Pearson Education: Edinburgh, UK, 2003.46. Kedziera, M. Zmiana modeli biznesowych pod wpływem nowych technologii w sektorze turystycznym. Stud. Ekon. 2020, 391,
45–56.47. Kachniewska, M. Turystyka zdrowotna jako determinanta kształtowania nowych modeli biznesowych. Przedsiebiorczosc
Zarzadzanie 2019, 20, 19–30.48. Havlíková, M.; Stupková, L.C.; Plíšková, L. Evaluation of sustainable tourism potential of the principle Giant Mountains resorts
in the Czech Republic. Environ. Socio-Econ. Stud. 2019, 7, 26–35. [CrossRef]49. Sinsin, T.E.M.; Mounir, F.; Aboudi, A. El Conservation, valuation and sustainable development issues of the Argan Tree Biosphere
Reserve in Morocco. Environ. Socio-Econ. Stud. 2020, 8, 28–35. [CrossRef]50. Ferreira, A. Between Development and Sustainability: Symbiotic Synergy or Irreconcilable Duality. Cent. Eur. Rev. Econ. Manag.
2017, 1, 27. [CrossRef]51. Mazur-Wierzbicka, E. Agritourism as a form of sustainable tourism. Intercathedra 2018, 1, 45–53.52. Komorowski, J.; Hołderna-Mielcarek, B. Economic and Social Consequences of Mass Tourism in City Management—The Case of
Poznan and Wrocław. Stud. Perieget. 2019, 3, 27–43.53. Nizioł, A.; Zyczynski, N. An increase of the region’s competitiveness through effective tourist product management: An example
using the thematic trail. Humanit. Soc. Sci. Q. 2020, 25, 41–48. [CrossRef]54. European Route of Industrial Heritage. Available online: https://www.erih.net/ (accessed on 14 December 2020).55. Widawski, K.; Olesniewicz, P. Thematic Tourist Trails: Sustainability Assessment Methodology. The Case of Land Flowing with
Milk and Honey. Sustainability 2019, 11, 3841. [CrossRef]56. Bogacz-Wojtanowska, E.; Gaweł, Ł.; Góral, A. Szlaki Kulturowe jako Medium Zmian w Kulturze; Stowarzyszenie Gmin i Powiatów
Małopolski: Kraków, Poland, 2016. (In Polish)57. Argasinski, W. Korzysci z partnerstwa w turystyce (na przykładzie programu marketingowego Karta Tatrzanska). Handel
Wewnetrzny 2014, 6, 157–170.58. Puczko, L.; Ratz, L. Trailing Goethe, Humbert, and Ulysses; Cultural Routes in Tourism. In Cultural Tourism, Global and Local
Perspectives; The Haworth Hospitality Press: New York, NY, USA, 2007; pp. 131–148.
159

Sustainability 2021, 13, 2028
59. Brudnicki, R. Badanie Ruchu Turystycznego w Bydgoszczy w Roku 2016; Bydgoskie Centrum Informacji: Bydgoszcz, Poland, 2016.Available online: https://visitbydgoszcz.pl/images/do_pobrania/szacunkowa-liczba-turystow-w-bydgoszczy-w-roku-2016.pdf (accessed on 14 December 2020). (In Polish)
60. Brudnicki, R. Badanie Ruchu Turystycznego w Bydgoszczy w Roku 2015; Bydgoskie Centrum Informacji: Bydgoszcz, Poland, 2015;pp. 1–66. Available online: https://visitbydgoszcz.pl/images/do_pobrania/Raport_2015.pdf (accessed on 14 December 2020).(In Polish)
61. Wozniak, L.; Brudnicki, R. Badanie Ruchu Turystycznego w Bydgoszczy w Roku 2017; Bydgoskie Centrum Informacji: Bydgoszcz,Poland, 2017. Available online: https://visitbydgoszcz.pl/images/do_pobrania/badania/Turystyka-w-Bydgoszczy-w-roku-2017.pdf (accessed on 14 December 2020). (In Polish)
62. Brudnicki, R. Badanie Ruchu Turystycznego w Bydgoszczy w 2018 Roku; Bydgoskie Centrum Informacji: Bydgoszcz, Poland, 2019;pp. 1–4. Available online: https://visitbydgoszcz.pl/images/do_pobrania/badania/liczba_turystow_w_Bydgoszczy_w_roku_2018_szacunki.pdf (accessed on 14 December 2020). (In Polish)
63. Zawadka, J.; Pietrzak-Zawadka, J. Tourist Trails as an Element of a Rural Tourist Product and their Popularity among theInhabitants of Poland. Ekon. Sr. 2018, 3, 195–207.
160

sustainability
Article
The Application of ICT and Smart Technologies inPolish Museums—Towards Smart Tourism
Mateusz Naramski
Department of Economy and Informatics, Faculty of Organization and Management,Silesian University of Technology, Akademicka 2A, 44-100 Gliwice, Poland; [email protected]
Received: 1 September 2020; Accepted: 6 November 2020; Published: 9 November 2020
Abstract: The concept of Smart Tourism is rapidly developing alongside Smart Cities, with increasingnumbers of ICT solutions being applied for the convenience of travelers as well as for gatheringinformation, which has become a valuable resource. The vast progress in the development ofInformation Technologies has also impacted the needs and expectations of tourists. However,various branches of tourism are adopting this concept at a different pace, and thus a growingdevelopment gap might emerge. Cases from all over the world show that museums are not immuneto this, and it is important for their future to meet these expectations. Therefore, the main objectiveof this study was to investigate the use of modern technologies in Polish museums and assess theirreadiness for adopting Smart Tourism. For this purpose, a nationwide online survey was conductedwith a sample size of 218 museums (from 500 unique entities in total). The results show that the issueof Smart Tourism in Polish museums is ambiguous. The results reveal that, currently, the status ofSmart Tourism adoption in museums is quite low, and significant gaps in some areas are shown;at the same time, other areas revealed a high potential for the future application of Smart Tourism.
Keywords: smart tourism; museums; Poland; ICT; smart technologies
1. Introduction
The world that we live in is constantly changing, and as time passes, societies are having to facenew challenges. In the last decades, the main challenges have been climate change, urbanization andglobalization. As Komnios [1] noticed, the fact that increasing amounts of the world population livein urban areas creates a pressure to create cites that are suited for the needs of future society. This isreflected in how cities are currently being developed and planned, with a strong emphasis being placedon innovation and on intelligent and knowledge-intensive solutions. Urban areas are expected tofully utilize the benefits of the synergies coming from combining the technologies, knowledge andskills found in various societies and organizations. This requires an undisturbed flow of informationand knowledge, meaning that adequate (smart) environments and spaces need to be in place andinterlinked with each other, creating a complex network of inter-organizational, social, institutional andenvironmental connections. This need can be seen as the origin of the Smart City paradigm, which hasemerged at the turn of the millennium in various sciences.
The concept of Smart Tourism has emerged from the Smart City paradigm and is an essential partof every tourist destination that adopts it. ICTs are the main component of every smart concept [2].The rapid development of the Internet and the related Information Technologies and innovationsaffect and reconfigure all sectors of the economy, including tourism, which needs to adapt to the newstandards by creating smart, individual offers to technology users [3–8]. As cities increasingly embracethe smartness concept, tourism is also following this path. This sets the expectations and needs ofmodern tourists at a new level, and museum visitors are not an exception to this. This is becausetechnological progress has not only affected business possibilities but has also impacted the needs
Sustainability 2020, 12, 9287; doi:10.3390/su12219287 www.mdpi.com/journal/sustainability161

Sustainability 2020, 12, 9287
and expectations of tourists, who seek the customization of products and expect to influence productcreation [9–13]. In multiple sources, ICTs have been highlighted for their contribution to improvingtourists’ experiences, providing benefits to the industry and having a positive effect on the quality oflife of local communities in tourist destinations [14–17], meaning that Smart Tourism can improve adestination’s competitiveness [18]. The main advantages of using technology for tourists are savingtime, allowing the better planning of a trip, allowing purchases to made with satisfying terms andconvenient conditions, allowing information to be found at a site and making the travel experiencemore practical and functional [18–24]. On the other hand, all the traffic, information and digitalfootprints left by travelers on the Internet form a part of Big Data, which can be analyzed to providetourist destinations with valuable knowledge on the behavioral patterns, habits and needs of tourists,allowing the creation of more targeted and individualized products with higher sales chances [23,25–29].Moreover, as a 2020 study by Cuesta-Valiño et al. [30] showed, the smartness concept in tourism canbe utilized to tackle issues that expand beyond economic matters by addressing the problems of thecultural differences of travelers and their resulting needs and expectations, making this concept asustainability domain as well.
The studies on technology use in tourism seem to be perspective-oriented, and an imbalanceof studies regarding one perspective in comparison to another can be noticed. In 2019, a team ofresearchers [31] published a detailed literature review of over 130 papers on the topic of mobiletechnologies and applications in Smart Tourism published between 2012 and 2017. The main findingsshowed that most of the research focused on the customer perspective (their attitudes and intentions,their experience and co-creation and their adoption of smartphones for traveling). Very little researchwas done regarding the provider experience, and when this was considered, the studies focused onICT solutions on the level of an entire tourist destination or the adoption of particularly selectedtechnologies or mobile applications and the stock market. While tourists benefit from conveniencesprovided by technological solutions (by offering fast services, more means of reliable communicationand streamlined connectivity, trips can be planned more easily and quickly and on more transparentconditions, which increases tourists’ satisfaction and allows the providers to better meet the needs andexpectations of customers), the same study revealed that stakeholders still do not fully recognize andappreciate the importance of ICTs (foremost, mobile technologies) and the benefits they can provide.This reveals an interesting gap in the field of Smart Tourism research concerning comprehensivestudies on entire branches of tourist service providers and their experiences, use histories and attitudestowards technology.
Therefore, the main goal of the present study was to explore this gap regarding the museumbranch and recognize the degree to which modern technologies are used in museums across the entirecountry of Poland. This allows us to determine the readiness of Polish museums to embrace the SmartTourism concept, or in other words, to show the already existing Smart Tourism potential and exposepossible issues that have to be overcome in the future to take advantage to this to the full extent.This also allows us to determine if the previously mentioned statement that stakeholders do not fullyrecognize and appreciate the potential of ICTs also applies to museums.
2. Smart Tourism and Smart Technologies
2.1. The Smart City Concept
The development of technology and the digitalization of data have impacted most social andeconomic organizations by introducing the smartness concept. This has improved general qualityof life, as well as enhancing economic performance [2]. The Smart City concept grew on this basis,and the improved resource use and pollution reduction resulting from this concept has led to the morefocused concepts of the Smart Village, Smart Tourism and finally Smart Tourism Destinations [32,33].
Some researchers [34,35] argue that the term Smart City is an evocative slogan that lacks a preciselydefined core. This may lead sometimes to the abuse of this term by governments, politicians or
162
Sustainability 2020, 12, 9287
organizations to realize their agenda by simply labeling it under this term. The same deficiency in thecommonly agreed definition of a Smart City often leads to explaining this term rather than using thesix distinct characteristics of a Smart City [35–37]:
1. Smart Economy, which is understood as an innovative and flexible economy that is integratedwith international markets and that transforms easily.
2. Smart Mobility, which relates to the wide use and access to ICTs, the use of safe and sustainabletransportation and local accessibility.
3. Smart Governance, which refers to governance that includes the society in decision-makingprocesses, with transparent systems and accessible public systems. This characteristic relates alsoto the quality of political strategies.
4. Smart Environment, which refers to low or no pollution, the sustainable use of resources and theattractiveness of the natural environment.
5. Smart Living, which reflects the quality of life in a given city and may be expressed in the availabilityof cultural and educational services, public safety, the accessibility of tourist attractions, the healthof the environment and the unity of society.
6. Smart People, which is understood as the quality of human–social capital, tolerance, flexibility,creativity, participation in social life and the level of cosmopolitanism.
Other researchers have proposed definitions for Smart Cities in the course of their research,taking into account the aspect of the concept that they were analyzing; an example is the work ofValano [35], who concluded that a Smart City (SC) is “an urban imaginary combining the conceptof ‘green cities’ with technological futurism and giving a name to techno-centric visions of the cityof tomorrow. At the same time, the Smart City is a framework for policies supporting technologicaland ecological urban transitions, a political technology that is currently spreading across Europe andfertilizing national and local political agendas.” He also named two main dangers that come fromthis concept, which are shared by other researchers as well [34,38,39]: the first one is that, as with anyother new urban vision, the concept requires some degree of restructuring, which eventually leads tothe exclusion of some current subjects in favor of others—the same is true for people, where somewill benefit at the price of the marginalization of others; the second one is that the SC concept isheavily technologically orientated, reducing the vision of a future city into a technology-centric idea,which may limit the opportunities for possible alternatives that might emerge.
As Battino and Lampreu [2] have noted, the development of smart concepts has to be evenedout between cities that have enjoyed the advantage of early digitalization and less-developed areas.Otherwise, the advantages provided by technology will lead to an increasing gap between thoseareas and intensify the problems of already neglected and depopulating areas [2]. One can assumethat the same might apply to tourism from another perspective, namely various tourism branches orsectors. If some sectors, services or branches follow the smart concepts trend and develop towards it,they might overwhelm others that did not keep up with the pace. This might be the case when onetourism sector is dominated by private companies and another is mainly the domain of public entities(such as museums) whose development is less affected by market stimuli such as competition and moredependent on local regulations and funding policies. It is important to keep up with the developmentpace; otherwise, the underestimation and inactive response to technological opportunities by touristsuppliers will lead to severe consequences [40].
2.2. The Smart Tourism Concept
Smart Tourism, as with the Smart City, is a concept that has many definitions, and researchersapproach it differently depending on their field and discipline; however, even if the boundaries mayseem blurry sometimes, some characteristics that define the concept can be distinguished [36,41]:
• It uses the Internet and network infrastructure to improve economic effectiveness and introducepolicies that support social, cultural and urban growth.
163

Sustainability 2020, 12, 9287
• It emphasizes the creation of attractive business spaces that incorporate social needs intheir services.
• It engages high-tech and creative industries.• It focuses on the relational and social capital in the development of cities.• It recognizes sustainable development as a strategic aspect of Smart City development.
For this research, Smart Tourism can be defined as a subset of the Smart City concept; as withSmart Cities, its aim is to improve the quality of life of its residents. Smart Tourist Destinations (STD)concentrate on the needs of travelers by improving the functioning of systems, business processes,governments and authorities, as well as other entities from the public and private sectors [42].Tourists now rely less on travel agencies and organized trips in favor of individually planned tours.The development of the Internet and mobile technologies, as well as the popularization of SmartTourism, has strengthened and aided this trend. This also affects the habits and expectations of touriststowards destinations, meaning that they support the information sources that modern tourists want touse [43].
The concept of Smart Tourism can be also treated as an evolution of previous technologyapplications in tourism rather than a completely new concept [44], meaning that Smart Tourism canbe seen as a more advanced form of eTourism [45]. Both of these concepts come down to the use ofICTs for development in tourism, but Smart Tourism places more emphasis on collecting, integratingand utilizing data gathered from infrastructure and user devices to provide an improved and morepersonalized tourism experience [46]. In other words, Smart Tourism is a concept that focuses onturning data and information into knowledge that can be used for the benefits of destinations, residentsand tourists [47].
One can go even further, as Buhalis [48] did in one of his recent publications, sharing aninteresting vision of how tourism supported by technology can enter a new stage: Ambient IntelligenceTourism (AIT). AIT seems to be the next step in the evolution of tourism (preceded by eTourismand then Smart Tourism) and is driven by a range of technologies: IoT, 5G networks, the Internetof Everything, RFID, mobile devices and smart wearables and their applications, cryptocurrencies,beacon networking, machine learning, artificial intelligence, pervasive computing and gamification.These various technologies contribute to a growing and fast-developing infrastructure that connects allstakeholders. This network provides a fluid and multidimensional interaction between the physicaland digital worlds. The AIT is the source of intelligence in current and future tourism ecosystems,making them sensitive but also flexible and adaptive to changes. The future cooperation of stakeholdersin tourism seems to be increasingly dependent on technological innovations; at the same time, if thoseinnovations are used adequately, it will make it easier to establish collaboration.
Regardless of the possible development paths, ICTs have introduced significant and inevitablechanges to tourism, bringing the business to the realm of online solutions [49], which has enhanced thetourist experience and created new smart travel services (in the forms of various apps and platformswhich help users to get information, share opinions, find hotels, restaurants and attractions andto travel through a destination). Simply put, Smart Tourism is the set of all information servicessurrounding tourists in the touring process (therefore, it is not only limited to the services providedon site while touring, but it also includes the pre and post-tour processes) [50]. It can also be definedas the development process of tourism that incorporates ICT solutions to eTourism and old-styletourism [46,51]. As stated by Pradhan et al. [52], keeping up with changes in technology is a keytask for all tourism stakeholders (as well as tourists themselves) because of the rapid change and fastdevelopment of information technology.
In conclusion, it is worth noting that there are five crucial components of Smart Tourism [53]:transportation, gastronomy, accommodation, ancillary services and attraction. The basis for a SmartTourism experience is the whole smart business ecosystem, built on data sharing between stakeholders(especially on the private–public plane). For Smart Tourism to develop all of the mentioned components,it needs to be supported by intelligent services within a Smart City and provide the necessary
164

Sustainability 2020, 12, 9287
functionality for tourists at any time. The reliability of this functionality is directly linked to technologicaldevelopment and ICT application.
2.3. The Role of ICTs in Smart Tourism and for Smart Tourists
As previously stated, Smart Tourism emerged from the combination of tourism and ICT or, as othersources mention, from tourism and smart technologies [54,55]. Smart Tourism can be also consideredas an entire ecosystem [55,56] consisting of smart tourists, smart technologies and smart businesses.S. Shen et al. [40] listed different forms of smart technologies that find application in smart tourism,including the following:
• The Internet of Things;• Cloud computing;• Artificial intelligence;• Mobile communication technologies;• Mobile devices and apps;• Big Data;• Virtual reality;• Augmented reality;• Intelligent chat robots;• Wearable devices;• Beacon networking.
Celdrán-Bernabeu et al. [41] mapped how key technologies and key elements of the touristicsystem have changed over time, from traditional tourism and through eTourism to today’s SmartTourism concept. Regarding key technologies, computer servers dominated in the era betweenthe 1950s and 1990s. After this, eTourism emerged on the basis of the rapid development of webtechnologies and the increasing availability of the Internet. This laid ground for modern Smart Tourism,which originates back to the beginning of the new millennium and is based on technologies such asBig Data, mobile technologies, the Internet of Things, cloud services and sensors. The key elements oftouristic systems have evolved from the global distribution and reserve systems, which later have beenreplaced by brokers, information sharing via the Internet and direct transactions (B2B, B2C and C2C).
Ivars-Baidal et al. [57] in another work have also studied the importance of particular ICTs intourism. According to their findings, the first technologies (with 2–5 years until they reveal their fullimpact or use) with the highest influence for tourism (according to the majority of the experts thatparticipated in the study) are real-time databases, local connectivity, mobile communications paymentsand 5G, Near Field Communication (NFC) payments, Bluetooth, wearables, Augmented Reality andunmanned aerial vehicles (UAVs). Some of the experts also listed technologies such as Big Data, IoT orVirtual Reality in this context.
The key role that technology plays in the Smart City and Smart Tourism concepts is not withoutits downsides and limitations. Sometimes, it has been criticized for privileging technological tycoons,raising citizens’ concerns regarding their privacy and the dependency on technology, as well as forpushing public services into the private sector [35,57].
It is obvious that various technologies now play different roles in tourism and impact tourists’behavior and change the functioning of a destination. Smartphones are now standard and are a necessityin tourism, representing the main platform for interaction between tourists and their destinationsboth in the real and virtual world [58]. They have taken word to mouth (WTM) promotion andexpanded it into the electronic world (eWTM) [59,60], making it even more impactful for the value of atourist experience at all travel stages (pre-travel, on-travel and post-travel) [61–65]. The popularityand importance of online reviews in tourism have been growing both for tourists and serviceproviders [66]. Online platforms such as TripAdvisor and similar apps have placed tourists inthe role of the co-creators of a touristic product by shaping an image for other customers [67,68].
165

Sustainability 2020, 12, 9287
Through technological development, tourists are no longer consumers but rather “adprosumers” [69](they advertise, produce and consume a good). Information that can be extracted from such a largedata set can be of use from the sustainability perspective for planning, developing, marketing andoperating touristic products that are advantageous both for the quality of residents’ life and touristvisits [46,50,70,71].
Smart technologies play different roles in each of the previously mentioned travel cycle stages [40].In the pre-visit stage, they are used for gathering information about attractions, finding places andservices, getting opinions and feedback from different sources and finally shaping plans for the tour.Therefore, smart technologies impact the tourists’ experience by affecting how they search for and plantheir visit, increasing their interests in the destination, reducing decision risks and providing a betteroverall understanding of the journey. In the on-site phase, the use of smart technologies includes mobilecommunications and transactions, the storing of memories or moments in the forms of recordings orimages, making on-site short-term decisions and supplementing the visitors’ knowledge by readingdetailed online comments or reviews about a point of interest the tourist is about to seek out. Thus,in terms of tourists’ experience, technologies influence how a visitor navigates and communicates,providing additional convenience, saving time and making the whole experience more flexible andmore enjoyable, as well as affecting the form of how memories are made and kept. Finally, at thepost-visit stage, smart technologies are used to share memories and gathered knowledge and alsofor tourists to write their own reviews (therefore providing others with the same advice the touristsreceived at previous stages). On this basis, it can be stated that smart technologies also influence howexperiences are shared and memories are recollected and how the evaluation process runs [40].
Smart technologies do not only affect the (smart) tourists’ experience, but they also help touriststo impact others’ behavior to be more responsible and sustainable. This was proved in a study byShen et al. [72], who found evidence that social networking sites are effective tools for developingsustainable and responsible behaviors from Smart Tourists at all three previously mentioned stages ofthe travel cycle (the influence is the strongest for the first two stages).
Tourists who embrace technological solutions can be seen as a separate subgroup of all touristsand referred to as Smart Tourists. Characteristics of Smart Tourists that distinguish them from othertourist groups can be found in research on this topic [13,44,45]:
1. Their use of smart devices is more integrated during their whole trip.2. They share their experiences during their trip through social media (in the form of live streams or
real-time updates).3. They use websites and mobile apps to get the most up-to-date information, both during and
before their trip.4. They experience the least inconvenience related to language and mobility while being more
familiar with their destination environment.5. They are reported to have the highest additional consumption during a trip, while at the same
time reporting the smallest income and spending budget in comparison to other groups.6. They are more prone to be positively influenced by social media, so they act more responsibly
and sustainably during their trip.
It is worth mentioning at this point that, even if the previously mentioned research works haveproven that data gathering and its analysis serve the purpose of sustainable development and thattourists are increasingly dependent on technology and expect the newest solutions to be supportedin touristic destinations, there is also another side of this aspect that has to be addressed, namelyprivacy issues and risk factors. As a study published in 2018 [73] has shown, there is no single modelof technology users among tourists. The authors identified four clusters of different tourist types thatdiffer in terms of their technology use and risk perception on the use of smartphones while traveling:
166

Sustainability 2020, 12, 9287
1. Not frequent travelers that use technology mainly for entertainment and do not see themselves ashighly technology-oriented, but are concerned with data privacy and rather use technology fortrip planning rather than for on-site information searching.
2. Senior travelers, who travel more frequently than the previous group and are more concerned withprivacy issues than the first cluster. This group also uses technology mainly for entertainment,but is less dependent on it and has a neutral attitude towards the use of smart technologiesin tourism.
3. Generation X tourists, who are technologically highly aware and travel frequently. Even if thisgroup expresses awareness of privacy risks from technology use in travels, they use it not onlyfor entertainment but also for information finding while on a trip and use technology intensivelyat a destination.
4. Technology-oriented young intensive travelers, who are not concerned with data privacy issues.This group is dominated by young millennials, mostly men, who use smart technologies at adestination more intensively than any other group while being least concerned with potential risks.
Another study [52] on the preconception of risk related to technology use by tourists has shownthat, in general, the perceived benefits of smart devices outweigh the potential risks. Smart technologieshave been proven to aid tourists in terms of cost-saving (while planning, browsing, booking or decidingon a tour), getting information while traveling and making the whole experience more convenient.The main worries for smart technology-using tourists are distrust towards the security of technologyregarding location tracking, sensitive information privacy and financial transaction security. On theother hand, a study on ICT in tourism by Ramos-Soler et al. [74] shares a different perspective on thereception of technology by senior tourists: the authors of the mentioned study underline the conceptthat ICTs and applications are key tools for sustainability in tourism, especially at World CulturalHeritage Sites. Their study proved that these tools are essential for senior travelers and that they havea positive impact on their traveling experience.
2.4. Current Findings on ICT Use in Museums
As mentioned in the introduction, most of the research on ICT use in Smart Tourism has focusedon the clients’ perspective, and the service providers’ point of view seems to be less frequently raised,let alone research that focuses on a specific branch, such as museums. However, some work in thisfield has already been undertaken, mainly by analyzing selected cases of museums that apply variousICTs or by reviewing a single technology and its benefits to museums.
From the perspective of Smart Tourism application in museums, all of the previously mentionedtechnologies can be of importance and use. Some studies focus on particular technologies, such as NearField Communication (NFC), because museums—especially public ones—are often hosts of variousmeetings, conferences, incentives and most of all exhibitions. Findings from research in Columbiahave shown that, in the modern world, NFC technology can be advantageous both for the organizersand participants of such events in tourism [75].
Smart technologies and the Internet of Things (IoT) in particular are not only useful solutionsfor tourists or valuable information sources about their behavior but can be also applied in museumsto maintain perfect display conditions for valuable exhibits. A study from Naples shows that smartsensors can monitor the environment and provide information about the health status of culturalobjects inside the museum [76].
Another technological solution that might find a broad application in smart museums isaudio-guides. However, a study [77] that was dedicated to reviewing audio-guides in the era ofSmart Tourism found that the use of audio-guides is still unexpectedly low. The study identified fourmajor reasons for this: (1) firstly, in many cases, the environment is not audio-guide friendly, with toomany noises and people who may disturb the listeners; (2) the use of audio-guide devices is stillnot user-friendly enough for casual users, who get frustrated when they have to operate the devicewhen entering every new exhibition or change locations and eventually give up on using it; (3) the
167

Sustainability 2020, 12, 9287
devices also hinder any social activity and interaction between tour participants, making the wholeexperience feel extremely isolated; and finally, (4) the narrative of an audio-guide lacks the elasticity andindividuality of a tour guided by a person, who can adapt to the needs of individuals (many touristsdo not seek long detailed educational content, but would rather get brief information in favor of moreentertainment, taking pictures and simply embracing the ambiance of a place). This shows that thesimple adoption of technology is not enough to achieve “smartness” in tourism but rather createsgood conditions to do so; in combination with other technologies such as Augmented Reality and amore individual approach to customer needs, the mentioned issues can be overcome, as Boletsis andChasanidou [78] have shown in their work.
Another study by Empler [79] was dedicated to ICTs in museums; this work took the formof a case study on five museum installations in Italy. The study focused on already applied ICTsin the selected museums. The findings of this study were that, in museums with low numbers ofartifacts and exhibitions, technology offers an additional commutation layer for additional informationand the interactive enrichment of the visiting experience, offering unique visualizations of spacesand events that would otherwise be left to the imagination of the visitors. The author named threemain groups who benefit from these solutions: school children (who become more engaged andattracted by gamification in the studied sites), tourists for whom the visited site was not their firstchoice (because they were only familiar with the most famous, main museums in city) and scholars(referring to scientists who specialize in the field of the given museum’s theme).
One can also find examples of studies regarding the needs and expectations of museum visitorsregarding ICT use in such sites. One such example is the study by Owen et al. [80], which was conductedin five Cultural Heritage sites in the UK. The research indicated the underutilization of ICTs in thestudied cases. However, it also showed that visitors strongly support advanced applications, such asAR, interactive museum installations, avatar applications and mobile media guides. The respondentsin this particular study also indicated that the variety of technologies used in a site has more impact ontheir satisfaction rating than how they are used. The main objective of such technology providers is topresent the expected benefits that come from using technology to the visitor, because tourists haveto decide what they will spend their limited time on and will not trade it off for something withoutknowing its possible advantages. As another example, in the study by Rey and Casado-Niera [81],the authors studied perceptions and expectations regarding the use of ICTs in museums based ona survey that was conducted on 115 participants. The study showed that many tourists are notfully aware of the possibilities and advances that ICTs offer. It is expected that ICTs will not beused as a replacement for traditional information carriers, but rather as tools that can enhance thevisitors’ experience by supplementing the already existing information and offering a cognitive andsensory addition to the experience. The expectations included also that ICTs would take a role thatsupports contact, information sharing and carrying out cultural activities. These observations aresupported by a different study from Indonesia showing that if a museum falls behind the trend ofintroducing new technologies, it quickly loses its visitors because it gets perceived as boring, ancient andunmaintained [82] or not personalized enough for individual visitors [83].
Finally, it is worth underlining the fact that Smart Tourism does not only benefit tourists and touristservice providers but has a significant role in the sustainable development of the whole destination.Smart Tourism adopts the perspective that tourists generate information that can be used to track theiractivity and that this information can be utilized not only to improve their experience but also to helpdevelop plans for the future in terms of better tourist distribution and the protection of the local societyand natural resources [84]. Big Data is only one of many ICTs that can be useful for this; the Internet ofThings, data mining, cloud computing and other modern technologies have expanded tourism to anew dimension, and they play now an important role in sustainable growth [85] as a developmentdriver for tourism and society [33,70]. Many researchers confirm that Smart Tourism contributes to thecreation of innovation and technology development and aids sustainability [70,86,87].
168

Sustainability 2020, 12, 9287
To conclude the theoretical section of this paper, it can be stated that the use of ICTs is inevitable inSmart Tourism, and the literature is full of different conceptions regarding its role and which particulartechnologies are key to its success. A large amount of research has been done analyzing the benefits ofSmart Tourism application in tourist destinations, as well as on the potential benefits for tourists thatICTs can provide. Studies that focus on the service providers are rare, and works that focus on an entirebranch, such as museums, are even scarcer. As presented in this section, the studies that do concentrateon museums are mainly case studies of specific institutions or are dedicated to a selected technology.This observation led the author of this publication to explore this field in more depth, adopting a morecomprehensive approach and conducting research on all museums in a country (selecting their nativecountry of Poland for the best communication possibilities with the researched entities and the bestfamiliarity with their environment, as gathered from previous studies). The aim of this work was torecognize the cross-section of ICT use in the entire sector and the museum managers’ attitudes towardsadopting ICTs and the Smart Tourism concept. Museums seem to be an interesting choice becausethe most important and most recognizable (and therefore most visited) examples are public entities;therefore, they also reflect the national approach and policies of a given country to this concept.
3. Materials and Methods
According to the register of Polish museums published by the Ministry of Culture and NationalHeritage [88], there were 879 registered museum entities in the whole of Poland in April 2020. However,the list includes not only museums that are already operational, but also museums that are still inpreparation or being organized. The list also contains departments of a parent entity (if a museum hasone or more branches in different locations but are run by the same parent organization, each of themhas a separate record on the list). Therefore, for this research, the list was narrowed down to activemuseums and only to the main parent units if a museum had multiple departments (thus, a recordwas excluded if it related to a museum that was marked as “in preparation” or as a branch of a mainmuseum on the list). With those restrictions, the final list counted 500 entities.
For 2 months, from the beginning of May 2020 until the end of June 2020, an invitation toparticipate in the research and three reminding messages (with a 2-week interval) were sent via email(because of the COVID-19 restrictions) to the 500 museums. The respondents were asked to fill out anonline form (using Google forms) that included 28 questions which provided the overall characteristicsof a museum, listed the technologies used in it and provided an insight into the awareness of SmartTourism and the application of technological solutions in that given museum. The questionnairedid not contain any questions about the museum’s name and precise location to ensure anonymity.The research was anonymous because of the desire to obtain reliable information that was not burdenedwith the emotional factor of museums wanting to present themselves as better than their competitors.Figure 1 presents the described research process in a synthesized diagram form.
Figure 1. Research subject selection and data collection diagram.
169

Sustainability 2020, 12, 9287
Since the intention of the author was to keep the confidence interval below 5% at a confidencelevel of 95%, the sample size had to extend to over 217 respondents. This goal was reached at theend of June, when the 218th filled form was sent back to the author, and the data collection processwas ended.
The collected data were analyzed and visualized using the R programing language and RStudioopen software.
4. Research Results and Analysis
4.1. General Characteristics of the Research Sample
As mentioned above, 218 museums from across Poland participated in the presented research.The majority of the responses came from public museums (83.94%). The remaining answers camefrom private museums (10.09%) and the voluntary sector (5.05%), and two entities were marked asmixed (public–private) ownership (0.92%). The researched population differs from this proportion to acertain extent. The private sector makes up 32.02% of the 500 unique museums from the Ministeriallist (and public entities make up the remaining 67.98%).
In Figure 2, one can see the spatial distribution of museums participating in the research,divided into voivodeships (administrative regions of Poland). Panel (a) shows the share of museumsfrom a given voivodeship participating in the study, and in panel (b), the share of museums from agiven voivodeship in the research sample is shown.
(a) (b)
Figure 2. The share of museums participating in the study, presented (a) as the percentage of allregistered museums in a given voivodeship and (b) as a percentage of the total number of museumstaking part in the research.
It can be seen that museums located in southern and eastern voivodeships showed the highestresearch participation turnout (with Podlaskie voivodeship museums reaching the highest response rateof 75%, and Zachodnioporskie exhibiting the lowest, at 20%). Additionally, the museums from southernand central Poland made up the majority of the research sample (with Małopolskie voivodeship havingthe highest share of 15.6%).
The first questions in the research form provided basic data that allowed the general characteristicsof Polish museums to be obtained. One of the main parameters that describe these entities is thenumber of tourists visiting a museum annually. The participants were asked for the total number oftourists visiting their object in the previous year (2019). The main descriptive statistics for this variableare shown in Table 1.
170

Sustainability 2020, 12, 9287
Table 1. Descriptive statistics for the variable describing the number of tourists visiting Polish museumsin 2019.
Statistic Value
Min. 01st Quartile 7500
Median 20,000Mean 84,768
3rd Quartile 64,427Max. 2,320,000
As can be seen, the mean value is quite high, extending beyond the third quartile. This is becauseof the small number of museums with an extraordinarily high number of annual visitors in comparisonto other museums; e.g., the internationally recognized museum in the former Auschwitz concentrationcamp (the maximum value probably comes from this site, but it is worth mentioning that the researchforms were anonymous, so there is no certainty).
In Figure 3, the distribution of the annual tourist number is shown, varied by the sector ofownership (the mixed sector was omitted, since it contained only two observations, and for betterclarity, the outlying values were also left out).
Figure 3. The annual number of tourists in Polish museums, varied by the type of ownership sector.
It can be seen that the number of tourists visiting public museums is much more varied than inthe case of private museums or those from the voluntary sector. The value of the first quartile for thepublic sector is significantly higher than the median for the private sector and almost matches themedian of the voluntary sector. One might assume that the reason for this may be the fact that manypublic museums offer free entry once a week, and because of the public funding, the entry tickets areoften also cheaper during the rest of the week in comparison to private museums. Figure 4 shows thisby illustrating the distribution of entry prices to museums from all three sectors, and Table 2 containsthe descriptive statistics of this variable.
Figure 4. The entry ticket price to Polish museums (in PLN), varied by the type of ownership sector.
171

Sustainability 2020, 12, 9287
Table 2. Descriptive statistics for the variable showing the entrance fee in Polish museums.
Statistic Value
Min. 0.01st Qu. 5.0Median 10.0Mean 11.4
3rd Qu. 15.0Max. 70.0
The ticket price range for the museums in the public sector is visibly smaller than in theother two sectors. It is also worth mentioning that the shown prices are in Polish Złoty (PLN)(1 PLN ≈ 0.25 USD/0.22 EUR (by exchange rates from the beginning of July 2020)). Additionally,it should be noted that the respondents were asked to name the price for their most commonly chosentour in case there were multiple variants available.
However, the assumed dependency between price and annual tourist count has been negatedby a statistical test. The Pearson’s correlation coefficient between those two variables indicates amoderate positive correlation (PCC = 0.59 and p-value < 2.2 × 10⁻¹⁶), meaning that the more populara museum is, the higher the price (which is understandable and economically justified). Therefore,the reason for such a large number of people visiting public museums must be something other thantheir relatively low price; it is probably related to the quality of the exhibits and their better fit to thetaste of mass visitors.
The last chosen general characteristic of Polish museums was their theme or discipline.Most entities (59.6%) from the research sample selected only one kind of theme that their museumfocuses on; the remaining 40.4% can be tagged as interdisciplinary museums. In Figure 5, how oftenevery kind of museum was selected by the respondents is shown.
Figure 5. The share of selected kinds of museum selected by the research participants.
As can be observed in the plot above, almost half of the museums declared that history is theirmain domain, while over a third of the research sample represented regional museums. The leastrepresented kinds of museum were nature and agricultural museums.
4.2. Smart Tourism in Polish Museums
The main objective of this study was to recognize the development stage of the Smart Tourismconcept in Polish museums. To do so, it was important to approach this problem both directly andindirectly; the direct approach refers to the awareness of Smart Tourism solutions and their purposefulapplication in museums, while the indirect approach relates to the recognition of solutions that areused in Polish museums and are—or could be—used in Smart Tourism but are not recognized as suchby the museum officials.
The direct approach was simple and straightforward. The representatives were asked if they werefamiliar with the Smart Tourism term (and if they were, they had to declare their attitude towards it).The share of responses to this question is depicted in Figure 6.
172

Sustainability 2020, 12, 9287
Figure 6. The recognition of Smart Tourism in Polish museums.
The collected data show that most (72%) of the museums in Poland were unfamiliar with theidea of Smart Tourism. Nearly a tenth (9.2%) declared that they knew the concept but were notplanning to implement it, and only 17.9% were planning to do so in the future. Only a marginal fraction(0.9%) claimed that they had already realized this function. There was no significant difference in thedistribution of the answers to this question in museums from various ownership sectors, kinds ofmuseums or in museums run by different levels of administration.
Based on the data above, one might say that the development stage of Smart Tourism in Polishmuseums is low, at least in the area of its deliberate use. The following questions that were asked in theresearch form were designed to identify areas in which Smart Tourism has been implemented withoutthat intention and to reveal the potential to change this low level of development of Smart Tourism.
First, the respondents were asked to select all the available tour types in their entity and to identifyhow common tours that use modern technology to extend the traditional sightseeing experience are.Figure 7 contains the percentages showing how often a given sightseeing option was confirmed bythe respondents.
Figure 7. The forms of sightseeing available in Polish museums.
One can see that the majority of the researched museums used traditional forms of sightseeing,with over 80% of museums offering individual sightseeing or optionally guided tours. It may beargued that if 83.03% of museums offer guided tours as an option, the result of 22.48% of mandatoryguided tours should be excluded; however, this might be explained by the fact that some museumsoffer various products (different routes or multiple locations), where some require a mandatory guideservice and others do not. The fact that over a fifth (21.1%) of the researched entities offer audio guidedtours and over a tenth (10.55%) incorporate tours that are guided through a mobile application shouldbe noted as a positive input regarding Smart Tourism’s development potential.
Furthermore, many researched sites declared that they were already planning to introduce moremodern solutions to the visitors’ experience. This is illustrated in Figure 8.
173

Sustainability 2020, 12, 9287
Figure 8. The forms of sightseeing that are planned for introduction in Polish museums.
Should these planned actions be realized, the total percentage of museums in Poland offeringaudio-guided tours would reach a decent share of approximately 40%, and the number of sites withthe option of using mobile applications for guidance would double to a modest 20%.
One of the key aspects of Smart Tourism is to serve and support one of the main requirementsof modern tourism—increasing a destination’s attractiveness—and therefore to attract more tourists,both domestic and foreign. In this sense, the adaptation of a touristic entity to provide services inmultiple languages might be considered to be another Smart Tourism development indicator. For thispurpose, the study participants had to select the number of languages that were available for varioussources of information about their site. Figure 9 presents the share of answers for each selectedinformation source.
Figure 9. The number of available languages in selected information sources for museum visitors.
Interestingly, the collected data show that foreign languages are widely available in Polishmuseums, particularly in the case of guided tours. These tours are available in the Polish languageexclusively in approximately only a quarter of the museums; the remaining majority of the researchedentities offer these tours in at least one language other than Polish. Surprisingly, the websites are on theother end of the spectrum in this matter; over half (53.46%) of all museum websites are not availablein languages other than Polish. This could be an area for relatively easy improvement in the future,especially because most of the researched sites have access to translation services and have alreadyemployed them for other materials, such as leaflets or information boards on the exhibits.
Continuing the subject of accessibility for foreigners and domestic visitors through modern media,the representatives of the researched museums were asked to name the mobile application in withtheir object is positioned. In Figure 10, the shares of museums using each selected mobile applicationare shown. The applications were selected based on one of the author’s previous papers that wasdedicated to the issue of mobile applications in tourism [89].
174

Sustainability 2020, 12, 9287
Figure 10. The presence of Polish museums in selected mobile applications.
Starting from the highest result, one may interpret the relatively high score of 53.21% of museumsbeing registered on TripAdvisor as a positive result from the perspective of the potential of SmartTourism in Polish museums. TripAdvisor is one of the most popular applications dedicated to touristsglobally. Such a large share of museums using the service to make themselves easier to find fordomestic and international tourists makes up to some extent for the lack of foreign languages on theirwebsites. The second-highest score (28.9%) relates to “Polska Niezwykła,” a Polish application withone of the richest databases of touristic sites in Poland [89]; unfortunately, this application supportsonly the Polish language. On the other hand, the fact that over a quarter (25.69%) of the museumsdo not use any mobile application to promote themselves leaves a significant unused potential thatshould be explored in the future. The fourth- and sixth-highest results also correspond to domesticapplications, and the last three correspond to international apps (again, revealing a potential that hasnot yet been fully exploited). The bar named “other apps” refers to mobile applications that have beennamed by fewer than five respondents and were added together to form a single group.
The idea that the use of technology could be significantly improved in Polish museums is reinforcedby further findings of this research. In the following question, the participants of the study were askedabout the use of online systems for reservations on ticket sales. The answer distribution is pictured inFigure 11.
Figure 11. The availability of online tour purchases and reservations in Polish museums.
As shown above, more than half (57.34%) of museums in Poland do not use any online tools forticket sales or reservations; these can only be made on-site or via a phone call. Less than a fifth (17.89%)
175

Sustainability 2020, 12, 9287
of the researched entities use online tools both for tour reservations and entry ticket sales, and theremaining quarter allow only one of those options—either reservations (14.68%) or purchases (10.09%).
Another important aspect of Smart Tourism is to not only use technological solutions to improveservice quality and accessibility but also to use those inputs to collect and utilize data that could beused for future improvements as well as for other entities belonging to a larger structure, such as aSmart City. To explore this aspect in Polish museums, the research form included questions aboutthe museum’s approach to the collection of data (regarding clients, employees, finance, inventory,business partners, tour reservation history and tour sales). The respondents could choose one of thefollowing options, for each kind of data: the data are archived, the data are kept only temporarily,the data are not collected, the data are collected and used to build a database or the data are onlykept by the period required by law (i.e., for insurance or tax purposes). The results are visualized inFigure 12.
Figure 12. Data collection in Polish museums, varied by the subject that the data concern.
The attitude towards data collection in Polish museums varies depending on what the dataconcern. Surprisingly, the kind of data that is least recorded by the museums is about their clients(39.91% of all museums claim that they do not collect any data regarding their customers) and pastreservations (37.61% of museums do not gather this information). It could also be considered unusualthat the second-highest share of data, which is kept only because of legal restrictions, concerns businesspartners (40.83%, exceeded only by the 52.29% of data regarding employees). The information about amuseum’s inventory was named as the most frequently archived data (44.04%), as well as representingthe highest share of the information used to build a database. The presented results might be interpretedas an indication of an outdated, old-fashioned approach to data exploitation in Polish museums.This is because the inventory data that are mostly archived and utilized in databases can be considered
176

Sustainability 2020, 12, 9287
the least useful for generating new knowledge; the data also do not lead to innovative solutions forproviding services for tourists or giving related urban institutions information that could be used bythem. The collection of these data is simply for the internal convenience of the museum in catalogingand keeping track of their exhibits. This thought is only reinforced by the results from a follow-upquestion that concerned the familiarity of museums with Big Data and its analysis. Figure 13 containsthe results.
Figure 13. The recognition of Big Data and its use in Polish museums.
The majority (58.26%) of the researched museums are not familiar with the concept of Big Data,and the second biggest share (21.1%) of answers was for “we are familiar with it, but we do not use itand do not intend to do so in the future”. Only a marginal (<6%) percentage of all researched museumsclaim to use Big Data and analyze it to improve their functionality, where 4.59% do their own researchand 1.38% rely on analysis that is outsourced or prepared by parent institutions.
Smart Tourism does not only refer to the use of technology and information collection but alsoto the application of those means for a bigger cause—improving cooperation and achieving goalson a larger scale (within a Smart City, a region, a country or even larger scales). However, to do so,information, data and the knowledge gained from them need to be made accessible and be shared.Therefore, the research form included a question about the museum’s attitude towards data sharing,and the results are shown in Figure 14.
Figure 14. The attitude of Polish museums to data sharing.
The presented results show that the most common attitude towards data sharing is ratherconservative, where over half (57.34%) of the museum representatives claimed that they do not shareany information beyond legal obligations (resulting from contracts and law) on their own initiative.On the other hand, over half (54.59%) of the researched entities are willing to share information in
177

Sustainability 2020, 12, 9287
response to formal requests (i.e., from government units, researchers or statistical offices). Interestingly,even if the majority of the research sample was made up of public museums, only 5.5% of them agreeto share data with parent institutions (i.e., the city hall or Marshal’s Office). This, with the addition ofthe 17.89% share for data sharing with business partners, may indicate a lack of initiative regardingSmart Tourism in the environment in which the museums function. As the results show, most ofthe museums are able and willing to share data (this is indicated by the high share for the answer“we share data in response to requests”), but the surrounding environment (local and national policies,public and business entities) is simply not oriented to gathering and utilizing data yet and thereforedoes not demand it.
Knowing that most Polish museums are not familiar with the popular concept of Big Data, but alsoknowing that a significant portion of the information is being kept by them (in the form of temporarystorage, archive or even a database), the next question asked in the research form was specificallyabout the use of databases by business partners, clients, contractors and suppliers that cooperate withthe investigated museums. The received answers may appear to be somehow inconsistent with theprevious answers, as shown in Figure 15.
Figure 15. The use of databases in Polish museums, varied by subject. DB: database.
It should be noted that, even if the highest share of all database subject categories correspondedto the statement that a given museum does not need a database, all the other answers indicate a higherlevel of database use (over 40% in all categories when combining the use of a museum’s own andexternal databases) than might arise from the previously discussed results (from Figure 11 especially).A probable explanation for this that provides consistency to the logic of those answers might be thatthe museums use databases to store information that in previous questions were marked as only beingkept temporarily or only for the time required by law. If so, this might be another field for improvement
178

Sustainability 2020, 12, 9287
in the future: the awareness of the importance of data gathering and processing could be increasedthrough a better understanding of and orientation toward Smart Tourism.
To complete the investigation on the use of Smart Tourism-oriented technology in Polish museums,the final three questions concerned technologies used for communications, divided into the use of(1) social media, (2) means of communication and (3) modern technologies used in the everydayfunctioning of a museum. The social media question referred to the assessment of the frequency of useof a given medium by the museum to inform customers about its activity. The respondents could usean ordinal scale (from never to constantly) to assess the frequency of use of 11 globally recognizablesocial media platforms (Facebook, Instagram, LinkedIn, Pinterest, Reddit, Snapchat, TikTok, Tumblr,Twitter, WeChat and YouTube), as well as naming others if they used a medium not included on thelist. From those 11 selected social media platforms, seven were not used by most of the researchedentities (where 93% or more of the museums claimed they never used it). The distribution of givenanswers for the remaining four social media platforms is shown in Figure 16.
Figure 16. The use of social media by Polish museums.
It can be is seen that, apart from Facebook, social media platforms are used by the museums inPoland rather scarcely, with YouTube being the second most used by most of them. Given the factthat those two media platforms have been available for more than a decade, they do not attract theyoungest audience, who have migrated to newer media platforms that are growing in popularity.Therefore, those should be seen as more representative of today’s standard, which may quickly changein the future. The recommendation here would be to invest more interest into newer social mediaplatforms to keep pace with “tomorrow’s” customers and to awaken more interest in culture andhistory in today’s youth by reaching out to them through media and content they find interesting andappealing today (the latest studies have shown that Facebook is aging with its users, and younger users,although present there, use other platforms such as Snapchat or Instagram more extensively [90,91].
To complement the previous question, the museum representatives were asked to select whichmeans of communication are used within the institution and which are used when contacting customersor business partners. The respondents could choose between yes or no answers for each recipientgroup and each communication platform listed (12 in total). The share of positive answers for eachoption is shown in Figure 17.
The results show clearly that some communication media are preferred by the museums overothers, regardless of the type of recipient. Phone calls (both cellular and landline) and e-mail arethe most frequently used in contacts with clients, partners and within institutions. Additionally,short messages and the Facebook Messenger application are used by a significant share of museums,primarily, but not only, for internal communication. Surprisingly, although the study was conductedafter the strictest COVID-19 restrictions in Poland had been introduced, the communication mediathat aid distance working (via videoconferencing) were selected only by a minority of respondents.The picture emerging from these results suggests that the museums’ approach towards means of
179

Sustainability 2020, 12, 9287
communication is rather conservative, and they rely on traditional and standardized solutions. At thesame time, they also indicate that there is a portion of employees who are familiar with alternativesolutions but that those are kept for internal matters and not utilized for the external issues ofthe institution.
Figure 17. The means of communication used in Polish museums.
The closing question in the research form was designed to recognize the use of selected ICTtechnologies in Polish museums, concluding the investigation into the familiarity and application ofSmart Tourism solutions in those cultural institutions. The share of answers describing the currentstate of use of seven selected technologies is shown in Figure 18.
It can be seen that the technology that is already used by the highest share (50%) of museums isvirtual touring. This technology was selected as “already used” multiple times more frequently than anyother listed technology (the second highest result was 15.14% for cloud computing). Moreover, 36.7% ofmuseums decided they were interested in this technology and are planning to also introduce it in thefuture. Virtual tours were the second highest ranking (36.7%) technology planned for implementation,immediately behind the desire to design a dedicated mobile application for a given museum (37.16%).At this point, it is worth remembering that, according to the previous results, over half of the museumshave websites available only in the Polish language and another third in only one foreign language(presumably English). Apart from virtual tours, other technologies listed in the form were selectedby a comparable fraction of museums as solutions that are not used by them (ranging from 29.36%to 40.83%). Two of the listed technologies were selected as unknown by approximately half of themuseums: the Internet of Things (53.21%) and NFC with RFID (48.17%). Those two technologies areoften used in modern ICT and play a significant role in the smart concept (in Smart Homes, Smart Citiesand consequentially in Smart Tourism). The high rate of unfamiliarity in this matter is yet another
180

Sustainability 2020, 12, 9287
indicator that museums in Poland could increase their Smart Tourism potential and are not fully readyto embrace this concept without several improvements (mentioned earlier when they emerged fromthe presented results). The main reason for this is probably not the lack of will on the side of themuseums’ management but rather a matter of regional and national policies that are still not fullyoriented towards introducing Smart Tourism into Polish museum tourism; thus, the museums are notrequired to embrace those solutions.
Figure 18. The recognition and use of various technologies in Polish museums.
5. Discussion and Conclusions
Based on the research results, the main observation that can be made is that Smart Tourism is arather unknown concept to museums in Poland. However, the findings have also shown that there issome potential that would ease the introduction of this concept.
Traditional tours in Polish museums are the dominant form of sightseeing, but many museumshave introduced technical solutions that support their operation. Many museums plan to develop inthis area, especially by increasing the availability of audio-guided tours (if the museums fulfill theirdeclarations, the availability of this solution should reach 40%) and designing their mobile applications(the expected availability would reach approximately 20%).
Concerning the handling of the needs of international tourists, the research has shown greatdifferences in this matter depending on the given aspect of a museum’s operation. Most of the museumsoffer guided tours in at least one language other than Polish; on the other hand, over half of themuseums’ websites are only available in Polish and therefore are not suited for foreigners to findinformation there directly. This paucity is however compensated to some extent by the fact that overhalf of the researched entities are registered in an internationally recognized service; i.e., TripAdvisor.
181

Sustainability 2020, 12, 9287
Similar diversity pertains to the use of technology in museums. A prominent majority of theinstitutions in Poland do not enable customers to buy or reserve tours via an online system. Additionally,data and information that are or could be gathered by museums are not utilized to their full potential;often, they are not stored or are only kept to fulfill legal obligations. In the most developed regionsof the world that focus on sustainability and use technology to aid it, tourism is required to matchand keep up with the development of a Smart City. The flow of data and information, as well astheir understanding, analysis and effective use to gain benefits throughout this structure, form thebasis of this smart system. However, to do so, the public sector must undertake awareness-raisingactions and prepare courses on the use of appropriate data analysis tools for public institution workers.As the research results have shown, Big Data analysis and the building and using of databases aresparsely present in Polish museums. It is possibly even implied that museum management assumesthat future tourism will not differ from how it is conducted today, and that the use of technology isonly an oddity or an additional feature to their business, rather than the basis of future operation(this thought emerges from the fact that many museums are interested in creating mobile apps andcreating virtual tours on their websites while there is simultaneously a low interest in the Internet ofThings concept or the use of cloud computing and other crucial Smart Tourism solutions).
The museums’ attitude towards social media and communication platforms seems also not tofollow the newest trends, and they rather use traditional (in today’s standards) solutions, focusing theirInternet activity on Facebook and occasionally on YouTube. Reaching out and raising interest in culturefor young generations of tourists might require opening up to other communication channels thatreach them more effectively. The same might also apply to the expectations and needs of internationaltourists who come from wealthier and more developed countries, in which newer social media andcommunication platforms are more popular among a broader population. For example, foreign touristsmight not want to risk expensive international phone calls to gain information or make a reservationfor a museum tour, and the lack of an immediate response through e-mail communication might bediscouraging for them. A solution to this might be for museums to use not only traditional phoneservices for their booking service but also online communicators alongside them (i.e., WhatsApp).
The presented observations can be used to formulate recommendations for museums and regionaladministrations, which would increase Smart Tourism’s potential and allow for a full adaptation of theconcept in the future. These recommendations are presented as follows.
1. Official museum websites would benefit from being translated into English (and maybeother languages), or at least parts of them containing basic information about the institution(opening time, contact, available kinds of tours and pricing).
2. The museums should continue to mark their presence in mobile applications and continue toexpand the information about themselves in those media while also taking into considerationand concentrating more on the needs of both domestic and foreign tourists.
3. In the long-term perspective, the reservation and ticket sales systems should be modernized andbecome available via the Internet. In times when people can book a restaurant table or reserve anappointment in a barbershop through a dedicated service or a mobile app and official matters canbe handled completely through a government website, one might expect the same functionalityto be available in cultural institutions such as museums (which, as has been shown in the results,are mainly public entities).
4. It is important to raise awareness of how useful and valuable it is to gather, keep and analyzeinformation. Even if, at first glance, Big Data might seem not to be of the highest importance,from the museum’s perspective, it plays a key role in the whole “ecosystem” of a Smart City.Therefore, it is indirectly related to the operating of museums and in the end can provide benefitsin the form of better infrastructure, more recognition and attracting more visitors. The gathereddata could be also used to build databases that are of use for museums.
5. The museums’ presentation and promotion of offers should expand to more social media platforms,especially those that are gaining global popularity. Furthermore, the contact options could be
182

Sustainability 2020, 12, 9287
supplemented by a wider spectrum of communication platforms—mainly online—that couldbe used both (1) to reach technology-oriented customers (2) and in times when the traditionalfunctioning of a museum is disturbed (as in the case of the COVID-19 pandemic outbreak).
6. For the previous recommendations to be effective, it is important to consider Smart Tourismorientation in development plans for cities and regions by setting guidelines and requirementsthat have to be met. Without those, the intrinsic implementation of Smart Tourism solutions willremain dependent only on the intentions and goodwill of museum officials (and as the studyhas shown, there is no conviction of its importance for the future of museum tourism inside ofthose institutions).
One of the main contributions of this study to the field is a comprehensive summary of ICT andtechnology use in Polish museums, which may be representative for countries in a similar stage ofdevelopment that already embrace new technologies in the public domain but in which the adaptationof the Smart Cities concept is limited to few major cities (and not to its full extent). It shows thecross-section of to which extent each technology is used on average in this particular branch oftourism. The study has also shown that museums’ use of new technologies and ICTs is rather selective,with museums most of the time limiting themselves to technologies that are well-known and alreadysolidly established in the mainstream while also viewing them as an optional oddity and as anadditional attraction that does not represent the core of future services. Therefore, the study confirmsthat the hypothesis by Dorcic et al. [31] (that stakeholders do not fully recognize and appreciate theimportance of ICTs and their benefits) also applies to museums.
The identified weaknesses and areas that need development should be solved and removed overtime. A network approach on the city level (or even wider) to information and knowledge sharingwould help in the area of effective data collection and utilization, as well as knowledge and informationsharing, which was identified to be a weak spot in the studied entities. Additionally, a successfulapplication of such network solutions would also aid in the process of the adoption of the Smart Cityconcept (and consequently Smart Tourism), as it is one of its core elements [1,41,48]. Better fundingprograms and improved policies that support new technology being introduced into the public domainare also an important improvement that has to be made. Referring back to Pradhan [52], it is a keytask for tourism stakeholders to keep up with technologies and introduce a variety of them, not onlybecause they are key for further development but also, as Owen et al. [80] observed, if presented asadvantageous for tourists and used in a variety of ways, they have a significant impact on tourists’satisfaction. One might also expect that, because of this effect, private museums will be the first tofollow this path (their actions are not as limited by funding and law policies but driven by the freemarket, and therefore clients’ satisfaction is key for their survival), and afterward, public entities willfollow to meet the standards set by the private sector to stay competitive. The same effect is expectedto occur in the area of museums meeting the needs and expectations of international travelers thatwere currently identified to be lacking. Additionally, the development of society and the furtherpopularization of Smart Cities is also expected to be of help in this case, since it is based on the evolutionof society; as the concept of Smart People increases in recognition, the public will become more tolerant,cosmopolitan and open to the needs of others [35–37].
The conducted research has some limitations. The main limitation is that the final research samplecontained a greater proportion of public museums to private ones than in the general population thatwas researched. Therefore, the finding concerning private entities may not show the full picture ofthe Smart Tourism potential in this sector. The second limitation is that the study concerned only theinternal state of the museums.
Future studies could supplement these findings by adding observations from the macro- andmicroenvironment of museums. City and regional policies, as well as national regulations and fundingpolicies, could provide a wider perspective on the current state of Smart Tourism development inPoland. The presented results might also be useful in other studies on the same or related subjects inother countries, providing a reference point for comparisons and benchmarking.
183

Sustainability 2020, 12, 9287
Funding: This research received funding from the Ministry of Science and Higher Education in Poland.
Acknowledgments: This paper was published as part of the research project “Smart Tourism in Polish tourism”(original title: “Smart Tourism w polskiej turystyce”) No. 13/010/BKM20/0047, financed by the Ministry of Scienceand Higher Education in Poland.
Conflicts of Interest: The author declares no conflict of interest.
References
1. Komninos, N. The Age of Intelligent Cities: Smart Environments and Innovation-for-All Strategies; Routledge:London, UK, 2014.
2. Battino, S.; Lampreu, S. The role of the sharing economy for a sustainable and innovative development ofrural areas: A case study in Sardinia (Italy). Sustainability 2019, 11, 3004. [CrossRef]
3. Mathews, S.; Bianchi, C.; Perks, K.J.; Healy, M.; Wickramasekera, R. Internet marketing capabilities andinternational market growth. Int. Bus Rev. 2016, 25, 820–830. [CrossRef]
4. Ferrero, R.; Beattie, E.; Phoenix, J. Sensor city-A global innovation hub for sensor technology. IEEE Instrum.Meas. Mag. 2018, 21, 4–16. [CrossRef]
5. Law, R.; Buhalis, D.; Cobanoglu, C. Progress on information and communication technologies in hospitalityand tourism. Int. J. Contemp. Hosp. Manag. 2014, 26, 727–750. [CrossRef]
6. Ghaderi, Z.; Hatamifar, P.; Henderson, J.C. Destination selection by smart tourists: The case of Isfahan, Iran.Asia Pac. J. Tour. Res. 2018, 23, 385–394. [CrossRef]
7. Semerádová, T.; Vávrová, J.N. Using a systemic approach to assess Internet marketing communication withinhospitality industry. Tour. Manag. Perspect. 2016, 20, 276–289. [CrossRef]
8. Buhalis, D.; O’Connor, P. Information communication technology revolutionizing tourism. Tour. Recreat. Res.2015, 30, 7–16.
9. Aurélien, D.; Desiré, R. An Evaluation of Destination Management Systems in Madagascar with Aspect ofTourism Sector. Am. J. Ind. Bus. Manag. Sci. Res. Publ. 2014, 4, 9. [CrossRef]
10. Alaei, A.R.; Becken, S.; Stantic, B. Sentiment Analysis in Tourism: Capitalizing on Big Data. J. Travel Res.2019, 58, 175–191. [CrossRef]
11. Jovicic, D.Z. From the traditional understanding of tourism destination to the smart tourism destination.Curr. Issues Tour. 2019, 22, 276–282. [CrossRef]
12. Talón-Ballestero, P.; García-Muiña, F.E.; Rienda-Gómez, J.J.; González-Serrano, L. Repeat Consumer Behavioron Smart P2P Tourism Platforms. Sustainability 2019, 11, 7082. [CrossRef]
13. Femenia-Serra, F.; Perles-Ribes, J.F.; Ivars-Baidal, J.A. Smart destinations and tech-savvy millennial tourists:Hype versus reality. Tour. Rev. 2019, 74, 63–81. [CrossRef]
14. Gretzel, U.; Zhong, L.; Koo, C.; Cacho, A.; Mendes-Filho, L.; Estaregue, D.; Alves, C.; Moura, B.; Cacho, N.;Lopes, F. Mobile tourist guide supporting a smart city initiative: A Brazilian case study. Int. J. Tour. Cities2016, 2, 164–183.
15. Lepkowska-White, E.; Parsons, A. Strategies for monitoring social media for small restaurants. J. Foodserv.Bus. Res. 2019, 22, 351–374. [CrossRef]
16. Wang, X.; Li, X.R.; Zhen, F.; Zhang, J. How smart is your tourist attraction? Measuring tourist preferences ofsmart tourism attractions via a FCEM-AHP and IPA approach. Tour. Manag. 2016, 54, 309–320.
17. Xiang, Z.; Magnini, V.P.; Fesenmaier, D.R. Information technology and consumer behavior in travel andtourism: Insights from travel planning using the internet. J. Retail. Consum. Serv. 2015, 22, 244–249.[CrossRef]
18. Koo, C.; Shin, S.; Gretzel, U.; Hunter, W.C.; Chung, N. Conceptualization of smart tourism destinationcompetitiveness. Asia Pac. J. Inf. Syst. 2016, 26, 561–576. [CrossRef]
19. Xu, F.; Huang, S.; Li, S. Time, money, or convenience: What determines Chinese consumers’ continuanceusage intention and behavior of using tourism mobile apps? Int. J. Cult. Tour. Hosp. Res. 2019, 13, 288–302.[CrossRef]
20. Kim, M.J.; Chung, N.; Lee, C.K.; Preis, M.W. Motivations and Use Context in Mobile Tourism Shopping:Applying Contingency and Task-Technology Fit Theories. Int. J. Tour. Res. 2015, 17, 13–24. [CrossRef]
21. Wang, D.; Xiang, Z.; Fesenmaier, D.R. Smartphone use in everyday life and travel. J. Travel Res. 2016, 55, 52–63.[CrossRef]
184

Sustainability 2020, 12, 9287
22. Garcia-Madariaga, J.; Recuero Virto, N.; Blasco López, M.F.; Aldas Manzano, J. Optimizing website quality:The case of two superstar museum websites. Int. J. Cult. Tour. Hosp. Res. 2019, 13, 16–36. [CrossRef]
23. Dickinson, J.E.; Ghali, K.; Cherrett, T.; Speed, C.; Davies, N.; Norgate, S. Tourism and the smartphone app:Capabilities, emerging practice and scope in the travel domain. Curr. Issues Tour. 2014, 1, 84–101. [CrossRef]
24. Rasinger, J.; Fuchs, M.; Höpken, W. Information Search with Mobile Tourist Guides: A Survey of UsageIntention. Inf. Technol. Tour. 2007, 9, 177–194. [CrossRef]
25. Vecchio PDel Mele, G.; Ndou, V.; Secundo, G. Creating value from Social Big Data: Implications for SmartTourism Destinations. Inf. Process. Manag. 2018, 54, 847–860. [CrossRef]
26. Del Chiappa, G.; Baggio, R. Knowledge transfer in smart tourism destinations: Analyzing the effects of anetwork structure. J. Destin. Mark. Manag. 2015, 4, 145–150. [CrossRef]
27. Pine, B.J.; Gilmore, J.H. Welcome to the experience economy. Harv. Bus Rev. 1998, 76, 97–105.28. Neuhofer, B.; Buhalis, D.; Ladkin, A. Smart technologies for personalized experiences: A case study in the
hospitality domain. Electron. Mark. 2015, 17, 243–254. [CrossRef]29. Gomez-Oliva, A.; Alvarado-Uribe, J.; Parra-Meroño, M.C.; Jara, A.J. Transforming Communication Channels
to the Co-Creation and Diffusion of Intangible Heritage in Smart Tourism Destination: Creation and Testingin Ceutí (Spain). Sustainability 2019, 11, 3848. [CrossRef]
30. Cuesta-Valiño, P.; Bolifa, F.; Núñez-Barriopedro, E. Sustainable, Smart and Muslim-Friendly TouristDestinations. Sustainability 2020, 12, 1778. [CrossRef]
31. Dorcic, J.; Komsic, J.; Markovic, S. Mobile technologies and applications towards smart tourism–state of theart. Tour. Rev. 2019. [CrossRef]
32. Guzal-Dec, D.; Zwolinska-Ligaj, M. The social field of smart villages concept: The case of peripheralregion—Lublin province in Poland. In Proceedings of the 2018 International Conference Economic Sciencefor Rural Development, Jelgava, Latvia, 9–11 May 2018; Volume 49, pp. 296–306.
33. Buhalis, D.; Amaranggana, A. Smart Tourism Destination. In Information and Communication Technologiesin Tourism; Xiang, Z., Tussyadiah, I., Eds.; Springer International Publishing: Cham, Switzerland, 2014;pp. 553–564.
34. Hollands, R.G. Will the real smart city please stand up? Intelligent, progressive or entrepreneurial? City2008, 12, 303–320. [CrossRef]
35. Vanolo, A. Smartmentality: The smart city as disciplinary strategy. Urban Stud. 2014, 51, 883–898. [CrossRef]36. Caragliu, A.; Del Bo, C.; Nijkamp, P. Smart Cities in Europe. J. Urban Technol. 2011, 18, 65–82. [CrossRef]37. Lombardi, P.; Giordano, S.; Farouh, H.; Yousef, W. Modelling the smart city performance. Innov. Eur. J. Soc.
Sci. Res. 2012, 25, 137–149. [CrossRef]38. Harvey, D.; Harvey, F.D. Spaces of Hope; University of California Press: Berkeley, CA, USA, 2000; Volume 7.39. Davis, M. Who Will Build The Ark? New Left Rev. 2010, 61, 29–46.40. Shen, S.; Sotiriadis, M.; Zhang, Y. The Influence of Smart Technologies on Customer Journey in Tourist
Attractions within the Smart Tourism Management Framework. Sustainability 2020, 12, 4157. [CrossRef]41. Celdrán-Bernabeu, M.A.; Mazón, J.N.; Ivars-Baidal, J.A.; Vera-Rebollo, J.F. Smart tourism. A study on
systematic mapping. Cuad. Tur. 2018, 41, 655–658. [CrossRef]42. Khan, M.S.; Woo, M.; Nam, K.; Chathoth, P.K. Smart City and Smart Tourism: A Case of Dubai. Sustainability
2017, 9, 2279. [CrossRef]43. Chung, H.C.; Chung, N.; Nam, Y. A Social Network Analysis of Tourist Movement Patterns in Blogs:
Korean Backpackers in Europe. Sustainability 2017, 9, 2251. [CrossRef]44. Kiatkawsin, K.; Sutherland, I.; Lee, S.K. Determinants of Smart Tourist Environmentally Responsible Behavior
Using an Extended Norm-Activation Model. Sustainability 2020, 12, 4934. [CrossRef]45. Femenia-Serra, F.; Neuhofer, B.; Ivars-Baidal, J.A. Towards a conceptualisation of smart tourists and their
role within the smart destination scenario. Serv. Ind. J. 2019, 39, 109–133. [CrossRef]46. Gretzel, U.; Sigala, M.; Xiang, Z.; Koo, C. Smart tourism: Foundations and developments. Electron. Mark.
2015, 25, 179–188. [CrossRef]47. Vargas-Sánchez, A. Exploring the concept of smart tourist destination. Enl. Tour. Pathmak. J. 2016, 6, 178–196.48. Buhalis, D. Technology in tourism-from information communication technologies to eTourism and smart
tourism towards ambient intelligence tourism: A perspective article. Tour. Rev. 2019, 75, 267–272. [CrossRef]
185

Sustainability 2020, 12, 9287
49. Colby, C.; Bell, K. The On-Demand Economy Is Growing, and Not Just for the Young and Wealthy.Available online: https://hbr.org/2016/04/the-on-demand-economy-is-growing-and-not-just-for-the-young-andwealthy (accessed on 15 June 2020).
50. Li, Y.; Hu, C.; Huang, C.; Duan, L. The concept of smart tourism in the context of tourism informationservices. Tour. Manag. 2017, 58, 293–300. [CrossRef]
51. Yoo, C.; Kwon, S.; Na, H.; Chang, B. Factors Affecting the Adoption of Gamified Smart Tourism Applications:An Integrative Approach. Sustainability 2017, 9, 2162. [CrossRef]
52. Pradhan, M.K.; Oh, J.; Lee, H. Understanding Travelers’ Behavior for Sustainable Smart Tourism:A Technology Readiness Perspective. Sustainability 2018, 10, 4259. [CrossRef]
53. Lee, P.; Hunter, W.C.; Chung, N. Smart Tourism City: Developments and Transformations. Sustainability2020, 12, 3958. [CrossRef]
54. Koo, C.; Mendes-Filho, L.; Buhalis, D. Guest editorial: Smart tourism and competitive advantage forstakeholders. Tour. Rev. 2019, 74, 1–128. [CrossRef]
55. Gretzel, U.; Zhong, L.; Koo, C. Application of smart tourism to cities. Int. J. Tour. Cities 2016, 2, 106–108.[CrossRef]
56. Buonincontri, P.; Micera, R. The experience co-creation in smart tourism destinations: A multiple caseanalysis of European destinations. Inf. Technol. Tour. 2016, 16, 285–315. [CrossRef]
57. Ivars-Baidal, J.A.; Celdrán-Bernabeu, M.A.; Mazón, J.N.; Perles-Ivars, Á.F. Smart destinations and theevolution of ICTs: A new scenario for destination management? Curr. Issues Tour. 2019, 22, 1581–1600.[CrossRef]
58. Gómez Oliva, A.; Server Gómez, M.; Jara, A.J.; Parra-Meroño, M.C. Turismo inteligente y patrimonio cultural:Un sector a explorar en el desarrollo de las Smart Cities. Int. J. Sci. Manag. Tour. 2017, 3, 389–411.
59. Cheung, C.M.K.; Lee, M.K.O.; Rabjohn, N. The impact of electronic word-of-mouth: The adoption of onlineopinions in online customer communities. Internet Res. 2008, 18, 229–247. [CrossRef]
60. Chu, S.; Kim, Y. Determinants of consumer engagement in electronic word-of-mouth (eWOM) in socialnetworking sites. Int. J. Advert. 2011, 30, 47–75. [CrossRef]
61. Martínez-Sala, A.M.; Monserrat-Gauchi, J.; Campillo Alhama, C. The relational paradigm in the strategiesused by destination marketing organizations. Rev. Lat. Comun. Soc. 2017, 72, 374–396.
62. Martínez-Sala, A.M.; Cifuentes Albeza, R.; Martínez-Cano, F.J. Las redes sociales de las organizacionesde marketing de destinos turísticos como posible fuente de eWOM. Observatorio OBS* 2018, 3, 246–271.[CrossRef]
63. Campillo Alhama, C.; Martínez-Sala, A.M. La estrategia de marketing turístico de los Sitios PatrimonioMundial a través de los eventos 2.0. PASOS 2019, 17, 425–452. [CrossRef]
64. Martínez-Sala, A.M. Marketing 2.0 applied to the tourism sector: The commercial function of the websites ofdestination marketing organization. Vivat Acad. 2018, 143, 1–23. [CrossRef]
65. Parra-Meroño, M.C.; Beltrán-Bueno, M.A. Estrategias de Marketing para Destinos Turísticos; Eumed Universidadde Málaga: Málaga, Spain, 2016.
66. Hlee, S.; Lee, H.; Koo, C. Hospitality and Tourism Online Review Research: A Systematic Analysis andHeuristic-Systematic Model. Sustainability 2018, 10, 1141. [CrossRef]
67. Shaw, G.; Bailey, A.; Williams, A. Aspects of service-dominant logic and its implications for tourismmanagement: Examples from the hotel industry. Tour. Manag. 2011, 32, 207–214. [CrossRef]
68. Wang, Y.; Fesenmaier, D.R. Towards understanding members’ general participation in and active contributionto an online travel community. Tour. Manag. 2004, 25, 709–722. [CrossRef]
69. Caro, J.L.; Luque, A.; Zayas, B. Nuevas tecnologías para la interpretación y promoción de los recursosturísticos culturales. PASOS 2015, 13, 931–945.
70. Boes, K.; Buhalis, D.; Inversini, A. Smart tourism destinations: Ecosystems for tourism destinationcompetitiveness. Int. J. Tour. Cities 2016, 2, 108–124. [CrossRef]
71. Koo, C.; Gretzel, U.; Hunter, W.C.; Chung, N. The role of IT in tourism. Asia Pac. J. Inf. Syst. 2015, 25, 99–104.72. Shen, S.; Sotiriadis, M.; Zhou, Q. Could Smart Tourists Be Sustainable and Responsible as Well?
The Contribution of Social Networking Sites to Improving Their Sustainable and Responsible Behavior.Sustainability 2020, 12, 1470. [CrossRef]
73. González-Reverté, F.; Díaz-Luque, P.; Gomis-López, J.M.; Morales-Pérez, S. Tourists’ Risk Perception and theUse of Mobile Devices in Beach Tourism Destinations. Sustainability 2018, 10, 413. [CrossRef]
186

Sustainability 2020, 12, 9287
74. Ramos-Soler, I.; Martínez-Sala, A.-M.; Campillo-Alhama, C. ICT and the Sustainability of World HeritageSites. Analysis of Senior Citizens’ Use of Tourism Apps. Sustainability 2019, 11, 3203. [CrossRef]
75. Silva-Pedroza, D.; Marin-Calero, R.; Ramirez-Gonzalez, G. NFC Evaluation in the Development of MobileApplications for MICE in Tourism. Sustainability 2017, 9, 1937. [CrossRef]
76. Chianese, A.; Piccialli, F. Designing a smart museum: When cultural heritage joins IoT. In Proceedings of the2014 Eighth International Conference on Next Generation Mobile Apps, Services and Technologies, Oxford,UK, 10–12 September 2014; pp. 300–306.
77. Lee, S.J. A review of audio guides in the era of smart tourism. Inf. Syst. Front. 2017, 19, 705–715. [CrossRef]78. Boletsis, C.; Chasanidou, D. Smart tourism in cities: Exploring urban destinations with audio augmented
reality. In Proceedings of the 11th Pervasive Technologies Related to Assistive Environments Conference,Corfu, Greece, 26–29 June 2018; pp. 515–521.
79. Empler, T. Traditional Museums, virtual Museums. Dissemination role of ICTs. DISEGNARECON 2018,11, 13-1.
80. Owen, R.; Buhalis, D.; Pletinckx, D. Visitors’ Evaluations of ICTs Used in Cultural Heritage. In VAST;The Eurographics Association: Aire-la-Ville, Switzerland, 2005; Volume 2005.
81. Rey, F.B.; Casado-Neira, D. Participation and technology: Perception and public expectations about the useof ICTs in museums. Procedia Technol. 2013, 9, 697–704. [CrossRef]
82. Amanda, R.; Santosa, P.; Rizal, M.N. Analysis of Tourists Preferences on Smart Tourism in Yogyakarta(Case: Vredeburg Fort Museum). J. Phys. Conf. Ser. 2018, 1007, 12040. [CrossRef]
83. Podzharaya, N.; Sochenkova, A. The Concept of Smart Tourism Based on Museum Digitalization inMontenegro. In Proceedings of the 2020 9th Mediterranean Conference on Embedded Computing (MECO),Budva, Montenegro, 8–11 June 2020; pp. 1–4.
84. Encalada, L.; Boavida-Portugal, I.; Cardoso Ferreira, C.; Rocha, J. Identifying Tourist Places of Interest Basedon Digital Imprints: Towards a Sustainable Smart City. Sustainability 2017, 9, 2317. [CrossRef]
85. Gargiulo Morelli, V.; Weijnen, M.; Van Bueren, E.; Wenzel, I.; De Reuver, M.; Salvati, L. Towards intelligently-sustainable cities? From intelligent and knowledge city programmes to the achievement of urban sustainability.TeMA J. Land Use Mobil. Environ. 2013, 6, 73–86.
86. La Rocca, R.A. The Role of Tourism in Planning the Smart City. Tema J. Land Use Mobil. Environ. 2014,7, 269–284.
87. Gretzel, U.; Werthner, H.; Koo, C.; Lamsfus, C. Conceptual foundations for understanding smart tourismecosystems. Comput. Hum. Behav. 2015, 50, 558–563. [CrossRef]
88. The Museum Register by the Ministry of Culture and National Heritage in Poland. Available online: http://bip.mkidn.gov.pl/pages/rejestry-ewidencje-archiwa-wykazy/rejestry-muzeow.php (accessed on 6 April 2020).
89. Naramski, M.; Herman, K. The Development of Mobile Tourism in the Upper Silesian Metropolitan Area ofPoland. Sustainability 2020, 12, 44. [CrossRef]
90. Sprout Social, Social Media Demographics to Inform Your Brand’s Strategy in 2020. Available online:https://sproutsocial.com/insights/new-social-media-demographics/ (accessed on 15 June 2020).
91. The London School of Economics and Political Science, Social Media Platforms and Demographics. Availableonline: https://info.lse.ac.uk/staff/divisions/communications-division/digital-communications-team/assets/documents/guides/A-Guide-To-Social-Media-Platforms-and-Demographics.pdf (accessed on 15 June 2020).
Publisher’s Note: MDPI stays neutral with regard to jurisdictional claims in published maps and institutionalaffiliations.
© 2020 by the author. Licensee MDPI, Basel, Switzerland. This article is an open accessarticle distributed under the terms and conditions of the Creative Commons Attribution(CC BY) license (http://creativecommons.org/licenses/by/4.0/).
187


sustainability
Article
An Analytical Model of Tourist DestinationDevelopment and Characteristics of the DevelopmentStages: Example of the Island of Bornholm
Adam R. Szromek
Department of Organization and Management, Institute of Economy and Informatics, Silesian Universityof Technology, Akademicka 2A, 44-100 Gliwice, Poland; [email protected]; Tel.: +48-32-277-7336
Received: 8 November 2019; Accepted: 17 November 2019; Published: 7 December 2019
Abstract: This paper presents the basis of the tourism area life cycle (TALC) concept and its extensionin the context of the implementation of sustainable development practices in the tourist businessmodel. The author uses the logistic function to determine the level of tourist absorption and capacity.The empirical basis of the methods used was statistics on the development of the tourist industry onBornholm. The objective of the paper is to determine the stage of development of the tourist area ofBornholm and the consequences of this stage for business models of tourist enterprises functioningthere. The results of the analysis indicate that the range of tourist absorption was reached in the1960s–1970s, and that it is currently getting closer to the upper threshold of that range. Tourismon Bornholm, in line with the TALC concept, is currently in the stabilization stage. Future touristtrends on Bornholm depend on many factors; however, if tourist development goes into the declinestage, the offered products may require transformation, in terms of both transport and the form andavailability of tourist attractions. Perhaps this will involve a total transformation of the island into afacility with a specific entertainment, leisure, or business profile. The listed solutions will requireentrepreneurs to react within the scope of a transformation of their business models into sustainablemodels of tourist business.
Keywords: sustainability; business model; logistic function; TALC
1. Introduction
Sustainable tourism, which has been developing rapidly for only a few decades, assumes thatit is necessary to responsibly manage and use the natural and cultural resources made available fortourists. It is also a concept referring to the degradation of the natural and cultural environment causedby excessive tourist activity and the infrastructure established in tourist areas (currently defined asovertourism). Starting from the 21st century, this phenomenon has become an important element inrunning a tourist business, because, as researchers have noted [1] since 2002 in the academic literature,one can observe a specific kind of business model which is a sustainable business model, defined as aset of components in which the components and the stakeholders interact to create, provide, capture,and list sustainable value [2]. It is, therefore, a tool to include sustainable development rules in acompany’s value logic and the logic of value creation [3].
For many decades, scientists have been thinking about methods of identifying the stages ofdevelopment of tourist destinations and studying the impact of tourist congestion on the inhabitantsof these areas. Despite many proposals, it is still difficult to define a universal tool for identifying thecurrent stage of development of a tourist destination. However, this is often only achieved after thefact. The most frequently confirmed approach by researchers, the concept of the tourism area life cycle(TALC) proposed by Butler [4], assumes the possibility of developing tourist areas in stages, which willresult in exceeding the critical tourist capacity of the area, after which a reversal of the growing trend
Sustainability 2019, 11, 6989; doi:10.3390/su11246989 www.mdpi.com/journal/sustainability189

Sustainability 2019, 11, 6989
of increasing numbers of tourists visiting the area and a slow disappearance of the tourist function willoccur. In general, it is associated with the degradation of natural and cultural areas that previouslyencouraged tourists to visit the area and excessively expand the tourist industry.
This paper uses the logistic function to determine the level of absorption and tourist capacity. Theempirical basis of the methods used was statistics on tourism development on Bornholm. The objectiveof the paper is, therefore, to determine the stage of development of the tourist area of Bornholm anddetermine the consequences of this stage for business models of tourist enterprises functioning there.
2. Theoretical Basis of the TALC Concept and Sustainable Tourism: Literature Review
The concept of the tourism area life cycle (TALC), published in 1980 [4], describes the process oftourist area development, dividing it into stages and describing each stage. According to Butler, thedevelopment of a tourist area takes the shape of an asymptotic curve that, when repeated during thecourse of occurrence, creates a cyclical image of changes, which is especially visible in the number ofpeople visiting the tourist area annually. The diagram of the concept covers six stages of evolutionof a tourist town: exploration, involvement, development, consolidation, stagnation, and decline orrejuvenation (defined jointly as a stage of dichotomy divergence) [5].
When distinguishing the evolutionary stages of the area, the symptomatic variable was used inthe form of the number of tourists visiting a given town during the year. This is not the only variablerepresenting this phenomenon, as Butler, when characterizing specific stages, also used other features,including spatial and economic ones [6,7].
The first stage is the exploration stage [8]. It is present when individual tourists start to appear insmall numbers in a given area, attracted by natural or cultural aspects. These are the tourists whoorganize their stay independently and do not use common patterns of holidays, and they have aminimal influence on the lives of locals and the local economy. Next is the involvement stage, whentourists visit a given area more often and some locals begin to profit from accommodations, catering,medical services, etc. The engagement of locals takes place by participating in the economic activityenvisaged for tourists or by directing services mainly or solely toward visitors. In a tourist town,expectations emerge for organized forms of leisure, and pressure can be felt to improve transportationand facilities for tourists.
The moment when tourism becomes one of the main sources of income in a given area and thenumber of tourists is equal to or exceeds the number of locals, the development stage begins. This isthe stage that signifies that the tourist market is well-defined. Local services are replaced by touristorganizations outside of the tourist area, and as a result, modern and complex services and productsappear, the locals lose control over the development of tourist functions, local engagement decreases,and even antagonism on the part of the locals emerges.
The consolidation stage means full development of the tourist function in a given area. This ischaracterized by a decrease in the growth rate of the number of tourists, and tourism becomes themain area of the local economy. Next, the separation of therapeutic and tourist functions (healthresorts, hotels, restaurants) from social functions (for example, households) takes place in the cityspace. Attempts are made to extend the tourist season and expand the territory in which the servicesare rendered. Antagonism on the part of locals can intensify, along with an intensification of obstaclesto carrying out business.
Next is the stagnation stage, which is characterized by a steady inhibition of the growth dynamicsof increased numbers of tourists, achievement of a peak number of tourists in a given area, and then aresulting decrease in visitor numbers. The tourist infrastructure, excessively burdened by too manyusers based on its technical capacity, starts to malfunction, which leads to economic difficulties as wellas social and ecological problems. The area has well-defined but old-fashioned offerings and its imagedoes not match the region. The development has reached the outskirts, and properties change owners.
The last stage of the cycle can be twofold: the decline stage, which results in a total collapseof health resorts, or the rejuvenation stage, starting with stabilization during the stagnation stage,
190

Sustainability 2019, 11, 6989
which leads to re-expansion of tourist functions. In the literature on the subject, the last stage isdefined in various ways. Butler calls it a stage of decline and rejuvenation. Agarwal [5] uses theterm “post-stagnation”, as it takes place after the stagnation stage. At the same time, it is a stage ofdichotomy divergence, as it is characterized by the divergence of two stages (decline and rejuvenation).Even though they can occur in the same cycle, they cannot occur at the same time.
If, however, the decline stage takes place, it is characterized by a decrease in the number oftourists and closure of unprofitable hotels and spas, transforming them to other entities (for example,nursing homes, private apartments). The area cannot compete for tourists with other, more attractivetowns. The service offerings decrease, and the town becomes less attractive and attracts fewer tourists.If the town has a sufficiently large infrastructure, then weekend or one-day tourists start to arrive.Engagement of the locals emerges, this time often generating demand by purchasing services that arenow available at more affordable prices. The decline stage can end with total or partial disappearanceof the tourist function in a given area.
The town may, however, enter the rejuvenation stage, but this is not possible without sensibleand complex activities that aim to expose features that determine the attractiveness of the area.Oppermann [9] cites (and confirms) Defert’s [10] opinion, dating back five decades, that a tourist area,despite the decline stage, can begin a new life cycle. This is possible, thanks to the town’s abilityto adjust its advantages to the needs of tourists and improve the attractiveness of services (throughproduct modification). Butler proposed two solutions: the first is based on introducing artificialattractiveness (for example, by transforming entities into casinos), and the second is based on usingpreviously unused natural resources [11].
The concept also assumes a critical point of tourist absorption and capacity, which, once reached,results in development of the area in a steady direction toward decline. It is, therefore, a symbolic pointof overcrowding of the tourist area that, once achieved, degrades the tourist area and its attractivenessand, as a result, its popularity.
The analysis of Butler’s [4] concept is consistent with two economic concepts, with sources in themodel of cyclical economy development by Keynes: the concept of economic growth by Rostow [12]and the product life cycle by Kotler and Turner [13]. The TALC concept, from the moment it waspublished, was often criticized by researchers, but more often its development scheme was discoveredin many parts of the world. Butler, participating in the process of supplementing his own concepttwo decades after it was published, added additional features characterizing this model [14]. In 2000,Butler added the characteristics of eight elements, on which the concept is based, and six years later heexpanded the concept, collecting the experiences of other researchers working with his model [14,15].The key supplementation was the reference to weak points and advantages that the literature identifiedin the course of two decades and the proposal of terms explaining the reasons for development, changes,limitations, and interference in the tourist area (Figure 1). Butler named eight issues [16]: (1) dynamism:change over time, one of the most characteristic features of tourist activity; (2) process: understood asa feature that characterizes the changes taking place in a tourist area, enabling a model-based viewof development; (3) tourist absorption and capacity or development limitations: the model is basedon the claim that if the number of visitors exceeds the tourist absorption and capacity, the qualityof their experience will decline; (4) initiative factors: factors that cause change in a tourist area, e.g.,innovation; (5) management: it is crucial to emphasize the management of a tourist area as a whole(comprehensively), because many components in this area lack management, even though they haveseparate resources and properties; (6) long-term perspective: this perspective needs to be consideredwhen observing an area in the initial development phase; it is an indicator of both the effectiveness ofactions that delay the onset of the decline phase and intervention actions that initiate rejuvenationimmediately after stabilization, typical for stagnation; (7) spatial components: if the development inan area slows down, a locational shift of the tourist area is proposed to sites where development isstarting from the beginning or is continuing; and (8) universal application: the model was designed forall tourist areas, including specialized areas such as spa resorts.
191

Sustainability 2019, 11, 6989
Figure 1. Sustainable development and the tourism area life cycle (TALC). Source: own work basedon [4,17,18].
The literature also cites other developments of this concept, but due to the subject of this work,further discussions will focus on sustainable development issues. Within the basis of the TALC concept,one can distinguish the work by Boyd [18], who divided the cycle into several spheres. The firstsphere overlaps with the first two stages in Butler’s model and is named the balance sphere, wherethe emphasis is placed on ecological integration as a state where ecological and biological processesof ecosystem communities achieve self-maintaining balance. The second is the sphere of conditionalbalance, divided into two subspheres. The first one concerns the development stage, where economicbalance is desired (meaning improvement of the quality of life and the environment take place at thesame time), but focuses on economic growth and development, and then (in the second subsphere)on a return to the maintenance of ecological integration. In the development stage, a decrease inenvironmental tolerance can be observed, and in the consolidation stage (the first stage of the criticalrange of tourist capacity of the area), the increased factors resulting in ecological tensions can beobserved. The third sphere, located above the critical area, is the sphere of unbalance, where ecologicaldestruction takes place.
Weaver and Lawton [19] found a gap in Butler’s [4] concept and Boyd’s proposal [18]. Theyassumed that the critical tourist capacity area does not change during the life cycle of a tourist area. Yet,along with the development of the area, its capacity increases when it comes to tourist absorption. Thismeans that this sphere of tolerance, tension, and ecological damage, just like balance or its lack, doesnot have to be constant in the entire cycle. Weaver and Lawton [19] proposed two possible solutionsfor reaching a balance of supply and demand while maintaining critical capacity. The first one isabout adjusting the supply to demand; along with increased visitors, the capacity to accommodatenew tourists increases. It does not mean, however, that reaching a critical capacity is excluded, as it ispossible that the rate of facilities’ capacity growth will not match the development pace, and that thearea capacity limits will be reached. An alternative is to limit the demand to a defined supply size.Then, the critical capacity will remain unchanged, and when it is reached, balance will not be achieved,unless the gray market, which bypasses those restrictions, expands.
Weaver and Lawton [19] proposed the use of one or several of the following limitations:
• Introducing restrictions on the place or standards concerning the acceptable number of visitors• Enforcing development standards• Introducing limitations on the number of places and conditions for accommodation• Introducing spheres that set limits on tourist activity development
192

Sustainability 2019, 11, 6989
• Introducing bans on infrastructure expansion, for example, airports, or increasing entrance feesto a tourist region (for example, visa charges), the amount of which depends on the desireddemand reduction
It must be noted that in recent years, researchers and practitioners have more often developedcomplex solutions indicated by Weaver and Lawton. An example is the Global Sustainable TourismCouncil (GSTC) [20], which developed criteria for sustainable tourism that focuses on four thematicareas: sustainable management, socioeconomic impact, cultural impact, and environmental impact(including resource consumption, pollution reduction, and biodiversity and landscape conservation).The GSTC criteria take into account guidelines and standards on environmental, social, cultural,economic, quality, human rights, health, safety, risk, and crisis management issues, as well as boostconstant development. They were developed to ensure a common global understanding of “sustainabletourism” and represent a minimum that every tourist enterprise and tourist reception area should striveto achieve. Those criteria indicate what needs to be done in terms of implementation of sustainabletourism, but not how to implement it. The performance indicators are a complement to the criteriathat allow determination of the level of the implementation of set goals.
Buhalis [21] noticed that destinations experience various environmental and sociocultural impactsduring their development stages. He developed a set of features that characterize individual stages ofdevelopment of a tourist area (according to Bull’s concept). Table 1 lists several groups of such features,and among them are:
• Destination characteristics• Marketing response• Economic impact• Social impact• Environmental impact
A decade later, Szromek [22] supplemented Buhalis’ table [21], indicating the compatibility ofassigned properties of destinations with the concept of Plog [23,24], through the use of selected elementsof both concepts and their reconstruction to make them useful in spa areas and extend their theoreticalvalue, making them more utilitarian. Butler’s concept (TALC), which describes the phase developmentof tourist areas, uses a complex set of changes (in time) and economic characteristics that describeeach phase of the tourist area for preliminary identification of the current phase of development. Thesecond concept (Plog’s) explains the phase development of a tourist area by typological changes inthe dominant group of tourists, taking into account the original typology of visitors (allocentrics,near-allocentrics, midcentrics, near-psychocentrics, and psychocentrics). Combining the scientificframeworks of these two concepts allowed an evaluation of the theoretical possibility of verifying bothconcepts, which would give them more importance because of not only the descriptive abilities postfactum, but also the prospective feature by being able to identify the current phase of development.Ultimately, a set of features was obtained, and thus, symptoms that could help determine the variousstages of development were specified. The results are presented in Table 1.
193

Sustainability 2019, 11, 6989
Ta
ble
1.
Des
tina
tion
life
cycl
ean
dto
uris
mim
pact
sac
cord
ing
toth
eco
ncep
tofB
uhal
is,s
uppl
emen
ted
bySz
rom
ek.
Dev
elo
pm
en
tS
tag
es
of
the
To
uri
stA
rea
Plo
g/B
utl
er
Exp
lora
tio
nIn
vo
lvem
en
tD
ev
elo
pm
en
tC
on
soli
dati
on
Sta
gn
ati
on
Po
st-S
tag
nati
on
Do
min
an
tT
ou
rist
s
Allo
cent
rics
Allo
cent
rics
Nea
r-al
loce
ntri
csN
ear-
allo
cent
rics
Mid
cent
rics
Mid
cent
rics
Nea
r-ps
ycho
cent
rics
Nea
r-ps
ycho
cent
rics
Psyc
hoce
ntri
csPs
ycho
cent
rics
Feat
ures
char
acte
rizi
ngin
divi
dual
stag
esof
tour
ista
rea
deve
lopm
ent
Dest
inati
on
Ch
ara
cteri
stic
s
Num
ber
ofvi
sito
rsFe
wM
any
Too
man
yM
any
Man
y
Gro
wth
rate
–Lo
wFa
stgr
owth
Fast
grow
thSl
owgr
owth
Dec
linin
g
Cap
acit
yof
beds
–Ve
rylo
wLo
wH
igh
Very
high
Very
high
Occ
upan
cyra
te–
Low
Very
high
Very
high
Hig
hLo
w
Serv
ice
pric
es–
Hig
hVe
ryhi
ghH
igh
Low
Very
low
Expe
nses
per
pers
on–
Hig
hVe
ryhi
ghVe
ryhi
ghLo
wVe
rylo
w
Vis
itor
type
Dri
fter
sIn
nova
tors
Inno
vato
rsFo
llow
ers
Che
apm
ass
mar
ket
Bran
dan
dat
trac
tive
ness
–Lo
wVe
ryhi
ghH
igh
Low
Very
low
Tour
ists
are
seen
as:
Gue
sts
Gue
sts
Cus
tom
ers
Cus
tom
ers
Fore
igne
rs
Mark
eti
ng
Resp
on
se
Mar
keti
ngpu
rpos
e–
Aw
aren
ess
Info
rmPe
rsua
dePe
rsua
deLo
yalt
y/ne
wm
arke
t
Stra
tegi
cfo
cus
–Ex
pans
ion
Pene
trat
ion
Def
ense
Def
ense
Rei
ntro
duce
Mar
keti
ngex
pens
es–
Gro
win
gH
igh
Hig
hFa
lling
Con
solid
atin
g
Prod
uct
–Ba
sic
Impr
oved
Goo
dD
eter
iora
ting
Dec
ayin
g
Prom
otio
n–
Intr
oduc
tion
Adv
erti
sing
Trav
eltr
ade
Trav
eltr
ade
Trav
eltr
ade
Pric
e–
Hig
hH
igh
Low
erLo
wBe
low
cost
Dis
trib
utio
n–
Inde
pend
ent
Inde
pend
ent
Trav
eltr
ade
Trav
eltr
ade
Trav
eltr
ade
194

Sustainability 2019, 11, 6989
Ta
ble
1.
Con
t.
De
ve
lop
me
nt
Sta
ge
so
fth
eT
ou
rist
Are
a
Plo
g/B
utl
er
Ex
plo
rati
on
Inv
olv
em
en
tD
ev
elo
pm
en
tC
on
soli
da
tio
nS
tag
na
tio
nP
ost
-Sta
gn
ati
on
Eco
no
mic
Imp
act
s
Empl
oym
ent
–Lo
wH
igh
Very
high
Hig
hLo
w
Cur
renc
yex
chan
ge–
Low
Very
high
Very
high
Hig
hLo
w
Profi
tabi
lity
ofpr
ivat
ese
ctor
–N
egat
ive
Gro
win
gVe
ryhi
ghH
igh
Dec
linin
g
Res
iden
ts’i
ncom
e–
Low
Very
high
Very
high
Low
Very
low
Inve
stm
ents
–Lo
wVe
ryhi
ghVe
ryhi
ghLo
wVe
rylo
w
Nat
iona
linc
ome
and
taxe
s–
Low
Very
high
Very
high
Low
Very
low
Econ
omic
stru
ctur
e–
Bala
nced
Tour
ism
orie
nted
Tour
ism
dom
inan
tTo
uris
mde
pend
ent
Unb
alan
ced
and
nots
etsuffi
cien
t
Dep
ende
nce
onin
term
edia
ries
–N
eglig
ible
Low
Hig
hO
verd
epen
dent
Ove
rdep
ende
nt
Impo
rt–
Low
Very
high
Very
high
Very
high
Hig
h
Infla
tion
–Lo
wVe
ryhi
ghVe
ryhi
ghH
igh
Low
So
cia
lIm
pa
cts
Tour
istt
ype
Allo
cent
ric
Allo
cent
ric
Mid
cent
ric
Mid
cent
ric
Psyc
hoce
ntri
cPs
ycho
cent
ric
Tour
ists
’ori
gin
Nea
rby
citi
esN
earb
yci
ties
Reg
ion
Who
leco
untr
yC
ount
ryan
dab
road
Cou
ntry
and
abro
ad
Rel
atio
nsbe
twee
nto
uris
tsan
dlo
cals
–Eu
phor
iaA
path
yIr
rita
tion
Ant
agon
ism
Fina
l
Tour
ista
rea
dem
ogra
phic
s–
Imm
igra
nts
and
exis
ting
resi
dent
s
Youn
gse
ttle
rsw
orki
ngin
tour
ism
;rel
ativ
esu
stai
nabi
lity
Bala
nced
Bala
nced
Imm
igra
tion
due
tono
jobs
Ava
ilabl
ean
dol
der
resi
dent
s
Mig
rati
ons
into
uris
tare
a–
Low
Hig
hVe
ryhi
ghH
igh
Low
Cri
me
into
uris
tare
a–
Low
Hig
hH
igh
Very
high
Very
high
Fam
ilyst
ruct
ure
–Tr
adit
iona
lAff
ecte
dM
oder
nM
oder
nM
oder
n
En
vir
on
me
nta
lIm
pa
cts
Envi
ronm
enta
ndvi
ews
Uns
poile
dU
nspo
iled
Impr
oved
No
resp
ect
Pollu
ted
Dam
aged
Con
serv
atio
nan
dhe
rita
geU
nspo
iled
Uns
poile
dIm
prov
edN
ore
spec
tD
ecay
edD
amag
ed
Ecol
ogic
aldi
stur
banc
eU
nspo
iled
Uns
poile
dIm
prov
edN
ore
spec
tD
ecay
edD
amag
ed
Air
pollu
tion
Neg
ligib
leN
eglig
ible
Low
Hig
hVe
ryhi
ghVe
ryhi
gh
Wat
erpo
lluti
onN
eglig
ible
Neg
ligib
leLo
wH
igh
Very
high
Very
high
Con
gest
ion
and
traffi
cja
ms
Low
Low
Low
Very
high
Very
high
Low
Eros
ion
Low
Low
Hig
hVe
ryhi
ghVe
ryhi
ghVe
ryhi
gh
Sour
ce:o
wn
wor
kba
sed
on[2
1–24
].
195

Sustainability 2019, 11, 6989
It must be noted that the measurement and identification of development stages of destinationsare based on observations and experience. In the case of an island, it is also possible to refer to examplesfrom other destinations, especially coastal tourist destinations. Therefore, previous experiences fromvarious tourist destinations described in the literature, for example, Venice, Barcelona, Krakow, or eventhe Arctic [25], might provide interesting insights.
Trancoso González [26] looked at the problem of overtourism when analyzing congestion inVenice, a city that receives 30 million tourists per year and where tourists do not stop coming, alsomotivated by cruises (in 2017, 2.5 million people landed) [27]. However, the causes of the problem arenoticed in tourism democratization, which has led to disproportionate use, not in excess but with badmanagement, even if increasing consumption was foreseen. In the case of the island’s tourist traffic, itwas proposed to shift tourists’ attention to cruises.
Similar approaches were applied in other destinations. Examples include Barcelona and Palmade Mallorca. Huete and Mantecón presented an interesting analysis of these and other destinations,analyzing the phenomenon of “tourismophobia” in the scientific literature [28].
In the literature, there are many examples of the implementation of rescue or preventive solutionsfor excessive tourist traffic. Examples include the Biosphere Reserve in Rügen [29] and Wolin NationalPark in Poland [30] and many others, even global ones such as the World Network of BiosphereReserves (669 biosphere reserves in 120 countries) [31]. Therefore, this problem is noticed in a contextthat goes beyond tourism, although it is very related to this human activity. Stoll-Kleemann andO’Riordan [32] described this issue in the context of biosphere reserves. They noticed that in thenew era of the Anthropocene, characterized by planetary boundaries being exceeded, with negativeconsequences not only for “the environment” in an abstract sense, but also for humans themselves,there is an urgent need for innovative ways to showcase sustainable living practices in the light ofdominant unsustainable patterns of growth and human consumption.
Even though the listed solutions for protecting the natural environment and local culture shouldbe subjected to tourist impact analysis at every stage of tourist area development, there are touristdestination development stages where such activities should be more intense. Therefore, the TALCconcept and its extensions can be useful tools for forecasting or diagnosing the situation.
A successful implementation of the proposed solutions to remedy the disappearance of the touristfunction requires their constant use, to ensure that they are rooted in enterprise or community strategicgoals. It is best to place them among elements creating a formal model of running a business.
Therefore, a business model is characteristic of the described business [33] or a descriptionof relations between components in an organization that result in the creation of value for theorganization [34]. In the majority of cases, it has the form of a tool used to run a business [35] or astory that explains how the enterprise works [33]. The business model is also defined as a theoreticalconstruct that describes the activity of the business based on selected indicators [36]. One of the mostaccurate definitions of the business model is the one by Wit [37]. Wit states that the essence of abusiness model is a visual depiction of organizational functioning logic, its elements or ventures in theform of appropriately named interlinked elements of a template that, once populated with content,ensures logical understanding of the functioning, survival, and development of an organization.Visualization of this organization functioning logic requires the use of a specified concept of modeling.Among the most popular concepts is the template by Osterwalder and Pigneur [38]. This modeltakes into account nine interconnected and interacting elements: customer segments, value proposals,distribution channels, customer relations, revenue streams, key resources, key activities, key partners,and cost structure.
Each of these elements can have assumptions that will implement the sustainable developmentconcept and delay the decline stage (the disappearance of the tourist function) or will make it possibleto skip it by entering a new cycle. Examples of such solutions drawing from the Global SustainableTourism Council [20] are practices of limiting energy use, pollution, water use, and waste production.An important example of introducing sustainable tourism rules is encouraging contractors, especially
196

Sustainability 2019, 11, 6989
tourist enterprise suppliers, to use similar practices that support and protect the local culture andnatural environment.
However, if the tourist area is in the stagnation or decline stage, pro-ecological practices are notenough, as entropy of the current local tourist industry system takes place. Then the enterprise isforced to introduce more radical actions and plans. These can be about changes in the scope of tourismproduct promotion or even transformation of the business activity.
3. Materials and Methods
The analysis of the intensity of tourist movement identified in a specific area is associated withseveral difficulties, enforcing the adoption of some assumptions. They aim to simplify the presentconditions to develop a model that can explain a specific phenomenon or development mechanism.Therefore, one of the first difficulties is to quantify the tourist movement. Current attempts to describetourist activity are limited mostly to the adoption of a specific symptomatic variable by which the sizeof tourist movement can be estimated, and thus approximately defined, taking into account deviationfrom the actual size of the movement. In the case of tourist reception areas, deviation concerningtourist movement intensity is associated with the inability to precisely measure the values that describethis phenomenon, meaning the number of visitors (including tourists), the length of their stay, etc.These values, even though they can be found in statistical reports, present movement that is registeredby entrepreneurs and entities providing tourist services or by border patrols. They do not cover thetotal size of tourist movement, as tourists can make use of many alternatives (family or second-homestays, unregistered stays, gray market or one-day stays, etc.)
The special tourist area is, in this context, an island, where communication takes place only withthe use of defined transportation channels, namely, maritime navigation and air transport. If the islanddoes not have an airport, then visitors can only make use of water transport (ferries, ships, etc.). Dueto the fact that there are specific and controllable transport channels, it is also possible to accuratelycapture tourist movement. It needs to be emphasized, however, that this is still an approximate number,as quite often the statistics do not differentiate tourists’ from island residents’ travel. Nevertheless,the observations made in such conditions allow for better approximation of the actual scale of thesituation, therefore, the probability of error distorting the results is lower.
An example of such a specific tourist area is the Danish island Bornholm, which relies onpassenger sea transport (with the use of several ferries) and, since 1982, air transport. The dominantmeans of transport is still the ferry that, for a decade, has handled more than 90% of total touristmovement [39]. This means that air traffic (with a capacity of 200,000 passengers per year) in this areawill be considered marginal.
The Danish Statistics Office (Denmarks Statistik) [39] has registered passenger traffic associatedwith the island since 1912, and in some periods this research was extended with an additional category,passenger type (resident/visitor). This observation allowed them to notice the stability of theseproportions in the years 1991–2009, when residents amounted to 30 ± 1% of passengers. Takinginto account the fact that the resident population of Bornholm in the last century underwent slightfluctuations (increasing steadily until 1965 and then decreasing, on average, by 305 persons a year), theinfluence of this phenomenon on the proportion of residents and nonresidents was insignificant.
Therefore, taking into account the stability of the proportions of passenger groups in the studiedperiod (1912–2018) and the probable (thanks to passenger movement control) high precision of touristmovement quantification in ferry transportation, it can be assumed that the image of the way thisphenomenon was shaped (Figure 2) reflects its true status.
197

Sustainability 2019, 11, 6989
Figure 2. Amount of passenger traffic on Bornholm island, 1912–2018. Source: own study based ondata from Denmarks Statistik [39].
Among important historical events that could have influenced the intensity of tourist movementon the island in the analyzed period, the following facts should be considered:
- World War II (1940–1945) significantly decreased transport movement to the island.- There was a trend among Danish people to spend family vacations by the sea (1948–1972).- The narrow-gauge railway that was functioning since 1900 closed in 1968; afterwards,
reconstruction of internal transport took place.- Denmark joined the EU in 1973.- An airport was established on the island in 1982, which made it possible to offer air transport for
passengers (in 1940–1968, the airport was used for other transport purposes).- In 1999, in the whole EU, a new law was introduced that liquidated duty-free shops.- A bridge opened in 2000 that shortened the journey from Sweden to Denmark and new, fast ferry
connections decreased the travel time to Bornholm from 7 to 3 h.- Denmark joined the Schengen Area in 2001.
Taking into account the development of tourism on Bornholm and the historical events of thearea, it can be seen that this phenomenon takes the form of a logistic function (1):
yt =k
1 + be−at . (1)
where yt is a variable determining the development of the analyzed phenomenon (explained variable);t is the time variable; a, b, k are parameters of the logistic function; and e is the base of the naturallogarithm (mathematical constant; e ≈ 2.7182).
The parameters for this logistic function were estimated by Hotelling [40,41]. According to thismethod, parametric estimation has two stages. First, the least squares method determines parametersa and k (transformed form of a linear function), then parameter b is estimated by performing the leastsquares estimation again.
The comparative analysis also uses the Pearson linear correlation coefficient rxy and thedetermination coefficient R2 to determine the quality of the quantitative model.
198
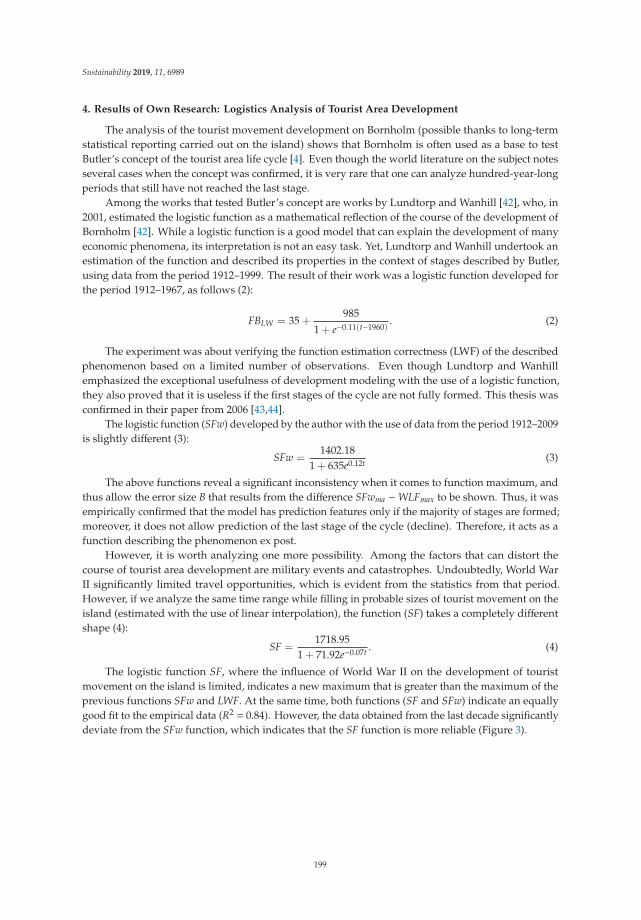
Sustainability 2019, 11, 6989
4. Results of Own Research: Logistics Analysis of Tourist Area Development
The analysis of the tourist movement development on Bornholm (possible thanks to long-termstatistical reporting carried out on the island) shows that Bornholm is often used as a base to testButler’s concept of the tourist area life cycle [4]. Even though the world literature on the subject notesseveral cases when the concept was confirmed, it is very rare that one can analyze hundred-year-longperiods that still have not reached the last stage.
Among the works that tested Butler’s concept are works by Lundtorp and Wanhill [42], who, in2001, estimated the logistic function as a mathematical reflection of the course of the development ofBornholm [42]. While a logistic function is a good model that can explain the development of manyeconomic phenomena, its interpretation is not an easy task. Yet, Lundtorp and Wanhill undertook anestimation of the function and described its properties in the context of stages described by Butler,using data from the period 1912–1999. The result of their work was a logistic function developed forthe period 1912–1967, as follows (2):
FBLW = 35 +985
1 + e−0.11(t−1960). (2)
The experiment was about verifying the function estimation correctness (LWF) of the describedphenomenon based on a limited number of observations. Even though Lundtorp and Wanhillemphasized the exceptional usefulness of development modeling with the use of a logistic function,they also proved that it is useless if the first stages of the cycle are not fully formed. This thesis wasconfirmed in their paper from 2006 [43,44].
The logistic function (SFw) developed by the author with the use of data from the period 1912–2009is slightly different (3):
SFw =1402.18
1 + 635e0.12t (3)
The above functions reveal a significant inconsistency when it comes to function maximum, andthus allow the error size B that results from the difference SFwma −WLFmax to be shown. Thus, it wasempirically confirmed that the model has prediction features only if the majority of stages are formed;moreover, it does not allow prediction of the last stage of the cycle (decline). Therefore, it acts as afunction describing the phenomenon ex post.
However, it is worth analyzing one more possibility. Among the factors that can distort thecourse of tourist area development are military events and catastrophes. Undoubtedly, World WarII significantly limited travel opportunities, which is evident from the statistics from that period.However, if we analyze the same time range while filling in probable sizes of tourist movement on theisland (estimated with the use of linear interpolation), the function (SF) takes a completely differentshape (4):
SF =1718.95
1 + 71.92e−0.07t . (4)
The logistic function SF, where the influence of World War II on the development of touristmovement on the island is limited, indicates a new maximum that is greater than the maximum of theprevious functions SFw and LWF. At the same time, both functions (SF and SFw) indicate an equallygood fit to the empirical data (R2 = 0.84). However, the data obtained from the last decade significantlydeviate from the SFw function, which indicates that the SF function is more reliable (Figure 3).
199

Sustainability 2019, 11, 6989
Figure 3. Logistic functions for passenger traffic of Bornholm island, 1912–2018. Source: own studybased on data from Denmarks Statistik [39].
What Lundtorp and Wanhill also achieved is knowledge on the subject of the stage-division of acycle that exceeds the so-called inflection point. Analyzing the function, and especially its characteristicpoints (calculating zero places with the use of subsequent derivatives), they established that a naturaldivision resulting from the logistic function is in five stages: the first one covers the area from 0% to 9%of the maximum function value and the subsequent ones from 9% to 21%, 21% to 79%, and 79% to 91%of maximum (100%). Thus, proper estimation of the logistic function allows calculation of both theinflection point and the function maximum, which, in turn, makes it possible to determine particularstages of the model.
Lundtorp and Wanhill assumed that the stages resulting from logistics function properties andthe mathematical division of the logistics function overlapped with the stages defined by Butler [4].When analyzing the history of Bornholm and the events that could have influenced the changes intourist movement on the island in the context of feature characteristics for subsequent TALC stages, itseems probable.
In line with this analysis, the exploration stage took place before 1940, therefore it can be assumedthat the period 1912–1940 was when the island was visited only for the purpose of getting to know anew area, without any evident signs of tourist function in that area. It must be noted that becauseDenmark was neutral, the influence of the Great War on passenger movement in Bornholm portscannot be observed.
The second stage of the island’s tourist development (involvement stage) consists of the years1940–1955. It can be divided into two important periods in the island’s history. In 1940–1945, Denmarkwas occupied by Nazi troops. At that time, passenger movement was minimal. The postwar erawas about further development of railway transport on the island and greater intensity of touristmovement, due to a trend among the Danish to spend family holidays on the seaside.
The growth stage shown in Diagram 3 in 1955–1994 was the time when the number of visitorsincreased. This growth was not regular but varied in specific moments of the island’s history. Anexample is a breakdown in the growth trend in 1966–1976, when the means of internal transportunderwent transformation. The growth trend continued along with the accession of Denmark to theEU, which probably increased the share of foreign tourists in the region (verifying this assumption isnot possible).
After 1994, a consolidation of tourist areas took place: the growth trend of the number of touristscollapsed and took on a new shape, a result of inhibition of the increased number of visitors. It istherefore a signal that the area entered the stagnation stage.
200

Sustainability 2019, 11, 6989
The technical analysis indicates that the maximum number of visitors will be reached in thestagnation stage, and thus in the whole cycle (at the level of 1.7 million passengers), in the third decadeof the 21st century. It does not mean, however, that carriers will not notice such numbers of passengersuntil that time, but this number may not be constant and stabilization at this level may take placeafter 2025.
It is worth noticing another characteristic of the change of the tourist area in the context ofovertourism. The expansion of tourism and its intensification consequently led to the disappearance oflocal culture and displacement of locals residing in tourist areas. This can be proven by observingmany cities that are intensely visited by tourists. This influence is particularly visible in the case oftourism on islands.
The analysis of the number of residents of Bornholm indicates that in the middle of the developmentstage and at the time of breaking the logistic function, a qualitative change in the population numbertrend took place. Whereas until 1966, the population of Bornholm was positively correlated with thenumber of visiting tourists (rxy = 0.787), after that period, the correlation between these variables wasnegative and much higher (rxy = −0.885). The conclusion, based on the above observation, indicatesthat the level of critical capacity and absorption of tourism of Bornholm started at the end of the 1960s(Figure 4).
Figure 4. Comparison between the number of tourists on Bornholm and the population living on theisland, 1912–2018. Source: own study.
The decline in the island’s population is not surprising. The migration of tourist destinationscaused by tourist congestion is found in many popular cities. It is possible to stop this trend. Thesolution may be to reduce congestion either by limiting tourist traffic (but also limiting income) orby expanding the tourist area, which can dissipate the excess tourists. An interesting solution to theproblem of tourist congestion on the island of Bornholm is to introduce changes in transport (sea andair) and develop tourist offerings, limiting tourist traffic on land and increasing it in the form of cruisesaround the island.
5. Conclusions
The scientific value of this paper lies in the correction of previous research in this area, butalso in providing a better tool for analyzing the stages of tourism development on Bornholm. Theobtained analytical model, combined with the cited concepts of tourist destination development, makeit possible to see the current phase of tourism development on the island and changes in the populationof inhabitants.
201

Sustainability 2019, 11, 6989
The consequences of the observed changes concern not only the resident population but alsoenterprises operating on the island. The business model of a tourist enterprise, located in a tourist areathat is in the involvement or exploration stage, will differ from the business model of an enterprisefunctioning in an area in the consolidation or stagnation stage. Due to the conditions faced byenterprises carrying out tourist activities at a time of excessive tourism movement, such a businessmodel should also take defined elements into account.
In the case of Bornholm, the range of tourist absorption was reached in the 1960s–1970s, andcurrently it is getting closer to the upper threshold of that range. This means that if tourist enterprisesfunctioning on Bornholm have not yet introduced remedial solutions to their business models, theyshould do so as quickly as possible. Referring to the concepts by Boyd [18], Butler [4], and Plog [24],the tourist area on Bornholm is entering the stage of unbalance, along with the consequences.
The future tourist trends on Bornholm depend on many factors; however, if tourist developmentgoes into the decline stage, the offered products may require transformation, in terms of bothtransportation and the form and availability of tourist attractions. Perhaps it will become necessary toexpand the airport near Ronne and increase tourist movement by plane. Another option is to transfertourist movement from land to sea. Perhaps it will be total transformation of the island into a facilitywith a specific entertainment, leisure, or business profile. The listed solutions will require entrepreneursto react regarding the scope of transformation of their business models into sustainable models oftourist business. This means that the solution to the described problem of island congestion may beto develop a proper approach to tourism management on the island that is focused on sustainabletourism. However, while sustainable tourism generally concerns protection of the natural environment,this time its basic task will be to protect the indigenous culture of the island.
Funding: This research received funding by the National Science Center in Poland.
Acknowledgments: This paper was published as part of the research project ‘A business model for health resortenterprises’, No. 2017/25/B/HS4/00301, supervised and financed by the National Science Center in Poland as partof statutory research No. 13/990/BK_19/0138 at the Silesian University of Technology, Faculty of Organizationand Management.
Conflicts of Interest: The author declares no conflicts of interest. The funders had no role in the design of thestudy; in the collection, analysis, or interpretation of data; in the writing of the manuscript; or in the decision topublish the results.
References
1. Nosratabadi, S.; Mosavi, A.; Shamshirband, S.; Zavadskas, E.K.; Rakotonirainy, A.; Wing Chau, K. SustainableBusiness Models: A Review. Sustainability 2019, 11, 1663. [CrossRef]
2. Geissdoerfer, M.; Bocken, N.M.; Hultink, E.J. Design thinking to enhance the sustainable business modellingprocess—A workshop based on a value mapping process. J. Clean. Prod. 2016, 135, 1218–1232. [CrossRef]
3. Abdelkafi, N.; Täuscher, K. Business models for sustainability from a system dynamics perspective. Organ.Environ. 2016, 29, 74–96. [CrossRef]
4. Butler, R.W. The Concept of the Tourism Area Cycle Evolution: Implications for Management of Resources.Can. Geogr. 1980, 24, 5–12. [CrossRef]
5. Agarwal, S. Restructuring seaside tourism. The resort lifecycle. Ann. Tour. Res. 2002, 29, 25–55. [CrossRef]6. Szromek, A.R.; Kapczynski, A. Hypotheses concerning the development of Polish spas in the years 1949–2006.
Tour. Manag. 2008, 29, 1035–1037.7. Szromek, A.R.; Kruczek, Z.; Using, R.W. Butler’s Model to Interpret the Development of Tourist Attractions,
Based on the Example of the Salt Mine in Wieliczka. Folia Turistica 2011, 25, 249–265.8. Szromek, A.R. Cyklicznosc rozwoju uzdrowisk na przykładzie uzdrowisk polskich. In Uzdrowiska i Ich
Znaczenie w Gospodarce Turystycznej; Szromek, A.R., Ed.; Proksenia: Kraków, Poland, 2010; pp. 17–40.9. Oppermann, M. What is New with the resort cycle? Tour. Manag. 1998, 19, 181–183. [CrossRef]10. Defert, P. Essaie de localization touristique. Tour. Rev. 1954, 9, 119.11. Szromek, A.R.; Model, R.W. Butlera, jako podstawa kreowania strategii rozwoju rynku polskich uzdrowisk
XXI wieku. Marketing i Rynek 2006, 5, 36–39.
202

Sustainability 2019, 11, 6989
12. Rostow, W.W. Stages of economic growth. Econ. Hist. Rev. 1959, 12, 1–16. [CrossRef]13. Kotler, P.; Turner, R.E. Marketing Management; Prentice-Hall: Scarborough, ON, Canada, 1993; pp. 3271–3397.14. Butler, R.W. (Ed.) The Origins of the Tourism Area Life Cycle. In The Tourism Area Life Cycle. Vol. 1.
Applications and Modifications; Channel View Publications: Cleveland, OH, USA, 2006; pp. 13–26.15. Butler, R.W. The resort cycle two decades on. In Reflections on Experience; Cassell: London, UK, 2000;
pp. 284–298.16. Oreja, J.R.; Rodriguez Parra-Lopez, E.; Yanes-Estavez, V. The sustainability of island destinations: Tourism
area life cycle and teleological perspectives. The case of Tenerife. Tour. Manag. 2008, 29, 53–65. [CrossRef]17. Lundgren, J.O. An empirical interpretation of the TALC: Tourist Product Life Cycles in the Eastern Townships
of Quebec. In The Tourism Area Life Cycle. Vol. 1. Applications and Modifications; Butler, R.W., Ed.; ChannelView Publications: Toronto, ON, Canada, 2006; Volume 1, pp. 91–106.
18. Boyd, S.W. The TALC Model and its Application to National Parks: A Canadian Example. In The TourismArea Life Cycle: Applications and Modifications; Butler, R.W., Ed.; Channel View Publications: Clevedon, UK;Buffalo, NY, USA; Toronto, ON, Canada, 2006; pp. 119–138.
19. Weaver, D.; Lawton, L. Tourism Management; John Wiley & Sons: Milton, Australia, 2006; p. 320.20. Global Sustainable Tourism Cuncil. GSTC Criteria for Hotels. GSTC Criteria for Tour Operators.
GSTC Criteria for Destinations. Available online: http://www.gstcouncil.org/gstc-criteria/ (accessed on 1August 2019).
21. Buhalis, D. Marketing the Competitive Destination of the Future. Tour. Manag. 2000, 21, 97–116. [CrossRef]22. Szromek, A.R. Development of Tourism and Spa Areas in the Concepts S.C. Plog and R.W. Butler. In Research
Bulletins of the Silesian University of Technology-Organisation and Management; No. 54; Publishing House of theSilesian University of Technology: Gliwice, Poland, 2010; pp. 305–322.
23. Plog, S.C. Why Destination Areas Rise and Fall in Popularity. Cornell Hotel Restaur. Adm. Q. 1974, 14, 55–58.[CrossRef]
24. Plog, S.C. Why Destination Areas Rise and Fall in Popularity: An update of a Cornell Quarterly classic.Cornell Hotel Restaur. Adm. Q. 2001, 42, 13–24. [CrossRef]
25. Kruczek, Z.; Kruczek, M.; Szromek, A.R. Possibilities of Using the Tourism Area Life Cycle Model toUnderstand and Provide Sustainable Solution for Tourism Development in the Antarctic Region. Sustainability2018, 10, 89. [CrossRef]
26. Trancoso González, A. Venice: The problem of overtourism and the impact of cruises. Investig. Reg. J. Reg.Res. 2018, 42, 35–51.
27. Responsible Travel. Available online: https://www.responsibletravel.com/copy/overtourism-in-venice(accessed on 22 October 2019).
28. Huete, R.; Mantecón, A. El auge de la turismofobia ¿hipótesis de investigación o ruido ideológico? PASOSRev. Tur. Patrim. Cult. 2018, 16, 9–19. [CrossRef]
29. Monge-Ganuzas, M. Geological heritage in biosphere reserves. In Proceedings of the Actas del VIII Congresode la Red Mundial de Reservas de la Biosfera Islas y Zonas Costeras, Menorca, Spain, 22–26 May 2018.
30. Wolin National Park. Available online: http://www.wolinpn.pl/index.php?page=45 (accessed on 22October 2019).
31. Roychoudhury, N.; Sharma, R.; Mishra, R.K. World Network of Biosphere Reserves. Van Sangyan 2017, 4,51–52.
32. Stoll-Kleemann, S.; O’Riordan, T. Biosphere Reserves in the Anthropocene. In The Encyclopedia of theAnthropocene; Dominick, A.D., Michael, I.G., Eds.; Elsevier: Oxford, UK, 2018; Volume 3, pp. 347–353.
33. Magretta, J. Why business models matter? Harv. Bus. Rev. 2002, 80, 86–92.34. Battistella, C.; Toni, A.; Zan, G.; Pessot, E. Cultivating business model agility through focused capabilities:
Amultiple case study. J. Bus. Res. 2017, 73, 65–82. [CrossRef]35. Teece, D. Business Models and Dynamic Capabilities; Long Range Planning: London, UK, 2017; Volume 51,
pp. 1–10.36. Dworak, J. Modele biznesu współczesnych przedsiebiorstw. Przedsiebiorstwo Współczesnej Gospodarce Teoria
Praktyka 2006, 4, 17–30.37. Wit, B. Ekologistyka w Systemie Zarzadzania Odpadami Niebezpiecznymi; Towarzystwo Naukowe Organizacji i
Kierowania, Stowarzyszenie Wyzszej Uzytecznosci DOM ORGANIZATORA: Torun, Poland, 2016.
203

Sustainability 2019, 11, 6989
38. Osterwalder, A.; Pigneur, Y. Business Model Generation: A Handbook for Visionaries, Game Changers, andChallengers; John Wiley & Sons: Hoboken, NJ, USA, 2010.
39. Denmarks Statistik. Baza Urzedu Statystycznego Danii. Available online: http://www.statbank.dk/statbank5a/default.asp?w=1024 (accessed on 22 October 2019).
40. Oliver, F.R. Methods of Estimating the Logistic Growth Function. J. R. Stat. Soc. Ser. C (Appl. Stat.) 1964, 13,57–66. [CrossRef]
41. Skrobacki, Z. Selected methods for the estimation of the logistic function parameters. Eksploatacja Niezawodnosc2007, 3, 52–56.
42. Lundtorp, S.; Wanhill, S. The resort lifecycle theory. Generating Processes and Estimation. Ann. Tour. Res.2001, 28, 947–964. [CrossRef]
43. Lundtrop, S.; Wanhill, S. Time Path Analysis and TALC Stage Demarcation. In The Tourism Area Life Cycle:Conceptual and Theoretical Issues; Butler, R.W., Ed.; Chanel View Publications: Toronto, ON, Canada, 2006;Volume 2, p. 146.
44. Moore, W.; Whitehall, P. The tourism area lifecycle and regime switching models. Ann. Tour. Res. 2005, 32,112–126. [CrossRef]
© 2019 by the author. Licensee MDPI, Basel, Switzerland. This article is an open accessarticle distributed under the terms and conditions of the Creative Commons Attribution(CC BY) license (http://creativecommons.org/licenses/by/4.0/).
204
sustainability
Article
Winter Sports Resorts and Natural Environment—SystematicLiterature Review Presenting Interactions between Them
Michał Zemła
����������������
Citation: Zemła, M. Winter Sports
Resorts and Natural
Environment—Systematic Literature
Review Presenting Interactions
between Them. Sustainability 2021, 13,
636. https://doi.org/10.3390/
su13020636
Received: 18 December 2020
Accepted: 6 January 2021
Published: 11 January 2021
Publisher’s Note: MDPI stays neu-
tral with regard to jurisdictional clai-
ms in published maps and institutio-
nal affiliations.
Copyright: © 2021 by the author. Li-
censee MDPI, Basel, Switzerland.
This article is an open access article
distributed under the terms and con-
ditions of the Creative Commons At-
tribution (CC BY) license (https://
creativecommons.org/licenses/by/
4.0/).
Department of Tourism and Regional Studies, Pedagogical University in Cracow, 30-084 Cracow, Poland;[email protected]
Abstract: The systematic literature review method was adopted to analyze the content of paperspublished since 2001 that focused on interactions between winter sports resort operations andthe natural environment. A total of 86 papers published in journals indexed in SCOPUS database were analyzed. Three main groups of topics presented in analyzed papers were found: theenvironmental impact of winter sports resorts, the management of environmental impacts andsustainable development of winter sports resorts, and finally the impact of climate change on wintersports resort operations. The biggest number of publications were devoted to the latter topic, andinterest in conducting research within this area has apparently grown during the last two decades.However, most conclusions reached by the authors of numerous studies are site-specific and difficultto extend to other resorts/destinations. Additionally, the conclusions presented in many papers arecontrary to the results achieved in other publications. Several gaps in our contemporary scientificknowledge and directions of future research are suggested in addition to the abovementioned resultsof the analysis conducted in the presented paper as the final conclusion of the research.
Keywords: winter sports; winter sports resorts; climate change; ecological impact; sustainable devel-opment
1. Introduction
“Ski resort” is not a term defined in the literature, and usually it is used to name alocality where an infrastructure for skiers is located [1]. Some authors use this term todefine a set of lifts and slopes under common management and accessed with a commonticket [2]. Less controversial are the terms “ski area” and “ski field,” which are used almostonly in the second stated possible meaning of “ski resort” [3,4]. The terms “ski resort,”“ski area,” and “ski field” are the traditional ones and have been commonly used for manydecades, yet during this time several changes occurred. The most important one was theinvention and growing popularity of snowboarding, usually using the same infrastructurethat was prepared for alpine skiing. That was the reason why the terms underlying theword “ski” became insufficient, and “winter sports resort” or “winter sports destination”came into use. Contemporarily both terms “ski resort” and “winter sports resort” are usedcommonly to label the same entity. To keep the consistency of the text in the presentedpaper the term “winter sports resorts” is being used solely and is understood to be a touristdestination of a special kind, identified by the unique tourism infrastructure and howvisitors spend their time there [4]. If it is agreed that a tourist destination is a place withphysical, historical, and ethnographic features that differentiate it from others in such a waythat it can attract non-residents and develop one or more different kinds of tourism [5], thewinter sports resort or destination may be defined as a geographical, economic, and socialunit consisting of all those firms, organizations, activities, areas, and installations that areintended to serve the specific needs of winter sports tourists [6]. This approach emphasizesthe complex character of a ski resort with a clear indication of the role of supplementaryservices (hotels, gastronomy, entertainment) and environment. However, the presented
Sustainability 2021, 13, 636. https://doi.org/10.3390/su13020636 https://www.mdpi.com/journal/sustainability
205

Sustainability 2021, 13, 636
terms might be used with a different meaning in the papers analyzed here. It is clear thatinfrastructure in winter sports resorts nowadays embraces much more than ski lifts andslopes and can be connected also with other winter activities, including cross-countryskiing, ski touring, sledges, toboggans, and ice skating [7]. However, this does not changethe fact that in most of the cases lifts and slopes are the main reason to visit a resort [4].Additionally, the problems presented in this paper concerning the relationship of wintersports resorts with the natural environment are visible mainly in the cases of alpine skiingand snowboarding infrastructure [8]. That is also the reason why most of the analyzedtexts are focused on alpine skiing and snowboarding when we analyze “ski resorts” or“winter sports resorts.”
Winter sports resorts are a special type of tourist destination due to, among otherthings, the complex and two-way nature of their relationship with the natural environment.These resorts’ success depends on the specific features of the environment, the lay of theland, climate, and transport accessibility [7]. On the other hand, winter sports resorts arealso often perceived as places where particular threats to nature occur [8]. This is dueto the large-scale nature of investments that interfere with nature, the accumulation of alarge number of tourists, and also the fact that they are usually established in mountainareas characterized by the highest value and sensitivity of ecosystems. All this is thereason why the interaction between the natural environment and winter sports resorts isthe subject of multiple scientific studies conducted by representatives of various scientificdisciplines. These studies have also been conducted for many years [7,9–12], but it shouldbe noted that the subject of interest in this research has evolved over the years due tothe increasing scope of scientific knowledge and due to new challenges that have arisen.Today, undoubtedly, an example of a challenge like this is global warming, which callsinto question the presence of natural snow cover in many places where winter sports aretraditionally played [13]. The relationship between winter sports resorts and the naturalenvironment, and, in particular, the scale of the negative impact of the development ofwinter sports on the surrounding nature, are also the subjects of multiple and often veryhighly charged emotional debates of a political nature, dominated by catchy argumentsbased on far-reaching simplifications, used both by representatives of ecological andenvironmental organizations and by promoters of winter sports development.
Despite the significant increase in scientific research on the impact of winter sportsresorts on the environment or on how the environment influences the way these resortsoperate, the common scientific knowledge on this subject is highly fragmented. In manycases, highly specific issues are the subject of research—for example, the impact of thedevelopment of a winter sports resort on particular species of amphibians or grasses, which,in addition, are site-specific, while works that show in a more comprehensive way therelationship between nature and how the winter sports resorts operate are missing [14,15].
The research carried out according to the systematic approach to literature reviewmethodology is an attempt to collect and structure the contemporary scientific achieve-ments on the subjects of the relations between winter sports and the environment andof the sustainable development of winter sports resorts. The research took into accountpublications that were published during 2000–2020 in journals indexed in the SCOPUSdatabase. This time span allowed not only to indicate the most interesting areas of scientificresearch, but also to observe how they have changed over the last 20 years.
2. Materials and Methods
Like many other review papers [16,17], this paper takes a systematic approach [16,18,19]to the literature review. A systematic review is a specific method that locates existing studies,selects and evaluates contributions, analyzes and synthesizes data and reports the evidencein such a way that it allows to reach reasonably clear conclusions about what is known andwhat is not [20].
The synthesis of the findings is the key point of all systematic reviews [21–23]. Thereare many methods to approach a systematic review. As the data for this review (the papers
206

Sustainability 2021, 13, 636
collected) contain a combination of quantitative and qualitative research, pure quantitativeanalysis of the data is not appropriate. The aim of this review is not to assess all literaturewritten on the sustainable development of winter sports resorts or on the interactionsbetween winter sports and the natural environment, but rather to capture the current stateof our scientific knowledge in the specific area.
The review seeks to create a comprehensive database of all tourism and hospitalityjournal articles published between January 2000 and April 2020 covering the issue of arelationship between the natural environment and the management of winter sports resorts.There are a number of different approaches to selecting databases to search for suitablepublications, which let you use a different number and different kinds of databases, start-ing from scientific search engines (google.scholar.com) [24,25], through indexing bases(SCOPUS, Web of Science) [24–30], ending with full-text sources of references (e.g., EB-SCOHost, Science Direct) [24,31]. It was decided to use the SCOPUS data set as a source.It is one of the most appreciated and complete indexing reference databases, which is aguarantee of the scientific quality of publications presented there. SCOPUS has been widelyused so far as a sole data set for literature reviews [26,32–34]. According to Meho andRogers [35] this data set is especially useful for literature reviews in the fields of life sciencesand social sciences, which are the most important scientific disciplines dealing with theissues analyzed in the paper. However, SCOPUS does not provide full-text versions ofindexed papers [26,28,29]. This choice required subsequently finding full-text versions ofthe selected papers in other sources.
Since the researched topic contained a set of different relations, a complicated searchstrategy was adopted. The key words: (ski OR “winter sports”) AND (sustainability ORclimate OR environment OR green OR ecological) AND (management OR business) wereused to search titles, keywords, and abstracts of publications. Additionally, the searchwas limited to scientific papers only and to finished publications. Additionally, to excludepapers that were not related to the area of the research, the results were limited to papers inenvironmental, social, and business sciences. Finally, the time span, i.e., 2001–2020, was set.The presented search strategy allowed to detect a group of 168 publications. The next stepwas to read carefully the abstracts of all selected papers and to reduce the list by skippingthe papers that did not fit the topic. The final list of accepted papers was 86 items [36–121].The reasons why some papers were skipped were diverse. Most frequently, these werethe papers that presented a general idea of tourism development in a particular area andwinter sports resorts were just one field of such a development, and an in-depth studywas not made. Another group of papers we skipped contained articles dealing with cablecars or lifts but with those that were used for purposes other than winter sports. Finally,there were several articles that presented the general problems of nature conservation in aparticular area, and winter sports were analyzed only as part of the environmental impacton nature and, again, an in-depth study was not made. As the last step, an in-depth studywas made of all papers contained in the final list to analyze their methods and conclusion.
3. Results
3.1. Topic Covered
All selected papers were divided into three categories (however, one paper couldhave been put into two categories at the same time) regarding the topics analyzed in thearticle. Those topical categories were as follows: environmental impact of the constructionand operation of winter sports resorts (“environmental impact”), management of thesustainable development of resorts (“management”), and impact of climate change on theoperation of resorts (“climate change”). Finally, four papers were focused on other topicsand were put into the fourth category that was labeled as “others.”
From among 86 scientific articles analyzed, as many as 51 were devoted to the issue ofclimate change, 30 were included in the “management” category, and 23 were included inthe “environmental impact” category (Table 1). Moreover, four articles dealt with otherissues, not related to any of the three subject groups mentioned above. They were: the
207

Sustainability 2021, 13, 636
influence of the weather on the sale of ski-tickets; the impact of ecological uncertainty onthe management of resorts; stakeholder cooperation in the ski region versus ecotourismregion; and the perception of avalanche danger by skiers.
Table 1. Number of Papers Published Year by Year.
Climate Change Environmental Impact Management Others Total
2020 3 0 0 0 32019 12 2 5 0 192018 3 1 2 1 72017 2 0 1 1 42016 4 3 2 1 102015 5 0 0 0 52014 6 1 2 0 92013 6 2 4 0 122012 0 6 4 0 102011 3 2 3 0 82010 1 1 0 0 22009 0 3 2 1 62008 2 0 1 0 32007 1 0 1 0 22006 2 0 1 0 32005 0 1 0 0 12004 0 0 1 0 12003 1 1 1 0 32002 0 0 0 0 02001 0 0 0 0 0Total 51 23 30 4 108
The number of publications that dealt with the relations between the operation ofwinter sports resorts and the natural environment in the last two decades was highlyvariable, but it was clear that many more of them were created in the second decade than inthe first decade of the century. During the first years of this decade (2011–2012), the numberof publications on the “environmental impact” and “management” largely increased, whileduring the following years, the “climate change” subject became much more popular. Asmany as 42 out of 51 publications identified as addressing the “climate change” subjectwere created in the years 2013–2020. This was as much as 69% of publications publishedin those years. The authors’ growing interest in the “climate change” subject was alsoevidenced by the average age of the publications analyzed. Publications on this subjectwere, on average, 5.1 years old, while the average age of articles on the “environmentalimpact” was 7.7 years, and on “management” was 7.3 years. The increasing number ofpublications on climate change over the last decade should not be a surprise. This topicwas not particularly popular in the public debate even at the end of the 20th century, notonly in the debate on winter sports, while the second decade of the 21st century was a timeof rapidly growing social awareness of the consequences of climate change. It was also thetime when the problem of maintaining snow cover in the winter season more and moreseverely affected an increasing number of resorts.
Big and growing interest in the “climate change” subject was also reflected in thenumber of citations of the articles analyzed. Despite the fact that, on average, articles on“climate change” were more than two years younger than the other articles, they were citedmost often—the average number of citations was 32, while in the case of “environmentalimpact” and “management,” it was 16 and 31, respectively. A clear difference betweenthe number of citations of these two topics was also highly conspicuous, and the averagenumber of citations for “environmental impact” was two times lower than for those for“management.” Seven publications among the analyzed ones were cited over 100 times,and the most frequently cited item was cited over 200 times (Table 2). From among themost frequently cited publications in Table 2, as many as four, and these are the four with
208

Sustainability 2021, 13, 636
clearly the highest citation index, were works on the “climate change” subject. Moreover,all four articles were linked by the co-author, i.e., D. Scott. It is also worth noting that thepublications listed in Table 2 clearly dominated over the others in terms of the number ofcitations. Only several works had more than 80 citations. It is also worth rememberingthat the average number of citations index in the case of publications issued over manyyears covers very large discrepancies between individual articles. Publications publishedin recent years have been cited very rarely so far; some of them have not yet been cited atall, which is natural. All the articles contained in Table 2 were published in the first decadeof the century; items with only slightly fewer citations also came from the same period oftime. In this context, it is worth paying attention to two articles that clearly broke out ofthis pattern. The first of them was Steiger et al. (2019) [43], which managed to be cited 44times over the year, while all other publications from 2018–2020 were cited only 34 times intotal. The second one of them was the article by J. Dawson and D. Scott, (2013) [87], whichwas the only one published after 2009 to have received more than 70 citations (86). It isworth noting that both of these items were on “climate change” (the article by Dawson andScott (2013) was also on “management”).
Table 2. The Most Commonly Cited Articles.
Authors Topic Number of Citations
Scott, D., McBoyle, G., Mills, B. [120] Climate change 219
Scott, D., McBoyle, G [114] Climate change 173
Scott, D., McBoyle, G., Minogue, A.,Mills, B. [116] Climate change 152
Scott, D., Dawson, J., Jones, B. [111] Climate change 135
Rivera, J., de Leon, P. [119] Management 123
Sharma, S., Aragón-Correa, J.A.,Rueda-Manzanares, A. [113] Management 112
Wipf, S., Rixen, C., Fischer, M.,Schmid, B., Stoeckli, V. [118] Environmental impact 108
3.2. People and Places
The issue of the relationship between the operation of winter sports resorts andthe natural environment was taken up by researchers from almost all continents. Mostoften these were scientists affiliated with the USA (18 articles), Austria (16 articles), andCanada (11 articles). In addition, researchers affiliated with France, Spain, Italy, Germany,Switzerland, and Australia were also authors or co-authors of more than five articles.Among the scientists, there were also representatives of countries like Andorra, Serbia,Bulgaria, Finland, Japan, Iran, and Malaysia. By far, D. Scott, who was the co-author ofall 11 publications affiliated with scientists from Canada, was the most active author. Inaddition, R. Steiger was co-author of seven publications while M. Pons was a co-authorof five articles. It should be noted that all three authors often published articles jointlyand all their presentations were focused on “climate change.” It is also worth noting thatD. Scott was one of the precursors of research on the impact of climate change on wintersports resorts, and his publications were written during the entire period that was beinganalyzed—the oldest was written in 2003, the newest in 2020.
The analyzed articles were published in multiple journals of various profiles. Thiswas very clearly shown by the fact that the most articles published in the same journalwas eight. This applied to Tourism Management and to the Journal of Sustainable Tourism.Nevertheless, the next journals in this ranking were Environmental Management and Journalof Outdoor Recreation and Tourism, from which only four articles were taken. Most articleswere published in journals dealing with the subject of tourism (apart from those mentioned,they were, among others, Current Issues in Tourism and Tourism Review), but they were
209

Sustainability 2021, 13, 636
also published in journals devoted to issues of, broadly understood, ecology (apart fromthe aforementioned, these were also, among others, WIT Transactions on Ecology and theEnvironment and Sustainability), regional problems (Policy Studies Journal, Revue de GeographieAlpine), or, narrowly understood, climate issues (Climate Change and Climate Research).
The affiliations of the authors of the publications analyzed were reflected in the spatialscope of the research conducted. As many as 22 articles were devoted to the analysis ofresorts located in the USA, moreover, 13 were located in Austria and eight in Canada.Some publications did not undertake research located in specific countries; in several otherpapers, the spatial scope covered multiple countries, in particular, those located in thesame mountain range, e.g., the Alpine or Pyrenean countries. There were also cases ofpublications that made comparisons between countries or even continents.
3.3. Methods Used
Taking into account that the authors of the publications analyzed were researcherswho represented various scientific disciplines, it was also obvious that in their researchthey used multiple and different research methods typical for a given discipline. Surveyingmethods were often used in the research, which are part of the broadly understood streamof social sciences. In 16 publications, surveys conducted among consumers or stakeholdersin winter sports resorts were used, while in another six works, the method of in-depthinterview was used. For representatives of natural sciences, it was more typical to collectand use the data on natural phenomena that were already available in a specific place(total of 24 publications). The development scenario analysis was used in 12 publications.Moreover, in 10 articles modeling methods and in eight regression methods or econometricmodels were used. Quite often, the considerations of individual authors were focusedon conducting a comparative analysis (10 publications) or using the case study method(6 publications). In three articles, literature studies were the leading method of analysis.
3.4. Environmental Impact
The vast majority of works that dealt with the impact of winter sports resorts onthe natural environment used approaches and methodologies typical of natural sciences.Most often, research was conducted to identify the impact of the operation of a wintersports resort, or a single aspect of it, on a specific element of the environment. Boththe impact of building resorts as well as new ski runs [63,108], and the impact of theresort’s operation on an ongoing basis [62,103] were considered separately. In the lattercase, all works were dominated by papers that analyzed the maintenance of ski runs,i.e., snowmaking [42,97,100,107,118] and grooming [100,105,118]. It is worth noting thatin most of the works, these two aspects of the resort’s operation, i.e., snowmaking andgrooming of ski runs, were indicated as the most harmful from the point of view of thenatural environment. Also on the part of the natural environment, a specific fragmentwas analyzed more often than an aggregate. The elements of the natural environmentanalyzed in multiple studies were soils [44,100,103] and grassland [44,103] or, to put itmore broadly, vegetation [94,96,100,118]. The influence of the resorts on the animal worldwas the subject of the analysis relatively less frequently. The article by Sato et al. [79] wasan example that presented the threat posed by winter sports resorts to reptiles, and worksby Brambilla et al. [63] and Caprio et al. [64] analyzed threats to birds. The attention wasdrawn to, among others, the need for intensive measures to revegetate ski runs. Althoughthese actions would not restore bird species diversity to the state it was before the construc-tion of ski runs, they would significantly improve this diversity [64]. However, Burt [94]indicated the right mixture of flora species that would allow to effectively revegetate skiruns. Still, restoration of grasslands on ski runs caused a recovery in the bird community,but not to the extent equivalent to a natural Alpine grassland community [64]. On the otherhand, in the article by Kangas et al. [108] analyses of the impact of the operation of wintersports resorts on water quality were made, and it was indicated that the state of waterspolluted by the resorts is similar to those polluted by agriculture and forestry; whereas
210

Sustainability 2021, 13, 636
Vanham et al. [107] indicated how important for local water conditions is the demand forspecial reservoirs needed for snowmaking as a result of large seasonal water fluctuations.Completely different conclusions were also obtained in the work by Barrantes et al. [85].In their research, these authors compared agricultural land and land used for ski runsand noticed that once the land used for grazing was converted to ski runs, its biodiversityincreased. Due to the dominant methodology of analyzing data related to a specific place,a significant part of the results and conclusions could not be merely transposed in a simpleway into analysis and management of resorts located in different natural conditions. On theother hand, it was noteworthy that the vast majority of studies showed a very strong andnegative impact of the construction and operation of winter sports resorts on individualelements of the environment.
The work by Kušcer and Dwyer [41], where the scale of environmental impacts ofvarious winter sports resorts was compared and where the ability to generate a smallerenvironmental impact per visitor in the case of large winter sports resorts than in the caseof small resorts was indicated, was an example of a publication in which a slightly differentperspective was adopted from those described above.
3.5. Climate Change
Climate change remains among the most important factors impacting operations of win-ter sports resorts worldwide as it influences snow conditions. According to Spandre et al. [61]the snow conditions are a major priority for ski resort operators to provide comfortable skiingconditions, to ski back down to the village, or even to connect with neighboring resorts.Multiple studies by climatologists that show the dramatic momentum of climate change andits potential consequences have now made climate warming one of the most important topicsundertaken by policy makers, entrepreneurs, and scientists. One of the first observationsrelated to the climate change was the observation that winter sports resorts can now operateon much smaller scales [116,120]. For many years, they have been indicated as one of themost typical examples of human economic activity that would be impaired as a result of thesechanges [84,87].
Works on the issue of the impact of climate change on the operation of winter sportsresorts most often adopted one of the two research perspectives. The first of them, the moreanalytical one, predicted the impact of climate change on winter sports resorts in a selectedarea, depending on how these changes took place [36,37,51,87,116]. In this approach,detailed data contained in the climate change scenarios were used. With this approach,the scale of the impact of climate warming could be indicated at various points in timeand dependent on how this change developed. This research was conducted in multipleregions of the world, starting from the USA and Canada [36,40,87,116], through the Alpinecountries [37,46,112] and the Pyrenees [71,82], ending with Japan [55] and India [77]. Itis worth noting that in different parts of the world, i.e., in different resorts, conclusionsof the analyses were different from resort to resort. In some cases, even in the optimisticcarbon dioxide emission scenario, the normal operation of the resorts was in danger asearly as in the fourth decade of the century [46,51,77], while in other studies, even if thescenario was pessimistic, the resorts’ operation could have only been restrained in the longterm (second half of the century) [84,111]. In this context, the anticipated shortening ofthe season and the decrease in carnet sale revenues, e.g., in Slovak resorts, according tothe study by Demiroglu et al. [72], should be treated in terms of an optimistic scenario.However, most studies showed a large difference in the prospects for the operation ofwinter sports resorts, depending on the carbon dioxide emission scenario that took placethere [36,37,83,116]. Discrepancies between individual studies could also be seen in termsof how the climate warming affected the weather conditions in each place. The research byDar et al. [77] indicated a very significant warming in the winter season and, as a result, areduction of snow cover in Kashmir, while Fischer [74] indicated that in the case of AustrianTirol, climate warming mainly applies to the summer season, and there are only slighttemperature fluctuations in winter. Taking into account these quite significant differences
211

Sustainability 2021, 13, 636
in the impact of climate warming on various resorts, in several research studies [71,82]attempts were made to group the resorts according to how seriously they were exposed toclimate change. The most common factor that differentiated this impact on resorts locatedin one region was, quite obviously, the height above sea level.
The second thread of considerations taken up most often in publications on “climatechange” was how the boards and stakeholders in winter sports resorts reacted [38,76,79,104].It was not a surprise that the two main strategies considered in response were: extendeduse of artificial snowmaking of ski runs [55,76] and the resort’s “escape” to greaterheights [82,99]. The implementation of each of these two strategies involved a signifi-cant increase in the operating costs of the resort. Moreover, for many resorts that alreadyoperated at the highest available heights, expansion to higher altitudes was impossible [82].Therefore, how the global warming threat could be limited with the expansion of artificialsnowmaking on ski runs was a matter of particular concern [55,61,83,86,120]. The resultsobtained in individual studies were quite significantly different. In some studies, theimportance of artificial snowmaking was indicated as an effective response to climatewarming. This allowed to make the risk as small as possible [116,120], or even to make itthe only option to survive for resorts [55,111], while, in other resorts, a minor significanceof this solution was indicated, as the one of minimum risk of no snow cover and thatgenerates significant costs [83]. These discrepancies are mainly the result of two facts. Thefirst and the obvious one is again the issue of conditions that are unique in the variousregions of the world studied. The second, however, is the issue of an approach to artificialsnowmaking itself and the technological progress that has already been made and willprobably still be made in terms of the efficiency of technical infrastructure. In some studies,it was assumed that the temperature range slightly above 0 ◦C prevented the operation ofsnowmaking devices. However, devices are now available that make it possible to produceartificial snow at almost any temperature, but the problem is then undoubtedly the costs ofpurchasing and operating such devices, as this makes the resort’s operation unreasonablein terms of finance [73,83,104,120]. It is exactly what the efforts of researchers in this topicshould be focused on in the near future, i.e., cost restrictions of artificial snow, its ecologicalconsequences, as well as the problem of access to water and energy resources needed forsnow production [89]. Spandre et al. [61] underlined that the access to the water volumesneeded to produce machine-made snow is already unequal between resorts, most of themrelying on water reservoirs, and any evolution of the need for additional snowmaking willrequire a proportionally higher water supply, storage, and related costs. An interesting areaof scientific considerations and actions taken by decision makers in winter sports resortswere in this context also indicated by Weiss et al. [39]. They indicated the efficiency of snowstorage as an effective strategy to reduce the scale of current production.
Occasionally, in the research on “climate change,” other threads were also included.Most often, they were devoted to research in the perception and behavior related to cli-mate warming among various stakeholders of winter sports resorts, on both the demandand supply sides. In some works [47,48,76,115] the attitudes of people managing and/orparticipating in the development of winter resorts toward climate change were analyzed.They confirmed that the respondents were quite aware of these changes, but this awarenesswas not fully translated into specific long-term actions [69]. Resort managers adjusted tothe annual fluctuations in the weather, rather than to a long-term change [69]. As a result,actions were often taken as a reaction to the changes that took place and were already seen,rather than those anticipated, and decision makers in resorts that were less exposed toclimate warming threat were less inclined to implement adaptation measures [40]. Therewas widespread belief that artificial snowmaking on ski runs is effective [69]; in some cases,the need to diversify the resort’s activities and to increase the off-season revenues wasalso emphasized [78,89]. In the research by Trawöger, [75], four groups of stakeholders inTyrolean winter sports resorts were distinguished based on their attitude toward climatechange. These groups were characterized as: convinced planners, annoyed deniers, am-bivalent optimists, convinced wait-and-seers. The insufficient number of actions taken by
212

Sustainability 2021, 13, 636
decision makers in winter sports resorts were not only a result of their passive attitude,but also of insufficient resources of knowledge available to them, including research andscientific publications [114]. In managing winter sports resorts, weather variables wereused far too seldom. They currently reflected the ongoing climate changes [102]. Anotherinteresting conclusion was reached by Hoffman et al. [109] who found a positive influenceof the awareness of possible climate change effects on the scope of corporate adaptation,but no significant influence of the vulnerability to climate change effects on the scope ofadaptation could be found in their research.
Other interesting conclusions were drawn on the basis of the research on skiers andthe analysis of their attitudes and behavior toward global warming [70,90]. As in the caseof the supply-side research, in this case it was also found that relatively high awarenessof changes was not associated with a significant modification of behavior [49,50]. Skierswho received information about problems with maintaining snow cover in a particularwinter sports resort may make different choices depending on the market segment theyrepresent. Generally, people who are more focused on skiing or snowboarding, are morelikely in such a situation to choose another resort, while people who pay more attentionto the experience of just staying in a specific place are more loyal to resorts more affectedby climate warming [68,70]. Eventually, Gonseth [86] found that ski areas benefiting fromsunny conditions tended to have more skier visits, which might suggest that additionalimpacts such as climate change may modify sunshine duration in mountain regions.
3.6. Management
The publications analyzed on this issue in large extent referred to management strate-gies and tools appropriate when faced with the situations presented like: “environmentalimpact” and “climate change.” Decisions on which directions and what methods willbe developed by the resorts, which are taken at the level of the management boards ofindividual resorts, were often criticized for disregarding the principles of nature protection,including fundamental ones like the protection of plant and animal species under legalspecies protection [63,70]. According to Luthe et al. [91] it is necessary to take a comprehen-sive view of how the tools and activities are designed in winter sports resorts to assess theirimpact on nature and make it as little as possible. On the other hand, Krticka et al. [53]called for allocating the profits from the operation of individual resorts to nature protectioninstead of further development of infrastructure.
A typical issue for this section of subjects was whether it made sense for individualwinter sports resorts to participate in various types of voluntary programs for imple-menting sustainable development and eco-labeling and, if so, how to be motivated to doit [58]. According to Rivera and de Leon [119], resorts’ participation in these programs ismotivated only by opportunistic reasons and may be forced by external pressure. Theirfindings indicated that participation in one of these programs by ski areas is a result ofinstitutional pressures in the form of enhanced federal oversight and of higher state en-vironmental demands exerted by state agencies, local environmental groups, and publicopinion. George [121] was critical about one of the most popular programs of this typein the USA, i.e., sustainable slopes charter. On the basis of the survey research he con-ducted, he claimed that the program is perceived as a fig leaf, and its only positive effectis an increase in environmental awareness among the resort’s guests. How importantthe participation of winter sports resorts in voluntary environmental programs (VEPs)is as a management strategy and response to this external pressure from customers wasalso questioned in the research by Needham and Little [88]. The results of their researchsuggested that the majority of visitors to the resorts not only knew nothing about theseprograms, but they were not motivated by them in any way in making their decisionabout which resort to choose. On the other hand, research by Needham and Little [88]allowed to indicate the characteristics of the features of visitors who were motivated bythese programs. Respondents who were motivated to visit Mt. Bachelor ski area in Oregon,USA, because of the voluntary environmental programs were more attached to this area
213

Sustainability 2021, 13, 636
and biocentric or environmentally oriented. Critical comments about VEPs, in particular,those related to being unaware that they exist by all involved, were also expressed byLittle and Needham [98] as well as Rivera et al. [117] in their articles. The involvement ofwinter sports resorts in eco-labeling programs was also critically assessed [58]. Accordingto Sato et al. [58] so far they have not met the expectations of the resort’s customers andare focused too much on by-products, while skiers expected the skiing environmentaleffects rather than general ones. On the other hand, Duglio and Beltramo [66] were lesscritical about eco-labeling winter sports resorts. They pointed out that eco-labeling canbe used at both the winter sports resort and destination levels. However, its effectivenessand impact on the profits of individual resorts varies from resort to resort [65], whilethe use of eco-certificates improves some companies’ results, at the same time it lowersother companies’ results. In the context of the above critical remarks, the title questionfrom the paper by Rivera et al. [117] “Is greener whiter yet?” does not seem to have apositive answer. On the other hand, it should be kept in mind that the main subject ofresearch in the works cited was primarily the marketing effectiveness of the environmentalpractices used, while there is no detailed research on what extent the implementationof sustainable slopes charter and other VEPs have influenced the actual level of impactexercised by individual resorts on the state of the natural environment. Nevertheless, inthe only article analyzed [117] that raised these issues, it was indicated that no evidencewas found to conclude that ski areas that adopted the VEPs displayed performance levelsthat were superior to nonparticipants for the following areas of environmental protection:overall environmental performance, expansion management, pollution management, andwildlife and habitat management. VEP participants only appeared to show a statisticallysignificant correlation with higher natural resource conservation performance rates. Notonly is individual resort participation in VEPs of particular importance, but also the propercommunication of environmental policy, which will help to create the desired marketingeffects of this kind of resort involvement [92]. Spector et al. [92] indicated that the resortsbelong to one of four groups in how they conduct and communicate their ecological policy:passive, exploiting, reactive, and proactive. Additionally, the need to examine the motiva-tions behind ski resort publications on environmental communications and the likelihoodof skiers selecting resorts based on the environmental communications posted on websiteswas underlined [92].
The negative impact of winter sports resorts on the natural environment was thesource of multiple conflicts: those understood literally, i.e., conflicts of resorts’ managerswith nature protection organizations and institutions, and conflicts of values. The sourceof these conflicts could be both the operation of resorts as a whole and their individualactions. In addition, these conflicts were aggravated by the negative impact of climatewarming, which made the resorts’ managers operate under greater economic pressure,while nature presented an additional negative factor. The issue of managing these conflictswas often discussed in publications in the field of “management” [106]. The issue of accessto the water resources necessary to intensify artificial snowing and how it is consumed [89]was an example of the conflict between nature and the operation of winter sports resortsthat has become more and more serious in the conditions of global warming. According toMorrison and Pickering [89], this conflict can be solved only by cooperation of multiplestakeholders involved in this problem. On the other hand, Sharma et al. [113] indicatedhow important organizational capabilities are in managing conflicts related to natureconservation in the surroundings of winter sports resorts. There was no doubt that theuse of ecological innovations in managing winter sports resorts [101] was an importantstrategy to mitigate conflicts related to nature protection. Smerecnik and Andersen [101]warned against, as it seems, simple diffusion of these innovations, which is not correct.Another conflict was analyzed by Bausch et al. [42]. They indicated that while fighting theeffects of global warming extensively using artificial snowmaking, winter sports resorts donot meet the expectations of recipients. What is more, they do not meet these expectationsfor two different reasons. Firstly, it increases the operating costs of the resorts, and, as a
214

Sustainability 2021, 13, 636
result, it increases the prices of tickets, and secondly, it causes the resorts to be perceived asanti-ecological, which in turn has a negative impact on guests’ loyalty. On the other hand,Dornier and Mauri [54] indicated that regardless of what kind of the problems there arehere, winter sports resorts will have to change the way they operate so that their operationis subject to the principles of sustainable development to the greatest extent possible.
4. Discussion and Conclusions
Although the number of publications concerning the relationship between the oper-ation of winter sports resorts and the natural environment has significantly increased, itseems that the level of contemporary scientific knowledge about the phenomena in researchis highly insufficient. One of the main issues noted in the conducted analysis of the publica-tions, which allows to put forward a far-reaching thesis, is the significant inconsistency ofconclusions resulting from individual studies. The obvious facts about the negative impactof climate warming on the operation of winter sports resorts and the negative impact ofthese resorts on the natural environment are undeniable conclusions that are not put intoquestion in any way in any of the texts. However, the scale of these influences and ways tolimit them remain a controversial issue. In most publications [42,46,61,97,100,104,107,118],the issue of artificial snowmaking was important. On the one hand, it was presented asthe only or the most effective panacea for the effects of global warming [55,61,83,116,120],and, on the other, as an element particularly responsible for environmental degrada-tion [42,97,100,107,118]. The significant number of publications on snowmaking of ski runsand the relative consistency of the conclusions drawn from these publications encouragefurther research on this issue, both in the context of climate change and in the contextof nature degradation. Economic and environmental analysis of other possible climatechange response strategies, such as “escape” to higher altitudes [82,99], is also an urgentissue. In the sources analyzed, there were no clear suggestions as to whether this could bean alternative to continue intensifying snowmaking of ski runs with sufficient efficiency,whether this alternative is financially attractive and, finally, whether it is less harmful tonature. Other, more “traditional” elements of the impact of winter sports resorts on nature,such as noise, deforestation, generation of garbage and sewage, etc., also require furtheranalysis. Despite the fact that these elements were recognized as contributing to the signifi-cant negative impact of winter sports resorts on nature many years ago [1,3,8,9,122,123],in the last two decades these topics were practically not discussed at all, and it is hard tosuppose that the knowledge available from publications from the twentieth century is fullyup-to-date in the present conditions. The sustainable development perspective on wintersports resorts requires also more attention to the needs of local inhabitants, which seems tobe in times of overtourism identified also in nature-based destinations [124,125] as a crucialdirection of future research.
There was a relative consensus among the authors of individual publications [88,119,121]about whether the tools used today as a response of the winter sports resorts management toclimate warming and to the growing awareness that it is necessary to limit the negative impactof these resorts on nature are sufficiently effective. However, the question remains unansweredwhether voluntary environmental programs or eco-labeling programs are insufficient toolsand whether it is necessary to search for more effective tools, or whether it is enough just torefine the way they are applied.
Relatively few publications [58,66,90] presented the role of consumers in the analysisof the winter sports resort–natural environment relationship. On the one hand, theirmere presence, as well as specific behaviors, are part of the negative impact of a wintersports resort on the environment; on the other hand, it is often the choices they make asto the destination of their ski trips and about a ski trip in general that are the primarytargets of all actions made by winter sports resort managements designed to make both theecological impact of the resort and the impact of climate warming on this resort as little aspossible [58,65]. Whereas the results of the few analyzed studies [88,98,117] that referred to
215

Sustainability 2021, 13, 636
the role of the consumer in the topic discussed indicated, above all, that there is no effectivecommunication about the actions taken and, as a result, customers are not aware of it.
There is no doubt that the attention of researchers today is more and more focusedon the analysis of the current and future consequences of climate warming. This wasclearly evidenced not only by the number of works on “climate change,” but also by howrapidly the number of these works has grown in recent years and the huge number ofcitations of most of these works. Scientific knowledge about climate change issues andtheir impact on the operation of winter sports resorts has undoubtedly been significantlydeveloped in the last two decades, however, also in this case many gaps can still beseen. This is a challenge and a field for future, further research. At the moment, themost important of them seems to be the limitation of research and conclusions in mostpublications [36,37,40,46,55,71,87,112,116] to resorts located only in a specific smaller orlarger region, with highly reduced possibilities of extending these results to other locations.There are no reviews that synthesize conclusions obtained in different regions, which wouldallow to identify key factors that affect the scale of threats in individual resorts. A set offactors like these would be relatively easily used in the analysis of future opportunities andthreats for resorts for which a research like this has not so far been conducted.
To sum up, it can be concluded that the conducted analysis allowed to identify asurprisingly large number of gaps in contemporary scientific knowledge on the issues thathave been the subject of research for many years. On the other hand, it is also true thatthe research area contains issues that are rapidly evolving in the contemporary world andissues that were previously not taken into account, such as the impact of global climatechange. All this generates new challenges for the managers of winter sports resorts and,as a result, new fields of research and scientific analysis that still need to be filled withfurther research.
The scientific output of the presented paper is connected mainly with the detection ofseveral gaps in contemporary knowledge and pointing out numerous directions of futureresearch. All three topics identified in the literature review require urgent development.In the case of “climate change” and “environmental impact,” future research shouldbe focused on the search for general, global rules, as most contemporary publicationsgive insight only into the local/regional conditions of particular resorts. In the case of“management,” the most important direction of future research is an understanding ofthe reasons for the low effectiveness of VEPs and the establishment of new, more effectivetools. Additionally, the ways of effectively using artificial snowmaking and making it lessdangerous for the natural environment is another issue that requires extensive research inthe future. Those implications related to the topic “management” might be perceived alsoas the most important managerial implications of the paper; however, in a paper dealingwith a literature review the most important expected output is always theory development,and practical recommendations play only a supplementary role.
The limitations of the presented conclusions are partly a result of the specific methoditself. Firstly, selecting the SCOPUS database as the basis for the search may seem contro-versial, just like any other alternative choice, and publications can be indicated that werepublished in the period analyzed and were involved in the issues analyzed, but were notincluded in the list because they were published in journals that were not indexed in SCO-PUS. Nevertheless, the SCOPUS database is considered to be one of the most prestigiousand one that contains the most influential scientific journals [25,28,29]. Hence, it can beassumed that publications that are not in journals contained in this database have a smallerimpact on the development of the contemporary scientific knowledge [28]. Selection of theproper data set/data sets always remains the controversial part of any literature review,regardless of the choices made. This selection is always a compromise between the creationof a manageable set of papers and the inclusion of all papers having a significant scientificimpact on future research [24]. The creation of a too wide set of papers might also becontroversial as too much attention can be put on the papers having very little impact andtoo little attention on the most important ones. Among reasonable alternatives for using
216

Sustainability 2021, 13, 636
SCOPUS, the Web of Science (WoS) database can be stated [29]. Contemporary literatureoffers arguments supporting the use of both of these databases solely and commonly, andnone of them remains without questions.
Objections may also be raised to the scope and details of the search formula used,which allowed to select a manageable collection of publications. However, it cannot beruled out that in the SCOPUS database there are also individual subsequent publicationson the issues discussed that were not included in the selected list. Nevertheless, it seemsthat in this case it is not the issue of the detailed elements of its application that is the mostimportant limitation of the method, but the problem is how to keep up with the rapidlydeveloping scientific knowledge. In the list, articles published over the course of almost 20years were analyzed. Equal attention has been paid to both older and newer publications.Whereas, what was known about causes, effects, and expected scenarios of global warmingquickly evolved during that time. The natural conditions associated with the effects of thiswarming that could have been seen more and more clearly have also changed. Therefore,there is a risk that some of the results and conclusions drawn from the older publicationsmay turn out to be at least partially out-of-date in the contemporary world. It may also beone of the reasons why the research results presented in various publications indicated inthe text were different. It was necessary to close the list at a specific point in time, therefore,it was another limitation to the results of the analyses conducted. Certainly, between thatmoment and the moment this article is published, more articles on this subject matter willhave been published. The numbers that show the level of citation of individual publicationswill have certainly changed, as well.
Funding: This research received no external funding.
Institutional Review Board Statement: Not applicable.
Informed Consent Statement: Not applicable.
Data Availability Statement: Data available in a publicly accessible repository.
Conflicts of Interest: The author declares no conflict of interest.
References
1. Gill, A.; Williams, P. Managing growth in mountain tourism communities. Tour. Manag. 1994, 15, 212–220. [CrossRef]2. Tuppen, J. The Restructuring of winter sports resorts in the French Alps: Problems, processes and policies. Int. J. Tour. Res. 2008,
2, 327–344. [CrossRef]3. Williams, P. Sustainable Alpine tourism development: Towards a self improvement approach. In Alpine Tourism. Sustainability
Reconsidered and Redesigned; Weiermair, K., Ed.; University of Innsbruck: Innsbruck, Austria, 1996; pp. 112–134.4. Zemła, M. The product quality of Polish ski-resorts: A case study of Silesian skiers’ requirements, satisfaction and complaints.
Tourism 2008, 56, 41–58.5. Goncalves, V.F.C.; Águas, P.M.R. The concept of life cycle: An application to the tourism product. J. Travel Res. 1997, 35, 12–22.
[CrossRef]6. Flagestad, A.; Hope, C.A. Strategic success in winter sports destinations: A sustainable value creation perspective. Tour. Manag.
2001, 22, 445–461. [CrossRef]7. Hudson, S.; Hudson, L. Winter Sport Tourism. Working in Winter Wonderlands; Goodfellow Publishers: Oxford, UK, 2015.8. Hudson, S. The ’greening’ of ski resorts: A necessity for sustainable tourism, or a marketing opportunity for skiing communities?
J. Vacat. Mark. 1996, 2, 176–185. [CrossRef]9. Todd, S.E.; Williams, P.W. From White to Green: A Proposed Environmental Management System Framework for Ski Areas.
J. Sustain. Tour. 1996, 4, 147–173. [CrossRef]10. Holden, A. Winter tourism and the environment in conflict: The case of Cairngorm, Scotland. Int. J. Tour. Res. 2000, 2, 247–260.
[CrossRef]11. Hudson, S. Snow Business: A Study of the International Ski Industry; Cassell: London, UK, 2000.12. Williams, P.W.; Todd, S.E. Towards an Environmental Management System for Ski Areas. Mt. Res. Dev. 1997, 17, 75. [CrossRef]13. Elsasser, H.; Abegg, B.; Buerki, R. Climate change and winter sports: Environmental and economic threats. Geogr. Bull. 2006, 38, 26–40.14. Zemla, M. Failures in building partnership for success in the competitive market: The case of Polish ski resorts. Manag. Glob.
Trans. 2008, 6, 421–444.15. Dansero, E.; Del Corpo, B.; Mela, A.; Ropolo, I. Olympic Games, conflicts and social movements: The case of Torino 2006.
In Olympic Games, Mega-Events and Civil. Societies; Palgrave Macmillan: London, UK, 2012; pp. 195–218.
217

Sustainability 2021, 13, 636
16. Mair, J.; Ritchie, B.W.; Walters, G. Towards a research agenda for post-disaster and post-crisis recovery strategies for touristdestinations: A narrative review. Curr. Issues Tour. 2016, 19, 1–26. [CrossRef]
17. Ratajczak, P.; Szutowski, D. Exploring the relationship between CSR and innovation. Sustain. Account. Manag. Policy J.2016, 7, 295–318. [CrossRef]
18. Booth, A. Acknowledging a Dual Heritage for Qualitative Evidence Synthesis: Harnessing the Qualitative Research andSystematic Review Research Traditions. Ph.D. Thesis, University of Sheffield, Sheffield, UK, 2013.
19. Booth, A.; Sutton, A.; Papaioannou, D. Systematic Approaches to Successful Literature Review; SAGE Publications Ltd.: London,UK, 2016.
20. Bryman, A.; Buchanan, D.A. The SAGE Handbook of Organizational Research Methods; Sage: London, UK, 2011.21. Mays, N.; Pope, C.; Popay, J. Systematically reviewing qualitative and quantitative evidence to inform management and
policy-making in the health field. J. Health Serv. Res. Policy 2005, 10, 6–20. [CrossRef]22. Greenhalgh, T.; Robert, G.; Macfarlane, F.; Bate, P.; Kyriakidou, O.; Peacock, R. Storylines of research in diffusion of innovation:
A meta-narrative approach to systematic review. Soc. Sci. Med. 2005, 61, 417–430. [CrossRef]23. Kannisto, K.A.; Koivunen, M.H.; Välimäki, M. Use of Mobile Phone Text Message Reminders in Health Care Services: A Narrative
Literature Review. J. Med. Int. Res. 2014, 16, e222. [CrossRef] [PubMed]24. Galvagno, M.; Dalli, D. Theory of value co-creation: A systematic literature review. Manag. Serv. Qual. Int. J. 2014, 24, 643–683.
[CrossRef]25. Popova, S.; Lange, S.; Bekmuradov, D.; Mihic, A.; Rehm, J. Fetal Alcohol Spectrum Disorder Prevalence Estimates in Correctional
Systems: A Systematic Literature Review. Can. J. Public Health 2011, 102, 336–340. [CrossRef] [PubMed]26. Oliveira, A.S.; de Barros, M.D.; de Carvalho Pereira, F.; Gomes, C.F.S.; da Costa, H.G. Prospective scenarios: A literature review
on the Scopus database. Futures 2018, 100, 20–33. [CrossRef]27. Chadegani, A.A.; Salehi, H.; Yunus, M.M.; Farhadi, H.; Fooladi, M.; Farhadi, M.; Ebrahim, N.A. A Comparison between Two
Main Academic Literature Collections: Web of Science and Scopus Databases. Asian Soc. Sci. 2013, 9, 18. [CrossRef]28. Osmani, M.; Weerakkody, V.; Hindi, N.M.; Al-Esmail, R.; Eldabi, T.; Kapoor, K.; Irani, Z. Identifying the trends and impact of
graduate attributes on employability: A literature review. Tert. Educ. Manag. 2015, 21, 367–379. [CrossRef]29. Wamba, S.F.; Akter, S. Big data analytics for supply chain management: A literature review and research agenda. In Workshop on
Enterprise and Organizational Modeling and Simulation; Springer: Cham, Switzerland, 2015; pp. 61–72.30. Hassan, S.-U.; Imran, M.; Gillani, U.A.; Aljohani, N.R.; Bowman, T.D.; Didegah, F. Measuring social media activity of scientific
literature: An exhaustive comparison of scopus and novel altmetrics big data. Scientometrics 2017, 113, 1037–1057. [CrossRef]31. Jaremen, D.E.; Nawrocka, E.; Zemła, M. Externalities of development of the sharing economy in tourism cities. Int. J. Tour. Cities
2020, 6, 138–157. [CrossRef]32. Brzezinski, M. Power laws in citation distributions: Evidence from Scopus. Scientometrics 2015, 103, 213–228. [CrossRef] [PubMed]33. Restall, B.; Conrad, E. A literature review of connectedness to nature and its potential for environmental management. J. Environ.
Manag. 2015, 159, 264–278. [CrossRef] [PubMed]34. Hassan, S.U.; Visvizi, A.; Waheed, H. The ‘who’ and the ‘what’ in international migration research: Data-driven analysis of
Scopus-indexed scientific literature. Behav. Inf. Technol. 2019, 38, 924–939. [CrossRef]35. Meho, L.I.; Rogers, Y. Citation counting, citation ranking, and h-index of human-computer interaction researchers: A comparison
of Scopus and Web of Science. J. Am. Soc. Inf. Sci. Technol. 2008, 59, 1711–1726. [CrossRef]36. Scott, D.; Steiger, R.; Knowles, N.; Fang, Y. Regional ski tourism risk to climate change: An inter-comparison of Eastern Canada
and US Northeast markets. J. Sustain. Tour. 2019, 28, 568–586. [CrossRef]37. Steiger, R.; Scott, D. Ski tourism in a warmer world: Increased adaptation and regional economic impacts in Austria. Tour. Manag.
2020, 77, 104032. [CrossRef]38. Ballotta, L.; Fusai, G.; Kyriakou, I.; Papapostolou, N.C.; Pouliasis, P.K. Risk management of climate impact for tourism operators:
An empirical analysis on ski resorts. Tour. Manag. 2020, 77, 104011. [CrossRef]39. Weiss, H.S.; Bierman, P.R.; Dubief, Y.; Hamshaw, S.D. Optimization of over-summer snow storage at midlatitudes and low
elevation. Cryosphere 2019, 13, 3367–3382. [CrossRef]40. Rivera, J.; Clement, V. Business adaptation to climate change: American ski resorts and warmer temperatures. Bus. Strat. Environ.
2019, 28, 1285–1301. [CrossRef]41. Kušcer, K.; Dwyer, L. Determinants of sustainability of ski resorts: Do size and altitude matter? Eur. Sport Manag. Q. 2018, 19, 539–559.
[CrossRef]42. Bausch, T.; Humpe, A.; Gössling, S. Does Climate Change Influence Guest Loyalty at Alpine Winter Destinations? Sustainability
2019, 11, 4233. [CrossRef]43. Steiger, R.; Scott, D.; Abegg, B.; Pons, M.; Aall, C. A critical review of climate change risk for ski tourism. Curr. Issues Tour. 2019,
22, 1343–1379. [CrossRef]44. Bacchiocchi, S.C.; Zerbe, S.; Cavieres, L.A.; Wellstein, C. Impact of ski piste management on mountain grassland ecosystems in
the Southern Alps. Sci. Total. Environ. 2019, 665, 959–967. [CrossRef]45. Gajdošíková, Z.; Gajdošík, T.; Kucerová, J. Slovak winter tourism destinations: Future playground for tourists in the Carpathians.
Tour. Hosp. Manag. 2019, 25, 161–178. [CrossRef]
218

Sustainability 2021, 13, 636
46. Spandre, P.; François, H.; Verfaillie, D.; George, E.; Morin, S. Winter tourism under climate change in the Pyrenees and the Frenchalps: Relevance of snowmaking as a technical adaptation. Cryosphere 2019, 13, 1325–1347. [CrossRef]
47. Knowles, N.L.B. Can the North American ski industry attain climate resiliency? A modified Delphi survey on transformationstowards sustainable tourism. J. Sustain. Tour. 2019, 27, 380–397. [CrossRef]
48. Cholakova, S.D.; Dogramadjeva, E.D. Climate change and the future of Pamporovo ski resort Bulgaria. the view of the localpopulation. Eur. J. Geogr. 2019, 10, 56–76.
49. Cholakova, S.D.; Dogramadjeva, E.D. Climate change and ski industry in Pamporovo resort, Bulgaria: An exploratory study onthe tourists’ perceptions. Eur. J. Tour. Res. 2019, 22, 166–192.
50. Demiroglu, O.C.; Dannevig, H.; Aall, C. Climate change acknowledgement and responses of summer (glacier) ski visitors inNorway. Scand. J. Hosp. Tour. 2018, 18, 419–438. [CrossRef]
51. Chin, N.; Byun, K.; Hamlet, A.F.; Cherkauer, K.A. Assessing potential winter weather response to climate change and implicationsfor tourism in the U.S. Great Lakes and Midwest. J. Hydrol. Reg. Stud. 2018, 19, 42–56. [CrossRef]
52. Gilani, H.R.; Innes, J.L.; De Grave, A. The effects of seasonal business diversification of British Columbia ski resorts on forestmanagement. J. Outdoor Recreat. Tour. 2018, 23, 51–58. [CrossRef]
53. Krticka, L.; Tomcíková, I.; Rakytová, I. Development versus conservation: Evaluation of landscape structure changes inDemänovská Valley, Slovakia. J. Mt. Sci. 2018, 15, 1153–1170. [CrossRef]
54. Dornier, R.; Mauri, C. Overview: Tourism sustainability in the Alpine region: The major trends and challenges. Worldw. Hosp.Tour. Themes 2018, 10, 136–139. [CrossRef]
55. Suzuki-Parker, A.; Miura, Y.; Kusaka, H.; Kureha, M. Assessing the Sustainability of Ski Fields in Southern Japan under GlobalWarming. Adv. Meteorol. 2018, 2018, 1–10. [CrossRef]
56. Hallandvik, L.; Andresen, M.S.; Aadland, E. Decision-making in avalanche terrain–How does assessment of terrain, reading ofavalanche forecast and environmental observations differ by skiers’ skill level? J. Outdoor Recreat. Tour. 2017, 20, 45–51. [CrossRef]
57. Falk, M.T.; Vieru, M. Demand for downhill skiing in subarctic climates. Scand. J. Hosp. Tour. 2016, 17, 388–405. [CrossRef]58. Sato, S.; Ko, Y.J.; Kellison, T.; Harada, M.; Bizen, Y. Do Snow-Based Sport Participants Intend to Purchase Products from
Environmentally Friendly Companies? J. Glob. Sport Manag. 2017, 2, 182–195. [CrossRef]59. Saiz, H.; Gartzia, M.; Errea, P.; Fillat, F.; Alados, C.L. Structure of Stockmen Collaboration Networks Under Two Contrasting
Touristic Regimes in the Spanish Central Pyrenees. Rangel. Ecol. Manag. 2017, 70, 281–289. [CrossRef]60. Rutty, M.; Scott, D.; Johnson, P.; Pons, M.; Steiger, R.; Vilella, M. Using ski industry response to climatic variability to assess
climate change risk: An analogue study in Eastern Canada. Tour. Manag. 2017, 58, 196–204. [CrossRef]61. Spandre, P.; François, H.; George-Marcelpoil, E.; Morin, S. Panel based assessment of snow management operations in French ski
resorts. J. Outdoor Recreat. Tour. 2016, 16, 24–36. [CrossRef]62. Fischer, A.; Helfricht, K.; Stocker-Waldhuber, M. Local reduction of decadal glacier thickness loss through mass balance
management in ski resorts. Cryosphere 2016, 10, 2941–2952. [CrossRef]63. Brambilla, M.; Pedrini, P.; Rolando, A.; Chamberlain, D. Climate change will increase the potential conflict between skiing and
high-elevation bird species in the Alps. J. Biogeogr. 2016, 43, 2299–2309. [CrossRef]64. Caprio, E.; Chamberlain, D.; Rolando, A. Ski-piste revegetation promotes partial bird community recovery in the European Alps.
Bird Study 2016, 63, 470–478. [CrossRef]65. Van Hoang, T.H.; Przychodzen, W.; Przychodzen, J.; Segbotangni, E.A. Does it pay to be green? A disaggregated analysis of U.S.
firms with green patents. Bus. Strat. Environ. 2020, 29, 1331–1361. [CrossRef]66. Duglio, S.; Beltramo, R. Environmental Management and Sustainable Labels in the Ski Industry: A Critical Review. Sustainability
2016, 8, 851. [CrossRef]67. Tashman, P.; Rivera, J. Ecological uncertainty, adaptation, and mitigation in the U.S. ski resort industry: Managing resource
dependence and institutional pressures. Strat. Manag. J. 2015, 37, 1507–1525. [CrossRef]68. Cocolas, N.; Walters, G.; Ruhanen, L. Behavioural adaptation to climate change among winter alpine tourists: An analysis of
tourist motivations and leisure substitutability. J. Sustain. Tour. 2015, 24, 846–865. [CrossRef]69. Haanpää, S.; Juhola, S.; Landauer, M. Adapting to climate change: Perceptions of vulnerability of down-hill ski area operators in
Southern and Middle Finland. Curr. Issues Tour. 2014, 18, 966–978. [CrossRef]70. Rutty, M.; Scott, D.; Johnson, P.; Pons, M.; Steiger, R. Behavioural adaptation of skiers to climatic variability and change in Ontario,
Canada. J. Outdoor Recreat. Tour. 2015, 11, 13–21. [CrossRef]71. Pons, M.; López-Moreno, J.I.; Rosas-Casals, M.; Jover, È. The vulnerability of Pyrenean ski resorts to climate-induced changes in
the snowpack. Clim. Chang. 2015, 131, 591–605. [CrossRef]72. Demiroglu, O.C.; Kucerová, J.; Ozcelebi, O. Snow reliability and climate elasticity: Case of a Slovak ski resort. Tour. Rev. 2015, 70, 1–12.
[CrossRef]73. Damm, A.; Köberl, J.; Prettenthaler, F. Does artificial snow production pay under future climate conditions?—A case study for a
vulnerable ski area in Austria. Tour. Manag. 2014, 43, 8–21. [CrossRef]74. Fischer, A. Snow flakes and fates: What hope is there for Alpine winter tourism? Sustain. Tour. VI 2014, 187, 293–305.75. Trawöger, L. Convinced, ambivalent or annoyed: Tyrolean ski tourism stakeholders and their perceptions of climate change.
Tour. Manag. 2014, 40, 338–351. [CrossRef]
219

Sustainability 2021, 13, 636
76. Hopkins, D. The sustainability of climate change adaptation strategies in New Zealand’s ski industry: A range of stakeholderperceptions. J. Sustain. Tour. 2014, 22, 107–126. [CrossRef]
77. Dar, R.A.; Rashid, I.; Romshoo, S.A.; Marazi, A. Sustainability of winter tourism in a changing climate over Kashmir Himalaya.Environ. Monit. Assess. 2013, 186, 2549–2562. [CrossRef]
78. Ghaderi, Z.; Khoshkam, M.; Henderson, J.C. From snow skiing to grass skiing: Implications of climate change for the ski industryin Dizin, Iran. Anatolia 2013, 25, 96–107. [CrossRef]
79. Hopkins, D.; Maclean, K. Climate change perceptions and responses in Scotland’s ski industry. Tour. Geogr. 2014, 16, 400–414.[CrossRef]
80. Sato, C.F.; Schroder, M.; Green, K.; Michael, D.R.; Osborne, W.; Lindenmayer, D.B. Managing ski resorts to improve biodiversityconservation: Australian reptiles as a case study. Ecol. Manag. Restor. 2014, 15, 147–154. [CrossRef]
81. Rutty, M.; Matthews, L.; Scott, D.; Del Matto, T. Using vehicle monitoring technology and eco-driver training to reduce fuel useand emissions in tourism: A ski resort case study. J. Sustain. Tour. 2013, 22, 787–800. [CrossRef]
82. Pons, M.; López Moreno, J.I.; Esteban, P.; Macià, S.; Gavaldà, J.; García, C.; Rosas-Casals, M.; Jover, E. Climate change influence onwinter tourism in the Pyrenees. Experience from the NIVOPYR research project. Pirineos 2014, 169, 169006.
83. Steiger, R.; Stötter, J. Climate Change Impact Assessment of Ski Tourism in Tyrol. Tour. Geogr. 2013, 15, 577–600. [CrossRef]84. Hendrikx, J.; Zammit, C.; Hreinsson, E.Ö.; Becken, S. A comparative assessment of the potential impact of climate change on the
ski industry in New Zealand and Australia. Clim. Chang. 2013, 119, 965–978. [CrossRef]85. Barrantes, O.; Reiné, R.; Ferrer, C. Changes in Land Use of Pyrenean Mountain Pastures—Ski Runs and Livestock Management—
Between 1972 and 2005 and the Effects on Subalpine Grasslands. Arctic. Antarct. Alp. Res. 2013, 45, 318–329. [CrossRef]86. Gonseth, C. Impact of snow variability on the Swiss winter tourism sector: Implications in an era of climate change. Clim. Chang.
2013, 119, 307–320. [CrossRef]87. Dawson, J.; Scott, D. Managing for climate change in the alpine ski sector. Tour. Manag. 2013, 35, 244–254. [CrossRef]88. Needham, M.D.; Little, C.M. Voluntary environmental programs at an alpine ski area: Visitor perceptions, attachment, value
orientations, and specialization. Tour. Manag. 2013, 35, 70–81. [CrossRef]89. Morrison, C.; Pickering, C.M. Perceptions of climate change impacts, adaptation and limits to adaption in the Australian Alps:
The ski-tourism industry and key stakeholders. J. Sustain. Tour. 2013, 21, 173–191. [CrossRef]90. Pröbstl-Haider, U.; Haider, W. Tools for measuring the intention for adapting to climate change by winter tourists: Some thoughts
on consumer behavior research and an empirical example. Tour. Rev. 2013, 68, 44–55. [CrossRef]91. Luthe, T.; Kägi, T.; Reger, J. A systems approach to sustainable technical product design: Combining life cycle assessment and
virtual development in the case of skis. J. Ind. Ecol. 2013, 17, 605–617. [CrossRef]92. Spector, S.; Chard, C.; Mallen, C.; Hyatt, C. Socially constructed environmental issues and sport: A content analysis of Ski Resort
Environmental Communications. Sport Manag. Rev. 2012, 15, 416–433. [CrossRef]93. Kangas, K.; Vuori, K.-M.; Määttä-Juntunen, H.; Siikamäki, P. Impacts of ski resorts on water quality of boreal lakes: A case study
in northern Finland. Boreal Environ. Res. 2012, 17, 313–325.94. Burt, J.W. Developing restoration planting mixes for active ski slopes: A multi-site reference community approach. Environ.
Manag. 2012, 49, 636–648. [CrossRef]95. Ristic, R.; Kašanin-Grubin, M.; Radic, B.; Nikic, Z.; Vasiljevic, N. Land Degradation at the Stara Planina Ski Resort. Environ.
Manag. 2012, 49, 580–592. [CrossRef]96. Keßler, T.; Cierjacks, A.; Ernst, R.; Dziock, F. Direct and indirect effects of ski run management on alpine Orthoptera. Biodivers.
Conserv. 2011, 21, 281–296. [CrossRef]97. Evette, A.; Peyras, L.; François, H.; Gaucherand, S. Environmental risks and impacts of mountain reservoirs for artificial snow
production in a context of climate change. Rev. Geogr. Alp. 2011, 99, 2. [CrossRef]98. Little, C.M.; Needham, M.D. Skier and Snowboarder Motivations and Knowledge Related to Voluntary Environmental Programs
at an Alpine Ski Area. Environ. Manag. 2011, 48, 895–909. [CrossRef]99. Steiger, R. The impact of snow scarcity on ski tourism: An analysis of the record warm season 2006/2007 in Tyrol (Austria).
Tour. Rev. 2011, 66, 4–13. [CrossRef]100. Roux-Fouillet, P.; Wipf, S.; Rixen, C. Long-term impacts of ski piste management on alpine vegetation and soils. J. Appl. Ecol.
2011, 48, 906–915. [CrossRef]101. Smerecnik, K.R.; Andersen, P.A. The diffusion of environmental sustainability innovations in North American hotels and ski
resorts. J. Sustain. Tour. 2011, 19, 171–196. [CrossRef]102. Bank, M.; Wiesner, R. Determinants of weather derivatives usage in the Austrian winter tourism industry. Tour. Manag.
2011, 32, 62–68. [CrossRef]103. Negro, M.; Isaia, M.; Palestrini, C.; Schoenhofer, A.; Rolando, A. The impact of high-altitude ski pistes on ground-dwelling
arthropods in the Alps. Biodivers. Conserv. 2010, 19, 1853–1870. [CrossRef]104. Bark, R.H.; Colby, B.G.; Domínguez, F. Snow days? Snowmaking adaptation and the future of low latitude, high elevation skiing
in Arizona, USA. Clim. Chang. 2009, 102, 467–491. [CrossRef]105. Burt, J.W.; Rice, K.J. Not all ski slopes are created equal: Disturbance intensity affects ecosystem properties. Ecol. Appl.
2009, 19, 2242–2253. [CrossRef]
220

Sustainability 2021, 13, 636
106. Arcuset, L. Possible paths towards sustainable tourism development in a high-mountain resort: The case of Valloire.Rev. Geogr. Alp. 2009, 97, 1–13. [CrossRef]
107. Vanham, D.; Fleischhacker, E.; Rauch, W. Impact of snowmaking on alpine water resources management under present andclimate change conditions. Water Sci. Technol. 2009, 59, 1793–1801. [CrossRef]
108. Kangas, K.; Tolvanen, A.; Kälkäjä, T.; Siikamäki, P. Ecological Impacts of Revegetation and Management Practices of Ski Slopes inNorthern Finland. Environ. Manag. 2009, 44, 408–419. [CrossRef]
109. Hoffmann, V.H.; Sprengel, D.C.; Ziegler, A.; Kolb, M.; Abegg, B. Determinants of corporate adaptation to climate change in wintertourism: An econometric analysis. Glob. Environ. Chang. 2009, 19, 256–264. [CrossRef]
110. Shih, C.; Nicholls, S.; Holecek, D.F. Impact of Weather on Downhill Ski Lift Ticket Sales. J. Travel Res. 2008, 47, 359–372. [CrossRef]111. Scott, D.; Dawson, J.; Jones, B. Climate change vulnerability of the US Northeast winter recreation– tourism sector. Mitig. Adapt.
Strat. Glob. Chang. 2007, 13, 577–596. [CrossRef]112. Pröbstl, U.; Prutsch, A.; Formayer, H.; Landauer, M.; Grabler, K.; Kulnig, A.; Jesch, M.; Dallhammer, E.; Krajasits, C. Climate
change in winter sport destinations—Transdisciplinary research for implementing sustainable tourism. Sustain. Tour. III 2008,115, 165–173.
113. Sharma, S.; Aragón-Correa, J.A.; Rueda-Manzanares, A. The contingent influence of organizational capabilities on proactiveenvironmental strategy in the service sector: An analysis of North American and European ski resorts. Can. J. Adm. Sci.2007, 24, 268–283. [CrossRef]
114. Scott, D.; McBoyle, G. Climate change adaptation in the ski industry. Mitig. Adapt. Strat. Glob. Chang. 2006, 12, 1411–1431.[CrossRef]
115. Bicknell, S.; McManus, P. The Canary in the Coalmine: Australian Ski Resorts and their Response to Climate Change. Geogr. Res.2006, 44, 386–400. [CrossRef]
116. Scott, D.; McBoyle, G.; Minogue, A.; Mills, B. Climate change and the sustainability of ski-based tourism in eastern North America:A reassessment. J. Sust. Tour. 2006, 14, 376–398. [CrossRef]
117. Rivera, J.; De Leon, P.; Koerber, C. Is Greener Whiter Yet? The Sustainable Slopes Program after Five Years. Policy Stud. J.2006, 34, 195–221. [CrossRef]
118. Wipf, S.; Rixen, C.; Fischer, M.; Schmid, B.; Stoeckli, V. Effects of ski piste preparation on alpine vegetation. J. Appl. Ecol.2005, 42, 306–316. [CrossRef]
119. Rivera, J.; de Leon, P. Is greener whiter? Voluntary environmental performance of Western Ski Areas. Policy Stud. J. 2004,32, 417–437. [CrossRef]
120. Scott, D.; McBoyle, G.; Mills, B. Climate change and the skiing industry in southern Ontario (Canada): Exploring the importanceof terms and conditions. Clim. Res. 2003, 23, 171–181. [CrossRef]
121. George, A. Managing ski resorts: Perceptions from the field regarding the sustainable slopes charter. Manag. Leis. 2003, 8, 41–46.[CrossRef]
122. Good, R. Ecologically Sustainable Development in the Australian Alps. Mt. Res. Dev. 1995, 15, 251–258. [CrossRef]123. Holden, A. The use of visitor understanding in skiing management and development decisions at the Cairngorm mountains,
Scotland. Tour. Manag. 1998, 19, 145–152. [CrossRef]124. Peeters, P.M.; Gössling, S.; Klijs, J.; Milano, C.; Novelli, M.; Dijkmans, C.H.S.; Mitas, O. Research for TRAN Committee-Overtourism:
Impact and Possible Policy Responses; European Parliament, Directorate General for Internal Policies, Policy Department B: Structuraland Cohesion Policies, Transport and Tourism: Brussels, Belgium, 2018.
125. Dodds, R.; Butler, R. Overtourism: Issues, Realities and Solutions; De Gruyter: Berlin, Germany, 2019.
221


sustainability
Article
A Model of the Sustainable Management of theNatural Environment in National Parks—A CaseStudy of National Parks in Poland
Piotr Olesniewicz 1, Sławomir Pytel 2,*, Julita Markiewicz-Patkowska 3, Adam R. Szromek 4 and
Sona Jandová 5
1 Faculty of Physical Education, University School of Physical Education in Wrocław, al. Ignacego JanaPaderewskiego 35, 51-612 Wrocław, Poland; [email protected]
2 Faculty of Life Sciences, University of Silesia in Katowice, ul. Bedzinska 60, 41-200 Sosnowiec, Poland3 Faculty of Finance and Management, WSB University in Wrocław, ul. Fabryczna 29–31, 53-609 Wrocław,
Poland; [email protected] Faculty of Organization and Management, Silesian University of Technology, ul. Roosevelta 26,
41-800 Zabrze, Poland; [email protected] Technical University of Liberec, Faculty of Mechanical Engineering, Department of Applied Mechanics
Studentská 2, 461 17 Liberec, Czech Republic; [email protected]* Correspondence: [email protected]; Tel.: +48-323-689-213
Received: 30 January 2020; Accepted: 27 March 2020; Published: 30 March 2020
Abstract: This paper aimed to present a model of natural environment management in national parksin Poland in the context of increased tourist traffic. The research area comprised Polish national parksas they are characterized by barely altered nature, little human impact, and undisturbed naturalphenomena. The methods involved the observational method, literature analysis and criticism,and the in-depth interview method employed in November 2019. The respondents included nationalpark management staff. The questions were prepared in accordance with the Berlin Declarationprinciples of sustainable tourism development and were extended with the authors’ own items.The questionnaire contained 17 questions, grouped in four parts: science and documentation; tourism;cooperation and education; environmental threats. The results indicate that in order for actions toprove efficient in a park, a conservation plan should be carefully developed. Its correctness requiresmonitoring the state of the environment, tourist traffic size and trends, and tourists’ impact on theenvironment. An important condition for effective tourism management in parks is to increase thecompetences of the administering bodies and knowledge regarding individuals’ responsibilities.Boards should be able to evaluate and modify conservation plans, spatial development plans,municipality development strategies, and projects for investments within the parks.
Keywords: sustainability; national park; management; tourism
1. Introduction
One of the basic contemporary problems is to maintain balance between tourism developmentand the need to preserve the valuable natural heritage. The only way to achieve the compromise issustainable development, the principles of which are embedded in the strategies of all fields of theeconomy, including tourism. However, the low social awareness of threats, as well as the incomes fromtourism for the inhabitants of regions attractive to tourists, significantly complicates the managementof valuable natural areas.
The best known form of nature conservation, embracing areas of the most valuable nature andlandscape, are national parks. Their idea dates back to the second half of the 19th century, when the firstnational park in the world, Yellowstone National Park, was established in 1872. Some researchers claim
Sustainability 2020, 12, 2704; doi:10.3390/su12072704 www.mdpi.com/journal/sustainability223

Sustainability 2020, 12, 2704
that this form of nature conservation should actually be treated as an investment for future generations [1].Therefore, proper management of a national park is important and should consist in proper planning,organizing, supervising, and controlling its activities [2]. Modern tourism is often oriented towardsshort-term income and thus contributes to the destruction of what it was originally supposed to profitfrom. This is caused by excessive concentration of tourist traffic, an improperly located tourist base, often inplaces of highest natural value, inappropriate forms of organizing recreation, and a lack of tourist culture.The introduction of pro-environmental measures in tourism may contribute to increasing the number ofnew jobs, while reducing the consumption of non-renewable resources. Planning actions for the sustainabledevelopment of human–nature systems requires integrated management and thinking. Two importantelements in the management of the relationship between nature and the community are ecosystem servicesand community livelihoods [3]. Natural protected areas face the challenge of reconciling natural attractionswith the satisfaction of different stakeholders without compromising their own resources. Appropriatemanagement and marketing can play an important role in sustainable activities [4]. In terms of management,natural beauty can be a double-edged sword for a given area. Beautiful scenery is a magnet that attractsnot only visitors but also second home owners. The latter can make a significant contribution to the localeconomy; a high demand for moving can increase the prices of local products and real assets, which inturn may affect the quality of life of local residents. On the other hand, the development of real assets maythreaten the integrity of natural resources in the area. Therefore, a sustainable approach should be adoptedin regions attractive in terms of their natural environment to prevent overtourism [5].
According to the World Commission on Protected Areas, the management of protectedareas is now understood as the main element of the legal, political, institutional, and practicalframework of conservation worldwide. The concept and its application remain a challenge for mostcountries. Countries are obliged to promote management diversity and to strengthen the relevantpolicies, practices, and capacities. The World Commission on Protected Areas (WCPA) has alsoprepared technical tools, such as the best practice guidelines for the management of protected areas.The Commission’s objective is to increase the capacity, effectiveness, and efficiency of protected areamanagers, both decision makers and others, in relation to sustainable tourism, by learning, exchanging,and developing information and guidance. The presented article is an attempt to engage in therecommendations of the World Commission on Protected Areas.
According to Myga-Piatek and Jankowski [6], tourism is becoming a global social phenomenon,with a considerable anthropogenic impact on the environment. The development of mass commercialtourism, its penetration into all types of landscape, and its impact on various geosystem componentsare beginning to cause losses and destruction in natural systems, as well as modifications to thesocio-cultural environment. The most radical transformations are observed in mountain ecosystemsowing to, among others, year-round tourist traffic loads and the orographic specificity. Krupa [7]indicates that the process of tourism management should be holistic, which means that tourismdevelopment must be integrated with the development of other economic areas in the region orcountry. Managing the development of all forms of sustainable tourism, especially in areas of highenvironmental value, is to consist mainly in properly controlling tourist traffic in time and space,creating zones for different types of tourist penetration, and planning the necessary infrastructureadapted to the individual conditions of the protected area.
On the basis of the above, it was established that it was essential to create a model of naturalenvironment management in national parks in Poland in the context of increased tourist traffic.This became the purpose of the presented paper.
There are many instruments of environmental management in Poland. As indicated byMizgajski [8], management can be divided into ongoing and programmed environmental protection.The most important groups of current control instruments include legal and administrative proceduresand solutions, financial and economic instruments, and sanctions. In the first group, the authorenumerates administrative decisions of regulatory nature, administrative proceedings conductedwith public participation. The financial and economic instruments of environmental management
224

Sustainability 2020, 12, 2704
involve, among others, charges for the use of the environment and administrative financial penalties,together with a mechanism for deferring and remitting them when investments are carried out,which eliminate exceeding the permissible levels of pollutant emissions, as well as public fundingsupport for environmental conservation projects. There are also so-called soft instruments related tothe market-based approach to environmental conservation by promoting environmentally friendlyproducts. Mizgajski [8] also discusses the second vast sphere of environmental management,namely environmental conservation planning. It covers the whole range of issues related to preparingand evaluating programme documents, including those of a strategic character. All of them mustbegin with an environmental diagnosis involving an assessment of the state of the environment,anthropogenic impact, as well as the corrective actions taken. On its basis, future changes are projectedand the scope of the programme implementation is defined.
However, the literature lacks descriptions of sustainable and comprehensive management.Therefore, it is justified to address the issue of model natural environment management in a sustainablemanner, which can be completed by effective, sustainable, and comprehensive management.
2. Literature Review
Investigating the relationship between the natural environment and man is of interest to manyscientific disciplines. In addition to the biological and geographical sciences that traditionally refer toit, the following should be mentioned: sociology, economics, spatial planning, landscape architecture,urban planning, political science, and law sciences. The scientific discourse is conducted on the basisof the assumptions of the sustainable development concept around the relationships among natural,cultural, and socio-economic values. Such a wide range of research into the relationship betweennature and man has yielded a rich literature output.
Human–environment relations are an important research issue of physical and socio-economicgeography and regional geography. Here, one can point at works on research methods and relationshipsbetween man and nature [9–12]. Moreover, the impact of the park and social dilemmas have beenanalysed [13–16], as well as major problems and trends in the relationship between the environmentand man [17,18]. Regional geography has been discussed as a discipline and subject of research andteaching [19–23]. Human activity changes our natural environment and, in extreme cases, even leads tothe exhaustion of biodiversity. Chemini and Rizzoli [24] have paid special attention to this, pointing outthat biodiversity not only has ethical and cultural value but also plays a role in the functioningof ecosystems.
There is also a wealth of theoretical output in the field of research methods and the assessment of thehuman–environment relationship. A research methodology has been described [25–28], and modellingsustainable development by constructing theories and typologies has been dealt with [29–32]. Butler [33]reviewed the term ‘sustainable tourism,’ starting with a discussion on the confusion arising fromimprecise and contradictory definitions of the concept and the need to distinguish between sustainabletourism and tourism development based on sustainable development principles.
Numerous studies have focused on quantitative methods and emphasized the economic aspects.The economic benefits of national parks were described [34,35], as well as park management and thecosts and advantages of parks. Abel and Blaikie [36] present new ideas for wildlife conservation inAfrica, indicating that they are inappropriate. A high proportion of the ideas do not address problemsrelated to social conflicts. It is precisely these historical conflicts that can reveal much about the sourcesof contemporary ecological problems. The case study of the Luangwa Valley in Zambia demonstratesa method to remedy these weaknesses. In the first part of the article, the authors examine the role ofLuangwa national parks in the context of the Zambian political economy and identify social groupscompeting for park resources. They then follow the historical origins of contemporary ecologicalchanges. These analyses lead to a model of parks and their relationships with the national economy.Clough and Meister [37] point out that since resources are limited, there is greater pressure on thosewho manage them to share them in a way allowing to maximise the benefits to the society. In this
225

Sustainability 2020, 12, 2704
study, an attempt was made to do this for the Whakapapa ski field and a village in Tongariro NationalPark. The aim of the research was to provide information that would allow us to estimate the economicvalue of the Whakapapa ski field, both for the region and for the whole country. This entails the use ofappropriate economic techniques which, although well known abroad, had been relatively rarely usedin New Zealand. Trakolis [38] presented the local residents’ perception of planning and managementissues, as investigated in a national park in north-western Greece. The conflicts caused by the lack of thelocal community participation in the designation procedure and then in the decision-making processrequired research. The author verified the knowledge about the park and its objectives, the necessityof works and the quality of infrastructure, attitudes towards certain decisions, and the managementpattern and effectiveness. Ferraro [39] focused on the fact that the long-term integrity of protected areasin low-income countries depended on the support of the neighbouring rural communities. He pointedout the need to understand the alternative costs of nature conservation, which are borne by the ruralcommunities neighbouring the protected areas. The author stated that there were few analyses ofthe effects of establishing protected areas. Cihar and Stankova [40] collected opinions and attitudestowards nature conservation and tourism in the territory of a Czech national park that had been closedto the public for 40 years because of the Iron Curtain. The authors conducted a survey among visitors,residents, and representatives of local self-governments.
An important issue raised in the literature was the awareness of the need to involve localcommunities in the processes of managing natural resources and protected areas. The researcherspointed out that the condition of the coexistence of nature and people living in protected areas wasproper social communication.
Another issue was the impact of the community on national parks. Jarvis [41] points out thatland protection in parks is often perceived as a cost for the economic development of rural areas.However, the debate on the development of the Canyon Forest Village on the southern edge of theGrand Canyon suggested the opposite. It indicated that natural systems could be extremely valuable torural economies and that national parks and rural area development could go hand in hand. Accordingto Kideghesho et al. [42], attitude research is increasingly recognized as a tool for assessing publicunderstanding and acceptance for protection. The results of the study were useful in guiding politicalinterventions. The investigators found that attitudes were positively or negatively influenced by manyfactors. Factors triggering positive attitudes reinforce protection objectives, while those generatingnegative attitudes may adversely affect the objectives.
There is also research on social conflicts in national parks. Fortin and Gagnon [43] indicatethat many national parks have been established around the world to protect nature, but not withoutconsequences for the neighbouring communities. As the social and economic development of thepopulation living around the park is increasingly recognized as essential to achieve protection objectives,the quality of park–community relationships has become a key issue. Burger [44] emphasizes theimportance of the position of local people in the case of investments that may affect their lives. He claimsthat the participation of the local community in the course of park construction should be a significantelement of the decision-making process. Królikowska [45], points to the so-called British concept ofthe relationship between the local population and the protected area, where people are perceived asan integral part of the landscape. The system of managing protected areas is as a rule focused moreon sustainable development than on strict protection. This approach allows for the promotion ofagricultural, forestry, or fishing activities within protected areas. Hibszer [46] referred to a key issueof the relationship between man and environment. The problem addressed in the study concernedthe relationship between the national park and the local community. Its essence was to answer thequestion of how the population living in national parks or their vicinity perceived their relationshipwith their closest national park. The awareness of the need to maintain balance between the protectionof natural and landscape values and the social and economic development of park communes, asdeclared by the authorities, is an important premise for verifying the relationships between this formof protected areas and local communities in Poland. According to Barker [47], further development of
226

Sustainability 2020, 12, 2704
mass tourism in the Alps burdens the landscape and the local communities. However, various forms ofthe development are observed. In the western Alps, ski resorts develop at high altitudes, outside localcommunities. In the eastern Alps, tourist facilities are concentrated around traditional communities.Congestion and pollution are obvious. Local and regional planning strategies adopted in response tochanges in tourism in the Alps provide relevant experiences for other mountain regions.
Other social conflicts have also been described. Beltran [16], presented an interesting way ofresolving conflicts between a national park and the population on the example of Sagarmatha NationalPark. The government of Nepal responded to international concerns about the environmental crisis byestablishing Sagarmatha National Park. In many parts of the world, the formation of national parksdisplaced indigenous people and imposed a strict nature conservation policy to create ‘wilderness’.Sagarmatha National Park, on the other hand, was a pioneering example of a new type of protectedarea, which recognized the rights of indigenous people to settle and provide for themselves. Bauer [48],on the example of Waza National Park in Cameron, indicated complex interactions between the parkand the surrounding population. The adopted management plan allowed for human cooperation, witha limited use of natural resources. In order to determine which resources were desirable and whichrepresented commitments, interviews were conducted with people from the park vicinity. In theirstudy, Bojórquez-Tapia et al. [49] recognize nature reserves as a category of land use that competeswith other land uses. Therefore, one of the basic objectives of conservation planning is to designreserves that protect the most valuable areas. However, the complexity of conservation issues, as wellas the urgent need to protect the key elements of biodiversity and a lack of data, forced planners torely on expertise and public participation when developing projects. According to Colchester [50],nature protection through establishing ‘national parks’ in the USA violated the rights of indigenouspeople, causing their impoverishment and social problems. After many efforts, international rulesfinally acknowledge the rights of indigenous people, and the new protection policy allows them toown and manage protected areas. Nevertheless, field studies show that these new rules are not yetwidely applied. Stern [51] presents a model based on empirical research explaining local objections toneighbouring protected areas. Analyses of data from 420 interviews with local residents and almosta year’s observation of three national parks revealed that the assumptions concerning local residentsmotivated primarily by rational economic stimuli were at best incomplete.
Some research pointed at ways to resolve conflicts through appropriate resource management [52–55].The tourist traffic in national parks has also been studied and described on numerous occasions.
Many studies have been devoted to the sustainable development of tourism [56–60]. Debates onsustainable tourism were conducted, among others, by Hunter [61]. Paunovic and Jovanovic [62] triedto answer the question of what lay behind the efforts for sustainable tourism in the German Alps andwhat views on these processes were represented by various stakeholders in the tourism industry.
The issue of modern tourism business in local development was discussed by Mortensen et al. [63]and Mika [64]. Elmi and Perlik [65] decided to investigate the reappearance of residents in the Alps.Research carried out in previous years highlighted the depopulation of these areas, and now theauthors have observed the phenomenon of a renewed influx of inhabitants. There are also theoreticalreferences to the man–nature tourism impacts [66–69]. The benefits of tourism for natural resourcemanagement in parks have been described [70–75]. Gios et al. [76] measured the benefits of naturalresources for tourism. They pointed out that measuring certain advantages made it possible to createappropriate development strategies. The researchers presented possible solutions for sustainabletourism in environmentally valuable areas.
Among the investigations on the attitude of local communities to national parks, the studies ofmany researchers stand out. They point to the objection of local communities to delimiting protectedareas. Kaltenborn et al. [77] indicated that the community-based management of protected areas hadbecome a strong political objective worldwide. Many African countries responded to this challenge,although with variable results. Tanzania, known for its abundant wildlife population in national parks,developed several projects aimed at improving the relationship between the park and people. So far,
227

Sustainability 2020, 12, 2704
however, there is little evidence that community-based programs have had any significant impacton management strategies, benefit distribution, or poverty alleviation. Von Ruschkowski [78] claimsthat the designation of protected areas (e.g., national parks) often leads to conflicts between localcommunities and the area administration. This phenomenon occurs all over the world and is probablyas old as the very idea of a national park. These conflicts often affect both the protected areas and thelocal communities, as tense relationships entail the risk of disruption to park planning, conservationobjectives, or regional economic development.
Researchers also determine the factors influencing acceptance. Raval [79] discussed investigationscarried out to understand resource use and management issues, as perceived by the people living in the parkvicinity. The study was conducted in the form of in-depth interviews, mainly with cattle breeders living inGir National Park in India. Fiallo and Jacobson [80] pointed out that the economic and social problemsfaced by many developing countries threatened the existence of such parks. Similarly, other authors [81–83].
2.1. Sustainable Development
According to Piontek [84], more than 40 definitions of sustainable development are mentionedin the literature. They all draw attention to the different manifestations of the use, application,and understanding of these words. The notion of sustainable development was first publicly appliedduring the first United Nations Conference on Environment and Development in Stockholm in 1972.The first definition, in turn, appeared at the United Nations Environment Programme managementbody session in 1975 and described sustainable development as a course of inevitable and desirableeconomic development that did not significantly or irreversibly disturb the human environment,did not lead to biosphere degradation, and reconciled the laws of nature, economics, and culture. Forthe purposes of this study, the definition of sustainable development was adopted as the right to satisfythe development aspirations of the current generation without limiting the rights of future generationsto satisfy their development needs [85]. This definition indicates that sustainable development doesnot constitute environmental conservation in its conventional meaning. Through the harmony ofeconomic, natural, and social aspects, this development is safe and beneficial for man, the environment,and the economy. It does not hinder development but even stimulates it, it does not take place at thecost of destroying the environment, for the benefit of future generations, who will also have the rightto develop. Weaver, D.B., and Lawton, L.J. [86] identify a deepening crisis of protected areas, which isaffected by four factors. Firstly, relatively undisturbed natural habitats around the world continue to bedestroyed and converted to serve other purposes as human populations increase, prosperity develops,and more natural resources are used. Secondly, the reduced government funding worldwide decreasestheir ability to fulfil key environmental functions. Thirdly, revenues are visitor-based and, as a result,a large part of them is spent on visitor satisfaction and not on environmental management. The fourthfactor is the increasing demand for rural outdoor and nature-based recreation in the increasinglyurbanized societies.
Leung, Y.F. [87] points out that protected area managers need a wide range of skills and expertiseto manage the complexity of protected area systems. The IUCN best practice guidelines are designed tomeet these needs, including the sharing of good practice experience around the world. Many protectedareas are managed for tourism and visits as part of their objective, involving a wide range of stakeholdersand the private sector. The rapidly growing demand for the development of tourism related to protectedareas emphasizes the need to provide clear guidance that will contribute to sustainable tourism inline with the fundamental objectives of protecting valuable areas. From a conservation point of view,tourism and sightseeing represent a complex set of challenges. Protected area managers around theworld are expected to make most of the areas accessible to visitors. Protected areas are a crucial elementof any global conservation strategy. Tourism acts as an important way of connecting visitors andvaluable protected areas.
Eagles, P.F., Bowman, M.E., and Tao, C.H. [88] elaborated on the ideas discussed above primarilyfor the planners and managers of parks and protected areas. It was designed to help park managers
228

Sustainability 2020, 12, 2704
think about the inflow of tourists into protected areas and to encourage them to consciously planthe management of the interaction between tourists and the environment. Effective planning allowsdifferent interest groups to maximize the potential positive effects of tourism while minimizing thenegative ones. The document is an important and requested material for protected tourism in EastAsia. It constitutes a valuable resource for park managers and other decision makers involved in parkplanning, supplementing current practices and theories applied by park authorities. The documentcontains information on best practices, guest management, education, stakeholder involvement,and other issues related to the protected area.
Mandic, A. [89] indicates that protected natural areas are often considered as areas of highrecreational value; therefore, many of them are increasingly threatened by the development of tourism.The research was conducted in a socio-economic context to address the complexity of this globalproblem. The study is based on an inductive approach to highlight the need for eco-thinking. The paperprovides an analysis of global and local factors that drive change. It concludes that the durability ofnature-based tourism and the resilience of protected areas are not possible in the absence of a multi-levelmanagement system, monitoring, education, and community consent.
Mandic, A., and Petric, L. [90] presented a study that analysed the economic effects of creatingprotected areas and indicated the implications for the public and private sectors. To this end,they applied the hedonic pricing method in order to take into account changes in hotel prices in relationto their location. The research results revealed a relationship between the unique environmentalattributes of a site and hotel prices. Hotels located near the territory of a national park charge higherfees, while increasing the distance from the park territory reduces prices. The researchers foundthat protected areas were components of an integrated tourist product, influencing the prices ofcomplementary tourist services, visitors’ satisfaction, and the competitiveness of destinations.
2.2. Tourism in the Aspect of Sustainable Development
New needs and expectations of tourists are the basis for creating tourist products that are consistentwith the principles of sustainable development. These principles are so crucial that the concept ofsustainable tourism has developed, as defined in the Charter for Sustainable Tourism. The concept isthe result of seeking dependencies and links between the economic, environmental, and social factorsdetermining development with a balance among them [91]. Any attempt to introduce the concept ofsustainable tourism development involves the need to relate it to a specific area with a specific tourismpotential. In this case, these are national parks, where the values of the natural environment, the existingdevelopment, as well as tourist traffic and its consequences must be studied. This leads to a conceptof sustainable tourism management in the region. Gałazka [91] implies that, in accordance with thedefinition presented by the European Federation of Natural and National Parks, sustainable tourismshould be considered to be any form of development of tourist traffic, tourist activity, and managementthat maintains the ecological, social, and economic integrity of territories and preserves their naturaland cultural resources for future generations. According to Para [92], the definition of sustainabletourism should acknowledge the environmental durability, relate to the economy concerned, and besocially and ethically adapted to the standards of the given community. These conditions can be metif all parties involved in tourism respect one another and cooperate. Sustainable tourism has beenaddressed by many researchers, who presented the understanding of and challenges for sustainabletourism development and the roles of stakeholders [93–96], as well as the problems of tourist indicators,sustainable development, environmental management, and measuring satisfaction with sustainabletourism [97–99]. An important role of research into new ways of describing sustainable tourismhas been explored by McCool, S.F., and Bosak, K. (Eds.) [100]. Their investigation indicated thattourism is only one of many human activities that affects host communities. Their paper includesengaging case studies with realistic applications. The references contained in the book, as well astools and techniques useful for tourism practitioners, suggest an innovative approach to marketing,management, and community development. The authors point out that sustainable development is
229

Sustainability 2020, 12, 2704
becoming a top priority, as tourist destinations try to maintain and increase their attractiveness totourists. However, tourism is now an economic activity and an engine of global capitalism. For thisreason, there is a tension between tourism and sustainable development. The researchers conductan important discussion on how sustainable tourism can be reformulated with the use of the indicatedset of tools.
2.3. The Essence of National Park Management
Environmental management is mainly the management of conservation and environmentformation. It is based on the so-called Deming circle, in which the actions taken are groupedinto planning, implementing the plan, checking (assessing the effectiveness of the actions),correcting shortcomings, and adapting the plan to the new circumstances. Therefore, the system ofenvironmental management is grounded in cyclical activities aimed at continuous improvement [101].
As indicated in Article 8b Item 1 of the act on nature conservation [102], the responsibilities ofnational parks include in particular:
1. Carrying out conservation activities in the national park ecosystems, aimed at achieving theobjectives referred to in Article 8 Item 2;
2. Providing access to the national park area in accordance with the principles set out in theconservation plan referred to in Article 18 or in the conservation responsibilities referred to inArticle 22 and in the ordinances of the national park director;
3. Conducting activities related to nature education.
The management of a national park should be performed in at least three categories:
• The management of nature conservation;• The management of a business entity;• The management of a public institution.
Nature conservation and the negative effects of tourist traffic in national parks are enumeratedboth in the act on nature conservation [102] and in the ordinances of the national park director. In orderto counteract these effects, the national park director determines, among others, the number of peoplewho can stay in a given place at the same time or the amount of admission fees. An important role isalso ascribed to conducting educational activity, aimed primarily at teaching the society how to usenatural resources [100].
National parks are also business entities. Kunasz [103] specifies that the resources of nationalparks include:
• Tangible resources, such as natural resources, land, buildings, means of transport, machinery,and equipment;
• Human and organizational resources: national parks have their own organizational structures;• Financial resources, understood as the possibility of obtaining the income characteristic of national
parks, including special purpose grants, revenues related to providing access to the national park,and conducting educational activity, as well as income from timber sales.
National parks cannot be managed by economic instruments alone. These may only be used tosupplement administrative and legal instruments. That is why the organizational and legal status ofthe park plays an important role in its management. As indicated by Ruskowski and Salachna [104],a national park is a state legal entity; therefore, it can be a subject of civil law relations and cantake credits and loans (up to 60% of the amount of income or 60% of costs), and the property ofa national park entirely constitutes state property. In turn, the Act on public finance [105] in Article9 Item 14 specifies that a national park is a public finance sector unit, managed by the park director,but supervised by the Minister of Environment. And it is the Minister of Environment who controlsthe operation of national parks.
Wasiuk [100] presented two main factors in national park management:
230

Sustainability 2020, 12, 2704
1. The factor distinguishing a national park from other entities: the legal regulations governing theactivities of national parks, the management of a particular type of resources in national parks,and the dependence of the decisions taken on the needs of nature;
2. The factor differentiating national parks: the attractiveness of the national park for visitors,the significance of the park’s nature for the society, the location and size of the park and its assets,budget size (including the amount of state funding and of so-called own revenues), and thenumber of employees.
The European Charter for Sustainable Tourism provides an important management model. It isan initiative of EUROPARC, which has long recognized the need to care for both the land and the peoplewho live and work there. National parks are not only facing challenges and pressures arising from thevisits to and misuse of the land that they manage; they also have the opportunity and potential to actas catalysts for change in sustainable development and lifestyle at the local, regional, and even nationallevel. The European Charter for Sustainable Tourism in Protected Areas is a practical managementtool that enables sustainable tourism development in protected areas. A key element of the charter isa common strategy for sustainable tourism and an action plan based on an in-depth analysis of thesituation. The aim of all projects and actions of the charter is to protect the natural and cultural heritageand to continuously improve tourism in protected areas in terms of the environment, local people,and businesses, as well as visitors. Over 20 years of experience have shown that the charter is a usefuland important tool that provides social, environmental, and economic benefits.
3. Material and Methods
The research involved 23 national parks owing to the prominence of the natural heritage thatthey have and make available to tourists. National parks are a sanctuary of wildlife, a place whereprotection is provided for entire ecosystems, i.e., all living organisms linked by interrelationships andinanimate elements of the environment in which they exist.
For this reason, the management of a national park is extremely difficult and requires modelsolutions to protect what is most valuable and at the same time to make it available to tourists.
3.1. Research Area
The research area comprised Polish national parks as they are characterized by barely alterednature, little human impact, and undisturbed natural processes and phenomena. Here, there is the lastnatural forest of the European Plain, the location of many unique and endangered species of fauna andflora, and the most famous bison habitat in the world.
In Poland, 23 national parks were created (Figure 1), which cover 1% of the country area. The parksoperate on the basis of the act of April 16, 2004, on nature conservation. In accordance with Article8 Item 1 of the act, a national park covers an area distinguished by specific natural, scientific, social,cultural, and educational values, with an area of not less than 1000 ha, where all nature and landscapevalues are subject to conservation. The internal organization, mode of operation, and manner ofgranting powers of attorney have been modified; since January 1, 2012, there is a regulation in forceaccording to which the minister in charge of the environment, by way of an ordinance, grants a nationalpark its statute, considering the need to ensure its efficient operation. A national park is managedby a director, appointed by the Minister of Environment, for a period of five years, from among thecandidates selected by a competition.
231

Sustainability 2020, 12, 2704
Figure 1. National parks in Poland against the background of Europe [106].
An important feature of the tourist traffic in national parks is the seasonality of visits, limiting thetourist traffic peak to 2–3 months. In most national parks, the tourist traffic is seasonal in nature, and thedependence on this factor has different significance in individual parks. Coast parks are burdened witha large number of visitors only during the holiday period. Mountain parks, where winter tourism isalso practised, have more balanced numbers of visits. The number of days off from work (the so-calledlong weekends) also affects the increase in the number of park visitors: there are more individual tripsand several-hour visits with own transport.
3.2. Research Methods
In the paper, the following research methods were used: the observational method, the method ofanalysis and criticism of literature, and the method of in-depth interviews. The observation method playeda major role. Observation is among the oldest research methods, allowing to put forward a hypothesis,collect data, verify and select materials, clarify issues, formulate a thesis, establish contacts with thestudied group. Its characteristic feature is cyclicality. Observation as a method must assume a selectionof observations under predefined conditions. It must adopt an appropriate selection, the criterion beingdetermined by the purpose of the observation. Observation is a research method when it considers all stagesof research activities. As a method, it determines how to prepare and implement the research technique andtools, consolidate observations, compile observation protocols, and develop research results and scientificgeneralizations. The most characteristic feature of observation is its cyclic nature: it starts with facts andends with them, and the facts ending one cycle begin the subsequent one [94].
Another method was that of literature analysis and criticism. With this method, one can determinewhat is known and what is not known, and what exists in the literature and what is not thereyet. One can establish whether the problem addressed is original, different from the discoveriesknown so far. The method allows to demonstrate differences, similarities, relationships, dependencies,and substantial features in the existing theories. The results of studies based on this method leadto important discoveries concerning activities and creative works. This method is widely used inhumanities but also in economic sciences. Its aim is also to establish relationships between products ofcreative activity. It is usually about determining the impact of one solution on another, for example,
232
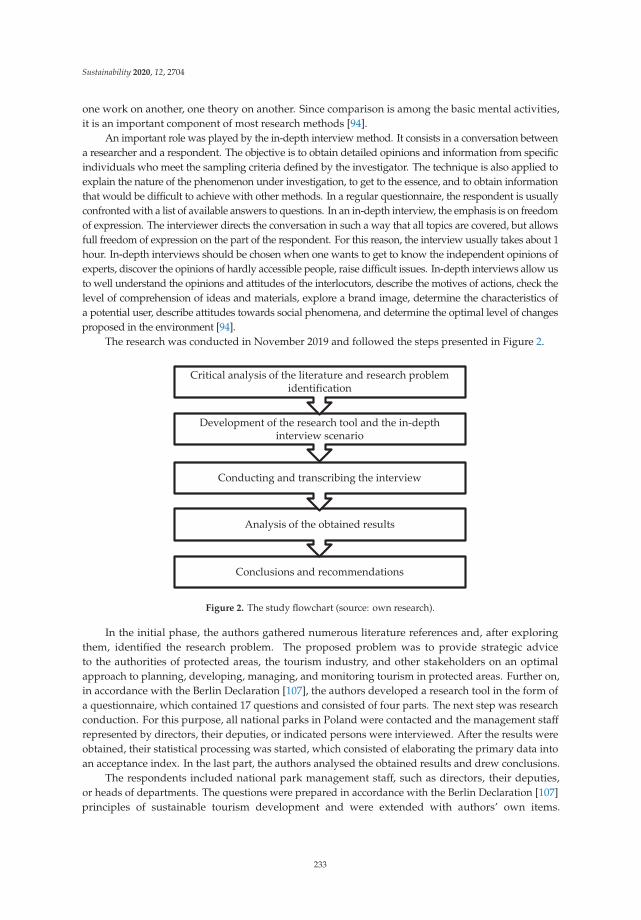
Sustainability 2020, 12, 2704
one work on another, one theory on another. Since comparison is among the basic mental activities,it is an important component of most research methods [94].
An important role was played by the in-depth interview method. It consists in a conversation betweena researcher and a respondent. The objective is to obtain detailed opinions and information from specificindividuals who meet the sampling criteria defined by the investigator. The technique is also applied toexplain the nature of the phenomenon under investigation, to get to the essence, and to obtain informationthat would be difficult to achieve with other methods. In a regular questionnaire, the respondent is usuallyconfronted with a list of available answers to questions. In an in-depth interview, the emphasis is on freedomof expression. The interviewer directs the conversation in such a way that all topics are covered, but allowsfull freedom of expression on the part of the respondent. For this reason, the interview usually takes about 1hour. In-depth interviews should be chosen when one wants to get to know the independent opinions ofexperts, discover the opinions of hardly accessible people, raise difficult issues. In-depth interviews allow usto well understand the opinions and attitudes of the interlocutors, describe the motives of actions, check thelevel of comprehension of ideas and materials, explore a brand image, determine the characteristics ofa potential user, describe attitudes towards social phenomena, and determine the optimal level of changesproposed in the environment [94].
The research was conducted in November 2019 and followed the steps presented in Figure 2.
Conclusions and recommendations
Analysis of the obtained results
Conducting and transcribing the interview
Development of the research tool and the in-depth interview scenario
Critical analysis of the literature and research problem identification
Figure 2. The study flowchart (source: own research).
In the initial phase, the authors gathered numerous literature references and, after exploringthem, identified the research problem. The proposed problem was to provide strategic adviceto the authorities of protected areas, the tourism industry, and other stakeholders on an optimalapproach to planning, developing, managing, and monitoring tourism in protected areas. Further on,in accordance with the Berlin Declaration [107], the authors developed a research tool in the form ofa questionnaire, which contained 17 questions and consisted of four parts. The next step was researchconduction. For this purpose, all national parks in Poland were contacted and the management staffrepresented by directors, their deputies, or indicated persons were interviewed. After the results wereobtained, their statistical processing was started, which consisted of elaborating the primary data intoan acceptance index. In the last part, the authors analysed the obtained results and drew conclusions.
The respondents included national park management staff, such as directors, their deputies,or heads of departments. The questions were prepared in accordance with the Berlin Declaration [107]principles of sustainable tourism development and were extended with authors’ own items.
233

Sustainability 2020, 12, 2704
The questionnaire contained 17 questions and consisted of four parts: science and documentation,tourism, cooperation and education, and environmental threats.
The statistical analysis consisted in processing the obtained primary data into an acceptance index(AI) ranging from 0 to 1, where 1 indicated full conformity with the analysed requirements. The answerswere analysed with reference to all parks together and with the consideration of a distinction intotwo criteria. The first one was the park qualification as a United Nations Educational, Scientific andCultural Organization (UNESCO) biosphere reserve or not, the other one constituted a division intofive groups resulting from the park type (coast, lake district, lowland, upland, and mountain).
The national park managers were asked the following questions:
1. Does the park have a nature conservation plan?2. Are environmentally friendly forms of tourist activity promoted?3. Are there any limits on the number of visitors and people walking on the trails?4. Are there any specified places where one can put up a tent?5. Has tourism been identified as an existing or potential threat to the nature of the park?6. Are environmental indicators for sustainable tourism planning taken into account?7. Is the development of tourism restricted in areas that have been under greatest impact so far?8. Is there a monitoring of the existing tourist traffic?9. Is the environmental impact of tourism monitored?10. Have the changes in the environmental impact of tourism development been assessed before?11. Is the existing tourist infrastructure being modernized instead of building a new one?12. Is ecological education run?13. Have educational pathways been established?14. Is there cooperation with local government units?15. Have regulations been developed concerning the specific way of making the park available?16. Is admission fee income received?17. Does the director have a scientific council?
On the basis of a broad source base, an analysis of the current development of tourism in parksand plans in this respect was made. The Local Data Bank of Statistics Poland [108] and websites ofparks and tourist organizations served to establish the number of park visitors. As a measure of touristtraffic in national parks, the indicator of tourist traffic intensity was applied, which is the quotientof the number of tourists (thousands) and the length of tourist trails (kilometres). The study alsoemployed the Defert index, providing information on the number of tourists per 1 km2 of a touristarea, which allows one to assess the population density in the studied area [109,110].
4. Results
4.1. Results of Secondary Sources Research
The main measure of the tourist function of a given area is the tourist traffic, defined as themovement of people for tourist purposes in the area. More than half of the total tourist traffic in Polandis generated by mountain parks; however, most of the tourist traffic is seasonal in nature. The exceptionsare mountain parks, such as Karkonosze National Park and Tatra National Park, where winter tourismis also practised. Polish national parks are very popular among tourists, as evidenced by their highattendance. The creation of each new national park is associated with an influx of tourists. In thefirst half of the 1960s, when there were only 10 national parks in Poland, the number of visitors wasbetween 4 and over 5 million per year, with a clear tendency to increase. Such high attendance involvedcompany visits, school excursions, and individual tourism. In the 1970s, the number of visitorsincreased to over 11 million per year. At present, the attendance of visitors to particular national parksvaries from 13 thousand people in Drawa National Park to over 3.7 million in Tatra National Park.
234

Sustainability 2020, 12, 2704
In nine parks, the annual number of tourists does not exceed 100 thousand (Table 1). In the followingseven, it does not exceed 1 million. The attendance exceeded 1 million in only five parks.
Table 1. Number of tourists visiting Polish national parks in 2009–2017.
Park NameNumber of Tourists (in thousands)
2009 2010 2011 2012 2013 2014 2015 2016 2017
Tatra National Park 2195 2002 2234 2947 2764 3092 3310 3683 3779Karkonosze National Park 2000 2000 2000 2000 2000 2000 2000 2000 2000Wolin National Park 1500 1500 1500 1500 1500 1500 1500 1500 1500Wielkopolski National Park 1200 1200 1200 1200 1200 1200 1200 1200 1200Kampinoski National Park 1000 1000 1000 1000 1000 1000 1000 1000 1000Pieniny National Park 838 603 710 770 734 719 815 931 898Stołowe Mountains National Park 366 319 335 350 347 367 480 286 515Bieszczady National Park 350 280 330 297 332 355 388 487 513Ojców National Park 400 400 400 400 400 400 400 428 430Słowinski National Park 386 311 317 312 309 304 319 323 317Białowieza National Park 190 170 134 121 119 120 133 163 249Roztocze National Park 100 100 100 120 120 120 134 187 203Swietokrzyski National Park 183 145 193 162 148 135 132 144 144Wigry National Park 120 110 110 110 110 115 110 125 125Gorce National Park 70 60 65 70 70 80 80 80 90Babia Góra National Park 67 54 75 63 81 76 81 114 83Magura National Park 50 50 45 40 50 40 40 50 50Polesie National Park 25 24 24 28 28 28 41 44 49Biebrza National Park 39 31 27 33 28 32 39 41 47Ujscie Warty National Park 20 10 20 57 54 51 52 43 34Bory Tucholskie National Park 60 60 60 60 33 33 33 35 32Narew National Park 11 13 10 12 15 15 15 20 19Drawa National Park 24 22 48 26 19 18 22 16 13
Source: own elaboration based on Statistics Poland [108].
Changes in attendance were most marked in Roztocze National Park and Polesie National Park,where the number of visitors increased by 100% in the examined period of 2009–2017. The mostunfavourable situation was observed in Bory Tucholskie National Park and Drawa National Park,where the number decreased by a half (Table 1).
An important role is played by the length of the designated tourist trails, as it determines thepossibility of dispersing tourists around the park area and not exerting excessive environmental impactby tourists. The length of trails is significantly varied and ranges between 16.7 km in Ujscie WartyNational Park to 550 km in Kampinoski National Park. There are over 200 km of trails in seven parksand over 100 km in five (Table 2).
In order to determine the tourist traffic impact on the nature of the park, in addition to the totalnumber of visitors, it is important to establish their ‘density’ in the park area and along the touristtrails. Taking into account the number of tourists and the size of the park, one can more preciselyestimate the impact and compare the parks.
Excessive concentration of tourist traffic or incorrectly located tourist base, as well as inappropriateforms of recreation management and a lack of tourist culture are the main reasons for threats.The development of tourism in protected areas is therefore highly limited. Any actions taken must beconsistent with the principles of sustainable development, and the number of tourists visiting a parkshould be adjusted to the park area. The calculated Defert index implies that the highest density,3.7 people per km2, is in Pieniny National Park. Equally high density occurs in Karkonosze NationalPark. Tourists will find the most space in Biebrza National Park and Narew National Park (Table 3).
235
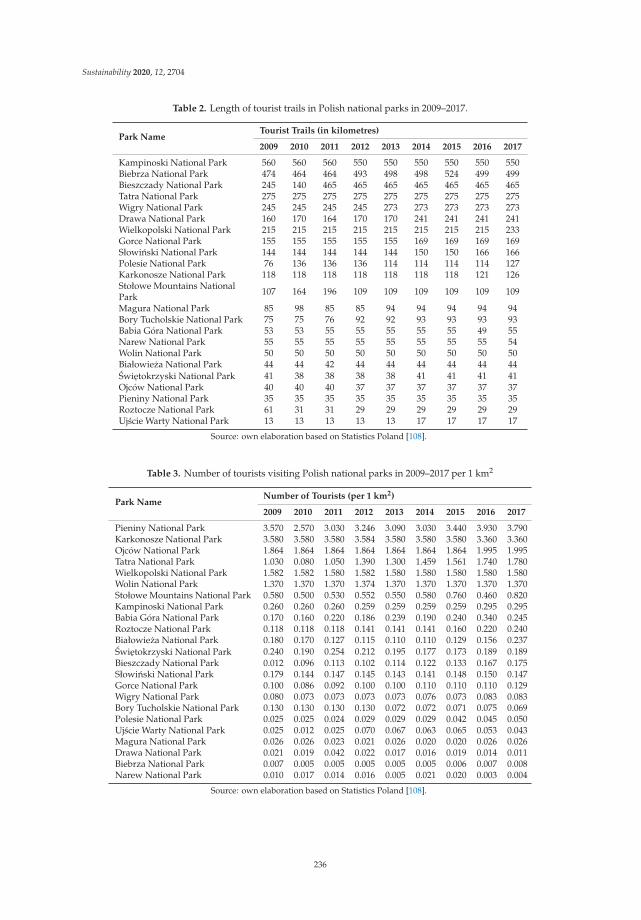
Sustainability 2020, 12, 2704
Table 2. Length of tourist trails in Polish national parks in 2009–2017.
Park NameTourist Trails (in kilometres)
2009 2010 2011 2012 2013 2014 2015 2016 2017
Kampinoski National Park 560 560 560 550 550 550 550 550 550Biebrza National Park 474 464 464 493 498 498 524 499 499Bieszczady National Park 245 140 465 465 465 465 465 465 465Tatra National Park 275 275 275 275 275 275 275 275 275Wigry National Park 245 245 245 245 273 273 273 273 273Drawa National Park 160 170 164 170 170 241 241 241 241Wielkopolski National Park 215 215 215 215 215 215 215 215 233Gorce National Park 155 155 155 155 155 169 169 169 169Słowinski National Park 144 144 144 144 144 150 150 166 166Polesie National Park 76 136 136 136 114 114 114 114 127Karkonosze National Park 118 118 118 118 118 118 118 121 126Stołowe Mountains NationalPark 107 164 196 109 109 109 109 109 109
Magura National Park 85 98 85 85 94 94 94 94 94Bory Tucholskie National Park 75 75 76 92 92 93 93 93 93Babia Góra National Park 53 53 55 55 55 55 55 49 55Narew National Park 55 55 55 55 55 55 55 55 54Wolin National Park 50 50 50 50 50 50 50 50 50Białowieza National Park 44 44 42 44 44 44 44 44 44Swietokrzyski National Park 41 38 38 38 38 41 41 41 41Ojców National Park 40 40 40 37 37 37 37 37 37Pieniny National Park 35 35 35 35 35 35 35 35 35Roztocze National Park 61 31 31 29 29 29 29 29 29Ujscie Warty National Park 13 13 13 13 13 17 17 17 17
Source: own elaboration based on Statistics Poland [108].
Table 3. Number of tourists visiting Polish national parks in 2009–2017 per 1 km2
Park NameNumber of Tourists (per 1 km2)
2009 2010 2011 2012 2013 2014 2015 2016 2017
Pieniny National Park 3.570 2.570 3.030 3.246 3.090 3.030 3.440 3.930 3.790Karkonosze National Park 3.580 3.580 3.580 3.584 3.580 3.580 3.580 3.360 3.360Ojców National Park 1.864 1.864 1.864 1.864 1.864 1.864 1.864 1.995 1.995Tatra National Park 1.030 0.080 1.050 1.390 1.300 1.459 1.561 1.740 1.780Wielkopolski National Park 1.582 1.582 1.580 1.582 1.580 1.580 1.580 1.580 1.580Wolin National Park 1.370 1.370 1.370 1.374 1.370 1.370 1.370 1.370 1.370Stołowe Mountains National Park 0.580 0.500 0.530 0.552 0.550 0.580 0.760 0.460 0.820Kampinoski National Park 0.260 0.260 0.260 0.259 0.259 0.259 0.259 0.295 0.295Babia Góra National Park 0.170 0.160 0.220 0.186 0.239 0.190 0.240 0.340 0.245Roztocze National Park 0.118 0.118 0.118 0.141 0.141 0.141 0.160 0.220 0.240Białowieza National Park 0.180 0.170 0.127 0.115 0.110 0.110 0.129 0.156 0.237Swietokrzyski National Park 0.240 0.190 0.254 0.212 0.195 0.177 0.173 0.189 0.189Bieszczady National Park 0.012 0.096 0.113 0.102 0.114 0.122 0.133 0.167 0.175Słowinski National Park 0.179 0.144 0.147 0.145 0.143 0.141 0.148 0.150 0.147Gorce National Park 0.100 0.086 0.092 0.100 0.100 0.110 0.110 0.110 0.129Wigry National Park 0.080 0.073 0.073 0.073 0.073 0.076 0.073 0.083 0.083Bory Tucholskie National Park 0.130 0.130 0.130 0.130 0.072 0.072 0.071 0.075 0.069Polesie National Park 0.025 0.025 0.024 0.029 0.029 0.029 0.042 0.045 0.050Ujscie Warty National Park 0.025 0.012 0.025 0.070 0.067 0.063 0.065 0.053 0.043Magura National Park 0.026 0.026 0.023 0.021 0.026 0.020 0.020 0.026 0.026Drawa National Park 0.021 0.019 0.042 0.022 0.017 0.016 0.019 0.014 0.011Biebrza National Park 0.007 0.005 0.005 0.005 0.005 0.005 0.006 0.007 0.008Narew National Park 0.010 0.017 0.014 0.016 0.005 0.021 0.020 0.003 0.004
Source: own elaboration based on Statistics Poland [108].
236

Sustainability 2020, 12, 2704
It should be emphasized that the tourist utilization of the parks is strongly determined by theirdegree of development, which allows for a legal penetration of the area along tourist trails. The analysisof the tourist traffic intensity on the trails reveals that the greatest number of tourists per trail kilometreis observed in Wolin National Park, where there are almost 30 thousand people per trail kilometre eachyear. There are over 25 thousand on the trails of Pieniny National Park and 15 thousand in KarkonoszeNational Park. The lowest tourist traffic intensity is reported for Biebrza National Park and DrawaNational Park (0.1 thousand each) (Table 4).
Table 4. Number of tourists visiting Polish national parks in 2006–2017 in thousands per trail kilometre.
Park NameTourist Traffic Intensity (in thousands per 1 km of trail)
2006 2007 2008 2009 2010 2011 2012 2013 2014 2015 2016 2017
Wolin National Park 31.9 31.9 29.9 29.9 29.9 29.9 29.9 29.9 29.9 29.9 29.9 29.9Pieniny National Park 22.0 23.0 21.5 23.8 17.2 20.3 22.0 21.0 20.5 23.3 26.6 25.7Karkonosze National Park 17.0 17.0 17.0 17.0 17.0 17.0 17.0 16.9 16.9 16.9 16.5 15.9Tatra National Park 9.7 8.1 7.6 8.0 7.3 8.1 10.7 10.1 11.2 12.0 13.4 13.7Ojców National Park 17.4 8.6 9.8 10.1 10.1 10.1 10.7 10.7 10.7 10.7 11.4 11.5Roztocze National Park 1.7 1.6 2.0 1.6 3.3 3.3 4.1 4.1 4.1 4.6 6.4 6.9Białowieza National Park 6.2 3.7 2.1 4.3 3.9 3.2 2.7 2.7 2.7 3.0 3.7 5.6Wielkopolski National Park 5.6 5.6 5.6 5.6 5.6 5.6 5.6 5.6 5.6 5.6 5.6 5.2Stołowe Mountains National Park 1.8 2.1 2.0 3.4 1.9 1.7 3.2 3.2 3.4 4.4 2.6 4.7Swietokrzyski National Park 5.0 4.3 5.1 4.5 3.9 5.2 4.3 4.0 3.3 3.2 3.5 3.5Ujscie Warty National Park 1.4 1.6 1.6 1.5 0.8 1.5 4.3 4.0 3.0 3.1 2.6 2.1Słowinski National Park 2.5 1.9 1.9 2.7 2.2 2.2 2.2 2.1 2.0 2.1 2.0 1.9Kampinoski National Park 2.8 2.8 2.8 1.8 1.8 1.8 1.8 1.8 1.8 1.8 1.8 1.8Babia Góra National Park 1.5 1.2 1.0 1.3 1.0 1.4 1.1 1.5 1.4 1.5 2.3 1.5Bieszczady National Park 1.0 1.4 1.1 1.4 2.0 0.7 0.6 0.7 0.8 0.8 1.0 1.1Gorce National Park 0.5 0.6 0.6 0.5 0.4 0.4 0.5 0.5 0.5 0.5 0.5 0.5Magura National Park 0.6 0.6 0.6 0.6 0.5 0.5 0.5 0.5 0.4 0.4 0.5 0.5Wigry National Park 0.5 0.5 0.5 0.5 0.4 0.4 0.4 0.4 0.4 0.4 0.5 0.5Polesie National Park 0.5 0.2 0.2 0.3 0.2 0.2 0.2 0.2 0.2 0.4 0.4 0.4Narew National Park 0.1 0.1 0.1 0.2 0.2 0.2 0.2 0.3 0.3 0.3 0.4 0.4Bory Tucholskie National Park 0.6 0.6 0.8 0.8 0.8 0.8 0.7 0.4 0.4 0.4 0.4 0.3Biebrza National Park 0.1 0.1 0.1 0.1 0.1 0.1 0.1 0.1 0.1 0.1 0.1 0.1Drawa National Park 0.2 0.1 0.2 0.1 0.1 0.3 0.2 0.1 0.1 0.1 0.1 0.1
Source: own elaboration based on Statistics Poland [108].
4.2. Primary Research
The research conducted in national parks indicates that park management is carried out ina conscious and responsible manner, with full respect for sustainable development principles.The directors of all the studied parks issued ordinances specifically regulating the way and scope ofmaking the park available, as well as visitor limits, and seven parks had a conservation plan. In allparks, sightseeing was allowed on marked tourist trails, educational or walking paths, public roads,and other accessible areas. Everywhere, educational activity was carried out and educational pathwayswere established. In addition, regulations were developed concerning the specific way of making thepark available.
4.2.1. Science and Documentation
A very important document for the proper operation and management of a park is the conservationplan. In accordance with Article 18 Item 2 of the act on nature conservation [102], a conservation planfor a national park should be created within five years after the park’s establishment. Unfortunately,only seven parks have such a plan. Some of them have submitted drafts of the conservation plansto the Minister, while others are in the process of inventorying the natural resources and developingsurveys. They are currently working on conservation tasks. In order to limit the negative effectsof tourist traffic in national parks, the lists of restrictions to be observed by visitors are indicated.Moreover, park directors issue ordinances through which they shape the individual policy of making
237

Sustainability 2020, 12, 2704
the national park available. The ordinances determine, among others, the number of people who canstay in a given place at the same time or the amount of admission fees. In all parks, sightseeing wasallowed on marked tourist trails, educational or walking paths, public roads, and other accessible areas.In addition, regulations were developed concerning the specific way of making the park available anduse of particular places and facilities of the park.
In all parks, a scientific council was established, whose tasks included assessing the state ofresources, formations, and components of nature, providing opinions on conservation plan andconservation task projects, assessing the conservation plan implementation, and providing opinionson research and scientific programmes in the field of nature conservation.
4.2.2. Tourist Issues
All the investigated parks promote environmentally friendly forms of tourist activity. The sitesthat may be made available and the maximum number of people who may simultaneously stay atthese sites were defined in the conservation plan or, in the case of some parks, until the plan wasdeveloped, in the conservation tasks. Making a national park accessible is associated with ensuringsafety for nature and visitors; therefore, visitor limits are introduced. The number of people visitingthe park is usually estimated by the park employees on the basis of the number of sold tickets, maps,and publications about the park, by direct counting tourists crossing the park entrances, as well aswith electronic sensors for monitoring tourist traffic.
In 21 parks, tourist traffic was monitored, the impact of tourism on the park nature conditionwas analysed and assessed, and, if necessary, measures were taken to minimize the traffic. All parksmodernized their tourist infrastructure. However, not all parks introduced visitor limits, and thedirectors claimed that the traffic should not be restricted but educational activities should be undertakento raise the culture of sightseeing. Camping was only allowed in 10 parks. In order to protect themost valuable resources from excessive tourist traffic, the trails were led in a way that avoided theseplaces. Entry fees were collected in 16 parks. To reduce the impact of tourism on the environment,channelling and zoning principles were introduced, which mean that tourists can only move alongestablished trails and stay in selected places. The zoning principle denotes the adjustment of touristtraffic intensity to the natural value of the area.
4.2.3. Educational Issues
As indicated in Article 8b Item 1 Points 2 and 3 of the act on nature conservation [102], makingthe park accessible and conducting activities related to nature education are among the tasks ofnational parks. These should be carried out in accordance with the rules set out in the conservationplan, conservation tasks, and the ordinances of the national park director, and only in a way thatwill not adversely affect the nature of the park (Article 12 Item 1). National park tasks also involveproviding information on and promoting nature conservation, including running a nature museum,information and education centres, and publishing information and promotion materials. All parksimplemented ecological education, established educational pathways, and cooperated with localgovernment units. Educational activities were conducted in the form of field lessons, workshops,and lectures. The basic objectives of education were to shape appropriate attitudes to nature in children,youth, and all park visitors, to broaden the knowledge related to nature conservation, and to familiarizepeople with the principles of park accessibility.
4.2.4. Environmental Threats
The research carried out and the provisions included in the conservation tasks established by theMinister of Environment indicate that certain aspects of tourism in the parks have been identified asfactors threatening or potentially threatening the parks’ nature. However, in general, tourism itselfis not a threat if it is well managed and when counter-measures are taken. The parks analyse theenvironmental impact of tourism in various ways. They implement projects, perform research, monitor
238

Sustainability 2020, 12, 2704
changes in the natural environment. Students and academics often conduct research as part of theirmaster theses and scientific articles. On the basis of the analyses of threats related to the anthropogenicimpact on the environment, water erosion, as well as the distribution and intensity of tourist traffic,the limits of people who can stay in a given place at a given time are defined. The conducted analysesof the impact of tourist traffic on the parks’ nature often result in excluding routes from tourist trafficbecause of trampling plants by tourists.
Among the various types of research on the flora and fauna of the parks, the most common arethe following:
• Soil condition monitoring;• Monitoring the condition, quantity, and quality of surface water and groundwater;• Meteorological monitoring;• Monitoring at selected water stations;• Monitoring of selected species or groups of plants and animals.
The analysis of the obtained results reveals the highest conformity in all investigated nationalparks in the following areas: creating regulations on making the park accessible, the presence ofthe park scientific council, undertaking promotion activities in the field of friendly forms of touristactivity, the modernization of the existing tourist infrastructure, ecological education, introducingeducational pathways, cooperation with local government units, monitoring the impact of tourism onthe environment, and assessing the impact of tourism on the environment.
All these issues have been identified as crucial in the implementation of strategic objectives forthe conservation and development of parks (AI = 1.0) (Table 5).
The lowest AI was obtained in the field of natural environment conservation plan development(AI = 0.30) and tourism as a potential threat to parks’ nature (AI = 0.39). The designation of campingareas was also rarely considered (AI = 0.43).
The division of the investigated parks into those that were UNESCO biosphere reserves and thosethat were not classified in this category allowed us to state that UNESCO biosphere reserves moreoften charged entrance fees (ΔAI = 0.32), more often developed natural environment conservationplans (ΔAI = 0.23), and more often considered tourism as an existing or potential threat for park nature(ΔAI = 0.27). Managers of UNESCO biosphere reserves less frequently introduced tourist traffic limits(ΔAI = –0.13) and less frequently designated camping areas (ΔAI = –0.17).
The differences observed in terms of the division of the investigated parks into coast, lake district,lowland, upland, and mountain ones revealed that nature conservation plans were more oftendeveloped in mountain parks (AI = 0.50). Similarly, revenues from admission fees were most oftenreported in mountain parks (AI = 0.88), and least frequently in coast parks (AI = 0.50). Camping areaswere more often introduced in lake district parks (AI= 0.80), less frequently in mountain (AI = 0.38) andlowland parks (AI = 0.40). These restrictions were not applied in coast parks (AI = 0.00). Tourist trafficlimits were more often noted in lake district (AI = 0.80) and upland parks (AI = 0.67) than in mountainparks (AI = 0.38). No tourist traffic limits were reported in coast parks (AI = 0.0).
239

Sustainability 2020, 12, 2704
Table 5. Acceptance index: research results.
Acceptance Index
To
tal
UNESCOBiosphereReserve
Park Type
Yes No
Co
ast
La
ke
Dis
tric
t
Lo
wla
nd
Up
lan
d
Mo
un
tain
1. Natural environment conservation plan 0.30 0.44 0.21 0.00 0.20 0.20 0.33 0.502. Regulations on making the park accessible 1.00 1.00 1.00 1.00 1.00 1.00 1.00 1.003. Scientific council 1.00 1.00 1.00 1.00 1.00 1.00 1.00 1.004. Promoting friendly forms of tourist activity 1.00 1.00 1.00 1.00 1.00 1.00 1.00 1.005. Tourist traffic limits 0.52 0.44 0.57 0.00 0.80 0.60 0.67 0.386. Restrictions on tourism development in areasunder impact 0.65 0.67 0.64 0.50 0.60 0.80 0.67 0.63
7. Designated camping areas 0.43 0.33 0.50 0.00 0.80 0.40 0.33 0.388. Tourist traffic monitoring 0.91 0.89 0.93 1.00 1.00 0.80 0.67 1.009. Modernization of the existing touristinfrastructure 1.00 1.00 1.00 1.00 1.00 1.00 1.00 1.00
10. Revenues from admission fees 0.70 0.89 0.57 0.50 0.60 0.60 0.67 0.8811. Ecological education 1.00 1.00 1.00 1.00 1.00 1.00 1.00 1.0012. Educational pathways 1.00 1.00 1.00 1.00 1.00 1.00 1.00 1.0013. Cooperation with local government units 1.00 1.00 1.00 1.00 1.00 1.00 1.00 1.0014. Tourism as an existing or potential threat 0.39 0.56 0.29 0.00 0.40 0.00 0.67 0.6315. Indicators for sustainable tourism planning 0.65 0.67 0.64 0.50 0.80 0.80 0.33 0.6316. Monitoring the impact of tourism on theenvironment 1.00 1.00 1.00 1.00 1.00 1.00 1.00 1.00
17. Assessing the impact of tourism on theenvironment 1.00 1.00 1.00 1.00 1.00 1.00 1.00 1.00
Source: own elaboration.
5. Model of Environmental Management System
The study results allow us to create a model system of managing the natural environmentin the park. It includes diagnosis, planning, responsibility allocation, documentation, monitoring,and measurement. Such management addresses environmental concerns. The system is a set of toolsthat allow us to apply environmental policy, which leads to minimizing the harmful impact on theenvironment in a way that is beneficial to both tourists and the environment (Figure 3).
240

Sustainability 2020, 12, 2704
Review of management adequacy, internal audit, and corrective actions
Monitoring, measurement, conformity assessment
Is there a monitoring of the existing tourist traffic? Is the environmental impact of tourism monitored?
Assigning the park staff scope of responsibilities and establishing the communication process
What is the park director and deputy director responsible for?
What are the particuar heads of departments responsible for?
What are the particuar emploees responsible for?
Preparation of relevant documents
Does the park have a nature conservation plan? Have regulations been developed concerning the specific way of making the park available?
Setting environmental conservation priorities
Is the development of tourism restricted in areas that have been
under greatest impact so far?
Are there any limits on the number of visitors and people walking on the
trails?
Are there any specified places where one can put up a tent?
Preparation of environmental objectives, tasks, and programmes
Does the director have a scientific council?
Has tourism been identified as an existing or potential threat to the nature of the
park?
Are environmental indicators for sustainable tourism planning taken
into account?
Have the changes in the environmental impact of
tourism development been assessed before?
Establishing environmental policy and strategy for action
Is admission fee income received? Is ecological education run? Have educational pathways
been established?Is there cooperation with local government units?
Diagnosis of the environment condition
Are environmentally friendly forms of tourist activity promoted?
Is the existing tourist infrastructure being modernized instead of building a new one?
Figure 3. Model system of managing the natural environment in a national park; (source: own elaboration).
The model proposed by the authors consists of seven main parts:
1. The diagnosis of the environment condition. The most important issue is to diagnose the conditionof the environment, i.e., to determine the environmental impact of any element that may threatenit. It is necessary to identify the environmental problems. This should be performed by means
241

Sustainability 2020, 12, 2704
of appropriate tools, such as questionnaire surveys, in-depth interviews, direct inspections andmeasurements, and random checks.
2. Establishing environmental policy and a strategy for action. The next step is to establishan appropriate policy, i.e., all intentions and ways of operating with regard to environmentalactivities. Environmental policy provides a framework for action and setting environmentalobjectives and tasks.
3. The preparation of environmental objectives, tasks, and programmes. The environmental objectiveshould be measurable and consistent with the environmental policy. In turn, environmentaltasks are detailed requirements for activity effects, resulting from the environmental objectives.Environmental objectives may, for example, include commitments to minimize all significantnegative environmental impacts or to promote environmental awareness among young peopleand the local community.
4. Setting environmental conservation priorities. These are actions aimed at identifying prioritiesfor action and quickly minimizing negative environmental impacts. They consist of managingkey processes in the park related to important environmental aspects.
5. The preparation of relevant documents. The documentation should include environmental policy,objectives and tasks, the responsibilities and duties of employees, information on environmentalaspects, records of monitoring the effects of environmental conservation activities, and theorganization of training courses.
6. Assigning the park staff scope of responsibilities and establishing the communicationprocess. This denotes indicating the park employees’ tasks for which they will beresponsible. The responsibilities may include, among others, the implementation, maintenance,and improvement of environmental conservation measures, coordination of teamwork,supervision of the identification and assessment of environmental aspects, ensuring monitoring,ensuring compliance with legal requirements, ensuring continuous improvement.
7. Monitoring, measurement, and conformity assessment. Inconsistencies may relate to the failure tomeet the legal provisions on environmental conservation, deviations from environmental policy,and related environmental objectives and tasks, failure to meet the adopted criteria for particularactivities and processes as revealed in the course of monitoring.
6. Discussion on the New Paradigm of National Park Management
National parks are characterized by high natural values, which make them attractive areas oftourist use. Therefore, the question is whether sustainable natural environment management can becarried out in national parks. Examples should be sought in similar environmentally valuable areas notonly in Europe, but also in the world. Out of the 220 national parks in Europe, almost half are mountainparks; they are most numerous in the Scandinavian Mountains and the Carpathians. The tourist trafficin European mountain national parks is highly diversified; in Scandinavian parks, it is small, in contrastto Alpine parks where, owing to good transport accessibility and tourist infrastructure, visitors arenumerous. The results obtained by the authors are in line with many foreign studies related to similarissues, although in other areas. The impact of human activity on our natural environment is remarkable.The environmental threats analysed by the authors are monitored in many countries. These problemswere specifically referred to by Chemini and Rizzoli [24]. They conducted their research in the Alps;they pointed out that a large part of these mountains biodiversity was linked to the interactionbetween the natural environment and traditional human activity. Today, land-use transformationsand other environmental and socio-economic processes, such as urbanization, tourism, or pollution,are significant forces for environmental change. The researchers indicated that mowing and thegrazing of livestock were major factors inhibiting tree succession in many regions of the Alps. In turn,abandoning mountain fields and meadows causes the expansion of shrubs and forests and reducesthe number of grass species. The environmental threats also result from the urbanization of the areasaround the parks. Elmi and Perlik [65] performed research in the Alps too. They decided to investigate
242

Sustainability 2020, 12, 2704
the reappearance of residents in the mountainous parts of the Alps. They asked whether this influxwas more than just a selective development of urban areas, and whether this could also be confirmedfor peripheral areas. They also sought answers to the question about the driving forces behind thismigration. The explanations are complex, as they need the consideration of the relationships betweenthe permanent population and second home owners. On the basis of empirical data collected at themunicipality level in five different provinces in the eastern Alps, the mentioned authors implied thatthe consistent settlement of new residents was only selective. This trend is focused on areas that cancount on good transport accessibility, located mainly in urban and suburban municipalities. Similarly,Barker [47] raised the important issue of mass tourism expansion in various mountain regions of theworld. He pointed at ski resorts and the emerging conflicts between environmental conservation andthe desire to expand the resorts. In the USA, the effects were stronger than in Europe, where successfulinvestments in tourism do not currently burden the landscape so much. The author investigated masstourism, and the findings indicate solutions valuable for other mountain regions.
The presented paper is focused on tourism issues. The respondents indicated benefits andthreats for the park resulting from tourism. They also highlighted investments in infrastructureand security. The advantages of natural resources for tourism were also studied by Gios et al. [111].They specified that, in several Alpine regions, the transition to a tourism economy was due to majorcapital investment. However, the management of an environmentally valuable area does not allowfor a high level of investment in hotels or guesthouses that would guarantee income from the use ofnatural resources; the only possible tourism is one compatible with maintaining high-quality naturalenvironments. Unfortunately, this type of tourism has few benefits for local communities. In fact,tourists only degrade the land and infrastructure on which tourism itself is based. Car traffic damagesunpaved roads, mountain bikes destroy paths and meadows, and infrastructure maintenance becomesa burden on the local community. Therefore, researchers are asking how to manage such an area,indicating that it is not an easy duty. However, an opportunity should be seen in the developmentof projects based on European Union programmes. A solution can also be to impose admissionfees for visitors. At present, this seems impractical, even if it could be implemented in the future.In addition to the technical difficulties involved in collecting entrance fees, the sensitivity of touristsdoes not yet seem mature enough to accept payment. Another solution could be to create a networkof lightweight infrastructure that would enable rational use of natural resources and attract tourists,and thus create jobs in the vicinity. Moreover, Gios et al. [111] pointed at interesting solutions forsustainable tourism that are possible to apply in Polish national parks. They also confirmed thata high level of investment in hotels or guesthouses, similar to in Poland, was not possible in suchvaluable natural areas. A similar subject was raised in relation to the German Alps by Paunovic andJovanovic [62]. Their research focused on threats to sustainable development, tourism, as well ascross-border cooperation and stakeholder involvement. The findings imply that only a comprehensiveapproach to disseminating knowledge about sustainable development can be the basis for mountaintourism development. The implementation should focus on specific sustainable tourism flagshipproducts. Cross-border cooperation and stakeholder involvement turned out to be crucial.
An important issue is the management process in the development of a tourist centre. The authorsof the present study devoted a lot of attention to this matter. A similar subject was referred to byBonzanigo et al. [112]. Their article presents the development and application of a management processfor the local development of an Alpine tourist resort. The researchers pointed out that an efficientcombination of modelling, decision making, and participatory processes could significantly improvedecisions regarding sustainable development. They showed that such a combination of methods andtools allowed to manage the involvement of local actors and stimulate local debates on adaptation toclimate changes and possible consequences for winter tourism. They also recommended encouragingcreativity and mitigating potential conflicts. This contributed to the development of alternativesustainable tourism planning strategies. Moreover, various management methods are indicated thatcan be used in Polish national parks.
243
Sustainability 2020, 12, 2704
The aim of the article was to create a universal model of national park management, to developa sustainable way of reconciling the increasing tourist traffic and nature conservation. A similarchallenge was taken up by Coban and Yildiz [113]. The proposed model aims to make Cappadociatourism more sustainable and competitive. The researchers implied that destination managementorganizations increased cooperation and coordination among stakeholders and contributed to thedestination competitiveness. The authors interviewed stakeholders to identify problems in Cappadociatourism and to suggest solutions. The main challenges were related to infrastructure, accessibility,human resources, sustainable development, and the environment. A well-prepared managementsystem can help the region become more competitive, at the same time minimizing current problems.Cooperation and coordination were identified as key functions owing to the presence of several tourismmanagement institutions in Cappadocia. The research provides a powerful input in the debate ona model approach to sustainable and competitive tourism. Directors of Polish national parks can takeadvantage of the recommendations presented in the study.
7. Conclusions and Recommendations
Managing the use, conservation, and formation of the natural environment is a very complexprocess. The principal objective is to ensure conservation and gain certainty that resources will remainavailable for future generations, as well as to improve the adverse effects of human activity and theoverall state of the natural environment.
The purpose of the paper was to attempt to present a model of natural environment managementin national parks in Poland in the context of increased tourist traffic. The assumed goal was achievedowing to in-depth interviews with the management staff of the parks. Their indications allowed us tocreate a comprehensive system of both nature conservation and making nature available to tourists.
Three issues are particularly important from the point of view of a national park activity. The firstone is the competence of the management bodies, as they have the best knowledge of the problemsoccurring in the park and should be able to directly influence them. The second issue is the legalobligation of parks to provide environmental education, so important in the modern world. The thirdissue is a good environmental management system, essential for sustainable management. The obtainedresults can be grouped into the following three categories:
1. Administrative and management bodies In order for the activities to have an impact on thepark area, a carefully developed conservation plan should be developed. The research indicatesthat only seven parks actually had such a plan; some have submitted draft conservation plansto the Minister, while others were in the process of inventorying the natural resources anddeveloping surveys. Its correctness requires research monitoring the state of the environment,the size and trends of the tourist traffic, and tourists’ impact on the environment. An importantcondition for a more effective tourism management in parks is to increase the competences of theadministering bodies and the knowledge regarding individual responsibilities. Boards should beable to analyse, evaluate, and modify not only conservation plans, but also spatial developmentplans, municipality development strategies, and projects for investments planned within theparks. The sustainable development of tourism in parks is not possible without the involvement oflocal communities and their taking real advantages of tourism. From this point of view, the mostfavourable is the development of agritourism, which provides employment for the residents;therefore, cooperation with local governments plays a significant role.
2. Education The research reveals that all parks implemented ecological education, establishededucational pathways, and cooperated with local government units. These actions, however,are insufficient. More attention should be paid to education and the promotion of ecologicalbehaviour among tourists and local communities. This is due to the diversified level of theirculture and identification with the park area, which depends on the history of developmentand traditions of these communities. A widespread lack of awareness of the negative impact ofhuman activity on the environment usually leads to the degradation of natural and landscape
244

Sustainability 2020, 12, 2704
values, which determine the attractiveness of the area. Economic instruments have the greatestcontribution to the effective management of environmental resources, as they can influence orforce reasonable actions for the natural environment.
3. Management system The research results obtained in Polish national parks indicate that theirmanagement is carried out in a non-accidental and reliable manner in relation to sustainabledevelopment principles. It was revealed that certain aspects of tourism in the parks wereconsidered to be factors threatening or potentially threatening the nature of the park. However,in general, tourism itself is not a threat if it is well managed and if preventive measures aretaken. The directors of the investigated parks try to include selected elements of the proposedmodel in the management process. However, only their comprehensive application can bringsuccess. The proposed model of the system of natural environment management in a park may beimplemented as a good practice in other state parks around the world. The modern managementof the natural environment in such valuable areas as national parks can reconcile two very difficultissues, namely nature conservation and its simultaneous availability to tourists. In a nationalpark, natural resources, i.e., ecosystems and their appropriate conservation, are always in thefront line; however, wisely conducted tourism does not have to produce negative effects. In thefuture, the proposed concept of the park management system may also find wide application inother institutions and companies that prioritize environmental conservation.
The model proposed by the authors has been verified in state-run national parks and is addressedto them. Unfortunately, in private national parks, the model would have to be modified and adjusted tothe needs of the park owner. Among the first owners of private national parks are Douglas Tompkins,Ted Turner, and Roxanne Quimby. Creating their policy of managing national parks, they have becomeleaders in the struggle to save the Earth for future generations.
Author Contributions: P.O. prepared the following elements of the article: the methodology, conclusions; S.P.prepared the following elements of the article: the methodology, conduct of research, developed the finalcontents of the article and proofread and revised it. J.M.-P. prepared the following elements of the article: themethodology, introduction, review of the literature. A.R.S. prepared the following elements of the article: themethodology, introduction and conclusions, conduct of research, calculations. S.J.—review and editing, datacorrection. All authors have read and agreed to the published version of the manuscript.
Funding: This research received funding by the National Science Center in Poland. The funders had no role in thedesign of the study; in the collection, analyses, or interpretation of data; in the writing of the manuscript, or in thedecision to publish the results.
Acknowledgments: This paper was published as part of the research project ‘A business model for health resortenterprises’ No. 2017/25/B/HS4/00301, supervised and financed by the National Science Center in Poland and aspart of statutory research No. BK-235/ROZ-1/2020 (13/010/BK_20/0042) at the Silesian University of Technology,Faculty of Organization and Management.
Conflicts of Interest: The authors declare no conflict of interest.
References
1. Burchard-Dziubinska, M.; Rzenca, A.; Drzazga, D. Zrównowazony Rozwój: Naturalny Wybór;Wydawnictwo Uniwersytetu Łódzkiego: Lodz, Poland, 2014.
2. Michalski, E. Zarzadzanie Przedsiebiorstwem: Podrecznik Akademicki; Wydawnictwo Naukowe PWN: Warsaw,Poland, 2013.
3. Wei, Y.; He, S.; Li, G.; Chen, X.; Shi, L.; Lei, G.; Su, Y. Identifying nature–community nexuses for sustainablymanaging social and ecological systems: A case study of the Qianjiangyuan National Park pilot area.Sustainability 2019, 11, 6182. [CrossRef]
4. Luque-Martínez, T.; Faraoni, N.; Doña-Toledo, L. Auditing the marketing and social media communicationof natural protected areas. How marketing can contribute to the sustainability of tourism. Sustainability 2019,11, 4014. [CrossRef]
5. Deng, J.; Li, J. Segmentation of nature-based tourists in a rural area (2008–2009): A single-item approach.Sustainability 2019, 11, 2052. [CrossRef]
245

Sustainability 2020, 12, 2704
6. Myga-Piatek, U.; Jankowski, G. Wpływ turystyki na srodowisko przyrodnicze i krajobraz kulturowy—Analizawybranych przykładów obszarów górskich. Probl. Ekol. Krajobr. 2009, 25, 27–38.
7. Krupa, J. Działania proekologiczne w turystyce szansa na jej zrównowazony rozwój. Zesz. Nauk. Tur. Rekr.2014, 1, 5–23.
8. Mizgajski, A. Zarzadzanie srodowiskiem i jego pozycja w badaniach geograficznych. Przegl. Geogr. 2008, 80,23–37.
9. Ackerman, E. Where is a research frontier? Ann. Assoc. Am. Geogr. 1963, 53, 429–440. [CrossRef]10. Hagerstrand, T. Geografia i badania zaleznosci pomiedzy natura a społeczenstwem. Przegl. Zagr. Lit. Geogr.
1979, 4, 35–46.11. Bartkowski, T. Zastosowania Geografii Fizycznej; PWN: Warsaw, Poland, 1986.12. Barbag, J. Przedmiot i zadania geografii regionalnej. Przegl. Geogr. 1959, 31, 495–515.13. Zube, E.H. Local and extra-local perceptions of national parks and protected areas. Landsc. Urban Plan. 1986,
13, 11–17. [CrossRef]14. Zube, E.H.; Busch, M.L. Park—People relationship: An international review. Landsc. Urban Plan. 1990, 19,
117–131. [CrossRef]15. West, P.C.; Brechin, S.R. (Eds.) Resident Peoples and National Parks: Social Dilemmas and Strategies in International
Conservation; University of Arizona Press: Tucson, AZ, USA, 1991.16. Beltran, J. (Ed.) Indigenous and Traditional Peoples and Protected Areas: Principles, Guidelines and Case Studies;
Best Practice Protected Areas Guildelines Series, No 4; WWF/IUCN: Gland, Switzerland, 2000.17. Macgill, S.M. Environmental questions and human geography. Int. Soc. Sci. J. 1986, 38, 357–375.18. Kantowicz, E.; Skotnicki, M. Główne problemy i tendencje w geografii regionalnej. In Podstawowe Problemy
Metodologiczne Polskiej Geografii; Chojnicki, Z., Ed.; Wydawnictwo Naukowe UAM: Poznan, Poland, 1991;pp. 229–243.
19. Dumanowski, B. Geografia regionalna jako dyscyplina badawcza. Przegl. Geogr. 1981, 53, 87–94.20. Kostrzewski, A. (Ed.) Geografia Regionalna Jako Przedmiot Badan i Nauczania; Bogucki Wydawnictwo Naukowe:
Poznan, Poland, 2006.21. Gocłowski, A.; Kałuski, S.; Kantowicz, E.; Walewski, A. Geografia regionalna. In Historia Geografii Polskiej;
Jackowski, A., Liszewski, S., Richling, A., Eds.; Wydawnictwo Naukowe PWN: Warsaw, Poland, 2008;pp. 248–260.
22. Fraser, I.; Chisholm, T. Conservation or cultural heritage? Cattle grazing in the Victoria Alpine NationalPark. Ecol. Econ. 2000, 33, 63–75. [CrossRef]
23. West, P.; Igoe, J.; Brockington, D. Parks and peoples: The social impact of protected areas. Ann. Rev. Anthropol.2006, 35, 251–277. [CrossRef]
24. Chemini, C.; Rizzoli, A. Land use change and biodiversity conservation in the Alps. J. Mt. Ecol. 2003, 7, 1–7.25. Domanski, R. Metody badania zbieznosci układów przestrzennych. Przegl. Geogr. 1969, 41, 79–92.26. Walewski, A. Badanie relacji miedzy zmiennymi o wartosciach grupowanych. Propozycja metodyczna.
Pr. Stud. Geogr. 1997, 19, 49–54.27. Walewski, A. Metody badania relacji przyroda-człowiek. Pr. Stud. Geogr. 2004, 34, 75–85.28. Walewski, A.; Kantowicz, E. The relations between man and the natural environment as the methodological
basis for delimitation of regions. Misc. Geogr. 2010, 14, 295–301. [CrossRef]29. Domanski, R. Konstruowanie teorii w geografii ekonomicznej. Przegl. Geogr. 1967, 1, 85–102.30. Domanski, R. Systemy Ekologiczno-Ekonomiczne. Modelowanie Współzaleznosci i Rozwoju; PAN: Warsaw, Poland,
1992.31. Kistowski, M. Regionalny Model Zrównowazonego Rozwoju i Ochrony Srodowiska Polski a Strategie Rozwoju
Województw; Bogucki Wydawnictwo Naukowe: Gdansk/Poznan, Poland, 2003.
246

Sustainability 2020, 12, 2704
32. Kistowski, M. Próba typologii sytuacji konfliktowych w relacjach „zagospodarowanieprzestrzenne—srodowisko przyrodnicze” na obszarze parków krajobrazowych nad Zatoka Gdanska.In Miedzy Ochrona Przyrody a Gospodarka—Blizej Ochrony. Konflikty Człowiek-Przyroda W Obszarach PrawnieChronionych w Polsce; Hibszer, A., Partyka, J., Eds.; PTG Oddział Katowicki: Sosnowiec, Poland, 2005;pp. 18–31.
33. Butler, R.W. Sustainable tourism: A state-of-the-art review. Tour. Geogr. 1999, 1, 7–25. [CrossRef]34. Pearce, D.G. Westland National Park: Economic Impact Study; University of Canterbury: Christchurch,
New Zealand, 1982.35. Kerr, G.N.; Sharp, B.H.; Gough, J.D. Economic Benefits of Mt. Cook National Park; University of Canterbury and
Lincoln College: Christchurch, New Zealand, 1986.36. Abel, N.; Blaikie, P. Elephants, people, parks and development: The case of the Luangwa Valley, Zambia.
Environ. Manag. 1986, 10, 735–754. [CrossRef]37. Clough, P.W.J.; Meister, A.D. Benefit Assessment of Recreation Land: The Whakapapa Area, Tongariro National
Park; Massey University: Palmerston North, New Zealand, 1989.38. Trakolis, D. Local people’s perceptions of planning and management issues in Prespes Lakes National Park,
Greece. J. Environ. Manag. 2001, 61, 227–241. [CrossRef] [PubMed]39. Ferraro, P.J. The local costs of establishing protected areas in low-income nations: Ranomafana National
Park, Madagascar. Ecol. Econ. 2002, 43, 261–275. [CrossRef]40. Cihar, M.; Stankova, J. Attitudes of stakeholders towards the Podyji/Thaya River Basin National Park in the
Czech Republic. J. Environ. Manag. 2006, 81, 273–285. [CrossRef] [PubMed]41. Jarvis, T.D. The Responsibility of National Parks in Rural Development. In National Parks and Rural
Development; Machlis, G., Field, D., Eds.; Island Press: Washington, DC, USA, 2000; pp. 219–229.42. Kideghesho, J.R.; Roskaft, E.; Kaltenborn, B.P. Factors influencing conservation attitudes of local people in
western Serengeti, Tanzania. Biodivers. Conserv. 2007, 16, 2213–2230. [CrossRef]43. Fortin, M.-J.; Gagnon, C. An assessment of social impacts of national parks on communities in Quebec,
Canada. Environ. Conserv. 1999, 26, 200–211. [CrossRef]44. Burger, T. Konflikt i współdziałanie. Swiadomosc ekologiczna i postawy społeczenstwa. In Swiadomosc
Ekologiczna i Społeczne Ruchy „Zielonych” w Polsce; Mirowski, W., Ed.; IFiS PAN: Warsaw, Poland, 1999;pp. 35–55.
45. Królikowska, K. Miedzy ochrona przyrody a rozwojem na obszarach górskich—konflikty i rozwiazania.Czas. Geogr. 2002, 73, 187–214.
46. Hibszer, A. Parki Narodowe w Swiadomosci i Działaniach Społecznosci Lokalnych; Uniwersytet Slaski: Katowice,Poland, 2013.
47. Barker, M.L. Traditional landscape and mass tourism in the Alps. Geogr. Rev. 1982, 72, 395–415. [CrossRef]48. Bauer, H. Local perception of Waza National Park, northern Cameron. Environ. Conserv. 2003, 30, 175–181.
[CrossRef]49. Bojórquez-Tapia, L.A.; de la Cueva, H.; Diaz, S.; Melgarejo, D.; Alcantar, G.; Solares, M.J.; Grobet, G.;
Cruz-Bello, G. Environmental conflicts and nature reserves: Redesigning Sierra San Pedro Martir NationalPark, Mexico. Biol. Conserv. 2004, 117, 111–126. [CrossRef]
50. Colchester, M. Conservation policy and indigenous people. Environ. Sci. Policy 2004, 7, 145–153. [CrossRef]51. Stern, M. The power of trust: Toward a theory of local opposition to neighboring protected areas. Soc. Nat.
Resour. 2008, 21, 859–875. [CrossRef]52. Heinen, J.T. Park-people relations in Kosi Tappu Wildlife Reserve, Nepal: A socio-economic analysis.
Environ. Conserv. 1993, 20, 25–34. [CrossRef]53. Lewis, C. Managing Conflicts in Protected Areas; IUCN: Gland, Switzerland, 1996.54. Odrowaz-Pieniazek, I.; Wozniak, J. Negocjacje jako strategia rozwiazywania konfliktów w sporach pomiedzy
parkami narodowymi a samorzadami. Człow. Srod. 1997, 21, 87–95.55. Nepal, S.K. Linking parks and people: Nepal’s experience in resolving conflicts in parks and protected areas.
Int. J. Sust. Dev. World 2002, 9, 75–90. [CrossRef]56. Hunter, C.; Green, H. Tourism and the Environment: A Sustainable Relationship? Routledge: London, UK, 1995.57. Hunter, C. Sustainable tourism as an adaptive paradigm. Ann. Tour. Res. 1997, 24, 850–867. [CrossRef]58. Draper, D. Toward sustainable mountain communities: Balancing tourism development and environmental
protection in Banff and Banff National Park, Canada. Ambio 2000, 29, 408–415. [CrossRef]
247

Sustainability 2020, 12, 2704
59. Sharpley, R. Tourism and sustainable development: Exploring the theoretical divide. J. Sustain. Tour. 2000, 8,1–19. [CrossRef]
60. Saarinen, J. Traditions of sustainability in tourism studies. Ann. Tour. Res. 2006, 33, 1121–1140. [CrossRef]61. Hunter, C. Sustainable tourism and the touristic ecological footprint. Environ. Dev. Sustain. 2002, 4, 7–20.
[CrossRef]62. Paunovic, I.; Jovanovic, V. Implementation of sustainable tourism in the German Alps: A case study.
Sustainability 2017, 9, 226. [CrossRef]63. Mortensen, T.L.; Leistritz, F.L.; Leitch, J.A.; Coon, R.C.; Ekstrom, B.L. Socioeconomic impact of the conservation
reserve program in North Dakota. Soc. Nat. Resour. 1990, 3, 53–61. [CrossRef]64. Mika, M. Załozenia i Determinanty Podtrzymywalnosci Lokalnego Rozwoju Turystyki; Instytut Geografii i
Gospodarki Przestrzennej Uniwersytetu Jagiellonskiego: Krakow, Poland, 2014.65. Elmi, M.; Perlik, M. From tourism to multilocal residence? Unequal transformation processes in the Dolomites
area. J. Alp. Res. 2014, 102. [CrossRef]66. Pawlaczyk, P. Modele oddziaływan człowiek-przyroda jako podstawa okreslenia pojemnosci
turystycznej parku narodowego. In Uzytkowanie Turystyczne Parków Narodowych. RuchTurystyczny—Zagospodarowanie—Konflikty—Zagrozenia; Partyka, J., Ed.; Instytut Ochrony Przyrody PAN,Ojcowski Park Narodowy: Ojcow, Poland, 2002; pp. 23–36.
67. Wnuk, Z.; Ziaja, M. (Eds.) Turystyka w Obszarach Natura 2000; Uniwersytet Rzeszowski: Rzeszow, Poland,2007.
68. Liszewski, S. Przestrzen turystyczna parków narodowych w Polsce. In Gospodarka i Przestrzen; Domanski, B.,Kurek, W., Eds.; Instytut Geografii i Gospodarki Przestrzennej UJ: Krakow, Poland, 2009; pp. 187–201.
69. Zajadacz, A. Koncepcja rozwoju rozwoju turystyki. In Uwarunkowania i Plany Rozwoju Turystyki. Walory iAtrakcje Turystyczne. Potencjał Turystyczny. Plany Rozwoju Turystyki; Seria Turystyka i Rekreacja—Studia iPrace; Naukowe UAM, Ed.; Adam Mickiewicz University: Poznan, Poland, 2009; Volume 3, pp. 93–130.
70. Butler, R.W. The concept of a tourist area cycle of evolution: Implications for management of resources.Can. Geogr. 1980, 24, 5–12. [CrossRef]
71. Brechin, S.R.; West, P.C.; Harmon, D.; Kutay, K. Resident Peoples and Protected Areas: A Framework forInquiry. In Resident Peoples and National Parks: Social Dilemmas and Strategies in International Conservation;West, P.C., Brechin, S.R., Eds.; University of Arizona Press: Tucson, AZ, USA, 1991; pp. 5–30.
72. Eagles, P.; McCool, S.F. Tourism in National Parks and Protected Areas: Planning and Management; CABI: NewYork, NY, USA, 2002.
73. Pytel, S. Atrakcyjnosc turystyczna miejsc migracji seniorów z województwa slaskiego. Ekon. Probl. Tur. 2014,1, 327–340.
74. Markiewicz-Patkowska, J.; Pytel, S.; Widawski, K.; Olesniewicz, P. Turystyka senioralna w kontekscie sytuacjimaterialnej polskich emerytów. Ekon. Probl. Tur. 2018, 2, 99–106.
75. Pytel, S.; Rahmonov, O. Migration processes and the underlying reasons: A study on pensioner migrants inPoland. Popul. Space Place 2019, 25, e2197. [CrossRef]
76. Stoll-Kleemann, S. Reconciling opposition to protected areas management in Europe: The German experience.Environ. Sci. Policy Sust. Dev. 2001, 43, 32–44. [CrossRef]
77. Kaltenborn, B.P.; Nyahongo, J.W.; Kidegesho, J.R.; Haaland, H. Serengeti National Park and itsneighbours—Do they interact? J. Nat. Conserv. 2008, 16, 96–108. [CrossRef]
78. Von Ruschkowski, E. Causes and Potential Solutions for Conflicts Between Protected Area Management andLocal People in Germany. In Rethinking Protected Areas in a Changing World: Proceedings of the 2009 GeorgeWright Society Biennial Conference on Parks, Protected Areas, and Cultural Sites in Portland, Oregon; Weber, S., Ed.;George Wright Society: Hancock, MI, USA, 2010; pp. 200–244.
79. Raval, S.R. Wheel of life: Perceptions and concerns of the resident peoples for Gir National Park in India.Soc. Nat. Resour. 1994, 7, 305–320. [CrossRef]
80. Fiallo, E.A.; Jacobson, S.K. Local communities and protected areas: Attitudes of rural residents towardsconservation and Machalilla National Park, Ecuador. Environ. Conserv. 1995, 22, 241–249. [CrossRef]
81. Brandon, L.; Redford, K.H.; Sanderson, S.E. (Eds.) Parks in Peril: People, Politics and Protected Areas; Island Press:Washington, DC, USA, 1998.
82. Allendorf, T.D. A framework for the park-people relationship: Insights from protected areas in Nepal andMyanmar. Int. J. Sust. Dev. World 2010, 17, 417–422. [CrossRef]
248

Sustainability 2020, 12, 2704
83. Caldecott, J. Designing Conservation Project; Cambridge University Press: Cambridge, UK, 1995.84. Piontek, F. Kontrowersje i Dylematy Wokół Rozwoju Zrównowazonego i Trwałego. Ekonomia a Rozwój Zrównowazony;
Wydawnictwo Ekonomia i Srodowisko: Bialystok, Poland, 2001.85. Torunski, J. Aspekty srodowiskowe zrównowazonego rozwoju obszarów prawnie chronionych. Zesz. Nauk.
Akad. Podl. Siedl. 2010, 84, 21–32.86. Weaver, D.B.; Lawton, L.J. A new visitation paradigm for protected areas. Tour. Manag. 2017, 60, 140–146.
[CrossRef]87. Leung, Y.F. Tourism and Visitor Management in Protected Areas: Guidelines for Sustainability; Spenceley, A.,
Hvenegaard, G., Buckley, R., Groves, C., Eds.; IUCN: Gland, Poland, 2018.88. Eagles, P.F.; Bowman, M.E.; Tao, C.H. Guidelines for Tourism in Parks and Protected Areas of East Asia; IUCN:
Gland, Poland, 2001.89. Mandic, A. Structuring challenges of sustainable tourism development in protected natural areas with
driving force–pressure–state–impact–response (DPSIR) framework. Environ. Syst. Decisions 2020, 1–17.[CrossRef]
90. Mandic, A.; Petric, L. The impacts of location and attributes of protected natural areas on hotel prices:Implications for sustainable tourism development. Environ. Dev. Sustain. 2020, 1–31. [CrossRef]
91. Gałazka, M. Turystyka zrównowazona w parkach narodowych w opinii turystów. Stud. Mat. Cent. Eduk.Przyr. Lesn. 2009, 11, 123–130.
92. Para, A.K. Zasady zrównowazonego rozwoju turystyki—Bariery i szanse dla branzy turystycznej. Zesz. Nauk.Tur. Rekr. 2013, 1. [CrossRef]
93. McMinn, S. The challenge of sustainable tourism. Environmentalist 1997, 17, 135–141. [CrossRef]94. Apanowicz, J. Zarys Metodologii Prac Dyplomowych i Magisterskich z Organizacji i Zarzadzania; Wyzsza Szkoła
Administracji i Biznesu: Gdynia, Poland, 1997.95. Byrd, E.T. Stakeholders in sustainable tourism development and their roles: Applying stakeholder theory to
sustainable tourism development. Tour. Rev. 2007, 62, 6–13. [CrossRef]96. Liburd, J.J.; Edwards, D. (Eds.) Understanding the Sustainable Development of Tourism; Goodfellow: Oxford,
UK, 2010.97. Mihalic, T. Environmental management of a tourist destination: A factor of tourism competitiveness.
Tour. Manag. 2000, 21, 65–78. [CrossRef]98. Ceron, J.P.; Dubois, G. Tourism and sustainable development indicators: The gap between theoretical
demands and practical achievements. Curr. Issues Tour. 2003, 6, 54–75. [CrossRef]99. Huete-Alcocer, N.; López-Ruiz, V.R.; Grigorescu, A. Measurement of satisfaction in sustainable tourism:
A cultural heritage site in Spain. Sustainability 2019, 11, 6774. [CrossRef]100. McCool, S.F.; Bosak, K. (Eds.) Reframing Sustainable Tourism; Springer: Dordrecht, The Netherlands, 2016.101. Wasiuk, A. Rachunkowosc w zarzadzaniu parkiem narodowym. Fin. Ryn. Fin. Ubezp. 2016, 80, 207–214.
[CrossRef]102. Ustawa z Dnia 16 Kwietnia 2004 r. o Ochronie Przyrody, Dz.U. 2004 nr 92 poz. 880. Available
online: http://prawo.sejm.gov.pl/isap.nsf/download.xsp/WDU20040920880/O/D20040880.pdf (accessed on12 November 2019).
103. Kunasz, M. Zasoby przedsiebiorstwa w teorii ekonomii. Gosp. Nar. 2006, 211, 33–48. [CrossRef]104. Ruskowski, E.; Salachna, J.M. Finanse Publiczne. Komentarz Praktyczny; ODDK: Gdansk, Poland, 2014.105. Government Republic of Poland. The Act on Public Finance; Government Republic of Poland: Warsaw, Poland,
2013.106. Nasza Krajoznawczo Górska Przygoda. Available online: https://www.naszakgp.pl/ (accessed on 12
November 2019).107. Berlin Declaration. Biodiversity and Sustainable Tourism. In Proceedings of the International Conference of
the Ministers of the Environment, Berlin, Germany, 6–8 March 1997.108. Local Data Bank of Statistics Poland. Available online: www.stat.gov.pl (accessed on 12 November 2019).109. Szromek, A.R. Wskazniki Funkcji Turystycznej. Koncepcja Wskaznika Funkcji Turystycznej i Uzdrowiskowej;
Wydawnictwo Politechniki Slaskiej: Gliwice, Poland, 2012.110. Szromek, A.R. Pomiar funkcji turystycznej obszarów za pomoca wskazników funkcji turystycznej na
przykładzie obszarów panstw europejskich. Stud. Ekon. 2013, 132, 91–103.
249

Sustainability 2020, 12, 2704
111. Gios, G.; Goio, I.; Notaro, S.; Raffaelli, R. The value of natural resources for tourism: a case study of theItalian Alps. Int J Tour Res 2006, 8, 77–85. [CrossRef]
112. Bonzanigo, L.; Giupponi, C.; Balbi, S. Sustainable tourism planning and climate change adaptation in theAlps: A case study of winter tourism in mountain communities in the Dolomites. J. Sustain. Tour. 2016, 24,637–652. [CrossRef]
113. Coban, G.; Yildiz, O.S. Developing a destination management model: Case of Cappadocia. Tour. Manag.Perspect. 2019, 30, 117–128. [CrossRef]
© 2020 by the authors. Licensee MDPI, Basel, Switzerland. This article is an open accessarticle distributed under the terms and conditions of the Creative Commons Attribution(CC BY) license (http://creativecommons.org/licenses/by/4.0/).
250

sustainability
Article
Carbon Footprint Evaluation Based on TouristConsumption toward Sustainable Tourism in Japan
Yusuke Kitamura *, Yuki Ichisugi, Selim Karkour and Norihiro Itsubo
Graduate School of Environmental and Information Studies, Tokyo City University, Yokohama 224-8551, Japan;[email protected] (Y.I.); [email protected] (S.K.); [email protected] (N.I.)* Correspondence: [email protected]; Tel.: +81-45-910-2930
Received: 18 February 2020; Accepted: 9 March 2020; Published: 12 March 2020
Abstract: The importance of the contribution of tourism to climate change has been noted by theUnited Nations World Tourism Organization (UNWTO). By combining a process-based life cycleassessment (LCA) and input–output analysis, several researchers have attempted to evaluate theimpacts of the tourism industry, as well as its products and services. Indeed, the tourism sector hasa wide range of industries, including travel and tours, transportation, accommodation, food andbeverage, amusement, souvenirs, etc. However, the existing cases do not show a breakdown of theimpact on climate change. In this paper, the carbon footprint (CFP) of the Japanese tourism industrywas calculated based on tourist consumption, using the Japanese input–output table and the Japanesetourism industry. We demonstrate that the total emissions were approximately 136 million t-CO2per year. The contribution ratio of each stage is as follows: Transport 56.3%, Souvenirs 23.2%, Petrol(direct emissions) 16.9%, Accommodation 9.8%, Food and Beverage 7.5%, and Activities 3.0%. Then,in the breakdown, the impacts are in the following order: Air transport 24.7%, Petrol (direct emissions)16.9%, Accommodation 9.8%, Food and Beverage 7.5%, Petrol 6.1%, Textile products 5.3%, Food items4.9%, Confectionery 4.8%, Rail transport 3.9%, Cosmetics 1.9%, and Footwear 1.8%. In addition totransportation, this research also highlights the contribution from souvenirs, accommodation, andfood and beverages.
Keywords: Life Cycle Assessment (LCA); Carbon Footprint (CFP); tourism
1. Introduction
According to the United Nations, more than three million people travel across the world everyday, and approximately 1.2 billion people travel abroad every year. This includes not only personaltravel, but also MICE [1] (Meetings, Incentives, Conferences, and Exhibitions,) which are internationalmeetings (conventions) held, for example, by international organizations, academic societies, etc.
The year 2017 was designated as the “International Year of Sustainable Tourism for Development”to spread awareness of the role of tourism. One of the messages was, through contact with nature,to raise awareness of the challenges posed by the effective use of resources and the effect on climatechange. Another intention was to increase awareness of global issues [2]. The United Nations WorldTourism Organization (UNWTO) is still recognizing the impact of tourism on global warming as animportant issue in the 21st century. UNWTO has defined sustainable tourism as "Tourism that takesfull account of its current and future economic, social and environmental impacts, addressing the needsof visitors, the industry, the environment and host communities" [3,4]. The world tourism industry hasalso begun to implement “Tourism for SDGs”, aiming to contribute to the Sustainable DevelopmentGoals (SDGs). In the "SDG compass", which shows the approach to the SDGs, the "life cycle assessment(LCA)" is introduced as one of the means to map the high-impact areas in the value chain in "Step2 Determine priority issues". Such international trends call for actions that include the concept ofsustainability, not only in developing countries but also in developed countries.
Sustainability 2020, 12, 2219; doi:10.3390/su12062219 www.mdpi.com/journal/sustainability251

Sustainability 2020, 12, 2219
In Japan, according to a survey by the Japanese Ministry of Land, Infrastructure, Transport,and Tourism (MLIT) [5], environmental efforts are one of the most important issues, regardless ofthe field of business. Today, in the field of tourism in Japan, there are a variety of local governments,residents, tourism industries, etc., that are making efforts to protect the environment. Establishing acooperative system that goes beyond the initiative of a single entity has been strongly recognized asan option to tackle the issue. In addition, it has been shown that environmental conservation effortsare not only indispensable for the sustainable development of tourism but also greatly related toimproving the attractiveness of tourist destinations.
According to the Japan Tourism White Paper (2017) [6], the gross domestic product (GDP) of thetourism sector, as defined by the UNWTO (2012), is approximately 8.5 trillion yen (about 78.6 billionUS dollars), accounting for approximately 1.7% of the country’s total GDP. Moreover, the growth rateof the tourism sector GDP is about 23%, which is higher than the growth rate for other industries.On the other hand, in a specific tourist area, a significant increase in visitors, for example, might resultin a negative impact on the civic life, natural environment, landscape, etc., which could greatly reducethe level of satisfaction for travelers. Such tourism situations have become a major issue, referred toas “overtourism”. The Japanese government has established the “Tourism Strategy Promotion TaskForce” as part of the Japan Tourism Agency (JTA) (2018). The goal of this entity is to harmonize theincreasing needs of tourists and the living condition of the residents in the tourist area. A system wasdeveloped to comprehensively examine and promote their coexistence. With these social issues inmind, the JTA is considering establishing an evaluation index for sustainable tourism in Japan.
In connection with overtourism, Martín Martín, JM et al. (2018) [7] analysed a study of the city ofBarcelona (Spain) that found that citizens had a general aversion to tourism. We have determined thatthere is a negative economic effect due to the increase in the number of accommodations and demandfor vacation rentals. The main effects are concerns about rising home rental prices and the move tohigher priced tourism markets. Martín Martín, J. M. et al. (2019) [8] also point to the issue of tourismseasonality. They looked at the factors that make decisions by tourism entrepreneurs. The results showthat entrepreneurs acknowledge the cost of shutting down during off-peak season. They also indicatedthat they placed great importance on the factors that justify closing the office for several months a year.These papers show that economic growth in the tourism sector has the potential to undermine othereconomies and change the style of the tourism sector.
Martínez, J.M.G. et al. (2019) [9] analysed the stability of rural tourism as a desirable condition forsustainable tourism in terms of the difference between rural tourism and urban tourism. The surveydraws on major tourist attractions in Spain. The analysis concludes that the annual level of stability ofrural tourism is not far from the stability of the most stable urban tourism, due to the much higherseasonality in coastal tourist destinations. Martinez, J.M.G. et al. (2020) [10] collected and analysedthe individual preferences of the most representative stakeholder groups (farmers, business owners,governments, scientists). They calculated the conflict index between groups of stakeholders in thisstudy. From here, the most favorable content to consider the target was shown. On the other hand,the most serious disagreements were found between farmers and scientists, and between farmers andgovernments. Thus, there are various issues concerning the sustainability of tourism, suggesting thattargeting through stakeholder communication is important.
A life cycle assessment (LCA) can be an alternative solution for this situation, as it can identifythe potential environmental impacts caused by the tourism sector within its different life cycle stages.From the viewpoint of LCA, there are two main methods for calculating the environmental impacts:Process-based LCA (focusing on the different processes constituting the scope of evaluation) andinput–output based LCA (focusing on the monetary interaction between the different industrialsectors). Filimonau et al. (2016) [11] made a summary of the different LCA studies focusing on tourism(Appendix A, Table A1).
The process method, which is a method of examining the individual processes that make up the lifecycle one by one and collecting and accumulating the environmental load data for each process, is often
252

Sustainability 2020, 12, 2219
targeted at specific product services such as holiday travel (including or excluding accommodation)and tourist accommodation (Appendix A, Table A1). On the other hand, the input–output method isbased on the estimated consumption of energy and resources, as well as the environmental impacts ofemitted substances by using an input–output table. The input–output is often targeted at evaluatingindustrial sectors, such as the local tourism sector and the national tourism industry.
Lenzen et al. (2018) [12] calculated the carbon footprint (CFP) of global tourism using multi-regionalinput–output (MRIO). The tourism industry is composed of a wide range of industries including travel,lodging, dining, amusement, souvenirs, etc., and is expected to grow at a global annual rate of 4%. Theglobal GHG (greenhouse gas) emissions related to tourism were not well quantified until now. In thisstudy, based on tourism-related data from 160 countries, the CFP for tourism was estimated to increasefrom 3.9 to 4.5 Gt CO2eq between 2009 and 2013. This is about four times the previous estimate andaccounts for about 8% of global GHG emissions. The authors commented on the high contribution offood and beverage in addition to travel and shopping.
In Japan, New Tourism Study Group of The Institute of Life Cycle Assessment, Japan (ILCAJ)has been studying the GHG emissions related to tourism since 2009 [13] to highlight their importance.In 2013, the calculation methods for tourism were examined, based on the works from Ito et al.(2011) [14], focusing on transportation, Tamari et al. (2011) [15], focusing on accommodation, andfinally, Kazama et al. (2011) [16], focusing on food and beverage. In the same year, the product categoryrule (PCR) [17] for travel was also examined in the Carbon Footprint Communication Program (CFPProgram). The bottom-up evaluation results were used for labeling, such as PCR for the CFP programand for the establishment of certification standards for Eco Mark (Type I label) [18,19].
Finally, Shimizu et al. (2015) [20] also examined 27 industrial sectors related to tourism in Japanand Korea using the input–output table approach, tourism statistics related to consumption, andvarious data on CO2 emission intensities. In the future, while the production value of the tourismindustry can be expected to increase, they noted that this is a possibility of increasing emissionsof greenhouse gases, such as carbon dioxide (CO2). However, for the domestic case, there is nobreakdown that clarifies the degree of impact of “travel, lodging, amusement, souvenirs, etc.”, whichare the key elements which compose tourism. Therefore, our study aims at clarifying this point.
In this study, we calculate the CFP for the entire Japanese tourism industry and quantitatively showthe breakdown by the different categories that compose this industry (transportation, accommodation,food and beverage, souvenirs, activities, etc.).
2. Materials and Methods
2.1. Input–Output Table Approach
In this method, the evaluation is conducted retrospectively from the supply chain, so thata comprehensive evaluation is performed from the viewpoint of the life cycle of products andservices. Therefore, this study uses the LCA method [21] in order to meet the objective of consideringcomprehensive evaluation by including the pre-tourism preparation stage and post-tourism stage, aswell as the different stages occurring during travelling.
In this research, the Japanese input–output table is used. The principles of this method are basedon the works from W.W. Leontief [22] and are often used in the LCA research field. The formula usedin this method is
Environmental loads = d(I −A)−1 f (1)
where d is the direct environmental impact and the environmental impact per production value. (I-A) −1
is the Leontief inverse matrix and can be used to consider the direct and indirect economic ripple effectcaused by the consumption of one type of goods. f is the amount of activity. This method helps toevaluate the entire supply chain. According to Hondo (2008) [23], it has the following advantages:
• Arbitrariness is not involved in the choice of system boundaries.
253

Sustainability 2020, 12, 2219
• There is a full understanding of the indirect environmental impact.• Public statistics with excellent transparency and objectivity are used.• It can evaluate all goods and services.
To sum up, it is possible to make an objective evaluation, and the existing limit to obtain the datafor each process is overcome by using the input–output table. Therefore, the calculation following thisapproach was adopted in this study.
2.2. System Boundaries
As shown in Table 1, the system boundaries of this study follow the traditional approach adoptedfor tourism evaluation. Preparation (Pre-tourism), Inbound Tourism, Domestic Tourism, OutboundTourism, and After (Post-tourism) are the different life stages. These cover consumptions related tomovement and accommodation of tourists and the staff and participants of MICE events. However,these do not include the consumption of foreign tourists before/after travelling or items purchased byMICE organizers or the energy consumption at the venues.
Table 1. Scope of the evaluation data. The items evaluated in this study are displayed as “�”, and “N”means NOT appliciatable.“P” in the table is an abbreviation of preparation for travel, “W” means whiletraveling, and “A” means after travel.
InboundTourism
DomesticTourism
DomesticTourism
DomesticTourism
OutboundTourism
Overnight Stay Day Trip Transit
Life cycle stage P W A P W A P W A P W A P W A 3
Productsand services
Travel agencies, touroperators and guide
N � N N � N N � N N � N N � N
Transport N � N N � N N � N N � N N � NAccommodation N � N N � N N N 2 N N � N N � N
Food and beverage N � N � � N � � N � � N � � NSouvenirs N � N � � N � � N � � N � � N
Activities (including others 1) N � N � � � � � � � � � � � N
1 This includes not only Cultural services, Recreation, and other entertainment services, but also other services. 2
Day trips are not included for non-staying trips. 3 After is included in “for transit” of domestic tourism, “N” is set inthis table.
The tourism statistics data “Internal and national tourism consumption, by timing of purchaseand products” provided by the JTA [24] distinguish foreign visitors visiting Japan (referred to asinbound tourism in this study), domestic tourism, which includes also the travels within Japan offoreign visitors (e.g., flight connection), and finally Japanese nationals/Japan foreign residents overseastravel (referred to in this study as outbound tourism).
The items evaluated in this study are displayed as “�” in Table 1, and those that are not includedare displayed as “Not applicable”. These data were provided by JPY (1$ = 113 JPY (2017 Ave.)).
2.3. Calculation Method of CFP
As mentioned earlier in Section 2.1, this study calculates the CFP using the input–output approach.The calculation formula is shown below:
5∑
k=1
CFPk = di(I −A)−1 fi + DEi (i = 1, . . . , n) (2)
where di is the direct GHG emission intensity provided for each sector by the Inventory Database forEnvironmental Analysis version 2” (IDEAv.2), as developed by the National Institute of AdvancedIndustrial Science and Technology (AIST). A is the direct input coefficient matrix: We used the 2011waste input–output table (WIO) developed by Kondo et al. (2019) [25] to have a broad overview. I is anidentity matrix, (I-A) (−1) is the Leontief inverse matrix, and fi is the amount of activity obtained fromthe statistics of the JTA(2017), as detailed previously. It would be more effective to use data focusing
254

Sustainability 2020, 12, 2219
on the same year; however, the last waste input–output table available focuses only on 2011. DEi is thedirect emission from fuel combustion added to the calculation in order to cover the full cradle to graveaspects of products and services. Using this equation, the calculation was extended from cradle-to-gateto cradle-to-grave.
The tourism statistics data “Internal and National tourism consumption, by timing of purchaseand products” [24], regularly surveyed by JTA, is calculated and aggregated based on Tourism SatelliteAccounts (TSA). The items were aggregated to represent the total amount spent during or for travel,including amounts paid for souvenirs, for example. Here, travel is defined as “going away fromthe area of daily life regardless of the content of activities at destination” and is used synonymouslywith tourism. Business trips were included in the data; however, the organizer’s consumption/wasteamount and direct environmental impact at MICE events were not included. The data are providedfor 2017.
The statistical data are based on the Survey of Consumption Trends for Foreign Visitors toJapan [26] and the Survey of Travel and Tourism Consumption in Japan (Survey details and results areincluded in [24]).
Visitor data in the survey are foreign visitors to Japan who leave Japan, excluding transit passengers,crew members, and those staying for more than a year. The following three surveys were conducted.A national survey, which reveals the types of foreign visitors, travel content, and consumption contentthroughout Japan, a regional survey, which clarifies the type of foreign visitors, the content of travel,and the content of consumption for each visited place (prefecture), and a cruise survey, which clarifiesthe types of foreign visitors who obtained ship tourism-landing permission, as well as the contentof travel and consumption. The survey was conducted with a target of approximately 140,000 votesper year, and the investigator asked foreigners visiting the departure lobby at the airport and seaportto be surveyed to cooperate. Therefore, the survey was conducted using a tablet terminal or a paperquestionnaire while listening.
Domestic traveler’s data measure the number of tourism trips and tourism consumption ofdomestic tourism and outbound tourism in 2017 by JTA. According to the result report, the surveytarget is residents in Japan. It targets about 25,000 people extracted based on the basic ledger. As for thesurvey method, JTA distributed questionnaires to the survey subjects. The reporter (the person beingsurveyed) or a proxy fills out the questionnaire and returns it. It is the tourist consumption amountestimated and totaled by multiplying the number of trips by the linear estimation multiplication factorfrom the answer result.
As shown in Table 2, it can be seen that spending for “Accommodation services” and “Foodand beverage serving services” is important, and for “Passenger transport services”, the amount ofspending is higher for planes (sum of domestic and international flights) and Shinkansen (Japanesebullet train).
Table 2. The amount of consumption for items subject to evaluation. The input–output table (I/O)classification codes corresponding to each Tourism Satellite Accounts (TSA) inventory item wereapplied. See Appendix A, Tables A2 and A3 for details.
Category of Products and ServicesInboundTourism
Domestic TourismDomesticTourism
DomesticTourism Outbound
Tourism
Total(B-JPY)
Rate (%)Overnight Stay Day Trip Transit
Travel agencies, tour operators, and guides 22 225 33 159 27 466 1.6%Transport 748 5320 2128 852 1041 10,090 33.6%Accommodation 1077 4148 0 18 883 6125 20.4%Food and beverage 766 2077 646 26 400 3914 13.0%Souvenirs 1418 3587 1583 250 397 7234 24.1%Activities 115 1151 641 128 150 2185 7.3%
Total(Billion-JPY) 4146 16,508 5031 1432 2897 30,015 100.0%
Rate(%) 13.8% 55.0% 16.8% 4.8% 9.7% 100% -
255

Sustainability 2020, 12, 2219
Table 2 and Appendix A, Table A2 detail the spending (top 3) of consumable items for each traveltype. In the case of inbound tourism, the largest spending is represented by accommodation andfood and beverage expenses, followed by medicines and cosmetics. Domestic sightseeing (overnightstay): Accommodation, food and drinks, and Shinkansen expenses are the largest expenses. Domesticsightseeing (day trip): Eating and drinking, Shinkansen, and gasoline costs are the largest expenditures.For domestic tourism (for transit), flight expenses (international flights) are the highest spendingamounts in most cases. Finally, for outbound tourism, accommodation, flight (international flights),and food and beverages are the greatest amounts.
In this article, each product/service item is associated with an input–output table (I/O) classificationcode. Some major items such as “Travel agencies, tour operators, and tourist guide services” do notinclude detailed sub-items but still correspond to I/O classification codes. See Appendix A, Table A2for each inventory item and I/O classification correspondence.
3. Results
3.1. CFP of Tourism
The CFP was calculated as shown below (Figure 1) and was found to be 136 million t-CO2eq. Thecontribution ratio of each stage is as follows: transport 56.3%, souvenirs 23.2%, petrol (direct emissions)16.9%, accommodation 9.8%, food and beverage 7.5%, and activities 3.0%.
Then, in the breakdown, the impact was in the following order: air transport 24.7%, accommodation9.8%, food and beverage 7.5%, petrol 6.1%, textile products 5.3%, food items 4.9%, confectionery 4.8%,rail transport 3.9%, cosmetics 1.9%, and footwear 1.8%.
Table 3 shows a summary of the top contributors of each travel type, ranking the items in GHGemissions. The top five rankings for inbound tourism are as follows: air transport, accommodation,cosmetics, food and beverage, and food items. For overnight stays of domestic tourism, they are asfollows: petrol (direct emissions), air transport, accommodation, food and beverage, and petrol. Forday trips of domestic tourism, they are as follows: petrol (direct emissions), petrol, food items, food andbeverage, and confectionery. For transit overseas of domestic tourism, they are as follows: air transport,textile products, footwear, petrol (direct emissions), and confectionery. For outbound tourism, they areas follows: air transport, accommodation, food and beverage, textile products, and confectionery.
Table 3. A summary of the top contributors of each travel type, ranking the items in terms of GHGemissions. From the results in Figures 2–6., the top five highest contributions in each stage are displayed.
Inbound TourismDomestic Tourism Domestic Tourism Domestic Tourism
Outbound TourismOvernight Stay Day Trip Transit
1 Air transport Petrol(direct emissions)
Petrol(direct emissions) Air transport Air transport
2 Accommodation Air transport Petrol Textile products Accommodation3 Cosmetics Accommodation Food items Footwear Food and beverage
4 Food and beverage Food and beverage Food and beverage Petrol(direct emissions) Textile products
5 Food items Petrol Confectionery Confectionery Confectionery
256

Sustainability 2020, 12, 2219
Tota
l GH
G E
mis
sion
s
136m
illio
n t-C
O2e
q
Air
,
24.7
%
Petr
ol(d
irec
t),
16.9
%
Tran
spor
t
56.3
%
Rai
l,
3.9%
Petr
ol,
6.1%
Souv
enir
s
23.2
%
Fig
ure
1.
Brea
kdow
nof
the
carb
onfo
otpr
int(
CFP
)by
each
life
cycl
est
age.
The
abov
efig
ure
show
sth
egr
eenh
ouse
gas
(GH
G)e
mis
sion
san
dsh
ows
the
cont
ribu
tion
ofth
eim
pact
inea
chlif
est
age.
Tabl
eA
4sh
ows
the
CFP
calc
ulat
ion
resu
lts
for
the
item
sof
each
prod
ucts
ervi
ce.
257

Sustainability 2020, 12, 2219
Air transportationAir transportation
Accommodation services
Accommodation services
Food- and beverage serving services
Food- and beverage serving services
Cosmetics, toothpaste Cosmetics, toothpaste
Others Others
0%
20%
40%
60%
80%
100%
Tourists Consumption GHG emissions
Comparison of Tourist Consumption and GHG emissions in Inbound tourism
Air transportation Petroleum products ( include direct emissions)Accommodation services Food- and beverage serving servicesOther textile industrial products Other food itemsConfectionery Railway passenger transportCosmetics, toothpaste Rubber and plastic footwearbus Other manufactured industrial productsMarine and inland water transportation Road freight transportation (except for self transportation)
Figure 2. Comparison of traveler’s consumption and the GHG emissions of inbound tourism.
Air transportationAir transportation
Petroleum products ( include direct emissions)
Accommodation services
Accommodation services
Food- and beverage serving services
Food- and beverage serving services
Railway passenger transport
Others
Others
0%
20%
40%
60%
80%
100%
Tourists Consumption GHG emissions
Comparison of Tourist Consumption and GHG emissions in domestic tourism(overnight stay)
Air transportation Petroleum products ( include direct emissions)Accommodation services Food- and beverage serving servicesOther textile industrial products Other food itemsConfectionery Railway passenger transportCosmetics, toothpaste Rubber and plastic footwearbus Other manufactured industrial productsMarine and inland water transportation Road freight transportation (except for self transportation)Others
Figure 3. Comparison of traveler’s consumption and the GHG emissions of domestic tourism(overnight stay).
258

Sustainability 2020, 12, 2219
Petroleum products ( include direct emissions)
Food- and beverage serving services
Food- and beverage serving services
Other textile industrial products
Other food items
Other food items
Confectionery
Confectionery
Railway passenger transport
Others
Others
0%
20%
40%
60%
80%
100%
Tourists Consumption GHG emissions
Comparison of Tourist Consumption and GHG emissions in Domestic tourism (day trip)
Air transportation Petroleum products ( include direct emissions)Accommodation services Food- and beverage serving servicesOther textile industrial products Other food itemsConfectionery Railway passenger transportCosmetics, toothpaste Rubber and plastic footwearbus Other manufactured industrial productsMarine and inland water transportation Road freight transportation (except for self transportation)Others
Figure 4. Comparison of traveler’s consumption and the GHG emissions of domestic tourism (day trip).
Air transportation
Air transportation
Others
Others
0%
20%
40%
60%
80%
100%
Tourists Consumption GHG emissions
Comparison of Tourist Consumption and GHG emissions in Domestic tourism(for Transit)
Air transportation Petroleum products ( include direct emissions)Accommodation services Food- and beverage serving servicesOther textile industrial products Other food itemsConfectionery Railway passenger transportCosmetics, toothpaste Rubber and plastic footwearbus Other manufactured industrial productsMarine and inland water transportation Road freight transportation (except for self transportation)Others
Figure 5. Comparison of traveler’s consumption and the GHG emissions of domestic tourism(for Transit).
259

Sustainability 2020, 12, 2219
Air transportation
Air transportation
Accommodation services
Accommodation servicesFood- and beverage serving services
Food- and beverage serving servicesOther textile industrial products
Other textile industrial products
Others Others
0%
20%
40%
60%
80%
100%
Tourists Consumption GHG emissions
Comparison of Tourist Consumption and GHG emissions in Outbound tourism
Air transportation Petroleum products ( include direct emissions)Accommodation services Food- and beverage serving servicesOther textile industrial products Other food itemsConfectionery Railway passenger transportCosmetics, toothpaste Rubber and plastic footwearbus Other manufactured industrial productsMarine and inland water transportation Road freight transportation (except for self transportation)Others
Figure 6. Comparison of traveler’s consumption and the GHG emissions of the outbound tourism stage.
From these results, the impact of transport is important, not only due to the transportation directlybut also due to the contribution from souvenirs, accommodation, and food and beverage.
The following sub-parts 3.2 to 3.4 show the detailed breakdown by stage.
3.2. Inbound Tourism
Figure 2 shows the comparison of travelers’ consumption and GHG emissions of the inboundtourism stage. Travelers spend a great deal on accommodation, food and beverage, and cosmetics, andthe GHG emissions show similar tendencies. It can also be seen that air transport has a higher impactthan others.
3.3. Domestic Tourism
3.3.1. Overnight Stay
Figure 3 shows the comparison of travelers’ consumption and GHG emissions of domestic tourism(overnight stay). Travelers spend a great deal on accommodation, food and beverage, and railwaytransport, and the GHG emissions share similar tendencies. Certainly, petroleum products (includedirect emissions) have a higher impact than others. Air transportation also has the fourth highestimpact in this stage.
3.3.2. Day Trip
Figure 4 shows the comparison of travelers’ consumption and GHG emissions of the domestictourism (day trip) stage. Travelers spend a lot on railway transport and food and beverage, and theGHG emissions show similar tendencies. Certainly, petroleum products (include direct emissions)have a higher impact than others.
260

Sustainability 2020, 12, 2219
3.3.3. For Transit Overseas
Figure 5 shows the comparison of travelers’ consumption and GHG emissions of domestic tourism(for Transit). Travelers spend a great deal on air transport, and the GHG emissions show a similartendency. Certainly, air transport has a higher impact than others. On the other hand, the ratio of railtransport is lower.
3.4. Outbound Tourism
Figure 6 shows the comparison of travelers’ consumption and the GHG emissions of the outboundstage. Travelers spend a great deal on air transport, and the GHG emissions have a similar tendency.Certainly, air transport has a higher impact than others. On the other hand, the ratio of rail transportis lower.
4. Discussion
4.1. Comparison with Existing Research
The GHG emissions of Japan in 2017, as announced by the Ministry of the Environment, were1292 million t-CO2eq [27]. Therefore, according to the results developed in this study, tourism in Japanaccounts for about 10.5% of the national CFP (Table 4).
Table 4. Comparison between the results of this study and the annual total CO2eq emissions in Japan.This article is based on the Japan Tourism Agency (JTA) statistical data [24] compiled from January toDecember, and the Ministry of the Environment’s published values [27] are compiled from April toMarch. A comparison was made for confirming the contribution from the tourism sector.
CaseGHG emission of Japan (Fixed
Report) in FY 2017This Case Result (Data of 2017)
Object The whole of Japan Tourism consumption of JapanAmount of emission
million t-CO2eq 1292 136
Ratio (%) 100 10.5
According to the estimation from the JTA [6], the tourism GDP in 2017 was 10.7 trillion yen whichis about 2.0% of Japan’s nominal GDP (545.1 trillion yen) (Table 5).
The tourism policy of the Japanese government is aimed at stimulating both inbound demandand domestic consumption; it can be estimated that the economic effects will increase further in thefuture [28]. Based on the results of this study and the following references, we should closely monitorthe relationship between economic activity and changes in GHG emissions.
Table 5. Comparison between Japan’s gross domestic product (GDP) and the tourism GDP (UnitedNations World Tourism Organization (UNWTO) standard).
Case GDP Japan Tourism Agency (JTA)
Object The whole of Japan (2017) Tourism consumption of Japan(2017)
Amount of GDP trillion-JPY 545.1 10.7Ratio (%) 100 2.0
Shimizu et al. (2014) [20] stated that, in the future, the tourism industry should actively considermeasures to reduce greenhouse gases, as one of the leading industries in the world. However, there areonly a few certification registrations in the CFP program [17] and Eco Mark [18,19] that are used to labelsystems for businesses in Japan. Lenzen et al. (2018) [12] noted that the majority of CFP is emitted bytravelers from high-income countries inside or outside their countries. Their results show about 8% ofglobal GHG emissions. In addition, the surge in tourism demand is becoming an urgent issue that farexceeds the decarbonization systems of tourism-related technologies. Figure 7 shows the relationship
261

Sustainability 2020, 12, 2219
between the GHG emissions and tourism consumption. The larger the vertical value, the higher theGHG emissions and therefore the higher the environmental impacts. The larger the horizontal value,the greater the tourism consumption and the higher the economic effects. Therefore, products andservices with low GHG emissions that are largely consumed by the tourism sector can be said to beproducts and services that contribute to both the environment and economy. For example, it could beconfirmed that accommodation and eating and drinking services have a lower environmental impactand better economic effects than air transportation. If focusing on transportation only, the economiceffects of air transportation and railway passenger transport are similar; however, it can be seen thatair transportation is superior in terms of the environmental burden. In addition, it can be seen thatsweets related to souvenirs, other foodstuffs, and other textile industry products certainly have a smallenvironmental impact but also a small economic effect.
Appendix A Figures A1–A6 show Figure 7 in detail. In each figure, the items for each productcategory are displayed in text. For example, Appendix A, Figure A5 shows text in the figure to indicateonly Souvenir items. Most items are above the linear approximation. Appendix A, Figure A6 showstext in the figure to indicate only Activity items. Many items are below the linear approximation.Thus, activities have less environmental impact than souvenirs and contribute to the economicimpact. However, the Accommodation in Figure 3 is only Accommodation services and Vacationhome ownership (imputed). No difference is shown here for the type of accommodation or set plan.Furthermore, the Food and beverage in Figure 4 has only one item and cannot show different typesof meals.
For this reason, in Japan, it is necessary to consider measures to reduce GHG emissions for eachproduct and service that compose tourism, such as accommodation, Food and beverage, and souvenirs,etc. In addition, it is necessary to educate the relevant operators to identify the environmental issuesand actively work on reducing GHG emissions. Finally, we believe that it is an urgent issue todevelop products and services that can be selected by travelers based on environmental labeling andother labeling systems. In recent years, the tourism trend has shifted from consumption of goods toexperiences. The study found that it is also beneficial to increase experiential consumption to aim for asustainable tourism style. After this, we plan to assess the environmental and economic impact ofindividual travel as a case study to see if this is sustainable tourism.
Filimonau et al. (2016) [11] expects that many of the LCA evaluation examples for tourismshown in the book can educate tourists to choose sustainable tourism. In Japan, there are only afew applications based on LCA methods (particularly process-based LCA) to evaluate the differentcomponents of tourism. In other countries, for example, the input–output LCA approach is used toevaluate the hotel industry by focusing not only on climate change but also on other environmentalimpacts (Appendix A, Table A1: Rosenblum et al. (2000)).
4.2. Limitations and Future Investigations
As an issue related to these results, it is necessary to expand the products and services thatconstitute tourism, from the viewpoint of evaluation with higher extensibility and comprehensiveness.In particular, this article does not include procurement, direct energy, waste, etc., of the MICEorganizers. In addition, as the results differ depending on the setting of the boundary range (ex:inbound tourism/domestic tourism, local consumption, etc.), examining how to use the results isalso necessary.
In the future, it is necessary to study the close link between the economic expansion and theseveral environmental impacts (climate change, land use, and water use, for example) of the differentproducts and services which are consumed in the tourism industry, not only air transportation but alsoother services, for example, accommodation and souvenirs. Moreover, not only a mid-range view isprofitable but also a long-term assessment to track the possible evolutions compared with the past.
262

Sustainability 2020, 12, 2219
y = 917.45x1.0809
R² = 0.7943
1.00E+07
1.00E+08
1.00E+09
1.00E+10
1.00E+11
1.00E+03 1.00E+04 1.00E+05 1.00E+06 1.00E+07
GH
G e
mis
sion
s [k
g-C
Oeq
]
Toursm consumptions [M-JPY]
Scatter plot (Total)Vertical axis GHG emissions horizontal axis Tourism consumptions
Figure 7. Scatter plot of the total GHG emissions and tourism consumption. Appendix A Figures A1–A6shows plots of details for each product and service (e.g., tour operators and guides, transport,accommodation, food and beverage, souvenirs, activities).
5. Conclusions
We have established a procedure to quantitatively view the Japanese tourism industry’s CFP.In this study, we calculated the CFP, and it was found to be 136 million t-CO2eq (Figure 1). Thecontribution ratio of each stage was as follows: Transport 56.3%, Souvenirs 23.2%, Accommodation9.8%, Food and Beverage 7.5%, Activities 3.0%. Then, in the breakdown, the impact had the followingorder: Air transport 24.7%, Petrol (direct emissions) 16.9%, Accommodation 9.8%, Food and Beverage7.5%, Petrol 6.1%, Textile products 5.3%, Food items 4.9%, Confectionery 4.8%, Rail transport 3.9%,Cosmetics 1.9%, and Footwear 1.8%.
From the results of this study, we have shown that tourism can generate GHG emissions thatcontribute to climate change and to the environmental burden. In addition, we showed the tendenciesof the characteristics of tourism and tourist consumption. The breakdown regards the use of airtransportation and accommodation services, which are indispensable for transportation and stay, andalso the contribution of food services, souvenirs, and confectionery. Through considering differenttypes of movements (domestic and global), we were able to confirm a high contribution from thepurchase and consumption of pharmaceuticals, cosmetics, shoes, and bags.
In addition, if the tourism industry is prosperous, despite a great economic effect advantage, thereis a drawback, as the environmental burden increases. It is then important for travelers to be able toselect products and services with a lower environmental impact.
In this study, priority was given to showing the whole of CFP in tourism and finding significantcontributions other than transportation. We need to know about low-carbon consumption of productsand services and changes in consumption styles over the medium to long term and consider alternativesto reduce significant contributions. However, it is necessary to thoroughly examine and discuss whetherchanges in travel styles will contribute to GHG reduction. It is also necessary to conduct evaluationstudies on whether new travel styles contribute to sustainable tourism from the perspectives of theenvironment, economy, and society, including CFP evaluation.
263

Sustainability 2020, 12, 2219
Author Contributions: Conceptualization, Y.K. and N.I.; methodology, Y.I. and N.I.; writing—original draftpreparation, Y.K. and S.K.; supervision, N.I. All authors have read and agreed to the published version ofthe manuscript.
Funding: This research received no external funding.
Acknowledgments: We would like to express our gratitude to Haruo Suzuki for his generous support forour study.
Conflicts of Interest: The authors declare no conflict of interest.
Appendix A
Table A1. Existing case study and paper. The following table was added by the author based on V.Filimonau et al. 2016 [11].
Study Object of Analysis Primary environmental Impacts Assessed Geographical Scope
Process-based LCA
Castellani and Sala (2012) [29] Holiday travel,Including accommodation
A range of impacts Italy
Filimonau et al. (2011a) [30]
Climate change
UK
Filimonau et al. (2014) [31] UK and France
El Hanandeh (2013) [32] Religious travel,Including accommodation Saudi Arabia
Pereira et al. (2015) [33] Holiday travel,Excluding accommodation Brazil
Filimonau et al. (2013) [34] Holiday package UK and Portugal
Kuo et al. (2005) [35] Tourist catering
A range of impacts
Taiwan
Michailidou et al. (2015) [36]
Tourist accommodation
Greece
König et al. (2007) [37] Portugal
Sára et al. (2004) [38]ItalyDe Camillis et al. (2008) [39]
Cerutti et al. (2014) [40]
Filimonau et al. (2011b) [41]Climate change
UK
Rosselló-Batle et al. (2010) [42] Spain
Li et al. (2010) [43] China
Input–output LCA
Scheepens et al. (2015) [44] Sector of regional tourism
Climate change
The Netherlands
Berners-Lee et al. (2011) [45] Large tourism business UK
Patterson and McDonald (2004) [46]National tourism industry
New Zealand
Cadarso et al. (2015) [47] Spain
Zhong et al. (2015) [48]China
Qin et al. (2015) [49] Tourist destination
Manfred Lenzen (2018) [12] Global tourism 160 countries
Rosenblum et al. (2000) [50] National hotel industry A range of impacts USA
264

Sustainability 2020, 12, 2219
Table A2. Internal and national tourism consumption, by timing of purchase and products (CY2017,Unit: Billion JPY).
Products InboundDomestic
Outbound TotalOvernight Stay Day Trip TRANSIT
Travel agencies, operators, and guidesTravel agencies, tour operators, and tourist
guide services 22 225 33 159 27 466
TransportAirplane (domestic, local) 19 1244 143 32 127 1565Airplane (international flight) 326 0 0 726 713 1765Bullet train 292 1443 595 22 0 2353Railways (excluding bullet train) 0 453 255 22 72 802Bus 0 248 178 13 118 558Taxi 61 112 33 5 0 212Ships (inner service, local) 6 97 10 0 11 125Ships (outbound) 1 0 0 4 0 5Car rental fee 43 256 45 0 0 345Gasoline cost 0 672 424 7 0 1,103Parking lot, toll road charge (except for
highway charge) 0 175 104 13 0 291
Highway charge 0 618 341 8 0 967Accommodation
Accommodation services 1077 3,697 0 18 883 5674Vacation home ownership (imputed) 0 451 0 0 0 451
Food and beverageFood and beverage serving services 766 2077 646 26 400 3914
SouvenirsAgricultural products 0 97 82 0 0 179Agricultural processed products 0 65 38 0 0 103Marine products 0 93 42 0 0 135Fisheries processed products 0 105 48 0 0 153Confectionery 137 1022 419 33 150 1762Other food items 163 691 333 21 0 1208Fiber products 35 652 232 63 109 1091Shoes, bags 257 285 111 56 101 810Ceramics and glass products 0 33 9 0 0 42Publication 18 50 24 9 0 101Wood products and paper products 0 23 18 0 0 42Medical supplies and Cosmetics 549 89 20 19 29 705Film 0 5 1 1 0 7Electrical equipment and related products 107 71 25 21 8 231Camera, glasses, watch 80 101 25 22 0 229Sports equipment · CD · stationery 0 124 109 5 0 238Other manufactured products 72 80 48 0 0 199
ActivitiesA day spa·warm-bathing facility·beauty salon 0 83 39 0 0 121Museums, museums, zoos and gardens,
aquariums 26 105 47 0 0 178
Watching sports and Art appreciation 9 82 93 0 44 228Amusement parks and expositions 47 232 151 0 55 486Sports Facilities 0 53 80 0 0 132Ski lift fee 0 27 13 0 0 40Camp site 0 0 1 0 0 1Exhibition and convention participation fee 0 16 16 0 0 31Tourist farm 0 7 8 0 0 16Fishing boat 0 20 14 0 0 33Guide fee 0 20 12 0 0 32Rental charge 10 64 12 13 0 97Massage 0 32 3 0 0 35Photo shoot fee 0 10 4 0 0 15Mail and communication charges 0 11 2 1 2 17Home delivery 0 80 10 6 9 105Travel insurance · Credit card admission fee 0 27 3 32 0 61Passport application fee 0 0 0 41 0 41Visa application fee 0 0 0 0 7 7Hairdresser/Barber 0 155 64 11 0 229Develop and print photos 0 31 14 5 0 49Laundry service 0 38 13 3 0 53Other 22 61 43 17 33 176
Total 4146 16,508 5031 1432 2897 30,015
265

Sustainability 2020, 12, 2219
Table A3. Sector row code table of the input–output table items by sector, as applied in this study.
ProductsInput–Output Table (I/O) Items
Row Code Sector
Travel agencies, operators, and guidesTravel agencies, tour operators, and tourist guide
services 5789090 Travel and other transportation incidental services
TransportAirplane (domestic, local) 5751010 Air transportationAirplane (international flight) 5751010 Air transportationBullet train 5711010 Railway passenger transportRailways (excluding bullet train) 5711010 Railway passenger transportBus 5721010 BusTaxi 5721020 TaxiShips (inner service, local) 5742010 Marine and inland water transportationShips (outbound) 5741010 Ocean transportationCar rental fee 6612010 Car rental businessGasoline cost 2111010 Petroleum productsParking lot, toll road charge (except for highway
charge) 5789010 Road transport facility provided
Highway charge 5789010 Road transport facility providedAccommodation
Accommodation services 6711010 Accommodation servicesVacation home ownership (imputed) 5531010 Vacation home ownership (imputed)
Food and beverageFood and beverage serving services 6721010 Food- and beverage serving services
SouvenirsAgricultural products 116090 Other non-food cropsAgricultural processed products 1116020 Agro-preserved food products (except bottles and cans)Marine products 172001 Inland fishery and aquacultureFisheries processed products 1113090 Other seafoodConfectionery 1115-030 ConfectioneryOther food items 1119090 Other food itemsFiber products 1519090 Other textile industrial productsShoes, bags 2229-010 Rubber and plastic footwearCeramics and glass products 2312020 Bags, bags and other leather productsPublication 5951030 PublicationWood products and paper products 1649090 Other pulp, paper and paper productsMedical supplies and Cosmetics 2081020 Cosmetics, toothpasteFilm 2083010 Photosensitive materialElectrical equipment and related products 3321020 Consumer electrical appliances (except air conditioners)Camera, glasses, watch 3919090 Other manufactured industrial productsSports equipment · CD · stationery 3919090 Other manufactured industrial productsOther manufactured products 3919090 Other manufactured industrial products
ActivitiesA day spa·warm-bathing facility·beauty salon 6731040 BathingMuseums, museums, zoos and gardens, aquariums 6312010 Social education (public)
Watching sports and Art appreciation 6741020 Office space (except movie theaters) and entertainmentcompanies
Amusement parks and expositions 6741020 Office space (except movie theaters) and entertainmentcompanies
Sports Facilities 6741040 Sports facility offer work, park, amusement parkSki lift fee 5711010 Railway passenger transportCamp site 6741040 Sports facility offer work, park, amusement parkExhibition and convention participation fee 6699090 Other business servicesTourist farm 131020 Agricultural services (except for veterinary services)Fishing boat 6741090 Other entertainmentGuide fee 6799090 Other personal servicesRental charge 6611010 Goods rental business (excluding rental cars)Massage 6411050 Medical (other medical services)Photo shoot fee 6799010 PhotographyMail and communication charges 5791010 Postal and letter mailHome delivery 5722010 Road freight transportation (except for self-transportation)Travel insurance · Credit card admission fee 5312010 Life insurancePassport application fee 6112010 Government (local)Visa application fee 6112010 Government (local)Hairdresser/Barber 6731030 Beauty industryDevelop and print photos 6799090 Other personal servicesLaundry service 6731010 laundry serviceOther 6799090 Other personal services
266

Sustainability 2020, 12, 2219
Table A4. CFP calculation result of I/O items of each product service in this study (Unit: kg-CO2eq).
I/O Items InboundDomestic
Outbound TotalOvernight Stay Day Trip TRANSIT
Transport 4.37E+09 3.84E+10 1.63E+10 8.02E+09 9.21E+09 7.64E+10Air transportation 3.48E+09 1.25E+10 1.44E+09 7.64E+09 8.47E+09 3.36E+10Petroleum products 0.00E+00 5.07E+09 3.20E+09 5.10E+07 0.00E+00 8.33E+09Railway passenger transport 4.80E+08 3.16E+09 1.42E+09 7.27E+07 1.19E+08 5.25E+09Bus 0.00E+00 1.03E+09 7.42E+08 5.45E+07 4.91E+08 2.32E+09Marine and inland water transportation 7.47E+07 1.20E+09 1.27E+08 4.75E+06 1.32E+08 1.53E+09Road transport facility provided 0.00E+00 7.13E+08 3.99E+08 1.86E+07 0.00E+00 1.13E+09Taxi 2.99E+08 5.55E+08 1.64E+08 2.55E+07 0.00E+00 1.04E+09Car rental business 3.38E+07 2.02E+08 3.56E+07 0.00E+00 0.00E+00 2.71E+08Ocean transportation 1.98E+06 0.00E+00 0.00E+00 1.00E+07 0.00E+00 1.20E+07Petroleum products (direct emissions) 0.00E+00 1.40E+10 8.80E+09 1.45E+08 0.00E+00 2.29E+10
Souvenirs 5.39E+09 1.62E+10 7.00E+09 1.09E+09 1.71E+09 3.14E+10Other textile industrial products 2.29E+08 4.29E+09 1.53E+09 4.17E+08 7.17E+08 7.18E+09Other food items 9.01E+08 3.83E+09 1.84E+09 1.18E+08 0.00E+00 6.69E+09Confectionery 5.03E+08 3.75E+09 1.53E+09 1.22E+08 5.50E+08 6.46E+09Cosmetics, toothpaste 2.02E+09 3.30E+08 7.25E+07 6.88E+07 1.07E+08 2.60E+09Rubber and plastic footwear 7.83E+08 8.68E+08 3.38E+08 1.70E+08 3.07E+08 2.47E+09Other manufactured industrial products 4.97E+08 9.97E+08 5.92E+08 8.81E+07 0.00E+00 2.17E+09Consumer electrical appliances (except air
conditioners) 3.87E+08 2.56E+08 8.84E+07 7.48E+07 2.76E+07 8.34E+08
Inland fishery and aquaculture 0.00E+00 5.64E+08 2.55E+08 0.00E+00 0.00E+00 8.19E+08Other seafood 0.00E+00 5.27E+08 2.42E+08 0.00E+00 0.00E+00 7.69E+08Other non-food crops 0.00E+00 2.04E+08 1.72E+08 0.00E+00 0.00E+00 3.76E+08Publication 6.33E+07 1.72E+08 8.16E+07 2.97E+07 0.00E+00 3.46E+08Agro-preserved food products (except bottles
and cans) 0.00E+00 2.03E+08 1.19E+08 0.00E+00 0.00E+00 3.22E+08
Other pulp, paper and paper products 0.00E+00 1.31E+08 1.03E+08 0.00E+00 0.00E+00 2.33E+08Bags, bags and other leather products 0.00E+00 9.59E+07 2.73E+07 0.00E+00 0.00E+00 1.23E+08Photosensitive material 0.00E+00 3.12E+07 7.51E+06 4.90E+06 0.00E+00 4.36E+07
Accommodation 2.51E+09 8.73E+09 0.00E+00 4.13E+07 2.06E+09 1.33E+10Accommodation services 2.51E+09 8.62E+09 0.00E+00 4.13E+07 2.06E+09 1.32E+10Vacation home ownership (imputed) 0.00E+00 1.07E+08 0.00E+00 0.00E+00 0.00E+00 1.07E+08
Food and Beverage 1.98E+09 5.37E+09 1.67E+09 6.61E+07 1.03E+09 1.01E+10Food- and beverage serving services 1.98E+09 5.37E+09 1.67E+09 6.61E+07 1.03E+09 1.01E+10
Cultural, Recreation, Entertainment, etc. 1.43E+08 2.56E+09 9.74E+08 1.86E+08 2.63E+08 4.13E+09Road freight transportation (except for
self-transportation) 0.00E+00 1.11E+09 1.33E+08 8.70E+07 1.27E+08 1.46E+09
Office space (except movie theaters) andentertainment companies 5.67E+07 3.17E+08 2.47E+08 0.00E+00 1.00E+08 7.21E+08
Bathing 0.00E+00 3.14E+08 1.48E+08 0.00E+00 0.00E+00 4.62E+08Social education (public) 6.06E+07 2.40E+08 1.08E+08 0.00E+00 0.00E+00 4.09E+08Beauty industry 0.00E+00 1.47E+08 6.05E+07 1.04E+07 0.00E+00 2.18E+08Other personal services 1.83E+07 9.18E+07 5.69E+07 1.77E+07 2.71E+07 2.12E+08Sports facility offer work, park, amusement
park 0.00E+00 7.05E+07 1.07E+08 0.00E+00 0.00E+00 1.78E+08
laundry service 0.00E+00 6.52E+07 2.34E+07 4.41E+06 0.00E+00 9.30E+07Goods rental business (excluding rental cars) 7.67E+06 4.95E+07 9.01E+06 9.83E+06 0.00E+00 7.60E+07Agricultural services (except for veterinary
services) 0.00E+00 3.37E+07 3.84E+07 0.00E+00 0.00E+00 7.21E+07
Other entertainment 0.00E+00 2.84E+07 1.97E+07 0.00E+00 0.00E+00 4.81E+07Life insurance 0.00E+00 1.81E+07 1.79E+06 2.14E+07 0.00E+00 4.13E+07Government (local) 0.00E+00 0.00E+00 0.00E+00 3.37E+07 5.33E+06 3.91E+07Medical (other medical services) 0.00E+00 3.39E+07 2.91E+06 0.00E+00 0.00E+00 3.68E+07Postal and letter mail 0.00E+00 1.60E+07 3.65E+06 1.78E+06 3.49E+06 2.49E+07Other business services 0.00E+00 9.82E+06 9.72E+06 0.00E+00 0.00E+00 1.95E+07Photography 0.00E+00 1.13E+07 4.90E+06 0.00E+00 0.00E+00 1.62E+07
Travel agencies, tour operators and guide 1.54E+07 1.54E+08 2.29E+07 1.09E+08 1.88E+07 3.21E+08Travel and other transportation incidental
services 1.54E+07 1.54E+08 2.29E+07 1.09E+08 1.88E+07 3.21E+08
Total 1.44E+10 7.15E+10 2.60E+10 9.52E+09 1.43E+10 1.36E+11
267

Sustainability 2020, 12, 2219
Figure A1. Scatter plot by product category (details of Figure 7 Scatter plot of the total GHG emissionsand tourism consumption). The text in the figure indicates only the Tour operator and guide items.
Figure A2. Scatter plot by product category (details of Figure 7 Scatter plot of the total GHG emissionsand tourism consumption). The text in the figure indicates only the Transport items.
268

Sustainability 2020, 12, 2219
Figure A3. Scatter plot by product category (details of Figure 7 Scatter plot of the total GHG emissionsand tourism consumption). The text in the figure indicates only the Accommodation items.
Figure A4. Scatter plot by product category (details of Figure 7 Scatter plot of the total GHG emissionsand tourism consumption). The text in the figure indicates only the Food and Beverage items.
269

Sustainability 2020, 12, 2219
Figure A5. Scatter plot by product category (details of Figure 7 Scatter plot of the total GHG emissionsand tourism consumption). The text in the figure indicates only the Souvenir items.
Figure A6. Scatter plot by product category (details of Figure 7 Scatter plot of the total GHG emissionsand tourism consumption). The text in the figure indicates only the Activities items.
270

Sustainability 2020, 12, 2219
References
1. Japan Tourism Agency (JTA). Promotion of Attracting and Holding MICE. Available online: http://www.mlit.go.jp/kankocho/shisaku/kokusai/mice.html (accessed on 13 August 2019).
2. United Nations World Tourism Organization (UNWTO). Definition. Available online: https://unwto-ap.org/why/tourism-definition/ (accessed on 13 August 2019).
3. 2017 International Year of Sustainable Tourism for Development. Available online: http://www.tourism4development2017.org/about/ (accessed on 14 August 2019).
4. United Nations World Tourism Organization (UNWTO). Sustainable Tourism for DevelopmentGuidebook–Enhancing capacities for Sustainable Tourism for Development in Developing Countries; UNWTO:Madrid, Spain, 2013.
5. Ministry of Land, Infrastructure, Transport and Tourism (Japan). Survey on Tourism and Environment. 2008.Available online: https://www.mlit.go.jp/common/000059329.pdf (accessed on 14 August 2019).
6. Japan Tourism Agency. The Japan Tourism White Paper (2017). (Announcement 12 June 2019). Availableonline: http://www.mlit.go.jp/common/001237338.pdf (accessed on 14 August 2019).
7. Martín Martín, J.M.; Guaita Martínez, J.M.; Salinas Fernández, J.A. An analysis of the factors behind thecitizen’s attitude of rejection towards tourism in a context of overtourism and economic dependence on thisactivity. Sustainability 2018, 10, 2851. [CrossRef]
8. Martin, J.M.M.; Martinez, J.M.G. Entrepreneurs’ attitudes toward seasonality in the tourism sector. Int. J.Entrep. Behav. Res. 2019. [CrossRef]
9. Martínez, J.M.G.; Martín, J.M.M.; Fernández, J.A.S.; Mogorrón-Guerrero, H. An analysis of the stability ofrural tourism as a desired condition for sustainable tourism. J. Bus. Res. 2019, 100, 165–174. [CrossRef]
10. Martinez, J.M.G.; Martín, J.M.M.; Fernández, J.A.S. Innovation in the Measurement of TourismCompetitiveness. In Analyzing the Relationship Between Innovation, Value Creation, and Entrepreneurship;IGI Global: Valencia, Spain, 2020; pp. 268–288.
11. Filimonau, V. Life Cycle Assessment (LCA) and Life Cycle Analysis in Tourism; Springer International Publishing:Cham, Switzerland, 2016.
12. Lenzen, M.; Sun, Y.; Faturay, F.; Ting, Y.; Geschke, A.; Malik, A. The carbon footprint of global tourism.Nat. Climate Chang. 2018, 8, 522–528. [CrossRef]
13. New Tourism Study Group of The Institute of Life Cycle Assessment, Japan. Available online: https://www.ilcaj.org/lcahp/kenkyukai-2.php (accessed on 14 August 2019).
14. Ito, Y.; Morimoto, R.; Shibahara, N.; Kato, H. CO2 Emission Factor of Transport Systems for Carbon Footprintin Tourism. In Proceedings of the 6th Meeting of the Institute of Life Cycle Assessment, Sendai, Japan, 2March 2011; pp. 32–33.
15. Tamari, Y.; Morimoto, R.; Inaba, A. The Estimation Method of CO2 Emission for Hotel Accommodation inthe Tourism. In Proceedings of the 6th Meeting of the Institute of Life Cycle Assessment, Sendai, Japan,2 March 2011; pp. 36–37.
16. Kazama, R.; Morimoto, R.; Inaba, A. The Estimation Method of CO2 Emission for Meal in the Tourism.In Proceedings of the 6th Meeting of the Institute of Life Cycle Assessment, Sendai, Japan, 2 March 2011;pp. 38–39.
17. Japan Environmental Management Association for Industry. Certified Carbon Footprint Communication ProgramCFP-PCR:PA-DO-01; Japan Environmental Management Association for Industry: Tokyo, Japan, 2014.
18. Japan Environment Association Eco Mark Office. Product Certification Standards “Service”: Hotel/Ryokan(Ver.2.0); Japan Environment Association Eco Mark Office: Tokyo, Japan, 2019.
19. Japan Environment Association Eco Mark Office. Product Certification Standards “Service”: Restaurant (Ver.1.0);Japan Environment Association Eco Mark Office: Tokyo, Japan, 2017.
20. Shimizu, T.; In, S. Estimation of CO2 Emission Volume by Japanese and Korean Tourism Industries. Int. J.Tour. Sci. 2015, 8, 71–79.
21. International Standard, ISO 14044: 2006(E). Environmental Management—Life Cycle Assessment–Requirementsand Guidelines, 1st ed.; ISO: Geneva, Switzerland, 2006.
22. Leontief, W.W. Input–Output Economics, 2nd ed.; Oxford University Press: New York, NY, USA, 1986.23. Hondo, H. Application of input–output table in LCA. J. Econ. Struct. 2008, 16, 5–15.
271

Sustainability 2020, 12, 2219
24. Japan Tourism Agency (JTA). Research study on economic impacts of tourism in Japan (2017 Edition).2019. Available online: http://www.mlit.go.jp/kankocho/siryou/toukei/shouhidoukou.html#cp3 (accessed on14 August 2019).
25. Kondo, Y. Estimation of 2011 Waste Input–output Table for Japan. J. Life Cycle Assess. Jpn. 2019, 15, 33–41.[CrossRef]
26. Japan Tourism Agency (JTA). Survey of Consumption Trends for Foreign Visitors to Japan (Part 3) (2017Edition). 2018. Available online: http://www.mlit.go.jp/kankocho/siryou/toukei/syouhityousa.html (accessedon 14 August 2019).
27. Ministry of the Environment Government of Japan. Calculation Results of Greenhouse Gas Emissions 2016.Available online: https://www.env.go.jp/earth/ondanka/ghg-mrv/emissions/results-h28.html (accessed on14 August 2019).
28. Japan Tourism Agency (JTA). Press/interview (Announcement 30 March 2016). Available online:https://www.mlit.go.jp/kankocho/news08_000281.html (accessed on 14 August 2019).
29. Castellani, V.; Sala, S. Ecological Footprint and Life Cycle Assessment in the sustainability assessment oftourism activities. Ecol. Indic. 2012, 16, 135–147. [CrossRef]
30. Filimonau, V.; Dickinson, J.; Robbins, D.; Reddy, M.V. A critical review of methods for tourism climate changeappraisal: Life cycle assessment as a new approach. J. Sustain. Tour. 2011, 19, 301–324. [CrossRef]
31. Filimonau, V.; Dickinson, J.; Robbins, D. The carbon impact of short-haul tourism: A case study of UK travelto Southern France using life cycle analysis. J. Clean. Prod. 2014, 64, 628–638. [CrossRef]
32. El Hanandeh, A. Quantifying the carbon footprint of religious tourism: The case of Hajj. J. Clean. Prod. 2013,52, 53–60. [CrossRef]
33. Pereira, R.P.T.; Glaydston, M.B.; Filimonau, V. The carbon implications of local visitor travel in Brazil: A caseof the Rio de Janeiro and São Paolo itinerary. J. Clean. Prod. 2017, 141, 256–266. [CrossRef]
34. Filimonau, V.; Dickinson, J.; Robbins, D.; Reddy, M.V. The role of ‘indirect’ greenhouse gas emissions intourism: Assessing the hidden carbon impacts from a holiday package tour. Transp. Res. Part A 2013, 54,78–91. [CrossRef]
35. Kuo, N.W.; Hsiao, T.Y.; Lan, C.F. Tourism management and industrial ecology: A case study of food servicein Taiwan. Tour. Manag. 2005, 26, 503–508. [CrossRef]
36. Michailidou, A.V.; Vlachokostas, C.; Maleka, D.; Feleke, E.; Moussiopoulos, N. Life cycle impact approachto promote sustainable tourism: A case study from Greek hotels. In Proceedings of the 14th InternationalConference on Environmental Science and Technology, Rhodes, Greece, 3–5 September 2015.
37. König, H.; Schmidberger, E.; de Cristofaro, L. Life cycle assessment of a tourism resort with renewablematerials and traditional techniques. Presented at the ‘Portugal SB07, Sustainable Construction,Materials and Practice—Challenge of the Industry for the New Millennium’ Conference, Lisbon, Portugal,12–14 September 2007.
38. Sára, B.; Raggi, A.; Petti, L.; Scimìa, E. Implementation of LCA to services: Case studies in the hospitalityindustry. In Proceedings of the 6th International Conference on EcoBalance, Tsukuba, Japan, 25–27 October2004.
39. De Camillis, C.; Petti, L.; Raggi, A. LCA: A key-tool for Sustainable Tourism? In Proceedings of the 8thInternational Conference on EcoBalance, Tokyo, Japan, 10–12 December 2008.
40. Cerutti, A.K.; Beccaro, G.L.; Bruun, S.; Donno, D.; Bonvegna, L.; Bounous, G. Assessment methods forsustainable tourism declarations: The case of holiday farms. J. Clean. Prod. 2016, 111, 511–519. [CrossRef]
41. Filimonau, V.; Dickinson, J.E.; Robbins, D.; Huijbregts, M.A.J. Reviewing the carbon footprint analysisof hotels: Life Cycle Energy Analysis (LCEA) as a holistic method for carbon impact appraisal of touristaccommodation. J. Clean. Prod. 2011, 19, 1917–1930. [CrossRef]
42. Rosselló-Batle, B.; Moiá, A.; Cladera, A.; Martínez, V. Energy use, CO2 emissions and waste throughout thelife cycle of a sample of hotels in the Balearic Islands’. Energy Build. 2010, 42, 547–558. [CrossRef]
43. Li, P.; Huang, J.H.; Mo, Y.F.; Yang, G.H. Carbon footprint calculation and analysis of accommodation servicesin four-star hotels of Kunming. Tour. Trib. 2010, 25, 27–34.
44. Scheepens, A.E.; Vogtländer, J.G.; Brezet, J.C. Two life cycle assessment (LCA) based methods to analyseand design complex (regional) circular economy systems. Case: Making water tourism more sustainable.J. Clean. Prod. 2016, 114, 257–268. [CrossRef]
272

Sustainability 2020, 12, 2219
45. Berners-Lee, M.; Howard, D.C.; Moss, J.; Kaivanto, K.; Scott, W.A. Greenhouse gas footprinting for smallbusinesses—The use of input–output data. Sci. Total Environ. 2011, 409, 883–891. [CrossRef]
46. Patterson, M.G.; McDonald, G. How Clean and Green is New Zealand Tourism? Lifecycle and Future EnvironmentalImpacts; Manaaki Whenua Press: Lincoln, New Zealand, 2004.
47. Cadarso, M.-Á.; Gómez, N.; López, L.-A.; Tobarra, M.-Á.; Zafrilla, J.-E. Quantifying Spanish tourism’s carbonfootprint: The contributions of residents and visitors: A longitudinal study. J. Sustain. Tour. 2015, 23, 922–946.[CrossRef]
48. Zhong, Y.; Shi, S.; Li, S.; Luo, F. Empirical research on construction of a measurement framework for tourismcarbon emission in China. Chin. J. Popul. Resour. Environ. 2015, 13, 240–249. [CrossRef]
49. Qin, Y.; Li, X.; Rong, P. Urban tourism carbon accounting based on improved EIO-LCA model: A case studyof Kaifeng City in Henan Province. Prog. Geogr. 2015, 34, 132–140.
50. Rosenblum, J.; Horvath, A.; Hendrickson, C. Environmental implications of service industries.Environ. Sci. Technol. 2000, 34, 4669–4676. [CrossRef]
© 2020 by the authors. Licensee MDPI, Basel, Switzerland. This article is an open accessarticle distributed under the terms and conditions of the Creative Commons Attribution(CC BY) license (http://creativecommons.org/licenses/by/4.0/).
273


MDPISt. Alban-Anlage 66
4052 BaselSwitzerland
Tel. +41 61 683 77 34Fax +41 61 302 89 18
www.mdpi.com
Sustainability Editorial OfficeE-mail: [email protected]
www.mdpi.com/journal/sustainability


MDPI St. Alban-Anlage 66 4052 Basel Switzerland
Tel: +41 61 683 77 34 Fax: +41 61 302 89 18
www.mdpi.com ISBN 978-3-0365-0889-4