Botz-4-sale: surviving organized DDoS attacks that mimic flash crowds
Upload
independentCategory
view
5download
0
RESEARCH PAPER
Surviving the Transformation: Social Quality in CentralAsia and the Caucuses
Pamela Abbott • Claire Wallace • Roger Sapsford
Published online: 13 February 2010� The Author(s) 2010. This article is published with open access at Springerlink.com
Abstract This paper develops a sociologically informed understanding of what influ-
ences the lives and life-choices of people living in Kazakhstan and Kyrgyzstan (Central
Asian Republics) and Armenia and Georgia (the Caucasus), four of the successor states of
the Soviet Union that suffered significant social and economic changes following the
collapse of the Union in 1991. The focus is on the nature of these societies for their
citizens; ultimately we are concerned to understand what makes a society liveable for all,
what type of society enables people to be generally satisfied with their lives. To do this we
use the Social Quality model to derive indicators from which to model what makes for a
liveable or at least tolerable society. The model is validated by reference to subjective
satisfaction—how people feel about life in general—as the ultimate outcome indicator of
individual well-being. The data we use were collected as part of a broader study of living
conditions, lifestyles and health in eight of the successor states of the Soviet Union, the
Confederation of Independent States (CIS).
Keywords Central Asia and Caucuses � Social quality � Transformation �Satisfaction � Agency and structure
1 Introduction
Research to date on subjective satisfaction in Europe and Eurasia has focused mainly on
the European Union, including the former communist countries of Central and Eastern
Europe that have now joined the EU. With the notable exception of the Russian Federation
much less attention has been paid to the former Soviet Union (FSU) and virtually none to
the Central Asia Republics and the countries of the Caucuses. However, the development
P. Abbott (&) � C. WallaceSchool of Social Sciences, University of Aberdeen, Aberdeen, UKe-mail: [email protected]
R. SapsfordNational University of Rwanda, Butare, Rwanda
123
J Happiness Stud (2011) 12:199–223DOI 10.1007/s10902-010-9187-9

trajectories of the countries of Eastern and Central Europe (CEE) have been very different
from those of the Commonwealth of Independent States. Most of the former had entered on
a ‘virtuous’ path of economic, political and civic development by the start of the twenty-
first century, with reported levels of subjective satisfaction improving (Abbott and Wallace
2009a, b, c; Easterlin 2009; Wallace and Haerpfer 2002). The length and depth of the
economic recession was much greater and recovery much slower in the successor states to
the Soviet Union and the future more uncertain. There has not been the same move towards
the establishment of regulated market economies, democratic government and the devel-
opment of civil society found in the countries of Eastern and Central Europe (Grun and
Klasen 2000; Haerpfer 2009).
It is now well established that the disintegration of the Soviet Union in 1991 has had a
negative impact on the health, wealth and well-being of the population. The social
transformation and structural change, backed and fuelled by economic collapse, led to a
breakdown of the normative structure and predictability of the social order—what Durk-
heim referred to as ‘anomie (Abbott and Beck 2003; Durkheim 1952; Galip 2009; Genov
1998; Krivosheyev 2004; Pridemore et al. 2007). Much of the research on the impact of the
post-1991 structural transformation on the well-being of the societies and the citizens of
the former USSR has focused on the Russian Federation and has demonstrated that the
changes have had a dramatically negative impact on the welfare of the societies and the
population (see e.g. Abbott 2007; Abbott and Sapsford 2006; Abbott and Wallace 2007,
2009a; Burawoy 1997, 2000, 2001; Burawoy et al. 2000; Shevchenko 2009; Rose 2009;
Wallace and Abbott 2009). However, much less is known about the impact of the trans-
formation on the life-satisfaction of those who have survived in other CIS countries,
including the Central Asian Republics and the Caucasus, although the very limited
research, mostly looking at the Central Asian Republics, suggests that there has been a
negative impact (Abbott 2002; Abbott and Wallace 2009a; Cockerham et al. 2004; De la
Sablonniere et al. 2009; Galip 2009; Kanji 2007; Namazie and Sandfrey 2002; Nazpary
2002; Richardson et al. 2008; Wallace and Abbott 2009). An index of well-being for
children, developed for 21 CEE and CIS countries (excluding the CEE countries that joined
the EU in 2003) and using a range of objective and subjective indicators, suggests that the
four countries considered here are below the regional average in this respect, with
Kazakhstan being marginally better than the other three countries (Richardson et al. 2008).
The data we use are about individuals, but the focus of the paper is on the nature of the
societies in which they live—what makes a society more or less tolerable, gives more or
less space for citizens to take control of their lives. Satisfaction is used as an indicator of
the good society—people will necessarily be dissatisfied with intolerable societies, and
even where people have come to terms with societies which are far from optimal, their
level of satisfaction is likely to be lower than in societies which give a better than tolerable
life-style. The focus of the paper is not individual satisfaction per se, however, but what it
is about societies that makes satisfaction possible.
2 Background
The ‘‘shock therapy’’ that resulted in system disintegration of the political and economic
structures in the FSU was unprecedented in modern times. It resulted not only in systems
disintegration but also in social disintegration, with people having to negotiate between old
familiar practices and the new realities which faced them in their daily lives. People
experienced the transformation as living in a permanent state of chaos/crisis (Nazpary
200 P. Abbott et al.
123
2002; Shevchenko 2009) with no known outcome. The transformation involved four
interdependent processes:
• the construction of new state formations and related institutions;
• a shift from planned and administered co-ordination of markets to economic markets
and private property;
• the move from the hegemony of the Communist Party to authoritarian regimes; and
• a realignment of states in the arena of international relations.
All aspects of social, economic and political life changed at once, and it was a painful
process for the majority of the population. New states emerged that lacked the institutional
mechanisms for social integration and social stability (Fligstein 2001; Walder 1994). New
class relationships were unleashed, and there was an intense struggle to secure access to
and control over resources. The transition from a bureaucratic-redistributive order to an
imperfect market order was accompanied by a dramatic decline in GDP, a decline in state
spending on health, education and social security benefits both in absolute and real terms,
an increase in unemployment and under-employment, the non- and late payment of wages,
a decline in the influence of the trade unions, an increase in inequalities, poverty and
malnutrition and a growth in informal economic activity (Abbott 2002). The vast majority
of the population were losers (Haerpfer and Zeilhofer 1995; Rose 2009) with survival for
many depending on participating in informal economies in place of, or as well as, the
formal economy. Those with know-how—the ‘‘winners’’—were able to exploit this situ-
ation, but the majority of the population were left unable to participate (Rose 2009).
The transformation inflicted considerable stress on the population (Wallace and Abbott
2009) with the breakdown of social order evidenced by an increase in lawlessness, a
dramatic growth in social inequalities and the inability of the public powers to regulate the
emerging market economy or to exercise good governance, to win the people’s trust or to
take care of the losers (Ledeneva 2006; Rose 2009; Sapsford and Abbott 2006). With
weakened generalised trust—a loss of trust in the impersonal institutions necessary for the
effective working of parties, business and civil society—the response of many was to
retreat into defensive anti-modern modes of survival relying on informal economic activity
and on kin (Abbott and Wallace 2009a; Burawoy 2000; Rose 2009). The basis for citi-
zenship was destroyed (Giddens 1994) and the security of the lives of the majority of the
population was shattered (Abbott and Wallace 2007, 2009a; Rose 2009). The dislocation in
the social structure resulted in a breakdown in the normative patterns that define the
expectation of actors, in the patterns of social relationships between actors and in the
embodied perceptions, habits and skills by which people produce and reproduce institu-
tional and related structures. The structural change means not only that people’s life
chances have been transformed (and, for many, for the worse) but that their understandings
of how to make life choices and their ability actually to do so have also changed. Culturally
shared templates are no longer appropriate for guiding behaviours in the changed socio-
economic and cultural contexts (Sztompka 2002; Abbott and Wallace 2009a).
The four countries under consideration in this paper declared their independence from
the former Soviet Union in December 1991 and joined the loosely confederated Com-
monwealth of Independent States (CIS) at that time. Kyrgyzstan, Georgia and Armenia are
three of the poorest CIS countries and are highly dependent on their agricultural sector,
whilst Kazakhstan has more developed industrial and service sectors mainly based on the
exploitation of its natural resources including oil. (Abbott 2002; EastAgri 2009). All four
have become authoritarian regimes (Haerpfer 2009). All the countries experienced
hyperinflation and an economic collapse in the 1990s, but by 2001 inflation was generally
Surviving the Transformation 201
123

under control and there were some signs of economic recovery. In Kazakhstan the adjusted
real GDP (PPPUS$) exceed that of 1990 by 2001, but in the other three countries it was
still significantly below the 1990 level. All the countries experienced significant growth in
income inequalities over the 1990s (Abbott 2002) and poverty levels were high in 2001
(Table 1). There was a reliance on informal economic activity, with households often
relying on a portfolio of incomes, especially in Armenia, Georgia and Kyrgyzstan (Abbott
2002; Abbott and Wallace 2009a). The health of the population was generally poor,
although, with the notable exception of Kazakhstan, they did not experience the same sharp
increase in mortality amongst men in mid-life that was experienced in the CIS countries of
Eastern European and Russia (Abbott 2002; Cockerham et al. 2004; Wallace and Abbott
2009).
Armenia is a landlocked country in the Caucus region of South West Asia, bordered by
Turkey to the West, Georgia to the North, Azerbaijan to the East and Iran to the South. It
remains heavily dependent on its Diaspora for economic survival and there has been
significant outmigration. In 2001 the population was estimated to be around four million,
but the correct figure is thought to be at least a million lower. Thirty-six per cent of the
population live in rural areas, and in 1999–2000 just over 40 per cent of the population
lived below the US$2 a day poverty line—the absolute poverty line for this region rec-
ommended by the World Bank (2000)—and over four-fifths below the US$4 poverty line
recommended by Milanovic (1998) as a more realistic measure for this region.
Georgia is located in the Caucasus in South West Asia, bordering on the Black sea
between Turkey and Russia. It had an estimated population of just fewer than five million
in 2001, although the correct figure is thought to be a million lower than this. Forty-eight
per cent of the population live in rural areas. In 1999–2000 just under a fifth of the
population lived below the US$2 poverty line and just over half below the US$4 poverty
line.
Kazakhstan is the largest of the Central Asian countries, with a landmass about the size
of the European Union. It is landlocked and shares a long northern border with Russia, the
Caspian Sea and Russia are to the west, China is to the east, and Kyrgyzstan, Uzbekistan,
and Turkmenistan lie to the south. It had an estimated population in 2001 of just fewer than
15 million, 52 per cent Kazakh, with ethnic Russians—numbering about five million—
constituting the second largest ethnic group. Some 1.3 million Russians, including many of
the most educated people, left the country between 1990 and 1998. It has significant natural
resources and these have fuelled the economic recovery. Fifty-six per cent of population
live in rural areas. Some 15.7 per cent of the population lived below the $2 per day and
31.6 per cent below the US$4 per day poverty line in 1999–2000.
Table 1 Adjusted Real GDP 1990 and 2001 (PPPUS$) and incidence of poverty 1999–2000
Country Armenia Georgia Kazakhstan Kyrgyzstan
GDP PPPUS$
1990 4,741 4,572 4,716 3,114
2001 2,650 2,560 6,500 1,927
Incidence of poverty in 2001
\US$2 43.5 18.9 15.7 49.1
\US$4 86.2 54.2 31.6 88.0
Source United Nations Human Development Reports (1993, 2003); Abbott (2002)
202 P. Abbott et al.
123

Kyrgyzstan is small and poor, with agriculture dominating the economy and contrib-
uting a third to GDP. It is landlocked; Kazakhstan lies to the north and China to the east,
and the country borders Tajikistan and Uzbekistan in the south and west. Just over two-
thirds of the population live in rural areas, and around 60 per cent of all workers are
employed in agriculture (mainly as subsistence producers). It is predominately Sunni
Muslim, although Islam is not a dominant force. The population in 2001 numbered 4.9
million, with about 60 per cent native Kyrgyz. The remainder are largely Russians and
Uzbeks. In 1999–2000 half the population lived below the US$2 per day poverty line and
nearly nine tenths below the US$4 per day poverty line.
3 Quality of Life
There are multiple definitions of quality of life, both based on objective and subjective
criteria and a multiplicity of ways in which people asses their own quality of life or
subjective well-being. However, an individual’s quality of life depends not only on what
they do but also on what happens in the wider society and the impact this has on indi-
viduals differentially placed in the societal opportunity structure.
Objective and subjective indicators of satisfaction or well-being correlate highly
(Economist Intelligence Unit 2005; Veenhoven 2009) but objective indicators such as
GDP, UNDP HDI and IMR do not tell us what makes a society liveable or tolerable. It is
now widely recognised, however, that people are good judges of their own circumstances
and that reported subjective well-being (e.g. general satisfaction) reflects people’s lived
experience and is meaningful (Clark et al. 2006; Kahneman and Krueger 2006 Land et al.
2007; Easterlin 2008). In this paper we consider the influences on general satisfaction,
which is seen for the most part as a relatively stable cognitive evaluation circumstances
strongly influenced by material situation (Meadow et al. 1992). Research on subjective
satisfaction uses a variety of data sets that do not provide the same variables for analysis; a
wide range of different indicators are used by researchers and the justification for the
selection of indicators is not always clear. In selecting indicators Allardt’s classification of
having (material factors), loving (social support) and being (sense of overall recognition)
has, however, been important (see Allardt 1993; Bohnke 2005). The most frequently used
dependent variable is the answer to a question on satisfaction with life in general (some
research uses the answer to a question on happiness) but the wording of the question varies
as does the range of possible answers. The selection of indicators, not surprisingly,
influences what is found to influence subjective well-being, although there is also a good
deal of consistency in terms of the most important indicators. It is also likely that responses
to the question on general satisfaction will be influenced by the questions preceding it in
the survey.
4 General Satisfaction in the CIS and Europe
There are wide differences in social and individual well-being across Europe and the
former Soviet Union. Generally the pattern is a North–South, West-East gradient, with the
countries of Western Europe having the high levels of social well-being and the most
satisfied and happy citizens and those of Eastern Europe and the former Soviet Union being
the least happy and satisfied (e.g. Abbott 2007; Abbott and Sapsford 2006; Abbott and
Wallace 2009b, c; Andren and Martinsson 2009; Bohnke 2005; Delhey 2004; Veenhoven
Surviving the Transformation 203
123
2001). There is some evidence that levels of general satisfaction fell following the fall of
communism but that by the turn of the twenty-first century they had recovered somewhat
(Easterlin 2009).
In 2003 the mean level of subjective general satisfaction in the EU 15 was 7.4 on a
ten-point scale, varying from a low of 5.9 in Portugal—above the mid-point of the scale
(5.5)—to a high of 8.4 in Denmark. For the new member states and candidate countries of
Central and Eastern Europe the mean score was 5.8, varying from a low of 4.4 in Bulgaria
to a high of 7.0 in Slovenia. The means for the three new member states that had formed
part of the FSU until 1991 were: Estonia 5.8; Latvia 5.5, and; Lithuania 5.3—around the
mid-point of the scale. In 2001 the average level of general satisfaction in the CIS was 2.4
on a four-point scale—below the mid-point of 2.5—varying from a low of 1.6 in Georgia
(notably lower than any of the other countries) to a high of 2.7 in Kyrgyzstan, above the
mid-point but not by much (see Table 2). In four of the CIS countries the mean was below
the mid-point and in three around it. This suggests that levels of general subjective sat-
isfaction are somewhat lower in the former Soviet Union than in the former communist
countries of Eastern and Central Europe but that the differences are not large.
5 Explaining General Satisfaction in the CIS and Europe
Material circumstances tend to be the main predictor of subjective satisfaction, with age
and gender making little difference, at least in Europe and the CIS (Abbott and Wallace
2009b, c; Andren and Martinsson 2009; Bohnke 2005; Delhey 2004). However, the per-
ceived quality of the society also has an independent influence, especially on satisfaction
(Bohnke 2005, 2008), as does social support, which generally becomes more important the
higher the level of prosperity of the country, with family support being more important in
poorer countries and friends in more affluent countries. The general pattern is that the
lower the level of the GDP of a country, the lower the level of satisfaction throughout the
population, with a greater variance in general satisfaction in poorer countries than in more
affluent ones. Within countries material circumstances are generally the main or a major
factor, although they tend to be less important in more affluent countries. A number of
other factors, objective and subjective, have also been shown to influence subjective sat-
isfaction fairly consistently In the CIS, in addition to economic circumstances, trust, social
support (having friends and family to rely on), social inclusion (e.g. being in employment,
being married, belonging to a civil society organisation), health and feeling in control of
one’s life have been shown to contribute to explaining general satisfaction (Abbott 2007;
Abbott and Sapsford 2006; Galip 2009; Kanji 2007; Namazie and Sandfrey 2002). Age,
gender, education and employment status generally have only a small impact.
Using a sociologically informed approach and selecting indicators derived from the
Social Quality model (Phillips 2006), Abbott and Wallace (2009b, c) found that the main
factors influencing subjective satisfaction across the EU 27 in 2003 and 2007 were: having
an adequate income for a decent standard of living, trusting other people and trusting
government, having close support and feeling socially integrated, and being healthy and
feeling in control of one’s life. They also found that economic factors were more important
in the former communist countries of Central and Eastern Europe than in the EU 15, with
some indication that as the economies of the former recovered, so the importance of
economic factors declined somewhat, with social support and feeling in control of one’s
life becoming more important. Age, gender education made little contribution to
explaining differences.
204 P. Abbott et al.
123

6 Developing a Sociological Model of Subjective Satisfaction
As sociologists we are concerned to derive our indicators from a sociological base. We
want to be able to define the type of society and social policies that enable people to have a
satisfactory or at least tolerable life. To do this we have to consider the articulation
between the quality of society and the subjective quality of individuals’ lives within it (e.g.
Abbott 2007; Abbott and Sapsford 2006; Abbott and Wallace 2007; Bohnke 2005; Phillips
2006; Veenhoven 2008). We have to go beyond a description of objective living conditions
and take account of citizens’ subjective understanding of their life situation and the extent
to which they feel able to make the necessary choices in order to act to secure their well-
being—to choose a style of life they value (Phillips 2006; Abbott and Wallace 2009b, c).
Subjective satisfaction has to be seen as the ultimate validating measure, on the argu-
ment that people should be more satisfied in a tolerable than an intolerable society (Land
et al. 2007; Richardson et al. 2008). This is not a paper about subjective satisfaction;
however, in the same way that Durkheim’s Suicide (1952) was not a treatise about suicide.
What Durkheim was exploring was the nature of anomic societies—societies where the
rules have broken down and there are no clear prescriptions for action—using suicide as a
Table 2 General satisfactionCIS in 2001 and central andeastern Europe in 2003
a Source LLH Data, authors’own calculations. Answer toquestion: How satisfied are you,all things considered with yourlife as a whole these days,1 = definitely satisfied,2 = quite satisfied, 3 = ratherdissatisfied, 4 = definitelydissatisfied. Variable recoded so1 = definitely dissatisfied and4 = definitely satisfied for thistableb Source Abbott and Wallace(2009b, c). Answer to question:All things considered howsatisfied would you say you arewith your life these days? Pleasetell me on a scale of 1 to 10,where 1 means very dissatisfiedand 10 means very satisfied
Country Mean on 4point scale
CISa
Armenia 2.28
Byelorussia 2.54
Georgia 1.58
Kazakhstan 2.57
Kyrgyzstan 2.69
Moldova 2.28
Russia 2.55
Ukraine 2.26
Average 2.37
Country Mean on 10point scale
Central and eastern Europeb
Bulgaria 4.42
Czech Repub 6.41
Estonia 5.81
Hungary 5.89
Latvia 5.48
Lithuania 5.33
Poland 6.18
Romania 6.11
Slovakia 5.59
Slovenia 7.01
Mean FCC 5.77
Mean EU 15 7.4
Surviving the Transformation 205
123

measurable indicator of the extent to which societies were anomic and as validation of his
theory-based conclusions. What we are trying to do here, similarly, is to explore the effects
of the various breakdowns—economic, political, social and normative/ideological—which
were occasioned by the breakdown of the Soviet socio-political system. The concern is
with how societies have rebuilt themselves—or not—into social spaces (see Abbott and
Sapsford 2005) which are tolerable or even satisfactory as human habitats.
To relate agency and structure we need to take a sociological approach and go beyond
considering people’s individual satisfaction with their life as a whole and with domains of
satisfaction, to consider the relationship between objective conditions and the subjective
evaluation of them and the impact this has on people’s ability to take control over their
lives (Phillips 2006; Wallace and Abbott 2009)—in other words, to consider the material
and the discursive nature of the society in which they live. The Social Quality approach,
which focuses on the individual as an active subject living in developing social conditions,
enables us to theorise the ways in which social and system integration impact on well-
being. It measures the extent to which the quality of daily life provides for an acceptable
standard of living, taking account of the structural features of societies and their institu-
tions as assessed by reference to their impact on citizens. Social Quality defines the space
within which citizens are able to participate in the social and economic life of their
communities under conditions which enhance their well-being and individual potential. It
is the social context within which individuals have the opportunity to develop the capa-
bilities to enable them to attain valued outcomes (Sen 1993). It identifies four domains or
areas—economic security (necessary material resources), social cohesion (necessary
accepted norms and values in place), social inclusion (access to necessary institutional and
infrastructural context) and the conditions for empowerment (the extent to which people
feel they have control over their own lives and the capacity for meaningful agency). Each
of the four aspects has been shown to make an independent contribution to explaining
satisfaction in other CIS countries (Abbott and Sapsford 2006; Abbott 2007) and the
European Union (Abbott and Wallace 2009b, c).
We build on these insights to consider what range of factors influences well-being in
Kazakhstan, Kyrgyzstan, Armenia and Georgia, in order to cast further light on the dif-
ferential impact of the transition on post–Soviet citizens. These four countries are of
interest particularly because they are not part of the developed West, for which the Social
Quality model was first developed, and show that the model has generality beyond the
countries for which it was first devised.
7 Methods
This paper dawns on a survey carried out in 2001 as part of The Living Conditions,Lifestyles and Health Project. Samples of 2,000 were selected in each country using multi-
stage sampling with stratification by region and area. There was no over- or under-sam-
pling of subgroups; however, in Georgia the regions of Abhazhia and Osetia had to be
excluded because of inaccessibility (3% of the national population). Within each primary
sampling unit households were selected using standardized random route procedures,
except in Armenia, where systematic random sampling from a list was used. The response
rates were 82 per cent in Kazakhstan, 71 per cent in Kyrgyzstan and 88 per cent in both
Armenia and Georgia. The questionnaire was developed by the project partners and
translated into Russian. Following a pilot it was amended and back translated into English
for final checking.
206 P. Abbott et al.
123
Given the need to consider the multiple influences on the dependent variables a series of
OLS regressions were carried out: for each quadrant of the social quality model and then
for all the significant indicators with the dependent variable being general satisfaction.—
The responses to the question How satisfied are you, all things considered, with your life asa whole these days—1 definitely satisfied, 2 quite satisfied, 3 rather dissatisfied or 4definitely dissatisfied?
The independent variables were selected from a rich data source as indicators
(approximate measures) of the elements of our model (see below and ‘‘Appendix’’):
Material Circumstances, Social Cohesion, Social integration and Conditions for Social
Empowerment. We also control for age and gender. When the countries were entered as
dummy variables with Kazakhstan as reference the adjusted R2 increased significantly and
the country Betas were strong, suggesting that the model may not be entirely a general one
but conceal some degree of difference between countries. Given this, the regression
analysis was re-run for each country separately.
Nine of the independent variables were scales/indices computed for use in the analysis
(social resource, personal support, trust in government, trust in institutions, personal
control, malaise, freedom, fear of crime and political influence—see ‘‘Appendix’’). The
scales were constructed using factor analysis with varimax rotation and all had acceptable
Cronbach alpha values. The reason for adding answers to several questions into a single
scales were (1) to combine items which theory would regard as aspects of the same
underlying/latent variable, and (2) to increase reliability by averaging out random mea-
surement error. Often it also had the effect of increasing the variability of a measure, and
so making it more useful in regression analysis.
All of the independent variables were tested and found to correlate with the dependent
variable. The models were tested for multicollinearity and were found to be satisfactory as
the tolerance of no variable was below 0 .40 (Tarling 2009). No variable was unacceptably
skewed or platy/leptokurtic.
8 General Satisfaction
It is perhaps not surprising that the citizens of the four countries report relatively low levels
of general satisfaction: only 12.3 per cent in Georgia, 41.5 per cent in Armenia, 57.5 per
cent in Kazakhstan and 61.1 per cent in Kyrgyzstan said they were definitely satisfied or
fairly satisfied. On a four point scale the means were, Georgia 1.6, Armenia, 2.3,
Kazakhstan 2.6 and Kyrgyzstan 2.7 (Table 2). What is perhaps surprising, in this and other
studies (e.g. Richardson et al. 2008), is that the highest levels of general satisfaction are
found in Kyrgyzstan, the poorest country, and a much lower level of general satisfaction in
Georgia compared with the other three countries. We return to this in the discussion below.
9 Economic Circumstances
As we have already shown (Table 1) there is clear evidence of the negative impact of the
transformation on the living conditions of the populations of the four countries. A majority
of respondents to our survey interpreted the post-1991 changes as having had a negative
impact on their society and their own lives; 70 per cent of respondents in Kazakhstan, over
80 per cent in Kyrgyzstan, 91 per cent in Georgia and 96 per cent in Armenian thought that
the disintegration of the USSR had had a negative impact on the economy of their country,
Surviving the Transformation 207
123
for example. Whilst a substantial majority rated the economy as having been sound in the
past (72.9% in Kazakhstan, 90% in Kyrgyzstan, 91.8% in Armenia, 92.2% in Georgia), few
thought it was sound in 2001 (15.9 in Kazakhstan, 9.5 in Kyrgyzstan, 3.6 in Armenia, 1.1
in Georgia). The majority of respondents were dissatisfied with the material situation of
their family: 58.4 per cent in Kyrgyzstan, 73.8 per cent in Kazakhstan, 83.3 per cent in
Armenia and 91.8 per cent in Georgia. Satisfaction with financial situation has been shown
to correlate highly with general satisfaction. We found this to be the case amongst our
respondents, with the correlation being 0.48 in Armenia, 0.59 in Kazakhstan, 0.66 in
Kirgizstan and 0.72 in Georgia.
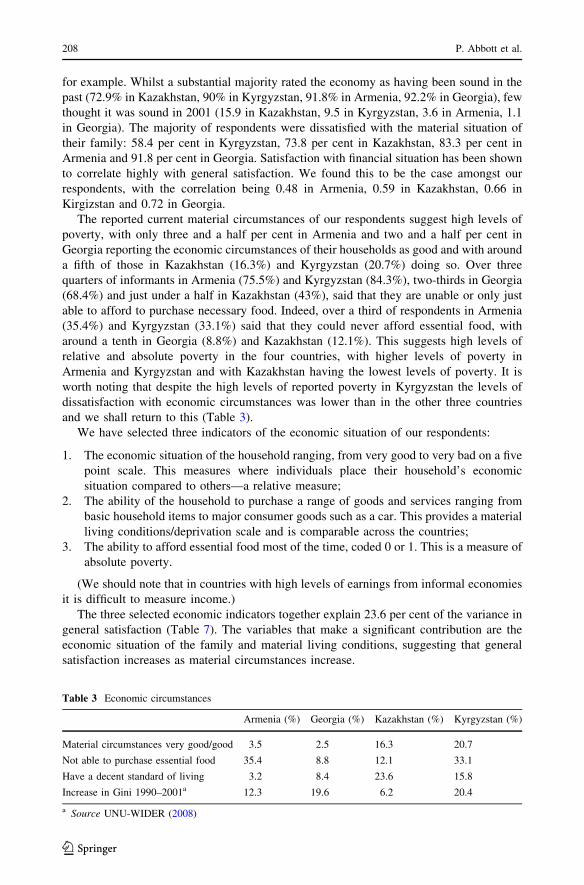
The reported current material circumstances of our respondents suggest high levels of
poverty, with only three and a half per cent in Armenia and two and a half per cent in
Georgia reporting the economic circumstances of their households as good and with around
a fifth of those in Kazakhstan (16.3%) and Kyrgyzstan (20.7%) doing so. Over three
quarters of informants in Armenia (75.5%) and Kyrgyzstan (84.3%), two-thirds in Georgia
(68.4%) and just under a half in Kazakhstan (43%), said that they are unable or only just
able to afford to purchase necessary food. Indeed, over a third of respondents in Armenia
(35.4%) and Kyrgyzstan (33.1%) said that they could never afford essential food, with
around a tenth in Georgia (8.8%) and Kazakhstan (12.1%). This suggests high levels of
relative and absolute poverty in the four countries, with higher levels of poverty in
Armenia and Kyrgyzstan and with Kazakhstan having the lowest levels of poverty. It is
worth noting that despite the high levels of reported poverty in Kyrgyzstan the levels of
dissatisfaction with economic circumstances was lower than in the other three countries
and we shall return to this (Table 3).
We have selected three indicators of the economic situation of our respondents:
1. The economic situation of the household ranging, from very good to very bad on a five
point scale. This measures where individuals place their household’s economic
situation compared to others—a relative measure;
2. The ability of the household to purchase a range of goods and services ranging from
basic household items to major consumer goods such as a car. This provides a material
living conditions/deprivation scale and is comparable across the countries;
3. The ability to afford essential food most of the time, coded 0 or 1. This is a measure of
absolute poverty.
(We should note that in countries with high levels of earnings from informal economies
it is difficult to measure income.)
The three selected economic indicators together explain 23.6 per cent of the variance in
general satisfaction (Table 7). The variables that make a significant contribution are the
economic situation of the family and material living conditions, suggesting that general
satisfaction increases as material circumstances increase.
Table 3 Economic circumstances
Armenia (%) Georgia (%) Kazakhstan (%) Kyrgyzstan (%)
Material circumstances very good/good 3.5 2.5 16.3 20.7
Not able to purchase essential food 35.4 8.8 12.1 33.1
Have a decent standard of living 3.2 8.4 23.6 15.8
Increase in Gini 1990–2001a 12.3 19.6 6.2 20.4
a Source UNU-WIDER (2008)
208 P. Abbott et al.
123

10 Social Cohesion
Social cohesion, as the term is used in the Social Quality model, is the extent to which a
society can be seen as a single integrated entity at the discursive level, with shared
norms and values. One of the best indicators of social cohesion is trust (Phillips 2006).
Trust tends to be highest amongst those who think there are few social conflicts, where
people feel safe and where there are strong informal networks (Delhey and Newton
2003). Levels of trust are generally low in these four countries (Table 4, and see
Sapsford and Abbott 2006). Overall levels of trust are highest in Kyrgyzstan, followed
by Kazakhstan and Armenia, with Georgia having on average the lowest levels of trust.
It is especially notable that general trust in other people (one indicator, perhaps, of
feeling that the society is ‘pulling together’ around a single set of norms and values) is
much higher in Kyrgyzstan than in the other three countries—although so is trust in
organs of government and formal institutions. However, fear of crime (which is one form
of distrust of fellow-citizens) is notably higher in Kyrgyzstan along with Kazakhstan and
lower in Armenia.
We selected four indicators as measures of social cohesion:
1. The answer to a question about the extent to which people can be trusted, coded from 1
high trust to 4 low trust;
2. A scale computed from the answers to a range of questions asking about trust in
Government, President of country, national parliament, regional government, political
parties) coded from 1, high to 4 low trust (see ‘‘Appendix’’);
3. A scale computed from the answers to a number of questions on trust in formal
organisations (courts, police, army, trade unions) coded from 1 high to 4 low trust (see
‘‘Appendix’’);
4. A scale computed from a number of questions concerning fear of crime (theft from
home, harassed or threatened, street robbery) coded from 1 ‘not worried’ to 4 ‘very
worried’ (see ‘‘Appendix’’).
Table 4 Social cohesion
Variable Armenia (%) Georgia (%) Kazakhstan (%) Kyrgyzstan (%)
Trust people in general 48.2 40.4 59.7 73.7
Trust president of country 47.6 38.4 75.0 67.2
Trust national government 30.6 5.1 54.5 60.5
Trust national parliament 24.2 5.4 43.5 52.7
Trust regional government 35.6 15.6 60.2 55.6
Trust political Parties 18.7 7.7 19.1 38.1
Trust the courts 31.4 12.6 34.9 46.8
Trust the police 35.2 8.2 33.6 50.1
Trust the army 85.3 32.2 69.4 75.7
The trade unions 25.1 10.3 32.4 45.0
Fear of burglary 26.2 51.6 62.8 57.6
Fear of robbery on street 23.1 46.6 55.6 59.6
Fear of attack on street 24.4 46.1 55.1 60.4
Surviving the Transformation 209
123

The four indicators together explained 19.5% of the variance, with all of them making a
significant contribution. Trust in government had the strongest Beta value and trust in
institutions also had a relatively large Beta. Trust in other people and fear of crime made
much smaller contributions to the variance explained (see Table 7).
11 Social Integration
Social Integration, in the model describes how people see themselves as living, within this
society, the extent to which they feel themselves to be part of that society or of some
fraction of it, the extent to which they are not alone but have the support of others. In terms
of social integration there is evidence of high levels of personal support from family and
friends but lower levels of integration into the wider society (Table 5). For example, over
90 per cent of respondents in the four countries said that they had someone to listen to
them, and over 85 per cent in Armenia and Kazakhstan and around 90 per cent in the other
two countries that there was someone who would help them in a crisis, but only a tiny
proportion, ranging from 1.9 per cent in Georgia to 7.5 per cent in Kyrgyzstan, said they
were active members of any organisation. The extent to which people could call upon help
from relatives and friends in times of need (social resource) varied between the four
countries but was generally lower than for personal support. For example, the number of
respondents who could call on support for getting a job varied from less than a third in
Georgia to just fewer than 60 per cent in Kyrgyzstan. Overall, respondents in Kyrgyzstan
reported the highest levels of support and those in Armenia the lowest, but the differences
are not large and the general pattern of social integration is the same across the four
countries.
We selected seven indicators of social integration to represent the various ways indi-
viduals can be socially integrated (‘‘Appendix’’):
1. Active membership of an organisation coded 0 no, 1 yes;
2. Identifying with the dominant ethnic group, coded 0 no, 1 yes;
3. Married or living with someone as a couple, coded 0 no, 1 yes;
4. Employed, coded 0 not in paid employment, 1 in paid employment;
Table 5 Social integration
Variable Armenia (%) Georgia (%) Kazakhstan (%) Kyrgyzstan (%)
Friends confide in 77.3 79.7 76.8 82.8
Help depressed 56.8 61.7 62.8 73.3
Help find job 43.2 31.3 49.0 58.8
Help pay urgent bill 58.5 55.3 75.8 69.7
Someone to listen 90.9 92.4 90.8 93.4
Someone help in crisis 85.7 91.3 87.4 90.1
Someone be self with 75.0 91.0 86.0 88.3
Someone appreciates you 94.0 93.6 84.4 93.5
Someone comfort if upset 91.6 91.3 90.8 93.2
Active in organisation 4.9 1.9 5.7 7.5
Married/live with partner 64.7 68.8 68.1 67.9
Per cent employed 43.7 36.1 22.8 53.2
210 P. Abbott et al.
123
5. Having a close friend to discuss matters with, coded 1 yes, 2 no;
6. Social Resource Scale computed from the answers to a range of questions about
having someone to rely on outside the household (feeling depressed, help in finding a
job, need to borrow money) coded 1 yes, 2 no;
7. Personal Support Scale computed from the answers to a range of questions on the
availability of personal support(someone to listen, help in a crisis, be yourself with,
appreciate you as a person, comfort you when upset) coded 1 yes, 2 no.
The social integration variables in combination explained 9.92 per cent of the variance
in general satisfaction. The strongest contribution was made by the social resource scale
(a measure of integration with friends and family more than wider groups or the society as
a whole), but being an active member of an organisation, identifying with the dominant
ethnic group, having a close friend and being married all making a noticeable contribution.
Being employed was significant only at the 95 per cent level and the personal support scale
did not make a significant contribution (see Table 7).
12 Conditions for Empowerment
Beyond Cohesion and Integration, there is the question of whether people feel that the
society in which they live is one in which it is possible to take action, individually or
collectively, and take some control over the direction of one’s life, and this is what is
meant by Conditions for Empowerment in the Social Quality Module. Levels of per-
ceived personal control are low in these four countries, especially in Armenia (Table 6),
with, for example, over two-thirds of Armenians (66.6%), nearly 50 per cent in
Kazakhstan (45.1%) and Kyrgyzstan(48.1%)—although less than a quarter (23%) of
Georgians—saying that they were unable to enjoy normal daily activities. Over 50 per
cent (varying from 51.1% in Armenia to 74.8% in Georgia) said that life was too
complicated. Over a third of respondents, rising to over two-thirds in Armenia, said that
they felt under constant strain. Only a small minority thought they could influence the
national government (9.6% in Armenia, 12.0% in Georgia, 9.3% in Kazakhstan, 23% in
Kyrgyzstan) or even take an interest in politics (28.9% in Armenia, 21.5% in Georgia,
34.4% in Kazakhstan, 37.4% in Kyrgyzstan). Over a third of respondents, rising to over
50 per cent in Georgia said they were afraid of illegal arrest. Only around a third of
respondents in Armenia (35.2%) and a half in Georgia thought they were free to join any
religion they wanted, although the proportions were somewhat higher in Kazakhstan
(74.8%) and Kyrgyzstan (62.7%). A majority of respondents, varying from 62 per cent in
Georgia to 79 per cent in Kyrgyzstan, said they were free to join any organisation, and
over two-thirds said they were free to travel. This suggests that the levels of perceived
freedoms are quite high but that levels of perceived control over life and influence on
society are much lower.
Health is a resource that enables people to participate in socially valued activities, and
lack of good health can be a barrier to participation. Levels of self-reported poor health are
comparatively high, especially in Armenia, and noticeably higher for women than men.
Psychosocial health was also reported as poor, with women experiencing on average more
malaise symptoms than men and with the Armenians having the poorest psychosocial
health, followed by the Kyrgyz and the Kazaks, with the Georgians having the best.
Education is also a resource that enables people to take more control over their lives,
including their health (Mirowsky and Ross 2003a, b). Around forty per cent of respondents
Surviving the Transformation 211
123

in Georgia have had at least some higher education, and around a quarter in the other three
countries.
We selected seven indicators of conditions for empowerment:
1. Political influence, a scale computed from answers to questions about the extent of
influence on national and regional government coded from 1 high to 4 low;
2. Basic Freedoms Scale computed from the answers to questions on freedom of
expression, to travel or to join an organisation, coded from 1 definitely free to 4
definitely not free;
3. The answer to a question on the extent to which the respondent had free choice and
control over their life, coded on a five point scale from a great deal of freedom and
choice to none at all;
Table 6 Conditions for empowerment
Armenia(%)
Georgia(%)
Kazakhstan(%)
Kyrgyzstan(%)
Unable to concentrate 55 11.4 21.7 46.9
Insomnia 62.7 30.8 38.3 46.5
Feel under constant strain 67.2 33.1 33.2 33.4
Losing confidence in self 29.6 13.2 12.6 18.3
Often shaking and trembling 39.8 9.6 16.7 22.3
Frightening thoughts 42.3 16.7 32.4 42.4
Spells of exhaustion/fatigue 35.7 28.9 44.0 53.7
Feeling of stress 39.2 18.4 25.0 25.3
Can not overcome difficulties 53.7 16.7 21.2 34.4
Unable to enjoy normal day-to-day activities 66.6 23.1 45.1 48.1
Dissatisfied with work 68.2 32.4 36.8 43.5
Life is too complicated 50.1 74.8 58.9 58.6
Impossible to influence things 68.3 15.6 36.6 23.1
Feeling lonely 36.4 15.6 24.2 26.6
Right to say what I think 82.5 87.0 80.9 89.1
Free to join any religion 35.2 48.6 74.8 62.7
Free to travel 82.5 67.3 72.7 81.2
Free to join any organisation 67.3 62.0 75.4 79.1
Afraid illegal arrest 57.5 52.2 43.0 35.1
Can take an interest in politics 28.9 21.5 34.4 37.4
Influence national government 9.6 7.6 8.3 23.0
Influence regional government 16.1 8.9 12.5 27.6
Some higher education 25.5 40.0 27.6 27.0
High level of freedom and choice (4/5 out 5) 58.4 55.3 55.7 67.4
Variable Kazakhstan Kirgizstan Armeni Georgia
Women(%)
Men(%)
Women(%)
Men(%)
Women(%)
Men(%)
Women(%)
Men(%)
Self reported health
Self reported health good 68.2 81.6 77.2 89.6 56.0 61.9 61.2 81.0
The male/female difference is significant p \ 0.001
212 P. Abbott et al.
123
4. Evaluation of health on a four point scale from very good to very bad;
5. A malaise scale measuring a general state of psychological distress (anxiety and
depression), a state of misery rather than a symptom of disease (Mirowsky and Ross,
2003b) computed from reporting a number of symptoms—unable to concentrate, loss
of confidence, often shaking and trembling, frightening thoughts, spells of exhaustion,
feelings of stress—code 1 has the symptom, 2 does not;
6. A personal control scale computed from reporting a number of symptoms (cannot
overcome difficulties, unable to enjoy normal day-to-day activities, dissatisfied with
work, life is too complicated, impossible to influence things/activities, feeling
lonely)—code 1 has the symptom, 2 does not;
7. Education—highest level primary, secondary, tertiary (one indicator of the choices
available to an individual).
The variables in total explained 12.9 per cent of the variance in general satisfaction,
with political influence and social control making the strongest contributions and freedom
and choice, self report health and malaise all making noticeable contributions. Education
and political freedom were not significant (Table 7).
13 Influences on General Satisfaction
Thus in quadrant-by-quadrant regressions we have shown that each of the quadrants by
itself explains a significant amount of the variance between people’s general satisfaction,
which we are taking as an indicator of the extent to which the societies in which they
live are seen as satisfactory. Economic factors alone account for nearly a quarter of the
variance, Social Cohesion for nearly 20 per cent, Social Integration for nearly 10 per
cent and Conditions for Social Empowerment around 13 per cent. The quadrants are not
independent of each other, however, either theoretically or empirically. Economic factors
are to some extent preconditions for social empowerment. Social Cohesion and Social
Integration relate to each other in complex ways, and both are affected by economic
factors in the sense that there tends to be greater trust in and reliance on personal and
family contacts and less on national organisations and structures when the economy is at
its worst. It is entirely possible that the effect of some of the quadrants is an artefact—
derivative from the effect of others rather than making a contribution which is inde-
pendent of them—and so we need to check the effect of each on the others’ ability to
explain variance in satisfaction. We therefore took all the variables that were significant
in the individual quadrant regressions and entered them in a single regression, also
controlling for age and gender.
Table 8 (Model 1) shows the results with general satisfaction as the dependent var-
iable. The total variance explained by the full model was 33.3 percent, more than was
explained by any of the quadrants alone or any of the variables within them. Economic
circumstances continued to make a strong contribution (economic situation and material
circumstances), with social cohesion (general trust, trust in government, trust in insti-
tutions, fear of crime), social inclusion (social resource, ethnicity and being married) and
empowerment (personal control, freedom and control, subjective health, malaise and
political influence) all continuing to make significant contribution. Age made a signifi-
cant contribution, suggesting that older people are less satisfied than younger ones, but
the Beta value was low.
Surviving the Transformation 213
123

Table 7 Influences on satisfaction with life within each quadrant of the social quality model
Variable B Beta SE
Total adjusted R2 0.236
Material security
Constant 4.380 .039
Economic situation of family .461 .375*** .016
Evaluation material living conditions .217 .145*** .020
Basic fooda -.028 -.020 .015
Total adjusted R2 0.193
Social cohesion
Constant 1.453 .074
Most people can be trusted .096 .100*** .013
Trust government scale .068 .248*** .005
Trust institutions scale .047 .178*** .005
Fear of crime scale .009 .031** .004
Total adjusted R2 0.099
Social integration
Constant 3.038 .077
Active member of organisationb -.186 -.086*** .026
Nationalityb -.199 -.085*** .030
Social resource scale .172 .200*** .012
Personal support scale .018 -.023 .011
Marriedb -.104 -.047*** .028
Employedb -.055 -.026* .027
Friend discuss important matters with .180 .072*** .034
Total adjusted R2 0.129
Conditions for empowerment
Constant 2.817 .105
Political influence .084 .202*** .006
Basic freedoms -.003 -.008 .006
Malaisec -.038 -.092*** .008
Freedom of choice and control .119 .131*** .013
Self reported health .138 .125*** .017
Controlc -.119 -.192*** .011
Educationc .010 .013 .010
Note most of the variables below are coded negatively—that is, a high score indicates poor economic status,poor material living conditions, etc. The exceptions, where a high score indicates a high number or pos-session of an attribute, are noted below each section of the table and should be taken into account wheninterpreting the polarity of coefficientsa ‘Ability to purchase basic food’ scores high if respondents are able to purchase it—the opposite of theother variables in this sub-tableb The four variables marked with a cross above score high if the informant is a member of a group, etc.The others are coded negatively (see above)c The three variables marked with a cross above score high if the informant does not report symptoms ofmalaise or lack of control and if he or she is more highly educated. The others are coded negatively (seeabove)
*** p \ 0.01, ** p \ 0.01, * p \ 0.01. See ‘‘Appendix’’ for construction of scales
214 P. Abbott et al.
123

14 Country Differences in General Satisfaction
Given the differences we noted above in the four countries, we tested the overall model to
see if it was a general one that applied to all four countries or if we needed separate models
for each country When we added the countries as dummy variables with Kazakhstan as the
reference country the amount of variance explained increased for general satisfaction by
just under 3 per cent and the three countries entered as dummies all varied significantly
Table 8 Factors explaining general satisfaction—overall regression
Variables Model 1 Model 2—controlling for country
B Beta SE B Beta SE
Constant 2.860 .171 3.473 .174
Age .003 .051** .001 .001 .017 .001
Gender .025 .012 .031 .009 .004 .030
Economic
Economic situation .282 .225*** .025 .216 .172*** .024
Material -.132 -.089*** .028 -.141 -.095*** .027
Social cohesion
General trust in people .041 .043** .015 .039 .040**
Trust government .040 .135*** .007 .033 .111*** .006
Trust institutions .044 .143*** .007 .015 .048* .007
Crime .020 .068*** .004 .016 .054*** .004
Social integration
Friend .044 .018 .039 .079 .031* .038
Social resource .043 .050** .014 .027 .031* .013
Active organizationa -.047 -.024 .030 -.033 -.017* .029
Nationalitya -.072 -.031* .034 -.004 -.002 .034
Marrieda -.081 -.036** .033 -.071 -.031* .032
Employeda .036 .017 .032 -.032 -.015 .031
Empowerment
Malaisea -.023 -.055** .009 -.004 -.009 -.008
Personal controla -.071 -.116*** .012 -.100 -.164*** .012
Health .045 .041** 0.19 .077 .070*** .019
Political influence .017 .042** .006 .014 .036* .006
Freedom .058 .065*** .013 .061 .069*** .013
Country
Armenioa -.151 -.066*** .046
Grorgia .678 .264*** .051
Kyrg -.087 -.037* .042
Adjusted R2 0.333 0.361
a Most of the variables are coded negatively—that is, a high score indicates poor economic status, poormaterial living conditions, etc. The exceptions, where a high score indicates a high number or possession ofan attribute, are marked with a cross
* p \ 0.05, ** p \ 0.01, *** p \ 0.001
Surviving the Transformation 215
123

Tab
le9
Fac
tors
expla
inin
ggen
eral
sati
sfac
tion
by
countr
y
Var
iable
sA
rmen
iaG
eorg
iaK
azak
hst
anK
yrg
yzs
tan
BB
eta
SE
BB
eta
SE
BB
eta
SE
BB
eta
SE
Const
ant
4.3
43
.335
1.8
93
.324
3.9
03
.346
3.8
28
.358
Ag
e.0
04
.06
2*
.00
2.0
04
.08
9*
.00
2.0
00
-.0
02
.00
2-
.00
3-
.03
9.0
02
Gen
der
-.0
76
-.0
37
.06
0-
.03
2-
.02
1.0
50
-.0
14
-.0
08
.05
6.1
42
.06
9*
.06
4
Eco
no
mic
Eco
no
mic
situ
atio
n.2
73
.21
6*
**
.04
6.0
37
.03
4.0
43
.15
2.1
22*
**
.04
9.2
81
.21
1*
**
.05
1
Mat
eria
l.0
61
.03
6.0
58
.24
3.1
93
**
*.0
49
.16
7.1
29*
**
.05
0.1
35
.09
1*
*.0
54
So
cia
lco
hes
ion
Gen
eral
trust
inpeo
ple
.048
-.0
55
.02
6.0
43
.06
2.0
25
-.0
35
-.0
25
.02
9-
.08
8-
.08
2*
*.0
33
Tru
stg
ov
ern
men
t.0
38
.12
6*
**
.01
2-
.01
0-
.03
1.0
15
.04
1.1
32*
**
.01
3.0
27
.08
7*
.01
2
Tru
stin
stit
uti
on
s.0
05
.01
3.0
14
.10
9.3
49
**
*.0
15
-.0
20
-.0
65
.01
3.0
16
.05
1.0
13
Cri
me
.00
4.0
13
.00
9.0
02
.01
0.0
08
.01
5.0
47
.01
0.0
27
.08
0*
*.0
10
So
cia
lin
teg
rati
on
Fri
end
-.0
01
.00
0.0
75
.09
3.0
49
.07
1.1
41
.07
1*
.06
3-
.04
6-
.01
5.0
92
So
cial
reso
urc
e.0
01
.00
1.0
27
.02
8.0
47
.02
4.0
54
-.0
69*
.02
6.0
17
.01
9.0
28
Act
ive
org
aniz
atio
n-
.11
2-
.04
2.0
76
-.0
33
-.0
14
.07
4-
.02
5-
.01
9.0
41
-.0
02
-.0
01
.05
6
Nat
ion
alit
y.0
62
.02
4.0
74
-.1
74
-.0
61
.09
2.0
01
.00
1.0
55
-.0
17
-.0
08
.06
3
Mar
ried
.21
6.0
97*
**
.06
4.0
00
.00
0.0
55
.11
0.0
58*
.05
7.0
51
.02
2.0
71
Em
plo
yed
-.0
67
-.0
29
.07
0-
.00
8-
.00
5.0
49
-.0
47
-.0
27
.05
6-
.04
3-
.02
1.0
64
Em
po
wer
men
t
Mal
aise
-.0
39
-.1
00*
*.0
15
-.0
28
-.0
76
.01
9-
.01
8-
.04
2.0
16
-.0
06
-.0
13
.01
8
Per
son
alco
ntr
ol
-.0
76
-.1
31*
**
.02
2-
.06
5-
.11
4*
*.0
28
-.1
50
-.2
57*
**
.02
1-
.09
3-
.14
3*
**
.02
5
Hea
lth
-.0
86
-.0
91*
*.0
32
.03
7.0
48
.03
2-
.12
8-
.13
3*
**
.04
1.1
54
.11
8*
**
.04
5
Po
liti
cal
infl
uen
ce-
.02
2-
.04
9.0
13
.05
2.1
75
**
*.0
11
.01
3.0
33
.01
3.0
07
.01
9.0
11
Fre
edom
.116
.119***
.029
.078
.102**
.028
.061
.072*
.027
.024
.035
.021
Ad
just
edR
20
.297
0.3
87
0.2
91
0.2
52
*p\
0.0
5,
**
p\
0.0
1,
**
*p\
0.0
01
216 P. Abbott et al.
123

from the reference country, suggesting that people in Armenia and Kyrgyzstan are more
satisfied than would be predicted by the model and those in Georgia less satisfied
(Table 8, Model 2). Given this, we ran the complete model for each country separately
(Table 9).
The amount of variance explained by the model varied between the countries. The
variance explained was 29.7 per cent for Armenia, 29.1 per cent for Kazakhstan, 25.2 per
cent for Kyrgyzstan and 38.7 per cent for Georgia. The economic variables made a strong
and significant contribution in each country. Economic situation made the largest contri-
bution to the variance explained in Armenia and Kyrgyzstan and was also significant in
Kazakhstan. In Georgia and Kazakhstan material circumstances made the largest contri-
bution and also contributed in Kyrgyzstan. Social cohesion also made a significant con-
tribution to the variance explained in all four countries (general trust in people and fear of
crime in Kyrgyzstan, trust in government in Armenia, Kazakhstan and Kyrgyzstan and
trust in institutions in Georgia). Of the social integration variables, having people to call
upon for help in time of need and having a close friend made a significant contribution in
Kazakhstan, and being married in Armenia and Kazakhstan. Of the empowerment vari-
ables, personal control made a contribution in all the countries, health in Armenia,
Kazakhstan and Kyrgyzstan, freedom in Armenia, Georgia and Kazakhstan, malaise in
Armenia and political influence in Georgia. Age made a significant contribution in
Armenia and Georgia, with younger people being more satisfied, but the Betas were weak
and it was significant at only the 95 per cent level. Thus the precise predictors of satis-
faction may vary, but variables from each quadrant still have an effect on the prediction,
and there is not much variance to be added by the difference between countries once the
four quadrants have been taken into account.
15 Conclusions
The main conclusions that can be drawn from the analysis are:
Firstly, levels of satisfaction are low in general in the four countries—the societies are
not seen as satisfactory or empowering by their citizens. The levels of satisfaction are
comparable with what is found in other CI S countries and, marginally lower than those
found in the former communist countries of Central and Eastern Europe. It is surprising
that there is not a greater difference given the sharp differences in their trajectories of
change during the 1990s and the situation they were in at the turn of the 21st century.
The former communist countries that have now become members of the EU had gen-
erally transformed into reasonably well-regulated market economies with growing
economies, democratic government and civil societies. By contrast the CIS countries had
only just begun weak economic recovery, had poorly regulated market economies,
authoritarian governments and weak civil societies. Whilst the peoples of the CEE
countries had seen the re-establishment of socially integrated societies and could look to
a relatively certain future this was not the case for the people living in the countries of
Central Asia and the Caucuses. However, as we have noted above, differences in the
wording of questions, the scales on which answers are recorded and where questions are
asked makes it difficult to compare responses from different surveys and comparisons
must be seen as indicative.
Secondly, it is worth noting that the level of general satisfaction was much higher in
Kyrgyzstan than in the other three countries, and this was unexpected given it level of
poverty. Interestingly, on a normalised index of subjective well-being for young people for
Surviving the Transformation 217
123
21 CEE and CIS countries Kyrgyzstan had the highest score, ?1 SD above the mean—
while Kazakhstan was just under -0.5 SD below the mean and Armenia -1.10 with
Georgia having the mean score (Richardson et al. 2008). We can only speculate as to why
people are more satisfied in Kyrgyzstan than would be expected given its level of economic
development. Although it was one of the poorest republics in the FSU it experienced a
significant decline in GDP in the 1990s and a growth in inequalities. It has reverted to a
pre-modern society with a high proportion of the population dependent on subsistence
agriculture and living in rural areas. This means that people spend most of their time in
contact with people they know well and are likely to trust. Shevchenko (2009) points out
that while levels of trust in general are low in post-Soviet society people trust relatives and
friends. Paradoxically, being dependent on subsistence agriculture may also give people
more control over their lives. Although the health of the population is not good there was
not the dramatic increase in mortality amongst men in mid-life experienced in the other
CIS countries and health status is certainly an influence on general well-being. Cultural
factors may also be important given that the population is predominantly Sunni-Muslim.
Certainly further research into the reasons for the higher levels of subjective satisfaction in
Kyrgyzstan is needed.
Thirdly, well-being and satisfaction are influenced by more than economic factors
even in societies where economic security is a major concern. The use of a model
derived from sociological theory enables us to show that the system and social inte-
gration enabling the empowerment of the members of a society is important. What is
surprising is the strength of the contribution of variables other than economic circum-
stances. We should also note that general satisfaction is not influenced by gender, and
age only makes a weak contribution—and then not in all the countries. Given that we
have derived our indicators from a theoretical model we can compare our findings here
with what we found for the wider Europe in 2003 (Abbott and Wallace 2009b, c). The
European analysis, like this one, found that all four quadrants of the Model made a
significant contribution to the variance explained. It found that the main influences on
general satisfaction were; material circumstances, being able to have a decent standard of
living as measured by a deprivation scale and being able to make ends meet; social
cohesion, trust in other people and trust in government; social integration, feeling left
out, and; conditions for empowerment, feeling life is too complicated and health. Being
married and frequent contact with friends and relatives also made a significant contri-
bution for the EU 15 but not for the countries of Central and Eastern Europe. The
strength of the Betas varied somewhat for the two groups of countries but within the
groups the model held. The main differences were that poverty (the inability to make
ends meet) and the two trust variables made a larger contribution to the variance
explained for the CEE countries and health for the EU15. The findings for the wider EU,
like the ones here, suggest that the key explanatory factors are having an adequate
income for a decent standard of living, feeling able to trust other people and government,
being integrated into society, being in good health and feeling in control of ones life.
Economic factors appear to be the most important in both analyses.
Fourthly, in societies that have undergone sudden and dramatic negatively perceived
economic and political change, financial security is a major influence on satisfaction, and
other variables that influence satisfaction are influenced by material circumstances and
may act as buffers that provide some support. Health, for example, is strongly influenced
by material circumstances, and economic circumstances condition the extent to which
individuals are able to access health care. Reliance on kin and friends for support also
provides some buffer to those in poor material circumstances.
218 P. Abbott et al.
123

Fifthly, the lack of social cohesion in the newly formed societies also clearly has a
negative impact on satisfaction with society and life. Lack of trust in other people and in
political and civil society institutions has a negative impact on satisfaction as well as being
a major barrier to social participation.
Sixthly, those who are empowered and able to exercise control over their lives are more
satisfied.
Seventh, while the individual variables explaining the variance in satisfaction vary
across the countries, the general model holds for all four countries. This reinforces the
importance of using a theoretical model from which to derive the variables for
inclusion.
There is evidence that the post-1991 economic and political changes are perceived
negatively by a majority of the people in all of the four countries. All four have declined,
and not yet recovered, in terms of providing social space in which citizens can take some
control of their own lives. Economic hardship is the norm, levels of trust in political and
other institutions are low and there is a feeling of lack of control over life in general. This
is reflected in the comparatively high levels of dissatisfaction. The analysis indicates that to
improve the well-being of the population as measured by their level of satisfaction Gov-
ernments need not only to develop their economies but also to ensure that they build
cohesive societies by ensuring that economic inequalities do not increase and by building
trust in political and social institutions. They also need to develop social and economic
policies that support social integration and empower people. Important here will be the
provision of health and social services as well as opportunities for employment. Economic
growth will be important in job creation and generating the resources to improve social and
other public services, but the Governments will need to ensure that inequalities are
reduced. Building trust will encourage social participation in bridging networks and
empower people, as will investment in social services. In other words, Governments need
to pay attention to building not only the economy but also the public and social institutions
in order to empower their populations. Empowered people who feel in control of their lives
will in turn contribute to the building of the economy.
It is evident that the key to satisfaction is a well-regulated society, a society with
social and systems integration that is able to deliver a decent standard of living to all.
This is common across the EU and CIS countries. The importance of economic factors
declines as societies are able to deliver a decent standard of living to the majority of the
population. What people want to feel satisfied with their lives is much the same where
ever they live. Variation in the factors that explain levels of satisfaction in different
societies are related to context and their place within the opportunity structure of the
societies in which they live.
Acknowledgments This paper draws on data from research produced as part of the Living Conditions,Lifestyles and Health Project. We acknowledge the work undertaken in carrying out the research on whichthis paper is based and are especially grateful for the enthusiastic work of the partners in each of thecountries who organised the surveys. We would also like to thank the anonymous reviewers who providedvery insightful and helpful comments on earlier versions of the paper. The authors remain personallyresponsible for the content, however. Ethical approval for the research on which this paper draws was givenby the Research Ethics Committee of the University of Derby, UK. Grant: The Living Conditions, Healthand Lifestyles Projected was funded by the EU under INCO-Copernicus.
Open Access This article is distributed under the terms of the Creative Commons Attribution Noncom-mercial License which permits any noncommercial use, distribution, and reproduction in any medium,provided the original author(s) and source are credited.
Surviving the Transformation 219
123

Appendix: Variables
Political Influence Scale
Influence national government
Influence regional government
Cronbach’s alpha: Armenia 0.82, Georgia 0.87, Kazakhstan 0.87, Kyrgyzstan 0.86
Freedom Scale
Say what I think
Join any organisation I like
Travel freely anywhere I want
Cronbach’s alpha: Armenia 0.60, Georgia 0.72, Kazakhstan 0.67, Krgyzstan 0.62
Trust Government Scale
President of Country
National Government
National parliament
Regional Government
Political parties
Cronbach’s alpha Armenia 0.91, Georgia 0.74, Kazakhstan 0.87, Kyrgyzstan 0.87
Trust Institutions Scale
Courts
Police
Army
Trade Unions
Cronbach’s alpha: Armenia 0.76, Georgia 0.75, Kazakhstan 0.74, Kyrgyzstan 0.74
Fear of Crime Scale
Burglary from House
Harassed or Threatened on Street
Robbed on Street
Cronbach’s alpha: Armenia 0.91, Georgia 0.95, Kazakhstan 0.89, Kyrgyzstan 0.84
Social Resource Scale
Someone to rely on if feeling depressed
Someone to rely on if need help finding a job
Someone to rely on if need to borrow money to pay urgent bill
Cronbach’s alpha Armenia 0.63, Georgia 0.83, Kazakhstan 0.70, Kyrgyzstan 0.79
220 P. Abbott et al.
123

Personal Support Scale
Someone can really count onto listen when you need to talk
Someone can really count onto help you out in a crisis
Someone you can totally be yourself with
Someone you feel appreciates you as a person
Someone can really count onto comfort you when upset
Cronbach’s alpha: Armenia. 0.83, Georgia, 0.96 Kazakhstan 0.84, Kyrgyzstan 0.83
Malaise Scale
Unable to concentrate
Insomnia
Feel under constant strain
Losing confidence in self
Often shaking and trembling
Frightening thoughts
Spells of exhaustion/fatigue
Feeling of stress
Cronbach’s alpha Armenia 0.81, Georgia 0.84, Kazakhstan 0.72, Kyrgyzstan 0.77
Personal Control Scale
Can not overcome difficulties
Unable to enjoy normal day-to-day activities
Dissatisfied with work
Life is too complicated
Impossible to influence things activities
Feeling lonely
Cronbach’s alpha Armenia 0.70, Georgia 0.72, Kazakhstan 0.67 Kyrgyzstan 0.70
References
Abbott, P. (2002). Living conditions, lifestyle and health in Armenia, Belarus, Georgia, Kazakhstan,Kyrgyzstan, Moldova, Russia and Ukraine. Social trends 1990–2000. Vienna: Institute for AdvancedStudies.
Abbott, P. (2007). Cultural trauma and social quality in post-soviet Moldova and Belarus. East EuropeanPolitics and Societies, 21, 219–258.
Abbott, P., & Beck, M. (2003). The post-soviet health crisis: A sociological explanation. In C. Haerpfer,D. Rotman, & S. Turmov (Eds.), Living conditions, lifestyles and health in post-soviet societies. Minsk:Minsk University Press.
Abbott, P., & Sapsford, R. (2005). Living on the margins: Older people, place and social exclusion. PolicyStudies, 26/1, 29–46.
Abbott, P., & Sapsford, R. (2006). Life-satisfaction in post-soviet Russia and Ukraine. Journal of HappinessStudies, 7, 252–287.
Abbott, P., & Wallace, C. (2007). Talking about health and well-being in post-soviet Ukraine and Russia.Journal of Communist Studies and Transitional Politics, 23, 181–202.
Abbott, P., & Wallace, C. (2009a). Patterns of participation in the formal and informal economies of thecommonwealth of independent states. International Journal of Sociology, 39, 12–38.
Surviving the Transformation 221
123

Abbott, P., & Wallace, C. (2009b). A virtuous spiral of development? Changing quality of life in central andeastern Europe. Paper given at the IX international conference of the international society for thequality of life studies, Florence, July.
Abbott, P., & Wallace, C. (2009c). Regimes for living: Structure, agency and quality of life. Final Report to EU,Workcare. University of Aberdeen, Aberdeen. http://www.abdn.ac.uk/socsci/research/nec/workcare.
Allardt, E. (1993). Having, loving and being: An alternative to the Swedish model of welfare research. InM. Nussbaum & A. Sen (Eds.), The quality of life. Oxford: Clarendon Press.
Andren, D., & Martinsson, P. (2009). What contributes to life satisfaction in transitional Romania? SocialIndicators Research, 87, 189–210.
Bohnke, P. (2005). First European quality of life survey: Life satisfaction, happiness and sense of belonging.Dublin: European Foundation for the Improvement of Living and Working Conditions.
Bohnke, P. (2008). Does society matter? Life satisfaction in an enlarged Europe. Social Indicators Research,87, 189–210.
Burawoy, M. (1997). The soviet decent into capitalism. American Journal of Sociology, 102, 30–44.Burawoy, M. (2000). Sociology for the second great transformation? American Review of Sociology, 26,
693–695.Burawoy, M. (2001). Transition without transformation: Russia’s involuntary road to capitalism. East
European Politics and Societies, 15, 269–290.Burawoy, M., Krotov, P., & Lytkina, T. (2000). Involution and destitution in capitalist Russia. Ethnography,
1, 43–65.Clark, A, Frijters, P., & Shields, M. (2006). Income and happiness: Evidence, explanations and economic
implications, Paris-Jourdain Sciences Ecomomiques, Working Paper no. 2004-24.Cockerham, W., Hintoe, B., Abbott, P., & Haerpfer, C. (2004). Health, lifestyles in central Asia: The case of
Kazakhstan and Kyrgyzstan. Social Science and Medicine, 59, 1409–1421.De la Sablonniere, R., Yaylor, D., Perozzo, C., & Sadykova, N. (2009). ‘‘Reconceptualising relative
deprivation in the context of dramatic change: The challenge confronting the people of Kyrgyzstan.European Journal of Social Psychology, 39, 325–345.
Delhey, J. (2004). Life satisfaction in an enlarged Europe. Luxembourg: European Foundation for theImprovement of Living and Working Conditions, Office for Official Publications of the EuropeanCommission.
Delhey, J., & Newton, K. (2003). Who trusts? The origins of social trust in seven societies. EuropeanSocieties, 5, 93–137.
Durkheim, E. (1952). Suicide: A study in Sociology. London: Routledge. (Translation).EastAgri. (2009). Economic Indicators. http://WWW.eastagri.org (last accessed 14/01/2009).Easterlin, R. A. (2008). Why psychology and economics need each other. In L. Bruno, F. Comin &
M. Pugno (Eds.), Capabilities and happiness. Oxford: Oxford University Press.Easterlin, R. (2009). Lost in transition: Life satisfaction on the road to capitalism. Journal of Economic
Behaviour and Organisation, 71/2, 130–145.Economist Intelligence Unit (2005) The Economist Intelligence Unit’s Quality-of-Life Index:
http://www.economist.com/media/pdf/QUALITY_OF_LIFE.pdy (last accessed 12/09/09).Fligstein, N. (2001). The architecture of markets: An economic sociology of twenty-first century capitalist
societies. Princeton, NJ: Princeton University Press.Galip, H. (2009). Subjective well-being in post-socialist countries: Comparative study of Azerbaijan and
Kyrgyzstan. Paper given at the IX International Conference of the International Society for the Qualityof Life Studies, Florence, July.
Genov, N. (1998). Transformation and anomie: Problems of quality of life in Bulgaria. Social IndicatorsResearch, 43, 197–209.
Giddens, A. (1994). Beyond Left and Right: the future of radical politics. Cambridge: Polity Press.Grun, C., & Klassen, S. (2000). Growth income and well-being in transition. Discussion Paper 2000-14,
Munich: University of Munich. http://epub.ub.umi-mucnchen.de. Last accessed 5th August 2009.Haerpfer, C. (2009). Democratic revolutions in post-communist Europe and post-soviet Eurasia 1988–2009.
Paper presented at APSA Annual Meeting, Toronto, September.Haerpfer, C., & Zeilhofer, H. (1995). Micro-economic developments. In Towards a market economy:
Beyond the point of no return, proceedings of the 2nd E.S.O.M.A.R. east and central Europeanconference, Amsterdam: European Society for Opinion and Marketing Research.
Kahneman, D., & Krueger, A. (2006). Developments in the measurement of subjective well-being. Journalof Economic Perspectives, 30, 3–24.
Kanji, A. (2007). Assessing the quality of life: Reflections from exploratory research in Syria and Tajikistan.Paper presented at the Well-being in International Research Conference, June, Bath: University ofBath.
222 P. Abbott et al.
123

Krivosheyev, V. (2004). Aonomy (sic) in modern Russian society. Social Sciences, 35, 50–53.Land, K., Lamb, V., Meadows, S., & Taylor, A. (2007). Measuring trends in child well-being: An evi-
denced-based approach. Social Indicators Research, 80, 105–132.Ledeneva, A. V. (2006). How Russia really works: The informal practices that shaped post-soviet politics
and business. Ithaca and London: Cornell University Press.Meadow, H. L., Mentzer, J. T., Rachtz, D. R., & Sirgy, M. J. (1992). A life satisfaction measure based on
judgement theory. Social Indicators Research, 26/1, 23–59.Milanovic, B. (1998). Income equality and poverty during the transition: A survey of the evidence.
Washington, DC: World Bank.Mirowsky, J. E., & Ross, C. E. (2003a). Education, social status and health. Hawthorne, NY: Aldine de
Gruyter.Mirowsky, J. E., & Ross, C. E. (2003b). Social causes of psychological distress. Hawthorne, NY: Aldine de
Gruyter.Namazie, C., & Sandfrey, P. (2002). Happiness in transition: The case of Kyrgyzstan. Review of Devel-
opment Economics, 5, 392–405.Nazpary, J. (2002). Post-soviet chaos: Violence and dispossession in Kazakhstan. London: Pluto Press.Phillips, D. (2006). Quality of life. Abingdon: Routledge.Pridemore, W., Canlin, M., & Cochran, J. (2007). An interrupted time-series analysis of Durkheim’s social
deregulation thesis: The case of the Russian federation. Justice Quarterly, 24, 271–290.Richardson, D., Hoelscher, P., & Bradshaw, J. (2008). Child well-being in central and eastern European
countries(CEE) and the commonwealth of independent states. Child Indicators Research, 1, 211–250.Rose, R. (2009). Understanding post-communist transformations: A bottom up approach. Abingdon and
New York: Routledge.Sapsford, R., & Abbott, P. (2006). Trust, confidence and social environment in post-communist societies.
Communist and Post-Communist Societies, 39, 59–71.Sen, A. (1993). Capability and well-being. In M. Nassabaum & A. Sen (Eds.), The quality of life. Oxford:
Clarendon Press.Shevchenko, O. (2009). Crisis and the everyday in post-soviet Moscow. Bloomington, Indiana: Indiana
University Press.Sztompka, P. (2002). Cultural trauma: The other face of social change. European Journal of Social Theory,
3, 441–465.Tarling, R. (2009). Statistical modelling for social researchers. London: Routledge.UNU-WIDER. (2008). World income inequality database, Version 2.0c. WWW.wider.unu.edu/research/
en_GB/database.Veenhoven, R. (2001). Are the Russians as unhappy as they say they are? Journal of Happiness Studies, 2,
111–136.Veenhoven, R. (2008). Sociological theories of subjective well-being. In M. Eid & R. Larsen (Eds.),
The science of subjective well-being: A tribute to Ed Diener. New York: Guilford Publications.Veenhoven, R. (2009). Well-being IN nations or well-being OF nations. Social Indicators Research, 91,
5–21.Walder, A. G. (1994). The decline of communist power: Elements of a theory of institutional change. Theory
and Society, 23, 297–323.Wallace, C., &Abbott, P. (2009). The consequences for health of system disintegration in the commonwealth
of independent states. Paper given at the European Sociological Association Conference, Lisbon,September.
Wallace, C., & Haerpfer, C. (2002). Patterns of participation in the informal economy in east-central Europe.In R. Neef & M. Stanculescu (Eds.), The social impact of the informal economies in eastern europe.Aldershot: Ashgate.
World Bank. (2000). Making transitions work for everyone: Poverty and inequality in Europe and centralAsia. Washington, DC: World Bank.
Surviving the Transformation 223
123
Copyright © 2022 FDOKUMEN