SurveyMotion: What Can We Learn from Sensor Data about ...
16
1 SurveyMotion: What Can We Learn from Sensor Data about Respondents’ Completion and Response Behavior in Mobile Web Surveys? 1 Jan Karem Höhne University of Mannheim (Germany) Universitat Pompeu Fabra (Spain) Stephan Schlosser University of Göttingen (Germany) Abstract Participation in web surveys via smartphones increased continuously in recent years. The reasons for this increase are a growing proportion of smartphone owners and an increase in mobile Internet access. However, research has shown that smartphone respondents are frequently distracted and/or multitasking, which might affect completion and response behavior in a negative way. We propose “SurveyMotion (SMotion),” a JavaScript-based paradata tool for mobile devices that can gather information about respondents’ motions during web survey completion by using sensor data. Specifically, we collect data about the total acceleration (TA) of smartphones. We conducted a lab experiment and varied the form of survey completion (e.g., standing or walking). Furthermore, we employed questions with different response formats (e.g., radio buttons and sliders) and measured response times. The results reveal that SMotion detects higher TAs of smartphones for respondents with comparatively higher motion levels. In addition, respondents’ motion level affects response times and the quality of responses given. The SMotion tool promotes the exploration of how respondents complete mobile web surveys and could be employed to understand how future mobile web surveys are completed. Keywords: acceleration, JavaScript, mobile sensors, passive data collection, response quality, smartphones, web survey Introduction and Background Recently, the use of mobile devices, such as smartphones and tablets, in web survey responding has increased markedly. As shown by Revilla et al. (2016), this is particularly observable for smartphones. The reasons for this trend seem to be twofold: first, the number of people who own a smartphone has accumulated and, second, high-speed mobile Internet access has increased. In addition, smartphones principally allow respondents to take part in surveys irrespective of their locality and situation (Mavletova, 2013). Previous research has shown that smartphone respondents are frequently surrounded by other people (Toninelli & Revilla, 2016a), which might affect completion and response behavior negatively because respondents may be distracted, due to their environment and/or multitasking. Lynn and Kaminska (2012), for instance, differentiate between distractions that This document is a preprint and thus it may differ from the final version: Höhne, J.K., & Schlosser, S. (2019). SurveyMotion: What can we learn from sensor data about respondents’ completion and res ponse behavior in mobile web surveys? International Journal of Social Research Methodology, 22, 379 –391. DOI: 10.1080/13645579.2018.1550279.
-
Upload
khangminh22 -
Category
Documents
-
view
5 -
download
0
Transcript of SurveyMotion: What Can We Learn from Sensor Data about ...
1
SurveyMotion: What Can We Learn from Sensor Data about Respondents’
Completion and Response Behavior in Mobile Web Surveys?1
Jan Karem Höhne
University of Mannheim (Germany)
Universitat Pompeu Fabra (Spain)
Stephan Schlosser
University of Göttingen (Germany)
Abstract
Participation in web surveys via smartphones increased continuously in recent years. The
reasons for this increase are a growing proportion of smartphone owners and an increase in
mobile Internet access. However, research has shown that smartphone respondents are
frequently distracted and/or multitasking, which might affect completion and response behavior
in a negative way. We propose “SurveyMotion (SMotion),” a JavaScript-based paradata tool
for mobile devices that can gather information about respondents’ motions during web survey
completion by using sensor data. Specifically, we collect data about the total acceleration (TA)
of smartphones. We conducted a lab experiment and varied the form of survey completion (e.g.,
standing or walking). Furthermore, we employed questions with different response formats
(e.g., radio buttons and sliders) and measured response times. The results reveal that SMotion
detects higher TAs of smartphones for respondents with comparatively higher motion levels.
In addition, respondents’ motion level affects response times and the quality of responses given.
The SMotion tool promotes the exploration of how respondents complete mobile web surveys
and could be employed to understand how future mobile web surveys are completed.
Keywords: acceleration, JavaScript, mobile sensors, passive data collection, response quality,
smartphones, web survey
Introduction and Background
Recently, the use of mobile devices, such as smartphones and tablets, in web survey responding
has increased markedly. As shown by Revilla et al. (2016), this is particularly observable for
smartphones. The reasons for this trend seem to be twofold: first, the number of people who
own a smartphone has accumulated and, second, high-speed mobile Internet access has
increased. In addition, smartphones principally allow respondents to take part in surveys
irrespective of their locality and situation (Mavletova, 2013).
Previous research has shown that smartphone respondents are frequently surrounded by
other people (Toninelli & Revilla, 2016a), which might affect completion and response
behavior negatively because respondents may be distracted, due to their environment and/or
multitasking. Lynn and Kaminska (2012), for instance, differentiate between distractions that
This document is a preprint and thus it may differ from the final version: Höhne, J.K., & Schlosser, S. (2019).
SurveyMotion: What can we learn from sensor data about respondents’ completion and response behavior in
mobile web surveys? International Journal of Social Research Methodology, 22, 379–391. DOI:
10.1080/13645579.2018.1550279.
2
demand aural attention (e.g., music playing in the background), distractions that demand visual
attention (e.g., looking after children), and multitasking (e.g., having a conversation). In line
with this classification, Toninelli and Revilla (2016b) show that respondents using a
smartphone report more distractions and/or multitasking behavior, such as watching TV and
talking with other people, than respondents using a PC. However, researchers usually gather
information about distractions and multitasking by means of self-reports. This implies that
respondents must confess that they do not pay close attention, which might cause imprecise
measures of distractions and/or multitasking.
Zwarun and Hall (2014) provide a somewhat different distinction. They distinguish
between environmental distractions (e.g., background noise), non-media multitasking (e.g.,
having a conversation), and electronic-media multitasking (e.g., checking emails). Electronic-
media multitasking can be further differentiated into multitasking on the same device and on
different devices. The first form of electronic-media multitasking can be registered passively
by means of JavaScript-based paradata (see Callegaro, 2013; Höhne, Revilla, & Lenzner, 2018;
Höhne & Schlosser, 2018; Höhne, Schlosser, & Krebs, 2017; Revilla & Couper, 2018;
Schlosser & Höhne, 2017; Sendelbah, Vehovar, Slavec, & Petrovčič, 2016; Zwarun & Hall,
2014). For instance, Schlosser and Höhne (2017) show that electronic-media multitasking on
the same device occurs among 6% of all smartphone respondents in a web survey; on average,
they leave the survey 1.2 times and for 21.7 seconds.
A further way to passively observe respondents’ behavior in mobile web surveys is to
gather sensor data (see Toepoel & Lugtig, 2015) – either via applications installed on the device
or via JavaScript implemented in web pages.1 Mobile devices, such as smartphones, contain a
large number of implemented mobile sensors, such as accelerometers, that collect data that
recognize user behavior (see Elhoushi, Georgy, Noureldin, & Korenberg, 2017; He, Hu, &
Wang, 2016; Toepoel & Lugtig, 2015). Such sensors can unobtrusively record users’
physiological states, such as movements and speed. For instance, if a person moves or walks,
he or she is usually creating different forms of acceleration2 (see He, Hu, & Wang, 2016),
which, in turn, is detected by the mobile device that is usually worn on the body (e.g., in the
pocket). In principle, this situation can be applied to mobile respondents completing a web
survey on a smartphone. This “respondent-device” link renders the possibility to differentiate
between mobile respondents on the basis of their motions (i.e., acceleration). In addition, this
link can be used to investigate completion and response behavior in mobile web surveys.
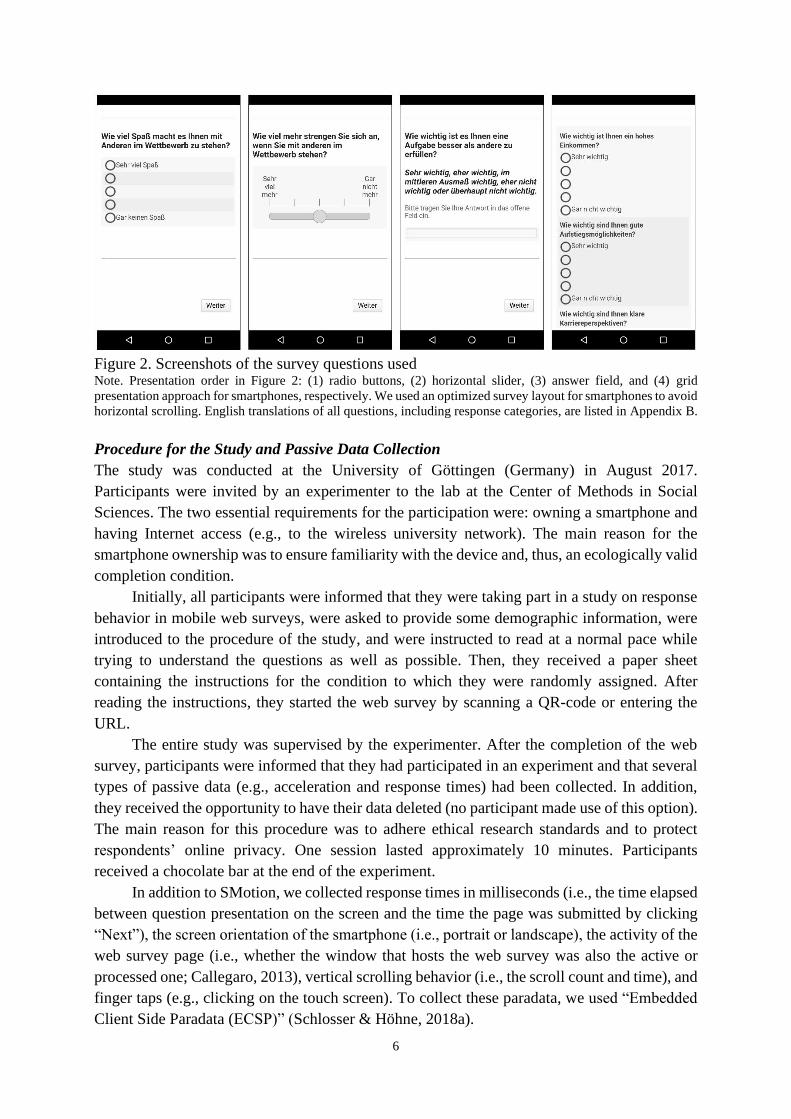
Imagine a Cartesian coordinate system with three dimensions. In this system, movements
can be described as accelerations on an x-axis (e.g., left and right), y-axis (e.g., up and down),
and z-axis (e.g., back and forth), respectively. Figure 1 illustrates the sensitivity axes of an
accelerometer implemented in a smartphone.
1 Elhoushi et al. (2017) provide a list of different sensor types, data acquisition approaches, and setups, including
brief descriptions. For instance, the freely available application “CPU-Z (CPUID)” for Android devices provides
a list of sensors implemented in the device and displays sensor information in real time. 2 The International System unit for acceleration is “meter per second squared (m/s2)”.

3
Figure 1. Sensitivity axes of an accelerometer implemented in a smartphone Note. The accelerometer records the acceleration events on three axes with predefined directions. The x-axis
indicates motions to the left and to the right, the y-axis indicates motions upwards and downwards, and the z-axis
indicates motions backwards and forwards.
We now propose “SurveyMotion (SMotion),” a JavaScript-based tool for measuring the
motion level of mobile devices, in general, and smartphones, in particular, to explore
completion conditions and to draw conclusions about the context of web survey completion.
More precisely, SMotion gathers the total acceleration (TA), which is defined as follows:
TA = √ax2 + ay
2 + az2
Equation 1. Determining total acceleration (TA) Note. Accelerations (a) along the x-, y-, and z-axis are defined as ax, ay, and az, respectively.
In order to measure the TA of mobile devices containing an accelerometer, SMotion uses
the “DeviceMotionEvent” – an application programming interface (API) – that provides
information about the speed of position and orientation changes. This API can be extended by
so-called properties, such as “.acceleration”, which are also part of the SMotion code (see
Appendix A for the JavaScript code). The SMotion code can be implemented as an invisible,
user-defined question in a web survey page and, thus, operates on page level. Upon submission
of the page, the TA data are stored together with respondents’ answers in the same dataset (for
a more detailed description, see Schlosser & Höhne, 2018a).
This usability study was inspired by sensing-based applications for smartphones, such as
step counters. The main goal was to introduce a new way to research completion and response
behavior in mobile web surveys. Thus, we explored the motion level of respondents using a
smartphone in web surveys and additionally investigated response times and the quality of
4
responses. For this purpose, we first outline the research hypotheses. Subsequently, we describe
the experimental design, the underlying sample, the survey questions used, the procedure of the
study, and the analytical strategy. We then present the results of the study and, finally, discuss
practical implications associated with sensor data and address future perspectives and ethical
considerations.
Research Hypotheses
In physics, acceleration is defined as the rate of change of velocity of an object over time. Thus,
the lower/higher the rate of change of velocity of an object in a specific time period is, the
lower/higher its acceleration. This also applies to respondents’ physical motions, such as body
and hand motions, which are transferred to the smartphone while they complete a web survey.
Therefore, smartphones can be used to record peoples’ motions and to investigate their actions
(see Elhoushi et al., 2017). For instance, respondents who walk while completing a web survey
on their smartphone should cause a higher TA than respondents who sit while completing a web
survey on their smartphone. Consequently, we expected that SMotion registers higher TA
values for respondents with a higher motion level, which would then indicate a proper
measurement (Hypothesis 1).
Performing more than one task simultaneously implies a relocation of a person’s mental
resources between these activities (Foehr, 2006; Monsell, 2003; Zwarun & Hall, 2014). For
instance, if a respondent completes a mobile web survey while taking a walk, his or her focus
temporarily switches between the survey (i.e., the question under consideration) and the
surroundings (e.g., the sidewalk or street). First, this might increase response times because
respondents must devote additional time to the secondary task (i.e., environmental orientation).
Second, this might increase response times because respondents must reorient themselves and
partially restart the response processes after re-focusing on the survey (Höhne & Schlosser,
2018). Therefore, we expected that the higher the motion level is, the higher the response times
of respondents (Hypothesis 2).
Engaging in several tasks at the same time (e.g., completing a web survey and walking
around) may also affect the quality of responses in an undesirable way. Since respondents must
expend further effort to the secondary task and must reorient themselves and partially begin the
cognitive processing of the questions anew when re-focusing on the survey, it can be assumed
that this increases the effort in responding and decreases the motivation of respondents. This
might cause a superficial rather than a conscientious responding, which supports the occurrence
of response bias and, thus, results in low response quality. In this study, we use primacy effects
(i.e., attraction to the beginning of the response scale) as an indicator of low response quality.
Based on our reasoning, we expected that the higher the motion level is, the lower the response
quality in terms of primacy effects (Hypothesis 3).
Method
Experimental Design
We employed a 2-by-2 between-subject design and randomly assigned participants to one of
four experimental groups by using random numbers. The first group (n = 22) was seated in front
of a desk with the smartphone lying on the desk during survey completion. The second group
(n = 22) stood at a fixed point and held the smartphone during survey completion. The third
5
group (n = 23) walked along an aisle with the smartphone in their hands during survey
completion. The fourth group (n = 22) climbed stairs with the smartphone in their hands during
survey completion.
Sample
A total of N = 120 university students participated in the experiment. Due to technical
difficulties with the Internet connection (n = 2) and the acquisition of SMotion (n = 28)3, data
could not be collected accurately for some respondents. Furthermore, n = 1 participant had
deactivated JavaScript. All these participants were excluded from the dataset, leaving n = 89
for the statistical analyses. These participants were between 18 and 42 years old with a mean
age of 24.5 and a standard deviation of 4.4. 55% were female and at least 85% had participated
previously in a web survey. Furthermore, 99% used their smartphone and 96% used the Internet
on a daily basis.
To evaluate the effectiveness of random assignment and the sample composition between
the four experimental groups, we also conducted chi-square tests. The results showed no
statistically significant differences regarding the following socio-demographic characteristics:
age [χ2(3) = 2.33, p = .51], gender [χ2(3) = 1.28, p = .73], survey participation [χ2(3) = 1.84, p
= .61], smartphone usage [χ2(3) = 3.08, p = .38], Internet usage [χ2(3) = 2.12, p = .55].
Survey Questions
We used three single questions with different response formats (i.e., one with radio buttons, one
with a horizontal slider, and one with an answer field for entering the response category) as
well as eight questions with a grid presentation approach (i.e., item-by-item). The three single
questions dealt with achievement motivation and were adapted from the Cross Cultural Survey
of Work and Gender Attitudes (2010). The eight grid questions dealt with job motivation and
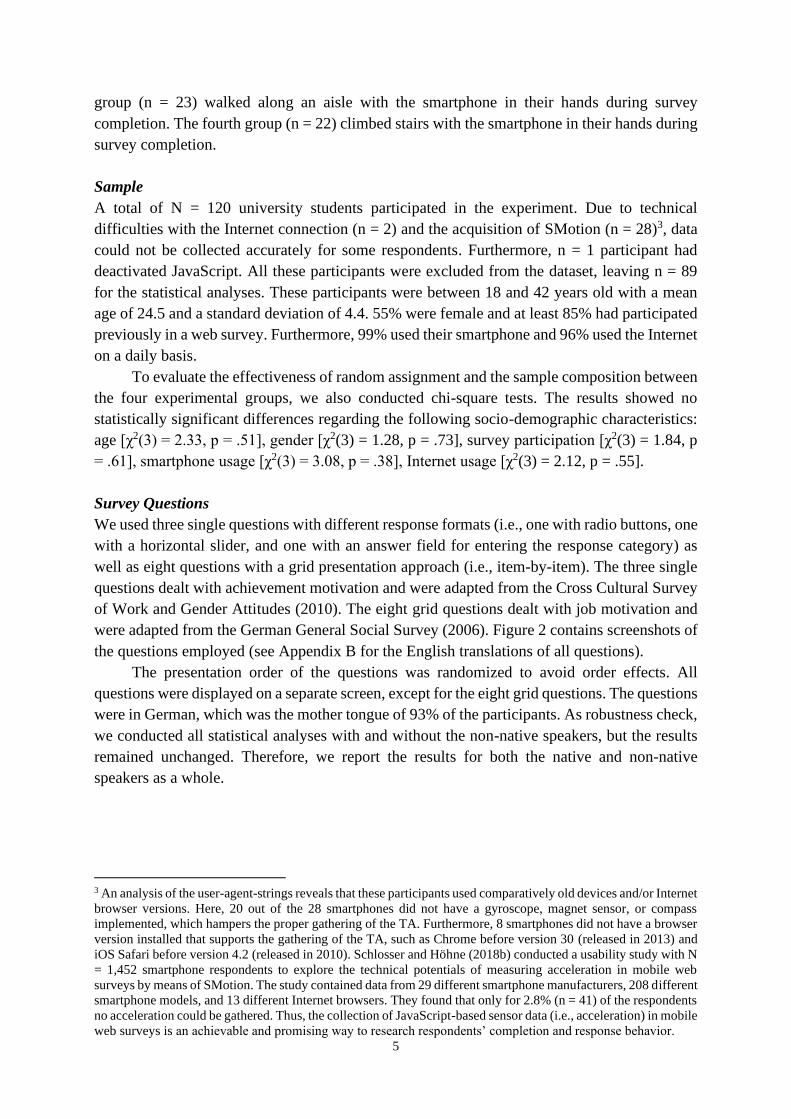
were adapted from the German General Social Survey (2006). Figure 2 contains screenshots of
the questions employed (see Appendix B for the English translations of all questions).
The presentation order of the questions was randomized to avoid order effects. All
questions were displayed on a separate screen, except for the eight grid questions. The questions
were in German, which was the mother tongue of 93% of the participants. As robustness check,
we conducted all statistical analyses with and without the non-native speakers, but the results
remained unchanged. Therefore, we report the results for both the native and non-native
speakers as a whole.
3 An analysis of the user-agent-strings reveals that these participants used comparatively old devices and/or Internet
browser versions. Here, 20 out of the 28 smartphones did not have a gyroscope, magnet sensor, or compass
implemented, which hampers the proper gathering of the TA. Furthermore, 8 smartphones did not have a browser
version installed that supports the gathering of the TA, such as Chrome before version 30 (released in 2013) and
iOS Safari before version 4.2 (released in 2010). Schlosser and Höhne (2018b) conducted a usability study with N
= 1,452 smartphone respondents to explore the technical potentials of measuring acceleration in mobile web
surveys by means of SMotion. The study contained data from 29 different smartphone manufacturers, 208 different
smartphone models, and 13 different Internet browsers. They found that only for 2.8% (n = 41) of the respondents
no acceleration could be gathered. Thus, the collection of JavaScript-based sensor data (i.e., acceleration) in mobile
web surveys is an achievable and promising way to research respondents’ completion and response behavior.
6
Figure 2. Screenshots of the survey questions used Note. Presentation order in Figure 2: (1) radio buttons, (2) horizontal slider, (3) answer field, and (4) grid
presentation approach for smartphones, respectively. We used an optimized survey layout for smartphones to avoid
horizontal scrolling. English translations of all questions, including response categories, are listed in Appendix B.
Procedure for the Study and Passive Data Collection
The study was conducted at the University of Göttingen (Germany) in August 2017.
Participants were invited by an experimenter to the lab at the Center of Methods in Social
Sciences. The two essential requirements for the participation were: owning a smartphone and
having Internet access (e.g., to the wireless university network). The main reason for the
smartphone ownership was to ensure familiarity with the device and, thus, an ecologically valid
completion condition.
Initially, all participants were informed that they were taking part in a study on response
behavior in mobile web surveys, were asked to provide some demographic information, were
introduced to the procedure of the study, and were instructed to read at a normal pace while
trying to understand the questions as well as possible. Then, they received a paper sheet
containing the instructions for the condition to which they were randomly assigned. After
reading the instructions, they started the web survey by scanning a QR-code or entering the
URL.
The entire study was supervised by the experimenter. After the completion of the web
survey, participants were informed that they had participated in an experiment and that several
types of passive data (e.g., acceleration and response times) had been collected. In addition,
they received the opportunity to have their data deleted (no participant made use of this option).
The main reason for this procedure was to adhere ethical research standards and to protect
respondents’ online privacy. One session lasted approximately 10 minutes. Participants
received a chocolate bar at the end of the experiment.
In addition to SMotion, we collected response times in milliseconds (i.e., the time elapsed
between question presentation on the screen and the time the page was submitted by clicking
“Next”), the screen orientation of the smartphone (i.e., portrait or landscape), the activity of the
web survey page (i.e., whether the window that hosts the web survey was also the active or
processed one; Callegaro, 2013), vertical scrolling behavior (i.e., the scroll count and time), and
finger taps (e.g., clicking on the touch screen). To collect these paradata, we used “Embedded
Client Side Paradata (ECSP)” (Schlosser & Höhne, 2018a).
7
Analytical Strategy
The sampling rate of the acceleration – on all three axes – by means of SMotion primarily
depends on the device and/or on frequency restrictions set in the JavaScript code. In this study,
we did not set any frequency restrictions in order to register the TA as precisely as possible (see
Appendix A for the JavaScript code). On average, the TA was measured every 53 milliseconds.4
To manage this relatively large amount of data, we calculated, per web survey page, a mean
value of the TA for each respondent. These mean values were based on the raw data without
checking for comparatively low or high values. The main reason for this strategy is that such
values represent particular characteristics of different motion levels (see Figure 3).
Similar to paradata, such as response times, the TA gathered with SMotion can be
analyzed on different aggregation levels. The first level contains TA data per person and page,
the second level contains averaged TA data per person and page, the third level contains
averaged TA data per page, and the fourth level contains only the average TA across all pages.
To define response time outliers, we first checked whether respondents left the web
survey page prior to its completion using “SurveyFocus (SF)” (see Höhne & Schlosser, 2018;
Höhne, Schlosser, & Krebs, 2017). None of the participants engaged in this kind of electronic-
media multitasking. Subsequently, we replaced observed response times beyond the
lower/upper fifth percentile with the lower/upper fifth percentile values, respectively. All
response time analyses were conducted with and without log transformation, but the results
remained unchanged. Thus, we report the untreated solution. Response times were not adjusted
for baseline reading speed (see Couper & Kreuter, 2013).
In addition, we checked whether respondents changed the screen orientation (e.g., from
portrait to landscape) but this kind of completion behavior did not occur. All respondents
completed the survey in portrait orientation. We also tested whether the experimental groups
differ regarding the number of finger taps on the screen, the number of scrolling events (at least
100 ms lasted between each scrolling event), and the scrolling time. However, there were no
significant differences between the groups.
To evaluate the equality of variances between the experimental groups, we calculated
Levene tests for the TAs and response times. No significant differences for response times
existed. Hence, only the results for the TAs are reported. In addition, we calculated one-way
analyses of variances (ANOVAs) using the Games-Howell correction for unequal variances
(for the TAs) and the Bonferroni correction for equal variances (for the response times). We
also calculated Cohen’s d (Cohen, 1969) as a measure of effect size for the TAs and response
times. Finally, we calculated chi-square tests to investigate primacy effects (i.e., the attraction
to the first response category of the scale).
There were no substantial differences between the groups 1 and 2 with a comparatively
low motion level and the groups 3 and 4 with a comparatively high motion level. Furthermore,
there were no substantial differences between the three single questions. To reduce the number
of statistical tests and efficiently summarize the results, we aggregated the data for the low
motion groups (1 and 2) as well as the high motion groups (3 and 4) and report the results for
the three aggregated single questions and the eight questions with a grid presentation approach,
respectively.
4 It is evident that the sampling rate for each device is constant across all study-relevant questions.
8
The preparation of the SMotion data and the paradata was conducted with R version 3.4.0.
This also applies to all subsequent statistical analyses reported in this article.
Results
Total Acceleration Data
To investigate the link between respondents’ motion level and acceleration gathered by
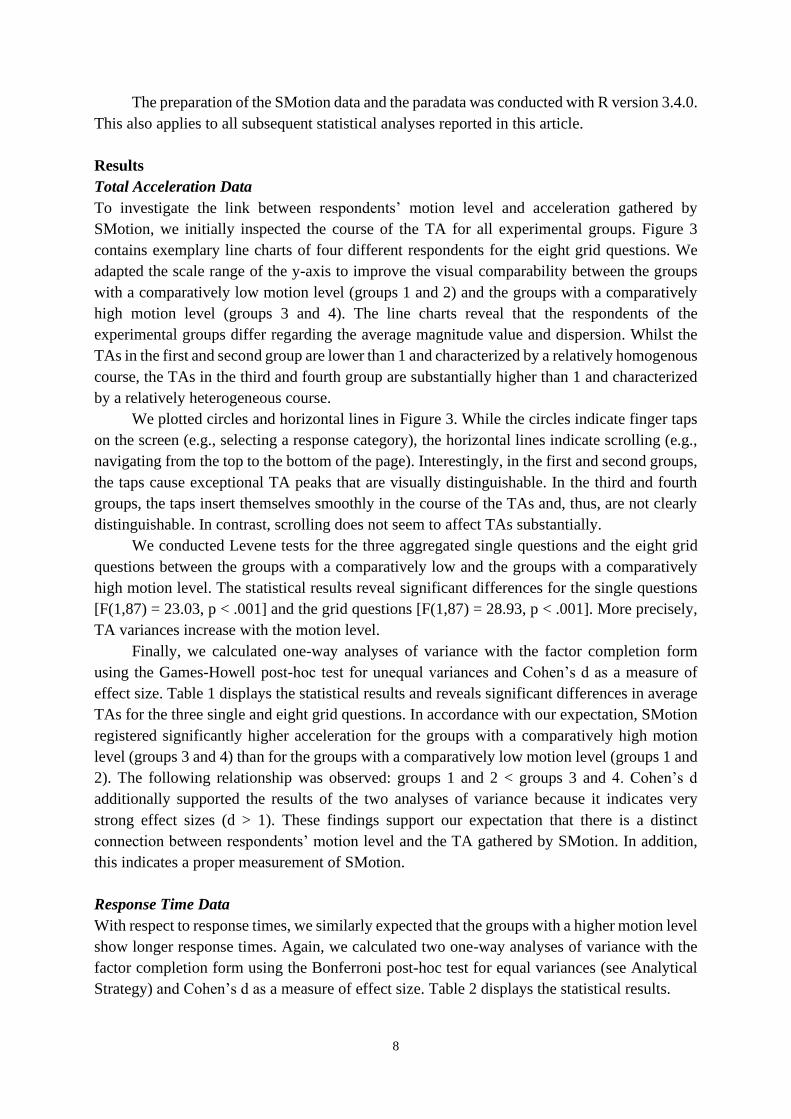
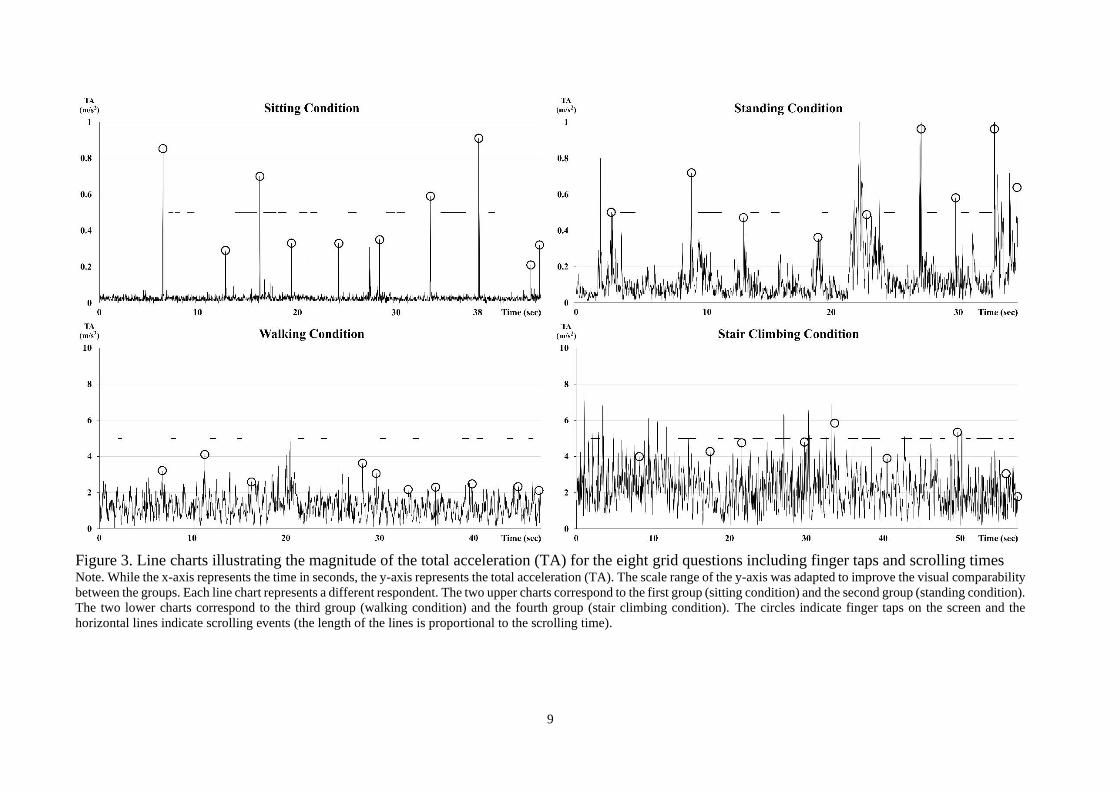
SMotion, we initially inspected the course of the TA for all experimental groups. Figure 3
contains exemplary line charts of four different respondents for the eight grid questions. We
adapted the scale range of the y-axis to improve the visual comparability between the groups
with a comparatively low motion level (groups 1 and 2) and the groups with a comparatively
high motion level (groups 3 and 4). The line charts reveal that the respondents of the
experimental groups differ regarding the average magnitude value and dispersion. Whilst the
TAs in the first and second group are lower than 1 and characterized by a relatively homogenous
course, the TAs in the third and fourth group are substantially higher than 1 and characterized
by a relatively heterogeneous course.
We plotted circles and horizontal lines in Figure 3. While the circles indicate finger taps
on the screen (e.g., selecting a response category), the horizontal lines indicate scrolling (e.g.,
navigating from the top to the bottom of the page). Interestingly, in the first and second groups,
the taps cause exceptional TA peaks that are visually distinguishable. In the third and fourth
groups, the taps insert themselves smoothly in the course of the TAs and, thus, are not clearly
distinguishable. In contrast, scrolling does not seem to affect TAs substantially.
We conducted Levene tests for the three aggregated single questions and the eight grid
questions between the groups with a comparatively low and the groups with a comparatively
high motion level. The statistical results reveal significant differences for the single questions
[F(1,87) = 23.03, p < .001] and the grid questions [F(1,87) = 28.93, p < .001]. More precisely,
TA variances increase with the motion level.
Finally, we calculated one-way analyses of variance with the factor completion form
using the Games-Howell post-hoc test for unequal variances and Cohen’s d as a measure of
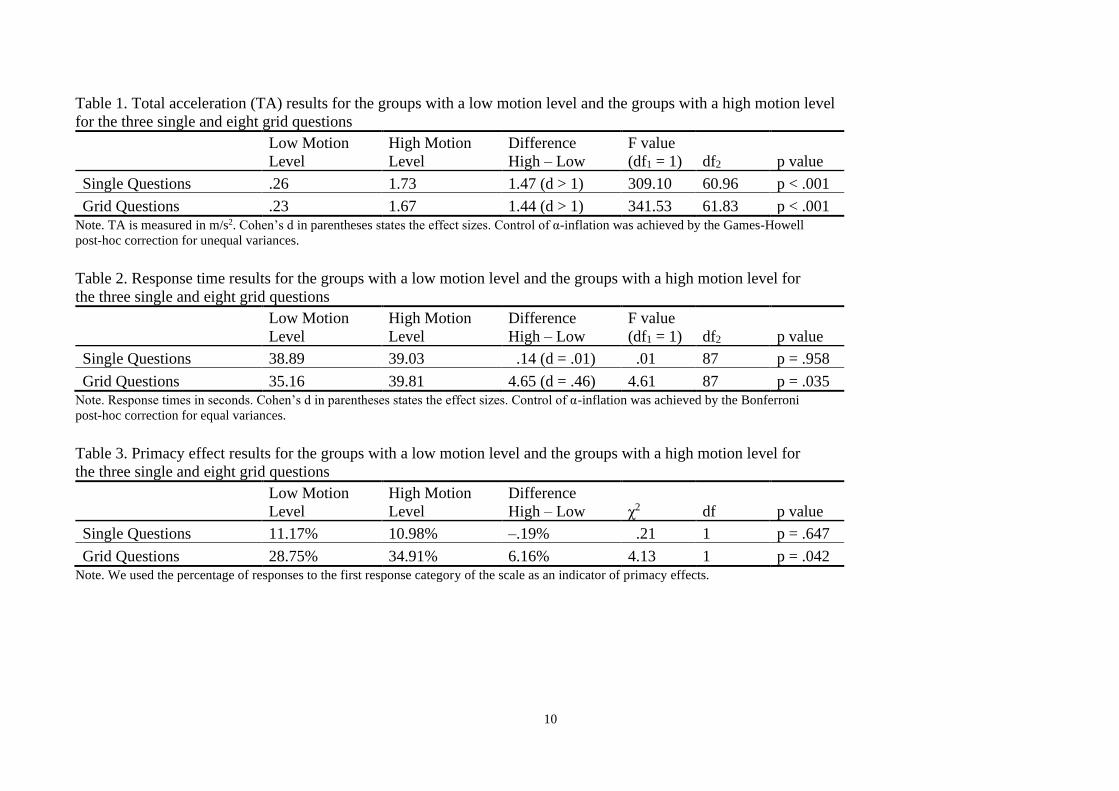
effect size. Table 1 displays the statistical results and reveals significant differences in average
TAs for the three single and eight grid questions. In accordance with our expectation, SMotion
registered significantly higher acceleration for the groups with a comparatively high motion
level (groups 3 and 4) than for the groups with a comparatively low motion level (groups 1 and
2). The following relationship was observed: groups 1 and 2 < groups 3 and 4. Cohen’s d
additionally supported the results of the two analyses of variance because it indicates very
strong effect sizes (d > 1). These findings support our expectation that there is a distinct
connection between respondents’ motion level and the TA gathered by SMotion. In addition,
this indicates a proper measurement of SMotion.
Response Time Data
With respect to response times, we similarly expected that the groups with a higher motion level
show longer response times. Again, we calculated two one-way analyses of variance with the
factor completion form using the Bonferroni post-hoc test for equal variances (see Analytical
Strategy) and Cohen’s d as a measure of effect size. Table 2 displays the statistical results.
9
Figure 3. Line charts illustrating the magnitude of the total acceleration (TA) for the eight grid questions including finger taps and scrolling times Note. While the x-axis represents the time in seconds, the y-axis represents the total acceleration (TA). The scale range of the y-axis was adapted to improve the visual comparability
between the groups. Each line chart represents a different respondent. The two upper charts correspond to the first group (sitting condition) and the second group (standing condition).
The two lower charts correspond to the third group (walking condition) and the fourth group (stair climbing condition). The circles indicate finger taps on the screen and the
horizontal lines indicate scrolling events (the length of the lines is proportional to the scrolling time).
10
Table 1. Total acceleration (TA) results for the groups with a low motion level and the groups with a high motion level
for the three single and eight grid questions
Low Motion
Level
High Motion
Level
Difference
High – Low
F value
(df1 = 1) df2 p value
Single Questions .26 1.73 1.47 (d > 1) 309.10 60.96 p < .001
Grid Questions .23 1.67 1.44 (d > 1) 341.53 61.83 p < .001 Note. TA is measured in m/s2. Cohen’s d in parentheses states the effect sizes. Control of α-inflation was achieved by the Games-Howell
post-hoc correction for unequal variances.
Table 2. Response time results for the groups with a low motion level and the groups with a high motion level for
the three single and eight grid questions
Low Motion
Level
High Motion
Level
Difference
High – Low
F value
(df1 = 1) df2 p value
Single Questions 38.89 39.03 .14 (d = .01) .01 87 p = .958
Grid Questions 35.16 39.81 4.65 (d = .46) 4.61 87 p = .035 Note. Response times in seconds. Cohen’s d in parentheses states the effect sizes. Control of α-inflation was achieved by the Bonferroni
post-hoc correction for equal variances.
Table 3. Primacy effect results for the groups with a low motion level and the groups with a high motion level for
the three single and eight grid questions
Low Motion
Level
High Motion
Level
Difference
High – Low χ2 df p value
Single Questions 11.17% 10.98% –.19% .21 1 p = .647
Grid Questions 28.75% 34.91% 6.16% 4.13 1 p = .042 Note. We used the percentage of responses to the first response category of the scale as an indicator of primacy effects.
11
In line with our previous expectation, it is observable that the groups with a higher motion level
produced longer response times than the groups with a lower motion level. However, this is
only significant for the questions with a grid presentation approach. In accordance with this
result, Cohen’s d indicates a medium strong effect size for the grid questions (d > .40). For the
single questions, no significant differences can be observed. Cohen’s d indicates a negligibly
small effect size (d < .10). Altogether, it seems that the question presentation format (single vs.
grid) matters.
Response Quality
In addition to TA data and response times, we compared the quality of responses between the
groups with a comparatively low motion level and the groups with a comparatively high motion
level. More precisely, we investigated respondents’ attraction to the beginning of the scale (i.e.,
the first response category). We expected that primacy effects are significantly more
pronounced in the high motion groups and calculated chi-square tests for the single and grid
questions, respectively. Similar to the results on response time data, Table 3 shows that this
applies to the questions with a grid presentation approach but not to the single questions. In
contrast, for the single questions, the percentage of responses to the first response category is
slightly higher in the low motion level groups. Hence, it seems that the question presentation
approach has an impact on response quality in terms of primacy effects when comparing groups
with different motion levels.
Discussion and Conclusion
This study explored the usability and usefulness of sensor data in mobile web surveys. We
proposed the tool “SurveyMotion (SMotion),” which enables researchers to register the total
acceleration (TA) of mobile devices, such as smartphones, by means of JavaScript. The findings
of the lab experiment show that respondents’ motion levels manifest themselves in the TA of
smartphones and, thus, provide supporting evidence for the presence of a respondent-device
link. For instance, respondents who walk around during web survey completion produce
different TA patterns than respondents who sit at a desk during web survey completion. Hence,
smartphone respondents can be differentiated on the basis of their motions (i.e., acceleration)
so that sensor data might be advantageous for mobile web surveys by allowing investigators to
draw conclusions about completion and response behavior.
As suggested by previous research, the simultaneous performance of multiple tasks
demands mental resources and increases completion time (Foehr, 2006; Monsell, 2003; Zwarun
& Hall, 2014). Therefore, we expected to observe longer response times for the groups with
comparatively high motion levels than for the groups with comparatively low motion levels.
This relation was only supported for the questions with a grid presentation approach (i.e., item-
by-item). One reason might be that the grid questions implied a more intricate and complex
navigation and coordination task (see Dillman, Smyth, & Christian, 2009), due to a
comparatively small screen size and comparatively intricate input capabilities. Respondents had
to pinpoint several question stems and response categories accompanied by vertical scrolling
and screen taps for providing their responses. In contrast, the single questions were presented
individually on the web-survey page without pinpointing question stems and response
12
categories by vertical scrolling, which required a simpler navigation and coordination task.
However, this reasoning lacks empirical evidence and requires additional research.
We found that the respondents with a comparatively high motion level produced lower
response quality than respondents with a low motion level. However, this finding only applies
to the questions with a grid presentation. Similar to response times, we see the reason in the
device-related issues and the comparatively high navigation and coordination task of the grid
presentation approach in smartphones, which seems to affect response behavior negatively and
support the occurrence of response bias (see Couper, Tourangeau, Conrad, & Zhang, 2013). In
this study, we only investigated one single indicator of low response quality (i.e., primacy
effects). Therefore, we recommend that future research employ further and/or multiple
indicators to draw robust conclusions about response quality across groups with different
motion levels.
The use of sensor data, such as acceleration, in mobile web surveys to explore
respondents’ completion and response behavior is in its infancy. Hence, much research exists
that could be addressed in the future. Two major routes could be addressed.
The first route is particularly related to technical considerations. To assess the usability
of sensor data, it seems necessary to decide on the merits and limits of their collection – via
applications and JavaScript – for different mobile devices. For instance, in this study, we could
not gather TAs for approximately 23% of the participants, which is attributable to device
properties and/or Internet browser versions (see footnote 3). It seems also important to explore
possible acceleration measurement differences across smartphone manufacturers and models,
operating systems, and web browsers. Additionally, it might be beneficial to validate sensor
data collected via smartphones by sensor data collected via other devices, such as physical
activity monitors attached to the wrist. A further point is to determine which kind of sensor data
can contribute to a better understanding of respondents’ behavior in mobile web surveys and
how they can be gathered and analyzed. SMotion is, in principle, extendable so that several
types of sensor data could be gathered simultaneously. Gyroscope data, for instance, might be
a valuable source of information because they measure the device’s rotation on the x-, y-, and
z-axes.
The second route is related to methodological considerations. To evaluate the usefulness
of sensor data for mobile web survey research, it seems important to explore further their
connection to common paradata. This study was able to reveal a connection between TA and
response times as well as a connection between TA and taps on the screen. Apparently, finger
taps can cause identifiable patterns on the three acceleration axes. In regards to the pertinent
sensor data literature (see Mehrnezhad, Toreini, Shahandashti, & Hao, 2016), it seems possible
to recognize respondents’ unique operation signatures to distinguish them by means of their
touch actions. For instance, these operation signatures could be used as a supplement to or as a
replacement of self-generated identification codes in mobile web-based longitudinal studies.
Finally, it is crucial to explore further the connection between motion levels and response
quality. Research that systematically employs different response quality indicators, such as non-
response and break-offs, is highly required.
A special application field of SMotion might be personalized feedback in mobile web
surveys, to increase respondents’ motivation and, thus, to enhance the quality of their responses.
13
SMotion can be used to determine respondents’ motion levels during survey completion to
provide immediate (real time) feedback. For instance, if a respondent shows a relatively high
motion level, he or she could be asked whether this is a convenient time or whether he or she
wants to continue at a later point in time.
As suggested by one of the anonymous reviewers, a drawback of sensor data, in general,
and acceleration data measured by SMotion, in particular, is that they are primarily associated
with mobile devices, such as smartphones. Thus, the investigation of distractions and
multitasking behavior by this kind of data is restricted to mobile web surveys. This restriction
is a limitation for general web surveys completed on other devices, such as PCs.
This study contains some limitations. First, it involved university students, who are quite
familiar with smartphones. In total, 99% of the participants used their smartphone on a daily
basis. Furthermore, 85% of the participants had participated in a web survey once before, which
implies relatively skilled respondents. This circumstance might limit the generalizability of the
empirical results. However, it must be noted that this study was planned and conceptionalized
as a usability study to test and introduce a new tool that could contribute to a better
understanding of completion and response behavior in mobile web surveys. Second, the
ecological validity of the study design is somewhat limited because the groups 3 and 4 (walking
and stair climbing condition) were walking and climbing in a delaminated area. This does not
necessarily match real world conditions and, thus, it would be desirable for future research to
test SMotion in the field, instead of in an artificial lab setting. This might also contribute to an
increase in case numbers. Finally, we tested a limited number of questions (i.e., three single
questions and eight questions with a grid presentation). Therefore, further research that tests a
higher number of questions employing different response formats is necessary.
The use of JavaScript enables researchers to gather a large number of paradata without
respondents’ knowledge and consent. This also applies to the collection of sensor data by means
of JavaScript and, thus, to the SMotion tool. Researchers using such data face serious ethical
considerations. Although we encourage researchers to make use of sensor data to improve and
enhance survey research methods, we clearly state that these data should not be used to surveil
respondents or to frivolously adapt final responses given by respondents (see Heerwegh, 2002).
Furthermore, we are convinced that these kinds of data should not be collected without
respondents’ consent, even if this decreases the willingness for participation (see Couper &
Singer, 2013). In our opinion, more research on informed consent and the most appropriate way
to obtain it is necessary to circumvent the technical advances that could compromise the online
privacy of respondents.
References
Callegaro, M. (2013). Paradata in Web Surveys. In F. Kreuter (Ed.), Improving Surveys with
Paradata. Analytic Uses of Process Information (pp. 261–280). Hoboken, NJ: John Wiley
& Sons.
Cohen, J. (1969). Statistical Power Analysis for the Behavioral Science. New York, NY:
Academic Press.
Couper, M.P., & Kreuter, F. (2013). Using paradata to explore item level response times in
surveys. Journal of the Royal Statistical Society, 176, 271–286.
14
Couper, M.P., & Singer, E. (2013). Informed consent for web paradata use. Survey Research
Methods, 7, 57–67.
Couper, M.P., Tourangeau, R., Conrad, F.G., & Zhang, C. (2013). The design of grids in web
surveys. Social Science Computer Review, 31, 322–345.
Dillman, D.A., Smyth, J.D., & Christian, L.M. (2009). Internet, mail, and mixed-mode surveys:
The tailored design method (3rd ed.). New York, NY: John Wiley.
Elhoushi, M., Georgy, J., Noureldin, A., & Korenberg, M.J. (2017). A survey on approaches of
motion mode recognition using sensors. IEEE Transactions on Intelligent Transportation
Systems, 18, 1662–1686.
Foehr, U. (2006). Media multitasking among youth: Prevalence, pairings, and predictors.
Retrieved August 16, 2017, from https://kaiserfamilyfoundation.files.wordpress.com/
2013/01/7592.pdf
He, J., Hu, C., & Wang, X. (2016). A smart device enabled system for autonomous fall detection
and alert. International Journal of Distributed Sensor Networks, 12, 1–10.
Heerwegh, D. (2002). Describing response behavior in web surveys using client side paradata.
Paper presented at the International Workshop on Web Surveys, Mannheim: Germany.
Höhne, J.K., Revilla, M., & Lenzner, T. (2018). Comparing the performance of agree/disagree
and item-specific questions across PCs and smartphones. Methodology: European
Journal of Research Methods for the Behavioral and Social Sciences, 14, 109–118.
Höhne, J.K., & Schlosser, S. (2018). Investigating the adequacy of response time outlier
definitions in computer-based web surveys using paradata SurveyFocus. Social Science
Computer Review, 36, 369–378.
Höhne, J.K., Schlosser, S., & Krebs, D. (2017). Investigating cognitive effort and response
quality of question formats in web surveys using Paradata. Field Methods, 29, 365–382.
Lynn, P., & Kaminska, O. (2012). The impact of mobile phones on survey measurement error.
Public Opinion Quarterly, 77, 586–605.
Mavletova, A. (2013). Data quality in PC and mobile web surveys. Social Science Computer
Review, 31, 725–743.
Mehrnezhad, M., Toreini, E., Shahandashti, S.F., & Hao, F. (2016). TouchSignatures:
Identification of user touch actions and PINs based on mobile sensor data via JavaScript.
Journal of Information Security and Applications, 26, 23–38.
Monsell, S. (2003). Task switching. Trends in Cognitive Sciences, 7, 134–140.
Revilla, M., & Couper, M.P. (2018). Comparing grids with vertical and horizontal item-by-item
formats for PCs and smartphones. Social Science Computer Review, 36, 349–368.
Revilla, M., Toninelli, D., Ochoa, C., & Loewe, G. (2016). Do online access panels really need
to allow and adapt surveys to mobile devices? Internet Research, 26, 1209–1227.
Schlosser, S., & Höhne, J.K. (2017). Does the continuity of web-survey processing matter?
Poster presented at the Conference of the European Survey Research Association, Lisbon:
Portugal.
Schlosser, S., & Höhne, J.K. (2018a). ECSP – Embedded Client Side Paradata. Zenodo. DOI:
10.5281/zenodo.1218941
15
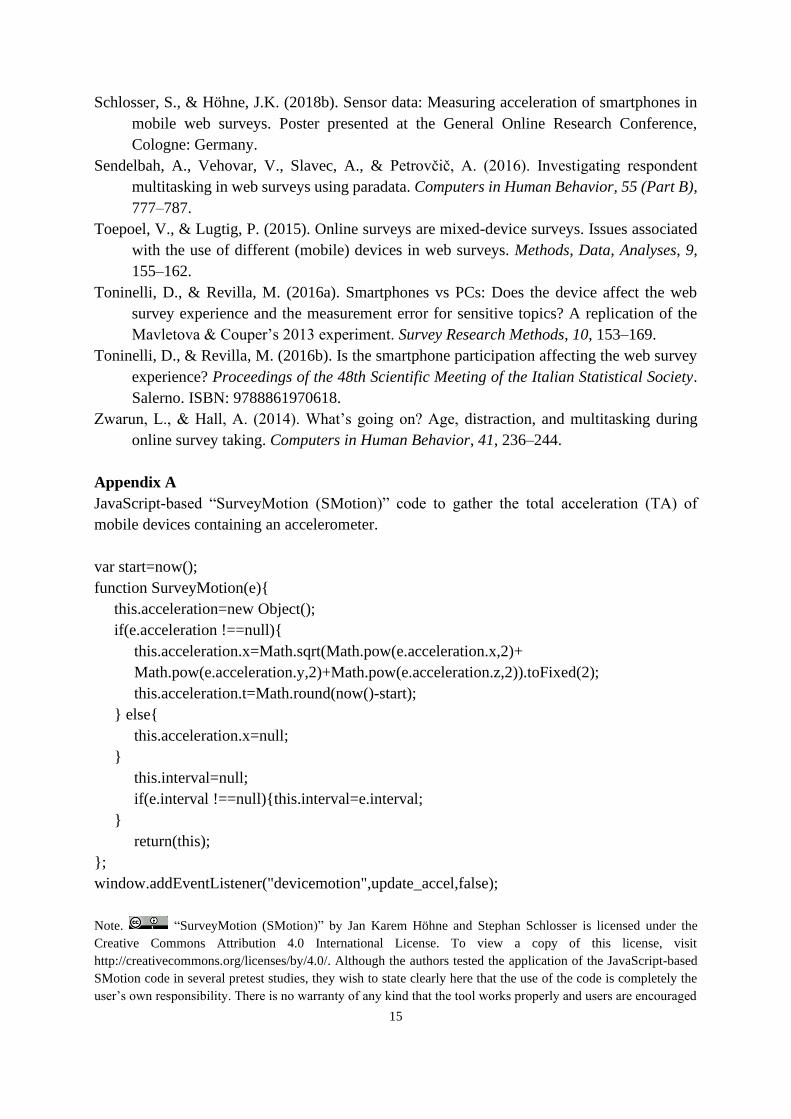
Schlosser, S., & Höhne, J.K. (2018b). Sensor data: Measuring acceleration of smartphones in
mobile web surveys. Poster presented at the General Online Research Conference,
Cologne: Germany.
Sendelbah, A., Vehovar, V., Slavec, A., & Petrovčič, A. (2016). Investigating respondent
multitasking in web surveys using paradata. Computers in Human Behavior, 55 (Part B),
777–787.
Toepoel, V., & Lugtig, P. (2015). Online surveys are mixed-device surveys. Issues associated
with the use of different (mobile) devices in web surveys. Methods, Data, Analyses, 9,
155–162.
Toninelli, D., & Revilla, M. (2016a). Smartphones vs PCs: Does the device affect the web
survey experience and the measurement error for sensitive topics? A replication of the
Mavletova & Couper’s 2013 experiment. Survey Research Methods, 10, 153–169.
Toninelli, D., & Revilla, M. (2016b). Is the smartphone participation affecting the web survey
experience? Proceedings of the 48th Scientific Meeting of the Italian Statistical Society.
Salerno. ISBN: 9788861970618.
Zwarun, L., & Hall, A. (2014). What’s going on? Age, distraction, and multitasking during
online survey taking. Computers in Human Behavior, 41, 236–244.
Appendix A
JavaScript-based “SurveyMotion (SMotion)” code to gather the total acceleration (TA) of
mobile devices containing an accelerometer.
var start=now();
function SurveyMotion(e){
this.acceleration=new Object();
if(e.acceleration !==null){
this.acceleration.x=Math.sqrt(Math.pow(e.acceleration.x,2)+
Math.pow(e.acceleration.y,2)+Math.pow(e.acceleration.z,2)).toFixed(2);
this.acceleration.t=Math.round(now()-start);
} else{
this.acceleration.x=null;
}
this.interval=null;
if(e.interval !==null){this.interval=e.interval;
}
return(this);
};
window.addEventListener("devicemotion",update_accel,false);
Note. “SurveyMotion (SMotion)” by Jan Karem Höhne and Stephan Schlosser is licensed under the
Creative Commons Attribution 4.0 International License. To view a copy of this license, visit
http://creativecommons.org/licenses/by/4.0/. Although the authors tested the application of the JavaScript-based
SMotion code in several pretest studies, they wish to state clearly here that the use of the code is completely the
user’s own responsibility. There is no warranty of any kind that the tool works properly and users are encouraged
16
to test its functionality before utilization. The authors and/or their affiliations cannot be held responsible for any
possible malfunctions and/or damages, even if SMotion is the responsible source.
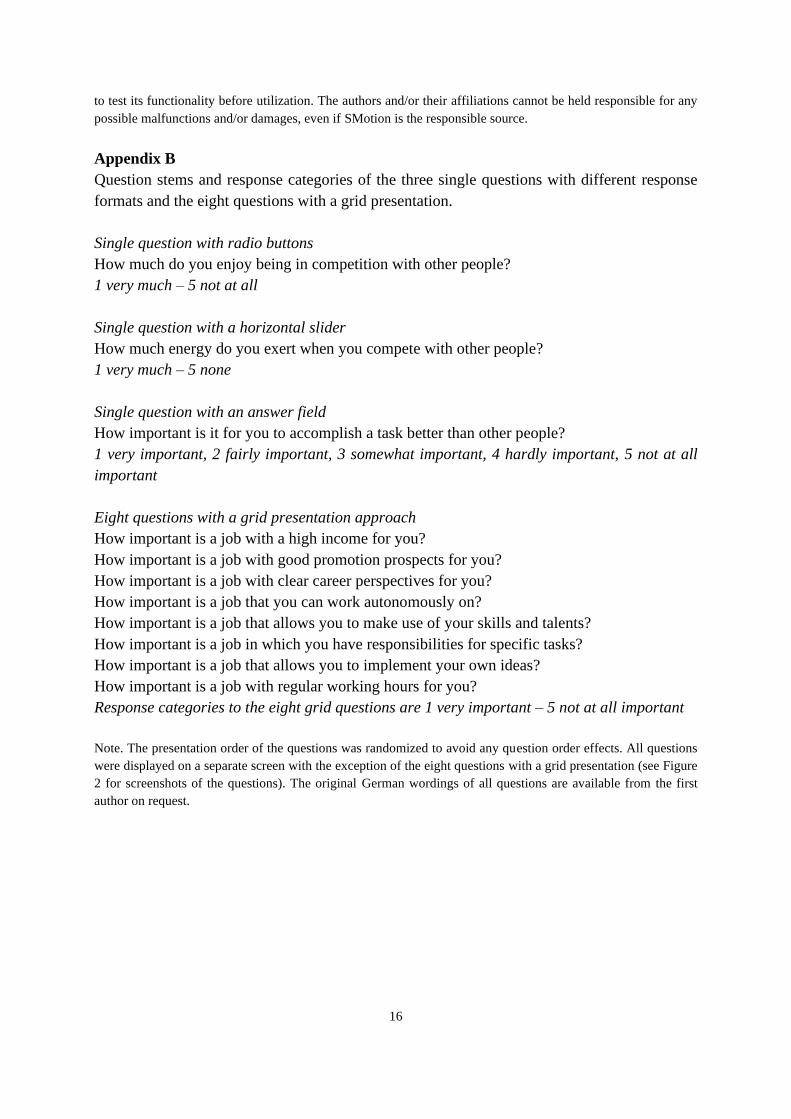
Appendix B
Question stems and response categories of the three single questions with different response
formats and the eight questions with a grid presentation.
Single question with radio buttons
How much do you enjoy being in competition with other people?
1 very much – 5 not at all
Single question with a horizontal slider
How much energy do you exert when you compete with other people?
1 very much – 5 none
Single question with an answer field
How important is it for you to accomplish a task better than other people?
1 very important, 2 fairly important, 3 somewhat important, 4 hardly important, 5 not at all
important
Eight questions with a grid presentation approach
How important is a job with a high income for you?
How important is a job with good promotion prospects for you?
How important is a job with clear career perspectives for you?
How important is a job that you can work autonomously on?
How important is a job that allows you to make use of your skills and talents?
How important is a job in which you have responsibilities for specific tasks?
How important is a job that allows you to implement your own ideas?
How important is a job with regular working hours for you?
Response categories to the eight grid questions are 1 very important – 5 not at all important
Note. The presentation order of the questions was randomized to avoid any question order effects. All questions
were displayed on a separate screen with the exception of the eight questions with a grid presentation (see Figure
2 for screenshots of the questions). The original German wordings of all questions are available from the first
author on request.