Surface Characteristics of High Translucent Multilayered ...
21
Citation: Toma, F.R.; Bîrdeanu, M.I.; Ut , u, I.-D.; Vasiliu, R.D.; Moleriu, L.C.; Porojan, L. Surface Characteristics of High Translucent Multilayered Dental Zirconia Related to Aging. Materials 2022, 15, 3606. https:// doi.org/10.3390/ma15103606 Academic Editors: John G. Fisher and Sangwon Park Received: 11 April 2022 Accepted: 16 May 2022 Published: 18 May 2022 Publisher’s Note: MDPI stays neutral with regard to jurisdictional claims in published maps and institutional affil- iations. Copyright: © 2022 by the authors. Licensee MDPI, Basel, Switzerland. This article is an open access article distributed under the terms and conditions of the Creative Commons Attribution (CC BY) license (https:// creativecommons.org/licenses/by/ 4.0/). materials Article Surface Characteristics of High Translucent Multilayered Dental Zirconia Related to Aging Flavia Roxana Toma 1 , Mihaela Ionela Bîrdeanu 2 , Ion-Dragos , Ut , u 3 , Roxana Diana Vasiliu 1 , Lavinia Cristina Moleriu 4 and Liliana Porojan 1, * 1 Department of Dental Prostheses Technology (Dental Technology), Center for Advanced Technologies in Dental Prosthodontics, Faculty of Dental Medicine, “Victor Babes , ” University of Medicine and Pharmacy Timis , oara, EftimieMurgu Sq. No. 2, 300041 Timisoara, Romania; fl[email protected] (F.R.T.); [email protected] (R.D.V.) 2 National Institute for Research and Development in Electrochemistry and Condensed Matter, 300569 Timisoara, Romania; [email protected] 3 Department of Materials and Fabrication Engineering, Politehnica University Timi¸ soara, Bd. Mihai Viteazu nr.1, 300222 Timisoara, Romania; [email protected] 4 Department of Functional Science, “Victor Babes , ” University of Medicine and Pharmacy Timis , oara, EftimieMurgu Sq. No. 2, 300041 Timisoara, Romania; [email protected] * Correspondence: [email protected] Abstract: (1) Background: The purpose of this study was to evaluate the differences in terms of surface characteristics (roughness, topography, microhardness) among layers for multi-layered high translu- cent and super-high translucent zirconia and the influence of finishing and aging on surface character- istics and microstructure. (2) Methods: Three types of translucent multilayer zirconia were evaluated: STML (4Y-TZP); IPS e.maxZirCAD CEREC/in Lab MT Multi (4Y-TZP + 5Y-TZP); CeramillZolidfx ML (5Y-TZP). Ninety-six plate-shaped samples (32 for a material), 16 mm × 14 mm × 1 mm size, were cut with a precision disc, polished on both sides with sand papers and sintered respecting the manufacturer’s protocol. Half of the specimens (16) were finished by polishing and the other half by glazing and then equally divided into one control group and one group subject to aging by autoclaving (1 h, 134 ◦ C, 0.2 MPa), resulting in four groups of eight samples, for each zirconia. The specimens were evaluated in three areas: cervical, medium, incisal-of each glazed or polished surface, before and after aging. Tests were performed to determine the surface roughness using a profilometer; the surface topography by an atomic force microscope (AFM) and a scanning electron microscope (SEM). Microhardness was recorded using a microhardness tester. Statistical analyses were performed using two-way ANOVA test, unpaired sample t-Test, paired sample t-Test (α = 0.05) and Pearson’s correlation. (3) Results: Before and after autoclaving, for glazed samples significance (p < 0.05) higher surface roughness, respectively lower microhardness in comparison with the pol- ished group was assessed. No significant differences (p > 0.05) were reported between the three areas, on glazed or polished surfaces of a material. Although, after aging an increase in surface roughness was observed both on glazed and polished samples, statistical differences were found for STML (p< 0.05). No significant differences (p> 0.05) concerning microhardness among the same areas, on glazed and polished surfaces, recorded before and after aging, except CeramillZolidfx ML glazed samples. (4) Conclusions: For tested zirconia materials no significant differences among layers were registered regarding surface characteristics. Surface treatment (glazing or polishing) has a significant impact on surface roughness and microhardness. Both before and after aging, the surface roughness values for the glazed samples were higher than for those polished. The super translucent 4Y-TZP material was more affected by aging compared to the super-high translucent 5Y-TZP material. The combined material revealed similarities for each layer corresponding to the microstructure. Keywords: multilayer zirconia; microroughness; surface topography; microhardness; aging Materials 2022, 15, 3606. https://doi.org/10.3390/ma15103606 https://www.mdpi.com/journal/materials
-
Upload
khangminh22 -
Category
Documents
-
view
0 -
download
0
Transcript of Surface Characteristics of High Translucent Multilayered ...

Citation: Toma, F.R.; Bîrdeanu, M.I.;
Ut,u, I.-D.; Vasiliu, R.D.; Moleriu, L.C.;
Porojan, L. Surface Characteristics of
High Translucent Multilayered
Dental Zirconia Related to Aging.
Materials 2022, 15, 3606. https://
doi.org/10.3390/ma15103606
Academic Editors: John G. Fisher
and Sangwon Park
Received: 11 April 2022
Accepted: 16 May 2022
Published: 18 May 2022
Publisher’s Note: MDPI stays neutral
with regard to jurisdictional claims in
published maps and institutional affil-
iations.
Copyright: © 2022 by the authors.
Licensee MDPI, Basel, Switzerland.
This article is an open access article
distributed under the terms and
conditions of the Creative Commons
Attribution (CC BY) license (https://
creativecommons.org/licenses/by/
4.0/).
materials
Article
Surface Characteristics of High Translucent MultilayeredDental Zirconia Related to AgingFlavia Roxana Toma 1, Mihaela Ionela Bîrdeanu 2 , Ion-Dragos, Ut,u 3, Roxana Diana Vasiliu 1,Lavinia Cristina Moleriu 4 and Liliana Porojan 1,*
1 Department of Dental Prostheses Technology (Dental Technology), Center for Advanced Technologies inDental Prosthodontics, Faculty of Dental Medicine, “Victor Babes, ” University of Medicine and PharmacyTimis, oara, EftimieMurgu Sq. No. 2, 300041 Timisoara, Romania; [email protected] (F.R.T.);[email protected] (R.D.V.)
2 National Institute for Research and Development in Electrochemistry and Condensed Matter,300569 Timisoara, Romania; [email protected]
3 Department of Materials and Fabrication Engineering, Politehnica University Timisoara,Bd. Mihai Viteazu nr.1, 300222 Timisoara, Romania; [email protected]
4 Department of Functional Science, “Victor Babes, ” University of Medicine and Pharmacy Timis, oara,EftimieMurgu Sq. No. 2, 300041 Timisoara, Romania; [email protected]
* Correspondence: [email protected]
Abstract: (1) Background: The purpose of this study was to evaluate the differences in terms of surfacecharacteristics (roughness, topography, microhardness) among layers for multi-layered high translu-cent and super-high translucent zirconia and the influence of finishing and aging on surface character-istics and microstructure. (2) Methods: Three types of translucent multilayer zirconia were evaluated:STML (4Y-TZP); IPS e.maxZirCAD CEREC/in Lab MT Multi (4Y-TZP + 5Y-TZP); CeramillZolidfxML (5Y-TZP). Ninety-six plate-shaped samples (32 for a material), 16 mm × 14 mm × 1 mm size,were cut with a precision disc, polished on both sides with sand papers and sintered respectingthe manufacturer’s protocol. Half of the specimens (16) were finished by polishing and the otherhalf by glazing and then equally divided into one control group and one group subject to agingby autoclaving (1 h, 134 ◦C, 0.2 MPa), resulting in four groups of eight samples, for each zirconia.The specimens were evaluated in three areas: cervical, medium, incisal-of each glazed or polishedsurface, before and after aging. Tests were performed to determine the surface roughness using aprofilometer; the surface topography by an atomic force microscope (AFM) and a scanning electronmicroscope (SEM). Microhardness was recorded using a microhardness tester. Statistical analyseswere performed using two-way ANOVA test, unpaired sample t-Test, paired sample t-Test (α = 0.05)and Pearson’s correlation. (3) Results: Before and after autoclaving, for glazed samples significance(p < 0.05) higher surface roughness, respectively lower microhardness in comparison with the pol-ished group was assessed. No significant differences (p > 0.05) were reported between the three areas,on glazed or polished surfaces of a material. Although, after aging an increase in surface roughnesswas observed both on glazed and polished samples, statistical differences were found for STML(p < 0.05). No significant differences (p> 0.05) concerning microhardness among the same areas, onglazed and polished surfaces, recorded before and after aging, except CeramillZolidfx ML glazedsamples. (4) Conclusions: For tested zirconia materials no significant differences among layers wereregistered regarding surface characteristics. Surface treatment (glazing or polishing) has a significantimpact on surface roughness and microhardness. Both before and after aging, the surface roughnessvalues for the glazed samples were higher than for those polished. The super translucent 4Y-TZPmaterial was more affected by aging compared to the super-high translucent 5Y-TZP material. Thecombined material revealed similarities for each layer corresponding to the microstructure.
Keywords: multilayer zirconia; microroughness; surface topography; microhardness; aging
Materials 2022, 15, 3606. https://doi.org/10.3390/ma15103606 https://www.mdpi.com/journal/materials

Materials 2022, 15, 3606 2 of 21
1. Introduction
To eliminate disadvantages as opacity, risk of chipping, substantial reduction of dentalstructure and also due aesthetics, biocompatibility and chemical stability compared toframework or conventional metal–ceramic, monolithic zirconia restorations are widelyused in dentistry [1]. In order to obtain materials with high translucency, but also resistant,new grades of zirconia have been developed, pre-sintered blocks being available as pre-shaded in various tonalities or multilayered with gradients of chroma [2]. The translucentdental zirconia generations involved modifications of the crystal structure, increasing thecontent of Y2O3 (Yttrium) and cubic phase, resulting in two polycrystalline materials:5Y-TZP and 4Y-TZP (partially stabilized zirconia with 5 mol% and respectively 4 mol%Yttrium) [3,4]. The main phase of zirconia is decisive for the individual characteristics ofeach zirconia system [5,6].
These compositional differences can influence three important clinical properties ofthe material: translucency, toughness, and resistance to hydrothermal aging [7].
The strategy for improving the optical performance of material imply microstructuralvariations—the higher Yttrium content influences the coefficient of thermal expansion, thesize of grains (they are larger), reduce the residual porosity, resulting fewer boundaries, lessbirefringence, and scattering of the light [8], leading to higher translucency [6]. A recentstudy related that 5Yis 33%, and 4Yis 13% more translucent than 3Y-zirconia (3 mol% Yt-trium stabilized-tetragonal zirconia polycrystal) [9]. The nanoparticles zirconia is presumedto be the next progress in evolution of this material [10–12].
In the microstructure, when stress occurs, the tetragonal phase ensures the abilityto withstand compression, stopping the progression of the micro-cracks and eliminationof microstructure defects [13], inducing transformation toughening. This mechanism isreduced for zirconia with higher cubic content. The super translucent 4Y-TZP (fourth-generation) contains 4 mol% Y2O3 and around 25% cubic phase. For super-high translucent5Y-TZP (third-generation), the Y2O3 content was increased to 5 mol% and the quantity ofthe cubic phase rises up to 50%, also the amount of tetragonal phase decreases, leadingto a lower possibility of tetragonal to monoclinic phase transformation, with reductionin strength and fracture toughness [8]; that is a disadvantage of these new translucentmaterials and the clinicians should use the 4Y and 5Y zirconia when the aesthetic needsare required.
Autoclave treatment induce an accelerate aging of zirconia [14,15].Negative effects were reported after simulated accelerating aging of zirconia—LTD
(low temperature degradation), by autoclaving [16], but limited types of materials wereevaluated in short-term aging, hence different studies on multilayered translucent zirconiaare essential for clinical applications. The aging process is associated with a slow tetragonalto monoclinic phase transformation, 4% volume increase of particles, micro-cracks withwater penetration, grain detachment, decrease in hardness and fracture strength, surfaceroughening and degradation at the surface (and subsurface) which is in contact withmoisture [1,17,18]. It was observed that hydrothermal and mechanical impact could causeunexpected phase transformation [19]. However, cubic zirconia undergoes almost nomonoclinic transformation and hydrothermal degradation. Many studies revealed that afteraging, 5Y-TZP was less affected than 3Y-TZP, but both experienced a strength reduction [20].
It was observed that the surface roughness and the microstructure characteristics canaffect the strength of the material [21] and be relevant factors that influence the appearance,the final color, or bacterial accumulation [22,23].
The monolithic multilayer zirconia has polychromatic, pre-colored layers—enamel(incisal), transition 1 and 2 (medium), dentin-body (cervical)—simulating the shade andtranslucency of the natural teeth; with chroma and opacity increasing toward gingival area;the enamel layer looking the most transparent, while the dentin layer appears more opaqueowingto the considerable low values for light permeability.
Several studies have reported that the first introduced multilayer zirconia (Katana,Kuraray Noritake), presented the same content of yttrium, respectively cubic phase in the

Materials 2022, 15, 3606 3 of 21
layers of the material; among these being only the color difference given by the pigmentcomposition [24]. Later, multilayer zirconia with different composition and microstructurein the same material (IPS e.maxZirCad Multi, IvoclarVivadent) was introduced.
The layers result as various formulations depending on the quantity of stabilizerand chemical composition. Because of these values, potential differences in the physicalproperties in the individual layers occur [6,25,26].
However, there are contradictory reports regarding the negative effects of the incorpo-ration of oxide pigments on strength of zirconia [27,28] and by interface between layerswas evidenced 30% lower strength than the bulk of material [29].
To improve aesthetics, polishing and glazing as surface treatments are applied [23,30].It has often been shown that the polishing ability depends on microstructure of the mate-rial [31]. The slight polishing causes transformation nucleation usually around scratchesdue to tensile residual stress [32] and an increase in the monoclinic phase, may strengthenthe material, but implies a directly proportional increase in surface roughness [33,34]. Thegentle grinding and polishing using a small-grit (15–30µm) tool and a low-speed hand-piece, cause less-extensive tetragonal to monoclinic transformation and induce minor or noobvious flaws [35–37] in zirconia with different Yttrium concentrations [38].
Glazing as a laboratory procedure is achieved through applying a blend of colorlessglass powder and liquid layer that reduced the roughness, seals the pores, and smoothens-the ceramic surface [39,40]. The appearance of the glazed surface can be influenced by thelayer deposition technique, the special brush, layer thickness, and uniformity of zirconiainterface features, sometimes resulting in an irregular wavy surface with small defects.According to various results, after aging, the glaze layer may be negatively affected, broken,or separated from thematerial [41,42].
It is known, when the dopant concentration is high, the surface roughness is increased(meaning for 8Y-or 5Y-TZP was higher in comparison to 3Y-TZP) [43,44]; also, it causesanincrease incubic phase amount and lowers the strength and fracture toughness, [1,6] andlowers the mechanical properties [45]. As a result, the surface treatment as glazing mayor not have a protective role; polishing may induce defects and/or phase transformationwhich can lead to an increase or decrease in strength of the material [32,46–48].
Glazing and polishing enhance the appearance of restorations, decrease the bacterialaccumulation, the inflammatory tissue response and the wear of opposing teeth [31–33].
This in vitro study aims to evaluate: (a) The differences in terms of surface charac-teristics (roughness, topography, micro-hardness) among layers for multi-layered hightranslucent and super-high translucent zirconia; (b) how glazing and polishing affect thesurface properties of the mentioned materials; (c) the influence of LTD (low temperaturedegradation) as aging method, on surface characteristics and microstructure.
The null hypotheses were: (1) There are not significant differences regarding thesurface texture and microhardness in the three areas (cervical, medium, incisal) of thematerials; (2) glazing and polishing affect the surface properties of the material; (3) theroughness value increases and microhardness decreases after the aging procedure.
2. Materials and Methods
Three types of commercially multilayered dental zirconia with various translucen-cies and Yttrium content wasinvestigated in this study: super-translucent zirconia STML(Katana, Kuraray Noritake Dental, Tokio, Japan)-noted ST; IPS e.maxZirCAD CEREC/inLab MT Multi (IvoclarVivadent AG, Schaan, Liechtenstein)-noted IP and super-high-translucent zirconia CeramillZolidfx ML (Amman Girrbach, AG, Koblach, Austria)-notedCE. The properties of these materials are presented in Table 1.

Materials 2022, 15, 3606 4 of 21
Table 1. Properties of the materials taken into the study [49–51].
RestaurationMaterial Manufacturer Translucency/
ShadeYttriumContent
FlexuralStrength
STML (ST)
Katana,KurarayNoritake
Dental, Japan
Supertranslucency
A24 mol% 750 MPa
IPS e.max ZirCAD (IP)
IvoclarVivadent AG,
Schaan,Liechtenstein
Super-hightranslucency + Super
translucencyA2
4 mol%-incisal4 + 5
mol%-transition4 mol%-cervical
850 MPa
Ceramill Zolid fxML (CE)
AmmanGirrbach, AG,
Koblach,Austria
Super-hightranslucency
A2/A35 mol% 700 MPa
2.1. Specimen Preparation
Ninety-six specimens (32 samples of each zirconia) were cut from presintered blocksof each material, with a precision disc, followed by polishing on both sides using #600,#1500, #2000 sandpapers. Each material was sintered in a ceramic furnace LHT 01/17D(Nabertherm, Lilienthal, Germany) 1550 ◦C/7h-for STML; DekemaAustromat 674 (DEKEMADental-Keramiköfen GmbH, Freilassing, Germany) 1500 ◦C/9 h 50 min-for IPS e.maxZirCADCEREC/in Lab MT Multi; Programat S2 (IvoclarVivadent, Schaan, Liechtenstein)1450 ◦C/8h-for CeramillZolidfx ML according to a protocol recommended by each manu-facturer. Half of the specimens (16 samples) were finished only by polishing and the otherhalf by glazing. The finishing procedure was performed on one surface of the plate. Further,each assortment was divided equally into one control group and one group subject to agingby autoclaving (1 h, 134 ◦C, 0.2 MPa), as LTD (low temperature degradation). Four groups(n = 8) resulted for each material: control glazed (cg), control polished (cp), autoclavedglazed (ag), autoclaved polished (ap). The glazed (g) and the polished (p) surfaces wereevaluated into three areas corresponding to the layers: cervical (c), medium (m), incisal (i),before, and after aging.
Glazing was performed for all specimens with two thin layers—IPS Ivocolor GlazePaste (IvoclarVivadent, Schaan, Liechtenstein) in Vita Vacumat 6000 M furnace (Bad Sackin-gen Germany), in accordance with the manufacturer’s indications. For polishing a low-speed device, polishing brush and diamond paste-Renfert Polish (Renfert, Hilzingen,Germany) was used, following the same technique to obtain a smooth and glossy surface.The final dimensions of plate-shaped samples were 16 mm × 14 mm and 1 mm thickness,andweremeasured with a caliper. For a better understanding a flowchart was created,inwhichthe studied groups are described-Figure 1.
Materials 2022, 15, x FOR PEER REVIEW 4 of 21
Table 1. Properties of the materials taken into the study [49–51].
Restauration
Material Manufacturer
Translucency/
Shade
Yttrium
Content
Flexural
Strength
STML (ST)
Katana, Kuraray
Noritake Dental,
Japan
Super
translucency
A2
4 mol% 750 MPa
IPS e.max Zir
CAD (IP)
Ivoclar Vivadent
AG, Schaan,
Liechtenstein
Super‐high
translucency +
Super
translucency
A2
4 mol%‐incisal
4 + 5 mol%‐transition
4 mol%‐cervical
850 MPa
Ceramill Zolid
fx ML (CE)
Amman
Girrbach, AG,
Koblach, Austria
Super‐high
translucency
A2/A3
5 mol% 700 MPa
2.1. Specimen Preparation
Ninety‐six specimens (32 samples of each zirconia) were cut from presintered blocks
of each material, with a precision disc, followed by polishing on both sides using #600,
#1500, #2000 sandpapers. Each material was sintered in a ceramic furnace LHT 01/17D
(Nabertherm, Lilienthal, Germany) 1550 °C/7h‐for STML; DekemaAustromat 674
(DEKEMA Dental‐Keramiköfen GmbH, Freilassing, Germany) 1500 °C/9 h 50 min‐for IPS
e.maxZirCAD CEREC/in Lab MT Multi; Programat S2 (IvoclarVivadent, Schaan, Liech‐
tenstein) 1450 °C/8h‐for CeramillZolidfx ML according to a protocol recommended by
each manufacturer. Half of the specimens (16 samples) were finished only by polishing
and the other half by glazing. The finishing procedure was performed on one surface of
the plate. Further, each assortment was divided equally into one control group and one
group subject to aging by autoclaving (1 h, 134 °C, 0.2 MPa), as LTD (low temperature
degradation). Four groups (n = 8) resulted for each material: control glazed (cg), control
polished (cp), autoclaved glazed (ag), autoclaved polished (ap). The glazed (g) and the
polished (p) surfaces were evaluated into three areas corresponding to the layers: cervical
(c), medium (m), incisal (i), before, and after aging.
Glazing was performed for all specimens with two thin layers—IPS Ivocolor Glaze
Paste (IvoclarVivadent, Schaan, Liechtenstein) in Vita Vacumat 6000 M furnace (Bad
Sackingen Germany), in accordance with the manufacturer’s indications. For polishing a
low‐speed device, polishing brush and diamond paste‐Renfert Polish (Renfert, Hil‐
zingen, Germany) was used, following the same technique to obtain a smooth and glossy
surface. The final dimensions of plate‐shaped samples were 16 mm × 14 mm and 1 mm
thickness, andweremeasured with a caliper. For a better understanding a flowchart was
created, inwhichthe studied groups are described‐Figure 1.
Figure 1. The flowchart of the study in which the main samples and groups were plotted and the
way they are divided; c = cervical area, m = medium area, i = incisal area.
Figure 1. The flowchart of the study in which the main samples and groups were plotted and theway they are divided; c = cervical area, m = medium area, i = incisal area.

Materials 2022, 15, 3606 5 of 21
2.2. Hydrothermal Aging
The samples were subjected to the artificial aging process as LTD (low temperaturedegradation) using an autoclave (Sterilclave 24 B, Cominox, CarateBrianza, Italy) withdistilled water for 1 h, at 134 ◦C and 0.2 MPa; it is known that 1 h of autoclaving in theseconditions would induce on zirconia, the same effects as 3–4 years in vivo [14].
2.3. Surface Roughness and Topography
The measurement of surface roughness was made using a contact profilometerSurftestSJ-201(Mitutoyo, Kawasaki, Japan) with a 2 µm diamond stylus. On each level (cervical,medium, incisal), three measurements were recorded in three randomly selected areas, onpolished and on the glazed samples, respectively. The values of the Ra (µm) and Rz (µm)parameters were obtained. Ra (µm) is arithmetic average surface roughness and Rz (µm) ismaximum surface roughness. The cut-off value was 0.3 mm to a force applied by 0.7 mN.
2.4. Atomic Force Microscopy (AFM)
The nanosurface characterization of the specimens was evaluated with an atomic forcemicroscope Nanosurf Easy Scan 2 Advanced Research (Nanosurf AG, Liestal, Switzer-land). The values of nanoroughness parameters Sa (nm)-arithmetical mean height andSq (nm)-root mean square height resulted. For surface topographic analysis, AFM pro-vided three-dimensional images that were achieved with a scan size of 2.2 × 2.2 µm, innon-contact mode.
2.5. Scanning Electron Microscopy (SEM)
To investigate the surface modification resulting from different surface treatments, ascanning electron microscope with high resolution field emission—Inspect S (FEI Com-pany, Hillsboro, OR, USA) was used. The assessment of surface characteristics was per-formed on both samples (glazed, polished), in the three individual colored areas (cervical,medium, incisal).
2.6. Microhardness Testing
A microhardness tester (HVS-10A1, Huatec, Bejing, China), was used to assess thesurface hardness of glazed, respectively polished surfaces of the samples, on each domain(cervical, medial, incisal) in three randomly selected areas. The indentation techniquedetermined the Vickers Hardness number (VN), by applying a force of 0.3 kg for 10 s.
2.7. Statistical Analysis
Two different programs were used for statistical analyses—the IBM SPSS Statisticssoftware (IBM, New York, NY, USA) and JASP (v.16.2, University of Amsterdam, Holland).In the first part was used descriptive statistics, calculating the central tendency and disper-sion parameters. To decide upon the statistical type of tests we applied the Shapiro–Wilktest for distribution and obtained that the data are normally distributed (p> 0.05) in most ofthe cases; for a complete perspective, parametrical and non-parametrical tests were applied.The repeated measures ANOVA test was used for statistical analysis of more than two-timemoments/dependent groups. The unpaired t-Test was applied for two different groups (forstatistical analysis of variables recorded on glazed and polished sides); the paired t-Test wasperformed for two-time moments situation (for comparing areas of treated surfaces-beforeand after aging, for a material and the significant differences because of autoclaving).
A correlation model between Ra and microhardness, was performed—the straight-ness of the correlation was measured using Pearson’s coefficient. For the entire study, asignificance level of α =0.05 was established.

Materials 2022, 15, 3606 6 of 21
3. Results3.1. Micro-Surface Roughness
Mean values and SD (standard deviation) for Ra (µm), arithmetic average surfaceroughness and Rz (µm), maximum surface roughness measurements on glazed and pol-ished samples, before aging are summarized in Table 2.
Table 2. Mean values with SD for Ra, Rz parameters of the samples, before aging (n = 8).
ST cg ST cp IP cg IP cp CE cg CE cp
Rac 0.064 ± 0.009 0.041 ± 0.009 0.073 ± 0.009 0.043 ± 0.010 0.086 ± 0.010 0.047 ± 0.009m 0.065 ± 0.009 0.043 ± 0.010 0.080 ± 0.009 0.044 ± 0.009 0.085 ± 0.010 0.045 ± 0.010i 0.067 ± 0.010 0.042 ± 0.010 0.083 ± 0.009 0.046 ± 0.009 0.084 ± 0.008 0.047 ± 0.010
Rzc 0.445 ± 0.099 0.360 ± 0.094 0.475 ± 0.098 0.366 ± 0.098 0.580 ± 0.096 0.386 ± 0.082m 0.466 ± 0.096 0.363 ± 0.091 0.530 ± 0.091 0.371 ± 0.096 0.573 ± 0.098 0.371 ± 0.091i 0.493 ± 0.093 0.378 ± 0.100 0.533 ± 0.100 0.385 ± 0.092 0.563 ± 0.090 0.373 ± 0.093
Ra (µm)—arithmetic average surface roughness, Rz (µm)—maximum surface roughness. ST= STML, IP= IPSe.maxZirCAD CEREC/in Lab MT Multi, CE= CeramillZolidfx ML. cg = control glazed, cp = control polished,c = cervical, m = medium, i = incisal.
Among glazed tested groups, the lowest mean Ra values were recorded for ST (0.064to 0.067) and the highest for CE (0.086 to 0.084), with very close values between layers. ForIP, the values tend to increase from the cervical (0.073 ± 0.009) to incisal (0.083± 0.009) area.
Among the polished tested groups, the lowest Ra values were measured for ST (0.041to 0.043) and the highest for CE (0.045 to 0.047), which were almost similar in all three areas.For IP, an upward trend was registered, the lowest value (0.043 ± 0.010) was in the cervicalarea and the highest (0.046 ± 0.009) in the incisal one.
Mean values and SD (standard deviation) for Ra (µm)-arithmetic average surfaceroughness and Rz (µm)-maximum surface roughness measurements after aging are sum-marized in Table 3.
Table 3. Mean values with SD for Ra, Rz parameters of the samples, after aging (n = 8).
ST ag ST ap IP ag IP ap CE ag CE ap
Rac 0.080 ± 0.009 0.054 ± 0.010 0.081 ± 0.009 0.052 ± 0.009 0.088 ± 0.009 0.048 ± 0.008m 0.078 ± 0.009 0.055 ± 0.010 0.084 ± 0.008 0.050 ± 0.009 0.087 ± 0.009 0.047 ± 0.009i 0.077 ± 0.009 0.052 ± 0.010 0.086 ± 0.010 0.049 ± 0.008 0.086 ± 0.009 0.048 ± 0.009
Rzc 0.535 ± 0.100 0.426 ± 0.101 0.543 ± 0.094 0.372 ± 0.090 0.576 ± 0.099 0.413 ± 0.095m 0.520 ± 0.095 0.422 ± 0.099 0.548 ± 0.097 0.383 ± 0.091 0.579 ± 0.095 0.406 ± 0.091i 0.518 ± 0.092 0.410 ± 0.091 0.562 ± 0.089 0.390 ± 0.094 0.591 ± 0.084 0.416 ± 0.090
Ra-arithmetic average surface roughness, Rz-maximum surface roughness. ST= STML, IP= IPS e.maxZirCADCEREC/in Lab MT Multi, CE= CeramillZolidfx ML. ag = aged glazed, ap = aged polished, c = cervical,m = medium, i = incisal.
Among glazed tested groups, it was observed that the surface roughness increasedin all areas for the three materials, the lowest mean Ra values were recorded for ST (0.077to 0.080) and the highest for CE (0.086 to 0.088), with very close values between layers.For IP, the Ra values increased significantly in the cervical area and slightly in incisal area;however, the surface roughness is lower in cervical area (0.081 ± 0.009) than in incisal area(0.086 ± 0.010) for this material.
Among polished tested groups the lowest Ra values were measured for ST (0.052 to0.054) and the highest for CE (0.047 to 0.048), almost similar in all three areas. For IP, thevalues tend to decrease from the cervical (0.053 ± 0.009) to incisal (0.049 ± 0.009) area.
For the glazed side, the lowest Rz values was recorded for ST (0.512 to 0.435) and thehighest (0.576 to 0.591) for CE and for IP an intermediate appearance with the lowest value(0.534 ± 0.094) in cervical area and the highest (0.562 ± 0.089) in incisal ones.
On the polished side, the lowest Rz values (0.406 to 0.416) were reported for CE andthe highest (0.518 to 0.535) for ST.
Materials 2022, 15, 3606 7 of 21
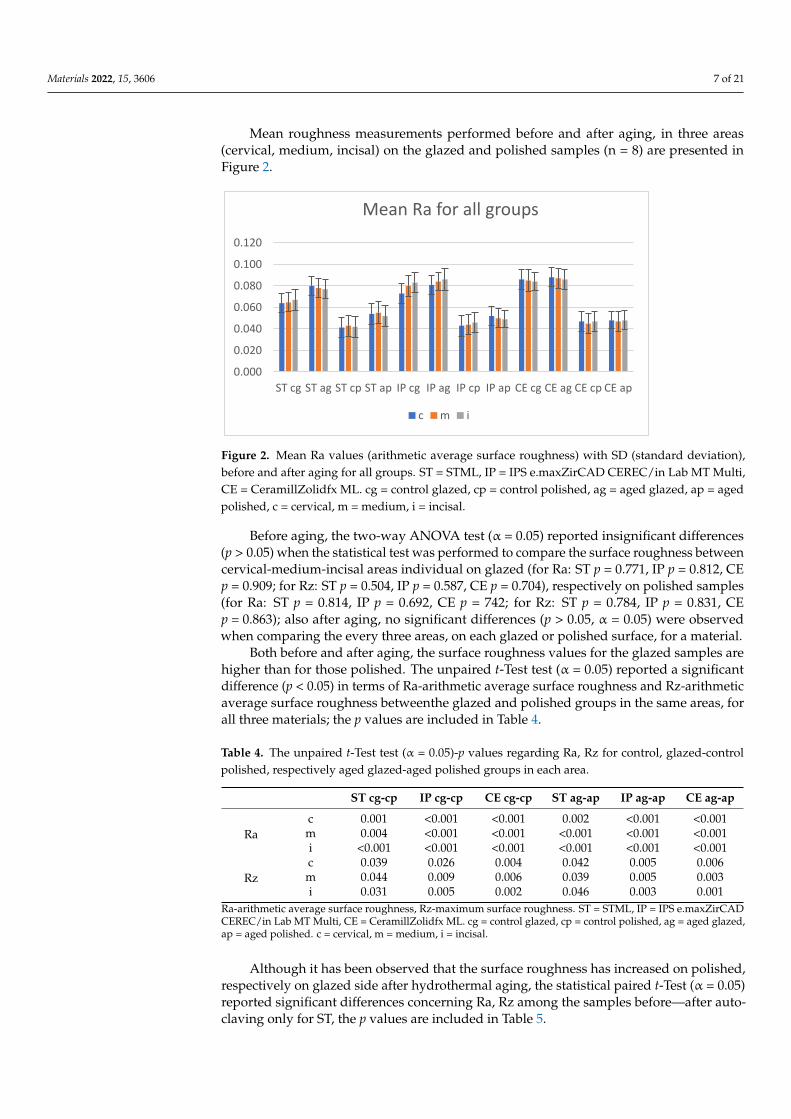
Mean roughness measurements performed before and after aging, in three areas(cervical, medium, incisal) on the glazed and polished samples (n = 8) are presented inFigure 2.
Materials 2022, 15, x FOR PEER REVIEW 7 of 21
For the glazed side, the lowest Rz values was recorded for ST (0.512 to 0.435) and the
highest (0.576 to 0.591) for CE and for IP an intermediate appearance with the lowest
value (0.534 ± 0.094) in cervical area and the highest (0.562 ± 0.089) in incisal ones.
On the polished side, the lowest Rz values (0.406 to 0.416) were reported for CE and
the highest (0.518 to 0.535) for ST.
Mean roughness measurements performed before and after aging, in three areas
(cervical, medium, incisal) on the glazed and polished samples (n = 8) are presented in
Figure 2.
Figure 2. Mean Ra values (arithmetic average surface roughness)with SD (standarddeviation), be‐
fore and after aging for all groups.ST = STML, IP = IPS e.maxZirCAD CEREC/in Lab MT Multi, CE
= CeramillZolidfx ML. cg = control glazed, cp = control polished, ag = aged glazed, ap = aged pol‐
ished,c = cervical, m = medium, i = incisal.
Before aging, the two‐way ANOVA test (α = 0.05) reported insignificant differences
(p > 0.05) when the statistical test was performed to compare the surface roughness be‐
tween cervical‐medium‐incisal areas individual on glazed (for Ra: ST p = 0.771, IP p =
0.812, CE p = 0.909; for Rz: ST p = 0.504, IP p = 0.587, CE p = 0.704), respectively on polished
samples (for Ra: ST p = 0.814, IP p = 0.692, CE p = 742; for Rz: ST p = 0.784, IP p = 0.831, CE p
= 0.863); also after aging, no significant differences (p > 0.05, α = 0.05) were observed when
comparing the every three areas, on each glazed or polished surface, for a material.
Both before and after aging, the surface roughness values for the glazed samples are
higher than for those polished. The unpaired t‐Test test (α = 0.05) reported a significant
difference (p < 0.05) in terms of Ra‐arithmetic average surface roughness and
Rz‐arithmetic average surface roughness betweenthe glazed and polished groups in the
same areas, for all three materials; the p values are included in Table 4.
Table 4. The unpaired t‐Test test (α = 0.05)‐p values regarding Ra, Rz for control,glazed‐control
polished, respectively aged glazed‐aged polished groups in each area.
ST cg‐cp IP cg‐cp CE cg‐cp ST ag‐ap IP ag‐ap CE ag‐ap
Ra
c 0.001 <0.001 <0.001 0.002 <0.001 <0.001
m 0.004 <0.001 <0.001 <0.001 <0.001 <0.001
i <0.001 <0.001 <0.001 <0.001 <0.001 <0.001
Rz
c 0.039 0.026 0.004 0.042 0.005 0.006
m 0.044 0.009 0.006 0.039 0.005 0.003
i 0.031 0.005 0.002 0.046 0.003 0.001
Ra‐arithmetic average surface roughness, Rz‐maximum surface roughness. ST = STML, IP = IPS
e.maxZirCAD CEREC/in Lab MT Multi, CE = CeramillZolidfx ML. cg = control glazed, cp = control
polished, ag = aged glazed, ap = aged polished. c = cervical, m = medium, i = incisal.
0.000
0.020
0.040
0.060
0.080
0.100
0.120
ST cg ST ag ST cp ST ap IP cg IP ag IP cp IP ap CE cg CE ag CE cp CE ap
Mean Ra for all groups
c m i
Figure 2. Mean Ra values (arithmetic average surface roughness) with SD (standard deviation),before and after aging for all groups. ST = STML, IP = IPS e.maxZirCAD CEREC/in Lab MT Multi,CE = CeramillZolidfx ML. cg = control glazed, cp = control polished, ag = aged glazed, ap = agedpolished, c = cervical, m = medium, i = incisal.
Before aging, the two-way ANOVA test (α = 0.05) reported insignificant differences(p > 0.05) when the statistical test was performed to compare the surface roughness betweencervical-medium-incisal areas individual on glazed (for Ra: ST p = 0.771, IP p = 0.812, CEp = 0.909; for Rz: ST p = 0.504, IP p = 0.587, CE p = 0.704), respectively on polished samples(for Ra: ST p = 0.814, IP p = 0.692, CE p = 742; for Rz: ST p = 0.784, IP p = 0.831, CEp = 0.863); also after aging, no significant differences (p > 0.05, α = 0.05) were observedwhen comparing the every three areas, on each glazed or polished surface, for a material.
Both before and after aging, the surface roughness values for the glazed samples arehigher than for those polished. The unpaired t-Test test (α = 0.05) reported a significantdifference (p < 0.05) in terms of Ra-arithmetic average surface roughness and Rz-arithmeticaverage surface roughness betweenthe glazed and polished groups in the same areas, forall three materials; the p values are included in Table 4.
Table 4. The unpaired t-Test test (α = 0.05)-p values regarding Ra, Rz for control, glazed-controlpolished, respectively aged glazed-aged polished groups in each area.
ST cg-cp IP cg-cp CE cg-cp ST ag-ap IP ag-ap CE ag-ap
Rac 0.001 <0.001 <0.001 0.002 <0.001 <0.001m 0.004 <0.001 <0.001 <0.001 <0.001 <0.001i <0.001 <0.001 <0.001 <0.001 <0.001 <0.001
Rzc 0.039 0.026 0.004 0.042 0.005 0.006m 0.044 0.009 0.006 0.039 0.005 0.003i 0.031 0.005 0.002 0.046 0.003 0.001
Ra-arithmetic average surface roughness, Rz-maximum surface roughness. ST = STML, IP = IPS e.maxZirCADCEREC/in Lab MT Multi, CE = CeramillZolidfx ML. cg = control glazed, cp = control polished, ag = aged glazed,ap = aged polished. c = cervical, m = medium, i = incisal.
Although it has been observed that the surface roughness has increased on polished,respectively on glazed side after hydrothermal aging, the statistical paired t-Test (α = 0.05)reported significant differences concerning Ra, Rz among the samples before—after auto-claving only for ST, the p values are included in Table 5.

Materials 2022, 15, 3606 8 of 21
Table 5. The paired t-Test test (α = 0.05)-p values regarding Ra, Rz for control glazed–agedglazed,respectively control polished–aged polished groups in each area.
ST cg-ag ST cp-ap IP cg-ag IP cp-ap CE cg-ag CE cp-ap
Rac 0.006 0.049 0.134 0.058 0.715 0.868m 0.046 0.022 0.521 0.387 0.662 0.628i 0.042 0.047 0.583 0.442 0.311 0.808
Rzc 0.371 0.225 0.775 0.621 0.583 0.866m 0.412 0.425 0.621 0.539 0.715 0.754i 0.344 0.568 0.592 0.546 0.662 0.862
Ra-arithmetic average surface roughness, Rz-maximum surface roughness. ST = STML, IP = IPS e.maxZir CADCEREC/in Lab MT Multi, CE = CeramillZolidfx ML. cg = control glazed, cp = control polished, ag = aged glazed,ap=aged polished. c = cervical, m = medium, i = incisal.
3.2. Atomic Force Microscopy (AFM)
Before aging, for each kind of material, fine and deeper interconnecting striations andscratches, small irregularities as scattered and sharp peaks were observed on both treatedsurfaces in all three areas. Among materials, for CE, the surface irregularities are moreobvious both in the group of glazed and those of polished samples.
The values for parameters Sa (nm)-arithmetical mean height and Sq (nm)-root meansquare height resulted for the glazed and polished samples are showed in Table 6.
Table 6. Sa, Sq values for control-glazed and control-polished samples, in each area (n = 8).
ST cg IP cg CE cg ST cp IP cp CE cp
Sac 1.651 1.960 1.723 1.048 1.244 1.388m 2.424 2.536 2.662 1.315 1.381 1.582i 1.524 1.598 1.924 1.529 1.529 1.343
Sqc 1.934 2.293 1.981 1.348 1.335 1.738m 2.945 3.049 3.123 1.691 1.552 2.113i 1.842 1.996 2.144 1.945 2.045 1.545
Sa = arithmetical mean height, Sq = root mean square height. ST = STML, IP = IPS e.maxZirCAD CEREC/inLab MT Multi, CE = CeramillZolidfx ML. cg = control glazed, cp = control polished, c = cervical, m = medium,i = incisal.
The AFM 3D images of the control group recorded on each area of glazed samples areshown in Figure 3.
Materials 2022, 15, x FOR PEER REVIEW 9 of 21
ST IP CE
c
m
i
Figure 3. 3D AFM images of the glazed samples, before aging.ST = STML, IP = IPS e.maxZirCAD
CEREC/in Lab MT Multi, CE = CeramillZolidfx ML. c = cervical, m = medium, i = incisal.
The AFM 3D images on each area of the polished samples of the control group are
shown in Figure 4.
ST IP CE
c
m
i
Figure 4. 3D AFM image of the polished samples of the control group. ST= STML, IP= IPS e.maxZirCAD
CEREC/in Lab MT Multi, CE= CeramillZolidfx ML, c = cervical, m = medium, i = incisal.
After aging, the values for Sa (nm)‐arithmetical mean height and Sq (nm)‐root mean
square height resulted for the glazed samples and polished samples are shown in Table 7.
Figure 3. 3D AFM images of the glazed samples, before aging.ST = STML, IP = IPS e.maxZirCADCEREC/in Lab MT Multi, CE = CeramillZolidfx ML. c = cervical, m = medium, i = incisal.

Materials 2022, 15, 3606 9 of 21
The AFM 3D images on each area of the polished samples of the control group areshown in Figure 4.
Materials 2022, 15, x FOR PEER REVIEW 9 of 21
ST IP CE
c
m
i
Figure 3. 3D AFM images of the glazed samples, before aging.ST = STML, IP = IPS e.maxZirCAD CEREC/in Lab MT Multi, CE = CeramillZolidfx ML. c = cervical, m = medium, i = incisal.
The AFM 3D images on each area of the polished samples of the control group are shown in Figure 4.
ST IP CE
c
m
i
Figure 4. 3D AFM image of the polished samples of the control group. ST= STML, IP= IPS e.maxZirCAD CEREC/in Lab MT Multi, CE= CeramillZolidfx ML, c = cervical, m = medium, i = incisal.
After aging, the values for Sa (nm)-arithmetical mean height and Sq (nm)-root mean square height resulted for the glazed samples and polished samples are shown in Table 7.
Figure 4. 3D AFM image of the polished samples of the control group. ST= STML, IP= IPSe.maxZirCAD CEREC/in Lab MT Multi, CE= CeramillZolidfx ML, c = cervical, m = medium,i = incisal.
After aging, the values for Sa (nm)-arithmetical mean height and Sq (nm)-root meansquare height resulted for the glazed samples and polished samples are shown in Table 7.
Table 7. Sa, Sq values for aged-glazed and aged-polished samples, in each area (n = 8).
ST ag IP ag CE ag ST ap IP ap CE ap
Sac 23.334 28.134 31.817 20.651 27.714 20.342m 21.419 29.050 27.315 31.783 27.674 22.991i 22.458 24.262 24.464 28.978 25.502 20.515
Sqc 26.744 32.526 36.371 23.669 31.778 23.529m 24.414 33.221 31.242 36.254 31.952 25.883i 25.702 27.911 27.873 32.988 29.106 23.728
Sa = arithmetical mean height, Sq = root mean square height. ST = STML, IP= IPSe.maxZirCAD CEREC/in Lab MT Multi, CE = CeramillZolidfx ML. ag = aged-glazed,ap = aged-polished, c = cervical, m = medium, i = incisal.
After aging, the AFM 3D images recorded the topography on each area of the glazedsamples—Figure 5.
Materials 2022, 15, 3606 10 of 21
Materials 2022, 15, x FOR PEER REVIEW 10 of 21
Table 7. Sa, Sq values for aged-glazed and aged-polished samples, in each area (n = 8).
ST ag IP ag CE ag ST ap IP ap CE ap
Sa c 23.334 28.134 31.817 20.651 27.714 20.342 m 21.419 29.050 27.315 31.783 27.674 22.991 i 22.458 24.262 24.464 28.978 25.502 20.515
Sq c 26.744 32.526 36.371 23.669 31.778 23.529 m 24.414 33.221 31.242 36.254 31.952 25.883 i 25.702 27.911 27.873 32.988 29.106 23.728
Sa = arithmetical mean height, Sq = root mean square height. ST = STML, IP= IPS e.maxZirCAD CEREC/in Lab MT Multi, CE = CeramillZolidfx ML. ag = aged-glazed, ap = aged-polished, c = cer-vical, m = medium, i = incisal.
After aging, the AFM 3D images recorded the topography on each area of the glazed samples—Figure 5.
ST IP CE c
m
i
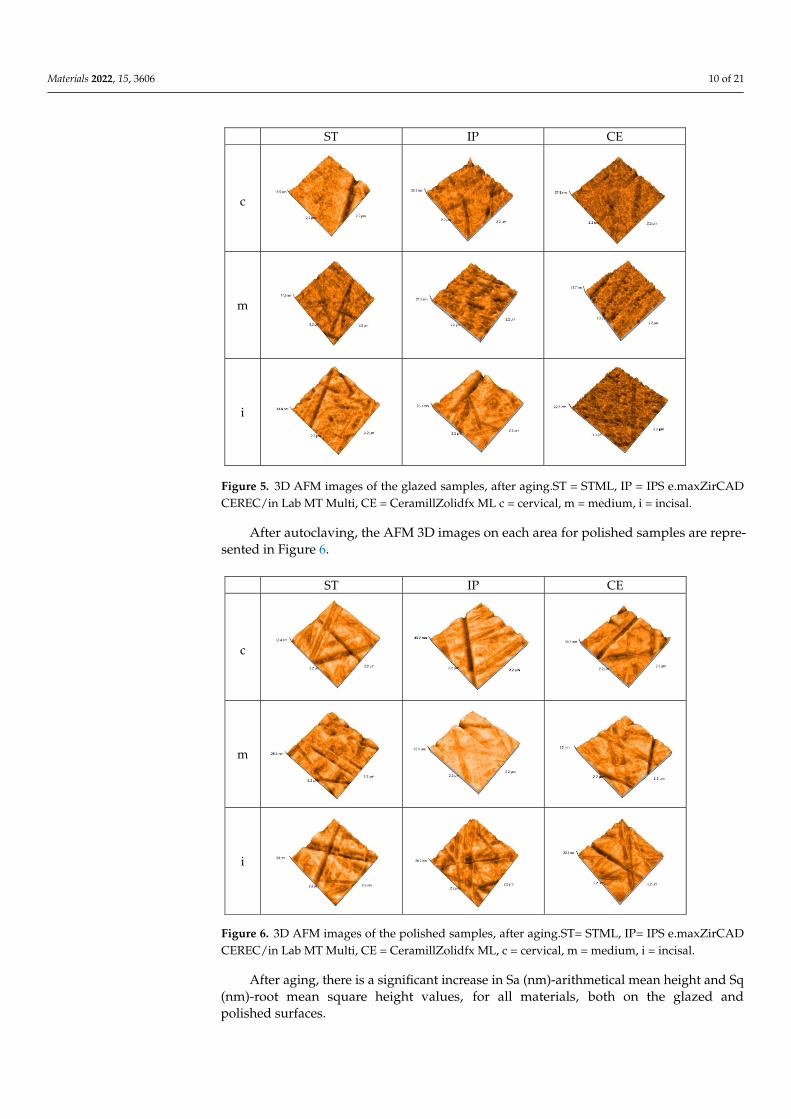
Figure 5. 3D AFM images of the glazed samples, after aging.ST = STML, IP = IPS e.maxZirCAD CEREC/in Lab MT Multi, CE = CeramillZolidfx ML c = cervical, m = medium, i = incisal.
After autoclaving, the AFM 3D images on each area for polished samples are rep-resented in Figure 6.
Figure 5. 3D AFM images of the glazed samples, after aging.ST = STML, IP = IPS e.maxZirCADCEREC/in Lab MT Multi, CE = CeramillZolidfx ML c = cervical, m = medium, i = incisal.
After autoclaving, the AFM 3D images on each area for polished samples are repre-sented in Figure 6.
Materials 2022, 15, x FOR PEER REVIEW 11 of 21
ST IP CE
c
m
i
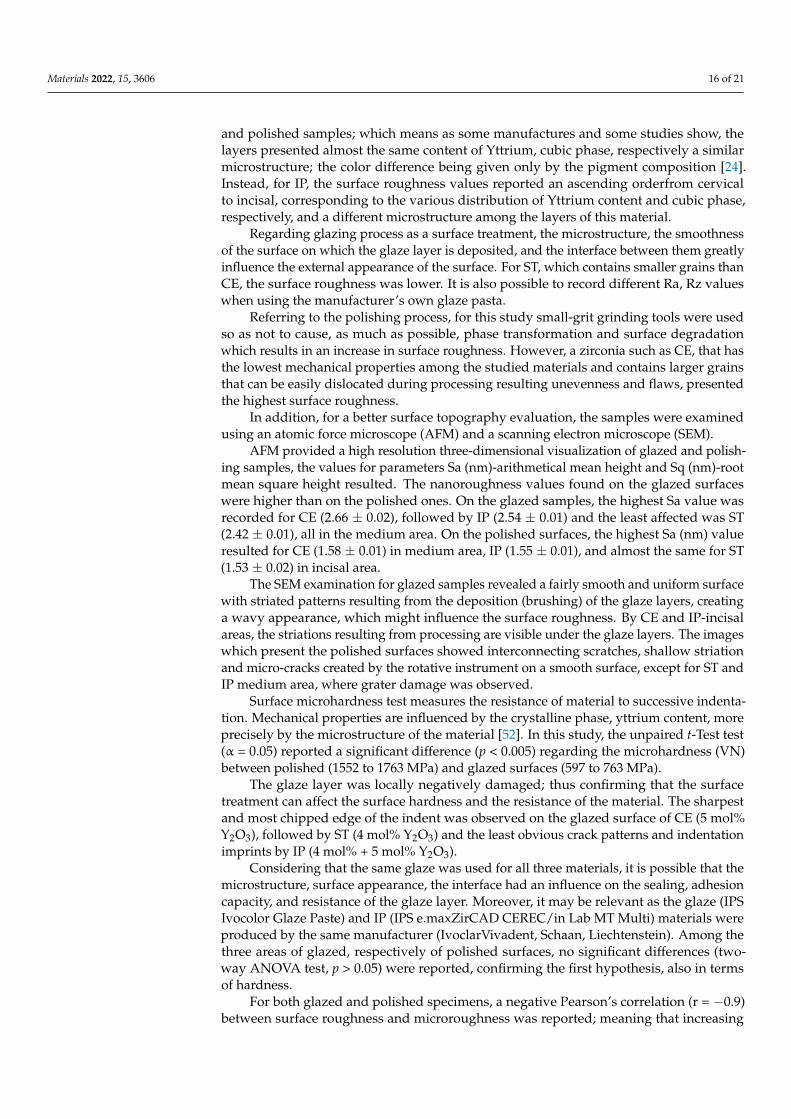
Figure 6. 3D AFM images of the polished samples, after aging.ST= STML, IP= IPS e.maxZirCAD
CEREC/in Lab MT Multi, CE = CeramillZolidfx ML, c = cervical, m = medium, i = incisal.
After aging, there is a significant increase in Sa (nm)‐arithmetical mean height and
Sq (nm)‐root mean square height values, for all materials, both on the glazed and pol‐
ished surfaces.
On the glazed samples Sa (nm) values have an ascending aspect from ST to CE. ST in
the medium area recorded the lowest value 21.41 ± 0.02 than 2.42 ± 0.01‐before; the highest
value resulted for CE in cervical area 31.81 ± 0.01, compared to 1.72 ± 0.01‐before. For IP in
medium area was reported an intermediate value 29.05 ± 0.02 compared to 2.54 ± 0.01‐before.
On the polished samples, the lowest value was reported for CE in cervical area 20.34
± 0.01, compared to 1.39 ± 0.01, before and the highest for ST in incisal and medium area
31.78 ± 0.02 than 1.32 ± 0.02, before. For IP, the values have an intermediate aspect, but
they are almost similar to those on glazed side.
On glazed side of specimens, the lowest Sq value is in medium area for ST‐24.41 ± 0.02
compared to 2.94 ± 0.01, before and the highest for CE in incisal area 36.37 ± 0.01, compared to
1.98 ± 0.01, before. For IP in medium area Sq value 33.22 ± 0.02 was recorded, compared to
3.05 ± 0.01, before.
On the polished side of samples, the lowest Sq values werereported for CE in cer‐
vical area 23.52 ± 0.01, compared to 1.74 ± 0.01, before and the highest for ST in medium
area 36.25 ± 0.02 than 1.69 ± 0.02, before.
Before aging, the two‐way ANOVA test (α = 0.05) reported no significant difference (p >
0.05) regarding to Sa = root mean square height, Sq = root mean square height, between the
three areas (cervical‐medium‐incisal) of glazed or polished samples for a material.
The unpaired t‐Test test (α = 0.05) reported significant differences (p < 0.05) in terms
of Sa‐arithmetical mean height in cervical and medium areas and no significant differ‐
ences in incisal area between glazed and polished surfaces of each material (incisal: ST
glazed‐polished p = 0.08; IP glazed‐polished p = 0.241; CE glazed‐polished p = 0.452).
After aging, the two‐way ANOVA test (α = 0.05) reported no significant difference (p
> 0.05) regarding to Sa = root mean square height, Sq = root mean square height, between
the three areas(cervical, medium, incisal) for each glazed or polished samples, of a mate‐
rial and the unpaired t‐Test test (α = 0.05) reported significant differences (p < 0.05) in
Figure 6. 3D AFM images of the polished samples, after aging.ST= STML, IP= IPS e.maxZirCADCEREC/in Lab MT Multi, CE = CeramillZolidfx ML, c = cervical, m = medium, i = incisal.
After aging, there is a significant increase in Sa (nm)-arithmetical mean height and Sq(nm)-root mean square height values, for all materials, both on the glazed andpolished surfaces.

Materials 2022, 15, 3606 11 of 21
On the glazed samples Sa (nm) values have an ascending aspect from ST to CE. STin the medium area recorded the lowest value 21.41 ± 0.02 than 2.42 ± 0.01-before; thehighest value resulted for CE in cervical area 31.81 ± 0.01, compared to 1.72 ± 0.01-before.For IP in medium area was reported an intermediate value 29.05 ± 0.02 compared to2.54 ± 0.01-before.
On the polished samples, the lowest value was reported for CE in cervical area20.34 ± 0.01, compared to 1.39 ± 0.01, before and the highest for ST in incisal and mediumarea 31.78 ± 0.02 than 1.32 ± 0.02, before. For IP, the values have an intermediate aspect,but they are almost similar to those on glazed side.
On glazed side of specimens, the lowest Sq value is in medium area for ST-24.41 ± 0.02compared to 2.94 ± 0.01, before and the highest for CE in incisal area 36.37 ± 0.01, comparedto 1.98 ± 0.01, before. For IP in medium area Sq value 33.22 ± 0.02 was recorded, comparedto 3.05 ± 0.01, before.
On the polished side of samples, the lowest Sq values werereported for CE in cervicalarea 23.52 ± 0.01, compared to 1.74 ± 0.01, before and the highest for ST in medium area36.25 ± 0.02 than 1.69 ± 0.02, before.
Before aging, the two-way ANOVA test (α = 0.05) reported no significant difference(p > 0.05) regarding to Sa = root mean square height, Sq = root mean square height, betweenthe three areas (cervical-medium-incisal) of glazed or polished samples for a material.
The unpaired t-Test test (α = 0.05) reported significant differences (p < 0.05) in terms ofSa-arithmetical mean height in cervical and medium areas and no significant differencesin incisal area between glazed and polished surfaces of each material (incisal: ST glazed-polished p = 0.08; IP glazed-polished p = 0.241; CE glazed-polished p = 0.452).
After aging, the two-way ANOVA test (α = 0.05) reported no significant difference(p > 0.05) regarding to Sa = root mean square height, Sq = root mean square height, betweenthe three areas(cervical, medium, incisal) for each glazed or polished samples, of a materialand the unpaired t-Test test (α = 0.05) reported significant differences (p < 0.05) in terms ofSa-arithmetical mean height, between the same areas of the glazed and polished surfacesof each material, for ST in cervical and medium area.
The before–after aging statistical paired T-Test (α = 0.05) found significant differ-ences (p ≤ 0.05) regarding Sa, Sq values among the same areas of glazed, respectivelypolished samples.
3.3. Scanning Electron Microscopy (SEM)
The surface topographic analysis revealed a regular and homogeneous structure forthe glazed samples, before aging, except some places with a wavy surface due to theapplication of glaze. In the medium area on ST followed by IP samples, the surfacedisplayed interconnecting striations and was rougher than the other areas; by IPS and CEin incisal area, fine striations are visible under glaze layer.
On the polished samples, before aging, the striations, small irregularities, and defectsare more obvious than on the glazed surfaces; for ST and IP in medium area, flaws andporosities were observed on the surface.
SEM images of the control samples are illustrated in Figures 7 and 8.

Materials 2022, 15, 3606 12 of 21
Materials 2022, 15, x FOR PEER REVIEW 12 of 21
terms of Sa‐arithmetical mean height, between the same areas of the glazed and polished
surfaces of each material, for ST in cervical and medium area.
The before–after aging statistical paired T‐Test (α = 0.05) found significant differ‐
ences (p ≤ 0.05) regarding Sa, Sq values among the same areas of glazed, respectively
polished samples.
3.3. Scanning Electron Microscopy (SEM)
The surface topographic analysis revealed a regular and homogeneous structure for
the glazed samples, before aging, except some places with a wavy surface due to the ap‐
plication of glaze. In the medium area on ST followed by IP samples, the surface dis‐
played interconnecting striations and was rougher than the other areas; by IPS and CE in
incisal area, fine striations are visible under glaze layer.
On the polished samples, before aging, the striations, small irregularities, and de‐
fects are more obvious than on the glazed surfaces; for ST and IP in medium area, flaws
and porosities were observed on the surface.
SEM images of the control samples are illustrated in Figures 7 and 8.
ST IP CE
c
m
i
Figure 7.SEM images for glazed samples before aging.ST= STML, IP= IPS e.maxZirCAD CEREC/in
Lab MT Multi, CE= CeramillZolidfx ML, c = cervical, m = medium, i = incisal.
ST IP CE
c
Figure 7. SEM images for glazed samples before aging. ST= STML, IP= IPS e.maxZirCAD CEREC/inLab MT Multi, CE= CeramillZolidfx ML, c = cervical, m = medium, i = incisal.
Materials 2022, 15, x FOR PEER REVIEW 13 of 22
ST IP CE c
m
i
Figure 8. SEM images for polished samples before aging.ST= STML, IP= IPS e.maxZirCAD CEREC/in Lab MT Multi, CE= CeramillZolidfx ML, c = cervical, m = medium, i = incisal.
After aging for glazed specimens, the appearance of the surfaces is quite similar; however, on ST samples in cervical and medium area, striations and micro-cracks may be observed. After autoclaving, for CE, the appearance of the surface is quite similar to that before aging. On polished samples, there was an obvious damage in all areas compared to the situation before aging.
After aging, the SEM images of samples are illustrated in Figures 9 and 10.
ST IP CE c
m
i
Figure 8. SEM images for polished samples before aging.ST= STML, IP= IPS e.maxZirCAD CEREC/inLab MT Multi, CE= CeramillZolidfx ML, c = cervical, m = medium, i = incisal.
After aging for glazed specimens, the appearance of the surfaces is quite similar;however, on ST samples in cervical and medium area, striations and micro-cracks may beobserved. After autoclaving, for CE, the appearance of the surface is quite similar to thatbefore aging. On polished samples, there was an obvious damage in all areas compared tothe situation before aging.
After aging, the SEM images of samples are illustrated in Figures 9 and 10.

Materials 2022, 15, 3606 13 of 21
Materials 2022, 15, x FOR PEER REVIEW 13 of 21
m
i
Figure 8. SEM images for polished samples before aging.ST= STML, IP= IPS e.maxZirCAD
CEREC/in Lab MT Multi, CE= CeramillZolidfx ML, c = cervical, m = medium, i = incisal.
After aging for glazed specimens, the appearance of the surfaces is quite similar;
however, on ST samples in cervical and medium area, striations and micro‐cracks may be
observed. After autoclaving, for CE, the appearance of the surface is quite similar to that
before aging. On polished samples, there was an obvious damage in all areas compared
to the situation before aging.
After aging, the SEM images of samples are illustrated in Figures 9 and 10.
ST IP CE
c
m
i
Figure 9. SEM images for glazed samples after aging.ST = STML, IP = IPS e.maxZirCAD CEREC/in
Lab MT Multi, CE = CeramillZolidfx ML, c = cervical, m = medium, i = incisal.
Figure 9. SEM images for glazed samples after aging.ST = STML, IP = IPS e.maxZirCAD CEREC/inLab MT Multi, CE = CeramillZolidfx ML, c = cervical, m = medium, i = incisal.
Materials 2022, 15, x FOR PEER REVIEW 14 of 21
ST IP CE
c
m
i
Figure 10. SEM images for polished samples after aging.ST = STML, IP = IPS e.maxZirCAD
CEREC/in Lab MT Multi, CE = CeramillZolidfx ML, c = cervical, m = medium, i = incisal.
3.4. Microhardness Testing
Before and after aging, the mean Vickers hardness values with SD (standard devia‐
tion) of the materials, for both glazed and polished specimens in three areas are pre‐
sented in Table 8.
Table 8. Mean Vickers hardness values with SD, for all samples (n = 8).
ST glazed ST polished IP glazed IP polished CE glazed CE polished
control groups
c 770.33 ±9.60 1763 ± 17.02 700 ± 5.72 1732 ± 15.70 632.67± 8.50 1637 ± 12.50
m 763.67 ± 8.62 1763 ± 17.02 597 ± 3.80 1638.67 ± 14.02 617 ± 7.90 1552 ± 8.41
i 694.67 ± 9.14 1732 ± 15.89 626 ± 4.20 1700.67 ± 15.03 610 ± 7.28 1597 ± 9.54
aged groups
c 672.67 ± 8.32 1711 ± 15.41 621 ± 4.10 1729.67 ± 15.05 708.33 ± 9.42 1532.33 ± 9.50
m 601 ± 5.12 1809.67 ± 17.91 603.33 ± 4.08 1764.33 ± 16.15 722± 8.11 1607.67 ± 8.97
i 640.33 ± 5.81 1797 ± 17.56 694.33 ± 4.21 1762.67 ± 16.08 722± 8.11 1667.67± 5.70
ST = STML, IP = IPS e.maxZirCAD CEREC/in Lab MT Multi, CE = CeramillZolidfx ML; c = cervical,
m = medium, i = incisal.
Before aging, the microhardness values for polished specimens were significantly
higher compared to the glazed ones.
On the glazed samples, the highest microhardness values were reported for ST
(770.33± 9.60), followed by IP (700 ± 5.72) and CE (632.67± 8.50) for all, in the cervical area.
On the polished samples, the highest surface microhardness was recorded for ST in cer‐
vical area and medium area (1763± 17.02), followed by IP in cervical area (1732 ± 15.70)
and CE in cervical area (1637± 12.50).
Among materials, for CE, on the glazed and polished surface, the microhardness
values were lower.
After aging, the microhardness for polished samples issignificantly higher com‐
pared to the glazed ones.
On the glazed side, for ST, the values decreased, the highest was recorded (672.67±
8.32) in cervical area; for IP the values are almost the same as before aging (ex. 694.33±
Figure 10. SEM images for polished samples after aging.ST = STML, IP = IPS e.maxZirCAD CEREC/inLab MT Multi, CE = CeramillZolidfx ML, c = cervical, m = medium, i = incisal.
3.4. Microhardness Testing
Before and after aging, the mean Vickers hardness values with SD (standard deviation)of the materials, for both glazed and polished specimens in three areas are presented inTable 8.

Materials 2022, 15, 3606 14 of 21
Table 8. Mean Vickers hardness values with SD, for all samples (n = 8).
ST Glazed ST Polished IP Glazed IP Polished CE Glazed CE Polished
control groupsc 770.33 ±9.60 1763 ± 17.02 700 ± 5.72 1732 ± 15.70 632.67± 8.50 1637 ± 12.50m 763.67 ± 8.62 1763 ± 17.02 597 ± 3.80 1638.67 ± 14.02 617 ± 7.90 1552 ± 8.41i 694.67 ± 9.14 1732 ± 15.89 626 ± 4.20 1700.67 ± 15.03 610 ± 7.28 1597 ± 9.54
aged groupsc 672.67 ± 8.32 1711 ± 15.41 621 ± 4.10 1729.67 ± 15.05 708.33 ± 9.42 1532.33 ± 9.50m 601 ± 5.12 1809.67 ± 17.91 603.33 ± 4.08 1764.33 ± 16.15 722± 8.11 1607.67 ± 8.97i 640.33 ± 5.81 1797 ± 17.56 694.33 ± 4.21 1762.67 ± 16.08 722± 8.11 1667.67± 5.70
ST = STML, IP = IPS e.maxZirCAD CEREC/in Lab MT Multi, CE = CeramillZolidfx ML; c = cervical, m = medium,i = incisal.
On the glazed samples, the highest microhardness values were reported for ST(770.33 ± 9.60), followed by IP (700 ± 5.72) and CE (632.67 ± 8.50) for all, in the cer-vical area. On the polished samples, the highest surface microhardness was recordedfor ST in cervical area and medium area (1763 ± 17.02), followed by IP in cervical area(1732 ± 15.70) and CE in cervical area (1637 ± 12.50).
Among materials, for CE, on the glazed and polished surface, the microhardnessvalues were lower.
After aging, the microhardness for polished samples issignificantly higher comparedto the glazed ones.
On the glazed side, for ST, the values decreased, the highest was recorded (672.67 ± 8.32)in cervical area; for IP the values are almost the same as before aging (ex. 694.33 ± 4.21)in incisal area. For CE, an increase in all three areaswas reported; the highest values(722 ± 8.11) were recorded in medium and incisal area.
On the polished samples, a minor increase in values can be observed; the highest(1667 ± 5.70) was reported for CE in incisal area.
The microhardness values recorded before and after aging on glazed and polishedsamples, in cervical, medium, incisal areas, for all three materials (n = 8), are summarizedin Figure 11.
Materials 2022, 15, x FOR PEER REVIEW 15 of 21
4.21) in incisal area. For CE, an increase in all three areaswas reported; the highest values
(722± 8.11) were recorded in medium and incisal area.
On the polished samples, a minor increase in values can be observed; the highest
(1667± 5.70) was reported for CE in incisal area.
The microhardness values recorded before and after aging on glazed and polished
samples, in cervical, medium, incisal areas, for all three materials (n = 8), are summarized
in Figure 11.
Figure 11. Mean microhardness values and SD before and after aging.ST = STML, IP = IPS
e.maxZirCAD CEREC/in Lab MT Multi, CE = CeramillZolidfx ML; cg = control glazed, cp = control
polished, ag = aged glazed, ap = aged polished;c = cervical, m = medium, i = incisal.
Before aging, the microhardness values for polished specimens were significantly
higher compared to the glazed ones.
There were insignificant differences (p > 0.05) when the statistical test two‐way
ANOVA was performed to compare the surface microhardness between cervi‐
cal‐medium‐incisal areas individual on glazed and on polished sides of each zirconia.
The unpaired t‐Test test (α = 0.05) assessed a significant impact (p < 0.005) to the
analysis in the same areas between control‐glazed and control‐polished groups, for all
three materials.
For both glazed and polished surfaces, Pearson’s correlation reported a negative
correlation between surface roughness Ra and microhardness, r = −0.9, which means that
the hardness decreases when the roughness is increased.
After autoclaving, no significant differences (p > 0.05) were observed by statistical
two‐way ANOVA test between every two or three areas, on each glazed or polished
surface for a material.
The unpaired t‐Test test (α = 0.05) revealed significant differences (p < 0.005) to the
analysis in the same areas between aged‐glazed and aged‐polished groups, for all three
materials.
The statistical paired t‐Test (α = 0.05) reported no significant differences concerning
microhardness values (Vickers Hardness number‐VN) among the same areas recorded
before and after aging, on the glazed and polished surfaces, except CE glazed samples;
the p values are included in Table 9.
0.00
500.00
1000.00
1500.00
2000.00
ST cg ST ag ST cp ST ap IP cg IP ag IP cp IP ap CE cg CE ag CE cp CE ap
Mean microhardness for all groups
c m i
Figure 11. Mean microhardness values and SD before and after aging. ST = STML, IP = IPSe.maxZirCAD CEREC/in Lab MT Multi, CE = CeramillZolidfx ML; cg = control glazed, cp = controlpolished, ag = aged glazed, ap = aged polished;c = cervical, m = medium, i = incisal.
Before aging, the microhardness values for polished specimens were significantlyhigher compared to the glazed ones.
There were insignificant differences (p > 0.05) when the statistical test two-wayANOVA was performed to compare the surface microhardness between cervical-medium-incisal areas individual on glazed and on polished sides of each zirconia.

Materials 2022, 15, 3606 15 of 21
The unpaired t-Test test (α = 0.05) assessed a significant impact (p < 0.005) to theanalysis in the same areas between control-glazed and control-polished groups, for allthree materials.
For both glazed and polished surfaces, Pearson’s correlation reported a negativecorrelation between surface roughness Ra and microhardness, r = −0.9, which means thatthe hardness decreases when the roughness is increased.
After autoclaving, no significant differences (p > 0.05) were observed by statisticaltwo-way ANOVA test between every two or three areas, on each glazed or polished surfacefor a material.
The unpaired t-Test test (α = 0.05) revealed significant differences (p < 0.005) tothe analysis in the same areas between aged-glazed and aged-polished groups, for allthree materials.
The statistical paired t-Test (α = 0.05) reported no significant differences concerningmicrohardness values (Vickers Hardness number-VN) among the same areas recordedbefore and after aging, on the glazed and polished surfaces, except CE glazed samples; thep values are included in Table 9.
Table 9. The paired t-Test test (α = 0.05)-p values for microhardnessamong control glazed-agedglazed, respectively control polished-aged polished groups in each area.
VN ST cg-ag STcp-ap IP cg-ag IP cp-ap CE cg-ag CE cp-ap
c 0.621 0.033 0.887 0.972 0.012 0.091m 0.116 0.248 0.584 0.623 0.016 0.183i 0.413 0.475 0.671 0.523 0.001 0.359
VN = Vickers Hardness number (microhardness value). ST = STML, IP = IPS e.maxZirCAD CEREC/in Lab MTMulti, CE = CeramillZolidfx ML. cg = control glazed, cp=control polished, ag = aged glazed, ap=aged polished.c = cervical, m = medium, i = incisal.
4. Discussion
The study investigated the surface characteristics, microstructure and microhardnesson glazed and polished samples of three multilayered dental zirconia with different per-centages of Y2O3 (4 mol%; 4 mol%+ 5 mol%; 5 mol%), first before and then after aging,achieved through autoclaving, as LTD (low temperature degradation).
Before aging, among materials ST = STML, IP = IPS e.maxZir CAD CEREC/in LabMT Multi, CE = CeramillZolidfx ML for the glazed samples, the lowest Ra-arithmeticaverage surface roughness values were found for ST (4 mol% Y2O3), followed by IP(4 mol% + 5 mol% Y2O3) and the highest surface roughness was recorded for CE (5 mol%Y2O3)-the superhigh-translucency zirconia, with the highest Yttrium content and the lowestflexural strength (700 MPa) of the three analyzed materials.
Among areas of the glazed samples, for ST, the highest Ra value (0.067 ± 0.010) wasrecorded in the incisal area; for IP, it was found that surface roughness increases fromcervical (0.073 ± 0.009) to incisal (0.083 ± 0.009); and for CE close values were reported,the highest cervical (0.086 ± 0.010). Between the glazed (cervical-medium-incisal) areasof a material no statistically significant differences were found (p < 0.05). On the polishedsamples, the same ratio was observed as for glazed specimens, the lowest Ra values werefound for ST (ex. 0.043 ± 0.010—medium), followed by IP (ex. 0.046 ± 0.009-incisal) andthe highest for CE (ex.0.047 ± 0.008-cervical). Among (cervical-medium-incisal) areas onglazed or polished surfaces of a material no statistically significant differences (two-wayANOVA test, α = 0.05) were found (p < 0.05).
The surface roughness values measured for the glazed samples are higher than forthose polished. The unpaired t-Test (α = 0.05) reported a significant difference (p < 0.05)in terms of Ra and Rz between the same areas of glazed and polished sample, for allthree materials.
When comparing the surface roughness obtained between the areas of a material, it isobserved that for ST, respectively for CE, the values are close to each other, both on glazed
Materials 2022, 15, 3606 16 of 21
and polished samples; which means as some manufactures and some studies show, thelayers presented almost the same content of Yttrium, cubic phase, respectively a similarmicrostructure; the color difference being given only by the pigment composition [24].Instead, for IP, the surface roughness values reported an ascending orderfrom cervicalto incisal, corresponding to the various distribution of Yttrium content and cubic phase,respectively, and a different microstructure among the layers of this material.
Regarding glazing process as a surface treatment, the microstructure, the smoothnessof the surface on which the glaze layer is deposited, and the interface between them greatlyinfluence the external appearance of the surface. For ST, which contains smaller grains thanCE, the surface roughness was lower. It is also possible to record different Ra, Rz valueswhen using the manufacturer’s own glaze pasta.
Referring to the polishing process, for this study small-grit grinding tools were usedso as not to cause, as much as possible, phase transformation and surface degradationwhich results in an increase in surface roughness. However, a zirconia such as CE, that hasthe lowest mechanical properties among the studied materials and contains larger grainsthat can be easily dislocated during processing resulting unevenness and flaws, presentedthe highest surface roughness.
In addition, for a better surface topography evaluation, the samples were examinedusing an atomic force microscope (AFM) and a scanning electron microscope (SEM).
AFM provided a high resolution three-dimensional visualization of glazed and polish-ing samples, the values for parameters Sa (nm)-arithmetical mean height and Sq (nm)-rootmean square height resulted. The nanoroughness values found on the glazed surfaceswere higher than on the polished ones. On the glazed samples, the highest Sa value wasrecorded for CE (2.66 ± 0.02), followed by IP (2.54 ± 0.01) and the least affected was ST(2.42 ± 0.01), all in the medium area. On the polished surfaces, the highest Sa (nm) valueresulted for CE (1.58 ± 0.01) in medium area, IP (1.55 ± 0.01), and almost the same for ST(1.53 ± 0.02) in incisal area.
The SEM examination for glazed samples revealed a fairly smooth and uniform surfacewith striated patterns resulting from the deposition (brushing) of the glaze layers, creatinga wavy appearance, which might influence the surface roughness. By CE and IP-incisalareas, the striations resulting from processing are visible under the glaze layers. The imageswhich present the polished surfaces showed interconnecting scratches, shallow striationand micro-cracks created by the rotative instrument on a smooth surface, except for ST andIP medium area, where grater damage was observed.
Surface microhardness test measures the resistance of material to successive indenta-tion. Mechanical properties are influenced by the crystalline phase, yttrium content, moreprecisely by the microstructure of the material [52]. In this study, the unpaired t-Test test(α = 0.05) reported a significant difference (p < 0.005) regarding the microhardness (VN)between polished (1552 to 1763 MPa) and glazed surfaces (597 to 763 MPa).
The glaze layer was locally negatively damaged; thus confirming that the surfacetreatment can affect the surface hardness and the resistance of the material. The sharpestand most chipped edge of the indent was observed on the glazed surface of CE (5 mol%Y2O3), followed by ST (4 mol% Y2O3) and the least obvious crack patterns and indentationimprints by IP (4 mol% + 5 mol% Y2O3).
Considering that the same glaze was used for all three materials, it is possible that themicrostructure, surface appearance, the interface had an influence on the sealing, adhesioncapacity, and resistance of the glaze layer. Moreover, it may be relevant as the glaze (IPSIvocolor Glaze Paste) and IP (IPS e.maxZirCAD CEREC/in Lab MT Multi) materials wereproduced by the same manufacturer (IvoclarVivadent, Schaan, Liechtenstein). Among thethree areas of glazed, respectively of polished surfaces, no significant differences (two-way ANOVA test, p > 0.05) were reported, confirming the first hypothesis, also in termsof hardness.
For both glazed and polished specimens, a negative Pearson’s correlation (r = −0.9)between surface roughness and microroughness was reported; meaning that increasing
Materials 2022, 15, 3606 17 of 21
the roughness implies decreasing the hardness and the surface treatment significantlyinfluenced the surface roughness, respectively the microhardness [53].
After aging, both glazed and polished samples show an increase in roughness andthe values recorded on the glazed samples were higher than for those polished ones.
Among glazed specimens, compared with the situation before aging, statistical pairedt-Test (α =0.05) revealed a significant increase in values for ST (p < 0.05) and an insignificantincrease for CE (p > 0.05); however, the lowest mean Ra values were recorded for ST (0.077to 0.080) and the highest for CE (0.086 to 0.088). For IP, the surface roughness increasedin cervical area and slightly in incisal area, but the values were lower in cervical area(0.081 ± 0.009) than in incisal area (0.086 ± 0.010).
As a result, the conclusion could be that the material with 4 mol% Yttrium content (ST,IP–cervical) undergoes a more intense aging process accompanied by phase transformation,volume increase of particles, grain detachment, and surface roughness. For CE (5 mol%Yttrium), the surface roughness before aging was the highest and after aging showed aminor increase, meaning that the superhigh-translucency zirconia is not very affected byaging; however, it remains the material with the roughest surface.
Other studies demonstrated as well that the increased roughness does not acceleratethe aging process for (super) high-translucent zirconia and the toughness was preservedafter grinding and LTD [16,54].
Certainly, the glaze layer has a protective role, but may be directly affected by theaging process or as a result of alteration in the underlying material, with influence onsurface texture and hardness.
Among polished samples, compared with the situation before aging, the paired t-Test(α = 0.05) reported that the surface roughness values for ST (p < 0.005) increased more thanthose for CE (p > 0.005) and among materials, the highest Ra values were measured for ST(0.052 to 0.054) and the lowest for CE (0.047 to 0.048); for IP, the values tend to decreasefrom the cervical (0.053 ± 0.009) to incisal (0.049 ± 0.009) area. This means that the materialwith 4 mol% Yttrium content is more susceptible to the aging process, thus hydrothermaland mechanical impact cause phase transformation, resulting in surface degradation andan increase in microhardness; this situation has been presented in other studies [55,56].
On the glazed surfaces, the nanoroughness values Sa = arithmetical mean height,Sq = root mean square height, were higher than on the polished ones;the lowest values werefound for ST and the highest for CE. On the polished specimens, the highest nanoroughnessvalues were recorded for ST and the lowest for CE. Regarding Sa and Sq, the paired t-Test(α = 0.05) reported a significant increase in glazed and polished specimens, after aging.
After aging, the surface topographic analysis (SEM) revealed for ST glazed specimens,more visible striations, and micro-cracks (cervical, medium- area), compared to the appear-ance before aging. For CE, a minor increase in surface roughness was recorded and thesurface aspect is quite similar to that before aging. On polished samples compared to theinitial situation, in all areas, an evident degradation with deeper striations and scratches,sharp peaks, irregularities and defectswas observed.
It was revealed that both before and after autoclaving, glazing and polishing as surfacetreatment, influenced and affected the microroughness and topography of zirconia withdifferent Yttrium content. The second null hypothesis is accepted.
Although an optimal threshold has not been set, it was reported that the roughnessvalue (Ra-arithmetic average surface roughness) above 0.2 µm, could induce negativeeffects such as retention of bacteria, periodontal inflammation, dental caries risk [57],and a value above 0.3 µm can be perceived by the tongue, negatively affecting patientcomfort [57,58]. The Ra values results of this study, for all three zirconia types, in threeareas on glazed, respectively polished surfaces, were lower than 0.2 µm, therefore they maybe considered clinically acceptable.
Regarding microhardness, after autoclaving, the unpaired t-Test test (α = 0.05) re-vealed that the values for polished samples are maintained significantly higher (p < 0.005)compared to the glazed one, confirming the second hypothesis, also in terms of hardness.
Materials 2022, 15, 3606 18 of 21
On the glazed specimens, for ST was observed a decrease in microhardness, whilethose for IP remained at a level similar to that before aging and CE, denotingan increase invalues. On the polished samples, for ST and IP a minor increase of values was recordedand for CE the values remain approximately the same as those before aging.
Before aging, ST (4 mol% Yttrium) recorded the lowest surface roughness and thehighest microhardness, demonstratingthe best mechanical properties among the studiedmaterials, on the glazed and polished samples. After aging, this material experiencedthe largest increase in roughness for both groups and microhardness decreased on glazedand increased on polished side. It seems that for the glazed samples, the aging processinduced t-to-m phase transformation with an increase in surface roughness, adverselyaffecting the interface features and the glaze layer and for the polished specimens, thephase transformation led to a toughening reaction.
For CE (5 mol% yttrium), before autoclaving, the microhardness values were close tothose for IP, but lower than those measured for ST on glazed surfaces and the lowest amongmaterials on polished samples. After aging, the microhardness increased for the glazedgroup and between materials was the highest; for the polished samples the values aremaintained (with a slight increase) as before aging and among materials were the lowest.It seems that the material was not very affected by aging process, however the hardnessincreased and the glaze layer had a protective role.
For IP (4 mol% + 5 mol%), regarding mechanical properties an intermediate aspectamong the tested materials, both on glazed and polished samples, before or after auto-clavingwas observed. The records revealed similarities between properties and valuesmeasured in cervical area with those of ST and the incisal area with those of CE.
The aging behavior is correlated with the microstructure of the material, and withthe surface treatment. As a result of these findings, the third null hypotheses—the rough-ness value would increase and microhardness decrease after the aging procedure—isnot accepted.
The limitation of this study was the short-term aging and the fact that certain factorsthat interact with restoration in oral environment could not be fully reproduced (chewingforce, saliva components, temperature, and pH fluctuations).
5. Conclusions
1. For tested zirconia materials, no significant differences among layers were registeredregarding surface characteristics.
2. Surface treatment (glazing or polishing) has a significant impact on surface roughnessand microhardness; the glazed samples were found with higher surface roughnessand lower microhardness compared to the polished ones. This correlation is preservedeven after LTD.
3. After aging microroughness increases, but significant only for the super translucentmaterial. There is a significant increase in nanoroughness values, for all materials,both on the glazed and polished surfaces. Related to microhardness, aging does nothave a significant influence.
4. The super translucent 4Y-TZP (fourth-generation) material was more affected byaging compared to the super-high translucent 5Y-TZP (third-generation) material.The material with 4 mol% + 5 mol% revealed similarities for each layer correspondingto the microstructure.
Author Contributions: Conceptualization, F.R.T. and L.P.; methodology, F.R.T. and L.P.; software,F.R.T. and L.C.M.; validation, F.R.T. and L.P.; investigation, F.R.T., M.I.B., I.-D.U. and R.D.V.;writing—F.R.T.; writing—review and editing, L.P.; supervision, L.P. All authors have read andagreed to the published version of the manuscript.
Funding: This research received no external funding.
Institutional Review Board Statement: Not applicable.

Materials 2022, 15, 3606 19 of 21
Informed Consent Statement: Not applicable.
Data Availability Statement: Not applicable.
Conflicts of Interest: The authors declare no conflict of interest.
References1. Denry, I.; Kelly, J.R. State of the art of zirconia for dental applications. Dent. Mater. 2008, 24, 299–307. [CrossRef] [PubMed]2. Yamada, Y.; Matsumoto, A.; Ito, Y. Zirconia Sintered Body, Zirconia Composition and Zirconia Calcined Body Production Method.
U.S. Patent 9212065, 15 December 2015.3. Salmang, H.; Scholze, H. Keramik Volständing Neuarbaitete und Erweiterte Auflage; Springer: Heidelberg, Germany, 2007; Volume 7,
pp. 817–838.4. Holleman-Wiberg, E. Lehrbuch der Anorganischen Chemie, 101st ed.; Walterde Gruyter & Co.: Berlin, Germany, 1995; pp. 918–985.5. Zhang, Y.; Inokoshi, M.; Batuk, M.; Hadermann, J.; Naert, I.; Van Meerbeek, B.; Vleugels, J. Strength, toughness and aging stability
of hightly translucent Y-TZP ceramics for dental restorations. Dent. Mater. 2016, 32, 327–337. [CrossRef] [PubMed]6. Zhang, Y.; Lawn, B.R. Novel zirconia materials in dentistry. J. Dent. Res. 2018, 97, 140–147. [CrossRef] [PubMed]7. Lawson, N. Everything You Need to Know about Dental Zirconia. Available online: https://www.DentalAcademyofCE.com
(accessed on 16 February 2022).8. Scientific Documentation. Microsoft Word–WissDok IPS e.maxZirCADenglisch_aktualisiert 30112017.docx. Available online:
https://www.ivoclar.com/ (accessed on 3 March 2022).9. Zhang, F.; Reveron, H.; Spies, B.C.; Van Meerbeek, B.; Chevalier, J. Trade-off between fracture resistance and translucency of
zirconia and lithium-desilicated glass ceramics for monolithic restorations. Acta Biomater. 2019, 91, 24–34. [CrossRef] [PubMed]10. Bressan, E.; Ferroni, L.; Gardin, C.; Bellin, G.; Sbricoli, L.; Sivolella, S.; Brunello, G.; Schwartz-Arad, D.; Mijiritsky, E.; Penarrocha,
M.; et al. Metal Nanoparticles Released from Dental Implant Surfaces: Potential Contribution to Chronic Inflammation andPeri-implant Bone Loss. Materials 2019, 12, 2036. [CrossRef]
11. Tatullo, M.; Genovese, F.; Aiello, E.; Amantea, M.; Makeeva, I.; Zavan, B.; Rengo, S.; Fortunato, L. Phosphorene is the NeuGraphene in Biomedical Application. Materials 2019, 12, 2301. [CrossRef]
12. Tatullo, M.; Zavan, B.; Genovese, F.; Codispoti, B.; Makeeva, I.; Fortunato, L.; Spagnuolo, G. Borophene Is a Promising 2DAllotropic Material for Biomedical Devices. Appl. Sci. 2019, 9, 3446. [CrossRef]
13. Garvie, R.C.; Hannink, R.H.; Pascoe, R.T. Ceramic steel? Nature 1975, 258, 703–704. [CrossRef]14. Chevalier, J.; Cales, B.; Drouin, J.M. Low-temperature aging of Y-TZP ceramics. J. Am. Ceram. Soc. 1999, 82, 2150–2154. [CrossRef]15. Kim, J.W.; Covel, N.S.; Guess, P.S.; Rekow, E.D.; Zhang, Y. Concerns of hydrothermal degradation in CAD/CAM zirconia. J. Dent.
Res. 2010, 89, 91–95. [CrossRef]16. Pereira, G.K.R.; Venturini, A.B.; Silvestri, T.; Dapieve, K.S.; Montagner, A.F.; Soares, F.Z.M.; Valandro, L.F. Low-temperature
degradation of Y-TZP ceramics: A sytematic review and meta-analysis. Mech. Behav. Biomed. Mater. 2015, 55, 151–163. [CrossRef][PubMed]
17. Kelly, J.; Denry, I. Stabilized zirconia as a structural ceramic: An overview. Dent. Mater. 2008, 24, 299–307. [CrossRef] [PubMed]18. Deville, S.; Gremillard, L.; Chevalier, J.; Fantozzi, G. A critical comparison of methods for the determination of aging sensitivity
in biomedical grade yttria-stabilized zirconia. J. Biomed. Mater. Res. Part B Appl. Biomater. 2005, 72, 239–245. [CrossRef] [PubMed]19. Basililio, M.A.; Cardoso, K.V.; Antonio, S.G.; Rizialla, A.S.; Santos, J.G.C.; Arioli, F.J.N. Effects of artificial aging condition on
yttria-stabilized zirconia implant abutsments. J. Prosthet. Dent. 2016, 116, 277–285. [CrossRef] [PubMed]20. Harada, A.; Shishido, S.; Barkarmo, S.; Inagaki, R.; Kanno, T.; Örtengren, U.; Egusa, H.; Nakamura, K. Mechanical and
microstructural properties of ultra-translucent zirconia ceramic stabilized with 5 mol% yttria. J. Mech. Behav. Biomed. Mater. 2020,111, 103974. [CrossRef]
21. McLean, J.W. The Science of Dental Ceramics, 1st ed.; Quintessence Publishing Co.: Berlin, Germany, 1979; pp. 96–110.22. Anselmi-Tamburini, U.; Woolman, I.N.; Munzir, Z.A. Transparent nanometric cubic and tetragonal zirconia obtaining by
high-pressure pulsed electric current sintering. Adv. Funct. Mater. 2007, 17, 3267–3273. [CrossRef]23. Porojan, L.; Vasiliu, R.D.; Birdeanu, M.I.; Porojan, S.D. Surface Characterisation of Dental Resin Composites Related to Condition-
ing and Finishing. Polymers 2021, 13, 4236. [CrossRef]24. Kolakarnprasert, N.; Kaiser, M.R.; Kim, D.K.; Zhang, Y. New multi-layered zirconias: Composition, microstructure and translu-
cency. Dent. Mater. 2019, 35, 797–806. [CrossRef]25. Pereira, G.K.R.; Guilardi, L.F.; Dapieve, K.S.; Kleverlaan, C.J.; Rippe, M.P.; Valandro, L.F. Mechanical reliability, fatigue strength
and survival analysis of new polycrystalline translucent zirconia ceramics for monolithic restorations. J. Mech. Behav. Biomed.Mater. 2018, 85, 57–65. [CrossRef]
26. Ueda, K.; Güth, J.F.; Erdelt, K.; Stimmelmayr, M.; Kappert, H.; Beuer, F. Light transmittance by a multi-colored zirconia material.Dent. Mater. J. 2015, 34, 310–314. [CrossRef]
27. Sedda, M.; Vichi, A.; Carrabba, M.; Capperucci, A.; Louca, C.; Ferrari, M. Influence of coloring procedure on flexural resistence ofzirconia blocks. J. Prosthet. Dent. 2015, 114, 98–102. [CrossRef] [PubMed]
28. Aboushelib, M.N.; de Jager, N.; Kleverlaan, C.J.; Feilzer, A.J. The influence of pigments on the slow crack grow in dental zirconia.Dent. Mater. 2012, 28, 410–415. [CrossRef] [PubMed]

Materials 2022, 15, 3606 20 of 21
29. Kaiser, M.R.; Kokarnprasert, N.; Rodrigues, C.; Chai, H.; Zhang, Y. Probing the interfacial strength of novel multi-layer zirconias.Dent. Mater. 2020, 36, 60–67. [CrossRef] [PubMed]
30. Kim, H.K.; Kim, S.H.; Lee, J.B.; Han, J.S.; Yeo, I.S. Effect of polishing and glazing on the color and spectral distribution ofmonolithic zirconia. J. Adv. Prosthodont. 2013, 5, 296–304. [CrossRef] [PubMed]
31. Sarac, D.; Sarac, Y.S.; Yuzbasioglu, E. The effect of porcelain polishing systems on the color and surface texture of feldspathicporcelain. J. Prosthet. Dent. 2006, 96, 122–128. [CrossRef] [PubMed]
32. Deville, S.; Chevalier, J.; Gremillard, I. Influence of surface finish and residual stress on the aging sensitivity of biomedical gradezirconia. Biomaterials 2006, 27, 2186–2192. [CrossRef] [PubMed]
33. Alghazzawi, T.F.; Lemons, J.; Liu, P.R.; Essig, M.E.; Bartoluccci, A.A.; Janowski, G.M. Influence of low-temperature environmentalexposure on the mechanical properties and structural stability of dental zirconia. J. Prosthodont. 2012, 21, 362–368.
34. Kohorst, P.; Borchers, L.; Strempel, J.; Stiesch, M.; Hassel, T.; Bach, F.W.; Hubsch, C. Low-temperature degradation of differentzirconia ceramics for dental application. Acta Biomater. 2012, 8, 1213–1220. [CrossRef]
35. Canneto, J.; Cattani-Lorente, M.; Durual, S.; Wiskott, A.H.W.; Scherrer, S.S. Grinding damage assessment on four high-strengthceramics. Dent. Mater. 2016, 32, 171–182. [CrossRef]
36. Kosmac, T.; Oblak, C.; Jevnikar, P.; Funduk, N.; Marion, L. The effect of surface grinding and sandblasting on flexural strengthand reliability of Y-TZP zirconia ceramic. Dent. Mater. 1999, 15, 426–433. [CrossRef]
37. Hjerppe, J.; Narhi, T.O.; Vallittu, P.K.; Lassila, L.V. Surface roughness and the flexural and bend strength of zirconia after differentsurface treatments. J. Prosthet. Dent. 2016, 116, 577–583. [CrossRef] [PubMed]
38. Park, C.; Vang, M.S.; Park, S.W.; Lim, H.P. Effect of various polishing system on the surface roughness and phase transformationof zirconia and the durability of the polishing systems. J. Prosthet. Dent. 2017, 117, 430–437. [CrossRef] [PubMed]
39. Al-Wahadni, A.; Martin, D.M. Glasing and Finishing Dental Porcelain. A Lit. Review. J.-Can. Dent. Assoc. 1998, 64, 580–583.40. Anusavice, K.J.; Shen, C.; Rawls, H.R. Phillip’s Science of Dental Materials, 12th ed.; Elsevier: St. Luis, MO, USA, 2012; pp. 231–255.41. Lai, X.; Si, W.; Jiang, D.; Sun, T.; Shao, L.; Deng, B. Effects of small-grit grinding and glazing on mechanical behaviours and aging
resistance of a super-translucent dental zirconia. J. Dent. 2017, 66, 23–31. [CrossRef]42. Vasiliu, R.D.; Porojan, S.D.; Bîrdeanu, M.I.; Ut,u, I.D.; Porojan, L. The Effect of Thermocycling and Surface Treatments on the
Surface Roughness and Microhardness of Three Heat-Pressed Ceramics Systems. Crystals 2020, 10, 160. [CrossRef]43. Jum’ah, A.A.; Brunton, P.A.; Li, K.C.; Waddell, J.N. Simulated clinical adjustment and intra-oral polishing of two translucent,
monolithic zirconia dental ceramics: An in vitro investigation of surface roughness. J. Dent. 2020, 101, 103447. [CrossRef]44. Alao, A.R.; Stoll, R.; Song, X.F.; Miyazaki, T.; Hotta, Y.; Shibata, Y.; Yin, L. Surface quality of yttria-stabilized tetragonal zirconia
polycrystal in CAD/CAM milling, sintering, polishing and sand blasting processes. J. Mech. Behav. Biomed. Mater. 2017, 65,102–116. [CrossRef]
45. Dib, M.H.M.; Goncalves, A.M.; Jasinevicius, R.G.; Duduch, J.C. Diamond wheel grinding performance evaluation of yttriastabilized zirconia-cubic and tetragonal phases. In Proceedings of the Euspen’s 15th International Conference & Exhibition,Leuven, Belgium, 1–5 June 2015.
46. Pereira, G.K.R.; Amaral, M.; Simoneti, R.; Rocha, G.C.; Cesar, P.F.; Valandro, L.F. Effect of grinding with diamond-disc and bur onmechanical behaviour of a Y-TZP ceramic. J. Mech. Behav. Biomed. 2014, 37, 133–140. [CrossRef]
47. Iseri, U.; Ozkurt, Z.; Yalniz, A.; Kazazoglu, E. Comparison of different grinding procedures on the flexural strange of zirconia. J.Prosthet. Dent. 2012, 107, 309–315. [CrossRef]
48. Lee, K.; Choe, H.; Heo, Y.; Lee, J.; Son, M. Effect of different grinding burs on the physical properties of zirconia. J. Adv. Prosthodont.2016, 8, 137. [CrossRef]
49. Kuraray Noritake—Technical Guide Katana Zirconia Multi-Layered Series. 201805-brochure-katana-zirconia-technical-guide-web-en_2.pdf. Available online: https://www.kuraraynoritake.eu/ (accessed on 21 February 2022).
50. Amann Girrbach-Verarbaitungstehnik—Zolid DNA Generation. 976109DE, 03/2021. Indikationsleitfaden_Zirkon_DE.pdf.Available online: amanngirrbach.com (accessed on 25 January 2022).
51. Ivoclar-Vivadent IPS e.max ZirCAD Labside Gebrauchsinformation 2019-06-27, Rev3a. Available online: https://www.cadstar.dental/download/87/materialdokumentation-de/5667919/ipse-maxzircadlabside.pdf (accessed on 18 February 2022).
52. Pereira, G.K.R.; Silvestri, T.; Camago, R.; Rippe, M.P.; Amaral, M.; Klevarlaan, C.J.; Valandro, L.F. Mechanical behaviour ofa Y-TZP ceramic for monolithic restauration: Effect of grinding and low-temperature aging. Mater. Sci. Eng. 2016, 63, 70–77.[CrossRef] [PubMed]
53. Vasiliu, R.D.; Ut,u, I.D.; Porojan, L. The effect of thermocycling on microhardness and surface roughness of two zirconia reinforcedlithium silicate glass-ceramics. J. Matpr. 2020, 45, 4247–4249.
54. Cotes, C.; Arata, A.; Melo, R.M.; Bottino, M.A.; Machado, J.P.B.; Souza, R.O.A. Effects of aging procedure of the topographicsurface, structural stability and mechanical strength of ZrO2-based dental ceramic. Dent. Mater. 2014, 30, 396–404. [CrossRef][PubMed]
55. Baldi, A.; Comba, A.; Ferrero, G.; Italia, E.; Tempesta, R.M.; Paolone, G.; Mazzoni, A.; Breschi, L.; Scotti, N. External gapprogression after cycling fatigue of adhesive overlays and crowns made with high translucency zirconia or lithium silicate. J.Eshet. Restor. Dent. 2022, 34, 557–564. [CrossRef] [PubMed]
56. Reyes, A.R.; Dennisson, J.B.; Powers, J.M.; Sierraalta, M.; Yaman, P. Translucency and Flexural Strength of Translucent ZirconiaCeramics. J. Prosthet. Dent. 2021, in press.

Materials 2022, 15, 3606 21 of 21
57. Jones, C.S.; Billington, R.W.; Pearson, G.J. The in vivo perception of roughness of restauration. Br. Dent. J. 2004, 196, 42–45.[CrossRef]
58. Bollen, C.M.; Lambrechts, P.; Quirynen, M. Comparison of surface roughness of oral hard materials to the threshold surfaceroughness for bacterial plaque retention: A review of the literature. Dent. Mater. J. 1997, 13, 258–269. [CrossRef]