
Supply Chain Innovation is a Key to Superior Firm Performance an Insight from Indian Cement...
15
Supply Chain Innovation is a Key to Superior Firm Performance an Insight from Indian Cement Manufacturing by Rameshwar Dubey, Tripti Singh and Saurabh Tiwari reprinted from International Journal of Innovation Science Volume 4 · Number 4 · December 2012 Multi-Science Publishing 1757-2223
-
Upload
independent -
Category
Documents
-
view
0 -
download
0
Transcript of Supply Chain Innovation is a Key to Superior Firm Performance an Insight from Indian Cement...
SSuuppppllyy CChhaaiinn IInnnnoovvaattiioonn iiss aa KKeeyy ttoo SSuuppeerriioorrFFiirrmm PPeerrffoorrmmaannccee aann IInnssiigghhtt ffrroomm IInnddiiaannCCeemmeenntt MMaannuuffaaccttuurriinnggby
RRaammeesshhwwaarr DDuubbeeyy,, TTrriippttii SSiinngghh aanndd SSaauurraabbhhTTiiwwaarrii
rreepprriinntteedd ffrroomm
IInntteerrnnaattiioonnaall JJoouurrnnaall ooff IInnnnoovvaattiioonn SScciieennccee
Volume 4 · Number 4 · December 2012
MMuullttii--SScciieennccee PPuubblliisshhiinngg11775577--22222233
Volume 4 · Number 4 · 2012
217
Supply Chain Innovation is a Key to SuperiorFirm Performance an Insight from Indian
Cement ManufacturingRameshwar Dubey1, Tripti Singh2 and Saurabh Tiwari3
1Symbiosis International University, Symbiosis Institute of Operations Management, Nashik, India2Motilal Nehru National Institute of Technology, School of Management Studies, Allahabad, India
3University of Petroleum &Energy Studies, College of Management and Economic Studies,Dehradun, India
[email protected] [email protected] [email protected]
ABSTRACTThe following statistical study shows the results of an investigation of supply chaininnovation practices of Indian Cement Manufacturers, which are a significantly large andquickly advancing industry in India. Aside from being a study of adoption of supplychain innovation practices (SCIP) in an emerging super power (India) the benefits ofsupply chain innovation (SCI) are discussed including the major advances in supplychain management. The statistical study compared innovation supply chain practices(like JIT, WMS, CPFR, and others) in 125 large cement firms to their financialperformance measures (ROI, market share, EBIDTA, customer satisfaction,productivity). The resulting correlations showed very high levels of reliability andadequacy, and were uses to make conclusions on which supply chain innovation practiceshad a positive impact on company financial performance. The conclusions are somewhatastounding with the interesting finding that some innovation practices do not supportfirm performance and maybe should be avoided; while others ICS practices are shown tosupport firm performance to a high degree.
Keywords: Supply Chain Innovation, Cement Industry, Firm Performance, India,Management Practices
1. INTRODUCTIONHow is supply chain innovation different from simply “supply chain”? Before establishing a cleardemarcation between these two similar looking terms, we will attempt to explain innovation. To many,the term “innovation” refers to use of new technology and may even refer to new technologicalproducts that improve our lives, improving productivity or efficiency. Technically though, innovationsspan a range from incremental to radical and can apply to products, services, and processes. When itcomes to supply chain innovation, we generally mean improvements in the way that supply chainsoperate, and more specifically, in the way that products, information, work, and funds flow (and aretemporarily stored) throughout the supply chains by using technology or approaches like ECR(Efficient Customer Response), VMI (Vendors Managed Inventory), ERP (Enterprise ResourcePlanning), RFID (Radio Frequency Identification Device) chips, and postponement strategy.Accordingly, supply chain management is all about managing the flow of materials, information, andfunds from source to the end users and also ensuring that after consumption it can be recycled ordisposed of, as per environmental norms; efficiently and effectively at lowest possible cost withoutcompromising service.
How can supply chain innovations help a firm? In a search for competitive differential advantage,many managers of world-class firms around the globe have come to realize that differentiating onprocesses is more sustainable than differentiating on products, even if product differentiation still exists[1]. Product differentiation is more fleeting than process differentiation because products are easier tosee and reverse engineer. Supply chain management processes, in particular those that span multipleorganizations and focus significantly on the flow of goods, information, and funds can be quitecomplex, requiring intra and inter-organizational coordination and collaboration. But resources applied

here often create significant cost savings or improved customer service through product availabilitymeasures [2]. Both cost savings and improved service levels can be leveraged in the marketplace. Thereare numerous examples like Dell, which, by adopting a virtual integration strategy can offer acustomized product at any location. In India Mumbai-Dubbawallah (a lunch box delivery service whichdeliveries lunches made at the customers’ home, usually by their wives, to the customer workplacesthen back home) has used an innovative approach to deliver tiffin boxes and done such a great job thatthey earned them a Six-Sigma certification; in a similar situation a company would need the help of anadvanced technology like RFIT to match their low error rates. On the other hand Mumbai-Dubbawalahused the traditional practice of color combination, which isn’t unique in-and-of itself. Recently, amanufacturer of two wheelers in West Bengal, offered their lowest priced motor-bike at $400, whileother companies offer a similar product at double the price. These are the examples of supply chaininnovation that Indian companies have successfully implemented to improve their profitability andmarket share. What is interesting is not the innovations, supply chains, or product themselves, but theprocesses that lead to such innovations. Some authors’ research shows that supply chain innovationscan emerge from a ‘customer-focused process’ which is aimed at uncovering clues and indications ofchanges in the marketplace which, if addressed by supply chain management innovation, could resultin new practices valued by customers. The process looks something like the following:
1.1 A Process for Innovation1. An organizations looking to develop supply chain innovations, starts by laying the groundwork
for managers to notice changes in the marketplace and business environment. 2. Next, the managers adopt a relatively formal set of procedures for capturing customer insights
that include: customer group meetings, one-on-one interviews (where customers comments andactions are formally captured and later analyzed), customer surveys, secondary purchasing, andsecondary market data. Analysis of this data is conducted using accepted qualitative interpretiveand quantitative statistical methods, looking for clues and patterns to changes that might generateopportunities for supply chain process improvements.
3. Next, the insights that emerge are discussed across functional areas and the organization to arriveat a common understanding of what they mean for various products, processes, and organizationsin the supply chain.
4. Finally, organizational learning occurs with cross-functional and cross-organizationaldiscussions.
1.2 Introduction to the Indian Cement IndustryThe supply and demand for cement in India has undergone a phenomenal amount of growth. On thewhole, the fact that India is a fast developing nation presents an enormous opportunity for thedevelopment of cement industry. The present section deals with the production status of the IndianCement Industry, its potential, the level of technology, scope, foreign direct investments, and futureprospects for the Industry
1.2.1 Production capacity: Demand in the cement industry has seen enormous growth due to the growth of infrastructure,residential, and commercial projects. Cement production in India is anticipated to increase to 315-320million tons (MT) by end of the fiscal year (2011) from the current 300 MT.
1.2.2 Technology upgrade: At present, the Indian cement industry is undergoing a technological change due principally togradation and assimilation witnessed in the sector. Presently, no less than 93% of the total capacity iswholly based on manufacturing under the modern dry process, which is deemed more environmentallyfriendly, while the remaining 7% employs the old wet and semi-dry process technology. The cementindustry in India has developed its technical capabilities to produce a range of cement types including:A) Ordinary Portland Cement (OPC), B) Portland Pozzolana Cement (PPC), C) Portland Blast FurnaceSlag Cement (PBFS), D) Oil Well Cement, E) Rapid Hardening Portland Cement, F) Sulphate ResistingPortland Cement, and G)White Cement.
Al-Muhaisen and Santarisi have reported that costs of the maintenance activities in the cementindustry are about 20-25 percent of the total production costs; furthermore they stressed the vital role
218 Supply Chain Innovation is a Key to Superior Firm Performance an Insight from Indian Cement Manufacturing
International Journal of Innovation Science

of the maintenance system to prevent failures, and enhance the overall efficiency [3]. Numerousresearchers have attempted to enhance maintenance systems within the cement industry. For exampleEti et al have emphasized the needs for an appropriate maintenance system that maintains highperformance by the reduction of unplanned down-time and inventory, and reduces the maintenancetime instead of relying on reactive maintenance procedures [4]. Stephens et al have discussed theopportunity of applying Automatic Downtime Monitoring strategy (ADM) within cement industry [5].The automatic downtime monitoring strategy has the ability to determine the Mean Time BetweenFailure (MTBF) and Mean Time To Repair (MTTR).
1.2.3 Foreign Direct Investments and Future ProspectsThe progressive liberalization and easing of Foreign Direct Investments (FDI) norms in various sectorshave paved the way for growth in foreign direct investments (FDI), which in turn has led to growingdemand for office space from multinational companies (MNCs) and other foreign investors. The totalFDI in the cement sector between April 2000 and August 2010 stood at US $1.9 billion. The cementindustry in India is known for its linkages with other sectors. The Government of India has takenvarious steps to provide the required impetus to the industry; at present 100 per cent FDI is allowed inthis industry. Both the state and export policies promote cement production. Exporters can claim dutydrawbacks on imports of coal and furnace oil up to 20 per cent of the total value of imports. Most stategovernments offer fiscal incentives in the form of sales tax exemptions/deferrals in order to attractinvestment. A recent research report titled ‘Indian Cement Industry Forecast to 2012’ published byresearch firm RNCOS in the year 2011 highlights that cement industry in India has witnessed massivegrowth on the back of various industrial developments and pro-economic policies of the UnionGovernment [6]. This has helped attract the attention of various global cement giants, thereby sparkinga wave of mergers and acquisitions in several states. The report has estimated India’s cementconsumption to grow at a compound annual growth rate (CAGR) of 11 per cent, between 2011-12 and2013-14.The research, which focused on the demand-supply outlook and the cement pricing in variousregions of the country revealed that Andhra Pradesh Cement Company topped the chart in 2008-09 interms of large plants and its largest installed capacity in India. A fast growing economy and theregulatory support is expected to further encourage the industry players to embark on expansion plans.Furthermore, it is estimated that the Government’s assistance to several infrastructure projects, roadnetworks, and housing facilities will boost the growth in cement consumption in the near future [7].
Table 1: Cement Industry profile in India
Number of Cement Companies 42Numbers of Cement Plants 139Installed Capacity (MT) 234.30Cement Production (MT) in the year 2009-2010 168.29Plants with capacity of one MT and above 97Manpower employed 1,200,000Annual Turnover in Mn.$ in the FY 2010 18,000Statistics-Mini & White Cement PlantsCement Plants (Nos.) Approx. 365Installed Capacity (MT) 11.10Cement Production (MT) 2010-2011 6.00
Source: Cement Manufacturers Association of India, 2011
There are approximately 42 large cement plants in India and 365 Mini and white cement plants, withan installed capacity of 234.30 (MT) and 11.10 (MT), respectively as per publication of CementManufacturers Association of India, 2011 [8]. The annual turnover was over Rs. 18,000 crore ($3.4 USbillion) in the financial year 2010. These statistics indicate that the large cement industry has provideddirect employment opportunities to more than 1,200,000 people and indirect employment to more than360,000 people. It also provides clinker (being lumps of ground with gypsum and calcium sulfate) toother mini cement plants so that the available clinker can be fully utilized. However there is animmense opportunity to increase the installed production capacity from 1 million tons to 2 million and
Rameshwar Dubey, Tripti Singh and Saurabh Tiwari 219
Volume 4 · Number 4 · 2012
above to take advantage of economy of scale provided that nearest market within a radius of 200 kmwhich can be supported by a plant.
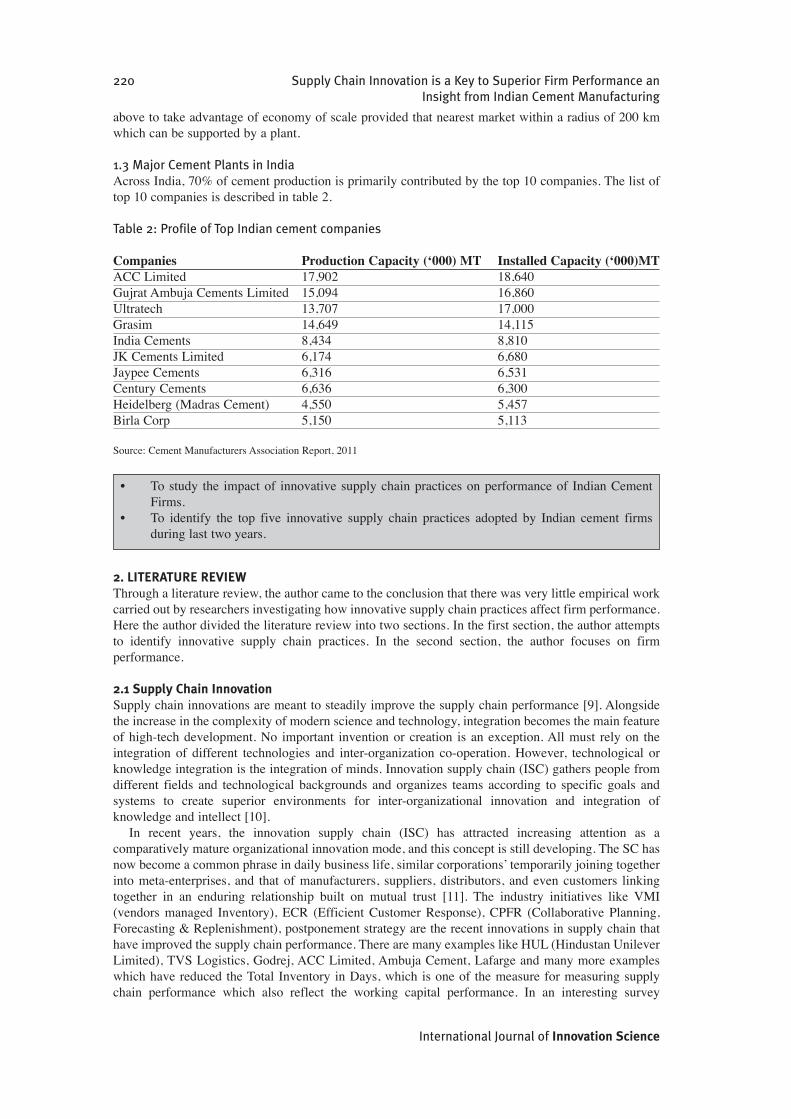
1.3 Major Cement Plants in IndiaAcross India, 70% of cement production is primarily contributed by the top 10 companies. The list oftop 10 companies is described in table 2.
Table 2: Profile of Top Indian cement companies
Companies Production Capacity (‘000) MT Installed Capacity (‘000)MTACC Limited 17,902 18,640Gujrat Ambuja Cements Limited 15,094 16,860Ultratech 13,707 17,000Grasim 14,649 14,115India Cements 8,434 8,810JK Cements Limited 6,174 6,680Jaypee Cements 6,316 6,531Century Cements 6,636 6,300Heidelberg (Madras Cement) 4,550 5,457Birla Corp 5,150 5,113
Source: Cement Manufacturers Association Report, 2011
Consequently, the objective of this study is:
2. LITERATURE REVIEW Through a literature review, the author came to the conclusion that there was very little empirical workcarried out by researchers investigating how innovative supply chain practices affect firm performance.Here the author divided the literature review into two sections. In the first section, the author attemptsto identify innovative supply chain practices. In the second section, the author focuses on firmperformance.
2.1 Supply Chain InnovationSupply chain innovations are meant to steadily improve the supply chain performance [9]. Alongsidethe increase in the complexity of modern science and technology, integration becomes the main featureof high-tech development. No important invention or creation is an exception. All must rely on theintegration of different technologies and inter-organization co-operation. However, technological orknowledge integration is the integration of minds. Innovation supply chain (ISC) gathers people fromdifferent fields and technological backgrounds and organizes teams according to specific goals andsystems to create superior environments for inter-organizational innovation and integration ofknowledge and intellect [10].
In recent years, the innovation supply chain (ISC) has attracted increasing attention as acomparatively mature organizational innovation mode, and this concept is still developing. The SC hasnow become a common phrase in daily business life, similar corporations’ temporarily joining togetherinto meta-enterprises, and that of manufacturers, suppliers, distributors, and even customers linkingtogether in an enduring relationship built on mutual trust [11]. The industry initiatives like VMI(vendors managed Inventory), ECR (Efficient Customer Response), CPFR (Collaborative Planning,Forecasting & Replenishment), postponement strategy are the recent innovations in supply chain thathave improved the supply chain performance. There are many examples like HUL (Hindustan UnileverLimited), TVS Logistics, Godrej, ACC Limited, Ambuja Cement, Lafarge and many more exampleswhich have reduced the Total Inventory in Days, which is one of the measure for measuring supplychain performance which also reflect the working capital performance. In an interesting survey
• To study the impact of innovative supply chain practices on performance of Indian CementFirms.
• To identify the top five innovative supply chain practices adopted by Indian cement firmsduring last two years.
220 Supply Chain Innovation is a Key to Superior Firm Performance an Insight from Indian Cement Manufacturing
International Journal of Innovation Science
published in “Supply Chain Digest” in the year 2010 based on survey conducted on top ten supplychain innovations of all-time are given below:
• Toyota Production System [12]• Continuous Replenishment adopted by P& G’s which laid the foundation of ECR (Efficient
Customer Response) and CPFR (Collaborative Planning, Forecasting and Replenishment)• Ocean Shipping Container, which was incidentally discovered by Malcom Mclean and was first
implemented in 1956, has reinvented the global logistics practice. In fact the concept ofmultimodal transportation took shape after the introduction of steel container.
• Economic Order Quantity, Harris was popularised by Wilson after he wrote an article in the year1934 [13&14].
• Ford Production System in the year 1913 which was pioneered by Henry Ford revolutionized theproduction system by introducing assembly line production. This invention improved theproduction rate at much lower cost.
• The Universal Product Code (UPC) in the 1974 changed the way supply chain practiced.• FedEx Tracking system in the year 1980 drove the idea that “information was as important as the
package itself,” and was the foundation of our current supply chain visibility systems andconcepts.
• Distribution Requirements Planning (DRP) in the year 1970 by Martin in Abbots Lab which laidthe foundation of today’s supply chain practices.
• 3 M’s Transportation Load Control Center in the year 1982 is now popular as LCC, which was aremarkable contribution in the field of transportation planning.
• Taylorism in the year 1880 refers to the pioneer work of Frederick Taylor towards scientificapproach towards manufacturing.
2.2 Company PerformanceIt has been a long debated issue about how to measure firm’s performance, and over the yearstraditional economic theories put a major emphasis on market power and industry structure asdeterminants of firm performance [15, 16, 17&18]. For measuring a firm’s performance, financial andnon-financial measures have been used. The financial measures include such as Return on Assets(ROA), market share, Return on Investment (ROI), Operating Profit of Firm (EBIDTA), and growthrates in domestic and export sales growth. Similar measures are used by previous researchers e.g. Hittet al., [19]. Similarly, the non-financial measures of performance include management’s perceptions ofproductivity, profitability, market share, and customer satisfaction relative to competitors.
3. CONCEPTUAL FRAMEWORK, MEASUREMENT INSTRUMENT DEVELOPMENT, AND DATACOLLECTION 3.1 Specific Hypotheses A hypothesis is a tentative statement about the relationship between two or more variables and is aspecific testable prediction about what one expects to happen in the study. While the hypothesispredicts what the researchers expect to see, the goal of research is to determine whether this predictionis right or wrong. When conducting an experiment, researchers might explore a number of differentfactors to determine the contribution of each to the ultimate outcome. While formulating the researchhypotheses following questions are considered:
• Are these hypotheses based on the identified research study?• Can these hypotheses be tested?• Do the hypotheses include independent and dependent variables?
Based on the literature review conducted, research gaps and research objectives identified followinghypotheses are proposed for the present study in Table 3.
Rameshwar Dubey, Tripti Singh and Saurabh Tiwari 221
Volume 4 · Number 4 · 2012
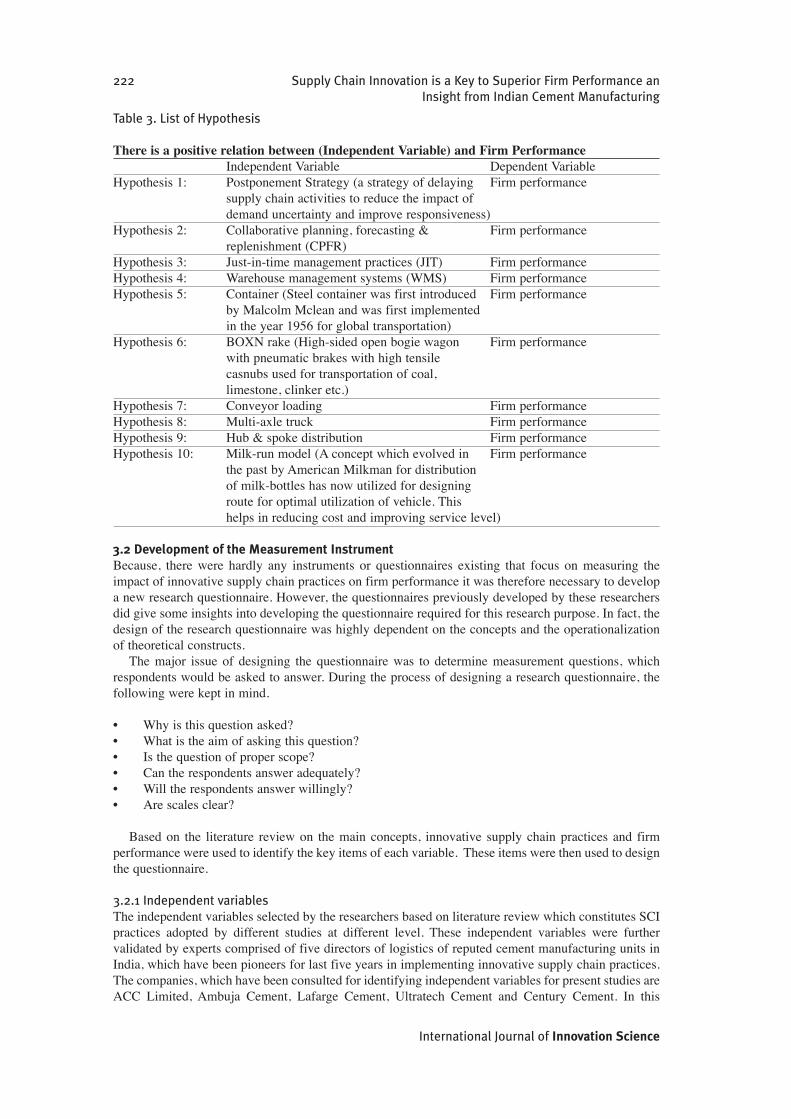
Table 3. List of Hypothesis
There is a positive relation between (Independent Variable) and Firm PerformanceIndependent Variable Dependent Variable
Hypothesis 1: Postponement Strategy (a strategy of delaying Firm performancesupply chain activities to reduce the impact of demand uncertainty and improve responsiveness)
Hypothesis 2: Collaborative planning, forecasting & Firm performance replenishment (CPFR)
Hypothesis 3: Just-in-time management practices (JIT) Firm performanceHypothesis 4: Warehouse management systems (WMS) Firm performanceHypothesis 5: Container (Steel container was first introduced Firm performance
by Malcolm Mclean and was first implemented in the year 1956 for global transportation)
Hypothesis 6: BOXN rake (High-sided open bogie wagon Firm performancewith pneumatic brakes with high tensile casnubs used for transportation of coal, limestone, clinker etc.)
Hypothesis 7: Conveyor loading Firm performanceHypothesis 8: Multi-axle truck Firm performanceHypothesis 9: Hub & spoke distribution Firm performanceHypothesis 10: Milk-run model (A concept which evolved in Firm performance
the past by American Milkman for distribution of milk-bottles has now utilized for designing route for optimal utilization of vehicle. This helps in reducing cost and improving service level)
3.2 Development of the Measurement InstrumentBecause, there were hardly any instruments or questionnaires existing that focus on measuring theimpact of innovative supply chain practices on firm performance it was therefore necessary to developa new research questionnaire. However, the questionnaires previously developed by these researchersdid give some insights into developing the questionnaire required for this research purpose. In fact, thedesign of the research questionnaire was highly dependent on the concepts and the operationalizationof theoretical constructs.
The major issue of designing the questionnaire was to determine measurement questions, whichrespondents would be asked to answer. During the process of designing a research questionnaire, thefollowing were kept in mind.
• Why is this question asked?• What is the aim of asking this question?• Is the question of proper scope?• Can the respondents answer adequately?• Will the respondents answer willingly?• Are scales clear?
Based on the literature review on the main concepts, innovative supply chain practices and firmperformance were used to identify the key items of each variable. These items were then used to designthe questionnaire.
3.2.1 Independent variablesThe independent variables selected by the researchers based on literature review which constitutes SCIpractices adopted by different studies at different level. These independent variables were furthervalidated by experts comprised of five directors of logistics of reputed cement manufacturing units inIndia, which have been pioneers for last five years in implementing innovative supply chain practices.The companies, which have been consulted for identifying independent variables for present studies areACC Limited, Ambuja Cement, Lafarge Cement, Ultratech Cement and Century Cement. In this
222 Supply Chain Innovation is a Key to Superior Firm Performance an Insight from Indian Cement Manufacturing
International Journal of Innovation Science

particular research, the author adopted an interview approach as there is dearth of empirical articlesfocusing on innovative supply chain practices and their impacts on firm performance. However thesepractices widely differ from firm to firm; hence, the researchers decided to focus on those practices thatwere adopted by Indian Cement Manufacturing firms.
3.3.2 Dependent variablesThe dependent variables adopted for present study as:
• ROI• Market Share• EBIDTA• Customer Satisfaction• Productivity
In order to refine the questionnaire developed by the researchers, the experts’ opinions were veryuseful. A total of twenty experts were invited to refine and validate measures for each concept. Thetwenty experts included four academic faculty members from the economics and managementdepartments of NIT (National Institute of Technology), IIT (Indian Institute of Technology), IIM(Indian Institute of Management), UPES, ACLM (Asian Council of Logistics Management), CII(Confederation of Indian Industry), CMA (Cement Manufacturers Association) that specialize in theInnovative Supply Chain Practices. The expert’s opinions helped to further refine the questionnaire.
3.2.3 Questionnaire instrumentThe respondents were asked to respond to the structured questionnaire on five point scale, provided tothem which consist of two sections. The first part was related to their Innovative Supply ChainPractices. In this section, a total of ten statements were used to measure Innovative Supply ChainPractices, and in second part there were five statements on firm performance divided into twocategories, i.e. financial and non-financial performance. The respondents were asked to indicate thedegree to which their firms employed the practices commonly seen in the four functional areas.
3.2.4 Data collectionThere are no collected data sources from previous research conducted on the same content and contextas those of this study. Primary data is therefore imperative for the current study. Primary data for thisstudy were gathered from manufacturing companies located in India.
3.2.5 Target population and sample designThis study focused on the cement manufacturing companies in India. The manufacturing companies inIndia were identified through a database of CMA (Cement Manufacturers Association). The databaseprovides the list of companies operating in India, their contact addresses, their type of business, andtheir type of ownership. From the database, 65 manufacturing companies were randomly chosen thatincluded both integrated cement manufacturing units, grinding units and mini cement plants to send thequestionnaires.
3.2.6 The surveyA mail survey was conducted between December 2010 to February 2011. Data collection proceeded bycalling the randomly targeted respondents in order to confirm their mail-address, inform them about thestudy and to encourage them to respond. A total of 250 questionnaires were then sent by mail to the 250manufacturing companies. Each mailing included a letter of introduction, a questionnaire and a returnaddress envelop with a stamp for the respondent to return their completed questionnaire. From thisprocess, 125 questionnaires were completed, for a gross response rate of 50%.
3.2.7 Data examination and explorationData entry started with the development of a coding plan for the items in the questionnaire. This planwas used to define variables in SPSS 16. The next step was the key-in of questionnaire responses in thedefined SPSS 16 data spreadsheet. The database was analysed and the software indicated that themissing values were distributed at random. According to Hair et al., this situation of missing data was
Rameshwar Dubey, Tripti Singh and Saurabh Tiwari 223
Volume 4 · Number 4 · 2012

acceptable for multivariate data analysis [20]. A factor analysis a statistical method were uses to helps tovalidate data and reduce large numbers into smaller size or produces strongly correlated variables, Hairet al [20]. The KMO value as represented in the Table 4 is 0.747 which shows that the data is highlyadequate for factor analysis. The communalities matrix is quite high; hence, the suitability of data is veryhigh. The Table 5 shows factor loadings of each variable using principal component analysis shows thatcomponent 1 has maximum number of variables followed by component 2 and component 3.
Table 4. KMO and Bartlett’s Test
Kaiser-Meyer-Olkin Measure of Sampling Adequacy 0.747Bartlett's Test of Sphericity Approx. Chi-Square 876.948
df 105Sig. 0.000
Table 5. Component Matrix using Principal Component Analysis
Principle Components 1 2 3 4 5
Postponement strategy .653 .212 .209 -.283 -.430Cpfr .716 .192 .159 -.417 .053Just-in-time management .464 -.077 -.009 -.327 .746Warehouse management systems .790 .029 -.161 -.321 .159Container .845 -.025 -.024 -.160 -.261Boxn rake .821 -.054 -.026 -.045 -.224Conveyor loading .849 -.157 -.067 .201 -.116Multi-axle truck .608 -.309 .107 .312 .325Hub & spoke distribution .536 -.245 .135 .529 .056Milk-run Model .622 -.297 .038 .448 -.009Roi .266 .622 -.453 .107 .126Market share .190 .656 -.325 .329 -.044Ebidta .188 .729 -.079 .212 .149Customer satisfaction .056 .417 .710 .144 .041Productivity -.033 .329 .763 .036 .101
3.2.8 Reliability analysis According to Hair et al. [20], reliability of a variable reflects the extent to which a variable or a set ofvariables are consistent in what it is intended to measure. If multiple measurements are taken, reliablemeasures will be very consistent in their values. Validity of the variable reflects the extent thatdifferences in scores among objectives reflect the objects’ true differences related to the construct thatis sought to be measured [20]. The reliability of a variable is a necessary but not a sufficient conditionfor its validity. Validity can never be established unequivocally, but can only be inferred either by directassessment or indirectly by assessing reliability. Imperfection in the measuring process that affect theassignment of scores or number in different ways each time a measure is taken, such as, a respondentwho misunderstands a question, are the cause of low reliability [20]. There are two dimensions thatunderline the concept of reliability. The first dimension is concerned with repeatability which requiresthe use of test-retest method to administer the same scale or measure to the same respondents at twoseparate times in order to test for stability [21].
The second dimension of reliability is concerned with the homogeneity of the measure. To measurethe internal consistency of a multiple-item measure, scores on subsets of the items within the scale arecorrelated [20]. Wiklund [15] also points out that the reliability of a measure is established by testingfor both stability and consistency. Consistency indicates how well the items measuring a concept hangtogether as a set, and Cronbach’s Alpha is a reliability coefficient indicating how well the items in a setare positively correlated to one another. Cronbach’s Alpha is computed in terms of the average inter-correlations among the items measuring the concept. The closer Cronbach’s Alpha is to 1, the higherthe internal consistency reliability. According to Hair et al. [20], no single item is a perfect measure ofa concept. Researchers must rely on a series of diagnostic measures to assess the internal consistency.
224 Supply Chain Innovation is a Key to Superior Firm Performance an Insight from Indian Cement Manufacturing
International Journal of Innovation Science
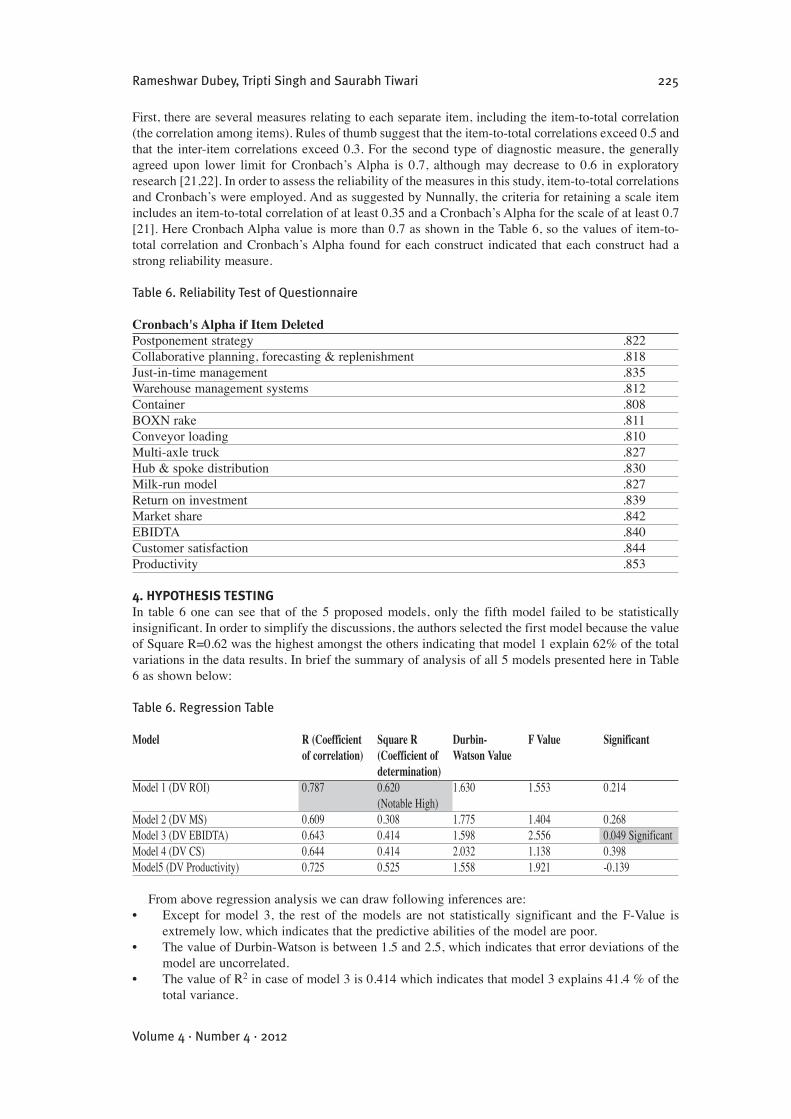
First, there are several measures relating to each separate item, including the item-to-total correlation(the correlation among items). Rules of thumb suggest that the item-to-total correlations exceed 0.5 andthat the inter-item correlations exceed 0.3. For the second type of diagnostic measure, the generallyagreed upon lower limit for Cronbach’s Alpha is 0.7, although may decrease to 0.6 in exploratoryresearch [21,22]. In order to assess the reliability of the measures in this study, item-to-total correlationsand Cronbach’s were employed. And as suggested by Nunnally, the criteria for retaining a scale itemincludes an item-to-total correlation of at least 0.35 and a Cronbach’s Alpha for the scale of at least 0.7[21]. Here Cronbach Alpha value is more than 0.7 as shown in the Table 6, so the values of item-to-total correlation and Cronbach’s Alpha found for each construct indicated that each construct had astrong reliability measure.
Table 6. Reliability Test of Questionnaire
Cronbach's Alpha if Item DeletedPostponement strategy .822Collaborative planning, forecasting & replenishment .818Just-in-time management .835Warehouse management systems .812Container .808BOXN rake .811Conveyor loading .810Multi-axle truck .827Hub & spoke distribution .830Milk-run model .827Return on investment .839Market share .842EBIDTA .840Customer satisfaction .844Productivity .853
4. HYPOTHESIS TESTINGIn table 6 one can see that of the 5 proposed models, only the fifth model failed to be statisticallyinsignificant. In order to simplify the discussions, the authors selected the first model because the valueof Square R=0.62 was the highest amongst the others indicating that model 1 explain 62% of the totalvariations in the data results. In brief the summary of analysis of all 5 models presented here in Table6 as shown below:
Table 6. Regression Table
Model R (Coefficient Square R Durbin- F Value Significantof correlation) (Coefficient of Watson Value
determination)Model 1 (DV ROI) 0.787 0.620 1.630 1.553 0.214
(Notable High)Model 2 (DV MS) 0.609 0.308 1.775 1.404 0.268Model 3 (DV EBIDTA) 0.643 0.414 1.598 2.556 0.049 SignificantModel 4 (DV CS) 0.644 0.414 2.032 1.138 0.398Model5 (DV Productivity) 0.725 0.525 1.558 1.921 -0.139
From above regression analysis we can draw following inferences are:• Except for model 3, the rest of the models are not statistically significant and the F-Value is
extremely low, which indicates that the predictive abilities of the model are poor.• The value of Durbin-Watson is between 1.5 and 2.5, which indicates that error deviations of the
model are uncorrelated. • The value of R2 in case of model 3 is 0.414 which indicates that model 3 explains 41.4 % of the
total variance.
Rameshwar Dubey, Tripti Singh and Saurabh Tiwari 225
Volume 4 · Number 4 · 2012
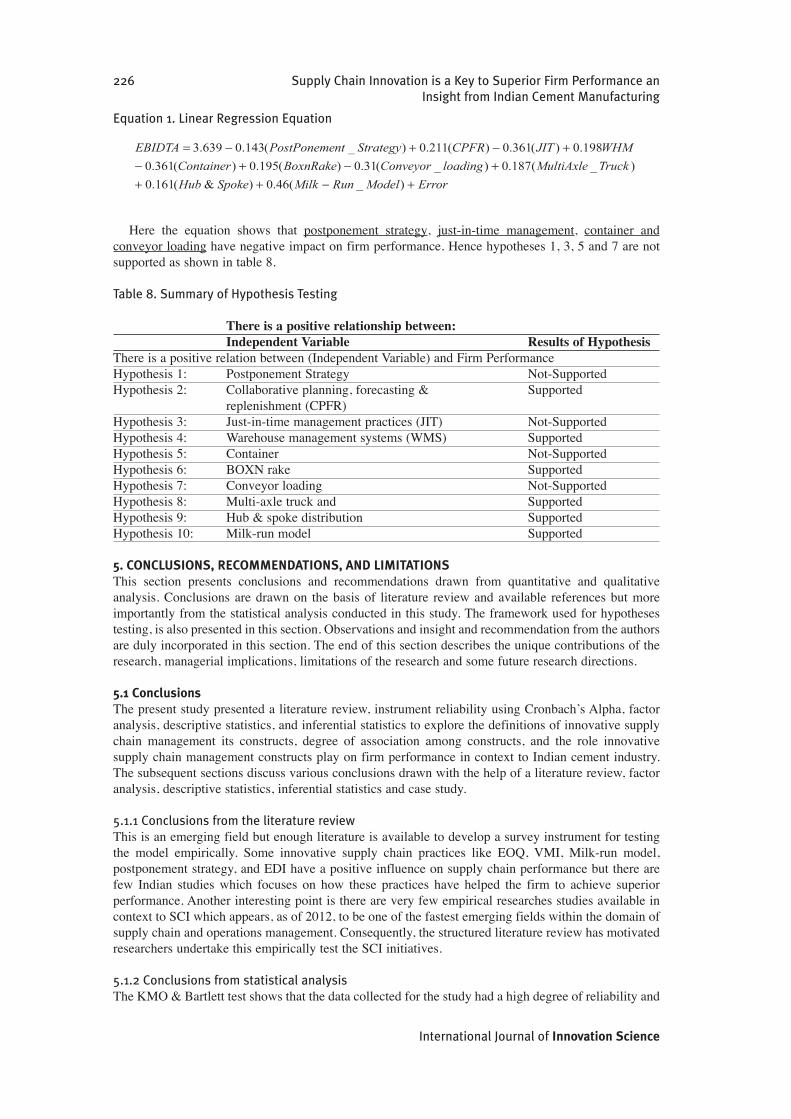
Equation 1. Linear Regression Equation
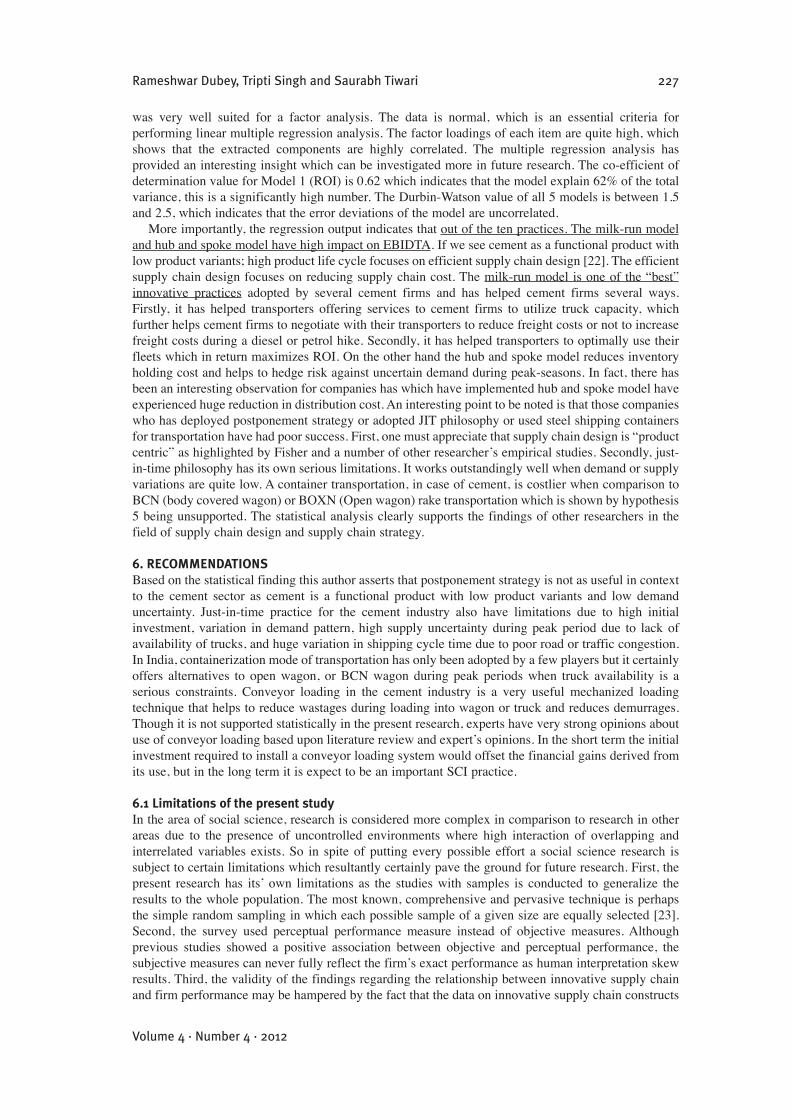
Here the equation shows that postponement strategy, just-in-time management, container andconveyor loading have negative impact on firm performance. Hence hypotheses 1, 3, 5 and 7 are notsupported as shown in table 8.
Table 8. Summary of Hypothesis Testing
There is a positive relationship between:Independent Variable Results of Hypothesis
There is a positive relation between (Independent Variable) and Firm PerformanceHypothesis 1: Postponement Strategy Not-SupportedHypothesis 2: Collaborative planning, forecasting & Supported
replenishment (CPFR)Hypothesis 3: Just-in-time management practices (JIT) Not-SupportedHypothesis 4: Warehouse management systems (WMS) SupportedHypothesis 5: Container Not-SupportedHypothesis 6: BOXN rake SupportedHypothesis 7: Conveyor loading Not-SupportedHypothesis 8: Multi-axle truck and SupportedHypothesis 9: Hub & spoke distribution SupportedHypothesis 10: Milk-run model Supported
5. CONCLUSIONS, RECOMMENDATIONS, AND LIMITATIONSThis section presents conclusions and recommendations drawn from quantitative and qualitativeanalysis. Conclusions are drawn on the basis of literature review and available references but moreimportantly from the statistical analysis conducted in this study. The framework used for hypothesestesting, is also presented in this section. Observations and insight and recommendation from the authorsare duly incorporated in this section. The end of this section describes the unique contributions of theresearch, managerial implications, limitations of the research and some future research directions.
5.1 ConclusionsThe present study presented a literature review, instrument reliability using Cronbach’s Alpha, factoranalysis, descriptive statistics, and inferential statistics to explore the definitions of innovative supplychain management its constructs, degree of association among constructs, and the role innovativesupply chain management constructs play on firm performance in context to Indian cement industry.The subsequent sections discuss various conclusions drawn with the help of a literature review, factoranalysis, descriptive statistics, inferential statistics and case study.
5.1.1 Conclusions from the literature reviewThis is an emerging field but enough literature is available to develop a survey instrument for testingthe model empirically. Some innovative supply chain practices like EOQ, VMI, Milk-run model,postponement strategy, and EDI have a positive influence on supply chain performance but there arefew Indian studies which focuses on how these practices have helped the firm to achieve superiorperformance. Another interesting point is there are very few empirical researches studies available incontext to SCI which appears, as of 2012, to be one of the fastest emerging fields within the domain ofsupply chain and operations management. Consequently, the structured literature review has motivatedresearchers undertake this empirically test the SCI initiatives.
5.1.2 Conclusions from statistical analysisThe KMO & Bartlett test shows that the data collected for the study had a high degree of reliability and
226 Supply Chain Innovation is a Key to Superior Firm Performance an Insight from Indian Cement Manufacturing
International Journal of Innovation Science
was very well suited for a factor analysis. The data is normal, which is an essential criteria forperforming linear multiple regression analysis. The factor loadings of each item are quite high, whichshows that the extracted components are highly correlated. The multiple regression analysis hasprovided an interesting insight which can be investigated more in future research. The co-efficient ofdetermination value for Model 1 (ROI) is 0.62 which indicates that the model explain 62% of the totalvariance, this is a significantly high number. The Durbin-Watson value of all 5 models is between 1.5and 2.5, which indicates that the error deviations of the model are uncorrelated.
More importantly, the regression output indicates that out of the ten practices. The milk-run modeland hub and spoke model have high impact on EBIDTA. If we see cement as a functional product withlow product variants; high product life cycle focuses on efficient supply chain design [22]. The efficientsupply chain design focuses on reducing supply chain cost. The milk-run model is one of the “best”innovative practices adopted by several cement firms and has helped cement firms several ways.Firstly, it has helped transporters offering services to cement firms to utilize truck capacity, whichfurther helps cement firms to negotiate with their transporters to reduce freight costs or not to increasefreight costs during a diesel or petrol hike. Secondly, it has helped transporters to optimally use theirfleets which in return maximizes ROI. On the other hand the hub and spoke model reduces inventoryholding cost and helps to hedge risk against uncertain demand during peak-seasons. In fact, there hasbeen an interesting observation for companies has which have implemented hub and spoke model haveexperienced huge reduction in distribution cost. An interesting point to be noted is that those companieswho has deployed postponement strategy or adopted JIT philosophy or used steel shipping containersfor transportation have had poor success. First, one must appreciate that supply chain design is “productcentric” as highlighted by Fisher and a number of other researcher’s empirical studies. Secondly, just-in-time philosophy has its own serious limitations. It works outstandingly well when demand or supplyvariations are quite low. A container transportation, in case of cement, is costlier when comparison toBCN (body covered wagon) or BOXN (Open wagon) rake transportation which is shown by hypothesis5 being unsupported. The statistical analysis clearly supports the findings of other researchers in thefield of supply chain design and supply chain strategy.
6. RECOMMENDATIONSBased on the statistical finding this author asserts that postponement strategy is not as useful in contextto the cement sector as cement is a functional product with low product variants and low demanduncertainty. Just-in-time practice for the cement industry also have limitations due to high initialinvestment, variation in demand pattern, high supply uncertainty during peak period due to lack ofavailability of trucks, and huge variation in shipping cycle time due to poor road or traffic congestion.In India, containerization mode of transportation has only been adopted by a few players but it certainlyoffers alternatives to open wagon, or BCN wagon during peak periods when truck availability is aserious constraints. Conveyor loading in the cement industry is a very useful mechanized loadingtechnique that helps to reduce wastages during loading into wagon or truck and reduces demurrages.Though it is not supported statistically in the present research, experts have very strong opinions aboutuse of conveyor loading based upon literature review and expert’s opinions. In the short term the initialinvestment required to install a conveyor loading system would offset the financial gains derived fromits use, but in the long term it is expect to be an important SCI practice.
6.1 Limitations of the present studyIn the area of social science, research is considered more complex in comparison to research in otherareas due to the presence of uncontrolled environments where high interaction of overlapping andinterrelated variables exists. So in spite of putting every possible effort a social science research issubject to certain limitations which resultantly certainly pave the ground for future research. First, thepresent research has its’ own limitations as the studies with samples is conducted to generalize theresults to the whole population. The most known, comprehensive and pervasive technique is perhapsthe simple random sampling in which each possible sample of a given size are equally selected [23].Second, the survey used perceptual performance measure instead of objective measures. Althoughprevious studies showed a positive association between objective and perceptual performance, thesubjective measures can never fully reflect the firm’s exact performance as human interpretation skewresults. Third, the validity of the findings regarding the relationship between innovative supply chainand firm performance may be hampered by the fact that the data on innovative supply chain constructs
Rameshwar Dubey, Tripti Singh and Saurabh Tiwari 227
Volume 4 · Number 4 · 2012
and firm performance were collected at the same point in time. Consequently, the direction of causalitybetween the two cannot be specified determined. Consequently, causality cannot be established withouta longitudinal study. Future research efforts seek to collect longitudinal data to confirm the causalrelationship between innovative supply chain constructs and firm performance. Finally, firmperformance may be affected by various other external variables not accounted for in this study. Itwould be beneficial to examine firm performance by taking external conditions like the economic andlegal situation into account.
ACKNOWLEDGEMENTSThe author specially expresses his thanks to two anonymous IJIS referees for their suggestions toimprove this manuscript. It would be incomplete without expressing my gratitude to Editor andEditorial team who undertook the effort in coordinating with me during entire review process, namelyBrian Glassman and Darrel Sandal. This research is an output of Centre of Supply Chain Research ofUniversity of Petroleum & Energy Studies, School of Management Studies, MNNIT, Asian Council ofLogistics Management and Symbiosis Institute of Operations Management, Nashik.
REFERENCES[1] Flint, J. (2007), “Supply Chain Innovation: Differentiating on processes is more sustainable than
differentiating on products. Industry Week, (July) <Last Accessed 10-2012 http://www.industryweek.com/articles/supply_chain_innovation_14615.aspx>
[2] Cement Manufacture Association of India <Last Accessed 10-2012 http://www.cmaindia.org/portal/static/DynamicFacts.aspx>
[3] Al-Muhaisen, M,. & Santarisi, N,. (2002) Auditing of the maintenance system of Fuhaisplant/Jordan Cement Factories Co. Journal of Quality in Maintenance Engineering. (8-1) 62–76.
[4] Eti, M., Ogaji, S., & Probert, S. (2004) Implementing Total Productive Maintenance in NigerianManufacturing Industries. Applied Energy. (79-4) 385-401.
[5] Stephens, K. & Sommers, J., (2004) Automatic equipment downtime monitoring in the cementindustry. Cement Industry Technical Conference. IEEE-IAS/PCA. 301 – 314.
[6] CMIE (Centre for Monitoring Indian Economy). Corporate Sector, Economic IntelligenceService, Various Issues. PROWESS Data Base. <Last Accessed 10-2012 http://www.cmie.com >
[7] Cement Manufacture Association of India <Last Accessed 10-2012 http://www.cmaindia.org/portal/index/index.aspx >
[8] Cement Manufacture Association of India <Last Accessed 10-2012 http://www.cmaindia.org/portal/static/DynamicFacts.aspx>
[9] Shah, J,. (2009), “Supply Chain Management: Text and Cases” Pearson Publishing. New Delhi.India
[10] Desbarats, G. (1999) The innovation supply chain. Supply Chain Management: An InternationalJournal, (4-1) 7-10.
[11] Womack, J., Jones, D., & Roos, D. (1990) “The machine that changed the world” MacmillanPublishing. New York.
[12] Sakai, Y. et al. (2007) Introduction to Toyota Production System to Promote InnovativeManufacturing. FUJITSU Sci.Tech.J. (43-1) 14-22 <last accessed http://www.fujitsu.com/downloads/MAG/vol43-1/paper02.pdf>
[13] Harris, Ford W. (1913) How Many Parts To Make At Once” Factory. The Magazine ofManagement, (10-2) 135-136, 152.
[14] Wilson, R. H. (1934) A Scientific Routine for Stock Control. Harvard Business Review, (13) 116-128.
[15] Chadwick, K. (1999) An Empirical Analysis of The relationship Among EO, OrganizationalCulture and Performance. <last accessed http://www.huizenga.nova.edu/Jame/articles/entrepreneurial-orientation.cfm>
[16] Chandler, G. and Hanks, S. (1994) Market Attractiveness, Resource-Based Capabilities, VentureStrategies and Venture Performance. Journal of Business Venturing. (4-9) 331-339.
228 Supply Chain Innovation is a Key to Superior Firm Performance an Insight from Indian Cement Manufacturing
International Journal of Innovation Science

[17] Knight, G.A. (1997) Firm Orientation and Strategy under Regional Market Integration.International Executive. (39-3) 351-74.
[18] Wiklund, J., (1999) The sustainability of the Entrepreneurial Orientation–PerformanceRelationship. Entrepreneurship Theory and Practice. (24-1) 37-48.
[19] Hitt, M.A. and Irelend, R.D. (1985) Corporate Distintive Competence, Strategy, Industry andPerformance. Strategic Management Journal. (6-3) 273-293.
[20] Hair, J.F.; Rolph, E.; Anderson, R.E.; Ronald, L.T.; and William, C.B (1999) “Multivariate DataAnalysis” Englewood Cliffs. N.J. Prentice-Hall International, Inc.
[21] Nunnally, J.C (1978) “Psychometric Theory” 2nd ed, New York: McGraw-Hill. New York.
[22] Fisher, M.L. (1997) What is the Right Supply Chain For Your Product? Harvard Business Review(75-3) 105-116.
[23] Newbold, P. (1999) “Statistics for Business and Economics” 4th ed, Prentice Hall-International,London.
Rameshwar Dubey, Tripti Singh and Saurabh Tiwari 229
Volume 4 · Number 4 · 2012