substance use - Department of Social Justice and Empowerment
88
MINISTRY OF SOCIAL JUSTICE AND EMPOWERMENT GOVERNMENT OF INDIA National Drug Dependence Treatment Centre (NDDTC), All India Institute of Medical Sciences (AIIMS), New Delhi SUBSTANCE USE SUBSTANCE USE SUBSTANCE USE MAGNITUDE OF IN INDIA 2019 2019
-
Upload
khangminh22 -
Category
Documents
-
view
2 -
download
0
Transcript of substance use - Department of Social Justice and Empowerment
MINISTRY OF SOCIAL JUSTICE AND EMPOWERMENT GOVERNMENT OF INDIA
National Drug Dependence Treatment Centre (NDDTC), All India Institute of Medical Sciences (AIIMS), New Delhi
SUBSTANCE USE SUBSTANCE USE SUBSTANCE USE MAGNITUDE OF
IN INDIA
20192019
Atul Ambekar, Rakesh Kumar Chadda, Sudhir Kumar Khandelwal, Ravindra Rao, Ashwani Kumar Mishra, Alok Agrawal. National Drug Dependence Treatment Centre (NDDTC), All India Institute of Medical Sciences (AIIMS), New Delhi
© Ministry of Social Justice and Empowerment, Government of India and NDDTC, AIIMS, New Delhi, February 2019
Suggested Citation
Ambekar A, Agrawal A, Rao R, Mishra AK, Khandelwal SK, Chadda RK on behalf of the group of investigators for the National Survey on Extent and Pattern of Substance Use in India (2019). Magnitude of Substance Use in India. New Delhi: Ministry of Social Justice and Empowerment, Government of India.
National Investigators
This report is an output from the project National Survey on Extent and Pattern of Substance Use in India which was commissioned and funded by Ministry of Social Justice and Empowerment, Government of India. The contents of this publication may be reproduced in whole or in part and in any form for educational or non-prot purposes without special permission from the copyright holders, provided acknowledgement of the source is made, as indicated below.
vk;; fqoh Kr Zjk kukH ly Lk a F[ kf kuv
MINISTRY OF SOCIAL JUSTICE AND EMPOWERMENT GOVERNMENT OF INDIA
National Drug Dependence Treatment Centre (NDDTC), All India Institute of Medical Sciences (AIIMS), New Delhi
vk;; fqoh Kr Zjk kukH ly Lk a F[ kf kuv
SUBSTANCE USE MAGNITUDE OF
IN INDIA20192019


lkekftd U;k; vkSj vf/kdkfjrk ea=hHkkjr ljdkj
Shashtri Bhawan, New Delhi – 110001
'kkL=h Hkou] ubZ fnYYkh&110001
Minister of Social Justice & EmpowermentGovernment of India
The Ministry of Social Justice and Empowerment, in collaboration with the National Drug Dependence Treatment Centre (NDDTC), AIIMS, New Delhi takes great pleasure in presenting the report on the Magnitude of Substance Use in India.This report presents the major ndings of the National Survey on Extent and Pattern of Substance Use in India, commissioned by the Ministry, in terms of proportion of Indian population affected by substance use. The survey involved interviews of more than 5 lakh individuals across all the 36 States and UTs of the country and use of multiple approaches to collect data.
Aside from its already high cost to the social fabric, public health and the economy, use of alcohol and illicit drugs has come to represent yet another danger for our country over the past few years. Of late, the menace of drug abuse in the younger generation has been rising all over the world and India is no exception to it. This impacts negatively on the academic, social, psychological, economical and physiological development of people using drugs and their families. Drug use among the youth is known to be inuenced by education, peer pressure, curiosity or urge to experiment, and availability of drugs and substance. The vulnerability of injecting drug users (IDUs) to get infected with HIV/AIDS due to sharing of needles and syringes and risky sexual behaviour makes the problem of drug use even more serious.
Having accurate knowledge on the extent and pattern of substance use in India is a signicant rst step in working together to address and ultimately resolve this serious social and health problem. It is our hope that this report will prove useful for all the stakeholders and allow them to develop a better understanding of the current situation of drug use in the country, the means of intervention and a yardstick against which progress may be measured. I congratulate the team which has worked tirelessly to bring this report.
MESSAGE
SHRI THAAWARCHAND GEHLOT
Jh Fkkojpan xgyksr
(THAAWARCHAND GEHLOT)

lkekftd U;k; vkSj vf/kdkfjrkjkT;ea=h
Hkkjr ljdkj
Shashtri Bhawan, New Delhi – 110001
'kkL=h Hkou] ubZ fnYYkh&110001
Minister of State forSocial Justice & Empowerment
Government of India
SHRI VIJAY SAMPLA
Jh fot; lkaiyk
Providing help and support to people affected by drug addiction is one of the key mandates of Ministry of Social Justice and Empowerment, Government of India. In order to develop effective strategies to deal with this problem, it is essential to have credible evidence regarding the dimension of the drug problem in the country and in various states.
I am pleased that this report, which describes the magnitude of substance use in India, is being released. It is hoped that this data will be utilized by all the stakeholders in their day-to-day work to provide help and relief to lakhs of Indians who are suffering because of drug addiction.
(VIJAY SAMPLA)
MESSAGE

lkekftd U;k; vkSj vf/kdkfjrk ea=ky;Hkkjr ljdkj
Shashtri Bhawan, New Delhi – 110001
'kkL=h Hkou] ubZ fnYYkh&110001
Ministry of Social Justice & EmpowermentGovernment of India
Inadequate research on the magnitude and dynamics of drug use at the national level or states has been a cause of concern. The deciency of data is due to the lack of resources on the one hand, and the sheer vastness of the country on the other. Cognizant of this fact and in line with its mandate, the Ministry of Social Justice and Empowerment, Government of India conducted a National Survey on Extent and Pattern of Substance Use in India through the National Drug Dependence Treatment Centre (NDDTC), All India Institute of Medical Sciences (AIIMS), New Delhi during 2018.
This survey has attempted to minimize the potential limitations of any single technique and uses different methodologies to project the data for the country and the states. The report presents data on users of various drugs and those affected by drug addiction, obtained through various components of this project, to understand the ‘big picture’ of the drug scenario in India.
The data and information presented in this report provide a framework to planners, policy makers, researchers and academicians to examine the current infrastructure and the means of intervention and suggest modications to deal with the problem of drug use. This data would also help in further ne-tuning of the National Action Plan for Drug Demand Reduction formulated by the Ministry of Social Justice and Empowerment for the period 2018-2025.
This report is denitely a catalytic attempt towards generating more meaningful data in the country on drug use and will help address more questions in future.
FOREWORD
MS. NILAM SAWHNEY
Secretary
lqJh uhye lkguhlfpo
(NILAM SAWHNEY)

While psychoactive substance use often tends to be framed as a problem or menace in the public-health or social-welfare discourse, the exact dimensions of substance use in lndia have not been assessed adequately, so far. A wide variety of entities - policy makers, researchers, service providers, law-enforcing agencies - need reliable and credible estimates of how many people in lndia use addictive substances and how many of them suffer from substance use disorders. Thus, we, the investigators behind the National Survey on Extent and Pattern of Substance Use, are extremely pleased to present this report on prevalence and extent of substance use in lndia.
This report presents the major findings cf the survey in terms of proportion of lndian population using various substances and those affected by substance use disorders. Representing a culmination of efforts of a large number of organizations and individuals, this is the first attempt in the history of lndia to provide detailed estimates of substance use in the country as well at the level of each state. We are now in a better position to reply as to which state of the country has the largest population of people affected by drug use? Or which substance is consumed by most lndian people who use drugs? After providing a snap-shot of the intricate and robust scientific research methodology, we would provide the results of the survey in terms of each of the major categories of psychoactive substances, at the national as well as at the level of states. We have also provided a broad framework of recommendations on how should the country move ahead in terms of mounting an effective response to the drug use epidemic. This comprehensive survey had multiple components. Considering the complex phenomenon of substance use and its consequences a number of issues need to be explored and studied in depth in order to inform formulation of appropriate policies; and programmes. Thus, a series of reports shall follow this document, with more specific recommendations, after the remainder of the studies conducted as part of this national survey.
We take this opportunity to express our gratitude to all individuals and organizations who made this work possible. We are grateful to the Ministry of Social Justice and Empowerment, Government of lndia for entrusting us with this humongous responsibility. The project would not have been possible without the guidance and support of the officers of the Ministry of Social Justice and Empowerment. The Hon'ble Minister of Social Justice and Empowerment, the Hon'ble Ministers of State for Social Justice and Empowerment and the Secretaries, Department of Social Justice and Empowerment have always been a guiding light in providing all possible support for facilitating and implementing the National Survey. Their able leadership kept the team motivated to overcome the operational and technical difficulties witnessed during the course of Survey.
The National lnstitute of Social Defence (NISD) also deserves special credit for effectively. managing the work of data collection through Regional Resource Training Centres and NGOs. The NGOs involved in the Survey need special attention who worked tirelessly despite facing
PREFACE
The Team of Investigators
New Delhi, February 2019
numerous operational challenges. More than 1500 personnel have been involved in this exercise in various capacities throughout the country, and we acknowledge the contribution of each one of them. Administration and staff of all the 11 collaborating medical institutes played a vital role in ensuring quality of the data collection process. State governments and their administration facilitated the data collection process and we are thankful to them. lndian Tourism Development Corporation (ITDC) facilitated the logistics for conducting more than 100 training programmes throughout the country. Finally, it would not have been possible to bring the report to this shape without the cooperation of the respondents - over five lakh men, women and children from all the nooks and corners of the country who agreed to provide us insights about some personal and private aspects of their lives. We are indebted to them.
We sincerely hope and expect that findings and recommendations from this report will be utilized by the political and social leaders, policy-makers, planners, researchers, academicians, development partners, service-providers and the civil society for formulating and implementing evidence-informed policies and strategies to address the challenges posed by drug use in the country. People affected by drug use are one of the most marginalised and under-served populations. It is hoped that this report provides strategic directions, to find ways to help save and improve their lives.
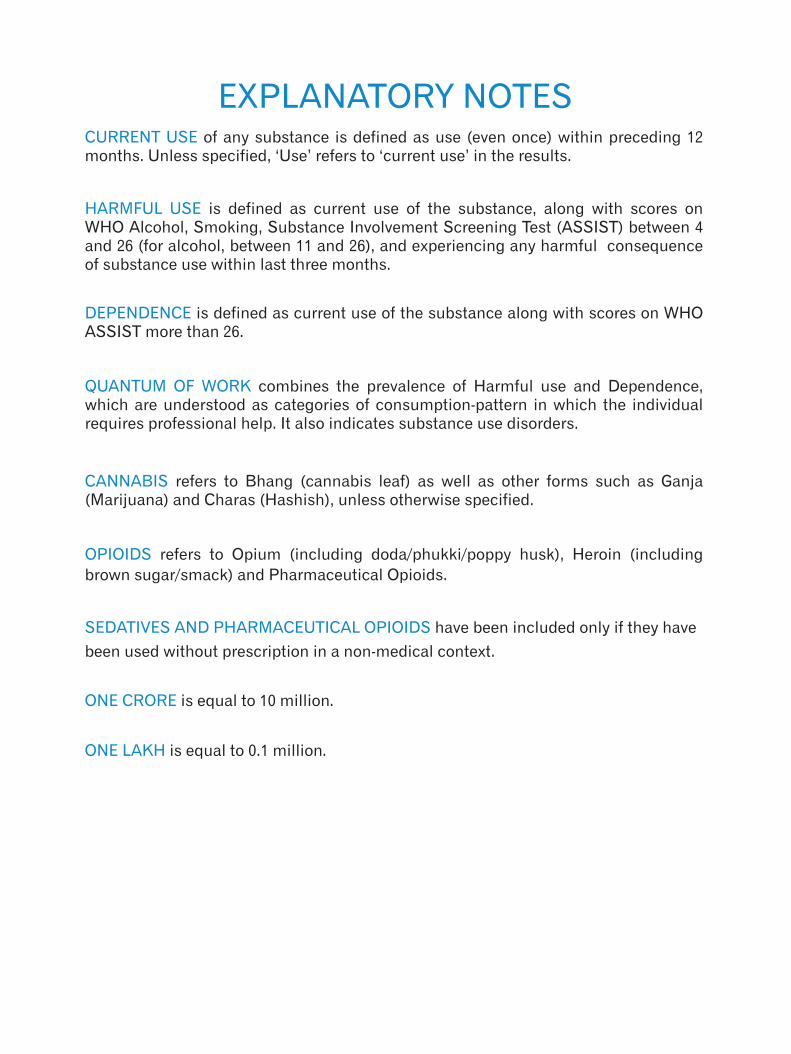
CURRENT USE of any substance is defined as use (even once) within preceding 12 months. Unless specified, ‘Use’ refers to ‘current use’ in the results.
DEPENDENCE is defined as current use of the substance along with scores on WHO ASSIST more than 26.
QUANTUM OF WORK combines the prevalence of Harmful use and Dependence, which are understood as categories of consumption-pattern in which the individual requires professional help. It also indicates substance use disorders.
OPIOIDS refers to Opium (including doda/phukki/poppy husk), Heroin (including
brown sugar/smack) and Pharmaceutical Opioids.
ONE CRORE is equal to 10 million.
is equal to 0.1 million.ONE LAKH
CANNABIS refers to Bhang (cannabis leaf) as well as other forms such as Ganja (Marijuana) and Charas (Hashish), unless otherwise specified.
HARMFUL USE is defined as current use of the substance, along with scores on WHO Alcohol, Smoking, Substance Involvement Screening Test (ASSIST) between 4 and 26 (for alcohol, between 11 and 26), and experiencing any harmful consequence of substance use within last three months.
SEDATIVES AND PHARMACEUTICAL OPIOIDS have been included only if they have
been used without prescription in a non-medical context.
EXPLANATORY NOTES
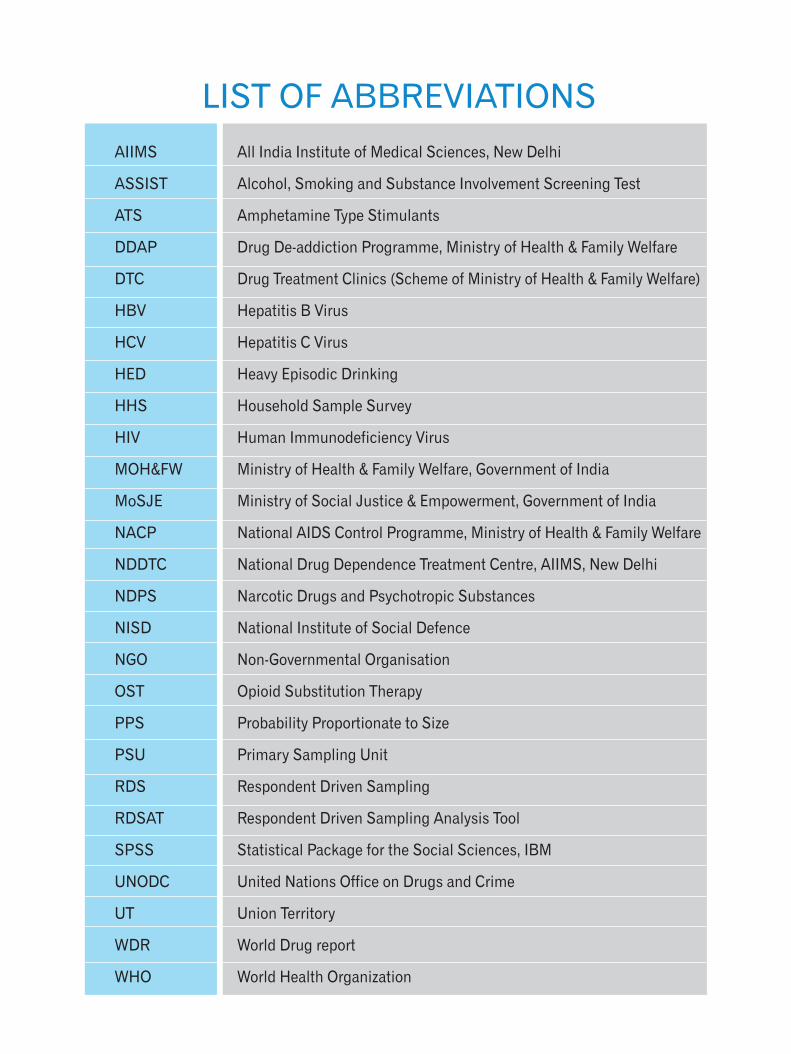
LIST OF ABBREVIATIONS
AIIMS
ASSIST
ATS
DDAP
DTC
HBV
HCV
HED
HHS
HIV
MOH&FW
MoSJE
NACP
NDDTC
NDPS
NISD
NGO
OST
PPS
PSU
RDS
RDSAT
SPSS
UNODC
UT
WDR
WHO
All India Institute of Medical Sciences, New Delhi
Alcohol, Smoking and Substance Involvement Screening Test
Amphetamine Type Stimulants
Drug De-addiction Programme, Ministry of Health & Family Welfare
Drug Treatment Clinics (Scheme of Ministry of Health & Family Welfare)
Hepatitis B Virus
Hepatitis C Virus
Heavy Episodic Drinking
Household Sample Survey
Human Immunodeficiency Virus
Ministry of Health & Family Welfare, Government of India
Ministry of Social Justice & Empowerment, Government of India
National AIDS Control Programme, Ministry of Health & Family Welfare
National Drug Dependence Treatment Centre, AIIMS, New Delhi
Narcotic Drugs and Psychotropic Substances
National Institute of Social Defence
Non-Governmental Organisation
Opioid Substitution Therapy
Probability Proportionate to Size
Primary Sampling Unit
Respondent Driven Sampling
Respondent Driven Sampling Analysis Tool
Statistical Package for the Social Sciences, IBM
United Nations Office on Drugs and Crime
Union Territory
World Drug report
World Health Organization
CONTENTS
EXECUTIVE SUMMARY
INTRODUCTION
METHODOLOGY
FINDINGS
THE WAY FORWARD
ANNEXURE
1
7
8
11
31
45

EXECUTIVE SUMMARY

[1] Description of these terms has been provided under
Explanatory notes
KEY FINDINGS
Use of Psychoactive Substances
Although the use of various psychoactive substances such as alcohol, cannabis and opioids has been observed in India for centuries, the current dimension of the extent and pattern of psychoactive substance use and the problems associated with their use are not well documented. In the absence of reliable and detailed information about the drug use problem in the country, it has been a challenge to formulate and implement effective policies and programmes to address drug use. In order to bridge this gap, the Ministry of Social Justice and Empowerment (MoSJE), Government of India, commissioned a National Survey on Extent and Pattern for Substance Use in India.
The National Drug Dependence Treatment Centre (NDDTC), All India Institute of Medical Sciences (AIIMS), New Delhi, was entrusted with the responsibility to lead the technical and scientific aspects of the National Survey which was conducted in all the 36 states and Uts of the country, in collaboration with ten other medical institutes and a network of 15 NGOs. This is the first occasion in the history of the country when effort has been made to study and document substance use from all the states and UTs of the country simultaneously. More than 1500 personnel were involved in data collection exercise which was conducted between December 2017 and October 2018.
The primary objective of the National Survey was to assess the extent and pattern of substance use in each state and UT. To achieve this objective, a combination of two data collection approaches was employed. A Household Sample Survey (HHS) was conducted among a representative sample of the 10-75 year old population of all the states and UTs of the country. During HHS, 200,111 households were visited in 186 districts of
the country and a total of 473,569 individuals were interviewed. In addition, a Respondent Driven Sampling (RDS) survey was conducted covering 135 districts and 72,642 people suffering from dependence on illicit drugs. A number of measures were taken to ensure optimum quality, high standards and adherence to ethical principles during data collection and analysis.
Data from HHS and RDS were analyzed and collated to generate estimates for eight categories of psychoactive substances: Alcohol, Cannabis, Opioids Cocaine, Amphetamine Type Stimulants (ATS), Sedatives, Inhalants and Hallucinogens. This report focuses on the magnitude of Current Use and estimation of harmful use and dependence for all the
1substance categories. The survey was conducted independently in each state / UT and country-level findings were generated by scientifically pooling data from all states and UTs. All the findings have been projected for estimated population of the country / state / UT in the year 2018.
The report establishes that a substantial number of people use psychoactive substances in India, and that substance use exists in all the population groups. However, adult men bear the brunt of substance use disorders. This survey also indicates that there are wide variations in the extent and prevalence of use across different states and between various substances.
EXECUTIVE SUMMARY
1National Drug Dependence Treatment Centre, AIIMS, New Delhi
Magnitude of Substance Use in India
National Survey on Extent and Pattern of Substance Use in India
Ministry of Social Justice and Empowerment Government of India 2
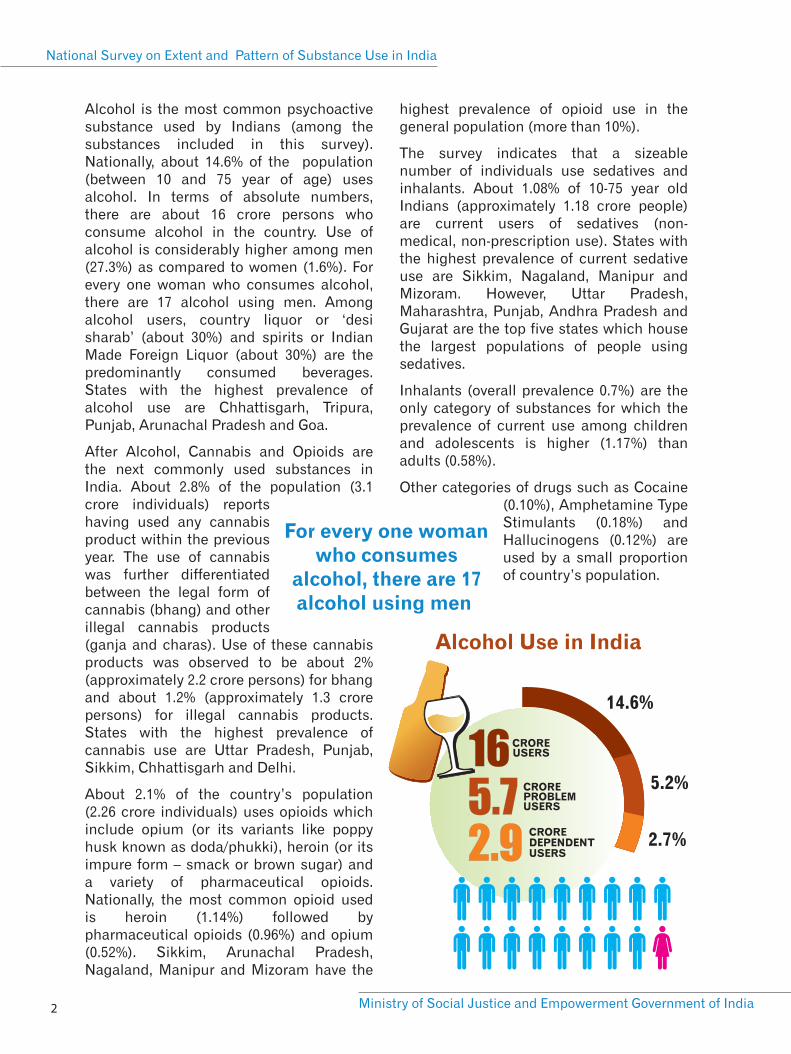
Alcohol is the most common psychoactive substance used by Indians (among the substances included in this survey). Nationally, about 14.6% of the population (between 10 and 75 year of age) uses alcohol. In terms of absolute numbers, there are about 16 crore persons who consume alcohol in the country. Use of alcohol is considerably higher among men (27.3%) as compared to women (1.6%). For every one woman who consumes alcohol, there are 17 alcohol using men. Among alcohol users, country liquor or ‘desi sharab’ (about 30%) and spirits or Indian Made Foreign Liquor (about 30%) are the predominantly consumed beverages. States with the highest prevalence of alcohol use are Chhattisgarh, Tripura, Punjab, Arunachal Pradesh and Goa.
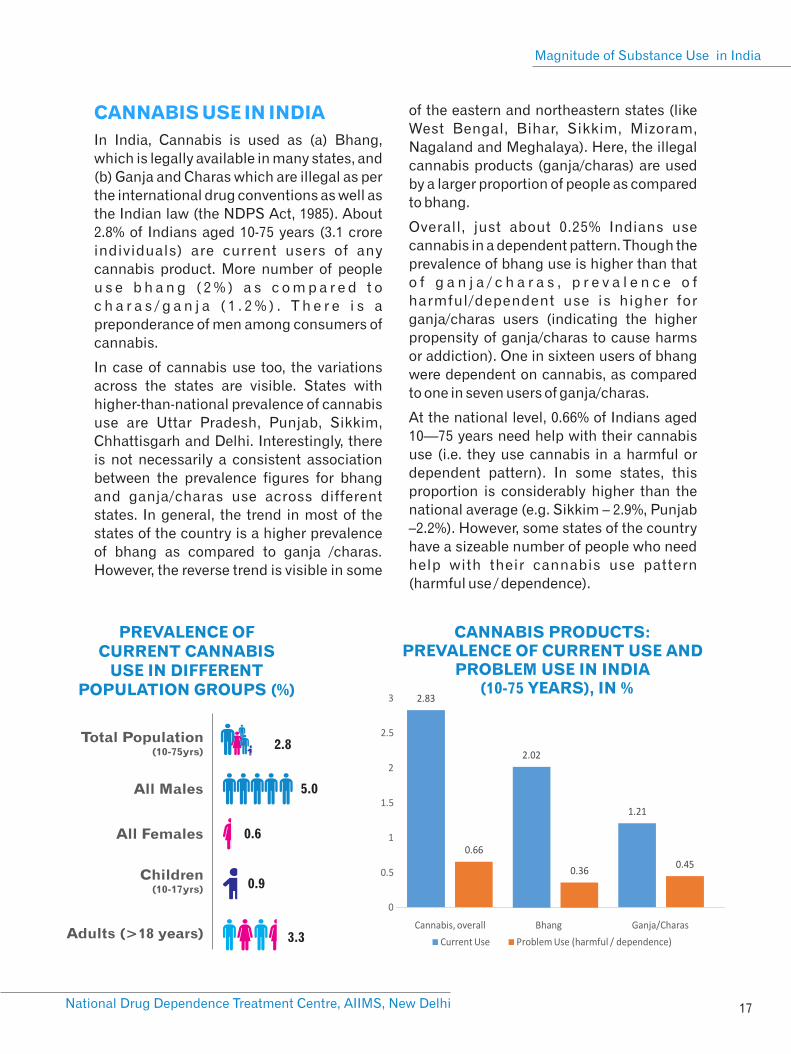
After Alcohol, Cannabis and Opioids are the next commonly used substances in India. About 2.8% of the population (3.1 crore individuals) reports having used any cannabis product within the previous year. The use of cannabis was further differentiated between the legal form of cannabis (bhang) and other illegal cannabis products (ganja and charas). Use of these cannabis products was observed to be about 2% (approximately 2.2 crore persons) for bhang and about 1.2% (approximately 1.3 crore persons) for illegal cannabis products. States with the highest prevalence of cannabis use are Uttar Pradesh, Punjab, Sikkim, Chhattisgarh and Delhi.
About 2.1% of the country’s population (2.26 crore individuals) uses opioids which include opium (or its variants like poppy husk known as doda/phukki), heroin (or its impure form – smack or brown sugar) and a variety of pharmaceutical opioids. Nationally, the most common opioid used is heroin (1.14%) followed by pharmaceutical opioids (0.96%) and opium (0.52%). Sikkim, Arunachal Pradesh, Nagaland, Manipur and Mizoram have the
highest prevalence of opioid use in the general population (more than 10%).
The survey indicates that a sizeable number of individuals use sedatives and inhalants. About 1.08% of 10-75 year old Indians (approximately 1.18 crore people) are current users of sedatives (non-medical, non-prescription use). States with the highest prevalence of current sedative use are Sikkim, Nagaland, Manipur and Mizoram. However, Uttar Pradesh, Maharashtra, Punjab, Andhra Pradesh and Gujarat are the top five states which house the largest populations of people using sedatives.
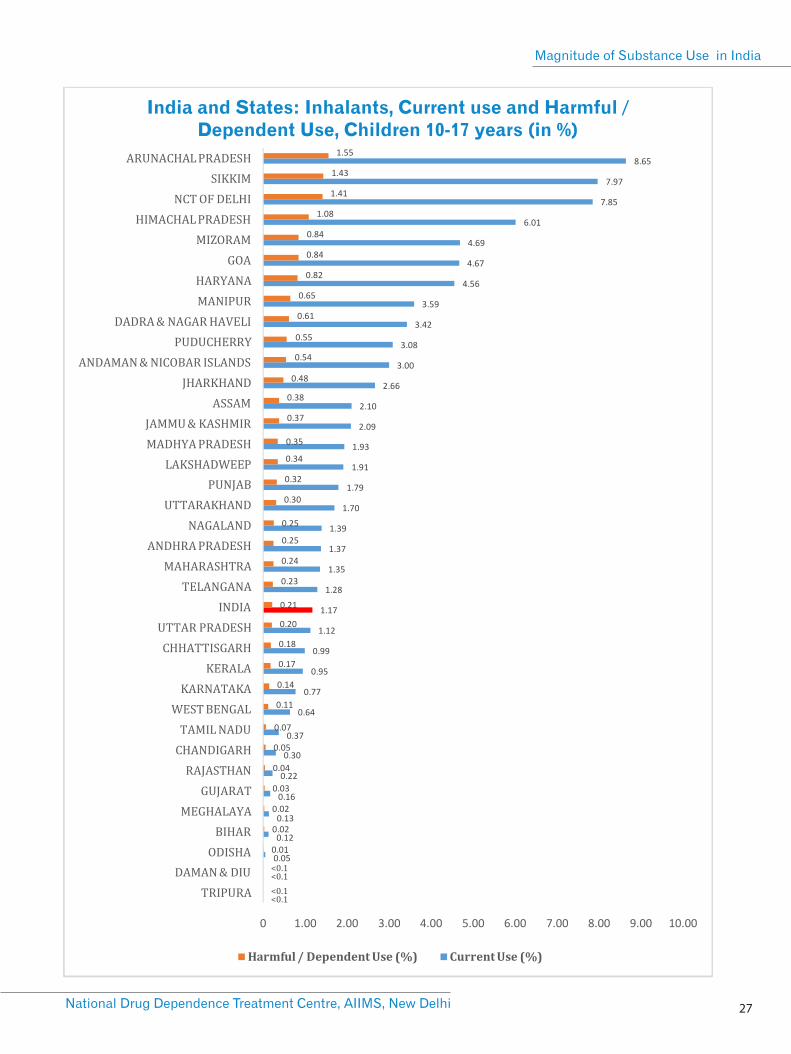
Inhalants (overall prevalence 0.7%) are the only category of substances for which the prevalence of current use among children and adolescents is higher (1.17%) than adults (0.58%).
Other categories of drugs such as Cocaine (0.10%), Amphetamine Type Stimulants (0.18%) and Hallucinogens (0.12%) are used by a small proportion of country’s population.
For every one woman who consumes
alcohol, there are 17 alcohol using men
16 CRORE USERS
5.7CRORE PROBLEM USERS
2.9CRORE DEPENDENT USERS
14.6%
5.2%
2.7%
Alcohol Use in India
3.1CRORE USERS
72LAKHPROBLEM USERS
25LAKHDEPENDENT USERS
2.8%
0.66%
0.25%
PR
OB
LE
M U
SE
RS
BHANG 40 LAKH
CHARAS / GANJA 50
LAKH
Cannabis Use in India
Opioid Use in India
2.3 CRORE USERS
77LAKHPROBLEM USERS
28LAKHDEPENDENT USERS
2.1%
0.70%
0.26%
PR
OB
LE
M U
SE
RSOPIUM 11
LAKH
HEROIN 63 LAKH
PHARMAOPIOIDS 25
LAKH
3National Drug Dependence Treatment Centre, AIIMS, New Delhi
Magnitude of Substance Use in India
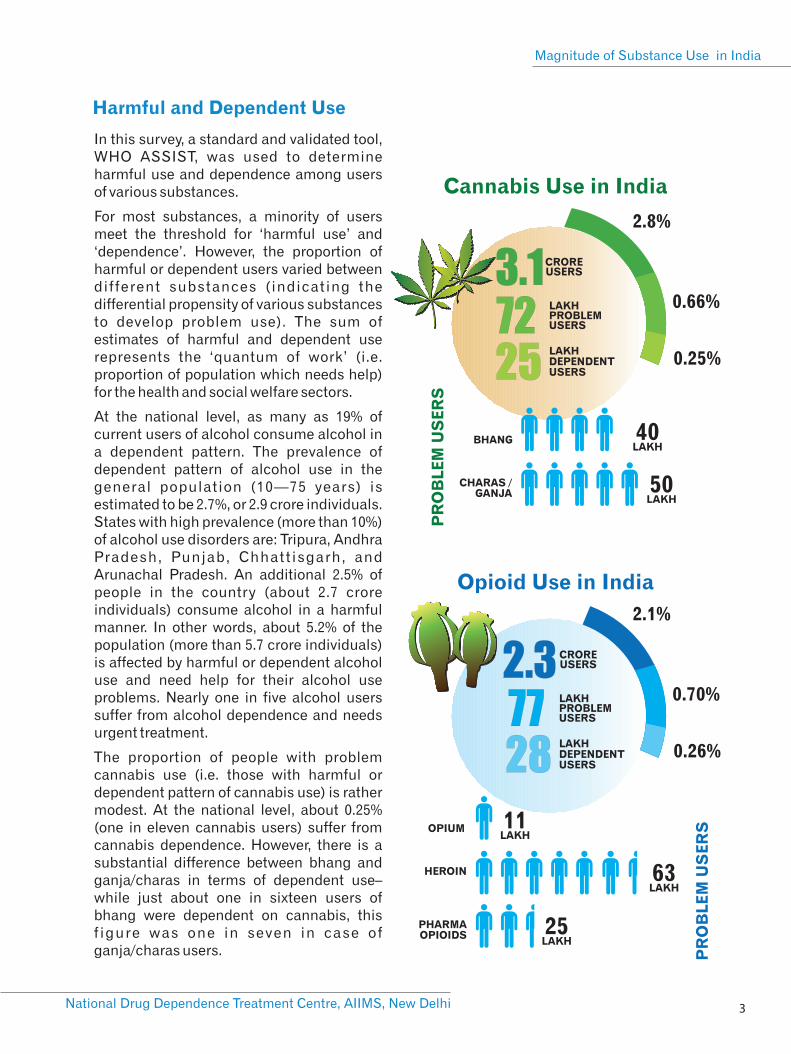
Harmful and Dependent Use
In this survey, a standard and validated tool, WHO ASSIST, was used to determine harmful use and dependence among users of various substances.
For most substances, a minority of users meet the threshold for ‘harmful use’ and ‘dependence’. However, the proportion of harmful or dependent users varied between different substances (indicating the differential propensity of various substances to develop problem use). The sum of estimates of harmful and dependent use represents the ‘quantum of work’ (i.e. proportion of population which needs help) for the health and social welfare sectors.
At the national level, as many as 19% of current users of alcohol consume alcohol in a dependent pattern. The prevalence of dependent pattern of alcohol use in the general population (10—75 years) is estimated to be 2.7%, or 2.9 crore individuals. States with high prevalence (more than 10%) of alcohol use disorders are: Tripura, Andhra Pradesh, Punjab, Chhattisgarh, and Arunachal Pradesh. An additional 2.5% of people in the country (about 2.7 crore individuals) consume alcohol in a harmful manner. In other words, about 5.2% of the population (more than 5.7 crore individuals) is affected by harmful or dependent alcohol use and need help for their alcohol use problems. Nearly one in five alcohol users suffer from alcohol dependence and needs urgent treatment.
The proportion of people with problem cannabis use (i.e. those with harmful or dependent pattern of cannabis use) is rather modest. At the national level, about 0.25% (one in eleven cannabis users) suffer from cannabis dependence. However, there is a substantial difference between bhang and ganja/charas in terms of dependent use– while just about one in sixteen users of bhang were dependent on cannabis, this f igure was one in seven in case of ganja/charas users.
Inhalant Use in India
77 LAKHUSERS
22LAKHPROBLEM USERS
8.5LAKHDEPENDENT USERS
0.7%
.21%
.08%
51 LAKH
26 LAKH U
SE
RS
National Survey on Extent and Pattern of Substance Use in India
Ministry of Social Justice and Empowerment Government of India 4
About 0.7% of Indians (approximately 77 lakh individuals) are estimated to need help for their opioid use problems. A far higher proportion of heroin users are dependent on opioids when compared with users of other opioids like opium and pharmaceutical o p i o i d s . O f t h e t o t a l e s t i m a t e d approximately 77 lakh people with opioid use disorders (harmful or dependent pattern) in the country, more than half are contributed by just a few states: Uttar Pradesh, Punjab, Haryana, Maharashtra, Madhya Pradesh, Delhi and Andhra Pradesh. However, in terms of percentage of population affected, the top states in the country are those in the north east (Mizoram, Nagaland, Arunachal Pradesh, Sikkim, Manipur) along with Punjab, Haryana and Delhi.
A sizeable number of people using other drugs like sedatives and inhalants also need help. In the general population, about 0.2% of Indians need help for their sedative use problems. At the national level, an estimated 4.6 lakh children and 18 lakh adults need help for their inhalant use (harmful use / dependence). In terms of absolute numbers, states with high population of children needing help for inhalant use are: Uttar Pradesh, Madhya Pradesh, Maharashtra, Delhi and Haryana.The number of people d e p e n d e n t o n c o c a i n e , AT S a n d Hallucinogens is extremely small in comparison to the size of country ’s population.
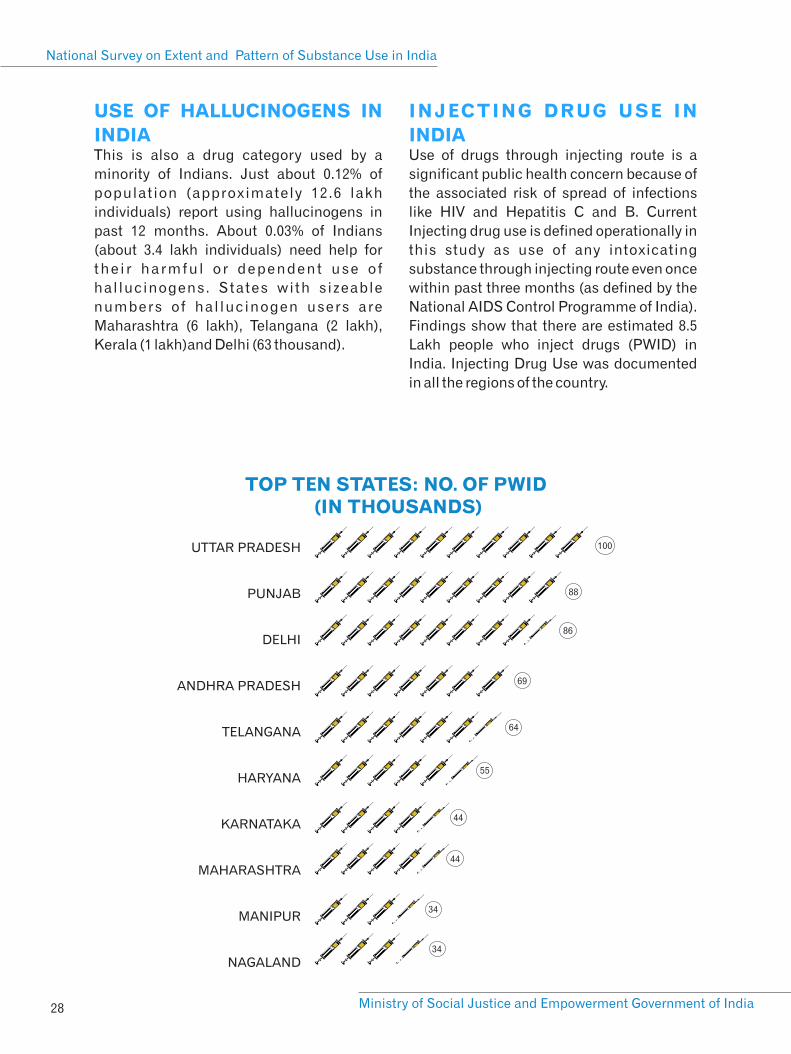
Nationally, it is estimated that there are about 8.5 Lakh People Who Inject Drugs (PWID). Opioid group of drugs are predominantly injected by PWID (heroin – 46% and pharmaceutical opioids – 46%). A substantial proportion of PWID report risky injecting practices. High numbers of PWID are estimated in Uttar Pradesh, Punjab, Delhi, Andhra Pradesh, Telangana, Haryana, Karnataka, Maharashtra, Manipur and Nagaland.
In general, a small minority of people affected by substance use disorders have access to treatment services. Only about one in thi r ty e ight people with a lcohol dependence report getting any treatment or help with alcohol problems. Among people suffering from dependence on illicit drugs, one among four persons has ever received any treatment. The rates of in-patient treatment / hospitalisation for alcohol and drug problems are even lower. Just about one in 180 individuals with alcohol dependence and one in 20 persons with illicit drug dependence report getting in-patient treatment.
In comparison to other similar surveys in the past, the prevalence of alcohol use appears to have been stable. However, a substantial proportion of Indians (more than 5%) suffer from alcohol use disorders. Comparing the figures for illicit drug use globally with India, while the prevalence of cannabis use is lower, prevalence of opioid use is India is three times that of global average. In the year 2004, opium was the major opioid used by men in India. This survey estimates that not only the overall opioid use is higher than in 2004, the use of heroin has surpassed opium as the most commonly used opioid.

THE WAY FORWARD
5National Drug Dependence Treatment Centre, AIIMS, New Delhi
Magnitude of Substance Use in India
Scientific evidence-based treatment needs to be made available for people with substance use disorders – at an adequate scale
This report makes it evident that a sizeable population in India is affected by substance use disorders and is in need of urgent help. However, reach of the national programmes for treatment of substance use disorders is grossly inadequate.
Considering the wide treatment gap (mismatch between demand and availability of treatment services) in the country, India needs massive investments in enhancing the avenues for treatment. Optimum allocation of resources for treatment of substance use disorders is imperative, based upon the evidence generated through this survey. Planning for a national level treatment programme must be guided by the absolute magnitude of the problem for prioritisation among the states. Addiction treatment programmes focused heavily upon inpatient treatment / hospitalization (in a ‘de-addiction centre’) are unlikely to cater to the huge demand for treatment. Enhancing treatment services as outpatient clinics, which have all the necessary components (trained human resources, infrastructure, medicines and supplies, a system of monitoring and mentoring) is urgently required. Scaling up of treatment services for substance use disorders would also require large-scale capacity building mechanisms. Overall, a coordinated, multi-stakeholder response will be necessary to scale-up treatment programmes in the country.
Evidence-based substance use prevention programmes are needed to protect the young people
Protecting the youth of the nation is of paramount importance. Ver y of ten, prevention of drug use is seen (erroneously)
as synonymous with spreading awareness about dangers of drug use among young people. Evidence for effectiveness of awareness generation as the predominant preventive strategy is very weak. Research has demonstrated that best prevention strategies are those which are based on scientific evidence and which involve working with famil ies, schools and communities in general. Prevention programmes must address the risk and protective factors aimed at not just preventing substance use, but also ensuring that young people grow and stay healthy into adulthood, enabling them to realize their potential and become productive members of their community and society.
A conducive legal and policy environmentis needed to help control drug problems
Findings indicate that despite the existence of strict drug control laws and a multitude of agencies working towards drug supply control, a wide variety of controlled drugs are being used and a sizeable number of Indians suffer from addiction to these drugs. Results also indicate a shif t in demand for psychoactive substances from traditional, low-potency, plant-based products (e.g. opium) to more potent and processed products (e.g. heroin). Thus, there may be elements of drug supply control which influence the pattern of demand. The nonmedical, recreational use of controlled pharmaceutical products remains a concern. However, ensuring their adequate availability for medicinal purposes is vital for public health. It is important that laws and policies are aimed at providing health and welfare services to people affected by substance use (rather than subjecting them to the criminal justice system). Overall, data from this survey indicate that there is a need of fresh thinking and innovative solutions as far as legal and policy measures aimed at drug supply control are concerned. More
National Survey on Extent and Pattern of Substance Use in India
Ministry of Social Justice and Empowerment Government of India 6
importantly, there needs to be an efficient coordination between the drug supply control sector as well as the entities involved in drug demand reduction and harm reduction.
The approach of generating and utilizingscientific evidence must continue
The survey represents a comprehensive scientific approach to explore and document the dynamics of substance use in the country and utilize the evidence for
informing policies and programmes. Such an approach needs to continue. Subsequent surveys and studies need to be conducted with incrementally enhanced refinement of methodologies. Every piece of the data would serve to incrementally inform evidence-based policies and programmes to protect and promote the health and welfare of Indian society.
INTRODUCTION
National Drug Dependence Treatment Centre, AIIMS, New Delhi
Magnitude of Substance Use in India
7
The use of mood-altering psychoactive 2substances has been part of human
civilization for millennia. In India, a variety of psychoactive substances like alcohol, cannabis and opioids have been used for hundreds of years. In modern times, however, the pattern and dimensions of use of such psychoactive substances has assumed pathological proportions.
Till date, the most robust evidence regarding substance use in India has been available only through the ‘National Survey on Extent,
3Pattern and Trends of Substance Use’ (2004) commissioned by the Ministry of Social Justice and Empowerment (MoSJE) and conducted in collaboration with the United Nations Office on Drugs and Crime ( U N O D C ) . T h e h o u s e h o l d s u r v e y component of the 2004 study reported that the prevalence of ‘current’ use of Alcohol was 21%, Cannabis 3% and Opiates 0.7% among men aged 12-60 years. Among the current users, about 26% of alcohol users were reported to be dependent, while 25% of cannabis users and 22% of opiate users were reported to be dependent. This was immensely useful data and has been the basis of many policies and programs to address drug use in India.
However, the 2004 survey suffered certain methodological limitations. Data was collected only from males and thus, there have been no estimates of the extent of substance use among female population. The sampling frame permitted findings at the national level only. Consequently, the state-wise variations with regard to the extent of substance use remained unknown. Only one methodology – household survey – was relied upon to estimate the prevalence of all substances (legal, socially-acceptable substances versus illicit, socially-hidden ones). Thus, the possibility of under-report ing and consequently, under-estimation of substance use could not be
ruled out.
In the absence of reliable and in-depth estimates of population affected by drug use problems, it has been a challenge to formulate and implement policies and p r o g r a m m e s t o a d d r e s s d r u g u s e . Consequently, it is imperative that evidence on the extent of use of such psychoactive substances (or ‘drugs’ in popular parlance) is generated and such evidence informs national policies and programmes. Given the federal nature of governance in India, and considering that addressing drug problems needs a multi stakeholder mechanism, it is important that such estimates are available at the national level as well as at the level of each state or Union Territory (UT) of the country.
Thus, the Ministry of Social Justice and Empowerment (MoSJE), Government of India, commissioned the ‘National Survey on Extent and Pattern of Substance Use in India’ in the year 2016. National Drug Dependence Treatment Centre (NDDTC), AIIMS, New Delhi was entrusted with the r e s p o n s i b i l i t y o f d e v e l o p i n g t h e methodology and leading the technical aspects of the survey in collaboration with ten other medical institutions. The task of data collection was managed by the National Institute of Social Defence (NISD), through 15 NGOs working with the MoSJE, Government of India. List of regional investigators (faculty from other medical institutions), research staff (engaged by medical institutes for survey monitoring and quali ty assurance) and super visor y personnel from NGOs has been provided at Annexure .
[2] For the sake of brevity and convenience the terms ‘substance’ and ‘drug’ have been used interchangeably in the document to denote the ‘psychoactive’ or ‘addictive’ substances.[3] Ray R. The extent, pattern and trends of drug abuse in India: National Survey. Ministry of Social Justice and Empowerment, Govt. of India & United Nations Office on Drugs and Crime, Regional Office for South Asia; 2004
National Survey on Extent and Pattern of Substance Use in India
Ministry of Social Justice and Empowerment Government of India 8
The primary objective of this survey was to
provide national and state-level estimates of
the proportion and the absolute number of
people who use various substances as well
as those suffering from substance use
disorders in India. Accordingly, the
prevalence in the population and the number
of people using the following substances
was estimated in the survey: Alcohol,
Cannabis, Opioids, Sedative-hypnotics,
Cocaine, Amphetamine Type Stimulants
(ATS), Hallucinogens and Inhalants (volatile 4solvents) .
COLLECTION OF DATA
Considering that substance use, particular
use of illicit drugs, is a hidden phenomenon,
a combination of two distinct approaches
was used to generate the estimates.
1. A Household Survey (HHS) was
conducted among a representative sample
of the general population (10-75 years old) in
each of the 36 states and UTs of the country.
This was aimed primarily at studying the use
of common, legal substances (like Alcohol
and Cannabis).
2. A Respondent Driven Sampling (RDS)
survey along with multiplier approach was
conducted in 34 states and UTs among
people suffering from dependence on illicit
drugs (opioids, cocaine, amphetamines,
s e d a t i v e / h y p n o t i c s , i n h a l a n t s a n d
hallucinogens). Since HHS tends to provide
an underestimation of prevalence of illicit
drug use (due to under reporting), the RDS
approach was employed for the purpose.
For the Household Survey (HHS), the survey
was planned to visit about 4000 households
in each of the state / UT of the country (i.e.
about 150,000 households nationally), with a
target sample size of about 12500 completed
interviews of individuals for each state. The
HHS sample was representative of the
general, household population (aged 10-75
years) of that state. The sample size was
statistically determined to reliably estimate
a phenomenon of 1% prevalence with 95%
confidence. The districts in each state and
the Primary Sampling Unit (PSU) within
each district was chosen with a Probability
Proportionate to Size (PPS) approach.
Within each PSU, the selected households
were chosen through simple random
technique. Thus, the sampling design was
such that it ensured that the sample was
representative of the entire household
population of the state (10-75 years). During
the HHS, a team of trained interviewers (one
male and one female) visited each of the
selected households and after obtaining
informed consent, interviewed each of the
eligible member (10-75 years), ensuring
adequate privacy and confidentiality.
Overall, 89% of the eligible members
residing in the selected households could be
successfully interviewed.
The Respondent Driven Sampling (RDS)
survey covered 135 districts across the 5country spread across 34 states and UTs.
Overall, a total of 72,642 people with drug
dependence were interviewed. Participants
in the RDS survey were referred by their own
peers thereby minimizing the selection bias.
Questionnaires for data collection were
developed in English language and
translated into the local languages as per the
requirement. Data from both (HHS & RDS)
METHODOLOGY
[4] Considering that recent, methodologically robust survey reports on Tobacco use in India exist, Tobacco use was not focused upon in this survey. [5] For operational reasons, RDS survey could not be conducted in A&N islands and Lakshadweep. HHS data has been used to estimate the prevalence of substance use in these Uts.
9National Drug Dependence Treatment Centre, AIIMS, New Delhi
Magnitude of Substance Use in India
surveys were collected and submitted using
online tools (hosted on the survey website
www.ndusindia.in) and were saved in a
secure centralised database, accessible only
to the national investigators. Data collection
in each state lasted for about 4-6 months.
Overall, in the country, data was collected
between December 2017 and October 2018.
Since data collection was being conducted
simultaneously in multiple states, it was a
challenge to ensure consistency and
standardisation. A number of measures
were taken for standardisation of data
col lection processes and to ensure
acceptable data quality.
CAPACITY BUILDING AND
QUALITY CONTROL
Ÿ Two National level consultations were
held with key stakeholders to clarify roles
and responsibilities of each agency and
solicit support of key government and
nongovernment stakeholders in October
2016 and May 2017. All the participating
agencies and the key ministries and
departments of central and state
g o v e r n m e n t p a r t i c i p a t e d i n t h e
consultations. Similar consultations
were held in each of the state and UT.
Ÿ A series of training programs were held
including a National Training of Trainers
workshop (September 2017), six Regional
Training of Trainer programmes (October-
November 2017) and more than 100 state
level training programs across all the
states and UTs. Overall, more than 1500
trained personnel were involved in data
collection and monitoring activities.
Ÿ During the data collection process, an
elaborate mechanism of monitoring was
put in place, by the local supervisory
personnel as well as monitoring by the
senior managers at the state levels and
e x p e r t s f r o m t h e n a t i o n a l l e v e l
institutions. Monitoring included onsite
visits and inspection as well as remote
monitoring and mentoring through
information technology tools.
Ÿ Ethical standards of the highest level
were maintained during data collection.
No identifying information was collected
from any of the respondents. Informed
consent was obtained from all the
respondents. The survey received
clearance from an ethical perspective
from AIIMS, New Delhi and all the other
participating medical institutions.
Ÿ Subsequent to the data collection, a
‘Revalidation Exercise’ was conducted,
during which a selected sample of
households were revisited to confirm the
d a t a c o l l e c t i o n . I n c a s e o f a n y
discrepancy, remedial measures were
taken.
DATA ANALYSIS AND
GENERATING ESTIMATES
All the data were thoroughly checked for
consistency and were cleaned before
analysis. Analyses were performed using
standard statistical software programs
[(SPSS and STATA for HHS) and (RDSAT for
RDS)].
Ÿ All the estimates and results are
described in terms of ‘weighted’
frequencies or means. In other words, the
results are applicable to the population of
respective states and the country as a
whole.
Ÿ The results have been presented in terms
o f p r e v a l e n c e o f ‘ c u r r e n t u s e ’ ,
‘dependence’ and ‘quantum of work’ for
each of the major substance category for
each state and for the country as a whole.
NOTE ON ESTIMATIONS
National Survey on Extent and Pattern of Substance Use in India
Ministry of Social Justice and Empowerment Government of India 10
Ÿ Estimates of current use, harmful use and dependence for Alcohol and Cannabis are
based upon data collected through HHS.
Ÿ In case of other illicit drugs (opioids, cocaine, amphetamine type stimulants,
sedativehypnotics, inhalants, hallucinogens), data collected through RDS (coupled with
multiplier) has been used to generate estimates of number and proportion of population
which is drug dependent. For this, ‘proportion of the respondents reporting that they were
admitted to a specific addiction treatment centre’, was used as a multiplier. In situations
when suitable multiplier data was not available, modelling exercise was conducted
which took into account the variations for estimates of illicit drug dependence obtained
through HHS vis-à-vis the RDS approach.
Ÿ Once the estimates of prevalence of dependence on illicit drugs were available, then in
next step, the prevalence of current use of illicit drugs was estimated. For this purpose,
data from HHS has been utilized (i.e. calculating the proportion of illicit drug users in
HHS who are dependent and then projecting it on to estimated prevalence of dependence
generated through RDS – multiplier, to estimate the prevalence of current use of illicit
drugs). This step was performed on the data derived from each of the state, considering
the state-wise variations.
The estimates of ‘quantum of work’
combine prevalence of ‘dependence’ as
well as ‘harmful use’.
Ÿ All the results are based upon estimated
population of the states in the year 2018
(population from Census 2011 was
projected for the year 2018 on the basis of
decadal growth rates of each state / UT).
For estimations at the national level,
findings from all the states were utilized
to generate the weighted means (i.e.
a c c o r d i n g t o t h e p r o p o r t i o n a t e
contribution of the state population to the
total national population). Thus, the
findings truly represent the national
estimates (amalgamation of all the state-
level estimates).
FINDINGS
11National Drug Dependence Treatment Centre, AIIMS, New Delhi
Magnitude of Substance Use in India
D E S C R I P T I O N O F T H E SAMPLE
In the household survey, a total of 200,111 households across 36 states and UTs were visited (spread across 5808 Primary Sampling Units and 186 districts) and a total of 473,569 individuals were interviewed. Notably, at the national level, the sample selected for HHS closely matched that of census 2011 (in terms of male:female and u r b a n : r u r a l r a t i o s , a n d a g e - g r o u p distribution).
In case of RDS, 72,642 individuals (aged 18-75 years) representing the population of people with drug dependence of the state were interviewed. The RDS sample reflects the profile of people with drug dependence (illicit drugs) in the country. Detailed profile of sample in HHS and RDS has been tabulated in the Annexure.
PREVALENCE AND EXTENT OF SUBSTANCE USE IN INDIA
This report presents data on estimates of Current Use (use within past 12 months), Harmful Use and Dependence, for the following categories of substances: Alcohol, Cannabis (Bhang and Ganja/Charas), O p i o i d s ( O p i u m , H e r o i n a n d Pharmaceut ical Opio ids) , Cocaine, Amphetamine Type Stimulants (ATS), Sedatives, Inhalants and Hallucinogens. A standard and validated tool, WHO Alcohol, Smoking and Substance Involvement Screening test (WHO ASSIST), was applied during the survey interviews to determine harmful use and dependence among those individuals who reported use of any psychoact ive substance within the preceding one year.
The survey indicates that a large number of p e o p l e i n I n d i a u s e p s y c h o a c t i v e substances, though there are wide
variations in prevalence across different states. Apart from tobacco (which was not the focus of the survey), Alcohol is the most common substance used in India. After alcohol, the two next commonly used substances in India are Cannabis and Opioids. A sizeable number of people use other categories of substances l ike Sedat ives and Inha lants . Coca ine , Amphetamine Type St imulants and Hallucinogens are used by a small proportion of the country’s population.
Results also show that not all people who use psychoactive substances use them in a pathological or problematic pattern. Indeed, in case of most substances, only a minority of users met the threshold for characterizing the pattern of their use as ‘harmful use’ or ‘dependence’. Among current users, the proportion who used the substance in a harmful or dependent pattern varied between different substances (indicating the differential propensity of substances to develop problem use). As individuals who use any substance in a harmful or dependent manner need help or treatment for the substance use related problems, the sum of estimates of harmful and dependent use indicates the ‘quantum of work’ for the health and social welfare sectors.
The extent of use, harmful use, dependent use and quantum of work for each of the substance categories have been described below. For each substance category, tables showing data for different states are presented in Annexure at the end of the report.
ALCOHOL USE IN INDIA
Alcohol is used in every part of the country including in those states which have enforced prohibition. Moreover, alcohol use does not appear to be an exclusively male phenomena. Though the prevalence of
National Survey on Extent and Pattern of Substance Use in India
Ministry of Social Justice and Empowerment Government of India 12
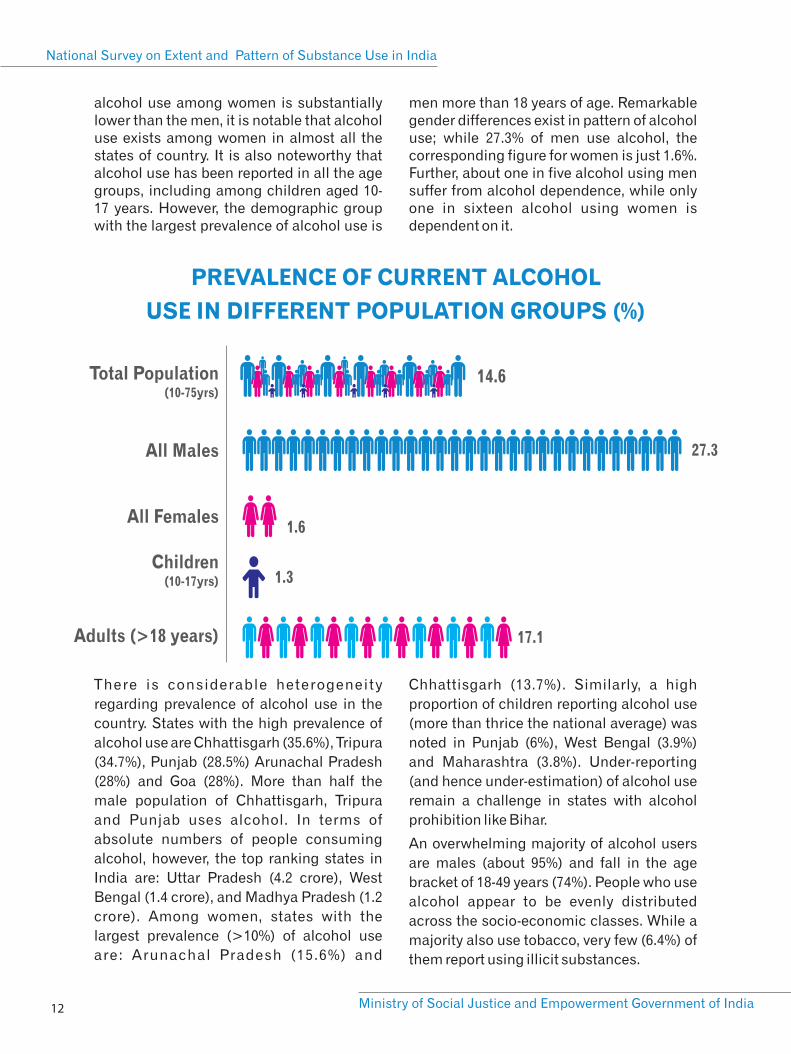
alcohol use among women is substantially lower than the men, it is notable that alcohol use exists among women in almost all the states of country. It is also noteworthy that alcohol use has been reported in all the age groups, including among children aged 10-17 years. However, the demographic group with the largest prevalence of alcohol use is
men more than 18 years of age. Remarkable gender differences exist in pattern of alcohol use; while 27.3% of men use alcohol, the corresponding figure for women is just 1.6%. Further, about one in five alcohol using men suffer from alcohol dependence, while only one in sixteen alcohol using women is dependent on it.
PREVALENCE OF CURRENT ALCOHOL
USE IN DIFFERENT POPULATION GROUPS (%)
Total Population (10-75yrs)
All Males
All Females
Children(10-17yrs)
Adults (>18 years)
14.6
27.3
1.6
1.3
17.1
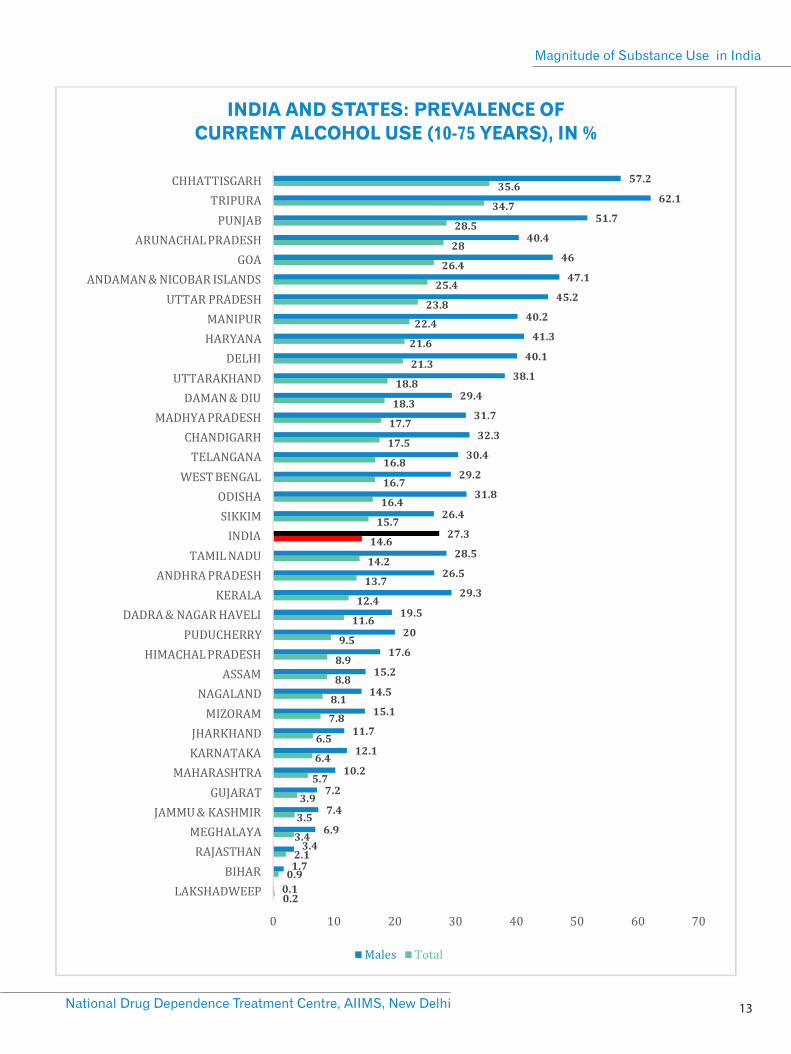
There is considerable heterogeneity
regarding prevalence of alcohol use in the
country. States with the high prevalence of
alcohol use are Chhattisgarh (35.6%), Tripura
(34.7%), Punjab (28.5%) Arunachal Pradesh
(28%) and Goa (28%). More than half the
male population of Chhattisgarh, Tripura
and Punjab uses alcohol. In terms of
absolute numbers of people consuming
alcohol, however, the top ranking states in
India are: Uttar Pradesh (4.2 crore), West
Bengal (1.4 crore), and Madhya Pradesh (1.2
crore). Among women, states with the
largest prevalence (>10%) of alcohol use
are: Arunachal Pradesh (15.6%) and
Chhattisgarh (13.7%). Similarly, a high
proportion of children reporting alcohol use
(more than thrice the national average) was
noted in Punjab (6%), West Bengal (3.9%)
and Maharashtra (3.8%). Under-reporting
(and hence under-estimation) of alcohol use
remain a challenge in states with alcohol
prohibition like Bihar.
An overwhelming majority of alcohol users
are males (about 95%) and fall in the age
bracket of 18-49 years (74%). People who use
alcohol appear to be evenly distributed
across the socio-economic classes. While a
majority also use tobacco, very few (6.4%) of
them report using illicit substances.
INDIA AND STATES: PREVALENCE OF
CURRENT ALCOHOL USE (10-75 YEARS), IN %
13National Drug Dependence Treatment Centre, AIIMS, New Delhi
Magnitude of Substance Use in India
National Survey on Extent and Pattern of Substance Use in India
Ministry of Social Justice and Empowerment Government of India 14
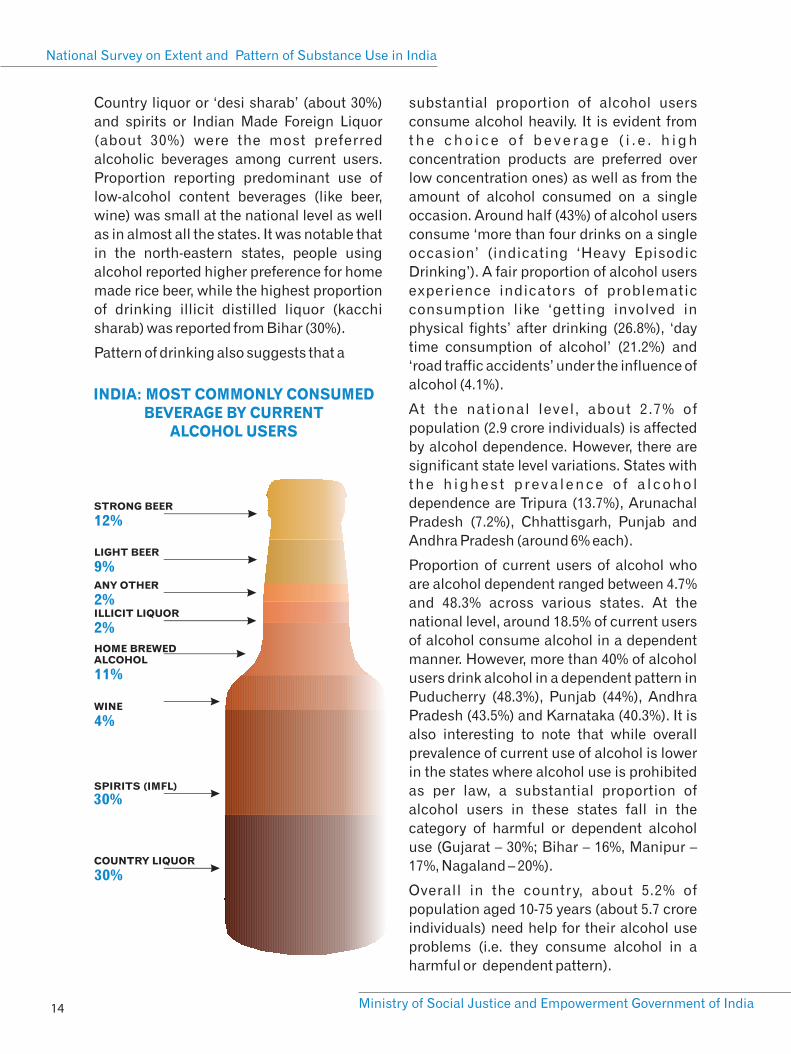
Country liquor or ‘desi sharab’ (about 30%)
and spirits or Indian Made Foreign Liquor
(about 30%) were the most preferred
alcoholic beverages among current users.
Proportion reporting predominant use of
low-alcohol content beverages (like beer,
wine) was small at the national level as well
as in almost all the states. It was notable that
in the north-eastern states, people using
alcohol reported higher preference for home
made rice beer, while the highest proportion
of drinking illicit distilled liquor (kacchi
sharab) was reported from Bihar (30%).
Pattern of drinking also suggests that a
substantial proportion of alcohol users
consume alcohol heavily. It is evident from
t h e c h o i c e o f b e v e r a g e ( i . e . h i g h
concentration products are preferred over
low concentration ones) as well as from the
amount of alcohol consumed on a single
occasion. Around half (43%) of alcohol users
consume ‘more than four drinks on a single
occasion’ (indicating ‘Heavy Episodic
Drinking’). A fair proportion of alcohol users
experience indicators of problematic
consumption like ‘getting involved in
physical fights’ after drinking (26.8%), ‘day
time consumption of alcohol’ (21.2%) and
‘road traffic accidents’ under the influence of
alcohol (4.1%).
At the national level, about 2.7% of
population (2.9 crore individuals) is affected
by alcohol dependence. However, there are
significant state level variations. States with
t h e h i g h e s t p r e v a l e n c e o f a l c o h o l
dependence are Tripura (13.7%), Arunachal
Pradesh (7.2%), Chhattisgarh, Punjab and
Andhra Pradesh (around 6% each).
Proportion of current users of alcohol who
are alcohol dependent ranged between 4.7%
and 48.3% across various states. At the
national level, around 18.5% of current users
of alcohol consume alcohol in a dependent
manner. However, more than 40% of alcohol
users drink alcohol in a dependent pattern in
Puducherry (48.3%), Punjab (44%), Andhra
Pradesh (43.5%) and Karnataka (40.3%). It is
also interesting to note that while overall
prevalence of current use of alcohol is lower
in the states where alcohol use is prohibited
as per law, a substantial proportion of
alcohol users in these states fall in the
category of harmful or dependent alcohol
use (Gujarat – 30%; Bihar – 16%, Manipur –
17%, Nagaland – 20%).
Overall in the country, about 5.2% of
population aged 10-75 years (about 5.7 crore
individuals) need help for their alcohol use
problems (i.e. they consume alcohol in a
harmful or dependent pattern).
COUNTRY LIQUOR
30%
WINE
4%
HOME BREWED ALCOHOL
11%
ILLICIT LIQUOR
2%
ANY OTHER
2%
LIGHT BEER
9%
STRONG BEER
12%
SPIRITS (IMFL)
30%
INDIA: MOST COMMONLY CONSUMED BEVERAGE BY CURRENT
ALCOHOL USERS
15National Drug Dependence Treatment Centre, AIIMS, New Delhi
Magnitude of Substance Use in India
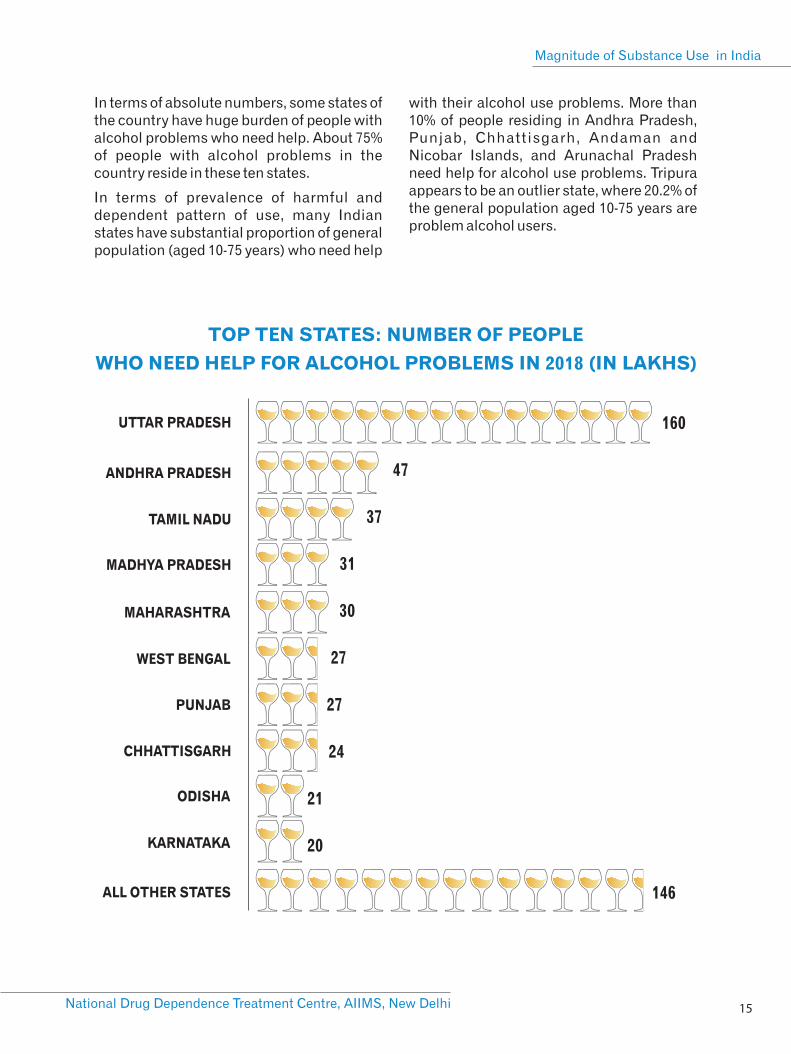
In terms of absolute numbers, some states of the country have huge burden of people with alcohol problems who need help. About 75% of people with alcohol problems in the country reside in these ten states.
In terms of prevalence of harmful and dependent pattern of use, many Indian states have substantial proportion of general population (aged 10-75 years) who need help
with their alcohol use problems. More than 10% of people residing in Andhra Pradesh, Punjab, Chhattisgarh, Andaman and Nicobar Islands, and Arunachal Pradesh need help for alcohol use problems. Tripura appears to be an outlier state, where 20.2% of the general population aged 10-75 years are problem alcohol users.
TOP TEN STATES: NUMBER OF PEOPLE
WHO NEED HELP FOR ALCOHOL PROBLEMS IN 2018 (IN LAKHS)
UTTAR PRADESH
ANDHRA PRADESH
TAMIL NADU
MADHYA PRADESH
MAHARASHTRA
WEST BENGAL
PUNJAB
CHHATTISGARH
ODISHA
KARNATAKA
160
47
37
31
30
27
27
24
21
20
ALL OTHER STATES 146
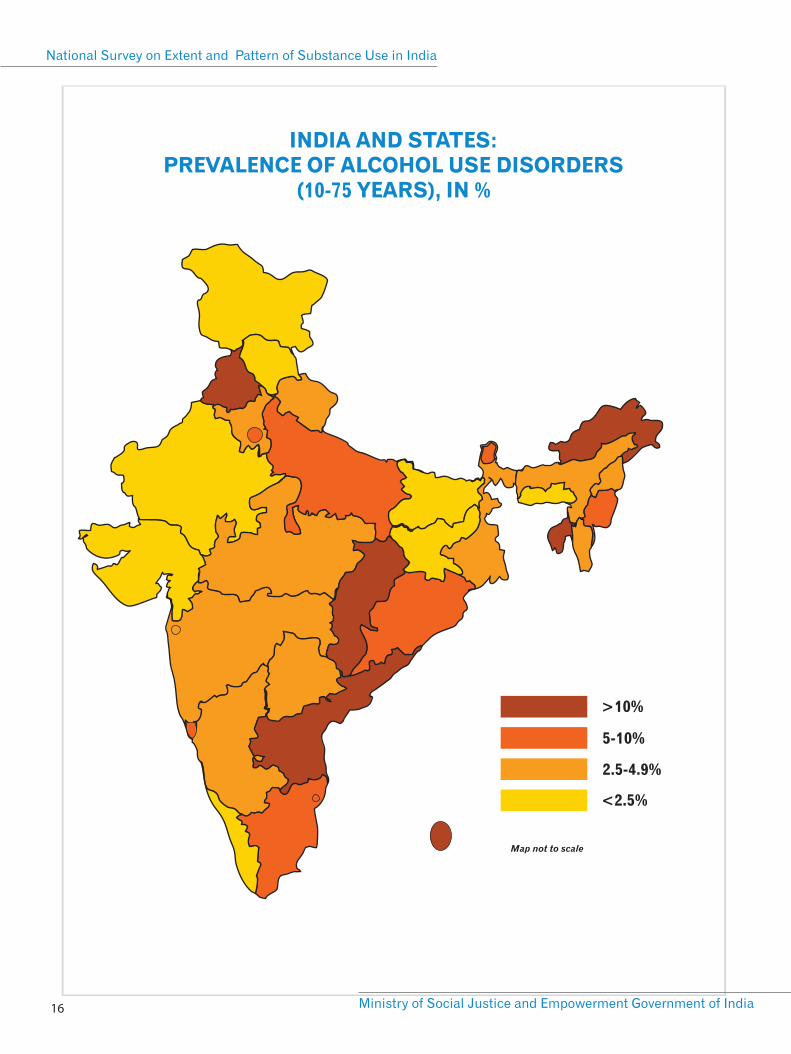
INDIA AND STATES: PREVALENCE OF ALCOHOL USE DISORDERS
(10-75 YEARS), IN %
National Survey on Extent and Pattern of Substance Use in India
Ministry of Social Justice and Empowerment Government of India 16
>10%
5-10%
2.5-4.9%
<2.5%
Map not to scale
17National Drug Dependence Treatment Centre, AIIMS, New Delhi
Magnitude of Substance Use in India
CANNABIS USE IN INDIA
In India, Cannabis is used as (a) Bhang,
which is legally available in many states, and
(b) Ganja and Charas which are illegal as per
the international drug conventions as well as
the Indian law (the NDPS Act, 1985). About
2.8% of Indians aged 10-75 years (3.1 crore
individuals) are current users of any
cannabis product. More number of people
u s e b h a n g ( 2 % ) a s c o m p a r e d t o
c h a r a s / g a n j a ( 1 . 2 % ) . T h e r e i s a
preponderance of men among consumers of
cannabis.
In case of cannabis use too, the variations
across the states are visible. States with
higher-than-national prevalence of cannabis
use are Uttar Pradesh, Punjab, Sikkim,
Chhattisgarh and Delhi. Interestingly, there
is not necessarily a consistent association
between the prevalence figures for bhang
and ganja/charas use across different
states. In general, the trend in most of the
states of the country is a higher prevalence
of bhang as compared to ganja /charas.
However, the reverse trend is visible in some
of the eastern and northeastern states (like
West Bengal, Bihar, Sikkim, Mizoram,
Nagaland and Meghalaya). Here, the illegal
cannabis products (ganja/charas) are used
by a larger proportion of people as compared
to bhang.
Overall, just about 0.25% Indians use
cannabis in a dependent pattern. Though the
prevalence of bhang use is higher than that
o f g a n j a / c h a r a s , p r e v a l e n c e o f
harmful/dependent use is higher for
ganja/charas users (indicating the higher
propensity of ganja/charas to cause harms
or addiction). One in sixteen users of bhang
were dependent on cannabis, as compared
to one in seven users of ganja/charas.
At the national level, 0.66% of Indians aged
10—75 years need help with their cannabis
use (i.e. they use cannabis in a harmful or
dependent pattern). In some states, this
proportion is considerably higher than the
national average (e.g. Sikkim – 2.9%, Punjab
–2.2%). However, some states of the country
have a sizeable number of people who need
help with their cannabis use pattern
(harmful use / dependence).
PREVALENCE OF CURRENT CANNABIS
USE IN DIFFERENT POPULATION GROUPS (%)
Total Population (10-75yrs)
All Females
Adults (>18 years)
2.8
All Males 5.0
0.6
Children(10-17yrs) 0.9
3.3
CANNABIS PRODUCTS: PREVALENCE OF CURRENT USE AND
PROBLEM USE IN INDIA (10-75 YEARS), IN %
<0.1
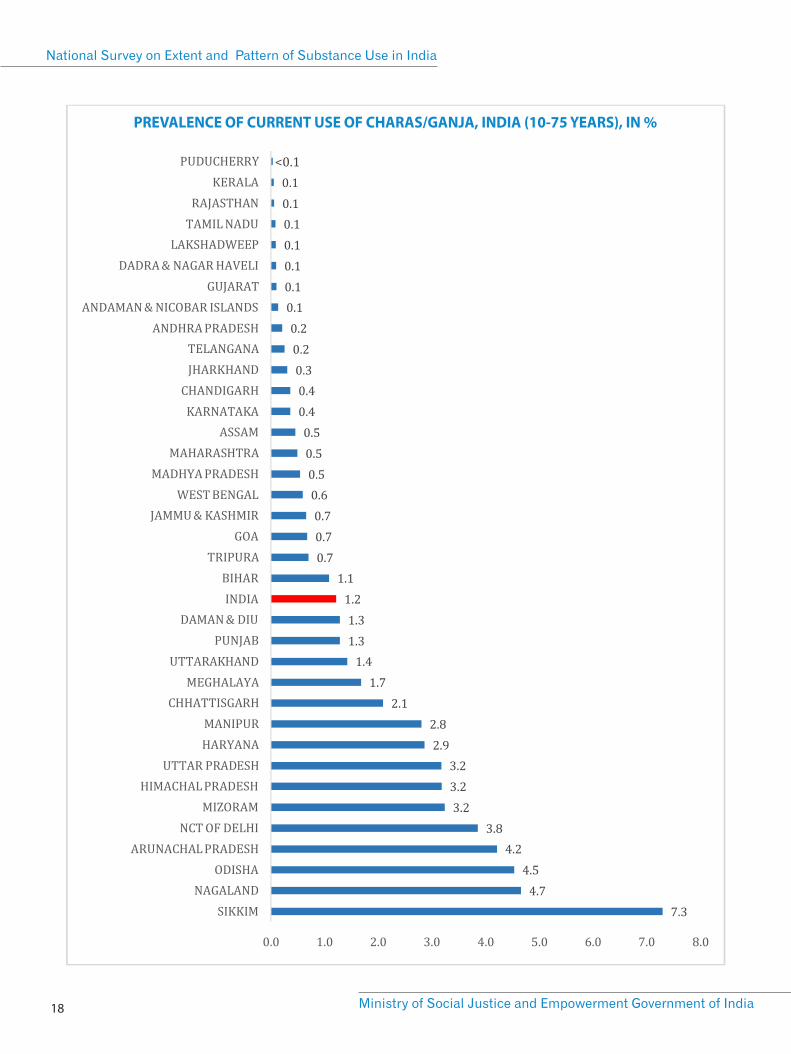
PREVALENCE OF CURRENT USE OF CHARAS/GANJA, INDIA (10-75 YEARS), IN %
National Survey on Extent and Pattern of Substance Use in India
Ministry of Social Justice and Empowerment Government of India 18
19National Drug Dependence Treatment Centre, AIIMS, New Delhi
Magnitude of Substance Use in India
TOP TEN STATES: NUMBER OF PEOPLE WHO NEED HELP
FOR CANNABIS RELATED PROBLEMS (2018)
(IN LAKHS)
UTTAR PRADESH
PUNJAB
ODISHA
MAHARASHTRA
CHHATTISGARH
BIHAR
HARYANA
DELHI
ASSAM
MADHYA PRADESH
28
5.7
4.9
4.6
3.8
3.8
3.5
3.1
1.9
1.7
ALL OTHER STATES 11.5
OPIOID USE IN INDIA PREVALENCE OF CURRENT OPIOID USE IN
DIFFERENT POPULATION GROUPS (%)
Total Population (10-75yrs)
All Males
All Females
Children(10-17yrs)
Adults (>18 years)
2.1%
4.0%
0.2%
2.1%
1.8%
The survey looked specifically for the
prevalence of current use and dependence
on three different sub-categories of
substances in the overall category of
o p i o i d s : ( 1 ) O p i u m ( i n c l u d i n g
doda/phukki/poppy husk); (2) Heroin
(including brown sugar/smack) and (3)
Pharmaceutical opioids (which itself
includes a variety of medications of the
opioid group).
Overall in the country, the prevalence of
current use of any opioid is 2.06%. Heroin is
the most commonly used opioid in
I n d i a ( 1 . 1 4 % ) . T h i s i s f o l l o w e d b y
pharmaceutical opioids (0.96%) and opium
(0.52%).
CURRENT USE AND PROBLEM USE
OF OPIOID DRUGS IN INDIA
(10-75 YEARS), IN %
National Survey on Extent and Pattern of Substance Use in India
Ministry of Social Justice and Empowerment Government of India 20
10.7
7.2
5.9
5.2
3.9
3.7
3.6
3.4
3.1
3.0
UTTAR PRADESH
PUNJAB
HARYANA
MAHARASHTRA
MADHYA PRADESH
DELHI
ANDHRA PRADESH
WEST BENGAL
RAJASTHAN
ODISHA
ALL OTHER STATES27
TOP TEN STATES: NO. OF PEOPLE
WHO NEED HELP FOR
OPIOID RELATED PROBLEMS
(IN LAKHS)
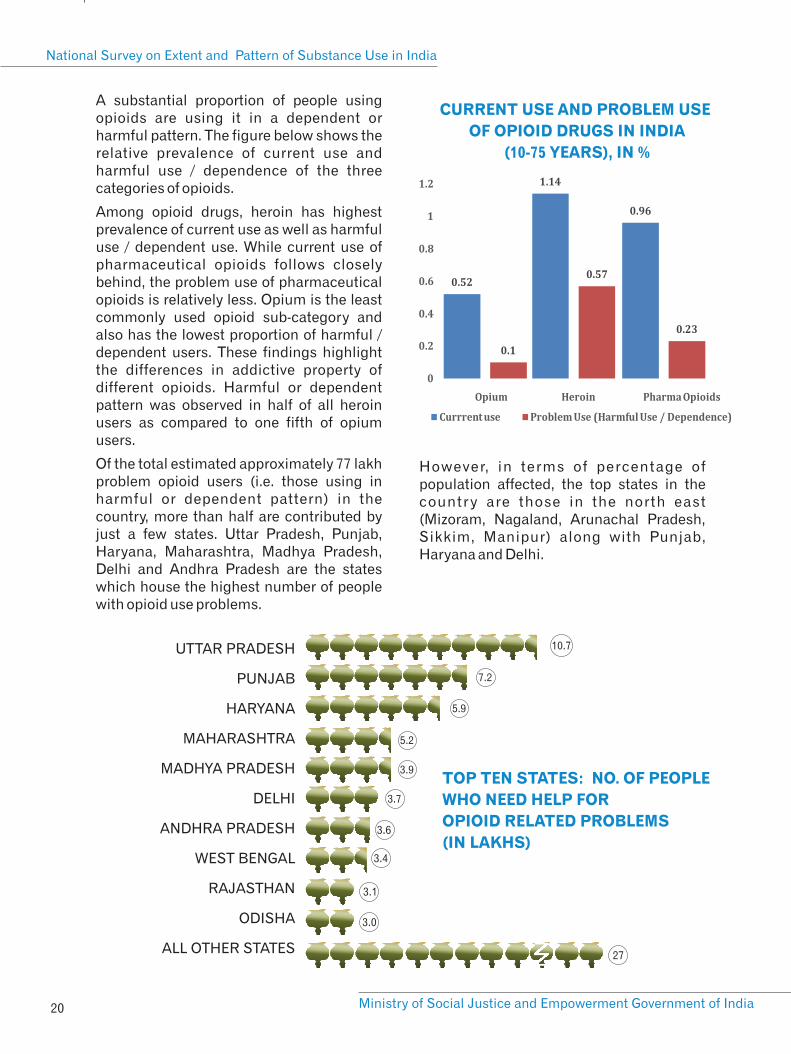
A substantial proportion of people using opioids are using it in a dependent or harmful pattern. The figure below shows the relative prevalence of current use and harmful use / dependence of the three categories of opioids.
Among opioid drugs, heroin has highest prevalence of current use as well as harmful use / dependent use. While current use of pharmaceutical opioids follows closely behind, the problem use of pharmaceutical opioids is relatively less. Opium is the least commonly used opioid sub-category and also has the lowest proportion of harmful / dependent users. These findings highlight the differences in addictive property of different opioids. Harmful or dependent pattern was observed in half of all heroin users as compared to one fifth of opium users.
Of the total estimated approximately 77 lakh problem opioid users (i.e. those using in harmful or dependent pattern) in the country, more than half are contributed by just a few states. Uttar Pradesh, Punjab, Haryana, Maharashtra, Madhya Pradesh, Delhi and Andhra Pradesh are the states which house the highest number of people with opioid use problems.
However, in terms of percentage of population affected, the top states in the country are those in the north east (Mizoram, Nagaland, Arunachal Pradesh, Sikkim, Manipur) along with Punjab, Haryana and Delhi.
21National Drug Dependence Treatment Centre, AIIMS, New Delhi
Magnitude of Substance Use in India
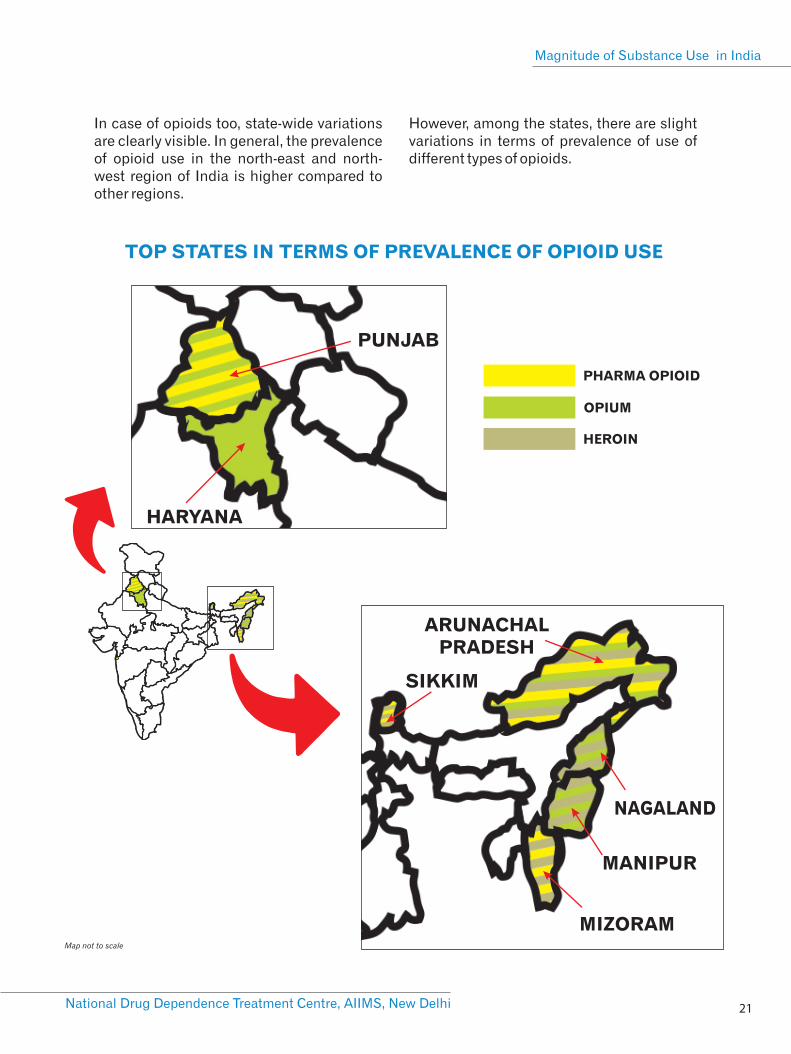
TOP STATES IN TERMS OF PREVALENCE OF OPIOID USE
NAGALAND
MANIPUR
MIZORAM
SIKKIM
ARUNACHAL PRADESH
PUNJAB
HARYANA
PHARMA OPIOID
OPIUM
HEROIN
Map not to scale
In case of opioids too, state-wide variations are clearly visible. In general, the prevalence of opioid use in the north-east and north-west region of India is higher compared to other regions.
However, among the states, there are slight variations in terms of prevalence of use of different types of opioids.
National Survey on Extent and Pattern of Substance Use in India
Ministry of Social Justice and Empowerment Government of India 22
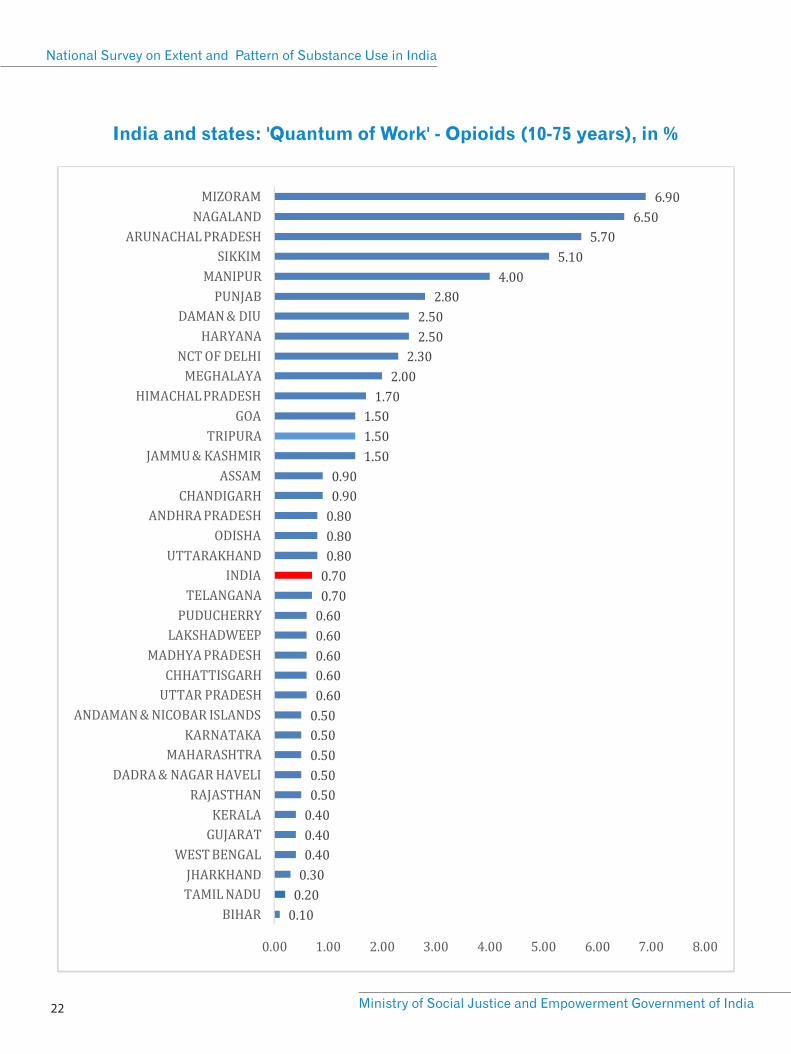
India and states: 'Quantum of Work' - Opioids (10-75 years), in %
23National Drug Dependence Treatment Centre, AIIMS, New Delhi
Magnitude of Substance Use in India
TOP TEN STATES : NO. OF PEOPLE WHO NEED HELP
FOR SEDATIVES RELATED PROBLEMS (IN LAKHS)
UTTAR PRADESH
MAHARASHTRA
PUNJAB
ANDHRA PRADESH
GUJARAT
HARYANA
MADHYA PRADESH
ODISHA
WEST BENGAL
DELHI
3.5
2.1
2.0
1.4
1.3
1.2
1.2
1.2
1.1
0.9
ALL OTHER STATES 6.1
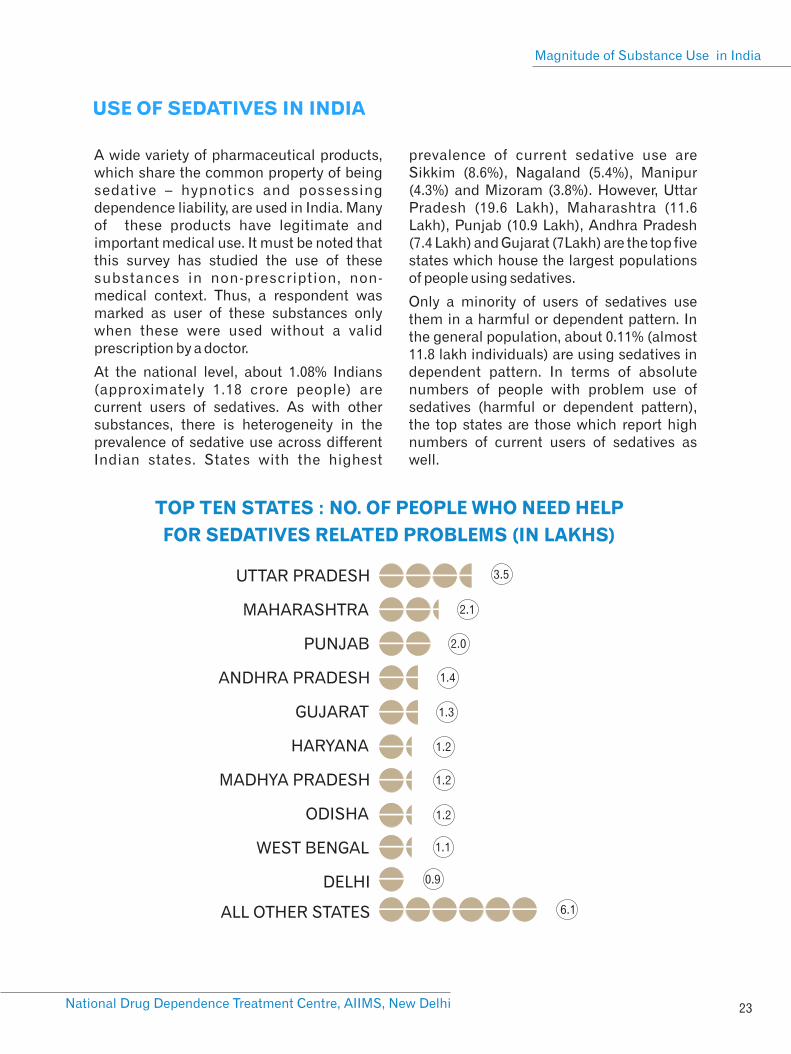
A wide variety of pharmaceutical products, which share the common property of being sedative – hypnotics and possessing dependence liability, are used in India. Many of these products have legitimate and important medical use. It must be noted that this survey has studied the use of these substances in non-prescription, non-medical context. Thus, a respondent was marked as user of these substances only when these were used without a valid prescription by a doctor.
At the national level, about 1.08% Indians (approximately 1.18 crore people) are current users of sedatives. As with other substances, there is heterogeneity in the prevalence of sedative use across different Indian states. States with the highest
prevalence of current sedative use are Sikkim (8.6%), Nagaland (5.4%), Manipur (4.3%) and Mizoram (3.8%). However, Uttar Pradesh (19.6 Lakh), Maharashtra (11.6 Lakh), Punjab (10.9 Lakh), Andhra Pradesh (7.4 Lakh) and Gujarat (7Lakh) are the top five states which house the largest populations of people using sedatives.
Only a minority of users of sedatives use them in a harmful or dependent pattern. In the general population, about 0.11% (almost 11.8 lakh individuals) are using sedatives in dependent pattern. In terms of absolute numbers of people with problem use of sedatives (harmful or dependent pattern), the top states are those which report high numbers of current users of sedatives as well.
USE OF SEDATIVES IN INDIA
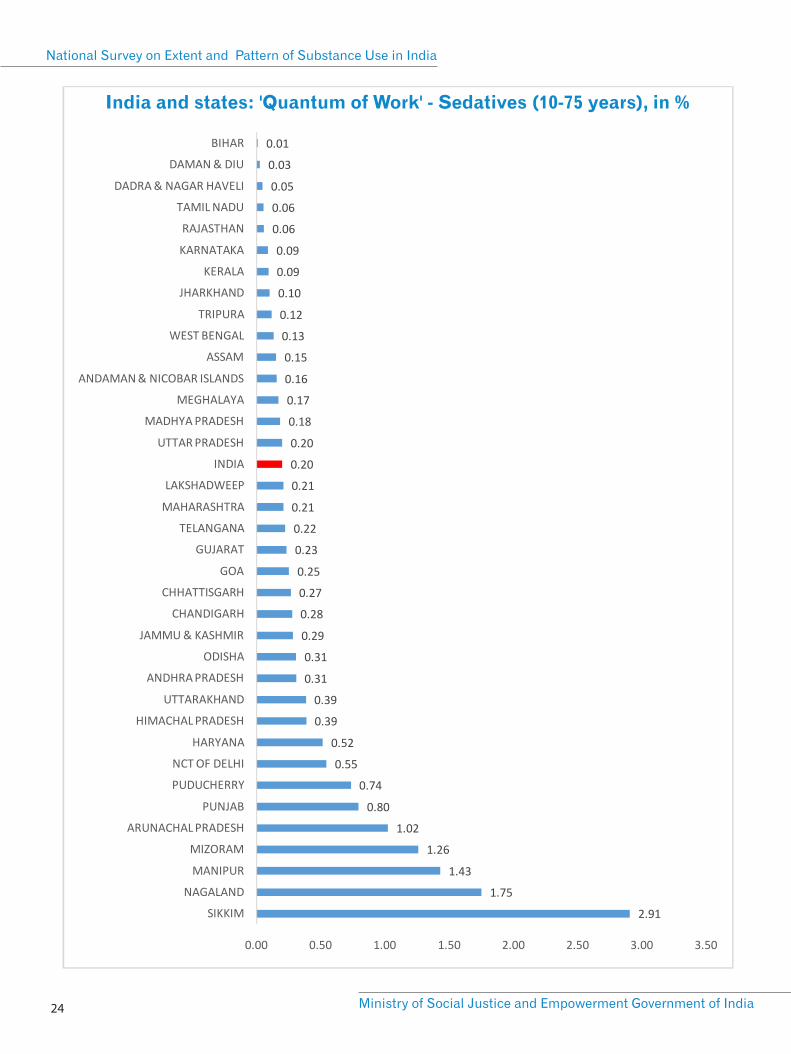
India and states: 'Quantum of Work' - Sedatives (10-75 years), in %
National Survey on Extent and Pattern of Substance Use in India
Ministry of Social Justice and Empowerment Government of India 24
0.58%
1.17%
0.07%
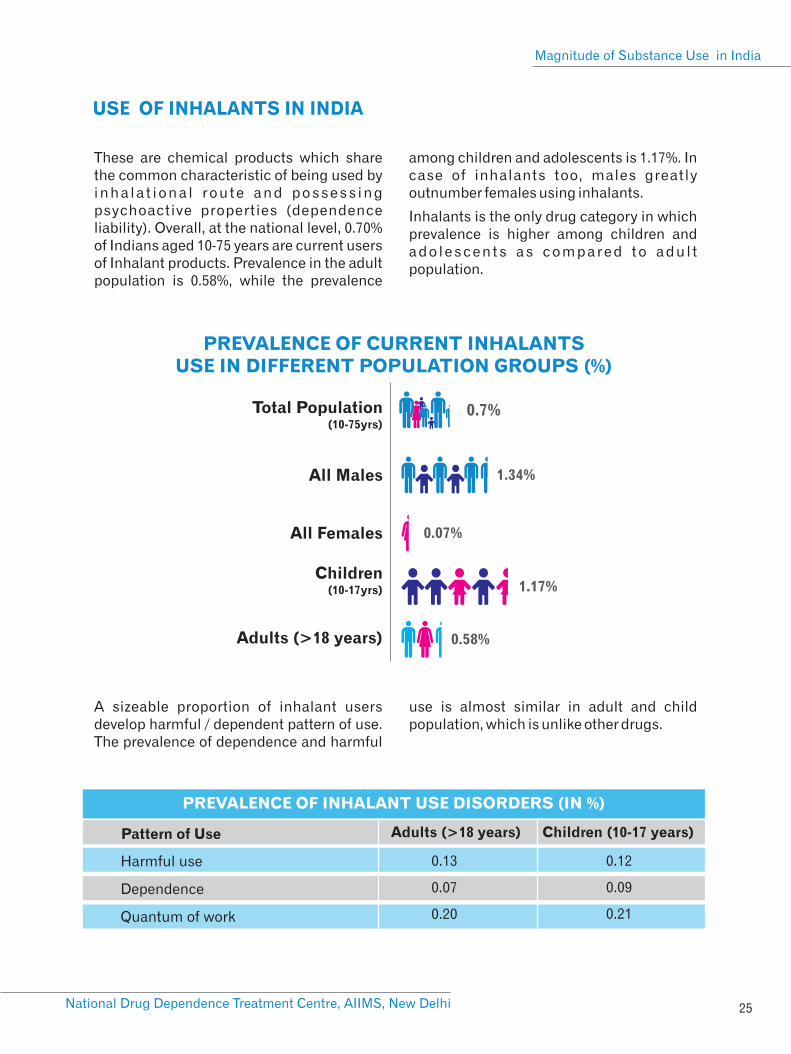
USE OF INHALANTS IN INDIA
25National Drug Dependence Treatment Centre, AIIMS, New Delhi
Magnitude of Substance Use in India
PREVALENCE OF CURRENT INHALANTSUSE IN DIFFERENT POPULATION GROUPS (%)
Total Population (10-75yrs)
All Males
All Females
Children(10-17yrs)
Adults (>18 years)
0.7%
1.34%
PREVALENCE OF INHALANT USE DISORDERS (IN %)
Harmful use
Dependence
Quantum of work
0.13
0.07
0.20
0.12
0.09
0.21
Pattern of Use Adults (>18 years) Children (10-17 years)
These are chemical products which share the common characteristic of being used by inha la t iona l route and possess ing psychoactive properties (dependence liability). Overall, at the national level, 0.70% of Indians aged 10-75 years are current users of Inhalant products. Prevalence in the adult population is 0.58%, while the prevalence
among children and adolescents is 1.17%. In case of inhalants too, males greatly outnumber females using inhalants.
Inhalants is the only drug category in which prevalence is higher among children and ado lescents as compared to adul t population.
A sizeable proportion of inhalant users develop harmful / dependent pattern of use. The prevalence of dependence and harmful
use is almost similar in adult and child population, which is unlike other drugs.
National Survey on Extent and Pattern of Substance Use in India
Ministry of Social Justice and Empowerment Government of India 26
UTTAR PRADESH
MADHYA PRADESH
MAHARASHTRA
DELHI
HARYANA
94
50
40
38
35
ALL OTHER STATES 201
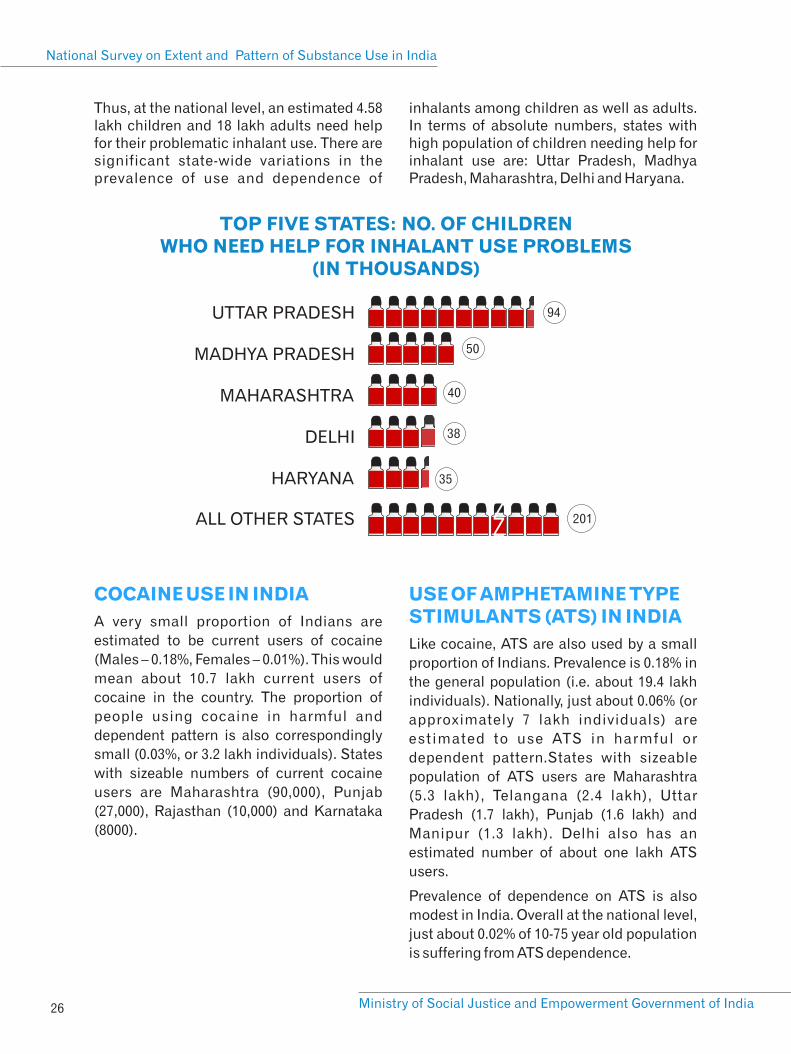
TOP FIVE STATES: NO. OF CHILDREN WHO NEED HELP FOR INHALANT USE PROBLEMS
(IN THOUSANDS)
Thus, at the national level, an estimated 4.58 lakh children and 18 lakh adults need help for their problematic inhalant use. There are significant state-wide variations in the prevalence of use and dependence of
inhalants among children as well as adults. In terms of absolute numbers, states with high population of children needing help for inhalant use are: Uttar Pradesh, Madhya Pradesh, Maharashtra, Delhi and Haryana.
COCAINE USE IN INDIA
A very small proportion of Indians are
estimated to be current users of cocaine
(Males – 0.18%, Females – 0.01%). This would
mean about 10.7 lakh current users of
cocaine in the country. The proportion of
people using cocaine in harmful and
dependent pattern is also correspondingly
small (0.03%, or 3.2 lakh individuals). States
with sizeable numbers of current cocaine
users are Maharashtra (90,000), Punjab
(27,000), Rajasthan (10,000) and Karnataka
(8000).
USE OF AMPHETAMINE TYPESTIMULANTS (ATS) IN INDIA
Like cocaine, ATS are also used by a small
proportion of Indians. Prevalence is 0.18% in
the general population (i.e. about 19.4 lakh
individuals). Nationally, just about 0.06% (or
approximately 7 lakh individuals) are
estimated to use ATS in harmful or
dependent pattern.States with sizeable
population of ATS users are Maharashtra
(5.3 lakh), Telangana (2.4 lakh), Uttar
Pradesh (1.7 lakh), Punjab (1.6 lakh) and
Manipur (1.3 lakh). Delhi also has an
estimated number of about one lakh ATS
users.
Prevalence of dependence on ATS is also
modest in India. Overall at the national level,
just about 0.02% of 10-75 year old population
is suffering from ATS dependence.
<0.1<0.1
<0.1<0.1
India and States: Inhalants, Current use and Harmful / Dependent Use, Children 10-17 years (in %)
27National Drug Dependence Treatment Centre, AIIMS, New Delhi
Magnitude of Substance Use in India
National Survey on Extent and Pattern of Substance Use in India
Ministry of Social Justice and Empowerment Government of India 28
UTTAR PRADESH
PUNJAB
DELHI
ANDHRA PRADESH
TELANGANA
HARYANA
KARNATAKA
MAHARASHTRA
MANIPUR
NAGALAND
100
88
86
64
55
44
34
34
69
44
TOP TEN STATES: NO. OF PWID (IN THOUSANDS)
USE OF HALLUCINOGENS IN
INDIAThis is also a drug category used by a
minority of Indians. Just about 0.12% of
population (approximately 12.6 lakh
individuals) report using hallucinogens in
past 12 months. About 0.03% of Indians
(about 3.4 lakh individuals) need help for
the i r harmful or dependent use o f
hallucinogens. States with sizeable
numbers of hal lucinogen users are
Maharashtra (6 lakh), Telangana (2 lakh),
Kerala (1 lakh)and Delhi (63 thousand).
INJECTING DRUG USE IN
INDIAUse of drugs through injecting route is a
significant public health concern because of
the associated risk of spread of infections
like HIV and Hepatitis C and B. Current
Injecting drug use is defined operationally in
this study as use of any intoxicating
substance through injecting route even once
within past three months (as defined by the
National AIDS Control Programme of India).
Findings show that there are estimated 8.5
Lakh people who inject drugs (PWID) in
India. Injecting Drug Use was documented
in all the regions of the country.
29National Drug Dependence Treatment Centre, AIIMS, New Delhi
Magnitude of Substance Use in India
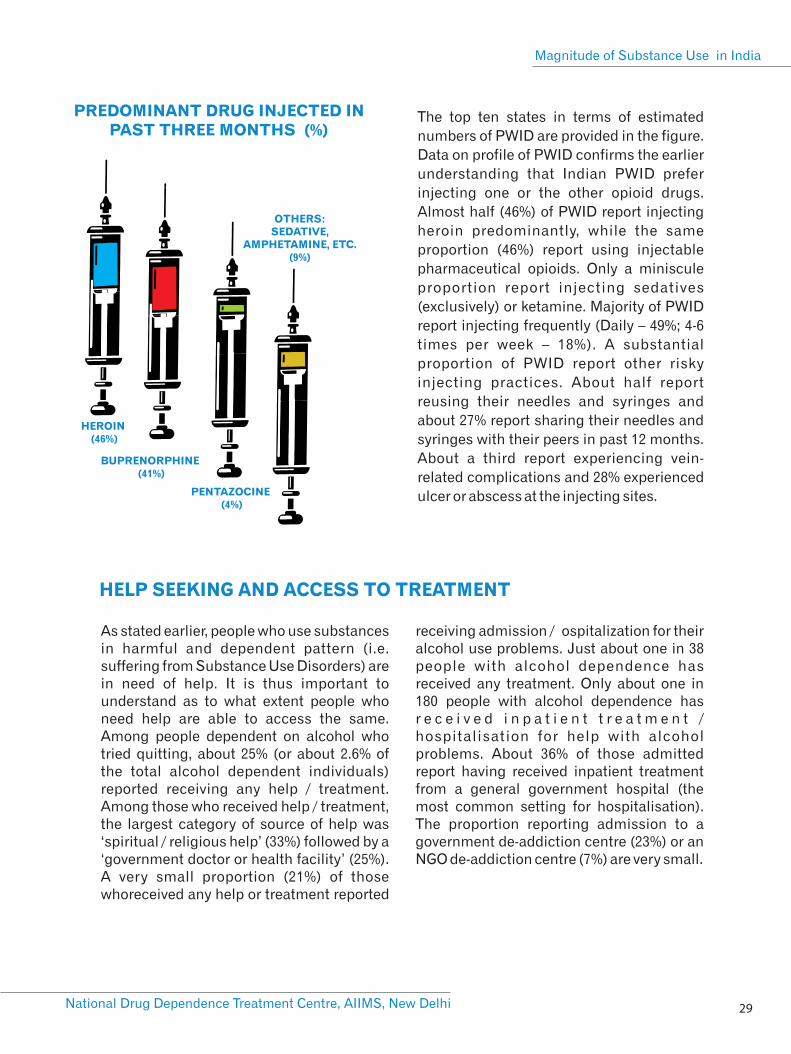
PREDOMINANT DRUG INJECTED IN PAST THREE MONTHS (%)
HEROIN (46%)
BUPRENORPHINE (41%)
PENTAZOCINE (4%)
OTHERS: SEDATIVE,
AMPHETAMINE, ETC.(9%)
HELP SEEKING AND ACCESS TO TREATMENT
The top ten states in terms of estimated
numbers of PWID are provided in the figure.
Data on profile of PWID confirms the earlier
understanding that Indian PWID prefer
injecting one or the other opioid drugs.
Almost half (46%) of PWID report injecting
heroin predominantly, while the same
proportion (46%) report using injectable
pharmaceutical opioids. Only a miniscule
proportion report injecting sedatives
(exclusively) or ketamine. Majority of PWID
report injecting frequently (Daily – 49%; 4-6
times per week – 18%). A substantial
proportion of PWID report other risky
injecting practices. About half report
reusing their needles and syringes and
about 27% report sharing their needles and
syringes with their peers in past 12 months.
About a third report experiencing vein-
related complications and 28% experienced
ulcer or abscess at the injecting sites.
As stated earlier, people who use substances in harmful and dependent pattern (i.e. suffering from Substance Use Disorders) are in need of help. It is thus important to understand as to what extent people who need help are able to access the same. Among people dependent on alcohol who tried quitting, about 25% (or about 2.6% of the total alcohol dependent individuals) reported receiving any help / treatment. Among those who received help / treatment, the largest category of source of help was ‘spiritual / religious help’ (33%) followed by a ‘government doctor or health facility’ (25%). A very small proportion (21%) of those whoreceived any help or treatment reported
receiving admission / ospitalization for their alcohol use problems. Just about one in 38 people with alcohol dependence has received any treatment. Only about one in 180 people with alcohol dependence has r e c e i v e d i n p a t i e n t t r e a t m e n t / hospitalisation for help with alcohol problems. About 36% of those admitted report having received inpatient treatment from a general government hospital (the most common setting for hospitalisation). The proportion reporting admission to a government de-addiction centre (23%) or an NGO de-addiction centre (7%) are very small.
National Survey on Extent and Pattern of Substance Use in India
Ministry of Social Justice and Empowerment Government of India 30
Tried to quit-did not
receive anytreatment
75%
ReceivedTreatment
25%
Hospitalisation21%
Other Treatment
79%
Treatment for Alcohol Dependence
Tried to quit-did not
receive anytreatment
75%
ReceivedTreatment
25%
Hospitalisation44%
Other Treatment
56%
Treatment for Drug Dependence
Similar trend is visible among those with dependence on illicit drugs. Among those affected by drug dependence, around 44% reported trying to give up drug use, of which, around 25% (i.e. about 12% of all drug dependent people) reported receiving any help or treatment ever. The most common source of treatment was a government
hospital (40% of those having received treatment). Among those who received treatment, as many as 44% reported having received in-patient treatment. Thus, among people suffering from dependence on illicit drugs, one among 20 people has received inpatient treatment / hospitalisation for help with drug problems ever in lifetime.
31
THE WAY FORWARD
National Drug Dependence Treatment Centre, AIIMS, New Delhi
Magnitude of Substance Use in India

THE WAY FORWARD WHAT DO THESE FINDINGS TELL US?
National Drug Dependence Treatment Centre, AIIMS, New Delhi
Magnitude of Substance Use in India
33
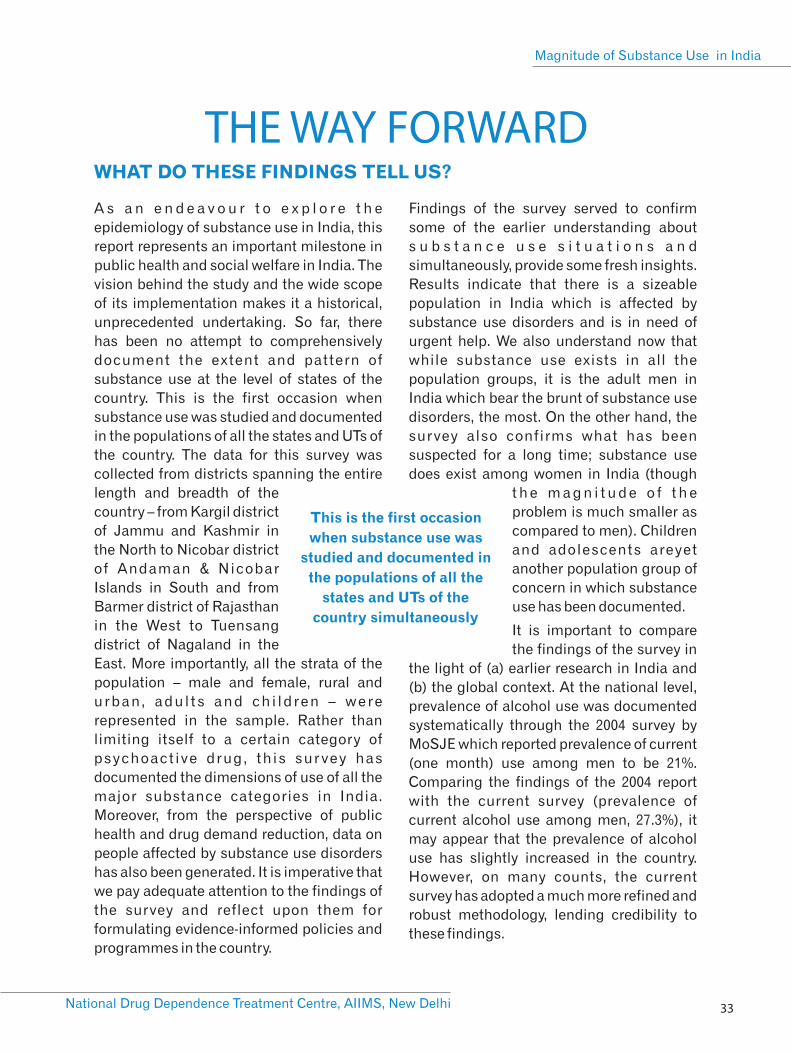
A s a n e n d e a v o u r t o e x p l o r e t h e
epidemiology of substance use in India, this
report represents an important milestone in
public health and social welfare in India. The
vision behind the study and the wide scope
of its implementation makes it a historical,
unprecedented undertaking. So far, there
has been no attempt to comprehensively
document the extent and pattern of
substance use at the level of states of the
country. This is the first occasion when
substance use was studied and documented
in the populations of all the states and UTs of
the country. The data for this survey was
collected from districts spanning the entire
length and breadth of the
country – from Kargil district
of Jammu and Kashmir in
the North to Nicobar district
of Andaman & Nicobar
Islands in South and from
Barmer district of Rajasthan
in the West to Tuensang
district of Nagaland in the
East. More importantly, all the strata of the
population – male and female, rural and
urban, adul ts and chi ldren – were
represented in the sample. Rather than
limiting itself to a certain category of
psychoactive drug, this sur vey has
documented the dimensions of use of all the
major substance categories in India.
Moreover, from the perspective of public
health and drug demand reduction, data on
people affected by substance use disorders
has also been generated. It is imperative that
we pay adequate attention to the findings of
the survey and reflect upon them for
formulating evidence-informed policies and
programmes in the country.
Findings of the survey served to confirm
some of the earlier understanding about
s u b s t a n c e u s e s i t u a t i o n s a n d
simultaneously, provide some fresh insights.
Results indicate that there is a sizeable
population in India which is affected by
substance use disorders and is in need of
urgent help. We also understand now that
while substance use exists in all the
population groups, it is the adult men in
India which bear the brunt of substance use
disorders, the most. On the other hand, the
survey also confirms what has been
suspected for a long time; substance use
does exist among women in India (though
t h e m a g n i t u d e o f t h e
problem is much smaller as
compared to men). Children
and adolescents areyet
another population group of
concern in which substance
use has been documented.
It is important to compare
the findings of the survey in
the light of (a) earlier research in India and
(b) the global context. At the national level,
prevalence of alcohol use was documented
systematically through the 2004 survey by
MoSJE which reported prevalence of current
(one month) use among men to be 21%.
Comparing the findings of the 2004 report
with the current survey (prevalence of
current alcohol use among men, 27.3%), it
may appear that the prevalence of alcohol
use has slightly increased in the country.
However, on many counts, the current
survey has adopted a much more refined and
robust methodology, lending credibility to
these findings.
This is the first occasion
when substance use was
studied and documented in
the populations of all the
states and UTs of the
country simultaneously

[8] Global and Asian estimates are based on the World Drug Report (2018), published by UNODC
[6] National Family Health Survey - 4 (2016) Available at rchiips.org/nfhs/factsheet_nfhs-4.shtml
[7] Global Status Report on Alcohol and Health (2018).
[9] Cannabis data presented here pertain to only the illicit forms (i.e. ganja / charas). Bhang is not included in these estimates.
PREVALENCE OF ILLICIT DRUG USE:8 COMPARISON OF GLOBAL, ASIAN AND NATIONAL (INDIA) ESTIMATES
(IN %)
9Cannabis
Opioids
Cocaine
ATS
3.9
0.70
0.37
0.70
1.2
2.06
0.11
0.18
Drug CategoryWorld
(15-64 years)
India
(10-75 years)
1.9
0.46
0.03
0.59
Asia
(15-64 years)
National Survey on Extent and Pattern of Substance Use in India
Ministry of Social Justice and Empowerment Government of India 34
Another source of information about the
prevalence of alcohol use at the national
level is the findings of the National Family
Health Survey (NFHS). The most recent
round of NFHS (2016) reports the prevalence
of alcohol use to be 29.2% in males and 1.2% 6in females .
Almost similar prevalence was estimated in
this survey too (when population aged 15-49
years is considered). We estimate the
prevalence to be 29.3% among men and 1.8%
among women. However, we must take a
note of methodological differences here.
NFHS has a much broader mandate and
hence, the required rigour in documenting
alcohol use is not expected. This survey, on
the other hand, was focused only on
substance use and hence the findings can be
considered as much closer to the real
picture.
It is also pertinent to compare the extent of
substance use in India vis-à-vis the global
data. World Health Organization (WHO)
reports that about half of the global
population aged more than 15 years is 7current (past 12 months) user of alcohol . In
comparison, India has a much lower
prevalence of alcohol use, as reported in this
survey. However we must note that a
substantial number of Indians (5.2%) use
alcohol in a harmful / dependent pattern,
which is almost equal to the global
estimates (5.1% according to WHO, 2018). In
other words, fewer people in India consume
alcohol, but a larger proportion are affected
by harmful use or dependence on alcohol.
Regarding other substances, in its most
recent World Drug Report (2018), the United
Nations Office and Drugs and Crime
(UNODC) has estimated that around 3.9% of
the global population aged 15- 64 years is
current (past 12 month) user of cannabis.
The figure for India, as estimated by the
current survey is 1.2% for the age-group 10 to 975 years . Estimated prevalence of opioid use
in India by this survey is considerably higher
than the Global and Asian average. However,
the prevalence of cocaine and ATS use is
much lower. Indeed, findings of this survey is
an opportunity for UNODC to take note of the
Indian data (and modify the global
estimates, if required, in the light of data
from India).
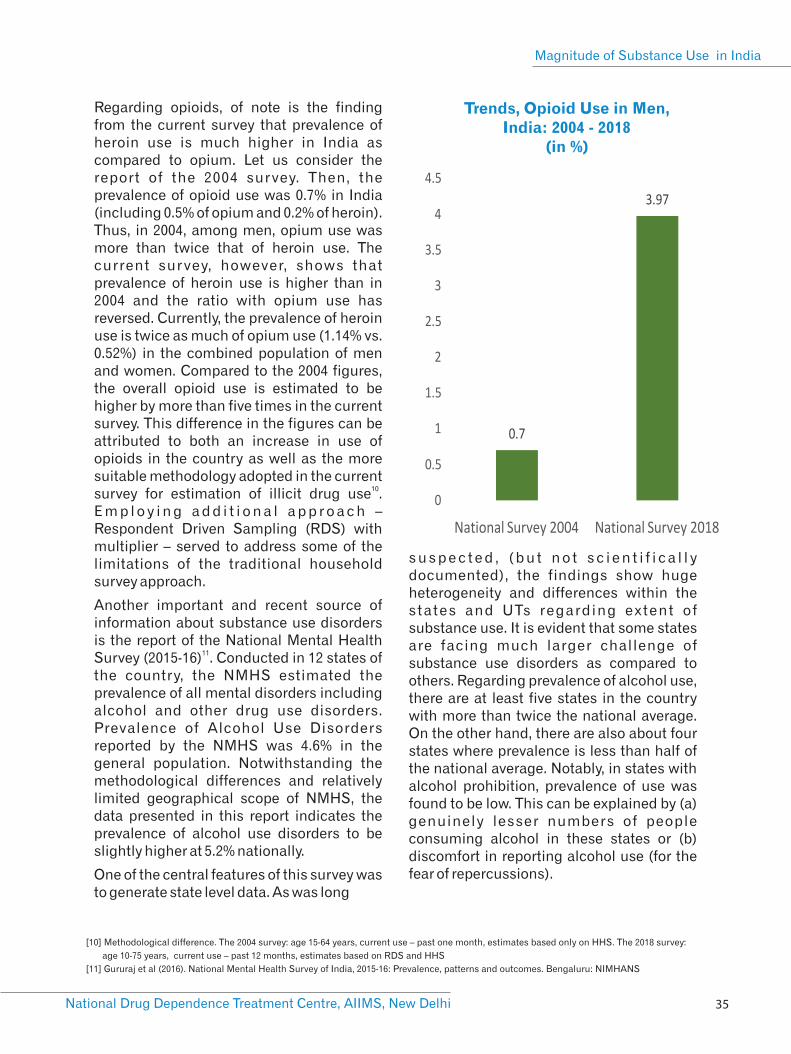
[11] Gururaj et al (2016). National Mental Health Survey of India, 2015-16: Prevalence, patterns and outcomes. Bengaluru: NIMHANS
[10] Methodological difference. The 2004 survey: age 15-64 years, current use – past one month, estimates based only on HHS. The 2018 survey:
age 10-75 years, current use – past 12 months, estimates based on RDS and HHS
Trends, Opioid Use in Men, India: 2004 - 2018
(in %)
National Drug Dependence Treatment Centre, AIIMS, New Delhi
Magnitude of Substance Use in India
35
Regarding opioids, of note is the finding from the current survey that prevalence of heroin use is much higher in India as compared to opium. Let us consider the report of the 2004 survey. Then, the prevalence of opioid use was 0.7% in India (including 0.5% of opium and 0.2% of heroin). Thus, in 2004, among men, opium use was more than twice that of heroin use. The current survey, however, shows that prevalence of heroin use is higher than in 2004 and the ratio with opium use has reversed. Currently, the prevalence of heroin use is twice as much of opium use (1.14% vs. 0.52%) in the combined population of men and women. Compared to the 2004 figures, the overall opioid use is estimated to be higher by more than five times in the current survey. This difference in the figures can be attributed to both an increase in use of opioids in the country as well as the more suitable methodology adopted in the current
10survey for estimation of illicit drug use . E m p l o y i n g a d d i t i o n a l a p p r o a c h – Respondent Driven Sampling (RDS) with multiplier – served to address some of the limitations of the traditional household survey approach.
Another important and recent source of information about substance use disorders is the report of the National Mental Health
11Survey (2015-16) . Conducted in 12 states of the country, the NMHS estimated the prevalence of all mental disorders including alcohol and other drug use disorders. Prevalence of Alcohol Use Disorders reported by the NMHS was 4.6% in the general population. Notwithstanding the methodological differences and relatively limited geographical scope of NMHS, the data presented in this report indicates the prevalence of alcohol use disorders to be slightly higher at 5.2% nationally.
One of the central features of this survey was to generate state level data. As was long
s u s p e c t e d , ( b u t n o t s c i e n t i f i c a l l y documented), the findings show huge heterogeneity and differences within the states and UTs regarding extent of substance use. It is evident that some states are facing much larger challenge of substance use disorders as compared to others. Regarding prevalence of alcohol use, there are at least five states in the country with more than twice the national average. On the other hand, there are also about four states where prevalence is less than half of the national average. Notably, in states with alcohol prohibition, prevalence of use was found to be low. This can be explained by (a) genuinely lesser numbers of people consuming alcohol in these states or (b) discomfort in reporting alcohol use (for the fear of repercussions).
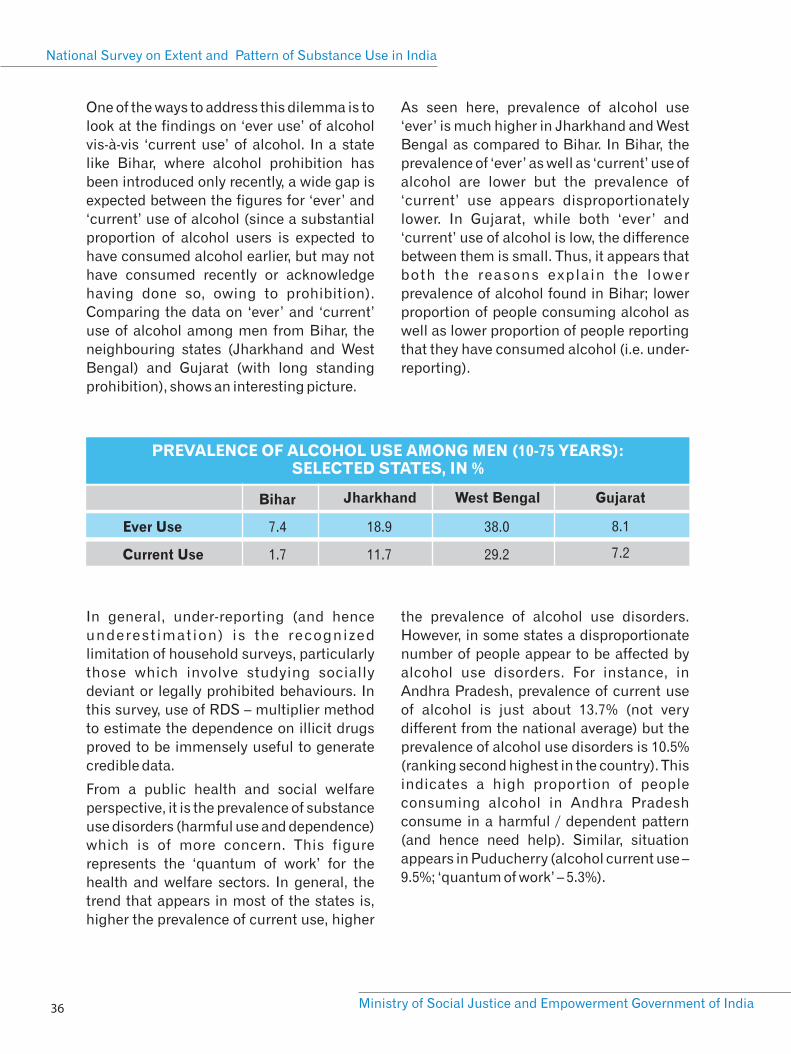
PREVALENCE OF ALCOHOL USE AMONG MEN (10-75 YEARS): SELECTED STATES, IN %
Ever Use
Current Use
8.1
7.2
Jharkhand
7.4
1.7
Bihar
18.9
11.7
West Bengal
38.0
29.2
Gujarat
National Survey on Extent and Pattern of Substance Use in India
Ministry of Social Justice and Empowerment Government of India 36
One of the ways to address this dilemma is to
look at the findings on ‘ever use’ of alcohol
vis-à-vis ‘current use’ of alcohol. In a state
like Bihar, where alcohol prohibition has
been introduced only recently, a wide gap is
expected between the figures for ‘ever’ and
‘current’ use of alcohol (since a substantial
proportion of alcohol users is expected to
have consumed alcohol earlier, but may not
have consumed recently or acknowledge
having done so, owing to prohibition).
Comparing the data on ‘ever’ and ‘current’
use of alcohol among men from Bihar, the
neighbouring states (Jharkhand and West
Bengal) and Gujarat (with long standing
prohibition), shows an interesting picture.
As seen here, prevalence of alcohol use
‘ever’ is much higher in Jharkhand and West
Bengal as compared to Bihar. In Bihar, the
prevalence of ‘ever’ as well as ‘current’ use of
alcohol are lower but the prevalence of
‘current’ use appears disproportionately
lower. In Gujarat, while both ‘ever’ and
‘current’ use of alcohol is low, the difference
between them is small. Thus, it appears that
both the reasons explain the lower
prevalence of alcohol found in Bihar; lower
proportion of people consuming alcohol as
well as lower proportion of people reporting
that they have consumed alcohol (i.e. under-
reporting).
In general, under-reporting (and hence
underest imation) is the recognized
limitation of household surveys, particularly
those which involve studying socially
deviant or legally prohibited behaviours. In
this survey, use of RDS – multiplier method
to estimate the dependence on illicit drugs
proved to be immensely useful to generate
credible data.
From a public health and social welfare
perspective, it is the prevalence of substance
use disorders (harmful use and dependence)
which is of more concern. This figure
represents the ‘quantum of work’ for the
health and welfare sectors. In general, the
trend that appears in most of the states is,
higher the prevalence of current use, higher
the prevalence of alcohol use disorders.
However, in some states a disproportionate
number of people appear to be affected by
alcohol use disorders. For instance, in
Andhra Pradesh, prevalence of current use
of alcohol is just about 13.7% (not very
different from the national average) but the
prevalence of alcohol use disorders is 10.5%
(ranking second highest in the country). This
indicates a high proportion of people
consuming alcohol in Andhra Pradesh
consume in a harmful / dependent pattern
(and hence need help). Similar, situation
appears in Puducherry (alcohol current use –
9.5%; ‘quantum of work’ – 5.3%).
National Drug Dependence Treatment Centre, AIIMS, New Delhi
Magnitude of Substance Use in India
37
Data on opioid use also display some
interesting patterns. It is well known that the
north-eastern states (which share borders
with illicit opioid producing countries) have
a higher problem of opioid use. This survey
also shows the similar trend – a higher
prevalence of opioid use – in north-eastern
states. Besides those in the north-eastern
region, a state which stands out in terms of
opioid use is Punjab. Punjab has a high
prevalence of current use of opioids as well
as of opioid use disorders. In the recent past,
two large studies focusing on opioid
dependence in Punjab have documented the
high magnitude of opioid problem in Punjab.
Indeed, the estimated numbers of people
with opioid dependence in Punjab, 12presented in this report (3.3 lakh) are
largely similar to the other previous studies 13
(Ambekar et al, 2015 – 2.3 lakh and Avasthi 14et al, 2019 – 2.7 lakh). The variation in
estimated numbers among these studies is
well within the margin of error for any such
estimation exercise. Besides Punjab and the
northeastern states, Haryana and Delhi also
display a high prevalence of current opioid
use as well as opioid use disorders. Indeed,
in as many as 13 states in the country, the
prevalence of opioid use disorders is more
than one percent (indicating a major public
health concern).
It is also worth noting that India’s opioid use
scenario shows a s ignif icant shi f t .
Traditionally, use of opium is established in
many parts of India. However, currently, at
the national level, it is the heroin which is
predominant opioid being used. In most
states of the country, prevalence of heroin
use is higher than that of opium. This is true
for the traditional legal producers of opium
(Rajasthan, Uttar Pradesh and Madhya
Pradesh) as well as the known illegal opium
cultivation state like Arunachal Pradesh.
C o m p a r i n g t h e p r e v a l e n c e o f
pharmaceutical opioids with that of heroin,
however, reveals a different picture. The
trend appears that in the southern states of
the country (where, in general, prevalence of
use of opioid as a category is low),
pharmaceutical opioids have a higher
prevalence than heroin. Sikkim is a
northeastern state which bucks this trend.
Indeed, Sikkim has the highest prevalence of
use of pharmaceutical opioids among all the
states.
Other than pharmaceutical opioids, another
important pharmaceutical drug category is
sedatives. Here too, it is Sikkim which has
the highest prevalence of current use of
sedatives as well as sedative use disorders.
This trend is in general apparent for other
states too; states with a higher prevalence of
use of pharmaceutical opioids, also have a
h i g h e r p r e v a l e n c e o f u s e o f
(pharmaceutical) sedatives.
The phenomenon of combining sedatives
with opioids by the users to potentiate the
psychoactive effects is well-known. It should
also be noted that a substantial proportion of
people who inject drugs (almost half of
them) report injecting pharmaceutical
opioids. Previous research from India has
establ ished that people who inject
pharmaceutical opioids often combine them 15with one or more pharmaceutical sedatives
. Thus, it is not surprising to see the figures
for use of pharmaceutical opioids and
sedatives go hand in hand.
[12] This is the figure for opioid dependence. Estimated number of
people who need help (harmful use and dependence) is higher in
Punjab: 6.8 lakh
[13] Punjab Opioid Dependence Survey. Available at
http://pbhealth.gov.in/scan0003%20(2).pdf
[14] Avasthi et al (2019). Epidemiology of dependence on illicit
substances, with a special focus on opioid dependence, in the
State of Punjab, India. Asian Journal of Psychiatry 39 (2019) 70–79
[15]Ambekar et al (2014). “Type of opioids injected: Does it matter?
A multicentric cross-sectional study of people who inject drugs”,
Drug Alcohol Rev.. doi: 10.1111/dar.12208

[16] NACO. Annual Report 2016-17.
[17] Dhawan et al (2015) “Treatment seeking behavior of inhalant using
street children: Are we prepared to meet their treatment needs”.
Indian J Psychol Med;37:282-7
National Survey on Extent and Pattern of Substance Use in India
Ministry of Social Justice and Empowerment Government of India 38
An important piece of data has been
generated here, regarding the estimated
number of people who inject drugs (PWID).
Injecting Drug Use is a known risk factor for
HIV epidemic in India. Many states of the
country (largely those in northeast) are
known for concentrated epidemic of HIV
infection among people who inject drugs.
While HIV testing was beyond the mandate
of this study, the findings do show that many
states in the country have a substantial
population of PWID and among them a
sizeable proportion report risky injecting
practices. So far, the number of PWID
(estimated by National AIDS Control
Organization) was understood to be just
under two lakh (among which about 1.2 lakh
PWID received services in the year 2016-
1617) . This survey estimates the number of
PWID to be about 8.5 lakh in India. Here, it is
important to note that NACO estimates the
number of those PWID which can be
provided services (i.e. in urban areas and
closely knit populations). Findings of this
survey indicate that there may be a
substantial population of PWID, which is
scattered and hence, difficult to reach with
services.
High prevalence of inhalant use among
children and adolescents is another
important concern for India. It is the only
category of substances where prevalence
among children is more than the prevalence
among adults. Many states of the country
have a substantial population of children
using inhalants and affected by inhalant use
disorders. Among children, earlier research
from India has shown that the street children
are particularly vulnerable population for 17inhalant use .
Besides reporting the figures for extent and
prevalence of substance use in India, this
report also seeks to draw attention towards
the abysmally low coverage with treatment
services for people affected by substance
use disorders. Among those people with
alcohol and drug dependence who make an
attempt to quit, just about a fourth report
receiving any help. Treatment in the formal,
organized sector is accessed by a very small
minority. Indeed, ‘admission to a de-
addiction centre’ (which is mistakenly
regarded as the primary modality of
treatment of substance use disorders in
India) is received by a miniscule proportion
of affected population. In the light of the
finding that most common type of facility
where patients receive treatment is the
government general hospital, it is evident
that neither the program by the MoSJE
(support to NGOs for establishing Integrated
Rehabilitation Services for Addicts – IRCAs)
nor the Drug De-Addiction program of
Ministry of Health and Family Welfare
(support to government hospitals for
establishing de-addiction centres) are able
to cater to the vast demand of treatment.
RECOMMENDATIONS
Considering the enormous challenge of
substance use disorders in the country, there
i s a n u r g e n t n e e d o f p o l i c i e s a n d
programmes which can bring relief to the
large number of affected Indian citizens. It is
imperat ive that these pol ic ies and
programmes are based upon scientific
evidence and take into consideration the
local, socio-cultural context. Substance use
disorders are clearly a significant public
health concern in the country, as evident by
the findings contained in this report. Thus,
we now discuss various measures which
must be undertaken to enable the country
deal with this concern.
[18] International Narcotics Control Board (2018). Treatment, rehabilitation and social reintegration for drug use disorders: essential components of drug demand reduction. Annual Report 2017. Vienna: INCB[19] United Nations General Assembly Special Session (UNGASS). Our joint commitment to effectively addressing and countering the world drug problem. (2016). United Nations.
National Drug Dependence Treatment Centre, AIIMS, New Delhi
Magnitude of Substance Use in India
39
Scientific evidence-based treatment needs to be made available for people with substance use disorders – at the required scale
Health sciences have made tremendous progress in last few decades. A number of treatment modalities for substance use disorders exist with a strong evidence base of their effectiveness. Substance use disorders are understood as health conditions for which effective treatment needs to be available to reduce the overall s o c i a l a n d p u b l i c - h e a l t h b u r d e n . International agencies have strongly recommended that national governments must allocate optimum resources for
18treatment of substance use disorders . Due priority needs to be accorded to substance use treatment among other health and welfare needs. India is a signatory to the outcome document of the thirtieth special session of the United Nations General Assembly, 2016 which has recommended treatment of drug use disorders as the key operational objective towards drug demand
19reduction .
Thus, for the health and social welfare sectors of the country, the figures for harmful use / dependence (or ‘quantum of work’) presented in this report, are much more relevant (as opposed to the figures indicating substance ‘use’). Results show that many states of the country have a large number of people who need treatment for their substance use disorders. The figure of more than five percent of general population affected by alcohol use disorders points to a significant public health challenge. In many states, a large proportion of the population (particularly adult males) are affected by alcohol use disorders and are in need of urgent help. At the level of states, the figures for prevalence of ‘quantum of work’ (i.e. proportion of population affected) is a helpful guide to plan resource allocation and other strategies. At the national level, however, it is also important to be guided by estimated number of people affected in each
state, in order to inform the national programme priorities. For instance, even small proportions of populations being affected in large states like Uttar Pradesh, reflects a very heavy treatment demand in terms of absolute numbers. Thus, it will be important that planning for a national level treatment programme takes into account both the high prevalence as well as absolute magnitude of the problem, for prioritisation among the states.
Data from this survey once again confirms what has been known for a long time; there is a gross mismatch between demand and availability of treatment services for substance use disorders in the country. The National Mental Health Survey (NMHS) reported a high ‘treatment gap’ (i.e. number of people, in need of treatment but not receiving treatment) for substance use disorders in India. The treatment gap, as reported by NMHS, was more pronounced for alcohol use disorders (86%) as compared to other drug use disorders (73%). A similar trend was observed in this survey; just about one in 37 people affected by alcohol use disorders and one in 20 affected by drug use disorders have received any treatment, ever.
Two major ministries of Government of India (MoSJE and MoH&FW) are mandated to provide treatment services. It is the finding of concern that the flagship treatment programmes of both these ministries hardly have any reach or coverage. Only a minuscule proportion of people affected by alcohol or drug dependence report having received treatment from a NGO de-addiction centre (such as an IRCA supported by MoSJE) or a government de-addiction centre (such as those supported by the Drug De Addiction programme of MOH&FW).
National Survey on Extent and Pattern of Substance Use in India
Ministry of Social Justice and Empowerment Government of India 40
This is not surprising considering that an addiction treatment programme which is focused heavily upon inpatient treatment / hospitalisation is unlikely to cater to the huge demand for treatment. In terms of types of treatment services, focusing only on the hospitalisation (or ‘deaddiction centres’) is neither feasible nor desirable. A large proportion of people with substance use disorders can be provided help in the outpatient settings by the trained personnel.
Considering the large numbers of people who need treatment and the poor availability of treatment services, India needs massive investments in enhancing the avenues for treatment. Along with the government sector, the civil society and the non government sector needs to be roped in. To the extent possible, there should be either integration or close linkage of substance use treatment services with other general healthcare services. Enhancing treatment services as outpatient clinics, which have all the necessary components (trained human resources, infrastructure, medicines and supplies, a system of monitoring and mentoring) is urgently required. Schemes such as the “Strengthening Drug De Addiction Programme: Establishing Drug Treatment Clinics” of MoH&FW, Government
20of India need to be scaled- up . Similarly, the Scheme for Prevention of Alcoholism and Substance (Drugs) Abuse by MoSJE needs innovations aimed at delivery of efficient and effective prevention and treatment services for people affected by substance use disorders. The model of Integrated Rehabilitation Centre for Addicts (IRCA), which so far remains focused largely upon provision of residential treatment, needs to evolve to incorporate additional elements. These can be outreach (aimed at generating the treatment demand and facilitating access to services), outpatient treatment (along with provision of medicines delivered by qualified personnel), etc. Involvement of and partnership with the civil society partners, including those representing the affected communities, would be crucial. It needs to be ensured that the treatment for
substance use disorders is provided within the framework of compliance with human rights and optimum quality and ethical standards.
Considering that more than five percent of Indians suffer from alcohol use disorders and an additional substantial proportion are affected by other drug use disorders, this is clearly a major public health concern for India. Alcohol and drug use disorders are significantly disabling mental health conditions themselves as well as risk factors for many other health conditions. Other than alcohol, it is the opioid use disorders which are the next major public health challenge for many states in India. It must be noted that effective treatment of opioid use disorders requires certain specific modalities of treatment, which in-turn demand some additional resources and capacities of s e r v i c e p r o v i d e r s . L o n g - t e r m pharmacotherapy is the mainstay for treatment of opioid dependence. Due to var ious reasons ( resource c runch , inadequate capacities of service providers, a n o n - c o n d u c i v e l e g a l a n d p o l i c y environment), it has been a challenge to scale-up the availability of evidence-based
21treatment for opioid dependence in India .
Scaling-up of treatment services for substance use disorders would also require large-scale capacity building mechanisms. This would mean enhancing capacities at all the levels for the professionals from the medical, para-medical social-sciences and behavioural sciences backgrounds. Resource institutions need to be identified and mandated with implementing large-scale initiatives towards human resource development. In addition, information technology based solutions may be leveraged to enhance the efficiency of capacity building systems.
[20] Dhawan et al (2017) “Treatment of substance use disorders through the government health facilities: Developments in the “Drug De-addiction Programme” of Ministry of Health and Family Welfare, Government of India” Indian Journal of Psychiatry. DOI:10.4103/psychiatry.IndianJPsychiatry_19_17[21] Ambekar et al (2017) “Challenges in the scale-up of Opioid Substitution Treatment (OST) in India” (Guest Editorial), Indian Journal of Psychiatry;59:6-9
National Drug Dependence Treatment Centre, AIIMS, New Delhi
Magnitude of Substance Use in India
41
Overall, a coordinated, multi-stakeholder response will be necessary to scale-up treatment programmes in the country.
Evidence-based substance use prevention programmes are needed to protect the young people
Findings of this survey indicate that substance use does exist even among children and adolescents, though only in small proportions. Thus, protecting the youth of the nation is of paramount importance. Another important component of a demand-reduction based response to the drug problem is in the form of strategies aimed at prevention of initiation of substance use. Very often, prevention of d rug use i s seen (e r roneous ly ) as synonymous with spreading the awareness about dangers of drug use among young people. Evidence for effectiveness of awareness generations as the predominant preventive strategy, is very weak. Awareness programmes can play an important role in establishing substance use disorders as bio-psycho-social health conditions (and not just moral failings). Thus, enhancing the awareness in the society can be an effective tool in minimising the stigma associated with substance use and facilitating access to prevention and treatment ser vices. Research has demonstrated that best prevention strategies are those which are based on scientific evidence and which involve working with families, schools and
22communities in general . Such effective prevention strategies are aimed at not just preventing substance use, but also ensuring that children and youth grow and stay healthy and safe into adulthood, enabling them to realize their potential and become productive members of their community and society. Research has identified a large number of ‘risk factors’ contributing to initiation of substance use and development of substance use disorders.
Many of these risk factors (biological processes, personality traits, mental health disorders, family neglect, growing up in
marginalized communities, etc.) are beyond the control of the individual. Thus, prevention strategies need to address such risk factors and attempt to enhance the ‘protective factors’ (psychological and emotional well-being, family attachment, affiliation to schools and communities). It will be important for any national or state level prevention program to ensure that strategies employed are those which have strong evidence base for their effectiveness. Since, peer involvement plays an important role in influencing the risk of initiation of substance use, peer-led interventions aimed at promotion of healthier lifestyle are recommended.
A conducive legal and policy environment is needed to help control drug problems
Supply reduction approaches, i.e. those aimed at making the drugs not available to the users are very popular and receive a considerable degree of prominence in most national policies throughout the world. In India, several government agencies are mandated to enforce strict drug control laws and regulations and ensuring that violators are brought to the criminal justice system. Under the primary Indian law related to drugs (the Narcotic Drugs and Psychotropic Substances - NDPS Act 1985), a variety of narcotic and psychotropic substances have been scheduled and brought under stringent control, making their trafficking and even the personal consumption a criminal offence. Yet, as the data indicates, a wide variety of these controlled substances are being used and a sizeable number of Indians suf fer f rom the addict ion to these substances. More importantly, it appears that while the law is enforced to control the availability of ALL the controlled substances, there is a variation among substances in terms of proportion of people using them and developing addiction to them.
[22] UNODC and WHO (2018). International Standards for Prevention
of Drug Use Disorders.
[23] International Narcotics Control Board (2018). Treatment,
rehabilitation and social reintegration for drug use disorders:
essential components of drug demand reduction. Annual Report
2017. Vienna: INCB
National Survey on Extent and Pattern of Substance Use in India
Ministry of Social Justice and Empowerment Government of India 42
This is illustrated by the example of opium and heroin. Previous national survey in 2004 estimated that the number of people using heroin was less than half that of opium. Today, while the prevalence of opium use is only marginally higher, heroin is found to be used by more than twice the number of opium. Opium is lower in potency, is permitted to be cultivated legally (and hence much cheaper even in the grey market), enjoys socio-cultural acceptance in many parts of the country and is arguably less harmful than heroin. Exerting the similar degree of control over the availability of opium and heroin does not appear to have been helpful for the Indian society. Indeed, relatively easier access to some of the low-potency opium products (like doda or phukki) may even prevent the transition to use of more potent and harmful heroin.
Another illustration of challenges with relying on supply control approaches is available with the data on cannabis use. Bhang enjoys the status of a legal substance, with considerable degree of social acceptance in many parts of India. Overall, at the national level, bhang is used by a larger proportion of people as compared to ganja or charas. Yet, the prevalence of illegal cannabis products like ganja and charas surpasses that of bhang in many states. It is also interesting to note that these states – where ganja / charas use is higher than bhang – include those where bhang is legally available as well as those with no legal availability of bhang (i.e. the licensed bhang outlets). In yet another example, Sikkim is known as the state which has put in place a specific law (the Sikkim Anti-Drugs Act – SADA 2006), focused largely on c o n t r o l l i n g t h e a v a i l a b i l i t y o f pharmaceut ical drugs. This sur vey estimates that Sikkim has the highest prevalence of use of pharmaceutical products (opioids and sedatives) in the country.
Another manner in which the drug supply control potentially influences the demand
reduction (in the form of treatment of drug addiction) is the case of pharmaceutical products (like opioids and sedatives).Too s t r ingent supply contro l measures regulating availability of medications may in fact hinder the access for patients who need these products for medical reasons. Poor availability and access to controlled medications in India has been a cause for concern. Data suggests that while a sizeable number of Indians use pharmaceutical products (opioids and sedatives), only a minority among them use these medications in harmful or dependent pattern. Thus, while regulating the availability of controlled medications is important, facilitating the access to these medications for patients is also essential. It is worthwhile to note that controlled pharmaceutical drugs are required for treatment of a variety of health conditions including pain, mental illnesses and substance use disorders themselves. While non-medical, recreational use of these products remains a concern, their adequate availability for medical purpose is vital for public health.
Yet another way in which laws and policies i n f l u e n c e t h e s u b s t a n c e u s e i s criminalisation of personal consumption of drugs. Under the NDPS Act (1985), personal consumption of controlled drugs is a criminal offence. Similarly, in the states with alcohol prohibition, consumption of alcohol is a criminal act. This criminalisation of people using substances further enhances the stigma, isolation and hinders access to treatment. In the line of recommendations by International Narcotics Control Board (INCB) and many other international agencies, it is important to take necessary s teps to min imise the s t igma and discrimination, and provide health and welfare services to people affected by substance use (rather than subjecting them
23to the criminal justice system).
National Drug Dependence Treatment Centre, AIIMS, New Delhi
Magnitude of Substance Use in India
43
Overall, data from this survey indicate that there is a need of fresh thinking and innovative solutions, as far as legal and policy measures aimed at drug supply control are concerned. More importantly, there needs to be an efficient coordination between the drug supply control sector as well as the entities involved in drug demand reduction and harm reduction.
Harm reduction needs to be embraced widely as a philosophy to deal with substance use
It is well known that for various reasons, many people affected by substance use disorders are unable to lead a drug-free life. Hence, with continued drug use, they remain at risk of suffering from various adverse consequences. ‘Harm reduction’ as an approach serves to minimise the risk of harms of substance use, even when complete abstinence from drugs is not possible. Harm reduction approach has been endorsed by the Government of India through the National Narcotic Drugs and Psychotropic Substances (NDPS) Policy, 2012 and the National AIDS Prevention and Control Policy, 2002. Primarily, in India, Harm reduction has been seen as an approach to prevent HIV infection among people who inject drugs. The National AIDS Control Pr o g r a m m e i s b e i n g s u c c e s s f u l l y implemented through providing harm reduction services to PWID. However, as the data indicate, estimated numbers of PWID are much higher than are currently being covered under the programme. There is a need to scale-up the programme according to the available evidence. In addition, the scope and ambit of harm reduction needs to be expanded to cover those people who are using drugs but not through the injecting route.
For instance, under the National AIDS Control Programme, a specific intervention aimed at treatment of opioid dependence (“Opioid Substitution Treatment” – OST) is provided only to PWID. It will be necessary to u r g e n t l y s c a l e - u p O S T f o r P W I D
(considering the high numbers of PWID estimated in this report) as well for the larger population of (non-injecting) people with opioid dependence (in order to reduce the risk of them initiating injecting drug use). In general, considering the high number of people with substance use disorders in India, harm reduction philosophy needs to be embraced widely in the Indian response to the drug problems. For instance, in order to address the risk of road traffic accidents, measures aimed at prevention of driving under the influence of alcohol are needed at a large scale.
The approach of generating and utilising
scientific evidence must continue
As a comprehensive scientific approach, this survey has been a historical initiative to explore and document the dynamics of substance use in the country. Such an approach of generating evidence and making that evidence the basis of policies and programmes needs to continue. Important learning and experiences have been gained in the process of conducting this study. A large number of organisations have been capacitated and empowered to rigorously collect scientific data. All these experiences and learnings need to be distilled so that a system of data collection, analysis and generation of credible information is maintained. Subsequent surveys and studies need to be conducted with incrementally enhanced refinement of methodologies. Significant investments of human resources and efforts which have gone into planning and conducting this survey need to be utilised in an ongoing manner.
For instance, while this report provides estimates of proportion and number of people affected by drug use at the national level and identifies states where the magnitude of the problem is higher, identifying more affected districts within the state was beyond the mandate of this survey. For this purpose, state level surveys will have to be conducted, which can identify the
National Survey on Extent and Pattern of Substance Use in India
Ministry of Social Justice and Empowerment Government of India 44
priority districts within the state. In addition, it must be noted that certain specific population groups such as prison inmates, school and college students, transport workers, homeless people, sex workers, transgender people, etc., have their own unique challenges and are not adequately covered under the populations studied in this survey. Data on extent of substance use among these population will be vital. In addition, more insights on the profile of treatment providers and challenges faced by
them will be important to enhance the capacity and reach of our interventions. These remaining components of the national survey also needs to be concluded in order to generate a comprehensive picture of substance use in the country. Every piece of the data would serve to incrementally inform evidence-based policies and programmes to protect and promote the health and welfare of Indian society.
ANNEXURE – 1Data Tables for Substance categories (Current Use,
Dependence and ‘Quantum of Work’): National and by states,
10-75 year old population
National Drug Dependence Treatment Centre, AIIMS, New Delhi
Magnitude of Substance Use in India
45

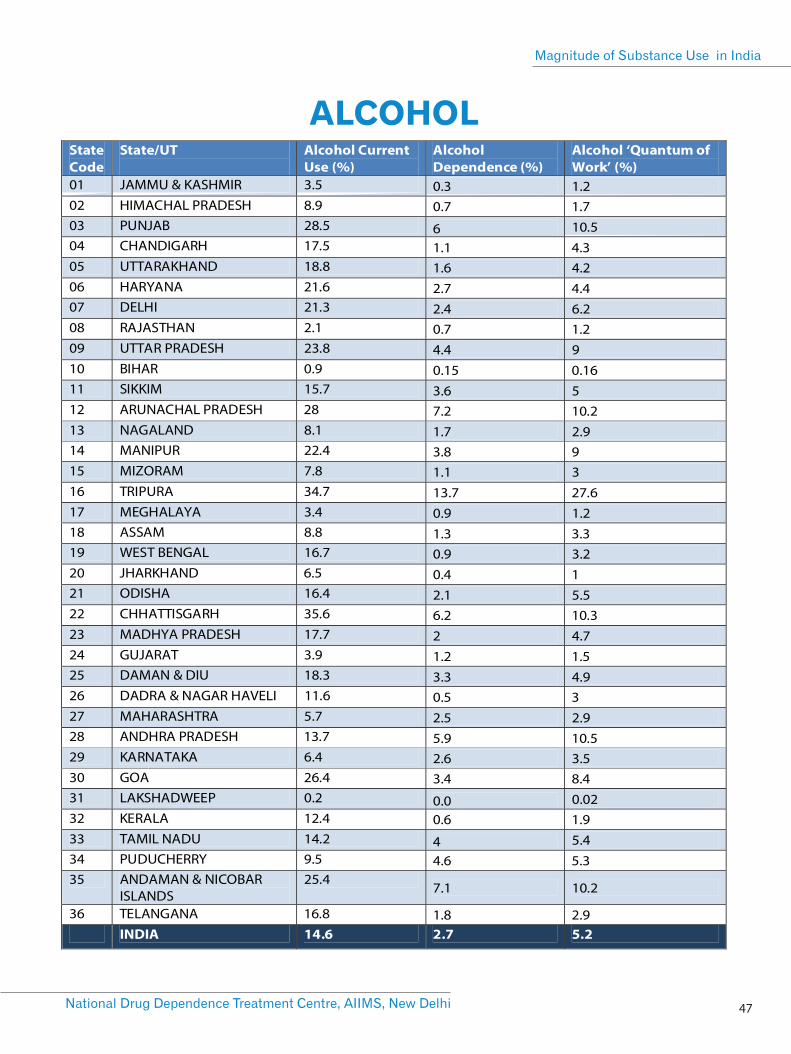
ALCOHOL
47National Drug Dependence Treatment Centre, AIIMS, New Delhi
Magnitude of Substance Use in India
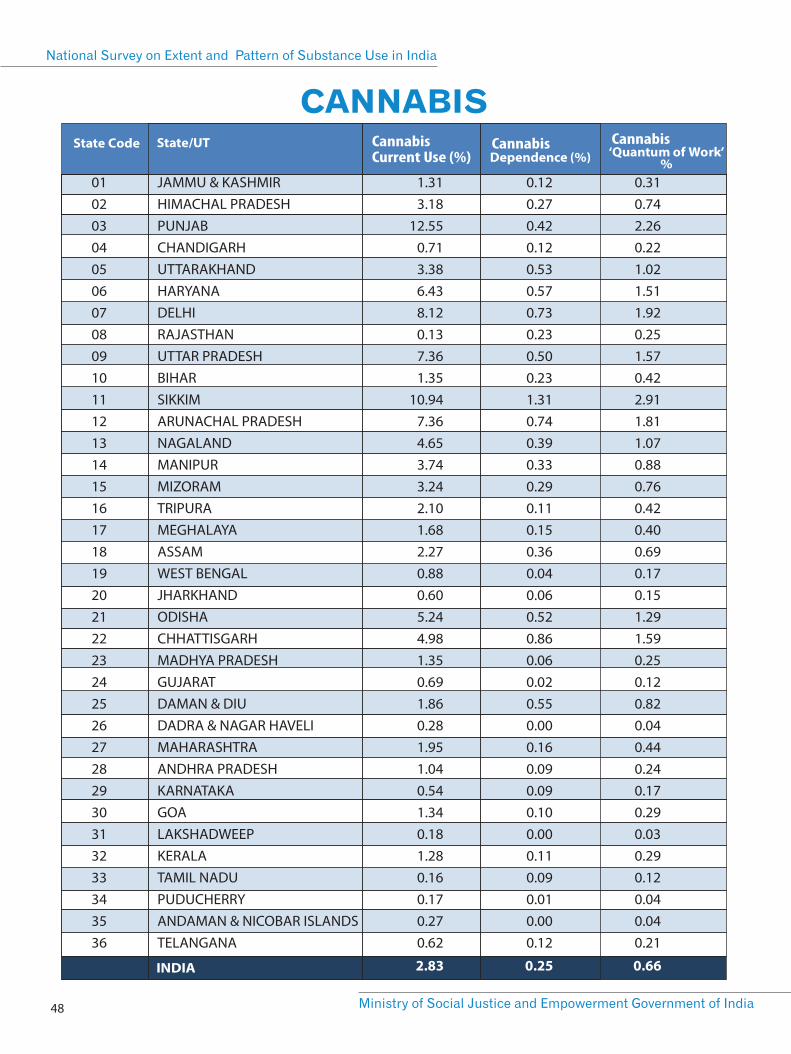
010203040506070809101112131415161718192021222324252627282930313233343536
1.313.18
12.550.713.386.438.120.137.361.35
10.947.364.653.743.242.101.682.270.880.605.244.981.350.691.860.281.951.040.541.340.181.280.160.170.270.62
0.120.270.420.120.530.570.730.230.500.231.310.740.390.330.290.110.150.360.040.060.520.860.060.020.550.000.160.090.090.100.000.110.090.010.000.12
0.310.742.260.221.021.511.920.251.570.422.911.811.070.880.760.420.400.690.170.151.291.590.250.120.820.040.440.240.170.290.030.290.120.040.040.21
JAMMU & KASHMIRHIMACHAL PRADESHPUNJABCHANDIGARHUTTARAKHANDHARYANADELHIRAJASTHANUTTAR PRADESHBIHARSIKKIMARUNACHAL PRADESHNAGALANDMANIPURMIZORAMTRIPURAMEGHALAYAASSAMWEST BENGALJHARKHANDODISHACHHATTISGARHMADHYA PRADESHGUJARATDAMAN & DIUDADRA & NAGAR HAVELIMAHARASHTRAANDHRA PRADESHKARNATAKAGOALAKSHADWEEPKERALATAMIL NADUPUDUCHERRYANDAMAN & NICOBAR ISLANDSTELANGANA
Cannabis CannabisCannabis Current Use (%)
2.83 0.25 0.66
National Survey on Extent and Pattern of Substance Use in India
Ministry of Social Justice and Empowerment Government of India 48
CANNABIS
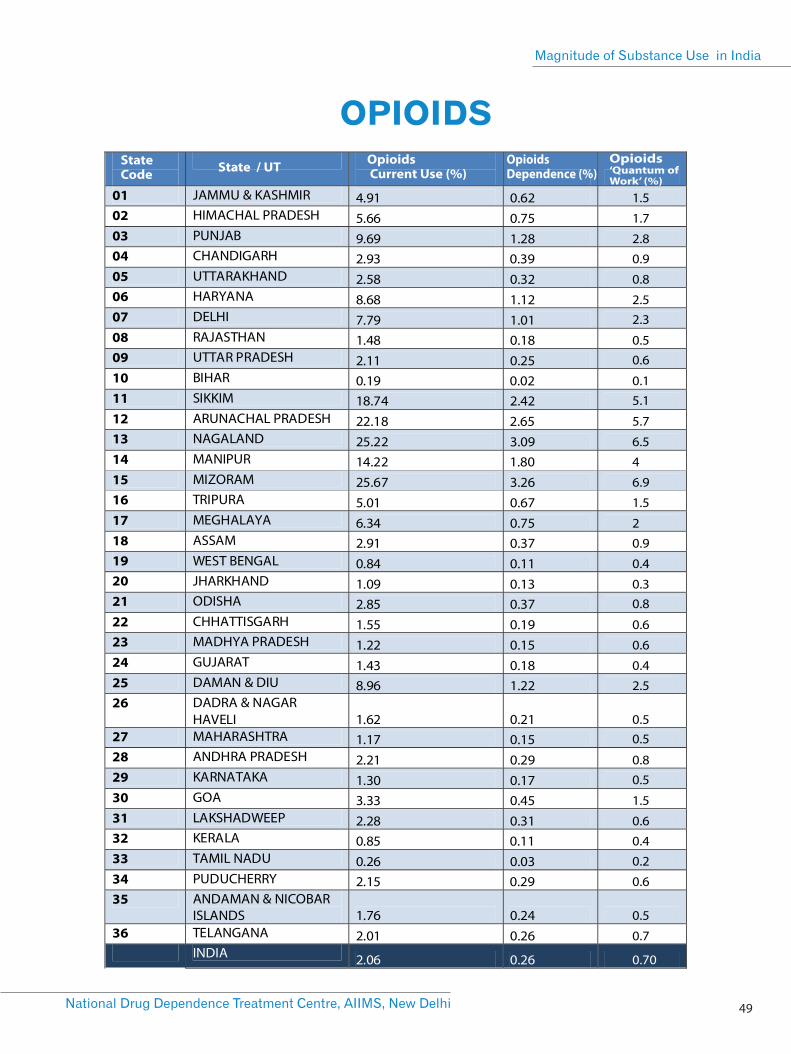
State Code State / UT Opioids
Current Use (%) OpioidsDependence (%)
Opioids‘Quantum of Work’ (%)
1.5
1.7
2.8
0.9
0.8
2.52.3
0.50.6
0.15.1
5.7
6.5
4
6.9
1.5
2
0.9
0.4
0.30.8
0.6
0.6
0.4
2.5
0.50.5
0.80.5
1.5
0.6
0.4
0.2
0.6
0.5
0.7
0.70
OPIOIDS
49National Drug Dependence Treatment Centre, AIIMS, New Delhi
Magnitude of Substance Use in India
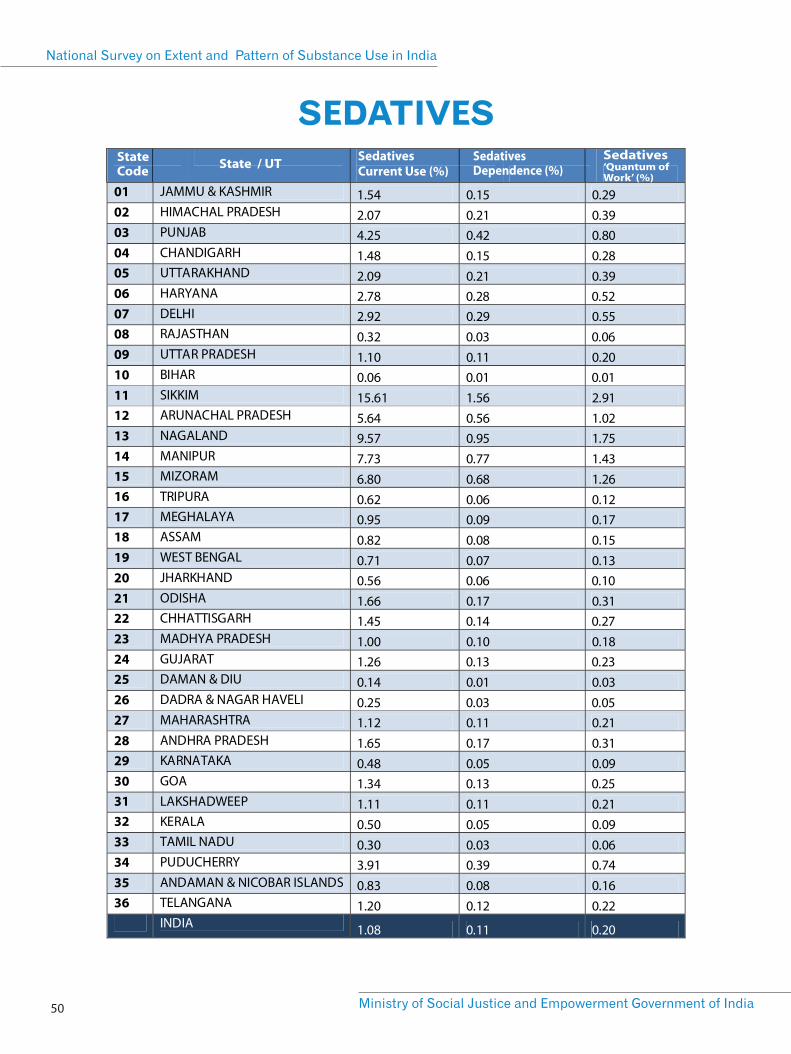
State Code State / UT Sedatives
Current Use (%) SedativesDependence (%)
Sedatives‘Quantum of Work’ (%)
SEDATIVES
National Survey on Extent and Pattern of Substance Use in India
Ministry of Social Justice and Empowerment Government of India 50
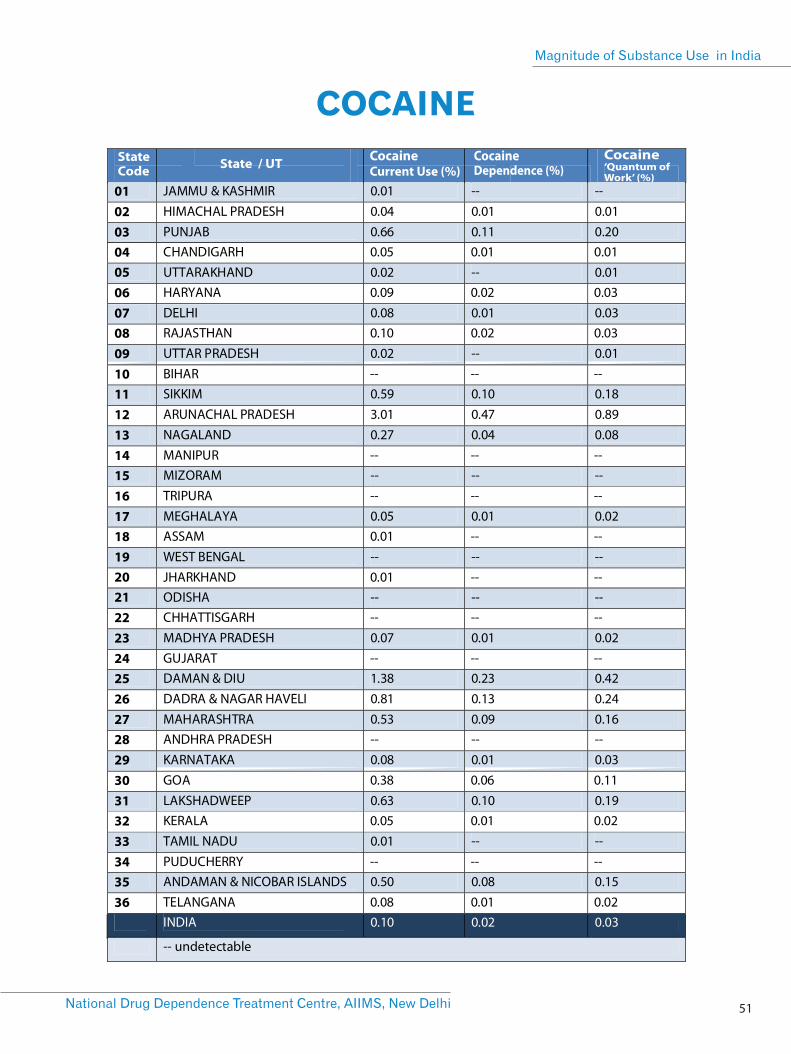
COCAINE
State Code State / UT Cocaine
Current Use (%) CocaineDependence (%)
Cocaine‘Quantum of Work’ (%)
51National Drug Dependence Treatment Centre, AIIMS, New Delhi
Magnitude of Substance Use in India
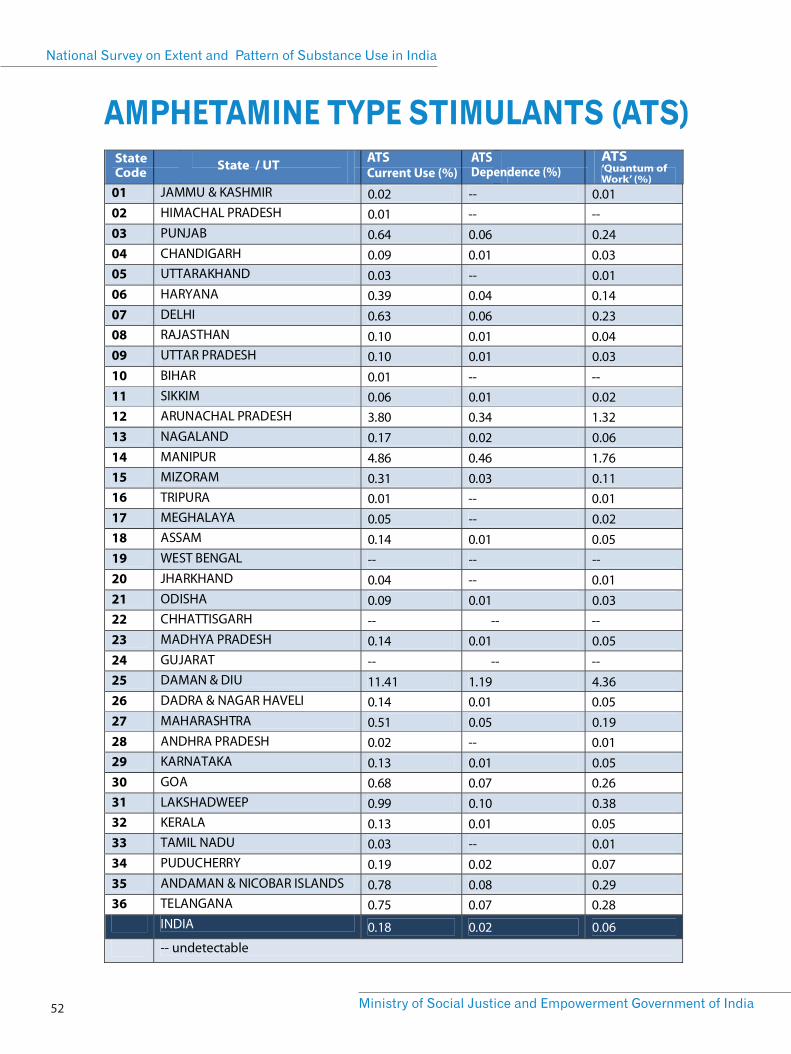
AMPHETAMINE TYPE STIMULANTS (ATS)State Code State / UT ATS
Current Use (%) ATSDependence (%)
ATS‘Quantum of Work’ (%)
National Survey on Extent and Pattern of Substance Use in India
Ministry of Social Justice and Empowerment Government of India 52
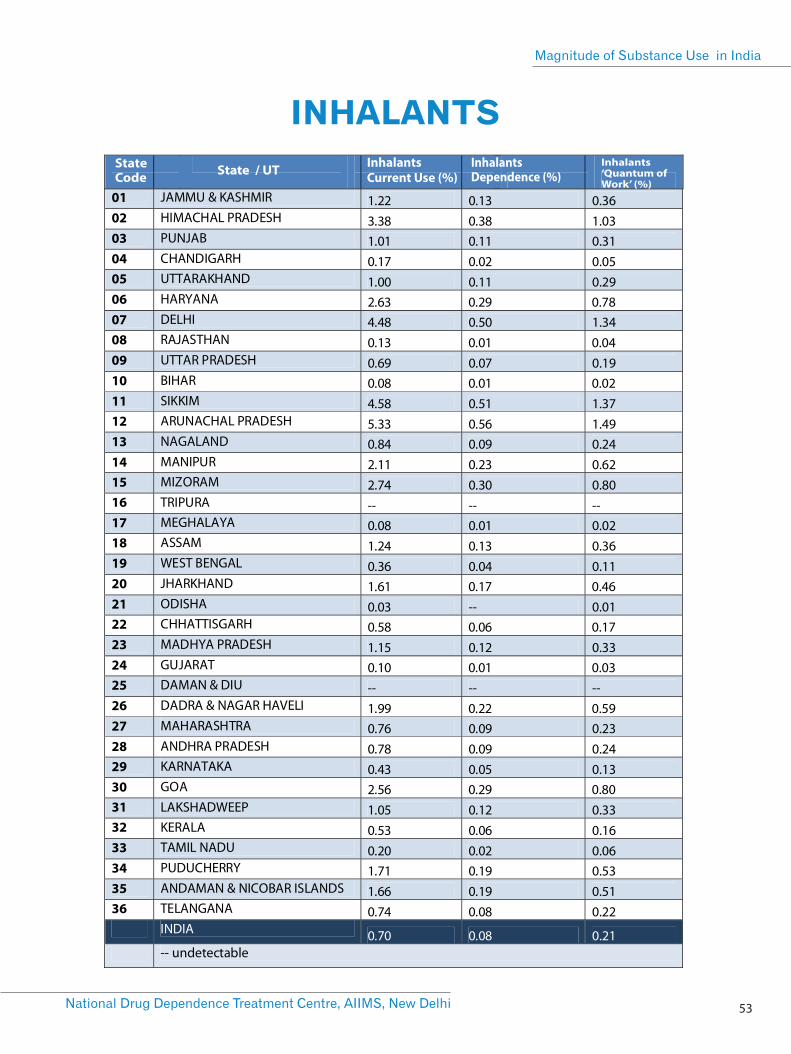
INHALANTS
State Code State / UT Inhalants
Current Use (%) InhalantsDependence (%)
Inhalants‘Quantum of Work’ (%)
53National Drug Dependence Treatment Centre, AIIMS, New Delhi
Magnitude of Substance Use in India
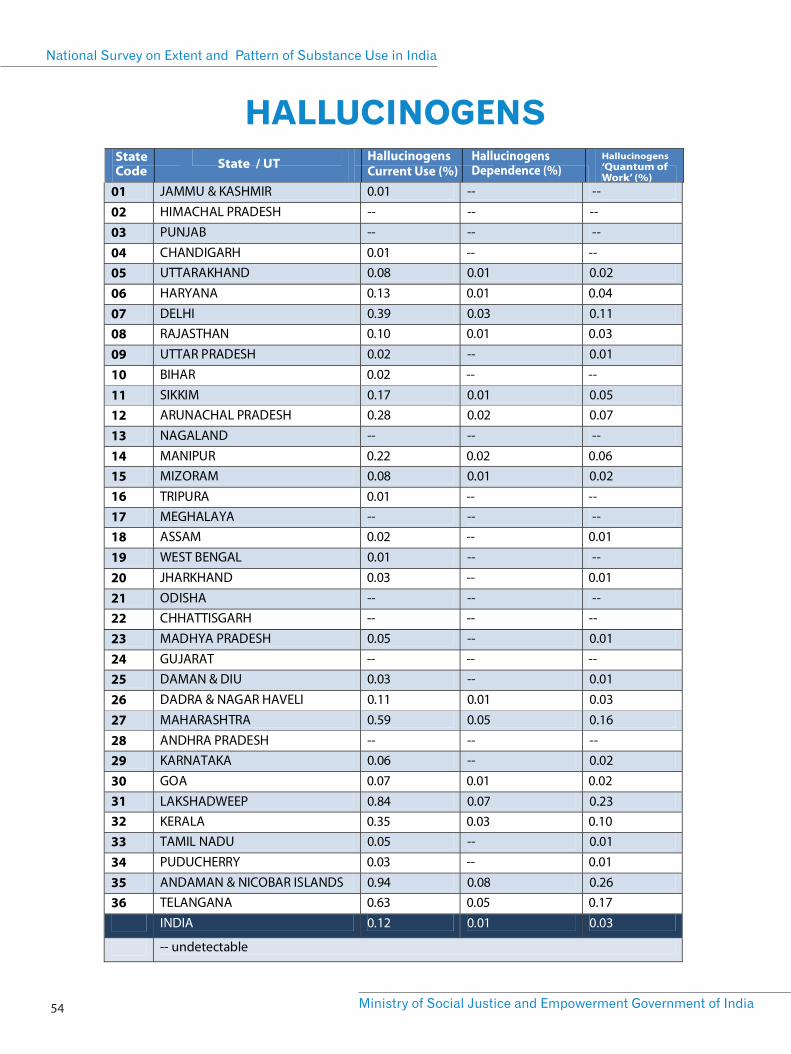
HALLUCINOGENSState Code State / UT Hallucinogens
Current Use (%) HallucinogensDependence (%)
Hallucinogens‘Quantum of Work’ (%)
National Survey on Extent and Pattern of Substance Use in India
Ministry of Social Justice and Empowerment Government of India 54
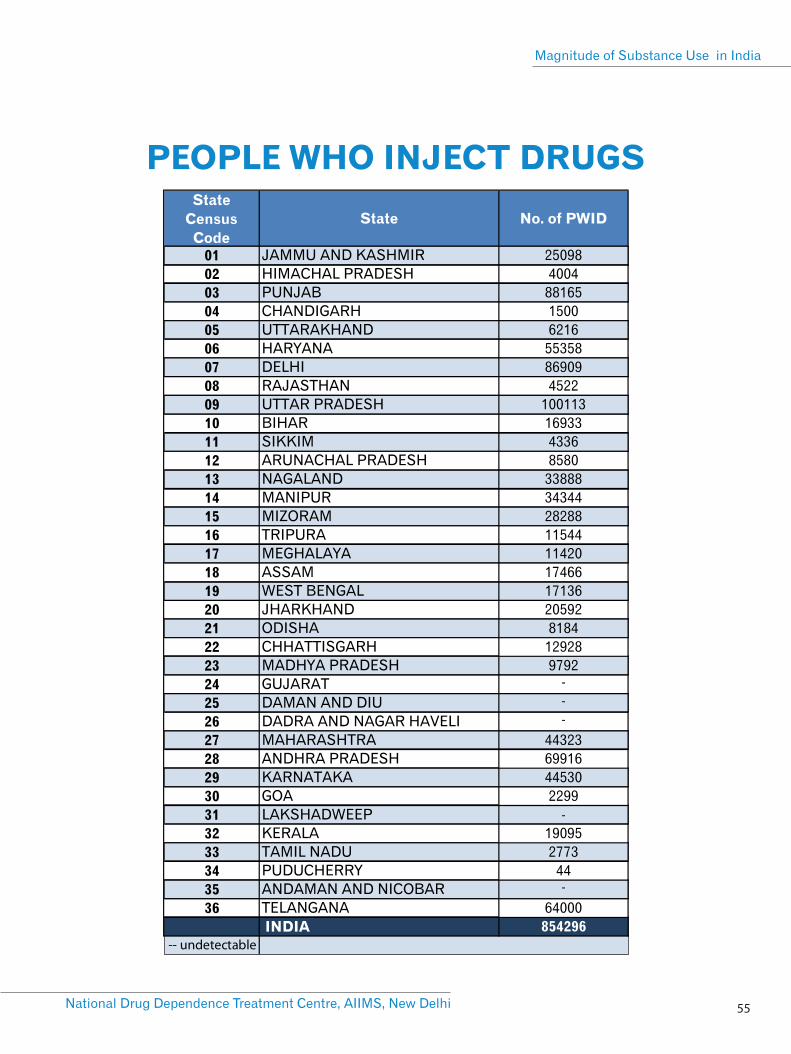
PEOPLE WHO INJECT DRUGS
National Drug Dependence Treatment Centre, AIIMS, New Delhi
Magnitude of Substance Use in India
55

ANNEXURE – 2Key Organizations and
Individuals Behind the Survey
57National Drug Dependence Treatment Centre, AIIMS, New Delhi
Magnitude of Substance Use in India
BEHIND THE SURVEY
Dr. R. Rina Project Director, ArunachalSACS, Department of Health Services
National Survey on Extent and Pattern of Substance Use in India
Ministry of Social Justice and Empowerment Government of India 58
KEY GOVERNMENT OFFICERS
LIST OF STATE NODAL OFFICERS
59National Drug Dependence Treatment Centre, AIIMS, New Delhi
Magnitude of Substance Use in India

Mr. K. Bono Singh Deputy Secretary, Departmentof Social Welfare
Ms. K. Saroja Devi Deputy Director, Departmentof Social Welfare
Dr. Keninguzo Dzuvichu Joint Director, NagalandSACS, Directorate of Healthand Family Welfare
National Survey on Extent and Pattern of Substance Use in India
Ministry of Social Justice and Empowerment Government of India 60
REGIONAL INVESTIGATORS FROM THE REGIONAL TECHNICAL AGENCIES
61National Drug Dependence Treatment Centre, AIIMS, New Delhi
Magnitude of Substance Use in India
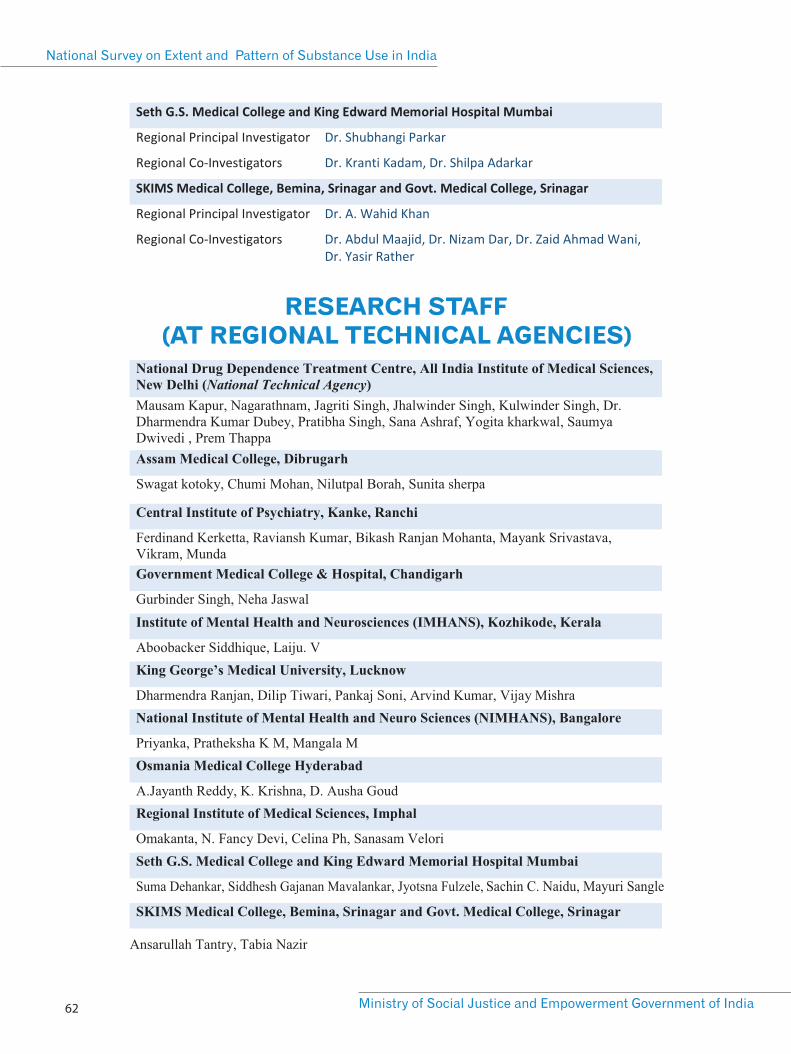
Sachin C. Naidu, Mayuri Sangle
RESEARCH STAFF (AT REGIONAL TECHNICAL AGENCIES)
National Survey on Extent and Pattern of Substance Use in India
Ministry of Social Justice and Empowerment Government of India 62
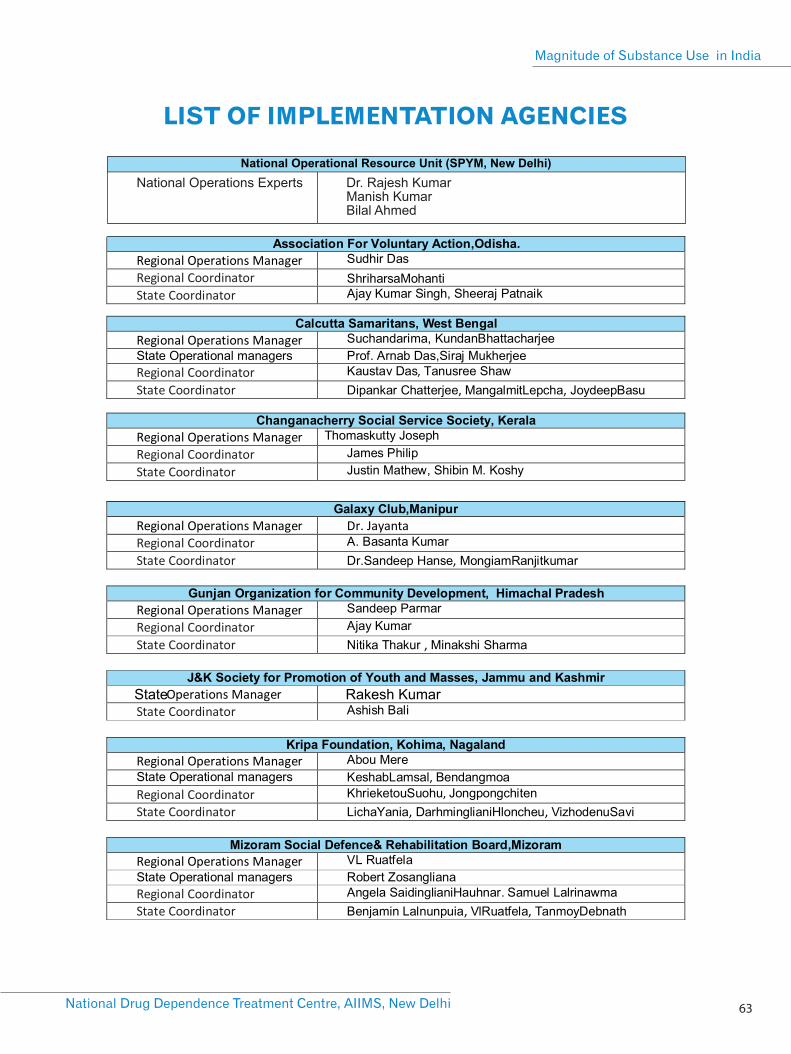

ANNEXURE – 3Description of Survey Sample
65National Drug Dependence Treatment Centre, AIIMS, New Delhi
Magnitude of Substance Use in India
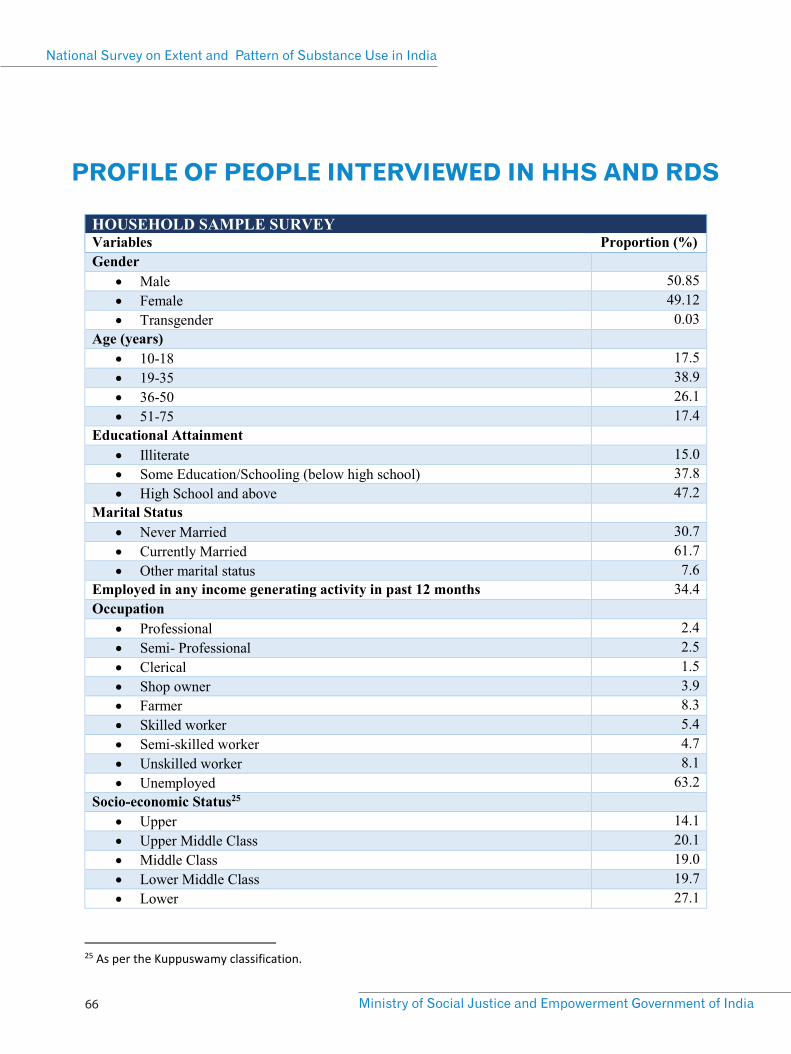
PROFILE OF PEOPLE INTERVIEWED IN HHS AND RDS
National Survey on Extent and Pattern of Substance Use in India
Ministry of Social Justice and Empowerment Government of India 66
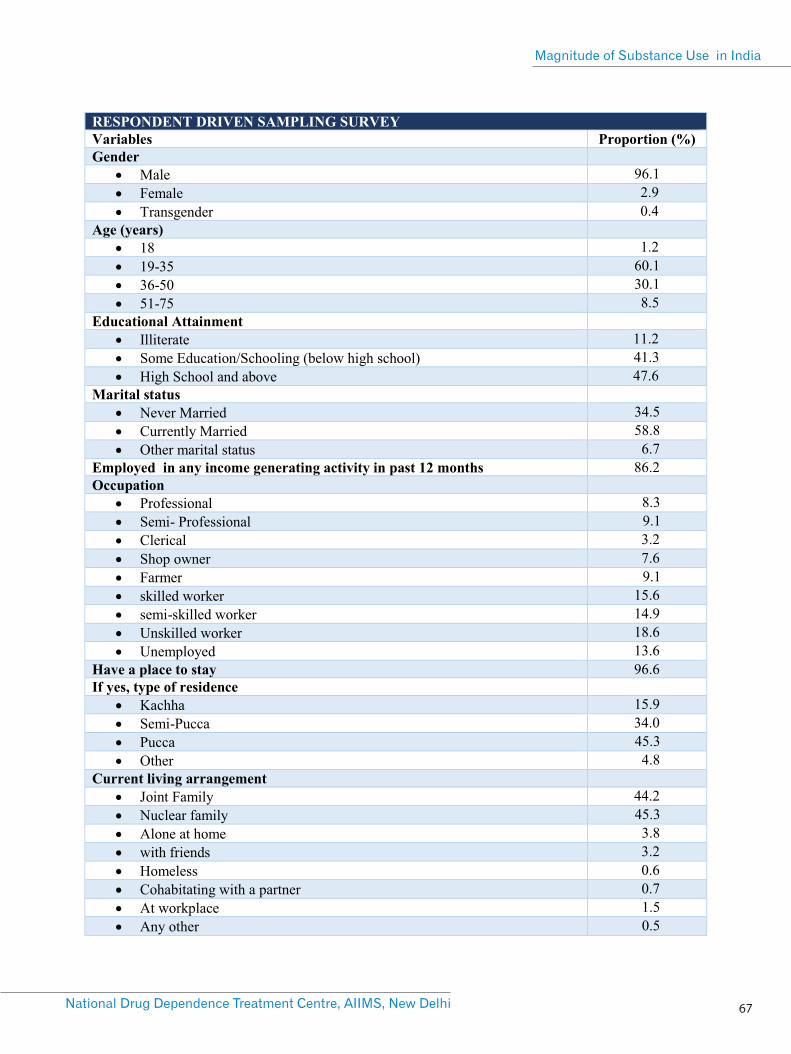
67National Drug Dependence Treatment Centre, AIIMS, New Delhi
Magnitude of Substance Use in India


Ministry of Social Justice and Empowerment Government of India
Shastri Bhawan, New Delhi-110001, INDIA
CGO Complex, Kamla Nehru Nagar, Ghaziabad-201002 (UP), INDIA
National Drug Dependence Treatment Centre (NDDTC), (AIIMS, New Delhi)