Substance Use among a Sample of Healthcare Workers in Kenya: A ...
11
Full Terms & Conditions of access and use can be found at http://www.tandfonline.com/action/journalInformation?journalCode=ujpd20 Journal of Psychoactive Drugs ISSN: 0279-1072 (Print) 2159-9777 (Online) Journal homepage: http://www.tandfonline.com/loi/ujpd20 Substance Use among a Sample of Healthcare Workers in Kenya: A Cross-Sectional Study Aggrey G. Mokaya, Victoria Mutiso, Abednego Musau, Albert Tele, Yeri Kombe, Zipporah Ng’ang’a, Erica Frank, David M. Ndetei & Veronic Clair To cite this article: Aggrey G. Mokaya, Victoria Mutiso, Abednego Musau, Albert Tele, Yeri Kombe, Zipporah Ng’ang’a, Erica Frank, David M. Ndetei & Veronic Clair (2016) Substance Use among a Sample of Healthcare Workers in Kenya: A Cross-Sectional Study, Journal of Psychoactive Drugs, 48:4, 310-319, DOI: 10.1080/02791072.2016.1211352 To link to this article: https://doi.org/10.1080/02791072.2016.1211352 Published with licence by Taylor & Francis.© 2016 Aggrey G. Mokaya, Victoria Mustiso, Abednego Musau, Albert Tele, Yeri Kombe, Zipporah Ng’ang’a, Erica Frank, David M. Ndetei, and Veronic Clair. Published online: 02 Aug 2016. Submit your article to this journal Article views: 725 View related articles View Crossmark data Citing articles: 1 View citing articles
-
Upload
khangminh22 -
Category
Documents
-
view
5 -
download
0
Transcript of Substance Use among a Sample of Healthcare Workers in Kenya: A ...
Full Terms & Conditions of access and use can be found athttp://www.tandfonline.com/action/journalInformation?journalCode=ujpd20
Journal of Psychoactive Drugs
ISSN: 0279-1072 (Print) 2159-9777 (Online) Journal homepage: http://www.tandfonline.com/loi/ujpd20
Substance Use among a Sample of HealthcareWorkers in Kenya: A Cross-Sectional Study
Aggrey G. Mokaya, Victoria Mutiso, Abednego Musau, Albert Tele, YeriKombe, Zipporah Ng’ang’a, Erica Frank, David M. Ndetei & Veronic Clair
To cite this article: Aggrey G. Mokaya, Victoria Mutiso, Abednego Musau, Albert Tele, YeriKombe, Zipporah Ng’ang’a, Erica Frank, David M. Ndetei & Veronic Clair (2016) SubstanceUse among a Sample of Healthcare Workers in Kenya: A Cross-Sectional Study, Journal ofPsychoactive Drugs, 48:4, 310-319, DOI: 10.1080/02791072.2016.1211352
To link to this article: https://doi.org/10.1080/02791072.2016.1211352
Published with licence by Taylor & Francis.©2016 Aggrey G. Mokaya, Victoria Mustiso,Abednego Musau, Albert Tele, Yeri Kombe,Zipporah Ng’ang’a, Erica Frank, David M.Ndetei, and Veronic Clair.
Published online: 02 Aug 2016.
Submit your article to this journal Article views: 725
View related articles View Crossmark data
Citing articles: 1 View citing articles
Substance Use among a Sample of Healthcare Workers in Kenya: ACross-Sectional StudyAggrey G. Mokaya, B.Sc., PGDip. a,b, Victoria Mutiso, B.A., M.Sc., Ph.D.c, Abednego Musau, M.B.Ch.B., M.P.H.d,Albert Tele, B.Sc., M.Sce, Yeri Kombe, M.B.Ch.B., M.P.H., Ph.D.f, Zipporah Ng’ang’a, B.Sc., M.Sc., Ph.D.g, Erica Frank,M.D., M.P.H.h,i, David M. Ndetei, M.B.Ch.B., D.P.M., M.R.C.Psych., F.R.C.Psych., M.D., D.Sc.j,k, and Veronic Clair, M.D.,M.Sc., C.C.F.P., F.R.C.P.C., Ph.D. l,m
aMaster Student, College of Health Sciences, Jomo Kenyatta University of Agriculture and Technology, Juja, Kenya; bMaster Student, KenyaMedical Research Institute, Centre for Public Health Research, Nairobi, Kenya; cDirector, Research Administration and Finance, Africa MentalHealth Foundation, Nairobi, Kenya; dResearch Officer, Africa Mental Health Foundation, Nairobi, Kenya; eStatistician, Africa Mental HealthFoundation, Nairobi, Kenya; fChief Research Officer, Kenya Medical Research Institute, Centre for Public Health Research, Nairobi, Kenya;gDeputy Vice Chancellor (Academic, Research and Student Affairs), South Eastern Kenya University, Kitui, Kenya; hProfessor and CanadaResearch Chair, University of British Columbia, Vancouver, BC, Canada; iFounder and President, NextGenU.org, Clear Lake, WA, USA;jFounding Director, Africa Mental Health Foundation, Nairobi, Kenya; kProfessor of Psychiatry, University of Nairobi, Nairobi, Kenya; lCo-PIeDATA K NextGenU.org, Vancouver, BC, Canada and Senior Scientist, Africa Mental Health Foundation, Nairobi, Kenya; mClinical Faculty,Faculty of Medicine, University of British Columbia, Vancouver, BC, Canada
ABSTRACTThis study describes reported substance use among Kenyan healthcare workers (HCWs), as it hasimplications for HCWs’ health, productivity, and their ability and likelihood to intervene on substanceuse. The Alcohol Smoking and Substance Involvement Screening Test (ASSIST) was administered to aconvenience sample ofHCWs (n=206) in 15health facilities. Reported lifetimeusewas 35.8% for alcohol,23.5% for tobacco, 9.3% for cannabis, 9.3% for sedatives, 8.8% for cocaine, 6.4% for amphetamine-likestimulants, 5.4% for hallucinogens, 3.4% for inhalants, and 3.9% for opioids. Tobacco and alcohol werealso the two most commonly used substances in the previous three months. Male gender and othersubstance use were key predictors of both lifetime and previous three months’ use rates. HCWs’substance use rates appear generally higher than those seen in the general population in Kenya, thoughlower than those reported among many HCWs globally. This pattern of use has implications for bothHCWs and their clients.
ARTICLE HISTORYReceived 6 April 2016Revised 20 May 2016Accepted 9 June 2016
KEYWORDSAlcohol; cannabis; healthworker; prevalence;substance use; tobacco
There has been a recent marked increase in the prevalenceof substance use disorders (SUDs) around the world(Whiteford et al. 2013). Between 1990 and 2010, there wasan increase of 37.6% in the global burden of diseases frommental health and SUDs (Whiteford et al. 2013). Using arisk factors approach to the Global Burden of Diseases(GBD), the proportion of the total GBD attributable tospecific SUD has increased by 57% for illicit drug use(cannabis, opioids, amphetamines, and injection druguse), 32% for alcohol use, and 3% for tobacco use (Limet al. 2012). Although the GBD for tobacco did not increasemuch since 1990, in 2010, tobacco use (including secondhand smoke) was the second most important risk factordriving theGBD, surpassed only by hypertension (Limet al.2012). It is projected that, by the year 2020, global tobacco-attributable mortality will be 10% (Mathers and Loncar2006), noteworthy as the highest smoking prevalence is
among men in low- and middle-income countries(LMICs) (Alwan 2011). Furthermore, alcohol ranked fifthamong the risk factors driving the GBD (Lim et al. 2012),with about 6% of deaths worldwide directly resulting fromalcohol consumption (Mendis et al. 2014); in LMICs likeKenya, the availability of cheap, homemade brews propa-gates unregulated alcohol use and is especially risky as theyregularly contain toxic levels of methanol (Lo et al. 2013).
Psychoactive substance use exists in all spheres ofsociety (Wu 2010), including among healthcare work-ers (Kenna and Lewis 2008). Tobacco and alcohol useamong clinicians is of particular concern, as it leads tolower rates of counseling and intervention for thesesubstances (Frank 2007; Frank, Breyan, and Elon2000; Oberg and Frank 2009). This is important asbrief counseling interventions for the management ofsubstance use around the world are effective and of low
CONTACT Veronic Clair [email protected] School of Population and Public Health, Faculty of Medicine, University of British Columbia, 2206 E. Mall,Vancouver, BC V6T 1Z9, Canada.Color versions of one or more of the figures in the article can be found online at www.tandfonline.com/UJPD.
JOURNAL OF PSYCHOACTIVE DRUGS2016, VOL. 48, NO. 4, 310–319http://dx.doi.org/10.1080/02791072.2016.1211352
© 2016 Aggrey G. Mokaya, Victoria Mustiso, Abednego Musau, Albert Tele, Yeri Kombe, Zipporah Ng’ang’a, Erica Frank, David M. Ndetei, and Veronic Clair. Published with licence byTaylor & Francis.This is an Open Access article distributed under the terms of the Creative Commons Attribution-NonCommercial-NoDerivatives License (http://creativecommons.org/licenses/by-nc-nd/4.0/),which permits non-commercial re-use, distribution, and reproduction in any medium, provided the original work is properly cited, and is not altered, transformed, or built upon in any way.
cost (Barrowclough et al. 2001; Dutra et al. 2008), andamong the few interventions recommended by theWHO as part of the Mental Health Global ActionPlan (WHO 2010b). Furthermore, HCWs’ substancemisuse decreases productivity and increases absentee-ism (McFarlin and Fals-Stewart 2002), which is ofparticular concern in LMICs where human resourcesto provide health services are scarce (WHO et al. 2006).
Alcohol and other psychoactive substances are used inboth urban and rural areas of Kenya (Atwoli et al. 2011;Shaffer et al. 2004), with current use among 15- to 65-year-olds of alcohol, tobacco, and cannabis being 13.6%, 9.1%,and 1.0%, respectively (NACADA2012). Current use of theKhat or Miraa plant (which produces an amphetamine-type effect when chewed) is estimated at 4.2% in Kenya(NACADA 2012), and is used in other parts of Africa andEurope as well (EMCDDA2011). NACADAdata in Kenyaindicate that the rate of current use of most substancesdecreased somewhat between 2007 and 2012 (NACADA2012). However, a recent case study ofmajor urban areas inKenya points to increasing use of different types of sub-stances, such as Shisha (water pipe smoking) and Kuber(chewing tobacco) (NACADA 2014). Another concern isthe young age atwhich substance use is initiated,withmanyKenyan youth experimenting with illicit drugs while theyare still in primary or secondary school (Kuria 1996). This isa phenomenon also seen in the larger sub-Saharan region,and a serious cause for concern (Gore et al. 2011).
While there are limited studies providing data onphysicians’ or other HCWs’ substance use, both glob-ally and in Kenya, existing data from high-incomecountries indicate that alcohol and some substanceuse rates frequently match or exceed those seen inthe population (Baldisseri 2007; Gastfriend 2005).This is contrary to the expectation of some that phy-sicians’ and healthcare workers’ knowledge of thenegative health and social consequences of alcoholand substance abuse would reduce use (Kenna andLewis 2008). Alternatively, an understanding of thesocial context and indication of some likely positivehealth effects of moderate alcohol use, or the negativestresses arising from high workload and from work-lifebalance issues, may promote substance use and abuseamong healthcare workers (Kenna and Lewis 2008;Trinkoff and Storr 1998).
Considering the increasing morbidity and mortalitycaused by alcohol, tobacco, and other substance usedisorders worldwide, the impact of HCWs’ personalsubstance use on their delivery of SUDs-related clinicalinterventions, and the impact on HCWs’ productivityand absenteeism, it is important to understand the pre-valence of SUDs in healthcare workers. It is especially
critical in LMICs, particularly in Kenya, where there arecurrently scant available data. This study sought todescribe substance use rates and factors associated withsubstance use among Kenyan HCWs.
Methods
The study is nested within the Computer-based Drug andAlcohol Training and Assessment in Kenya (eDATA K).eDATA K is a research program of the Africa MentalHealth Foundation and NextGenU.org (the only providerof globally free, accredited, higher education courses), andfunded by Grand Challenges Canada and the AnnenbergPhysician Training Program in Addiction Medicine. Thegoals of eDATA K are to (1) assess the impact of onlinelearning related to alcohol, tobacco, and other substanceuse disorders on Kenyan primary HCWs, and on thepatients attended by these HCWs; and (2) understand thefactors that may influence the impact of these onlinecourses. It is this second goal that prompted this study onsubstance use habits of HCWs.
Ethical approval was granted by the Kenya MedicalResearch Institute Ethics Review Committee and theUniversity of British Columbia Research Ethics Board.The study was carried out from July to September 2014,with verbal and written consent received prior to datacollection. Questionnaires were serialized, for anonym-ity, before being distributed to respondents who com-pleted and returned them within half a day.
Participants
The study was carried out at 15 facilities: 11 public primarycare outpatient clinics in Machakos and MakueniCounties, three private outpatient clinics in Nairobi, andone in Machakos. These facilities were selected for eDATAK based on the following criteria: (1) being a typical facilityoffering primary care services; (2) staff expressing an inter-est in the training program; (3) having electricity; and (4)being part of participating eDATA K counties or privatehealthcare institutions.
All HCWs in the selected facilities’ outpatient ser-vices were invited to participate in the eDATA Ksurvey. The minimum sample size requirement toassess the impact of online training on knowledge,skills, and attitudes towards SUDs for HCWs in thelarger eDATA K study was 120. A total of 236 HCWsexpressed interest in participating in eDATA K, ofwhich 87.3% (206) completed the survey on theirsubstance use. In small, private clinics, public healthcenters, and dispensaries, at least 80% of staff partici-pated in this study on the prevalence of various
JOURNAL OF PSYCHOACTIVE DRUGS 311
substance use; in larger facilities (county and sub-county hospitals outpatients departments), 50–75%of outpatient staff participated.
Measures
In a cross-sectional design, respondents were asked tocomplete the WHO’s Alcohol, Smoking, and SubstanceInvolvement Screening Test (ASSIST). The ASSIST collectsinformation on, and determines levels of risk from, the useof tobacco products, alcohol, cannabis, amphetamine-typestimulants, cocaine, sedatives and sleeping pills, hallucino-gens, opioids, and “other” drugs (Humeniuk et al. 2010).The survey takes about five minutes to complete and hasbeen validated for use in LMICs (Humeniuk and Ali 2006).Each substance is the object of eight questions to establishits lifetime use (Question 1); frequency of use in the pastthree months (Question 2); frequency of experiencing astrong desire or urge to use each substance in the lastthree months (Question 3); frequency of health, social,legal, or financial problems related to substance use in thelast three months (Question 4); frequency with which useof each substance has interfered with roles or responsibil-ities in the past threemonths (Question 5); whether anyonehas ever expressed concern about the respondent’s use ofeach substance, and how recently that occurred (Question6); whether the respondent has ever tried to cut down orstop the use of a substance, and failed in that attempt, andhow recently that occurred (Question 7); and whether therespondent has ever injected a substance, and how recentlythat occurred (Question 8).
Responses to questions 2 through 7 of the ASSISTgenerated a score indicating the level of risk associatedwith the respondent’s use of each category of substance.Risk was classified as: low risk (0 to 10 for alcohol, and0 to 3 for all other substances); moderate risk (11 to 26for alcohol, and 4 to 26 for the other substances); andhigh risk (27 and above) (Humeniuk et al. 2010).
To adapt the survey to Kenya and to enable the respon-dents to properly understand the various categories ofsubstances covered by the ASSIST, examples of substancesand their local or colloquial names were included; e.g.,amphetamine-type stimulants (miraa/mairungi, khat, kan-geta, muguka, katepa, kirembe, mafuta, giza, majani, veve,uppers, pep pills, bennies, speed, ecstasy). A survey of socio-demographic information was also included. The question-naires were administered in English.
Data management and statistical analysis
All data were double-entered and assessed for quality andoutliers. Data analyses were undertaken using IBM SPSS®Version 21. The first analytic stage established the basic
descriptive statistics (means and standard deviationsfor numerical variables and frequencies for nominaland ordinal variables). For tobacco, alcohol, cannabis,and cocaine, the four most prevalent substances used inthe last three months, logistic regression models wereused to assess the association and odds ratios betweenthe use of a given substance and the use of the othersubstances, as well as associations with the variousavailable socio-demographic factors. To minimize theexclusion of cases from missing answers to surveyquestions, we performed regression analyses on theoriginal and a multiple imputation data set, and theregression analysis presents the results of the fifth andlast iteration.
Dependent variables were lifetime use and pre-vious three months’ use. Lifetime use was definedas an affirmative response to Question 1 of theASSIST: “In your life which of the following substanceshave you ever used (non-medical use only)?” Previousthree months’ use was derived from the followingquestion: “In the past 3 months, how often have youused the substances you mentioned?” with responsescoded to include all respondents who used a givensubstance at least once in that time period.Independent variables were age, a socioeconomic sta-tus (SES) index based on ownership of assets (mobilephone, bicycle, motorbike, car), facility type (privateoutpatient clinic, public health center, public hospitaloutpatient clinic), region (Nairobi, Machakos,Makueni), occupation (clinician, non-clinician), gen-der (male, female), education (secondary school, cer-tificate, diploma, degree), and marital status (marriedand non-married—a combination of single, cohabit-ing, divorced/separated, or widow/widower).
Multivariate models included variables significantlyassociated with consumption at the bivariate level for atleast one of the substance use of interest, as well as demo-graphic variables typically associated with substance use(age, gender, education, and SES), and absent correla-tions >0.4 (an indicator of collinearity) between includedvariables (from Spearman’s rank-order correlation co-effi-cient (rs)) (Dawson and Trapp 2004; Tu et al. 2005).Unadjusted odds ratios (OR) and adjusted odds ratios(AOR) with 95% confidence intervals were estimatedfrom the logistic regression models. The level of statisticalsignificance was set at p ≤ 0.05, and all tests were two-sided.
Results
Demographic characteristics
Of the 206 respondents, nurses, clinical officers (thosewith a Diploma in Medicine, enabling them to practiceat a level similar to nurse practitioners or physician
312 A. G. MOKAYA ET AL.
assistants in other countries), and medical doctors werecategorized as clinicians (45.1%), with all other cadresof staff categorized as non-clinicians (54.9%), includingcommunity health workers, laboratory technicians,receptionists, and other support staff. Clinicians wereeducated to certificate (32.6%), diploma (35.9%), andundergraduate degree (31.5%) levels. Slightly more thanhalf of non-clinicians held certificates (55.6%), 4.6%held diplomas, 10.2% had undergraduate degrees, and29.6% had only a secondary school education. Three-quarters (75.7%) of respondents were working in public(government-owned) facilities; the remainder workedin private facilities. The majority (63.1%) of respon-dents were female. The mean age was 35.3 years(SD = 10.1), with a range of 20 to 58 years.
Almost all (97.6%) respondents indicated that theywere Christian, with the rest reporting that they wereBuddhist (1.5%) or Muslim (1.0%). Most respondents(87.6%) worked full-time and, of those who workedpart-time, 73% said they also ran a business on theside. Almost all respondents (95.9%) reported owninga mobile phone, while only 9.8% owned a motor vehi-cle. Two-thirds (67.3%) indicated that they were mar-ried, and most of the remainder were single (29.3%).
Healthcare workers’ substance use rates
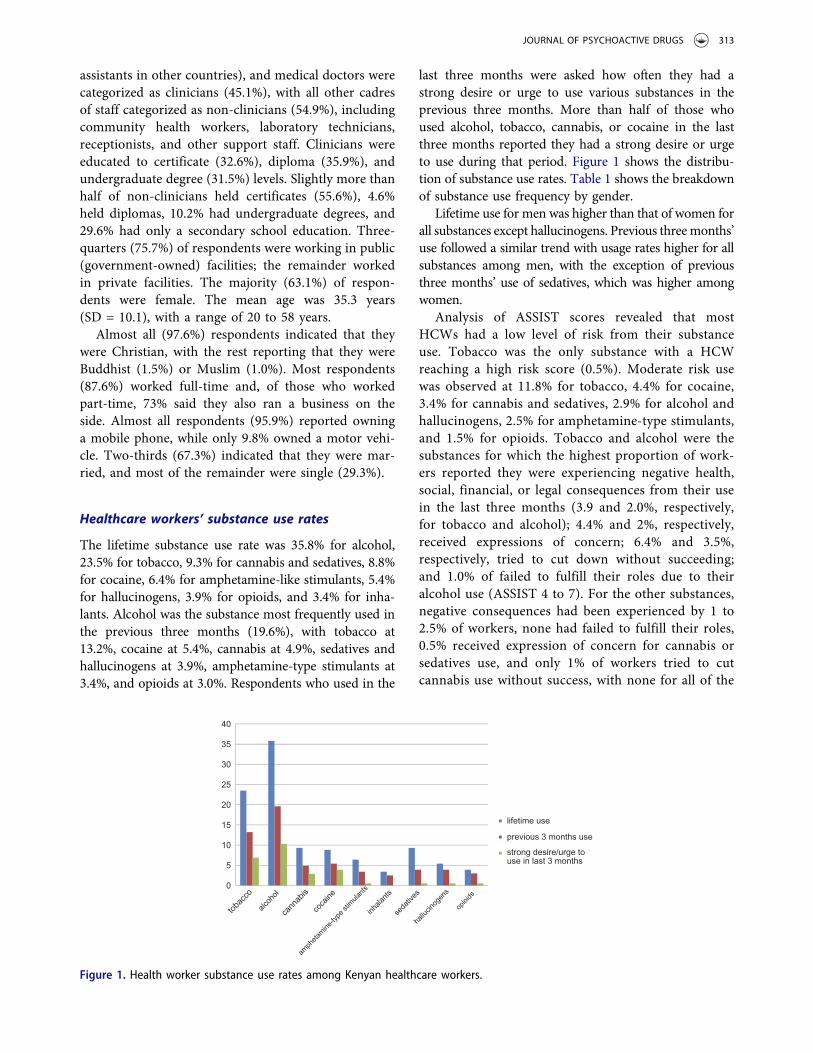
The lifetime substance use rate was 35.8% for alcohol,23.5% for tobacco, 9.3% for cannabis and sedatives, 8.8%for cocaine, 6.4% for amphetamine-like stimulants, 5.4%for hallucinogens, 3.9% for opioids, and 3.4% for inha-lants. Alcohol was the substance most frequently used inthe previous three months (19.6%), with tobacco at13.2%, cocaine at 5.4%, cannabis at 4.9%, sedatives andhallucinogens at 3.9%, amphetamine-type stimulants at3.4%, and opioids at 3.0%. Respondents who used in the
last three months were asked how often they had astrong desire or urge to use various substances in theprevious three months. More than half of those whoused alcohol, tobacco, cannabis, or cocaine in the lastthree months reported they had a strong desire or urgeto use during that period. Figure 1 shows the distribu-tion of substance use rates. Table 1 shows the breakdownof substance use frequency by gender.
Lifetime use for men was higher than that of women forall substances except hallucinogens. Previous threemonths’use followed a similar trend with usage rates higher for allsubstances among men, with the exception of previousthree months’ use of sedatives, which was higher amongwomen.
Analysis of ASSIST scores revealed that mostHCWs had a low level of risk from their substanceuse. Tobacco was the only substance with a HCWreaching a high risk score (0.5%). Moderate risk usewas observed at 11.8% for tobacco, 4.4% for cocaine,3.4% for cannabis and sedatives, 2.9% for alcohol andhallucinogens, 2.5% for amphetamine-type stimulants,and 1.5% for opioids. Tobacco and alcohol were thesubstances for which the highest proportion of work-ers reported they were experiencing negative health,social, financial, or legal consequences from their usein the last three months (3.9 and 2.0%, respectively,for tobacco and alcohol); 4.4% and 2%, respectively,received expressions of concern; 6.4% and 3.5%,respectively, tried to cut down without succeeding;and 1.0% of failed to fulfill their roles due to theiralcohol use (ASSIST 4 to 7). For the other substances,negative consequences had been experienced by 1 to2.5% of workers, none had failed to fulfill their roles,0.5% received expression of concern for cannabis orsedatives use, and only 1% of workers tried to cutcannabis use without success, with none for all of the
0
5
10
15
20
25
30
35
40
lifetime use
previous 3 months use
strong desire/urge touse in last 3 months
Figure 1. Health worker substance use rates among Kenyan healthcare workers.
JOURNAL OF PSYCHOACTIVE DRUGS 313
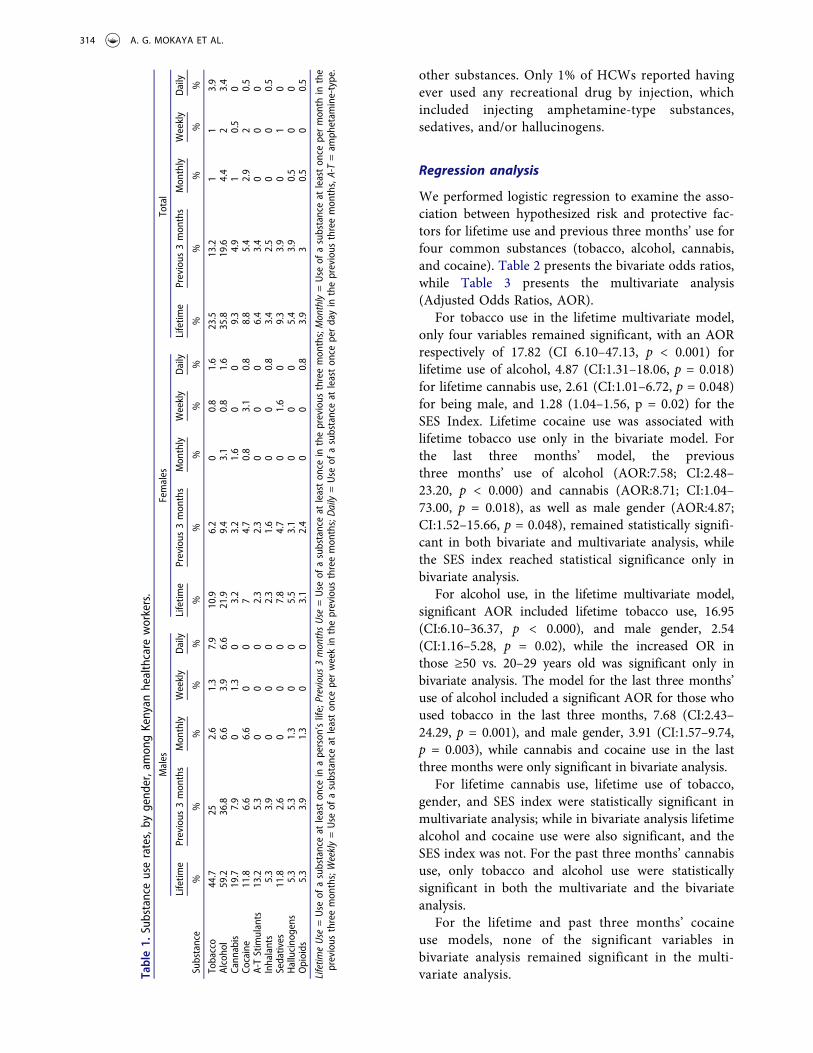
other substances. Only 1% of HCWs reported havingever used any recreational drug by injection, whichincluded injecting amphetamine-type substances,sedatives, and/or hallucinogens.
Regression analysis
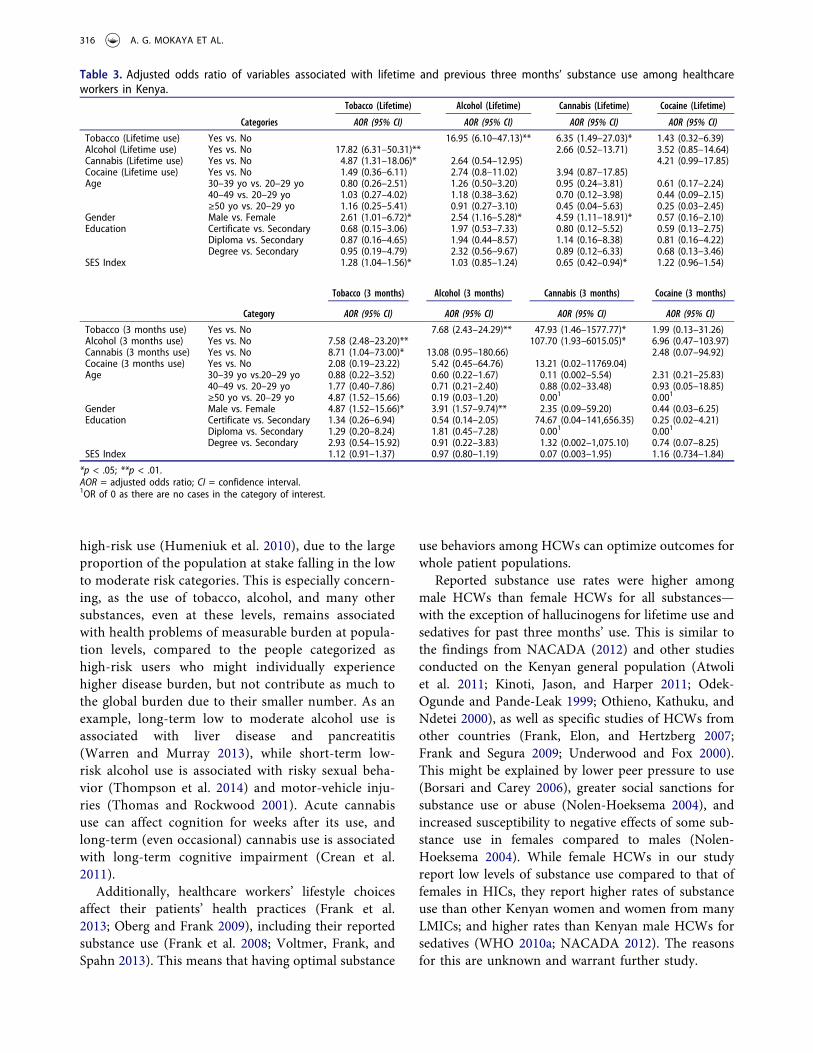
We performed logistic regression to examine the asso-ciation between hypothesized risk and protective fac-tors for lifetime use and previous three months’ use forfour common substances (tobacco, alcohol, cannabis,and cocaine). Table 2 presents the bivariate odds ratios,while Table 3 presents the multivariate analysis(Adjusted Odds Ratios, AOR).
For tobacco use in the lifetime multivariate model,only four variables remained significant, with an AORrespectively of 17.82 (CI 6.10–47.13, p < 0.001) forlifetime use of alcohol, 4.87 (CI:1.31–18.06, p = 0.018)for lifetime cannabis use, 2.61 (CI:1.01–6.72, p = 0.048)for being male, and 1.28 (1.04–1.56, p = 0.02) for theSES Index. Lifetime cocaine use was associated withlifetime tobacco use only in the bivariate model. Forthe last three months’ model, the previousthree months’ use of alcohol (AOR:7.58; CI:2.48–23.20, p < 0.000) and cannabis (AOR:8.71; CI:1.04–73.00, p = 0.018), as well as male gender (AOR:4.87;CI:1.52–15.66, p = 0.048), remained statistically signifi-cant in both bivariate and multivariate analysis, whilethe SES index reached statistical significance only inbivariate analysis.
For alcohol use, in the lifetime multivariate model,significant AOR included lifetime tobacco use, 16.95(CI:6.10–36.37, p < 0.000), and male gender, 2.54(CI:1.16–5.28, p = 0.02), while the increased OR inthose ≥50 vs. 20–29 years old was significant only inbivariate analysis. The model for the last three months’use of alcohol included a significant AOR for those whoused tobacco in the last three months, 7.68 (CI:2.43–24.29, p = 0.001), and male gender, 3.91 (CI:1.57–9.74,p = 0.003), while cannabis and cocaine use in the lastthree months were only significant in bivariate analysis.
For lifetime cannabis use, lifetime use of tobacco,gender, and SES index were statistically significant inmultivariate analysis; while in bivariate analysis lifetimealcohol and cocaine use were also significant, and theSES index was not. For the past three months’ cannabisuse, only tobacco and alcohol use were statisticallysignificant in both the multivariate and the bivariateanalysis.
For the lifetime and past three months’ cocaineuse models, none of the significant variables inbivariate analysis remained significant in the multi-variate analysis.Ta
ble1.
Substanceuserates,by
gend
er,amon
gKenyan
healthcare
workers.
Males
Females
Total
Substance
Lifetim
ePrevious
3mon
ths
Mon
thly
Weekly
Daily
Lifetim
ePrevious
3mon
ths
Mon
thly
Weekly
Daily
Lifetim
ePrevious
3mon
ths
Mon
thly
Weekly
Daily
%%
%%
%%
%%
%%
%%
%%
%
Tobacco
44.7
252.6
1.3
7.9
10.9
6.2
00.8
1.6
23.5
13.2
11
3.9
Alcoho
l59.2
36.8
6.6
3.9
6.6
21.9
9.4
3.1
0.8
1.6
35.8
19.6
4.4
23.4
Cann
abis
19.7
7.9
01.3
03.2
3.2
1.6
00
9.3
4.9
10.5
0Co
caine
11.8
6.6
6.6
00
74.7
0.8
3.1
0.8
8.8
5.4
2.9
20.5
A-TStimulants
13.2
5.3
00
02.3
2.3
00
06.4
3.4
00
0Inhalants
5.3
3.9
00
02.3
1.6
00
0.8
3.4
2.5
00
0.5
Sedatives
11.8
2.6
00
07.8
4.7
01.6
09.3
3.9
01
0Hallucino
gens
5.3
5.3
1.3
00
5.5
3.1
00
05.4
3.9
0.5
00
Opioids
5.3
3.9
1.3
00
3.1
2.4
00
0.8
3.9
30.5
00.5
Lifetim
eUse
=Use
ofasubstanceat
leaston
cein
aperson
’slife;Previous
3monthsUse
=Use
ofasubstanceat
leaston
cein
theprevious
threemon
ths;Monthly=Use
ofasubstanceat
leaston
cepermon
thin
the
previous
threemon
ths;Weekly=Use
ofasubstanceat
leaston
ceperweekin
theprevious
threemon
ths;Daily=Use
ofasubstanceat
leaston
ceperdayin
theprevious
threemon
ths,A-T=am
phetam
ine-type.
314 A. G. MOKAYA ET AL.
Discussion
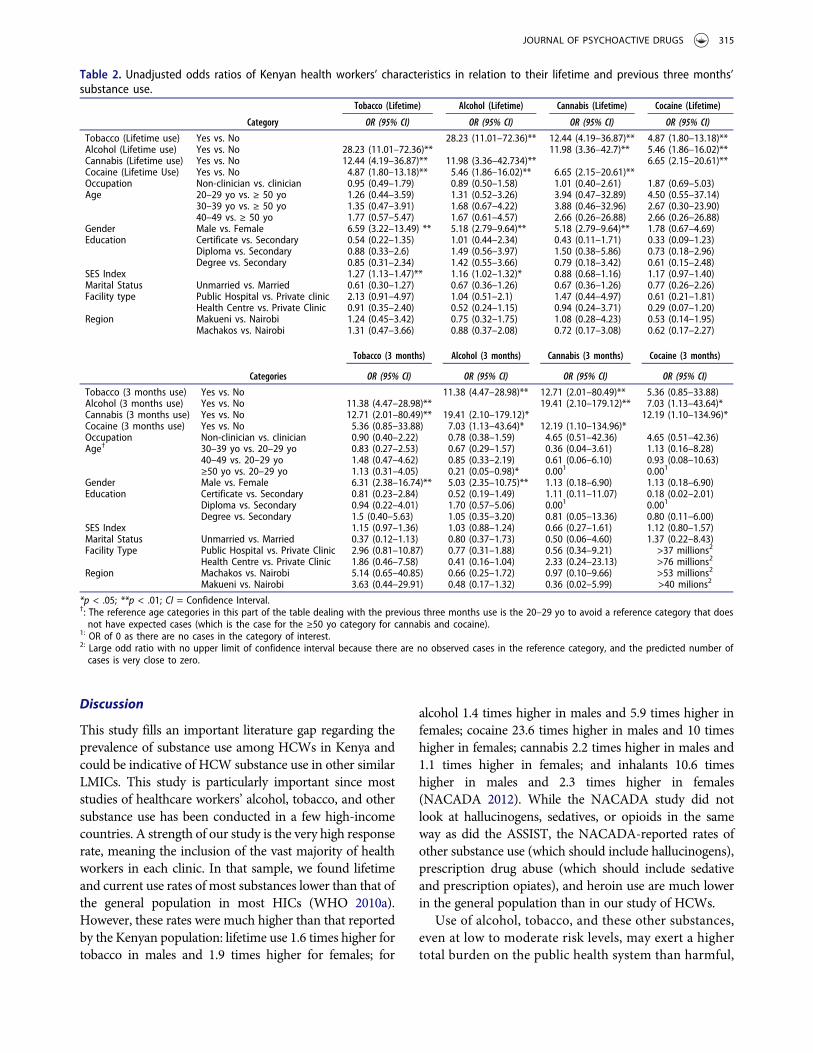
This study fills an important literature gap regarding theprevalence of substance use among HCWs in Kenya andcould be indicative of HCW substance use in other similarLMICs. This study is particularly important since moststudies of healthcare workers’ alcohol, tobacco, and othersubstance use has been conducted in a few high-incomecountries. A strength of our study is the very high responserate, meaning the inclusion of the vast majority of healthworkers in each clinic. In that sample, we found lifetimeand current use rates of most substances lower than that ofthe general population in most HICs (WHO 2010a).However, these rates were much higher than that reportedby the Kenyan population: lifetime use 1.6 times higher fortobacco in males and 1.9 times higher for females; for
alcohol 1.4 times higher in males and 5.9 times higher infemales; cocaine 23.6 times higher in males and 10 timeshigher in females; cannabis 2.2 times higher in males and1.1 times higher in females; and inhalants 10.6 timeshigher in males and 2.3 times higher in females(NACADA 2012). While the NACADA study did notlook at hallucinogens, sedatives, or opioids in the sameway as did the ASSIST, the NACADA-reported rates ofother substance use (which should include hallucinogens),prescription drug abuse (which should include sedativeand prescription opiates), and heroin use are much lowerin the general population than in our study of HCWs.
Use of alcohol, tobacco, and these other substances,even at low to moderate risk levels, may exert a highertotal burden on the public health system than harmful,
Table 2. Unadjusted odds ratios of Kenyan health workers’ characteristics in relation to their lifetime and previous three months’substance use.
Tobacco (Lifetime) Alcohol (Lifetime) Cannabis (Lifetime) Cocaine (Lifetime)
Category OR (95% CI) OR (95% CI) OR (95% CI) OR (95% CI)
Tobacco (Lifetime use) Yes vs. No 28.23 (11.01–72.36)** 12.44 (4.19–36.87)** 4.87 (1.80–13.18)**Alcohol (Lifetime use) Yes vs. No 28.23 (11.01–72.36)** 11.98 (3.36–42.7)** 5.46 (1.86–16.02)**Cannabis (Lifetime use) Yes vs. No 12.44 (4.19–36.87)** 11.98 (3.36–42.734)** 6.65 (2.15–20.61)**Cocaine (Lifetime Use) Yes vs. No 4.87 (1.80–13.18)** 5.46 (1.86–16.02)** 6.65 (2.15–20.61)**Occupation Non-clinician vs. clinician 0.95 (0.49–1.79) 0.89 (0.50–1.58) 1.01 (0.40–2.61) 1.87 (0.69–5.03)Age 20–29 yo vs. ≥ 50 yo 1.26 (0.44–3.59) 1.31 (0.52–3.26) 3.94 (0.47–32.89) 4.50 (0.55–37.14)
30–39 yo vs. ≥ 50 yo 1.35 (0.47–3.91) 1.68 (0.67–4.22) 3.88 (0.46–32.96) 2.67 (0.30–23.90)40–49 vs. ≥ 50 yo 1.77 (0.57–5.47) 1.67 (0.61–4.57) 2.66 (0.26–26.88) 2.66 (0.26–26.88)
Gender Male vs. Female 6.59 (3.22–13.49) ** 5.18 (2.79–9.64)** 5.18 (2.79–9.64)** 1.78 (0.67–4.69)Education Certificate vs. Secondary 0.54 (0.22–1.35) 1.01 (0.44–2.34) 0.43 (0.11–1.71) 0.33 (0.09–1.23)
Diploma vs. Secondary 0.88 (0.33–2.6) 1.49 (0.56–3.97) 1.50 (0.38–5.86) 0.73 (0.18–2.96)Degree vs. Secondary 0.85 (0.31–2.34) 1.42 (0.55–3.66) 0.79 (0.18–3.42) 0.61 (0.15–2.48)
SES Index 1.27 (1.13–1.47)** 1.16 (1.02–1.32)* 0.88 (0.68–1.16) 1.17 (0.97–1.40)Marital Status Unmarried vs. Married 0.61 (0.30–1.27) 0.67 (0.36–1.26) 0.67 (0.36–1.26) 0.77 (0.26–2.26)Facility type Public Hospital vs. Private clinic 2.13 (0.91–4.97) 1.04 (0.51–2.1) 1.47 (0.44–4.97) 0.61 (0.21–1.81)
Health Centre vs. Private Clinic 0.91 (0.35–2.40) 0.52 (0.24–1.15) 0.94 (0.24–3.71) 0.29 (0.07–1.20)Region Makueni vs. Nairobi 1.24 (0.45–3.42) 0.75 (0.32–1.75) 1.08 (0.28–4.23) 0.53 (0.14–1.95)
Machakos vs. Nairobi 1.31 (0.47–3.66) 0.88 (0.37–2.08) 0.72 (0.17–3.08) 0.62 (0.17–2.27)
Tobacco (3 months) Alcohol (3 months) Cannabis (3 months) Cocaine (3 months)
Categories OR (95% CI) OR (95% CI) OR (95% CI) OR (95% CI)
Tobacco (3 months use) Yes vs. No 11.38 (4.47–28.98)** 12.71 (2.01–80.49)** 5.36 (0.85–33.88)Alcohol (3 months use) Yes vs. No 11.38 (4.47–28.98)** 19.41 (2.10–179.12)** 7.03 (1.13–43.64)*Cannabis (3 months use) Yes vs. No 12.71 (2.01–80.49)** 19.41 (2.10–179.12)* 12.19 (1.10–134.96)*Cocaine (3 months use) Yes vs. No 5.36 (0.85–33.88) 7.03 (1.13–43.64)* 12.19 (1.10–134.96)*Occupation Non-clinician vs. clinician 0.90 (0.40–2.22) 0.78 (0.38–1.59) 4.65 (0.51–42.36) 4.65 (0.51–42.36)Age† 30–39 yo vs. 20–29 yo 0.83 (0.27–2.53) 0.67 (0.29–1.57) 0.36 (0.04–3.61) 1.13 (0.16–8.28)
40–49 vs. 20–29 yo 1.48 (0.47–4.62) 0.85 (0.33–2.19) 0.61 (0.06–6.10) 0.93 (0.08–10.63)≥50 yo vs. 20–29 yo 1.13 (0.31–4.05) 0.21 (0.05–0.98)* 0.001 0.001
Gender Male vs. Female 6.31 (2.38–16.74)** 5.03 (2.35–10.75)** 1.13 (0.18–6.90) 1.13 (0.18–6.90)Education Certificate vs. Secondary 0.81 (0.23–2.84) 0.52 (0.19–1.49) 1.11 (0.11–11.07) 0.18 (0.02–2.01)
Diploma vs. Secondary 0.94 (0.22–4.01) 1.70 (0.57–5.06) 0.001 0.001
Degree vs. Secondary 1.5 (0.40–5.63) 1.05 (0.35–3.20) 0.81 (0.05–13.36) 0.80 (0.11–6.00)SES Index 1.15 (0.97–1.36) 1.03 (0.88–1.24) 0.66 (0.27–1.61) 1.12 (0.80–1.57)Marital Status Unmarried vs. Married 0.37 (0.12–1.13) 0.80 (0.37–1.73) 0.50 (0.06–4.60) 1.37 (0.22–8.43)Facility Type Public Hospital vs. Private Clinic 2.96 (0.81–10.87) 0.77 (0.31–1.88) 0.56 (0.34–9.21) >37 millions2
Health Centre vs. Private Clinic 1.86 (0.46–7.58) 0.41 (0.16–1.04) 2.33 (0.24–23.13) >76 millions2
Region Machakos vs. Nairobi 5.14 (0.65–40.85) 0.66 (0.25–1.72) 0.97 (0.10–9.66) >53 millions2
Makueni vs. Nairobi 3.63 (0.44–29.91) 0.48 (0.17–1.32) 0.36 (0.02–5.99) >40 milions2
*p < .05; **p < .01; CI = Confidence Interval.†: The reference age categories in this part of the table dealing with the previous three months use is the 20–29 yo to avoid a reference category that doesnot have expected cases (which is the case for the ≥50 yo category for cannabis and cocaine).
1: OR of 0 as there are no cases in the category of interest.2: Large odd ratio with no upper limit of confidence interval because there are no observed cases in the reference category, and the predicted number ofcases is very close to zero.
JOURNAL OF PSYCHOACTIVE DRUGS 315
high-risk use (Humeniuk et al. 2010), due to the largeproportion of the population at stake falling in the lowto moderate risk categories. This is especially concern-ing, as the use of tobacco, alcohol, and many othersubstances, even at these levels, remains associatedwith health problems of measurable burden at popula-tion levels, compared to the people categorized ashigh-risk users who might individually experiencehigher disease burden, but not contribute as much tothe global burden due to their smaller number. As anexample, long-term low to moderate alcohol use isassociated with liver disease and pancreatitis(Warren and Murray 2013), while short-term low-risk alcohol use is associated with risky sexual beha-vior (Thompson et al. 2014) and motor-vehicle inju-ries (Thomas and Rockwood 2001). Acute cannabisuse can affect cognition for weeks after its use, andlong-term (even occasional) cannabis use is associatedwith long-term cognitive impairment (Crean et al.2011).
Additionally, healthcare workers’ lifestyle choicesaffect their patients’ health practices (Frank et al.2013; Oberg and Frank 2009), including their reportedsubstance use (Frank et al. 2008; Voltmer, Frank, andSpahn 2013). This means that having optimal substance
use behaviors among HCWs can optimize outcomes forwhole patient populations.
Reported substance use rates were higher amongmale HCWs than female HCWs for all substances—with the exception of hallucinogens for lifetime use andsedatives for past three months’ use. This is similar tothe findings from NACADA (2012) and other studiesconducted on the Kenyan general population (Atwoliet al. 2011; Kinoti, Jason, and Harper 2011; Odek-Ogunde and Pande-Leak 1999; Othieno, Kathuku, andNdetei 2000), as well as specific studies of HCWs fromother countries (Frank, Elon, and Hertzberg 2007;Frank and Segura 2009; Underwood and Fox 2000).This might be explained by lower peer pressure to use(Borsari and Carey 2006), greater social sanctions forsubstance use or abuse (Nolen-Hoeksema 2004), andincreased susceptibility to negative effects of some sub-stance use in females compared to males (Nolen-Hoeksema 2004). While female HCWs in our studyreport low levels of substance use compared to that offemales in HICs, they report higher rates of substanceuse than other Kenyan women and women from manyLMICs; and higher rates than Kenyan male HCWs forsedatives (WHO 2010a; NACADA 2012). The reasonsfor this are unknown and warrant further study.
Table 3. Adjusted odds ratio of variables associated with lifetime and previous three months’ substance use among healthcareworkers in Kenya.
Tobacco (Lifetime) Alcohol (Lifetime) Cannabis (Lifetime) Cocaine (Lifetime)
Categories AOR (95% CI) AOR (95% CI) AOR (95% CI) AOR (95% CI)
Tobacco (Lifetime use) Yes vs. No 16.95 (6.10–47.13)** 6.35 (1.49–27.03)* 1.43 (0.32–6.39)Alcohol (Lifetime use) Yes vs. No 17.82 (6.31–50.31)** 2.66 (0.52–13.71) 3.52 (0.85–14.64)Cannabis (Lifetime use) Yes vs. No 4.87 (1.31–18.06)* 2.64 (0.54–12.95) 4.21 (0.99–17.85)Cocaine (Lifetime use) Yes vs. No 1.49 (0.36–6.11) 2.74 (0.8–11.02) 3.94 (0.87–17.85)Age 30–39 yo vs. 20–29 yo 0.80 (0.26–2.51) 1.26 (0.50–3.20) 0.95 (0.24–3.81) 0.61 (0.17–2.24)
40–49 vs. 20–29 yo 1.03 (0.27–4.02) 1.18 (0.38–3.62) 0.70 (0.12–3.98) 0.44 (0.09–2.15)≥50 yo vs. 20–29 yo 1.16 (0.25–5.41) 0.91 (0.27–3.10) 0.45 (0.04–5.63) 0.25 (0.03–2.45)
Gender Male vs. Female 2.61 (1.01–6.72)* 2.54 (1.16–5.28)* 4.59 (1.11–18.91)* 0.57 (0.16–2.10)Education Certificate vs. Secondary 0.68 (0.15–3.06) 1.97 (0.53–7.33) 0.80 (0.12–5.52) 0.59 (0.13–2.75)
Diploma vs. Secondary 0.87 (0.16–4.65) 1.94 (0.44–8.57) 1.14 (0.16–8.38) 0.81 (0.16–4.22)Degree vs. Secondary 0.95 (0.19–4.79) 2.32 (0.56–9.67) 0.89 (0.12–6.33) 0.68 (0.13–3.46)
SES Index 1.28 (1.04–1.56)* 1.03 (0.85–1.24) 0.65 (0.42–0.94)* 1.22 (0.96–1.54)
Tobacco (3 months) Alcohol (3 months) Cannabis (3 months) Cocaine (3 months)
Category AOR (95% CI) AOR (95% CI) AOR (95% CI) AOR (95% CI)
Tobacco (3 months use) Yes vs. No 7.68 (2.43–24.29)** 47.93 (1.46–1577.77)* 1.99 (0.13–31.26)Alcohol (3 months use) Yes vs. No 7.58 (2.48–23.20)** 107.70 (1.93–6015.05)* 6.96 (0.47–103.97)Cannabis (3 months use) Yes vs. No 8.71 (1.04–73.00)* 13.08 (0.95–180.66) 2.48 (0.07–94.92)Cocaine (3 months use) Yes vs. No 2.08 (0.19–23.22) 5.42 (0.45–64.76) 13.21 (0.02–11769.04)Age 30–39 yo vs.20–29 yo 0.88 (0.22–3.52) 0.60 (0.22–1.67) 0.11 (0.002–5.54) 2.31 (0.21–25.83)
40–49 vs. 20–29 yo 1.77 (0.40–7.86) 0.71 (0.21–2.40) 0.88 (0.02–33.48) 0.93 (0.05–18.85)≥50 yo vs. 20–29 yo 4.87 (1.52–15.66) 0.19 (0.03–1.20) 0.001 0.001
Gender Male vs. Female 4.87 (1.52–15.66)* 3.91 (1.57–9.74)** 2.35 (0.09–59.20) 0.44 (0.03–6.25)Education Certificate vs. Secondary 1.34 (0.26–6.94) 0.54 (0.14–2.05) 74.67 (0.04–141,656.35) 0.25 (0.02–4.21)
Diploma vs. Secondary 1.29 (0.20–8.24) 1.81 (0.45–7.28) 0.001 0.001
Degree vs. Secondary 2.93 (0.54–15.92) 0.91 (0.22–3.83) 1.32 (0.002–1,075.10) 0.74 (0.07–8.25)SES Index 1.12 (0.91–1.37) 0.97 (0.80–1.19) 0.07 (0.003–1.95) 1.16 (0.734–1.84)
*p < .05; **p < .01.AOR = adjusted odds ratio; CI = confidence interval.1OR of 0 as there are no cases in the category of interest.
316 A. G. MOKAYA ET AL.
Socio-economic indicators (SES index, education,occupation) were associated with substance use inbivariate analysis in this study. This is similar to theNACADA findings showing that 19.8% of people in thehighest income group in Kenya currently use alcoholcompared with 13.2% in the lowest income group, afrequently observed association, especially for thosewith a college education (Atwoli et al. 2011;NACADA 2012; Odek-Ogunde and Pande-Leak1999). However, a previous study in Kenya showedthat lower levels of education and poor employmentstatus were risk factors for cannabis use (Kinoti, Jason,and Harper 2011). Neither region nor age were signifi-cantly associated with substance use, contrasting withother Kenyan and global studies showing that increas-ing age is a risk factor for alcohol consumption in thegeneral population (Lo et al. 2013). Studies also showhigher use rates with increasing age among medicalstudents and physicians (Flaherty and Richman 1993;Frank et al. 2008).
As in other studies of co-occurring substance use inthe general population (Akre et al. 2010; Lee, Martin,and Kelly 2014; McKetin et al. 2014; Rodríguez-Álvarezet al. 2015), our study showed that consumption ofalcohol, tobacco, cannabis, or cocaine significantlyincreased the odds of at least one of the other sub-stances being used.
Even though this study used a relatively small con-venience sample, a large proportion of HCWs in thetargeted departments of the participating health facil-ities responded to the survey. Furthermore, despite thepotential for social desirability bias, many HCWsreported the use of substances identified as stigmatized(Room 2005). The report of use of stigmatized sub-stances in relatively high proportion further supportsthis study as providing a relatively valid representationof substance use among Kenyan HCWs of theseregions.
These findings indicate the need for a more rigorousassessment of substance use, abuse, and dependence inHCWs in Kenya and other LMICs, since there are fewexisting studies, and because HCWs’ personal sub-stance use affects their provision of substance-use-related care (Frank 2007; Frank, Breyan, and Elon2000; Oberg and Frank 2009). Furthermore, it cannotbe assumed that HCWs understand the consequencesof their own consumption, as there is limited substanceuse training available, and there had been no trainingon the topic for our particular sample of communityhealth workers (Hitchen, Tairyan, and Clair 2014).These findings indicate the need for training and inter-vention for HCWs who abuse substances, a need rarelyaddressed in many LMICs.
Funding
The authors acknowledge funding from Grand ChallengesCanada–GCC (GMH 0092-04), Canada Research ChairProgram, Annenberg Physician Training Program inAddiction Medicine.
ORCID
Aggrey Mokaya http://orcid.org/0000-0002-6663-6330Veronic Clair http://orcid.org/0000-0002-1939-9993
References
Akre, C., P. Michaud, A. Berchtold, and J. Suris. 2010.Cannabis and tobacco use: Where are the boundaries? Aqualitative study on cannabis consumption modes amongadolescents. Health Education Research 25 (1):74–82.doi:10.1093/her/cyp027.
Alwan, A. 2011. Global status report on noncommunicable dis-eases 2010. Geneva, Switzerland:World Health Organization.
Atwoli, L., P. Mungla, M. Ndung’u, K. Kinoti, and E. Ogot.2011. Prevalence of substance use among college studentsin Eldoret, Western Kenya. BMC Psychiatry 11 (1):34.doi:10.1186/1471-244X-11-34.
Baldisseri, M. 2007. Impaired healthcare professional. CriticalCare Medicine 35 (2 Suppl):S106–16. doi:10.1097/01.CCM.0000252918.87746.96.
Barrowclough, C., G. Haddock, N. Tarrier, S. Lewis, J. Moring,R. O’Brien, N. Schofield, and J. McGovern. 2001.Randomized controlled trial of motivational interviewing,cognitive behavior therapy, and family intervention forpatients with comorbid schizophrenia and substance usedisorders. American Journal of Psychiatry 158 (10):1706–13.doi:10.1176/appi.ajp.158.10.1706.
Borsari, B., and K. Carey. 2006. How the quality of peer relation-ships influences college alcohol use. Drug and Alcohol Review25 (4):361–70. doi:10.1080/09595230600741339.
Crean, R., N. Crane, and B. Mason. 2011. An evidence basedreview of acute and long-term effects of cannabis use onexecutive cognitive functions. Journal of AddictionMedicine 5 (1):1–8. doi:10.1097/ADM.0b013e31820c23fa.
Dawson, B., and R. Trapp. 2004. Basic & clinical biostatistics,4th ed. Columbus, OH: McGraw Hill Professional.
Dutra, L., G. Stathopoulou, S. Basden, T. Leyro, M. Powers,and M. Otto. 2008. A meta-analytic review of psychosocialinterventions for substance use disorders. AmericanJournal of Psychiatry 165 (2):179–87. doi:10.1176/appi.ajp.2007.06111851.
EMCDDA (European Monitoring Centre for Drugs and DrugAddiction). 2011. 2011 annual report. European MonitoringCentre for Drugs and Drug Addiction. http://www.emcdda.europa.eu/online/annual-report/2011/cannabis/3.
Flaherty, J., and J. Richman. 1993. Substance use and addic-tion among medical students, residents, and physicians.Psychiatric Clinics of North America 16 (1):189–97.
Frank, E. 2007. We physicians preach what we practice, andthat matters. Medscape General Medicine 9 (4):59.
Frank, E., J. Breyan, and L. Elon. 2000. Physician disclosureof healthy personal behaviors improves credibility and
JOURNAL OF PSYCHOACTIVE DRUGS 317
ability to motivate. Archives of Family Medicine 9 (3):287–90. doi:10.1001/archfami.9.3.287.
Frank, E., Y. Dresner, M. Shani, and S. Vinker. 2013. Theassociation between physicians’ and patients’ preventivehealth practices. CMAJ: Canadian Medical AssociationJournal 185 (8):649–53. doi:10.1503/cmaj.121028.
Frank, E., L. Elon, and V. Hertzberg. 2007. A quantitativeassessment of a four-year intervention that improvedpatient counseling through improving medical studenthealth. Medscape General Medicine 9 (2):58.
Frank, E., L. Elon, T. Naimi, and R. Brewer. 2008. Alcoholconsumption and alcohol counselling behaviour amongUS medical students: Cohort study. BMJ 337 (1):a2155.doi:10.1136/bmj.a2155.
Frank, E., and C. Segura. 2009. Health practices of Canadianphysicians. Canadian Family Physician 55 (8):810–11.e7.
Gastfriend, D. 2005. Physician substance abuse and recovery:What does it mean for physicians—And everyone else?JAMA 293 (12):1513–15. doi:10.1001/jama.293.12.1513.
Gore, F., P. Bloem, G. Patton, J. Ferguson, V. Joseph, C. Coffey, S.Sawyer, and C. Mathers. 2011. Global burden of disease inyoung people aged 10–24 years: A systematic analysis. TheLancet 377 (9783):2093–102. doi:10.1016/S0140-6736(11)60512-6.
Hitchen, C., K. Tairyan, and V. Clair 2014. Piloting computerbased training on substance use disorders for primary carein Kenya: A developmental evaluation of eData K. Capstoneproject report, Burnaby, Canada: Simon Fraser University.
Humeniuk, R., and R. Ali. 2006. Validation of the Alcohol,Smoking and Substance Involvement Screening Test(ASSIST) and pilot brief intervention: A technical reportof phase II findings of the WHO ASSIST Project. Geneva,Switzerland: World Health Organization. http://www.who.int/substance_abuse/activities/assist_technicalreport_phase2_final.pdf
Humeniuk, R., R. Ali, V. Poznyak, and M. Monteiro. 2010.The Alcohol, Smoking and Substance Involvement ScreeningTest (ASSIST): Manual for use in primary care. Geneva,Switzerland: World Health Organization.
Kenna, G., and D. Lewis. 2008. Risk factors for alcohol andother drug use by healthcare professionals. SubstanceAbuse Treatment, Prevention, and Policy 3 (1):3.doi:10.1186/1747-597X-3-3.
Kinoti, K., L. Jason, and G. Harper. 2011. Determinants ofalcohol, khat, and bhang use in rural Kenya. AfricanJournal of Drug and Alcohol Studies 10 (2):107–18.
Kuria, M. 1996. Drug abuse among urban as compared torural secondary schools students in Kenya: A short com-munication. East African Medical Journal 73 (5):339.
Lee, D., C. Martin, and T. Kelly. 2014. Acute effect of alcoholon inhibitory control and subsequent tobacco use in youngadult occasional smokers. Drug & Alcohol Dependence 140(July):e118. doi:10.1016/j.drugalcdep.2014.02.337.
Lim, S., T. Vos, A. Flaxman, G. Danaei, K. Shibuya, H. Adair-Rohani, M. AlMazroa, et al. 2012. A comparative riskassessment of burden of disease and injury attributable to67 risk factors and risk factor clusters in 21 regions,1990–2010: A systematic analysis for the Global Burdenof Disease Study 2010. The Lancet 380 (9859):2224–60.doi:10.1016/S0140-6736(12)61766-8.
Lo, T., J. Oeltmann, F. Odhiambo, C. Beynon, E. Pevzner, K.Cain, K. Laserson, and P. Phillips-Howard. 2013. Alcohol
use, drunkenness and tobacco smoking in rural WesternKenya. Tropical Medicine & International Health: TM &IH 18 (4):506–15. doi:10.1111/tmi.12066.
Mathers, C., and D. Loncar. 2006. Projections of global mor-tality and burden of disease from 2002 to 2030. PlosMedicine 3 (11):e442. doi:10.1371/journal.pmed.0030442.
McFarlin, S., and W. Fals-Stewart. 2002. Workplace absentee-ism and alcohol use: A sequential analysis. Psychology ofAddictive Behaviors 16 (1):17–21. doi:10.1037/0893-164X.16.1.17.
McKetin, R., J. Chalmers, M. Sunderland, and D. Bright.2014. Recreational drug use and binge drinking:Stimulant but not cannabis intoxication is associated withexcessive alcohol consumption. Drug and Alcohol Review33 (4):436–45. doi:10.1111/dar.12147.
Mendis, S., T. Armstrong, D. Beticher, F. Branca, J. Lauer, C.Mace, V. Poznyak, L. Riley, V. Da Costa Silva, and G.Stevens. 2014. Global status report on noncommunicablediseases 2014. Geneva, Switzerland: World HealthOrganization.
NACADA. 2012. Rapid assessment of drugs and substanceabuse in Kenya. http://www.nacada.go.ke/documents-and-resources/category/8-research-survey-findings?download=40:rapid-assessment-of-alcohol-and-drug-abuse-situation-in-kenya-2012
NACADA. 2014. Trends and patterns of emerging drugs inKenya: A case study of Mombasa and Nairobi counties.NAC/10/2014. Nairobi, Kenya: National Authority for theCampaign against Alcohol and Drug Abuse.
Nolen-Hoeksema, S. 2004. Gender differences in risk factorsand consequences for alcohol use and problems. ClinicalPsychology Review 24 (8):981–1010. doi:10.1016/j.cpr.2004.08.003.
Oberg, E., and E. Frank. 2009. Physicians’ health practicesstrongly influence patient health practices. The Journal ofthe Royal College of Physicians of Edinburgh 39 (4):290–91.doi:10.4997/JRCPE.2009.422.
Odek-Ogunde, M., and D. Pande-Leak. 1999. Prevalence ofsubstance use among students in a Kenyan university: Apreliminary report. East African Medical Journal 76(6):301–06.
Othieno, C., D. Kathuku, and D. Ndetei. 2000. Substance abusein outpatients attending rural and urban health centres inKenya. East African Medical Journal 77 (11):592–95.
Rodríguez-Álvarez, T., I. Racamonde, I. González-Mariño,A. Borsotti, R. Rodil, I. Rodríguez, E. Zuccato, J.Quintana, and S. Castiglioni. 2015. Alcohol and cocaineco-consumption in two European cities assessed bywastewater analysis. Science of the Total Environment536 (December):91–98. doi:10.1016/j.scitotenv.2015.07.016.
Room, R. 2005. Stigma, social inequality and alcohol anddrug use. Drug and Alcohol Review 24 (2):143–55.doi:10.1080/09595230500102434.
Shaffer, D., R. Njeri, A. Justice, W. Odero, and W. Tierney.2004. Alcohol abuse among patients with and without HIVinfection attending public clinics in Western Kenya. EastAfrican Medical Journal 81 (11):594–98.
Thomas, V., and K. Rockwood. 2001. Alcohol abuse, cogni-tive impairment, and mortality among older people.Journal of the American Geriatrics Society 49 (4):415–20.doi:10.1046/j.1532-5415.2001.49085.x.
318 A. G. MOKAYA ET AL.
Thompson, R., N. Eaton, M. Hu, B. Grant, and D. Hasin.2014. Regularly drinking alcohol before sex in the UnitedStates: Effects of relationship status and alcohol use dis-orders. Drug and Alcohol Dependence 141:167–70.doi:10.1016/j.drugalcdep.2014.05.021.
Trinkoff, A., and C. Storr. 1998. Work schedule characteristicsand substance use in nurses. American Journal of IndustrialMedicine 34 (3):266–71. doi:10.1002/(ISSN)1097-0274.
Tu, Y., M. Kellett, V. Clerehugh, and M. Gilthorpe. 2005.Problems of correlations between explanatory variables inmultiple regression analyses in the dental literature. BritishDental Journal 199 (7):457–61. doi:10.1038/sj.bdj.4812743.
Underwood, B., and K. Fox. 2000. Law and ethics: A surveyof alcohol and drug use among UK-based dental under-graduates. British Dental Journal 189 (6):314–17.doi:10.1038/sj.bdj.4800756.
Voltmer, E., E. Frank, and C. Spahn. 2013. Personal healthpractices and patient counseling of German physicians inprivate practice. International Scholarly Research Notices2013 (August):e176020. doi:10.5402/2013/176020.
Warren, K., and M. Murray. 2013. Alcoholic liver disease andpancreatitis: Global health problems being addressed by
the U.S. National Institute on Alcohol Abuse andAlcoholism. Journal of Gastroenterology and Hepatology28 (S1):4–6. doi:10.1111/jgh.2013.28.issue-s1.
Whiteford, H., L. Degenhardt, J. Rehm, A. Baxter, A. Ferrari,H. Erskine, F. Charlson, et al. 2013. Global burden ofdisease attributable to mental and substance use disorders:Findings from the Global Burden of Disease Study 2010.The Lancet 382 (9904):1575–86. doi:10.1016/S0140-6736(13)61611-6.
WHO. 2010a. Atlas on substance use (2010): Resources for theprevention and treatment of substance use disorders.Geneva, Switzerland: World Health Organization.
WHO. 2010b. mhGAP intervention guide for mental, neuro-logical and substance use disorders in non-specialized healthsettings. Geneva, Switzerland: World Health Organization.
WHO et al. 2006. The World Health Report: 2006: Workingtogether for health. http://apps.who.int/iris/handle/10665/43432
Wu, L.-T. 2010. Substance abuse and rehabilitation:Responding to the global burden of diseases attributableto substance abuse. Substance Abuse and Rehabilitation2010 (1):5–11. doi:10.2147/SAR.S14898.
JOURNAL OF PSYCHOACTIVE DRUGS 319