Sub-Doppler RQ-branch spectra and ab initio dipole derivative calculation for the ν11 (au)...
8
Sub-Doppler R Q-branch spectra and ab initio dipole derivative calculation for the n 11 (a u ) CH 2 -wagging mode of 1,3-butadiene Zhen-Dong Sun a,1 , Li-Hong Xu a, * , R.M. Lees a , Xing-Jie Jiang a , Sean Perry a , Norman C. Craig b a Canadian Institute for Photonic Innovations (CIPI), Centre for Laser, Atomic, and Molecular Science (CLAMS), and Department of Physical Sciences, University of New Brunswick, 100 Tucker Park Road, Saint John, NB, Canada E2L 4L5 b Department of Chemistry, Science Center A263, Oberlin College, 119 Woodland St., Oberlin, OH 44074-1097, USA Received 27 September 2004; revised 23 November 2004; accepted 23 November 2004 Available online 8 February 2005 Abstract The infrared spectrum of the n 11 (a u ) out-of-plane CH 2 -wagging vibrational mode of the environmentally important 1,3-butadiene molecule has been investigated at sub-Doppler resolution with a CO 2 -laser/microwave-sideband spectrometer in order to fully resolve the rotational structure in a number of compact R Q-branch heads. The center frequencies of over 90 saturation Lamb dips in the 11 mm region have been measured with an estimated absolute accuracy of 200 kHz. The new data have been combined with previous Fourier transform results to refine the parameters in the molecular Hamiltonian. A value of jdm c /dQ 11 jZ0.3135 debye has been obtained for the transition dipole derivative for the n 11 mode on the basis of ab initio calculations. q 2005 Elsevier B.V. All rights reserved. Keywords: 1,3-Butadiene; Infrared spectra; Sideband spectrometer; Lamb dip; Sub-Doppler measurement; Dipole derivative; Line intensities 1. Introduction This paper reports sub-Doppler infrared spectral measurements and an ab initio-based dipole derivative calculation for the CH 2 -wagging n 11 (a u ) vibrational mode of 1,3-butadiene. Butadiene is a molecule of major industrial and environmental importance as well as of fundamental spectroscopic interest. It ranked 36th on the list of most produced chemicals in the USA in the mid-90s and has a worldwide annual production of approximately 5.5 billion kg, used principally for manufacture of synthetic rubber and plastics with small amounts also found in gasoline. Environmentally, 1,3-butadiene is a widespread pollutant entering the atmosphere in trace quantities primarily via combustion processes. It is a component both of vehicle exhaust and of cigarette smoke. From a health perspective, it is a known irritant and carcinogen [1] and is regulated under the Clean Air Act and Toxic Substances Control Act by the Environmental Protection Agency in the USA and under the Canadian Environmental Protection Act in Canada. Thus, detailed information on its fundamental physical properties is of significance. Scientifically, as the simplest of the polyenes, 1,3- butadiene is a prototype for studies of structural effects and skeletal torsion associated with conjugated p-bonding and has thereby attracted much ab initio theoretical interest (see [2] and [3], for example, and the references cited therein). However, because the lowest energy planar trans form of the normal isotopic species is non-polar, detailed infor- mation is not available from traditional microwave spectroscopy and must be sought instead from rotationally resolved infrared vibrational spectra. Rotational constants for the ground state have been reported in two recent studies. One was a Fourier transform infrared (FTIR) investigation of the CH 2 -wagging n 11 vibrational mode at 11 mm [4], while the other employed a slit-jet difference- frequency laser instrument to record the spectrum of the n 1 CH-stretching band around 3 mm at sub-Doppler resolution in a cooled molecular jet [5,6]. Both works are in substantial 0022-2860/$ - see front matter q 2005 Elsevier B.V. All rights reserved. doi:10.1016/j.molstruc.2004.11.093 Journal of Molecular Structure 742 (2005) 69–76 www.elsevier.com/locate/molstruc * Corresponding author. Tel.: C1 506 648 5632; fax: C1 506 648 5948. E-mail address: [email protected] (L.-H. Xu). 1 Permanent address: Department of Physics, Yantai University, Yantai 264005, People’s Republic of China.
-
Upload
newbrunswick -
Category
Documents
-
view
1 -
download
0
Transcript of Sub-Doppler RQ-branch spectra and ab initio dipole derivative calculation for the ν11 (au)...

Sub-Doppler RQ-branch spectra and ab initio dipole derivative calculation
for the n11 (au) CH2-wagging mode of 1,3-butadiene
Zhen-Dong Suna,1, Li-Hong Xua,*, R.M. Leesa, Xing-Jie Jianga, Sean Perrya, Norman C. Craigb
aCanadian Institute for Photonic Innovations (CIPI), Centre for Laser, Atomic, and Molecular Science (CLAMS), and Department of Physical Sciences,
University of New Brunswick, 100 Tucker Park Road, Saint John, NB, Canada E2L 4L5bDepartment of Chemistry, Science Center A263, Oberlin College, 119 Woodland St., Oberlin, OH 44074-1097, USA
Received 27 September 2004; revised 23 November 2004; accepted 23 November 2004
Available online 8 February 2005
Abstract
The infrared spectrum of the n11 (au) out-of-plane CH2-wagging vibrational mode of the environmentally important 1,3-butadiene
molecule has been investigated at sub-Doppler resolution with a CO2-laser/microwave-sideband spectrometer in order to fully resolve the
rotational structure in a number of compact RQ-branch heads. The center frequencies of over 90 saturation Lamb dips in the 11 mm region
have been measured with an estimated absolute accuracy of 200 kHz. The new data have been combined with previous Fourier transform
results to refine the parameters in the molecular Hamiltonian. A value of jdmc/dQ11jZ0.3135 debye has been obtained for the transition
dipole derivative for the n11 mode on the basis of ab initio calculations.
q 2005 Elsevier B.V. All rights reserved.
Keywords: 1,3-Butadiene; Infrared spectra; Sideband spectrometer; Lamb dip; Sub-Doppler measurement; Dipole derivative; Line intensities
1. Introduction
This paper reports sub-Doppler infrared spectral
measurements and an ab initio-based dipole derivative
calculation for the CH2-wagging n11 (au) vibrational mode
of 1,3-butadiene. Butadiene is a molecule of major
industrial and environmental importance as well as of
fundamental spectroscopic interest. It ranked 36th on the list
of most produced chemicals in the USA in the mid-90s and
has a worldwide annual production of approximately
5.5 billion kg, used principally for manufacture of synthetic
rubber and plastics with small amounts also found in
gasoline. Environmentally, 1,3-butadiene is a widespread
pollutant entering the atmosphere in trace quantities
primarily via combustion processes. It is a component
both of vehicle exhaust and of cigarette smoke. From a
health perspective, it is a known irritant and carcinogen [1]
0022-2860/$ - see front matter q 2005 Elsevier B.V. All rights reserved.
doi:10.1016/j.molstruc.2004.11.093
* Corresponding author. Tel.: C1 506 648 5632; fax: C1 506 648 5948.
E-mail address: [email protected] (L.-H. Xu).1 Permanent address: Department of Physics, Yantai University, Yantai
264005, People’s Republic of China.
and is regulated under the Clean Air Act and Toxic
Substances Control Act by the Environmental Protection
Agency in the USA and under the Canadian Environmental
Protection Act in Canada. Thus, detailed information on its
fundamental physical properties is of significance.
Scientifically, as the simplest of the polyenes, 1,3-
butadiene is a prototype for studies of structural effects and
skeletal torsion associated with conjugated p-bonding and
has thereby attracted much ab initio theoretical interest (see
[2] and [3], for example, and the references cited therein).
However, because the lowest energy planar trans form of
the normal isotopic species is non-polar, detailed infor-
mation is not available from traditional microwave
spectroscopy and must be sought instead from rotationally
resolved infrared vibrational spectra. Rotational constants
for the ground state have been reported in two recent
studies. One was a Fourier transform infrared (FTIR)
investigation of the CH2-wagging n11 vibrational mode at
11 mm [4], while the other employed a slit-jet difference-
frequency laser instrument to record the spectrum of the n1
CH-stretching band around 3 mm at sub-Doppler resolution
in a cooled molecular jet [5,6]. Both works are in substantial
Journal of Molecular Structure 742 (2005) 69–76
www.elsevier.com/locate/molstruc
Z.-D. Sun et al. / Journal of Molecular Structure 742 (2005) 69–7670
agreement on the values of the ground-state rotational
constants, while providing constants for different upper
vibrational states. Our present work represents an extension
to the FTIR study in which we too have achieved sub-
Doppler resolution within a number of dense RQ-branch
heads in the n11 band by employing saturation Lamb-dip
detection with a CO2-laser/microwave-sideband spec-
trometer [7].
The CH2-wagging n11 (au) vibrational mode of 1,3-
butadiene gives rise to a well-defined c-type band
centered at 908 cmK1. The FTIR spectrum of this band
was recorded on a Bruker IFS 120 HR instrument by
Michael Lock at 0.002 cmK1 resolution at Justus-Liebig
University in Giessen, Germany, and was analyzed at
Oberlin College [4]. The rotational analysis is at an
advanced stage with lines observed up to Ka0Z24 and J
as high as 70. The part of the band with Ka0%10
appeared to be unperturbed and was fitted to experimen-
tal accuracy employing a Watson-type asymmetric rotor
Hamiltonian in A-reduction with 9 parameters (Evib, A,
B, C, DJ, DJK, DK, dJ, dK) [4]. Similar rotational analyses
for the butadiene-2,3-d2 isotopic species [4] and the three
1,4-d2 species have also been completed [8].
In the resolution-limited FTIR spectrum, the RQ-branch
heads were generally unresolved for Q branches of medium
K. Accordingly, we have carried out saturation Lamb-dip
measurements for several of these Q-branch heads. Our
motivations were (i) to test the performance of the CO2-
laser/microwave-sideband spectrometer in our laboratory
for a larger molecular species than usually studied with
Lamb-dip techniques, (ii) to resolve and obtain accurate line
positions for the overlapped components in the Q-branch
heads, and (iii) to obtain an estimate of the dipole derivative
for this band. The latter is an important piece of information
needed in connection with detection and quantification of
1,3-butadiene in cigarette smoke with a tunable diode laser
system [9].
In an initial exploration at Doppler-limited resolution
using the broad-band scanning mode of our instrument [7],
we observed the KaZ10)9, 9)8, 8)7, 7)6, 6)5 and
5)4 Q-branch heads. Collectively, they are strong features
in the spectrum. We then moved to the sub-Doppler
saturation Lamb-dip mode of the spectrometer [7,11] and
were able to fully resolve and measure all components of the
KaZ10)9, 9)8, 8)7, and 7)6 Q-branch heads. Our
observed line positions are close to predictions based on the
previous FTIR analysis [4] but reveal systematic differences
ranging up to a few tens of MHz. As well, a dipole
derivative for the n11 mode has been obtained based on an ab
initio B3LYP/6-311CCG** calculation using GAUSSIAN 03
[10]. Our value is consistent with an estimation obtained
through comparison of the intensities of the weakest Lamb-
dip signals observed for 1,3-butadiene against those of other
molecular bands (such as the n8 fundamental of CH3OH [7]
and the 2n2 overtone of OCS [11]) measured on the same
apparatus.
2. Experimental details and analysis procedure
The CO2-laser/microwave-sideband spectrometer used
for the present study has been described previously in some
detail [7,11,12]. Earlier experiments employed hot,
sequence and regular lines of the 9-mm CO2 laser band for
both broadband surveys and saturation Lamb-dip measure-
ments of methanol (CH3OH) [7] and for sub-Doppler
measurements of carbonyl sulfide (OCS) [11]. Readers are
referred to these previous papers for details of the setup and
measurement procedures. For the 1,3-butadiene work, we
needed to switch down to the lower 11-mm 10P CO2 laser
band and so had to change the mirror set in the Fabry-Perot
etalon filter, but otherwise the experimental system
remained the same apart from extensive realignment.
The 1,3-butadiene sample had a stated purity of 99C%
(inhibited with p-tert-butylcatechol) and was obtained from
Sigma-Aldrich in a small 100-g lecture bottle. In transfer-
ring the sample to our system we first filled a 1000 ml Pyrex
flask with the vapor to a pressure of about 6 Torr and carried
out several freeze-pump-thaw cycles in a liquid-N2-cooled
sidearm to remove any residual air or other impurities. The
sample was then admitted at room temperature into our
0.6-m base multipass cell, which was set to 16 transits for a
total path length of 9.6 m.
The current work on the 908 cmK1 n11 band involved the
use of high-J CO2 laser lines in the 10P region. Aided by
the Fourier transform spectra, we first determined which of
the RQ-branches would overlap with available laser side-
bands using a search engine built in Matlab. We then
recorded Doppler-limited survey spectra using the broad-
band scanning mode of the spectrometer, and observed all of
the expected Q-branch heads with a signal-to-noise (S/N)
ratio comparable to the FTIR results. Here, we employed
signal/background ratioing [7,12] with dual HgCdTe
detectors and identical lock-in amplifiers set to 0.3-s time
constant, optical chopping at 1 kHz, and a sample pressure
of w80 mTorr. Fig. 1 shows a comparison between the
FTIR trace (bottom) for the KaZ6)5 RQ branch and our
broad-scan sideband spectrum (top) taken with one of the
hot-band CO2 laser lines. It can be seen that our trace
displays slightly better resolution with somewhat sharper
spectral features.
Following the broadband survey scans, we examined
the RQ-branch heads in detail employing the saturation
Lamb-dip technique [7,11]. Compared with our previous
work on methanol (CH3OH) and carbonyl sulfide (OCS),
the present Lamb-dip measurements for 1,3-butadiene
(C4H6) presented a significant challenge because (i) 1,3-
butadiene is a relatively large molecule with a much
higher spectral line density so that each unresolved RQ-
branch head in the FTIR spectrum typically contains
more than 10 rotational components piled up in a
frequency window of less than 0.02 cmK1, (ii) the CO2
laser lines that overlap with the RQ-branch heads are
in the high-J 10P region where the laser power is low,
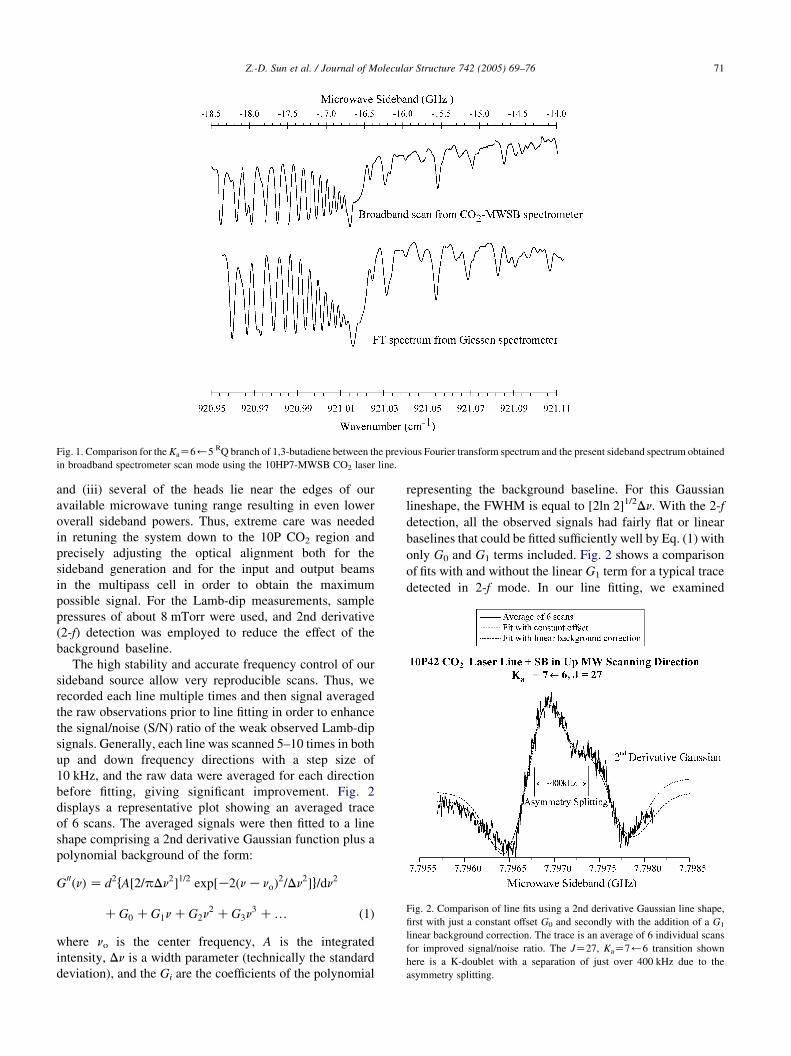
Fig. 1. Comparison for the KaZ6)5 RQ branch of 1,3-butadiene between the previous Fourier transform spectrum and the present sideband spectrum obtained
in broadband spectrometer scan mode using the 10HP7-MWSB CO2 laser line.
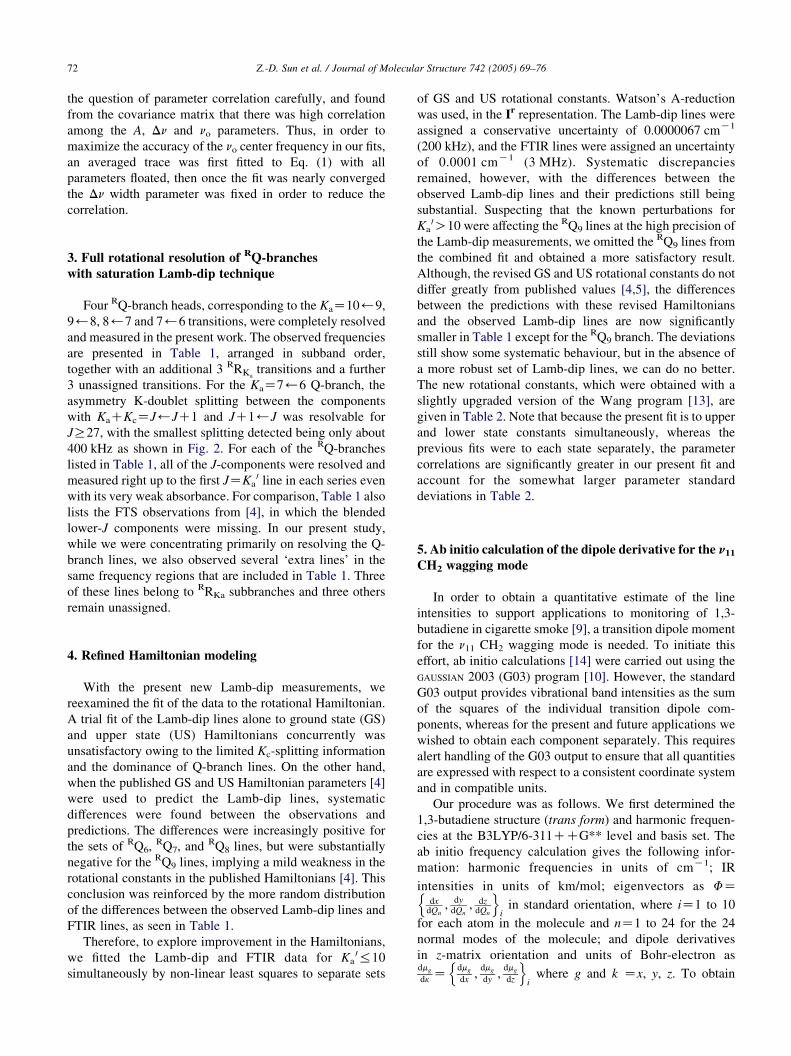
Fig. 2. Comparison of line fits using a 2nd derivative Gaussian line shape,
first with just a constant offset G0 and secondly with the addition of a G1
linear background correction. The trace is an average of 6 individual scans
for improved signal/noise ratio. The JZ27, KaZ7)6 transition shown
here is a K-doublet with a separation of just over 400 kHz due to the
asymmetry splitting.
Z.-D. Sun et al. / Journal of Molecular Structure 742 (2005) 69–76 71
and (iii) several of the heads lie near the edges of our
available microwave tuning range resulting in even lower
overall sideband powers. Thus, extreme care was needed
in retuning the system down to the 10P CO2 region and
precisely adjusting the optical alignment both for the
sideband generation and for the input and output beams
in the multipass cell in order to obtain the maximum
possible signal. For the Lamb-dip measurements, sample
pressures of about 8 mTorr were used, and 2nd derivative
(2-f) detection was employed to reduce the effect of the
background baseline.
The high stability and accurate frequency control of our
sideband source allow very reproducible scans. Thus, we
recorded each line multiple times and then signal averaged
the raw observations prior to line fitting in order to enhance
the signal/noise (S/N) ratio of the weak observed Lamb-dip
signals. Generally, each line was scanned 5–10 times in both
up and down frequency directions with a step size of
10 kHz, and the raw data were averaged for each direction
before fitting, giving significant improvement. Fig. 2
displays a representative plot showing an averaged trace
of 6 scans. The averaged signals were then fitted to a line
shape comprising a 2nd derivative Gaussian function plus a
polynomial background of the form:
G00ðnÞ Z d2fA½2=pDn2�1=2 exp½K2ðn KnoÞ2=Dn2�g=dn2
CG0 CG1n CG2n2 CG3n3 C. (1)
where no is the center frequency, A is the integrated
intensity, Dn is a width parameter (technically the standard
deviation), and the Gi are the coefficients of the polynomial
representing the background baseline. For this Gaussian
lineshape, the FWHM is equal to [2ln 2]1/2Dn. With the 2-f
detection, all the observed signals had fairly flat or linear
baselines that could be fitted sufficiently well by Eq. (1) with
only G0 and G1 terms included. Fig. 2 shows a comparison
of fits with and without the linear G1 term for a typical trace
detected in 2-f mode. In our line fitting, we examined
Z.-D. Sun et al. / Journal of Molecular Structure 742 (2005) 69–7672
the question of parameter correlation carefully, and found
from the covariance matrix that there was high correlation
among the A, Dn and no parameters. Thus, in order to
maximize the accuracy of the no center frequency in our fits,
an averaged trace was first fitted to Eq. (1) with all
parameters floated, then once the fit was nearly converged
the Dn width parameter was fixed in order to reduce the
correlation.
3. Full rotational resolution of RQ-branches
with saturation Lamb-dip technique
Four RQ-branch heads, corresponding to the KaZ10)9,
9)8, 8)7 and 7)6 transitions, were completely resolved
and measured in the present work. The observed frequencies
are presented in Table 1, arranged in subband order,
together with an additional 3 RRKatransitions and a further
3 unassigned transitions. For the KaZ7)6 Q-branch, the
asymmetry K-doublet splitting between the components
with KaCKcZJ)JC1 and JC1)J was resolvable for
JR27, with the smallest splitting detected being only about
400 kHz as shown in Fig. 2. For each of the RQ-branches
listed in Table 1, all of the J-components were resolved and
measured right up to the first JZKa0 line in each series even
with its very weak absorbance. For comparison, Table 1 also
lists the FTS observations from [4], in which the blended
lower-J components were missing. In our present study,
while we were concentrating primarily on resolving the Q-
branch lines, we also observed several ‘extra lines’ in the
same frequency regions that are included in Table 1. Three
of these lines belong to RRKa subbranches and three others
remain unassigned.
4. Refined Hamiltonian modeling
With the present new Lamb-dip measurements, we
reexamined the fit of the data to the rotational Hamiltonian.
A trial fit of the Lamb-dip lines alone to ground state (GS)
and upper state (US) Hamiltonians concurrently was
unsatisfactory owing to the limited Kc-splitting information
and the dominance of Q-branch lines. On the other hand,
when the published GS and US Hamiltonian parameters [4]
were used to predict the Lamb-dip lines, systematic
differences were found between the observations and
predictions. The differences were increasingly positive for
the sets of RQ6, RQ7, and RQ8 lines, but were substantially
negative for the RQ9 lines, implying a mild weakness in the
rotational constants in the published Hamiltonians [4]. This
conclusion was reinforced by the more random distribution
of the differences between the observed Lamb-dip lines and
FTIR lines, as seen in Table 1.
Therefore, to explore improvement in the Hamiltonians,
we fitted the Lamb-dip and FTIR data for Ka0%10
simultaneously by non-linear least squares to separate sets
of GS and US rotational constants. Watson’s A-reduction
was used, in the Ir representation. The Lamb-dip lines were
assigned a conservative uncertainty of 0.0000067 cmK1
(200 kHz), and the FTIR lines were assigned an uncertainty
of 0.0001 cmK1 (3 MHz). Systematic discrepancies
remained, however, with the differences between the
observed Lamb-dip lines and their predictions still being
substantial. Suspecting that the known perturbations for
Ka0O10 were affecting the RQ9 lines at the high precision of
the Lamb-dip measurements, we omitted the RQ9 lines from
the combined fit and obtained a more satisfactory result.
Although, the revised GS and US rotational constants do not
differ greatly from published values [4,5], the differences
between the predictions with these revised Hamiltonians
and the observed Lamb-dip lines are now significantly
smaller in Table 1 except for the RQ9 branch. The deviations
still show some systematic behaviour, but in the absence of
a more robust set of Lamb-dip lines, we can do no better.
The new rotational constants, which were obtained with a
slightly upgraded version of the Wang program [13], are
given in Table 2. Note that because the present fit is to upper
and lower state constants simultaneously, whereas the
previous fits were to each state separately, the parameter
correlations are significantly greater in our present fit and
account for the somewhat larger parameter standard
deviations in Table 2.
5. Ab initio calculation of the dipole derivative for the n11
CH2 wagging mode
In order to obtain a quantitative estimate of the line
intensities to support applications to monitoring of 1,3-
butadiene in cigarette smoke [9], a transition dipole moment
for the n11 CH2 wagging mode is needed. To initiate this
effort, ab initio calculations [14] were carried out using the
GAUSSIAN 2003 (G03) program [10]. However, the standard
G03 output provides vibrational band intensities as the sum
of the squares of the individual transition dipole com-
ponents, whereas for the present and future applications we
wished to obtain each component separately. This requires
alert handling of the G03 output to ensure that all quantities
are expressed with respect to a consistent coordinate system
and in compatible units.
Our procedure was as follows. We first determined the
1,3-butadiene structure (trans form) and harmonic frequen-
cies at the B3LYP/6-311CCG** level and basis set. The
ab initio frequency calculation gives the following infor-
mation: harmonic frequencies in units of cmK1; IR
intensities in units of km/mol; eigenvectors as FZdx
dQn; dy
dQn; dz
dQn
n oi
in standard orientation, where iZ1 to 10
for each atom in the molecule and nZ1 to 24 for the 24
normal modes of the molecule; and dipole derivatives
in z-matrix orientation and units of Bohr-electron asdmg
dkZ
dmg
dx;
dmg
dy;
dmg
dz
n oi
where g and k Zx, y, z. To obtain
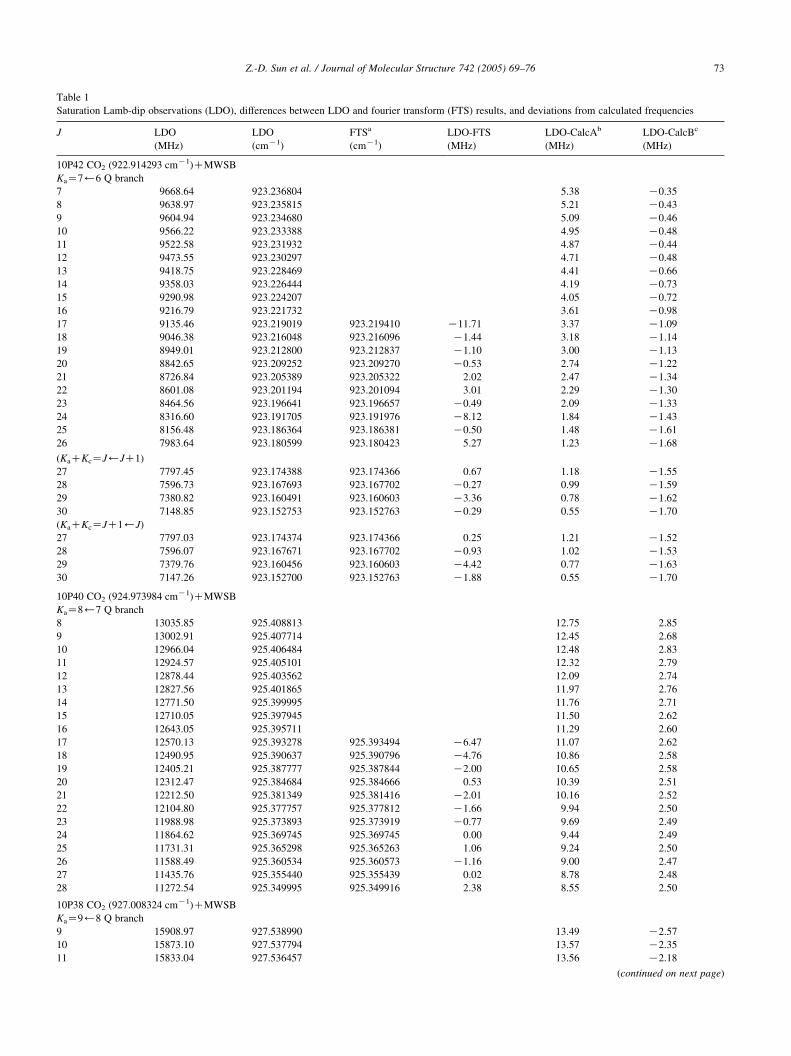
Table 1
Saturation Lamb-dip observations (LDO), differences between LDO and fourier transform (FTS) results, and deviations from calculated frequencies
J LDO
(MHz)
LDO
(cmK1)
FTSa
(cmK1)
LDO-FTS
(MHz)
LDO-CalcAb
(MHz)
LDO-CalcBc
(MHz)
10P42 CO2 (922.914293 cmK1)CMWSB
KaZ7)6 Q branch
7 9668.64 923.236804 5.38 K0.35
8 9638.97 923.235815 5.21 K0.43
9 9604.94 923.234680 5.09 K0.46
10 9566.22 923.233388 4.95 K0.48
11 9522.58 923.231932 4.87 K0.44
12 9473.55 923.230297 4.71 K0.48
13 9418.75 923.228469 4.41 K0.66
14 9358.03 923.226444 4.19 K0.73
15 9290.98 923.224207 4.05 K0.72
16 9216.79 923.221732 3.61 K0.98
17 9135.46 923.219019 923.219410 K11.71 3.37 K1.09
18 9046.38 923.216048 923.216096 K1.44 3.18 K1.14
19 8949.01 923.212800 923.212837 K1.10 3.00 K1.13
20 8842.65 923.209252 923.209270 K0.53 2.74 K1.22
21 8726.84 923.205389 923.205322 2.02 2.47 K1.34
22 8601.08 923.201194 923.201094 3.01 2.29 K1.30
23 8464.56 923.196641 923.196657 K0.49 2.09 K1.33
24 8316.60 923.191705 923.191976 K8.12 1.84 K1.43
25 8156.48 923.186364 923.186381 K0.50 1.48 K1.61
26 7983.64 923.180599 923.180423 5.27 1.23 K1.68
(KaCKcZJ)JC1)
27 7797.45 923.174388 923.174366 0.67 1.18 K1.55
28 7596.73 923.167693 923.167702 K0.27 0.99 K1.59
29 7380.82 923.160491 923.160603 K3.36 0.78 K1.62
30 7148.85 923.152753 923.152763 K0.29 0.55 K1.70
(KaCKcZJC1)J)
27 7797.03 923.174374 923.174366 0.25 1.21 K1.52
28 7596.07 923.167671 923.167702 K0.93 1.02 K1.53
29 7379.76 923.160456 923.160603 K4.42 0.77 K1.63
30 7147.26 923.152700 923.152763 K1.88 0.55 K1.70
10P40 CO2 (924.973984 cmK1)CMWSB
KaZ8)7 Q branch
8 13035.85 925.408813 12.75 2.85
9 13002.91 925.407714 12.45 2.68
10 12966.04 925.406484 12.48 2.83
11 12924.57 925.405101 12.32 2.79
12 12878.44 925.403562 12.09 2.74
13 12827.56 925.401865 11.97 2.76
14 12771.50 925.399995 11.76 2.71
15 12710.05 925.397945 11.50 2.62
16 12643.05 925.395711 11.29 2.60
17 12570.13 925.393278 925.393494 K6.47 11.07 2.62
18 12490.95 925.390637 925.390796 K4.76 10.86 2.58
19 12405.21 925.387777 925.387844 K2.00 10.65 2.58
20 12312.47 925.384684 925.384666 0.53 10.39 2.51
21 12212.50 925.381349 925.381416 K2.01 10.16 2.52
22 12104.80 925.377757 925.377812 K1.66 9.94 2.50
23 11988.98 925.373893 925.373919 K0.77 9.69 2.49
24 11864.62 925.369745 925.369745 0.00 9.44 2.49
25 11731.31 925.365298 925.365263 1.06 9.24 2.50
26 11588.49 925.360534 925.360573 K1.16 9.00 2.47
27 11435.76 925.355440 925.355439 0.02 8.78 2.48
28 11272.54 925.349995 925.349916 2.38 8.55 2.50
10P38 CO2 (927.008324 cmK1)CMWSB
KaZ9)8 Q branch
9 15908.97 927.538990 13.49 K2.57
10 15873.10 927.537794 13.57 K2.35
11 15833.04 927.536457 13.56 K2.18
(continued on next page)
Z.-D. Sun et al. / Journal of Molecular Structure 742 (2005) 69–76 73
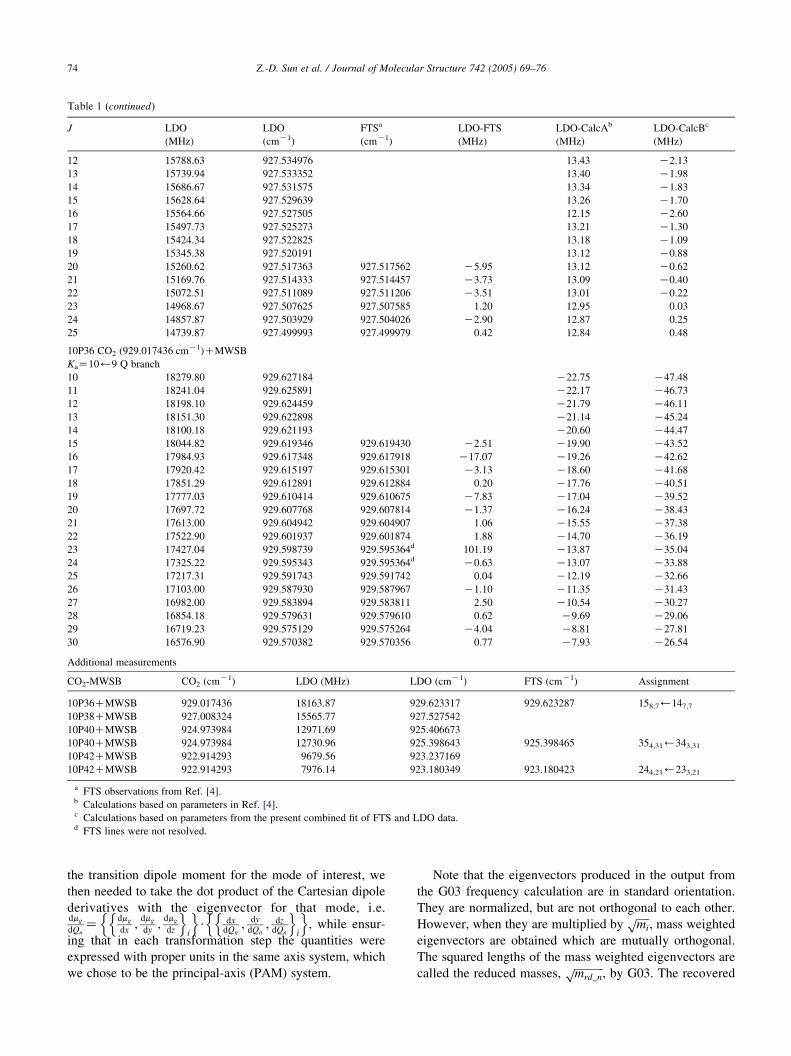
Table 1 (continued)
J LDO
(MHz)
LDO
(cmK1)
FTSa
(cmK1)
LDO-FTS
(MHz)
LDO-CalcAb
(MHz)
LDO-CalcBc
(MHz)
12 15788.63 927.534976 13.43 K2.13
13 15739.94 927.533352 13.40 K1.98
14 15686.67 927.531575 13.34 K1.83
15 15628.64 927.529639 13.26 K1.70
16 15564.66 927.527505 12.15 K2.60
17 15497.73 927.525273 13.21 K1.30
18 15424.34 927.522825 13.18 K1.09
19 15345.38 927.520191 13.12 K0.88
20 15260.62 927.517363 927.517562 K5.95 13.12 K0.62
21 15169.76 927.514333 927.514457 K3.73 13.09 K0.40
22 15072.51 927.511089 927.511206 K3.51 13.01 K0.22
23 14968.67 927.507625 927.507585 1.20 12.95 0.03
24 14857.87 927.503929 927.504026 K2.90 12.87 0.25
25 14739.87 927.499993 927.499979 0.42 12.84 0.48
10P36 CO2 (929.017436 cmK1)CMWSB
KaZ10)9 Q branch
10 18279.80 929.627184 K22.75 K47.48
11 18241.04 929.625891 K22.17 K46.73
12 18198.10 929.624459 K21.79 K46.11
13 18151.30 929.622898 K21.14 K45.24
14 18100.18 929.621193 K20.60 K44.47
15 18044.82 929.619346 929.619430 K2.51 K19.90 K43.52
16 17984.93 929.617348 929.617918 K17.07 K19.26 K42.62
17 17920.42 929.615197 929.615301 K3.13 K18.60 K41.68
18 17851.29 929.612891 929.612884 0.20 K17.76 K40.51
19 17777.03 929.610414 929.610675 K7.83 K17.04 K39.52
20 17697.72 929.607768 929.607814 K1.37 K16.24 K38.43
21 17613.00 929.604942 929.604907 1.06 K15.55 K37.38
22 17522.90 929.601937 929.601874 1.88 K14.70 K36.19
23 17427.04 929.598739 929.595364d 101.19 K13.87 K35.04
24 17325.22 929.595343 929.595364d K0.63 K13.07 K33.88
25 17217.31 929.591743 929.591742 0.04 K12.19 K32.66
26 17103.00 929.587930 929.587967 K1.10 K11.35 K31.43
27 16982.00 929.583894 929.583811 2.50 K10.54 K30.27
28 16854.18 929.579631 929.579610 0.62 K9.69 K29.06
29 16719.23 929.575129 929.575264 K4.04 K8.81 K27.81
30 16576.90 929.570382 929.570356 0.77 K7.93 K26.54
Additional measurements
CO2-MWSB CO2 (cmK1) LDO (MHz) LDO (cmK1) FTS (cmK1) Assignment
10P36CMWSB 929.017436 18163.87 929.623317 929.623287 158,7)147,7
10P38CMWSB 927.008324 15565.77 927.527542
10P40CMWSB 924.973984 12971.69 925.406673
10P40CMWSB 924.973984 12730.96 925.398643 925.398465 354,31)343,31
10P42CMWSB 922.914293 9679.56 923.237169
10P42CMWSB 922.914293 7976.14 923.180349 923.180423 244,21)233,21
a FTS observations from Ref. [4].b Calculations based on parameters in Ref. [4].c Calculations based on parameters from the present combined fit of FTS and LDO data.d FTS lines were not resolved.
Z.-D. Sun et al. / Journal of Molecular Structure 742 (2005) 69–7674
the transition dipole moment for the mode of interest, we
then needed to take the dot product of the Cartesian dipole
derivatives with the eigenvector for that mode, i.e.dmg
dQnZ
dmg
dx;
dmg
dy;
dmg
dz
n oi
n o$ dx
dQn; dy
dQn; dz
dQn
n oi
n o, while ensur-
ing that in each transformation step the quantities were
expressed with proper units in the same axis system, which
we chose to be the principal-axis (PAM) system.
Note that the eigenvectors produced in the output from
the G03 frequency calculation are in standard orientation.
They are normalized, but are not orthogonal to each other.
However, when they are multiplied byffiffiffiffiffimi
p, mass weighted
eigenvectors are obtained which are mutually orthogonal.
The squared lengths of the mass weighted eigenvectors are
called the reduced masses,ffiffiffiffiffiffiffiffiffiffiffimrd_n
p, by G03. The recovered
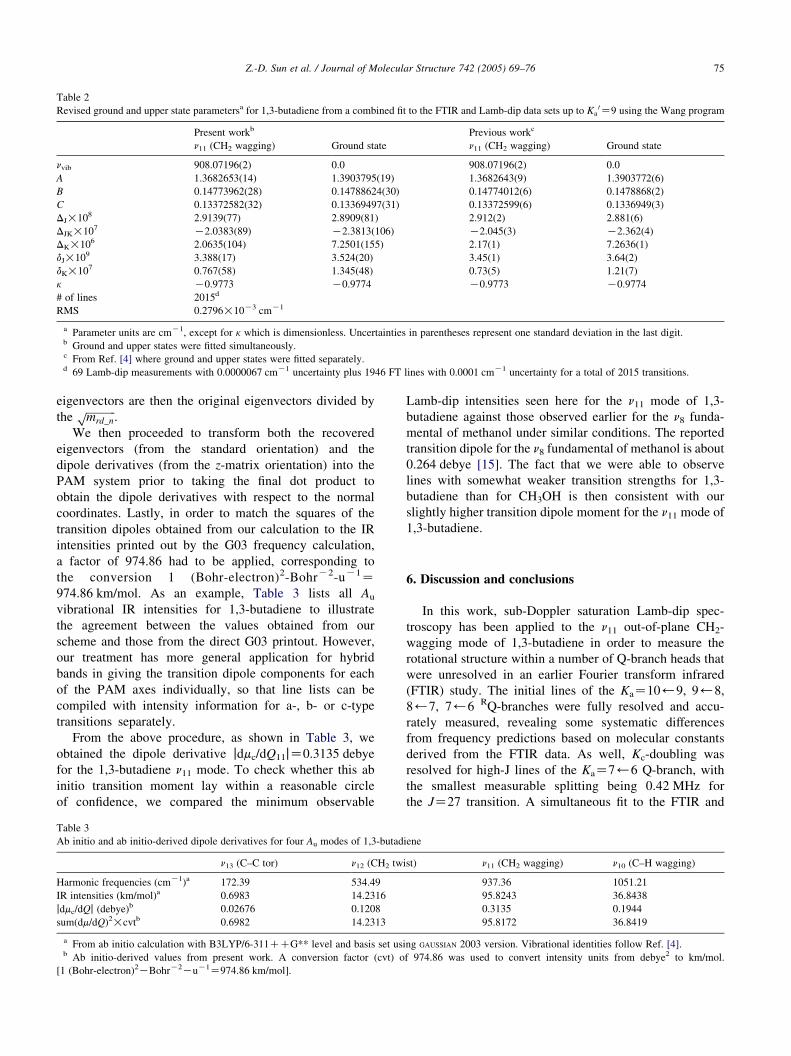
Table 2
Revised ground and upper state parametersa for 1,3-butadiene from a combined fit to the FTIR and Lamb-dip data sets up to Ka0Z9 using the Wang program
Present workb Previous workc
n11 (CH2 wagging) Ground state n11 (CH2 wagging) Ground state
nvib 908.07196(2) 0.0 908.07196(2) 0.0
A 1.3682653(14) 1.3903795(19) 1.3682643(9) 1.3903772(6)
B 0.14773962(28) 0.14788624(30) 0.14774012(6) 0.1478868(2)
C 0.13372582(32) 0.13369497(31) 0.13372599(6) 0.1336949(3)
DJ!108 2.9139(77) 2.8909(81) 2.912(2) 2.881(6)
DJK!107 K2.0383(89) K2.3813(106) K2.045(3) K2.362(4)
DK!106 2.0635(104) 7.2501(155) 2.17(1) 7.2636(1)
dJ!109 3.388(17) 3.524(20) 3.45(1) 3.64(2)
dK!107 0.767(58) 1.345(48) 0.73(5) 1.21(7)
k K0.9773 K0.9774 K0.9773 K0.9774
# of lines 2015d
RMS 0.2796!10K3 cmK1
a Parameter units are cmK1, except for k which is dimensionless. Uncertainties in parentheses represent one standard deviation in the last digit.b Ground and upper states were fitted simultaneously.c From Ref. [4] where ground and upper states were fitted separately.d 69 Lamb-dip measurements with 0.0000067 cmK1 uncertainty plus 1946 FT lines with 0.0001 cmK1 uncertainty for a total of 2015 transitions.
Z.-D. Sun et al. / Journal of Molecular Structure 742 (2005) 69–76 75
eigenvectors are then the original eigenvectors divided by
theffiffiffiffiffiffiffiffiffiffiffimrd_n
p.
We then proceeded to transform both the recovered
eigenvectors (from the standard orientation) and the
dipole derivatives (from the z-matrix orientation) into the
PAM system prior to taking the final dot product to
obtain the dipole derivatives with respect to the normal
coordinates. Lastly, in order to match the squares of the
transition dipoles obtained from our calculation to the IR
intensities printed out by the G03 frequency calculation,
a factor of 974.86 had to be applied, corresponding to
the conversion 1 (Bohr-electron)2-BohrK2-uK1Z974.86 km/mol. As an example, Table 3 lists all Au
vibrational IR intensities for 1,3-butadiene to illustrate
the agreement between the values obtained from our
scheme and those from the direct G03 printout. However,
our treatment has more general application for hybrid
bands in giving the transition dipole components for each
of the PAM axes individually, so that line lists can be
compiled with intensity information for a-, b- or c-type
transitions separately.
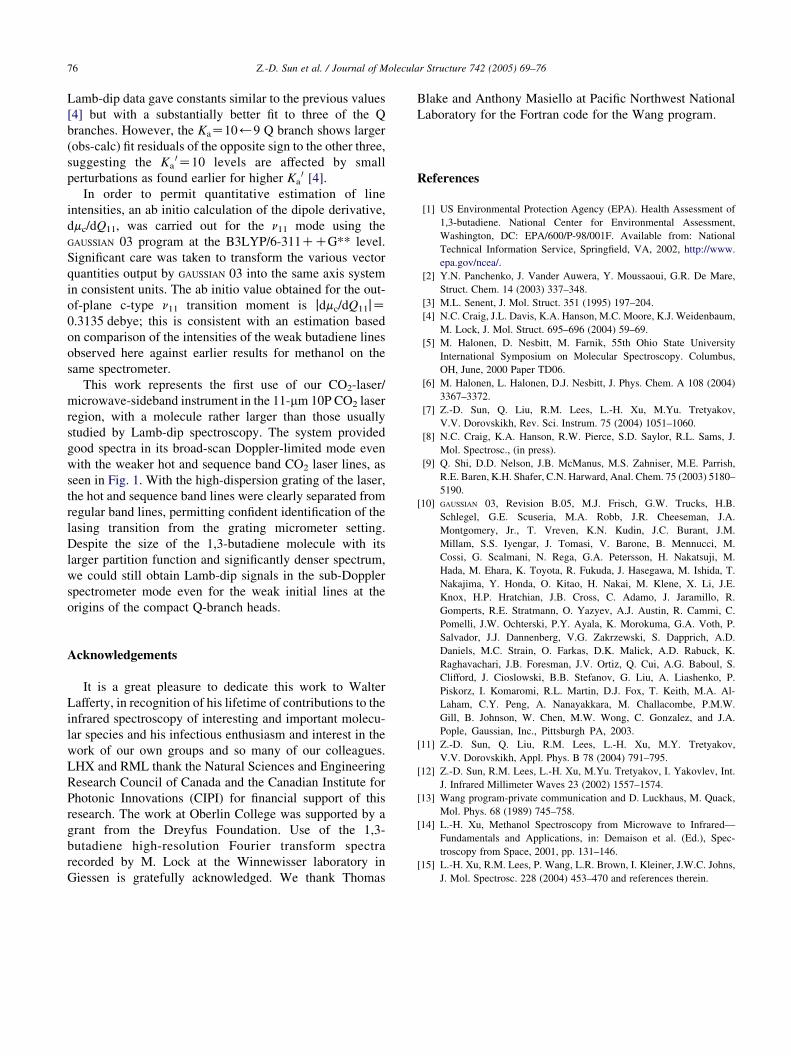
From the above procedure, as shown in Table 3, we
obtained the dipole derivative jdmc/dQ11jZ0.3135 debye
for the 1,3-butadiene n11 mode. To check whether this ab
initio transition moment lay within a reasonable circle
of confidence, we compared the minimum observable
Table 3
Ab initio and ab initio-derived dipole derivatives for four Au modes of 1,3-butad
n13 (C–C tor) n12 (CH2 tw
Harmonic frequencies (cmK1)a 172.39 534.49
IR intensities (km/mol)a 0.6983 14.2316
jdmc/dQj (debye)b 0.02676 0.1208
sum(dm/dQ)2!cvtb 0.6982 14.2313
a From ab initio calculation with B3LYP/6-311CCG** level and basis set usib Ab initio-derived values from present work. A conversion factor (cvt) o
[1 (Bohr-electron)2KBohrK2KuK1Z974.86 km/mol].
Lamb-dip intensities seen here for the n11 mode of 1,3-
butadiene against those observed earlier for the n8 funda-
mental of methanol under similar conditions. The reported
transition dipole for the n8 fundamental of methanol is about
0.264 debye [15]. The fact that we were able to observe
lines with somewhat weaker transition strengths for 1,3-
butadiene than for CH3OH is then consistent with our
slightly higher transition dipole moment for the n11 mode of
1,3-butadiene.
6. Discussion and conclusions
In this work, sub-Doppler saturation Lamb-dip spec-
troscopy has been applied to the n11 out-of-plane CH2-
wagging mode of 1,3-butadiene in order to measure the
rotational structure within a number of Q-branch heads that
were unresolved in an earlier Fourier transform infrared
(FTIR) study. The initial lines of the KaZ10)9, 9)8,
8)7, 7)6 RQ-branches were fully resolved and accu-
rately measured, revealing some systematic differences
from frequency predictions based on molecular constants
derived from the FTIR data. As well, Kc-doubling was
resolved for high-J lines of the KaZ7)6 Q-branch, with
the smallest measurable splitting being 0.42 MHz for
the JZ27 transition. A simultaneous fit to the FTIR and
iene
ist) n11 (CH2 wagging) n10 (C–H wagging)
937.36 1051.21
95.8243 36.8438
0.3135 0.1944
95.8172 36.8419
ng GAUSSIAN 2003 version. Vibrational identities follow Ref. [4].
f 974.86 was used to convert intensity units from debye2 to km/mol.
Z.-D. Sun et al. / Journal of Molecular Structure 742 (2005) 69–7676
Lamb-dip data gave constants similar to the previous values
[4] but with a substantially better fit to three of the Q
branches. However, the KaZ10)9 Q branch shows larger
(obs-calc) fit residuals of the opposite sign to the other three,
suggesting the Ka0Z10 levels are affected by small
perturbations as found earlier for higher Ka0 [4].
In order to permit quantitative estimation of line
intensities, an ab initio calculation of the dipole derivative,
dmc/dQ11, was carried out for the n11 mode using the
GAUSSIAN 03 program at the B3LYP/6-311CCG** level.
Significant care was taken to transform the various vector
quantities output by GAUSSIAN 03 into the same axis system
in consistent units. The ab initio value obtained for the out-
of-plane c-type n11 transition moment is jdmc/dQ11jZ0.3135 debye; this is consistent with an estimation based
on comparison of the intensities of the weak butadiene lines
observed here against earlier results for methanol on the
same spectrometer.
This work represents the first use of our CO2-laser/
microwave-sideband instrument in the 11-mm 10P CO2 laser
region, with a molecule rather larger than those usually
studied by Lamb-dip spectroscopy. The system provided
good spectra in its broad-scan Doppler-limited mode even
with the weaker hot and sequence band CO2 laser lines, as
seen in Fig. 1. With the high-dispersion grating of the laser,
the hot and sequence band lines were clearly separated from
regular band lines, permitting confident identification of the
lasing transition from the grating micrometer setting.
Despite the size of the 1,3-butadiene molecule with its
larger partition function and significantly denser spectrum,
we could still obtain Lamb-dip signals in the sub-Doppler
spectrometer mode even for the weak initial lines at the
origins of the compact Q-branch heads.
Acknowledgements
It is a great pleasure to dedicate this work to Walter
Lafferty, in recognition of his lifetime of contributions to the
infrared spectroscopy of interesting and important molecu-
lar species and his infectious enthusiasm and interest in the
work of our own groups and so many of our colleagues.
LHX and RML thank the Natural Sciences and Engineering
Research Council of Canada and the Canadian Institute for
Photonic Innovations (CIPI) for financial support of this
research. The work at Oberlin College was supported by a
grant from the Dreyfus Foundation. Use of the 1,3-
butadiene high-resolution Fourier transform spectra
recorded by M. Lock at the Winnewisser laboratory in
Giessen is gratefully acknowledged. We thank Thomas
Blake and Anthony Masiello at Pacific Northwest National
Laboratory for the Fortran code for the Wang program.
References
[1] US Environmental Protection Agency (EPA). Health Assessment of
1,3-butadiene. National Center for Environmental Assessment,
Washington, DC: EPA/600/P-98/001F. Available from: National
Technical Information Service, Springfield, VA, 2002, http://www.
epa.gov/ncea/.
[2] Y.N. Panchenko, J. Vander Auwera, Y. Moussaoui, G.R. De Mare,
Struct. Chem. 14 (2003) 337–348.
[3] M.L. Senent, J. Mol. Struct. 351 (1995) 197–204.
[4] N.C. Craig, J.L. Davis, K.A. Hanson, M.C. Moore, K.J. Weidenbaum,
M. Lock, J. Mol. Struct. 695–696 (2004) 59–69.
[5] M. Halonen, D. Nesbitt, M. Farnik, 55th Ohio State University
International Symposium on Molecular Spectroscopy. Columbus,
OH, June, 2000 Paper TD06.
[6] M. Halonen, L. Halonen, D.J. Nesbitt, J. Phys. Chem. A 108 (2004)
3367–3372.
[7] Z.-D. Sun, Q. Liu, R.M. Lees, L.-H. Xu, M.Yu. Tretyakov,
V.V. Dorovskikh, Rev. Sci. Instrum. 75 (2004) 1051–1060.
[8] N.C. Craig, K.A. Hanson, R.W. Pierce, S.D. Saylor, R.L. Sams, J.
Mol. Spectrosc., (in press).
[9] Q. Shi, D.D. Nelson, J.B. McManus, M.S. Zahniser, M.E. Parrish,
R.E. Baren, K.H. Shafer, C.N. Harward, Anal. Chem. 75 (2003) 5180–
5190.
[10] GAUSSIAN 03, Revision B.05, M.J. Frisch, G.W. Trucks, H.B.
Schlegel, G.E. Scuseria, M.A. Robb, J.R. Cheeseman, J.A.
Montgomery, Jr., T. Vreven, K.N. Kudin, J.C. Burant, J.M.
Millam, S.S. Iyengar, J. Tomasi, V. Barone, B. Mennucci, M.
Cossi, G. Scalmani, N. Rega, G.A. Petersson, H. Nakatsuji, M.
Hada, M. Ehara, K. Toyota, R. Fukuda, J. Hasegawa, M. Ishida, T.
Nakajima, Y. Honda, O. Kitao, H. Nakai, M. Klene, X. Li, J.E.
Knox, H.P. Hratchian, J.B. Cross, C. Adamo, J. Jaramillo, R.
Gomperts, R.E. Stratmann, O. Yazyev, A.J. Austin, R. Cammi, C.
Pomelli, J.W. Ochterski, P.Y. Ayala, K. Morokuma, G.A. Voth, P.
Salvador, J.J. Dannenberg, V.G. Zakrzewski, S. Dapprich, A.D.
Daniels, M.C. Strain, O. Farkas, D.K. Malick, A.D. Rabuck, K.
Raghavachari, J.B. Foresman, J.V. Ortiz, Q. Cui, A.G. Baboul, S.
Clifford, J. Cioslowski, B.B. Stefanov, G. Liu, A. Liashenko, P.
Piskorz, I. Komaromi, R.L. Martin, D.J. Fox, T. Keith, M.A. Al-
Laham, C.Y. Peng, A. Nanayakkara, M. Challacombe, P.M.W.
Gill, B. Johnson, W. Chen, M.W. Wong, C. Gonzalez, and J.A.
Pople, Gaussian, Inc., Pittsburgh PA, 2003.
[11] Z.-D. Sun, Q. Liu, R.M. Lees, L.-H. Xu, M.Y. Tretyakov,
V.V. Dorovskikh, Appl. Phys. B 78 (2004) 791–795.
[12] Z.-D. Sun, R.M. Lees, L.-H. Xu, M.Yu. Tretyakov, I. Yakovlev, Int.
J. Infrared Millimeter Waves 23 (2002) 1557–1574.
[13] Wang program-private communication and D. Luckhaus, M. Quack,
Mol. Phys. 68 (1989) 745–758.
[14] L.-H. Xu, Methanol Spectroscopy from Microwave to Infrared—
Fundamentals and Applications, in: Demaison et al. (Ed.), Spec-
troscopy from Space, 2001, pp. 131–146.
[15] L.-H. Xu, R.M. Lees, P. Wang, L.R. Brown, I. Kleiner, J.W.C. Johns,
J. Mol. Spectrosc. 228 (2004) 453–470 and references therein.


![[{VOCl2(CH2(COOEt)2)}4] as a molecular precursor for ...](https://static.fdokumen.com/doc/165x107/633d2038fa275cda9203f2bf/vocl2ch2cooet24-as-a-molecular-precursor-for-.jpg)


![Thermal [4 + 2] Cycloadditions of 3Acetyl, 3Carbamoyl, and 3-Ethoxycarbonyl-Coumarins with 2,3Dimethyl1,3-butadiene under Solventless Conditions: A Structural Study](https://static.fdokumen.com/doc/165x107/631436e25cba183dbf077646/thermal-4-2-cycloadditions-of-3acetyl-3carbamoyl-and-3-ethoxycarbonyl-coumarins.jpg)