A Late Minoan III Propylon at Haghia Triada (with N. Cucuzza)
Upload
newcastle-antiquariesCategory
view
0download
0
For Peer Review
Studying pigments on painted plaster in Minoan, Roman and
Early Byzantine Crete. A multi-analytical technique
approach
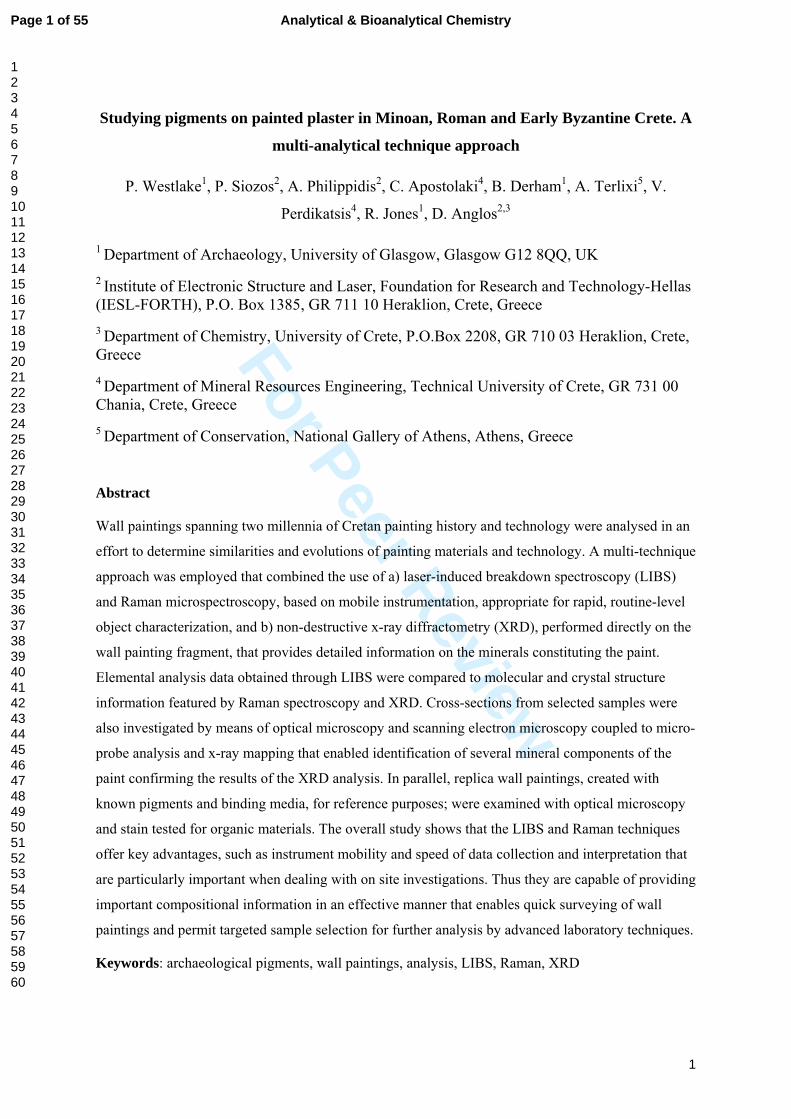
Journal: Analytical and Bioanalytical Chemistry
Manuscript ID: ABC-00906-2011
Type of Paper: Original Paper
Date Submitted by the Author:
19-May-2011
Complete List of Authors: Westlake, Polly; University of Glasgow, Department of Archaeology
Siozos, Panayiotis; IESL-FORTH Philippidis, Aggelos; IESL-FORTH Apostolaki, Chryssa; Technical University of Crete, Department of Mineral Resources Engineering Derham, Brendan; University of Glasgow, Department of Archaeology Terlixi, Agni; National Gallery of Athens, Department of Artistic Conservation Perdikatsis, Vasilios; Technical University of Crete, Department of Mineral Resources Engineering Jones, Richard; University of Glasgow, Department of Archaeology
Anglos, Demetrios; IESL-FORTH
Keywords: archaeological pigments, wall paintings, analysis, LIBS, Raman, XRD
Analytical & Bioanalytical Chemistry
For Peer Review
1
Studying pigments on painted plaster in Minoan, Roman and Early Byzantine Crete. A
multi-analytical technique approach
P. Westlake1, P. Siozos2, A. Philippidis2, C. Apostolaki4, B. Derham1, A. Terlixi5, V.
Perdikatsis4, R. Jones1, D. Anglos2,3
1 Department of Archaeology, University of Glasgow, Glasgow G12 8QQ, UK 2 Institute of Electronic Structure and Laser, Foundation for Research and Technology-Hellas (IESL-FORTH), P.O. Box 1385, GR 711 10 Heraklion, Crete, Greece 3 Department of Chemistry, University of Crete, P.O.Box 2208, GR 710 03 Heraklion, Crete, Greece 4 Department of Mineral Resources Engineering, Technical University of Crete, GR 731 00 Chania, Crete, Greece 5 Department of Conservation, National Gallery of Athens, Athens, Greece
Abstract
Wall paintings spanning two millennia of Cretan painting history and technology were analysed in an
effort to determine similarities and evolutions of painting materials and technology. A multi-technique
approach was employed that combined the use of a) laser-induced breakdown spectroscopy (LIBS)
and Raman microspectroscopy, based on mobile instrumentation, appropriate for rapid, routine-level
object characterization, and b) non-destructive x-ray diffractometry (XRD), performed directly on the
wall painting fragment, that provides detailed information on the minerals constituting the paint.
Elemental analysis data obtained through LIBS were compared to molecular and crystal structure
information featured by Raman spectroscopy and XRD. Cross-sections from selected samples were
also investigated by means of optical microscopy and scanning electron microscopy coupled to micro-
probe analysis and x-ray mapping that enabled identification of several mineral components of the
paint confirming the results of the XRD analysis. In parallel, replica wall paintings, created with
known pigments and binding media, for reference purposes; were examined with optical microscopy
and stain tested for organic materials. The overall study shows that the LIBS and Raman techniques
offer key advantages, such as instrument mobility and speed of data collection and interpretation that
are particularly important when dealing with on site investigations. Thus they are capable of providing
important compositional information in an effective manner that enables quick surveying of wall
paintings and permit targeted sample selection for further analysis by advanced laboratory techniques.
Keywords: archaeological pigments, wall paintings, analysis, LIBS, Raman, XRD
Page 1 of 55 Analytical & Bioanalytical Chemistry
123456789101112131415161718192021222324252627282930313233343536373839404142434445464748495051525354555657585960
For Peer Review
2
1. Introduction
Materials analysis has long been recognised as an essential component of archaeological research. It
often yields critical compositional information that may lead to object characterization, revealing
ingredients and technologies used by craftsmen, or even providing insight to technology exchanges,
communication and trade. Furthermore, in the context of object conservation, it allows informed
decisions necessary for proper conservation/restoration of objects to be made. Indeed, several
advanced materials analysis techniques are being used in archaeological research and conservation
science but, to-date, their use is primarily confined in the premises of specialized research laboratories
or large scientific facilities. On the other hand, there is growing motivation for the use of modern
analytical methods on site and in real time, for example, during excavation or survey campaigns and
in subsequent conservation work. Evidently the need for compact analytical instruments and versatile,
robust, non-destructive methodologies that would avoid sampling and enable analytical studies to be
performed rapidly, routinely and non-destructively, in the context of the museum or conservation
laboratory, is an important challenge. Furthermore it is highly desirable to have techniques and
instruments available that can be operated by skilled archaeologists and conservation staff in situ, not
requiring the presence of specialised research scientists or technicians. This would enable more
effective conservation procedures and excavation decisions to be undertaken rapidly and decisively
for the benefit of the long-term preservation of cultural heritage. It would also increase the availability
of suitable collections for more focused and time-consuming analysis in the post-excavation stage by
enabling an effective sample ‘screening process’ to take place.
The present study is part of a broader project that aims to explore the wall painting pigments used on
the island of Crete from the Bronze Age to the Roman and Byzantine periods. A fairly large body of
work exists on the analysis of pigments used in Bronze Age wall paintings from Crete [1-3] in relation
to issues concerning on the one hand painting materials and technology and on the other painting style
and thematic content. In contrast, information regarding wall paintings from later periods is scarce.
The current project begins to redress the balance, and to augment our understanding of the whole
palette of Cretan wall painting pigments.
The principal materials and methods of constructing a wall painting remained almost unchanged on
Crete from the Bronze Age until (and in many cases including) the 20th century. Levelling layers of
plaster, usually a combination of hydrated lime (calcium hydroxide) with various inorganic and
organic filler materials such as calcitic or quartzitic sand, crushed ceramics, or straw, were applied to
the wall, prior to the application of a thin, fine layer of almost pure slaked lime. In most cases,
pigments were ground to powder, mixed with water, and applied to the still wet uppermost plaster
layer, where they would adhere to the surface through carbonation of the hydrated lime (the a fresco
Page 2 of 55Analytical & Bioanalytical Chemistry
123456789101112131415161718192021222324252627282930313233343536373839404142434445464748495051525354555657585960

For Peer Review
3
technique). Whether or not a second technique of wall painting was employed (using an organic
binding medium such as egg or casein – painting a secco), is difficult to ascertain due to the
deterioration of organic materials through time.
The most commonly found pigments in each period tend to be the ‘mineral pigments’, red, yellow,
and the multifarious tonal variations from brown to orange to purple provided by these iron oxides or
hydroxides (heamatite, Fe2O3; goethite, FeO(OH); limonite, Fe2O3 xH2O). In the Bronze Age, black
pigments were charcoal based, typically created from burnt plant or bone, although some black
pigments were formed from ground pyrolusite (MnO2), while white was generally produced from
calcium carbonate (CaCO3) or kaolinite (Al2Si2O5(OH)4). Greater variation is evident in the blue and
green colours, both in tems of the early and continued use of the synthetic blue pigment Egyptian blue
(cuprorivaite, CaCuSi4O10), and the creation of hues through admixtures and layering, for example
yellow over blue to achieve a green hue, and red above blue/black for purple. The introduction of
synthetic lead based pigments – white (Pb(OH)2 ⋅ 2PbCO3) and red (Pb3O4) – in the Roman period,
enriched the palette, and created more vivid tones of pink and orange, although the basic palette was
unchanged from the earliest Cretan wall paintings.
The diachronic approach to the project has raised interesting questions regarding the painting
technologies of the different periods. Comparing the pigments employed in Bronze Age Crete to those
of the Roman and Byzantine periods provides information regarding the relative importance of, on the
one hand, iconographic tradition, and on the other, the more basic issues of availability/accessibility
of painting materials. In addition to the appearance or disappearance of certain pigments, the use of
admixtures and layering of pigments to alter their optical effects throughout the history of Cretan wall
painting was studied. In this way, archaeometry, archaeology and technical art history are drawn upon
to determine what materials, or combinations of materials were selected, and some of the reasons
behind these choices.
From the materials characterization standpoint, the pigment study described in this paper follows a
multi-analytical approach that explicitly makes use of a combination of non-destructive and micro-
destructive techniques. Such a strategy is increasingly adopted in wall painting studies, and especially
in the Aegean Bronze Age [Table 4.3 in Ref. 1]. In this study, laser-induced breakdown spectroscopy
(LIBS) and Raman micro-spectroscopy, based on two compact mobile instruments, were employed
for direct analysis of the wall painting fragments, complemented by x-ray diffractometry (XRD),
scanning electron microscopy coupled to electron microprobe analysis and x-ray mapping, that served
as reference methods providing detailed information on the pigment composition and identity. The
main objective of this campaign was to investigate the applicability of LIBS and Raman techniques
Page 3 of 55 Analytical & Bioanalytical Chemistry
123456789101112131415161718192021222324252627282930313233343536373839404142434445464748495051525354555657585960
For Peer Review
4
and analysis of paint materials and assess the level and confidence of analytical information
comparing the results with detailed materials analysis obtained by XRD.
The LIBS technique has been used in the analysis of objects of archaeological and artistic importance
[4,5]. It provides information about the elemental composition on the basis of the optical emission
spectrum arising from a micro-plasma that is generated on the surface of the object/sample
investigated, by means of focusing a laser pulse. One of the important features of LIBS is that no
sampling or sample preparation is required. The analysis is carried out directly on the object. The
technique is almost non-destructive, actually classified as micro-destructive, since the diameter of the
spot probed during the analysis is on the order of 100-200 micrometers. The depth of the crater
formed does not exceed a few micrometers, in the case of wall paintings (it is significantly less when
hard materials, such as stone or metals are probed). In the past few years, several research groups
have demonstrated that LIBS analysis can be performed using compact equipment and as a result
portable LIBS units have emerged that were proved useful in the context of cultural heritage analysis
[6-8]. The present application of LIBS has at least one point of comparison in the form of data
obtained by Brysbaert al [9] on Minoan wall paintings from Palaikastro in eastern Crete, as well as
Thebes on the Greek Mainland and Tell d’Aba in Egypt of contemporary date.
Raman spectroscopy is a widely-established technique, an excellent analytical tool for art
conservation and archaeological science that presents unique advantages over other molecular
analysis techniques [10,11].It features high sensitivity and specificity enabling analysis of a wide
variety of organic, inorganic and bio-materials, often directly on the object under study, non-
invasively, at short times and with superb spatial resolution when the analysis is performed on a
Raman microscope. Raman spectra arise as a result of inelastic scattering of light by matter and
display bands at frequencies, corresponding to characteristic vibrational modes of molecules or
materials. These frequencies are intimately connected to the chemical bonding and its immediate
environment and as such are highly specific enabling identification of various materials, for example
pigments and minerals, sometimes even permitting discrimination among different crystal phases of
the same material.
X-ray powder diffraction (XRD) is a rapid analytical technique for identifying unknown crystalline
phases. Normally, the analyzed material is finely ground, homogenized, and the average bulk
crystalline phase composition is determined. By comparing the positions (angles) and intensities of
the diffraction peaks against a library of known crystalline materials, the target material can be
identified.
Page 4 of 55Analytical & Bioanalytical Chemistry
123456789101112131415161718192021222324252627282930313233343536373839404142434445464748495051525354555657585960
For Peer Review
5
2. Experimental
2.1 Wall painting samples
Fragments from each of the three periods were selected for analysis from :
• the Bronze Age Palace at Knossos (c.1550-1400 B.C), KN 01-11;
• two large Roman buildings at Knossos, the Villa Dionysos and the Unexplored Mansion (c.1st - 2nd
century A.D), VD 01-14 and UM 01-12 respectivley, and
• the Byzantine Mitropolis Basilica, at Gortyna in the south of the island (5th -6th century A.D), G
01-12.
Fragments were chosen with paint layers consisting of one or more of the typical pigments found in
each period, or which appeared to be anomalous in terms of hue, mixtures or layering. Other selection
criteria included size, condition, and relative significance of the fragments, and little/no evidence of
modern conservation interventions. Initial examination under a stereomicroscope aided the selection
of fragments for analysis, and refined questions to be addressed through analysis.
The archaeological/art historical focus throughout may be summarised as follows: how much
continuity do we see in the practice of wall painting from Bronze Age to Byzantine Crete in terms of
the materials used and the methods of applying them?
2.2 Replicas
Before beginning analysis of the wall painting samples, preliminary work was undertaken on replicas
created in order to test and hone the analytical techniques. The replicas consisted of a layer of coarse
lime plaster (1:3 lime and quartz sand) and an uppermost layer of lime and fine sand 2:1. Four
pigments were selected: red ochre; green earth; carbon black; and manganese black, all from Kremer
Pigments. For the fresco replicas, pigments were ground and mixed with de-ionised water at 1, 10, 20
and 40% concentration. These were applied 1 hour after application of the uppermost plaster layer to
achieve optimum adherence of pigments within the carbonating lime. For the secco replicas, pigments
were mixed at the above concentrations with a selection of organic binding media: walnut oil; lime-
casein; hide glue; egg yolk and egg white; beeswax; mastic; gum tragacanth, and were applied onto
the dry plaster surface.
2.3 LIBS analysis
In this campaign, a portable LIBS spectrometer (LMNT-II) was used. This instrument, developed and
constructed at IESL-FORTH, is based on a passively Q-switched Nd:YAG laser operating at 1064 nm
(energy: 10 mJ/pulse, pulse duration: 10 ns). A dual compact fiber optic spectrograph (Avantes) is
Page 5 of 55 Analytical & Bioanalytical Chemistry
123456789101112131415161718192021222324252627282930313233343536373839404142434445464748495051525354555657585960
For Peer Review
6
used to record the emission spectra across a wavelength range extending from 240 to 760 nm, with
resolution of about 0.1 nm. The system is equipped with a miniature CCD camera that enables
visualization of the object during analysis and aiming of the laser beam. All spectra were collected
with a time-delay of 1.3 μs with respect to the laser pulse minimizing the continuum present at early
times following laser ablation. In a typical analysis, the object is placed at the focal point of the
focusing lens (approximately 70 mm from the optical head), and by means of a XYZ-translation stage
the laser beam is aimed accurately on the point selected for analysis, which is viewed on line through
the CCD camera. An area corresponding to a diameter of about 0.2 mm is probed by the laser beam.
A single pulse is adequate for obtaining a spectrum with high S/N. Typically, a few pulses, 2-6, are
delivered at each point, and separate spectra are recorded, particularly when depth profiling
information is sought. The latter can be achieved because of the laser ablation effect that results in the
removal of thin (of the order of a few microns per pulse) layers of materials during analysis.
2.4 Raman microscopy
In the present study, a mobile Raman microspectrometer (JY Horiba HE 785) was used. The
excitation source is a cw diode laser, emitting at 786 nm (maximum power on the sample : 50 mW),
fiber optically coupled to an optical head that enables focusing of the beam by means of a number of
objective lenses (10x, 20x, 50x) which provide variable focusing of the beam (and thus magnification
of the work area) down to a few microns on the sample surface. A white light illumination system and
a high resolution colour camera (video microscope) are also part of the optical head and offer very
clear view of the area under investigation, necessary for positioning the beam on individual pigment
particles or particle aggregates. The scattered Raman radiation is collected through the focussing
objective and sent through an optical fiber to a compact spectrograph, equipped with a concave
grating, which provides spectral coverage up to 3200cm-1 at a spectral resolution of about 10-15 cm-1.
Spectra are recorded on a high-sensitivity, air-cooled detector, SynapseTM CCD (1024 x 256 pixels).
In a typical measurement, the entire fragment is placed under the microscope objective and with the
help of an XYZ micro-positioner and the video microscope, the spot to be analysed is selected.
Analysis is therefore performed in situ, namely on the fragment itself, with no need of any sampling.
A limitation, we experienced with a few of the fragments, was related to the high surface roughness
that prevented the high magnification objective from focusing on features that were located in “deep
valleys”. The beam power on the sample was, depending on the material investigated, in the range of
0.05-5.5 mW. Typical exposure time of the CCD was 20 s per scan, while normally 10 to 20 scans
were averaged.
Page 6 of 55Analytical & Bioanalytical Chemistry
123456789101112131415161718192021222324252627282930313233343536373839404142434445464748495051525354555657585960
For Peer Review
7
A laboratory Raman microscope (Nicolet Almega XR) was used in a few cases when excitation at a
short wavelength (473 nm) was needed, for example in the case of some blue paints that contained
Egyptian Blue, which fluoresces very strongly when excited at 786 nm.
2.5 X-ray diffraction analysis
The crystalline phase analysis was carried out on a Bruker D8 Advance Diffractometer, using Ni-
filtered Cu Kα radiation (35 kV, 35mA) with a Lynx Eye strip silicon detector. Data were collected
for 2θ values in the range of 3° to 70° with a step size of 0.02° and a count time of 1 second per strip
step. The diffractograms were taken non-destructively directly on the surface of the fragment, or using
zero background Si-sample holders with pigment material of a few milligrams (<5 mg), by dispersing
the sample powder with alcohol . The diffractograms were analyzed and interpreted with the Diffrac
Plus software package from Bruker and the Powder Diffraction File (PDF).
The size of the painted plaster fragments varied between 3x3 and 0.2x0.2 cm2. They were rotated so
as to minimize surface roughness and grain size effects (grain size should be <10 μm). Since many of
the fragments have a layered structure, the penetration depth of the X-ray beam determines the
thickness of the samples with the corresponding crystalline phase composition. The penetration depth
depends on the mass absorption factor and the density of the crystalline phases (calculated for some of
the identified minerals and shown in Table 1) and is a function of the diffraction angle 2θ. Typical
penetration depth values are given in Fig. 1. In samples with more than one pigment layer, the
penetration depth determines the crystalline phases detected by XRD. Considering, for example, a
hematite layer over a layer of Egyptian blue, both approximately 10 μm thick, and taking into account
that the characteristic 2θ peaks are at 33.31o for hematite and at 11.65o and 27.10 o for Egyptian blue,
it turns out (according to the figures shown in Table 1) that XRD will not detect Egyptian blue lying
under the hematite layer because the penetration depth in hematite for 2θ at 10 o and 30o is 1.1 and
3.2 μm respectively (for Cu radiation). In the reverse case (actually encountered in sample VD08)
hematite is clearly detected under a layer of Egyptian blue, whose penetration depth for 2θ at 30o is 26
μm; thus both mineral phases, Egyptian Blue and hematite, are detected.
At this point it is necessary to recognise some limitations of relying solely on XRD for the crystalline
phase identifications. The first concerns minerals belonging to the mica mineral group - illite,
muscovite, biotite, celadonite and glauconite – having the characteristic d-value 10Ǻ at 2θ = 8.85o
(CuKα). But this peak in illite, celadonite and glauconite is broad compared to that in muscovite and
biotite. Since both celadonite and glauconite are characterized as Green Earth it is important to be able
to differentiate them, and so additional criteria, those of colour and especially chemical composition,
are introduced. Celadonite and glauconite are very similar in chemical composition, especially in their
Fe content, but the former is usually richer in Si and Mg and poorer in Αl than glauconite. The
Page 7 of 55 Analytical & Bioanalytical Chemistry
123456789101112131415161718192021222324252627282930313233343536373839404142434445464748495051525354555657585960
For Peer Review
8
situation regarding riebeckite, which features commonly in our results, constitutes the second
limitation: this mineral shares the same main peak of 2θ=10.7o with d=8.3Ǻ with other members of
the amphibole mineral group such as tremolite, actinolite, hornblende and glaucophane. Again,
chemical composition data is required to resolve the identity of the mineral. To this end, polished
sections were prepared of a number of specimens, which were subsequently examined by optical
microscopy and scanning electron microscopy (SEM).
Please insert Table 1
Please insert Fig. 1
2.6 Optical microscopy
Polished cross-sections of the minute wall painting samples, containing all the microstratigraphy from
the pigment to the plaster substrate, were prepared and studied with an optical polarizing microscope
in reflected light for the following: colour, particle size, shape, pigment/binding medium ratio, as well
as on the thickness of paint layers, admixtures of pigments, and paint layer stratigraphy. This offers a
useful ‘pictorial’ guide when interpreting data from elemental analyses. In the present study, images
of cross sections were particularly instructive in the interpretation of results when juxtaposed with
data from LIBS depth profiling, concerning successive layers of pigments; an example appears in Fig.
2. Examination of the replicas with optical microscopy focused on similar issues and included the
testing of stains for organic materials (Oil Red for lipids [12] and fluorescein isothiocyanate for
proteinaceous media).
Please insert Fig. 2
2.6 Scanning Electron Microscopy (SEM)
The same samples were also analyzed on a JEOL JSM 5400 Scanning Electron Microscope, equipped
with an Energy Dispersive X-ray Spectrometer by Oxford instruments (INCA energy 300 EDS).
Microanalysis of single pigment grains down to 1 μm, as well as of the matrix and the total average of
the paint layer were performed. Furthermore, X-ray mapping was used to study the element
distribution in the pigment layer. The above technique permitted a full micro-stratigraphic analysis
and interpretation of all decorative and background paint layers and the chemical composition of the
mineral pigments.
Page 8 of 55Analytical & Bioanalytical Chemistry
123456789101112131415161718192021222324252627282930313233343536373839404142434445464748495051525354555657585960
For Peer Review
9
3. Results and Discussion
The overall analytical study was divided into two stages. Stage1 concentrated on the use of LIBS and
Raman micro-spectroscopy for the characterization of the painted plaster fragments (a total of 53)
involved in this study. As detailed in the experimental part, both techniques carry out spot analysis,
and in the case of polychrome samples several spots across the painted surface were analysed. The
main goal of Stage 1 studies was to evaluate the capability of the LIBS and Raman techniques for
obtaining analytical information in situ, involving zero sample preparation. This is of particular
importance considering that both techniques are portable and therefore can be used for analytical
campaigns that are performed on site. Stage 2 studies were based on the use high performance
laboratory instruments such as XRD and SEM-EDX that enable a thorough characterization of the
paint and identification of its constituent pigment minerals. These measurements were performed on a
smaller, but representative number of fragments that were selected on the basis of the results obtained
in Stage 1, and provided further grounds for critically assessing the results obtained by the LIBS and
Raman analyses.
To facilitate the discussion, analytical results are presented, grouped on the basis of paint colour,
following the stage1-stage 2 approach outlined above. Furthermore, the overall analysis results are
discussed in terms of their significance concerning pigment materials used across the different
historical periods investigated.
3.1 Red
This group involves several wall painting fragments, a total of 21 (Table 2), exhibiting different
tonalities of red (from dark to light) and pink; in some cases the paint layer extends all over the
painted surface, while in others it covers just a fraction of it being part of a polychromatic motif. In all
fragments, independently of site or period, LIBS spectra collected on the red paint show emission
lines corresponding to iron that provide strong evidence for the presence of an iron-based pigment that
is most likely a red ochre (typically composed of Fe-oxides/hydroxides, clay, quartz, calcite). A
number of additional elements, such as Ca, Na, Al, Mg, Si, but also Ba and Sr in trace concentration
and occasionally Zn, are also detected based on distinct emission lines observed in the LIBS spectra.
These obviously originate from matrix minerals such as, for example, calcite, clay minerals and
quartz, and have been detected in all fragments examined. A positive correlation between Sr and Ca
due to the substitution of Ca by Sr in the calcite crystal structure is observed in all cases in which Ca
was detected. A representative LIBS spectrum from a red painted plaster is shown in Fig. 3. Strong
emission lines from Fe and Ca are clearly observed, while lines from Na, Al, Mg, Si, Ba, Sr and Zn
are easily identified.
Page 9 of 55 Analytical & Bioanalytical Chemistry
123456789101112131415161718192021222324252627282930313233343536373839404142434445464748495051525354555657585960
For Peer Review
10
Please insert Fig. 3
From the qualitative point of view, identifying Fe in a red painted plaster is a rather trivial finding,
given that the use of red ochre was commonly used in antiquity including the Byzantine period
relevant to this study. But something that can be further evaluated is the Fe emission signal intensity.
This depends on the concentration of Fe in the sample and in general can be correlated with the
pigment density. In this context it is instructive to view as an example the average intensity of the
same Fe emission line recorded in all plaster samples that were examined as a function of paint
colour. (Fig. 3) Despite rather significant line intensity variations among the different samles, it is
relatively straightforward to discriminate high Fe-content paints, mainly red and ones from those of
low Fe-content. The high Fe-content found in yellow, brown or red coloured paints is a strong
indication for the presence of iron-oxide-hydroxide minerals, but, obviously, unambiguous pigment
identification is given by the XRD or Raman analysis. It is further interesting to observe that non-red
or non-yellow paints still contain amounts of iron that most likely relate to Fe-containing minerals
present in the plaster or used as pigments. This observation is to be further discussed in the context of
the blue, green and black paint analysis.
Returning to the observed line intensity variations, it has to be noted that matrix composition is an
important factor that determines the overall signal intensity in a LIBS measurement. Thus the
intenstiy of spectral lines, such as for example those shown in Fig. 3, have to be handled cautiously as
regards their correlation with the concentration of a certain element in the solid and should be
considered as representing a semi-quantitative picture.
Please insert Fig. 4
Continuing with the LIBS analysis of the red plaster fragments, an interesting observation is the clear
presence of lead, Pb, in the red paint in a small number of samples, two from Gortyna (G03, G06,
Roman – Byzantine period) and one from the Villa Dionysos at Knossos (VD01, Roman period) (Fig.
5). The origin of Pb emission, which can be related either to red lead (minium, Pb3O4) or lead white
(Pb(OH)2 ⋅ 2PbCO3), is a question to be addressed by the molecular analysis techniques employed in
the present study. However, it is noted here that the presence of Pb in sample G03 was also confirmed
through X-Ray mapping performed on a polished cross section in SEM, which clearly indicates that
Pb is rather diffusely distributed across the paint surface in a manner similar to that of Ca and clearly
different from the more localized distribution of Fe, Al and Si. This may suggest that the red pigment
is an iron-based one, while the presence of Pb relates to lead white used as a background or in order to
Page 10 of 55Analytical & Bioanalytical Chemistry
123456789101112131415161718192021222324252627282930313233343536373839404142434445464748495051525354555657585960
For Peer Review
11
dilute the red paint. This is in agreement with a further observation, made on the basis of LIBS data,
proving that Pb is present in the blue and black paint of fragment VD01, besides the red paint as well
as in the blue paint of fragment G01. From the perspective of materials use and availability it is
important to note that Pb was detected solely in samples from the Roman and Byzantine periods and
not in ones from the Bronze Age.
Please insert Fig. 5
In parallel to LIBS analysis, Raman spectra were collected from 21 red painted plaster fragments, of
which 13 showed spectral bands characteristic of red iron oxide, Fe2O3 (hematite). This clearly proves
the presence of hematite/red earth and effectively confirms the strong evidence provided by the LIBS
data. For example, in Fig. 6 indicative Raman spectra collected from red painted plasters from the
sites of Knossos (VD10) and Gortyna (G04) are shown against a spectrum collected from pure red
iron oxide. Raman bands at 229 cm-1 (A1g), 296 cm-1 (Eg) and 412 cm-1 (Eg) correspond to Fe2O3
vibrations modes.
Please insert Fig. 6
As mentioned in the experimental part, a major advantage of Raman microscopy is that by focusing
the laser beam on distinct pigment grains one avoids excitation of other co-existing pigments or
impurities thereby minimizing unwanted interferences. Indeed this has been the case throughout this
study, yet it is interesting to note that a number of red painted plasters did not yield spectra
corresponding to hematite or any other red pigment, despite efforts to focus on red pigment
grains/areas. Instead, broad features due to fluorescence were observed and, in some cases, bands
related to the presence of calcite, gypsum or quartz (Fig. 7). These observations are attributed to the
fact that the Raman analysis is carried out in situ without any surface/sample preparation (e.g.
polishing), thereby suffering limitations that relate either to excessive contribution of fluorescence
from impurities or organic constituents or to inefficient exposure of the relevant pigment grain or
grains to the laser beam when other, often transparent, minerals are masking the pigment. It is noted
that calcite bands were recorded in several of the samples examined (see Tables 3-6), independent of
plaster colour. This observation may be possibly due to a) the use of lime white to modify or extend
(dilute) the pigments, b) the presence of impurities in the raw material [13] contribution to the Raman
signal from the lime plaster substrate. It is recalled that strong Ca emission lines were detected in all
LIBS spectra as well.
Page 11 of 55 Analytical & Bioanalytical Chemistry
123456789101112131415161718192021222324252627282930313233343536373839404142434445464748495051525354555657585960
For Peer Review
12
Raman spectra collected on those red plaster fragments, which by LIBS analysis were found to
contain Pb (VD01, G03, G06), showed no bands coming from either red lead or lead white (expected
at 122, 148,550 cm-1 or 681, 1051 cm-1 respectively). [14] No hematite bands were observed either.
Instead, the presence of calcite was verified by its strong band at 1089 cm-1, in G03, and G06 (Fig. 7)
while VD01 showed just very strong fluorescence background. It is noted that measurements in these
samples were mainly limited to red areas and no spectra were collected from white areas, where the
probability of finding lead white would have been higher. Furthermore, given that lead white is
present at relatively low quantities compared to calcite, as shown by LIBS, any Raman signal,
expected at 1051 cm-1 would be low and possibly masked by the nearby strong band of calcite at 1089
cm-1.
Please insert Fig. 7
A representative number of red painted plasters was analysed by XRD (KN09, UM04, UM08 and
VD10) and on the basis of the characteristic diffraction peaks recorded, the presence of hematite was
confirmed. In addition calcite, illite, kaolinite and quartz were detected, which could be primary
accessory minerals in the iron ochre pigments. As regards calcite it is added that it is also as
secondary mineral by the carbonization of slaked lime used in the fresco painting technique. The
XRD results reveal the identity of the minerals in the red paints examined and essentially help to
explain the LIBS data, which, besides Fe, arising from the red ochre, show additional elements related
to the accessory minerals of the pigment. Likewise, Raman data are in good agreement with the XRD
results. It is noteworthy that in UM04 tridymite, a high temperature polymorph of SiO2, was identified
by XRD, a clear indication for the presence of synthetic hematite, produced by heating a Fe-hydroxide
ochre.
Please insert Table 2
Further analysis of wall painting pigments from the Roman period onwards may reveal a more varied
palette, however, on the basis of results from the current study it seems that painters in Crete adhered
to a more traditional range of materials than were used elsewhere. This is seen especially with the red
pigments. The Roman writers Pliny and Vitruvius [15-17] refer to various red pigments other than the
iron oxides found in the Cretan examples discussed here, including red lead (lead tetraoxide),
cinnabar (mercury sulphide; Ref 16, pp. 119-127), and realgar (arsenic sulphide; Ref. 16, pp. 75-77).
Analysis to date indicates that lead based pigments were not part of the Bronze Age Cretan wall
Page 12 of 55Analytical & Bioanalytical Chemistry
123456789101112131415161718192021222324252627282930313233343536373839404142434445464748495051525354555657585960
For Peer Review
13
painting palette. Red lead is less attested historically than lead white, although it is included in Pliny’s
list of pigments (Ref. 15, p.119, p.123, p.217, pp.220-1), and was reported in paintings again from
Pompeii [18]. Although much later in date, it is interesting to note that painters are cautioned by the
early 15th century writer Cennino Cennini [19] (in Chapter. XLI) against the use of red lead as a wall
painting pigment due to its chemical instability.
Cinnabar (HgS) has been identified in Hellenistic and Roman painting, both as a pure pigment(as at
Vicenza [20] and Pella, Greece [20]) and as admixture with red ochre (in Cyprus [22]). The organic
red colorant madder, deposited onto an insoluble base, has also been identified in the Pompeian
paintings [13].
3.2 Yellow
As with red, LIBS analysis of yellow paint, carried out on a total of seven plaster fragments (Table 3),
resulted in intense emissions from Fe in the corresponding spectra (see also Fig. 3) which correlate
with the expected presence of yellow ochre (goethite or limonite).
Based on the Raman spectra (Fig. 8) that were collected from VD09, VD10, UM07 and UM10, clear
information about the identity of the yellow pigment is obtained on the basis of characteristic spectral
bands of iron oxide goethite, FeO(OH). It is noted that yellow ochre, named also limonite (Fe2O3.
xH2O) is almost amorphous while goethite is crystalline. But as was found with the red paints, Raman
spectra collected on two yellow paints yielded no goethite bands neither bands corresponding to
limonite, which is found in yellow ochre.
XRD analysis indeed confirms the presence of iron oxide minerals in the yellow painted plasters
(hematite in Kn08, VD09 and geothite in VD10).
Please insert Fig. 8
Analysis of yellow paint layers from both the Bronze Age and the Roman period have identified
pigments based on iron oxides, yellow ochre. Although a second yellow pigment, orpiment (arsenic
sulphide), is mentioned by both Pliny and Vitruvius (Ref. 15 p.101; Ref. Ref. 17 : Vitruvius VII,
Chapter VII), Pliny notes the unsuitability of orpiment as a pigment for fresco painting, and definitive
identification of its use in Roman wall painting is lacking [23]. Despite the increasing application of
lead based yellow pigments from the Roman period onwards (for example, the lead oxide pigment
massicot has been identified in Roman paintings at Pompeii, while in later artists’ treatises, such as Il
Page 13 of 55 Analytical & Bioanalytical Chemistry
123456789101112131415161718192021222324252627282930313233343536373839404142434445464748495051525354555657585960
For Peer Review
14
Libro dell' Arte, Cennino Cennini describes a (presumed) lead tin yellow pigment he names
Giallorino (Ref. 19: Ch. XLVI)), painters in Crete appear to have maintained the more traditional
palette, and continued with the use of yellow ochre.
Please insert Table 3
3.3 Blue
Blue paint was present in 21 of the plaster fragments investigated (Table 4). Notably, in 12 of these
fragments LIBS spectra record relatively weak but clear emission from Cu indicating the use of a Cu-
based blue pigment (Error! Reference source not found.) that cannot be further identified on the
basis of its elemental composition.
Please insert Table 9
Despite the fact that the blue colour on the plaster surface is very clear and in some cases quite vivid,
it is surprising that the Cu emission signal observed in some of the LIBS spectra is rather weak.
Observation of the blue paint under the optical microscope shows clearly the presence of a rather low
density of relatively large-sized dark blue pigment grains scattered across a white matrix background.
Evidently this particle density is adequate to yield a blue colour appearance to the paint. But in the
LIBS measurement, the focused laser beam probes, along with the few pigment grains, a significant
part of the lime-based matrix, leading to an emission spectrum that represents the average
composition of the area analysed (of diameter in the range of 150-200 microns), which is dominated
by the strong Ca emission lines (Fig.9).
LIBS was found to be particulalrly effective in the characterization of layered paints. When LIBS
analysis is performed by using a number of consecutive laser pulses on the same spot, corresponding
spectra from successive layers of material can be recorded, that map the in-depth composition of the
paint layer or layers. This can be considered, in a way, as a kind of direct/in situ cross-section
analysis. One however needs to take into account two issues: a) the thickness of material removed per
laser pulse (λ = 1064 nm) is on the order of 1 micron, yet this can occasionally become significantly
larger when fragile paints are analysed and b) each pulse still monitors an average composition across
the irradiated spot (diameter approx. 150-200 microns).
For example, optical inspection of wall painting fragment VD08 showed clearly that at some point the
red paint has been applied over an underlying blue layer. LIBS analysis was carried out at that area
Page 14 of 55Analytical & Bioanalytical Chemistry
123456789101112131415161718192021222324252627282930313233343536373839404142434445464748495051525354555657585960
For Peer Review
15
employing a total of 7 laser pulses and recording (single-shot) spectra corresponding to each
individual pulse. By monitoring the Cu line intensity, (Fig. 10) a transition point is clearly observed
following irradiation of the paint with the 5th laser pulse. Evidently a gradual layer-by-layer removal
of paint takes place revealing the Cu-rich underlying paint. It is noted that Cu is detected from the
very first pulse, albeit at rather low intensity, until reaching pulse no 4, indicating that either small
quantities of the blue pigment are present in the red paint or that the red paint particle density is such
that it permits part of the laser beam to reach the underlying blue paint layer. On the other hand,
considering the Fe-line(s) intensity, it is seen that the Fe emission signal does not change
dramatically. The low signal corresponding to pulse no1, has been observed in several other
fragments as well, and is attributed to inefficient plasma formation resulting when a fresh surface,
bearing loose dust other material particles. On the other hand, pulse no7 shows a decreasing trend that
might indicate a drop of Fe concentration when the beam finally reaches the blue paint layer. In the
same wall painting fragment, a purple paint over blue was also investigated in the same fashion, 8
laser pulses were used, giving quite similar results with the Cu-line intensity showing an increase
upon reaching the blue paint layer and the Fe-line intensity correspondingly decreasing.
Please insert Figure 10
Raman measurements on the blue paints were quite revealing and in most cases enabled identification
of the Cu-based pigments suggested by LIBS. In particular, 11 of the 13 blue plaster fragments
examined, all from Knossos, were found to contain Egyptian Blue (CaCuSi4O10, cuprorivaite).
Notably the Egyptian Blue identification was based not on any Raman bands but on the extremely
strong fluorescence emission recorded when the microscope objective was focused on blue pigment
grains or grain aggregates (Fig. 11). It is widely known [24,25] that Egyptian Blue, upon excitation in
the visible and NIR, exhibits strong fluorescence emission with a maximum at about 890 nm.
Please insert Fig. 11
Unlike the samples from Knossos, those from Gortyna showed neither Egyptian Blue fluorescence
nor any Raman bands that could be related to the presence of a different blue pigment. It is noted here
that azurite, a Cu-based blue pigment, known to have been used in Byzantine times, shows quite low
Raman scattering cross-section when excited in the NIR, i.e. 786 nm [26] and therefore not easy to
detect. Surprisingly, in two cases, G11, G12, for which LIBS spectra did show the presence of Cu,
Raman bands characteristic of phthalocyanine blue (CuC32H16N8) were recorded. (Fig. 12)
Page 15 of 55 Analytical & Bioanalytical Chemistry
123456789101112131415161718192021222324252627282930313233343536373839404142434445464748495051525354555657585960
For Peer Review
16
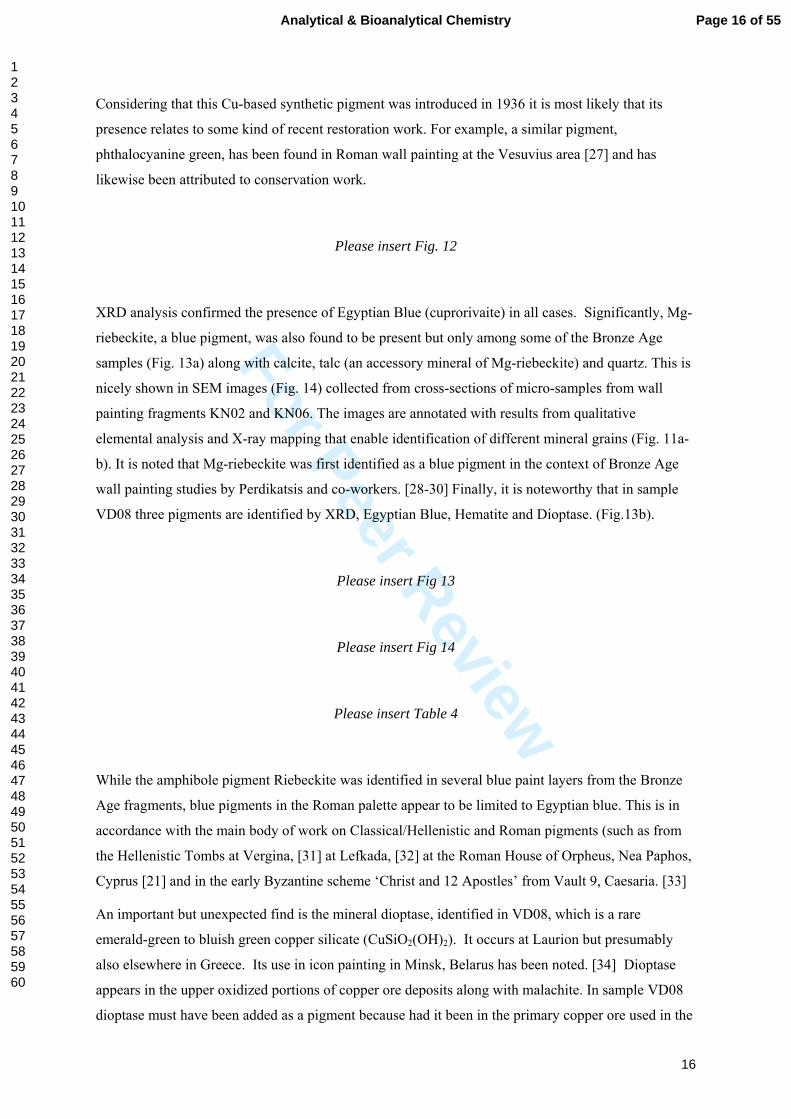
Considering that this Cu-based synthetic pigment was introduced in 1936 it is most likely that its
presence relates to some kind of recent restoration work. For example, a similar pigment,
phthalocyanine green, has been found in Roman wall painting at the Vesuvius area [27] and has
likewise been attributed to conservation work.
Please insert Fig. 12
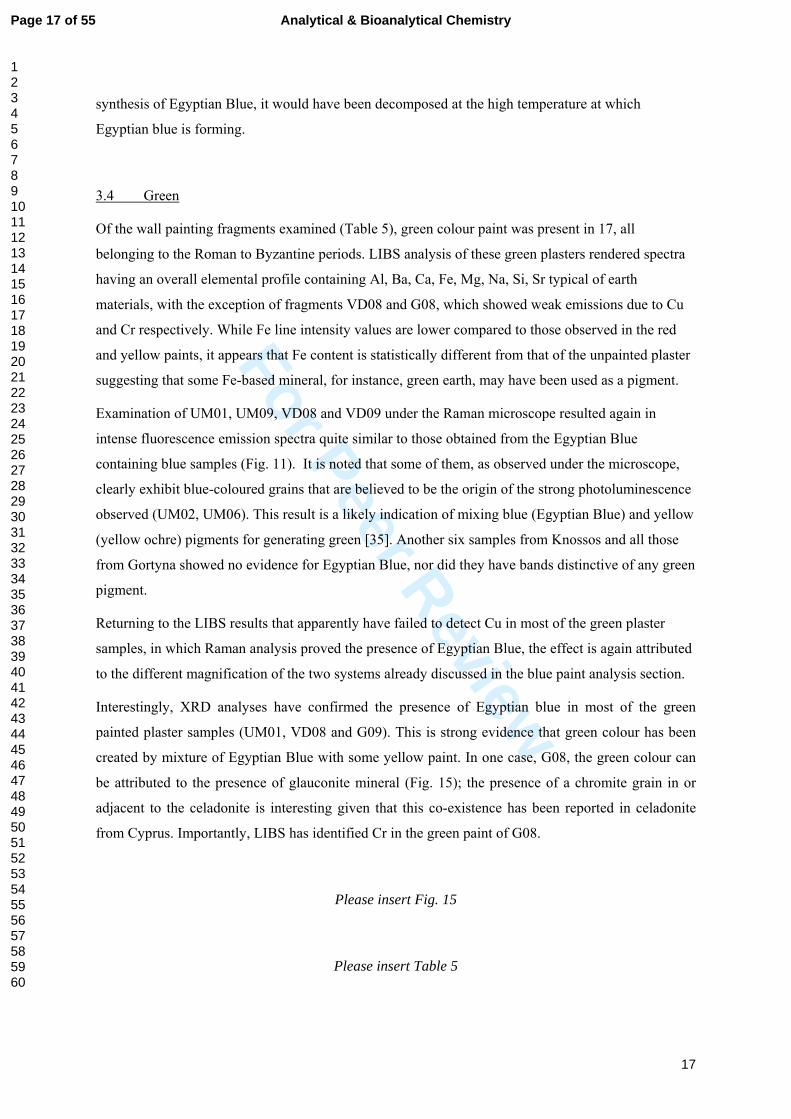
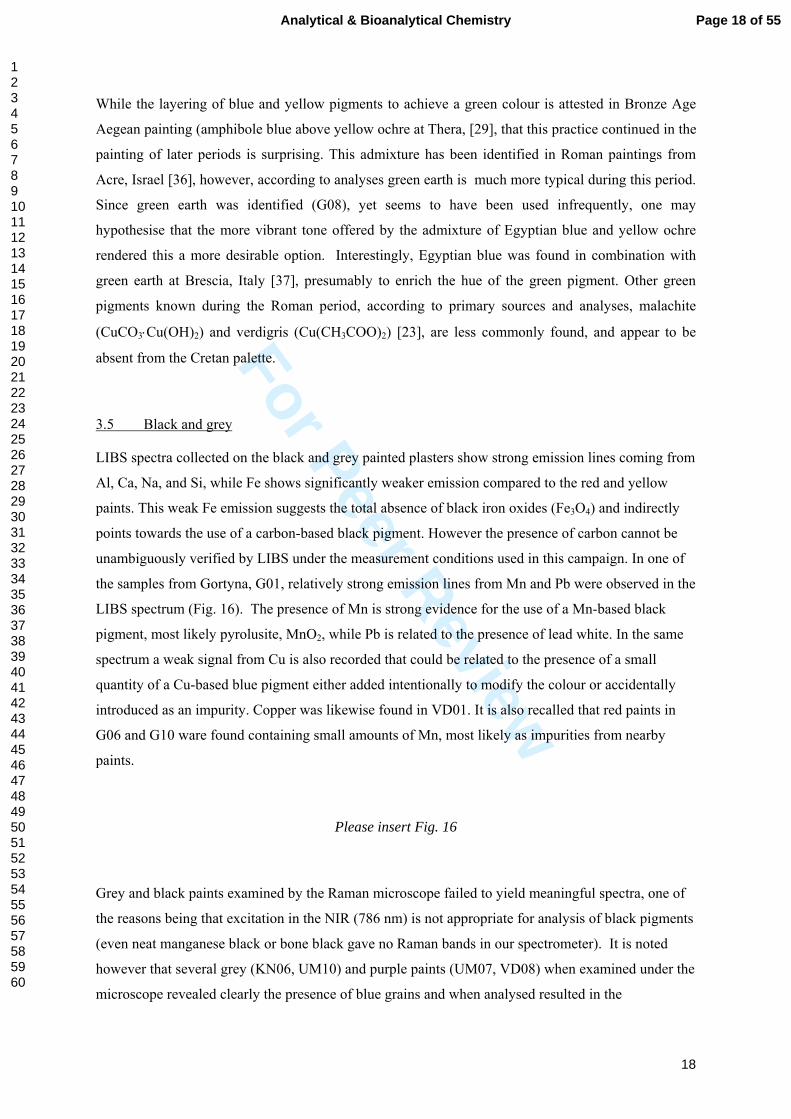
XRD analysis confirmed the presence of Egyptian Blue (cuprorivaite) in all cases. Significantly, Mg-
riebeckite, a blue pigment, was also found to be present but only among some of the Bronze Age
samples (Fig. 13a) along with calcite, talc (an accessory mineral of Mg-riebeckite) and quartz. This is
nicely shown in SEM images (Fig. 14) collected from cross-sections of micro-samples from wall
painting fragments KN02 and KN06. The images are annotated with results from qualitative
elemental analysis and X-ray mapping that enable identification of different mineral grains (Fig. 11a-
b). It is noted that Mg-riebeckite was first identified as a blue pigment in the context of Bronze Age
wall painting studies by Perdikatsis and co-workers. [28-30] Finally, it is noteworthy that in sample
VD08 three pigments are identified by XRD, Egyptian Blue, Hematite and Dioptase. (Fig.13b).
Please insert Fig 13
Please insert Fig 14
Please insert Table 4
While the amphibole pigment Riebeckite was identified in several blue paint layers from the Bronze
Age fragments, blue pigments in the Roman palette appear to be limited to Egyptian blue. This is in
accordance with the main body of work on Classical/Hellenistic and Roman pigments (such as from
the Hellenistic Tombs at Vergina, [31] at Lefkada, [32] at the Roman House of Orpheus, Nea Paphos,
Cyprus [21] and in the early Byzantine scheme ‘Christ and 12 Apostles’ from Vault 9, Caesaria. [33]
An important but unexpected find is the mineral dioptase, identified in VD08, which is a rare
emerald-green to bluish green copper silicate (CuSiO2(OH)2). It occurs at Laurion but presumably
also elsewhere in Greece. Its use in icon painting in Minsk, Belarus has been noted. [34] Dioptase
appears in the upper oxidized portions of copper ore deposits along with malachite. In sample VD08
dioptase must have been added as a pigment because had it been in the primary copper ore used in the
Page 16 of 55Analytical & Bioanalytical Chemistry
123456789101112131415161718192021222324252627282930313233343536373839404142434445464748495051525354555657585960
For Peer Review
17
synthesis of Egyptian Blue, it would have been decomposed at the high temperature at which
Egyptian blue is forming.
3.4 Green
Of the wall painting fragments examined (Table 5), green colour paint was present in 17, all
belonging to the Roman to Byzantine periods. LIBS analysis of these green plasters rendered spectra
having an overall elemental profile containing Al, Ba, Ca, Fe, Mg, Na, Si, Sr typical of earth
materials, with the exception of fragments VD08 and G08, which showed weak emissions due to Cu
and Cr respectively. While Fe line intensity values are lower compared to those observed in the red
and yellow paints, it appears that Fe content is statistically different from that of the unpainted plaster
suggesting that some Fe-based mineral, for instance, green earth, may have been used as a pigment.
Examination of UM01, UM09, VD08 and VD09 under the Raman microscope resulted again in
intense fluorescence emission spectra quite similar to those obtained from the Egyptian Blue
containing blue samples (Fig. 11). It is noted that some of them, as observed under the microscope,
clearly exhibit blue-coloured grains that are believed to be the origin of the strong photoluminescence
observed (UM02, UM06). This result is a likely indication of mixing blue (Egyptian Blue) and yellow
(yellow ochre) pigments for generating green [35]. Another six samples from Knossos and all those
from Gortyna showed no evidence for Egyptian Blue, nor did they have bands distinctive of any green
pigment.
Returning to the LIBS results that apparently have failed to detect Cu in most of the green plaster
samples, in which Raman analysis proved the presence of Egyptian Blue, the effect is again attributed
to the different magnification of the two systems already discussed in the blue paint analysis section.
Interestingly, XRD analyses have confirmed the presence of Egyptian blue in most of the green
painted plaster samples (UM01, VD08 and G09). This is strong evidence that green colour has been
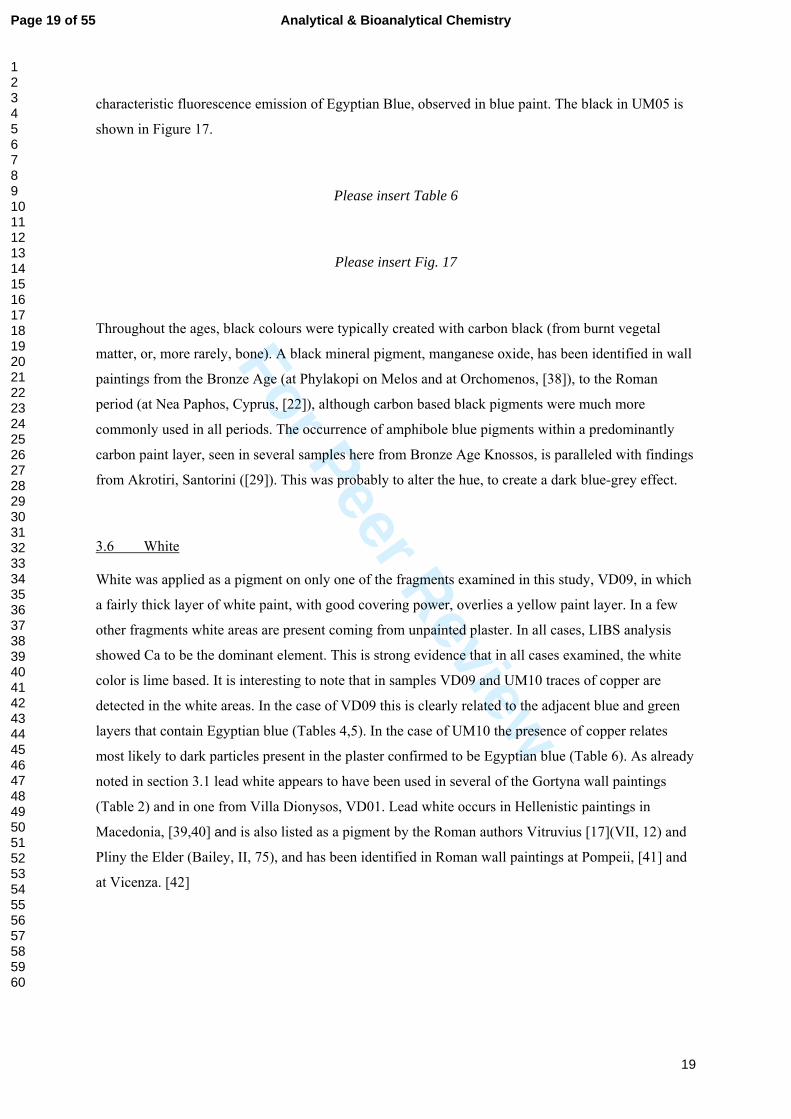
created by mixture of Egyptian Blue with some yellow paint. In one case, G08, the green colour can
be attributed to the presence of glauconite mineral (Fig. 15); the presence of a chromite grain in or
adjacent to the celadonite is interesting given that this co-existence has been reported in celadonite
from Cyprus. Importantly, LIBS has identified Cr in the green paint of G08.
Please insert Fig. 15
Please insert Table 5
Page 17 of 55 Analytical & Bioanalytical Chemistry
123456789101112131415161718192021222324252627282930313233343536373839404142434445464748495051525354555657585960
For Peer Review
18
While the layering of blue and yellow pigments to achieve a green colour is attested in Bronze Age
Aegean painting (amphibole blue above yellow ochre at Thera, [29], that this practice continued in the
painting of later periods is surprising. This admixture has been identified in Roman paintings from
Acre, Israel [36], however, according to analyses green earth is much more typical during this period.
Since green earth was identified (G08), yet seems to have been used infrequently, one may
hypothesise that the more vibrant tone offered by the admixture of Egyptian blue and yellow ochre
rendered this a more desirable option. Interestingly, Egyptian blue was found in combination with
green earth at Brescia, Italy [37], presumably to enrich the hue of the green pigment. Other green
pigments known during the Roman period, according to primary sources and analyses, malachite
(CuCO3⋅Cu(OH)2) and verdigris (Cu(CH3COO)2) [23], are less commonly found, and appear to be
absent from the Cretan palette.
3.5 Black and grey
LIBS spectra collected on the black and grey painted plasters show strong emission lines coming from
Al, Ca, Na, and Si, while Fe shows significantly weaker emission compared to the red and yellow
paints. This weak Fe emission suggests the total absence of black iron oxides (Fe3O4) and indirectly
points towards the use of a carbon-based black pigment. However the presence of carbon cannot be
unambiguously verified by LIBS under the measurement conditions used in this campaign. In one of
the samples from Gortyna, G01, relatively strong emission lines from Mn and Pb were observed in the
LIBS spectrum (Fig. 16). The presence of Mn is strong evidence for the use of a Mn-based black
pigment, most likely pyrolusite, MnO2, while Pb is related to the presence of lead white. In the same
spectrum a weak signal from Cu is also recorded that could be related to the presence of a small
quantity of a Cu-based blue pigment either added intentionally to modify the colour or accidentally
introduced as an impurity. Copper was likewise found in VD01. It is also recalled that red paints in
G06 and G10 ware found containing small amounts of Mn, most likely as impurities from nearby
paints.
Please insert Fig. 16
Grey and black paints examined by the Raman microscope failed to yield meaningful spectra, one of
the reasons being that excitation in the NIR (786 nm) is not appropriate for analysis of black pigments
(even neat manganese black or bone black gave no Raman bands in our spectrometer). It is noted
however that several grey (KN06, UM10) and purple paints (UM07, VD08) when examined under the
microscope revealed clearly the presence of blue grains and when analysed resulted in the
Page 18 of 55Analytical & Bioanalytical Chemistry
123456789101112131415161718192021222324252627282930313233343536373839404142434445464748495051525354555657585960
For Peer Review
19
characteristic fluorescence emission of Egyptian Blue, observed in blue paint. The black in UM05 is
shown in Figure 17.
Please insert Table 6
Please insert Fig. 17
Throughout the ages, black colours were typically created with carbon black (from burnt vegetal
matter, or, more rarely, bone). A black mineral pigment, manganese oxide, has been identified in wall
paintings from the Bronze Age (at Phylakopi on Melos and at Orchomenos, [38]), to the Roman
period (at Nea Paphos, Cyprus, [22]), although carbon based black pigments were much more
commonly used in all periods. The occurrence of amphibole blue pigments within a predominantly
carbon paint layer, seen in several samples here from Bronze Age Knossos, is paralleled with findings
from Akrotiri, Santorini ([29]). This was probably to alter the hue, to create a dark blue-grey effect.
3.6 White
White was applied as a pigment on only one of the fragments examined in this study, VD09, in which
a fairly thick layer of white paint, with good covering power, overlies a yellow paint layer. In a few
other fragments white areas are present coming from unpainted plaster. In all cases, LIBS analysis
showed Ca to be the dominant element. This is strong evidence that in all cases examined, the white
color is lime based. It is interesting to note that in samples VD09 and UM10 traces of copper are
detected in the white areas. In the case of VD09 this is clearly related to the adjacent blue and green
layers that contain Egyptian blue (Tables 4,5). In the case of UM10 the presence of copper relates
most likely to dark particles present in the plaster confirmed to be Egyptian blue (Table 6). As already
noted in section 3.1 lead white appears to have been used in several of the Gortyna wall paintings
(Table 2) and in one from Villa Dionysos, VD01. Lead white occurs in Hellenistic paintings in
Macedonia, [39,40] and is also listed as a pigment by the Roman authors Vitruvius [17](VII, 12) and
Pliny the Elder (Bailey, II, 75), and has been identified in Roman wall paintings at Pompeii, [41] and
at Vicenza. [42]
Page 19 of 55 Analytical & Bioanalytical Chemistry
123456789101112131415161718192021222324252627282930313233343536373839404142434445464748495051525354555657585960
For Peer Review
20
3.7 Modern replicas
The value of the observations on the modern replicas, introduced in section 2.2, lies chiefly in the
enquiry into the painting technique which will be the object of a separate publication. Here we present
only a summary of some of the findings. While the two black paint layers appeared fairly
homogeneous, the green earth consisted of particles of various. White particles, probably from the
plaster layer, were observed in the red earth paint layers.
A distinct difference was observed between the fresco and secco paint layers with the highest
concentration of pigment. While the fresco paint layers varied in thickness and presented a rather
uneven surface topography, those applied with binding media were of a more consistent thickness.
This was especially the case with pigment applied with egg as a binding medium.
Surprisingly, pigment penetration into the plaster layer, with both the fresco and the secco replicas,
was minimal. Further experiments were undertaken mixing the pigments with saturated lime water
prior to application; this resulted in deeper penetration of the pigments, but also a drastic alteration
(dilution) of the pigment hue. Staining tests for proteins and lipids gave positive results in the secco
paint layers. That fluorescence was not observed in the paint layers with oil or resin is probably due to
the materials having been recently applied, since research shows that aged samples present greater
fluorescence. In almost every case, some areas within the plaster layers auto-fluoresced. Since no
organic materials were (intentionally) added to the plaster, this serves as a caution when interpreting
results of the staining tests.
4. Conclusions
In this study 53 wall painting samples were analysed in the context of a scientific study aimed at a)
determining similarities and evolutions of painting materials and technology in Bronze Age, Roman-
Hellenistic to Byzantine Crete and b) to test a multi-analytical technique methodology that combined
mobile instrumentation, LIBS and Raman spectroscopy, with laboratory techniques, mainly non-
destructive XRD performed directly on the wall painting fragments, but also SEM coupled to X-ray
analysis and mapping performed on micro-samples.
Concerning practical aspects of analysis the LIBS system used was found to be rather more versatile
compared to the Raman system based on operational factors, including sample positioning, signal
intensity and hence sensitivity, immunity to ambient light and speed of data acquisition. On the other
hand the Raman microscope offered superior magnification, hence high spatial resolution, but
measurements needed rather long acquisition times (typically 1-5 minutes) and had to be performed
in the dark. For that purpose a light-tight enclosure was used. Both instruments were used in situ,
Page 20 of 55Analytical & Bioanalytical Chemistry
123456789101112131415161718192021222324252627282930313233343536373839404142434445464748495051525354555657585960
For Peer Review
21
directly on the wall painting fragments. In particular, the LIBS system can be easily used to analyze
large objects or structure (e.g. a wall) with the use of an appropriate support or scaffolding.
From the point of view of analytical information, LIBS yields data that relate to the elemental
composition of the sample, actually a small area of the sample surface, typically 0.1 mm2. Major,
minor and, in favourable cases, trace elements can be detected. In the absence of proper calibration
standards, quantitative results are difficult to obtain. But in cases of highly heterogeneous materials,
such as those dealt with in this study, the semi-quantitative picture can still be quite useful. Actual
molecular structure information cannot be extracted, however, knowing types of materials that might
be present in the sample, it is often possible to correlate elemental information with specific
compounds, for example iron with hematite in the case of the red paints or manganese with pyrolusite.
On the other hand, Raman spectra provide clear evidence for the presence of specific molecular
structures, thus revealing the identity of pigments and minerals. Emission of fluorescence can be a
source of interference, as was shown in several cases in this study, overwhelming the Raman
scattering signal, which is quite weaker, yet in a few favourable cases, for instance, that of Egyptian
blue, fluorescence emission can offer equally valuable analytical information. Using excitation at
longer wavelengths, in the near infrared, minimizes fluorescence from organic substances present but
on the other hand certain materials, for example Cu pigments or carbon black are detected efficiently
only with visible excitation. Finally, unlike LIBS, which results in small but finite sample removal
during analysis, the Raman technique is totally non-destructive, provided no excessive laser power is
used during measurements that might lead to local thermal alteration of the sample surface.
The two techniques offer complementary information that can be quite useful for conservators and
archaeologists. In addition, they feature significant advantages having to do with their application
outside the research laboratory in an effective manner that enables quick surveying of samples and
objects, aiding object selection for subsequent analysis by advanced laboratory techniques, such as the
ones used in this study, XRD and SEM-EDX that proved, in most cases, unambiguously the identity
of pigments and minerals present in the painted plaster.
In the archaeological context, looking at data obtained on Bronze Age, i.e. Minoan wall paintings
elsewhere on Crete, there is a high level of comparability (Ref. 1, Table 6.7a; Ref.2, Table 13.2). The
presence of the green earth celadonite together with chlorite in a green fragment at Palaikastro is
noted. Turning to the pigments responsible for blue colours, an issue that has attracted much
attention, there are some significant geographical trends: At Knossos Egyptian Blue and Riebeckite
occur sometimes together [43], as they do at Chania in the west of Crete [44], yet Egyptian Blue is
absent at Kommos in the south [3] and at Palaikastro. However, the situation in the Mesara of Crete
appears complex since Perdikatsis [45] and Dandrau [46] have both detected Egyptian Blue in
conjunction with riebeckite-glaucophane at Ayia Triadha, and at nearby Phaistos Duell and Gettens
Page 21 of 55 Analytical & Bioanalytical Chemistry
123456789101112131415161718192021222324252627282930313233343536373839404142434445464748495051525354555657585960
For Peer Review
22
[47] found Egyptian Blue. Jones’ recent attempt to classify Minoan pigments as local, regional and
exotic, has placed the iron-rich blue, belonging to the amphibole family and comprising riebeckite,
glaucophane or crossite, as a regional product. This has followed on the geological work of Seidel et
al [48] who recognised that, the locations of these minerals on Crete are known only at the broad
geological level: glaucophane in phyllite-quartzite rocks in West Crete and crossite/magnesio-
riebeckite in similar formations in the centre and east (Fig. 18). The apparent absence of tin (note
that Sn if present is certainly <1% and often <0.1%) in any of the Egyptian Blue examples studied
here seems to contrast with the situation found elsewhere (Ref. 1 pp. 134-5).
Please insert Fig. 18
On the basis of evidence from the current study, the wall painting palette used in Crete from the
Bronze Age to the early Byzantine period appears somewhat limited. Few changes are seen in the
materials and techniques from the earliest to the latest of our examples. Significant additions to the
Bronze Age palette during the later periods are the lead based pigment detected in some paint layers
from the Roman wall paintings, and celadonite, green earth, on one Byzantine fragment. The results
presented here are in accordance with previous analyses of Bronze Age wall painting in Crete and the
Aegean. Likewise, results from the Roman wall paintings are consistent with those from the Roman
Empire as a whole, but do not include any of the more ‘exotic’ materials, such as malachite and
cinnabar, occasionally evidenced elsewhere from this period. Comparanda for the early Byzantine
paintings was unavailable. It is hoped that future research in this area will develop these preliminary
findings, and provide a more complete picture of the materials and techniques used in this period.
Finally, a brief comment can be made on the plaster substrate which was found, as expected, to be
lime-based in all samples. In the SEM, primary and secondary calcite was observed in eight samples.
But work could usefully be done on a fuller characterisation of the plasters, including an explanation
for the grey-blue hue of the plaster layer in UM10 and in a Bronze Age sample from Mochlos in East
Crete containing small particles of carbon within the plaster matrix. The source of that carbon – bone
ash or plant – and its purpose (colourant?) are as yet unclear. Another issue is the complex plaster
stratigraphy observed in several samples, as mentioned at the start of the Results section. Along with
the study of the modern replicas, this topic will be reported in a separate publication.
Page 22 of 55Analytical & Bioanalytical Chemistry
123456789101112131415161718192021222324252627282930313233343536373839404142434445464748495051525354555657585960
For Peer Review
23
Acknowledgements
This project is carried out in the frame of a collaboration between the Department of Archaeology,
University of Glasgow and IESL-FORTH, funded in part by the Leverhulme Trust, UK. We are very
grateful to those who gave permission to analyse the wall painting fragments from their excavations:
Dr Sara Paton, Dr Colin MacDonald, and Prof.ssa Raffaella Farioli. Many thanks also to all who
facilitated the study and selection of original materials: Dr Doniert Evely, Professor Todd Whitelaw,
Dr Evangelia Kiriatzi, Mrs Helen Clark, and Mrs Vicki Tzavara of the British School at Athens, Dr
Kostas Giapitsoglou and colleagues at the 13th Ephorate of Byzantine Antiquities, the 23rd Ephorate of
Prehistoric and Classical Antiquities, Dr A.G.Benvenuti, and colleagues at the Scuola Archeologica
Italiana di Atene. PS and AF acknowledge support from the EC Charisma project (FP7-INFRA-Grant
agreement no: 228330). We thank Dr Ross Stevenson and Dr Karen Faulds in the Chemistry
Department at Strathclyde University for access to their Raman spectroscopy instrumentation.
Page 23 of 55 Analytical & Bioanalytical Chemistry
123456789101112131415161718192021222324252627282930313233343536373839404142434445464748495051525354555657585960

For Peer Review
24
References
1. Brysbaert A (2008) The Power of Technology in the Bronze Age Eastern Mediterranean.
Monographs in Mediterranean Archaeology. Equinox, London
2. Jones RE, Photos-Jones E (2004) Technical studies of Aegean Bronze Age wall paintings:
methods, results and future prospects. In: Aegean Wall Paintings: a tribute to Mark Cameron. British
School at Athens, London, pp 199-228
3. Dandrau A, Dubernet S (2006) Plasters from Kommos: A Scientific Analysis of Fabrics and
Pigments. In: Kommos V: The Monumental Minoan Buildings at Kommos. Princeton University
Press, Princeton, pp 236–241
4. Anglos D (2001) Laser-Induced Breakdown Spectroscopy in Art and Archaeology. Appl Spectrosc
55:186A-205A
5. Giakoumaki A, Melessanaki K, Anglos D (2007) Laser-induced breakdown spectroscopy (LIBS) in
archaeological science—applications and prospects. Anal Bioanal Chem 387:749-760-760
6. Cunat J, Palanco S, Carrasco F, Simon MD, Laserna JJ (2005) Portable instrument and analytical
method using laser-induced breakdown spectrometry for in situ characterization of speleothems in
karstic caves. J Anal At Spectrom 20:295-300
7. Fortes FJ, Cunat J, Cabalin LM, Laserna JJ (2007) In Situ Analytical Assessment and Chemical
Imaging of Historical Buildings Using a Man-Portable Laser System. Appl Spectrosc 61:558-564
8. Agresti J, Mencaglia A, Siano S (2009) Development and application of a portable LIPS system for
characterising copper alloy artefacts. Anal Bioanal Chem 395:2255-2262
9. Brysbaert A, Melessanaki K, Anglos D (2006) Pigment analysis in Bronze Age Aegean and Eastern
Mediterranean painted plaster by laser-induced breakdown spectroscopy (LIBS). J Archaeol Sci
33:1095-1104
10. Smith GD, Clark RJH (2004) Raman microscopy in archaeological science. J Archaeol Sci
31:1137-1160
11. Vandenabeele P, Edwards HGM, Moens L (2007) A Decade of Raman Spectroscopy in Art and
Archaeology. Chem Rev 107:675-686
12. Mazzeo, R. Prati, S., Sandu, I, Spring, M. (2009). Paint layers. In: Pinna, D. Galeoti, M., Mazzeo,
R. Scientific Examination for the investigation of Paintings. A Handbook for Conservator - Restorers.
Firenze Italy: Centro Di della Edifirmi srl)
Page 24 of 55Analytical & Bioanalytical Chemistry
123456789101112131415161718192021222324252627282930313233343536373839404142434445464748495051525354555657585960
For Peer Review
25
13. Eastaugh N, Walsh V, Chaplin T, Siddall R (2004) The Pigment Compendium: A Dictionary of
Historical Pigments. Elsevier Butterworth-Heinemann, Oxford
14. Burgio L, Clark RJH (2001) Library of FT-Raman spectra of pigments, minerals, pigment media
and varnishes, and supplement to existing library of Raman spectra of pigments. with visible
excitation Spectrochim Acta A 57:1491-1521
15. Bailey K (1929) The Elder Pliny's Chapters on Chemical Subjects, Part I. Edward Arnold & Co,
London
16. Bailey K (1932) The Elder Pliny's Chapters on Chemical Subjects, Part II. Edward Arnold & Co,
London
17. Vitruvius, The Ten Books on Architecture. (1960) (trans: Morgan MH). Dover Publications,
New York
18. Augusti S (1967) I colori pompeiani. De Luca Editore, Rome
19. Cennino D' Andrea Cennini. The Craftsman's Handbook. The Italian "Il Libro dell' Arte". (1960)
(trans: Thompson DV). Dover Publications, New York
20. Mazzocchin GA, Agnoli F, Salvadori M (2004) Analysis of Roman age wall paintings found in
Pordenone, Trieste and Montegrotto. Talanta 64:732-741
21. Calamiotou M, Siganidou M, Filippakis SE (1983) X-Ray Analysis of Pigments from Pella,
Greece. Stud Conservat 28:117-121
22. Kakoulli I Roman wall paintings: a scientific investigation of their technology. In: Roman Wall
Painting: Materials, Techniques, Analysis and Conservation: Proceedings of the International
Workshop, Fribourg, 7-9 March 1996. pp 131-141
23. Siddall R., (2006) Not a day without a line drawn : pigments and painting techniques of Roman
Artists. Proceedings of the Royal Microscopical Society 2: 18-31
24. Pozza G, Ajό D, Chiari G, De Zuane F, Favaro M (2000) Photoluminescence of the inorganic
pigments Egyptian blue, Han blue and Han purple. J Cult Herit 1:393-398
25. Accorsi G, Verri G, Bolognesi M, Armaroli N, Clementi C, Miliani C, Romani A (2009) The
exceptional near-infrared luminescence properties of cuprorivaite (Egyptian blue). Chem Commun
23:3392-3394
26. RRUFF™ Project. http://rruff.info/.
27. Aliatis I, Bersani D, Campani E, Casoli A, Lottici PP, Mantovan S, Marino I-G, Ospitali F (2009)
Green pigments of the Pompeian artists' palette. Spectrochim Acta A 73:532-538
Page 25 of 55 Analytical & Bioanalytical Chemistry
123456789101112131415161718192021222324252627282930313233343536373839404142434445464748495051525354555657585960
For Peer Review
26
28. Filippakis SE, Perdikatsis B, Th. P (1976) An analysis of blue Pigments from Greek bronze age.
Stud Conservat 21:143-153
29. Perdikatsis V, Kilikoglou V, Sotiropoulou S, Chryssikopoulou E (2000) Physicochemical
characterisation of pigments from Theran wall paintings. In: The Wall Paintings of Thera - Vol. 1:
Proceedings of the First International Symposium, Athens, 30 August - 4 September 2000. pp 103-
129
30. Profi S, Perdikatsis B, Filippakis SE (1977) X-Ray analysis of Greek bronze age pigments from
Thera (Santorini). Stud Conservat 22:107-115
31. Filippakis SE, Petrakis A, Assimenos K (1979) X-ray analysis of pigments from Vergina (second
tomb). Stud Conservat 24:54-58
32. Mirtsou E, Kesisoglou M, Michailidis K (1985) Αναλυση χρωματων και κονιαματων
μακεδονικου ταφου της περιοχης Λευκαδιων. Ανθρωπολογικα 8:47-51
33 R Linn (1996) Scientific investigation of the Roman and early Byzantine wall paintings of
Caesarea, Israel, Unpublished MA Courtauld Institute of Art, University of London.
34. www.obitel-minsk.by/obitel-minsk_mid496.html
35. Bearat H (1996) Chemical and mineralogical analyses of gallo-roman wall painting from
Dietikon, Switzerland. Archaeometry 38:81-95
36. Segal I, Porat N (1997) Composition of pigments from the Hellenistic walls in Acre. In: Roman
Wall Painting: Materials, Techniques, Analysis and Conservation: Proceedings of the International
Workshop, Fribourg, 7-9 March 1996. pp 85-92
37. Bugini R, Folli L (1997) Materials and Making Techniques of Roman Republican Wall Paintings.
In: Roman Wall Painting: Materials, Techniques, Analysis and Conservation: Proceedings of the
International Workshop, Fribourg, 7-9 March 1996. pp 121–130
38. Brysbaert A (2004) Technology and Social Agency in Bronze Age Aegean and Eastern
Mediterranean Painted Plaster. PhD thesis, Department of Archaeology, University of Glasgow,
Scotland.
39. H. Brecoulaki , V. Perdikatsis (2002), Ancient Painting on Macedonian Funerary Monuments,IV-
III c B.C: A comparative study on the use of color, in M.A. Tiverios, D.S. Tsiafakis eds, Color in
Ancient Greece, pp.147-154, Aristotle University of Thessaloniki
40. V. Perdikatsis, Y. Maniatis, Chr. Saatsoglou-Paliadeli (2002) Characterization of the pigments and
the painting technique used on the Vergina stelae, in M.A. Tiverios, D.S. Tsiafakis eds, Color in
Ancient Greece, pp.245-258, Aristotle University of Thessaloniki
Page 26 of 55Analytical & Bioanalytical Chemistry
123456789101112131415161718192021222324252627282930313233343536373839404142434445464748495051525354555657585960

For Peer Review
27
41. Varone A, Bearat H (1997) Pittori romani al lavoro. Materiali, strumenti, techniche: evidenze
archeologiche e dati analitici de un recente scavo pompeiano lungo via dell’Abbondanza (reg. IX ins.
12). In: Roman Wall Painting: Materials, Techniques, Analysis and Conservation: Proceedings of the
International Workshop, Fribourg, 7-9 March 1996.
42. Mazzocchin GA, Agnoli F, Mazzocchin S, Colpo I (2003) Analysis of pigments from Roman wall
paintings found in Vicenza. Talanta 61:565-572
43. Cameron MAS, Jones RE, Filippakis SE (1977) Analuysis of Fresco Samples form Knossos, The
Annals of the British School of Archaeology in Athens 72: pp.123-184
44. Photos-Jones E, Jones RE, Hall AJ (2003) Technical report on painted plaster fragments from the
Greek-Sewdish excavations at Kastelli, Khania, Crete. Appendix 4. In: The Greek-Swedish
excavations at the Agia Aikaterini Square, Kastelli, Khania, 1970-1987 and 2001: Results of the
excavations under the direction of Yannis Tzedakis and Carl-Gustaf Styrenius, vol III. Astrom
Editions, Stockholm, pp 306-320
45. Perdikatsis V (1995) Analysis of pigments from ancient Greek art monuments, in Proc. Scientific
Symp. Art and Technology (Athens 1993), Athens, 272-80.
46. Dandrau A (1999) La peinture murale minoenne, I. La palette du peintre égéen et égyptien à l'Age
du Bronze. Nouvelles données analytiques. Bulletin de correspondance hellénique 123:1-41
47. Gettens RJ, Duell P (1942) A Review of the problem of Aegean wall painting. Technical Studies,
in the Field of the Fine Arts 10:179-223
48. Seidel E, Okrusch M, Kreuzer H, Raschka H, Harre W (1976) EO-Alpine metamorphism in
uppermost unit of Cretan nappe system - petrology and geochronology 1 Lendas area (Asterousia
Mountains) Contrib. Minaeral Petrol 57: 259-275
Page 27 of 55 Analytical & Bioanalytical Chemistry
123456789101112131415161718192021222324252627282930313233343536373839404142434445464748495051525354555657585960
For Peer Review
28
LIST OF TABLES
Table 1 Density and mass absorption factors for some minerals that were identified in the
plaster samples.
Table 2 Summary of results of red paint analysis
Table 3 Summary of results of yellow paint analysis
Table 5 Summary of results of green paint analysis
Table 6 Summary of results of black and grey paint analysis
Page 28 of 55Analytical & Bioanalytical Chemistry
123456789101112131415161718192021222324252627282930313233343536373839404142434445464748495051525354555657585960
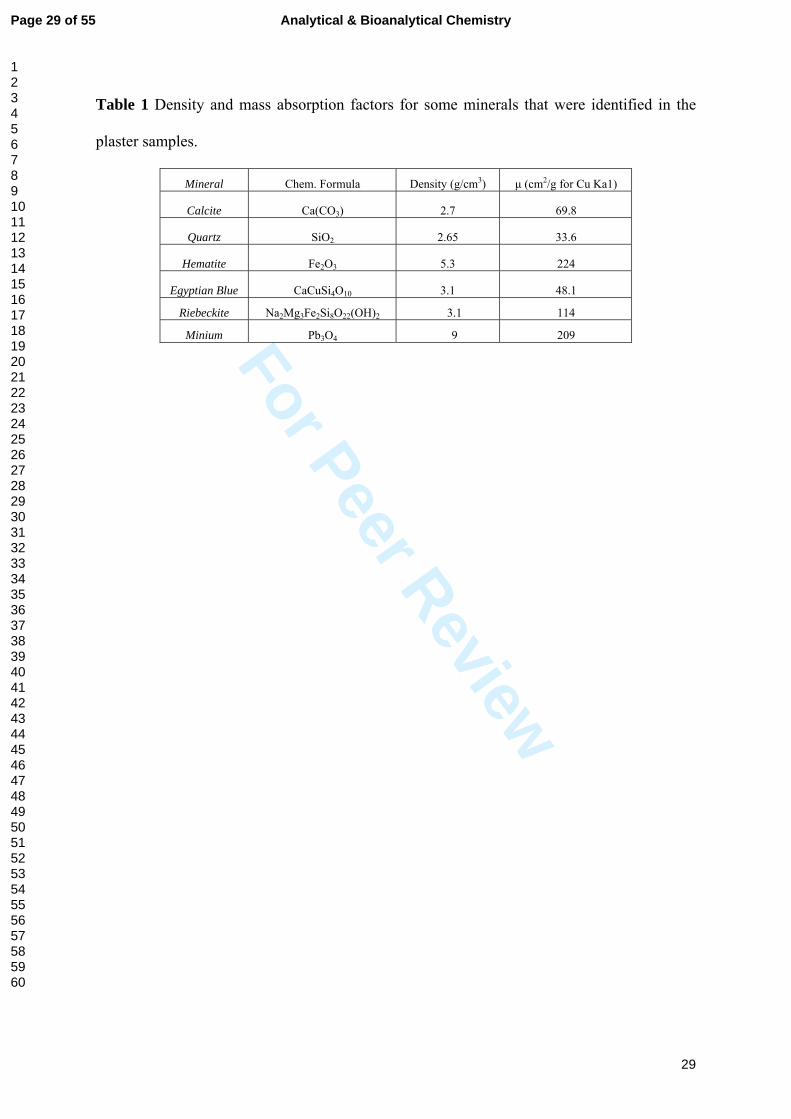
For Peer Review
29
Table 1 Density and mass absorption factors for some minerals that were identified in the
plaster samples.
Mineral Chem. Formula Density (g/cm3) μ (cm2/g for Cu Ka1)
Calcite Ca(CO3) 2.7 69.8
Quartz SiO2 2.65 33.6
Hematite Fe2Ο3 5.3 224
Egyptian Blue CaCuSi4O10 3.1 48.1
Riebeckite Na2Mg3Fe2Si8O22(OH)2 3.1 114
Minium Pb3O4 9 209
Page 29 of 55 Analytical & Bioanalytical Chemistry
123456789101112131415161718192021222324252627282930313233343536373839404142434445464748495051525354555657585960
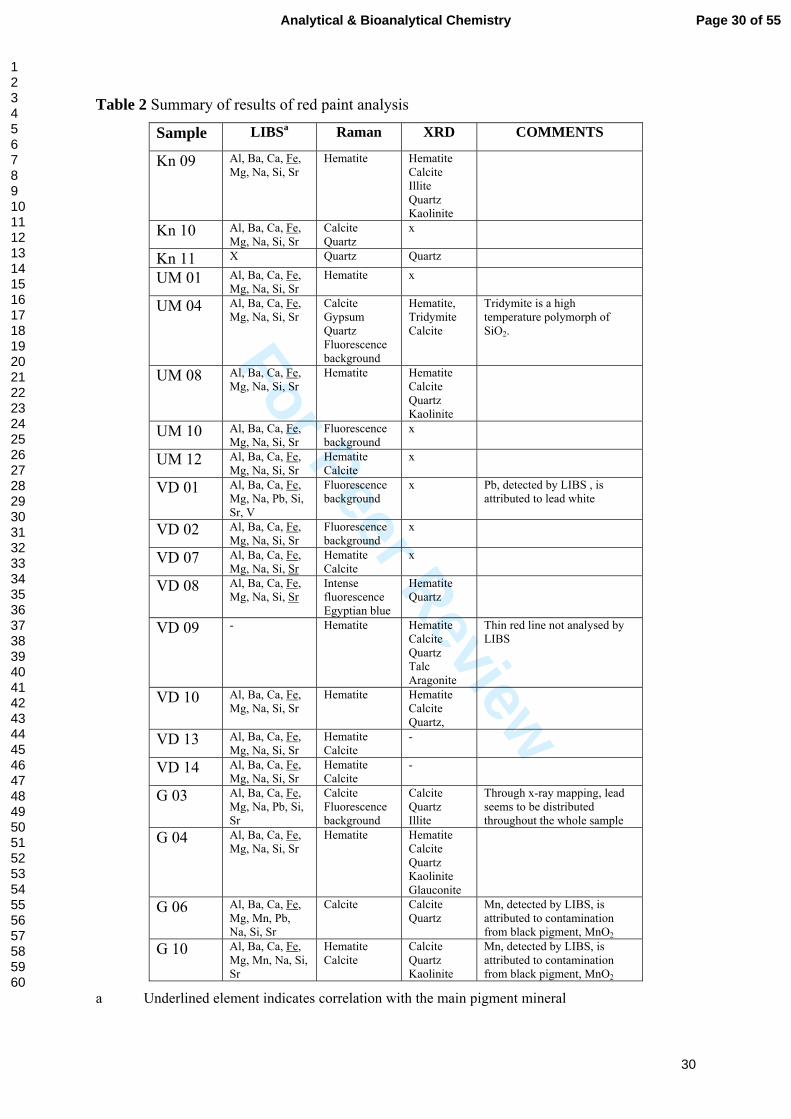
For Peer Review
30
Table 2 Summary of results of red paint analysis
Sample LIBSa Raman XRD COMMENTS
Kn 09 Al, Ba, Ca, Fe, Mg, Na, Si, Sr
Hematite Hematite Calcite Illite Quartz Kaolinite
Kn 10 Al, Ba, Ca, Fe, Mg, Na, Si, Sr
Calcite Quartz
x
Kn 11 X Quartz Quartz
UM 01 Al, Ba, Ca, Fe, Mg, Na, Si, Sr
Hematite x
UM 04 Al, Ba, Ca, Fe, Mg, Na, Si, Sr
Calcite Gypsum Quartz Fluorescence background
Hematite, Tridymite Calcite
Tridymite is a high temperature polymorph of SiO2.
UM 08 Al, Ba, Ca, Fe, Mg, Na, Si, Sr
Hematite Hematite Calcite Quartz Kaolinite
UM 10 Al, Ba, Ca, Fe, Mg, Na, Si, Sr
Fluorescence background
x
UM 12 Al, Ba, Ca, Fe, Mg, Na, Si, Sr
Hematite Calcite
x
VD 01 Al, Ba, Ca, Fe, Mg, Na, Pb, Si, Sr, V
Fluorescence background
x Pb, detected by LIBS , is attributed to lead white
VD 02 Al, Ba, Ca, Fe, Mg, Na, Si, Sr
Fluorescence background
x
VD 07 Al, Ba, Ca, Fe, Mg, Na, Si, Sr
Hematite Calcite
x
VD 08 Al, Ba, Ca, Fe, Mg, Na, Si, Sr
Intense fluorescence Egyptian blue
Hematite Quartz
VD 09 - Hematite Hematite Calcite Quartz Talc Aragonite
Thin red line not analysed by LIBS
VD 10 Al, Ba, Ca, Fe, Mg, Na, Si, Sr
Hematite Hematite Calcite Quartz,
VD 13 Al, Ba, Ca, Fe, Mg, Na, Si, Sr
Hematite Calcite
-
VD 14 Al, Ba, Ca, Fe, Mg, Na, Si, Sr
Hematite Calcite
-
G 03 Al, Ba, Ca, Fe, Mg, Na, Pb, Si, Sr
Calcite Fluorescence background
Calcite Quartz Illite
Through x-ray mapping, lead seems to be distributed throughout the whole sample
G 04 Al, Ba, Ca, Fe, Mg, Na, Si, Sr
Hematite Hematite Calcite Quartz Kaolinite Glauconite
G 06 Al, Ba, Ca, Fe, Mg, Mn, Pb, Na, Si, Sr
Calcite Calcite Quartz
Mn, detected by LIBS, is attributed to contamination from black pigment, MnO2
G 10 Al, Ba, Ca, Fe, Mg, Mn, Na, Si, Sr
Hematite Calcite
Calcite Quartz Kaolinite
Mn, detected by LIBS, is attributed to contamination from black pigment, MnO2
a Underlined element indicates correlation with the main pigment mineral
Page 30 of 55Analytical & Bioanalytical Chemistry
123456789101112131415161718192021222324252627282930313233343536373839404142434445464748495051525354555657585960
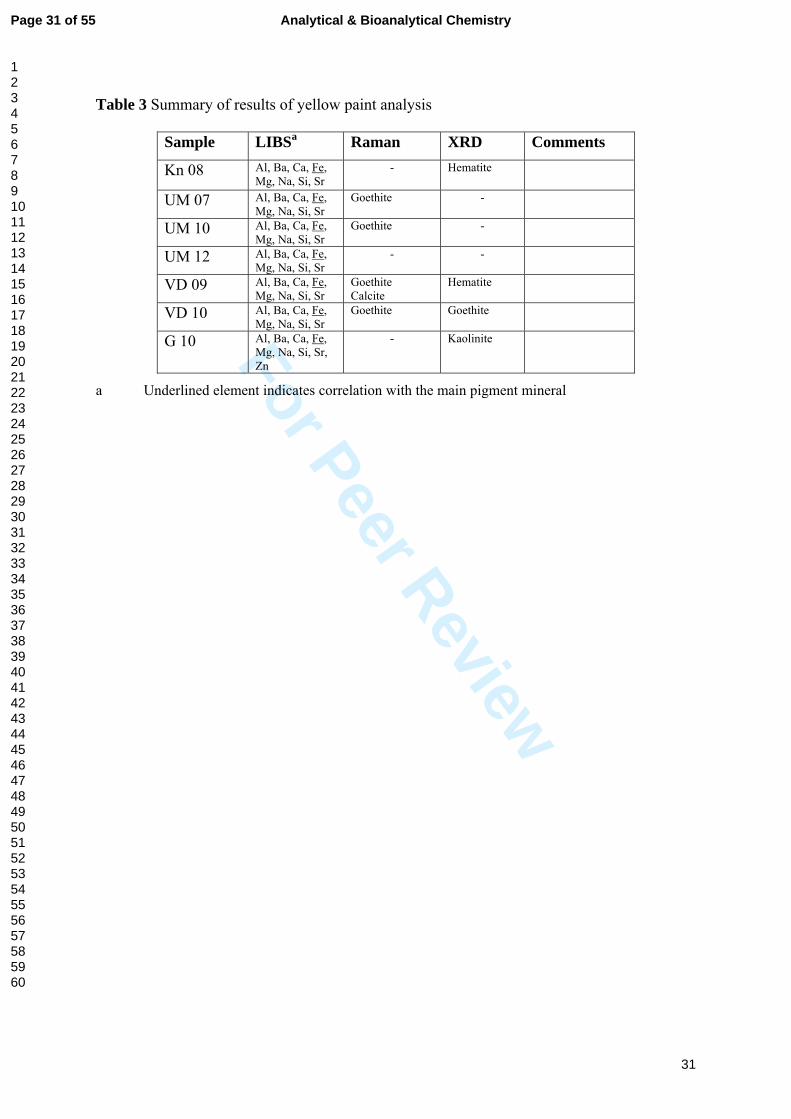
For Peer Review
31
Table 3 Summary of results of yellow paint analysis
Sample LIBSa Raman XRD Comments
Kn 08 Al, Ba, Ca, Fe, Mg, Na, Si, Sr
- Hematite
UM 07 Al, Ba, Ca, Fe, Mg, Na, Si, Sr
Goethite -
UM 10 Al, Ba, Ca, Fe, Mg, Na, Si, Sr
Goethite -
UM 12 Al, Ba, Ca, Fe, Mg, Na, Si, Sr
- -
VD 09 Al, Ba, Ca, Fe, Mg, Na, Si, Sr
Goethite Calcite
Hematite
VD 10 Al, Ba, Ca, Fe, Mg, Na, Si, Sr
Goethite Goethite
G 10 Al, Ba, Ca, Fe, Mg, Na, Si, Sr, Zn
- Kaolinite
a Underlined element indicates correlation with the main pigment mineral
Page 31 of 55 Analytical & Bioanalytical Chemistry
123456789101112131415161718192021222324252627282930313233343536373839404142434445464748495051525354555657585960
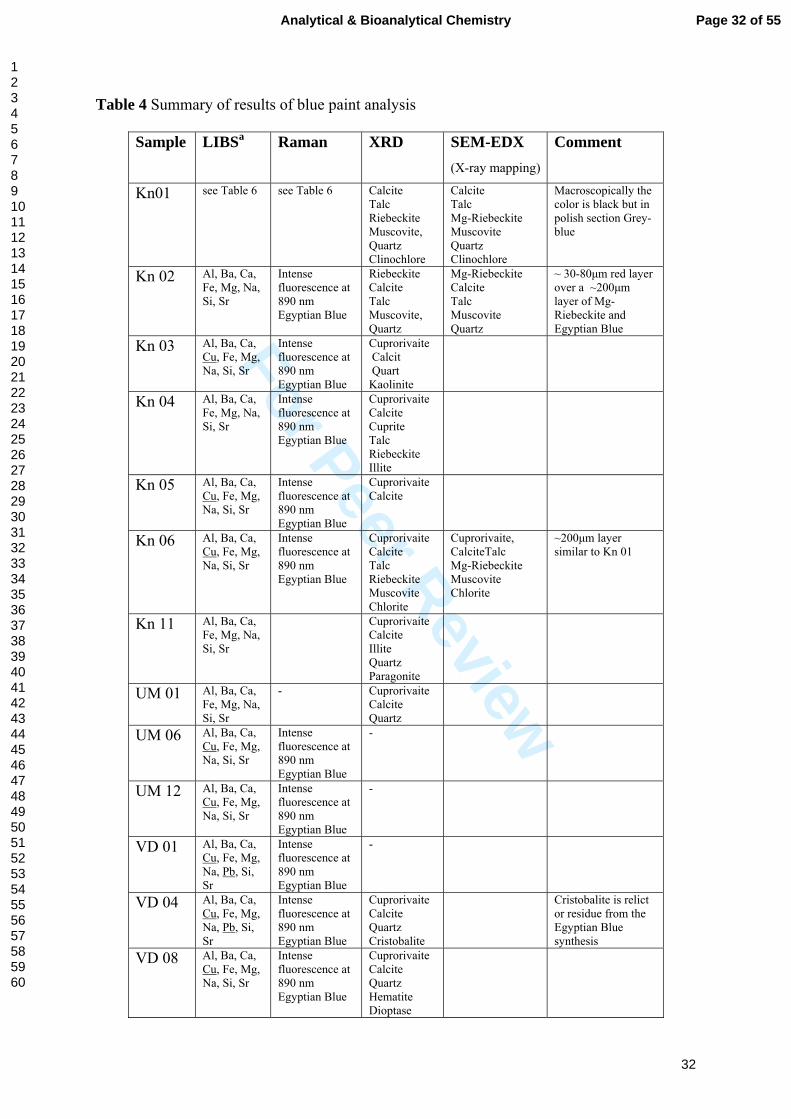
For Peer Review
32
Table 4 Summary of results of blue paint analysis
Sample LIBSa Raman XRD SEM-EDX (X-ray mapping)
Comment
Kn01 see Table 6 see Table 6 Calcite Talc Riebeckite Muscovite, Quartz Clinochlore
Calcite Talc Mg-Riebeckite Muscovite Quartz Clinochlore
Macroscopically the color is black but in polish section Grey-blue
Kn 02 Al, Ba, Ca, Fe, Mg, Na, Si, Sr
Intense fluorescence at 890 nm Egyptian Blue
Riebeckite Calcite Talc Muscovite, Quartz
Mg-Riebeckite Calcite Talc Muscovite Quartz
~ 30-80μm red layer over a ~200μm layer of Mg-Riebeckite and Egyptian Blue
Kn 03 Al, Ba, Ca, Cu, Fe, Mg, Na, Si, Sr
Intense fluorescence at 890 nm Egyptian Blue
Cuprorivaite Calcit Quart Kaolinite
Kn 04 Al, Ba, Ca, Fe, Mg, Na, Si, Sr
Intense fluorescence at 890 nm Egyptian Blue
Cuprorivaite Calcite Cuprite Talc Riebeckite Illite
Kn 05 Al, Ba, Ca, Cu, Fe, Mg, Na, Si, Sr
Intense fluorescence at 890 nm Egyptian Blue
Cuprorivaite Calcite
Kn 06 Al, Ba, Ca, Cu, Fe, Mg, Na, Si, Sr
Intense fluorescence at 890 nm Egyptian Blue
Cuprorivaite Calcite Talc Riebeckite Muscovite Chlorite
Cuprorivaite, CalciteTalc Mg-Riebeckite Muscovite Chlorite
~200μm layer similar to Kn 01
Kn 11 Al, Ba, Ca, Fe, Mg, Na, Si, Sr
Cuprorivaite Calcite Illite Quartz Paragonite
UM 01 Al, Ba, Ca, Fe, Mg, Na, Si, Sr
- Cuprorivaite Calcite Quartz
UM 06 Al, Ba, Ca, Cu, Fe, Mg, Na, Si, Sr
Intense fluorescence at 890 nm Egyptian Blue
-
UM 12 Al, Ba, Ca, Cu, Fe, Mg, Na, Si, Sr
Intense fluorescence at 890 nm Egyptian Blue
-
VD 01 Al, Ba, Ca, Cu, Fe, Mg, Na, Pb, Si, Sr
Intense fluorescence at 890 nm Egyptian Blue
-
VD 04 Al, Ba, Ca, Cu, Fe, Mg, Na, Pb, Si, Sr
Intense fluorescence at 890 nm Egyptian Blue
Cuprorivaite Calcite Quartz Cristobalite
Cristobalite is relict or residue from the Egyptian Blue synthesis
VD 08 Al, Ba, Ca, Cu, Fe, Mg, Na, Si, Sr
Intense fluorescence at 890 nm Egyptian Blue
Cuprorivaite Calcite Quartz Hematite Dioptase
Page 32 of 55Analytical & Bioanalytical Chemistry
123456789101112131415161718192021222324252627282930313233343536373839404142434445464748495051525354555657585960
For Peer Review
33
VD 09 Al, Ba, Ca, Cu, Fe, Mg, Na, Si, Sr
Intense fluorescence at 890 nm Egyptian Blue
Calcite Quartz Hematite Talc Aragonite
G 01 Al, Ba, Ca, Cu, Fe, Mg, Na, Pb, Si, Sr
Calcite -
G 04 Al, Ba, Ca, Fe, Mg, Na, Si, Sr
Calcite Quartz Kaolinite Hematite Glauconite
G 06 Al, Ba, Ca, Cu, Fe, Mg, Na, Si, Sr
Calcite Quartz
G 07 Al, Ba, Ca, Fe, Mg, Na, Si, Sr
Calcite Calcite Quartz
G 10 Al, Ba, Ca, Fe, Mg, Si, Sr, Zn
Calcite Quart Kaolinite
G 11 Al, Ba, Ca, Cu, Fe, Mg, Na, Si, Sr
Phthaloc. blue Calcite
Calcite Quartz Hematite Chlorite
G 12 Al, Ba, Ca, Cu, Fe, Mg, Na, Si, Sr
Phthaloc. blue Calcite
Calcite Quartz,
a Underlined element indicates correlation with the main pigment mineral
Page 33 of 55 Analytical & Bioanalytical Chemistry
123456789101112131415161718192021222324252627282930313233343536373839404142434445464748495051525354555657585960
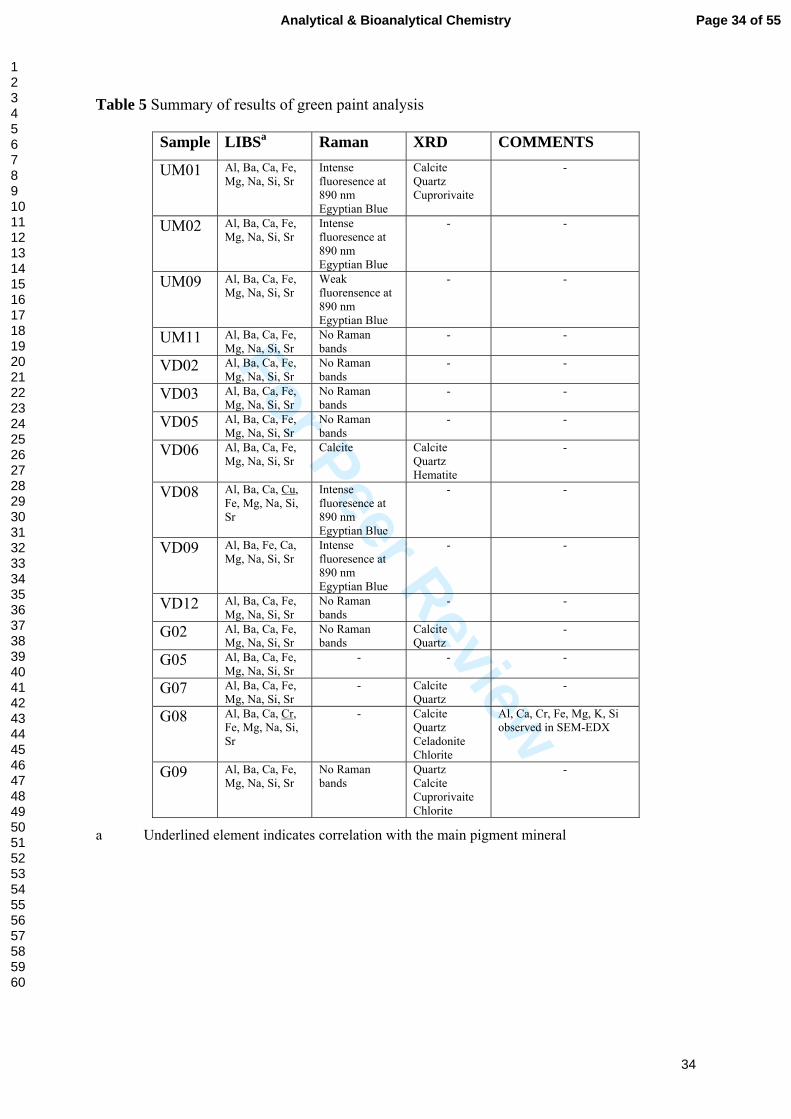
For Peer Review
34
Table 5 Summary of results of green paint analysis
Sample LIBSa Raman XRD COMMENTS
UM01 Al, Ba, Ca, Fe, Mg, Na, Si, Sr
Intense fluoresence at 890 nm Egyptian Blue
Calcite Quartz Cuprorivaite
-
UM02 Al, Ba, Ca, Fe, Mg, Na, Si, Sr
Intense fluoresence at 890 nm Egyptian Blue
- -
UM09 Al, Ba, Ca, Fe, Mg, Na, Si, Sr
Weak fluorensence at 890 nm Egyptian Blue
- -
UM11 Al, Ba, Ca, Fe, Mg, Na, Si, Sr
No Raman bands
- -
VD02 Al, Ba, Ca, Fe, Mg, Na, Si, Sr
No Raman bands
- -
VD03 Al, Ba, Ca, Fe, Mg, Na, Si, Sr
No Raman bands
- -
VD05 Al, Ba, Ca, Fe, Mg, Na, Si, Sr
No Raman bands
- -
VD06 Al, Ba, Ca, Fe, Mg, Na, Si, Sr
Calcite Calcite Quartz Hematite
-
VD08 Al, Ba, Ca, Cu, Fe, Mg, Na, Si, Sr
Intense fluoresence at 890 nm Egyptian Blue
- -
VD09 Al, Ba, Fe, Ca, Mg, Na, Si, Sr
Intense fluoresence at 890 nm Egyptian Blue
- -
VD12 Al, Ba, Ca, Fe, Mg, Na, Si, Sr
No Raman bands
- -
G02 Al, Ba, Ca, Fe, Mg, Na, Si, Sr
No Raman bands
Calcite Quartz
-
G05 Al, Ba, Ca, Fe, Mg, Na, Si, Sr
- - -
G07 Al, Ba, Ca, Fe, Mg, Na, Si, Sr
- Calcite Quartz
-
G08 Al, Ba, Ca, Cr, Fe, Mg, Na, Si, Sr
- Calcite Quartz Celadonite Chlorite
Al, Ca, Cr, Fe, Mg, K, Si observed in SEM-EDX
G09 Al, Ba, Ca, Fe, Mg, Na, Si, Sr
No Raman bands
Quartz Calcite Cuprorivaite Chlorite
-
a Underlined element indicates correlation with the main pigment mineral
Page 34 of 55Analytical & Bioanalytical Chemistry
123456789101112131415161718192021222324252627282930313233343536373839404142434445464748495051525354555657585960
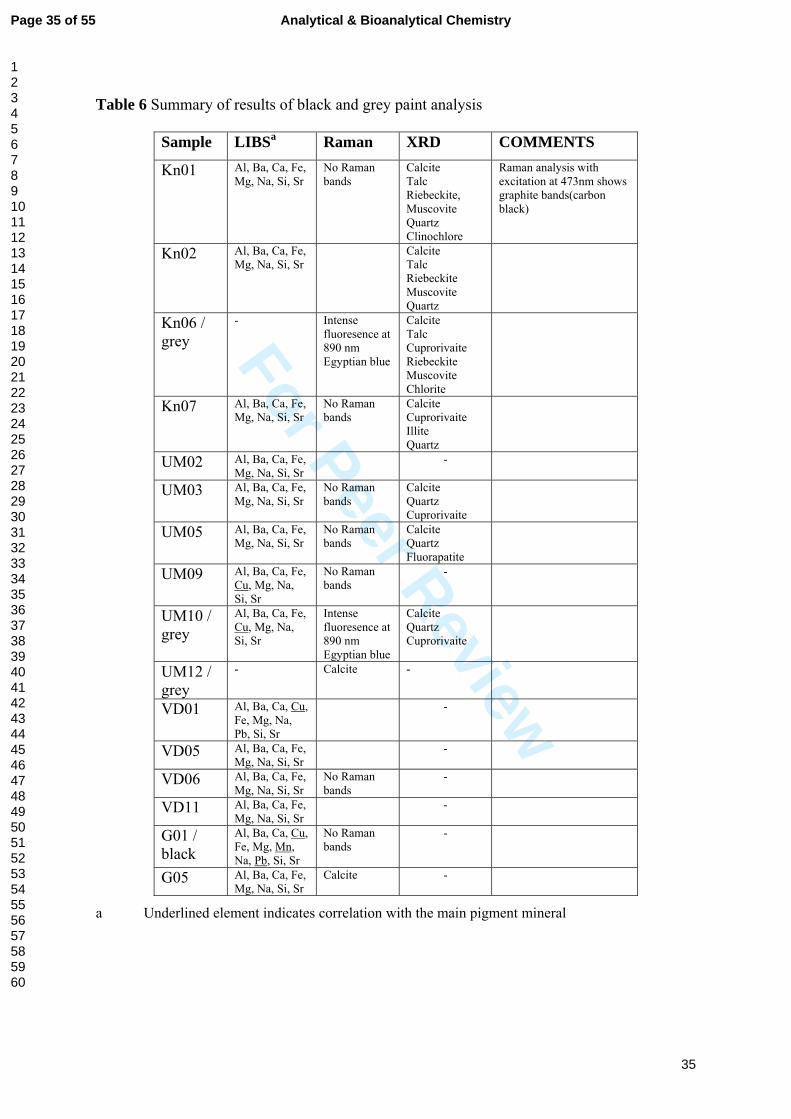
For Peer Review
35
Table 6 Summary of results of black and grey paint analysis
Sample LIBSa Raman XRD COMMENTS
Kn01 Al, Ba, Ca, Fe, Mg, Na, Si, Sr
No Raman bands
Calcite Talc Riebeckite, Muscovite Quartz Clinochlore
Raman analysis with excitation at 473nm shows graphite bands(carbon black)
Kn02 Al, Ba, Ca, Fe, Mg, Na, Si, Sr
Calcite Talc Riebeckite Muscovite Quartz
Kn06 / grey
- Intense fluoresence at 890 nm Egyptian blue
Calcite Talc Cuprorivaite Riebeckite Muscovite Chlorite
Kn07 Al, Ba, Ca, Fe, Mg, Na, Si, Sr
No Raman bands
Calcite Cuprorivaite Illite Quartz
UM02 Al, Ba, Ca, Fe, Mg, Na, Si, Sr
-
UM03 Al, Ba, Ca, Fe, Mg, Na, Si, Sr
No Raman bands
Calcite Quartz Cuprorivaite
UM05 Al, Ba, Ca, Fe, Mg, Na, Si, Sr
No Raman bands
Calcite Quartz Fluorapatite
UM09 Al, Ba, Ca, Fe, Cu, Mg, Na, Si, Sr
No Raman bands
-
UM10 / grey
Al, Ba, Ca, Fe, Cu, Mg, Na, Si, Sr
Intense fluoresence at 890 nm Egyptian blue
Calcite Quartz Cuprorivaite
UM12 / grey
- Calcite -
VD01 Al, Ba, Ca, Cu, Fe, Mg, Na, Pb, Si, Sr
-
VD05 Al, Ba, Ca, Fe, Mg, Na, Si, Sr
-
VD06 Al, Ba, Ca, Fe, Mg, Na, Si, Sr
No Raman bands
-
VD11 Al, Ba, Ca, Fe, Mg, Na, Si, Sr
-
G01 / black
Al, Ba, Ca, Cu, Fe, Mg, Mn, Na, Pb, Si, Sr
No Raman bands
-
G05 Al, Ba, Ca, Fe, Mg, Na, Si, Sr
Calcite -
a Underlined element indicates correlation with the main pigment mineral
Page 35 of 55 Analytical & Bioanalytical Chemistry
123456789101112131415161718192021222324252627282930313233343536373839404142434445464748495051525354555657585960
For Peer Review
36
FIGURE CAPTIONS
Fig. 1 Diagram of the calculated penetration depth values of Cu Kα x-ray radiation, for,
minerals identified in the plaster samples, as a function of 2θ.
Fig. 2 Polished cross-section of paint sample taken from wall painting KN02.
Fig. 3 LIBS spectrum of red painted plaster, G04. (Note: the broad bands in the range of 550-
570 nm and 600-650 nm are attributed to emission from excited CaO formed in the laser
ablation plume). Inset: Detailed view of the spectrum in the range of 410-450 nm where
distinct Fe and Ca emission lines are observed.
Fig. 4 Mean value of the raw intensity (not normalized) of the Fe emission line at 438.354
nm for the different paints analysed in all the wall painting fragments investigated. LIBS
spectra corresponding to the second laser pulse irradiating the paint have been used in order
to minimize the influence of surface impurities affecting spectra obtained with the first pulse.
Fig. 5 Detail of LIBS spectrum obtained from the red painted area of plaster fragment VD01.
Pb emission lines : 357.273, 363.957, 368.346, 373.994, 405.78 nm.
Fig. 6 Raman spectra obtained from red painted plasters and a sample of pure hematite (The
band at 370 cm-1 has been confirmed to have its origin on an instrumental artefact).
Fig. 7 Raman spectra from red plasters UM04 and G06 showing bands from calcite and
calcite gypsum and quartz respectively but no bands from hematite or lead white. The UM04
spectrum has not been baseline corrected in order to show the intense broadband background
fluorescence.
Fig. 8 Raman spectra from yellow painted plaster fragments VD10. The spectrum of pure
yellow ochre is shown for comparison.
Fig. 9 Cu emission lines (324.754 nm and 327.396 nm) in the LIBS spectrum obtained from
blue paint on VD 04 blue pigment.
Page 36 of 55Analytical & Bioanalytical Chemistry
123456789101112131415161718192021222324252627282930313233343536373839404142434445464748495051525354555657585960
For Peer Review
37
Fig. 10 LIBS depth profiling of red over blue paint in sample VD08.
Fig. 11 Fluorescence emission spectrum collected on the Raman spectrometer from sample
UM 02. Top: blue grain; Bottom: green particles.
Fig. 12 Raman spectrum of sample in blue paint (G 11). The peaks point with blue are due to
phthalocyanine blue.
Fig. 13 X-Ray Diffractogram of samples KN04 (a) and VD08 (b).
Fig. 14 SEM images with elemental analysis mapping from samples KN02 (a) and KN06 (b).
Fig. 15 SEM image with elemental analysis mapping from sample G08.
Fig. 16 Part of LIBS spectrum collected on black painted plaster, G01, showing the presence
of Mn. Emission lines (470.972, 472.748, 473.911, 475.404, 476.153 and 476.238, 476.586
and 476.643, 478.342, 482.352 nm.
Fig. 17 SEM image with elemental analysis mapping from sample UM05.
Fig. 18 Distribution of the blue minerals glaucophane and crossite/riebeckite within the
phyllite-quartzite unit in Crete; the former is more common in the west of the island, the
latter in the east. (Adapted from Ref. 48, Fig. 8).
Page 37 of 55 Analytical & Bioanalytical Chemistry
123456789101112131415161718192021222324252627282930313233343536373839404142434445464748495051525354555657585960
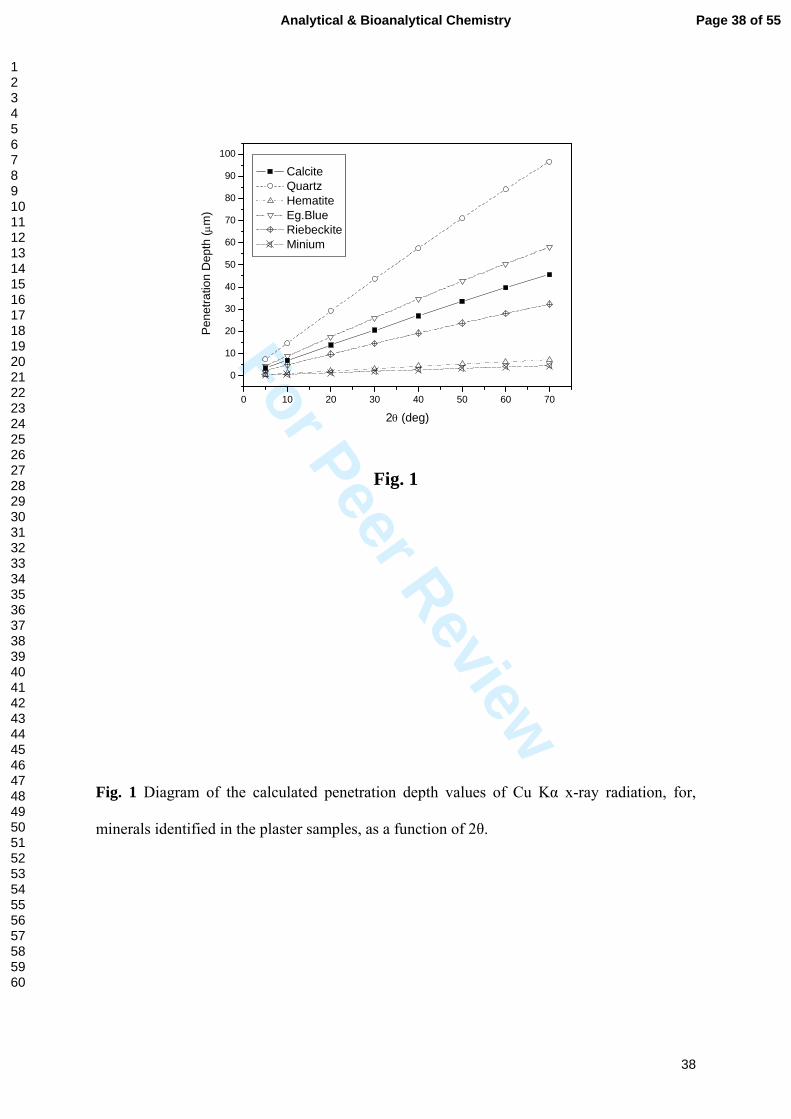
For Peer Review
38
0 10 20 30 40 50 60 70
0
10
20
30
40
50
60
70
80
90
100
Pen
etra
tion
Dep
th (μ
m)
2θ (deg)
Calcite Quartz Hematite Eg.Blue Riebeckite Minium
Fig. 1
Fig. 1 Diagram of the calculated penetration depth values of Cu Kα x-ray radiation, for,
minerals identified in the plaster samples, as a function of 2θ.
Page 38 of 55Analytical & Bioanalytical Chemistry
123456789101112131415161718192021222324252627282930313233343536373839404142434445464748495051525354555657585960
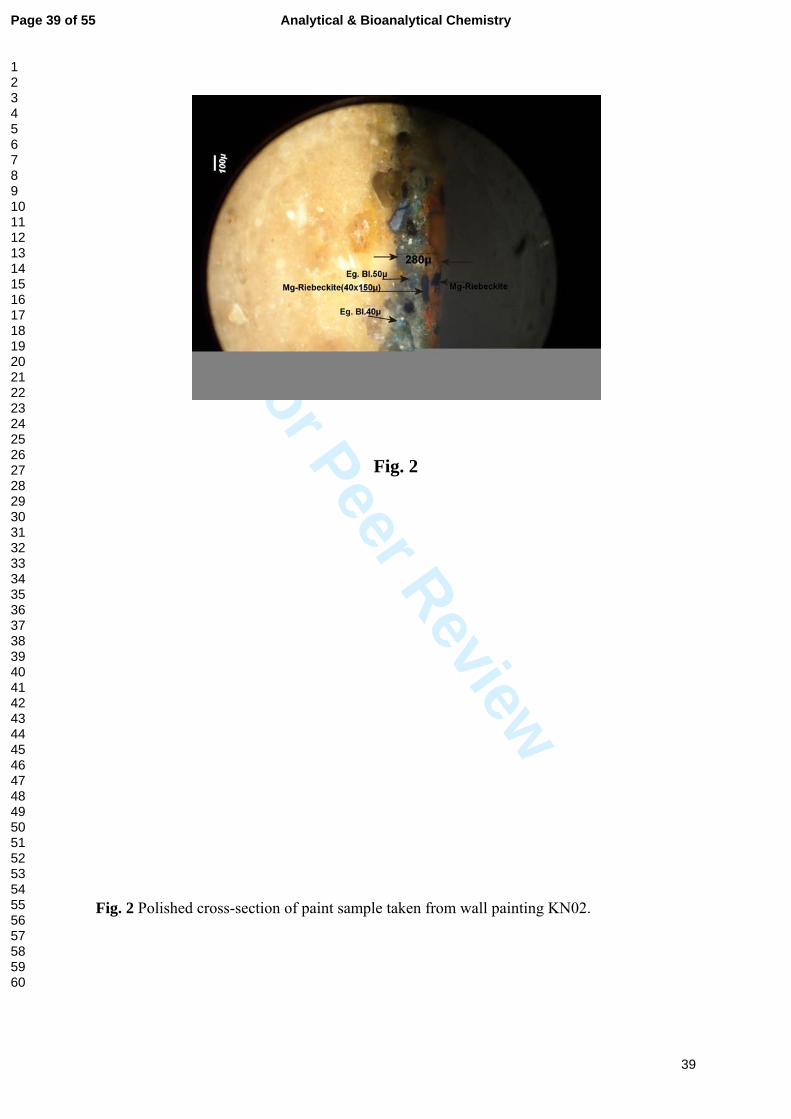
For Peer Review
39
Fig. 2
Fig. 2 Polished cross-section of paint sample taken from wall painting KN02.
Page 39 of 55 Analytical & Bioanalytical Chemistry
123456789101112131415161718192021222324252627282930313233343536373839404142434445464748495051525354555657585960
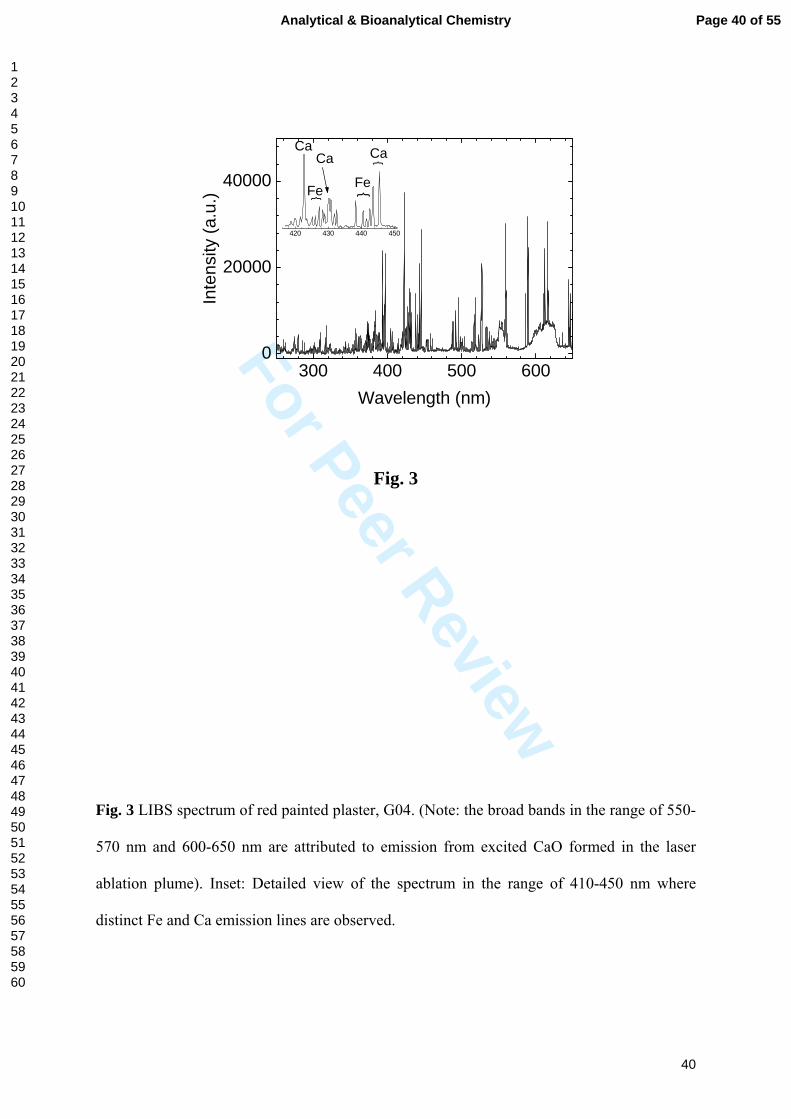
For Peer Review
40
300 400 500 6000
20000
40000
420 430 440 450
Fe
}
Fe
Inte
nsity
(a.u
.)
Wavelength (nm)
CaCa
} }
Ca
Fig. 3
Fig. 3 LIBS spectrum of red painted plaster, G04. (Note: the broad bands in the range of 550-
570 nm and 600-650 nm are attributed to emission from excited CaO formed in the laser
ablation plume). Inset: Detailed view of the spectrum in the range of 410-450 nm where
distinct Fe and Ca emission lines are observed.
Page 40 of 55Analytical & Bioanalytical Chemistry
123456789101112131415161718192021222324252627282930313233343536373839404142434445464748495051525354555657585960
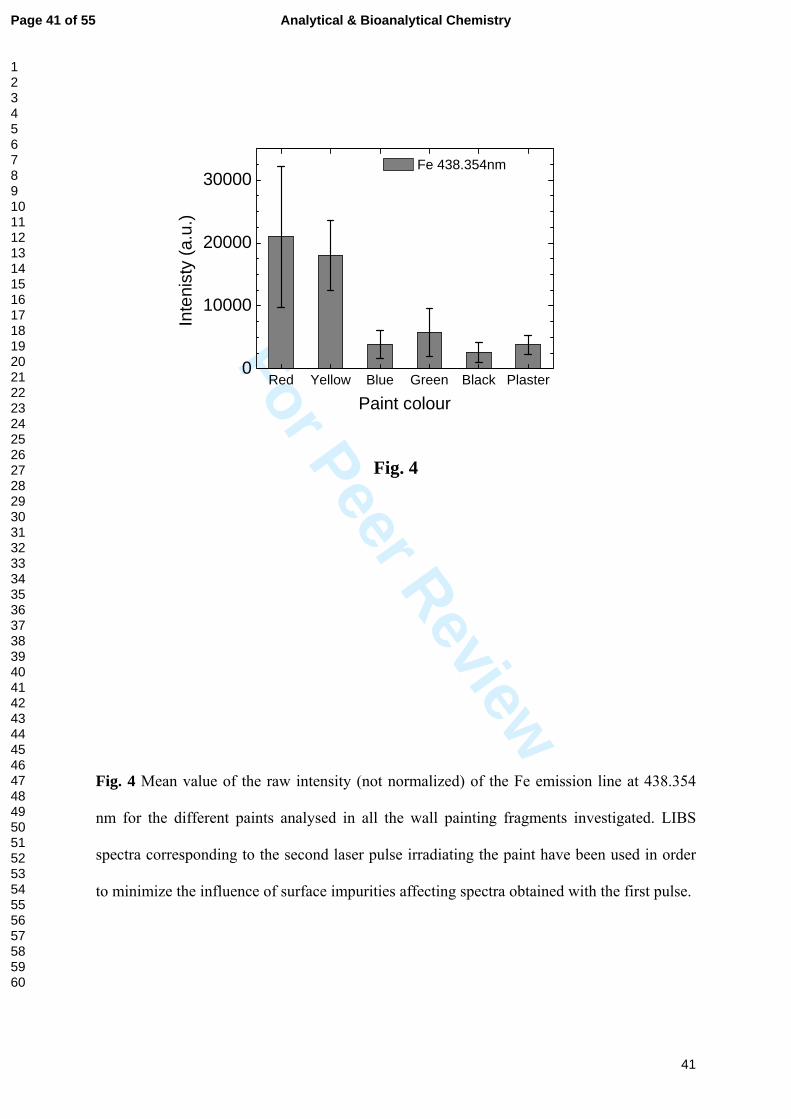
For Peer Review
41
Red Yellow Blue Green Black Plaster0
10000
20000
30000
Inte
nist
y (a
.u.)
Paint colour
Fe 438.354nm
Fig. 4
Fig. 4 Mean value of the raw intensity (not normalized) of the Fe emission line at 438.354
nm for the different paints analysed in all the wall painting fragments investigated. LIBS
spectra corresponding to the second laser pulse irradiating the paint have been used in order
to minimize the influence of surface impurities affecting spectra obtained with the first pulse.
Page 41 of 55 Analytical & Bioanalytical Chemistry
123456789101112131415161718192021222324252627282930313233343536373839404142434445464748495051525354555657585960
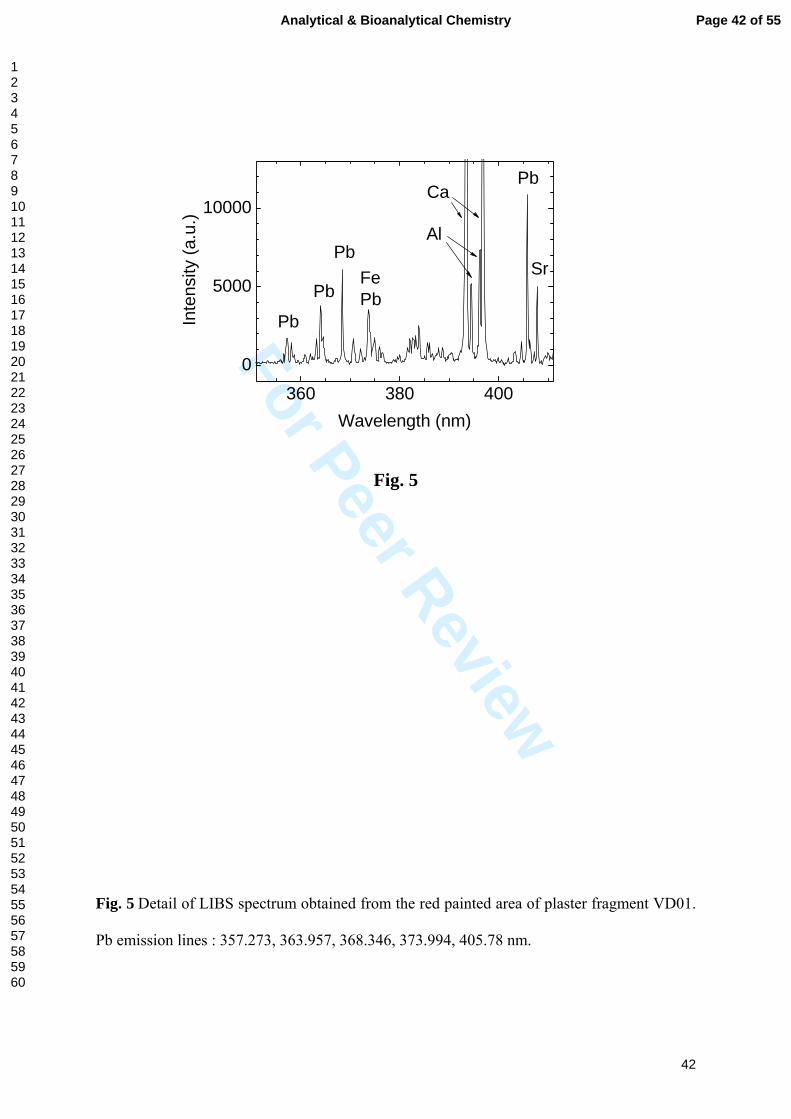
For Peer Review
42
360 380 4000
5000
10000
Pb
Sr
Al
Ca
Pb
Pb
Inte
nsity
(a.u
.)
Wavelength (nm)
Pb
FePb
Fig. 5
Fig. 5 Detail of LIBS spectrum obtained from the red painted area of plaster fragment VD01.
Pb emission lines : 357.273, 363.957, 368.346, 373.994, 405.78 nm.
Page 42 of 55Analytical & Bioanalytical Chemistry
123456789101112131415161718192021222324252627282930313233343536373839404142434445464748495051525354555657585960
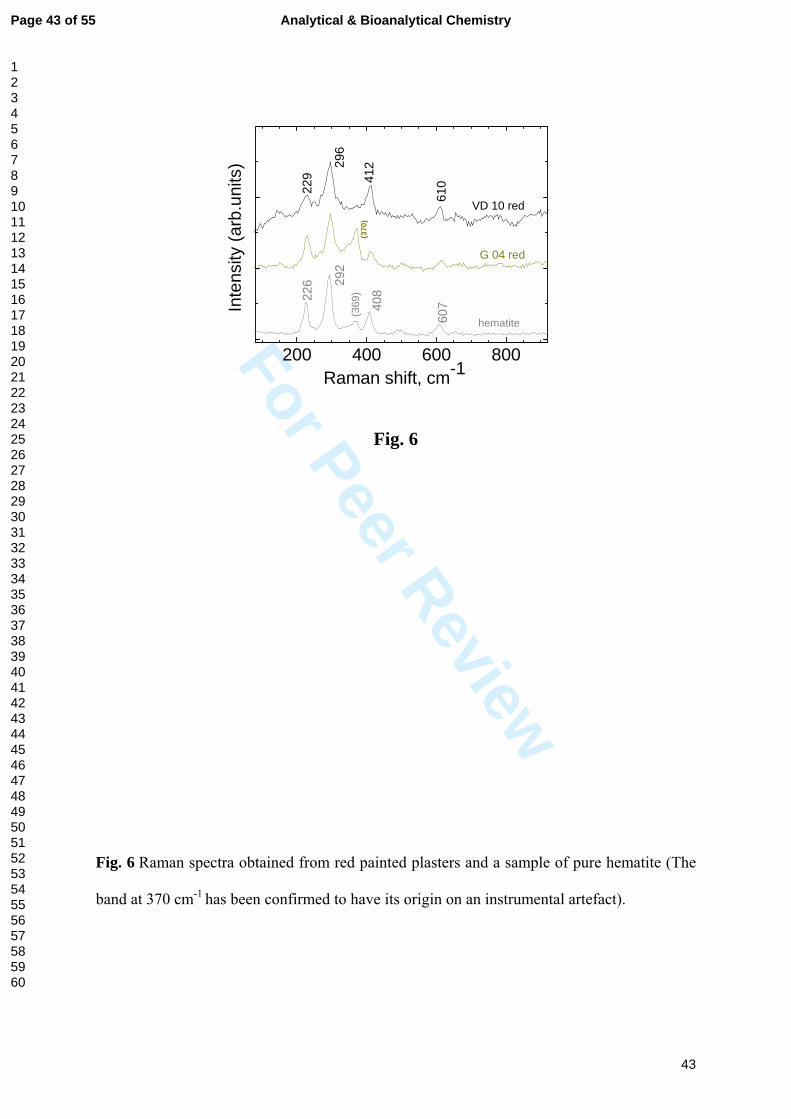
For Peer Review
43
200 400 600 800
610
(369
)
60740
8
292
226
VD 10 red
G 04 red
412
(370
)
296
Inte
nsity
(arb
.uni
ts)
Raman shift, cm-1
hematite22
9
Fig. 6
Fig. 6 Raman spectra obtained from red painted plasters and a sample of pure hematite (The
band at 370 cm-1 has been confirmed to have its origin on an instrumental artefact).
Page 43 of 55 Analytical & Bioanalytical Chemistry
123456789101112131415161718192021222324252627282930313233343536373839404142434445464748495051525354555657585960
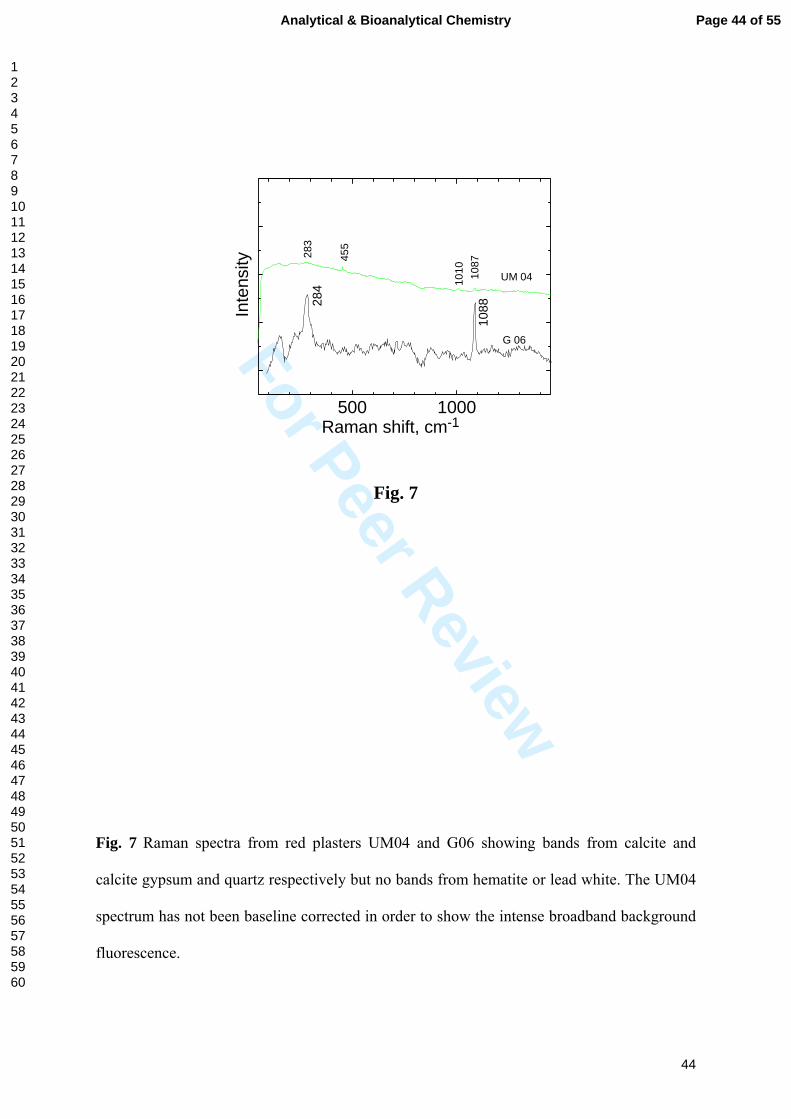
For Peer Review
44
500 1000
283
1087
1010
455
UM 04
1088In
tens
ity
Raman shift, cm-1
G 06
284
Fig. 7
Fig. 7 Raman spectra from red plasters UM04 and G06 showing bands from calcite and
calcite gypsum and quartz respectively but no bands from hematite or lead white. The UM04
spectrum has not been baseline corrected in order to show the intense broadband background
fluorescence.
Page 44 of 55Analytical & Bioanalytical Chemistry
123456789101112131415161718192021222324252627282930313233343536373839404142434445464748495051525354555657585960
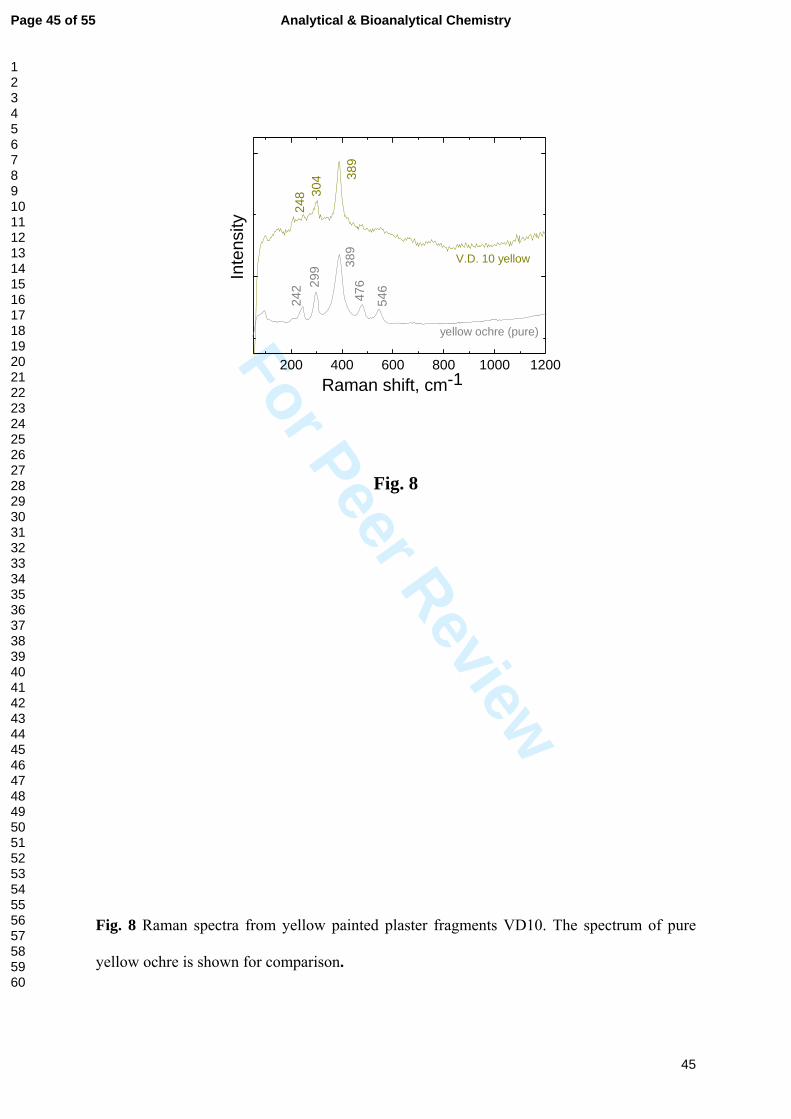
For Peer Review
45
200 400 600 800 1000 1200
V.D. 10 yellow
389
546
476
242 29
924
8 304
Inte
nsity
Raman shift, cm-1
389
yellow ochre (pure)
Fig. 8
Fig. 8 Raman spectra from yellow painted plaster fragments VD10. The spectrum of pure
yellow ochre is shown for comparison.
Page 45 of 55 Analytical & Bioanalytical Chemistry
123456789101112131415161718192021222324252627282930313233343536373839404142434445464748495051525354555657585960
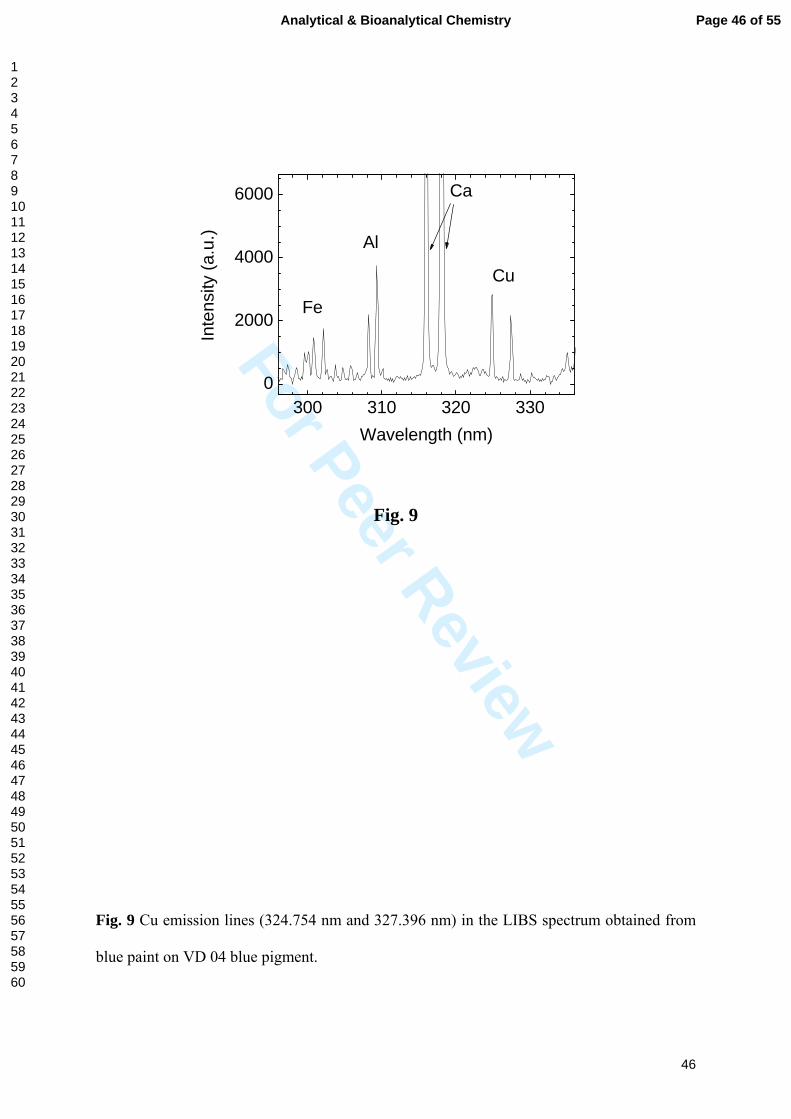
For Peer Review
46
300 310 320 3300
2000
4000
6000
Fe
Ca
Cu
Inte
nsity
(a.u
.)
Wavelength (nm)
Al
Fig. 9
Fig. 9 Cu emission lines (324.754 nm and 327.396 nm) in the LIBS spectrum obtained from
blue paint on VD 04 blue pigment.
Page 46 of 55Analytical & Bioanalytical Chemistry
123456789101112131415161718192021222324252627282930313233343536373839404142434445464748495051525354555657585960
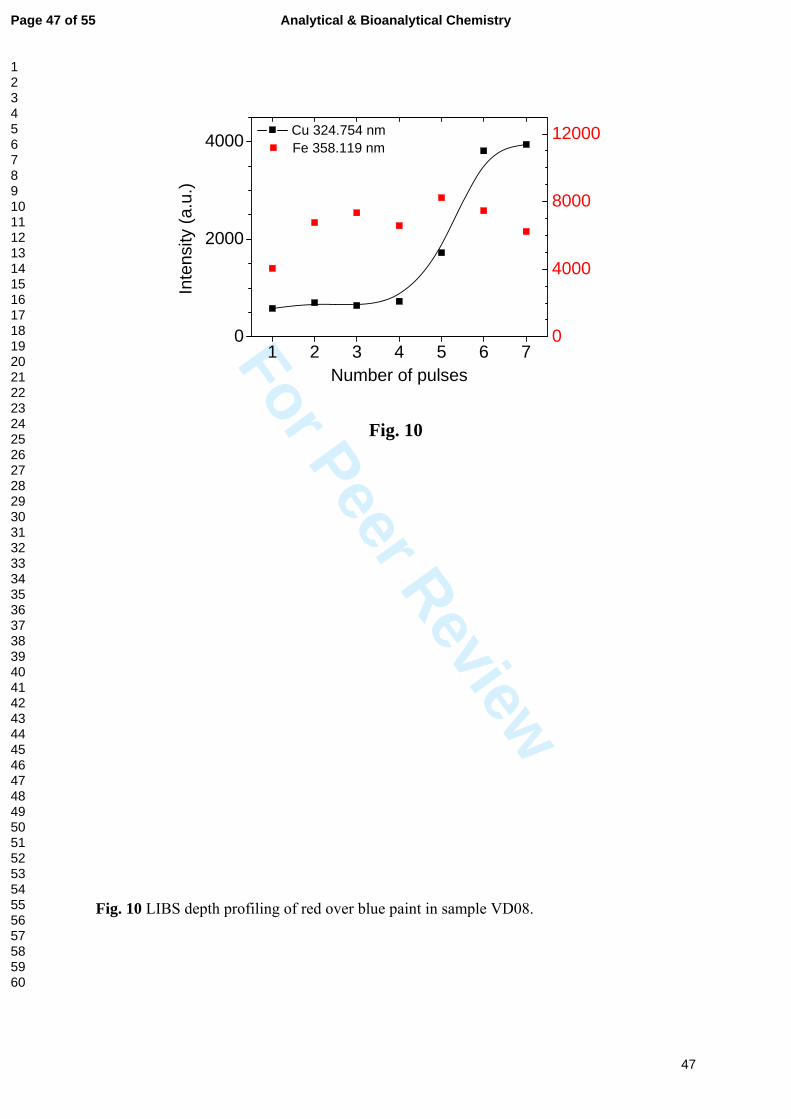
For Peer Review
47
1 2 3 4 5 6 70
2000
4000
0
4000
8000
12000
Inte
nsity
(a.u
.)
Number of pulses
Cu 324.754 nm Fe 358.119 nm
Fig. 10
Fig. 10 LIBS depth profiling of red over blue paint in sample VD08.
Page 47 of 55 Analytical & Bioanalytical Chemistry
123456789101112131415161718192021222324252627282930313233343536373839404142434445464748495051525354555657585960
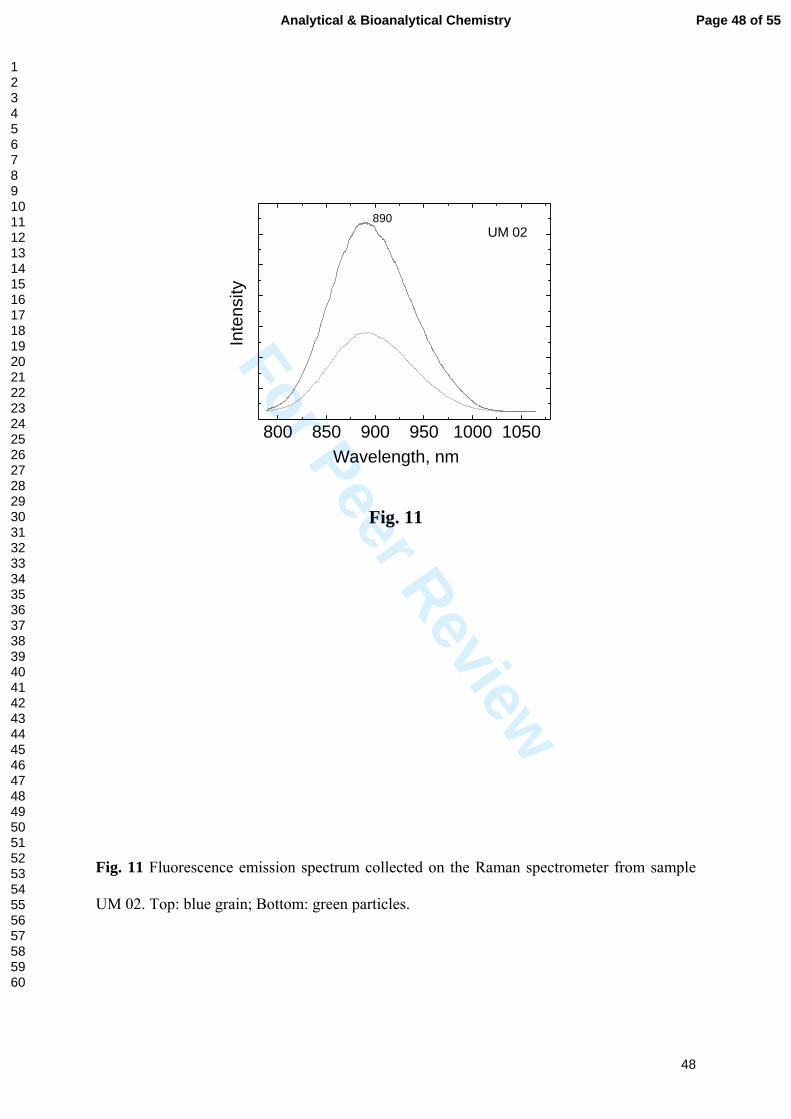
For Peer Review
48
800 850 900 950 1000 1050
In
tens
ity
Wavelength, nm
890UM 02
Fig. 11
Fig. 11 Fluorescence emission spectrum collected on the Raman spectrometer from sample
UM 02. Top: blue grain; Bottom: green particles.
Page 48 of 55Analytical & Bioanalytical Chemistry
123456789101112131415161718192021222324252627282930313233343536373839404142434445464748495051525354555657585960
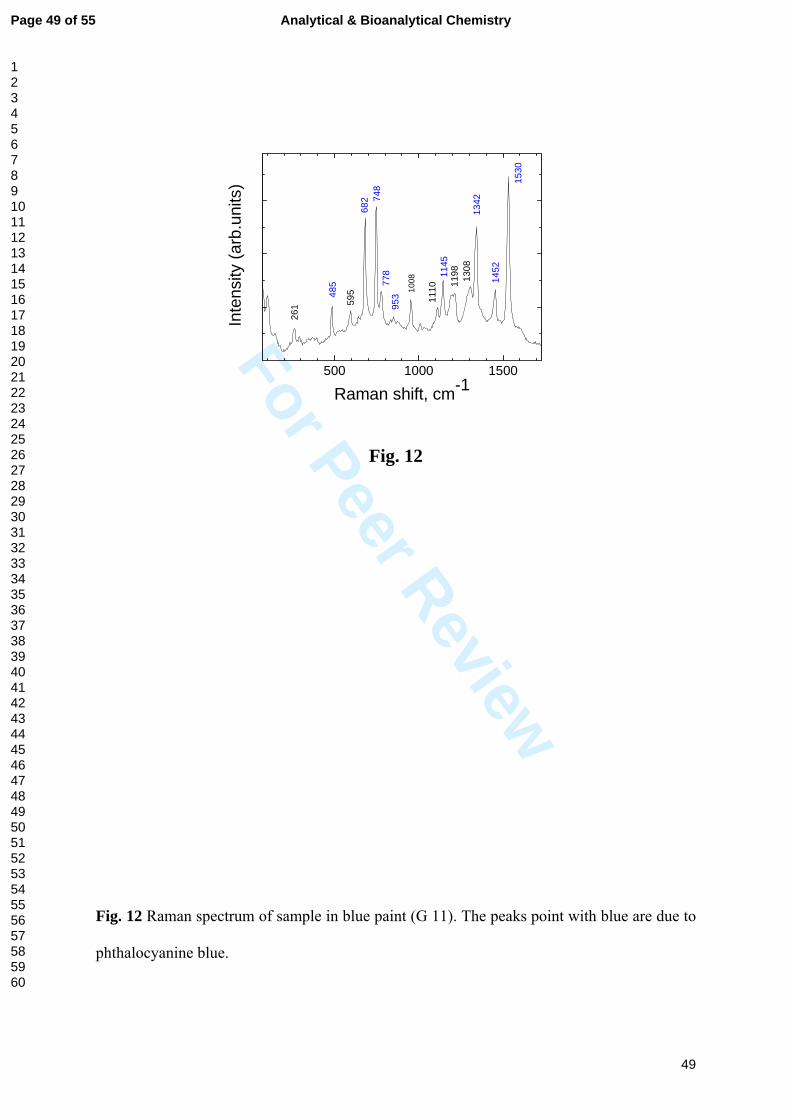
For Peer Review
49
500 1000 1500
Inte
nsity
(arb
.uni
ts)
Raman shift, cm-1
1530
1452
1342
1308
1198
1110
1145
1008
953
778
748
682
485
595
261
Fig. 12
Fig. 12 Raman spectrum of sample in blue paint (G 11). The peaks point with blue are due to
phthalocyanine blue.
Page 49 of 55 Analytical & Bioanalytical Chemistry
123456789101112131415161718192021222324252627282930313233343536373839404142434445464748495051525354555657585960
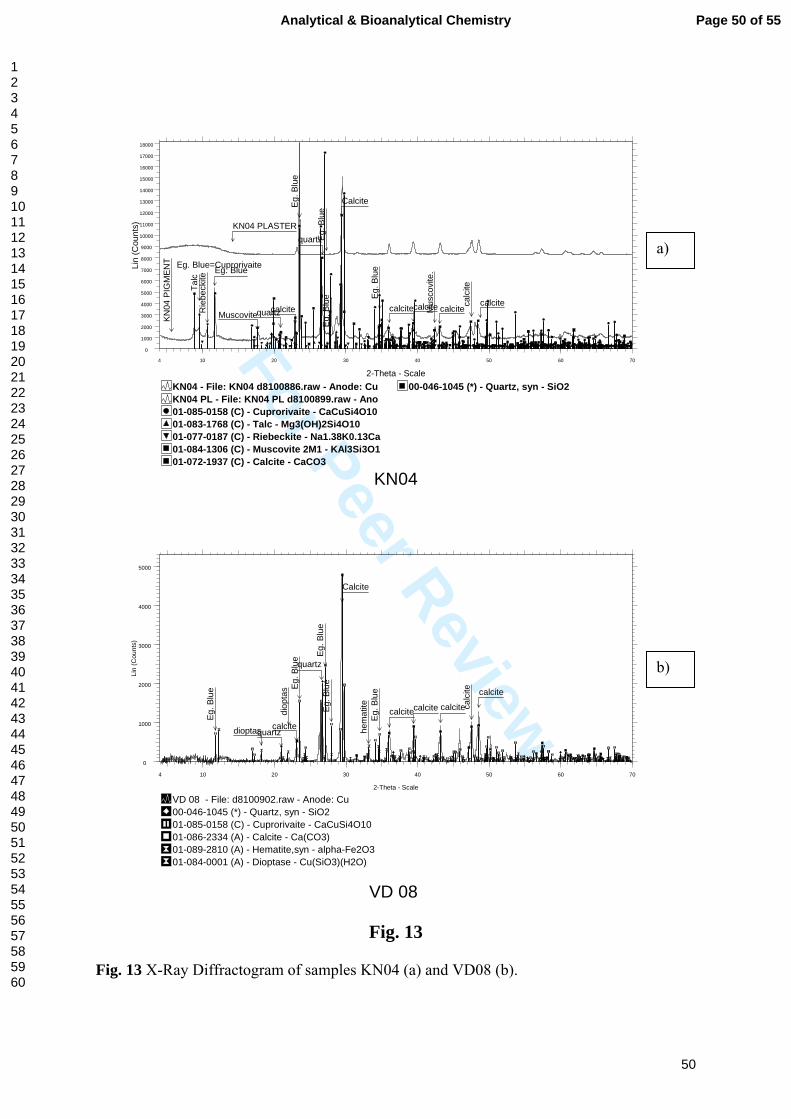
For Peer Review
50
KN04
00-046-1045 (*) - Quartz, syn - SiO2
01-072-1937 (C) - Calcite - CaCO301-084-1306 (C) - Muscovite 2M1 - KAl3Si3O101-077-0187 (C) - Riebeckite - Na1.38K0.13Ca01-083-1768 (C) - Talc - Mg3(OH)2Si4O1001-085-0158 (C) - Cuprorivaite - CaCuSi4O10KN04 PL - File: KN04 PL d8100899.raw - AnoKN04 - File: KN04 d8100886.raw - Anode: Cu
Lin
(Cou
nts)
0
1000
2000
3000
4000
5000
6000
7000
8000
9000
10000
11000
12000
13000
14000
15000
16000
17000
18000
2-Theta - Scale4 10 20 30 40 50 60 70
Eg. Blue
Eg. B
lue
Eg. B
lue
Eg. B
lue Eg
. Blu
e
Calcite
calcite calcitecalcite calcitecalciteca
lcite
quartz
quartzRie
beck
iteTa
lc
Muscovite
Eg. Blue=Cuprorivaite
KN04 PLASTER
KN04
PIG
MEN
T
Mus
covi
te.
VD 08
01-084-0001 (A) - Dioptase - Cu(SiO3)(H2O)01-089-2810 (A) - Hematite,syn - alpha-Fe2O301-086-2334 (A) - Calcite - Ca(CO3)01-085-0158 (C) - Cuprorivaite - CaCuSi4O1000-046-1045 (*) - Quartz, syn - SiO2VD 08 - File: d8100902.raw - Anode: Cu
Lin
(Cou
nts)
0
1000
2000
3000
4000
5000
2-Theta - Scale
4 10 20 30 40 50 60 70
Eg. B
lue Eg
. Blu
e Eg. B
lue
Eg. B
lue
Eg. B
lue
Calcite
calcite
calcitecalcite calcite
calcite
calc
ite
quartz
quartzdioptas
diop
tas
hem
atite
Fig. 13
Fig. 13 X-Ray Diffractogram of samples KN04 (a) and VD08 (b).
a)
b)
Page 50 of 55Analytical & Bioanalytical Chemistry
123456789101112131415161718192021222324252627282930313233343536373839404142434445464748495051525354555657585960
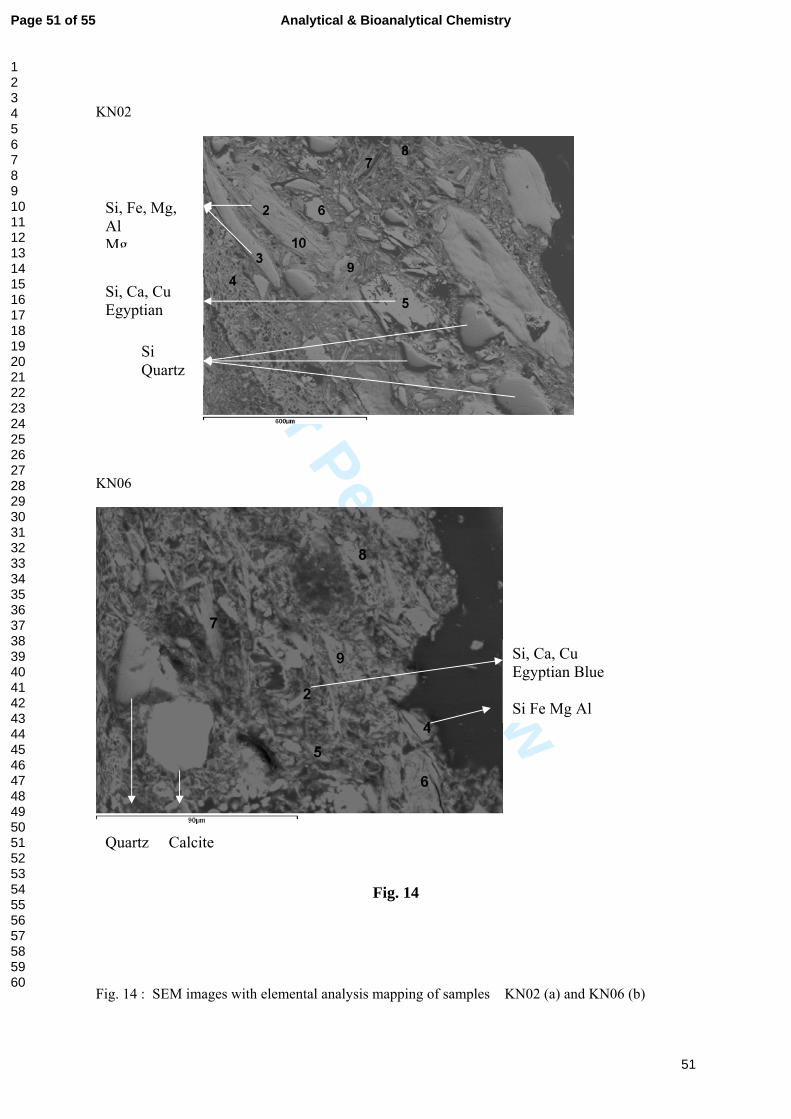
For Peer Review
51
KN02
KN06
Fig. 14
Fig. 14 : SEM images with elemental analysis mapping of samples KN02 (a) and KN06 (b)
Si, Fe, Mg, Al Mg
Si, Ca, Cu Egyptian
Si Quartz
Si, Ca, Cu Egyptian Blue Si Fe Mg Al
Quartz Calcite
Page 51 of 55 Analytical & Bioanalytical Chemistry
123456789101112131415161718192021222324252627282930313233343536373839404142434445464748495051525354555657585960
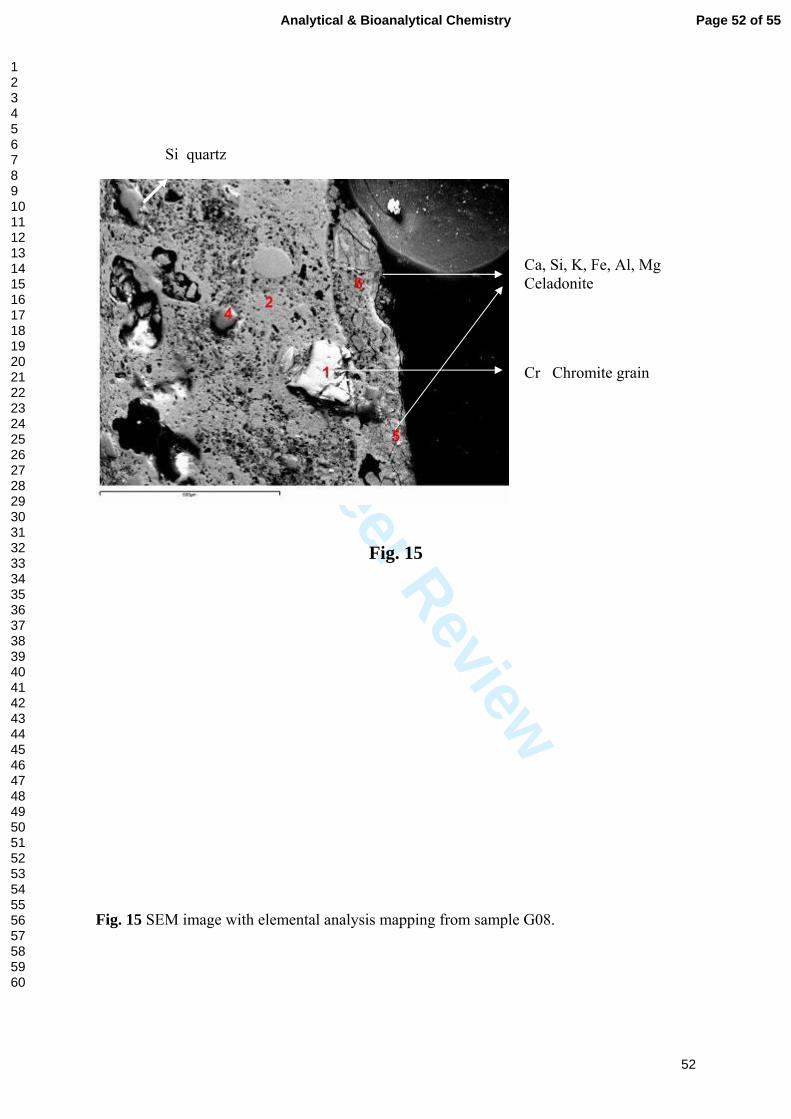
For Peer Review
52
Fig. 15
Fig. 15 SEM image with elemental analysis mapping from sample G08.
Cr Chromite grain
Ca, Si, K, Fe, Al, Mg Celadonite
Si quartz
Page 52 of 55Analytical & Bioanalytical Chemistry
123456789101112131415161718192021222324252627282930313233343536373839404142434445464748495051525354555657585960
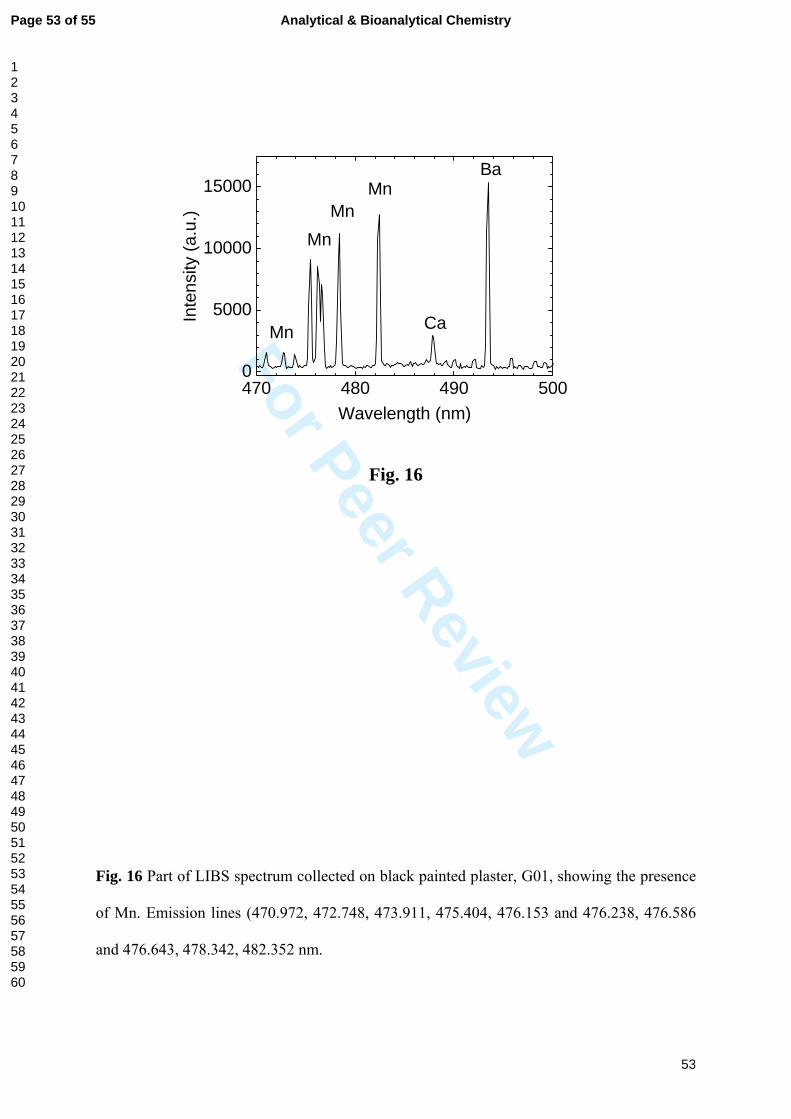
For Peer Review
53
470 480 490 5000
5000
10000
15000
Mn Ca
BaMn
MnMn
Inte
nsity
(a.u
.)
Wavelength (nm)
Fig. 16
Fig. 16 Part of LIBS spectrum collected on black painted plaster, G01, showing the presence
of Mn. Emission lines (470.972, 472.748, 473.911, 475.404, 476.153 and 476.238, 476.586
and 476.643, 478.342, 482.352 nm.
Page 53 of 55 Analytical & Bioanalytical Chemistry
123456789101112131415161718192021222324252627282930313233343536373839404142434445464748495051525354555657585960
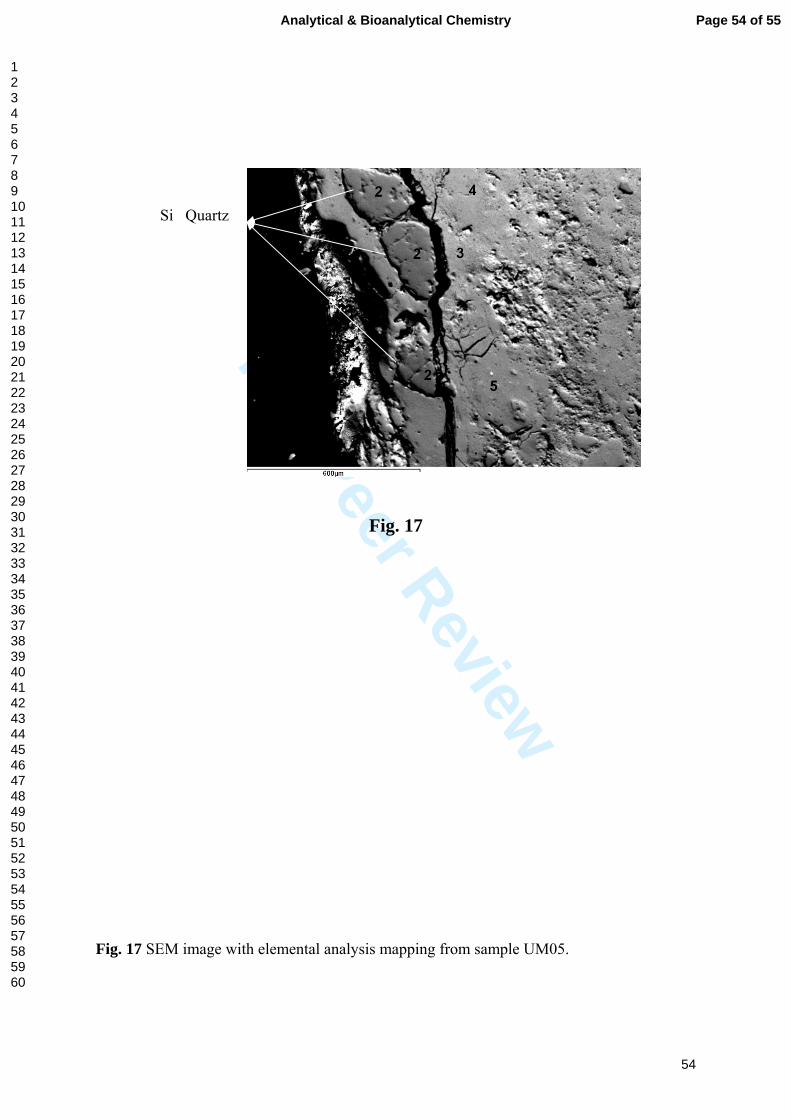
For Peer Review
54
Fig. 17
Fig. 17 SEM image with elemental analysis mapping from sample UM05.
Si Quartz
Page 54 of 55Analytical & Bioanalytical Chemistry
123456789101112131415161718192021222324252627282930313233343536373839404142434445464748495051525354555657585960
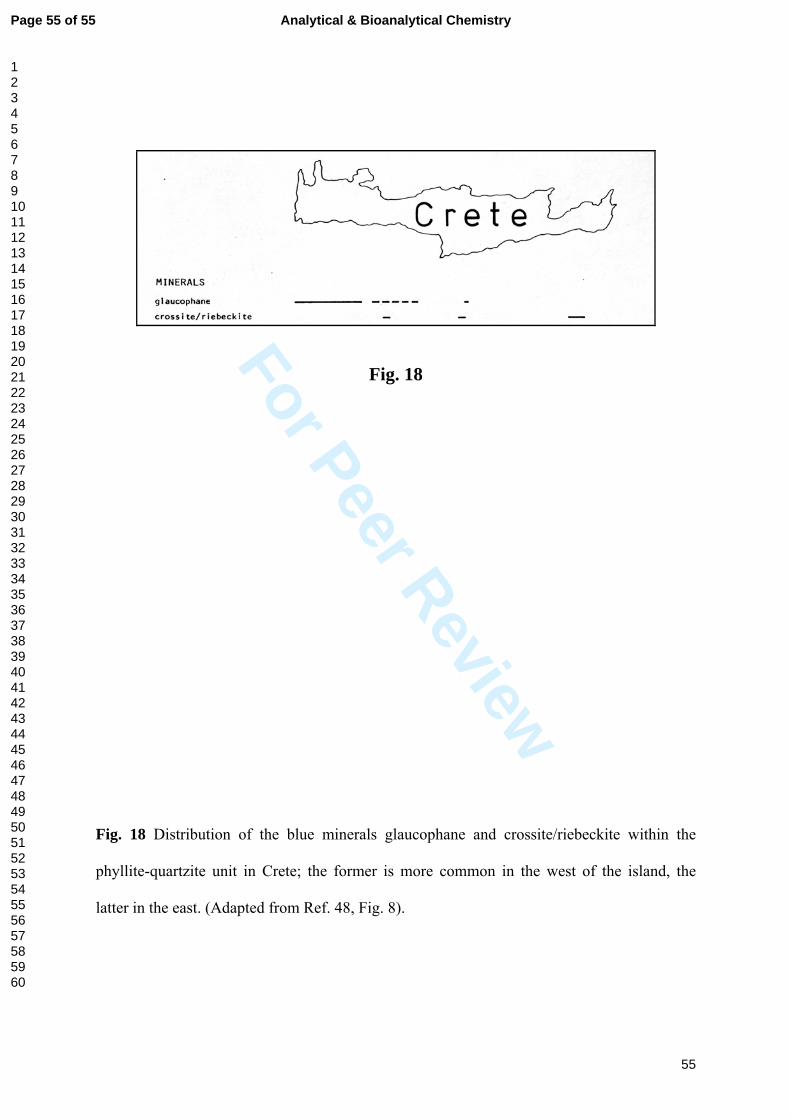
For Peer Review
55
Fig. 18
Fig. 18 Distribution of the blue minerals glaucophane and crossite/riebeckite within the
phyllite-quartzite unit in Crete; the former is more common in the west of the island, the
latter in the east. (Adapted from Ref. 48, Fig. 8).
Page 55 of 55 Analytical & Bioanalytical Chemistry
123456789101112131415161718192021222324252627282930313233343536373839404142434445464748495051525354555657585960
Copyright © 2022 FDOKUMEN