
study on the development potential of the content industry in ...
148
ERIA Research Project Report 2012, No.13 S STUDY ON THE D DEVELOPMENT P POTENTIAL OF THE C CONTENT I INDUSTRY IN E EAST A ASIA AND THE A A S S E E A A N N R REGION Edited by Sirisak Koshpasharin Kensuke Yasue
-
Upload
khangminh22 -
Category
Documents
-
view
0 -
download
0
Transcript of study on the development potential of the content industry in ...
ERIA Research Project Report 2012, No.13
SSTTUUDDYY OONN TTHHEE DDEEVVEELLOOPPMMEENNTT
PPOOTTEENNTTIIAALL OOFF TTHHEE CCOONNTTEENNTT
IINNDDUUSSTTRRYY IINN EEAASSTT AASSIIAA AANNDD TTHHEE
AASSEEAANN RREEGGIIOONN
Edited by
Sirisak Koshpasharin
Kensuke Yasue
ERIA Research Project Report 2012, No.13
SSTTUUDDYY OONN TTHHEE DDEEVVEELLOOPPMMEENNTT
PPOOTTEENNTTIIAALL OOFF TTHHEE CCOONNTTEENNTT
IINNDDUUSSTTRRYY IINN EEAASSTT AASSIIAA AANNDD TTHHEE
AASSEEAANN RREEGGIIOONN
Edited by
Sirisak Koshpasharin
Kensuke Yasue
March, 2014
i
TABLE OF CONTENTS
Table of Contents i
List of Project Members ii
Executive Summary iv
CHAPTER 1 Background of this Research 1
CHAPTER 2 Trends in Content Industry 11
CHAPTER 3 Industry Structure 19
CHAPTER 4 Economic Contribution Analysis 33
CHAPTER 5 Case Studies 47
CHAPTER 6 Policies and Initiatives in the Audiovisual Content Industry 73
CHAPTER 7 SWOT Analysis 95
CHAPTER 8 Summary and Policy Recommendation 119
Appendix 125
ii
LIST OF PROJECT MEMBERS
WORKING GROUP MEMBERS:
MR. SIRISAK KOSHPASHARIN (PROJECT LEADER): Executive Committee, National
Committee of Film & Video, Ministry of Culture, Thailand.
MR. FANG DEYUN: Executive Director, International Institute, China
Communication Research Center, State Administration of Radio, Film and TV
(SARFT), China.
MR. ARMEIN FIRMANSYAH: Director of Creative Media-based Economic
Development, Directorate General Economics-based Media, Creative Design
and the Science and Technology, Ministry of Tourism and Creative Economy,
Indonesia.
MR. HIDEAKI IBUKI: Director, Media and Content Industry Division, Ministry of
Economy, Trade and Industry, Japan.
MR. HWANG, JOON SUK: Director, Cultural Industry Policy Division, Ministry of
Culture, Sports and Tourism, Korea.
MR. HASNUL NADZRIN SHAH: Head of Strategy, Policies and alliances for the
Creative Multimedia Division, Multimedia Development Corporation (MDeC),
Malaysia.
MS. ROWENA WENG ENRIQUEZ BAGADION: Founding President, Creative
Economies Council of the Philippines, the Philippines.
MS. SURYAHTI ABDUL LATIFF: Deputy Director, Strategy Development & Industry
Analysis, Industry Strategy Division, Media Development Authority, Singapore.
MR. MITSUO MATSUMOTO (PROJECT COORDINATOR): Managing Director for
Research Affairs, Economic Research Institute for ASEAN and East Asia
(ERIA), Indonesia.
MR. KENSUKE YASUE (PROJECT COORDINATOR): Chief Research Professional,
Mitsubishi Resaerch Institute (MRI), Japan.

iii
MR. YOSHIFUMI FUKUNAGA (PROJECT COORDINATOR): Senior Policy Coordinator,
Economic Research Institute for ASEAN and East Asia (ERIA), Indonesia.
iv
EXECUTIVE SUMMARY
1. Background of this Study
Objectives
This study aims to analyze the content industry, considering its
structure and contribution to the economy, based on industry/market
data and national statistics, as well as case studies describing ripple
effects, industry-wise and country-wise, such as imports and exports.
The study also overviews the policy measures taken in each country to
assess the government’s current role in promoting industry growth.
Secondly, taking into account the opinions of government and industry
/ businesses, this report assess the strength / weakness / opportunities /
threats (i.e. performs a ‘SWOT’ analysis), for each country, and also for
the region as a whole. The purpose of the SWOT analysis is to verify
how the content industry in each country could enhance productivity
and increase trade in the region, by looking at the challenges facing
several stages of the industry’s value chain.
Finally, these analyses will be the basis of policy recommendations,
which are expected to promote the industry in each country and also to
promote cooperation among governments and businesses in the content
industry, to accelerate development in the value chain and strengthen
competitiveness.
Framework and methodology
First, the research framework for analysis and research items was
planned. Secondly, basic data from each country were gathered and
reorganized for mutual comparison, to review the overall growth
potential for the industry. Thirdly, the situation and issues regarding
industry structure and/or relevant policies were verified and organized
for qualitative analysis. Also, through cross-industry input-output
analysis, an estimation of the economic contribution of the audiovisual
content industry was conducted. A SWOT analysis was conducted,
taking into account opinions from government and industry /
businesses.
Finally, taking the analysis results into account, policy
v
recommendations were developed.
Covered Countries & Industries
In this report, eight countries, China, Indonesia, Japan, Korea,
Malaysia, the Philippines, Singapore, and Thailand are covered.
The definition of the content industry in this report is shown in Figure
1. Five subsectors, namely TV broadcasting, film, animation, games
and music, are the scope of this research. In a global perspective,
especially in developed countries, the five subsectors are driving
growth in the content industry. In general, these subsectors are
commonly recognized categories in terms of statistics and related
industry data, which lowers the barrier of analysis and cross-country
comparison.
Additionally, deeper analysis is conducted mainly targeting the
audiovisual content industry (including TV broadcasting, film and
animation), which is considered as the core of the content or creative
industry. Note that animation is mostly considered to be a subset of TV
broadcasting and/or film. It is, however, one of the growing sectors in
Asia. Therefore this sector is independently analyzed with respect to
available statistics.
Figure 1: Scope of the Industry
2. Main Findings of the Report
The main findings in each chapter of the report are stated as follows.
The total market size of the content industry (TV broadcasting, Film,
Animation, Games and Music) is 191 billion USD (2011). The audiovisual
content industry (TV broadcasting, Film and Animation) is 140 billion
USD (2011). (Chapter 2).
Audiovisual content industry
vi
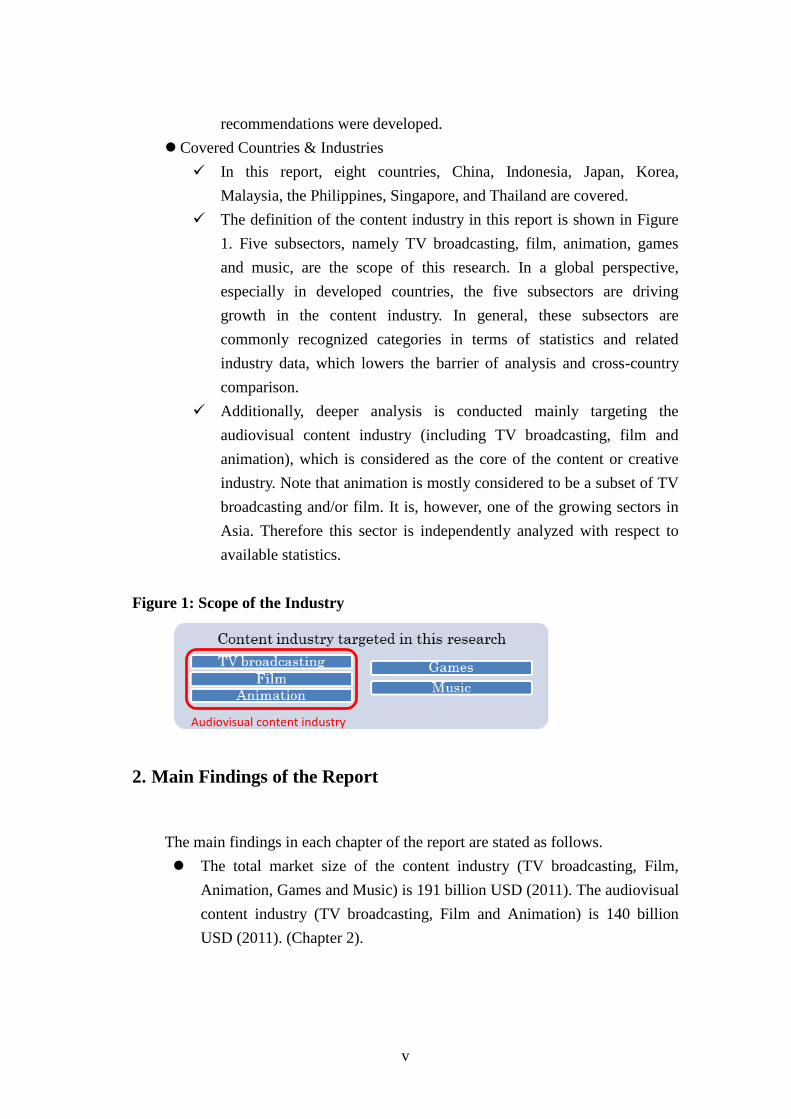
Figure 2: Market Revenue in Each Country (2011)
Note : the vertical axis is different for left and right figure.
Source: Statistics provided by member countries, PwC (2012).
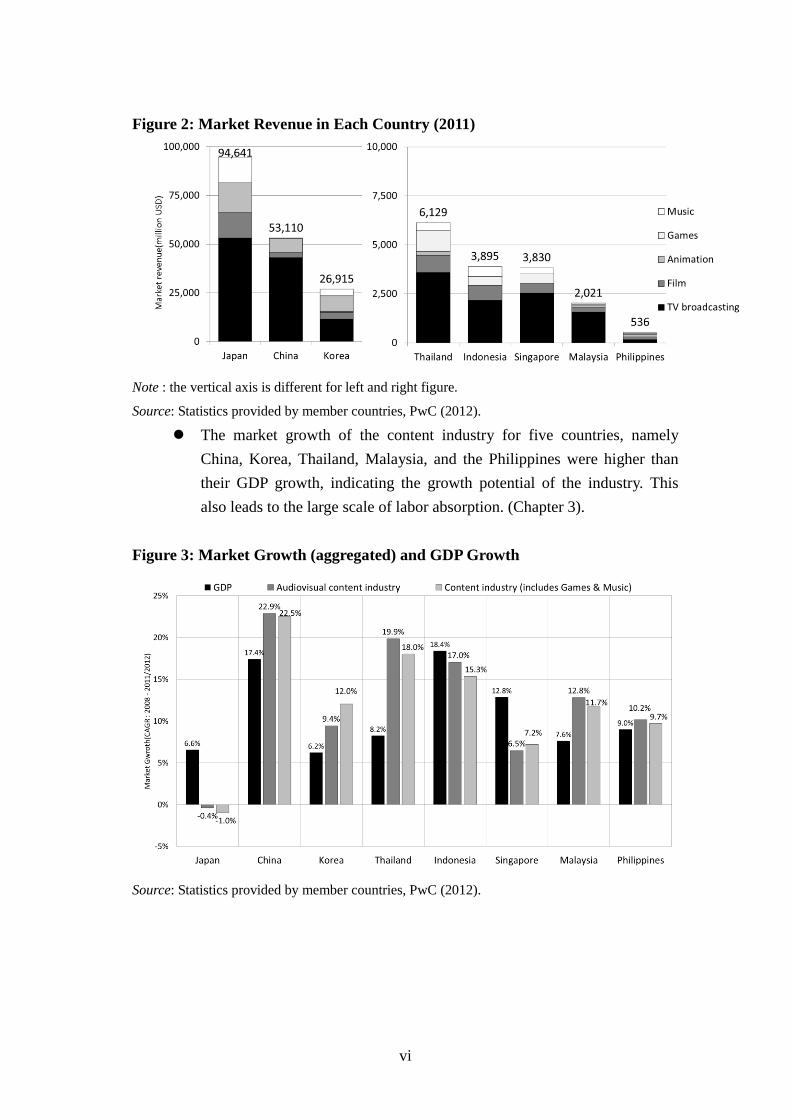
The market growth of the content industry for five countries, namely
China, Korea, Thailand, Malaysia, and the Philippines were higher than
their GDP growth, indicating the growth potential of the industry. This
also leads to the large scale of labor absorption. (Chapter 3).
Figure 3: Market Growth (aggregated) and GDP Growth
Source: Statistics provided by member countries, PwC (2012).
vii
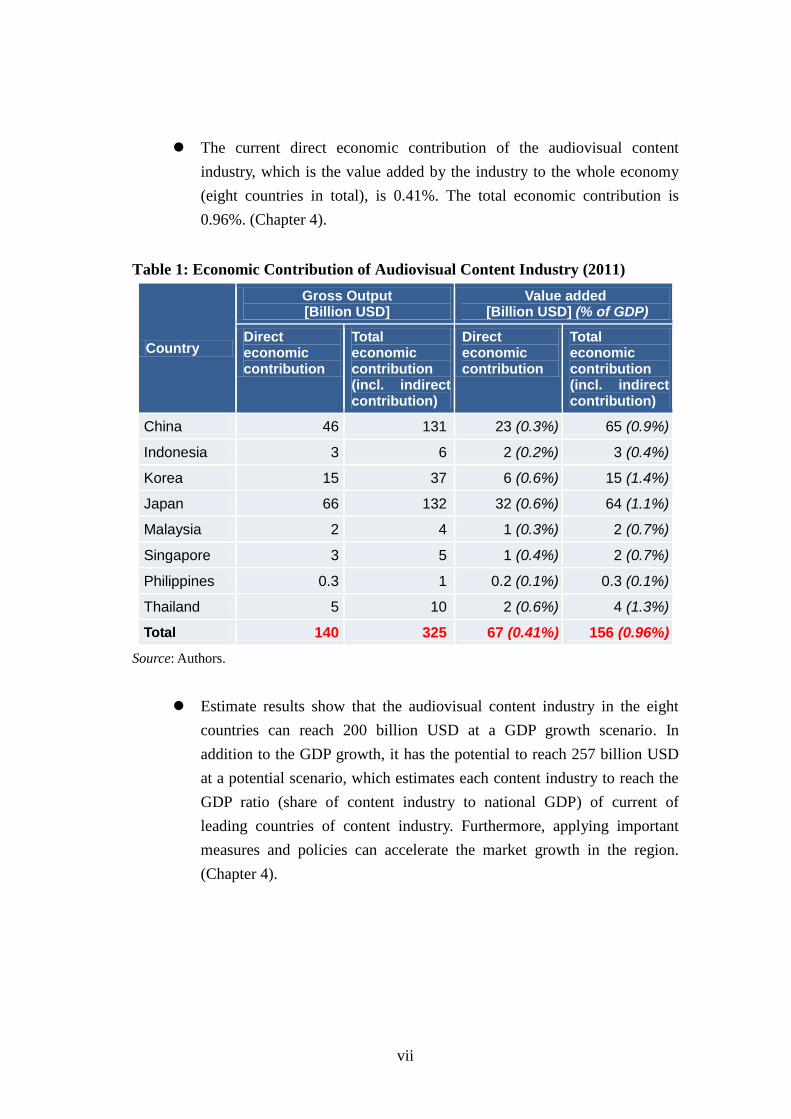
The current direct economic contribution of the audiovisual content
industry, which is the value added by the industry to the whole economy
(eight countries in total), is 0.41%. The total economic contribution is
0.96%. (Chapter 4).
Table 1: Economic Contribution of Audiovisual Content Industry (2011)
Country
Gross Output [Billion USD]
Value added [Billion USD] (% of GDP)
Direct economic contribution
Total economic contribution (incl. indirect contribution)
Direct economic contribution
Total economic contribution (incl. indirect contribution)
China 46 131 23 (0.3%) 65 (0.9%)
Indonesia 3 6 2 (0.2%) 3 (0.4%)
Korea 15 37 6 (0.6%) 15 (1.4%)
Japan 66 132 32 (0.6%) 64 (1.1%)
Malaysia 2 4 1 (0.3%) 2 (0.7%)
Singapore 3 5 1 (0.4%) 2 (0.7%)
Philippines 0.3 1 0.2 (0.1%) 0.3 (0.1%)
Thailand 5 10 2 (0.6%) 4 (1.3%)
Total 140 325 67 (0.41%) 156 (0.96%)
Source: Authors.
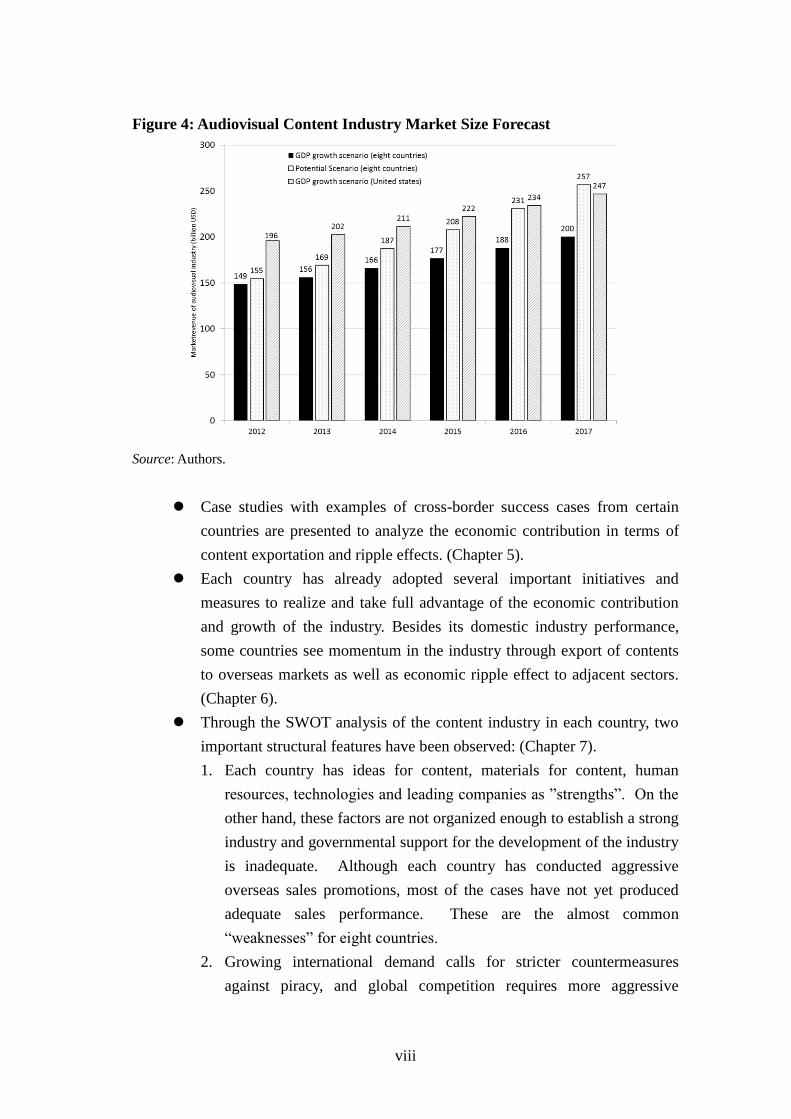
Estimate results show that the audiovisual content industry in the eight
countries can reach 200 billion USD at a GDP growth scenario. In
addition to the GDP growth, it has the potential to reach 257 billion USD
at a potential scenario, which estimates each content industry to reach the
GDP ratio (share of content industry to national GDP) of current of
leading countries of content industry. Furthermore, applying important
measures and policies can accelerate the market growth in the region.
(Chapter 4).
viii
Figure 4: Audiovisual Content Industry Market Size Forecast
Source: Authors.
Case studies with examples of cross-border success cases from certain
countries are presented to analyze the economic contribution in terms of
content exportation and ripple effects. (Chapter 5).
Each country has already adopted several important initiatives and
measures to realize and take full advantage of the economic contribution
and growth of the industry. Besides its domestic industry performance,
some countries see momentum in the industry through export of contents
to overseas markets as well as economic ripple effect to adjacent sectors.
(Chapter 6).
Through the SWOT analysis of the content industry in each country, two
important structural features have been observed: (Chapter 7).
1. Each country has ideas for content, materials for content, human
resources, technologies and leading companies as ”strengths”. On the
other hand, these factors are not organized enough to establish a strong
industry and governmental support for the development of the industry
is inadequate. Although each country has conducted aggressive
overseas sales promotions, most of the cases have not yet produced
adequate sales performance. These are the almost common
“weaknesses” for eight countries.
2. Growing international demand calls for stricter countermeasures
against piracy, and global competition requires more aggressive
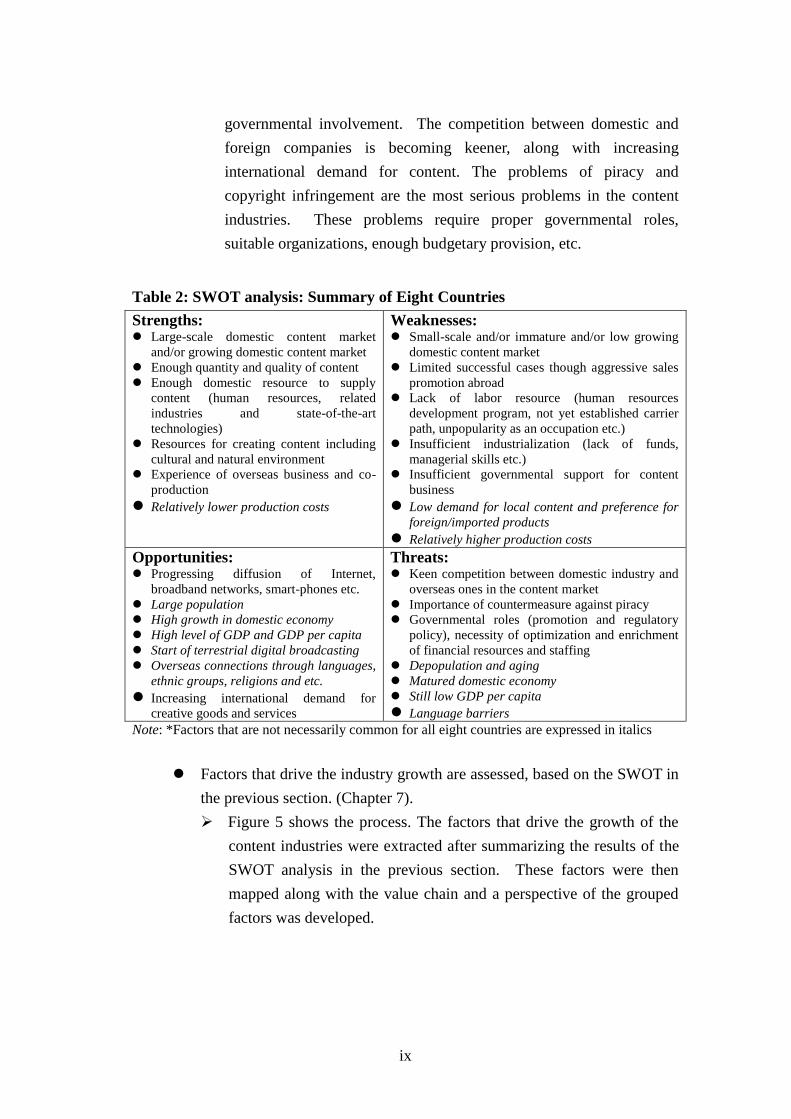
ix
governmental involvement. The competition between domestic and
foreign companies is becoming keener, along with increasing
international demand for content. The problems of piracy and
copyright infringement are the most serious problems in the content
industries. These problems require proper governmental roles,
suitable organizations, enough budgetary provision, etc.
Table 2: SWOT analysis: Summary of Eight Countries
Strengths: Large-scale domestic content market
and/or growing domestic content market
Enough quantity and quality of content
Enough domestic resource to supply
content (human resources, related
industries and state-of-the-art
technologies)
Resources for creating content including
cultural and natural environment
Experience of overseas business and co-
production
Relatively lower production costs
Weaknesses: Small-scale and/or immature and/or low growing
domestic content market
Limited successful cases though aggressive sales
promotion abroad
Lack of labor resource (human resources
development program, not yet established carrier
path, unpopularity as an occupation etc.)
Insufficient industrialization (lack of funds,
managerial skills etc.)
Insufficient governmental support for content
business
Low demand for local content and preference for
foreign/imported products Relatively higher production costs
Opportunities: Progressing diffusion of Internet,
broadband networks, smart-phones etc.
Large population
High growth in domestic economy
High level of GDP and GDP per capita
Start of terrestrial digital broadcasting
Overseas connections through languages,
ethnic groups, religions and etc.
Increasing international demand for
creative goods and services
Threats: Keen competition between domestic industry and
overseas ones in the content market
Importance of countermeasure against piracy
Governmental roles (promotion and regulatory
policy), necessity of optimization and enrichment
of financial resources and staffing
Depopulation and aging
Matured domestic economy
Still low GDP per capita
Language barriers Note: *Factors that are not necessarily common for all eight countries are expressed in italics
Factors that drive the industry growth are assessed, based on the SWOT in
the previous section. (Chapter 7).
Figure 5 shows the process. The factors that drive the growth of the
content industries were extracted after summarizing the results of the
SWOT analysis in the previous section. These factors were then
mapped along with the value chain and a perspective of the grouped
factors was developed.
x
Figure 5: Chart Analysis Process
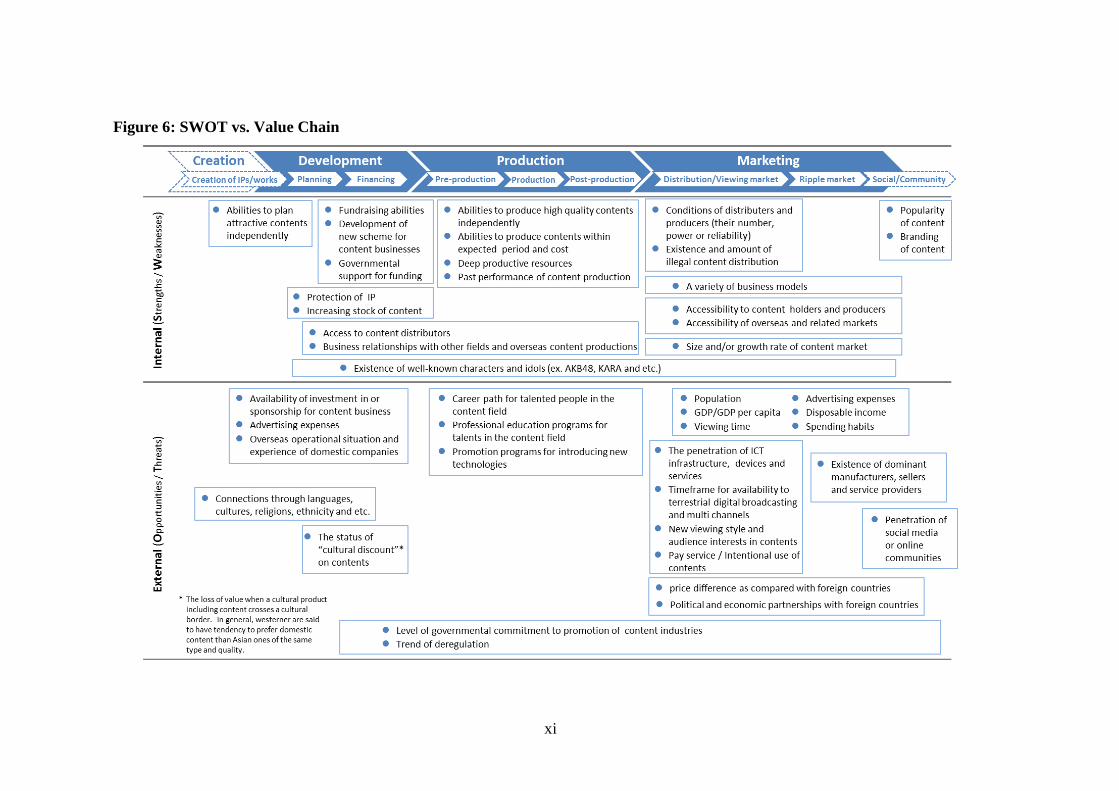
The extracted factors are mapped and shown in Figure 6. The horizontal
axis on the chart is the value chain. The vertical axis on the chart describes
the internal / external perspectives extracted from SWOT.
The chart overviews the factors of the internal and external
environments of the content industries along the value chain. The
chart depicts grouped factors necessary to be considered in the content
industries. Each factor mapped on the chart is essential for industry
growth.
xi
Figure 6: SWOT vs. Value Chain

xii
3. Policy Recommendations [Policy objectives]
For the sake of the growth of the content industries in each country in the region
the region’s policy objectives should be:
- To achieve the potential that the content industries in each country have by
utilizing the scale of the content markets and the assets of the content industries
in each country
- To promote trade and cooperation among content industries in the region
[Policy recommendation]
1. Promotion of collaboration to establish and enhance content industries in each
country
(1) Continuous effort to provide collaboration opportunities (GtoG, GtoP,
PtoP)
* G: Governmental sectors P: Private sectors
(2) Standardization of frameworks and tools for quantitative evaluation, such
as statistics relating to the content industries
(3) Enhancement of cooperative promotion policy for international co-
production (bilateral and multilateral)
(4) Promotion of standardization of regulations and policy measures (for
example: rules and customs related to international co-production)
2. Reinforcement of factors in the content industries in each country
2.1 Human resource development
(1) Support for discovery and training of talented people
(2) Support for creation of employment in the media and content industries
(3) Development of training programs (to fill supply and demand gaps
between academy and industry)
(4) Deregulation of personnel exchange (the visa problem) and simplifying
procedures
2.2 Business promotion
(1) Establishment and improvement of funding schemes (for example:
introduction of incentive schemes for domestic and international funding)
(2) Joint provision of resources for content localization1 (for example: sharing
information on companies, price lists and evaluations)
(3) Promotion of international co-production
2.3 Expansion of content trading
(1) Creation of a common intellectual property system
(2) Joint countermeasures against piracy
(3) Deregulation of imports of legal content
2.4 Effective use of new technologies
(1) Provision of opportunities for information sharing and exchange of ideas
1 Localization is a process of adapting a product or service to a particular language, culture, and
desired local "look-and-feel."

xiii
among governments and business operators of each county
(2) Promotion of international standardization of new technologies
1
CHAPTER 1
Background of this Study
1. Objective
It is recognized that the content industry is one of the potential cores of
economic growth in Asia and ASEAN countries.1 This research aims to analyze this
industry, considering its structure and contribution to the economy based on
industry/market data and national statistics, as well as case studies describing ripple
effects, industry-wise and country-wise, such as imports and exports. It is also
overviews the policy measures taken in each country to assess the current situation of
government’s role in promoting industry growth.
Secondly, taking into account the opinions of government and
industry/businesses, this report assess the strength/weakness/opportunity/threats (i.e.
conducts a ‘SWOT’ analysis), for each country, and also for the region as a whole.
The purpose of the SWOT analysis is to verify how the content industry in each
country could enhance productivity and increase trade in the region, by looking at the
challenges at several stages of the industry’s value chain.
Finally, these analyses will be the basis of the policy recommendation, for
promoting the industry in each country and also cooperation among governments and
1 UNCTAD, Creative Economy Report (2008, 2010)
2
businesses in the content industry, to accelerate development in value chain and
strengthening competitiveness.
2. Framework and Methodology
2.1. Study Flow
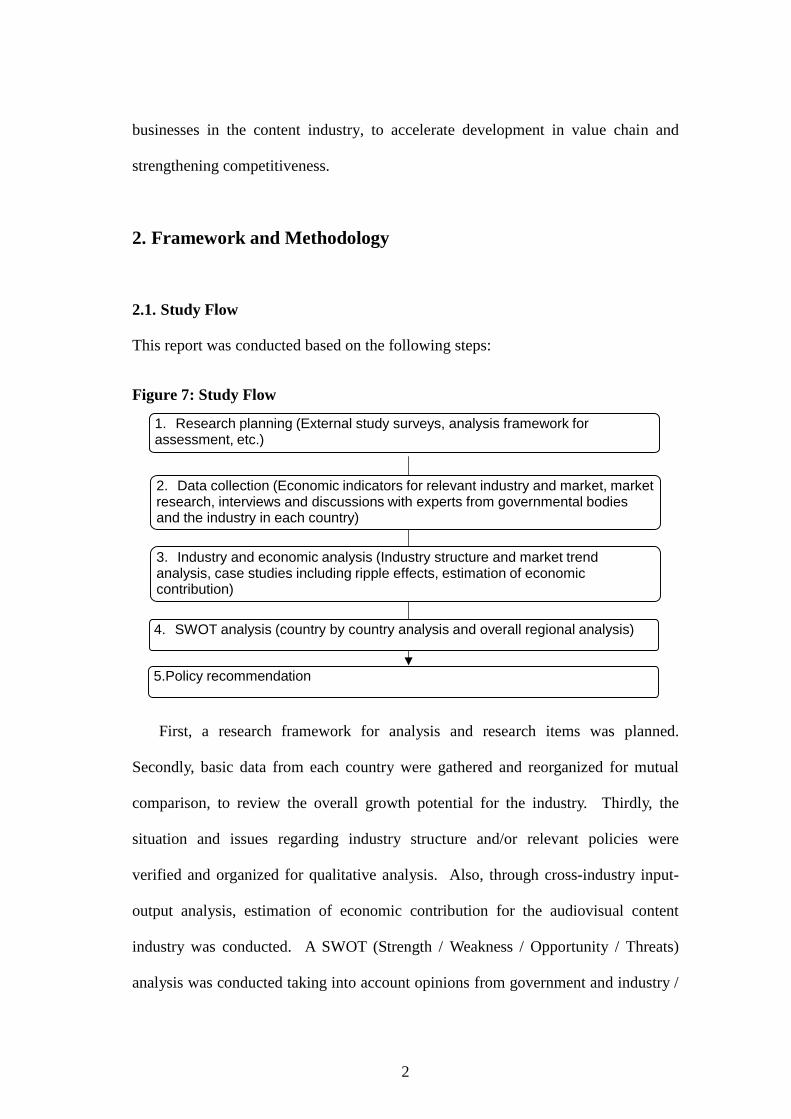
This report was conducted based on the following steps:
Figure 7: Study Flow
5.Policy recommendation
2. Data collection (Economic indicators for relevant industry and market, market research, interviews and discussions with experts from governmental bodies and the industry in each country)
3. Industry and economic analysis (Industry structure and market trend analysis, case studies including ripple effects, estimation of economic contribution)
1. Research planning (External study surveys, analysis framework for assessment, etc.)
4. SWOT analysis (country by country analysis and overall regional analysis)
First, a research framework for analysis and research items was planned.
Secondly, basic data from each country were gathered and reorganized for mutual
comparison, to review the overall growth potential for the industry. Thirdly, the
situation and issues regarding industry structure and/or relevant policies were
verified and organized for qualitative analysis. Also, through cross-industry input-
output analysis, estimation of economic contribution for the audiovisual content
industry was conducted. A SWOT (Strength / Weakness / Opportunity / Threats)
analysis was conducted taking into account opinions from government and industry /
3
businesses.
Finally, taking the analysis results into account, policy recommendation were
developed.
2.2. Covered Countries and Industries
In this report, eight countries, China, Indonesia, Japan, Korea, Malaysia,
Philippines, Singapore, and Thailand is covered.
The definition of the content industry in this report is shown in Figure 8. Five
subsectors, namely TV broadcasting, film, animation, game and music, are the scope
of this research. In global perspective, especially in developed countries, the five
subsectors is the driving growth in the content industry. To add, in general, these
subsectors are commonly recognized category in terms of statistics and related
industry data, which lowers the barrier of analysis and cross-country comparison.
On top of that, deeper analysis is conducted mainly targeting the audiovisual
content industry (including TV broadcasting, film and animation), which is
considered as the core industry in the context of content or creative industry. Note
that animation is mostly considered to be a subset of TV broadcasting and/or film,
however it is one of the growing sectors in Asia. Therefore the sector is
independently analyzed with respect to available statistics.
4
Figure 8: Scope of the Industry
There are several ways of defining the audiovisual content industry in detail, by
looking at individual subsectors within TV broadcasting, film, animation industry.
These are:
Types of output
Stages in the value chain
Breaking down the industry in this way helps to understand the value added in
different stages of the economic activity in the industry.
“Types of output” refers to the output of content in products or services within
the industry. In this report, the following outputs are included:
- TV programs (domestic and foreign program distributed domestically)
- Films
- Animation
The above currently represents the key outputs of the industry. However, when
economically evaluating the content industry, it is difficult to distinguish the value
added within the flow from production to final consumption. Moreover, taking into
account the recent trends in market convergence, its range of outputs is increasingly
transformative. To give examples relating to the film and television broadcasting
industry; convergence among different types of content, merchandizing originating in
film/ television programs can be seen as well as, and increasing demand for multi-
Audiovisual content industry
5
screen (TV/ PC/ mobile) provision over broadcast and communication network. The
framework and industry categorization used in the national statistics do not exactly
reflect these trends. Consequently, analysis of outputs based on the traditional film
and TV sector split will not reflect the whole industry. The market trends concerning
new subsectors, such as internet distribution, need to be taken into account and be
assessed in a wider view, given that the estimates are bound by available statistics.
“Stages in the value chain” can be broken down into the following components:
Production
Distribution
Film Exhibition
Television Broadcasting(Terrestrial /satellite / CATV)
Home video (retail and rental)
Online service (Internet distribution to TV/PC/Mobile)
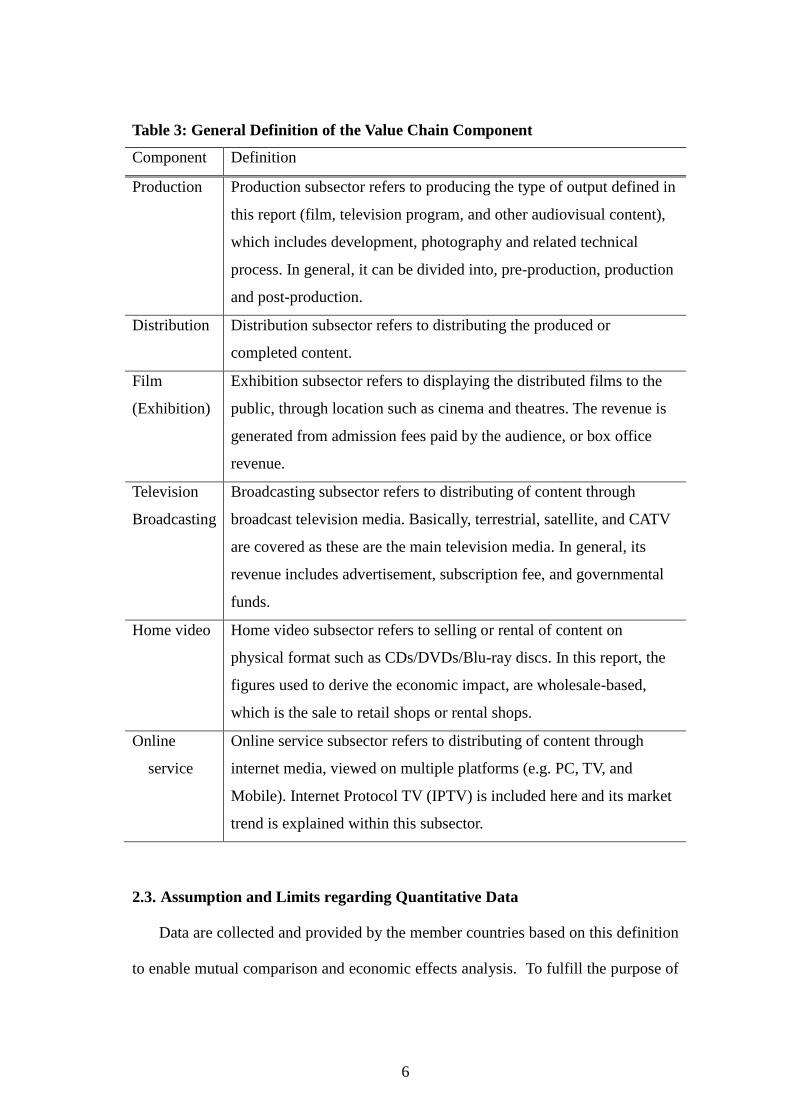
The definition for each component is explained in Table 3.
6
Table 3: General Definition of the Value Chain Component
Component Definition
Production Production subsector refers to producing the type of output defined in
this report (film, television program, and other audiovisual content),
which includes development, photography and related technical
process. In general, it can be divided into, pre-production, production
and post-production.
Distribution Distribution subsector refers to distributing the produced or
completed content.
Film
(Exhibition)
Exhibition subsector refers to displaying the distributed films to the
public, through location such as cinema and theatres. The revenue is
generated from admission fees paid by the audience, or box office
revenue.
Television
Broadcasting
Broadcasting subsector refers to distributing of content through
broadcast television media. Basically, terrestrial, satellite, and CATV
are covered as these are the main television media. In general, its
revenue includes advertisement, subscription fee, and governmental
funds.
Home video Home video subsector refers to selling or rental of content on
physical format such as CDs/DVDs/Blu-ray discs. In this report, the
figures used to derive the economic impact, are wholesale-based,
which is the sale to retail shops or rental shops.
Online
service
Online service subsector refers to distributing of content through
internet media, viewed on multiple platforms (e.g. PC, TV, and
Mobile). Internet Protocol TV (IPTV) is included here and its market
trend is explained within this subsector.
2.3. Assumption and Limits regarding Quantitative Data
Data are collected and provided by the member countries based on this definition
to enable mutual comparison and economic effects analysis. To fulfill the purpose of
7
this research, references may be made to a wider concept of industry, which include
the audiovisual content industry and other segments of industry.
Note that each country has its limit in current statistics concerning certain areas;
therefore in some cases external databases are referred to. Table 5 shows in detail,
that was covered (provided by the member countries) in the analysis.
Table 4: Reference Source of Primary Indicators
Parameter Reference Source
Economic
Indicator
GDP per capita World Bank
Population World Bank
Labor National account, various country statistics
sources
Economy
breakdown by
industry, Input-
Output table
National account of each country
Industry
indicator
Market revenue Statistics provided from each member country
PricewaterhouseCoopers “Entertainment and
Media Outlook”
Employment Statistics provided from each member country
8
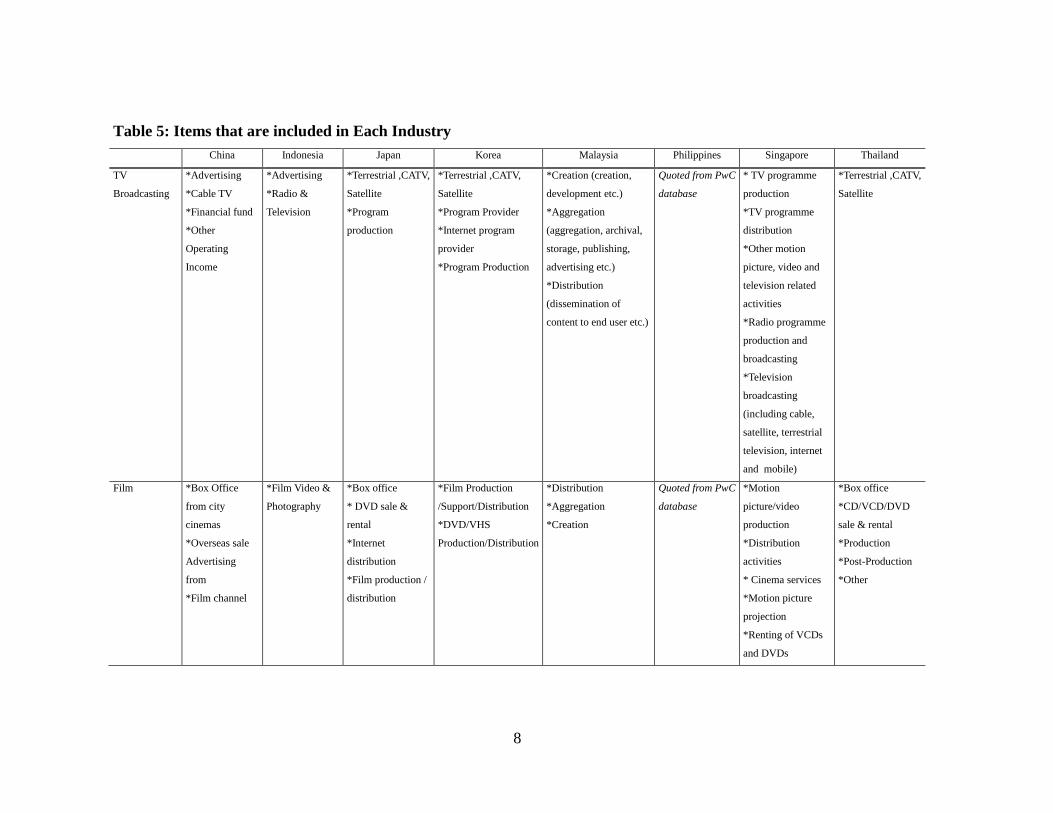
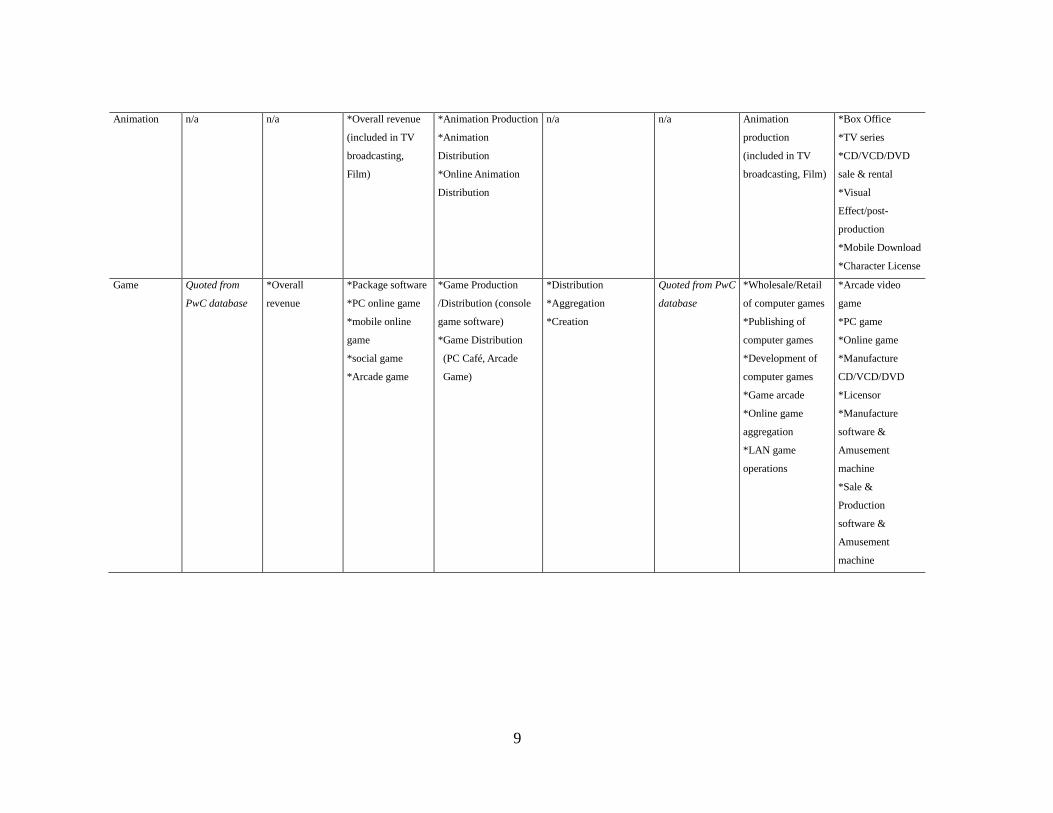
Table 5: Items that are included in Each Industry
China Indonesia Japan Korea Malaysia Philippines Singapore Thailand
TV
Broadcasting
*Advertising
*Cable TV
*Financial fund
*Other
Operating
Income
*Advertising
*Radio &
Television
*Terrestrial ,CATV,
Satellite
*Program
production
*Terrestrial ,CATV,
Satellite
*Program Provider
*Internet program
provider
*Program Production
*Creation (creation,
development etc.)
*Aggregation
(aggregation, archival,
storage, publishing,
advertising etc.)
*Distribution
(dissemination of
content to end user etc.)
Quoted from PwC
database
* TV programme
production
*TV programme
distribution
*Other motion
picture, video and
television related
activities
*Radio programme
production and
broadcasting
*Television
broadcasting
(including cable,
satellite, terrestrial
television, internet
and mobile)
*Terrestrial ,CATV,
Satellite
Film *Box Office
from city
cinemas
*Overseas sale
Advertising
from
*Film channel
*Film Video &
Photography
*Box office
* DVD sale &
rental
*Internet
distribution
*Film production /
distribution
*Film Production
/Support/Distribution
*DVD/VHS
Production/Distribution
*Distribution
*Aggregation
*Creation
Quoted from PwC
database
*Motion
picture/video
production
*Distribution
activities
* Cinema services
*Motion picture
projection
*Renting of VCDs
and DVDs
*Box office
*CD/VCD/DVD
sale & rental
*Production
*Post-Production
*Other
9
Animation n/a n/a *Overall revenue
(included in TV
broadcasting,
Film)
*Animation Production
*Animation
Distribution
*Online Animation
Distribution
n/a n/a Animation
production
(included in TV
broadcasting, Film)
*Box Office
*TV series
*CD/VCD/DVD
sale & rental
*Visual
Effect/post-
production
*Mobile Download
*Character License
Game Quoted from
PwC database
*Overall
revenue
*Package software
*PC online game
*mobile online
game
*social game
*Arcade game
*Game Production
/Distribution (console
game software)
*Game Distribution
(PC Café, Arcade
Game)
*Distribution
*Aggregation
*Creation
Quoted from PwC
database
*Wholesale/Retail
of computer games
*Publishing of
computer games
*Development of
computer games
*Game arcade
*Online game
aggregation
*LAN game
operations
*Arcade video
game
*PC game
*Online game
*Manufacture
CD/VCD/DVD
*Licensor
*Manufacture
software &
Amusement
machine
*Sale &
Production
software &
Amusement
machine
10
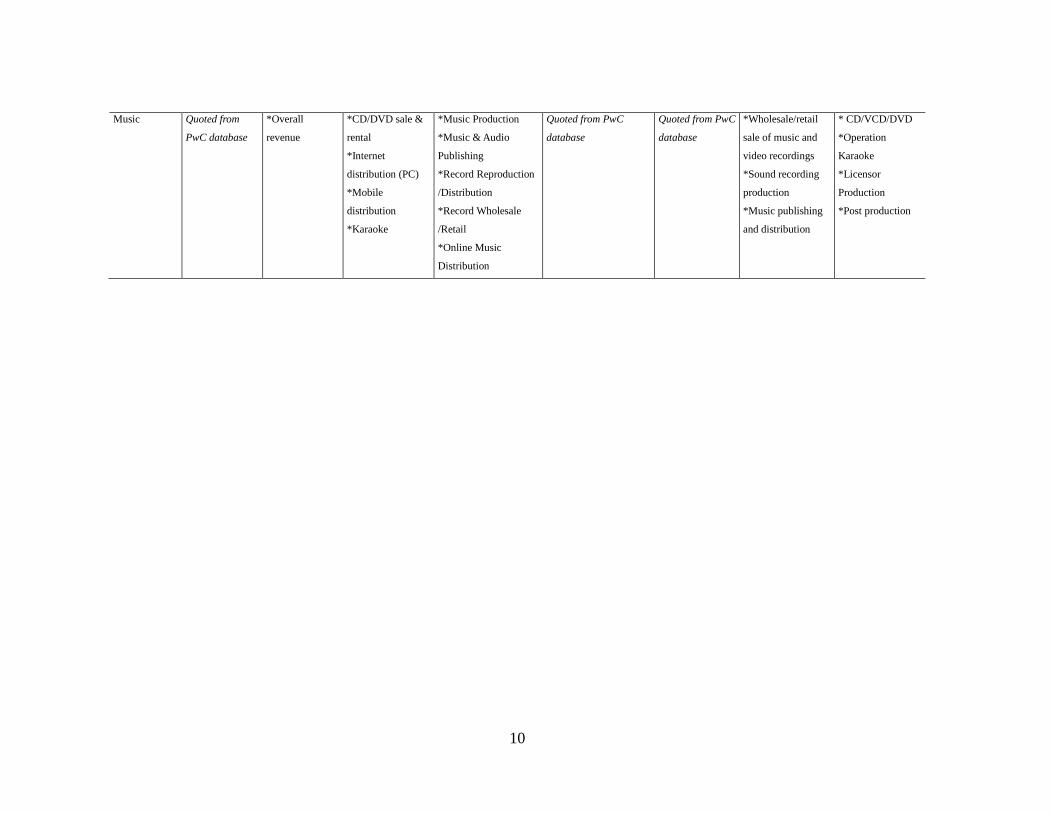
Music Quoted from
PwC database
*Overall
revenue
*CD/DVD sale &
rental
*Internet
distribution (PC)
*Mobile
distribution
*Karaoke
*Music Production
*Music & Audio
Publishing
*Record Reproduction
/Distribution
*Record Wholesale
/Retail
*Online Music
Distribution
Quoted from PwC
database
Quoted from PwC
database
*Wholesale/retail
sale of music and
video recordings
*Sound recording
production
*Music publishing
and distribution
* CD/VCD/DVD
*Operation
Karaoke
*Licensor
Production
*Post production
11
CHAPTER 2
Trends in Content Industry
1. The Global Perspective
1.1. Background
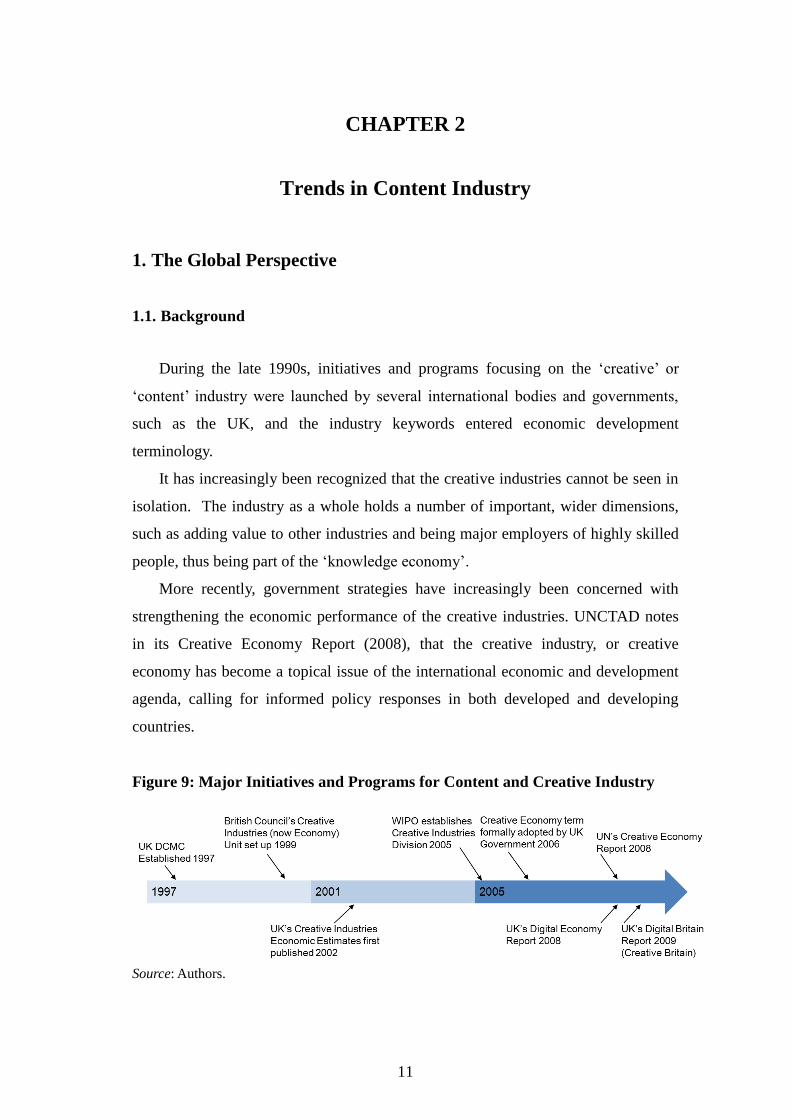
During the late 1990s, initiatives and programs focusing on the ‘creative’ or
‘content’ industry were launched by several international bodies and governments,
such as the UK, and the industry keywords entered economic development
terminology.
It has increasingly been recognized that the creative industries cannot be seen in
isolation. The industry as a whole holds a number of important, wider dimensions,
such as adding value to other industries and being major employers of highly skilled
people, thus being part of the ‘knowledge economy’.
More recently, government strategies have increasingly been concerned with
strengthening the economic performance of the creative industries. UNCTAD notes
in its Creative Economy Report (2008), that the creative industry, or creative
economy has become a topical issue of the international economic and development
agenda, calling for informed policy responses in both developed and developing
countries.
Figure 9: Major Initiatives and Programs for Content and Creative Industry
Source: Authors.
12
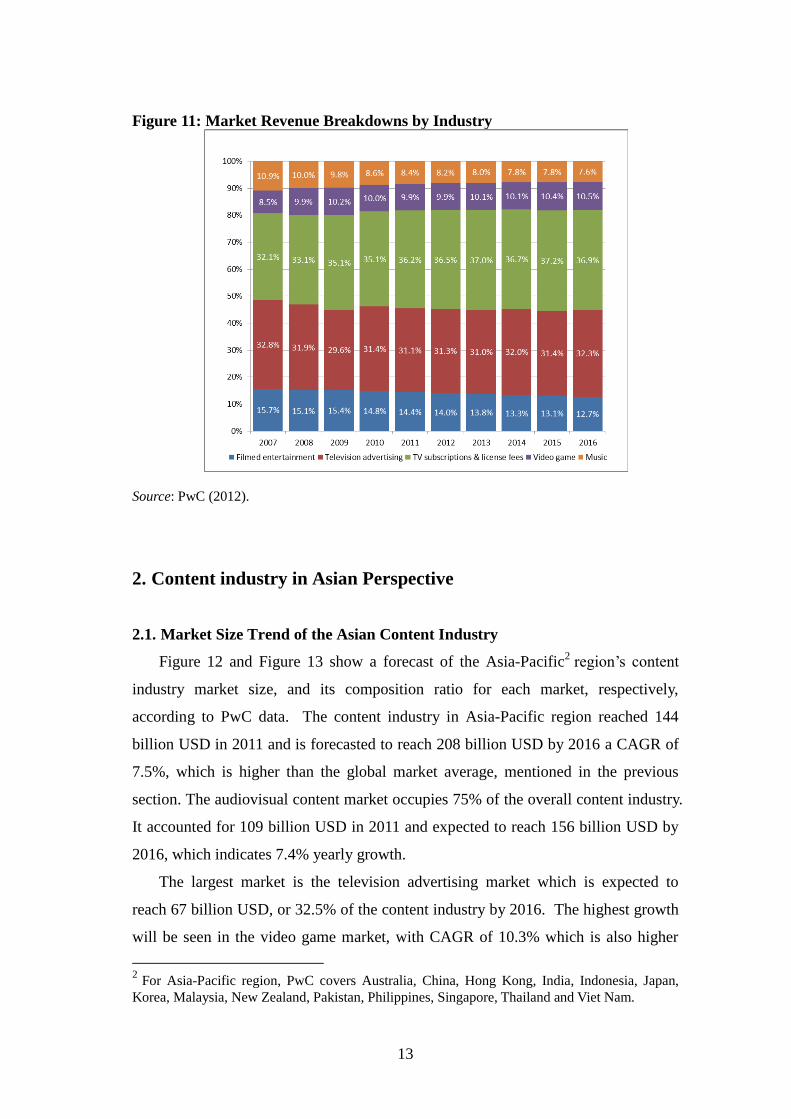
1.2. Market Size Trend of the Global Content Industry
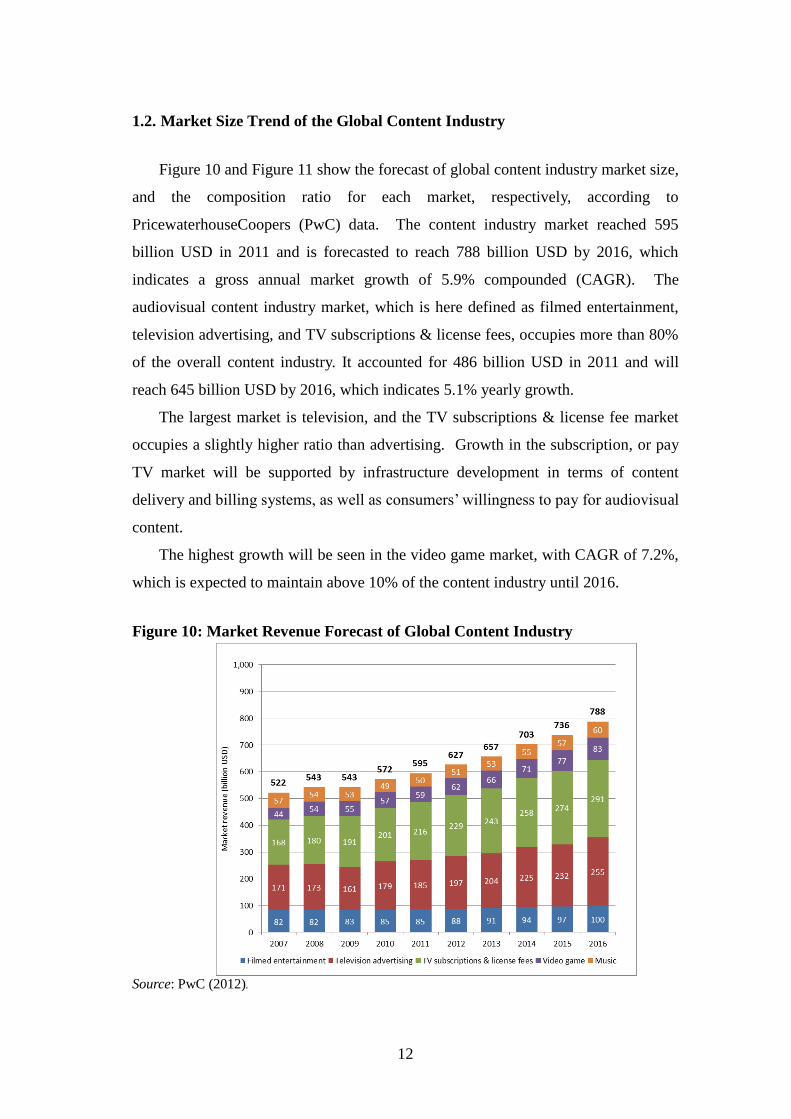
Figure 10 and Figure 11 show the forecast of global content industry market size,
and the composition ratio for each market, respectively, according to
PricewaterhouseCoopers (PwC) data. The content industry market reached 595
billion USD in 2011 and is forecasted to reach 788 billion USD by 2016, which
indicates a gross annual market growth of 5.9% compounded (CAGR). The
audiovisual content industry market, which is here defined as filmed entertainment,
television advertising, and TV subscriptions & license fees, occupies more than 80%
of the overall content industry. It accounted for 486 billion USD in 2011 and will
reach 645 billion USD by 2016, which indicates 5.1% yearly growth.
The largest market is television, and the TV subscriptions & license fee market
occupies a slightly higher ratio than advertising. Growth in the subscription, or pay
TV market will be supported by infrastructure development in terms of content
delivery and billing systems, as well as consumers’ willingness to pay for audiovisual
content.
The highest growth will be seen in the video game market, with CAGR of 7.2%,
which is expected to maintain above 10% of the content industry until 2016.
Figure 10: Market Revenue Forecast of Global Content Industry
Source: PwC (2012).
13
Figure 11: Market Revenue Breakdowns by Industry
Source: PwC (2012).
2. Content industry in Asian Perspective
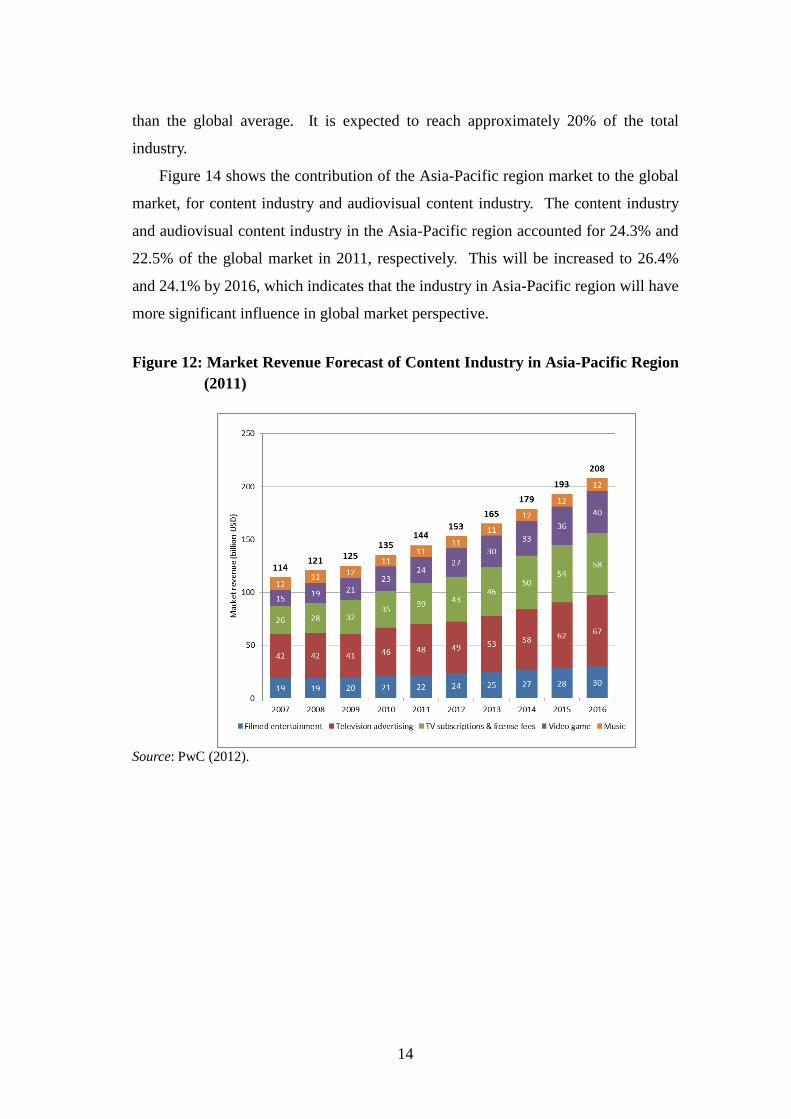
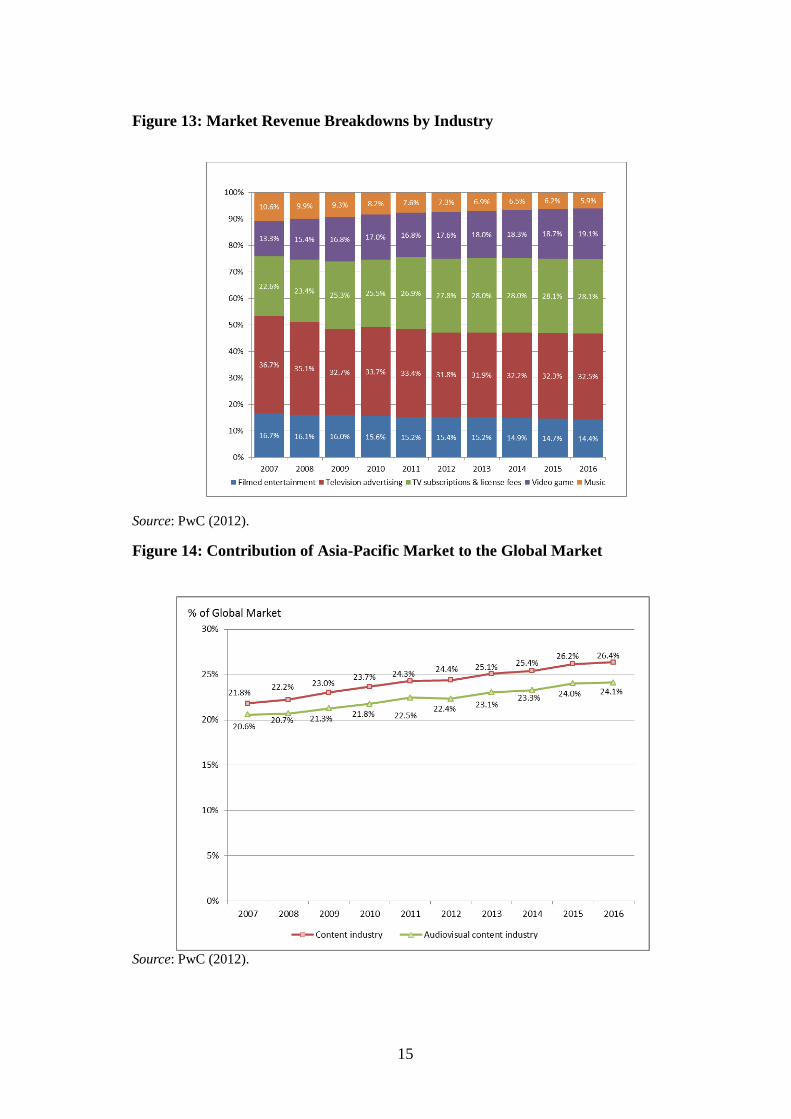
2.1. Market Size Trend of the Asian Content Industry
Figure 12 and Figure 13 show a forecast of the Asia-Pacific2 region’s content
industry market size, and its composition ratio for each market, respectively,
according to PwC data. The content industry in Asia-Pacific region reached 144
billion USD in 2011 and is forecasted to reach 208 billion USD by 2016 a CAGR of
7.5%, which is higher than the global market average, mentioned in the previous
section. The audiovisual content market occupies 75% of the overall content industry.
It accounted for 109 billion USD in 2011 and expected to reach 156 billion USD by
2016, which indicates 7.4% yearly growth.
The largest market is the television advertising market which is expected to
reach 67 billion USD, or 32.5% of the content industry by 2016. The highest growth
will be seen in the video game market, with CAGR of 10.3% which is also higher
2 For Asia-Pacific region, PwC covers Australia, China, Hong Kong, India, Indonesia, Japan,
Korea, Malaysia, New Zealand, Pakistan, Philippines, Singapore, Thailand and Viet Nam.
14
than the global average. It is expected to reach approximately 20% of the total
industry.
Figure 14 shows the contribution of the Asia-Pacific region market to the global
market, for content industry and audiovisual content industry. The content industry
and audiovisual content industry in the Asia-Pacific region accounted for 24.3% and
22.5% of the global market in 2011, respectively. This will be increased to 26.4%
and 24.1% by 2016, which indicates that the industry in Asia-Pacific region will have
more significant influence in global market perspective.
Figure 12: Market Revenue Forecast of Content Industry in Asia-Pacific Region
(2011)
Source: PwC (2012).
15
Figure 13: Market Revenue Breakdowns by Industry
Source: PwC (2012).
Figure 14: Contribution of Asia-Pacific Market to the Global Market
Source: PwC (2012).
16
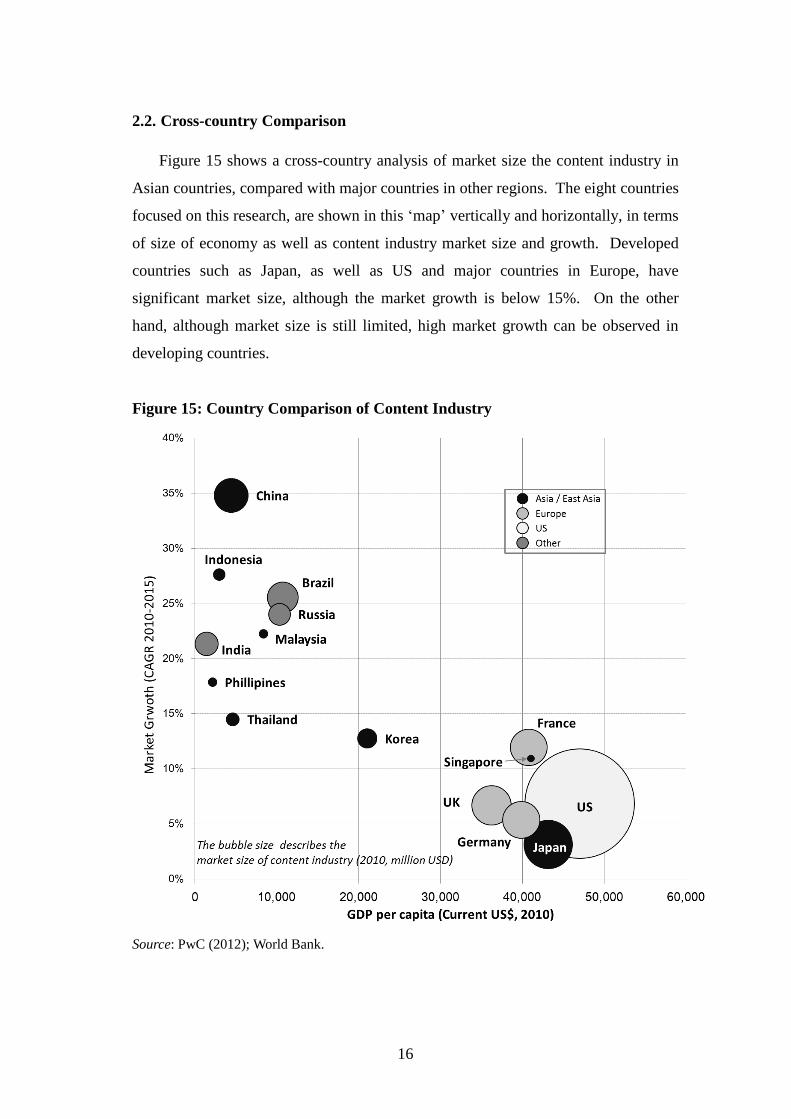
2.2. Cross-country Comparison
Figure 15 shows a cross-country analysis of market size the content industry in
Asian countries, compared with major countries in other regions. The eight countries
focused on this research, are shown in this ‘map’ vertically and horizontally, in terms
of size of economy as well as content industry market size and growth. Developed
countries such as Japan, as well as US and major countries in Europe, have
significant market size, although the market growth is below 15%. On the other
hand, although market size is still limited, high market growth can be observed in
developing countries.
Figure 15: Country Comparison of Content Industry
Source: PwC (2012); World Bank.
17
The analysis above indicates the overall market potential as well as the
difference among countries from an economic perspective. UNCTAD describes this
phenomenon in its Creative Economy report (2010), emphasizing the contribution of
creative economy and industry in the Asia-Pacific region, as below.
In the Asia-Pacific region, the creative industries have been an important
element in the development of mature economies such as Japan and the Republic
of Korea, as well as of fast-growing economies such as Singapore and Malaysia.
Many city authorities in China, Japan, the Republic of Korea and Singapore
have formulated economic investment policies based on creativity and creative
enterprise as a strategy for economic growth and competitive advantage.
In most Asian countries the concept of creative economy associated with
cultural industries gradually is being absorbed and reflected in national
economic development strategies. Many countries in the region started to analyze
the potential of their creative industries for job creation, revenue and trade.
(quoted from UNCTAD “Creative Economy Report 2010”)
As UNCTAD have stated, it is well acknowledged in the Asian-Pacific region
that the creative and content industry has the potential value to create jobs, revenue
and trade, and many countries in the region have been implementing policies to
enhance its economic contribution.
UNCTAD, in its report, also describes, the Asia-Pacific region dividing into
different groups according to how importantly the concept and activities of creative
industries figure in the economy. For example, several major Asia-Pacific economies,
such as China, India, Indonesia, Malaysia, the Philippines, Korea, Singapore,
Thailand and Viet Nam, have much activity related to the creative economy as well
as a strategic interest in creative industry development, whilst other Asian countries
have less emphasis on creative industry development, or it exists mostly in terms of
the more traditional cultural activities of community life.
Efforts in developing stronger government-to-government links across the
region, or regional measures to enhance the creative and contents industry are
essential for the regional growth, but it is more important to firstly recognize and

18
respect the differences among the countries in both the economic and cultural
perspectives of creative or content industries, in order to fulfill any form of
collaboration incentives in the region.
19
CHAPTER 3
Industry Structure
In this chapter, current status of the content industry structure is presented, to
overview the market revenue and potential growth for each country.
1. Market Size and Growth
1.1. Market Size of Content Industry
The market revenue of the content industry is shown in Figure 16. Japan has the
largest market among eight countries, which accounted for 94.6 billion USD in 2011.
It is followed by China and Korea, with market revenue of 53.1 billion USD and 26.9
billion USD, respectively. The market revenue in other ASEAN countries is within
the range of 0.5 to 6.1 billion USD.
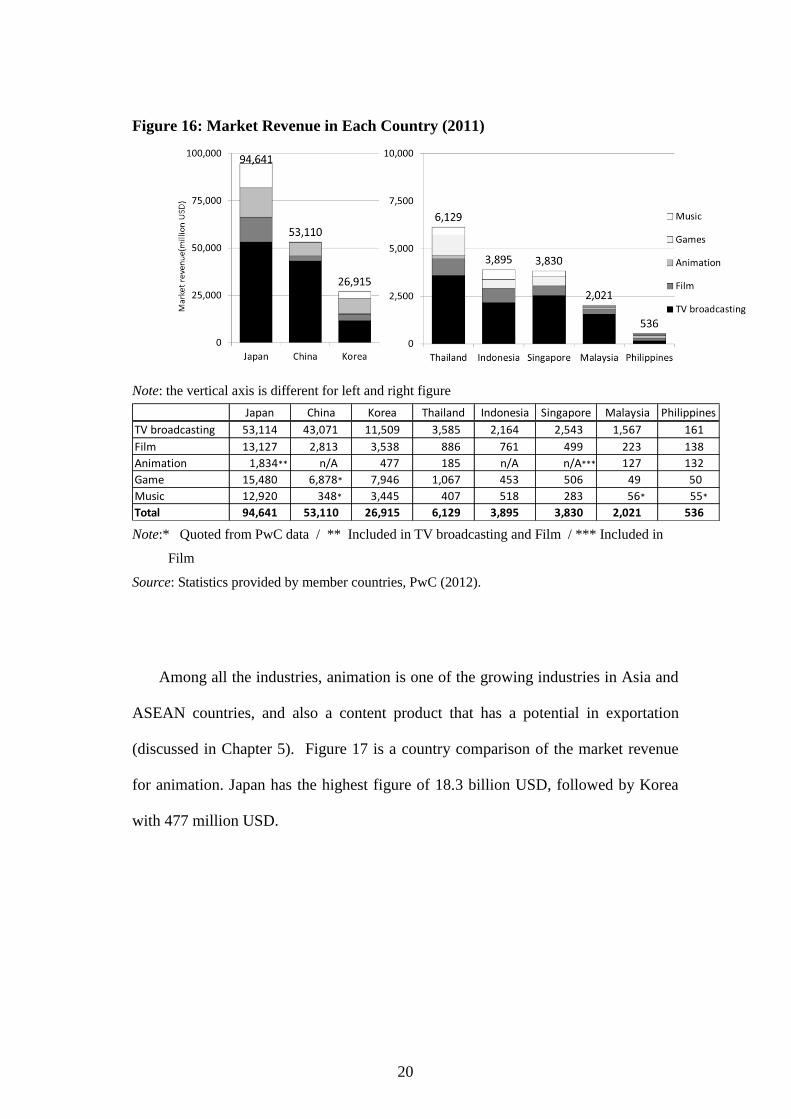
20
Figure 16: Market Revenue in Each Country (2011)
Note: the vertical axis is different for left and right figure
Japan China Korea Thailand Indonesia Singapore Malaysia Philippines
TV broadcasting 53,114 43,071 11,509 3,585 2,164 2,543 1,567 161
Film 13,127 2,813 3,538 886 761 499 223 138
Animation 1,834** n/A 477 185 n/A n/A*** 127 132
Game 15,480 6,878* 7,946 1,067 453 506 49 50
Music 12,920 348* 3,445 407 518 283 56* 55*
Total 94,641 53,110 26,915 6,129 3,895 3,830 2,021 536
Note:* Quoted from PwC data / ** Included in TV broadcasting and Film / *** Included in
Film
Source: Statistics provided by member countries, PwC (2012).
Among all the industries, animation is one of the growing industries in Asia and
ASEAN countries, and also a content product that has a potential in exportation
(discussed in Chapter 5). Figure 17 is a country comparison of the market revenue
for animation. Japan has the highest figure of 18.3 billion USD, followed by Korea
with 477 million USD.
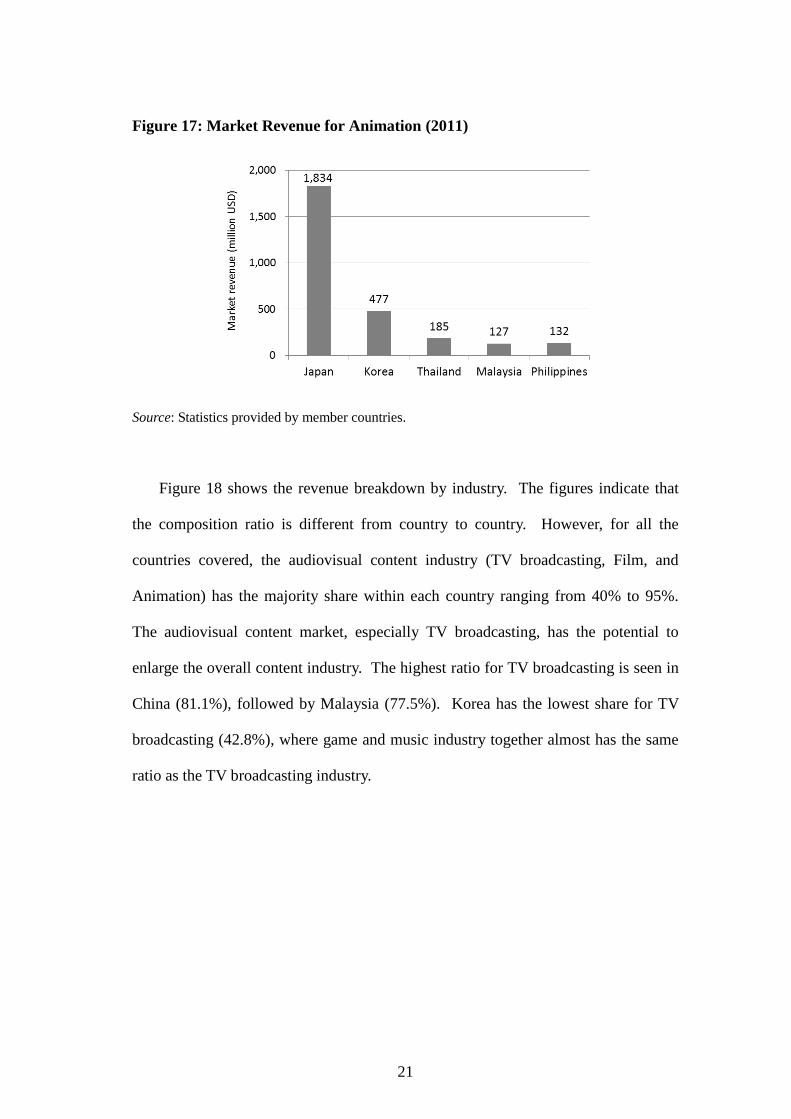
21
Figure 17: Market Revenue for Animation (2011)
Source: Statistics provided by member countries.
Figure 18 shows the revenue breakdown by industry. The figures indicate that
the composition ratio is different from country to country. However, for all the
countries covered, the audiovisual content industry (TV broadcasting, Film, and
Animation) has the majority share within each country ranging from 40% to 95%.
The audiovisual content market, especially TV broadcasting, has the potential to
enlarge the overall content industry. The highest ratio for TV broadcasting is seen in
China (81.1%), followed by Malaysia (77.5%). Korea has the lowest share for TV
broadcasting (42.8%), where game and music industry together almost has the same
ratio as the TV broadcasting industry.
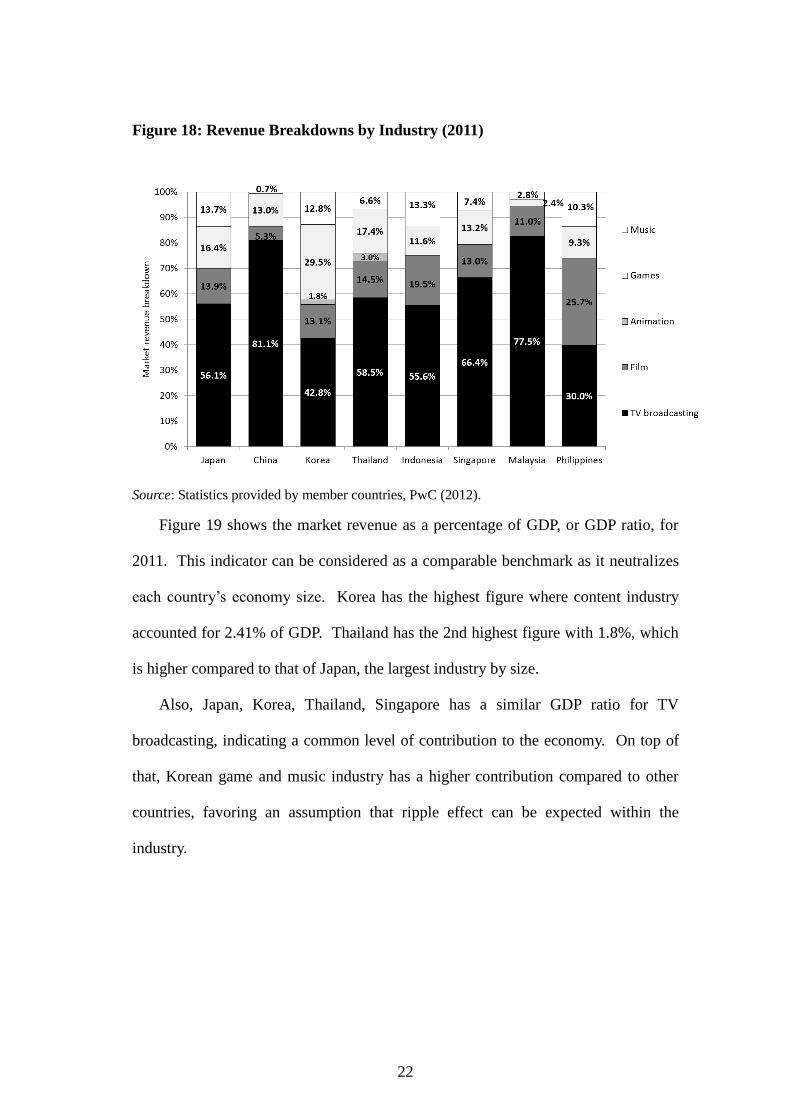
22
Figure 18: Revenue Breakdowns by Industry (2011)
Source: Statistics provided by member countries, PwC (2012).
Figure 19 shows the market revenue as a percentage of GDP, or GDP ratio, for
2011. This indicator can be considered as a comparable benchmark as it neutralizes
each country’s economy size. Korea has the highest figure where content industry
accounted for 2.41% of GDP. Thailand has the 2nd highest figure with 1.8%, which
is higher compared to that of Japan, the largest industry by size.
Also, Japan, Korea, Thailand, Singapore has a similar GDP ratio for TV
broadcasting, indicating a common level of contribution to the economy. On top of
that, Korean game and music industry has a higher contribution compared to other
countries, favoring an assumption that ripple effect can be expected within the
industry.
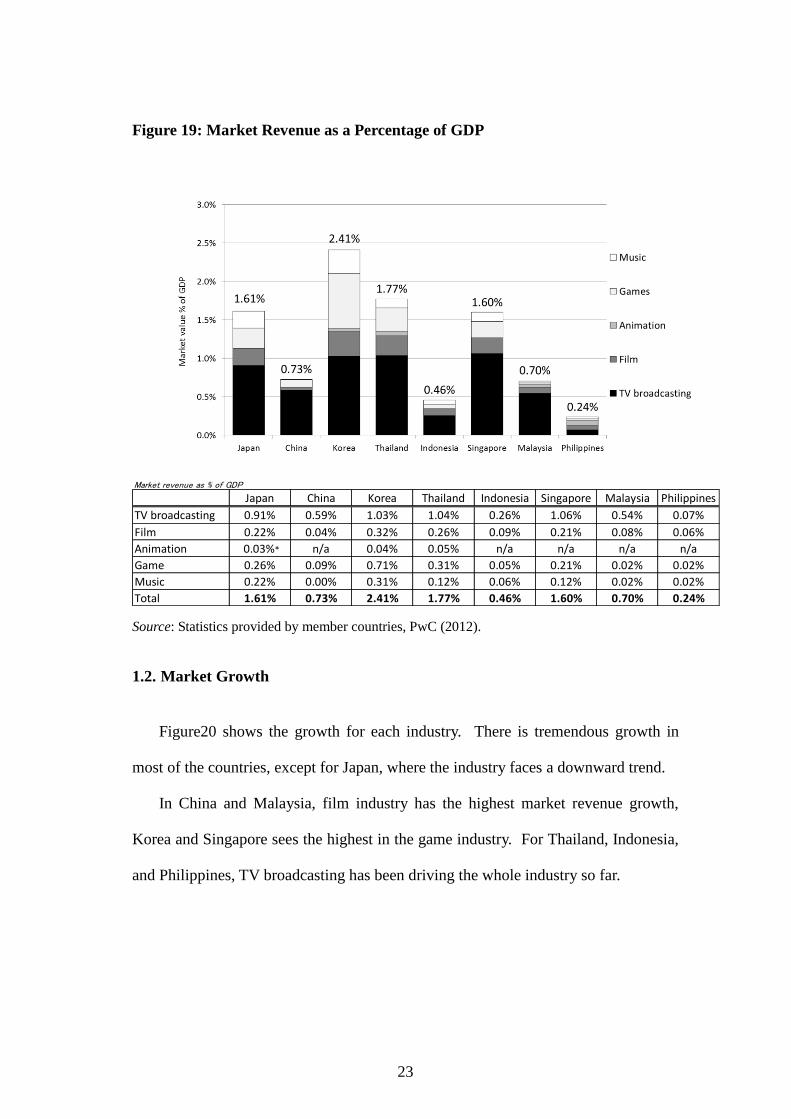
23
Figure 19: Market Revenue as a Percentage of GDP
Market revenue as % of GDP
Japan China Korea Thailand Indonesia Singapore Malaysia Philippines
TV broadcasting 0.91% 0.59% 1.03% 1.04% 0.26% 1.06% 0.54% 0.07%
Film 0.22% 0.04% 0.32% 0.26% 0.09% 0.21% 0.08% 0.06%
Animation 0.03%* n/a 0.04% 0.05% n/a n/a n/a n/a
Game 0.26% 0.09% 0.71% 0.31% 0.05% 0.21% 0.02% 0.02%
Music 0.22% 0.00% 0.31% 0.12% 0.06% 0.12% 0.02% 0.02%
Total 1.61% 0.73% 2.41% 1.77% 0.46% 1.60% 0.70% 0.24%
Source: Statistics provided by member countries, PwC (2012).
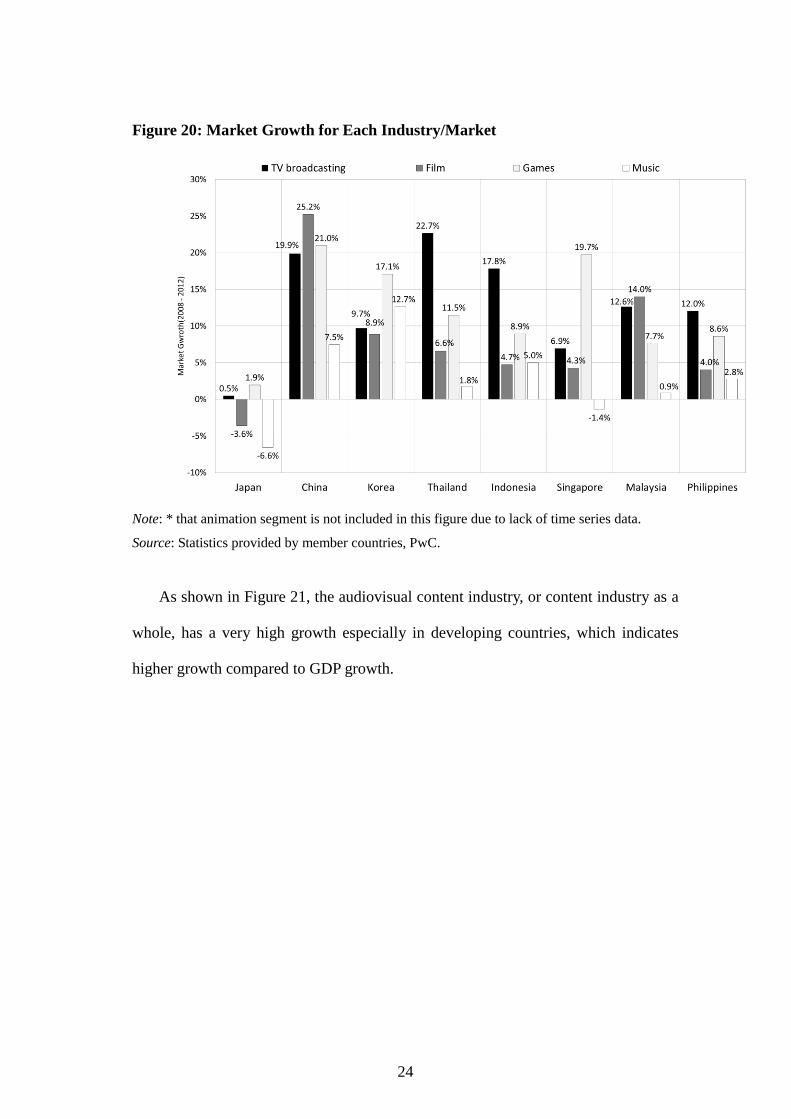
1.2. Market Growth
Figure20 shows the growth for each industry. There is tremendous growth in
most of the countries, except for Japan, where the industry faces a downward trend.
In China and Malaysia, film industry has the highest market revenue growth,
Korea and Singapore sees the highest in the game industry. For Thailand, Indonesia,
and Philippines, TV broadcasting has been driving the whole industry so far.
24
Figure 20: Market Growth for Each Industry/Market
Note: * that animation segment is not included in this figure due to lack of time series data.
Source: Statistics provided by member countries, PwC.
As shown in Figure 21, the audiovisual content industry, or content industry as a
whole, has a very high growth especially in developing countries, which indicates
higher growth compared to GDP growth.

25
Figure 21: Market Growth (aggregated) and GDP Growth
Source: Statistics provided by member countries, PwC.
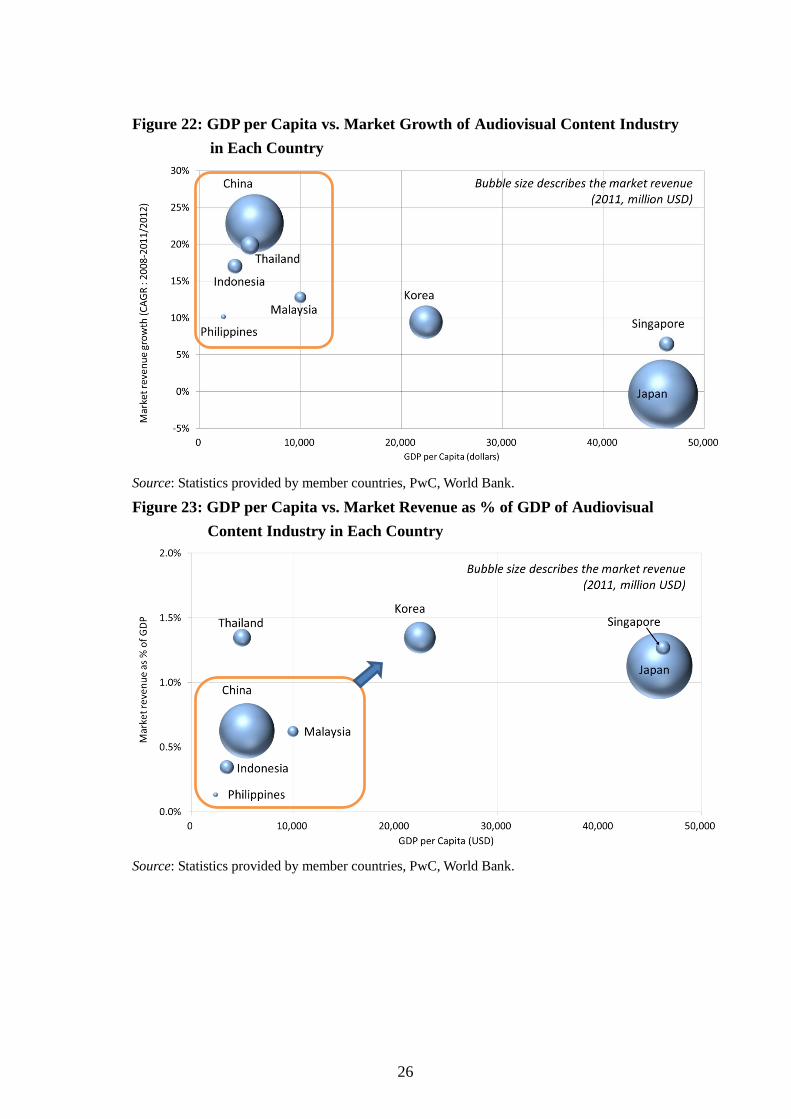
1.3. Positioning of Audiovisual Content Industry in Each Country
Figure 22 and Figure 23 map the GDP per capita vs. the market revenue growth
and GDP per capita vs. market revenue as a percentage of GDP, respectively, for
audiovisual content industry in each country. The figures indicate that China and
developing ASEAN country group, namely Thailand, Indonesia, Malaysia and
Philippines, have high growth, compared to Japan, Singapore, and Korea.
Moreover, the relationship between the GDP per capita and the economic
contribution of audiovisual content industry indicate that, there is still potential for
the industry to evolve in order to increase its contribution, when comparing the
countries in the similar economic development stage.
26
Figure 22: GDP per Capita vs. Market Growth of Audiovisual Content Industry
in Each Country
Source: Statistics provided by member countries, PwC, World Bank.
Figure 23: GDP per Capita vs. Market Revenue as % of GDP of Audiovisual
Content Industry in Each Country
Source: Statistics provided by member countries, PwC, World Bank.

27
1.3.1. Market Structure and Players
The market revenue breakdown as well as number of players (companies) in TV
broadcasting animation and film industry is summarized in Table 6. Note that the
data is shown for countries with available statistics.
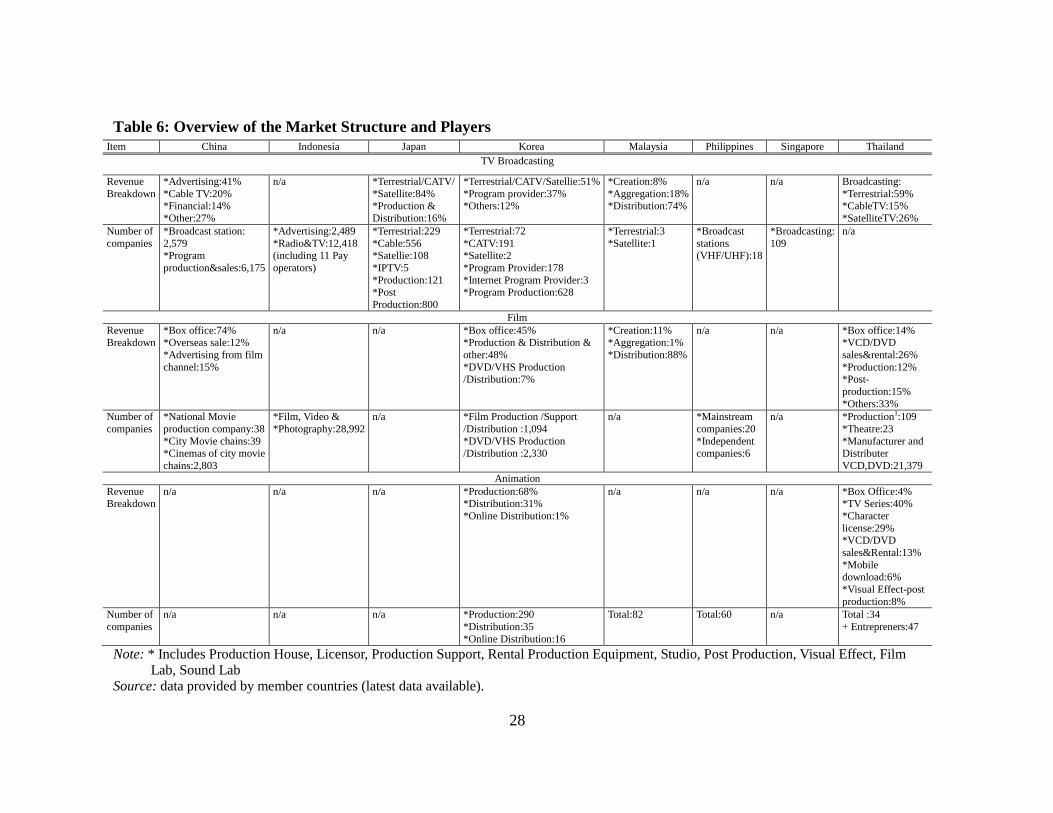
28
Table 6: Overview of the Market Structure and Players
Item China Indonesia Japan Korea Malaysia Philippines Singapore Thailand
TV Broadcasting
Revenue
Breakdown
*Advertising:41%
*Cable TV:20% *Financial:14%
*Other:27%
n/a *Terrestrial/CATV/
*Satellite:84% *Production &
Distribution:16%
*Terrestrial/CATV/Satellie:51%
*Program provider:37% *Others:12%
*Creation:8%
*Aggregation:18% *Distribution:74%
n/a n/a Broadcasting:
*Terrestrial:59% *CableTV:15%
*SatelliteTV:26%
Number of
companies
*Broadcast station:
2,579 *Program
production&sales:6,175
*Advertising:2,489
*Radio&TV:12,418 (including 11 Pay
operators)
*Terrestrial:229
*Cable:556 *Satellie:108
*IPTV:5
*Production:121 *Post
Production:800
*Terrestrial:72
*CATV:191 *Satellite:2
*Program Provider:178
*Internet Program Provider:3 *Program Production:628
*Terrestrial:3
*Satellite:1
*Broadcast
stations (VHF/UHF):18
*Broadcasting:
109
n/a
Film
Revenue Breakdown
*Box office:74% *Overseas sale:12%
*Advertising from film
channel:15%
n/a n/a *Box office:45% *Production & Distribution &
other:48%
*DVD/VHS Production /Distribution:7%
*Creation:11% *Aggregation:1%
*Distribution:88%
n/a n/a *Box office:14% *VCD/DVD
sales&rental:26%
*Production:12% *Post-
production:15%
*Others:33%
Number of
companies
*National Movie
production company:38
*City Movie chains:39
*Cinemas of city movie
chains:2,803
*Film, Video &
*Photography:28,992
n/a *Film Production /Support
/Distribution :1,094
*DVD/VHS Production
/Distribution :2,330
n/a *Mainstream
companies:20
*Independent
companies:6
n/a *Production1:109
*Theatre:23
*Manufacturer and
Distributer
VCD,DVD:21,379
Animation
Revenue Breakdown
n/a n/a n/a *Production:68% *Distribution:31%
*Online Distribution:1%
n/a n/a n/a *Box Office:4% *TV Series:40%
*Character
license:29% *VCD/DVD
sales&Rental:13%
*Mobile download:6%
*Visual Effect-post
production:8%
Number of
companies
n/a n/a n/a *Production:290
*Distribution:35
*Online Distribution:16
Total:82 Total:60 n/a Total :34
+ Entrepreners:47
Note: * Includes Production House, Licensor, Production Support, Rental Production Equipment, Studio, Post Production, Visual Effect, Film
Lab, Sound Lab Source: data provided by member countries (latest data available).
29
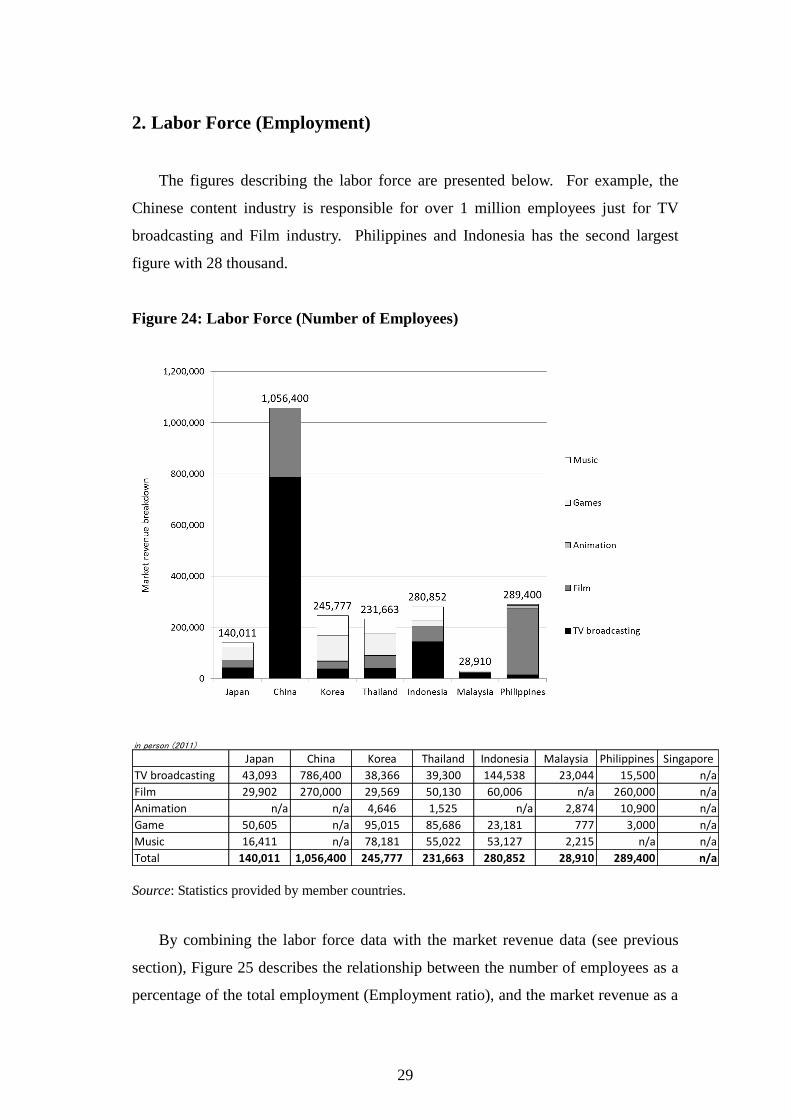
2. Labor Force (Employment)
The figures describing the labor force are presented below. For example, the
Chinese content industry is responsible for over 1 million employees just for TV
broadcasting and Film industry. Philippines and Indonesia has the second largest
figure with 28 thousand.
Figure 24: Labor Force (Number of Employees)
in person (2011)
Japan China Korea Thailand Indonesia Malaysia Philippines Singapore
TV broadcasting 43,093 786,400 38,366 39,300 144,538 23,044 15,500 n/a
Film 29,902 270,000 29,569 50,130 60,006 n/a 260,000 n/a
Animation n/a n/a 4,646 1,525 n/a 2,874 10,900 n/a
Game 50,605 n/a 95,015 85,686 23,181 777 3,000 n/a
Music 16,411 n/a 78,181 55,022 53,127 2,215 n/a n/a
Total 140,011 1,056,400 245,777 231,663 280,852 28,910 289,400 n/a
Source: Statistics provided by member countries.
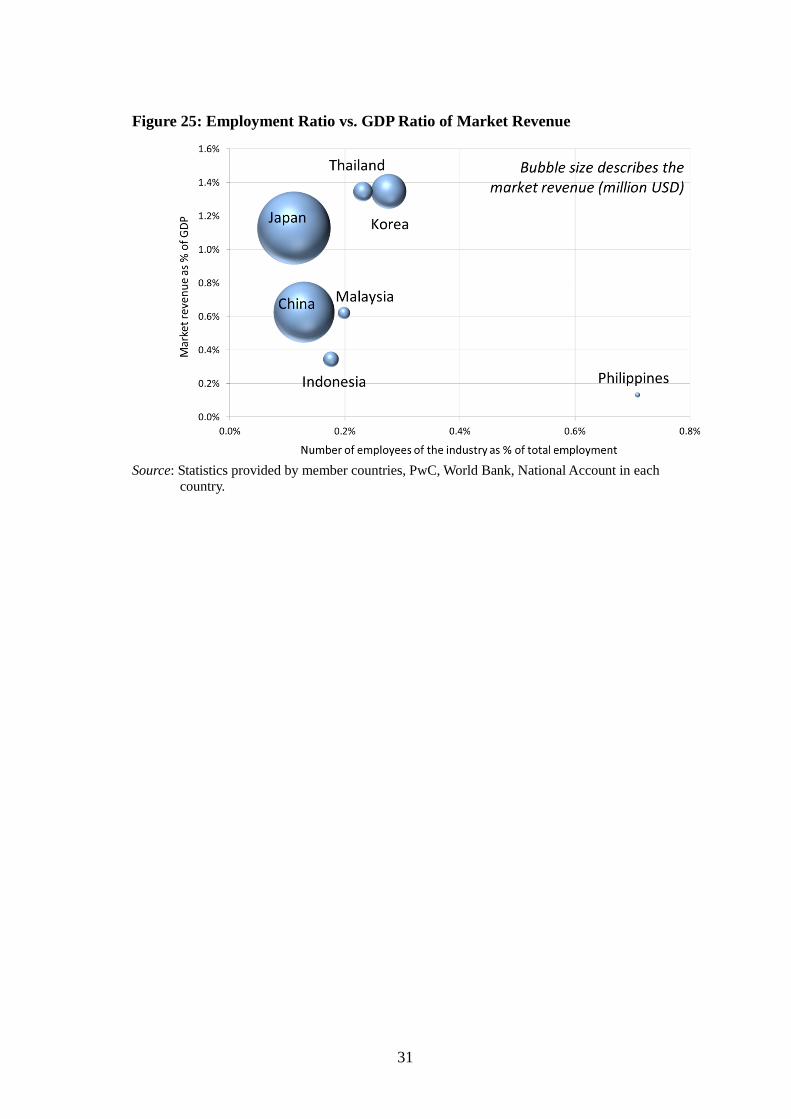
By combining the labor force data with the market revenue data (see previous
section), Figure 25 describes the relationship between the number of employees as a
percentage of the total employment (Employment ratio), and the market revenue as a
30
percentage of GDP (GDP ratio), in each country. Due to the availability of data,
Figure 25 covers only TV broadcasting and film industry; however it is the core of
the content industry in terms of market size, therefore it highlights most of the
characteristics of the content industry as a whole. The higher the GDP ratio (vertical
axis), and the lower the employment ratio (horizontal axis), indicates that the
industry is more productive. For example, Japan has a productive industry, where it
has a relatively high GDP ratio, with the lowest employment ratio among the all
countries. In other words, much of the labor force is utilized to generate adding
value to the economy. However, looking at the opposite way, the figure can be
interpreted as the employment absorption of the content industry, where the
difference in employment ratio indicates how much the industry can employ with the
same level of market size in its economy. In particular, Philippines has low GDP
ratio with high employment ratio compared to other countries, indicating that the
industry employs more labor force in relation to the GDP ratio. It can be said that,
due to its labor-intensive nature, the content industry can create large scale of
employment; therefore by creating a sustainable eco-system within the industry and
expanding its market revenue will contribute to the economy in the long term.
Also, it is worth noting that, Thailand and Korea are relatively close to each
other, hence it can be assumed that the role and structure of the content industry,
within their own economy in terms of revenue and employment, is similar.
31
Figure 25: Employment Ratio vs. GDP Ratio of Market Revenue
Source: Statistics provided by member countries, PwC, World Bank, National Account in each
country.

32
33
CHAPTER 4
Economic Contribution Analysis
In this chapter, economic contribution analysis is conducted for the audiovisual
content industry for the eight countries. Section 1 explains the fundamentals of the
economic contribution of the content industry. Section 2 and 3 explains the
methodology, and estimated results, respectively. Secondly, forecast of audiovisual
content industry market revenue is presented in 4.
1. The Fundamentals of Economic Contribution of the Content
Industry
From an economic perspective, the content industry, or in a broader definition
the creative industry, has been recognized as a fast growing industry contributing to
economic growth, employment and trade, etc. The typical way to estimate an
industry’s contribution to the national economy is to measure its value added.
Basically, the sum of the value added of all industries in a country equals its GDP,
therefore estimating the value added of an industry indicates the pure portion of, or
the contribution of, the industry within the whole economy.
Depending on the definitions used, several countries and regions have attempted
to estimate the economic contribution of the content and creative industry. For
example, according to UNCTAD (2010), in Europe, it was estimated that the creative
industry generated a turnover of 654 billion Euros in 2003, contributing to their
34
economies from 0.8% to 3.4% of GDP in each European country. Also, in the United
States, the creative industries accounted for 6.4% of economy, generating foreign
sales and exports in the order of $125.6 billion in 2007. Table 7 shows recent
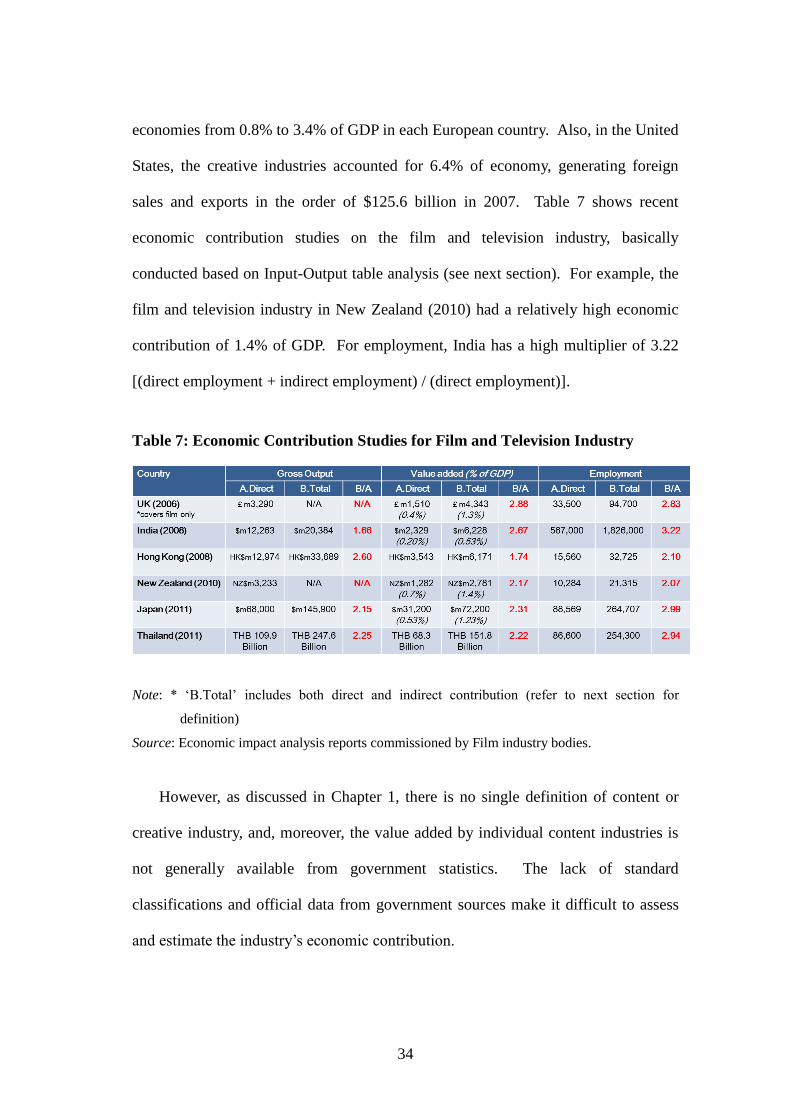
economic contribution studies on the film and television industry, basically
conducted based on Input-Output table analysis (see next section). For example, the
film and television industry in New Zealand (2010) had a relatively high economic
contribution of 1.4% of GDP. For employment, India has a high multiplier of 3.22
[(direct employment + indirect employment) / (direct employment)].
Table 7: Economic Contribution Studies for Film and Television Industry
Note: * ‘B.Total’ includes both direct and indirect contribution (refer to next section for
definition)
Source: Economic impact analysis reports commissioned by Film industry bodies.
However, as discussed in Chapter 1, there is no single definition of content or
creative industry, and, moreover, the value added by individual content industries is
not generally available from government statistics. The lack of standard
classifications and official data from government sources make it difficult to assess
and estimate the industry’s economic contribution.
35
Considering these circumstances and the availability of data sources, this report
aims to estimate the economic contribution of the audiovisual content industry for
each of the eight Asia/ASEAN countries, through a simplified model, and to
aggregate the figures to capture the impact as a region.
2. Methodology
This report estimates the economic contribution of the audiovisual content
industry (TV broadcasting, film, and animation) for 2011, assessing the indices
shown in Table 8, for the eight countries. In particular, it is a macro-economic
approach, to estimate the portion of the value added by the content industry in the
total economic activity.
Table 8: Indices of Economic Contribution Analysis
Index Definition
Gross output Total amount of production concerning value of goods and services
based on labor and capital within the industry. It basically represents
the total amount of revenue of all participants in the industry. Gross
output includes the intermediate inputs, which is the value of all
goods and services used as inputs to generate that output.
Value added Value that was added by activities within the industry, which
excludes the value of intermediate input from the Gross output. It
consists of production surplus, labor income and net indirect tax.
Value added is describes the gross domestic product (GDP)
contribution of an industry. It is the most commonly used measure
of the value generated by an industry or by the economy as a whole,
and can be used to compare with national GDP statistics.
A simple equation to express this is:
Value-Added = Gross Output - the cost of Intermediate Inputs
36
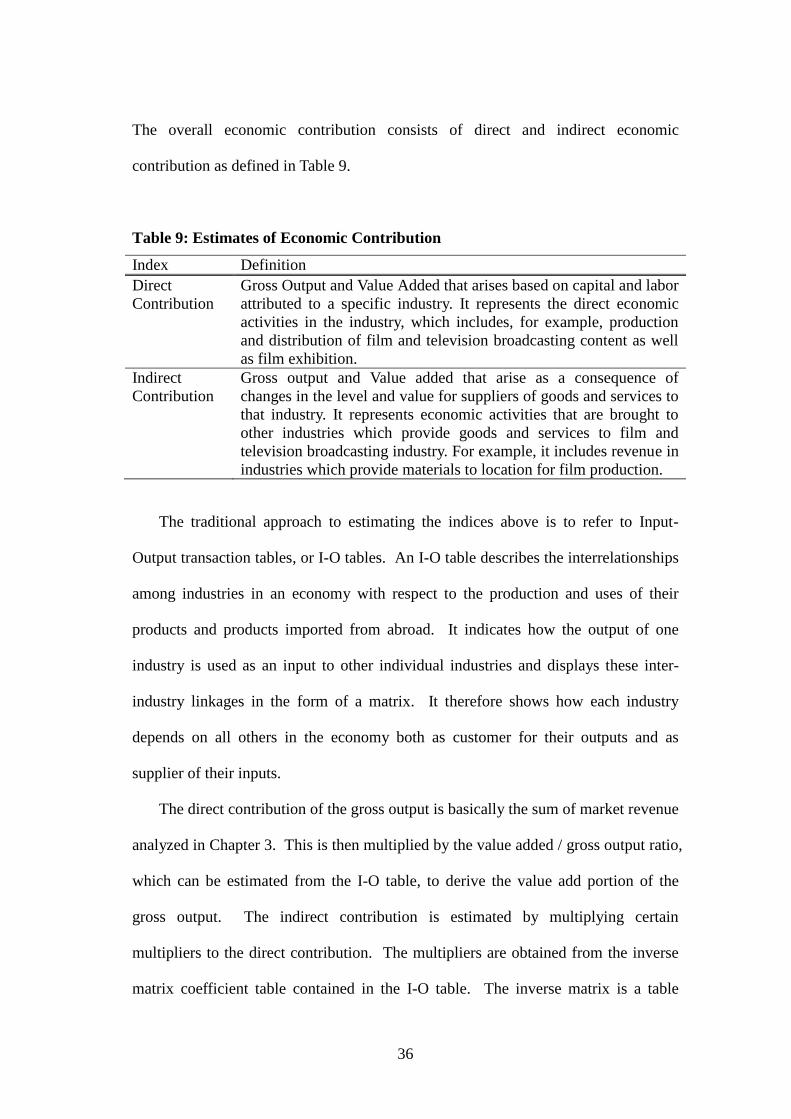
The overall economic contribution consists of direct and indirect economic
contribution as defined in Table 9.
Table 9: Estimates of Economic Contribution
Index Definition
Direct
Contribution
Gross Output and Value Added that arises based on capital and labor
attributed to a specific industry. It represents the direct economic
activities in the industry, which includes, for example, production
and distribution of film and television broadcasting content as well
as film exhibition.
Indirect
Contribution
Gross output and Value added that arise as a consequence of
changes in the level and value for suppliers of goods and services to
that industry. It represents economic activities that are brought to
other industries which provide goods and services to film and
television broadcasting industry. For example, it includes revenue in
industries which provide materials to location for film production.
The traditional approach to estimating the indices above is to refer to Input-
Output transaction tables, or I-O tables. An I-O table describes the interrelationships
among industries in an economy with respect to the production and uses of their
products and products imported from abroad. It indicates how the output of one
industry is used as an input to other individual industries and displays these inter-
industry linkages in the form of a matrix. It therefore shows how each industry
depends on all others in the economy both as customer for their outputs and as
supplier of their inputs.
The direct contribution of the gross output is basically the sum of market revenue
analyzed in Chapter 3. This is then multiplied by the value added / gross output ratio,
which can be estimated from the I-O table, to derive the value add portion of the
gross output. The indirect contribution is estimated by multiplying certain
multipliers to the direct contribution. The multipliers are obtained from the inverse
matrix coefficient table contained in the I-O table. The inverse matrix is a table
37
which describes the value of economic activity required to meet the demand, when
additional demand in a certain industry is assumed. The sum of the inverse matrix
coefficients (“Multiplier”) describes the scale of impact on own industry as well as
on other industries and is represented in figure of 1 or more. For example, when a
multiplier is “1.5”, “1” equals to the value attributed to its own industry and “0.5” to
other industries. In particular, high multipliers may be due to the requirements of the
industries for extensive outsourcing and to significant inter-industry dependence.
However, the industry category generally does not directly correspond to the content
industry, therefore through our analysis, the industry or sector that best describes the
audiovisual content industry from each countries I-O table is chosen.
Table 10 shows the parameters used in estimating the economic contribution for
each country. The parameters are basically quoted directly from the I-O tables,
although some figures are estimated from coefficients contained in the I-O tables.
Note that assumptions such as international trades among countries are not
considered.
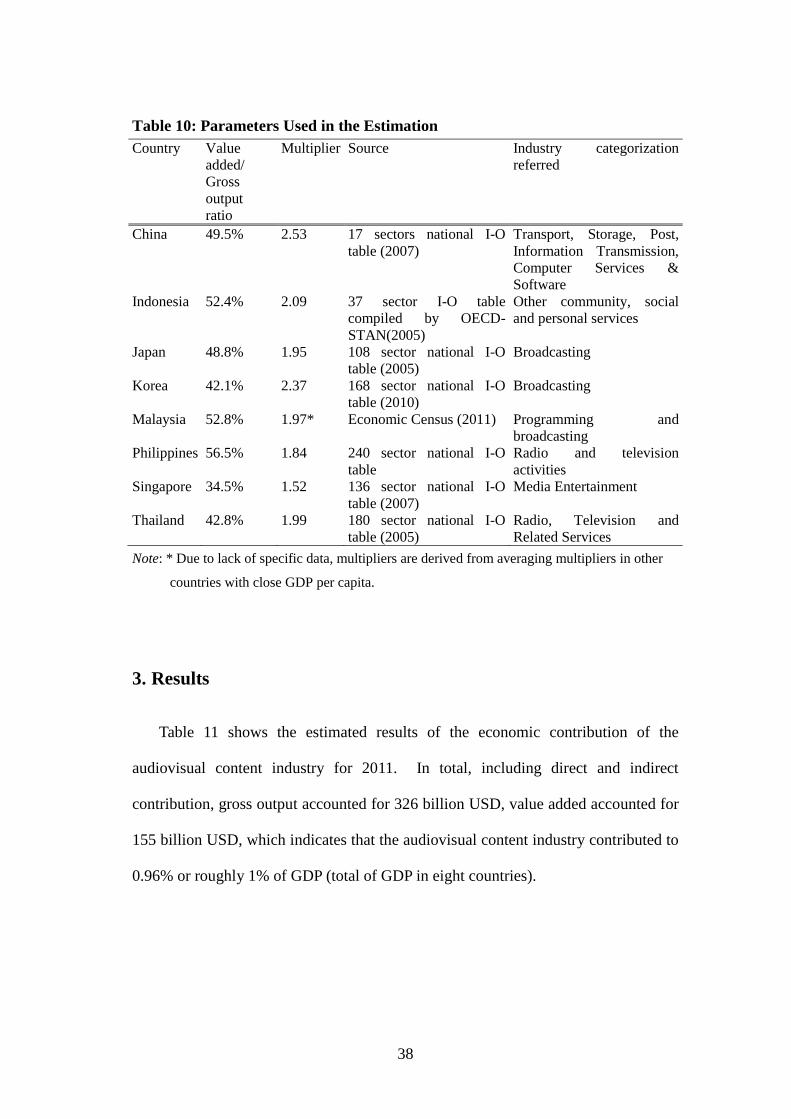
38
Table 10: Parameters Used in the Estimation
Country Value
added/
Gross
output
ratio
Multiplier Source Industry categorization
referred
China 49.5% 2.53 17 sectors national I-O
table (2007)
Transport, Storage, Post,
Information Transmission,
Computer Services &
Software
Indonesia 52.4% 2.09 37 sector I-O table
compiled by OECD-
STAN(2005)
Other community, social
and personal services
Japan 48.8% 1.95 108 sector national I-O
table (2005)
Broadcasting
Korea 42.1% 2.37 168 sector national I-O
table (2010)
Broadcasting
Malaysia 52.8% 1.97* Economic Census (2011) Programming and
broadcasting
Philippines 56.5% 1.84 240 sector national I-O
table
Radio and television
activities
Singapore 34.5% 1.52 136 sector national I-O
table (2007)
Media Entertainment
Thailand 42.8% 1.99 180 sector national I-O
table (2005)
Radio, Television and
Related Services
Note: * Due to lack of specific data, multipliers are derived from averaging multipliers in other
countries with close GDP per capita.
3. Results
Table 11 shows the estimated results of the economic contribution of the
audiovisual content industry for 2011. In total, including direct and indirect
contribution, gross output accounted for 326 billion USD, value added accounted for
155 billion USD, which indicates that the audiovisual content industry contributed to
0.96% or roughly 1% of GDP (total of GDP in eight countries).
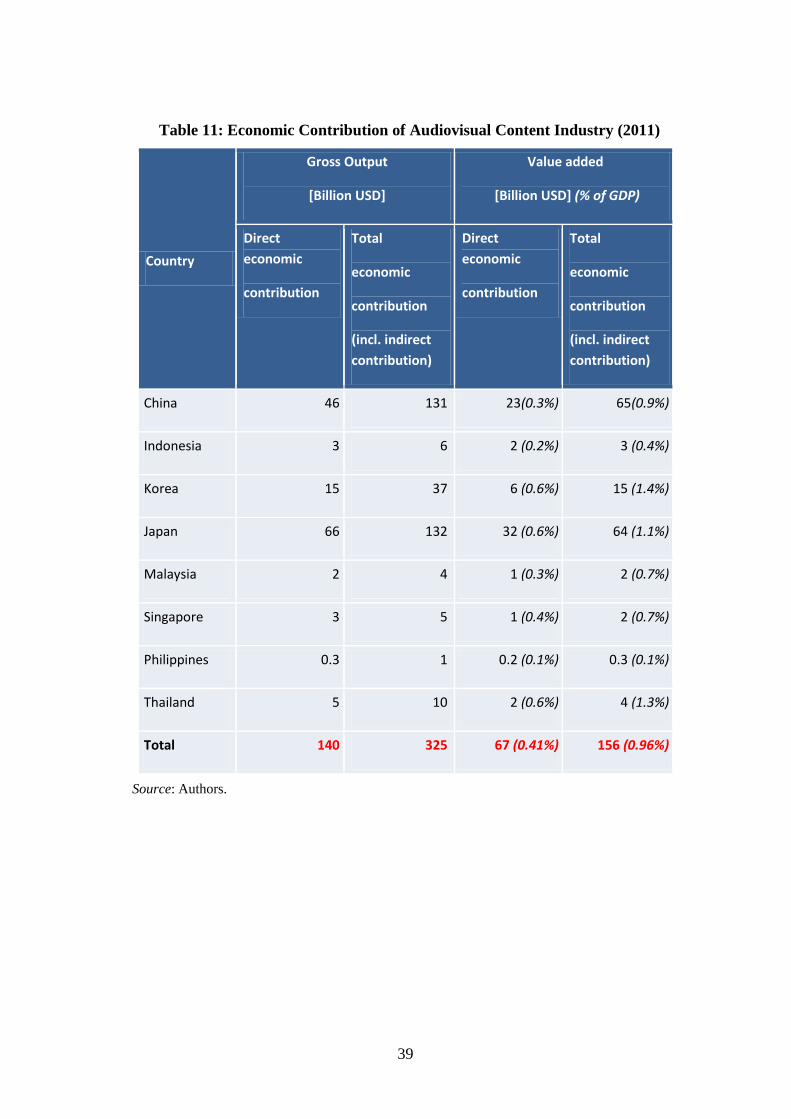
39
Table 11: Economic Contribution of Audiovisual Content Industry (2011)
Country
Gross Output
[Billion USD]
Value added
[Billion USD] (% of GDP)
Direct
economic
contribution
Total
economic
contribution
(incl. indirect
contribution)
Direct
economic
contribution
Total
economic
contribution
(incl. indirect
contribution)
China 46 131 23(0.3%) 65(0.9%)
Indonesia 3 6 2 (0.2%) 3 (0.4%)
Korea 15 37 6 (0.6%) 15 (1.4%)
Japan 66 132 32 (0.6%) 64 (1.1%)
Malaysia 2 4 1 (0.3%) 2 (0.7%)
Singapore 3 5 1 (0.4%) 2 (0.7%)
Philippines 0.3 1 0.2 (0.1%) 0.3 (0.1%)
Thailand 5 10 2 (0.6%) 4 (1.3%)
Total 140 325 67 (0.41%) 156 (0.96%)
Source: Authors.
40
4. Forecast of Audiovisual Content Industry
Although it is useful to estimate the current industry’s contribution derived in the
previous section, considering the high potential of the audiovisual content industry,
this report conducts a 5 year forecast of the industry for the eight countries, based on
certain scenarios.
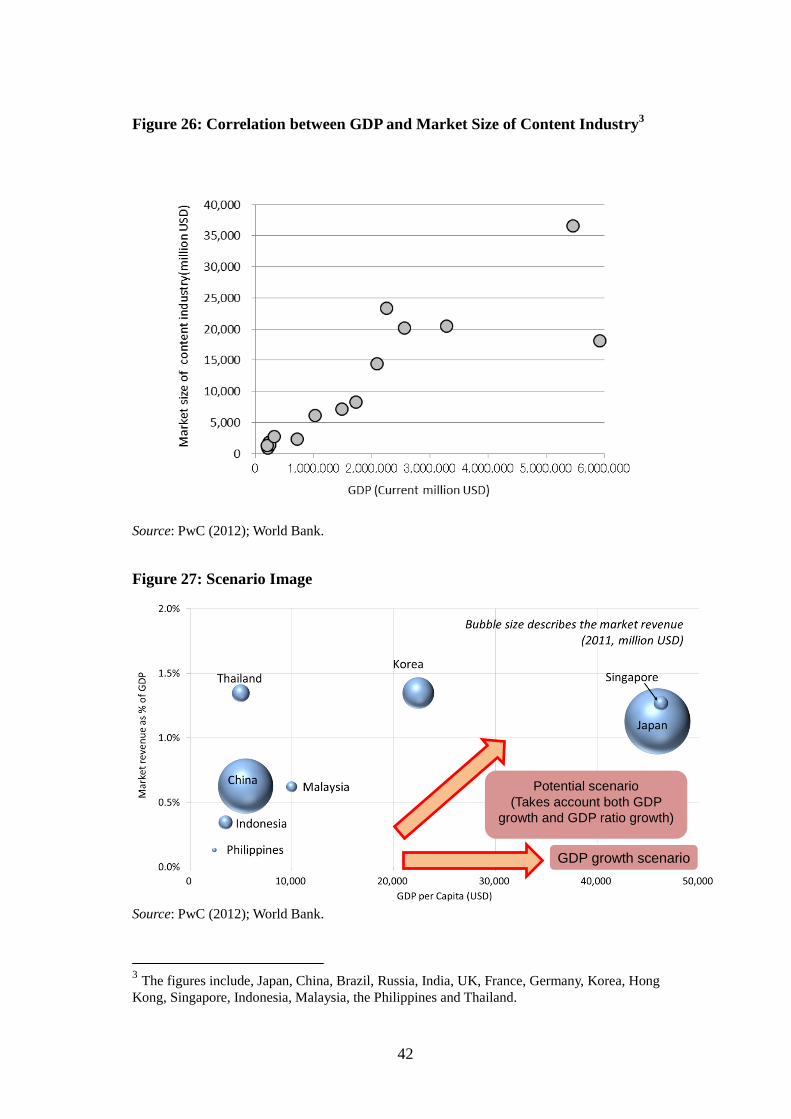
4.1. Scenarios
In this report, two scenarios, GDP growth scenario, and potential scenario is
considered. The details are described in Table 12, and the image is shown in Figure
27.
41
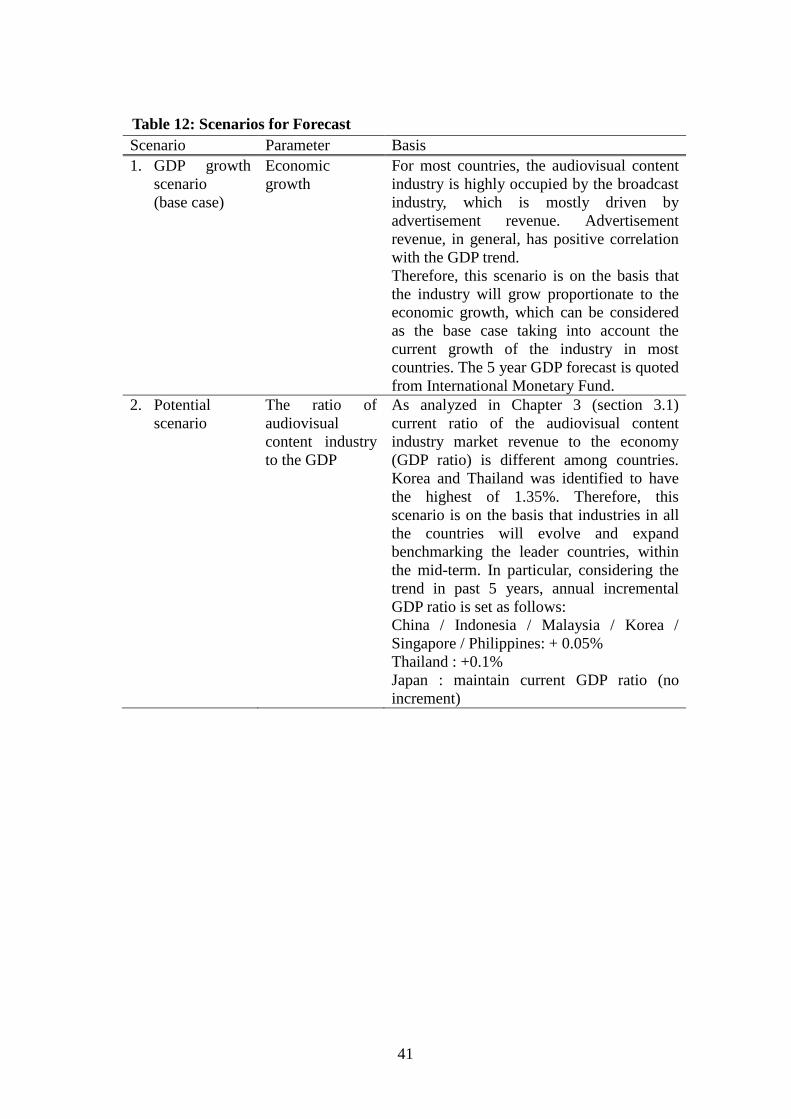
Table 12: Scenarios for Forecast
Scenario Parameter Basis
1. GDP growth
scenario
(base case)
Economic
growth
For most countries, the audiovisual content
industry is highly occupied by the broadcast
industry, which is mostly driven by
advertisement revenue. Advertisement
revenue, in general, has positive correlation
with the GDP trend.
Therefore, this scenario is on the basis that
the industry will grow proportionate to the
economic growth, which can be considered
as the base case taking into account the
current growth of the industry in most
countries. The 5 year GDP forecast is quoted
from International Monetary Fund.
2. Potential
scenario
The ratio of
audiovisual
content industry
to the GDP
As analyzed in Chapter 3 (section 3.1)
current ratio of the audiovisual content
industry market revenue to the economy
(GDP ratio) is different among countries.
Korea and Thailand was identified to have
the highest of 1.35%. Therefore, this
scenario is on the basis that industries in all
the countries will evolve and expand
benchmarking the leader countries, within
the mid-term. In particular, considering the
trend in past 5 years, annual incremental
GDP ratio is set as follows:
China / Indonesia / Malaysia / Korea /
Singapore / Philippines: + 0.05%
Thailand : +0.1%
Japan : maintain current GDP ratio (no
increment)
42
Figure 26: Correlation between GDP and Market Size of Content Industry3
Source: PwC (2012); World Bank.
Figure 27: Scenario Image
Source: PwC (2012); World Bank.
3 The figures include, Japan, China, Brazil, Russia, India, UK, France, Germany, Korea, Hong
Kong, Singapore, Indonesia, Malaysia, the Philippines and Thailand.
GDP growth scenario
Potential scenario (Takes account both GDP
growth and GDP ratio growth)
43
4.2. Estimated Forecast
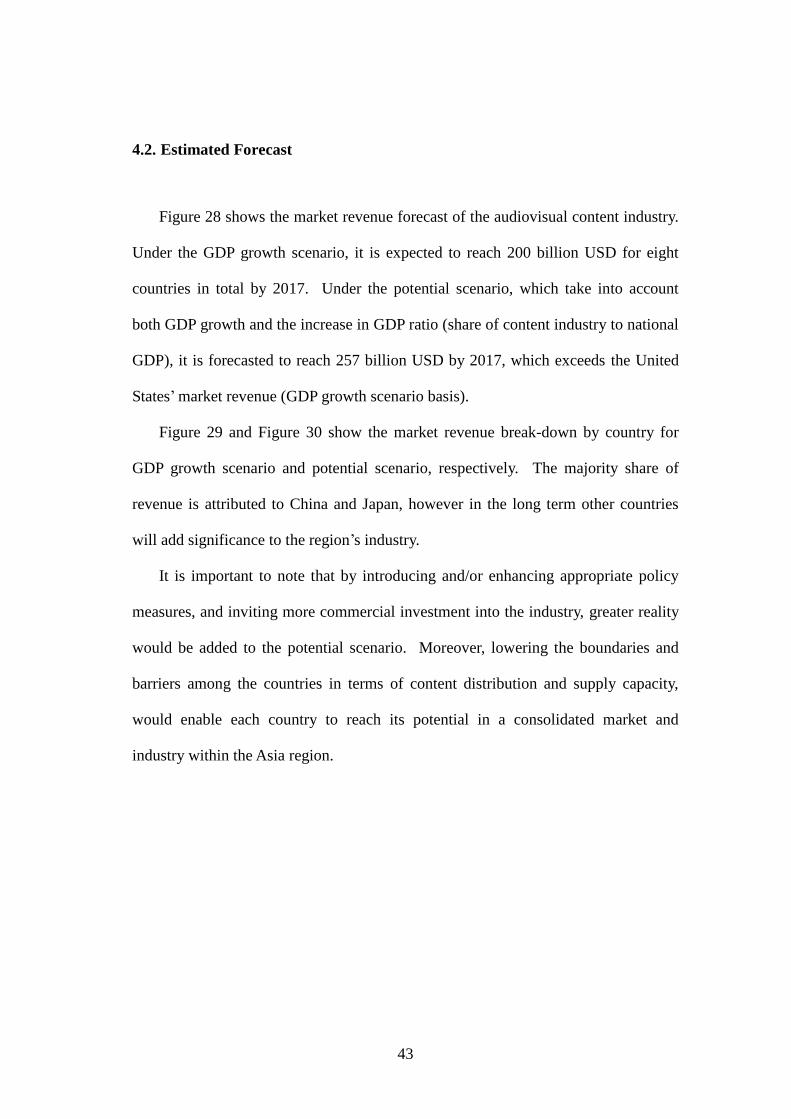
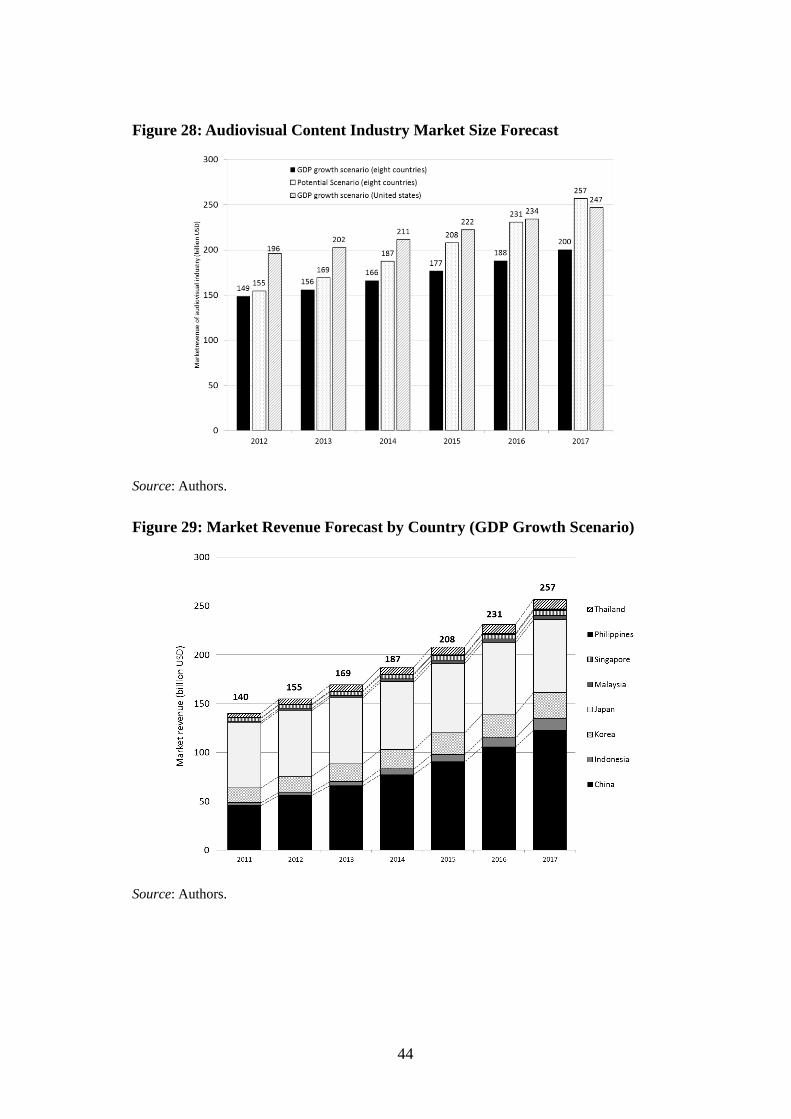
Figure 28 shows the market revenue forecast of the audiovisual content industry.
Under the GDP growth scenario, it is expected to reach 200 billion USD for eight
countries in total by 2017. Under the potential scenario, which take into account
both GDP growth and the increase in GDP ratio (share of content industry to national
GDP), it is forecasted to reach 257 billion USD by 2017, which exceeds the United
States’ market revenue (GDP growth scenario basis).
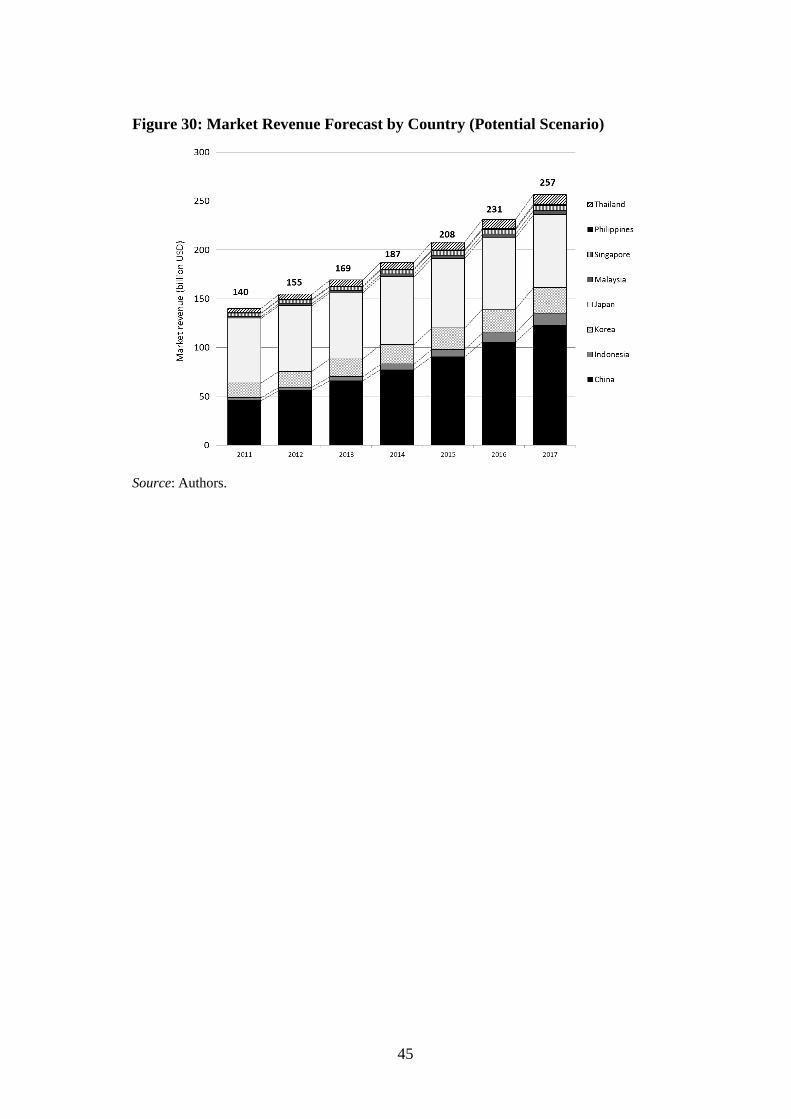
Figure 29 and Figure 30 show the market revenue break-down by country for
GDP growth scenario and potential scenario, respectively. The majority share of
revenue is attributed to China and Japan, however in the long term other countries
will add significance to the region’s industry.
It is important to note that by introducing and/or enhancing appropriate policy
measures, and inviting more commercial investment into the industry, greater reality
would be added to the potential scenario. Moreover, lowering the boundaries and
barriers among the countries in terms of content distribution and supply capacity,
would enable each country to reach its potential in a consolidated market and
industry within the Asia region.
44
Figure 28: Audiovisual Content Industry Market Size Forecast
Source: Authors.
Figure 29: Market Revenue Forecast by Country (GDP Growth Scenario)
Source: Authors.
45
Figure 30: Market Revenue Forecast by Country (Potential Scenario)
Source: Authors.

46
47
CHAPTER 5
Case Studies
In this chapter, case studies are presented to analyze the economic contribution
in terms of content exportation and ripple effects. Examples of cross-border success
cases from certain countries are presented on the basis of the availability of statistics
and related information.
1. Exportation of Contents
Exporting content and creative products/services can contribute to the economy
in terms of domestic industry development and its sustainability. Export of contents
is defined as selling products in each sector, such as TV broadcast programs, films,
animation, games and music overseas. This includes revenues when TV programs are
traded, or games and CDs/DVDs are shipped to other countries. There are various
ways of exporting contents. However, this report does not focus on its definition in
details, but rather overviews the current export trend of content products originating
in the Asian region.
According to UNCTAD report (2010), during 2002-2008, trade in goods and
services from the creative industries grew on CAGR of 14%. World exports of
audiovisual content services, which amounted to 13.7 billion USD in 2002, reached
26.4 billion USD in 2008, much through trade in the form of rights transactions as
the means for buying and selling creative content. In one of the highest exporting
48
countries, United Kingdom, in 2007, the creative industries accounted for 6.2 percent
of the economy, measured as value added, accounting of 4.5 percent of total British
exports.
However, according to UNCTAD (2010), the exports of creative industry are
dominated by developed countries. For audiovisual content the ratio is 89.5%, which
is the highest among the creative product/service categories defined by the UNCTAD.
In developing a pan-Asian content industry perspective, import/export of content is
one of the key accelerating factors for the region. In this section, case studies of the
export of contents originating in major exporting Asian countries are presented.
1.1. Content Export from China
With support from the Chinese government, such as promoting private
companies to participate in overseas exhibitions, Chinese industry has had a variety
of networks for exports established for around 20 years, for exporting TV programs
such as news, drama, variety, documentaries and others, as well as films, covering
over 100 countries or areas in five continents. Private companies like Beijing Star,
Jiangtoon Animation, Shan Mao Cartoon, Beauty Media, Zhejiang Huace Media, and
Huayi Brothers Media Group offer export services.
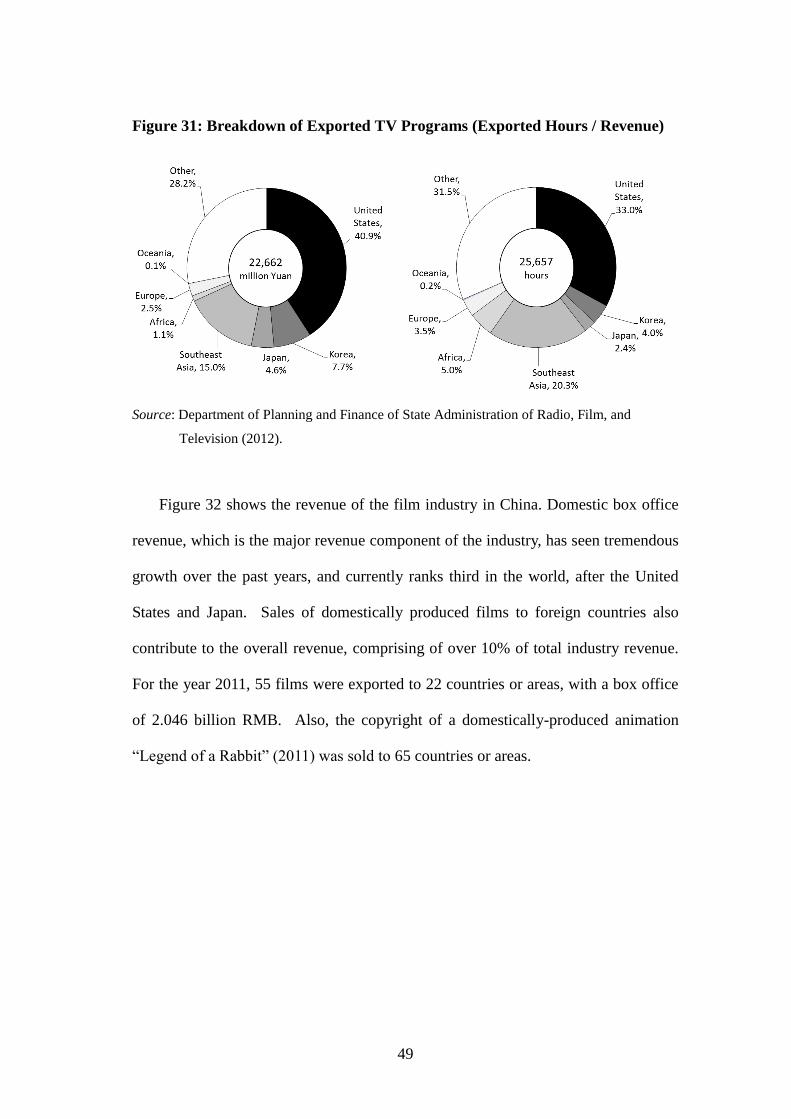
Figure 31 shows the statistics of export of TV programs originating in China for
the year 2011. The left figure shows the breakdown of destination countries and
regions for exported hours, which in total, add up to 25,567 hours annually. The right
figure shows the breakdown of export revenues, which is 22.7 billion RMB in total.
The most important export destination, in terms of hours as well as revenue, is the
United States, followed by Korea and Japan.
49
Figure 31: Breakdown of Exported TV Programs (Exported Hours / Revenue)
Source: Department of Planning and Finance of State Administration of Radio, Film, and
Television (2012).
Figure 32 shows the revenue of the film industry in China. Domestic box office
revenue, which is the major revenue component of the industry, has seen tremendous
growth over the past years, and currently ranks third in the world, after the United
States and Japan. Sales of domestically produced films to foreign countries also
contribute to the overall revenue, comprising of over 10% of total industry revenue.
For the year 2011, 55 films were exported to 22 countries or areas, with a box office
of 2.046 billion RMB. Also, the copyright of a domestically-produced animation
“Legend of a Rabbit” (2011) was sold to 65 countries or areas.
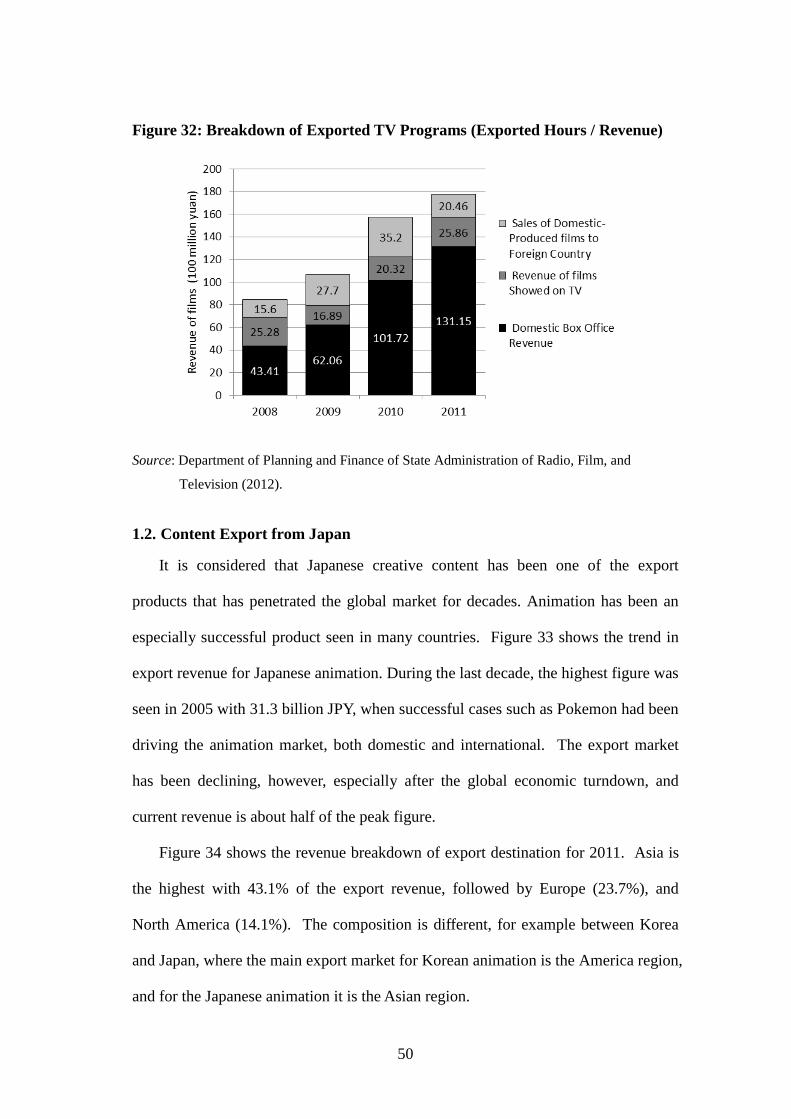
50
Figure 32: Breakdown of Exported TV Programs (Exported Hours / Revenue)
Source: Department of Planning and Finance of State Administration of Radio, Film, and
Television (2012).
1.2. Content Export from Japan
It is considered that Japanese creative content has been one of the export
products that has penetrated the global market for decades. Animation has been an
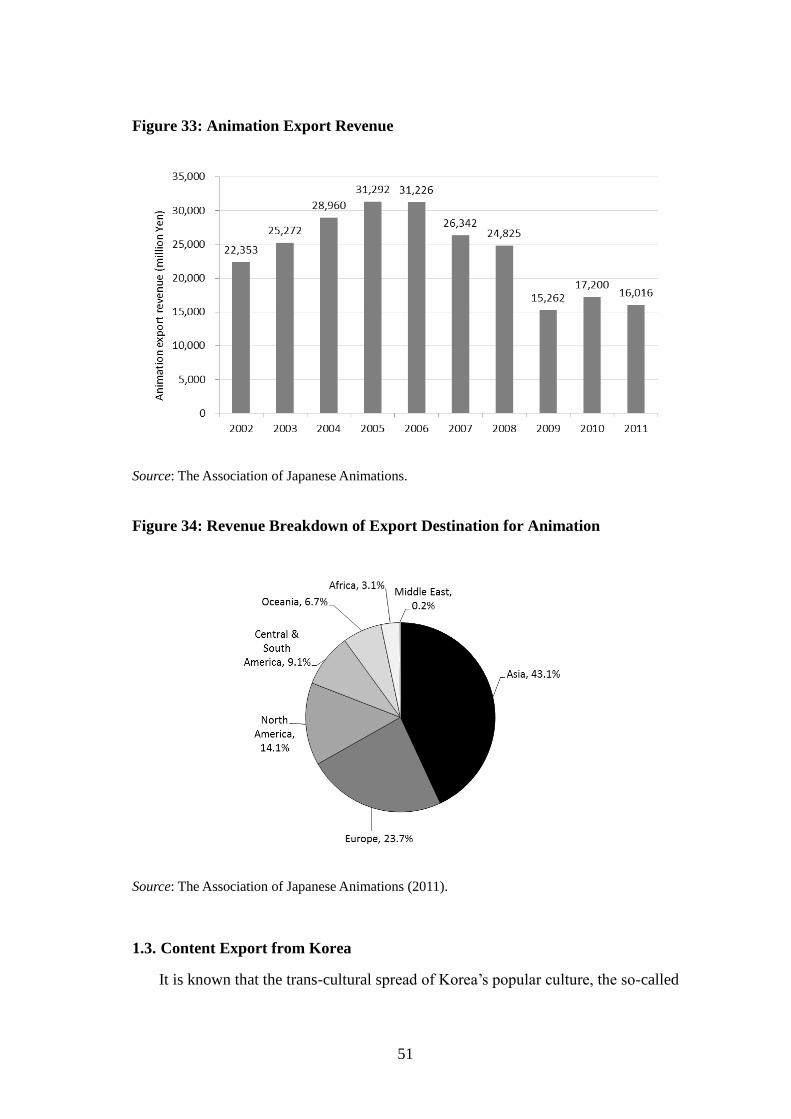
especially successful product seen in many countries. Figure 33 shows the trend in
export revenue for Japanese animation. During the last decade, the highest figure was
seen in 2005 with 31.3 billion JPY, when successful cases such as Pokemon had been
driving the animation market, both domestic and international. The export market
has been declining, however, especially after the global economic turndown, and
current revenue is about half of the peak figure.
Figure 34 shows the revenue breakdown of export destination for 2011. Asia is
the highest with 43.1% of the export revenue, followed by Europe (23.7%), and
North America (14.1%). The composition is different, for example between Korea
and Japan, where the main export market for Korean animation is the America region,
and for the Japanese animation it is the Asian region.
51
Figure 33: Animation Export Revenue
Source: The Association of Japanese Animations.
Figure 34: Revenue Breakdown of Export Destination for Animation
Source: The Association of Japanese Animations (2011).
1.3. Content Export from Korea
It is known that the trans-cultural spread of Korea’s popular culture, the so-called
52
Hallyu or the “Korean wave (K-wave)”, began gathering momentum in the mid-
1990s. Since then, Korean content has been appreciated for its simultaneous
universality and Korean culture. In return, the expansion of these markets invigorated
Korea’s cultural industries to thrive and to systematize a foundation for further
development. The Hallyu has flowed into other industry sectors such as food,
fashion and computer gaming, drawing an increased base of tourists to Korea, and
this is also one of the aspects of the economic ripple effect that is discussed in the
next section. While the Hallyu phenomenon is broader than films and TV, these
media play a very important role within Hallyu due to the emotional contribution
such media can have. According to Oxford Economics, the total film and television
exports from Korea were 0.4% of total service exports in 2011, and approximately
equivalent to exports by the insurance and computer and information service sectors.
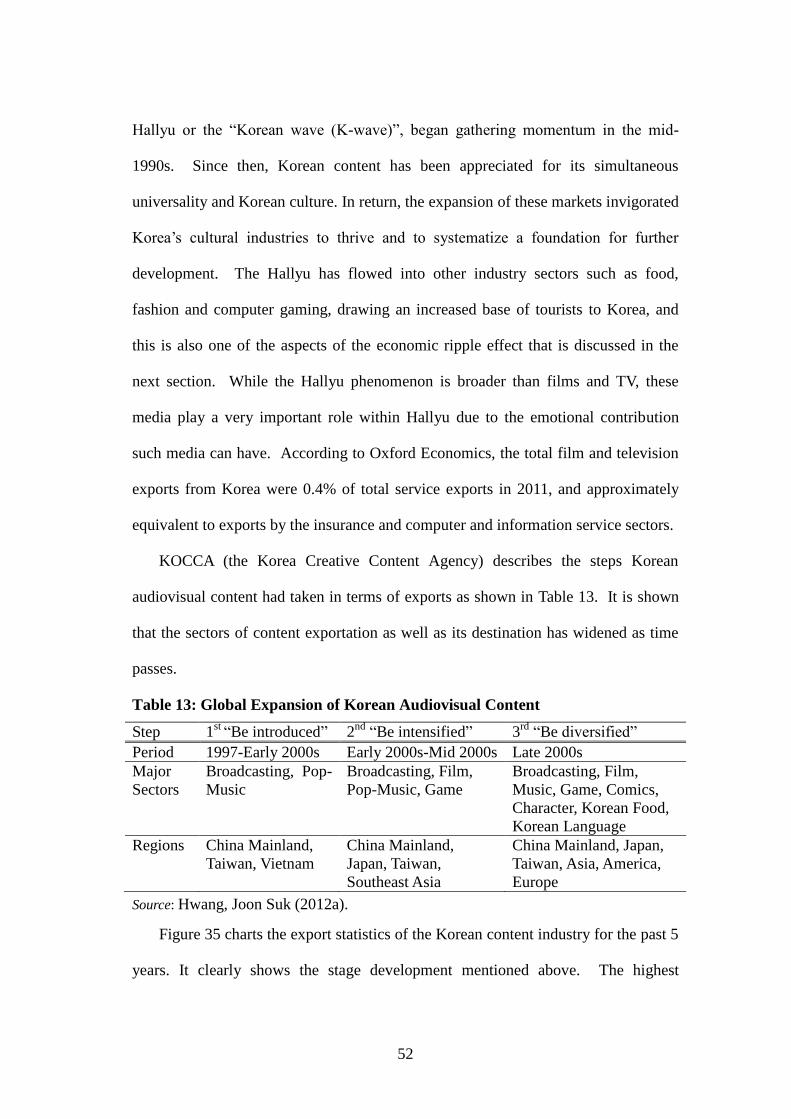
KOCCA (the Korea Creative Content Agency) describes the steps Korean
audiovisual content had taken in terms of exports as shown in Table 13. It is shown
that the sectors of content exportation as well as its destination has widened as time
passes.
Table 13: Global Expansion of Korean Audiovisual Content
Step 1st
“Be introduced” 2nd
“Be intensified” 3rd
“Be diversified”
Period 1997-Early 2000s Early 2000s-Mid 2000s Late 2000s
Major
Sectors
Broadcasting, Pop-
Music
Broadcasting, Film,
Pop-Music, Game
Broadcasting, Film,
Music, Game, Comics,
Character, Korean Food,
Korean Language
Regions China Mainland,
Taiwan, Vietnam
China Mainland,
Japan, Taiwan,
Southeast Asia
China Mainland, Japan,
Taiwan, Asia, America,
Europe
Source: Hwang, Joon Suk (2012a).
Figure 35 charts the export statistics of the Korean content industry for the past 5
years. It clearly shows the stage development mentioned above. The highest
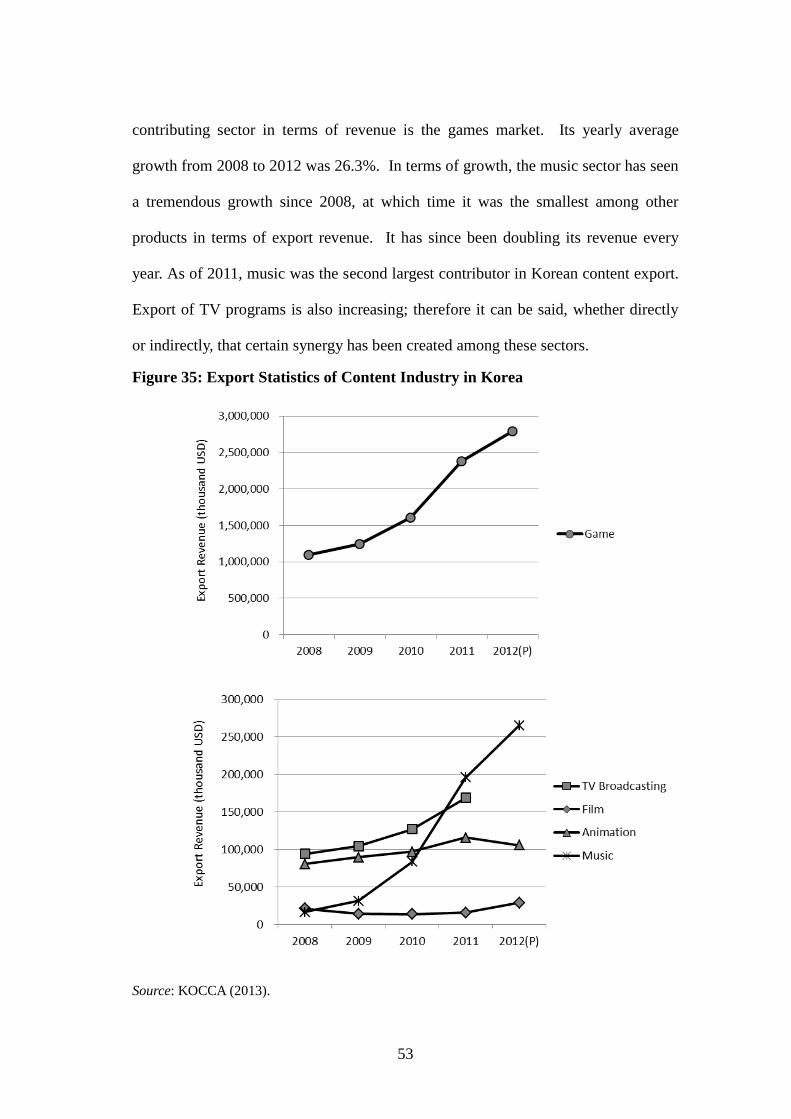
53
contributing sector in terms of revenue is the games market. Its yearly average
growth from 2008 to 2012 was 26.3%. In terms of growth, the music sector has seen
a tremendous growth since 2008, at which time it was the smallest among other
products in terms of export revenue. It has since been doubling its revenue every
year. As of 2011, music was the second largest contributor in Korean content export.
Export of TV programs is also increasing; therefore it can be said, whether directly
or indirectly, that certain synergy has been created among these sectors.
Figure 35: Export Statistics of Content Industry in Korea
Source: KOCCA (2013).
54
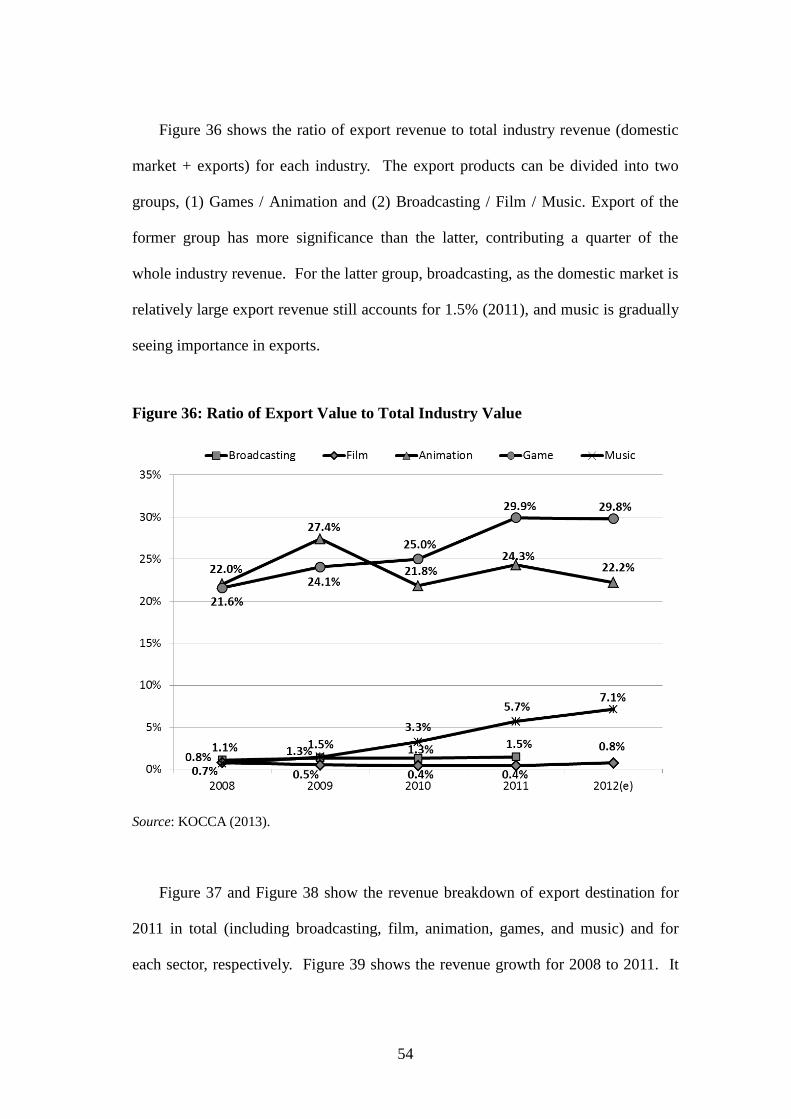
Figure 36 shows the ratio of export revenue to total industry revenue (domestic
market + exports) for each industry. The export products can be divided into two
groups, (1) Games / Animation and (2) Broadcasting / Film / Music. Export of the
former group has more significance than the latter, contributing a quarter of the
whole industry revenue. For the latter group, broadcasting, as the domestic market is
relatively large export revenue still accounts for 1.5% (2011), and music is gradually
seeing importance in exports.
Figure 36: Ratio of Export Value to Total Industry Value
Source: KOCCA (2013).
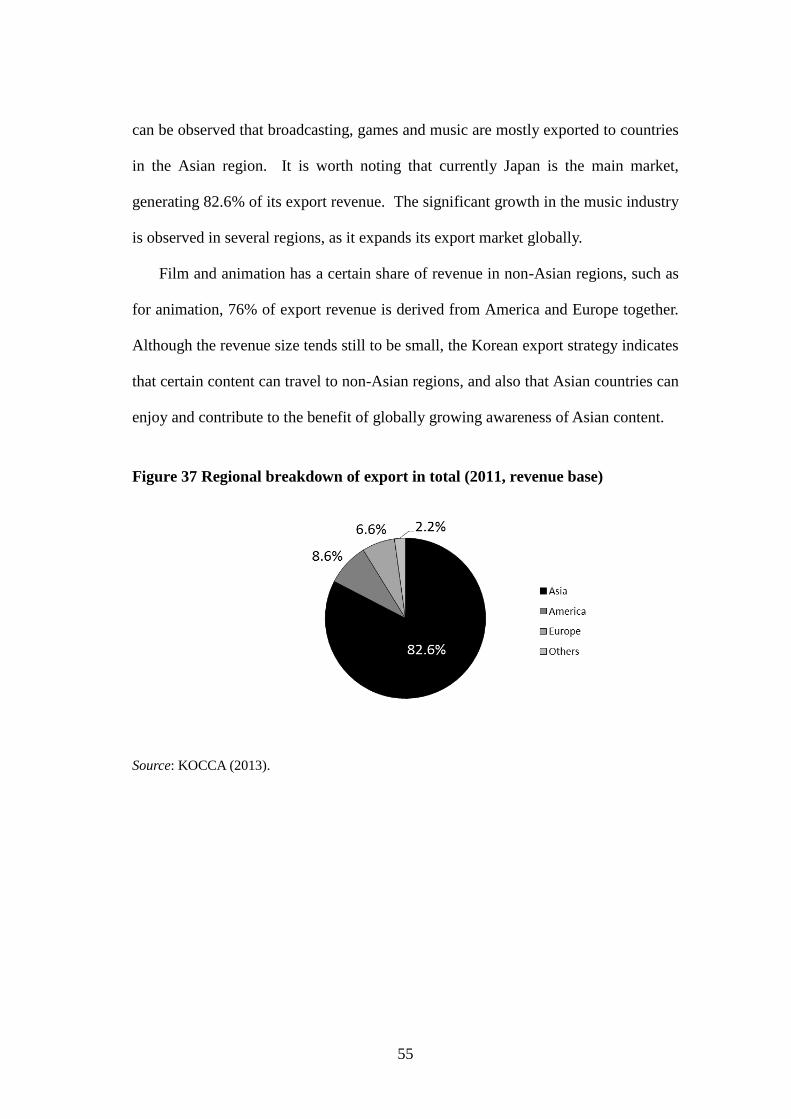
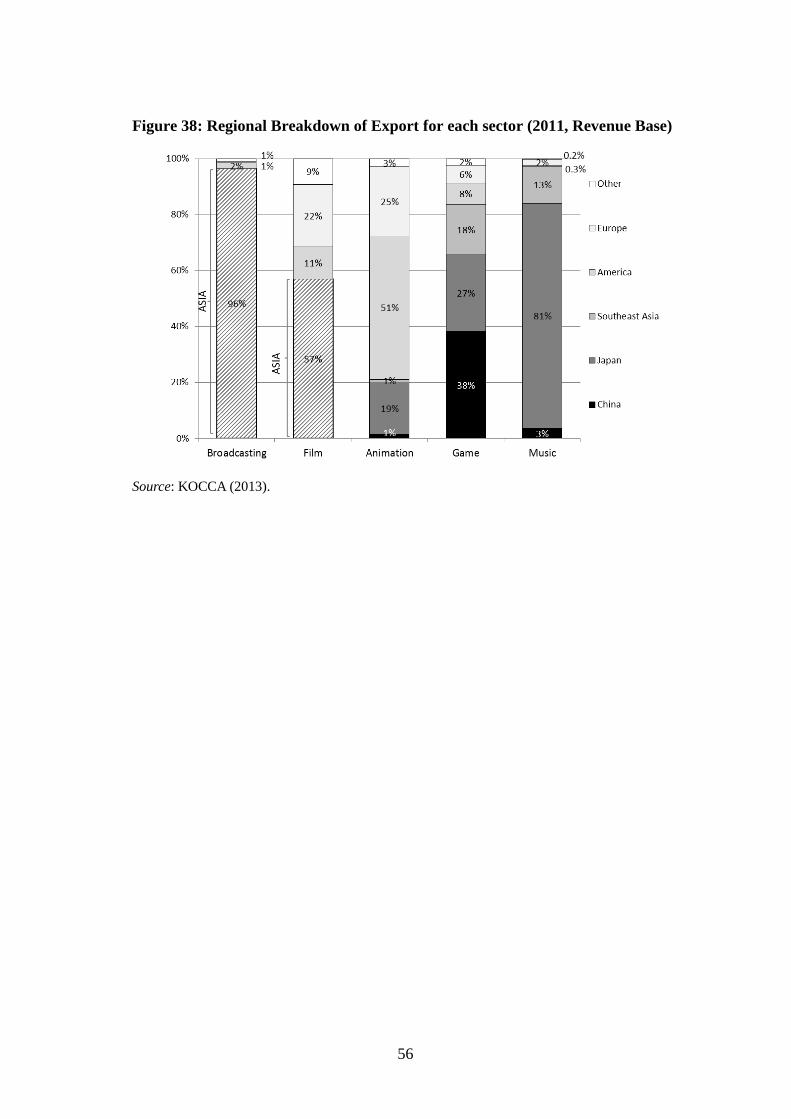
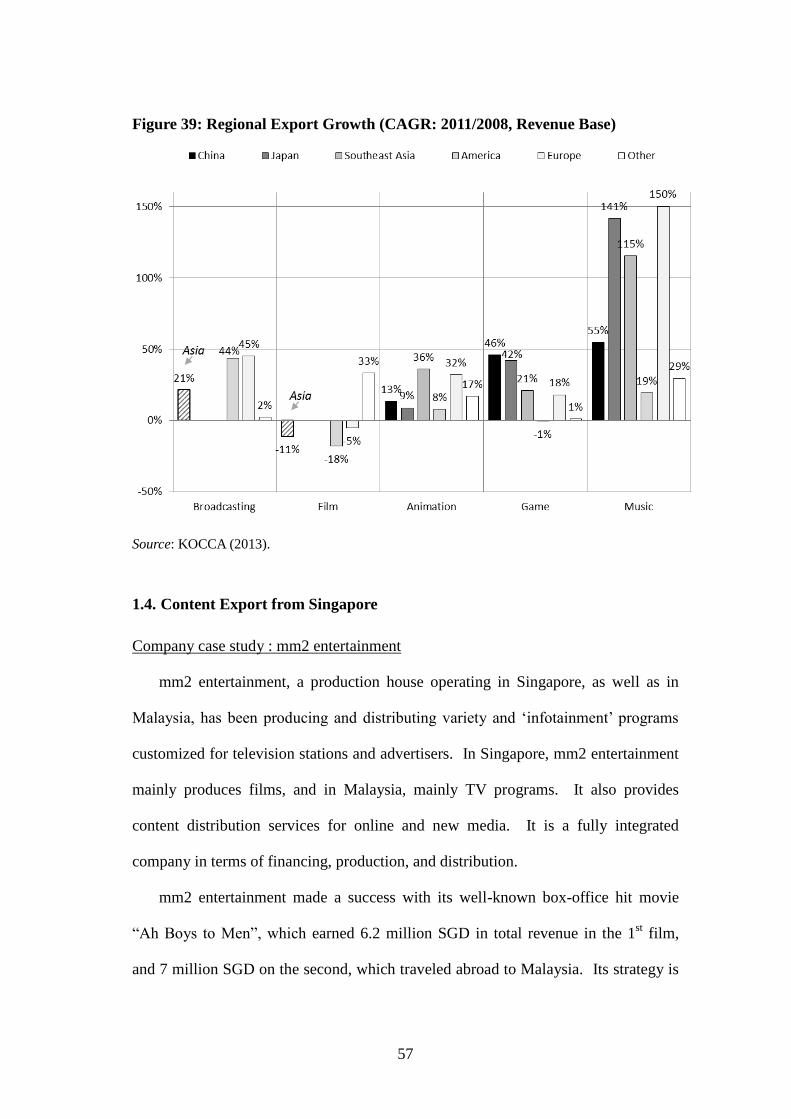
Figure 37 and Figure 38 show the revenue breakdown of export destination for
2011 in total (including broadcasting, film, animation, games, and music) and for
each sector, respectively. Figure 39 shows the revenue growth for 2008 to 2011. It
55
can be observed that broadcasting, games and music are mostly exported to countries
in the Asian region. It is worth noting that currently Japan is the main market,
generating 82.6% of its export revenue. The significant growth in the music industry
is observed in several regions, as it expands its export market globally.
Film and animation has a certain share of revenue in non-Asian regions, such as
for animation, 76% of export revenue is derived from America and Europe together.
Although the revenue size tends still to be small, the Korean export strategy indicates
that certain content can travel to non-Asian regions, and also that Asian countries can
enjoy and contribute to the benefit of globally growing awareness of Asian content.
Figure 37 Regional breakdown of export in total (2011, revenue base)
Source: KOCCA (2013).
56
Figure 38: Regional Breakdown of Export for each sector (2011, Revenue Base)
Source: KOCCA (2013).
57
Figure 39: Regional Export Growth (CAGR: 2011/2008, Revenue Base)
Source: KOCCA (2013).
1.4. Content Export from Singapore
Company case study : mm2 entertainment
mm2 entertainment, a production house operating in Singapore, as well as in
Malaysia, has been producing and distributing variety and ‘infotainment’ programs
customized for television stations and advertisers. In Singapore, mm2 entertainment
mainly produces films, and in Malaysia, mainly TV programs. It also provides
content distribution services for online and new media. It is a fully integrated
company in terms of financing, production, and distribution.
mm2 entertainment made a success with its well-known box-office hit movie
“Ah Boys to Men”, which earned 6.2 million SGD in total revenue in the 1st film,
and 7 million SGD on the second, which traveled abroad to Malaysia. Its strategy is
58
to look at Singapore and Malaysia as a single market, because the two countries
share a similar culture and the audiences tend to accept the same content. mm2
entertainment produces and distributes in both markets, while supplying products to
other countries such as Hong Kong. Its view of the market trend is that it has been
seeing in both Singapore and Malaysia a tendency for people to go and see the
movies, and pay for the content. Therefore piracy is not such a big issue for the
company as it was few years ago.
mm2 entertainment had stated that the cost of production in Singapore on the
contrary of the low budget, therefore it seeks to invite strategic partners in terms of
investment, distribution, marketing and promotion. A Malaysian production
company- Grand Brilliance - also invested in Ah Boys To Men.
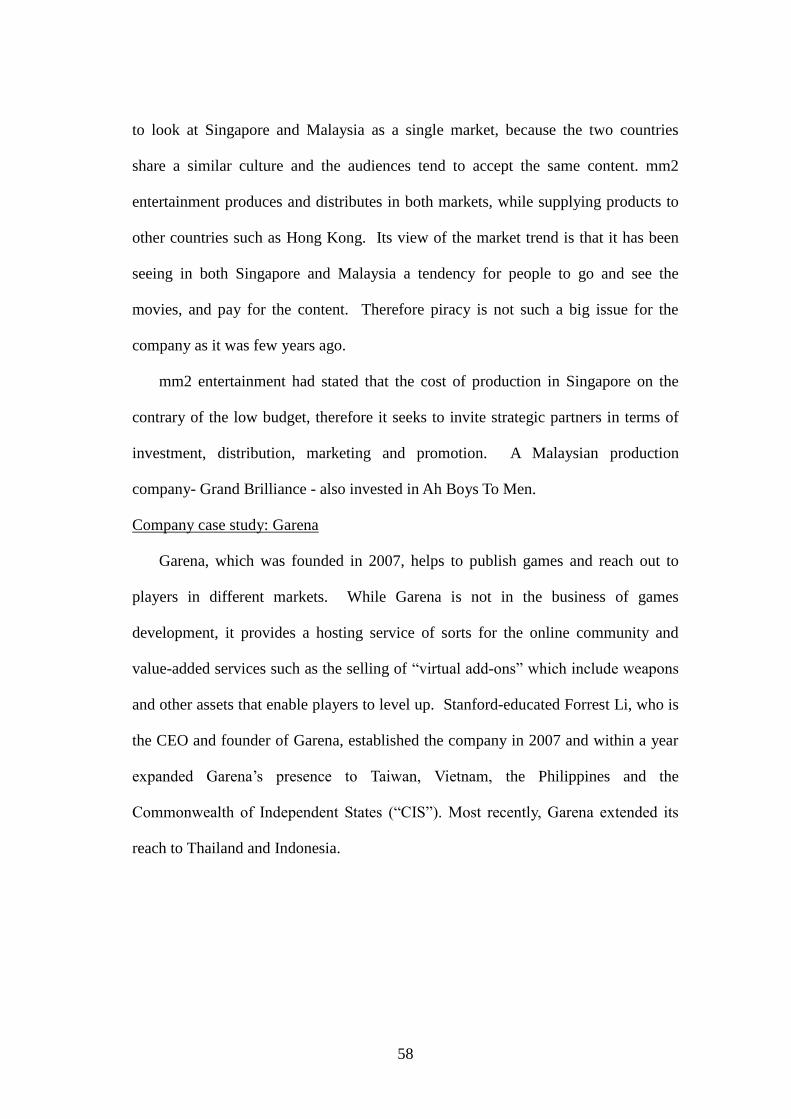
Company case study: Garena
Garena, which was founded in 2007, helps to publish games and reach out to
players in different markets. While Garena is not in the business of games
development, it provides a hosting service of sorts for the online community and
value-added services such as the selling of “virtual add-ons” which include weapons
and other assets that enable players to level up. Stanford-educated Forrest Li, who is
the CEO and founder of Garena, established the company in 2007 and within a year
expanded Garena’s presence to Taiwan, Vietnam, the Philippines and the
Commonwealth of Independent States (“CIS”). Most recently, Garena extended its
reach to Thailand and Indonesia.
59
Figure 40: Image of Garena platform
Source: Garena (2013).
Benefiting from wide experience, the founders studied the rapid evolution of
online games and were inspired to take the online gaming experience to a higher
level. Garena launched its latest flagship online game platform, Garena+, in 2010.
This is a social platform designated for online gamers to meet, chat and play games
with each other. On Garena+, gamers are able to effortlessly discover and play

60
games while connecting with other gamers. Garena+ provides gamers with the
ability to track gameplay, view the achievement of their buddies through a
centralized buddy list, connect with clans and groups of similar interests on games,
and voice chat with many gamers simultaneously through public or private channels.
Since its launch, the monthly active users on Garena+ had surpassed the 1 million
mark.
In addition to providing an e-sports playground for popular classics such as DotA
and Age of Empire, Garena also introduced the latest premium online games on
Garena+, including the award-winning League of Legends and other premium game
titles, such as the first-person shooting game Black Shot and real-time strategy game
Heroes of Newerth.
Today, Garena publishes and operates online games primarily in Southeast Asia
and Taiwan, and has achieved more than 2,000% revenue growth over the period
from 2009 to 2011. Ranked 15th
in the Deloitte Technology Fast 500 (Asia-Pacific)
2012 for being one of the fastest–growing technology firms in the Asia Pacific region
(and 1st in Southeast Asia). Garena made history by being the first Singapore
interactive digital media company to enter Deloitte’s Top 20 ranking for Asia.
Today, it has over 60 million registered users playing on its gaming platform and
is able to support up to 675,000 concurrent users. The company has grown from 10
employees just 5 years ago to over 400 employees, with half of the technical staff in
Singapore, and the rest scattered over 9 cities in Southeast Asia. Garena makes
money from selling subscriptions, value-added services and virtual currency, and its
revenue has grown 3 to 4 times since it was incorporated. One of Garena’s main
game offers, League of Legends, is distributed in Southeast Asia and Taiwan. In
early 2013, Garena has reached a million players for League of Legends in Taiwan.
61
While there are many angles to Garena’s success, the key success factors would
include the items below.
I. A radical change in business model. Previously the gaming industry
was dominated by the “console-and-box” model whereby consumers
would have to spend $50 or more for a disc copy of a game. Garena
has joined the industry in moving to the “free-to-download model”
and built its revenues through the sale of virtual goods.
II. A focus on its role within the value chain. While developers focused
on the development of the gaming content, Garena seeks to bring
about a better users ‘experience’ in all other regards such as software
upgrades, transaction of virtual goods, etc…
III. Investment in the social networks of gamers. Garena believes that the
social interaction amongst its gamers adds value and ‘stickiness’ to
its platforms. Hence it constantly upgrades its social interactivity
elements such as a proprietary instant messaging service and other
community or societal building tools.
Garena is a fundee of the Interactive Digital Media Programme Office (www.idm.sg).
2. Ripple Effects of Content Goods & Products
2.1. Categorizing the Ripple Effects
One aspect of the economic ripple effects generated by the content industry is the
value added in different products, such as product planning and production within
non-content industries. One typical example would be character merchandizing from
a popular animated cartoon.
Audiovisual content, or screen-based content (including TV) is clearly a medium
that has a huge impact on consumption. The economic impact of audiovisual content
62
can be consequently be much bigger than the estimated values given in previous
pages.
Table 14: Categorization and Example of Ripple Effects
Category Description
Character, Design Product planning / marketing for apparel, toys, or general
merchandizing through reconfiguration of content format and
copyright management of programs and films
Fashion Product planning / marketing for clothing and accessories after
reconfiguration of content format and copyright management of
programs and films. Cosmetics - celebrity marketing through contents
(especially in TV drama) is one example.
Product Promoting products through a non-traditional advertising technique
(Product Placement Effect)
Culture Product planning / marketing in related service market by expressing
lifestyles of the film characters [Examples: “dance boom”, “soccer
boom”]
Food Attracting food –experience
Tourism Consumption made by filming crew/ staff and tourists visiting film
locations (lodging, meals, souvenir purchase and so on)
Transportation Consumption made by filming crew/staff and tourists visiting filming
locations on transportation
Other fields Increase in recognition (rise in popularity) of the filming location, etc.
2.2. “Pleasant Goat and Big Big Wolf” (China)
One success story of content export from China, is the “Happy Lamb and Grey
Wolf” or “Pleasant Goat and Big Big Wolf”, a Chinese animated television series
created by Huang Weiming, Lin Yuting and Luo Yinggeng, and produced by Creative
Power Entertaining. The show was aired in 52 countries in Asia and the Middle East
region including, India and Singapore. In January 2009, the first Happy Lamb and
Grey Wolf film - The Super Snail Adventure - was launched in China. It has broken
the domestic box office record for a Chinese animated film, earning 30 million RMB
during its opening weekend, and foreign versions also added to the success story.
The popular “Pleasant Goat and Big Big Wolf” has run to more than 800
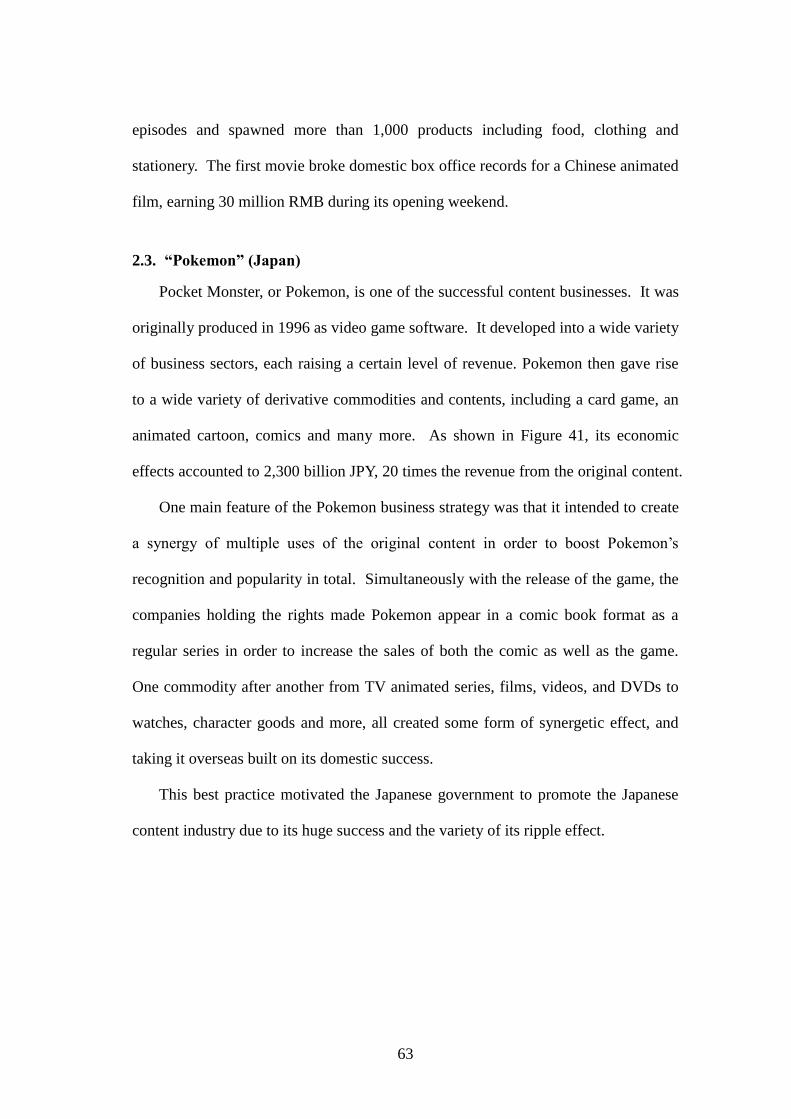
63
episodes and spawned more than 1,000 products including food, clothing and
stationery. The first movie broke domestic box office records for a Chinese animated
film, earning 30 million RMB during its opening weekend.
2.3. “Pokemon” (Japan)
Pocket Monster, or Pokemon, is one of the successful content businesses. It was
originally produced in 1996 as video game software. It developed into a wide variety
of business sectors, each raising a certain level of revenue. Pokemon then gave rise
to a wide variety of derivative commodities and contents, including a card game, an
animated cartoon, comics and many more. As shown in Figure 41, its economic
effects accounted to 2,300 billion JPY, 20 times the revenue from the original content.
One main feature of the Pokemon business strategy was that it intended to create
a synergy of multiple uses of the original content in order to boost Pokemon’s
recognition and popularity in total. Simultaneously with the release of the game, the
companies holding the rights made Pokemon appear in a comic book format as a
regular series in order to increase the sales of both the comic as well as the game.
One commodity after another from TV animated series, films, videos, and DVDs to
watches, character goods and more, all created some form of synergetic effect, and
taking it overseas built on its domestic success.
This best practice motivated the Japanese government to promote the Japanese
content industry due to its huge success and the variety of its ripple effect.
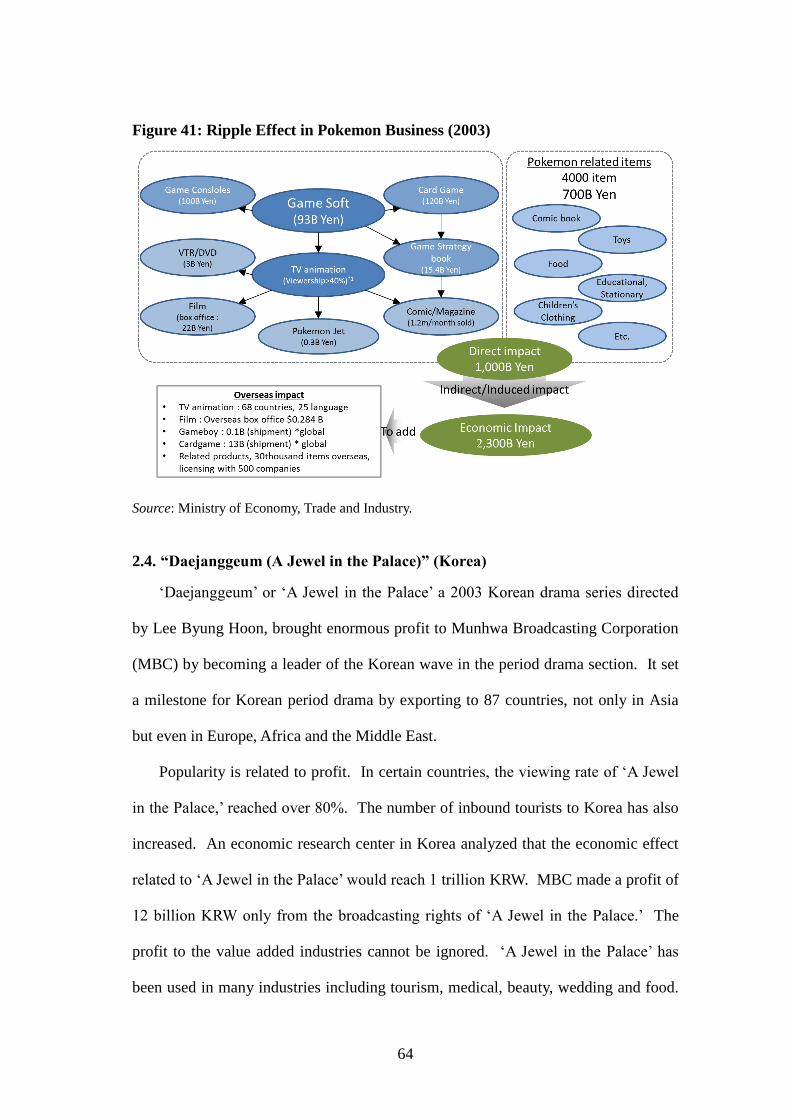
64
Figure 41: Ripple Effect in Pokemon Business (2003)
Source: Ministry of Economy, Trade and Industry.
2.4. “Daejanggeum (A Jewel in the Palace)” (Korea)
‘Daejanggeum’ or ‘A Jewel in the Palace’ a 2003 Korean drama series directed
by Lee Byung Hoon, brought enormous profit to Munhwa Broadcasting Corporation
(MBC) by becoming a leader of the Korean wave in the period drama section. It set
a milestone for Korean period drama by exporting to 87 countries, not only in Asia
but even in Europe, Africa and the Middle East.
Popularity is related to profit. In certain countries, the viewing rate of ‘A Jewel
in the Palace,’ reached over 80%. The number of inbound tourists to Korea has also
increased. An economic research center in Korea analyzed that the economic effect
related to ‘A Jewel in the Palace’ would reach 1 trillion KRW. MBC made a profit of
12 billion KRW only from the broadcasting rights of ‘A Jewel in the Palace.’ The
profit to the value added industries cannot be ignored. ‘A Jewel in the Palace’ has
been used in many industries including tourism, medical, beauty, wedding and food.
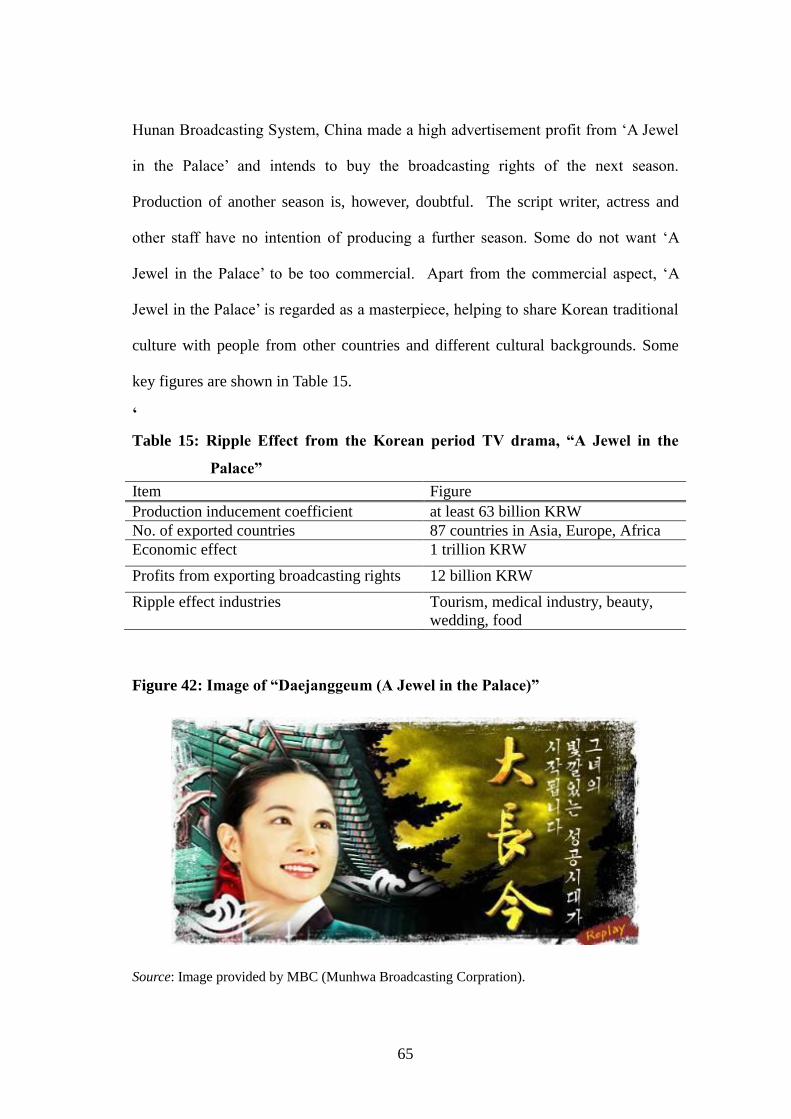
65
Hunan Broadcasting System, China made a high advertisement profit from ‘A Jewel
in the Palace’ and intends to buy the broadcasting rights of the next season.
Production of another season is, however, doubtful. The script writer, actress and
other staff have no intention of producing a further season. Some do not want ‘A
Jewel in the Palace’ to be too commercial. Apart from the commercial aspect, ‘A
Jewel in the Palace’ is regarded as a masterpiece, helping to share Korean traditional
culture with people from other countries and different cultural backgrounds. Some
key figures are shown in Table 15.
‘
Table 15: Ripple Effect from the Korean period TV drama, “A Jewel in the
Palace”
Item Figure
Production inducement coefficient at least 63 billion KRW
No. of exported countries 87 countries in Asia, Europe, Africa
Economic effect 1 trillion KRW
Profits from exporting broadcasting rights 12 billion KRW
Ripple effect industries Tourism, medical industry, beauty,
wedding, food
Figure 42: Image of “Daejanggeum (A Jewel in the Palace)”
Source: Image provided by MBC (Munhwa Broadcasting Corpration).
66
2.5. “Gangnam Style” by PSY (Korea)
In 2012, Korean musician PSY became a world star. His music video ‘Gangnam
Style’ had unexpected popularity worldwide. Revenues were amazing. One of the
Korean media reported that PSY’s sales revenue was more than 33 billion KRW and
the net profit, 15 billion KRW. If the amount of intangible value were included, the
amount would be much higher.
When ‘Gangnam Style’ ranked second in the Billboard Chart Hot 100, a
professor from Sungshin Women’s University in Korea analyzed the economic value
of ‘Gangnam Style’ as being more than 1 trillion KRW. Besides being on the 2nd
Place on the Billboard Chart for 7 weeks, ‘Gangnam Style’ was also ranked Number
One in the Official UK single top 100 chart, and in music charts in many other
countries. Pop columnist DJ KIM said on a radio show that PSY had done the work
of hundreds of diplomats by himself. In the global financial newspaper, the Financial
Times, an article entitled, ‘Gangnam Style Boosts South Korea Brand’ was published.
In acknowledgement of his contribution, PSY won a special award from the
2012 Korea Popular Culture Artist Awards, the Okgwan Order of Culture Merit from
the Korean Ministry of Culture, Sports and Tourism.
While it is difficult to calculate the intangible value of PSY, it is possible to
estimate the amount based on the inter-industry relation table published by the Bank
of Korea. Using 1.908 of the production inducement coefficient in the 2010 inter-
industry relation table and 33 billion KRW of sales revenue, the effect on production
inducement is 62 billion 964 million KRW (33 Billion x 1.908). Furthermore, the
effect on value-added inducement can be calculated as 27 billion 654 million KRW
(33billion x 0.838). As the number employee increased by 21 per 1 billion KRW
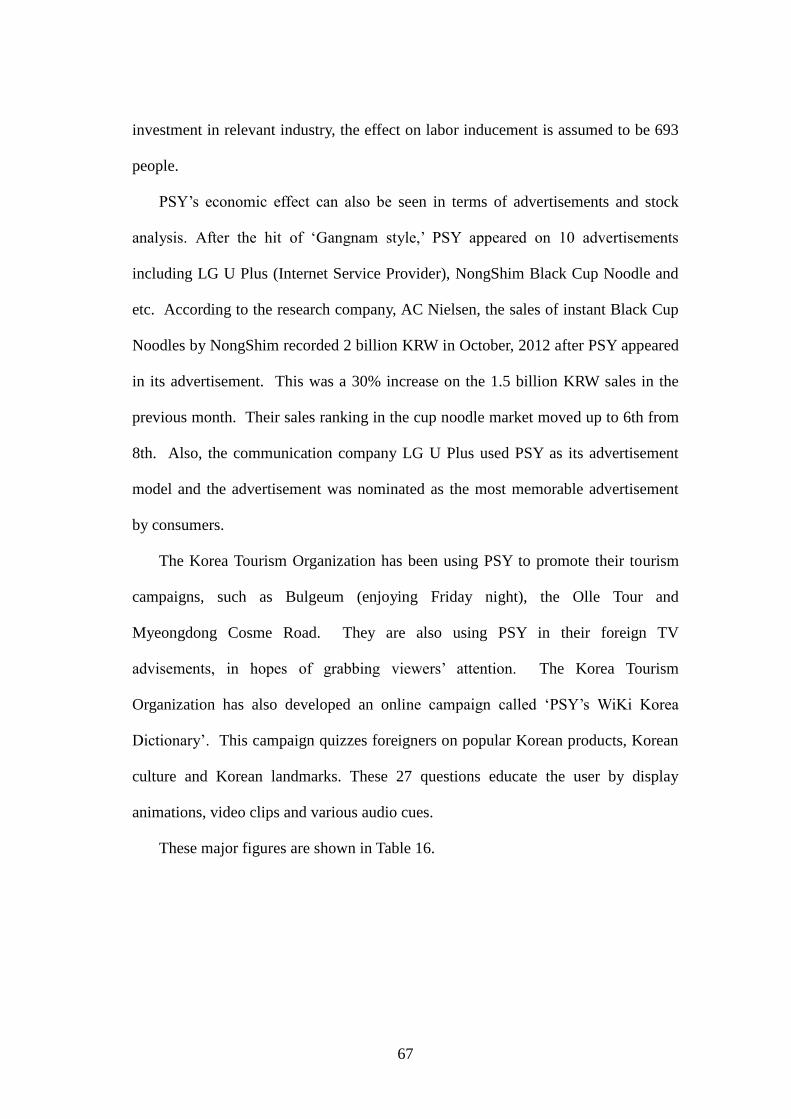
67
investment in relevant industry, the effect on labor inducement is assumed to be 693
people.
PSY’s economic effect can also be seen in terms of advertisements and stock
analysis. After the hit of ‘Gangnam style,’ PSY appeared on 10 advertisements
including LG U Plus (Internet Service Provider), NongShim Black Cup Noodle and
etc. According to the research company, AC Nielsen, the sales of instant Black Cup
Noodles by NongShim recorded 2 billion KRW in October, 2012 after PSY appeared
in its advertisement. This was a 30% increase on the 1.5 billion KRW sales in the
previous month. Their sales ranking in the cup noodle market moved up to 6th from
8th. Also, the communication company LG U Plus used PSY as its advertisement
model and the advertisement was nominated as the most memorable advertisement
by consumers.
The Korea Tourism Organization has been using PSY to promote their tourism
campaigns, such as Bulgeum (enjoying Friday night), the Olle Tour and
Myeongdong Cosme Road. They are also using PSY in their foreign TV
advisements, in hopes of grabbing viewers’ attention. The Korea Tourism
Organization has also developed an online campaign called ‘PSY’s WiKi Korea
Dictionary’. This campaign quizzes foreigners on popular Korean products, Korean
culture and Korean landmarks. These 27 questions educate the user by display
animations, video clips and various audio cues.
These major figures are shown in Table 16.
68
Table 16: Major Figures from the Effect of PSY’s “Gangnam Style”
Item Figure
Effect on production inducement at least 63 billion KRW
Sales 33 billion KRW
Net profit 15 billion KRW
Billboard Chart #2
Official UK single top 100 chart #1
Economic Value Over 1 trillion KRW
Effect on production inducement 62,964 million KRW
Effect on value-added inducement 27,654 million KRW
Effect on labor inducement 693 people
Advertisement revenue about 5 billion KRW
Increase on sales of the PSY’s adve
rtised product
Cup Noodle: increased by 30 % from1.5 billi
on KRW to 2 billion KRW
Stock increase (YG Entertainment) 47,600 KRW (July 2012)
⇒ 100,000 KRW (October 2012)
Figure 43: Image of PSY’s “Gangnam Style”
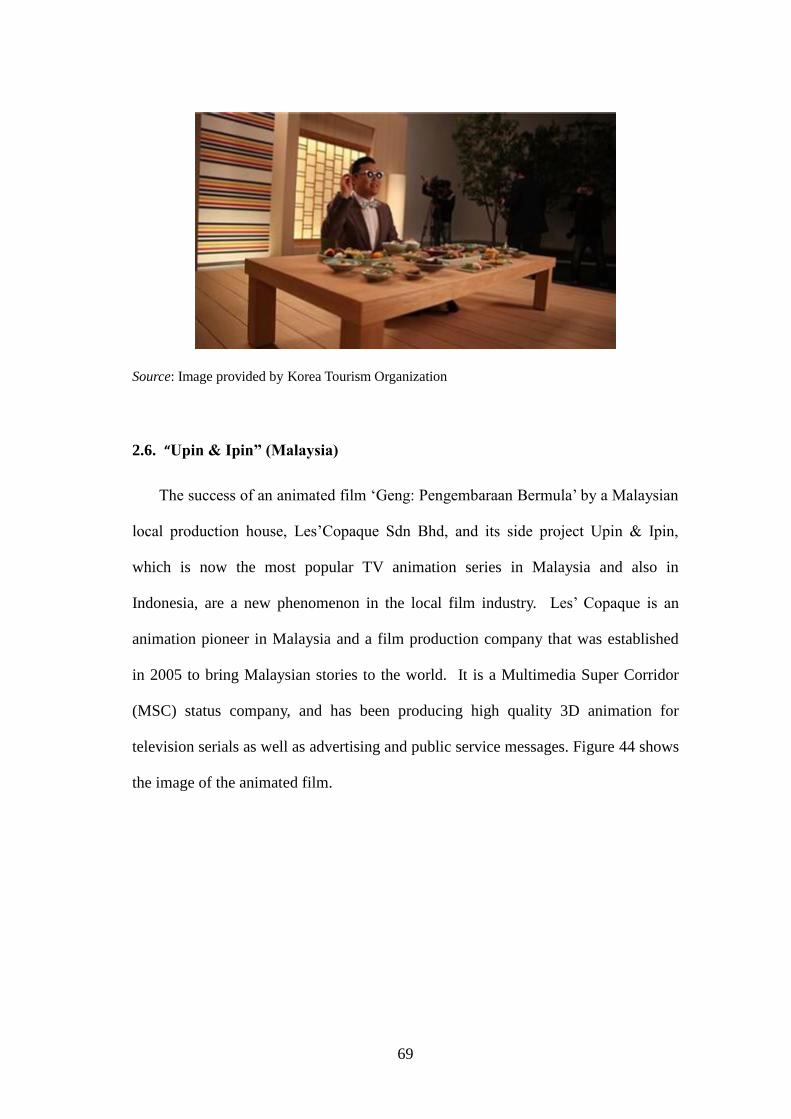
69
Source: Image provided by Korea Tourism Organization
2.6. “Upin & Ipin” (Malaysia)
The success of an animated film ‘Geng: Pengembaraan Bermula’ by a Malaysian
local production house, Les’Copaque Sdn Bhd, and its side project Upin & Ipin,
which is now the most popular TV animation series in Malaysia and also in
Indonesia, are a new phenomenon in the local film industry. Les’ Copaque is an
animation pioneer in Malaysia and a film production company that was established
in 2005 to bring Malaysian stories to the world. It is a Multimedia Super Corridor
(MSC) status company, and has been producing high quality 3D animation for
television serials as well as advertising and public service messages. Figure 44 shows
the image of the animated film.
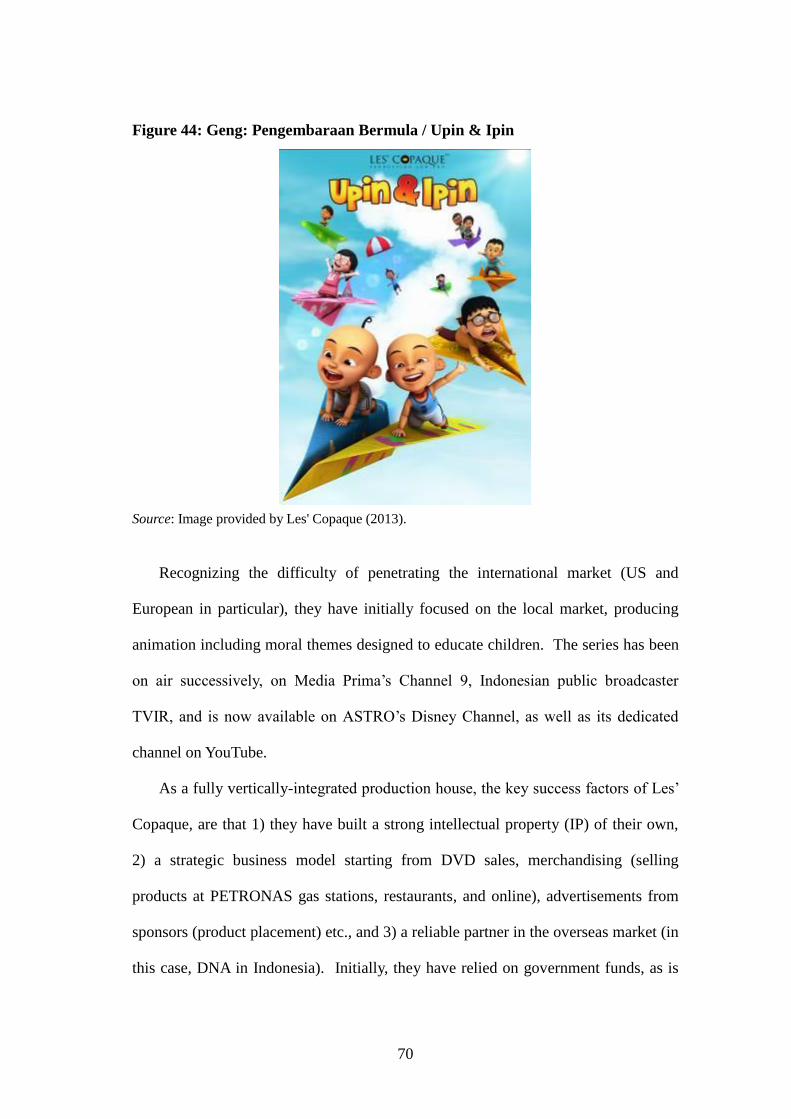
70
Figure 44: Geng: Pengembaraan Bermula / Upin & Ipin
Source: Image provided by Les' Copaque (2013).
Recognizing the difficulty of penetrating the international market (US and
European in particular), they have initially focused on the local market, producing
animation including moral themes designed to educate children. The series has been
on air successively, on Media Prima’s Channel 9, Indonesian public broadcaster
TVIR, and is now available on ASTRO’s Disney Channel, as well as its dedicated
channel on YouTube.
As a fully vertically-integrated production house, the key success factors of Les’
Copaque, are that 1) they have built a strong intellectual property (IP) of their own,
2) a strategic business model starting from DVD sales, merchandising (selling
products at PETRONAS gas stations, restaurants, and online), advertisements from
sponsors (product placement) etc., and 3) a reliable partner in the overseas market (in
this case, DNA in Indonesia). Initially, they have relied on government funds, as is
71
common for most players in the industry, but now approximately 50% of their
revenue comes from production, and the rest comes from merchandising and other
businesses, which is similar to the Disney model. The company has been in
negotiations to set up an Upin & Ipin Theme Park in Sepang, in the State of Selangor,
Malaysia. It is expected to open in 3 years’ time, featuring park rides and other
attractions centered on the Upin and Ipin brand. Les’ Copaque is open to exploring
business opportunities with international partners who are interested in new avenues
for the established brand and market presence of over 300 million consumers.
2.7. “Lost in Thailand” (China and Thailand)
“Lost in Thailand” is a 2012 Chinese comedy film directed by and starring Xu
Zheng, Wang Baoqiang, and Huang Bo. The film has grossed more than 200 million
USD at the Chinese box-office to date. The film premiered on December 12, 2012.
On January 1, 2013, the film crossed over the 1 billion RMB mark, the first in
Chinese film history. It beat James Cameron's 3D re-issue of “Titanic” which
grossed 975 million RMB and the previous Chinese record holder “Painted Skin: The
Resurrection” which grossed 727 million RMB.
In addition to its success in China, the comedy film has produced ripple effects
in Thailand, where the story was set. The box office hit is said to have had similar
effects to Korean pop culture, which has influenced Thai society. For example, due to
its success, it is said that a great number of tourists from China are being attracted to
visit Thailand. According to the Tourism Authority of Thailand (TAT), 300,000
Chinese tourists visited Thailand in February 2013, up from 200,000 in February
2012, a 50 percent increase. Media also reported that 384 charter flights were
planned to carry Chinese tourists to major tourist destinations across Thailand, such
72
as Chiang Mai, Phuket and Samui, during February 2013. It is said that in Chiang
Mai alone there were 26 charter flights scheduled during the Chinese New Year. Also,
according to the Kasikorn Research Centre, Thailand will be a major destination for
Chinese tourists during the Lunar New Year period, thanks to the hit film. The
research forecasted the number of Chinese tourists to grow by 37.9 percent to at least
800,000 in the first quarter, compared to the previous year. It was expected that the
tourists would spend 29.6 billion THB in total, a 44.4 percent increase year on year.
This case study describes an important example of a ripple effect originating in
one country (China) benefitting another country (Thailand), widening its effect to
related industries such as tourism.
73
CHAPTER 6
Policies and Initiatives in Audiovisual Content Industry
In this chapter, polices and initiatives, mainly in promoting audiovisual content
industry are introduced for each country.
1. China
With the rapid development of the Chinese economy, the Chinese government is
paying more attention to the improvement of the spiritual and cultural life of its
citizens, and is taking some effective measures to promote Chinese culture. The
Chinese government defines the culture industry in China as the for-profit industries
that produce cultural goods and cultural services, and activities directed at the
provision of cultural and entertainment goods and services, as well as an aggregate
that is related to all these activities. The industries covered by this definition include
live arts performing, films, audio and visual production, entertainment, tourism, arts
training and artistic products (The Tenth Five-year Plan, 2002). Based on this
definition, China has further classified its culture industry into three groups: the core,
the peripheral and culture-related.
The Chinese government actively promotes the cultural industry and has set a
target of growth from the current 3.5% of GDP to 5% of GDP in 2015. This goal is
seen as enhancing the cultural industry, especially the audiovisual content industry.
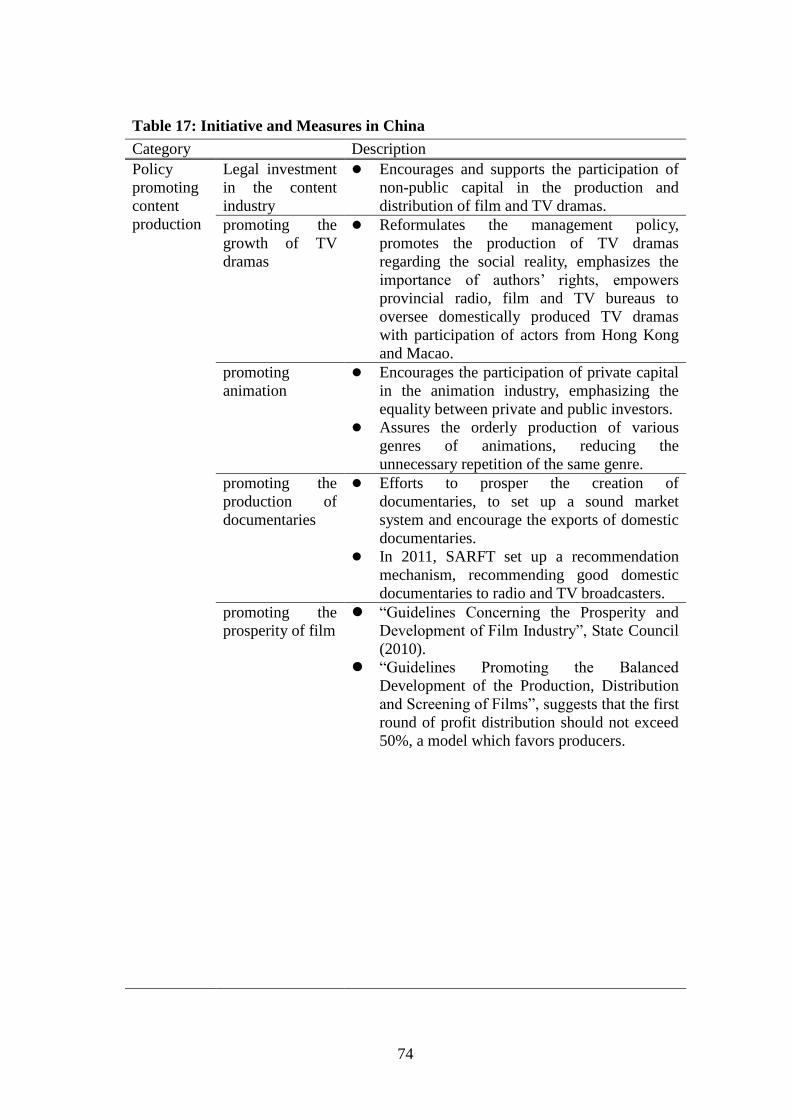
74
Table 17: Initiative and Measures in China
Category Description
Policy
promoting
content
production
Legal investment
in the content
industry
Encourages and supports the participation of
non-public capital in the production and
distribution of film and TV dramas.
promoting the
growth of TV
dramas
Reformulates the management policy,
promotes the production of TV dramas
regarding the social reality, emphasizes the
importance of authors’ rights, empowers
provincial radio, film and TV bureaus to
oversee domestically produced TV dramas
with participation of actors from Hong Kong
and Macao.
promoting
animation
Encourages the participation of private capital
in the animation industry, emphasizing the
equality between private and public investors.
Assures the orderly production of various
genres of animations, reducing the
unnecessary repetition of the same genre.
promoting the
production of
documentaries
Efforts to prosper the creation of
documentaries, to set up a sound market
system and encourage the exports of domestic
documentaries.
In 2011, SARFT set up a recommendation
mechanism, recommending good domestic
documentaries to radio and TV broadcasters.
promoting the
prosperity of film
“Guidelines Concerning the Prosperity and
Development of Film Industry”, State Council
(2010).
“Guidelines Promoting the Balanced
Development of the Production, Distribution
and Screening of Films”, suggests that the first
round of profit distribution should not exceed
50%, a model which favors producers.
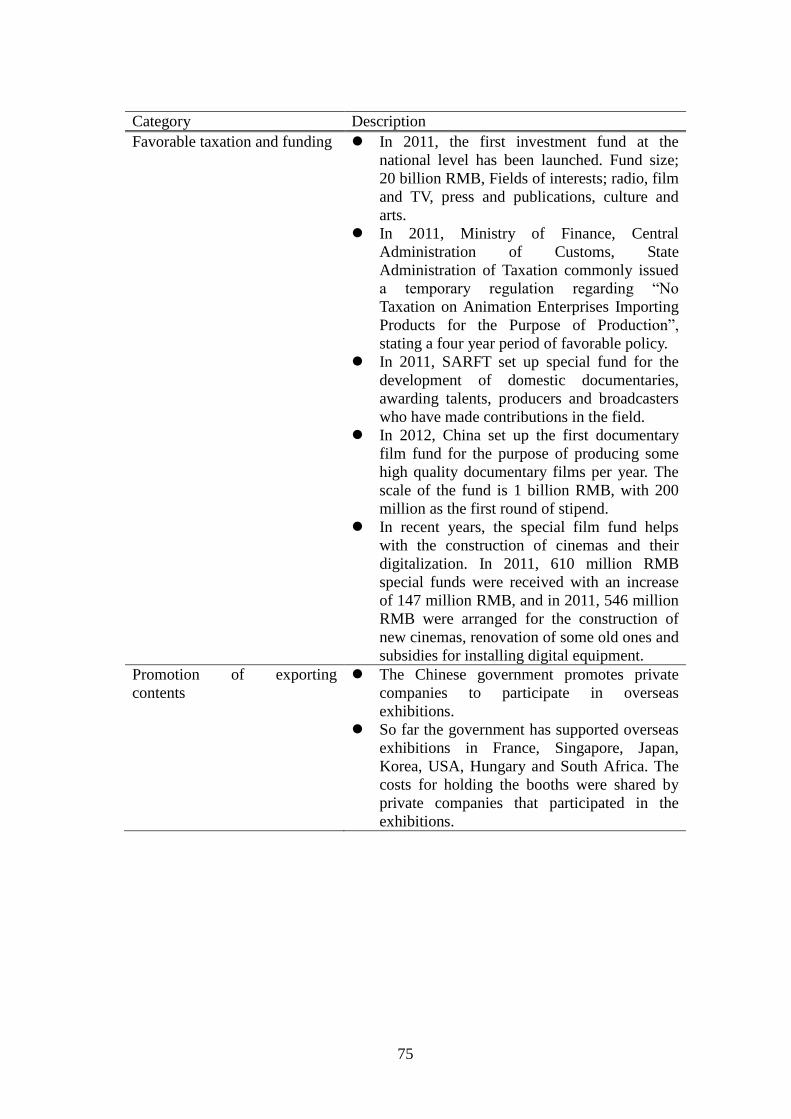
75
Category Description
Favorable taxation and funding In 2011, the first investment fund at the
national level has been launched. Fund size;
20 billion RMB, Fields of interests; radio, film
and TV, press and publications, culture and
arts.
In 2011, Ministry of Finance, Central
Administration of Customs, State
Administration of Taxation commonly issued
a temporary regulation regarding “No
Taxation on Animation Enterprises Importing
Products for the Purpose of Production”,
stating a four year period of favorable policy.
In 2011, SARFT set up special fund for the
development of domestic documentaries,
awarding talents, producers and broadcasters
who have made contributions in the field.
In 2012, China set up the first documentary
film fund for the purpose of producing some
high quality documentary films per year. The
scale of the fund is 1 billion RMB, with 200
million as the first round of stipend.
In recent years, the special film fund helps
with the construction of cinemas and their
digitalization. In 2011, 610 million RMB
special funds were received with an increase
of 147 million RMB, and in 2011, 546 million
RMB were arranged for the construction of
new cinemas, renovation of some old ones and
subsidies for installing digital equipment.
Promotion of exporting
contents
The Chinese government promotes private
companies to participate in overseas
exhibitions.
So far the government has supported overseas
exhibitions in France, Singapore, Japan,
Korea, USA, Hungary and South Africa. The
costs for holding the booths were shared by
private companies that participated in the
exhibitions.
76
2. Indonesia
The government of Indonesia recognizes the creative industries’ economic
potential for job creation, poverty eradication, increasing national income, and
nurturing nationalism. In 2009, the “Instruction of the President of the Republic of
Indonesia No.6 of 2009 regarding Development of Creative Economy”, as a sign of
government commitment, stated explicitly an action program by 27
ministries/institutions and local governments. In this commitment, the government
detailed the policy for creative economic development for the years 2009-2015. The
development of economic activities is based on the creativity, skills, and individual
talents of creative and inventive individuals who are economically valuable and
influential on Indonesia’s public welfare. The government has also launched the
“Vision and Mission of the Creative Economy” for 2025.
The reorganized and newly established ministry, having changed its name from
the “Ministry of Tourism” to the “Ministry of Tourism and Creative Economy”,
focuses on creating new competitiveness for Indonesia in the creative economic
sector.
Table 18: Framework of Vision and Mission of Creative Economy for 2025
Item Description
Vision The Indonesian nation with good quality of life and creativity in
the world
Mission Empower Indonesia’s human resources to:
1. Increase the contribution of creative industries to the GDP of
Indonesia
2. Increase the national exports of products/services based on the
creativity of the nation that carries the spirit of contemporary local
content
3. Increase the employment as a result of the opening of new jobs in
the creative industries
77
4. Increase a number of highly competitive firms engaged in the
creative industries
5. Prioritize the utilization of sustainable resources for the earth and
coming generations
6. Create creative innovations, including those based on wisdom and
cultural heritage archipelago, that have economic value
7. Develop creative potentials in the areas and regions of Indonesia
8. Develop creative branding on the products/services as national
branding of
Indonesia
Goals 1. Nurturing creative human beings with a creative mind-set
2. Developing industries that are leading in domestic market and
abroad, nurturing the local entrepreneurs
3. Developing technology that supports the creativity of Indonesian
people
4. Utilizing domestic raw materials effectively for the creative industry
5. Encouraging Indonesian people to appreciate and consume local
products
6. Winning high trust from financing institutions for the creative
industries in the economic sector as an attractive industry
One of the government’s initiatives aiming to grow creative talents is the
establishment of a school of design and animation called “HelloMotion Academy”
(www.hellomotion.com/ ). Based on their experience in the animation and creative
industry in Indonesia, an efficient curriculum has been developed and short courses
set up, taking only months to complete and at an affordable price. Since the
HelloMotion Academy started in 2004, it has had more than 2,500 alumni. Many of
them are now working in the animation industry.
In 2004, HelloMotion launched “HelloFest” (HelloMotion Festival) – it started
out as a graduation day for the academy’s first batch of graduates, but it’s now a huge
yearly festival of pop culture. With a concept of creating a hub linking creators and
early-adopters of the creative products in one event, the festival engaged at least
20,000 people in a one day event. Through this interaction, HelloFest has created a
channel to deliver ideas to the public, and is becoming a facilitator for various agents
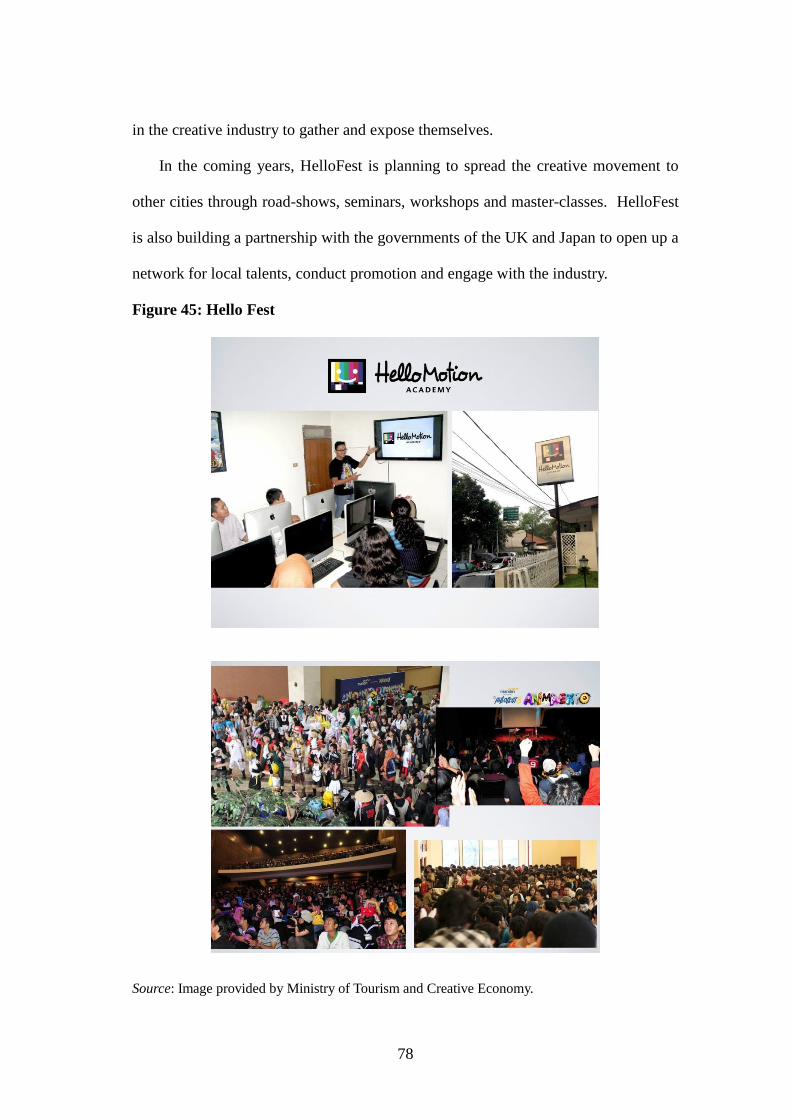
78
in the creative industry to gather and expose themselves.
In the coming years, HelloFest is planning to spread the creative movement to
other cities through road-shows, seminars, workshops and master-classes. HelloFest
is also building a partnership with the governments of the UK and Japan to open up a
network for local talents, conduct promotion and engage with the industry.
Figure 45: Hello Fest
Source: Image provided by Ministry of Tourism and Creative Economy.
79
3. Japan
Considering the global perspective and the current serious conditions of the
Japanese economy, several initiatives have been taken toward achieving economic
growth. The creative content industry is targeted as one of the strategic pillars in the
current growth strategy. The “Cool Japan Strategy” is aimed at transforming the
appeal of Japanese culture and lifestyle (food, fashion, lifestyle, and various content
media such as animation, dramas, games, films and music; and tourism) into added
value (= create a mechanism to convert culture into industry). It is hoped to create
new growth industries, thereby creating employment and opportunities for small and
medium enterprises (SMEs) and youth. The Ministry of Economy, Trade and
Industry (METI) and the Agency for Cultural Affairs (which conducts policies such
as the protection of cultural properties and promoting arts and culture) are currently
mainly promoting the content industry including movies, music, game software, and
animation—as a promising industry for economic growth.
The market size of the content industry in Japan including movies, animation,
TV programs, games and books is around 150 billion USD, which is second only to
the USA. The growth rate compared with previous years keeps contracting, however,
due to the falling birthrate and the aging of Japan’s society as well as the general
business depression.
Japanese content is highly regarded in some foreign countries as “Cool Japan”.
However exports to foreign countries accounted for by the content industry make up
only around 5% of Japan’s total exports, and the Japanese content industry is losing
opportunities to take advantage of markets and demand in Asian countries.
A key factor for sustained growth is to work on profit increase by international
80
business, building partnerships in foreign countries and taking advantage of Japanese
content’s value.
Table 19: Initiative and Measures in Japan
Regulation Description
Support for
localization
and
promotion
The Subsidy for the Localization & Promotion of Japanese
Visual Media (J-LOP) aims to promote awareness and
appreciation of Japanese visual media and enhance its
commercial value in overseas markets. METI and Ministry of
Internal Affairs and Communications of Japan have jointly
started the subsidy for localization and overseas promotional
activities for projects relating to Japanese culture, including
films, TV programs, animation, music, digital comics and games.
The subsidy budget for localization is 95 million USD and for
promotion is 60 million USD. Up to 50% of the approved
expenses are subsidized.
Support for
international
coproduction
Ministry of Internal Affairs and Communications of Japan has
started the subsidy for international coproduction that Japanese
broadcasters and productions produce audiovisual contents with
overseas broadcasters.
The subsidy budget for coproduction is 15 million USD.
Japan Brand
Fund
The Japanese government will set up Japan Brand Fund (TBD)
by Public- Private joint Initiative (under discussion at cabinet
level) in 2013.
The Fund provides risk money to business which tries to meet
potential demand for “Cool Japan” products and services in
overseas markets.
Establishmen
t of new
company for
overseas
development
of content
The Innovation Network Corporation of Japan has launched “All
Nippon Entertainment Works Inc. (ANEW)” to support planning
and development for global market.
ANEW functions not only as a sales representative for a wide
variety of Japanese contents / IPs, targeting the U.S. / global
market, but also provides full scale operational / financial
support for film development process in the U.S.
Leading Japanese IP holders provide multi-dimensional support,
including proprietary access to competitive IPs to ANEW as
“Collaboration Partners”.
81
Source: METI
Driving
international
co-
production
In 2011, the Agency for Cultural Affairs created a subsidy for
movie production based on international co-productions (METI
supports authorization of international co-productions).
Candidate works are required to contribute (1) to develop
overseas markets for Japanese producers and production
companies and (2) to advance globalization and qualitative
progress through cultural and people-to-people exchange.
Organize
CoFesta
(international
exhibition)
CoFesta (Japan International Contents Festival) is the largest
comprehensive contents festival in Japan. Eighteen events
connected with the content industry including games, animation,
comics (manga), characters, broadcast, music and films, and
content-related industrial events like fashion and design are held
in cooperation with each other.
The content industry works together to promote its contents
overseas with powerful public relations.
Anti-piracy
measures
Content Overseas Distribution Association (CODA) takes anti-
piracy measures in cooperation with rights holders and copyright
related organizations in foreign countries and requests to remove
illegal contents.
As anti-piracy measures on the Internet, a proving test was
enforced to remove illegal video contents from video hosting
internet services in some countries. Almost 100 % on requests
from CODA were successfully removed. Regarding pirated
DVDs, CODA supports execution of rights in collaboration with
local regulatory bodies in foreign countries. CODA successfully
82
seized 6.5 million DVDs. (Total number from January 2005 to
March 2012).
Fostering
human
resources for
producers
Sending young producers to top film schools in the U.S., who
will assume the role of overseas development and management
of the total value chain of the content industry in the future.
Establishmen
t of Gloczus
Inc.
The new company Gloczus provides services including clearing,
translation and promotion to small businesses for supporting
overseas development of their high-quality contents.
4. Korea
A long history of cultural policy in Korea, emphasized differently by varied
government administrations such as the Korea Creative Content Agency (KOCCA)
and the Korean Film Council (KOFIC), has provided a sturdy backbone to the rise of
the Korean Wave and a new age of transnational cultural flows. Fostering the growth
of the creative content industries in Korea, under the Ministry of Culture, Sports and
Tourism, KOCCA actively promotes Korean companies involved in animation,
broadcasting, character licensing, games, music, and mobile and digital technologies
by serving as a global bridge between Korean creative content providers and
international partners. The agency is committed to developing and promoting the
Korean creative content industry, building infrastructure for developing creativity
and technology, developing global partnerships to enhance and support marketing
efforts, and encouraging industry investment to strengthen Korea as a global content
provider.

83
Table 20: Initiative and Measures in Korea
Category Item Description
Policy
promoting
content
production
Supporting
audiovisual
content format
production
The government supports audiovisual content
format production. It is in line with the support
for broadcasting content formatting.
Building a foundation for the audiovisual content creation
Korea Broadcast grand prix awards
Infrastructure
Support
Operating
Production
center in
Broadcaster’s
Center.
Infrastructure for content production support
by KOCCA is located in Broadcaster’s center
in Mok-dong, Seoul.
Digital Magic
Space(DMS)
Production
Center
Constructed in 2006, a production center,
DMS is located in Sangam-dong, Seoul. The
building has total 12 floors and from 6th floor
to 12th floor, broadcasting related companies
are moved in.
Establishment of
digital
broadcasting
content support
Center
Facility that can be used for a low price, is
certainly needed to strengthen the
competitiveness of independent broadcasting
studio and Post-production
Policies
promoting
oversea
distribution
Participation
support in
international
broadcasting
trade exhibition
At international broadcasting trade exhibitions,
a joint Korea booth operates for the export of
broadcasting program. Governmental support
is required for providing an opportunity to
export for producers
International
broadcasting
trade exhibition
From 2001, BCWW (Broadcast Worldwide)
has been held to revitalize the broadcasting
industry and promote the export.
Supporting of
reproduction of
broadcast
content for
export
As a part of encouraging the export of
broadcast content, the reproduction of
broadcast content is supported. Initiated in
1999, it supports translation, editing, M/E
segregation, subtitle, dubbing to export the
broadcast content oversea.
Supporting of
oversea
distribution
The government promotes the distribution of
reproduced programs in emerging regions with
priority. Further exchange for program
distribution, local language dubbing, subtitle
and reproduction are supported in regions
where needed.
Supporting of
international
broadcasting
culture exchange
International broadcasting culture exchange
has operated since 2007 for audiovisual co-
production and consecutive broadcasting by
each country.
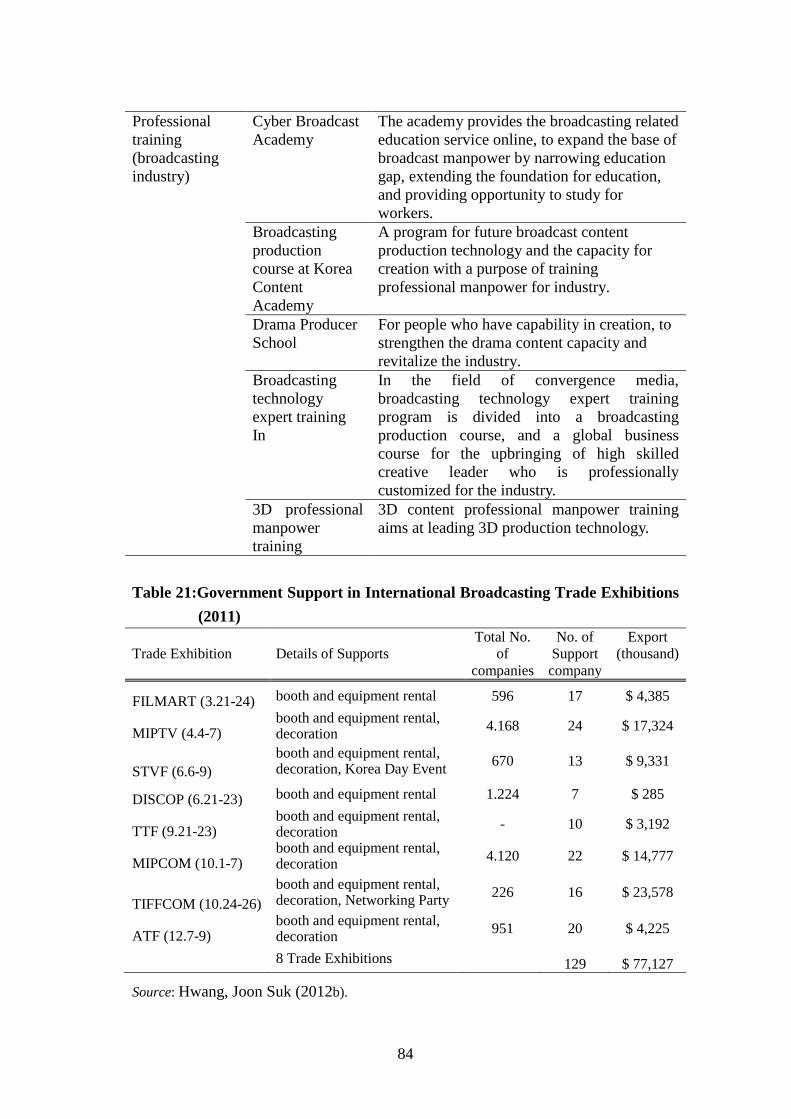
84
Professional
training
(broadcasting
industry)
Cyber Broadcast
Academy
The academy provides the broadcasting related
education service online, to expand the base of
broadcast manpower by narrowing education
gap, extending the foundation for education,
and providing opportunity to study for
workers.
Broadcasting
production
course at Korea
Content
Academy
A program for future broadcast content
production technology and the capacity for
creation with a purpose of training
professional manpower for industry.
Drama Producer
School
For people who have capability in creation, to
strengthen the drama content capacity and
revitalize the industry.
Broadcasting
technology
expert training
In
In the field of convergence media,
broadcasting technology expert training
program is divided into a broadcasting
production course, and a global business
course for the upbringing of high skilled
creative leader who is professionally
customized for the industry.
3D professional
manpower
training
3D content professional manpower training
aims at leading 3D production technology.
Table 21:Government Support in International Broadcasting Trade Exhibitions
(2011)
Trade Exhibition Details of Supports
Total No.
of
companies
No. of
Support
company
Export
(thousand)
FILMART (3.21-24) booth and equipment rental 596 17 $ 4,385
MIPTV (4.4-7) booth and equipment rental, decoration
4.168 24 $ 17,324
STVF (6.6-9)
booth and equipment rental, decoration, Korea Day Event
670 13 $ 9,331
DISCOP (6.21-23) booth and equipment rental 1.224 7 $ 285
TTF (9.21-23) booth and equipment rental, decoration
- 10 $ 3,192
MIPCOM (10.1-7) booth and equipment rental, decoration
4.120 22 $ 14,777
TIFFCOM (10.24-26)
booth and equipment rental, decoration, Networking Party
226 16 $ 23,578
ATF (12.7-9) booth and equipment rental, decoration
951 20 $ 4,225
8 Trade Exhibitions 129 $ 77,127
Source: Hwang, Joon Suk (2012b).
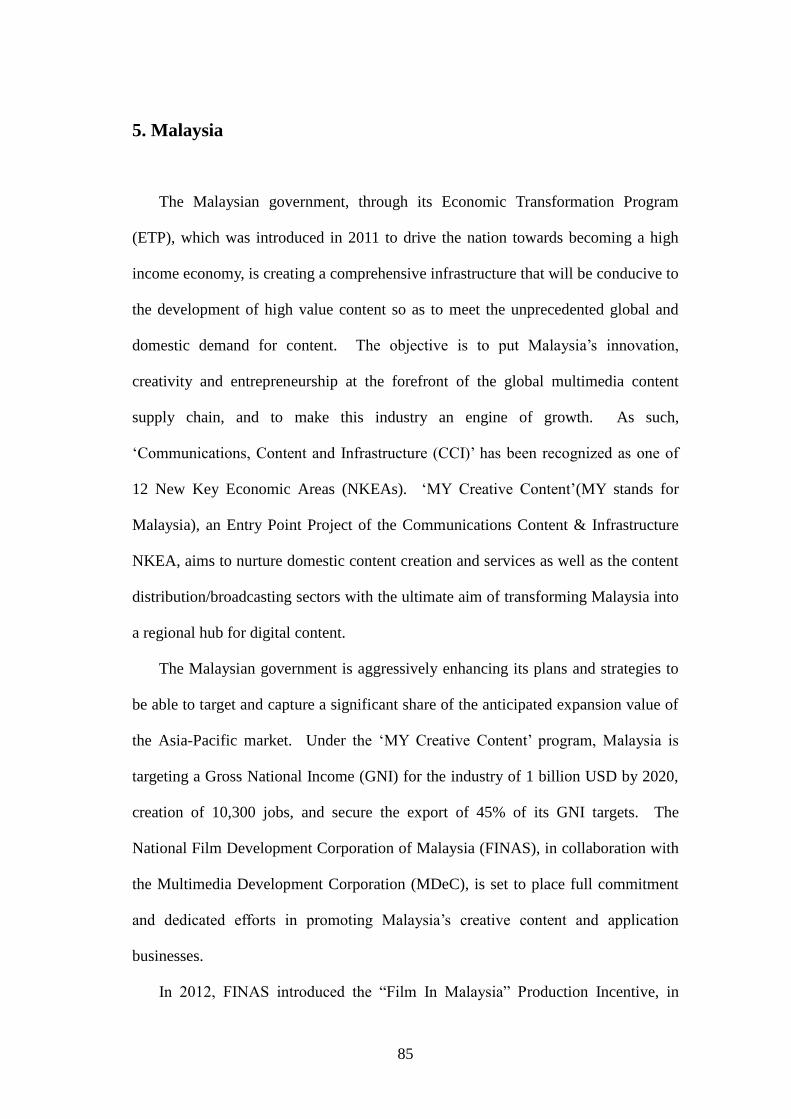
85
5. Malaysia
The Malaysian government, through its Economic Transformation Program
(ETP), which was introduced in 2011 to drive the nation towards becoming a high
income economy, is creating a comprehensive infrastructure that will be conducive to
the development of high value content so as to meet the unprecedented global and
domestic demand for content. The objective is to put Malaysia’s innovation,
creativity and entrepreneurship at the forefront of the global multimedia content
supply chain, and to make this industry an engine of growth. As such,
‘Communications, Content and Infrastructure (CCI)’ has been recognized as one of
12 New Key Economic Areas (NKEAs). ‘MY Creative Content’(MY stands for
Malaysia), an Entry Point Project of the Communications Content & Infrastructure
NKEA, aims to nurture domestic content creation and services as well as the content
distribution/broadcasting sectors with the ultimate aim of transforming Malaysia into
a regional hub for digital content.
The Malaysian government is aggressively enhancing its plans and strategies to
be able to target and capture a significant share of the anticipated expansion value of
the Asia-Pacific market. Under the ‘MY Creative Content’ program, Malaysia is
targeting a Gross National Income (GNI) for the industry of 1 billion USD by 2020,
creation of 10,300 jobs, and secure the export of 45% of its GNI targets. The
National Film Development Corporation of Malaysia (FINAS), in collaboration with
the Multimedia Development Corporation (MDeC), is set to place full commitment
and dedicated efforts in promoting Malaysia’s creative content and application
businesses.
In 2012, FINAS introduced the “Film In Malaysia” Production Incentive, in
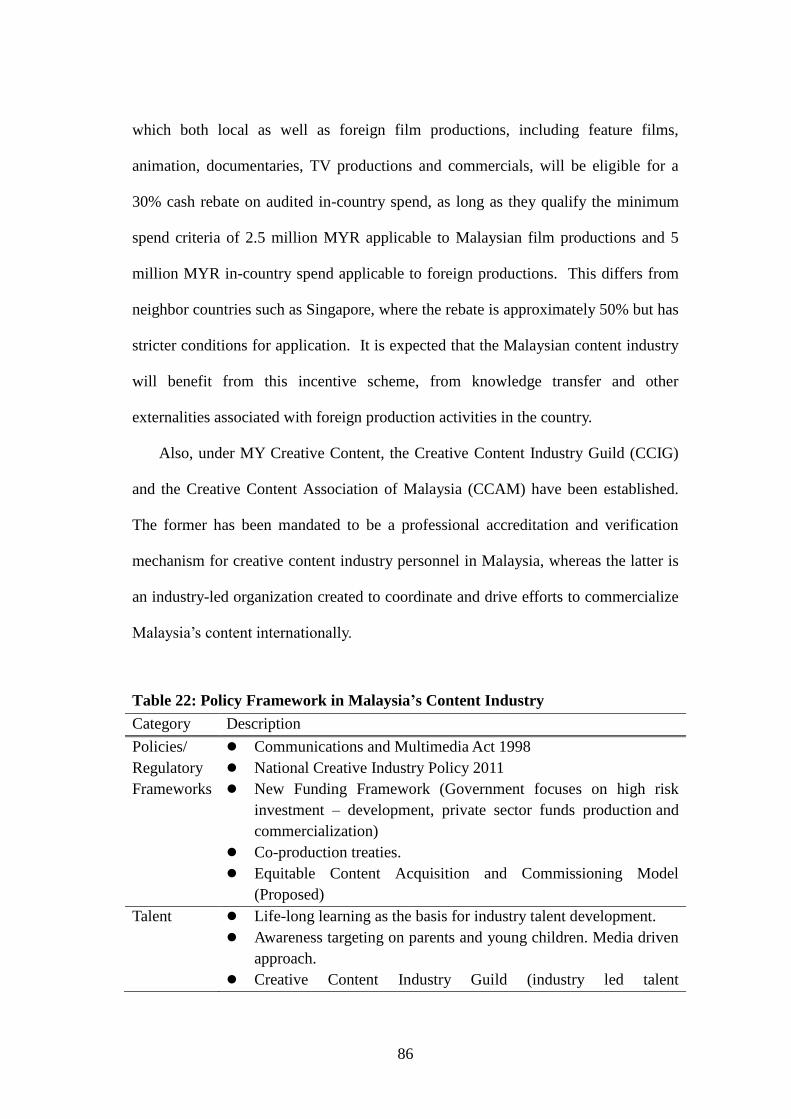
86
which both local as well as foreign film productions, including feature films,
animation, documentaries, TV productions and commercials, will be eligible for a
30% cash rebate on audited in-country spend, as long as they qualify the minimum
spend criteria of 2.5 million MYR applicable to Malaysian film productions and 5
million MYR in-country spend applicable to foreign productions. This differs from
neighbor countries such as Singapore, where the rebate is approximately 50% but has
stricter conditions for application. It is expected that the Malaysian content industry
will benefit from this incentive scheme, from knowledge transfer and other
externalities associated with foreign production activities in the country.
Also, under MY Creative Content, the Creative Content Industry Guild (CCIG)
and the Creative Content Association of Malaysia (CCAM) have been established.
The former has been mandated to be a professional accreditation and verification
mechanism for creative content industry personnel in Malaysia, whereas the latter is
an industry-led organization created to coordinate and drive efforts to commercialize
Malaysia’s content internationally.
Table 22: Policy Framework in Malaysia’s Content Industry
Category Description
Policies/
Regulatory
Frameworks
Communications and Multimedia Act 1998
National Creative Industry Policy 2011
New Funding Framework (Government focuses on high risk
investment – development, private sector funds production and
commercialization)
Co-production treaties.
Equitable Content Acquisition and Commissioning Model
(Proposed)
Talent
Life-long learning as the basis for industry talent development.
Awareness targeting on parents and young children. Media driven
approach.
Creative Content Industry Guild (industry led talent

87
coordination).
Incentives
“Film in Malaysia”: 30% production incentives for foreign and
local projects that meet the basic criteria (managed by FINAS)
MSC Malaysia Status (managed by Multimedia Development
Corporation Sdn.Bhd (MDeC))
Iskandar Development Region Incentive (managed by the
Iskandar Regional Development Authority – IRDA)
Investment tax credits for institutional and private investors on
content projects that meet a basic criteria. (Proposed)
Markets
Government industry development agencies (marketing function
included)
Multimedia Development Corporation (MDeC)
National Film Development Corporation (FINAS)
Creative Content Association of Malaysia (Industry led Marketing
Association)
6. Philippines
As discussed in the previous chapters, the content industry in the Philippines is
emerging, and is one of the most influential and important industries that are
instrumental in fostering progress and development in the country. There is, however,
no one government body that takes care of the Philippines’ creative / content industry.
The Creative Economics Council of the Philippines (CECP) was established to aid
necessary collaboration among related industry bodies. CECP mainly defines the
creative industry as: Publishing & Printed Media, Design, Creative Service, New
Media, Audiovisual (film, TV). Besides these sectors, the Visual Arts and
Performing Arts sectors have some form of support from the government. CECP
mostly collaborates with DTI (the Department of Trade and Industry), DOST (the
Department of Science & Technology), and ICTO (the ICT Office).
However, CECP manages business cost at the project level, as the body does not
88
have financial backup. Therefore CECP currently supports entrepreneurship by
assisting talented people, with experience in animation and the games industry to
start up their own businesses in the local market. CECP recognizes the importance of
gaining and exchanging knowledge, and collaborating among different content
industries.
The government is currently exploring support initiatives for content import
/export. The Creative Industry Act which is managed by the Design Council of the
Philippines will soon be passed. This act aims to promote the creative industry and
includes foreign investment promotion schemes.
At present, creative industry, especially the media industry, is not fully opened
due to restrictions on foreign investment. NEDA (the National Economic and
Development Authority) has commented that policy making, including de-regulation,
is necessary, as investment is essential for this industry to develop. Although the
animation and games industries are growing, driven by outsourcing demand, the
challenge is to stimulate the further growth of the domestic market.
7. Singapore
Singapore has targeted a strategic goal of achieving $8.0 billion SGD in value-
added, $25.7 billion SGD in revenue, and 68,000 jobs in total, under their Singapore
Media Fusion Plan (June 2009).
The Ministry of Communication and Information (MCI), reorganized in
November 2012, is currently encouraging development in 7 media clusters
(Broadcast, Animation, Film, Music, Interactive Media, Games and Publishing)
89
through MDA (the Media Development Authority). The audiovisual content sector is
one of their priorities in the industry.
One of MCI’s major policies relating to the audiovisual sector is its PSB (Public
Service Broadcast) framework. Due to the paradigm shift toward media
consumption over new media, MCI accepted a recommendation put forward by the
PSB Review Panel, and re-launched the PSB Contestable Funds Scheme (formerly
known as the Public Service Content Scheme). MCI also appointed a Convergence
Review Panel to review market convergence between media and ICT. Their next
step is a Joint Master Plan (JMP) to design certain frameworks in areas such as
licensing, standard content codes, regulations, capacity building, etc.
Table 23: PSB Contestable Funds Scheme
Category Description
Objectives Extend the reach of PSB content to multiple media platforms
Raise the quality of PSB content via contestability
Encourage innovation in PSB content creation
Type of funding Grant scheme (previously a co-investment model)
Type of platform
funded
Extend the reach of PSB programmes onto multiple
broadcast platforms, FTA (free-to-air) TV, Pay TV, Radio and
Online platforms (previously only FTV TV platform)
Content producers will have more opportunities to create
innovative PSB programmes for different commissioning
broadcasters that can be offered on multiple platforms (e.g.
TV drama with spin-offs episodes on internet or radio).
Fund The government plans to fund up to 630 million SGD to
2016.
All PCFS (PSB Contestable Funds Scheme)-funded
programmes will be made available eventually to the public
on a free-to-access platform.
In terms of promoting content media, in 2011 MDA simplified the previous 46
schemes into 5 main grant schemes and holistic approach to support projects,
individuals and companies from all media sectors, namely Animation, Broadcast,
90
Film, Games, Interactive Media, Music and Publishing. The target is 5 areas,
Development, Production, Marketing, Talent and Enterprise.
Table 24: MDA’s Grant scheme
Area Description
Development Assistance
(D-ASSIST)
To help individuals and companies create new IP, to
a sufficiently developed stage so as to be ‘pitchable’
for production
Production Assistance
(P-ASSIST)
To catalyse engagement and upgrading of local
industry talent in output of products that can be
marketed both locally and internationally
Marketing Assistance
(M-ASSIST)
To help industry promote and monetise its
capabilities, capacity and output
Talent Assistance (T-ASSIST) To enable structured as well as on-the-job
upskilling for industry personnel
Enterprise Assistance
(E-ASSIST)
To groom high-potential local media enterprises to
progress to specified higher tiers of revenue and
profitability
MDA also focuses on infrastructure development, such as integrating a media
hub district, the Mediapolis @ One-north. Media concepts, prototypes, content,
services and applications will be developed, test-bedded, produced, financed and
distributed on the 19-ha media precinct, which is intended to be both vibrant and
sustainable.
One of the pioneers at the Mediapolis is Infinite Studios, a fully integrated media
entertainment and creative service company. Its two state-of-the-art sound-stages
will be housed with advanced post-production, visual effects and animation facilities.
91
8. Thailand
The Thai government has announced a policy to develop Thailand into a more
value-added economy and increase the share of the creative economy value from 1.2
percent to 2.0 percent of the country’s gross domestic product (GDP) by the end of
2012, under a new “Creative Thailand” policy. The objective is to strengthen the
country as a whole; fortunately Thai society has good basic skills and other social
capital and cultural background that can be used as a base for digital content raw
materials.
In 2010, the government allocated a fund of 200 million THB to develop
Thailand as a production base for digital content, a part of a 17.6 billion THB budget
allocated to boost the country’s creative industries. In addition, Thailand’s ICT
Master Plan, 2009-2013, seeks to promote the digital content industry, aiming for the
industry to have a total value of 165 billion THB by 2013.
One other industry Thailand has been interested in developing is the film
industry, as well as all upstream industries for businesses such as animated games,
computer graphics, advertisements, software, websites, and others. In addition, the
Software Industry Promotion Agency (SIPA), the Ministry of Culture and the
National Federation of the Thai Films Associations launched a project called “Film
Expo Asia 2010,” a competition for short films. It was the first of its kind in Asia,
and the event aimed to promote Thailand as a land of rich culture and heritage, in
which every concerned party could realize that the country is one of the best
destinations for filmmaking and traveling. It was a creative effort to propel Thailand
to the forefront of the Asian film industry and to capture a larger market share of the
world’s digital content industry.
92
On September 2012, the Ministry of Culture and the National Federation of Thai
Films Associations announcement on the annual statistic report of the Film,
Animation, Games and Karaoke industries values, showed the total of the industry
for year 2011, which turned out higher than 77 billion THB.
Compared to other Asian countries, Thailand’s TV & film industry is mainly led
by the private sector. The government oversees the development, basic
infrastructures and policy framework; however supporting funds are rather limited.
However, the government is currently exploring newer incentive schemes and new
participation for creative media, to accelerate economic development and strengthen
its international competitiveness. By encouraging content distribution at the regional
level, they hope to lead development in the industry, and help create ripple effects
such as tourism.
The National Film and Video Commission established by Film and Video Act
B.E. 2551 has approved a strategy plan to promote the industry of film and video
(2012-2016) as follow:
1) Develop ability to produce the industry of film and video.
2) Adjust the structure of industrial management of the industry of film and video.
3) Promote and develop the personnel in the industry of film and video.
4) Develop film and video market of Thailand aggressively domestically and
abroad.
5) Promote Thailand to be copyright-infringement free zone in video and film
works.
6) Build appropriate value in consuming film and video.
7) Promote the business of shooting done by foreign countries in Thailand.
8) Promote cooperation in investment in the industry of film and video with foreign
countries.
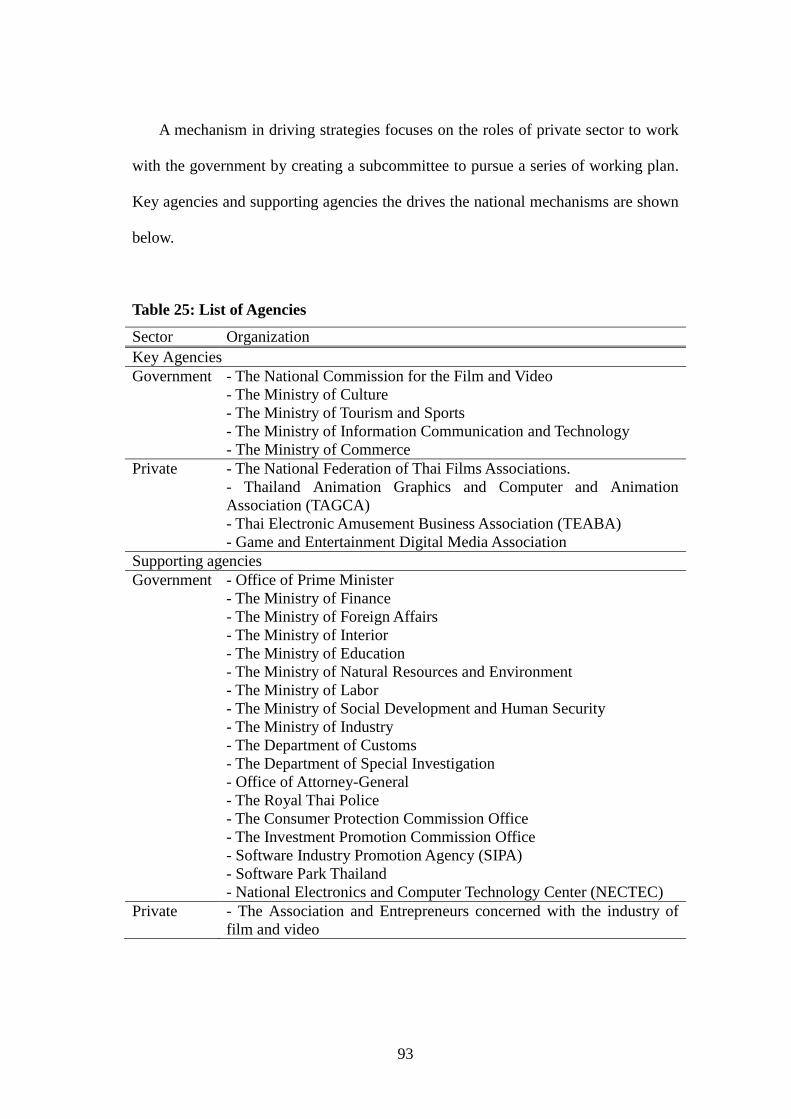
93
A mechanism in driving strategies focuses on the roles of private sector to work
with the government by creating a subcommittee to pursue a series of working plan.
Key agencies and supporting agencies the drives the national mechanisms are shown
below.
Table 25: List of Agencies
Sector Organization
Key Agencies
Government - The National Commission for the Film and Video
- The Ministry of Culture
- The Ministry of Tourism and Sports
- The Ministry of Information Communication and Technology
- The Ministry of Commerce
Private - The National Federation of Thai Films Associations.
- Thailand Animation Graphics and Computer and Animation
Association (TAGCA)
- Thai Electronic Amusement Business Association (TEABA)
- Game and Entertainment Digital Media Association
Supporting agencies
Government - Office of Prime Minister
- The Ministry of Finance
- The Ministry of Foreign Affairs
- The Ministry of Interior
- The Ministry of Education
- The Ministry of Natural Resources and Environment
- The Ministry of Labor
- The Ministry of Social Development and Human Security
- The Ministry of Industry
- The Department of Customs
- The Department of Special Investigation
- Office of Attorney-General
- The Royal Thai Police
- The Consumer Protection Commission Office
- The Investment Promotion Commission Office
- Software Industry Promotion Agency (SIPA)
- Software Park Thailand
- National Electronics and Computer Technology Center (NECTEC)
Private - The Association and Entrepreneurs concerned with the industry of
film and video

94
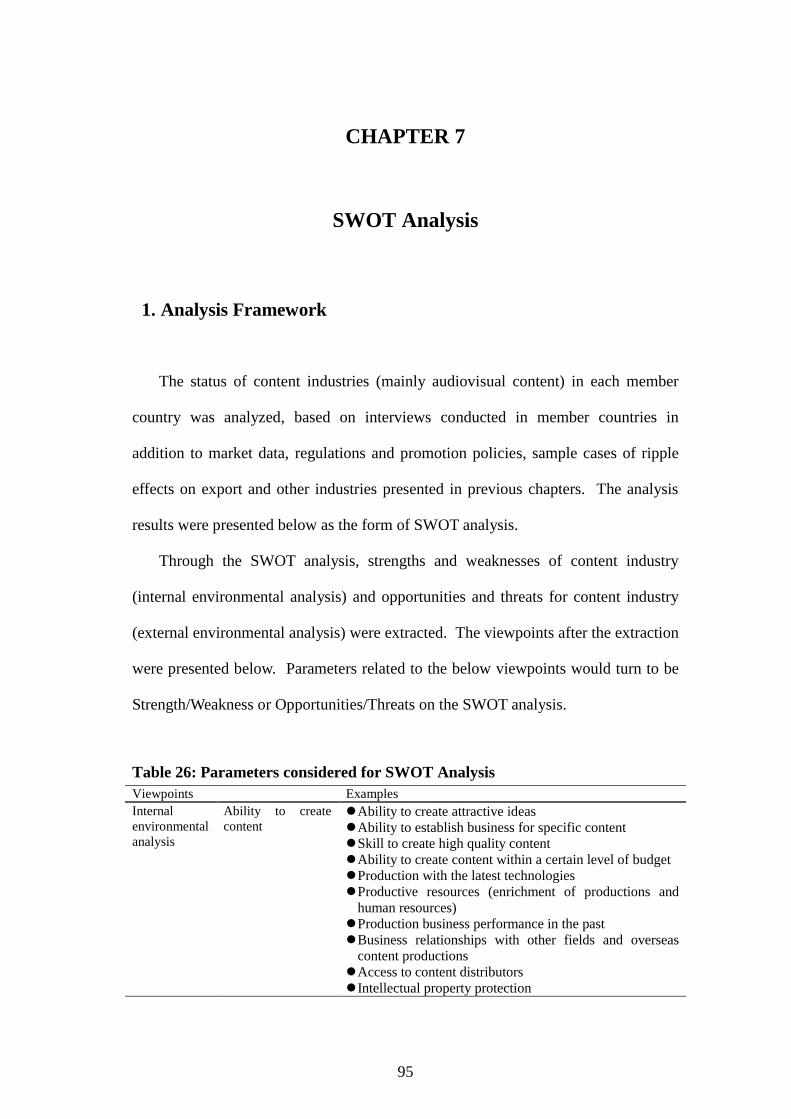
95
CHAPTER 7
SWOT Analysis
1. Analysis Framework
The status of content industries (mainly audiovisual content) in each member
country was analyzed, based on interviews conducted in member countries in
addition to market data, regulations and promotion policies, sample cases of ripple
effects on export and other industries presented in previous chapters. The analysis
results were presented below as the form of SWOT analysis.
Through the SWOT analysis, strengths and weaknesses of content industry
(internal environmental analysis) and opportunities and threats for content industry
(external environmental analysis) were extracted. The viewpoints after the extraction
were presented below. Parameters related to the below viewpoints would turn to be
Strength/Weakness or Opportunities/Threats on the SWOT analysis.
Table 26: Parameters considered for SWOT Analysis
Viewpoints Examples
Internal
environmental
analysis
Ability to create
content Ability to create attractive ideas
Ability to establish business for specific content
Skill to create high quality content
Ability to create content within a certain level of budget
Production with the latest technologies
Productive resources (enrichment of productions and
human resources)
Production business performance in the past
Business relationships with other fields and overseas
content productions
Access to content distributors
Intellectual property protection
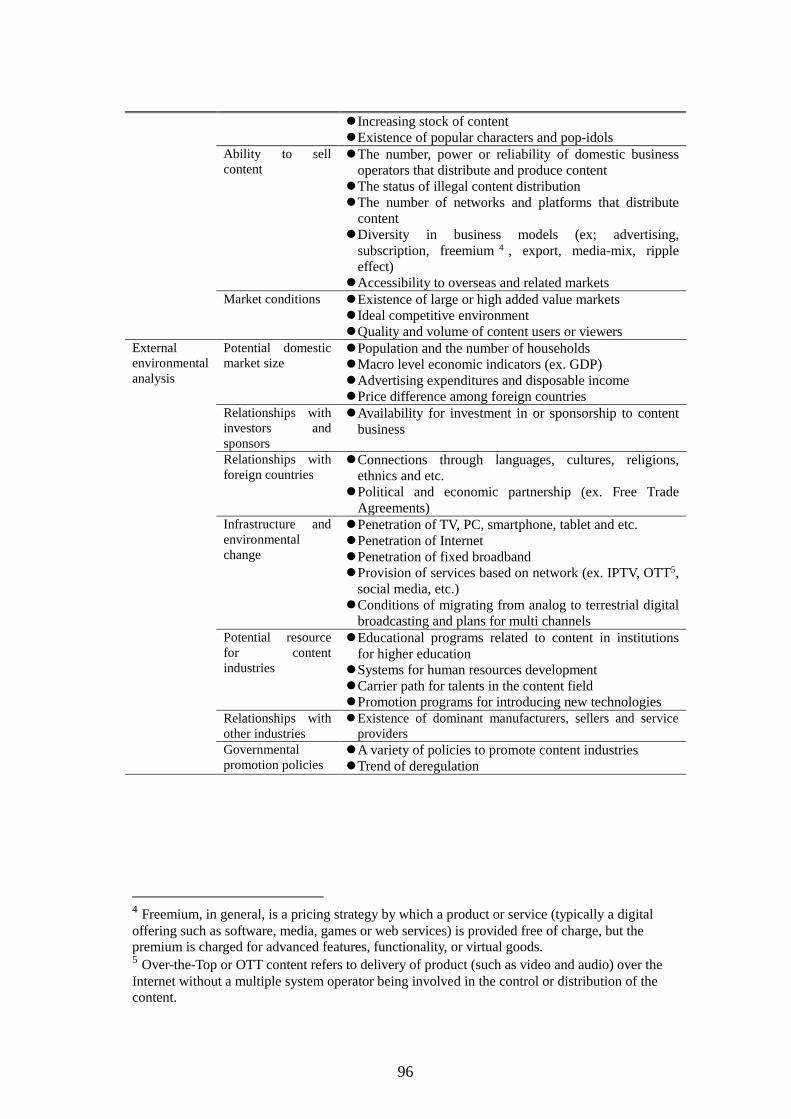
96
Increasing stock of content
Existence of popular characters and pop-idols
Ability to sell
content The number, power or reliability of domestic business
operators that distribute and produce content
The status of illegal content distribution
The number of networks and platforms that distribute
content
Diversity in business models (ex; advertising,
subscription, freemium 4 , export, media-mix, ripple
effect)
Accessibility to overseas and related markets
Market conditions Existence of large or high added value markets
Ideal competitive environment
Quality and volume of content users or viewers
External
environmental
analysis
Potential domestic
market size Population and the number of households
Macro level economic indicators (ex. GDP)
Advertising expenditures and disposable income
Price difference among foreign countries
Relationships with
investors and
sponsors
Availability for investment in or sponsorship to content
business
Relationships with
foreign countries Connections through languages, cultures, religions,
ethnics and etc.
Political and economic partnership (ex. Free Trade
Agreements)
Infrastructure and
environmental
change
Penetration of TV, PC, smartphone, tablet and etc.
Penetration of Internet
Penetration of fixed broadband
Provision of services based on network (ex. IPTV, OTT5,
social media, etc.)
Conditions of migrating from analog to terrestrial digital
broadcasting and plans for multi channels
Potential resource
for content
industries
Educational programs related to content in institutions
for higher education
Systems for human resources development
Carrier path for talents in the content field
Promotion programs for introducing new technologies
Relationships with
other industries
Existence of dominant manufacturers, sellers and service
providers
Governmental
promotion policies A variety of policies to promote content industries
Trend of deregulation
4 Freemium, in general, is a pricing strategy by which a product or service (typically a digital
offering such as software, media, games or web services) is provided free of charge, but the
premium is charged for advanced features, functionality, or virtual goods. 5 Over-the-Top or OTT content refers to delivery of product (such as video and audio) over the
Internet without a multiple system operator being involved in the control or distribution of the
content.
97
2. Results
The results of SWOT analysis in each member country were presented below.
As mentioned above, the results were based on various indices, market data,
regulations, interviews with specialists in each member country.
2.1. China
The size and growth of the domestic market is a huge advantage. Along with the
growth of the domestic market, domestic content supply capability (production
capability) is also increasing. Aggressive promotion in the global market has been
conducted. Furthermore, the country has the advantage of low production costs.
However, it does not yet have enough sales performance abroad.
In addition to the potential size of the domestic market, it is likely that more
Chinese companies will advance into the global market, and business expansion
overseas is expected.
Though market expansion is progressing, countermeasure against piracy are a
critical issue in the domestic market. Additionally the economies of scale are not
always working because the domestic market is divided by a variety of languages
and ethnic groups. Regulations related to importing programs have the possibility of
being a factor suppressing the growth of the domestic market.
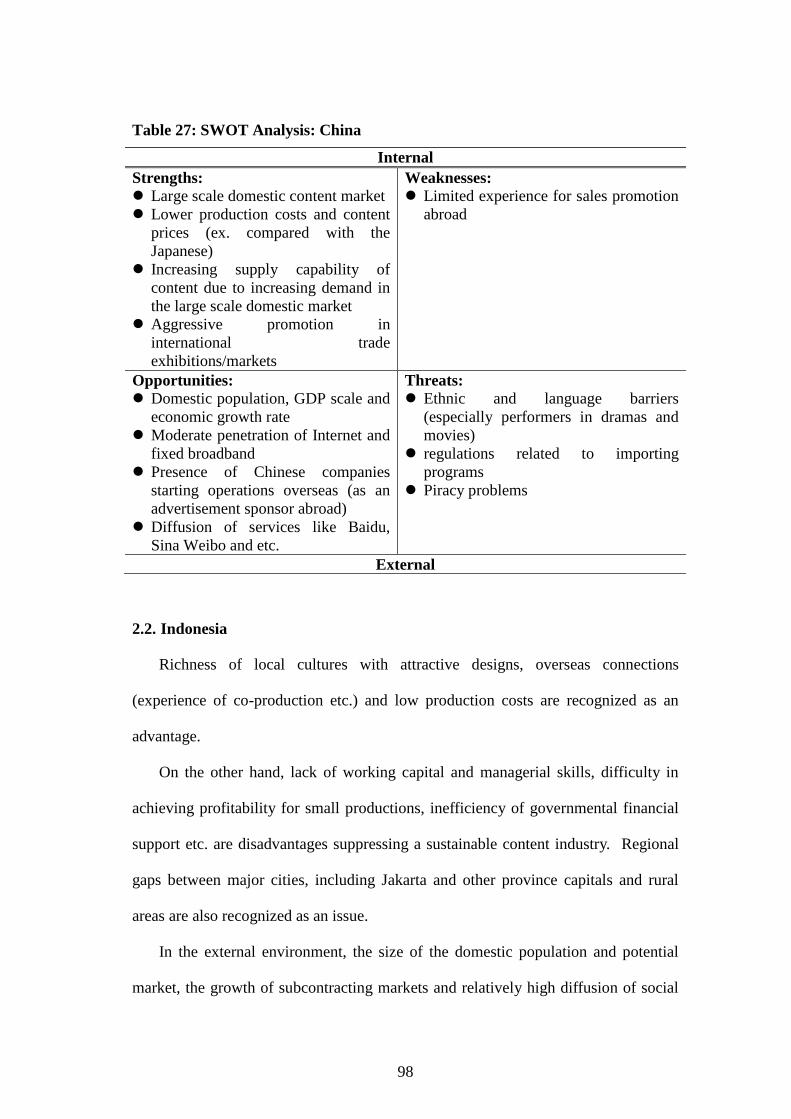
98
Table 27: SWOT Analysis: China
Internal
Strengths:
Large scale domestic content market
Lower production costs and content
prices (ex. compared with the
Japanese)
Increasing supply capability of
content due to increasing demand in
the large scale domestic market
Aggressive promotion in
international trade
exhibitions/markets
Weaknesses:
Limited experience for sales promotion
abroad
Opportunities:
Domestic population, GDP scale and
economic growth rate
Moderate penetration of Internet and
fixed broadband
Presence of Chinese companies
starting operations overseas (as an
advertisement sponsor abroad)
Diffusion of services like Baidu,
Sina Weibo and etc.
Threats:
Ethnic and language barriers
(especially performers in dramas and
movies)
regulations related to importing
programs
Piracy problems
External
2.2. Indonesia
Richness of local cultures with attractive designs, overseas connections
(experience of co-production etc.) and low production costs are recognized as an
advantage.
On the other hand, lack of working capital and managerial skills, difficulty in
achieving profitability for small productions, inefficiency of governmental financial
support etc. are disadvantages suppressing a sustainable content industry. Regional
gaps between major cities, including Jakarta and other province capitals and rural
areas are also recognized as an issue.
In the external environment, the size of the domestic population and potential
market, the growth of subcontracting markets and relatively high diffusion of social
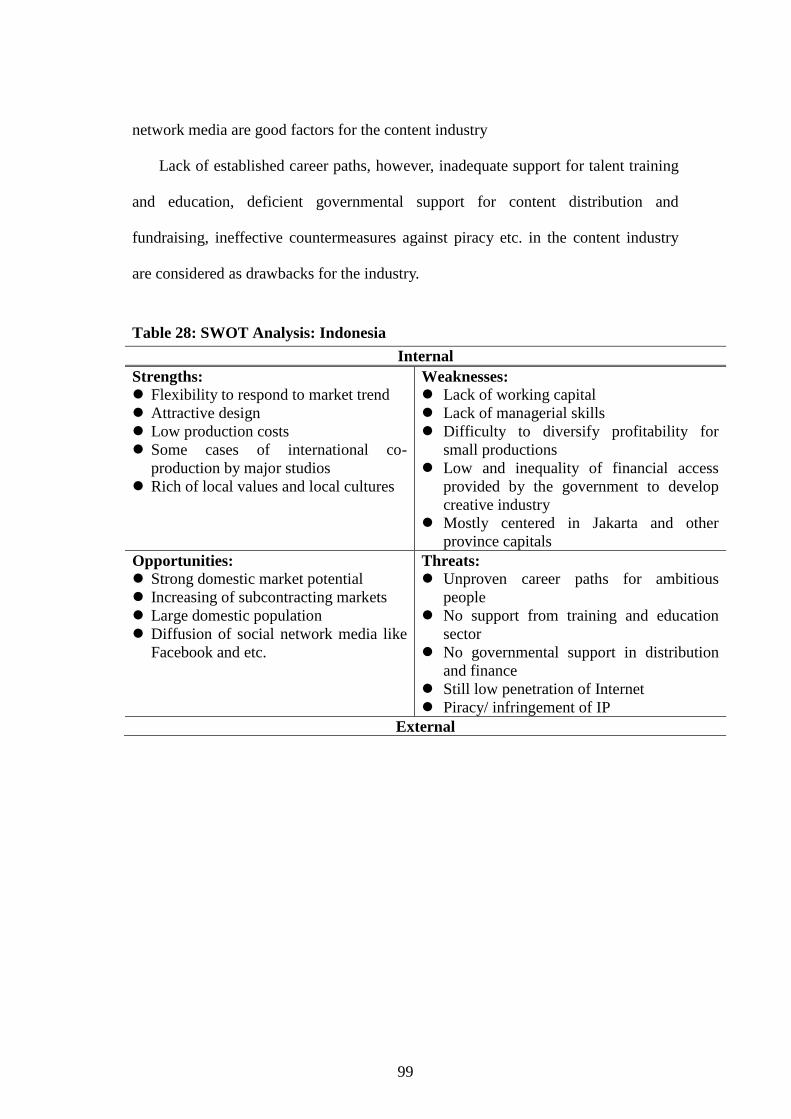
99
network media are good factors for the content industry
Lack of established career paths, however, inadequate support for talent training
and education, deficient governmental support for content distribution and
fundraising, ineffective countermeasures against piracy etc. in the content industry
are considered as drawbacks for the industry.
Table 28: SWOT Analysis: Indonesia
Internal
Strengths:
Flexibility to respond to market trend
Attractive design
Low production costs
Some cases of international co-
production by major studios
Rich of local values and local cultures
Weaknesses:
Lack of working capital
Lack of managerial skills
Difficulty to diversify profitability for
small productions
Low and inequality of financial access
provided by the government to develop
creative industry
Mostly centered in Jakarta and other
province capitals
Opportunities:
Strong domestic market potential
Increasing of subcontracting markets
Large domestic population
Diffusion of social network media like
Facebook and etc.
Threats:
Unproven career paths for ambitious
people
No support from training and education
sector
No governmental support in distribution
and finance
Still low penetration of Internet
Piracy/ infringement of IP
External
100
2.3. Japan
Along with a relatively large domestic market, high planning and production
capabilities, an established production environment including related industries and
technologies, holding plenty of attractive content, the popularity of Japanese content
in the global market are considered as advantages.
On the other hand, the mature market with low growth, relatively high
production costs, differences in needs and business customs between the domestic
and overseas markets, unsuccessful efforts for generating profit from interest in
Japanese content abroad, insufficient promotion policies or support systems to sell
content abroad etc. are disadvantages.
In the external environment, high GDP and GDP per capita, the high diffusion of
network infrastructure including the Internet, diffusion of services such as Nicovideo
and LINE, many Japanese companies operating overseas, strengthened support by
public-private partnerships to promote Japanese content etc. are good factors for the
content industry.
Depopulation and aging, however, maturation and low growth in the domestic
economy, the unpopularity of broadcast media in the young generation, language
barriers, insufficient governmental support, and the necessity of countermeasures
against piracy are considered as problems.
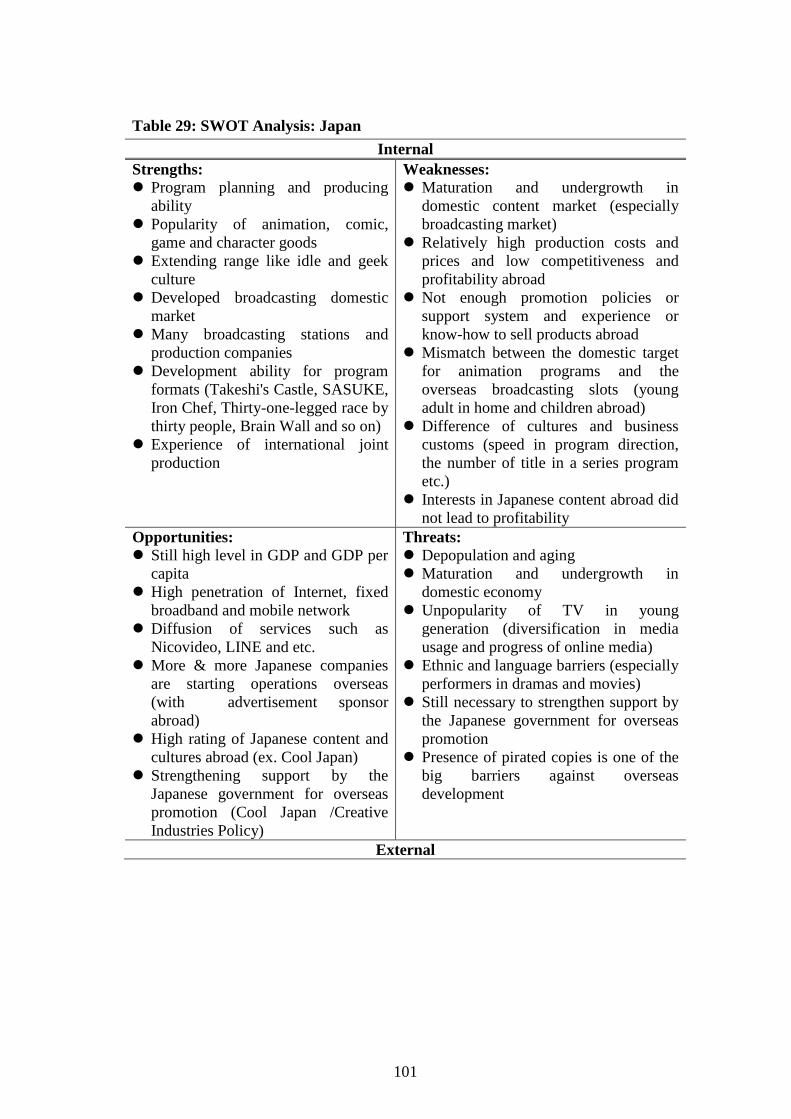
101
Table 29: SWOT Analysis: Japan
Internal
Strengths:
Program planning and producing
ability
Popularity of animation, comic,
game and character goods
Extending range like idle and geek
culture
Developed broadcasting domestic
market
Many broadcasting stations and
production companies
Development ability for program
formats (Takeshi's Castle, SASUKE,
Iron Chef, Thirty-one-legged race by
thirty people, Brain Wall and so on)
Experience of international joint
production
Weaknesses:
Maturation and undergrowth in
domestic content market (especially
broadcasting market)
Relatively high production costs and
prices and low competitiveness and
profitability abroad
Not enough promotion policies or
support system and experience or
know-how to sell products abroad
Mismatch between the domestic target
for animation programs and the
overseas broadcasting slots (young
adult in home and children abroad)
Difference of cultures and business
customs (speed in program direction,
the number of title in a series program
etc.)
Interests in Japanese content abroad did
not lead to profitability
Opportunities:
Still high level in GDP and GDP per
capita
High penetration of Internet, fixed
broadband and mobile network
Diffusion of services such as
Nicovideo, LINE and etc.
More & more Japanese companies
are starting operations overseas
(with advertisement sponsor
abroad)
High rating of Japanese content and
cultures abroad (ex. Cool Japan)
Strengthening support by the
Japanese government for overseas
promotion (Cool Japan /Creative
Industries Policy)
Threats:
Depopulation and aging
Maturation and undergrowth in
domestic economy
Unpopularity of TV in young
generation (diversification in media
usage and progress of online media)
Ethnic and language barriers (especially
performers in dramas and movies)
Still necessary to strengthen support by
the Japanese government for overseas
promotion
Presence of pirated copies is one of the
big barriers against overseas
development
External
102
2.4. Korea
The well-established system to support content exports, profitable results from
trading content in overseas markets, the popularity of Korean content domestically
and internationally, ripple effects on other business fields, relatively low production
costs and selling prices are advantages.
On the other hand, the small domestic market, the lack of storytelling ability,
immature market held back by piracy and the low awareness of the need for payment
for content are problems.
In the external environment, the high diffusion of network infrastructure
including the Internet, the presence of Korean companies in the global market and
high expectations on Korean content by media related companies abroad are good
factors for the content industry.
Depopulation and aging, however, language barriers, long-term economic
depression and shrinking domestic consumption are considered as problems.
103
Table 30: SWOT Analysis: Korea
Internal
Strengths:
Program planning and producing
ability
Popularity of “Korean made” content
(drama and music)
Preference of domestic content
Ripple effect on tourism and industrial
products
Overseas promotion based on
cooperation between the Korean
government and private companies
High presence in overseas markets
(established Korean content in overseas
countries)
Lower production costs and content
prices (especially as compared with the
Japanese one)
Weaknesses:
Limited size of domestic market and
importance of exportation in content
industries
Lack of storytelling ability
Immature market caused by piracy
and devaluation of content purchase
price
Opportunities:
High penetration of Internet, fixed
broadband, mobile network and
smartphone
Presence of Korean companies starting
operations overseas and good condition
and their good condition in business (as
an advertisement sponsor abroad)
Expectation on Korean content by
media related companies abroad
(acquisition of content with potential
high program rating)
Threats:
Depopulation and aging
Ethnic and language barriers
(especially performers in dramas and
movies)
Long-term economic depression and
consumption shrinking
External
104
2.5. Malaysia
Strong governmental support for the content industry, the availability of raw
talent in content fields, growing presence in overseas markets for animation and live
action, active overseas promotion by business entrepreneurs are advantages.
On the other hand, the small domestic market, human resource scarcity for
production, the necessity of expanding investment, slow growth in subscription
services as compared with the diffusion of satellite broadcasting, still limited
successful cases of sales promotion abroad are problems.
In the external environment, relatively high GDP per capita, the fairly strong
diffusion of the Internet, the launch of terrestrial digital broadcasting in the near
future and strong relationship with Islamic nations which provide wide opportunity
for market expansion, are good factors for the content industry.
The small size of the domestic population, however, high dependence on exports,
the brain drain from the domestic market, and a “comfort zone mentality” are
considered as problems
105
Table 31: SWOT Analysis: Malaysia
Internal
Strengths:
Strong government support in developing
the creative content sector (national
policy, developmental programs, grants,
incentives)
Availability of raw talent that can be
trained
Growing presence in the international
market as a regional player for animation
and live action production
Active overseas promotion of industry
players who are capable of servicing the
needs of the global market
Weaknesses:
Limited domestic market size
Limited size of human resource for
production (labor shortage and etc.)
Necessity of expanding investment in
productions due to relatively high
production costs and insufficient budget
in some cases
Diffusion of satellite broadcasting and
relatively slow growth of other
subscription services (ex. IPTV and etc.)
Aggressive sales promotion abroad and
still limited successful cases (the most
popular and valuable programs produced
domestically in most countries)
Opportunities:
Relatively high level in GDP per capita
Good penetration of Internet
Start of terrestrial digital broadcasting at
the end of 2013 and the completion of
shifting predicted by 2015
Strong connections with Islamic nations,
which provide wide opportunity for
market expansion
Threats:
Limited size of domestic population
Importance of export and import in the
content industry as same as other
industries
Brain drain into other countries
Comfort zone mentality
External
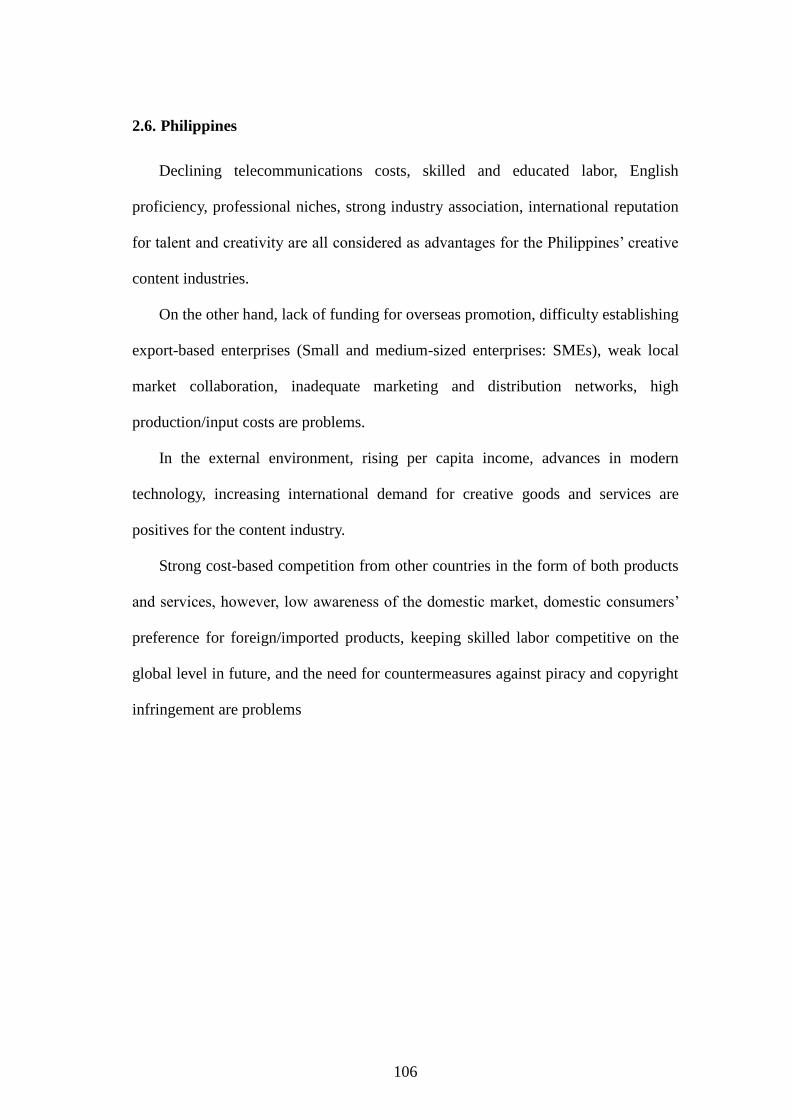
106
2.6. Philippines
Declining telecommunications costs, skilled and educated labor, English
proficiency, professional niches, strong industry association, international reputation
for talent and creativity are all considered as advantages for the Philippines’ creative
content industries.
On the other hand, lack of funding for overseas promotion, difficulty establishing
export-based enterprises (Small and medium-sized enterprises: SMEs), weak local
market collaboration, inadequate marketing and distribution networks, high
production/input costs are problems.
In the external environment, rising per capita income, advances in modern
technology, increasing international demand for creative goods and services are
positives for the content industry.
Strong cost-based competition from other countries in the form of both products
and services, however, low awareness of the domestic market, domestic consumers’
preference for foreign/imported products, keeping skilled labor competitive on the
global level in future, and the need for countermeasures against piracy and copyright
infringement are problems
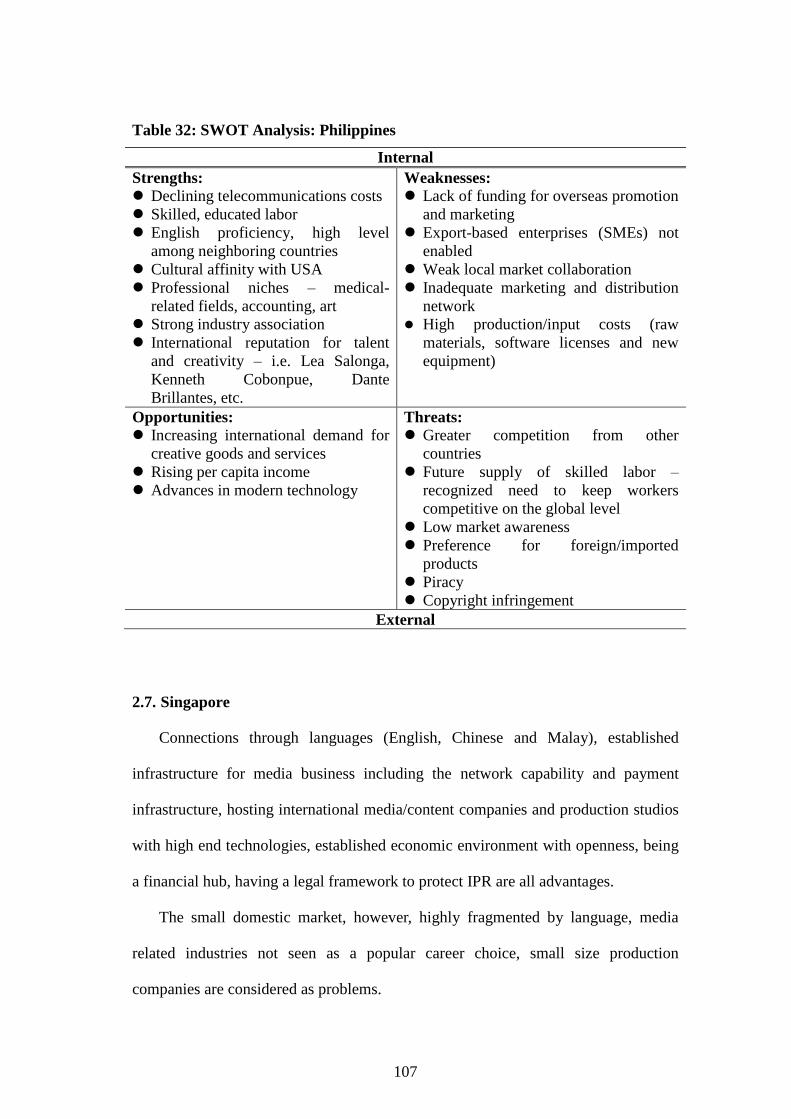
107
Table 32: SWOT Analysis: Philippines
Internal
Strengths:
Declining telecommunications costs
Skilled, educated labor
English proficiency, high level
among neighboring countries
Cultural affinity with USA
Professional niches – medical-
related fields, accounting, art
Strong industry association
International reputation for talent
and creativity – i.e. Lea Salonga,
Kenneth Cobonpue, Dante
Brillantes, etc.
Weaknesses:
Lack of funding for overseas promotion
and marketing
Export-based enterprises (SMEs) not
enabled
Weak local market collaboration
Inadequate marketing and distribution
network
High production/input costs (raw
materials, software licenses and new
equipment)
Opportunities:
Increasing international demand for
creative goods and services
Rising per capita income
Advances in modern technology
Threats:
Greater competition from other
countries
Future supply of skilled labor –
recognized need to keep workers
competitive on the global level
Low market awareness
Preference for foreign/imported
products
Piracy
Copyright infringement
External
2.7. Singapore
Connections through languages (English, Chinese and Malay), established
infrastructure for media business including the network capability and payment
infrastructure, hosting international media/content companies and production studios
with high end technologies, established economic environment with openness, being
a financial hub, having a legal framework to protect IPR are all advantages.
The small domestic market, however, highly fragmented by language, media
related industries not seen as a popular career choice, small size production
companies are considered as problems.
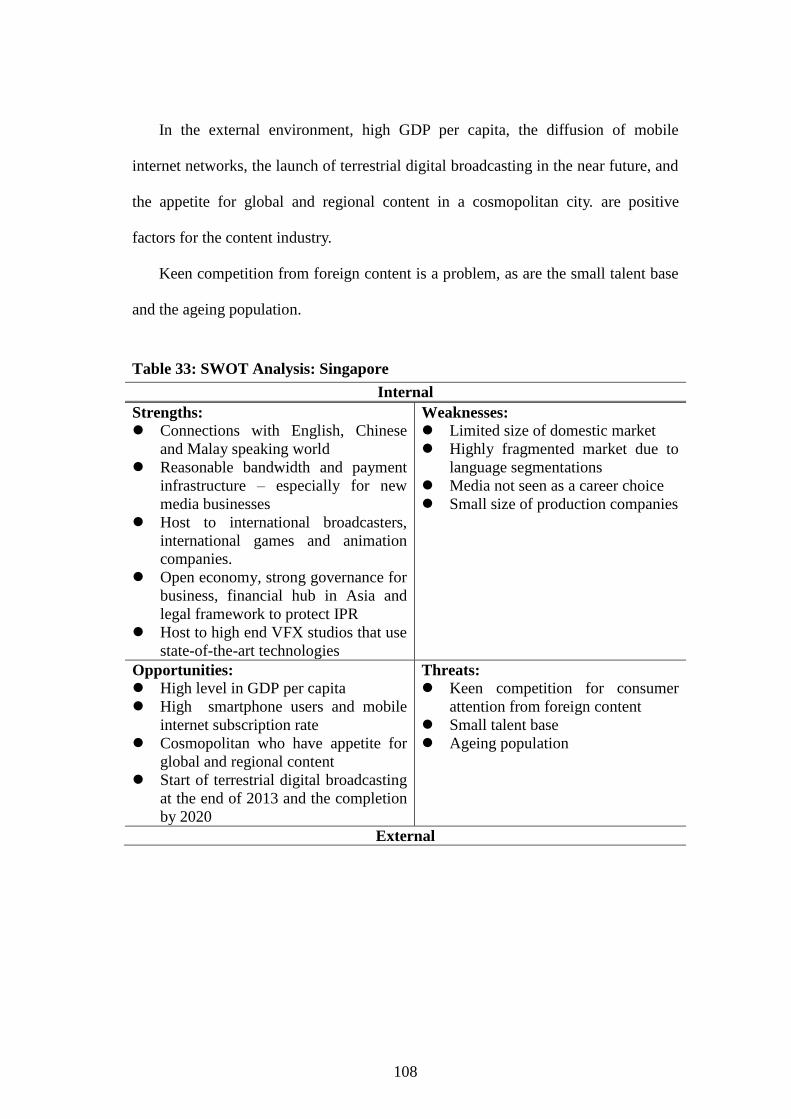
108
In the external environment, high GDP per capita, the diffusion of mobile
internet networks, the launch of terrestrial digital broadcasting in the near future, and
the appetite for global and regional content in a cosmopolitan city. are positive
factors for the content industry.
Keen competition from foreign content is a problem, as are the small talent base
and the ageing population.
Table 33: SWOT Analysis: Singapore
Internal
Strengths:
Connections with English, Chinese
and Malay speaking world
Reasonable bandwidth and payment
infrastructure – especially for new
media businesses
Host to international broadcasters,
international games and animation
companies.
Open economy, strong governance for
business, financial hub in Asia and
legal framework to protect IPR
Host to high end VFX studios that use
state-of-the-art technologies
Weaknesses:
Limited size of domestic market
Highly fragmented market due to
language segmentations
Media not seen as a career choice
Small size of production companies
Opportunities:
High level in GDP per capita
High smartphone users and mobile
internet subscription rate
Cosmopolitan who have appetite for
global and regional content
Start of terrestrial digital broadcasting
at the end of 2013 and the completion
by 2020
Threats:
Keen competition for consumer
attention from foreign content
Small talent base
Ageing population
External
109
2.8. Thailand
A fast growing domestic market, the high quality of the content industry
including related industries and human resources, a variety of film locations and
facilities services, progressive overseas development by domestic business
entrepreneurs, some cases of ripple effect on tourism and other fields are advantages.
The relatively limited governmental resources available to assist private
companies, however, weak human resources development programs within the
industry, many different regulatory government departments related to the content
industries, absence of established conditions of agreement for international
cooperation are problems.
In the external environment, with an affluent population, high economic growth
in a variety of fields is expected. Growing spending power along with a growing
middle class, the launch of terrestrial digital broadcasting, economic integration in
ASEAN scheduled in 2016 are positive factors for the content industry.
Low average GDP per capita, however, undeveloped broadband networks,
unstable power supply, the shortage of funding and staff in governmental support for
the content industry, insufficient measures in terms of tax incentives and other
privileges offered to business entrepreneurs, lack of legal enforcement to suppress
copyright violation and the existence of censorship in films are problems.
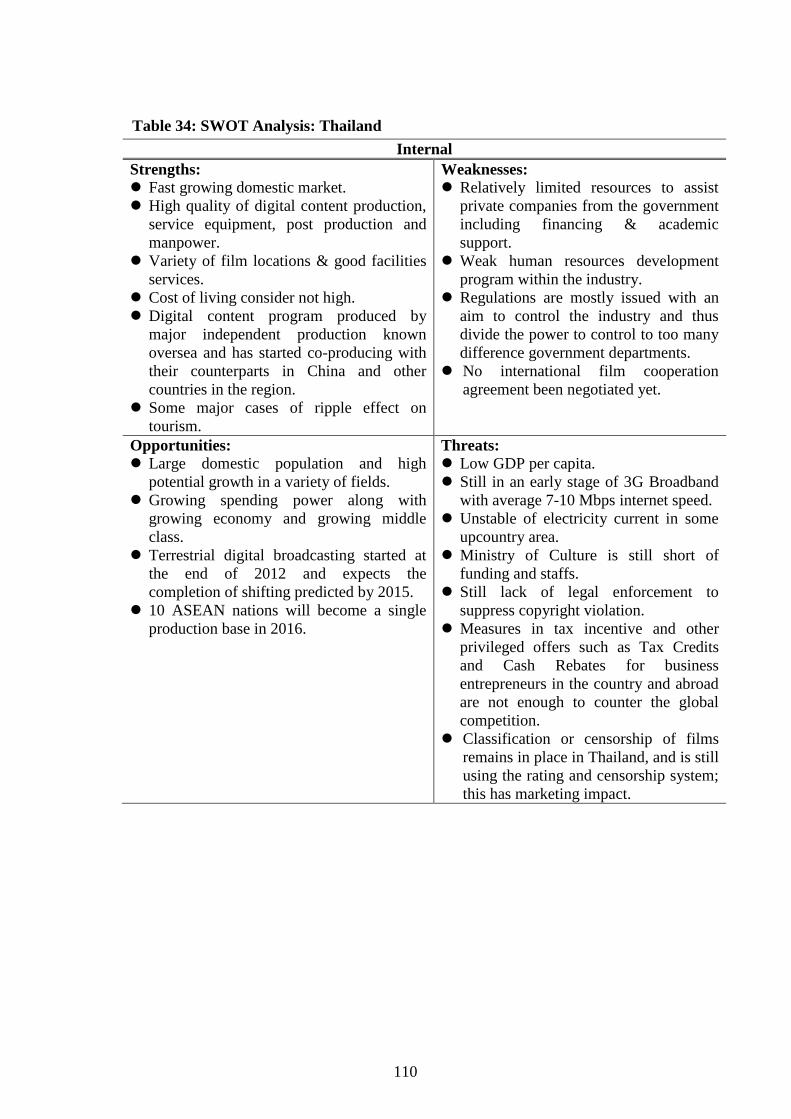
110
Table 34: SWOT Analysis: Thailand
Internal
Strengths:
Fast growing domestic market.
High quality of digital content production,
service equipment, post production and
manpower.
Variety of film locations & good facilities
services.
Cost of living consider not high.
Digital content program produced by
major independent production known
oversea and has started co-producing with
their counterparts in China and other
countries in the region.
Some major cases of ripple effect on
tourism.
Weaknesses:
Relatively limited resources to assist
private companies from the government
including financing & academic
support.
Weak human resources development
program within the industry.
Regulations are mostly issued with an
aim to control the industry and thus
divide the power to control to too many
difference government departments.
No international film cooperation
agreement been negotiated yet.
Opportunities:
Large domestic population and high
potential growth in a variety of fields.
Growing spending power along with
growing economy and growing middle
class.
Terrestrial digital broadcasting started at
the end of 2012 and expects the
completion of shifting predicted by 2015.
10 ASEAN nations will become a single
production base in 2016.
Threats:
Low GDP per capita.
Still in an early stage of 3G Broadband
with average 7-10 Mbps internet speed.
Unstable of electricity current in some
upcountry area.
Ministry of Culture is still short of
funding and staffs.
Still lack of legal enforcement to
suppress copyright violation.
Measures in tax incentive and other
privileged offers such as Tax Credits
and Cash Rebates for business
entrepreneurs in the country and abroad
are not enough to counter the global
competition.
Classification or censorship of films
remains in place in Thailand, and is still
using the rating and censorship system;
this has marketing impact.
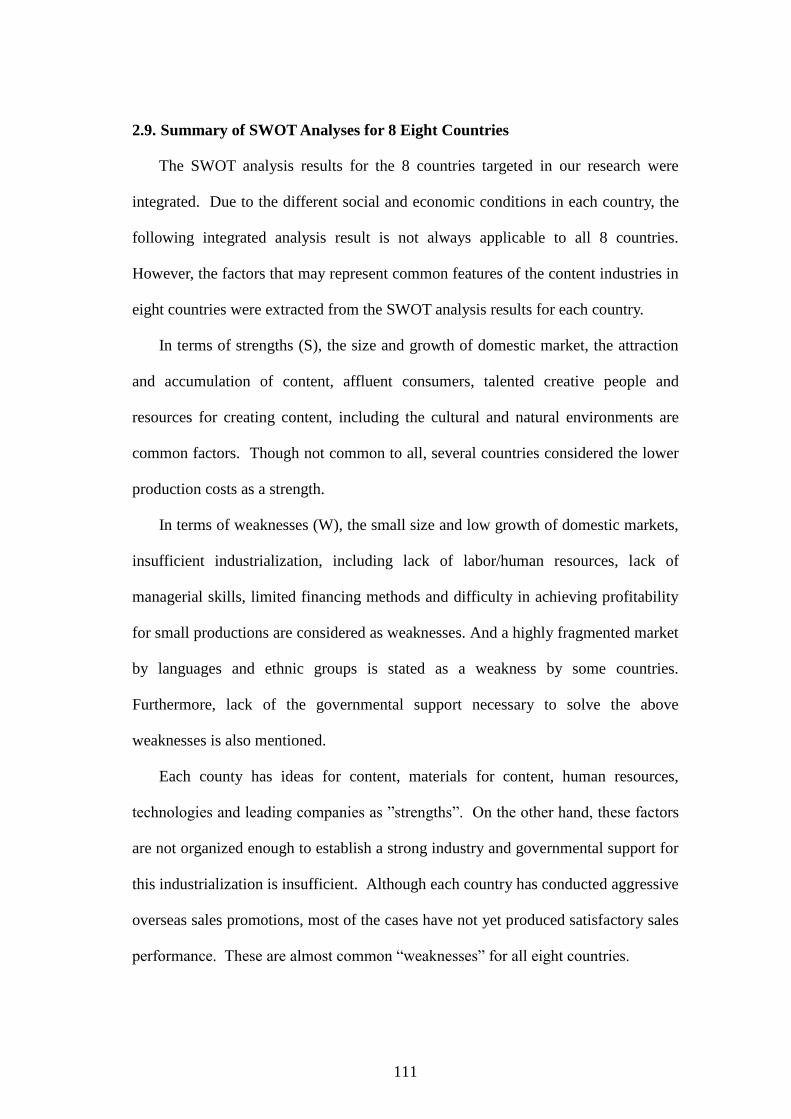
111
2.9. Summary of SWOT Analyses for 8 Eight Countries
The SWOT analysis results for the 8 countries targeted in our research were
integrated. Due to the different social and economic conditions in each country, the
following integrated analysis result is not always applicable to all 8 countries.
However, the factors that may represent common features of the content industries in
eight countries were extracted from the SWOT analysis results for each country.
In terms of strengths (S), the size and growth of domestic market, the attraction
and accumulation of content, affluent consumers, talented creative people and
resources for creating content, including the cultural and natural environments are
common factors. Though not common to all, several countries considered the lower
production costs as a strength.
In terms of weaknesses (W), the small size and low growth of domestic markets,
insufficient industrialization, including lack of labor/human resources, lack of
managerial skills, limited financing methods and difficulty in achieving profitability
for small productions are considered as weaknesses. And a highly fragmented market
by languages and ethnic groups is stated as a weakness by some countries.
Furthermore, lack of the governmental support necessary to solve the above
weaknesses is also mentioned.
Each county has ideas for content, materials for content, human resources,
technologies and leading companies as ”strengths”. On the other hand, these factors
are not organized enough to establish a strong industry and governmental support for
this industrialization is insufficient. Although each country has conducted aggressive
overseas sales promotions, most of the cases have not yet produced satisfactory sales
performance. These are almost common “weaknesses” for all eight countries.
112
In terms of opportunities (O), the expectation of market growth based on the
diffusion and improvement of communications infrastructure, increasing
international demand for content, and creative goods and services are commonly
mentioned. And in addition, more than a few countries consider the expectation of
fundamental growth, such as in the size of their population and GDP, and overseas
connections through languages and ethnic groups as opportunities.
In terms of threats (T), keen competition with foreign companies along with
growing international demand for content, problems of piracy and copyright
infringement, the necessity for proper governmental roles, suitable organizations, and
lack of budgetary provision are indicated as threats.
This means that increasing international demand calls for stricter
countermeasures against piracy, and keen global competition requires more
aggressive governmental involvement.
* All factors in the SWOT table are not always applicable for all 8 countries (the
factors that are applicable for most of countries were extracted).
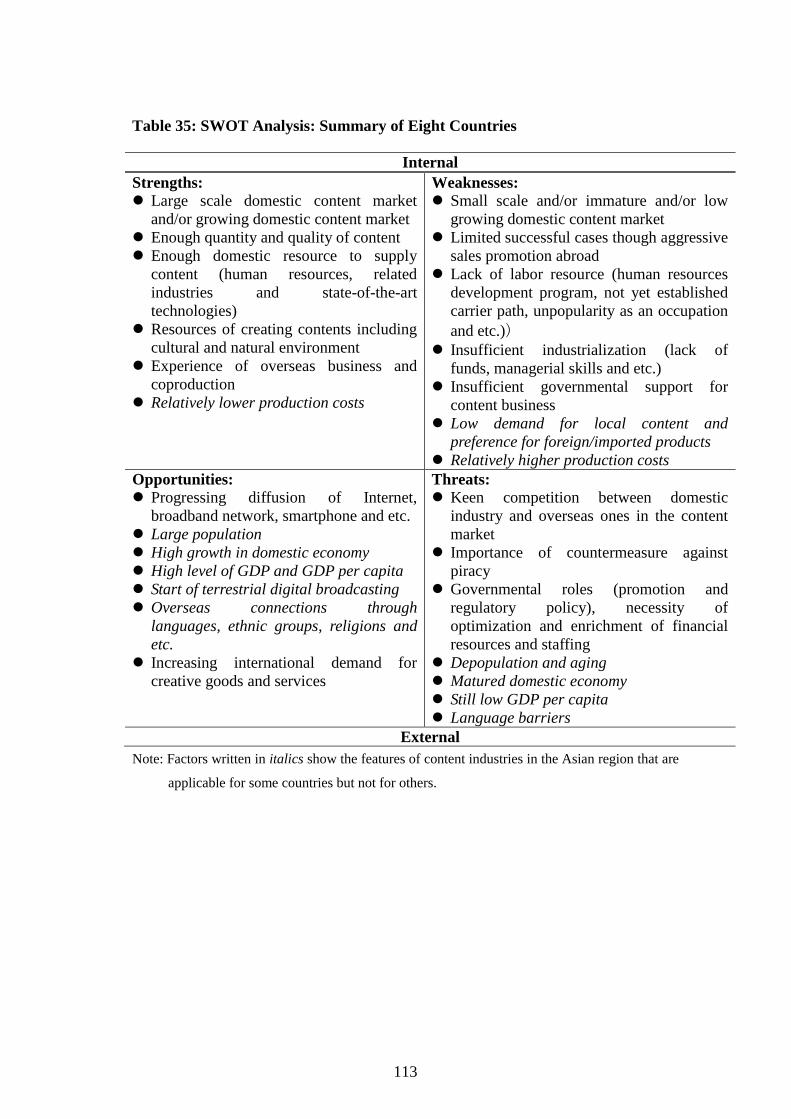
113
Table 35: SWOT Analysis: Summary of Eight Countries
Internal
Strengths:
Large scale domestic content market
and/or growing domestic content market
Enough quantity and quality of content
Enough domestic resource to supply
content (human resources, related
industries and state-of-the-art
technologies)
Resources of creating contents including
cultural and natural environment
Experience of overseas business and
coproduction
Relatively lower production costs
Weaknesses:
Small scale and/or immature and/or low
growing domestic content market
Limited successful cases though aggressive
sales promotion abroad
Lack of labor resource (human resources
development program, not yet established
carrier path, unpopularity as an occupation
and etc.))
Insufficient industrialization (lack of
funds, managerial skills and etc.)
Insufficient governmental support for
content business
Low demand for local content and
preference for foreign/imported products
Relatively higher production costs
Opportunities:
Progressing diffusion of Internet,
broadband network, smartphone and etc.
Large population
High growth in domestic economy
High level of GDP and GDP per capita
Start of terrestrial digital broadcasting
Overseas connections through
languages, ethnic groups, religions and
etc.
Increasing international demand for
creative goods and services
Threats:
Keen competition between domestic
industry and overseas ones in the content
market
Importance of countermeasure against
piracy
Governmental roles (promotion and
regulatory policy), necessity of
optimization and enrichment of financial
resources and staffing
Depopulation and aging
Matured domestic economy
Still low GDP per capita
Language barriers
External
Note: Factors written in italics show the features of content industries in the Asian region that are
applicable for some countries but not for others.
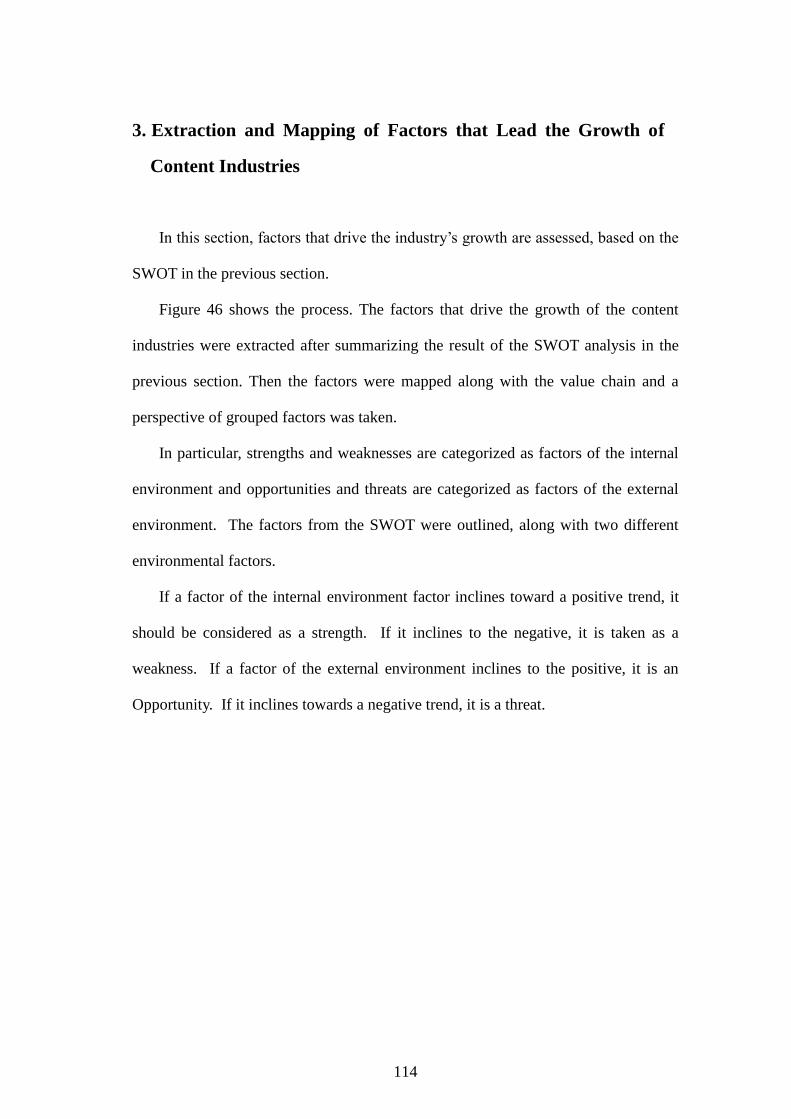
114
3. Extraction and Mapping of Factors that Lead the Growth of
Content Industries
In this section, factors that drive the industry’s growth are assessed, based on the
SWOT in the previous section.
Figure 46 shows the process. The factors that drive the growth of the content
industries were extracted after summarizing the result of the SWOT analysis in the
previous section. Then the factors were mapped along with the value chain and a
perspective of grouped factors was taken.
In particular, strengths and weaknesses are categorized as factors of the internal
environment and opportunities and threats are categorized as factors of the external
environment. The factors from the SWOT were outlined, along with two different
environmental factors.
If a factor of the internal environment factor inclines toward a positive trend, it
should be considered as a strength. If it inclines to the negative, it is taken as a
weakness. If a factor of the external environment inclines to the positive, it is an
Opportunity. If it inclines towards a negative trend, it is a threat.
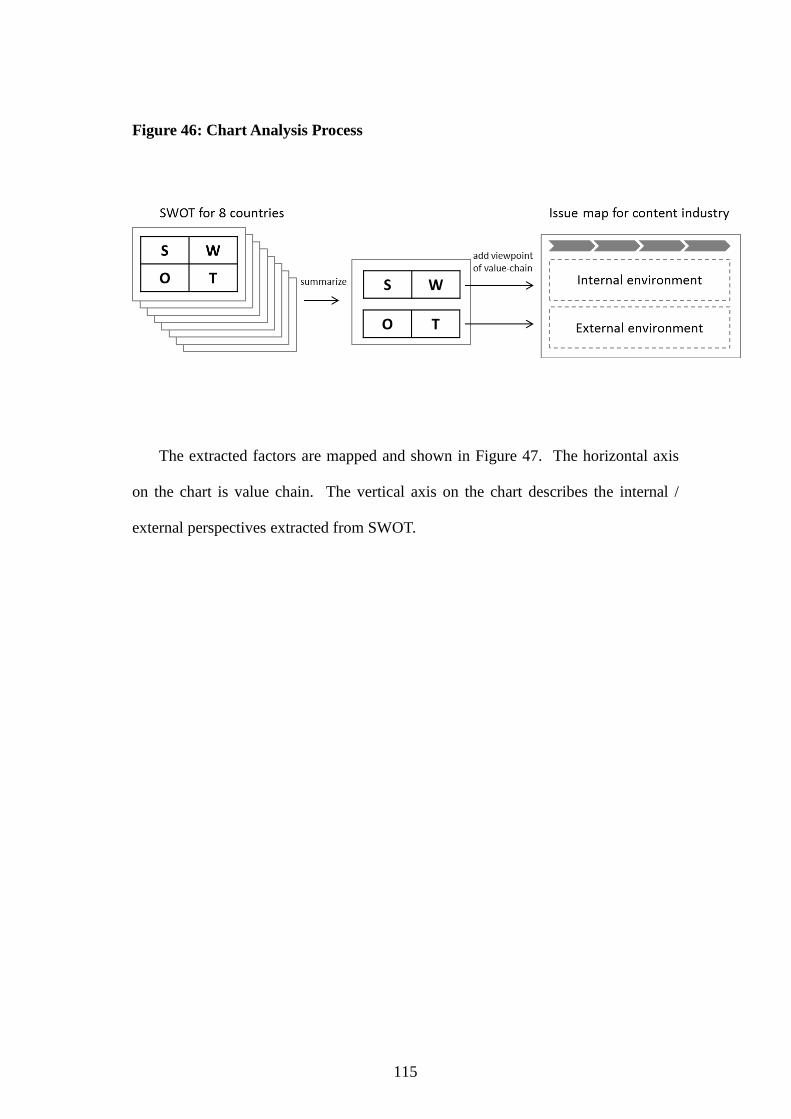
115
Figure 46: Chart Analysis Process
The extracted factors are mapped and shown in Figure 47. The horizontal axis
on the chart is value chain. The vertical axis on the chart describes the internal /
external perspectives extracted from SWOT.
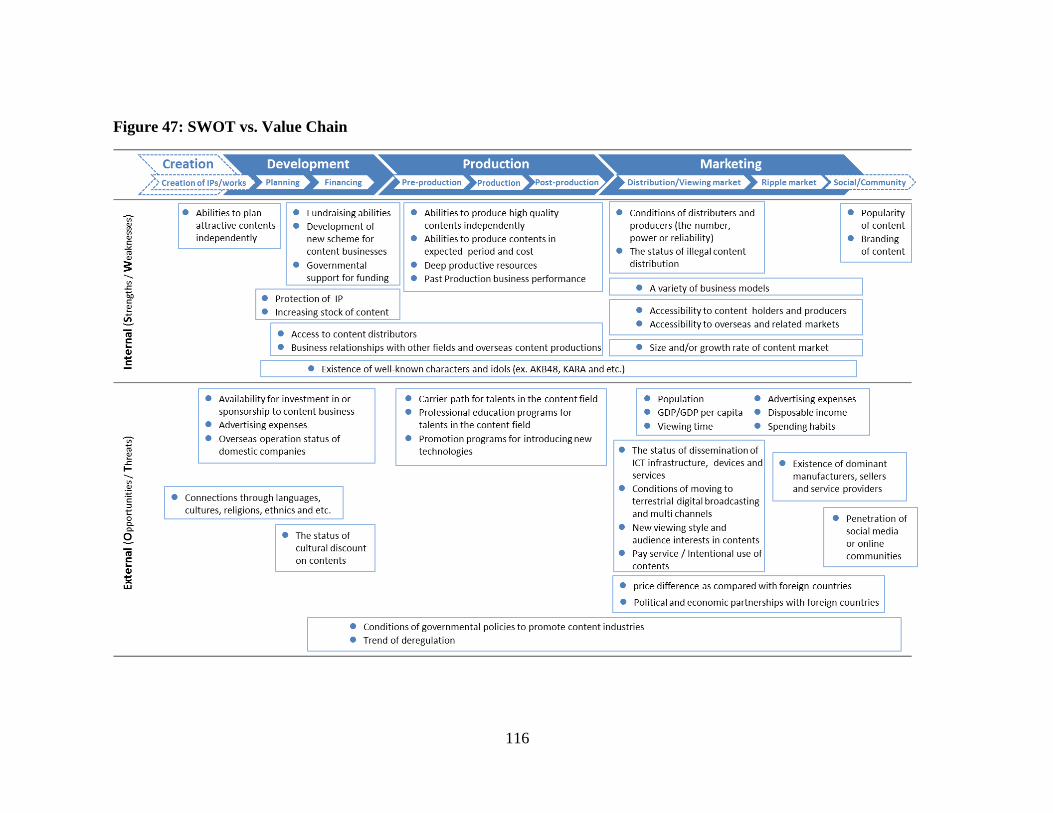
116
Figure 47: SWOT vs. Value Chain

117
The chart overviews the factors of internal and external environment in content
industries along with the value chain. The chart depicts grouped factors necessary to be
considered in content industries. Each factor mapped on the chart is essential for
industry growth.

118
119
CHAPTER 8
Policy Recommendation
1. Discussion Process of Policy Recommendations
Based on the research described above, and the analysis results, the working group
members discussed policy recommendations and the following opinions were
proposed.
- The aim of a policy recommendation should be agreed and then detailed items
would be considered.
- Detailed items mentioned below are essential: a common framework for content
satellite account6, measures to lower the barriers for content market convergence,
human resource development, funding schemes, antipiracy measures, easing import
regulation.
- Even though a small market in a single country, establishing a bigger content
market in the region and expanding businesses’ scale can be expected through
cooperation among member countries. Measures to create a bigger market are
critical.
- of the first step towards realizing the above ideas would be active discussion and
exchange of information among governments of member countries, followed by the
promotion of concrete projects such as co-production.
6 OECD defines satellite accounts as follows.Satellite accounts provide a framework linked to the
central accounts and which enables attention to be focussed on a certain field or aspect of
economic and social life in the context of national accounts; common examples are satellite
accounts for the environment, or tourism, or unpaid household work.
http://stats.oecd.org/glossary/detail.asp?ID=2385
120
Based on these opinions, in addition to the results of the research and analysis
described in chapters 3 to 7, important items were identified and proposed as policy
recommendations for this project. The details of the policy recommendations are
introduced in the next section.
2. Policy Recommendations
[Policy objectives]
First, each country has its own content market contributing to its domestic
economy. Through achievement of the potential for the content market in each
country, more contribution to the domestic economy would be expected. (See
Chapters 3 and 4.)
Secondly, in addition to domestic effort in each country, promoting content
exchange and co-production inside the region would be expected to lead to more
effective economic contribution. (See Chapter 5 and 7.)
The policy objectives were determined as described later based on these points
of view.
[Policy recommendation]
1. Promotion of collaboration to establish and enhance content industries in each
country
In the discussion of policy recommendations by working group, most members
stated the necessity of increasing opportunities for sharing information and
exchanging ideas. As a first step towards accomplishing two policy objectives, it is
considered definitely important to extend these kinds of opportunities.
121
2. Reinforcement of factors in content industries in each country
Based on the discussion in the working group meeting, individual items of policy
recommendation were proposed from the following four points of view: human
resource development, business promotion, expansion of content trading, and
effective use of new technologies.
2.1. Human resource development
The importance of human resource development was often suggested in
interviews in each member country (See Chapter 7). It is essential not only to secure
high level creators and professionals for the production process but to develop
standard training programs. This is also important to support job creation,
considering that human resources have in the past been developed through on-the-job
training in many cases. Furthermore, easing business visa regulations and
simplifying the procedures for travel abroad are also considered as critical for
increasing the opportunities of co-production and employment in other countries.
2.2. Business promotion
The importance of increasing funding, and sharing business resources for
localization of content to promote content business in each member country, were
suggested by the working group. Even though industrial resources regarding
planning, producing and distributing contents have been established to some extent
in each country, fundraising and resources for distributing contents in other countries
are still lacking. And through co-production more enhancement of planning and
producing and consequent mutual growth are expected.
It is expected that strengthening these functions would bring further growth to
the content market in each country. (See Chapter 7.)
2.3. Expansion of content trading
As stated in the policy objective, promoting content trade is also critical for the
growth of the content industry in each country. (See Chapters 5 and 7.)
For the purpose of encouraging content trade, and dealing with copyright
infringement, strong initiatives to disrupt the distribution of pirated content and
122
promote the trading of legal materials are urgently needed. Cooperation among
member countries on anti-piracy measures, and the easing of regulations restricting
legal content imports are desirable. (See Chapter 7.)
2.4. Effective use of new technology
Some members of the working group believed that while the content industry
creates new markets through the development and use of new technologies, some
existing content markets may decline.
While introducing new technologies is important for the growth of the content
industry, further information-sharing and the exchange of ideas among governments
and business operators in each county is considered as critical for the industry’s
growth. Promoting international standardization of the new technologies is also
considered important for the growth of the content industry in the region.
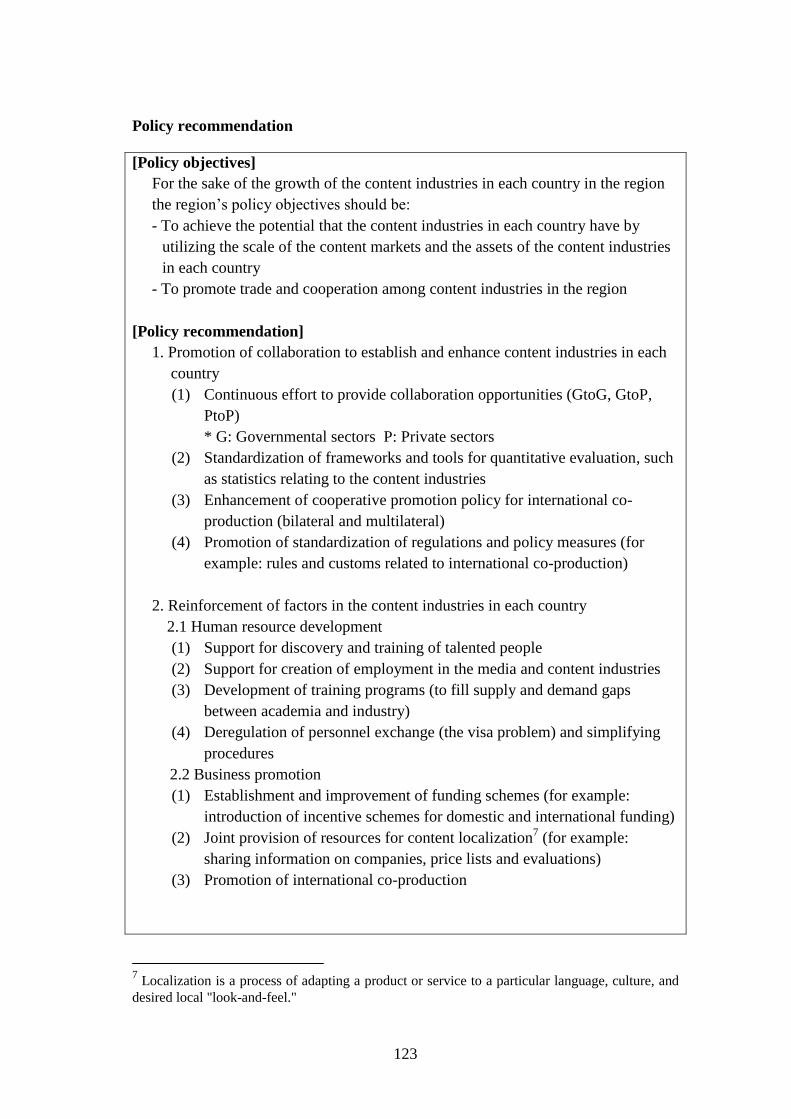
123
Policy recommendation
[Policy objectives]
For the sake of the growth of the content industries in each country in the region
the region’s policy objectives should be:
- To achieve the potential that the content industries in each country have by
utilizing the scale of the content markets and the assets of the content industries
in each country
- To promote trade and cooperation among content industries in the region
[Policy recommendation]
1. Promotion of collaboration to establish and enhance content industries in each
country
(1) Continuous effort to provide collaboration opportunities (GtoG, GtoP,
PtoP)
* G: Governmental sectors P: Private sectors
(2) Standardization of frameworks and tools for quantitative evaluation, such
as statistics relating to the content industries
(3) Enhancement of cooperative promotion policy for international co-
production (bilateral and multilateral)
(4) Promotion of standardization of regulations and policy measures (for
example: rules and customs related to international co-production)
2. Reinforcement of factors in the content industries in each country
2.1 Human resource development
(1) Support for discovery and training of talented people
(2) Support for creation of employment in the media and content industries
(3) Development of training programs (to fill supply and demand gaps
between academia and industry)
(4) Deregulation of personnel exchange (the visa problem) and simplifying
procedures
2.2 Business promotion
(1) Establishment and improvement of funding schemes (for example:
introduction of incentive schemes for domestic and international funding)
(2) Joint provision of resources for content localization7 (for example:
sharing information on companies, price lists and evaluations)
(3) Promotion of international co-production
7 Localization is a process of adapting a product or service to a particular language, culture, and
desired local "look-and-feel."

124
2.3 Expansion of content trading
(1) Creation of a common intellectual property system
(2) Joint countermeasures against piracy
(3) Deregulation of imports of legal content
2.4 Effective use of new technologies
(1) Provision of opportunities for information sharing and exchange of ideas
among governments and business operators of each county
(2) Promotion of international standardization of new technologies
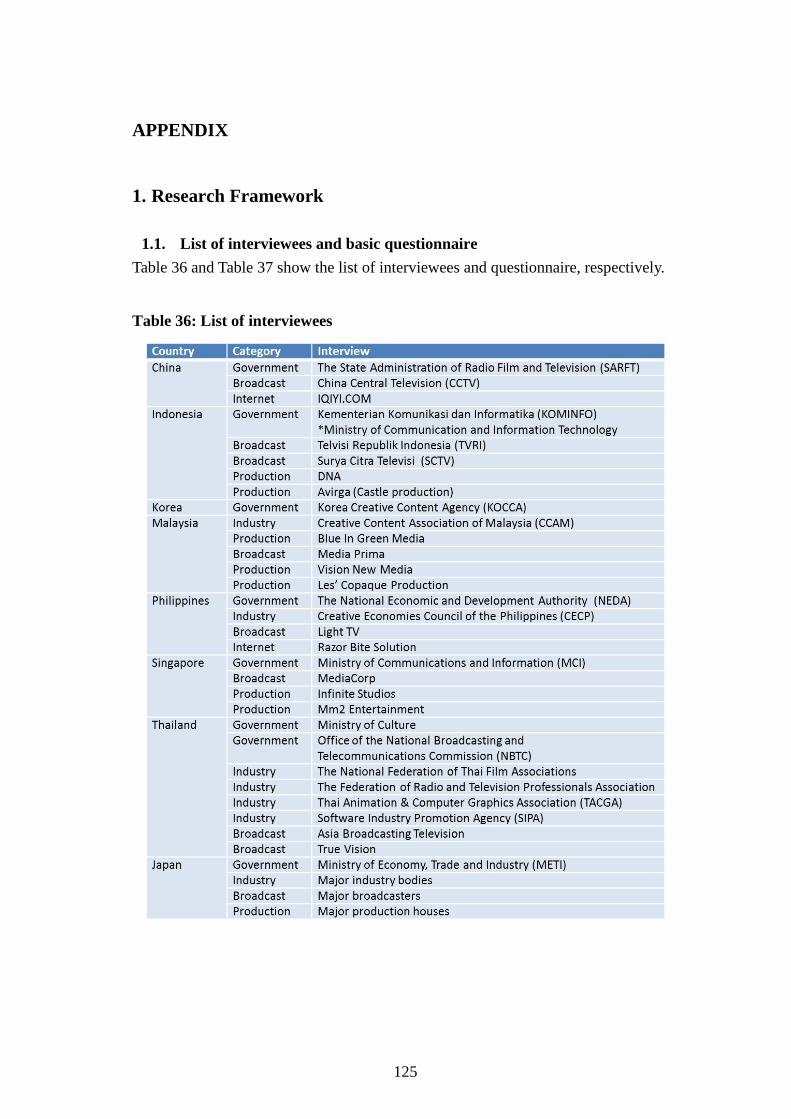
125
APPENDIX
1. Research Framework
1.1. List of interviewees and basic questionnaire
Table 36 and Table 37 show the list of interviewees and questionnaire, respectively.
Table 36: List of interviewees
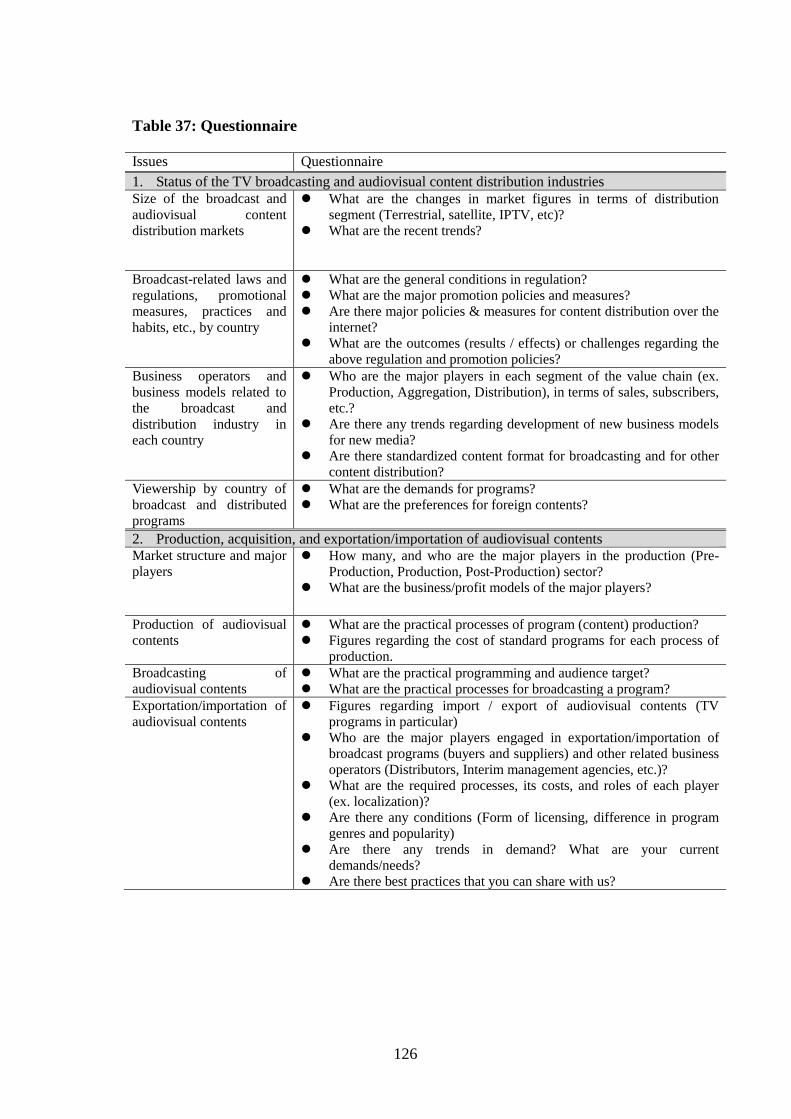
126
Table 37: Questionnaire
Issues Questionnaire
1. Status of the TV broadcasting and audiovisual content distribution industries Size of the broadcast and
audiovisual content
distribution markets
What are the changes in market figures in terms of distribution
segment (Terrestrial, satellite, IPTV, etc)?
What are the recent trends?
Broadcast-related laws and
regulations, promotional
measures, practices and
habits, etc., by country
What are the general conditions in regulation?
What are the major promotion policies and measures?
Are there major policies & measures for content distribution over the
internet?
What are the outcomes (results / effects) or challenges regarding the
above regulation and promotion policies?
Business operators and
business models related to
the broadcast and
distribution industry in
each country
Who are the major players in each segment of the value chain (ex.
Production, Aggregation, Distribution), in terms of sales, subscribers,
etc.?
Are there any trends regarding development of new business models
for new media?
Are there standardized content format for broadcasting and for other
content distribution?
Viewership by country of
broadcast and distributed
programs
What are the demands for programs?
What are the preferences for foreign contents?
2. Production, acquisition, and exportation/importation of audiovisual contents Market structure and major
players
How many, and who are the major players in the production (Pre-
Production, Production, Post-Production) sector?
What are the business/profit models of the major players?
Production of audiovisual
contents What are the practical processes of program (content) production?
Figures regarding the cost of standard programs for each process of
production.
Broadcasting of
audiovisual contents What are the practical programming and audience target?
What are the practical processes for broadcasting a program?
Exportation/importation of
audiovisual contents
Figures regarding import / export of audiovisual contents (TV
programs in particular)
Who are the major players engaged in exportation/importation of
broadcast programs (buyers and suppliers) and other related business
operators (Distributors, Interim management agencies, etc.)?
What are the required processes, its costs, and roles of each player
(ex. localization)?
Are there any conditions (Form of licensing, difference in program
genres and popularity)
Are there any trends in demand? What are your current
demands/needs?
Are there best practices that you can share with us?
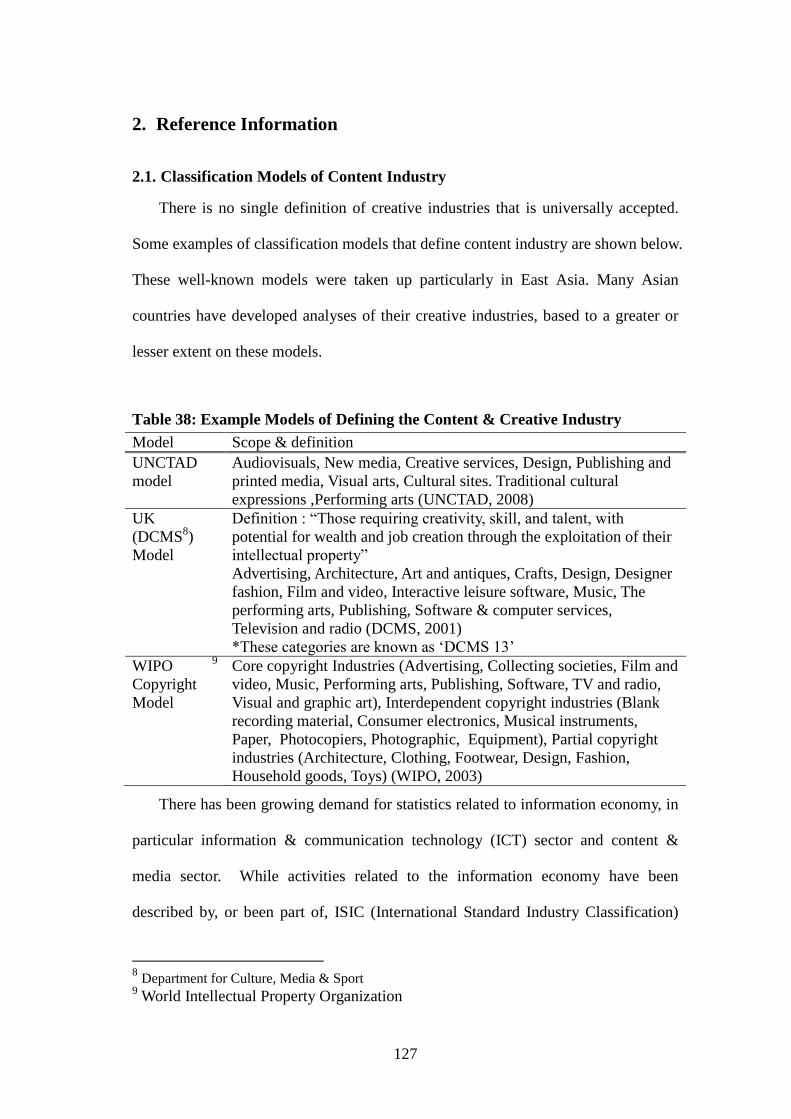
127
2. Reference Information
2.1. Classification Models of Content Industry
There is no single definition of creative industries that is universally accepted.
Some examples of classification models that define content industry are shown below.
These well-known models were taken up particularly in East Asia. Many Asian
countries have developed analyses of their creative industries, based to a greater or
lesser extent on these models.
Table 38: Example Models of Defining the Content & Creative Industry
Model Scope & definition
UNCTAD
model
Audiovisuals, New media, Creative services, Design, Publishing and
printed media, Visual arts, Cultural sites. Traditional cultural
expressions ,Performing arts (UNCTAD, 2008)
UK
(DCMS8)
Model
Definition : “Those requiring creativity, skill, and talent, with
potential for wealth and job creation through the exploitation of their
intellectual property”
Advertising, Architecture, Art and antiques, Crafts, Design, Designer
fashion, Film and video, Interactive leisure software, Music, The
performing arts, Publishing, Software & computer services,
Television and radio (DCMS, 2001)
*These categories are known as ‘DCMS 13’
WIPO9
Copyright
Model
Core copyright Industries (Advertising, Collecting societies, Film and
video, Music, Performing arts, Publishing, Software, TV and radio,
Visual and graphic art), Interdependent copyright industries (Blank
recording material, Consumer electronics, Musical instruments,
Paper, Photocopiers, Photographic, Equipment), Partial copyright
industries (Architecture, Clothing, Footwear, Design, Fashion,
Household goods, Toys) (WIPO, 2003)
There has been growing demand for statistics related to information economy, in
particular information & communication technology (ICT) sector and content &
media sector. While activities related to the information economy have been
described by, or been part of, ISIC (International Standard Industry Classification)
8 Department for Culture, Media & Sport
9 World Intellectual Property Organization
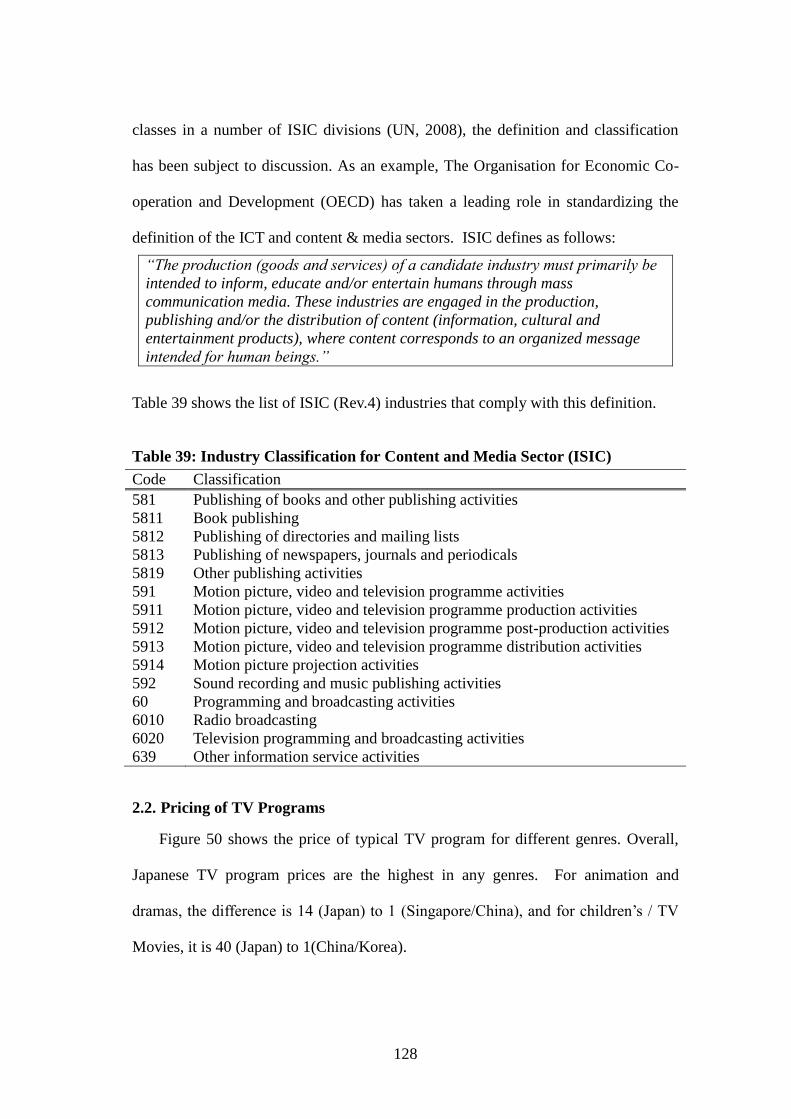
128
classes in a number of ISIC divisions (UN, 2008), the definition and classification
has been subject to discussion. As an example, The Organisation for Economic Co-
operation and Development (OECD) has taken a leading role in standardizing the
definition of the ICT and content & media sectors. ISIC defines as follows:
“The production (goods and services) of a candidate industry must primarily be
intended to inform, educate and/or entertain humans through mass
communication media. These industries are engaged in the production,
publishing and/or the distribution of content (information, cultural and
entertainment products), where content corresponds to an organized message
intended for human beings.”
Table 39 shows the list of ISIC (Rev.4) industries that comply with this definition.
Table 39: Industry Classification for Content and Media Sector (ISIC)
Code Classification
581 Publishing of books and other publishing activities
5811 Book publishing
5812 Publishing of directories and mailing lists
5813 Publishing of newspapers, journals and periodicals
5819 Other publishing activities
591 Motion picture, video and television programme activities
5911 Motion picture, video and television programme production activities
5912 Motion picture, video and television programme post-production activities
5913 Motion picture, video and television programme distribution activities
5914 Motion picture projection activities
592 Sound recording and music publishing activities
60 Programming and broadcasting activities
6010 Radio broadcasting
6020 Television programming and broadcasting activities
639 Other information service activities
2.2. Pricing of TV Programs
Figure 50 shows the price of typical TV program for different genres. Overall,
Japanese TV program prices are the highest in any genres. For animation and
dramas, the difference is 14 (Japan) to 1 (Singapore/China), and for children’s / TV
Movies, it is 40 (Japan) to 1(China/Korea).
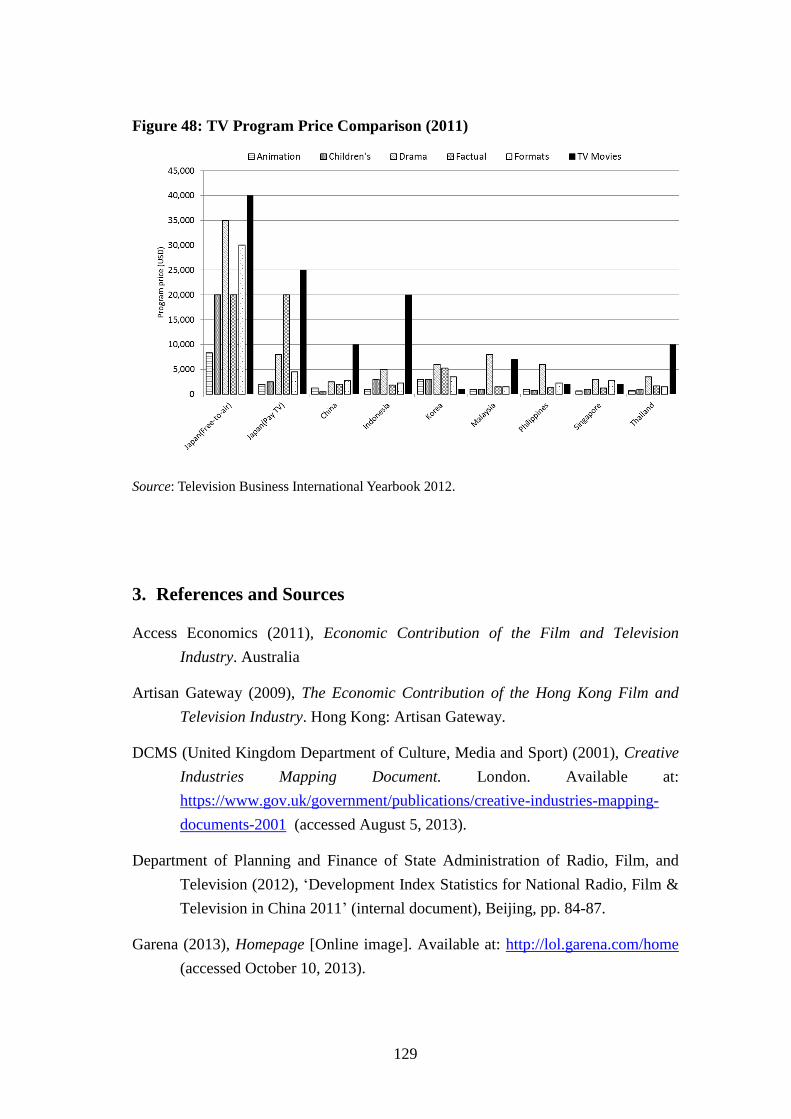
129
Figure 48: TV Program Price Comparison (2011)
Source: Television Business International Yearbook 2012.
3. References and Sources
Access Economics (2011), Economic Contribution of the Film and Television
Industry. Australia
Artisan Gateway (2009), The Economic Contribution of the Hong Kong Film and
Television Industry. Hong Kong: Artisan Gateway.
DCMS (United Kingdom Department of Culture, Media and Sport) (2001), Creative
Industries Mapping Document. London. Available at:
https://www.gov.uk/government/publications/creative-industries-mapping-
documents-2001 (accessed August 5, 2013).
Department of Planning and Finance of State Administration of Radio, Film, and
Television (2012), ‘Development Index Statistics for National Radio, Film &
Television in China 2011’ (internal document), Beijing, pp. 84-87.
Garena (2013), Homepage [Online image]. Available at: http://lol.garena.com/home
(accessed October 10, 2013).
130
Hwang, Joon Suk (2012a), KOCCA (Korea Creative Content Agency), ‘Power Point
Presentation’, FY2012 ERIA Working Group Workshop, Global Expansion
of Korean Audiovisual Content.
Hwang, Joon Suk (2012b), (email by Kim, Young Soo), Internal PDF data. Sent
Wednesday 20 March 2013.
Informa telecoms & media (2011), Television Business International Yearbook 2012.
London: Informa telecoms & media.
KOCCA (Korea Creative Content Agency) (email by Kim, Young Soo) (2013)
Internal Excel file data. Sent Thursday 18 April 2013.
Korea Toursm Organization (n.d.), Image of Psy [Online image]. Available at:
http://www.ibuzzkorea.com/eng/wikikorea/ (accessed October 10, 2013).
Les' Copaque (2013), (email by Mohd Zarin Bin Abdul Karim), Image. Sent Monday
30 September 2013. Available at:
http://lescopaque.com/upload/UIS7_POSTER_v01.zip
Mitsubishi Research Institute (2012), Economic Contribution of the Japanese Film
and Television Industry. Tokyo: MRI.
Munhwa Broadcasting Corporation (MBC) (n.d.), Homepage [Online image].
Available at: http://www.imbc.com/broad/tv/drama/daejanggum/index.html
(accessed October 18, 2013).
Oxford Economics (2012), Economic Contribution of the Thailand Film and
Television Industry. London: Oxford Economics.
PricewaterhouseCoopers (2009), Economic Contribution of the New Zealand Film
and Television Industry. Wellington: PwC.
PricewaterhouseCoopers (2010), Economic Contribution of Indian Film and
Television Industry. Prepared by PricewaterCoopers for Motion Picture
Distrubutors Association (India).
PwC (PricewaterhouseCoopers) (2012), Global Entertainment and Media Outlook
2012-2016. New York: PwC.
Simatupang, T. M., S. Rustiadi and D. B. M. Situmorang (2012), ‘Enhancing the
Competitiveness of the Creative Services Sectors in Indonesia’ in Tullao, T. S.
and H. H. Lim (eds.), Developing ASEAN Economic Community (AEC) into A
131
Global Services Hub, ERIA Research Project Report 2011-1, Jakarta: ERIA,
pp.173-270.
The Association of Japanese Animations (n.d.). Available at:
http://www.aja.gr.jp/english/ (accessed July 2013).
UN (United Nations) Department of Economic and Social Affairs (2008), ISIC
(International Standard Industry Classification) Rev.4, New York. Available
at: http://unstats.un.org/unsd/cr/registry/regdntransfer.asp?f=135 (accessed
August 5, 2013).
UNCTAD (United Nations Conference on Trade and Development) (2008), Creative
Economy Report 2008: The challenge of assessing the creative economy
towards informed policy-making. Geneva. Available at:
http://unctad.org/fr/Docs/ditc20082cer_en.pdf (accessed August 5, 2013).
UNCTAD (United Nations Conference on Trade and Development) (2010), Creative
Economy Report 2010: A Feasible Development Option. Geneva. Available
at: http://unctad.org/es/Docs/ditctab20103_en.pdf (accessed August 5, 2013).
WIPO (World Intellectual Property Organization) (2003), Guide on Surveying the
Economic Contribution of the Copyright-Based Industries. Geneva. Available
at:
http://www.wipo.int/export/sites/www/freepublications/en/copyright/893/wip
o_pub_893.pdf (accessed June 4, 2013).
World Bank database (World Development Indicators), Available at:
http://data.worldbank.org/indicator/ (accessed July 2013).
4. Currency Rate
The table below shows the currency rate used in this report, in particular market
data described in Chapter 3.
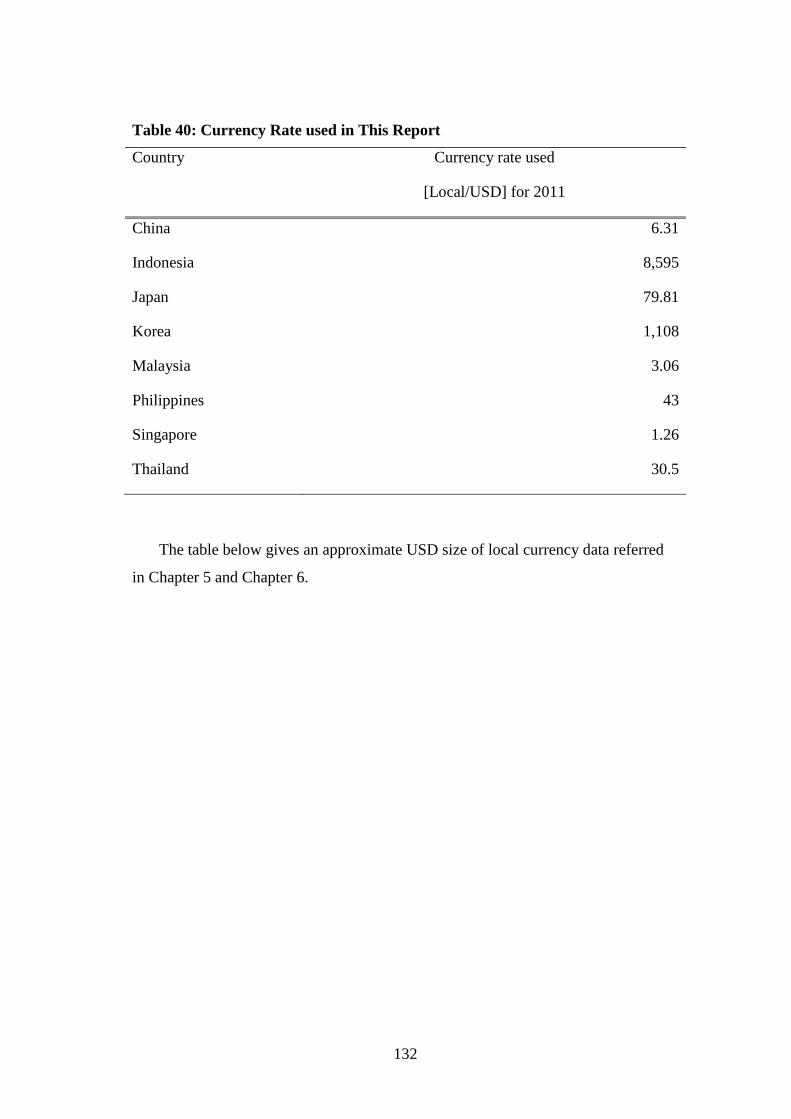
132
Table 40: Currency Rate used in This Report
Country Currency rate used
[Local/USD] for 2011
China 6.31
Indonesia 8,595
Japan 79.81
Korea 1,108
Malaysia 3.06
Philippines 43
Singapore 1.26
Thailand 30.5
The table below gives an approximate USD size of local currency data referred
in Chapter 5 and Chapter 6.
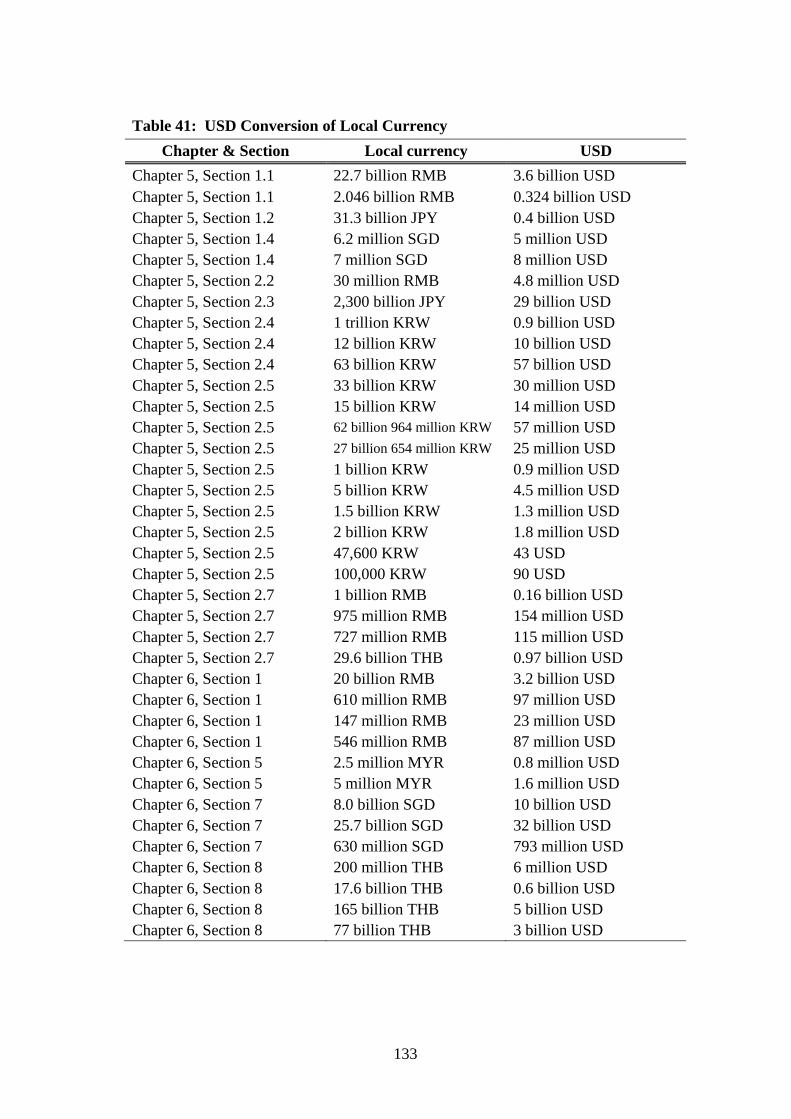
133
Table 41: USD Conversion of Local Currency
Chapter & Section Local currency USD
Chapter 5, Section 1.1 22.7 billion RMB 3.6 billion USD
Chapter 5, Section 1.1 2.046 billion RMB 0.324 billion USD
Chapter 5, Section 1.2 31.3 billion JPY 0.4 billion USD
Chapter 5, Section 1.4 6.2 million SGD 5 million USD
Chapter 5, Section 1.4 7 million SGD 8 million USD
Chapter 5, Section 2.2 30 million RMB 4.8 million USD
Chapter 5, Section 2.3 2,300 billion JPY 29 billion USD
Chapter 5, Section 2.4 1 trillion KRW 0.9 billion USD
Chapter 5, Section 2.4 12 billion KRW 10 billion USD
Chapter 5, Section 2.4 63 billion KRW 57 billion USD
Chapter 5, Section 2.5 33 billion KRW 30 million USD
Chapter 5, Section 2.5 15 billion KRW 14 million USD
Chapter 5, Section 2.5 62 billion 964 million KRW 57 million USD
Chapter 5, Section 2.5 27 billion 654 million KRW 25 million USD
Chapter 5, Section 2.5 1 billion KRW 0.9 million USD
Chapter 5, Section 2.5 5 billion KRW 4.5 million USD
Chapter 5, Section 2.5 1.5 billion KRW 1.3 million USD
Chapter 5, Section 2.5 2 billion KRW 1.8 million USD
Chapter 5, Section 2.5 47,600 KRW 43 USD
Chapter 5, Section 2.5 100,000 KRW 90 USD
Chapter 5, Section 2.7 1 billion RMB 0.16 billion USD
Chapter 5, Section 2.7 975 million RMB 154 million USD
Chapter 5, Section 2.7 727 million RMB 115 million USD
Chapter 5, Section 2.7 29.6 billion THB 0.97 billion USD
Chapter 6, Section 1 20 billion RMB 3.2 billion USD
Chapter 6, Section 1 610 million RMB 97 million USD
Chapter 6, Section 1 147 million RMB 23 million USD
Chapter 6, Section 1 546 million RMB 87 million USD
Chapter 6, Section 5 2.5 million MYR 0.8 million USD
Chapter 6, Section 5 5 million MYR 1.6 million USD
Chapter 6, Section 7 8.0 billion SGD 10 billion USD
Chapter 6, Section 7 25.7 billion SGD 32 billion USD
Chapter 6, Section 7 630 million SGD 793 million USD
Chapter 6, Section 8 200 million THB 6 million USD
Chapter 6, Section 8 17.6 billion THB 0.6 billion USD
Chapter 6, Section 8 165 billion THB 5 billion USD
Chapter 6, Section 8 77 billion THB 3 billion USD