Study on tariff design for distribution systems - European ...
652
Study on tariff design for distribution systems Final Report Prepared for: DIRECTORATE‐GENERAL FOR ENERGY DIRECTORATE B – Internal Energy Market 28 January 2015
-
Upload
khangminh22 -
Category
Documents
-
view
1 -
download
0
Transcript of Study on tariff design for distribution systems - European ...

Study on tariff design for distribution systems
Final Report
Prepared for:
DIRECTORATE‐GENERAL FOR ENERGY
DIRECTORATE B – Internal Energy Market
28 January 2015

2
Table of contents
1. EXECUTIVE SUMMARY AND MAIN RESULTS ................................................................. 1
2. TASK 1‐ INDICATORS OF THE COST‐EFFECTIVENESS OF THE DSOS AND THEIR OPERATIONAL EFFICIENCY .......................................................................................... 7
2.1. Introduction ......................................................................................................... 7 2.2. Criteria for identifying and selecting indicators .................................................. 10 2.3. Proposed relevant inputs ................................................................................... 11 2.4. Proposed indicators ........................................................................................... 22
3. TASK 2 ‐ EU‐WIDE PRINCIPLES FOR TARIFF REGULATION ............................................ 33 3.1. Policy objectives and the role of DSOs ................................................................ 33 3.2. Policy objectives linked to distribution tariffs ..................................................... 34 3.3. Principles of tariff regulation .............................................................................. 34 3.4. EU wide principles .............................................................................................. 38
4. TASK 3 ‐ ANALYSIS OF THE DISTRIBUTION TARIFFS AND THEIR METHODOLOGIES OR TERMS AND CONDITIONS APPROVED BY REGULATORY AUTHORITIES ........... 40
4.1. Introduction ....................................................................................................... 40 4.2. Industry structure .............................................................................................. 40 4.3. Revenue setting mechanism ............................................................................... 42 4.4. Tariffs ................................................................................................................. 61 4.5. Network development ....................................................................................... 77 4.6. Embedded generation ........................................................................................ 82 4.7. Metering ............................................................................................................ 85
5. TASK 4 ‐ IDENTIFICATION OF BEST PRACTICES TO CALCULATE AND DESIGN DISTRIBUTION TARIFFS ....................................................................................... 91
5.1. Introduction ....................................................................................................... 91 5.2. Industry structure .............................................................................................. 91 5.3. Revenue setting mechanism ............................................................................... 91 5.4. Tariffs ................................................................................................................. 99 5.5. Network development ..................................................................................... 102 5.6. Other roles of distributors ................................................................................ 104 5.7. Metering .......................................................................................................... 105
6. TASK 5 – ANALYSIS OF TARIFF STRUCTURES OF DIFFERENT USER GROUPS ............... 106 6.1. Introduction ..................................................................................................... 106 6.2. Role of setting the distribution tariff ................................................................ 106 6.3. Analysis of the Electricity Distribution Tariff ..................................................... 107 6.4. Analysis of GAS Distribution Tariff .................................................................... 128
7. TASK 6 ‐ RECOMMENDATIONS TO THE COMMISSION ............................................... 178
APPENDIX 1: COUNTRY REPORTS ............................................................................................ 183

1. Executive summary and main results
This report presents the results of the Study on Tariff Design for Distribution Systems commissioned by DG Energy to the consortium of AF‐Mercados, REF‐E and Indra.
The objective of the project is collecting information about regulatory schemes applied in the Member States to electricity and gas distribution, identifying best practices and developing recommendation for the Commission on desirable features of distribution tariff regulation, in the light of the foreseeable changes in the distribution business.
In particular, the consortium’s mandate included the following pieces of work. First, the consortium was required to develop a set of indicators allowing to compare multiple aspects of gas and electricity distribution businesses across Member States, with the ultimate purpose of assessing cost‐effectiveness, quality of service and operational efficiency. We have developed indicators of: products and services supplied by the distributors, quality of service, network topology and cost. We refer the interested reader to Section 2 of the report for the presentation of these indicators.
Second, we were required to review and discuss principles driving the design of effective tariff regulation schemes. We grouped these principles under three headings: system sustainability, which refers to the ability of the regulatory system to attract capital in the industry; economic efficiency, which refers to the ability of the regulatory system to induce cost minimization in the short and in the long term; protection, which refers to the achievement of a fair split of the surplus generated in the industry among the stakeholders, including in particular regulated firms and consumers.
Third, we were required to characterize the regulatory schemes implemented in all Member States, analyse their outcome in terms of tariff structures and levels, identify best practices and develop recommendations for the Commission. To this purpose we administered a questionnaire and a data request to all European national regulators.
While the project focused on methodological issues, we were asked to collect data from regulators on tariff levels for standard consumers and on distribution costs. We would like to stress that assessing the relative merits of regulatory schemes implemented in different countries based on the tariff and cost comparisons presented in this report would be inappropriate, as it was beyond our mandate to perform an empirical analysis of the factors affecting distribution cost and their allocation among consumer types in the Member States. Such factors include, for example, the structure of distribution and transmission networks, the degree of gas penetration, cost allocation methodologies, distributor’s responsibilities and composition of the customer base.
In the remaining of this section we highlight the general findings of our analysis, focusing on their policy implications. The existing regulation of electricity and gas distribution tariffs is in most Member States consistent with the traditional features of the distribution business, which we identify as the following:
Little generation connected to distribution networks and inflexible demand, so that the primary role of distribution consists in transferring a basically unidirectional power from the transmission network to the consumers’ premises, trough relatively passive networks;
Ensuring universal access to the service or a target network coverage, respectively for electricity and gas, and continuity of supply are the main distribution output;

2
Technology and network planning methodologies are consolidated, implying limited uncertainty optimal investment decisions and ease of auditing by regulators;
Very diverse industry structures among Member States, with high fragmentation in some countries.
The traditional features of the distribution business appear to be reflected in the structure and outcomes of regulatory systems currently implemented in most European countries. In particular:
With the exception of Great Britain, current incentive‐based regulatory schemes place little emphasis on characterizing the outputs delivered by the distributor, but for quality of service schemes in some countries;
Typically distributors are not exposed to volume risk and to the risk that their investment turn out to be less useful than expected when they were decided, for example because of lower than expected demand;
Revenue setting mechanisms based on benchmarking are implemented in countries where the distribution sector is highly fragmented;
Regulators and stakeholders are generally less involved in the decision‐making process on distribution network development, compared to transmission;
Traditional tariff structures reflect a situation of limited availability of information on each consumer’s responsibility in causing distribution costs and are also affected by affordability and fairness considerations.
As regards the outcome of the traditional regulatory models the analysis of available data on allowed revenues and distribution tariffs shows that:
Distribution tariff structures by user groups are very different among countries. For example, the share of distribution cost paid by residential users ranges from 33% to 69% for electricity and from 32% to 86% for gas.
In most countries, the share of distribution revenues from tariff components based on energy is large, resulting in an asymmetry between the structure of distribution costs (mostly fixed) and the way they are charged to consumers;
In the electricity sector the energy component applied to households is on average 69% of the total network charge. This situation is common in most countries apart from three (The Netherlands, Spain and Sweden) where the energy charge weights between 21% and 0%. In the case of industrial clients the weight of the energy component is still dominant (around 60% for both small and large industrial clients) but there is more variability among countries and the corresponding weight ranges between 13% and 100%;
In the gas sector the energy component applied to households is on average 74% of the total network charge and in all the countries with available data its weight is higher than fixed components. For large consumers the weight of energy component is lower than for household consumer, while still accounting around 61% on average. As it happens in the electricity sector, in the case of large consumers there is more variability among countries and the corresponding weight of energy components ranges between 15% and 100%;

3
Unit distribution costs are variable among countries both for electricity and gas. We stress, however, that distribution cost differences are the result of multiple factors, which the regulatory scheme is just one of and that investigating the causes of such differences was beyond the purpose of this project. Different DSOs are, in fact, required to provide different qualities of service; they serve different loads, accommodate different proportions of distributed generation and do not operate under comparable conditions in terms of, for example, density of population connected, and geographical constraints, with an impact on network design and operations;
Unit distribution costs in almost all countries fall within the range 20‐35 EUR/MWh. The variability in terms of unit cost per connection point is higher than the per MWh and the different relative position of countries confirms the different composition of user typologies, in particular in terms of consumption levels.
In the gas sector the variability of average cost shows a range between 2.17 EUR/MWh and 14.61 EUR/MWh.
The distribution activity is currently going through major changes, which may affect the structure of optimal regulatory schemes. First, an investment cycle is being spurred by the need to increase the distribution network’s capacity to host an expanding fleet of renewable generators. Future investments appear to depart from traditional distribution upgrades in several respects:
They involve innovative technologies whose cost and performances are more uncertain and on which information asymmetries between regulators and firms might be greater;
Multiple options to achieve the same results are available, such as deployment of storage capacity or increasing demand response, deploying smart technologies as an alternative to upgrading lines and substations, distributing or centralising network intelligence, developing new telecommunication infrastructures or exploiting existing ones;
Distribution investment decisions interact with the outcome of decisions in areas beyond the distributors’ control, such as renewable production targets or national deployment strategies of IT infrastructures.
Second, the content of the distribution business is enriching, as distributors take on responsibilities related to dispatch of embedded generation and flexible loads, facilitation of retail competition, energy efficiency.
Such changes are affecting the terms of the trade‐off between efficiency and protection objectives in distribution tariff regulation. Regulatory frameworks that, in our view, are most effective in the new environment share the following features, which we present next in the form of recommendations.
Recommendation 1: Distributors should not be exposed to risks related to events that are not under their control. This implies, in particular, that distributors should not be exposed to:
Volume risk given their limited control on power and gas consumption; this is a feature of regulatory schemes already deployed in most Member States either by adjusting the revenue allowance in the following years to offset volume effects or via largely capacity‐based tariffs.
The risk of cost under‐recovery in case investments turn out to be ex‐post less useful than expected.

4
Recommendation 2: major distribution network investment decisions should be subject to a structured and open ex‐ante scrutiny by stakeholders and regulators. The outcome of such scrutiny would be a thoroughly audited investment strategy which consumers could be safely required to undertake the risk of. We note incidentally that an open and inclusive decision‐making process would ease coordination of distribution investment decisions and the outcomes of related decision making streams.
Complex investment approval proceedings may place an unjustified administrative burden on small distributors and, if the distribution sector is highly fragmented, on the regulator; such cost would ultimately be passed on to consumers via distribution tariffs. Streamlined scrutiny processes, possibly boiling down just to transparency requirements, could be envisaged for investment plans meeting certain predefined conditions, set by the regulator for example via benchmarking. However, we are not aware of countries with highly fragmented distribution industries in which extensive ex‐ante scrutiny is implemented. The relative merits of alternative mechanisms to govern network development in that context are therefore largely untested.
Recommendation 3: Financial incentives have proved very effective in aligning the distributors’ objectives with the regulator’s and, ultimately, the consumers on matters such as quality of service and cost minimisation. The following features increase the power or reduce the cost for consumers of incentive‐based regulatory schemes:
Use of all available information on the efficient costs of distributors. In this respect we recommend that the Commission promote regular publication of information and data about technical features, revenue setting methodologies, output targets and allowed revenues set for distributors in all Member States. Cost unbundling of activities for which a large part of costs can be assessed in isolation – such as metering – should be promoted, as this improves the quality of the information which incentive schemes can be based on.
Focus on outputs: multiple performance dimensions, or outputs, have to be addressed by incentive‐based regulatory schemes as distributors acquire increasing responsibilities. Effective financial incentives in this context can be provided via premiums and penalties related to the achievement of pre‐determined output targets. Targets should be selected such that they directly impact on the value of the service delivered by the distributor for network users’ and, ultimately, consumers. We note incidentally that output based mechanisms can be implemented on top of a baseline tariff and investment scenario approved by the regulator along the lines of Recommendation 2.
Focus on total cost and long regulatory periods: setting allowed revenues in terms of total costs provides incentives to distributors to select the efficient combination of operating and capital costs and to exploit any opportunities to create synergies with other sectors. Long regulatory periods increase the power of such incentives.
Incentives to innovation and inter‐sectorial synergies: incentives for distributors to deploy innovative technologies should be mainly a by‐product of regulatory schemes targeting outputs, rather than being pursued through schemes targeting specific technologies or solutions. This would ensure that only innovation directly impacting on the value of the service for network users be implemented and, more generally, that regulation be technology neutral. The same recommendation holds for incentives to exploit synergies between distribution investments and the supply of non‐energy local services;

5
Re‐openings and allowed revenue indexation: allowed revenue updates during the regulatory period should be triggered only by very major events, whose occurrence and impact on cost are clearly beyond the distributor’s control. Some major cost items beyond the distributors control are known to be variable in time. When robust indexes of such costs are available, the distributor’s allowed revenues should be parametrized, in order to reduce the risk borne by distributors.
Recommendation 4: efficient distribution tariffs should be designed to send long term incremental cost signals to consumers. In general, this requires that:
Costs for consumer specific infrastructures be covered through standing charges or connection charges;
Costs for shared infrastructures be split among network users based on each one’s contribution to the infrastructure’s peak load.
This recommendation is based on the assumption – which should be investigated empirically on a case by case basis – that distribution capacity shortages are optimally addressed through network upgrades and that therefore scarcity conditions in distribution are typically transitory. If, instead, congestions turned out to be a permanent feature of optimally dimensioned distribution systems, experience in transmission and economic theory suggest that dynamic pricing systems are far more effective in rationing available capacity than time‐of‐use tariffs set long before real time.
We are not aware of any applications of dynamic charging to distribution services; therefore, any assessment of the relative merits of alternative models is speculative. However, experience in transmission pricing suggests that schemes addressing transportation capacity scarcity via locational energy price differentiation are more effective than schemes based on dynamic network charges.
The report is organised as follows. Section 2 presents a set of indicators allowing the characterisation and comparison of the activities and performance of European electricity and gas distributors. Section 3 contains the discussion of the economic principles governing tariff regulation. Section 4 contains our analysis of the distribution tariffs and their methodologies or terms and conditions in EU Member States. In Section 5, we identify and discuss best practices on distribution tariff design. Section 6 reports the results of our analysis of the tariff structures by network user groups in EU Member States. In Section 7 we develop recommendations for the Commission.

6
Aknowledgments
The authors acknowledge active involvement in the project of the European regulators, whose contribution went far beyond replying to the questionnaires.
We are also grateful for crucial inputs received from members of the project’s steering Committee:
Manuel Sanchez Jimenez, DG ENERGY
Konstantinos Stamatis, DG ENERGY
Natalie McCoy, CEER
Iain Morgan, Ofgem
Werner Friedl, E‐Control
Valentine Roux, CRE
Luis Manuel Schultz, Bundesnetzagentur
Stefano Caruggi, AEEGSI.
Finally, participants in a stakeholder meeting, held in Brussels on November 18, 2014 provided valuable contributions to the project by commenting a draft version of this report.
Disclaimer
This document has been prepared for the European Commission, however it reflects the views of the authors only and the Commission cannot be held responsible for any use which may be made of the information contained therein.

7
2. Task 1‐ Indicators of the cost‐effectiveness of the DSOs and their operational efficiency
2.1. Introduction
The merits of assessing DSO cost effectiveness and operative efficiency
This task is being undertaken with the aim of supporting the European Commission in analysing DSO performance and identifying policy options concerning electricity and natural gas distribution in Europe.
The development and application of well‐designed indicators of DSO inputs, outputs and costs has several important merits.
Firstly, indicators can reveal specific and important details of the structure of a distribution network. Given the substantial differences in distribution network structures between European countries, indicators can play a role in helping the Commission to gain a detailed understanding of the variations in network structures throughout Europe.
Beyond helping to understand the differences in physical network structure, well‐designed indicators can also shed light on various difficult‐to‐measure characteristics of distribution networks, including: the types of services offered and the quality of those services; the degree to which distributed generation capacity (including renewable generation) is integrated into the network system; and the use and effectiveness of flexibility measures by DSOs.
Thirdly, understanding the relationship between the inputs and outputs of distribution activities and distribution costs is not straightforward. This is partly a consequence of the multiple objectives of DSOs, while the numerous inputs and outputs of distribution activities can make it difficult to understand the exact costs associated with each and every distribution input and output without undertaking a detailed analysis.
Well‐designed indicators should also be replicable, meaning that they can be employed repeatedly in future years, thereby allowing the Commission to monitor the evolution of DSOs´ performances over time. This is important for several reasons. For instance, indicators that provide an accurate means of monitoring performance change over time can help the Commission and DSOs to evaluate the effectiveness of measures (best practice or otherwise) implemented by DSOs with the intention of addressing issues that were previously identified as requiring attention. In the event that implemented measures are not delivering the anticipated performance improvements, they can be adjusted, discontinued or replaced.
Lastly, performance indicators can be used within the Commission´s overall analysis of the electricity and natural gas distribution sectors throughout the EU. That is, indicators can be used to build‐up an overall picture of sector performance, and also to focus in on specific aspects of service provision performance that may be of particular interest. This can then play a crucial role in the Commission´s development of policy.
The assessment of DSOs´ performances, and areas where improvements are needed, is central to ensuring that optimal policy decisions can be made. That is, policies can be shaped to address those areas identified as needing improvement as well as addressing key sector objectives. Moreover, the effectiveness of DSOs under implemented policies can be analysed at various points over the policy´s lifetime using well‐designed assessment techniques. This can allow the effectiveness of policies to be

8
critiqued, and on‐going adjustments and modifications to the policy can consequently be made if required.
The usefulness of streamlined indicators at EU level is remarkable for national and lower level governments as well. A reliable international benchmarking of efficiency and quality performances can decisively help them to address the main challenges and goals facing the industry, and to take action if necessary on its structure and regulatory principles, including with a view to pursue social and environmental objectives.
Differences between Member States´ regulatory approaches
There are two main Directives relating to common rules for the internal energy markets in Europe for electricity (2009/72/EC) and natural gas (2009/73/EC). Both Directives offer significant flexibility to NRAs in their development of regulations for electricity and natural gas distribution pricing. These Directives specify that NRAs should take on the duty of ´fixing or approving, in accordance with transparent criteria, transmission or distribution tariffs and their methodologies´.1
In relation to efforts to improve the cost‐effectiveness of distribution activities, the same Directives make requirements on NRAs to ´ensure that transmission and distribution system operators are granted appropriate incentive, over both the short and long term, to increase efficiencies, foster market integration and security of supply and support the related research activities.´2
Given the flexibility provided by the electricity and natural gas Directives for each country to pursue its preferred approach to distribution pricing and general regulation of the sector, it is the case that important differences exist between the regulatory approaches to electricity and natural gas distribution in individual Member States. Whilst on the one hand this allows national preferences to be pursued by each country (allowing countries to theoretically adopt the approach which it perceives to be the most efficient or comfortable for its individual situation), it also severely limits the potential to use inference benchmarking techniques to analyse and compare overall DSO performance between countries, already hindered by legislative, fiscal and other country specific contexts.3 This is an important aspect in relation to the Commission’s perspective, in relation to its analysis and the development of optimal policies.4
There are various reasons why it is problematic to use statistical and other benchmarking techniques to compare performance between countries. For example, the use of diverse definitions of key variables across Member States means that attempts to compare certain aspects of performance may be compromised due to different countries´ interpretations of what exactly is to be measured. This problem is particularly pronounced in relation to cost comparisons across countries due to the role of national factors in the definition of costs, which may be related, for example, to regulatory
1 Article 37(1)(a) of Directive 2009/72/EC and Article 41(1)(a) of Directive 2009/73/EC 2 Article 37(8) of Directive 2009/72/EC and Article 41(8) of Directive 2009/73/EC 3 It is worth noting, however, that measures are currently being taken with a view to addressing this challenge. CEER has a work stream ongoing which is looking at the issue of benchmarking DSOs and TSOs across Member States in order to develop its understanding of best practice. 4 Such information will be valuable to the Commission in several respects. For instance, a detailed understanding of specific best practices in regulatory measures for promoting and facilitating the adoption of technologies and practices for ´smarter´ distribution systems will help the Commission to offer guidance and recommendations to Member States whilst also respecting individual countries´ characteristics and preferred approaches.

9
regimes for labour and country‐specific taxation approaches. Moreover, it is also the case that significant variations exist in the architecture, size and conditions of countries´ distribution systems.
Given these complexities and challenges, the use of indicators that can provide a comprehensive and detailed picture of the inputs and outputs of distribution activities and distribution costs could be a more sensible and effective way of analysing DSO performance. Performance indicators have excellent potential for identifying the relevant issues to be analysed by the Commission and others, and can play an important role in helping the Commission in its development (and on‐going review) of policies.
The new needs that assessments and benchmarking have to take into account
The assessment and benchmarking techniques in use at any given time are generally designed to measure (and allow comparisons to be made of) the factors considered to be most significant. These factors are generally linked to, and reflective of, the strategic aims and objectives of the sector.
The priority objectives of the electricity and natural gas distribution sectors in the EU have shifted in comparison to what were traditionally considered to be the central objectives of the sectors. This is perhaps most clearly reflected by a ´then and now´ comparison of the responsibilities falling on DSOs.
The traditional role of DSOs can be generally summarised as their being transporters of electricity and natural gas from transmission networks to end‐consumers. This meant that the sectors´ policy objectives (and hence the regulatory regimes) focused on three central topics, namely:
1. Ensuring that the population had a very high level of (overall) access to services, mainly through ensuring a high rate of connections;
2. Promoting improvements in the productivity of service provision, and sharing the benefits of those improvements among electricity and natural gas consumers; and
3. Ensuring that electricity and natural gas supply was of an overall high quality of service.
DSOs nowadays have certain specific responsibilities (and new technologies which allow them) to deliver smarter and more integrated distribution networks in a timely and more efficient way. That is, whilst DSOs should continue to ensure high quality of service provision, high levels of access and efficiency improvements, there is also a clear drive to create the conditions necessary for more integrated and intelligent distribution networks to be created and to operate. Specifically, a number of tools to fulfil the general sector objectives (stated above) are emerging or increasing in importance, including:
Developing financial measures which encourage more efficient consumption of electricity and natural gas by consumers;
Removing obstacles to DSOs’ implementation of innovative (non‐traditional) investment options;
Designing financial measures which incentivise DSOs to make investments which provide the most cost‐effective solutions for all network users as a whole;
Ensuring that adequate (technical and other) standards are implemented, particularly for new technologies and modes of operating distribution systems;

10
Addressing data privacy and security issues which arise from the use of innovative technologies and techniques;
Removing obstacles to DSOs´ implementation of innovative network tariffs to incentivise the more efficient use of the network;
Improving DSOs´ abilities to identify and address any potential emerging issues with smarter, advanced technologies and applications such as innovative storage applications; and
Incorporating (potentially) large‐scale renewable and embedded generation into distribution networks; and
Incorporating demand and supply side flexibility resources into distribution networks.
It is clear that the shifts in the overall objectives of the electricity and natural gas sectors, and DSOs´ roles and responsibilities, means that new measurement scales are called for, in order to ensure that assessments do indeed measure the current performance factors of importance.
2.2. Criteria for identifying and selecting indicators
The identification and selection of indicators of DSOs´ cost effectiveness and operative efficiencies is of central importance to being able to adequately assess and benchmark DSOs´ performance. A wide variety of performance indicators could be potentially chosen for use, but it is critical to the overall success of the performance evaluation process to ensure that the best ones are selected. In this context, the optimal indicators are those that will allow meaningful and objective comparisons of DSO performance, within each country, as well as facilitating cross‐country comparisons.
For practical reasons it is necessary to select a relatively small number of variables that are capable of explaining performance and a large share of incurred distribution costs in a meaningful way. Consequently, criteria should be devised to select the most useful indicators.
It is essential that indicators are relevant. That is, an indicator must be able to answer a specific research question of interest. In other words, they should be comprehensible and their potential to assess a certain clearly defined aspect of performance should be beyond question.
An important characteristic of indicators is also that they should be measurable. In practice this means that an indicator should measure and assess a specific aspect of distribution for which the required information is available. A certain degree of variation in data availability of different countries is inevitable, hence indicators that are more widely available across countries should have priority over those indicators whose availability, and practical applicability, is likely to be patchy or inexistent.
In the selection of indicators to be used, priority should also be given to those that facilitate objective assessments. For example, indicators that use a calculation methodology that does not eliminate ´background´ or other country‐specific factors that are not related to the aspect being measured should be avoided.
Finally, indicators should facilitate comparisons between the distribution systems and DSOs of different countries, notably to allow benchmarking of performance evolution over time.

11
2.3. Proposed relevant inputs
Before describing the different indicators which could be used to assess and benchmark the cost‐effectiveness of the DSOs and their operational efficiencies, it is important to clearly define each of the relevant key input variables (i.e. the inputs which are used in the calculations of indicator values). These are considered below, firstly for electricity distribution, and then for natural gas distribution.
Furthermore, some additional elements must be taken into account when employing and evaluating the indicators, such as:
The unbundling status in each case (ownership, legal, etc.);
Type of regulator existing in the country;
Type of existing regime (concession, its duration, or license, licensing authority, etc.); and
Other services provided by the DSO (e.g. gas, water, waste collection, local transport, etc.).
Electricity: input variables
Electricity sector‐related input variables are grouped into four distinct areas, namely:
Variables of the electricity firm´s products and services (Table 1);
Variables of the electricity firm´s quality of service (Table 2);
Variables of the electricity distribution network typology (Table 3); and
Variables of cost (Table 4).

12
Table 1: Variables of the electricity firm´s products and services
Variable Description Unit of measurement Data / information source
Connected end‐consumers (residential)
Number of customers defined as residential customers Count DSO Annual Reports
Connected end‐consumers (non‐residential)
Number of customers defined as industrial or commercial customers Count DSO Annual Reports
Metered consumers Total number of consumers that have a meter installed and properly working, by voltage, in the last 3 years, including type of meter
Count DSO Annual Reports
System‐connected embedded generation
Number and peak power of embedded generation connected by voltage Count and MW DSO Annual Reports
Storage capacity of the distribution grid
The electricity storage capacity of the distribution grid under consideration MW DSO Annual Reports
Stored energy on distribution grid The amount of electricity stored on the distribution grid MWh DSO Annual Reports
Peak demand Demand level during peak hour MW DSO Annual Reports
Demand flexibility Quantity of controllable electricity load (flexibility) MW DSO Annual Reports
Electricity supplied Amount of electricity delivered in a year per each typology of customers MWh DSO Annual Reports
Balancing duties DSOs´ duties related to system balancing No specific units (qualitative information)
Network Regulations / Grid Codes
Electric car charging points Number of car charging points provided within the network Count DSO Annual Report; Municipal Authority Reports
DSO Electric car charging points The share (%) of total electric car charging points which are owned by DSOs % DSO Annual Reports Municipal Authority Reports
EV demand EV chargers total rated power MW DSO Annual Reports
EV injection The amount of electricity which can be obtained by the distribution network from Evs
MWh DSO Annual Reports
Smart meters Number and type of smart meters installed Count DSO Annual Reports

13
Variable Description Unit of measurement Data / information source
MW of distributed generation The total electrical generation capacity of all distributed generation connected to the network
MW DSO Annual Reports
Number of customers on time‐of‐use/critical peak/real‐time dynamic
pricing
The total number of customers with supply agreements with a specific DSO which have pricing contracts based on time‐of‐use/critical peak/real‐time
dynamic pricing
Count DSO Annual Reports
Table 2: Variables of the electricity firm´s quality of service
Variable Description Unit of measurement Data / information source
Interruptions Number and duration of relevant interruptions occurred in a year, based on SAIFI, SAIDI or similar
Count, MWh and minutes/year
DSO Annual Report; NRA Reports
Technical losses Amount of energy accounted as technical losses MWh DSO Annual Reports
Commercial losses Amount of energy accounted as commercial losses MWh DSO Annual Reports
Number of distribution forced outage events
Number of events in which there is a forced outage in the distribution network
Count DSO Annual Reports
Output‐based regulation Incentives, revenue or tariff components that are related to quality of service parameters
Qualitative description NRA Publications; DSO Reports
Smart meters incentives framework A description of any relevant mechanisms in place in the event that incentives to install new smart meters are in operation
Qualitative description Government Ministry Reports; NRA Publications;
DSO Reports

14
Table 3: Variables of the electricity distribution network typology
Variable Description Unit of measurement Data / information source
Overhead lines Number of kilometres of lines controlled and operated by the distributors by voltage, in the last 3 years
Km DSO Annual Reports
Underground lines Km of underground lines controlled and operated by the distributors by voltage, in the last 3 years
Km DSO Annual Reports
Distribution power transformers Number and power of total power transformers installed Count and MW DSO Annual Reports
Smart grid projects Number and value (in both cost and NPV) of projects Count, number of meteringpoints involved, € (cost and
NPV)
DSO Annual Reports; Direct consultation with DSO
New technologies incentives framework
Any scheme for the connection or implementation of new infrastructure (electric vehicles, local energy storage, etc.) that is operated or under
development
Qualitative description DSO Annual Reports; NRA publications
Area size Total surface area of supplied municipalities Km2 DSO websites and publications
Area population Total Number of inhabitants of the served area Count DSO publication or national official statistics
Area characteristics Main characteristics of the served area Qualitative description: (Mostly) flat / hilly /
mountainous / small islands
DSO websites and publications
Share of urban customers Share of connected customers located in municipalities with more than 15,000 inhabitants
% DSO websites and publications

15
Table 4: Variables of cost
Variable Description Unit of measurement Data / information source
OPEX OPEX includes all regulated operating expenditure required for the provision of regulated distribution services. It is fully recovered in the year
in which the expenditure is incurred.
€/year DSO Annual Reports; NRA Reports
CAPEX Regulated expenditure for the creation of assets required for the provision of regulated distribution services. Costs are recovered through
depreciation over several years
€/year DSO Annual Reports; NRA Reports
RAB Value of the official regulated asset base at the end of last year € DSO Annual Reports; NRA Reports
RAB valuation method Methodology used for RAB valuation by tariff methodology (Book value, Current cost, MEAV, other to be specified
DSO Annual Reports; NRA Reports
X factor Productivity improvement factor %/year general, %/year specific
DSO Annual Reports; NRA Reports
Incentives Incentives provided for, for example, the improvement of the quality of services; smart meters; connection of distributed generation, biogas;
other distributed energy resources (electric vehicles, local energy storage); use of benchmarking techniques; and productivity improvement factor(s)
Qualitative descriptions DSO Annual Reports; Government Ministry
Reports
Labour cost The amount which is directly or indirectly given to employees defined as labour cost in the balance sheet
€/year DSO Annual Reports
Revenues Revenues received (to be specified from: connection activities, distribution activities, other)
€/year DSO Annual Reports; NRA Reports
Customer care personnel Number of employees in the customer care unit Count DSO Annual Reports
Total employees Number of employees in the DSO Count DSO Annual Reports
Residential distribution tariffs level
Tariff levels for residential customers (please provide Table by customer classes if appropriate)
€c / kWh Government Ministry Publications; DSO Annual
Reports
Commercial distribution tariffs level
Tariffs level for commercial customers (please provide Table by customer classes if appropriate)
€c / kWh Government Ministry Publications; DSO Annual

16
Variable Description Unit of measurement Data / information source
Reports
Industrial distribution tariffs level
Tariffs level for industrial customers (please provide Table by customer classes if appropriate)
€c / kWh Government Ministry Publications; DSO Annual
Reports
Residential average standing charge
Tariffs level for residential customers (please provide Table by customer classes if appropriate)
€ / kWh Government Ministry Publications; DSO Annual
Reports
Commercial average standing or load‐related charge
Tariffs level for commercial customers (please provide Table by customer classes if appropriate)
€ / kWh Government Ministry Publications; DSO Annual
Reports
Industrial average standing or load‐related charge
Tariffs level for industrial customers (please provide Table by customer classes if appropriate)
€ / kWh Government Ministry Publications; DSO Annual
Reports
Connection charges Average amount required by the DSO for a new connection by voltage and by customer type or rated power
€ DSO Annual Reports
Average rate of return Weighted Average Cost of Capital, or other as applicable; before tax % NRA Reports; DSO Annual Reports
Number of regulatory period Number of regulatory period Count NRA Reports; DSO Annual Reports
Length of regulatory period Length of current regulatory period (please specify if any change is expected)
Years NRA Reports; DSO Annual Reports
Awards / penalties The amount of awards or penalties coming from the mechanism used to improve the DSO's quality performance or other objectives (output‐based
regulation)
€ DSO Annual Reports
Natural gas: input variables
The proposed relevant inputs for natural gas DSO performance assessment are similar to those described for electricity DSOs; however, they also include some differences, due to specific characteristics of natural gas distribution. Natural gas sector‐related input variables are also grouped into four distinct areas, namely:
Variables of the natural gas firm´s products and services (Table 5);

17
Variables of the natural gas firm´s quality of service (Table 6);
Variables of the natural gas distribution network typology (Table 7); and
Variables of cost (Table 8).
Table 5: Variables of the natural gas firm´s products and services
Variable Description Unit of measurement Data / information source
Connected end‐consumers (residential)
Number of customers defined as residential customers Count DSO Annual Reports
Connected end‐consumers (non‐residential)
Number of customers defined as industrial or commercial customers Count DSO Annual Reports
Metered consumers Total number of consumers that have a meter installed and properly working, by size, and time of measurement (daily, hourly)
Count DSO Annual Reports
Distributed production connected
Cubic meters of biogas/bio‐methane connected by size and typology Cm DSO Annual Reports
Peak demand Demand level during peak hour or day Cm/hr or cm/day DSO Annual Reports
Demand flexibility Quantity of interruptible gas consumption Cm DSO Annual Reports
Storage capacity Storage capacity under DSO control Mcm DSO Annual Reports
Gas delivered Amount of gas delivered in a year per each typology of customer Mcm DSO Annual Reports
Meters Total number of meters installed Count DSO Annual Reports
Daily or hourly metering Total number of meters with daily or hourly measurement and related consumption
Count (specify if hourly) and (if possible) cm
DSO Annual Reports
Pressure/temperature corrected meters
Total number of meters with pressure/temperature corrected measurement and related consumption
Count and (if possible) cm DSO Annual Reports
Smart meters Number and type of smart meters installed Count DSO Annual Reports

18
Table 6: Variables of the natural gas firm´s quality of service
Variable Description Unit of measurement Data / information source
Interruptions Number and amount of relevant interruptions occurred in a year Count and lost cm DSO Annual Report; NRA Reports
Checks on network Percentage of safety checks on network per year Count and MWh DSO Annual Report; NRA Reports
Leakages Number and amount of detected leakages occurred in a year Count and MWh DSO Annual Report; NRA Reports
Emergency interventions No of emergency interventions after customers’ or third party calls Count DSO Annual Reports
Technical losses Amount of energy/cm accounted as technical losses MWh or cm DSO Annual Reports
Commercial losses Amount of energy/cm accounted as commercial losses MWh or cm DSO Annual Reports
Output‐based regulation Incentives, revenue or tariff component that are related to quality of service parameters
Qualitative description NRA Publications; DSO Reports
Smart meters incentives framework
A description of any relevant mechanisms in place in the event that incentives to install new smart meters are in operation
Qualitative description Government Ministry Reports; NRA Publications;
DSO Reports
Table 7: Variables of the natural gas distribution network typology
Variable Description Unit of measurement Data / information source
Pipelines Km of pipelines controlled and operated by the distributors, by pressure class
Km DSO Annual Reports
Distributed generation incentives framework
Any scheme to boost the connection of biogas / biomethane production (FiT scheme, etc.)
Description of the incentive level revision
methodology/timing and length of the incentives
DSO Annual Reports; NRA Reports

19
Area size Total surface area of supplied municipalities5 Km2 DSO websites and publications
Area characteristics Main characteristics of the served area (Mostly) flat / hilly / mountainous / small islands
DSO websites and publications
Area population Total No. of inhabitants of served area Count DSO publication or national official statistics
Share of urban customers Share of connected customers located in municipalities with more than 15,000 inhabitants
% DSO websites and publications
Table 8: Variables of cost
Variable Description Unit of measurement Data / information source
OPEX OPEX includes all regulated operating expenditure required for the provision of regulated distribution services. It is fully recovered in the year
in which the expenditure is incurred.6
€/year DSO Annual Reports; NRA Reports
CAPEX Regulated expenditure for the creation of assets required for the provision of regulated distribution services. Costs are recovered through
depreciation over several years
€/year DSO Annual Reports; NRA Reports
RAB Value of the official regulated asset base at the end of last year if available € DSO Annual Reports; NRA Reports
RAB valuation method Method used for RAB valuation by tariff methodology (Book value, Current cost, MEAV, other to be specified
DSO Annual Reports; NRA Reports
X factor Productivity improvement factor %/year general, %/year specific
DSO Annual Reports; NRA Reports
Incentives Incentives provided for: the improvement of the quality of services; smart meters; connection of biogas; local storage); use of benchmarking
techniques; and productivity improvement factor(s)
Qualitative descriptions DSO Annual Reports; Government Ministry
Reports
Labour cost The amount which is directly or indirectly given to employees defined as labour cost in the balance sheet
€/year DSO Annual Reports
5 By this we mean the geographic area (km2) of the municipality which is supplied by a DSO. 6 Different arrangements may be used in the case where Totex remuneration is used.

20
Variable Description Unit of measurement Data / information source
Revenues Revenues received (to be specified from: connection activities, distribution activities, other)
€/year DSO Annual Reports; NRA Reports
Customer care personnel Number of employees in the customer care unit Count DSO Annual Reports
Total employees Number of employees in the DSO Count DSO Annual Reports
Residential distribution tariffs level
Tariff levels for residential customers (please provide Table by customer classes if appropriate)
€c / kWh Government Ministry Publications; DSO Annual
Reports
Commercial distribution tariffs level
Tariffs level for commercial customers (please provide Table by customer classes if appropriate)
€c / kWh Government Ministry Publications; DSO Annual
Reports
Industrial distribution tariffs level
Tariffs level for industrial customers (please provide Table by customer classes if appropriate)
€c / kWh Government Ministry Publications; DSO Annual
Reports
Residential average standing charge
Tariffs level for residential customers (please provide Table by customer classes if appropriate)
€ / kW Government Ministry Publications; DSO Annual
Reports
Commercial average standing or capacity‐related charge
Tariffs level for commercial customers (please provide Table by customer classes if appropriate)
€ / kW Government Ministry Publications; DSO Annual
Reports
Industrial average standing or load‐related charge
Tariffs level for industrial customers (please provide Table by customer classes if appropriate)
€ / kW Government Ministry Publications; DSO Annual
Reports
Connection charges Average amount required by the DSO for a new connection by voltage € DSO Annual Reports
Average rate of return Weighted Average Cost of Capital, or other as applicable; before tax % NRA Reports; DSO Annual Reports
Number of regulatory period Number of regulatory period7 Count NRA Reports; DSO Annual Reports
7 By this we refer to the number of regulatory periods which have been in effect since the first regulatory period commenced, up to and including the current regulatory period (e.g. if 4 regulatory periods have previously been in effect but since stopped, the currently regulatory period is the 5th regulatory period).

21
Variable Description Unit of measurement Data / information source
Length of regulatory period Length of current regulatory period (please specify if any change is expected)
Years NRA Reports; DSO Annual Reports
Awards / penalties The amount of awards or penalties coming from the mechanism used to improve the DSO's quality performance or other objectives (output‐based
regulation)
€ DSO Annual Reports

22
2.4. Proposed indicators
The project team proposes to use a range of indicators of DSOs´ cost effectiveness and operative efficiency, which are set out below. Each indicator has been considered in relation to its ability to meet the selection requirements explained in section 2, specifically:
The variation (improvement) of the indicator would determine a quantifiable benefit to grid users and, in general, society as a whole;
It is possible to determine (measure or calculate) the value of the index in a sufficiently accurate and objective way;
The value of the index can be influenced (even if to a limited extent) by the network operator or the system operator; this includes metering. It is also specified that performance targets should be cleansed of external effects outside the control of network operators; and
The index should be as far as possible, technology neutral.
For each indicator, an explanation of what is being measured (and the output/result of the measurement) is provided, as well as a description of the specific method (formula) used to calculate the indicator value.8
Suggested indicators are commonly used (or considered for use) in benchmarking exercises. Whereas simple indicators may provide useful information, their separate use may be misleading. For example, comparison of employees/customers ratios may be meaningless unless characteristics of served areas are also considered, which are reflected in population density or network length per customer, etc. Generally speaking, multivariate analysis is recommended. The following indicators should be considered as preliminary information in order to identify the most relevant issues and set up an analysis of service effectiveness or efficiency.
Indicators for electricity DSOs are provided in Table 9 and those for natural gas DSOs are provided in Table 10.
8 It should be understood that these indicators are not used directly to assess DSO performance; rather, performance is assessed in terms of outputs. The use of input‐based indicators, however, provides a useful means of normalizing the outputs in different Member States, in order to allow some degree of comparison between Member States to be made.

23
Table 9: Proposed indicators for electricity DSOs
Indicator name Formula Explanation Uses and limitations
Indicators related to customer base and the provision of customer services
Average number of customers
[Total num. of customers at start of period (connections) + total number of customers at end of period] / 2
This is an indicator on the average number of customers Average number of customers for the benchmarking period.
Population density Population / surface area (Inhabs./Km2) This is likely to affect costs of service in several ways Benchmarking
Customer density Total customers / Km of network This is an indicator on customer density in a given area Customer density
Indicators related to revisions and updates of distribution network technologies
Updating of meter technology
Meters replaced in a year / meters in service at the beginning of the same year
This is an indicator of the rate at which meters are replaced Meter replacement rate
Distribution transformer utilisation
(Electricity sold (MWh) * 100) / (total distribution transformer capacity (MVA) * 8760h)
This indicator looks at the total energy delivered to consumers on the low voltage network through distribution transformers. Total Distribution Transformer Capacity is calculated by adding up the capacity (nameplate rating) of all distribution transformers installed on the distribution network
The Distribution Transformer Utilisation indicates the effectiveness of distribution planning in matching transformer capacity with demand. A low utilisation implies a greater investment in distribution transformers. A higher utilisation implies higher efficiency in capital outlay on the distribution network (or on the other side of the scale, deferred capacity upgrade and erosion of security margins)
Indicators related to technical aspects and characteristics of the distribution network
Load factor (Annual electricity supplied (MWh) / 8760) / Peak annual demand (MW)
Load factor is a ratio of average annual load to maximum annual load per DSO level. This indicator measures how much power is supplied on the average per unit of peak demand.
Load factor provides information on how efficiently the power system equipment is used and, to a certain extent, helps understand how close the power supply system is to being overloaded. When load factor is high (i.e., average supply is only marginally below peak demand), equipment usage efficiency is high and vice

24
Indicator name Formula Explanation Uses and limitations
versa. At the same time, when load factor is close to 100%, the system might be at its capacity limit and could collapse with potential increase in peak demand.
Underground cable ratio
Length of underground cables/total network length
Important cost and quality factor Benchmarking of most relevant solution to improve urban quality
Storage Average stored energy / energy distributed
The ratio of stored energy to energy distributed A comparison of the electricity which is stored to the electricity distributed
Storage capacity /peak demand The ratio of network storage capacity to peak demand of the network
The proportion of peak demand which can be met by stored electricity
EV EV demand / total demand The ratio of EV chargers total rated power to peak demand of the network
The potential maximum proportion of network total demand which comes from EVs
EV injections / total demand The ratio of electricity which can be obtained from EVS to total electricity demand
The potential maximum proportion of total network demand which could be met from electricity supplied by EVs
Demand flexibility coverage
MW of flexible demand / peak demand The ratio of demand which is flexible to peak demand Proportion of peak demand which could be met by flexible demand
DG coverage MW of DG / peak demand The ratio of DG generation capacity to peak demand on the network
The potential maximum proportion of peak demand which could be met by DG
MW of DG / min demand The ratio of DG generation capacity to the minimum demand level
The potential maximum proportion of minimum network demand which could be met by DG. Also provides some indication of the likelihood for DG to be curtailed in periods of minimum demand
Reverse Power Flow
((Number of hours in which there is a flow inversion in a primary substation or a given HV/MV transformer) / 8760) *100
The % of hours in which there is a flow inversion in a primary substation or a given HV/MV transformer
Indicates the relative amount of time in year in which there is reverse power flow in a primary substation
Indicators of service provision performance
Distribution Reliability
(Number of distribution forced outage events (events) / length of distribution line (Km)) * 100
This indicator looks at forced outage events per 100 km of distribution lines and cables.
Reliability of the distribution network

25
Indicator name Formula Explanation Uses and limitations
SAIFI9 Total Customer Interruptions / Average Number of Customers (connections)
System Average Interruption Frequency Index: The ‘Total Customer Interruptions’ is the sum of the customer interruptions for each outage including both forced and planned interruptions. A customer interruption for a power outage is the total customers interrupted for the event
SAIFI indicates the average number of outages a customer experienced for the period
SAIDI9 Total Customer Interruptions Duration Interrupted (customer Hr) / Average Number of Customers (connection)
System Average Interruption Duration Index: Total Customer Interruptions Duration Index is found by summing the customer interruptions duration for each customer interruption event. This includes both planned and forced events.
SAIDI indicates the average power outage duration experienced by a customer during the benchmarking period
CAIDI
Sum of customer‐minutes off for all sustained interruptions / Total n. of customers affected by the sustained interruptions
Customer Average Interruption Duration Index: CAIDI is the weighted average length of an interruption for customers affected during a specified time period
CAIDI indicates the duration of outages related to the numbers of costumers
Distribution losses (energy input LESS energy billed to consumers in kWh / energy input in kWh) * 100
Distribution losses (Technical + Commercial losses): is the difference between energy supplied at the input points and energy billed to customers in percentage terms for a particular period. Electricity Delivered to the Distribution Network (input point) is the total energy measured at the demarcation points between transmission and distribution. Where a utility does not have a transmission network, the electricity delivered to the Distribution Network would be equal to the Net Generation.
Efficiency of distribution infrastructure
9 The SAIDI and SAIFI indicators of service continuity could be further separated and elaborated, taking into account the work developed in recent years by CEER benchmarking electricity DSO quality of service. For instance, it could also be possible to calculate SAIDI and SAIFI values where ´planned interruptions´ and ´forced / unplanned interruptions´ are considered separately, thereby generating separate SAIDI and SAIFI values for each type of network interruption event.

26
Indicator name Formula Explanation Uses and limitations
Curtailment10 DG not withdrawn due to congestion and/or security risk
Curtailment: this is the time in which a DG could be generated but it is halted from doing so by human decision, due to the risk of congestion and/or security risk. Curtailment is expressed in terms of the proportion of time in which a unit could be generating but is curtailed
Proportion of time in which a DG unit is curtailed / prevented from generating electricity
Indicators of financial aspects and costs
Distribution O&M costs
Distribution O&M costs (€) / Length of distribution line (Km)
Distribution Operating & Maintenance costs related to the length of the distribution network
The total cost of operating and maintaining the distribution network on a per km line (overhead line and underground cable). This indicator should be carefully interpreted as it does not include the age of the network.
Actual debt to equity ratio
Long term debt\non‐current liability (€) * 100 / Equity\Net assets\Capital reserves + Long term debt\ non‐current liability
This looks at the gearing of the business. Gearing is a measure of financial leverage, demonstrating the degree to which a firm's activities are funded by the owner's funds versus creditor's funds
The higher the gearing, the greater the risk. When the business is performing well higher returns are generated for the owners. When losses are incurred the impact on the owner is increased. The optimum gearing ratio is specific for each industry.
Rate of Return on Assets, actual and
allowed by regulator
EBIT\Operating Profit (€) * 100 / Average non‐current assets (€)
The rate of return on assets is the return generated from the investment in the assets of the business. Earnings Before Interest Tax (EBIT) is the operating profits generated by the business after all operating costs including depreciation have been deducted from the income.
The return generated from the investment in the assets of the business.
Return on Equity Profit after tax\earning after tax (€) * 100 / Equity\net assets\capital reserves
Return on Equity is the returns generated by the business for the owners of the business. In most utilities in the Pacific the owners of the utility is the government. Profit after tax (PAT) is the profit after interest is paid on funds from debt financiers and tax is paid to Government.
The returns generated by the business for the owners of the business
10 Note that no specific uniform judgment on DSO performance is made in relation to curtailment rate. For instance, in Member States which have a deep or relatively‐shallow connection boundary, DSOs may be able to connect generators to the network on a curtailed contract which otherwise would not have been connected due to high connection costs. In such an example, the overall amount of distributed generation within the system is increased, which has positive benefits. As mentioned above, input‐based indicators are used here as a means to normalize the outputs of different Member States, which allows inter‐country comparisons to be made

27
Indicator name Formula Explanation Uses and limitations
Current Ratio Current assets (€) * 100 / Current liabilities (€)
Current ratio indicates the ability of a utility to meet its short term liabilities (liabilities due within 12 months). Where the ratio is less than 100%, there is a risk that should the suppliers and liability owners’ call on payment the utility would not be able to make all payments
The ability of a utility to meet its short term liabilities
Labour cost efficiency
Total labour cost / customer This indicator shows the average labour costs incurred per customer
The average labour costs of the DSO per customer.
Average supply cost Total operating expenses (€) / Natural gas sold (cm)
This indicator shows the operating costs incurred per unit of electricity sold (expressed in € / cm)
Average distribution cost
Cost recovery Operating revenue/costs This indicator is the ratio of unit revenue to cost Sustainability of cost levels/tariffs. It would reflect the price‐cost‐revenue collection relationship.
Opex recovery Operating costs / revenue billed The indicator of operating expenses covered by revenues is a ratio of operating costs to revenues billed, expressed as percentage.
It reflects if the utility is capable of recovering its current expenditures at the existing consumption level and tariffs. This indicator is below 100% if operational cost is covered by revenues. To be able to recover costs that include capital expenses (in addition to operating expenses) and to account for non‐collection, this indicator should be noticeably below 100%.
Average Opex Opex / MWh This is the indicator of the average OPEX incurred per unit of electricity distributed
A measure of how much OPEX is incurred in distributing a unit of electricity. Its use is relevant in the context of multivariate analysis.
Opex / connection The ratio of OPEX incurred to connections within the distribution network
A measure of how much OPEX is incurred per connection (ratio) within the network (i.e. it is not a reflection of the OPEX incurred by each connection). Its use is relevant in the context of multivariate analysis.
Opex / km The ratio of OPEX incurred to the number of kilometres of network lines
A measure of how much OPEX is incurred in the context of the size/length of the network. Its use is relevant in the context of multivariate analysis.
Average Capex Capex / MWh This is the indicator of the average CAPEX costs incurred per unit of electricity distributed
A measure of how much CAPEX is incurred in distributing a unit of electricity. Its use is relevant in the context of multivariate analysis.
Capex / connection The ratio of CAPEX incurred to connections within the distribution network
A measure of how much CAPEX is incurred per connection (ratio) within the network (i.e. it is not a reflection of the OPEX incurred by each connection). Its

28
Indicator name Formula Explanation Uses and limitations
use is relevant in the context of multivariate analysis.
Capex / km The ratio of CAPEX incurred to the number of kilometres of network lines
A measure of how much CAPEX is incurred in the context of the size/length of the network. Its use is relevant in the context of multivariate analysis.
Indicators of related to the use of innovative tariffs
Incentivising tariffs share
Percentage of consumers on time‐of‐use/critical peak/real‐time dynamic distribution pricing
Percentage of total number of consumers on time‐of‐use/critical peak/real‐time dynamic pricing
Proportion of total consumers which are on distribution ´incentivising tariffs´ at any given point in time.
Load changes Measured modifications of electricity consumption patterns after new pricing schemes
Measured modifications of electricity consumption patterns after the introduction of new pricing schemes
Percentage change (+ = consumption increase; ‐ = consumption decrease) in electricity consumption following the introduction of new pricing schemes11.
11 The formulation of this index depends on the issue that the innovative pricing scheme is meant to address. If, for example, the measure aimes to reduce withdrawals at certain times, load changes at those time will be measured by the index.

29
Table 10: Proposed indicators for natural gas DSOs
Indicator name Formula Explanation Uses and limitations
Indicators related to customer base and the provision of customer services
Average number of customers
(Total num. of customers at start of period (connections) + total number of customers at end of period) / 2
This is an indicator on the average number of customers Average number of customers for the benchmarking period.
Population density Population / surface area (Inhabs./Km2)
This is likely to affect costs of service in several ways Benchmarking
Customer density Total customers / Km of network This is an indicator on customer density in a given area12 Customer density
Productive natural gas usage
(Total commercial gas billed (MWh) + Total industrial gas billed (MWh) or Total other (productive) gas billed (MWh)) * 100 / natural gas sold (MWh)
This is an indicator for the natural gas used in economic productive way; it is the ratio of the commercial and industrial natural gas billed with the overall natural gas sold
It is assumed that the natural gas billed to commercial and industrial customers is productive for the economy. Based on this assumption, this indicator captures the productive economic impact of natural gas supply. It ignores the economic impact of domestic supply and other categories
Service coverage (Number of households supplied (household) / Total number of household in country) * 100
This indicator gives the service coverage by the ratio of households supplied and households in the country
This indicator looks at the natural gas coverage with respect to the country served by the utility. It also indicates the potential market yet to be served by the utility
Indicators related to revisions and updates of distribution network technologies
Real time meter reading
No. of meters with daily or hourly measurement/Total No. of meters
This explains the share of gas that is subject to precise reading and does not require estimation by load profiling
Availability of real time meter reading improves the estimation of consumption by suppliers and hence facilitates market balancing and liquidity
12 This measure also encompasses technological choices which have been made in the area (including, for example, network redundancies)

30
Indicator name Formula Explanation Uses and limitations
Distribution Reliability (Number of distribution forced outage events (events) / length of distribution pipeline (Km)) * 100
This indicator looks at forced outage events per 100 km of distribution pipelines
Reliability of the distribution network
SAIFI Total Unplanned Customer Interruptions / Average Number of Customers (connections)
System Average Interruption Frequency Index: The ‘Total Customer Interruptions’ is the sum of the customer interruptions for each outage including both forced and planned interruptions. A customer interruption for an outage is the total customers interrupted for the event
SAIFI indicates the average number of supply interruptions a customer experienced for the period
SAIDI
Total Unplanned Customer Interruptions Duration Interrupted (customer Hr) / Average Number of Customers (connection)
System Average Interruption Duration Index: Total Customer Interruptions Duration Index is found by summing the customer interruptions duration for each customer interruption event. This includes both planned and forced events.
SAIDI indicates the average supply interruption duration experienced by a customer during the benchmarking period
CAIDI
Sum of customer‐minutes off for all sustained unplanned interruptions / Total n. of customers affected by the sustained interruptions
Customer Average Interruption Duration Index: CAIDI is the weighted average length of an interruption for customers affected during a specified time period
CAIDI indicates the duration of supply interruptions related to the numbers of costumers
Unaccounted for gas13
(Total billed gas plus own consumption) / total gas at the input point) * 100
Aggregate Technical & Commercial losses: this aggregate measure compares natural gas supplied to the distributor with natural gas sold to customers. The difference between these figures is the energy lost in distribution due to technical reasons (e.g., network leakages), commercial reasons (e.g., theft and unaccounted or unmetered sales) and errors in the estimation of consumers without daily or hourly meters..
Effectiveness in minimizing unrecoverable energy cost. The problem comes in estimating actual energy delivered to customers that are not metered, which is particularly common in rural areas. Energy purchased by unmetered customers can be estimated from the consumption of comparable, metered customers, or from substation metered data
Number of gas network inspections
Number of inspections undertaken in one year / total length of gas pipeline network
The number of gas inspections undertaken in one year as a proportion of the total gas pipeline network owned and operated by the DSO.
This is an indicator of the level of activity that each DSO makes regarding network safety inspections in its network.
13 This is an indirect way of measuring gas leakages

31
Indicator name Formula Explanation Uses and limitations
Odorising gas level testing
Number of tests of odorising gas levels / number of connection points
The number of tests undertaken of odorising gas levels within a year, as related to the number of connection points within the network
This is an indicator of the degree of safety inspection activity undertaken by a DSO, and in this case specifically related to odorising gas levels
Indicators of financial aspects and costs
Distribution O&M costs
Distribution O&M costs (€) / Length of distribution pipeline (Km)
Distribution Operating & Maintenance costs related to the length of the distribution network
The total cost of operating and maintaining the distribution network on a per km pipeline. This indicator should be carefully interpreted as it does not include the age of the network.
Debt to Equity Ratio
Long term debt\non‐current liability (€) * 100 / Equity\Net assets\Capital reserves + Long term debt\non‐current liability
This looks at the gearing of the business. Gearing is a measure of financial leverage, demonstrating the degree to which a firm's activities are funded by the owner's funds versus creditor's funds
The higher the gearing, the greater the risk. When the business is performing well higher returns are generated for the owners. When losses are incurred the impact on the owner is increased. The optimum gearing ratio is specific for each industry. For the utility business in the Pacific a Benchmark of 50% is deemed suitable.
Rate of Return on Assets
EBIT\Operating Profit (€) * 100 / Average non‐current assets (€)
EBIT\Operating Profit (€) * 100 / Average non‐current assets (€)
The return generated from the investment in the assets of the business.
Return on Equity Profit after tax\earning after tax (€) * 100 / Equity\net assets\capital reserves
Return on Equity is the returns generated by the business for the owners of the business. In most utilities in the Pacific the owners of the utility is the government. Profit after tax (PAT) is the profit after interest is paid on funds from debt financiers and tax is paid to Government.
The returns generated by the business for the owners of the business
Current Ratio Current assets (€) * 100 / Current liabilities (€)
Current ratio indicates the ability of a utility to meet its short term liabilities (liabilities due within 12 months). Where the ratio is less than 100%, there is a risk that should the suppliers and liability owners’ call on payment the utility would not be able to make all payments
The ability of a utility to meet its short term liabilities
Average supply cost Total operating expenses (€) / Natural gas sold (cm)
This indicator shows the operating costs incurred per unit of electricity sold (expressed in € / cm)
The unit costs of supplying natural gas
Labour cost efficiency Total labour cost / customer This indicator shows the average labour costs incurred per customer
The average labour costs of the DSO per customer.
Cost recovery op. revenue / costs This indicator is the ratio of unit revenue to cost Sustainability of cost levels/tariffs. It would reflect the price‐cost‐revenue collection relationship.

32
Indicator name Formula Explanation Uses and limitations
Opex recovery operating costs / revenue billed The indicator of operating expenses covered by revenues is a ratio of operating costs to revenues billed, expressed as percentage.
It reflects if the utility is capable of recovering its current expenditures at the existing consumption level and tariffs. This indicator is below 100% if operational cost is covered by revenues. To be able to recover costs that include capital expenses (in addition to operating expenses) and to account for non‐collection, this indicator should be noticeably below 100%.
Average Opex Opex / cm This is the indicator of the average OPEX costs incurred per unit of natural gas distributed
A measure of how much OPEX is incurred in distributing a unit of natural gas. Its use is relevant in the context of multivariate analysis.
Opex / connection The ratio of OPEX incurred to connections within the distribution network
A measure of how much OPEX is incurred per connection (ratio) within the network (i.e. it is not a reflection of the OPEX incurred by each connection). Its use is relevant in the context of multivariate analysis.
Opex / Km The ratio of OPEX incurred to the number of kilometres of pipeline in the distribution network
A measure of how much OPEX is incurred in the context of the length of the pipeline network. Its use is relevant in the context of multivariate analysis.
Average CAPEX CAPEX / cm This is the indicator of the average CAPEX costs incurred per unit of natural gas distributed
A measure of how much CAPEX is incurred in distributing a unit of natural gas. Its use is relevant in the context of multivariate analysis.
CAPEX / connection The ratio of CAPEX incurred to connections within the distribution network
A measure of how much CAPEX is incurred per connection (ratio) within the network (i.e. it is not a reflection of the OPEX incurred by each connection). Its use is relevant in the context of multivariate analysis.
CAPEX / Km The ratio of CAPEX incurred to the number of kilometres of network pipelines
A measure of how much CAPEX is incurred in the context of the length of the pipeline network. Its use is relevant in the context of multivariate analysis.

33
3. Task 2 ‐ EU‐wide principles for tariff regulation
3.1. Policy objectives and the role of DSOs
Traditionally the regulation of DSO activities has been focussed on the attainment of (operational) cost efficiency together with an adequate level of quality of service and service coverage. Within this framework the DSOs have to adapt the infrastructure to the needs of demand growth and are pushed to increase their (operational) efficiency through incentive measures on allowed revenues.
The gradual diffusion of new smart grid technologies and the new models and roles attributed to DSOs within the process of smartening of the grid have added new relevant objectives to the distribution activity and a new dimension and relevance to the traditional ones. DSOs are now a fundamental actor in the implementation of the “active network” and will increasingly interact with TSOs and market participants in the management of their systems.
Apart from the policy objectives traditionally linked to DSO activities, the additional policy objectives that can be identified in European and national policies in the fields of energy markets, climate policies and security of supply are:
• Encouraging energy efficiency;
• Encouraging the development of Distributed Energy Resources (DER);
• Contributing to system flexibility;
• Promoting the well‐functioning of the electricity and gas markets.
These objectives will be pursued through the development and smartening of the distribution grids for which six deployment priorities have been identified by the EU TP Smart Grids. The priorities include: enabling the grid to integrate users with new requirements; enhancing efficiency in day‐to‐day grid operation; ensuring grid security, system control and quality of supply; better planning of future grid investment; improving market functioning and customer service; enabling and encouraging stronger and more direct involvement of consumers in their energy usage.
The accomplishment of the above mentioned objectives and deployment priorities encompasses all the aspects of the regulation of DSO activities, including:
• The relationship of DSOs with other stakeholders;
• The definition of standards for smart grid deployment;
• The regulation of the interfaces (i.e. the boundaries of asset ownership and operating activities) between the DSOs, TSOs and market participants;
• The installation and maintenance of smart metering;
• Data handling;
• Data privacy and security rules;
• The roles and responsibilities for electric vehicles (EV) connection;
• The procedures and platforms for the procurement and use of system services in the DSO networks;
• The regulation of DSOs’ tariffs in terms of allowed revenues and tariffs structure.

34
This last aspect constitutes the focus of the current study and is particularly relevant for the accomplishments of the core policy objectives that apply to DSO activities.
3.2. Policy objectives linked to distribution tariffs
In this chapter principles for distribution tariffs are discussed within the broader analysis of the objectives and tools available to regulators, governments and the Commission to shape the future role of the DSOs.
Based on the traditional and new role of DSOs within the process of smartening of the electricity network the following broad set of policy objectives can be identified related to distribution tariff system:
• Efficient operation of the network;
• Delivering target quality requirements at minimum cost;
• Allocating distribution costs amongst network users in a fair and efficient manner;
• Enhancing coverage of networks.
• Selecting the right set of investments to develop and enhance distribution grids;
• Coordinating the distribution network development and the deployment of smart technologies with the development of Distributed Energy Resources (DER);
• Extracting demand‐side flexibility;
These last two objectives correspond to the new role attributed to DSOs with the deployment of smart grid technologies and expected penetration of DER at EU level, but all the objectives are directly or indirectly affected by the current development and smartening of distribution grids.
The new role of DSO in the current context will in fact require them to accommodate the entrance of DER by expanding network capacity and improving its reliability, on the one side, and to allow demand flexibility through grids characterized by real time information exchanges between DSOs and the TSO – as well as speeding up greater market integration and operational network security (ERGEG, 2010) on the other. Making this possible is strictly related to the comprehensive design and regulation of distribution tariffs as it will be affected by:
1. The capacity of revenue regulation to provide incentives on investment and innovation;
2. The capacity of the regulation of tariffs to promote and facilitate network user’s active participation and flexibility.
3.3. Principles of tariff regulation
3.3.1. Principles
According to literature and regulatory practice, the design of tariff regulation schemes should reflect various principles related to the ability to send short term and long term signals for optimal system operation and system development as well as the sustainability of the distribution business and the protection of consumers.
Those tariff regulation principles can be grouped into three main sets:

35
The first set regards System Sustainability Principles and includes:
Sufficiency – network tariffs should allow the full recovery of efficient network costs and a reasonable return on capital
Achievability and adequacy of the regulated rate of return – the regulated rate of return should guarantee a return in line with the relative risk of the investments and financing conditions.
Achievability of the incentive components – the incentive mechanism should pose achievable targets.
Additivity of components – various tariff components must add up to give the total revenue requirement to be recovered
The second set regards Economic Efficiency Principles that aim to provide signals both to DSOs and network users to behave in a way that maximises social welfare in both the short and the long term. This includes:
Productive efficiency – network services should be delivered to consumers at the lowest possible cost
o Infrastructure cost efficiency: tariff regulation should aim to incentivise efficient investment;
o Operational cost efficiency: tariffs regulation should aim to reduce operational (including administrative) costs;
o Coordination – tariff regulation should aim to minimise the total system cost by coordinating distribution investment and operation with other stakeholder’s investment decisions and operation including: transmission, generation, consumption, ancillary services.
Allocative efficiency – tariff should incentivise the users to use the grid efficiently
o Peak reduction ‐ Network tariffs should promote peak demand management and aim to reduce infrastructure cost for peak demand
o Flexibility ‐ Tariffs should encourage system flexibility, e.g. distributed generation, demand response and energy efficiency
o Market promotion ‐ Tariffs should promote well‐functioning electricity and gas markets
Cost reflectiveness – consumers should be charged in accordance with the costs of the services they have received taking into account their contribution to peak demand and their position in the network.
Promotion of innovation – tariff regulation should not create any barrier to DSO innovation
The third set regards Protection Principles in order to safeguard the interests of stakeholders:
Transparency – the methodology and results of tariff allocations should be published and available to network participants, whose bills should clearly state each charged component
Non‐discrimination – all users that belong to a certain category and demand the same network services should be charged the same, irrespective of the end‐use of electricity

36
Equity – certain categories of users, like low income users, or users that are located in remote areas, are charged a tariff which is lower than the cost of the services received
Simplicity – the methodology and results of the tariff allocations should be easy to understand and implement
Predictability – tariffs should be based on observable variables, known by users and other interested parties, who should be able to easily forecast future charges
Stability – tariffs methodology should be stable in order to minimize regulatory uncertainty
Consistency – tariff regulation have to comply with the legislation in place.
3.3.2. Trade‐offs between principles
The multiple objectives belonging to the three sets described above are not always compatible with one another and in many cases present clear trade‐offs that the regulator should take into account when designing tariff regulation.
For instance, tariffs that satisfy the cost reflectiveness principles may not satisfy the simplicity principle as their calculation may require the use of a complex methodology that takes into account the costs caused by the position in the network and the contribution to peaks. Moreover, the cost reflectiveness principle may be in contrast with the stability principle if it requires a frequent updating of tariffs depending on network conditions and use.
With respect to the equity principle, a system may choose to implement it by introducing a social network tariff. Low‐income customers may result to have a lower tariff even though they impose a cost of delivery identical or similar to high‐income customers. In this case, tariffs may not be efficient but could still satisfy other system requirements such as complete cost recovery.
Similarly, there can be systems in which the cost of services delivered to certain users may be higher than other users depending on their geographical position. In such electricity systems, postage‐stamp tariffs based on the principle of equity would result in a higher average tariffs for consumers in relatively low cost areas, thereby subsiding the customers in high cost areas. Such a tariff structure is inconsistent with the principle of allocative efficiency and cost reflectiveness, but could be deemed fair across the population as a whole.
Another example is given by the principle of allocative efficiency that may be in contrast with sustainability since network charges that are based on marginal costs are not expected to provide full cost recovery (due to the lumpiness of grid investments, economies of scale, reliability con‐straints) to DSOs. In the same way, the efficient allocation of costs may be based on the Ramsey‐pricing principle, which is clearly discriminatory.
The trade‐off between System Sustainability Principles and Economic Efficiency Principles may actually result to be particularly relevant in the current context where DSOs are increasingly required to invest in and operate new (smart) technologies, as analysed more in depth in Task 4,. With that respect it is important to decide the degree to which regulated firms should be required to accept the risks of investing in new technologies and the right balance between risks and incentives. If regulated firms are required to take on the risks of investing in new technologies ‐ which typically have uncertain cost and performance profiles ‐ one likely consequence is that those firms will require higher rates of return because investors which provide capital for such network investments will offer less‐attractive conditions (as compensation for higher levels of uncertainty, compared with

37
investments in technologies which have well‐understood lifetimes and cost profiles). As a result, regulated firms will likely demand higher allowed revenues from the regulator; and this would have the effect of pushing up prices for consumers.
It is therefore the case that during periods where a major determinant of the successful development of smarter distribution networks is the ability to attract capital (at acceptable rates) for investments, the ideal point on the trade‐off may lean towards sustainability and the implementation of regulatory frameworks which place less risk on regulated firms.
3.3.3. Relevant synergies
Besides the trade‐offs existing between different tariff regulatory principles there are also some important synergies that have to be taken into account. One example is given by the intertwined nature of the productive efficiency, allocative efficiency and cost causality principles. The shared network in fact complicates the decision of what network to build, how to balance short term cost minimization with long term network development, which connections to enable, what quality of service to reach and how to share the common costs of the network among different users. All that, taking into account that there are individual decisions that can affect the overall cost of service and the cost supported by future customers as in the case of new connections, peak load and flexibility decisions of network users, while, on the other hand, there are general decisions that affect customers with different preferences and benefits.
The principle of productive efficiency implies the principles of infrastructure cost efficiency and operative cost efficiency. The regulation can treat them separately or together, depending on the regulatory approach. One aspect of the productive efficiency principle that is gaining relevance today is the substitution effect of OPEX and CAPEX and the coordination between them. The ‘deferred investment value’ of distributed generation can be defined as the value of postponing the need to reinforce the system in case of load growth or reducing the investment required in case of equipment replacement14. A proper coordination of network investment and DER and flexibility development can alleviate congestion and reduce the need for generation in other parts of the network. It may also change the distribution of load and power flows across the network and lower the overall level of losses in the system. It is important to take into account that the impact of distributed generation on DSO investment expenditures may be positive or negative dependent on network characteristics, type of network management operation and dynamics in the distribution network (e.g. electricity demand growth and need for asset replacement). The impact on DSO investment expenditures also varies significantly depending on where distributed generators choose to connect. In the event that most or all distributed generators choose to connect in areas where space capacity does not exist, then costs will be considerably higher than if they connect in areas where there is spare capacity.
These factors highlight the relevance of how to incentivize DSOs to engage in active distribution system management and introduce another fundamental synergy between economic efficiency principles and innovation promotion. While the form of remuneration itself results in different incentives to be cost‐efficient (e.g. within an incentive‐based system DSOs get to keep all the savings from cost reductions), and also in the choices among CAPEX and OPEX, the regulatory framework can also include additional elements that recognize the different risk profile and cost drivers of
14 Cao et al., 2006; Méndez et al., 2006a; Jil & Goos, 2006

38
innovative technologies and operating procedures in order to stimulate their deployment by DSOs. Indeed, in a survey conducted by CEER (2011), two major barriers to the deployment of smart and active distribution systems were identified, namely first, to encourage network operators to choose the most cost‐efficient investment solutions, and second, to encourage network operators to choose innovative solutions.
3.4. EU wide principles
3.4.1. Current principles present in EU legislation
The two key Directives concerning common rules for the internal market in electricity (2009/72/EC) and natural gas (2009/73/EC) provide significant flexibility to national regulatory authorities (NRAs) in the development of regulations for electricity and natural gas distribution pricing.
In particular, Article 37(1) (a) of Directive 2009/72/EC and Article 41(1)(a) of Directive 2009/73/EC state that the NRA shall have the duty of:
“Fixing or approving, in accordance with transparent criteria, transmission or distribution tariffs or their methodologies”.
In addition, Article 37(8) of Directive 2009/72/EU and Article 41(8) of Directive 2009/73/EC require NRAs to:
“Ensure that transmission and distribution system operators are granted appropriate incentive, over both the short and long term, to increase efficiencies, foster market integration and security of supply and support the related research activities”.
Provisions in Directive 2009/72/EC (Art. 25.7), moreover require that
“When planning the development of the distribution network, energy efficiency/demand‐side management measures or distributed generation that might supplant the need to upgrade or replace electricity capacity shall be considered by the distribution system operator”.
Some additional restrictions on the activities of NRAs are provided by the requirement to ensure there are no cross‐subsidies between different activities in the electricity and natural gas supply chain (Articles 37(1)(f) and 41(1)(f) respectively).
Furthermore, the Directive 2012/27/EU (Article 15) states that:
“Member states shall ensure the removal of those incentives in transmission and distribution tariffs that are detrimental to overall efficiency (including energy efficiency) of the generation, transmission, distribution, and supply of electricity or those that might hamper participation of demand response, in balancing markets and ancillary services”.
Finally, in Annex XI of the Directive, it is stated that “network tariffs shall be cost‐reflective of cost‐savings in networks achieved from demand‐side and demand‐response measures and distributed generation, including savings from lowering the costs of delivery or of network investment and a more optimal operation of the network”. It is moreover presented that “network regulation and tariffs shall not prevent network operators or energy retailers making available system services for demand response measures, demand management and distributed generation on organized electricity markets”.

39
Reflecting the flexibility provided by the Directives, a wide variety of approaches for the pricing of distribution services has been introduced in the Member States (MS).
3.4.2. Relevant principles in the current context
In order to meet the challenges posed by the tariff regulation in the new context of active grid management and smartening of the DSOs’ grids, a balance should be found between the multiple conflicting principles described in the previous paragraphs. In particular it seems fundamental to strike a balance among the principles of sufficiency, productive efficiency, allocative efficiency, cost reflectiveness, innovation promotion, transparency, predictability, simplicity and stability. This balance depends on how NRAs weigh each of the principles within the specific regulatory context of each country, but a common basis of shared principles would facilitate the promotion of the policy objectives linked to distribution activities at the EU level.
The sufficiency requirement is a necessary condition to attract capital in the industry; we note in this respect that the merits of incentive‐based mechanisms (such as price‐cap or revenue‐cap mechanisms) require the sufficiency requirement to be stated in a way such that it is compatible with companies occasionally obtaining less than, and more than, the baseline revenue targets. At the same time innovation promotion is fundamental to assure the implementation of the measures that are needed in order to overcome the potential barriers to innovation and production efficiency posed by innovation risks.
On the other hand, the close interdependence of the productive efficiency, allocative efficiency and cost causality principles highlights how the allocation of distribution costs should be based as far as possible on tariffs that reflect costs, including opportunity cost in case of scarcity. This is even more important now that the rollout of smart meters fosters users’ active role in the system and improves customer incentives to enable network optimisation and the necessary investments by DSOs, satisfying at the same time the non‐discrimination principle.
Stability of tariffs methodology is one more relevant principle that helps minimizing regulatory uncertainty and therefore promotes investments and users active participation.
On the user protection side, it is important to assure that tariffs are transparent and therefore able to provide clear information on each cost component that helps the efficacy of the economic signals received by network users, thus also promoting competition and market functioning. Predictability of tariffs that are based on observable variables, known by users and other interested parties, further enhances users’ understanding and confidence, facilitating virtuous behaviour.
Starting from a tariff system meeting those principles, it is then possible to develop criteria to assess the merit of measures providing additional incentives to reduce peak demand and promote flexibility. The principles on the assessment of such additional measures will be developed together with the analysis of MS regulatory systems and the identification of best practices in the following chapters.

40
4. Task 3 ‐ Analysis of the distribution tariffs and their methodologies or terms and conditions approved by regulatory authorities
4.1. Introduction
In this chapter we identify regularities and highlight exceptions, across Member States, on selected aspects of the organization and regulation of electricity and gas distribution. A detailed description of the regulatory schemes implemented in each Member State can be found in the Annex.
We organize the analysis around the following topics, each investigated in a section of the chapter:
Industry structure (section 4.2)
Revenue setting mechanism (section 4.3)
Tariff setting mechanism (section 0)
Network development (section 4.5)
Flexibility measures (section 4.6)
Metering (section 4.7)
Regulatory schemes implemented by the Member States are typically hybrid, in that they include multiple provisions sometimes with opposite effects. Therefore our characterization of the regulatory models implemented in the Member States reflects to some extent our judgement of the relative impact of alternative provisions.
4.2. Industry structure
The following tables report the number of DSO’s active in each Member State, the number of large distributors and the total number of consumers connected to the distributor’s network for the electricity and gas sectors.
Table 11: Electricity distribution industry structure ‐ summary
Number of DSOs
Number of large DSOs (>100,000 customers)
Share of total demand covered by large DSOs
Total number of consumers connected to the distribution network
AT 124 11 92% 5 870 000
BE n/a n/a n/a n/a
BG n/a n/a n/a n/a
CY n/a n/a n/a n/a
CZ 3 1 83% 5 800 000
DE 883 103 74% 49 300 000
DK 71 7 70% 3 000 000
EE n/a n/a n/a n/a
ES 342 17 95% 29 500 000
FI 81 8 20% 3 100 000
FR 81 8 20% 3 100 000

41
Number of DSOs
Number of large DSOs (>100,000 customers)
Share of total demand covered by large DSOs
Total number of consumers connected to the distribution network
GB 21 14 99.5% 30 000 000
GR 1 1 100% 7 179 314
HR 1 1 100% 2 300 000
HU 6 6 100% 5 500 000
IE 1 1 100% 2 000 000
IT 151 10 97% 27 000 000
LT 6 1 100% 1 620 000
LU 5 1 90% 281 428
LV n/a n/a n/a n/a
MT 1 1 100% 285 214
NL 8 5 n/a 8 000 000
PL 169 5 91% 16 800 000
PT 13 3 99% 6 086 000
RO 8 8 100% 8 842 000
SE 8 5 52% 5 200 000
SI 1 1 100% 925 000
SK 163 3 n/a 2 400 000
Source: data provided by national regulators
Table 12: Gas distribution industry structure – summary
Number of DSOs
Number of large DSOs (>100,000 customers)
Share of total demand covered by large DSOs
Total number of consumers connected to the distribution network
AT 20 6 n/a 1 350 000
BE n/ n/a n/a n/a
BG n/a n/a n/a n/a
CY n/a n/a n/a n/a
CZ 74 6 n/a n/a
DE 720 88 n/a n/a
DK 3 1 90% n/a
EE n/a n/a n/a n/a
ES 5 4 100% 7 448 827
FI 25 0 0% 75
FR 26 3 99% 11 000 000
GB 31 19 99.6% 23 329 812
GR 3 1 n/a 298 874
HR 36 1 48% n/a
HU 10 5 99% 3 060 000
IE 1 1 100% 657 000
IT 233 30 81% 21 523 072
LT 6 1 n/a n/a

42
Number of DSOs
Number of large DSOs (>100,000 customers)
Share of total demand covered by large DSOs
Total number of consumers connected to the distribution network
LU 3 0 0% 84 277
LV n/a n/a n/a n/a
MT n/a n/a n/a n/a
NL 9 7 n/a 7 500 000
PL 35 6 95% 6 470 000
PT 11 4 88% 1 341
RO n/a n/a n/a n/a
SE 5 0 0% 37 000
SI n/a n/a 65% n/a
SK n/a n/a n/a n/a
Source: data provided by national regulators
As the tables show there’s a high level of heterogeneity across member States on the structure of distribution, in particular for electricity: in several countries there are more than 100 DSOs (AT, DE, ES, FR, IT, PL, SK), in others there only one company provides distribution services to all consumers (GR, HR, IE, MT, SI) or there are less than 10 distribution companies (CZ, HU, LT, NL, RO, SE).
The gas distribution sector is less heterogeneous: in most countries there are less than 50 distribution firms and only in two countries more than 100 gas distributors operate (DE, IT). A very high percentage of demand ranging from 48% to 100% in gas and from 52 to 100% in electricity is served by large system operators (i.e. those with more than 100,000 customers), even in countries with many small distributors.
Distribution companies with more than 100,000 customers are legally unbundled in all member states but MT that has obtained derogation from the requirements of Article 26 of Directive 2009/72 /EC. In most countries, distribution companies are part of groups that are also active in retailing. Exceptions are NL, where ownership unbundling was imposed15, and SE, where ownership unbundling is mandatory both in electricity and gas. Also in GB there are some independent electricity and gas distributors.
Distribution companies with less than 100,000 customers in most member States feature just functional or accounting unbundling. In few countries, FI, SK, DK, and DE for electricity and HR, SI and LU for gas, a large share of consumers ‐ ranging from 26% to 80% in electricity and from 35% to 100% for gas, are served by distributors that are not subject to legal unbundling.
4.3. Revenue setting mechanism
Allowed revenues for distributors are set or approved by regulators in most Member States, with the exception of ES, where allowed revenues are set by the Government.
15 Although two DSOs in NL are still not ownership unbundled pending their appeal against the imposed unbundling.

43
In the following tables we assess the risk‐allocation properties of the regulatory scheme implemented in each Member State for the electricity and gas sectors, based on the following basic features:
Fixed price/revenues versus cost‐reimbursement: other things equal, fixed‐price or fixed revenues scheme place more risk on the distributors than cost‐reimbursement schemes because the former makes the distributor’s revenues independent from actual costs.
Total revenue versus price targets: total revenue targets hedge distributors against volume risk, as they make allowed revenues independent of the number of users served and energy delivered. In case volumes reduce, tariffs are allowed to increase until the revenue target is achieved. Unit price targets are not adjusted to keep into account any divergence between actual volumes and the volumes expected when the targets were fixed.
Actual cost versus standard cost: Schemes based on standard cost place more risk on regulated firms compared to schemes based on actual cost, as actual cost might turn out to be different from the standard levels on which allowed revenues are based.
Frequency or price revisions: Longer time lags between tariff‐reviews16, other things equal, place more risk on the regulated firm.
Re‐openings: Provision to relax or tighten the price‐ or revenue‐cap during the regulatory period in case of events beyond the distributor’s control and which were unforeseen when tariffs were set. These provisions reduce the risk on distributors.
Additional incentive‐based compensation schemes: These are schemes targeted to specific objectives, such as: loss reduction, quality of service improvements, smart metering deployment, etc.
Regulatory schemes placing more risk on distributors are thought to provide superior incentives to cost minimization, in exchange for above‐normal (expected) profits. Therefore, our analysis implicitly assesses the Member States positioning on the trade‐off between: providing incentives to cost minimisation and allowing higher expected returns in order to account for risk placed on distributors.
16 We use here “tariff review” in a general sense, as the moment when the revenue or price target is reset by the regulator.

44
Table 13: Revenue setting mechanisms for electricity distributors ‐ summary
Country Ex‐ante vs. ex‐post allowed cost
Volume risk on
distributors
Actual cost vs. standard cost Reopenings Regulatory lag17
Financial incentives for quality of service
Ex post assessment
of investment usefulness
Other Ad‐hoc
schemes
Fixed
price/revenues
Cost of
service
Actual cost Standard cost Allowed Years
AT √ Total allowed cost
set at the beginning of the regulatory period, with firm specific
X factor
No
√Historic costs to set start‐of‐period
√Benchmarking to
assess cost differences among distributors.
√
4 No √X factor
reduction in case assets are
not used adequately
√ Smart
metering (cost‐
reimburement)
BE n/a n/a n/a n/a n/a n/a n/a n/a n/a n/a
BG n/a n/a n/a n/a n/a n/a n/a n/a n/a n/a
CY √
Cost‐plus, without
performance incentives
No √Historic costs (actual costs) are included in
the RAB
No 5 No No
CZ √ Operating cost is
subject to revenue cap
system. Allowed cost set at the beginning of the regulatory period and update yearly with a X factor
√ Capital costs are subject to
“cost reimbursement” and Return
of Rate regulation
No √Actual OPEX incurred in the certain period of the previous regulatory
period.
√The regulatory framework
may be altered during the regulatory
period in case the market conditions or
general economic situation
4 √ No No
17 Regulatory lag is the duration of the tariff period

45
Country Ex‐ante vs. ex‐post allowed cost
Volume risk on
distributors
Actual cost vs. standard cost Reopenings Regulatory lag17
Financial incentives for quality of service
Ex post assessment
of investment usefulness
Other Ad‐hoc
schemes
Fixed
price/revenues
Cost of
service
Actual cost Standard cost Allowed Years
change significantly
DE √ Total allowed cost
set at the beginning of the regulatory period, with firm specific
X factor
√ Costs that
cannot (or only marginally) be influenced by the DSO or
that are highly volatile are treated as
pass‐through elements.
No
√Historic costs (60%),
revaluated costs (40%)
√Benchmarking to
assess cost differences among distributors. use of standard cost parameters related to the expansion of the
service
5 √Targets with premiums
and penalties
√
Ex‐post
evaluation via
benchmark,
but no
individual ex‐
post
evaluation of
investments
√ Research funds
provided by state. Quality
remunerations for
reduced interruptions
. Non controllable costs (e.g. concession fees, cost of required smart
meters) are passed through
DK √ Total allowed
revenue set at the beginning of the regulatory period, with a maximum level of return on
capital
√
√Historical revenues
√DSOs are benchmarked against each other on
depreciations, operating costs, and quality of supply
10+ 1 √(penalties)
No
EE n/a n/a n/a n/a n/a n/a n/a n/a n/a n/a
ES √ Total allowed
No √Allowed CAPEX is
No 1 √(Targets,
No √ Metering,

46
Country Ex‐ante vs. ex‐post allowed cost
Volume risk on
distributors
Actual cost vs. standard cost Reopenings Regulatory lag17
Financial incentives for quality of service
Ex post assessment
of investment usefulness
Other Ad‐hoc
schemes
Fixed
price/revenues
Cost of
service
Actual cost Standard cost Allowed Years
costs are assessed annually, and tariffs are
reviewed every three months.
Revenue cap with efficiency
adjustments
based on a comparison of unit investment
costs plus incentives to reduce investment
costs
Premiums and
penalties)
assessed separately (as standard
costs)
FI √ Efficient
investment included in the
RAB and reconciliation
mechanisms are used to ensure that actual
revenues are in‐line with allowed
revenues
No √Actual costs (of efficient
investments) are included in the RAB and
reconciliation mechanisms are used to
ensure that actual revenues are in‐line
with allowed revenues
No 4 √Targets. Premiums
and penalties up to +/‐ 20% of the annual rate of return
No
FR √ Productivity
factor is applied on some predefined
controllable OPEX
√ Non controllable OPEXs and Capital charges only
No √
4 √(targets with premium
and penalties)
No √ Smart meter (extra –
remuneration for good
performance in terms of
costs, deadlines and quality of service)
GR √ CAPEX and
No √ No 1 No No

47
Country Ex‐ante vs. ex‐post allowed cost
Volume risk on
distributors
Actual cost vs. standard cost Reopenings Regulatory lag17
Financial incentives for quality of service
Ex post assessment
of investment usefulness
Other Ad‐hoc
schemes
Fixed
price/revenues
Cost of
service
Actual cost Standard cost Allowed Years
OPEX costs are reimbursed under a cost‐plus approach
(they are updated annually)
Actual costs are used in
the RAB
HR √ Rate of return
(cost of service)
regulatory approach. The
Allowed Revenue comprises
planned CAPEX and OPEX for the next regulatory period
√
√Historic costs to set start‐of‐period
1 No No No
HU √ Total Allowed revenues set at the beginning of the regulatory period with a
maximum level of return on capital and update yearly with a X factor
NoTo determine next year’s (T)
tariffs, justified
revenues are divided with T‐2 year’s quantities.
√OPEX are assessed in details once in every 4 years. Costs are indexed with inflation‐X yearly.
√Benchmarking to
assess cost differences among distributors. The DSO better than the average receives only its own costs, the
DSO doing worse receives only the
average
No 4 √Penalty system to ensure quality
standards
No No
IE √ Total allowed
No √replacement cost
√Benchmarking to
5 √Targets with
√Investments
No

48
Country Ex‐ante vs. ex‐post allowed cost
Volume risk on
distributors
Actual cost vs. standard cost Reopenings Regulatory lag17
Financial incentives for quality of service
Ex post assessment
of investment usefulness
Other Ad‐hoc
schemes
Fixed
price/revenues
Cost of
service
Actual cost Standard cost Allowed Years
revenue set at the beginning of the regulatory period
(acquisition cost, indexed with inflation)
assess cost differences among distributors.
premiums and
penalties
can be excluded from the RAB in case of a negative judgment
IT √ Hybrid system, price cap applies
on OPEX
√ Hybrid system,
cost reimbursement on CAPEX
No √Assets within the RAB are evaluated on the basis of a ‘historical revaluated cost’
approach. Every year the value of the DSOs’ assets are updated by the inflation index of
the price of “investment goods”
No CAPEX costs
are revised
every 1 year;
the tariff
component
related to
OPEX is reset
every 4 years
Yes √Assessments take place for all input‐based incentives
different from smart grids that are not subject to ex‐
ante evaluation.
Only losses compensatio
n is calculated separately from the
distribution revenue
constraint.
LT √ 50/50
price/revenue cap model
√ DSOs bear 50% of the volume risk through volume
adjustment factor
√Historic costs to set
start‐of‐period (For the new regulatory period 2015‐2019 RAB would be based on LRAIC model, taking into account optimal
network structure ‐benchmark‐ and
reasonable cost value)
√CAPEX subject to benchmarking and special analysis; international
benchmarking may be considered also for
OPEX
5 √Penalties
No No
LU √ Some CAPEX and controllable OPEX
subject to revenue cap (and
√ Some CAPEX and non‐
controllable OPEX are
NO √historic or re‐evaluated
cost, book value
4 No No No

49
Country Ex‐ante vs. ex‐post allowed cost
Volume risk on
distributors
Actual cost vs. standard cost Reopenings Regulatory lag17
Financial incentives for quality of service
Ex post assessment
of investment usefulness
Other Ad‐hoc
schemes
Fixed
price/revenues
Cost of
service
Actual cost Standard cost Allowed Years
updated according to a pre‐defined formula)
subject to cost reimbursemen
t
LV n/a n/a n/a n/a n/a n/a n/a n/a n/a n/a
MT √ DSO estimates the actual distribution
costs, according to the approved methodologies
, and the regulator fixes and approves the final tariffs
No √The regulator focus on the cost estimates provided by the DSO
based on the assumptions that the DSO will have to satisfy
all the reasonable demands for service
No Not fixed No No No
NL √ Price cap with firm specific X
factors based on benchmarking of
total costs
√ Revenue
comes mainly from capacity
tariff components
√Actual revenues (or costs) to set start‐of‐
period
√Estimated industry‐
average costs at end of period (yardstick)
based on benchmark, with X factors closing gap during period
√
3 √
√Via
benchmarking of total costs at the start of the regulatory
period
No
PL √ Revenue cap
(with efficiency adjustments on OPEX via RPI‐X
method)
√
√Total expenditure benchmarking
No 4 No √An ex‐post
assessment of “usefulness” is carried out but it does not affects RAB
√ Metering, assessed separately (by higher WACC than “usual” grid investments)

50
Country Ex‐ante vs. ex‐post allowed cost
Volume risk on
distributors
Actual cost vs. standard cost Reopenings Regulatory lag17
Financial incentives for quality of service
Ex post assessment
of investment usefulness
Other Ad‐hoc
schemes
Fixed
price/revenues
Cost of
service
Actual cost Standard cost Allowed Years
PT √ Operating cost is subject to price cap system.
Allowed cost set at the beginning of the regulatory
period and update yearly with a X factor
√ Capital costs are subject to
“cost reimbursement” and Return
of Rate regulation
PartlyShared
between DSO and
consumers
√OPEX is defined in the first year of regulatory period and updated
both with IPIB‐X and the evolution of the cost
drivers set
No
3 √ No √ Investments in innovation
have a remuneration premium and the x factor in OPEX
RO √ Price CAP model, with X factor
No √RAB value set in 2004, at the moment of implementing the incentive based
regulation. This value is actualized with
consumer price index. New investments enter with initial book value.
√, There are corrections mainly due to
volumes variation, cost of electricity losses and
non‐controllable
costs.
5 √ No √ Reduction of distribution network losses. Between 50% and 75% of losses
efficiency gain are
transferred to
customers, the rest to the DSO.
SE √ Price‐cap on
controllable OPEX
√ Cost‐plus on CAPEX and non‐controllable OPEX.
Yes √Actual costs for CAPEX and non‐controllable
OPEX. Planned investments in the
forthcoming regulatory
√Standardised costs
only to the extent that an efficiency factor is used to estimate
controllable OPEX at
No 4 YesCosts of
interruptions for
customers are included
No No

51
Country Ex‐ante vs. ex‐post allowed cost
Volume risk on
distributors
Actual cost vs. standard cost Reopenings Regulatory lag17
Financial incentives for quality of service
Ex post assessment
of investment usefulness
Other Ad‐hoc
schemes
Fixed
price/revenues
Cost of
service
Actual cost Standard cost Allowed Years
period are included within the RAB. Four
methods can be used to value assets to be rolled into the RAB: standard values, acquisition
value, book value and valuation by other way. The methods are used in descending order.
the end of the period in regulation as measure of quality. Actual
interruptions costs are
compared to reference
level annually.
Revenue cap is adjusted
for deviations
SI √ Total allowed cost
set at the beginning of the regulatory period, with firm specific
X factor
No √Book value
√Benchmarking to assess O&M cost differences among
distributors.
√
3 √Targets with premiums
and penalties
No √ Smart
meters (A one‐off
additional 2% yield in the year of activation of the assets applies for the Smart
Grid projects of a total value
exceeding € 200,000.)
SK √ Price CAP model
Yes √Input value RAB is based on the performed DSO
√Prices be adjusted in
5 √
√The price formula
No

52
Country Ex‐ante vs. ex‐post allowed cost
Volume risk on
distributors
Actual cost vs. standard cost Reopenings Regulatory lag17
Financial incentives for quality of service
Ex post assessment
of investment usefulness
Other Ad‐hoc
schemes
Fixed
price/revenues
Cost of
service
Actual cost Standard cost Allowed Years
asset assessment in 2006. The RAB value for 2012 takes into account CAPEX development in the given period and the value of depreciation. During the regulatory period the RAB value
does not vary
some specific circumstances
includes a parameter by which NRA checks the amount of investment realized. The amount of CAPEX is
checked in the first place as necessary to perform the regulated activity.
GB √ Revenues are set every 8 years as part of a price control process. Penalties or rewards from incentive schemes
automatically update these
revenues (on a 2 year lag).
No √In determining the
revenue requirement the toolkit approach
used also makes use of historical and network company forecast data.
√Standard costs are calculated using a combination of aggregated and disaggregated
econometric and engineering based approaches, TOTEX
and disaggregated data
√
8 √Incentive
adjustments in the allowed revenue
formula for quality of service
No √ Incentive
adjustments in the allowed revenue
formula for distribution
losses performance
, performance in relation to Transmission Connection
Point Charges, innovation

53
Country Ex‐ante vs. ex‐post allowed cost
Volume risk on
distributors
Actual cost vs. standard cost Reopenings Regulatory lag17
Financial incentives for quality of service
Ex post assessment
of investment usefulness
Other Ad‐hoc
schemes
Fixed
price/revenues
Cost of
service
Actual cost Standard cost Allowed Years
funding performance
, and performance in relation to Distributed Generation
Table 14: Revenue setting mechanisms for gas distributors ‐ summary
Country Ex‐ante vs ex‐post allowed cost Volume risk on
distributors
Actual cost vs standard cost Reopenings Regulatory lag
Financial incentives for Quality of service
Ex post assessment
of investment usefulness
Other Ad‐hoc
schemes
Fixed
price/revenues
Cost of service Actual cost Standard cost Allowed Years
AT √Total allowed cost set at the beginning of the regulatory period, with firm specific X factors
based on benchmarking of
total costs
No
√Historic costs to set start‐of‐period
√Benchmarking to assess cost differences among
distributors; gaps between standard and costs
narrowed by X factors.
√
5 NoNow inactive, but formula included in the revenue calculation mechanisms
√Via
benchmarking of total costs at the start of the regulatory period.
BE n/a n/a n/a n/a n/a n/a n/a n/a n/a n/a

54
Country Ex‐ante vs ex‐post allowed cost Volume risk on
distributors
Actual cost vs standard cost Reopenings Regulatory lag
Financial incentives for Quality of service
Ex post assessment
of investment usefulness
Other Ad‐hoc
schemes
Fixed
price/revenues
Cost of service Actual cost Standard cost Allowed Years
BG n/a n/a n/a n/a n/a n/a n/a n/a n/a n/a
CY n/a n/a n/a n/a n/a n/a n/a n/a n/a n/a
CZ √Operating cost is subject to revenue cap system. Allowed
cost set at the beginning of the regulatory period and update yearly with a X factor
√ Capital costs are subject to “cost reimbursement” and Return of Rate
regulation
No √Actual OPEX incurred in the certain period of the previous regulatory
period.
The current RAB is based on this revaluated
(based on replacement values) book value of
assets and is not further indexed.
√Legislation allows
reassessing determined
parameters for regulatory period or
regulatory year only in
exceptional cases (e.g.
supply security disruption).
5 No No No
DE √Total allowed cost set at the beginning of the regulatory period, with firm specific X factor
√ Costs that cannot (or only marginally) be influenced by
the DSO or that are highly volatile are treated as pass‐
through elements.
No √Historic costs (60%), revaluated costs (40%)
√Benchmarking to assess cost differences among distributors; use of
standard cost parameters related to the expansion of
the service
5 No √Through the
TOTEX benchmarking
√ Research funds
provided by state. Quality remunerations for reduced interruptions.
Non controllable costs (e.g. concession fees, cost of
smart meters) are passed

55
Country Ex‐ante vs ex‐post allowed cost Volume risk on
distributors
Actual cost vs standard cost Reopenings Regulatory lag
Financial incentives for Quality of service
Ex post assessment
of investment usefulness
Other Ad‐hoc
schemes
Fixed
price/revenues
Cost of service Actual cost Standard cost Allowed Years
through.
DK √Allowed revenues set at the beginning of the regulatory
period
No
√Book value
√Benchmarking of operating costs (unit cost model)
4 No No No
EE n/a n/a n/a n/a n/a n/a n/a n/a n/a n/a
ES √Total allowed cost set in 2002 and
updated every year based on inflation
(up to 2014), volumes and number of connections
√
√Same per connection and per cm cost allowed for all
distributors
Ministry’s discretion
√Penalties for
service interruptions
No
FI √ No √Actual costs, with no
benchmarking
4 No A partial ex‐
post
assessment is
carried out, but
not published
No
FR √Allowed revenues set at the beginning of the regulatory
period, productivity factor on the OPEX and output based incentive regulation
√ For some costs components (i.e. capital charges).
NoDSOs are hedged with climatic risk. However, they bear the risk of
loss of customers.
√
NoBenchmarking is for
information purpose only. It contributes to the definition of the
productivity factor.
√
4 √Bonus/penalties applied
depending on predefined targets
NoAssessment of investment
efficiency only (not usefulness) through the
analysis of unit costs
√ For smart
meter project (in case of
good performance in terms of
costs, deadlines and quality of service)

56
Country Ex‐ante vs ex‐post allowed cost Volume risk on
distributors
Actual cost vs standard cost Reopenings Regulatory lag
Financial incentives for Quality of service
Ex post assessment
of investment usefulness
Other Ad‐hoc
schemes
Fixed
price/revenues
Cost of service Actual cost Standard cost Allowed Years
GR √Total allowed
revenues are set
No √Each DSO forecasts its
allowed revenues based on planned investments and its own ´business model´
n/a No fixed period
No No No
HR √Allowed revenue is set for regulatory period based on
planned CAPEX and OPEX
√ Ex‐post adjustment based on real values
for CAPEX
No
√Net book value
√Benchmarking of operating
costs
3 since 2014, 5 since 2017
√Revenue formula
√In 2017
√ Cost
reimbursement for services
provided outside of the guaranteed standards
HU √ Regulatory model is
based on cost reimbursement
No √DSO costs with more than 100.000 customers are
compared to each other in benchmark process
√Legislation allows an
extraordinary tariff revision
which is used to compensate for big unexpected changes in the
market environment.
4 No No No
IE √Allowed revenues set at the beginning of the regulatory
period
√ For some costs components
No √Replacement value and updated to consider
inflation
√Benchmarking to assess cost differences among
distributors
5 No No No
IT √Hybrid system, partly price‐cap
(OPEX)
√ Hybrid system, partly cost
reimbursement / cost of service
(CAPEX)
No √OPEX are defined on the basis of a parametric
approach. The values are differentiated on the basis of the size of DisCos and
6 √Premium/
penalties for service
intervention speed, gas
√
√ Metering capital and
opex

57
Country Ex‐ante vs ex‐post allowed cost Volume risk on
distributors
Actual cost vs standard cost Reopenings Regulatory lag
Financial incentives for Quality of service
Ex post assessment
of investment usefulness
Other Ad‐hoc
schemes
Fixed
price/revenues
Cost of service Actual cost Standard cost Allowed Years
density of final customers (delivery points / meter). Centralized assets are
defined using a parametric approach. New
investments related to electronic meters are
evaluated on the basis of a mix of actual costs and
standard costs.
leaks numbers,
incidents and emergencies, continuity of
supply, commercial quality
LT √Allowed revenues set at the beginning of the regulatory
period
No √Historic costs to set start‐of‐period
√CAPEX subject to
benchmarking and special analysis; international benchmarking may be
considered also for OPEX
5 √Targets with premiums
and penalties
√
No
LU √Some CAPEX and controllable OPEX subject to revenue cap (and updated according to a pre‐defined formula)
√ Some CAPEX and non‐controllable
OPEX are subject to cost reimbursement
NoTariffs are
updated on a yearly basis
√Historic or re‐evaluated
cost, book value
4 No No No
LV n/a n/a n/a n/a n/a n/a n/a n/a n/a n/a
MT n/a n/a n/a n/a n/a n/a n/a n/a n/a n/a
NL √Price cap with firm specific x factors
based on benchmarking of
total costs
√Revenue comes mainly from capacity tariff components
√Actual revenues (or costs) to set start‐of‐
period
Estimated industry‐average costs at end of period (yardstick) based on
benchmark, with X factors closing gap during period
√
3 No √Via
benchmarking of total costs at the start of the regulatory period
No

58
Country Ex‐ante vs ex‐post allowed cost Volume risk on
distributors
Actual cost vs standard cost Reopenings Regulatory lag
Financial incentives for Quality of service
Ex post assessment
of investment usefulness
Other Ad‐hoc
schemes
Fixed
price/revenues
Cost of service Actual cost Standard cost Allowed Years
PL √Hybrid system,
partly revenue‐cap (OPEX)
√ Hybrid system, partly cost‐
reimbursement (CAPEX)
√However, DSOs can apply for an ex post correction if planned and real revenues do
not align
√Actual costs used, total
expenditure. No benchmarking applied
√DSOs may request a reopening
1 No √
No
PT √Operating cost is
subject to price cap system. Allowed cost set at the beginning of the regulatory period and update yearly with a X factor
√ Capital costs are subject to “cost reimbursement” and Return of Rate
regulation
No √OPEX is defined in the first year of regulatory period and updated with
IPIB‐X factor Capital costs are
assessed every year. There are ex‐post real values adjustments.
No 3 No No
RO n/a n/a n/a n/a n/a n/a n/a n/a n/a n/a
SE √Price‐cap on
controllable OPEX
√ Cost‐plus on CAPEX
and non‐controllable OPEX.
√
√Actual costs for CAPEX and non‐controllable
OPEX. Planned investments in the
forthcoming regulatory period are included within the RAB. Four
methods can be used to value assets to be rolled into the RAB: standard values, acquisition value,
book value and valuation by other way. The methods are used in
descending order.
√Standardised costs only to
the extent that an efficiency factor is used to estimate controllable OPEX at the end of the period
No 4 No No No

59
Country Ex‐ante vs ex‐post allowed cost Volume risk on
distributors
Actual cost vs standard cost Reopenings Regulatory lag
Financial incentives for Quality of service
Ex post assessment
of investment usefulness
Other Ad‐hoc
schemes
Fixed
price/revenues
Cost of service Actual cost Standard cost Allowed Years
SI √Total allowed cost set at the beginning of the regulatory period, with firm specific X factor
No
√Book value
√Benchmarking to assess O&M cost differences among distributors.
3 No No No
SK √Price CAP model
Yes √Input value RAB is based on the performed DSO asset assessment in
2006. The RAB value for 2012 takes into account CAPEX development in the given period and the value of depreciation. During the regulatory period the RAB value
does not vary
√Tariff prices could be adjusted in some specific circumstances
5 No
No
GB √Revenues are set
every 8 years as part of a price control
process. Penalties or rewards from
incentive schemes automatically update these
revenues (on a 2 year lag).
No, over‐ or under‐recovery of
revenues is corrected in the following allowed revenue formula
√In determining the
revenue requirement the toolkit approach
used also makes use of historical and network company forecast data.
√Standard costs are calculated using a
combination of aggregated and disaggregated econometric and engineering based
approaches, TOTEX and disaggregated data
√
8 √
No

60
As the tables show, mechanisms based on pre‐determining the distributor’s allowed revenues for a certain regulatory period – typically 4 or 5 years18 ‐ are implemented in most member States for electricity; yearly rate revisions are implemented only in HR, DK, ES, MT19, GR. For gas, only PL sets tariff every year.
In several countries cost benchmarking is used to assess allowed distribution revenues; in electricity, AT, ES, FR, DE, LT, GB, PL, NL, HU benchmark total distribution costs, while DK, IE, SI and SE benchmark only operating costs. In some cases, in particular AT, SE and NL, cost departures from benchmark level (may20) result in higher X factors, rather than below‐cost initial allowed revenues, in order to ensure that allowed revenues gradually convergence to efficient costs. Benchmarking in gas is also frequently implemented, although capital costs are typically subject to a cost reimbursement regime, except in GB, NL and DE where total cost benchmarking is applied.
Approaches based on pre‐determined allowed revenues, as opposed to mechanisms ensuring recovery of actual costs, are typically motivated as a way to incentivize distributors to minimize cost during the regulatory period. However, multiple provisions are implemented in order to mitigate the risk of unintended profits or losses for distributors resulting from unanticipated dynamics of demand or cost. First, in most Member States tariff adjustments during the regulatory period are allowed in order to hedge distributors for volume risk, i.e. from the risk that demand for distribution services turn out to be lower or higher than the level assumed when the tariff parameters are set. In gas, for example, only ES, SK, and to a limited extent NL, leave distributors with volume risk.
Second, tariff structures that place more weight on fixed or capacity‐related components tend to reduce the volume risk, to the extent that energy consumptions are more volatile than capacity commitments and the number of connections. In NL, for example, gas and electricity distribution costs are recovered almost entirely through capacity‐dependent charges.
Third, in most countries the revenue setting process is forward looking; in particular allowed revenues reflects investment that are expected to be carried out during the regulatory period. In some cases investments foreseen at the tariff setting stage are checked ex‐post against actual investments and the cost of extra or under‐investment is offset in the next tariff setting round.
Fourth, in some countries only the share of revenues corresponding to operating costs is fixed ex‐ante, while the share corresponding to investment cost is updated annually to reflect actually incurred expenditures, and so are tariffs. This holds for electricity in AT, DE21, LU, GR, IT, SE, CZ, PT and, for gas, in AT, HR, LU, CZ, HU, PT, FI, IT, PL, SE. In FR, both operating and investment costs which are considered to be uncontrollable by the DSO are included in the expense and income claw‐back account mechanism,
Fifth, ad hoc revenue assessment methodologies are implemented for selected activities whose costs are possibly more difficult to predict and/or whose technological, industrial and financial
18 GB implements a 8 year regulatory period. 19 In MT the review takes place when at the distributor’s call. 20 In NL the NRA decides upon cost departures based on the specific circumstances. 21 In DE electricity distributors can apply for cost‐based revenue assessment in the case of major expansion investments at the 110‐kV level.

61
dimensions are exceptional compared to others investments. – in particular, those related to smart meter deployment, like in DE and IT.22
Sixth, when cost benchmarking is implemented, firms with higher than average costs can request that their own cost be individually analyzed in order to assess the impact on cost of special circumstances that may not have been adequately kept into account in the benchmarking exercise.
Seventh, allowed revenue revisions during the regulatory period at the distributor’s request (so called “re‐openings”) are carried out if exceptional and unforeseen events cause actual costs or revenues materially depart from those expected when allowed revenues were set.
A potentially large source of risk for distributors is that investments that were sunk based on certain expectations turn out to be less useful than expected, in particular in case actual demand is lower than expected when the investment was decided.23 We notice in this respect that only IE in electricity and HR, LT, and PL in gas provide for an explicit ex‐post assessment of usefulness of distribution investment in the context of the allowed revenue setting process. However, an implicit ex‐post assessment of usefulness of investments is carried out in those Member States that base allowed revenues or X factors on total cost benchmarking. In that case a distributor might not be able to cover the cost of useless investment that other distributors did not make, to the extent that the cost of the useless investment will not impact (or will impact only marginally) on the standard cost assessed by the regulator.
In most countries, economic incentives to deliver target levels of quality of service are implemented. No quality related incentives are implemented in AT, HR, LU, CY, GR, PL, MT.
The revenue setting mechanisms implemented in most countries, both for electricity and gas, appear to place moderate risk on distributors, in particular in terms of under or over remuneration of invested capital. More robust incentives to reduce operating cost, and therefore more risk on distributors, are implemented in most countries.
4.4. Tariffs
In most Member States tariffs are set by the national regulator. However in some countries the responsibilities are shared between the regulator and the DSO, the NRA mainly defines the rules and approves the tariff proposed by the DSO. ES is the only country where the Government sets the tariffs.
Distribution tariffs are published in all member States. However, ES distribution tariffs are bundled with other tariff components, covering costs such as renewable generation subsidization. In GR only total gas retail tariffs are published.
22 In FR, for gas and electricity, the ad hoc revenue settlement for smart meters is not motivated by the fact that costs are possibly more difficult to predict, but rather for incentive purposes, explained by the fact that the technological, industrial and financial dimensions of the project are exceptional compared to other investments. 23 It can be noted that sunk investments based on expectation which turn out to be less useful than expected are also a source of risk for the customer base whom fund the assets. Hence it may be appropriate that this risk is shared between the DSO and customers. Ex‐post reviews may generate regulatory uncertainty for DSOs and could therefore lead to less investments being made than if the DSOs are allowed to assess the risks themselves.

62
The following tables report, for each Member State, information on the main features of distribution tariffs and connection charges for the electricity and gas sectors. In particular we consider:
The cost‐reflectiveness criterion implemented in setting distribution tariffs
The split of distribution tariffs in components that reflect different DSOs’ activities, like power transportation, metering and commercial activities.
The tariff structure, including the base to assess tariff components (e.g. energy consumption, maximum power withdrawal, etc.), time‐of‐use tariffs and geographical differentiation.
Structure of connection charges (deep or shallow)
Social tariffs
The breakdown of distribution cost among consumer’s types: we report the share of distribution costs allocated to the different types of consumers.

63
Table 15: Electricity, distribution tariffs and connection charges
Country Cost reflectiveness
Tariff splitting for different DSO activities
Tariff structure
Time of use tariffs
Geographical uniformity
Connection charges
Social tariffs implemented/via the distributor?
Share of distribution costs on consumer
classes
Domestic/small bus./large bus
AT √ Based on
connection voltage (cascading), energy
and capacity
√ Network, metering, commercial
Power Energy Fixed
√ Only for large consumers
√ Only for HV consumers
Deep No/No 7%/24%/69%
BE n/a n/a n/a n/a n/a n/a n/a n/a
BG n/a n/a n/a n/a n/a n/a n/a n/a
CY √ Based on
connection charge (varies depending on customer class) and an energy use
charge
Information not available
Fixed charge based on
total energy consumption
(€/bi‐monthly)
Energy
√ Yes for
domestic, commercial and industrial customers.
Not for public light or water pumping customers
√
Generally, they
are shallow. In
exceptional
cases, they are
deep
No/No 37%/43%/20%
CZ Based on connection voltage (cascading), energy
and capacity
No Monthly max withdrawal power
Energy
√
Not geographically‐
uniform
Shallow. A Fee for
connection is defined according
voltage level and type of connection
Fee covers half of the average
connection cost
No/No 42%/29%/29%

64
Country Cost reflectiveness
Tariff splitting for different DSO activities
Tariff structure
Time of use tariffs
Geographical uniformity
Connection charges
Social tariffs implemented/via the distributor?
Share of distribution costs on consumer
classes
Domestic/small bus./large bus
DE √ Based on
connection voltage (postage stamps), operating hours,
energy and capacity
√ Network usage,
metering, metering point operation and
billing
Power Energy
Fixed (per year)
No Only atypical customers
No Each DSO sets different tariffs
Deep No/No n/a
DK √ Based on
connection voltage and energy
No Subscription Energy
√ Only for large consumers
No Each DSO sets different tariffs
Shallow No/No n/a
EE n/a n/a n/a n/a n/a n/a n/a n/a
ES √ Based on
connection voltage, energy and capacity
√ Network, commercial
Monthly max withdrawal
Energy
√ All but smallest
consumers
√
Shallow Standard for
smaller consumers
Yes/No Implemented via
retailers
52%/23%/25%
FI √ Based on
connection voltage, energy and capacity
n/a Energy Maximum withdrawal capacity
Fixed / per customer charge
√
No Both types.
Shallow charges
for small
consumers and
small
embedded
generators.
Deep charges for larger
consumers and generators
No/No Information not publicly‐available
FR √ Based on
connection voltage, duration of usage
√ Withdrawal, metering ,
administrative
Power Energy Fixed
√ Withdrawal components
√
Shallow for
residential
consumers and
deep for
Yes/No Implemented via
retailers
68%/14%/18% LV<36kVA/LV>36kVA/HV

65
Country Cost reflectiveness
Tariff splitting for different DSO activities
Tariff structure
Time of use tariffs
Geographical uniformity
Connection charges
Social tariffs implemented/via the distributor?
Share of distribution costs on consumer
classes
Domestic/small bus./large bus
(rate of use of the grid) and capacity
management generators
GR √ Based on
connection voltage and energy
n/a Capacity charge
Energy
√
√
Deep for embedded
generators and isolated
consumers; partially‐deep for all other consumers
Yes/Yes 53%/38%/9%
HR No Depending on the customer category and the tariff model
No Meter
Active power (MV and LV >30 kW)
Active energy Excess reactive
energy (only non‐
residential customers)
√ two different components in peak and
off‐peak times
√
Deep No/No 47%/38%/15%
HU Based on voltage level and energy
Network cost Distribution
losses
Monthly max withdrawal power
Fixed Energy
No √ Shallow for Small
Customers at LV
No/No n/a
IE No Capital and
operating costs are allocated across different system levels and then divided by the number of
No Energy Fixed (annual)
Power (only business
customer and auto
producers)
√ Day/night tariff
No Urban and rural tariff for domestic
customers
Shallow for small
connections
No/No n/a

66
Country Cost reflectiveness
Tariff splitting for different DSO activities
Tariff structure
Time of use tariffs
Geographical uniformity
Connection charges
Social tariffs implemented/via the distributor?
Share of distribution costs on consumer
classes
Domestic/small bus./large bus
customers in each level
IT √ Based on capacity, voltage levels and
energy
Distribution, metering and commercial services.
Energy Capacity Fixed, per customer charge
No √
Shallow
charges:
consumers and
embedded
generators.
HV network users ‐ mainly‐
shallow approach, with deeper charges
Yes (it is a subsidy mechanism) /Yes (via both the distributor
and retailers)
n/a
LT √ Based on
connection voltage, power and energy
No Power Energy
√ One time zone tariff
and two time zone tariff
√
Deep No/No 33%/26%/41% Residential/commercial <400kw/commercial
>=400kw
LU √ Based on
connection voltage
No Actual peak demand over
the year
Energy
No
No Each DSO sets different tariffs
Shallow for small customers,
deep for larger customers
No/No 34%/66% Residential/industrial
LV n/a n/a n/a n/a n/a n/a n/a n/a
MT n/a n/a Monthly max withdrawal power
Fixed Energy
√ Only non‐residential (day/night)
√
Both types. Deep charges
for consumers
and generators
for Connection
No/No Although presence of energy vouchers
n/a

67
Country Cost reflectiveness
Tariff splitting for different DSO activities
Tariff structure
Time of use tariffs
Geographical uniformity
Connection charges
Social tariffs implemented/via the distributor?
Share of distribution costs on consumer
classes
Domestic/small bus./large bus
ratings above 60A, the others shallow
NL √ Based on capacity
and energy
Distribution and
connection, metering
Contracted kW
Peak kW
Energy Capacity (for
small customers)
No √ Only metering tariffs for small consumers are uniform. For
other tariffs the calculation
method is the same but the
actual tariff may be different
Shallow No/No 51% / 18% / 31%
PL √ Based on capacity
and energy
Energy Transition fee
(charge resulting from
termination of PPAs)
Per end‐user subscription
fee
√
No Shallow No/No 39% / 30% / 31%
PT √ Based on
connection voltage level, contracted
power and average power in peak hours
No Monthly max withdrawal power
Fixed Energy
√
√
Deep for
consumers and
generators
Yes/No Implemented via
suppliers
73%/10%/17%
RO √ Based on
connection voltage
n/a Energy No No Both types. Shallow For
small
No/No n/a

68
Country Cost reflectiveness
Tariff splitting for different DSO activities
Tariff structure
Time of use tariffs
Geographical uniformity
Connection charges
Social tariffs implemented/via the distributor?
Share of distribution costs on consumer
classes
Domestic/small bus./large bus
(cascading), and energy
generators/consumers
Deep For large
generators
SE √ Based on capacity
and energy
Each DSO can use any methodology they prefer as long as it is non‐discriminatory and objective
DSOs can use any structure they wish
provided that it is non‐
discriminatory and objective
√ Used by some DSOs, but not
others
No Deep No/No Information is not available
SI √ Based on
connection voltage, use of the network,
energy (gross method)
NO Power Energy
√ Summer/wint
er
√
Shallow
No/No 52%/32%/16% Residential/other LV/MV
SK √ Based on
connection voltage
Network cost Distribution
losses
Monthly max withdrawal
Energy Losses
√ Depending on DSO
No Deep No/No 35%/27%/38%
GB √ Based on
connection voltage (cascading), energy
and capacity
Energy Daily fixed
charge
Daily capacity charge
Reactive charge
Exceeded capacity charge
√
No Deep No/No Domestic: 51% Small non‐HH: 12% Medium non‐HH: 6%
HH: 31%

69
Table 16: Gas, distribution tariffs and connection charges
Country Cost
reflectiveness
Tariff splitting for
different DSO
activities
Tariff
structure
Time of use
tariffs
Geographical
uniformity
Connection
charges
Social tariffs implemented/via the distributor?
Share of distribution costs on consumer
classes
Large/small
AT √ Based on
connection level, energy (30%) and capacity (70%)
√ Use of system, metering, other
services
Capacity charge (not for small
consumers)
Energy charge
√ Only for very
large consumers
NO 9 price areas
Deep NO/NO 14%/86% Based on network level of
connection
BE n/a n/a n/a n/a n/a n/a n/a n/a
BG n/a n/a n/a n/a n/a n/a n/a n/a
CY n/a n/a n/a n/a n/a n/a n/a n/a
CZ Based partially on capacity and commodity for each category of consumers.
In each category there
are subcategories or bands of consumption.
No Capacity charge
Energy charge
No
No Each DSO charges different tariff in
each zone
Not used
No/No 46%/18%/36%
DE √ Energy (30%) and capacity (70%)
√ Network usage,
metering, metering point operation and
billing
Standard load profile:
Fixed monthly fee
Energy charge Load
No No 728
gas DSOs, each one charges
different tariffs
Deep No/No n/a

70
Country Cost
reflectiveness
Tariff splitting for
different DSO
activities
Tariff
structure
Time of use
tariffs
Geographical
uniformity
Connection
charges
Social tariffs implemented/via the distributor?
Share of distribution costs on consumer
classes
Large/small
metered:
Capacity charge
Energy charge
DK n/a No Energy charge
No No 3 DSOs charges different tariffs
Mostly Shallow for consumers and embedded generators
No/No n/a
EE n/a n/a n/a n/a n/a n/a n/a n/a
ES √ Network, ancillary services (metering,
intersections)
Contractual capacity (a Fixed charge for small
consumers)
Energy
No
√
Shallow
Fixed price for
smaller
consumers
No/No This information is not published by the Spanish
NRA
FI √ Based on energy and capacity, but
exact split between each is set by individual
DSOs
√ As each DSO is free to design its tariffs, the splits of tariffs between different activities varies (and is not published)
Generally includes
contractual capacity and
energy consumed, but varies between different DSOs (who set their own tariff structures)
No No Shallow No/No This information is not published by the Finnish
NRA
FR √ Based on yearly gas consumption
No Fixed monthly fee
Capacity charge
No NO 26 DSOs charges different tariffs (GRDF represents
Shallow Yes/No Via the retail tariff
n/a

71
Country Cost
reflectiveness
Tariff splitting for
different DSO
activities
Tariff
structure
Time of use
tariffs
Geographical
uniformity
Connection
charges
Social tariffs implemented/via the distributor?
Share of distribution costs on consumer
classes
Large/small
Energy charge
96%)
GR √ Based on energy and capacity.
Distribution tariffs are bundled with supply tariffs.
√ Bundled into a
single tariff, which is also bundled with
a supply tariff
Not specified; DSOs are free to implement their own structures (not published)
No No Shallow No Not published by the Greek NRA.
HR √ Based on yearly gas consumption
No Energy charge
Fixed monthly fee
No
No 36 DSOs with
different energy charges
Mostly shallow. Deep if special investment required
No/No System for support to vulnerable customers is currently being
created on the state level.
71%/29%
HU √
Based in consumption
categories. Fixed cost are divided by the corresponding quantities and
variable costs are divided by the day degree corrected
volumes
No Fixed charge Capacity charge (Just consumers with a gas meter size above 100m3)
Energy charge
√ Reduced
capacity fee for consumers who have
consumption in the
summer period but do not consume in winter
No There is a regional
pricing
Shallow For small and medium sized consumers
No/No 51%/20%/29%
IE √ Based on volume ranges and 80:20
Capacity: Commodity split
No Capacity charges (based on expected peak day
withdrawal)
Energy
No √ Tariffs are postulated
Shallow and Deep
No/No n/a

72
Country Cost
reflectiveness
Tariff splitting for
different DSO
activities
Tariff
structure
Time of use
tariffs
Geographical
uniformity
Connection
charges
Social tariffs implemented/via the distributor?
Share of distribution costs on consumer
classes
Large/small
IT √ Energy
√ Network costs,
metering, commercial service
costs
Fixed component and
variable (energy)
component (variable
component depends on consumption
class)
No Tariff areas Shallow Yes (it is a subsidy mechanism)/Yes
Not published by the Italian NRA.
LT n/a No Energy charge
No No 6 DSOs charges different tariffs
Mostly deep No/No 32%/30%/38% Residential/ Commercial
<10.5 GWh/ Commercial >= 10.5 GWh
LU √ Based on pressure
level
No Capacity charge
Energy charge
No No 3 DSOs with
different tariffs
Shallow for small
consumers. Deep for larger consumers
No/No n/a
LV n/a n/a n/a n/a n/a n/a n/a n/a
MT n/a n/a n/a n/a n/a n/a n/a n/a
NL √ Based on energy and connection
capacity
√ Distribution and connection, metering
Administrative cost
Transport‐related capacity
Connection cost
Metering
No √ Only metering tariffs for small consumers are uniform. For
other tariffs the calculation
method is the same but the
actual tariff may
Shallow No 13% / 87% Based on connection capacity differentiation

73
Country Cost
reflectiveness
Tariff splitting for
different DSO
activities
Tariff
structure
Time of use
tariffs
Geographical
uniformity
Connection
charges
Social tariffs implemented/via the distributor?
Share of distribution costs on consumer
classes
Large/small
be different
PL √ Based on capacity of connection and
energy
No Hourly capacity
Energy
No No Deep No Not published by the Polish NRA
PT √ Based on
determination of long run average incremental costs
for the MP network and for the LP network.
These incremental costs are further differentiated by: (i) incremental cost of used capacity; (ii)
incremental cost of energy in peak
periods; (iii) incremental cost of energy in off‐peak periods; (iv) incremental cost
per client, connected to the peripheral section,
and (v) incremental cost per customer, associated with
No Fixed charge Capacity
charge
Energy charge
√ Two periods: off‐peak
(August) and peak (rest of the year)
√
Deep Yes/Yes Discount is given on the price contracted
54%/22%/24%

74
Country Cost
reflectiveness
Tariff splitting for
different DSO
activities
Tariff
structure
Time of use
tariffs
Geographical
uniformity
Connection
charges
Social tariffs implemented/via the distributor?
Share of distribution costs on consumer
classes
Large/small
measuring, reading and data
processing.
RO n/a n/a n/a n/a n/a n/a n/a n/a
SE √ DSOs can use any methodology they like provided it is
non‐discriminatory and
objective.
√ Differentiation is not explicitly required. DSOs have freedom to use their preferred
approach
DSOs can use any
methodology they like
provided it is non‐
discriminatory and objective.
Some DSOs use ToU tariffs
No Deep No/No Not published by the Swedish NRA
SI √ Based on annual consumption
√ Metering
Flat rate(fixed monthly)
Power (only large
consumers)
Capacity (only large consumers)
Energy
No No 16 DSOs, with different tariffs
Shallow No/No n/a
SK √ Based in capacity component and other variables (actual usage of cost center by the sale group ‐ e.g.
number of customers, gas
volumes sold, gas
No Fixed charge Capacity
charge
Energy charge
No √ n/a No/No 69%/7%/24%

75
Country Cost
reflectiveness
Tariff splitting for
different DSO
activities
Tariff
structure
Time of use
tariffs
Geographical
uniformity
Connection
charges
Social tariffs implemented/via the distributor?
Share of distribution costs on consumer
classes
Large/small
daily maximum) of each sales group. The legislation rules set the
forbiddance of the cross donations of the sale groups.
GB √ Energy and
capacity
(No typical customer category
capacity definitions).
√ Distribution system
use, metering
System charges
Customer charges
No No Deep No/No Not published

76
As the tables show, in all member States distribution costs are allocated to classes of consumers based on some cost‐reflectivity criterion. Cost cascading is typically implemented, implying that consumers connected at a certain network level – typically associated with connection voltage or pressure – are not allocated costs of the network levels downstream of their connection level.
The splitting across consumers connected at the same voltage level of the share of total cost allocated to that level is generally based on energy consumption and maximum power withdrawal (or contractually committed capacity). Greater detail on the energy/capacity allocation of costs is provided in section 0 (task 5).
The structure of distribution tariffs is generally characterized by:
A component based on the consumers energy withdrawal,
A component based on the consumers committed capacity, i.e. on the consumer’s peak withdrawal over a certain time period (monthly of yearly); for smaller consumers contractual maximum available capacity is commonly used as charging basis, instead of actual peak withdrawal,
A fixed component, typically intended to cover metering or administrative costs.
Time of use distribution tariffs are implemented for electricity in several countries, typically for non‐residential consumers and with daily (night/day) or seasonal (winter/summer) structure. Time of use gas distribution tariffs are not common.
Nationwide, uniform tariffs are implemented for electricity in HR, FR, LT, SI, ES, HU, MT, PT, CY, GR, IT and for gas in ES, PT, SK. In the other countries tariffs are differentiated by Distribution Company or by tariff zones larger than the areas covered by individual distributors. In NL only metering tariffs for small users are nationwide uniform.
Social tariffs are implemented for electricity in ES, IT, FR and GR and for gas in IT, FR and PT. In IT and PT this is done with the involvement of the distribution company. Suppliers are responsible for implementation of social tariffs, with the exception of gas social tariffs in IT and PT. The mechanism in force in Italy can be considered as a mechanism to subsidise costs for specific (low‐income) consumers.
Connection charges are defined “deep” when they are intended to cover both consumer specific costs and part of the cost of infrastructures shared among multiple network users. Deep connection charges are implemented in AT, HR, DE, LT, PT, SK, GR, SE and in gas by AT, DE, LT, PT, GB, PL, SE; FR, IR, LU, HU, MT, RO, FN for electricity and IR, LU for gas implement deep connection charges for large network users. All other Member States implement “shallow” connection charges, i.e. charges that cover only (and sometimes not entirely) the cost of infrastructures that are not shared among multiple network users.
Total distribution costs are split differently among types of consumers in different countries. In particular, the share of distribution cost paid by residential users ranges from 33% to 69% for electricity, while small gas consumers pay a share of distribution cost between 32% and 86%.
Generally distribution tariffs do not appear to be related to the consumer’s (or consumer’s type) withdrawal at times in which total load is highest2425.
24 On the contrary it is common to charge consumers based on their “individual” maximum load, even if takes place at times in which the network is not highly utilized.

77
Rather than on sending short term signals, the weight placed in most countries on capacity‐related charges is consistent with sending consumers long term price signals on the cost of developing the distribution system to serve additional demand. This logic is explicitly referred to by PT, for gas distribution tariffs. We notice however that geographical tariff averaging, implemented in some countries presumably according to a fairness criterion or income redistribution objectives, may distort the price signals delivered by distribution tariffs.
However, the quality of such long term price signals is unclear. In particular, as discussed in greater detail in section 0 distribution tariffs in most countries appear to rely on energy charges more than it would be consistent with the cost structure of DSOs: for household consumers, the weight of active energy charge is at least the 70% of the distribution electricity networks cost, being the Fixed and/or Capacity charges) around the 20‐30% of the distribution network tariff charges. For large consumers the weight of energy component is lower than for household consumer, however such weight represents on average more than half of the distributions cost.
4.5. Network development
The following tables report, for each Member State, information on the main features of network development process for the electricity and gas sectors. In particular we consider:
If a distribution network development plan is published and if it is subject to approval by the regulator or by the government
If (and how) the distribution network development plan addresses:
o Targets of embedded generation hosting capability
o Quality of service targets
o Issues related to system operations, at the distribution network level (demand response, storage systems, etc.).
25 With the partial exception of IE, for gas distribution tariffs, and FR and GB for electricity tariff.

78
Table 17: Electricity Distribution network development
Country Published
distribution network
development plan
(DNDP)
Investments approved by regulator/ government
DNDP contains hosting capacity
target
DNDP addresses quality of
service issues
DNDP addresses “system operation”
issues
AT No Notified to NRA, not
published
No No No No
BE n/a n/a n/a n/a n/a
BG n/a n/a n/a n/a n/a
CY No However, the DSO considers (in an informal planning
process) the likely long‐term developments in specific geographic areas (i.e. cities).
No No N.a. No
CZ No. Only TSO publishes development plans
No No No No
DE √ Only on HV level
√ Only for certain
investment (Investment measures) and only formal check for
eligibility
No
No
No
DK No Not published
No No √ Quality of service
targets are considered when general system
layout is determined
No
EE n/a n/a n/a n/a n/a
ES No √ No √ No
FI √ DSO develops plans every 2 years and notifies them to the NRA (but they are not
published).
No No √ No
FR No Not published
√ Only for smart metering
programme
√ DSO has to publish the generation hosting capacity for each HV/MV substation
No No
GR No √ No No No
HR √ Approved by the
√ Investments plans are
No duty to connect all the
√ Analysis under
√ Analysis on RES

79
Country Published
distribution network
development plan
(DNDP)
Investments approved by regulator/ government
DNDP contains hosting capacity
target
DNDP addresses quality of
service issues
DNDP addresses “system operation”
issues
regulator and published every year
subjects to official approval
renewable capacity that applies
preparation targets, and demand flexibility under preparation
HU No Only a National
Development Plan for transmission lines is submitted to the NRA
No No No No
IE No Notified to NRA, not
published
No No
√ DSO takes quality of service targets into account
when developing DNDP
√ Integration of RES‐E
generation
IT √ Prepared, updated and published annually
No Yes √ No
LT No Only submitted to NRA
√ Only large investment
No √
√ Assumptions on future demand flexibility
LU No Only notified to NRA
√ Soft approval
No No No
LV n/a n/a n/a n/a n/a
MT No DSO notified to the regulator but not approved and not
published
No No √ Limited
No
NL √ Published every 2 years
No No √ No
PL √ Published every 3
years, looking 5 years ahead
√ No No No
PT √ Submitted every 2
years
√ No √ No
RO √ There are detailed
investment plans that can be treated as development plan.
They are approved by the regulator and not
published.
√ No √ No
SE No No No No No
SI √ Published for all
voltage levels > 110kV
√
No √ taken as an input
No

80
Country Published
distribution network
development plan
(DNDP)
Investments approved by regulator/ government
DNDP contains hosting capacity
target
DNDP addresses quality of
service issues
DNDP addresses “system operation”
issues
SK No No Subject to RONI approval
GB √ 5‐Year plan published annually with mid‐year
update
No No √ No
Table 18: Gas distribution network development
Country Published distribution
network development plan
(DNDP)
Investments approved by
regulator/government
DNDP contains coverage targets
DNDP addresses quality of service issues
AT No No
BE n/a n/a n/a n/a
BG n/a n/a n/a n/a
CY n/a n/a n/a n/a
CZ No. Only TSO publishes development
plans
No No No
DE No √ Only for certain
investment (Investment measures)
DK No Not regulated
No No
EE n/a n/a n/a n/a
ES √ (some Regions)
No √
No
FI No No No No
FR No Not published
√ Legally subject to
economical study and must comply with
Benefits/Investment ratio. The methodology is audited by the NRA
No
GR √
No No No
HR √ √ √ No Planned to be implemented starting from 2nd regulatory
period
HU No √ No No

81
Country Published distribution
network development plan
(DNDP)
Investments approved by
regulator/government
DNDP contains coverage targets
DNDP addresses quality of service issues
IE No √
No A Separate Performance Report is published that
outlines service targets and performance
IT No √ Investments in network
development are governed by the local
authorities
n/a n/a
LT No Notified to the NRA
√ Soft approval
No No
LU No Notified to the NRA
√ Soft approval
No
LV n/a n/a n/a n/a
MT n/a n/a n/a n/a
NL √ Published every 2 years
No
No √
PL √
No √
√
PT √ √ No Not explicitly
RO n/a n/a n/a n/a
SE No n/a n/a n/a
SI No √
No
SK √, publishes but not approved by the NRA
No No No
GB √ 10‐Year plan, prepared annually
No √
The depth of ex‐ante scrutiny of the distributors’ investment is diverse among member States. For electricity, only HR, DE (for network assets at voltage greater than 110 kV), GB, IT, PL, NL, PT publish distribution network development plans. Only in six countries distribution network development plans are approved by regulators, while in three (FR, DE, LT) the regulator approve only selected investments. The same holds for gas distribution, with plans published only in HR, GB, GR, NL, PT, and approved only in few countries. A distinguishing feature of gas distribution in IT and ES is the involvement of the local government in network development planning.
With regard to the topics covered in the plans, in some cases quality of service issues are explicitly addressed in the plans, but hosting capacity targets for embedded generation (in electricity) are generally not indicated in the plans. The same holds for issues related to system operations, such as demand side flexibility, storage systems or control of embedded generators.

82
The distribution network development decision‐making process, then, appears less structured and transparent than the transmission network development process in most member States. This is consistent with the traditional features of the gas and power distribution service:
A focus on universal network coverage and continuity of service;
Little generation capacity and dispatchable resources (such as controllable load or energy storage equipment) connected to the distribution network
Unidirectional power flows, from transmission network interconnections to consumers.
4.6. Embedded generation
The following table reports, for each Member State, information on the activities of distributors as system operators for the electricity sector only. In particular we consider if distributors:
Dispatch embedded generators
Dispatch interruptible loads
Deploy other flexibility mechanisms, such as storage systems.

83
Table 19: Distribution system operations
Country Distributor can dispatch
embedded generators
Distributor dispatches
interruptible load
Distributor controls other
sources of flexibility
AT √ Only for security reasons
√
√ Demonstration projects
BE n/a n/a n/a
BG n/a n/a n/a
CY No No No
CZ √ Only asked by system
operator
√
√ DSO can use a remote control
system to switch on/off participating appliances
DE √ Full dispatch authority on
generators
√
√ Battery storage
DK √ Only in case of planned
work on the grid or breach of contract
No No
EE n/a n/a n/a
ES No
No √ Batteries and capacitors
FI No No No
FR √ Only in case the distribution system cannot host more
injections
No √ Smart grid pilot projects (battery
packs, flexible loads); ripple control of electric water heaters
GR No No No
HR √ Only in case the distribution system cannot host more
injections
√
No
HU √ Only large embedded generators in case the
distribution system cannot host their injections
No No
IE √ Only for security reasons
No No
IT No No √ Demonstration projects
LT No No No
LU √ Only in case the distribution system cannot host more
injections
√
No

84
Country Distributor can dispatch
embedded generators
Distributor dispatches
interruptible load
Distributor controls other
sources of flexibility
LV n/a n/a n/a
MT √ Only large embedded
generators are subject to dispatch by the DSO
No N.A
NL No No √ Demand response and flexibility
provided by decentralised generation.
PL √ DSOs are allowed to
dispatch any generation
units connected to the
distribution network except
for generation units with an
installed capacity of 50MW
or more
√ DSOs may curtail flexible loads if the safe operation of the grid
is in danger.
No, unless a bilateral agreement is developed between the DSO and the flexibility provider
PT No In case of security reasons, the DSO may be forced to require generators to
disconnect.
No √ capacitor banks and transformer
taps for voltage control
RO √ However third level of
dispatching rights under the National Dispatch Center
√ Only for safety reasons in
emergency cases
N.A
SE √ Can dispatch RES generation plant connected to their
networks
√
No
SI No No √ Capacitators in primary
substations
SK √ Only large embedded
generators
n/a n/a
GB √
√ DNOs can enter into bilateral
agreements
√ Demonstration projects
In ten countries distributors don’t have control on embedded generators. In ES renewable generators’ are dispatched centrally by the system operator, even if these generators are connected to distribution networks. In CZ and RO, distributors act as agents of the system operator in issuing dispatch orders to renewable generators.
In about half of the European countries, distributors control interruptible loads. In AT, FR, DE, SI, ES, NL, PT distributors control further sources of flexibility or are engaged in pilot projects involving deployment of storage capacity and smart grid technologies.

85
The role of electricity distribution companies appears to be changing, mainly as a consequence of the expanding share of generation capacity hosted by the distribution network.
From the traditional role of managers of a basically passive infrastructure, distributors are starting to evolve into system operators, with (some) control on generation capacity, flexible load and other sources of flexibility, like storage capacity.
Such trend is at a very early stage and it appears that a set of organizational arrangements explicitly codifying the new role of distributors has yet been developed in any member States.
4.7. Metering
The following tables report, for each Member State, information on the involvement of distributors in meter‐related activities for the electricity and gas sectors. In particular we investigated:
The role of distributors in metering,
If distributors enjoy a monopoly in metering activities
Deployment targets of smart metering systems.
Table 20: Electricity Metering
Country Distributor performs
metering /own meters
Distributor enjoys monopoly
on meter‐related activities
Smart‐metering
deployment calendar
Current/Expected level
of penetration
AT √
√ De facto
2015_10%/ 2017_70%/ 2019_95%
BE n/a n/a n/a
BG n/a n/a n/a
CY √ DSO is responsible for
metering; the meters are owned by the network
owner
√
0% current/ no formal plans for roll out
CZ √ √ Do not have plans for a large‐scale rollout of smart
meters.
DE √ No 2014_1%/at the end of the mandatory roll‐
out_30%‐50%
DK √
√
2014_57%/2020_100%
EE n/a n/a n/a
ES √
√
2014_35%/ 2016_70%/ 2020_100%

86
Country Distributor performs
metering /own meters
Distributor enjoys monopoly
on meter‐related activities
Smart‐metering
deployment calendar
Current/Expected level
of penetration
FI √ Performs metering and owns most meters (some
meters are leased)
√
2013: 93% of all customers
have a smart meter;
Overall aim (without deadline) for 100% roll out
FR √ √ 2014_0.5%/effective roll out 2015‐2021
GR √
√
2016: 0.5% 2017: 2.2%
HR √
√
N/A
HU √ √ Final implementation of Smart meter is still in
progress. There is no final decision on deployment of Smart metering system.
IE √ √ Mass roll‐out in 2018
IT √
Monopoly on consumer‐side metering; no monopoly on generation‐side metering
Full deployment at all voltage levels
LT √ √ 2014_1% (commercial)/ +3000 pilot project for residential in 2015
LU √ √ 2014_0%/2018_95%
LV n/a n/a n/a
MT √ √ Smart meters installed and billed remotely by the end
of 2013 by customer category: Residential:
73.257; Domestic: 32.310; Non‐Residential: 11.816.
Note: The number of smart meters does not
correspond exactly to the number of consumers with smart meters because consumers with an RES generator are normally provided with two smart meters : A PV meter and import /export meter
NL √
√ Monopoly on metering services
for small customers only
2020: 100% smart meter rollout to customers
PL Performs metering. DSOs
own the householders and
small businesses meters.
Other customers generally
√
No formal plans for roll out

87
Country Distributor performs
metering /own meters
Distributor enjoys monopoly
on meter‐related activities
Smart‐metering
deployment calendar
Current/Expected level
of penetration
own their meters
PT √ √ Continue with the deployment of large‐scale
smart metering pilot projects.
RO √ √ However DSOs may externalize
the activity
The deployment of smart meters is in the stage of approval of the pilot‐
projects, there are 120 000 clients included in this
stage.
SE Performs metering and
responsible for all data
management tasks, but they
cannot own the meters
√
In 2013 all customers in Sweden already have a smart meter installed
SI √ √ 2014_31%
SK √ √ Currently test operations on selected consumer
groups are being conducted.
GB √ DSOs are only obliged to maintain meters installed
pre March 2007
No Market is liberalised
2015:12% / 2016: 17% / 2017: 29% / 2018: 47% / 2019: 67% / 2020: 100%
Table 21: Gas metering
Country Distributor performs
metering /own meters
Distributor enjoys monopoly on meter‐related activities
Smart‐metering deployment calendar
Current/Expected level of penetration
AT √
√ De facto
59% gas volumes are metered daily (or hourly)/No plans to deploy SMs to small
consumers
BE n/a n/a n/a
BG n/a n/a n/a
CY n/a n/a n/a
CZ √ √ There is negative CBA in the Czech Republic so there is smart meters just in pilot
projects

88
Country Distributor performs
metering /own meters
Distributor enjoys monopoly on meter‐related activities
Smart‐metering deployment calendar
Current/Expected level of penetration
DE √
√ De facto
n/a
DK √
√
n/a
EE n/a n/a n/a
ES √ (large consumers own their
meters)
√
Only large consumers (70% of gas volumes) are daily metered/no plans to deploy SM to small
consumers
FI √
√
1.3% of gas customers have a smart meter. There are no explicit plans for further
future roll outs
FR √
√
2014_1% daily metered/ 2016_ pilot project of 150,
000 meters for retail market and small
companies/roll out 2017‐2022/aim : 95%
GR √
√
No smart meter roll out in 2013; no plans for future
roll outs
HR √
√ De facto, but customers can choose another provider of the meters
2013_11.6% daily metered / 2014_ pilot projects planned for the deployment of smart
meters
HU √ √ There are several ongoing pilot projects.
IE √
√
2014_24% daily metered/NRA conducting stakeholder engagement
and consultation to inform the optimal smart
metering solution
IT √
√
Around 0.5% of gas customers had a smart meter installed in 2012. Future roll out plan:
G40 unit customers: 100% by 31 Dec. 2014;
G16 and G25 unit class customers: 60% by 31 Dec.
2014; 100% by 31 Dec. 2015;
G10 unit class customers: 15% by 31 Dec. 2014; 30% by 31 Dec. 2015
Small customers (G6 units or lower):
for distributors with more than 200,000 delivery
points (as at 31 Dec. 2013):

89
Country Distributor performs
metering /own meters
Distributor enjoys monopoly on meter‐related activities
Smart‐metering deployment calendar
Current/Expected level of penetration
3% by 31 Dec. 2014;; 60% by 31 Dec. 2018
LT √
√
2014_850 remote reading meter/ Ministry
of Energy is now preparing smart meters full roll out
schedule which will start with a pilot project
LU √
√
2014_0/2020_95%
LV n/a n/a n/a
MT n/a n/a n/a
NL √
√ Monopoly on metering services for
small customers only
In 2013, 8% of customers had a smart meter
installed. 2020: 100% smart meter rollout to customers
PL √
√
Information on this is not available
PT √ √ Portugal concluded CBA with negative results and decided not to proceed
with large‐scale roll‐out of smart metering systems. No smart meters installed
so far.
RO n/a n/a n/a
SE √ Performs metering and is
responsible for data management, but cannot own
the meters
√
In 2012, 3.4% of customers had a smart meter installed. No explicit
information available on future deployment of smart
meters
SI √/No Metering device may be
owned by the gas DSO or the customer
√
2014_0.5%/deployment of smarts meters is
foreseen for customers with high consumption and with less predictable
demand profile
SK √ √ Smart meters are currently standard placed in the off‐take category above 60 000
m3/year. Currently ca. 4 800 smart
meters are placed.
GB √ DSOs are only required to provide metering services
when requested to do so by a gas supplier
No, the metering market is liberalised
Future roll out (all customers): 2014 – 1.5%; 2015 – 15%; 2016 – 26%; 2017 – 44%; 2018 – 65%; 2019 – 85%; 2020 – 100%

90
In all Member States but the GB, gas and electricity distributors are responsible for metering, under a formal or de facto monopoly regime. Distributors typically own meters, even though in some countries large consumers own their meters.
Meter data management activities are separated from meter ownership in GB, where data management is carried out by an independent company, and in SE, where data management is a distributors’ responsibility, but distributors do not own meters.
Roll out of electricity smart meters is progressing at different pace in different member States:
IT, FI, SE, have already 100% or nearly 100% coverage,
Most countries will reach in 2014 coverage below 10%; these are: AT, FR, IE, LT, CY, GR, LU, CZ, HU, PT, PL, RO, DE, RO, SK; in some of these countries pilot projects are being carried out,
Most countries have plans to reach full or almost full coverage by 2020, with the exception of DE, CZ, HU, PT, RO, SK.
Mass roll‐out plans of gas smart meters have been approved only in FR, GB, IT, NL, LU; they are expected to deliver full or almost full coverage by 2020. Currently in most countries smart gas meters are deployed only for large consumers.

91
5. Task 4 ‐ Identification of best practices to calculate and design distribution tariffs
5.1. Introduction
We organize the analysis around the following topics, each one investigated in a section of the chapter:
Industry structure (section 5.2)
Revenue setting mechanism (section 5.3)
Tariff setting mechanism (section 5.4)
Network development (section 5.5)
Flexibility measures (section 5.6)
Metering (section 5.7)
5.2. Industry structure
The distribution activity in the EU Member States has developed under different governance models. Generally, it fell under the responsibility of municipalities or of relatively small district authorities (e.g. Germany, Austria, Netherlands, and Belgium). This holds in particularly for gas distribution, which could be substituted by other fuels and was normally not subject to a universal service obligation. Therefore, its availability was often a choice left to local powers.
At the opposite extreme, in several countries a unitary organisation of the service at national level, with a view to providing a basic service at uniform conditions to the whole country has been selected: this has been the case mostly for electricity (e.g. the Great Britain, France, Italy, Slovenia,…) but in some countries also for gas (the Great Britain, Spain, most of France).
Between these extremes, several countries have followed intermediate models, with distribution in the hand of provinces or larger districts. Examples are found in the Czech Republic and Portugal. The liberalisation process has triggered remarkable changes in the structure of distributors, notably at country level. For example, Great Britain split its single gas distributor, setting up four smaller ones, sold to different companies. On the other hand, the Netherlands have promoted concentration of distributors, which have been reduced by an order of magnitude.
Data collected by the study may be the basis for further studies on the relative merits of alternative industry structures, possibly providing guidance to Member States that could be interested in promoting further restructuring.
5.3. Revenue setting mechanism
Providing incentives to firms enjoying an information advantage over the regulator generally requires that some risks be placed on the firms and higher expected rate of returns have to

92
be granted in order to compensate investors for that risks. In this section, we compare alternative revenue setting mechanisms in terms of:
Incentives provided to distributors to make efficient long‐term decisions and to carry out their operations at minimum cost;
Risks placed on distributors and expected rate of returns necessary to attract capital in the industry.
Revenue setting mechanism
Incentives• Cost of service• Quality• Capacity
Risk•Cost of capital
Other features of the regulatory framework
• Credibility of regulator’s commitment• Stakeholders ‘ monitoring• ...
Other features of the institutional framework governing the distributors’ activity may have a strong impact on the incentives‐risk trade‐off. These include for example the credibility of the regulator’s commitments, the involvement of the stakeholders in monitoring the distributor’s performance and the industry structure. However, we will focus here on tariff‐related issues.
The position of a country’s regulatory system on the incentive‐risk trade‐off results from the interplay of all its features. Alternative frameworks may achieve similar balance between risks and incentives despite using different constraints. Similar formal structures of the regulatory framework may result in materially different outcomes depending on the interaction between regulator and regulated firm when the system’s parameters are set. Finally, exogenous conditions may impact on the effectiveness of certain regulatory mechanisms.
For these reasons it is impossible to identify a “best” set of regulatory mechanisms and the discussion on best practices needs to be cast in terms of general features of the regulatory framework, which can be achieved by alternative mechanisms. In the remaining of this section we characterize desirable features of regulatory system for electricity and gas distribution, and relate them to the mechanisms implemented in Europe.

93
Risk allocation between consumers and regulated firms
Other things equal, higher expected rate of returns have to be granted in order to compensate investors for risk; therefore a desirable feature of regulatory mechanisms is that they do not exposure distributors to risks caused by factors that are not under their control.
As discussed in section 0 the revenue setting mechanisms implemented in most Member States limit exposure of distributors to risks that are not under their control. First, distributors are typically shielded from volume risks. This is consistent with the modest price elasticity of demand such that distributors have limited, if any, control on the demand for their services. The approach used in the Czech Republic seems to be fairly representative of the typical, and generally‐optimal, risk allocation approach used in Member States. That country´s regulatory system does not place volume risk on the DSO; rather, an allowed revenue target is set for specific years, and if a DSO doesn´t receive, or exceed, the revenue target due to lower‐than‐anticipated demand, revenues are corrected in the following year´s tariffs.26
Second, generally European distributors bear little investment risk related to:
Investment selection, and
Investment implementation.
We refer as risk related to investment selection to the risk that some assets turn out to be not useful, for example because expectations of demand growth or generation connections do not materialize.
Our survey of the European countries shows that such risk is normally not placed on distributors27. An alternative approach would focus on incentivising distributors to take efficient investment decisions by:
Granting distributors full autonomy in investment selection and;
Placing on distributors the cost of any stranded assets.
We discuss further in the section on optimal investment decisions the relative merits of alternative regulatory schemes in terms of incentives to select the optimal investment path. Here we limit ourselves to noticing that the distribution industry appears to be going through an investment cycle for the deployment of smart technologies and the implementation of capacity upgrades necessary to increase the distribution networks’ capacity to host embedded (renewable) generators and more flexible demand. Since incentive based mechanisms place risk on the regulated firms, during periods in which attracting capital in the industry is the main concern the cost of providing incentives is higher than in static situations. This, other things equal, moves the optimal point in the trade‐off between incentives and risks, towards schemes that leave less risk on the regulated firms and are therefore able to attract capital at lower cost, as opposed to mechanisms delivering high‐powered incentives. This holds all the more if, as it appears
26 This, and other, risk mitigation measure(s) used in the Czech Republic´s distribution regulatory framework are discussed in Section 2.2 of the Czech Republic electricity report (page 189 of this report), 27 However, in some countries ex‐post assessments of the investment’s opportunity is possible,

94
to be the case, new technologies are being implemented, with uncertain cost and performance.
However, as discussed in section 5.5, if consumers are to bear most or the entire investment risk thorough ex‐ante scrutiny of the distributor’s investment decisions by regulators is necessary. In Great Britain the regulator undertakes extensive ex‐ante assessments of DSOs´ business plans (i.e. their investment plans for the following 8‐year regulatory period). Specifically, the regulator analyses each DSO´s plan in terms of efficiency, costs, proposed means of dealing with risks and uncertainties and ability to deliver required outputs.28
We refer as risk related to investment implementation to the risk that the cost of new network assets turn out to be greater that the corresponding revenue allowance granted to the distributor. This risk is a feature of schemes that incentivize distributors to minimise the cost of deploying assets agreed with the regulators – whose value will therefore be included in the regulatory asset base. In such model, the regulator and the distributor agree, at the beginning of the regulatory period, to a certain investment pattern and to the corresponding allowed revenues. If the distributor implements the investment at a cost lower (larger) than the pre‐determined level, the distributor retains part of the savings (bears part of the extra‐cost).
The power of such schemes depends on conditions that can only be assessed empirically. In particular, an information asymmetry between the regulator and the firm on the investment’s cost is necessary to justify implementing incentive‐based schemes to reduce investment costs. However, if such asymmetry is very large the distributor might end‐up with large rents. In that situation, then, a mechanism allowing recovery of actually incurred costs might serve the consumers’ interests better than an incentive scheme, as higher investment costs due to lack of incentives might be more than offset by lower information rent. Second, incentives to minimize investment cost may come from other sources. For example, the obligation to procure large network components via tenders relieves the regulator from implementing an incentive‐based mechanism to minimise the corresponding costs.
Benchmarking and standard costing
Benchmarking and standard costing can and are used across Europe in two ways:
As an element of the regulator’s toolbox;
As a core element of the revenue setting scheme.
As items in the regulator’s toolbox, benchmarking and standard costing provide information on efficient distribution costs. By reducing the information asymmetry between regulator and regulated firm, benchmarking allows the regulator to set up more powerful (or less expensive, in terms of rents left with the distributors) incentive‐schemes.
In particular, cost benchmarking or standard costing may provide valuable information on the cost of new or replacement infrastructures, especially if such infrastructures are based on consolidated technologies. Availability of robust information about the cost of new assets allows mitigating the firm’s information advantage and to support the introduction of
28 This is discussed in section 4.4.2 of the Great Britain country report (electricity).

95
incentive schemes inducing distributors to minimize the cost of network upgrades, like those discussed in the previous section.
In Denmark for example, DSOs are benchmarked against each other on OPEX; however, if a DSO incurs extraordinary costs due to an unexpected extraordinary event, it can receive an exemption of those costs from the benchmarking process.
As a core element of the revenue setting scheme, benchmarking and standard costing are used directly to determine the distributors’ allowed revenues. In case of benchmarking, for example, allowed unit revenue for all distributors could be set equal to average unit cost across all other distributors in the previous year. In case of standard costs, the distributors’ allowed revenues would instead be set equal to standard costs.
With benchmarking and standard costing each distributor’s allowed revenues are to a large extent independent from the distributor’s cost. That provides the incentive to minimize costs.
Benchmarking and standard costing may be implemented on operating costs only or on total costs. The latter scheme is commonly referred to as Totex regulation.
Provided the conditions discussed below are met, Totex regulation may address multiple regulatory objectives, including incentivising the distributor to:
Carry out the optimal network development strategy;
Select the optimal mix of operating and capital costs
Eliminating inefficiencies.
Both Germany and Austria undertake benchmarking on Totex for the determination of their X factors to be used in their price controls. In the case of Germany, the information deficit issue for Capex costs of DSOs proposed investments is assumed to be addressed, because cost efficiency is promoted via Totex benchmarking.29
A crucial necessary condition for benchmarking based revenue setting mechanism to be effective is that the (efficient) cost be the same for all distributors. If that is not the case revenue setting mechanisms based on benchmarking may result in:
Unjustified rents for firms operating in low cost areas;
Economic sustainability problems for firms operating in high cost areas.
Further, implementation of an effective revenue setting mechanism based on benchmarking may present challenges in the following areas. First, it might be difficult to characterize a significant empirical relation between distribution costs and distribution outputs, such as number of connections, energy delivered, maximum system power, hosting capacity of embedded generation, quality of service. The same difficulties may arise in assessing the impact on costs of exogenous factors, such as population density, climatic conditions.
Second, if the technological environment is dynamic and uncertain, cost benchmarking may provide little information on future costs. Further, cost benchmarking and uncertainty about the performance of alternative technologies may induce risk adverse distributors to adopt the same technology rather than to experiment with potentially more efficient alternatives, as the mechanism is such that costs borne by all firms are passed on to consumers.
29 This application is described further in section 2.2 of both Austria and Germany´s country analyses, discussed on page 155 and page 200 of this report, respectively.

96
Finally, under (Totex) benchmarking regulation distributor‐specific stranded investment would not pass on to consumers. For example, if all benchmarked distributors had carried out the same investments, under the same expectation of demand growth, and demand turns out to be lower than expected only in some distribution areas, tariffs based on benchmarking would not allow distributors operating in those areas to recover total costs. This feature might increase materially distributors’ risk and cost of capital and, ultimately, distribution tariffs.
Additional provisions can be introduced to mitigate the impact of those issues, at the price of further distortions, for example:
If a standard cost function ‐ linking costs and outputs ‐ turns out to be difficult to estimate, it might be easier to characterize a relation between distribution costs and some inputs, such as indicators of the network’s dimension (kilometers of lines, number of substations …). However, the input selection is to some extent under the firm’s control. Therefore, reference to inputs, instead of outputs, in order to assess allowed revenues may distort the regulated firm’s incentives to cost minimization
If location‐specific cost determinants are impossible to reflect in a robustly estimated cost function, distributors might be granted the option to apply for an individual cost assessment whose outcome would be used to set allowed revenues. However, this option can be expected to attract distributors located in high‐cost areas, while low‐cost outliers would select the benchmarking mechanism.
Whether the conditions for successful implementation of benchmarking regulation, and in particular homogeneity of cost conditions, are met is a matter for empirical assessment in each country. We note, however, that setting allowed revenues based on cost benchmarking or standard cost might be the only option if the industry structure is highly fragmented, so that analysing cost information provided by (hundreds of) distributors would entail unreasonable administrative costs.
Optimal investment decisions and trade‐off between operating cost and capital cost
Regulatory systems that make total allowed revenues independent of the firm’s behaviour provide incentives to total cost minimisation and therefore induce distributors to select the optimal investment path and ratio between operating and capital expenses.
As discussed in the previous section, benchmarking is a way to make allowed revenues consistently independent of each firm’s cost. Therefore, provided the prerequisites for its successful implementation hold, benchmarking provides incentives to distributors to make optimal investment decision and select the efficient opex/capex ratio.
With the alternative “building block” approach, implemented in most European countries, allowed revenues are set for a multi‐year regulatory period, at the start of period. Incentives to cost minimisation result from the independence of allowed revenues from the firm’s actual cost during the regulatory period.
Some features of this model, however, may reduce its incentive power. First, predetermination of allowed revenues is typically based on the distributor’s proposed investment plan, which the regulator implicitly ratifies at the beginning of the regulatory period by allowing recovery of its expected cost during the regulatory period. In other terms allowed revenues are not independent of the investment decision, and there regulator is more or less explicitly involved in such decision.

97
During the regulatory period the distributor could and would have the incentive to depart from the original investment strategy – including the capex/opex ratio – in favour of a lower cost alternative, if one existed. This is the case since the lower cost strategy would allow the distributor to take advantage of the predetermined allowed revenues that were computed based on the more costly strategy, until the next price review. However, in the context of repeated interactions with the regulator, we would expect that this is unlikely to happen, as it might be interpreted, for example as evidence that:
The firm concealed the more efficient investment option at the revenue setting stage, or
The firm is delaying necessary investment to obtain profits in the short term, while consequences of such delay on, say, quality of service, will materialize in the future.
This holds to the point that claw back of tariff revenues is implemented in some countries in case the distributor does not realize planned investment. In addition, as discussed in section 0 (task 3) several measures are commonly put in place in order to limit the risk that invested capital turn out to be under‐remunerated. These features may reduce, in practice, the ability of the revenue setting mechanisms to drive the firm’s investment decisions, and therefore the capex/opex ratio selection. 30
Second, the ability of the revenue setting mechanisms to induce efficient investment decisions is likely to be reduced by the limited duration of the regulatory period. For illustrative purposes, consider a system based on pre‐determined total revenue cap, possibly dependent on some output variables. Under this scheme, during the regulatory period revenues are independent from total actual cost. The distributor has to deliver the outputs agreed with the regulator and bear the corresponding cost, in exchange for the pre‐determined revenues. As a consequence the distributor’s profit maximising strategy consists in minimising total cost. However, in order to provide correct investment incentives, the regulatory period has to be at least as long as the time‐horizon relevant for the distributor’s investment assessment. If, for example, the benefit of an investment in terms of lower operating costs is expected to materialise in 15 years, total revenues must be fixed for at least 15 years for the distributor to receive the correct incentives to invest. If, on the contrary, a tariff review is expected to transfer the benefit of the investment to the consumers in the form of lower tariffs after only 5 years, the incentive for the firm to substitute capital for operating cost would be curbed31.
Keeping allowed revenues fixed over the very long period necessary to provide optimal investment incentives would make departure of actual costs from allowed revenues likely; consumers would then have to pay a high risk premium to attract capital in such a risky enterprise.
We recall incidentally that experience in the transmission sector confirms that financial incentives aimed at inducing system operators to make optimal network development decisions are very hard to design and implement. There are no indications that regulators that have implemented such mechanisms regard them as a substitute for
30 This holds to the point that claw back of tariff revenues could take place if the distributor does not realize planned investment. 31 Notice that the argument holds even if the distributor is allowed to recover the entire invetsment cost. What distrots the distributor incentive is the limited duration of the period in which it can appropriate the variable cost saving.

98
careful monitoring of the system operator’s plans. We will further address distribution network development issues in section 4.5.
Incentive‐based mechanisms on operating costs, quality of service and on other distributor’s targets
In most countries incentive based mechanisms are implemented to induce distributors to reduce operating costs. These mechanisms are based on:
(Various implementations of) standard costing, mainly based on the comparison of the costs of distributors operating in different areas and;
Predetermination of allowed revenues for a certain number of years, irrespective of actual operating cost.
Incentive‐based mechanisms have proved very effective in inducing operating cost reductions in several countries, including for example in Great Britain and Italy. In Italy for instance, OPEX are subject to a price cap and at the beginning of each new regulatory period the new cap price is set so that 50% of the efficiency gains achieved (that is, the difference between actual and allowed costs) by the DSO in the previous period are not transferred to the customers through reduced tariffs.32 Instead, the savings are kept by the DSO, therefore providing a strong incentive to DSOs to reduce their OPEX.33
Financial incentives targeting quality of the distribution service in the form of penalties or premiums for quality levels respectively below or above pre‐determined targets are part of the standard regulatory toolbox for distribution in Europe and have proven to be effective.
Incentive mechanisms targeting individual performances (or outputs) of the distributor’s activity may be effective, provided:
The performance level can unambiguously be measured;
The value for the consumers of achieving the target can be assessed; this might be difficult if the performances that are incentivised have an indirect impact on the consumer’s welfare34;
The regulator has enough information to develop an autonomous view on the cost for the distributor to achieve the target; otherwise consumers might end up paying high cost to induce the distributors to deliver the target performance.
32 This measure is considered in Section 2.2. of the Italian electricity country analysis, on page 379 of this report. 33 This measure is considered in Section 2.2. of the Italian electricity country analysis, on page 379 of this report. 34 An example, from transmission, is incentive systems on the TSOs to forecast accurately intermittent renewable production. The ability to forecast renewable production has an indirect impact on consumers, via lower system operation costs and/or greater security of supply. However, the relationship between the incentivised performance and the consumer’s pay‐off is complex and difficult to quantify.

99
5.4. Tariffs
Tariff setting responsibilities are split differently between regulators and distributors (and the Government, in Spain) in different Member States. In this respect, no clearly superior model has emerged from our analysis, provided the methodology and assumptions which tariffs result from are transparent and verifiable, at least by the regulator.
In all member States total distribution costs are allocated to different categories of consumers based on some notion of cost‐reflectiveness. We find that greater transparency would be beneficial on:
i) The methodology to split total distribution costs among the different categories of consumers, typically consumers connected at different voltage or pressure level and
ii) The drivers for cost allocation to capacity and energy charges.
Traditionally, energy demand by small consumers has been price inelastic in the short term. In that context alternative methodologies to split costs among consumers would differ mainly in terms of wealth (re‐)distribution, and fairness would be the relevant metric to assess them.
However, measures that are being introduced to exploit the flexibility potential of small consumer’s electricity demand, and more generally policies focusing on efficiency in the electricity industry, would lead to emphasizing efficiency considerations in distribution tariff design.
We have not encountered tariff schemes providing short term price signals of distribution capacity availability on a continuous basis. We find this approach sound, as short term price signals of the scarcity of transportation capacity are efficiently conveyed via locational differentiation of the electricity prices.
Summer/winter or day/night distribution tariffs are implemented in a limited number of countries. When assessing these arrangements the following elements should be kept in account. First, in order for such tariff systems to convey correct price signals, distribution scarcity conditions must be accurately predictable far in advance of real time, which is rarely the case.
Second, given the typical structure of distribution networks35, persistent distribution scarcity conditions are likely to place continuity of service at risk and therefore are unlikely to be a feature of an optimally dimensioned network36. In addition, addressing a structural shortage of distribution capacity by systematically curtailing embedded renewable generation (even though through price signals) would run against the very purpose of renewable generation support, which is maximising renewable production. For these reasons we would expect that
35 Less meshed than transmission networks. 36 Notice incidentally that, in this respect, distribution and transmission differ. In particular, insufficient transmission capacity typically results (only) in higher generation cost and therefore optimally dimensioned transmission system may feature some scarcity situations. This happens because transmission networks are typically highly meshed. On the contrary, distribution networks traditionally feature a more tree‐like topology, consistent with their function of transferring a unidirectional power flow from transmission to the consumers’ premises. With such a topology, lack of distribution capacity is likely to result in frequent service disruptions; these are very costly because of the high cost of unserved load. For that reason it is unlikely that an optimally dimensioned distribution system feature recurring scarcity situations.

100
sending short term scarcity signals to ration the use of distribution network should be normally unnecessary.
Third, in case scarcity conditions happen to be a structural feature of a distribution system, charging structures fixed well in advance of real time are highly imperfect substitutes for dynamic pricing schemes. In particular, the distinguishing feature of such schemes is that either distribution charges or energy prices vary on a continuous basis and by location in order to balance supply and demand of (distribution) transportation services. The merits of alternative forms of dynamic pricing have been extensively discussed in the context of electricity transmission. Reviewing that discussion is beyond the purpose of this report37. It suffices to recall that, in all practical applications locational energy price differentiation has been favoured over dynamic charging of network services. However, we are not aware of any application of either locational energy prices or dynamic network charging to distribution.
Finally, for the sake of completeness we recall a pricing scheme often referred to in the discussion on optimal distribution tariffs: “critical load” pricing. The distinguishing feature of critical load pricing is that high distribution charges apply when the distribution system’s load peaks. Two possible implementations of such scheme can be conceived. First, a critical load charging structure set ex‐ante, based on forecasts of the hours in which distribution peak‐load will occur. This approach suffers the limitations of all schemes based on pre‐determined tariff structure, discussed above. In particular, charges fixed ex‐ante provide strong signals to network users as to when they should reduce network use but do not guarantee that this happens when capacity is really scarce38.
Alternatively, critical pricing can be implemented ex‐post. In this version, the hours in which system peak was reached are identified after‐the‐fact and injections and withdrawals that took place at those times are subject to higher distribution charges. This version of critical load pricing mechanism can be regarded as a simplified form of dynamic network charging. In particular, with this form of ex‐post critical load pricing:
Scarcity hours are correctly identified, like in an ideal dynamic network charging system;
The level of the charges applied in those hours is pre‐determined, while in an efficient dynamic pricing system such charges would take, at each time, the value that balances supply and demand of transportation capacity.
When sending short term scarcity signals is unnecessary or impossible, distribution tariff structures based on long term cost causation criteria, as those currently implemented in most Member States might be appropriate, if anything on fairness grounds.
Based on economic theory, as reflected in the cost allocation methodologies used in several countries, appropriate cost drivers for such tariff schemes appear to be:
The consumer’s withdrawal at the distribution system’s peak, as an indicator of the consumer’s responsibility in causing the cost of shared distribution assets. Proxies for this cost driver are commonly used. In France, for example the load factor of contracted connection capacity – i.e. the ratio between consumption and contracted
37 Interested readers are referred to, for example, Dmitri Perekhodtsev and Guido Cervigni, Chapter 4, Congestion management and transmission rights, in The Economics of energy markets. Theory and policy. Pippo Ranci and Guido Cervigni editors, Edward Elgar Publisher, 2013. 38 A variation of this argument is known as “shifting peak”. This occurs in case most network users move away from high‐priced hours and cause peak‐load to move to low‐priced hours,

101
connection capacity – is used as a proxy of the consumer’s responsibility in causing distribution costs. We expect that once smart meters are deployed, charging consumers directly based on such cost driver will be possible.
The consumer’s maximum withdrawal, as an indicator of the consumer’s responsibility in causing the cost of consumer‐specific assets.
We conjecture, that increasing consistency between the structure of distribution tariffs and the structure of distribution incremental costs would result, in most countries, in greater reliance on capacity related charges over energy related charges, compared to the current situation and, in some countries, to greater geographical differentiation.
Both shallow and deep connection charges are used in Europe and we find no compelling reason to favour one approach over the other. Deep connection charges are (more) consistent with a logic of network expansion driven by the connection requests. On the contrary, shallow connection charges are (more) consistent with an approach in which generation hosting capacity is developed in anticipation of connection requests. We were not able to characterize the policies of the Member States in this area and a discussion of the relative merits of the two approaches to network development is beyond the scope of this project39.
However, we find that as the share of embedded generation increases:
Rights and obligations for connected generators should be clearly established and consistently enforced; in a context of very high penetration of renewable embedded generation such obligations could include, for example, a duty to participate in the markets for ancillary services, or limitations to their right to inject power in the system in case such injection caused unreasonable re‐dispatch cost.40 In France for example the DSO can require embedded generators to disconnect in the event that the distribution system cannot handle their power injections. Similarly, in Luxembourg, DSOs can require embedded generators to disconnect if network conditions require it, and DSOs can also directly control flexible loads.41
The (expected) cost for the system to enforce the rights granted to embedded generators, for example re‐dispatch or network upgrade costs, should be reflected in connection charges in order to coordinate generation and distribution investment decisions.
In the electricity distribution sector in Germany for example, the connection charge is meant to cover the cost of the facilities that are specifically set up to serve the customer and the connection to his housing. In addition, the consumer is obliged to pay a contribution towards the cost of the reinforcement of networks and shared resources.42
Consumers in Germany are obliged to pay the connection costs and a contribution towards the network costs. The DSO prepares an estimate based on its cost but the customer is free to procure the necessary works from a different provider. For consumers and generators alike, the DSO may refuse connection only if it is impossible or if it would entail an 39 The former approach has the advantage of reducing the risk of stranded investment. However, implementation of network upgrades after the user’s commitment may delay connections. 40 Another approach to incentivise generators to limit their injections is to apply a charge to them, which is geographically‐ and/or timely‐differentiated to match incentive and network needs. 41 As discussed in Sections 4.2 of the France and Luxembourg country analyses, on page 284 (France analysis) and page 417 (Luxembourg analysis) of this report. 42 As discussed in section 3.2 of the German electricity distribution analysis, on page 405 of this report

102
unreasonable cost. Upon request of the requesting party, in the case of lack of hosting capacity the reasons must also contain meaningful information regarding the concrete measures and the costs associated therewith would be individually necessary for development of the system to achieve connection to the system.
5.5. Network development
Our analysis in section 0 (task 3) suggests that electricity and gas distributors in Europe enjoy greater autonomy than transmission system operators in taking network development decisions, since network development plans are generally not published and subject to public consultation; furthermore, in most countries distributors are not subject to the regulator’s approval. We notice incidentally that in no country electricity distribution network development plans appear to indicate targets on generation hosting capacity.
In some respects such governance model of network development is consistent with the traditional features of the distribution business. In particular:
The outputs of distribution were easy to characterize and verify. Broadly these output can be characterized as: making the electricity service universally available, reaching a reasonable coverage of the population with gas networks and fulfilling certain quality levels, mainly in terms of service continuity;
Technologies to realize and manage traditional passive distribution networks were consolidated and the main development decisions concerned network topology and asset sizing.
The content of the distribution service, in particular for electricity, can be expected to change in the future if the current policy and technological trends persist.
First, multiple resources connected to distribution networks will be dispatchable43 including embedded generators, flexible loads, storage systems and other active network equipment. Further, smart‐grid technologies will make the network topology more dynamic than in the past.
This evolution will present distribution system operators and regulators with new trade‐offs both in day‐by‐day operations and in network development. For example developing demand side flexibility might be an alternative to network upgrades; deploying network intelligence, an alternative to building new lines and transformers.
Second, interaction between development decisions at the transmission level and at the distribution levels might become more complex, as the two become in some respects more similar.
Third, network development decisions will have to be coordinated with the outcomes of other policy streams. For example, as the share of embedded generation grows, network development plans and renewable generation targets need to be coordinated, to prevent that in some areas network upgrades turn out to be useless – because no generation connection is requested – while in other areas
43 By dispatchable we mean that injections and withdrawals by those resources will be controllable. The regulatory and trading arrangements governing dispatch of embedded generators and flexible loads are still being developed, including the form of the distributors’ involvement.

103
network development fails to keep up with connection requests by generators.44 Some countries currently have more clearly‐defined approaches to coordinating and integrating (network development, RES integration and hosting capacity) targets compared to other countries. For instance, in Slovenia, RES targets are explicitly taken into consideration within the network development plan to forecast hosting capacity requirements;45 in Lithuania, Government‐set RES targets are explicitly used as an input in the distribution development plan, which must make provisions for consistent hosting capacity;46 and in the Netherlands, network development plans are based on regional‐level RES development plans.47 Another important policy interacting with distribution network planning is that on electric mobility, as lack of distribution capacity may constrain large scale adoption of electric vehicles. Further, telecommunication technologies are crucial in smart‐metering and smart‐grid solutions; this may result in points of contact between, on one hand, smart‐metering and smart‐grid plans and, on the other hand, policies on national or local ICT infrastructures. For example multiple local services, including waste collection and street control, could use the same telecommunication infrastructure set up for smart meters.
These trends call for a more comprehensive, transparent and open distribution network planning process, with greater involvement of regulators and stakeholders to some extent on the lines of mechanisms currently governing development of transmission networks. In that context as many as the distributor’s objectives should be cast in terms of outputs, including for example targets on:
Hosting capacity of embedded generation in each area of the distribution network
Maximum total curtailment of renewable generation connected to the transmission network;
Quality of service.
Allowed revenues could then be set against those targets and output‐based incentive mechanisms designed. For examples, in exchange for a certain total revenue allowance distributors could be required to compensate embedded generators for delays in connection or for production curtailment beyond pre‐defined targets48.
The regulatory regime in Great Britain makes extensive use of reward and penalty incentives within the formulae used to calculate each DSOs´ allowed revenues. These incentives are used to encourage DSOs to achieve specific identified outputs. The main outputs which the British regulator aims to promote through the use of incentives include: developing high‐quality business plans, reducing overall costs, dealing with customer complaints; customer satisfaction; engaging with stakeholders; and reducing electricity losses and disruptions.49
44 This highlights the risk of stranded assets on the network. In Member States where there is no shallow connection boundary, building the network ahead of need in this manner is more difficult as it requires a contribution from the connecting customer who benefits from the investment. 45 Discussed in Section 4.1 of the Slovenian country analysis (page 559 of this report) 46 Discussed in Section 4.1 of the Lithuanian country analysis (on page 406 of this report) 47 Discussed in Section 4.1 of the Netherlands country report (on page 452 of this report) 48 Measures on this line are implemented in Germany. 49 These incentives are discussed in section 4.4.2 of the Great Britain country report (electricity), where the sizes of each incentive is quantified.

104
Although the trends highlighted have by far a larger impact on the electricity industry, we would expect that a more transparent, open and comprehensive planning process be beneficial in the gas distribution sector.
We note finally that in highly fragmented distribution sectors implementation of open and audited planning processes might be unfeasible or too expensive. One possibility would be to group neighbouring distributors for the purpose of producing plans to feed into the consultation or auditing process.
We note incidentally that some crucial decisions that will shape the content of the distribution business in the future have to be coordinated among (at least, small neighbouring) distribution companies. These decisions include for example the selection of smart meter and smart grid technologies and possibly the arrangements governing operations of EV charging stations, in order to ensure interoperability of information systems and coordinated operations of interconnected networks, as well as full exploitation of scale economies. We would then expect that the same institutional process ensuring such coordination might be adapted to aggregate multiple distributors’ investment plans.
5.6. Other roles of distributors
We have identified three areas of responsibilities of distributors beyond their traditional role of energy carriers.
First, in some countries distributors play a role of facilitators of retail competition, for example through their involvement in the supplier switching process.
Second, in some countries distributors are assigned energy efficiency responsibilities.
Third, the increasing share of generation capacity connected to distribution networks might change the content of the distributor’s activity. In a possible scenario distributors might develop into “system operators”, i.e. they will control and dispatch resources connected to their networks.
At this stage we do not envisage specific implications of these activities in terms of optimal methodology to set allowed revenues and distribution tariffs. Simple financial incentive schemes may be designed to align the distributor’s objectives with the regulator’s in selected matters. For example fixed‐price schemes to cover the costs of administering switching processes may induce distributors to minimize cost. Performance related premiums and penalties may induce distributors to actively pursue their energy efficiency objectives. The application of incentives to invest in smart metering technologies may also become more prevalent. In the electricity distribution sector in Poland for example, the regulator introduced an incentive to invest in smart metering, through allowing an increased return on capital for investments that meet the necessary requirements.50
Incentive‐based regulation of system operations activities is also conceivable, but experience in the transmission sector indicates that striking the optimal balance between incentives and risks in the field of system operations is hard. This happens, in particular, because it is difficult to disentangle the effects on total supply costs of factors beyond and factors under the system operator’s control. We would expect that the similar issues would affect the design of an incentive based mechanism of the distributors’ activity as system operators.
50 This measure is considered in Section 3.2 of the Polish electricity distribution analysis, on page 476 of this report.

105
However, incentivisation of selected system operator tasks, for which performance are easily measurable, have proven to be effective. For example, in some countries system operators are exposed to financial incentives to provide to market participants accurate estimates of demand for renewable production.
We would expect that the similar issues would affect the design of an incentive based mechanisms of the distributors’ activity as system operators.
5.7. Metering
With the exception of the Great Britain, the prevailing organization of metering activities in Europe is based on a monopoly of gas and electricity distributors, either formally established or de‐facto, Therefore tariff regulation of the metering activity is and will remain necessary.
We don’t see any particular issues in the allocation of metering costs across consumers, since a large part of them is clearly associated with the metering point, and the remaining part, mostly related to ICT and data management, is independent from the consumer’s characteristics or behaviour.
Most European regulators have mandated accounting separation of metering activities, in some cases because smart‐metering costs are subject to specific treatment. We support this approach for two reasons.
Firstly, accounting unbundling facilitates benchmarking of the cost and performance of smart‐metering businesses, which we would expect to be reasonably comparable across distributors, even operating in different Member States.
Secondly, unbundling makes it easier to reorganize metering activities in the future, in case for example data management were to be transferred from distributors to third parties.

106
6. Task 5 – Analysis of tariff structures of different user groups
6.1. Introduction
In this chapter we analyse and compare the electricity and gas distribution tariff structure and other aspects across EU Member States in different consumers groups. The analysis is based on the statement and the data facilitated by national regulators.
The analysis is based around the following topics:
Role of setting the distribution tariff
Analysis of electricity distribution Tariff
o Tariff structure
o Tariff components by consumer group
o Revenues per energy consumption and connection points
o Average network tariff by consumer group
Analysis of Gas Distribution Tariff
o Tariff structure
o Tariff Components by consumer group
o Revenues per energy consumption and connection points
o Average network tariff by consumer group
The analysis is focused on distribution network charges, excluding connection charges for end‐users and distribution tariff for embedded generators.
6.2. Role of setting the distribution tariff
The responsibility of setting the distribution tariffs (Electricity and Gas) do not usually depend on a single actor in the EU member states. Each government through the national law (Energy act) defines the main principles of the energy sector, including the distribution business. In general two main approaches are followed:
NRA is the main responsible. The setting of the distribution tariff, methodology, and prices for the regulatory period is an exclusive responsibility of the regulator. This approach is used in the following countries: Austria, Croatia, Czech Republic, France, Greece, Hungary, Italy, Ireland, Luxembourg, Lithuania, Portugal, Romania and Slovenia. Spain is a special case since the government is the main responsible along with the support of the regulator.
Share of responsibilities. The NRA sets the rules, the methodology and approves tariffs or allowed revenues, while DSOs set the tariff structure and level, and the corresponding allocation between different categories of users (for instance of electricity usually by voltage levels and gas usually annual consumption). The NRA then assesses and approves the tariffs. This approach is used in the following countries: Belgium, Cyprus, Denmark, Estonia, Finland, Germany, Malta, Poland, Slovakia, Sweden and The Netherlands. In Great Britain the regulator assesses the

107
tariff and defines the framework of price control and revenues, but does not approve tariffs.
The figure below shows that there are 15 countries (53%) where the responsibilities of setting the distribution tariff are centralized in regulatory authorities. Other 11 countries (39%) share the responsibilities between NRAs and DSOs. There are 2 countries for which information is not available. The Annex describes in detail who is responsible of setting the distribution tariff in each Member State (MS).
Figure 1: Main responsible party for setting Distribution Tariff (Number of countries)
Source: Own elaboration on data collected from NRAs. Situation in 2013
6.3. Analysis of the Electricity Distribution Tariff
6.3.1. Tariff structure
In each EU country the tariff structure is defined by the national regulator or DSO according to certain customer segmentation. In most cases the segments are defined by voltage level, while in some countries tariffs are defined in terms of consumers’ class (´household´, ´industrial´, etc.).
The main variables considered in the definition of tariff structures are:
Voltage level. Tariff levels are defined for specific voltage ranges at the point of connection to the distribution grid. Usually there are three levels: High Voltage (higher than 36 kV), Medium Voltage (between 1‐36 kV) and Low Voltage (less than 1 kV). In some countries the distribution networks only operate Medium Voltage and Low Voltage networks.
Contractual capacity/power. Tariff levels are defined for ranges of contractual power according to users demand profile.
Consumer group. Users are segmented according to their characteristics. Customer categories are often differentiated by the type of user (Small house, Household,

108
Farm, Business Customers, Small Industrial, Public lighting systems, Public recharging of electric vehicles, etc.)
Metering system. Tariff levels are designed according to the capabilities of metering devices to obtain data (Smart metering: Time of use consumption, Peak demand power, etc.)
Annual consumption. Tariff levels are sorted out according to different intervals or bands of annual consumption ( Kwh/year).
Geographic zone. In some countries the geographic zone is one of the variables used to define tariff levels.
In the majority of the EU Member States (24 of 25 with available data), the main variable used to define the tariff categories is the voltage level. In some countries such as Denmark, Estonia, Romania and Slovenia this is the only variable used to allocate users to a given tariff category.
In other countries both the voltage level and the contractual power are the main variables for identifying tariff categories. This happens for example in Austria, France, Greece, Hungary, The Netherlands, Poland, Portugal and Spain.
Other countries such as Croatia, Cyprus, Czech Republic, Italy, Lithuania and Slovakia also have tariffs defined by voltage level and specific consumers groups such as Households, Small Industrial, Large Industrial, etc. In the Czech Republic, Finland, Ireland and Malta the tariffs are defined by voltage level, specific consumers groups and contractual capacity.
It is as also important to highlight that metering systems are one of the criteria in use in some countries in order to define the tariff segmentation. Some MS that use this variable are Austria, Croatia, France, Germany, Greece, Ireland, Luxembourg and Great Britain.
One additional component that is taken into consideration in a limited number of countries is the annual energy consumption as in the case of Finland (i.e.: Tariff L1. House with electrical heating in every room, 3x25 A, usage 18000 kWh/annum) and Malta.
Finally in Sweden, the methodologies for setting the tariff vary considerably between the different DSOs as long as it is non‐discriminatory and objective.
The following table describes the variables involved in the definition of the tariff levels for each country.

109
Table 22: Key variables used in the definition of electricity distribution tariffs categories in EU countries
Tariff Structure
Country Voltage level
Annual Energy consumption
Consumer group
Metering system
Contractual capacity/power
Austria X X X
Belgium N.A N.A N.A N.A N.A
Bulgaria N.A N.A N.A N.A N.A
Croatia N.A X X
Cyprus X X
Czech Republic X X X
Denmark X
Estonia X
Finland X X X X
France X X X
Germany X X
Greece X X X
Hungary X X
Ireland X X X X
Italy X X
Latvia N.A N.A N.A N.A N.A
Lithuania X X
Luxembourg X X
Malta X X X X
Netherlands X X
Poland X X
Portugal X X
Romania X
Slovakia X X
Slovenia X
Spain X X
Sweden Depends on DSO
Great Britain X X X X
Total countries 23 2 10 8 13
Source: Own elaboration on data provided by NRAs with reference to the year. Situation in 2013
6.3.2. Tariff components
The analysis illustrates the identification of the electricity tariff components and a comparison of component weight share across EU Member States for the following consumer groups:
Household user connected to a low voltage network with an annual consumption of 3,5 MWh and 6 kW of contractual power.

110
Small Industrial user connected to a low voltage network, an annual consumption of 50 MWh and 35 kW of contractual power. (In The Netherlands this contractual power ‐35KW‐ is part of Household tariff)
Large industrial user with an annual consumption of 24000 MWh, 7000 use hours and 4000 kW of contractual power.
The most common components in Electricity networks are:
Fixed component: In some countries it is known as standing charge or service charge by connection point/costumer. (€/day, €/month, €/year).
Capacity component: component to charge the users for the availability to use a maximum power. Usually for the household user the maximum power is controlled thought a circuit breaker. For the industrial user the maximum power is controlled and metered through peak demand meters (maximeters). In most countries, the user will face considerable charges, if they exceed this maximum contractual capacity (€/kW).
Active Energy component: charge for the actual usage of energy. It is the volumetric component of the tariff. In some countries it is known as commodity or variable charge (€/kWh).
Reactive energy/power component: charge for reactive energy (€/ KVArh).
Loss energy component: it is a per energy component used to charge the technical distribution network losses. In most of the countries the losses are included in the active energy component.
Components of electricity distribution tariffs were analysed according to the information provided by regulators as well as publicly available information. Additionally, for countries where data are available, the weight of each component for each consumer group along with other relevant aspects are shown.

111
6.3.2.1. Household consumer group
Identification of tariff components
The following figure refers to Households consumer groups and describes for each tariff components, in how many EU Member States it is applied.
Figure 2: Distribution Tariff components in Household (Number of countries)51
Source: Own formulation based on data provided by national regulators. Situation in 2013. Data from Bulgaria and Latvia are not available.
The next table details the tariff components defined for household consumers across EU member states.
51 For countries which fall into the category of ´could apply in some tariffs´, this refers to the situation whereby some (but not all) of the tariffs used in that country include the particular tariff component under consideration.

112
Table 23: Distribution tariff components identified by country for Household consumers
Country Fixed Charge Capacity charge Energy charge Energy reactive Other
Austria Yes No Yes No No
Belgium Yes No Yes No No
Bulgaria N.A N.A N.A N.A N.A
Croatia No No Yes No Yes, Metering
Cyprus Yes No Yes No No
Czech Republic Yes No Yes No No
Denmark Yes No Yes No No
Estonia No
Yes, it’s possible. There are two
options: Capacity + Energy or Energy
Yes No No
Finland No Yes Yes No No
France Yes Yes Yes No No
Germany Yes No Yes No No
Greece No Yes Yes No No
Hungary Yes No Yes
Possible if the meter installed can measure the reactive power.
Yes, Loss charges
Ireland Yes No Yes Yes No
Italy Yes Yes Yes No Yes, Metering
Latvia N.A N.A N.A No N.A
Lithuania Yes, it is Possible
No Yes No No
Luxembourg Yes No Yes No Yes, Metering
Malta Yes No Yes No No
Poland Yes No Yes No Yes, subscription fee (Metering)
Portugal No Yes Yes No No
Romania No No Yes No No
Slovakia No Yes Yes No Yes, distribution
losses
Slovenia No Yes Yes No No
Spain No Yes Yes No Yes, Metering
Sweden Yes No Yes No No
The Netherlands Yes Yes No No No
Great Britain Yes No Yes No No
Source: Own elaboration on information provided by national regulators included in country reports (country report Table 3: Tariff components, customers and revenues per customer class). N.A: Data not available.
In the case of household clients, most countries apply a fixed (standing) charge (16), while a lower number of countries apply a capacity charge (9). Fixed charges (a flat fee for a period of time: day, month, year) could depend on different parameters as shown below.
For example in Austria, for a Household user (Tariff 7) a fixed (standing annual) charge between 13,80 and 23,52 €/year is charged depending on the zone. In Denmark or Italy, all consumers pay a subscription or fixed charge that is equal for all the consumers in the same
113
class. In the Czech Republic there is a fixed per capacity reservation component equal for all consumers in the same class (CZK/A of circuit breaker and month). In Hungary household consumers are charged a Basic charge that includes a per connection component for all consumers in the same class. In Luxembourg the residential customers with LV SLP (Non metered Low Voltage Synthetic Load Profile) only pay 2€ per month as a fixed charged.
Other countries with fixed components include: Belgium, Cyprus, Denmark, France, Germany, Italy, Malta, Ireland, Luxembourg, Poland, Sweden, The Netherlands and Great Britain.
The capacity charge depends on the maximum power contracted and billed to end‐users. Users may pay a kW/day, kW/month or kW/year fee. For example in Spain household consumers usually have the 2.0A tariff which is for a contracted power lower than 10kW (€/kW/year).
This capacity component applies in Finland, France, Greece, Italy, Portugal, Slovakia, Slovenia, Spain and The Netherlands. In Estonia the capacity charges could apply or not depending on DSO.
Usually in the countries where the user pays for a capacity charge, they do not pay for a fixed charge, with the exception of France, Italy, The Netherlands and Sweden. In almost all the countries the variable cost of distribution network is charged as an energy component (25) with the exception of The Netherlands.
In some countries (12) such as Austria, Croatia, Czech Republic, Ireland, Lithuania, Portugal, Poland, Spain and Great Britain there could be more than one energy component depending on the time of use. These kinds of tariffs encourage consumers to use energy at off‐peaks time which reduces the energy used in peak periods, balancing the grid consumption.
For example in Austria There are four time blocks (winter and summer, both split in a peak and off‐peak time) and 15 zones. In Ireland, Croatia, Estonia or Lithuania the energy component could have one or two time zones. In Spain, the energy component of tariff 3.1 has three time zones (3P).
The reactive energy component is less common in Household consumers (1 countries). Although the component is defined by the regulator, it is hardly ever put into practice. For example in Hungary it only applies to consumers, if the meter installed can measure the reactive power (this charge represents only a very small part of the DSO’s income). In Spain the reactive component is defined and published by the regulator, but in practice it is not charged to household consumers. In Ireland a reactive energy charge applies to this consumer group.
In the majority of the countries (17) there are no “other” distribution tariff components for household consumers. However in Hungary and Slovakia, there is a Loss Distribution component which is part of the network tariff. In Croatia, Spain, Luxembourg, Poland and Italy, there is a separate tariff component which charges for the use of metering devices.
Weight of tariff components
The following figure shows a comparison of weights of tariff components across EU member states for Household consumers. For the calculation, the following components were considered: fixed charge, capacity charge and active energy charge.

114
Figure 3: Distribution Tariff component weight in Households
Source: Own elaboration on Fixed charges, Capacity charges and Energy charges values facilitated by national regulators. Data of Belgium, Bulgaria, Croatia, Denmark, Estonia, Ireland, Latvia, Lithuania and Malta are not available. Household consumer with an annual consumption of 3500 kWh connected to the low voltage grid and 6 KW of contracted capacity. Situation in 2013. Details on values of each component by country is summarised in “Annex 5: Breakdown of electricity network annual charges by country – customer types”.
For a Household consumer, the average active energy component across EU member states (19 countries with data available) is above 69% of the total.
In most of countries, the weight of the energy component is above 60% including Austria, Cyprus, Czech Republic, France, Germany, Greece, Hungary, Italia, Poland, Portugal, Slovakia, Slovenia and Great Britain. In Romania the network is recovered only by an energy component.
On the other hand Finland presents an even distribution of cost recovery between the energy and fixed components, while a few countries including Spain and Sweden the fixed or capacity component is dominant and around or above 80% In the Netherlands the totality of costs is charged through the capacity component for household consumers.
6.3.2.2. Small industrial consumers
Identification of tariff components
The following figure refers to the Small Industrial consumer group and describes in how many countries a specific tariff component is applied.
Figure 4: Distribution Tariff components in Small Industrial (Number of countries)

115
9
16
24
117
16
7
1
1317
2 13 3 3 3 4
Fixed Charge (€) Capacity charge [€/kW]
Energy charge[€/kWh]
Energy reactive (€/kvarh)
Other
Distribution tariff components in EU Countries by consumer group: Small Industrial
Yes No Could apply in some tariffs Data no available
Source: Own elaboration based on questionnaires and country report with data provided by national regulators. Situation in 2013. Data for Belgium, Bulgaria and Latvia are not available for this consumer group.
The next table shows details of the tariff components defined for small industrial consumer
across EU Member States.
Table 24: Distribution tariff components identified by country for Small Industrial consumer
Country Fixed Charge Capacity charge Energy charge Energy reactive Other
Austria No Yes Yes N.A No
Belgium N.A N.A N.A N.A N.A
Bulgaria N.A N.A N.A N.A N.A
Croatia No Yes Yes Yes Yes, Metering
Cyprus Yes No Yes No No
Czech Republic No Yes Yes Yes No
Denmark Yes No Yes No No
Estonia No
Yes, it’s possible. There are two
options: Capacity + Energy or Energy
Yes Yes N.A
Finland No Yes Yes No No
France Yes Yes Yes Yes No
Germany No Yes Yes Yes No
Greece No Yes Yes No No
Hungary Yes No Yes Yes Yes, Loss charges
Ireland Yes No Yes Yes No
Italy Yes Yes Yes No Yes, Metering
Latvia N.A N.A N.A N.A N.A
Lithuania No Yes Yes No No

116
Country Fixed Charge Capacity charge Energy charge Energy reactive Other
Luxembourg No Yes Yes No Yes, Metering
Malta Yes No Yes Yes No
Poland No Yes Yes No Yes,
subscription fee (Metering)
Portugal No Yes Yes Yes No
Romania No No Yes No No
Slovakia No Yes Yes No Yes,
distribution losses
Slovenia No Yes Yes No No
Spain No Yes Yes Yes Yes, Metering
Sweden Yes No Yes No No
The Netherlands No Yes No Yes No
Great Britain Yes
Yes. It can apply if the small industrial consumer if they
elect to move to HH settlement.
Yes
Yes. It can apply if the small industrial
consumer if they elect to move to HH settlement.
No
Source: Own elaboration based on questionnaires and country report with data provided by national regulators. N.A: Data not available.
Most countries apply a capacity charge (16) rather than a fixed charge (9) contrary to what happens with household clients. The capacity charge is applied in Austria, Croatia, Czech Republic, Finland, France, Germany, Greece, Italy, Lithuania, Luxembourg, Poland, Portugal, Slovakia, Slovenia, Spain and The Netherlands. A fixed component is applied in Cyprus, Denmark, France, Hungary, Ireland, Italy, Malta, Sweden and Great Britain. In France and Italy both components could apply for small industrial consumers. In Great Britain both components can apply if the customer chooses to move to smart metering (supply points with half hourly meters). In Estonia the capacity charges could apply or not depending on DSO.
In all the countries with available information there is an energy component for small industrial consumers. In 15 countries a time‐of‐use distribution tariff is applied in one way or another. (See Annex 4 Summary of time‐of‐use differentiation in electricity distribution tariff by consumer group)
The reactive energy component for small industrial users is more common than with household clients. This component exists in 12 countries of the 25 where this kind of data is available. Those are Croatia, Czech Republic, Estonia, France, Germany, Hungary, Ireland, Malta, Portugal, Spain and The Netherlands and Great Britain. In Great Britain the reactive charge can apply to small customers if they choose to move to smart metering (supply points with half hourly meters). For Austria, Cyprus, Denmark, Finland, Greece, Italy, Lithuania, Luxembourg, Poland, Romania, Slovakia, Slovenia and Sweden there is no evidence on the use of this component.
In some countries there are also additional distribution tariff components (7). There is a Loss Distribution component in Hungary and Slovakia. In Croatia, Spain, Luxembourg, Italy and Poland, there is a tariff component which charges for the use of metering devices.

117
Weight share of tariff components
The following figure shows a comparison of weight of tariff components across EU Member States for small industrial consumers. For the calculation, the following components were considered: fixed charge, capacity charge and active energy charge.
Figure 5: Distribution Tariff component weight in Small Industrial
60%
2%
36%
47%
30%
1%
14%
47%
92%
84%
64%
87%
20%
66%
80%
38%
100%
9%
46%
40%
98%
64%
53%
70%
99%
86%
53%
8%
16%
36%
13%
100%
80%
34%
20%
62%
0%
91%
54%
AT
CY
CZ
FI
FR
DE
GR
HU
IT
LU
PL
PT
RO
SK
SI
ES
SE
NL
GB
Ave.
Fixed + Capacity components Energy component
Source: Own elaboration on data provided by national regulators on fixed charges, capacity charges and energy charges, Data for Belgium, Bulgaria, Croatia, Denmark, Estonia, Ireland, Latvia, Lithuania and Malta are not available. Small industrial consumer with an annual consumption of 50000 kWh connected to the low voltage grid and contracted capacity of 35 KW. Situation in 2013 Details for each component by country is summarised in “Annex 5: Breakdown of electricity network annual charges by country – customer types”
For a small Industrial consumer, the average active energy charge (19 countries with data available) is about 54% of the total charges for distribution activities, while non‐volumetric charges (fixed or capacity component) amount to around 46%. For this type of consumer the capacity or/and fixed component have a higher weight when compared with household consumers.
The weight of the active energy charge is higher than 85% of the total expenditure in 6 out of 19 countries with available data. These countries are Cyprus, Germany, Greece, Romania, Slovakia and Great Britain. Romania is a special case where only an energy component applies.
In other countries distribution network costs are spread more evenly between different tariff components).These countries are: Czech Republic, Finland, France, Hungary and Sweden.

118
On the other hand, in some countries such as Austria, Italia, Luxembourg, Poland, Portugal, Slovenia, Spain and The Netherlands the fixed and/or capacity charge (Contracted Power) represent between 60% and 100% of the distribution network tariff charges.
6.3.2.3. Large industrial consumers
Identification of tariff components
The following figure refers to the large industrial consumer group and describes in how many countries a specific tariff component is applied.
Figure 6: Distribution Tariff components for Large Industrial customers (Number of countries)
10
21
26
16
8
16
5
10
17
12 2 2 2 2
Fixed Charge (€) Capacity charge [€/kW]
Energy charge[€/kWh]
Energy reactive (€/kvarh)
Other
Distribution tariff components in EU Countries by consumer group: Large Industrial
Yes No Could apply in some tariffs Data no available
Source: Own elaboration based on questionnaires and country report with data provided by national regulators. Situation in 2013. Data for Belgium, Bulgaria and Latvia are not available for this consumer group.
The next table details the tariff components defined for large industrial consumer across EU Member States.

119
Table 25: Distribution tariff components by country for Large Industrial consumers
Country Fixed Charge Capacity charge Energy charge Energy reactive Other
Austria No Yes Yes No No
Belgium Yes Yes Yes Yes No
Bulgaria N.A N.A N.A N.A N.A
Croatia No Yes Yes Yes Yes, Metering
Cyprus Yes No Yes No No
Czech Republic No Yes Yes Yes No
Denmark Yes No Yes No No
Estonia No Yes Yes Yes No
Finland No Yes Yes Yes No
France Yes Yes Yes Yes No
Germany No Yes Yes Yes No
Greece No Yes Yes Yes Possible
Hungary Yes Yes Yes Yes Yes, Loss charges
Ireland Yes Yes Yes Yes No
Italy Yes Yes Yes No Yes, fees related to
activity measurement
Latvia N.A N.A N.A N.A N.A
Lithuania No Yes Yes No No
Luxembourg No Yes Yes No Yes, Metering
Malta Yes No Yes Yes No
Poland No Yes Yes Yes Yes, subscription fee
(Metering)
Portugal No Yes Yes Yes No
Romania No No Yes No No
Slovakia No Yes Yes No Yes, distribution
losses
Slovenia No Yes Yes Yes No
Spain No Yes Yes Yes Yes, Metering
Sweden Yes No Yes No No
The Netherlands
No Yes Yes No No
Great Britain Yes Yes Yes Yes Yes, Excess Capacity
charge
Source: Own elaboration based on questionnaires and country report with data provided by national regulators. N.A: Data not available.
In most countries (21) with available information the capacity charge for large industrial consumers applies. Cyprus, Denmark, Malta, Romania and Sweden are exceptions. Malta only has a fixed charge (€/year) and energy charges for voltage levels and Romania only has a volumetric component (€/kWh). In Denmark larger consumers pay a subscription fee that is equal for everyone in the same class.
There are 6 countries where both a fixed charge and a capacity charge apply. These countries are Belgium, France, Hungary, Ireland, Italy and Great Britain.

120
As in the small industrial consumer group, all the countries have an energy component. In 15 of 26 countries, a time‐of‐use distribution tariff is applied (See Annex 4. Summary of time‐of‐use differentiation in electricity distributions tariff by consumer group).
Reactive energy charges are applied in the majority of countries (16). Exceptions occur in some countries, such as Austria, Cyprus, Denmark, Greece, Luxembourg, Romania, Slovakia, Slovenia and Sweden. In the Netherlands, it depends on the DSO criteria.
There are additional distribution tariff components in some countries (8). Those are the same countries and components that are applied in small consumer clients. In Great Britain there is an exceeded capacity charge (per day) for consumer with half hourly meter installed (Typical Industrial‐High Voltage).
Weight of tariff components
The following figure shows a comparison of weights of tariff components across EU Member States for large industrial consumers according to the data facilitated by the national regulators. For the calculation, the following components were considered: fixed charge, Capacity charge and Active energy charge.
Figure 7: Distribution Tariff component weight for Large Industrial
Source: Own elaboration based on data provided by national regulators for Fixed charges, Capacity charges and Energy charges. Large industrial customer with an annual consumption of 24000 MWh and 7000 use hours connected to the medium voltage grid and 4000 KW of contracted capacity. Situation in 2013 Detailed values of each component by country is summarised in “Annex 5: Breakdown of electricity network annual charges by country – customer types”
For a large industrial consumer, the capacity or fixed component of the distribution tariff has an average weight of approximately 42% across EU Member States (19 countries with data available). In some countries such as Czech Republic, Germany, Italy, Luxembourg, Portugal

121
and Spain the weight of fixed and capacity components are at least 60% of network tariff charges.
In a majority of countries, network costs are recovered more through energy components than through fixed or capacity components. Some countries with this characteristic are Austria, Cyprus, Finland, France, Greece, Hungary, Poland, Slovakia, Slovenia, Sweden, The Netherlands and Great Britain. In Romania all network costs are charged through an energy component.
6.3.3. Allowed revenues for distribution activities
The objective of this section is to provide an overview of the allowed revenues for electricity
distribution activities across EU member states Comparison of ratios of allowed distribution
revenues and their activities is a complex task, mainly because in different countries DSOs do
not provide an identical and homogenous product/service, neither this is delivered under
comparable conditions.
The services delivered by DSOs across Europe are different in many respects. Different DSOs
are required to provide different qualities of service; they serve different loads,
accommodate different proportions of distributed generation and do not operate under
comparable conditions in terms of, for example, density of population connected, and
geographical constraints with an impact on network design and operations.
In this context, the indicators presented in this section serve to show reference values and an overview of electricity distribution revenues across EU Member States, but do not attempt to identify differences in efficiency or best practices.
The following figure shows the total electricity distributions revenues (Excluding transmission cost, taxes and levies) and a breakdown of the cost of different distribution activities across EU Member states in 2013 where data are available.
The analysis is based on the data provided by national regulators.

122
Figure 8: Electricity Distribution revenues across EU Member States in 2013. (Millions of Euros)
11783
8170
6202
4954
4374
2784
1557
29
626
834
210
574
328
5650
4240
1550
1280
1140
904
729
515
274
253
162
131
92
0 5000 10000 15000
DE
FR
GB
IT
ES
SE
PL
NL
AT
FI
PT
CZ
RO
DK
GR
IE
HU
SK
HR
EE
SI
LU
LT
CY
MT
Distribution (Network only)
Metering
Customer Management
Others
Distribution revenues (Details by distribution activity are not available)
12982
9332
6265
5069
4965
2994
1734
1263
687
777
429
Source: Own elaboration on data provided by National Regulators. Total Distributions revenues include: Distributions revenues (Network only), Metering and Customer
Management. Cost of distribution losses is not included.
Details and comments on the values for each country are summarised in Annex 7. Allowed electricity distribution revenues across EU Member states in 2013 Spain: Data of allowed distribution revenues for 2014. Germany: analysis based on data of DSO under the responsibility of Bundesnetzagentur. DSOs with fewer than 100000 final customers are predominantly under the responsibility of the regulatory authorities of the German federal states. The share of revenues of DSOs regulated by BNetzA from total revenues is roughly 85‐90% and can vary from year to year. The data is based on planned values. The revenues are still provisional as the final formal approval of revenues including volatile costs and permanent not controllable costs is only commenced with approval of revenues in 3rd regulatory Period starting from 2019. Revenue data do not contain revenues for elements that are not within network charges but are passed through by the DSO (e.g. concession fee, renewable energy support levy).Total allowed revenues have been reduced by the amount of upper grid charge to avoid double counting of costs (and inclusion of transmission costs in revenue figures).
According to the data available for 25 EU member states, the electricity distribution allowed revenues in 2013 were approximately 63 billion €. Germany was the country with the higher share, followed by France, Great Britain, Italy, Spain and Sweden.

123
The following figure shows the total electricity distribution revenues (Excluding transmission cost, taxes and levies) per energy delivered (€/ MWh) across EU Member states in 201352.
Figure 9: Electricity Distribution revenues per energy delivered across EU Member States in 2013. (Euros per MWh)
46,10
26,59
25,10
25,09
25,54
23,22
21,39
21,12
15,28
17,45
17,07
13,60
1,69
3,25
2,76
1,33
1,93
2,37
1,71
0,24
2,33
0,18
1,22
0,93
1.02
1.87
4,55
0,09
0,77
0,53
34,93
34,26
32,19
31,70
30,64
27,80
27,77
25,83
24,55
24,51
21,40
16,24
0 10 20 30 40 50 60
SE
PL
EE
LU
IE
PT
HR
AT
RO
SK
DE
NL
FR
FI
DK
SI
CZ
ES
IT
HU
GB
GR
LT
MT
Distribution (Network only)
Metering
Customer Management
Others
Distribution revenues (Details bydistribution activity are not available)
17,63
52,33
20,24
29,84
27,65
27,95
26,53
27,47
24,12
17,60
21,62
Source: Own elaboration on data provided by National Regulators. Total Distributions revenues include: Distributions revenues (Network only), Metering and Customer
Management. Cost of distribution losses is not included.
Details and comments on the values for each country are summarised in Annex 7. Allowed electricity distribution revenues across EU Member states in 2013. Spain: Data of allowed distribution revenues for 2014. Germany: analysis based on data of DSO under the responsibility of Bundesnetzagentur. DSOs with fewer than 100,000 final customers are predominantly under the responsibility of the regulatory authorities of the German federal states. The share of revenues of DSOs regulated by BNetzA from total revenues is roughly 85‐90% and can vary from year to year. The data is based on planned values. The revenues are still provisional as the final formal approval of revenues including volatile costs and permanent not controllable costs is only commenced with approval of revenues in 3rd regulatory Period starting from 2019. Revenue data do not contain revenues for elements that are not within network charges but are passed through by the DSO (e.g. concession fee, renewable
52 In some countries as Greece, Ireland, Italy, Portugal, Spain the cost of distribution losses are charged in retail prices and are not included in distribution allowed revenues. In other countries such as Cyprus, Denmark, Estonia, France, Germany, the Czech Republic, Hungary and the Netherlands the distributions losses are include in the total allowed revenues of DSO´s. In any case, revenue ratios are calculated excluding distribution losses according to available data provided by national regulators.

124
energy support levy).Total allowed revenues have been reduced by the amount of upper grid charge to avoid double counting of costs (and inclusion of transmission costs in revenue figures).
The analysis of average distribution revenues by distributed energy shows that the country with higher revenue per MWh is Sweden (52,33 €/MWh), followed by Poland (34,93 €/MWh), Estonia (34,26 €/MWh) and Luxembourg (32,19 €/MWh). On the other hand the countries with less allowed revenues per MWh are Malta (13,60 €/MWh), Lithuania (16,24 €/MWh), Greece (17,60 €/MWh) and Great Britain (17,63 €/MWh).
The following figure shows the total electricity distributions revenues (Excluding transmission cost, taxes and levies) per connection point (€/connection point) across EU Member states in 2013.
Figure 10: Distribution revenues per connection point across EU Member States in 2013. (Euros per connection point)
,
341,51
270,30
234,51
235,97
191,10
207,37
162,70
172,60
101,93
101.69
71,53
29,80
25,76
29,77
23,93
12,53
15,26
2,13
19,86
80,41
576,52
489,02
468,40
325,85
275,76
271,03
252,24
211,77
210,28
179,05
152,30
128,93
80,64
0 100 200 300 400 500 600 700 800 900 1000
SE
LU
EE
FI
NL
IE
AT
DK
SI
FR
DE
PL
CZ
SK
PT
GB
HR
CY
ES
IT
RO
GR
MT
HU
LT
Distribution (Network only)
Metering
Customer Management
Others
Distribution revenues (Details by distribution activityare not available)
925,51
367,27
267,87
301,05
260,00
215,49
209,50
182,56
176,64
105,07
94,78
Source: Own elaboration on data provided by National Regulators. Total Distributions revenues include: Distributions revenues (Network only), Metering and Customer
Management. Cost of distribution losses is not included.
Details and comments on the values for each country are summarised in Annex 7. Allowed electricity distribution revenues across EU Member states in 2013. Spain: Data of allowed distribution revenues for 2014. Germany: analysis based on data of DSO under the responsibility of Bundesnetzagentur. DSOs with fewer than 100000 final customers are predominantly under the responsibility of the regulatory authorities of the German federal states. The share of revenues of DSOs regulated by BNetzA from total revenues is roughly 85‐90% and can

125
vary from year to year. The data is based on planned values. The revenues are still provisional as the final formal approval of revenues including volatile costs and permanent not controllable costs is only commenced with approval of revenues in 3RD regulatory Period starting from 2019. Revenue data do not contain revenues for elements that are not within network charges but are passed through by the DSO (e.g. concession fee, renewable energy support levy).Total allowed revenues have been reduced by the amount of upper grid charge to avoid double counting of costs (and inclusion of transmission costs in revenue figures). Data of connections points is not available. The value used is based on the number of measurement points in the grid of all DSO in Germany.
In terms of distribution revenues by connection points in 2013, Sweden presents the highest value (925€/connection point) followed by Luxembourg (576€/connection point), Estonia (489€/connection point), Finland (468€/connection point) and Netherlands (367€/connection point). The countries with the lowest allowed revenues per connection points are Lithuania (80€/connection point), Hungary (95€/connection point), Malta (101€/connection point) and Greece (105 €/connection point). Apart from the difference in cost items included in the allowed revenues in different Member States, it is interesting to notice the different relative position of countries in terms of average revenue by distributed energy and by connection point, which is due to the different composition of user typologies in different countries and their corresponding consumption levels.
6.3.4. Network charges
A comparison of electricity network charges across EU member states is a complex task for many reasons:
limited availability of data for an average consumer class profile in different countries;
in some countries the network cost include the transmission and other non‐distribution activities;
Some countries have a high number of DSOs with different tariff schemes that make the calculation of a homogeneous national tariff very complex.
In addition to the complexity associated with differences in tariff structures and comparability of data the definition of consumer groups (household, small Industrial and large Industrial) requires relevant simplifications as the characteristics and consumption patterns of users differ significantly across EU countries.
In this context, the indicators presented in the following section serve to show reference values and an overview of average network tariff for given consumer types across EU Member States, but does not mean to be representative of the specific context of each analysed country.
The calculation of the average network charges were mainly done by each of the national regulator using the definitions of consumer group provided by consultants. The characteristics of each consumers group (Annual consumption, contracted capacity and use hours) try to represent the average of users across EU Members States. However the consumption profile in some countries could be different to the consumers group defined.
Household consumer
The following figure shows the average distribution network tariff (cent€/KWh) for an electricity household consumer across EU countries. This data excludes transmission network cost, taxes and levies. The comparison is based on data provided by national regulators.

126
Figure 11: Total (€) and Average network charges (cent€/kWh) for Households, 2013
Household consumer with an annual consumption of 3500 kWh connected to the low voltage grid and a contracted capacity of 6 kW. Situation in 2013. Source: Own calculation based on data provided by national regulators. Detailed values of each tariff component by country are summarised in “Annex 5: Breakdown of electricity network annual charges by country – customer types”. Spain: Average network tariff based on values for 2014. Germany: The given average network cost include transmission revenues. Transmission costs are not charged separately but are part of distribution tariffs. The share of transmission costs within the distribution revenues can only very roughly be approximated and can vary greatly from DSO to DSO. On the low voltage level average share is very roughly about 5%‐15%. Data on tariff structures were only available for DSOs in BNetzA responsibility. The given shares for fixed, capacity and energy charges are calculated of the average shares for the consumer groups from these BNetzA regulated DSOs. The average network cost in cent €/kWh is taken from the "Monitoringbericht 2014" and is calculated as an average of all DSO in Germany.
For household consumers, the average network charges in EU is approximately 4,91 cent € per Kwh (Based on data available of 18 countries). The countries with the highest average network charges are Sweden, Czech Republic, Luxembourg, Germany and The Netherlands. On the other hand, the countries with lower average tariffs are Greece, Malta, Spain, Portugal and Great Britain.
Small Industrial consumer
The following figure shows the average distribution network tariff (cent€/KWh) for a small industrial consumer across EU countries, excluding transmission network cost, taxes and levies. The comparison is based on data provided by national regulators.

127
Figure 12: Total (€) and Average network charges (cent€/kWh) for Small industrial consumer, 2013
Small industrial consumer with an annual consumption of 50000 kWh connected to the low voltage grid and a contracted capacity of 35 kW. Situation in 2013 Source: Own calculation based on data provided by national regulators. Detailed values of each component by country are summarised in “Annex 5: Breakdown of electricity network annual charges by country – customer types”. Spain: Average network tariff based on values for 2014. Germany: Average network tariff includes transmission revenues. Transmission costs are not charged separately but are part of distribution tariffs. The share of transmission costs within the distribution revenues can only very roughly be approximated and can vary greatly from DSO to DSO. On the low voltage level average share is very roughly about 5%‐15%. Average network costs for distribution only could not be calculated from these values. Data on tariff structures were only available for DSOs in BNetzA responsibility. The given shares for fixed, capacity and energy charges are calculated of the average shares for the consumer groups from these BNetzA regulated DSOs. The average network cost in cent €/kWh is taken from the "Monitoringbericht 2014" and is calculated as an average of all DSOs in Germany
For small industrial consumers, the average network charges in EU is approximately 3,52 cent € per Kwh (Based on data available of 17 countries) considering the charges of fixed, capacity and energy components. Czech Republic, Slovenia and Germany are the countries with higher average network charges. The countries with lower average network charges are Poland, Malta, Spain, Greece, and Romania.
Large Industrial consumer
The following figure shows the average distribution network tariff (cent€/KWh) for a large industrial consumer across EU Member States, excluding transmission network cost, taxes and levies. The comparison is based on data provided by national regulators.

128
Figure 13: Total (Thousands of €) and Average network charges (cent€/kWh) for Large industrial consumer, 2013
Large industrial with an annual consumption of 24000 MWh and 7000 use hours connected to the medium voltage grid and a contracted capacity of 4,000 kW. Situation in 2013. Source: Own calculation based on data provided by national regulators. Detailed values of each component by country are summarised in “Annex 5: Breakdown of electricity network annual charges by country – customer types”. Spain: Average network tariff based on values for 2014. Germany: Average network tariffs include transmission revenues. Transmission costs are not charged separately but are part of distribution tariffs. The share of transmission costs within the distribution revenues can only very roughly be approximated and can vary greatly from DSO to DSO. On the medium voltage level average share is very roughly about 15‐30%. Data on tariff structures were only available for DSOs in BNetzA responsibility. The given shares for fixed, capacity and energy charges are calculated of the average shares for the consumer groups from these BNetzA regulated DSOs. The average network cost in cent €/kWh is taken from the "Monitoringbericht 2014" and is calculated as an average of all DSOs in Germany. On the medium voltage level average share is very roughly about 15‐30%. Average network costs for distribution only could not be calculated from these value. Data on tariff structures were only available for DSOs in BNetzA responsibility. The given shares for fixed, capacity and energy charges are calculated of the average shares for the consumer groups from these BNetzA regulated DSOs. The average network cost in cent €/kWh is taken from the "Monitoringbericht 2014" and is calculated as an average of all German DSOs.
For large industrial consumers, the average network charge in EU is approximately 1,05 cent € per Kwh (based on data available of 17 countries) considering the fixed, capacity and energy components. Malta, Germany and Hungary are the countries with higher average network charges. The countries with lower average network charges are Portugal, Spain and Romania.
6.4. Analysis of GAS Distribution Tariff
6.4.1. Tariff structure
In each EU country the tariff structure is defined by the national regulator or DSO according to certain customer segmentation. In many cases the segments are defined on a consumption basis, while in other countries tariffs are defined based on pressure level or other characteristics. The main variables that define gas tariff structure are described below:

129
Annual consumption. Tariff levels are structured according to different intervals or bands of annual consumption. In some countries the consumption is expressed in cubic meters of gas (m3 /year), however in others countries the energy consumption by year is used (kWh/year).
Pressure level. Pressure level that customers are connected to. Usually there are two levels: low pressure and medium/high pressure (usually pressure level higher than 4‐6 bar).
Used capacity, corresponding to the maximum metered daily consumption for a 12 month time window
Metered or not metered capacity (Daily, Non‐Daily,…) Tariff levels are designed according to the capabilities of metering devices to obtain data (Peak daily demand, time of use consumption, etc.)
Geographic zone. In some countries the geographic zone is one of the variables used to define tariff levels.
In most countries (18) distribution tariffs are defined according to annual consumption bands. The connection points/consumers are segmented into consumption bands or tariff level by their demand behaviour. For the low consumption bands, the energy price is higher than those in upper levels.
These countries use annual consumption as a variable to define their tariff structure: Austria, Croatia, Czech Republic, Denmark, Estonia, France, Germany, Ireland, Italy, Lithuania, Luxembourg, The Netherlands, Poland, Portugal, Slovakia, Slovenia, Spain and Great Britain.
However in the Czech Republic, Denmark, Luxembourg, Spain and Portugal, the tariff structure is defined by an annual consumption band for each pressure level. So in these countries there are some tariffs for low pressure and different consumption bands and other tariffs for medium pressure and other consumption bands.
In Austria utilization charges are segmented by network pressure level, measurement, consumption level and geographic zone. Since there are 2 network levels, 2 measurement types (for level 3 only: with or without hourly peak measure), 9 geographical zones (the 9 Austrian Provinces or Länder) and 10 consumption blocks, there are more than 300 values.
In Germany and The Netherlands the distribution tariff is set according to annual consumption band and used capacity. In Poland, tariff blocks are defined by pressure level, used capacity and annual consumption. There is moreover one category for clients with an hourly capacity withdrawal not exceeding 110 kWh/h, subdivided into four groups of customers based on yearly consumption, and another category for clients with an hourly capacity withdrawal exceeding 110 kWh/h – subdivided into six groups, based on the level of booked capacity.
In others, like Hungary, tariff blocks are defined by the size of gas meters and not by consumption (Below 20m3/h, 20‐100 m3/h, 100‐500 m3/h and Above 500 m3/h).
The following table describes the variables involved in the definition of the tariff levels for each country.

130
Table 26: Key variables used in the definition of gas distribution tariffs structure in EU countries. (2013)
Country Pressure Level Annual Consumption Used Capacity Meter capabilities
Austria X X X
Belgium N.A N.A N.A N.A
Bulgaria N.A N.A N.A N.A
Croatia X
Czech Republic X X
Denmark X
Estonia
Depend on DSO. Only one DSO the tariff levels are
define by annual consumption. Others DSO´s have only one tariff level
(€/m3)
Finland Depends on DSO Depends on DSO Depends on
DSO Depends on DSO
France X
Germany X X
Greece No specific methodology
No specific methodology No specific methodology
No specific methodology
Hungary X
Ireland X
Italy X
Latvia N.A N.A N.A N.A
Lithuania X
Luxembourg X X
Netherlands X X
Poland X X
Portugal X X
Romania N.A N.A N.A N.A
Slovakia X
Slovenia X
Spain X X
Sweden Depends on DSO Depends on DSO Depends on
DSO Depends on DSO
Great Britain X
Total countries 5 18 4 1
Source: elaboration based on data provided by national regulators. Situation in 2013
6.4.2. Tariff components
The analysis involves the identification of the gas distribution tariff components and comparison of the weight of each component in EU member states for two different consumer groups: household and industrial consumer groups (1).
Household consumer of natural gas with a standard annual consumption of 15 MWh

131
Industrial consumer of natural gas with a standard annual consumption of 50 GWh and 7000 use hours
Gas networks tariffs usually have the following components:
Fixed charge: In some countries it is known as standing charge or service charge by connection point/consumer (€/day, €/month, €/year).
Capacity charge: charges for the availability of network capacity would normally be expressed in terms of a maximum daily rate reserved by the consumer either in volumetric or energy terms (Max Kw/h/ day, m3/h/day). In most countries, the user faces considerable charges, when the maximum capacity usage is exceeded.
Energy charge: it is the variable or volumetric component of the tariff. In some countries it is known as commodity charge (€/Kwh, €/m3).
6.4.2.1. Household consumers
Identification of tariff components
The gas distribution tariff components applied in EU countries for household consumers are summarized in the figure below.
Figure 14 Distribution Tariff GAS components in Households (Number of countries)
Source: Own elaboration based on data provided by national regulators. Situation in 2013. Data from Belgium, Bulgaria, Greece, Latvia and Romania is not available from this consumer group. Details for each country are summarised in “Annex 3: Summary of gas distribution tariff components by consumer group”.

132
Next table provides details on the tariff components applied to household consumer across EU Member States.
Table 27: Distribution tariff components identified by country for a Household consumer
Country Fixed Charge Capacity charge Energy charge Other
Austria Yes, depending of annual
consume Yes, depending of annual consume
Yes No
Belgium N.A N.A N.A N.A
Bulgaria N.A N.A N.A N.A
Croatia Yes No Yes No
Czech Republic Yes No Yes No
Denmark No No Yes No
Estonia No No Yes No
Finland Yes, varies depending on
DSO No
Yes, varies depending on DSO
No
France Yes No Yes No
Germany
Yes, if the annual consumption of up to 1.5m kWh1 and a maximum exit
load of 500 kWh/h
Yes, if Annual consumption
above 1.5m kWh/a Yes Yes, Metering
Greece N.A N.A N.A N.A
Hungary Yes No Yes Yes, Metering
Ireland No Yes Yes No
Italy Yes No Yes No
Latvia N.A N.A N.A N.A
Lithuania No No Yes No
Luxembourg No No Yes Yes, Metering
Poland No Yes Yes No
Portugal Yes No Yes No
Romania N.A N.A N.A N.A
Slovakia Yes No Yes No
Slovenia Yes No Yes Yes. Metering
Spain Yes No Yes No
Sweden Yes No Yes No
The Netherlands Yes Yes No Yes, Metering
Great Britain No Yes Yes Yes, Metering
Source: Own elaboration on data provided by national regulators. N.A: Data not available
For household consumers, 11 out of 21 countries with available data have a fixed charge as part of the tariff. This fixed component is a per customer component (€/month or year), while capacity related charges are much less common. Countries with a fixed component are: Croatia, Czech Republic, France, Hungary, Italy, Portugal, Slovakia, Slovenia, Spain, Sweden and The Netherlands. In Austria and Germany a fixed component could apply if the

133
annual energy consumption is lower than a set limit. If the customer exceeds this amount, he is charged with a capacity component and not with a fixed component.
There are 4 countries with a capacity component related charge. Usually when a fixed charge component is present no capacity charge component is applied. An exceptional case is The Netherlands where, according to the yearly energy consumption, the tariff could have both components. Moreover, there are 2 countries with just a capacity component: Ireland and Poland
In Great Britain, supply points with annual consumption less than 73200 KWh are charged by a capacity charge (typical household consumers). Supply points with an annual consumption between 73200 KWh and 732000 KWH are charged with a fixed component that depends on the frequency of meter reading, plus a capacity charge.
In Austria and Germany a capacity component charge could apply as it is commented above.
All but one of the EU member states with available information (19) have an energy related component as part of the distribution tariff structure. The Netherlands is the exception, as household customers in that country only pay a capacity charge and a fixed annual charge (i.e. they do not pay an energy related component as part of the distribution tariff structure). Usually there are different intervals for annual consumption levels (kWh or m3), being the unit prices of the lowest consumption levels more expensive than the unit prices for the highest levels of consumption. In Denmark, Estonia Lithuania and Luxembourg all consumers are charged only an energy related (per m3) distribution tariff.
In the majority of countries (15) there are no “other” distribution tariff components in the household category. However, there are 6 cases with some other type of components. In Germany, Hungary, Luxembourg, Slovenia, The Netherlands and Great Britain, there is a tariff component that charges the use of metering devices and this charge is regulated by Law.
Weight of tariff components
The following figure shows a comparison of the weight of tariff components across EU member states for household consumers taking into account: fixed charges, capacity charges and energy charges.

134
Figure 15: Distribution Tariff Gas component weight for Households
12%
35%
53%
35%
5%
31%
28%
20%
23%
100%
26%
88%
65%
100%
47%
65%
100%
100%
95%
69%
72%
80%
77%
74%
AT
CZ
EE
FR
IT
LT
LU
PT
SK
SI
ES
SE
NL
Ave.
Fixed + Capacity components Energy component
Household consumer with an annual consumption of 15000 KWh. Situation in 2013 Source: Own calculation based on data provided by national regulators regarding Fixed charges, Capacity charges and Energy charges, Detailed values of each component by country is summarised in “Annex 6: Breakdown of gas network annual charges by country – customer types”
The figure above shows the weight of each tariff component for a household client in countries with available data. In 11 of 13 countries, the energy component has more weight than fixed or capacity components. Only in France and the Netherlands, fixed or capacity component has more weight than the commodity charge. In The Netherlands there is not an energy component for this type of consumers.
6.4.2.2. Industrial consumers
The gas distribution tariff components applied in the EU countries for the Industrial category are summarized in the figure below.

135
Figure 16: Distribution Tariff Gas components for Industrial Consumers (Number of countries)
913
19
5
117
1
15
1 1 1 1
5 5 5 5
Fixed Charge Capacity Charge Energy/Comodity Charge Other
Distribution tariff components in EU Countries by consumer group: Industrial
Yes No Could apply in some tariffs Data no available
Source: Own elaboration based on data provided by national regulators. Situation in 2013. Data from Belgium, Bulgaria, Greece, Latvia and Romania is not available from this consumer group.
Details of each country are summarised in “Annex 3: Summary of gas distribution tariff components by consumer group”.
Next table details the tariff components defined for an industrial consumer across EU Member States.
Table 28: Distribution tariff components identified by country for Industrial consumer
Country Fixed Charge Capacity charge Energy charge Other
Austria No Yes Yes No
Belgium N.A N.A N.A N.A
Bulgaria N.A N.A N.A N.A
Croatia Yes No Yes No
Czech Republic Yes No Yes No
Denmark No No Yes No
Estonia No No Yes No
Finland Yes, varies depending on
DSO Yes, varies depending
on DSO Yes, varies depending
on DSO Yes, varies depending
on DSO
France Yes Yes Yes No
Germany No Yes Yes Yes, Metering
Greece N.A
Hungary No Yes Yes Yes, Metering
Ireland No Yes Yes No
Italy Yes No Yes No

136
Country Fixed Charge Capacity charge Energy charge Other
Latvia N.A N.A N.A N.A
Lithuania No No Yes No
Luxembourg No Yes Yes Yes, Metering
Poland No Yes Yes No
Portugal Yes Yes Yes No
Romania N.A N.A N.A N.A
Slovakia Yes Yes Yes No
Slovenia Yes Yes Yes Yes. Metering
Spain No Yes Yes No
Sweden Yes No Yes No
The Netherlands Yes Yes No No
Great Britain No Yes Yes Yes, Metering
Source: Own elaboration based on data provided by national regulators. N.A: Data not available.
For industrial clients a capacity charge (13) applies in most countries rather than a fixed charge (9), contrary to what is applied in the case of household clients.
Capacity components are applied in Austria, France, Germany, Hungary, Ireland, Luxembourg, Poland, Portugal, Slovakia, Slovenia, Spain, The Netherlands and Great Britain. A fixed component applies in Croatia, Czech Republic, Italy and Sweden. In France, Portugal, Slovakia, Slovenia and The Netherlands both components could apply for industrial consumers.
In Austria, fixed and capacity charges are differentiated by province and not by consumption block. Also a discount of the capacity charge applies to industries consuming between March and October only.
The energy component exhibits a similar situation to the case of household customers. In almost all countries the variable cost of distribution network is charged as an energy component (19), been the Netherlands the exception. There is only one country identified with time of use differentiation: Portugal. In Portugal for medium pressure and low pressure with an annual consumption higher than 10000 m3 the energy term is differentiated in peak and off peak time zone.
In terms of “other” components in industrial consumers, the situation is similar to that in household consumers.
In Finland and Sweden there is no single approach used by DSOs to allocate distribution costs to the tariffs. DSOs have freedom to use the tariff components that they prefer. DSOs are in charge of setting the distribution tariffs as well.
Greek Distribution tariffs are bundled together with retail tariffs, so it is impossible to isolate and examine the tariffs for distribution activities.

137
Weight of tariff components
The following figures show a comparison of the weight of different tariff components across EU member states for two types of Industrial consumers. For the calculation, the following components were considered: fixed charge, capacity charge and energy charge.
Figure 17: Distribution Gas Tariff component weight for an Industrial consumer with an annual consumption of 50GWh
15%
74%
56%
18%
78%
85%
14%
66%
100%
39%
85%
26%
100%
44%
100%
100%
82%
22%
15%
86%
34%
100%
61%
AT
CZ
EE
FR
IT
LT
LU
PT
SK
SI
ES
SE
NL
Ave.
Fixed + Capacity components Energy component
Industrial consumer with an annual consumption of 50,000 MWh and 7,000 use hours. Source: Own elaboration based on data provided by national regulators for Fixed charges, Capacity charges and Energy charges. Detailed values of each component by country are summarised in “Annex 6: Breakdown of gas network annual charges by country – customer types”

138
Figure 18: Distribution Gas Tariff component weight for an Industrial consumer with an annual consumption of 90GWh
29%
73%
52%
16%
77%
82%
15%
66%
100%
39%
71%
27%
100%
48%
100%
100%
84%
23%
18%
85%
34%
100%
61%
AT
CZ
EE
FR
IT
LT
LU
PT
SK
SI
ES
SE
NL
Ave.
Fixed + Capacity components Energy component
Industrial consumer with an annual consumption of 90000 MWh and 7000 use hours. Source: Own elaboration based on data provided by national regulators for Fixed charges, Capacity charges and Energy charges. Detailed values for each component by country are summarised in “Annex 6: Breakdown of gas network annual charges by country – customer types”
For both industrial consumer profiles (50GWh and 90GWh annual consumption), the capacity or fixed component has an average weight of approximately 39% across EU Member States (13 countries with available data), while the energy or commodity component represents around 61% of the distribution network tariff.
Countries where the energy component has a higher weight than the sum of fixed and capacity components are: Austria, Estonia, Italia, Lithuania, Luxembourg, Slovenia and Sweden. In Estonia and Lithuania network costs are recovered only through an energy component.
In some countries such as Czech Republic, Portugal, Slovakia and Spain the weight of fixed and capacity components are at least 70% of network tariff charges. In the Netherlands, network costs are recovered through capacity and fixed components. In the Netherlands, there is not an energy component for the industrial consumer either the household consumer.

139
6.4.3. Allowed revenues for gas distribution activities
The objective of this section is to provide an overview of the allowed revenues for gas distribution activities across EU member states. The analysis is based on the data facilitated by national regulators.
As in the electricity sector, the comparison of ratios of allowed distribution revenues is a complex task, because in each country DSO do not provide an identical and homogenous service delivered in comparable conditions (Density of population connected; geographical constraints with an impact on network design and operations).
Given the above, the indicators presented in this section are meant to be a starting point for an overview of distribution revenues across EU Member States, and are not meant to identify differences in efficiency or possible best practices.
The following figure shows the total gas distributions revenues across EU Member states in 2013. The revenues include: distribution network usage, metering, customer management and other revenues related with distribution activities. Transmission/transport cost, taxes and levies are excluded.
Figure 19: Gas Distribution revenues across EU Member States in 2013. (Millions of Euros)
3 139
1 131
542
248
130
43
162
140
25
‐
‐
‐
‐
‐
19
‐
4500
3200
1475
954
564
381
302
201
84
72
62
49
33
26
0 1000 2000 3000 4000 5000
DE
FR
GB
IT
ES
NL
PL
AT
CZ
SK
PT
HU
DK
IE
SE
FI
HR
SI
LT
LU
EE
Distribution (Network only)
Metering
Customer Management
Others
Distribution revenues (Details by distribution activity arenot available)
3300
1271
566
278
185
51
3291
Source: Own elaboration on data provided by National Regulators.

140
Details and comments on the values for each country are summarised in Annex 8. Allowed gas distribution revenues across EU Member states in 2013. Germany: Distribution Allowed revenues of DSOs under responsibility of BNetzA . Allowed revenues of other DSO under Federal States responsibilities are unknown.
In absolutes terms, the country with the highest allowed revenues for distributions activities is Germany (4500 million €) followed by France (3500 million €), Great Britain (3291 million €), Italy (3200 million €), and Spain (1475 million €). The countries with the lowest allowed revenues in absolute terms are Estonia, Luxembourg and Lithuania.
The following figure shows gas distributions revenues (excluding transmission cost, taxes and levies) per energy delivered (€/ MWh) across EU Member states in 2013.
Figure 20: Gas Distribution revenues per energy delivered across EU Member States in 2013. (Euros per MWh)
12,26
9,29
9,60
5,76
3,31
3,53
2,15
0,96
2,65
0,49
0,26
0,27
1,33
11,99
9,00
8,77
8,54
7,09
6,53
6,09
5,98
5,82
5,49
4,86
2,97
2,17
0 2 4 6 8 10 12 14 16
SI
IE
PT
FR
IT
ES
SE
SK
CZ
DE
AT
PL
HR
LT
DK
HU
GB
LU
NL
FI
Distribution (Network only)
Metering
Customer Management
Others
Distribution revenues (Details by distribution activity arenot available)
14.61
13.27
10.09
14.61
13.27
14.61
13.27
10,09
14,61
13,27
6,02
3,72
3,59
2,41
Source: Own elaboration on data provided by National Regulators. Details and comments on the values for each country are summarised in Annex 8. Allowed gas distribution revenues across EU Member states in 2013. Germany: Distribution Allowed revenues of DSOs under responsibility of BNetzA. Allowed revenues of other DSO under Federal States responsibilities are unknown.
According to the information available, the country with more allowed revenues per MWh distributed is Slovenia (14,61 €/MWh), followed by Ireland (13,27 €/MWh), Portugal (11,99 €/MWh) and France (10,09 €/MWh). On the other hand the countries with the lowest allowed revenues per energy are Hungary, Great Britain, Luxembourg, The Netherlands and Finland.

141
The following figure shows gas distributions revenues (Excluding transmission cost, taxes and levies) per connection point (€/connection point) across EU Member states in 2013.
Figure 21: Gas Distribution revenues per connection point across EU Member States in 2013. (Euros per connection point)
401
321
285
197
157
79
‐
2240
426
397
252
225
200
197
149
147
95
87
0 500 1000 1500 2000 2500
SE
DE
AT
LU
SI
FR
IE
SK
PT
ES
CZ
NL
IT
PL
HR
HU
LT
Distribution (Network only)
Metering
Customer Management
Others
Distribution revenues (Details by distribution activity are notavailable)
420
383
299
282
177
91
Source: Own elaboration on data provided by National Regulators. Details and comments on the values for each country are summarised in Annex 8. Allowed gas distribution revenues across EU Member states in 2013. Germany: Distribution Allowed revenues of DSOs within the BNetzA. Allowed revenues of other DSO under Federal States responsibilities are unknown.
In terms of distribution revenues by connection points in 2013, Sweden is the country with the highest revenue per connection point (2240 €/connection point), followed by Germany (426 €/connection point), Austria (420€/connection point), Luxembourg (397 €/connection point), Slovenia (383€/ connection point) and France (299€/connection point). The countries with the lowest allowed revenues per connection points are Lithuania (87€/connection point), Hungary (88€ /connection point) and Croatia (95 € /connection point).

142
6.4.4. Network charges
In this section we analyse the average gas network tariff for different consumer groups. The analysis is based on data provided by national regulators for a given consumer profile. The consumer groups are defined as follows:
Household consumer of natural gas with a standard annual consumption of 15 MWh.
Industrial consumer of natural gas with a standard annual consumption of 50 GWh and 7000 use hours
Industrial consumer of natural gas with a standard annual consumption of 90 GWh and 7000 use hours
In addition to the complexity associated with differences in tariff structures and comparability of data, the definition of consumer groups (household, small Industrial and large Industrial) requires relevant simplifications as the characteristics and consumption patterns of users can differ significantly across EU countries.
In this context, the indicators presented in the following section are meant to show reference values that can be compared across different countries for given consumer types, but do not mean to be representative of the specific context and typical consumer profile of each analysed country.
As in the electricity sector, the average network charges calculation were mainly done by each of the national regulator using the definitions/guides of consumer group provided by the consultants. The characteristics of each consumers group (annual consumption and use hours) try to represent the average of users across EU Members States. However the consumption profile in some countries could be different to the consumers group defined.
Household consumer
The following figure shows the average distribution network tariff (cent € per energy) for a household consumer across EU countries. The values are net of taxes and levies. The comparison is based on data provided by national regulators.

143
Figure 22: Total (€) and Average network charges (cent€/kWh) for Households, 2013
Household consumer with an annual consumption of 15,000 kWh. Situation in 2013. Source: Own elaboration based on data provided by national regulators. Detailed values for each component by country are summarised in “Annex 6: Breakdown of gas network annual charges by country – customer types”. Spain: average network tariff includes transmission cost.
According to the available data, Sweden, Portugal and Spain are the countries with highest average tariffs for a household client (15000 KWh of annual consumption). In Sweden the energy component (417€, 0,0278 €/KWh) has more weight than the fixed component (122€/year), as well as in Portugal (Energy component: 507€, 0,0337 €/KWh; fixed component: 29€/year). On the other hand the countries with the lowest network tariff are Estonia, Lithuania and Luxembourg.
Industrial consumer
The following figures show the average distribution network tariff (cent € per energy) for two types of industrial consumers (50 GWh and 90 GWh of annual consumption) across EU countries. The figures in the graph are net of taxes and levies.

144
Figure 23: Total (€) and Average network charges (cent€/kWh) for Industrial consumer (50GWh), 2013
Industrial consumer with an annual consumption of 50000000 kWh and 7000 use hours. Situation in 2013. Source: Own elaboration based on data provided by national regulators. Detailed values for each component by country are summarised in “Annex 6: Breakdown of gas network annual charges by country – customer types”. Spain: average network tariff includes transmission cost.
For an industrial consumer with an annual consumption of 50 GWh, Sweden, Slovenia and Lithuania are the countries with higher average net gas network tariffs. On the other hand Italy, France and The Czech Republic are the countries with the lowest tariffs.
Figure 24: Total (€) and Average network charges (cent€/kWh) for Industrial consumer (90GWh), 2013
Industrial consumer with an annual consumption of 90000000 kWh and 7000 use hours. Situation in 2013. Source: Own elaboration based on data provided by national regulators.

145
Detailed values for each component by country are summarised in “Annex 6: Breakdown of gas network annual charges by country – customer types”. Spain: average network tariff includes transmission cost.
For an industrial consumer with an annual consumption of 90 GWh, Sweden, Slovenia, Luxembourg and Lithuania are the countries with more expensive distribution average net network tariffs. On the other hand Italy, France and The Czech Republic are the countries with the lowest tariffs.

146
1. Annex
Annex 1: Responsible in setting distribution tariffs by country
Country DSO Government The NRA Main
Responsibility
Austria Providing opinions
Providing opinions
Sets principles, methodology, values, approves tariffs
NRA
Belgium Main responsibility Defines main principles Approves DSO proposals NRA/DSO
Bulgaria Not available
Croatia Sets tariff structure after public
consultation NRA
Cyprus Prepare a tariff proposal and submit it to the
NRA for their approval
Prepares the tariff methodology (issued as a regulation)
NRA/DSO
Czech Republic
Main responsibility NRA
Denmark Main responsibility Sets rules Set rules and approved tariff.
Monitors ex‐post NRA/DSO
Estonia Main responsibility Defines main principles Sets rules and monitors ex‐post NRA/DSO
Finland Sets the tariff levels NRA/DSO
France Defines main principles Main responsibility NRA
Germany Implements Issues tariff structure
rules Main responsibility NRA
Greece
Electricity. Sets the structure (following consultation)
Gas. The tariff is defined by the Max Allowed revenues
NRA
Hungary Defines main principles Main responsibility NRA
Ireland Calculates for NRA
approval Main responsibility NRA
Italy Provides the regulator with data on its cost and
quality levels Defines main principles Issues the tariff structure NRA
Latvia Not available
Lithuania Proposes after consultation
Defines main principles Sets principles, methodology,
values, approves tariffs NRA
Luxembourg Main responsibility NRA
Malta Proposes the tariff
structure Consulted by Regulator Approves NRA/DSO
Poland Proposes tariff structure
to NRA Sets general rules
Takes decision on tariff structure based on DSO proposal
NRA/DSO
Portugal Define main principles Main responsibility NRA
Romania
May propose a change in the tariff and the NRA
should asses the request. All DSO apply
the same tariff structure.
Main responsibility. NRA
Slovakia Calculates for NRA
approval Defines main principles
Sets principles, methodology, values, approves tariffs
NRA/DSO
Slovenia Issues primary law Sets a general act with NRA

147
Country DSO Government The NRA Main
Responsibility
methodologies, and charges
Spain Sets the tariff structure (1) NRA
Sweden Decides on the tariff
structure
May take decisions on tariff structures in individual cases, according to non‐discriminating
requirements
NRA/DSO
The Netherlands
Proposes tariffs (and allocations of total income) to the NRA
Sets the principal of the tariff structure
Makes final decision on proposed tariffs
NRA/DSO
Great Britain
Proposes tariff structure to NRA
Takes decision on tariff structure
based on DSO proposal NRA/DSO
(1) A draft amendment to the Electricity Act, which is still under parliamentary procedure, provides that the definition of the
tariff structure will be assumed by the Ministry of Industry, Energy and Tourism.
Annex 2: Summary of electricity distribution tariff components by consumer group
Country Consumer group Fixed Charge Capacity charge
Energy charge
Energy reactive Other
Austria Household Yes No Yes No No
Small industrial No Yes Yes No No
Large industrial No Yes Yes No No
Belgium
Household Yes No Yes No No
Small industrial N.A N.A N.A N.A N.A
Large industrial Yes Yes Yes Yes No
Bulgaria Household N.A N.A N.A N.A N.A
Small industrial N.A N.A N.A N.A N.A
Large industrial N.A N.A N.A N.A N.A
Croatia
Household No No Yes No Yes,
Metering
Small industrial No Yes Yes Yes Yes,
Metering
Large industrial No Yes Yes Yes Yes,
Metering
Cyprus Household Yes No Yes No No
Small industrial Yes No Yes No No
Large industrial Yes No Yes No No
Czech Republic Household Yes No Yes No No
Small industrial No Yes Yes Yes No
Large industrial No Yes Yes Yes No
Denmark Household Yes No Yes No No
Small industrial Yes No Yes No No
Large industrial Yes No Yes No No
Estonia Household No
Yes, it s posible. There
are two options: Capacity + Energy or Energy
Yes No No
Small industrial No Yes, its
posible. There Yes Yes N.A

148
Country Consumer group Fixed Charge Capacity charge
Energy charge
Energy reactive Other
are two options: Capacity + Energy or Energy
Large industrial No Yes Yes Yes No
Finland Household No Yes Yes No No
Small industrial No Yes Yes No No
Large industrial No Yes Yes Yes No
France Household Yes Yes Yes No No
Small industrial Yes Yes Yes Yes No
Large industrial Yes Yes Yes Yes No
Germany Household Yes No Yes No No
Small industrial No Yes Yes Yes No
Large industrial No Yes Yes Yes No
Greece Household No Yes Yes No No
Small industrial No Yes Yes No No
Large industrial No Yes Yes Yes Possible
Hungary
Household Yes No Yes
Possible if the meter installed can
measure the reactive power.
Yes, Loss charges
Small industrial Yes No Yes Yes Yes, Loss charges
Large industrial Yes Yes Yes Yes Yes, Loss charges
Ireland Household Yes No Yes Yes No
Small industrial Yes No Yes Yes No
Large industrial Yes Yes Yes Yes No
Italy
Household Yes Yes Yes No Yes,
Metering
Small industrial Yes Yes Yes No Yes,
Metering
Large industrial Yes Yes Yes No Yes,
Metering
Latvia Household N.A N.A N.A No N.A
Small industrial N.A N.A N.A No N.A
Large industrial N.A N.A N.A No N.A
Lithuania Household Yes, it is Possible No Yes No No
Small industrial No Yes Yes No No
Large industrial No Yes Yes No No
Luxembourg
Household Yes No Yes No Yes,
Metering
Small industrial No Yes Yes No Yes,
Metering
Large industrial No Yes Yes No Yes,
Metering
Malta Household Yes No Yes No No
Small industrial Yes No Yes Yes No
Large industrial Yes No Yes Yes No
Poland Household Yes No Yes No Yes,
subscription

149
Country Consumer group Fixed Charge Capacity charge
Energy charge
Energy reactive Other
fee (Metering)
Small industrial No Yes Yes No
Yes, subscription
fee (Metering)
Large industrial No Yes Yes Yes
Yes, subscription
fee (Metering)
Portugal Household No Yes Yes No No
Small industrial No Yes Yes Yes No
Large industrial No Yes Yes Yes No
Romania Household No No Yes No No
Small industrial No No Yes No No
Large industrial No No Yes No No
Slovakia
Household No Yes Yes No Yes,
distribution losses
Small industrial No Yes Yes No Yes,
distribution losses
Large industrial No Yes Yes No Yes,
distribution losses
Slovenia Household No Yes Yes No No
Small industrial No Yes Yes No No
Large industrial No Yes Yes Yes No
Spain
Household No Yes Yes No Yes,
Metering
Small industrial No Yes Yes Yes Yes,
Metering
Large industrial No Yes Yes Yes Yes,
Metering
Sweden Household Yes No Yes No No
Small industrial Yes No Yes No No
Large industrial Yes No Yes No No
The Netherlands
Household Yes Yes No No No
Small industrial No Yes No Yes No
Large industrial No Yes Yes No No
Great Britain
Household Yes No Yes No No
Small industrial Yes
Yes. It can apply if the
small industrial consumer if they elect to move to HH settlement.
Yes
Yes. It can apply if the small industrial consumer if they elect to move to HH settlement.
No
Large industrial Yes Yes Yes Yes Yes, Excess Capacity charge

150
N.A: Information not available Source: Prepared by authors based on information of each electricity country report according to consumer group definition (Table 3: Tariff components, customers and revenues per customer class). Situation in 2013. Belgium data based on Eurelectric paper: “Network tariff structure for a smart energy system”
Annex 3: Summary of gas distribution tariff components by consumer group
Country Consumer group
Fixed Charge Capacity charge Energy charge
Other
Austria Household
Yes, depending of annual consume
Yes, depending of annual consume
Yes No
Industrial No Yes Yes No
Belgium Household N.A N.A N.A N.A
Industrial N.A N.A N.A N.A
Bulgaria Household N.A N.A N.A N.A
Industrial N.A N.A N.A N.A
Croatia Household Yes No Yes No
Industrial Yes No Yes No
Czech Republic Household Yes No Yes No
Industrial Yes No Yes No
Denmark Household No No Yes No
Industrial No No Yes No
Estonia Household No No Yes No
Industrial No No Yes No
Finland
Household Yes, varies
depending on DSO
No Yes, varies
depending on DSO
No
Industrial Yes, varies
depending on DSO
Yes, varies depending on DSO
Yes, varies depending on
DSO
Yes, varies depending on
DSO
France Household Yes No Yes No
Large industrial Yes Yes Yes No
Germany Household
Yes, if the annual
consumption of up to 1.5m kWh1 and a
maximum exit load of 500 kWh/h
Yes, if Annual consumption above
1.5m kWh/a Yes Yes, Metering
Industrial No Yes Yes Yes, Metering
Greece Household N.A.
Industrial N.A.
Hungary Household Yes No Yes Yes, Metering
Industrial No Yes Yes Yes, Metering
Ireland Household No Yes Yes No
Industrial No Yes Yes No
Italy Household Yes No Yes No
Industrial Yes No Yes No
Latvia Household N.A N.A N.A N.A
Industrial N.A N.A N.A N.A
Lithuania Household No No Yes No

151
Country Consumer group
Fixed Charge Capacity charge Energy charge
Other
Industrial No No Yes No
Luxembourg Household No No Yes Yes, Metering
Industrial No Yes Yes Yes, Metering
Poland Household No Yes Yes No
Industrial No Yes Yes No
Portugal Household Yes No Yes No
Industrial Yes Yes Yes No
Romania Household N.A N.A N.A N.A
Industrial N.A N.A N.A N.A
Slovakia Household Yes No Yes No
Industrial Yes Yes Yes No
Slovenia Household Yes No Yes Yes. Metering
Industrial Yes Yes Yes Yes. Metering
Spain Household Yes No Yes No
Industrial No Yes Yes No
Sweden Household Yes No Yes No
Industrial Yes No Yes No
The Netherlands Household Yes Yes No Yes, Metering
Industrial Yes Yes No No
Great Britain Household No Yes Yes Yes, Metering
Industrial No Yes Yes Yes, Metering
Source: Prepared by authors based on information of each electricity country report according to consumer group definition (Table 3: Tariff components, customers and revenues per customer class). Situation in 2013 1) The threshold of 1.5m kWh can be adjusted by the DSO
According to Greek regulator, there is not possible to understand the different tariff components used by a DSO to recover costs for
distribution activities.
Annex 4: Summary of time of use differentiation in electricity distributions tariff by consumer group
Time Differentiation
Country Household Small Industry
Large Industry
Observations
Austria Yes Yes Yes There are four different tariff times for every network area (summer ‐ high, summer ‐ low, winter ‐ high and winter ‐ low); but just for consumers starting with network level 3.
Belgium N.A N.A N.A Bulgaria N.A N.A N.A Croatia Yes Yes Yes There are two different energy components in peak (8 – 21
hours) and off‐peak (21 – 8 hours) times. Cyprus No No No Czech Republic Yes Yes Yes Daily differentiation: peaks and off‐peaks. The start and end
of off peak periods during the day are decided by each DSO based on grid conditions and activated via remote control system; the total duration of off‐peaks per day has to amount to the value set out in the tariff specifications.
Denmark No No Yes No time of use differentiation except for large consumers with consumption above 100.000 kWh.
Estonia Yes Yes Yes Energy component has two options: Base tariff or time of use tariff (night‐day)
Finland No Yes No Large LV customer may choose time‐of‐use tariffs based on

152
Time Differentiation
day and night time of use or winter and summer time of use.
France Yes Yes Yes There is a time differentiation for all groups of consumers.HVA (between 50kW and 63kW): Three different tariffs are proposed. Two of them as per kW and per kWh components which are time differentiated. LV above 36kVA: Two different tariffs are proposed. One as both per kW and per kWh time differentiated component. The other as only per kWh time differentiated components. There is no flat tariff. LV up to 36kVA: Three different tariffs are proposed. One of them as per kWh time differentiated component (two index, intra‐day time differentiation).
Germany No No No Normal tariffs have no time component. Atypical costumers are rewarded with lower tariffs if their peak load does not coincide with network peak load.
Greece Yes Yes Yes For example, electricity prices for night‐time consumption are lower (i.e. not charged energy consumption at night
time). Hungary No No No Ireland Yes Yes Yes There are energy component‐ time zone tariff (day or night)
to consumers with day and night meter. To consumers with Standard meter have a 24h tariff. The night c/kWh rates are applicable to night storage heating, which is separately metered and controlled by a time switch.
Italy No No No Latvia N.A N.A N.A Lithuania Yes Yes Yes Households: There are two types of tariff, which can be
chosen. The one time zone tariff and two time zones tariff. Commercial & Industrial customers: May choose 2 TOU tariffs: one, two or four time zone tariffs.
Luxembourg No Yes Yes Malta No Yes Yes Non‐residential consumers with consumption > 5000 MWh
or 5500 MVAh (day/night): charged a day premium of €0.002 and a night discount of €0.035 over the applicable non‐residential tariff.
Poland Yes Yes Yes The energy component is different in peak and off‐peak time (2 or 3 time zones). The zones are defined in different way.
Portugal Yes Yes Yes The energy component is differentiated by time period (peak, half‐peak, off‐peak and super off‐peak times) and seasonal period.
Romania No No No Slovakia Depends
on DSO Depends on
DSO Depends on
DSO
For some DSO’s no time of use differentiation and for some DSO per energy component is different in peak and off‐peak times, in order to reflect the degree of utilization of shared distribution network assets.
Slovenia Yes Yes Yes Both components (for kW and Kwh) are different regarding time of use. In winter period tariffs are higher than in summer period. Component for kWh are time differential for working days. From 6 to 22 o’clock the tariff is higher. The rest of the hours (and in nonworking days) are defined as the low tariff. This applies for all group of consumers.
Spain Yes Yes Yes For Low Voltage tariff (< 1 kV) and contracted power mess than 15 kW, there are 1 time period or 2 energy time period and 3 energy time period with no time use differentiation in contracted power. Furthermore for also LV with contracted power higher than 15 KW, there is a 3 time period: energy and power time of use differentiation. For High Voltage (> 1 kV) : All tariff with 6 time period (energy and power)
Sweden Depends on DSO
Depends on DSO
Depends on DSO
DSO´s decide and some are using tariffs differentiated according to time of use.
Netherlands No No No

153
Time Differentiation
Great Britain Yes Yes Yes There are a number of different tariff classes but the main four types are: Domestic: One or two rate (day or night) NHH metered (non‐domestic): One or two rate (day or night) HH metered (LV, HV and HV substation): Three rate (red (peak) / amber / green) EHV HH metered: Super‐red rate (per KWh)
Total Countries 12 15 15
Source: Prepared by authors based on information of each electricity country report according to distribution tariff data.

154
Annex 5: Breakdown of electricity network annual charges by country – customer types
Country Consumer group National Tariff
reference
Sources/ Observations Average distribution network cost for the year 2013
Fixed (€) Capacit
y (€)
Active
Energy (€)
Reactive
Energy (€)
Total (€) Average
network
cost (cent
€/kwh)
Austria Household Tariff of Residential grid
level 7 not metered ‐
Lower Austria region
Data provided by E‐Control based on Electricity
System Charges Ordinance 2013
http://www.e‐
control.at/portal/page/portal/medienbibliothek/rec
ht/dokumente/pdfs/SNE‐
VO%20Novelle%202013_BGBL_II_481_2012.pdf
Charges are segmented by time and geographical
zone. Indicative values are provided for Vienna
(industrial and commercial) and Lower Austria
(residential), which are intermediate in the range.
149 167 4,76
Small Industrial Tariff of Small
commercial grid level 7
metered ‐ Vienna region
1386 905 ‐ 2291 4,58
Large Industrial Tariff of Industrial grid
level 4 ‐ Vienna region
‐ 106080 112968 ‐ 219048 0,91
Belgium Household
Small Industrial
Large Industrial
Bulgaria Household
Small Industrial
Large Industrial
Croatia Household

155
Country Consumer group National Tariff
reference
Sources/ Observations Average distribution network cost for the year 2013
Fixed (€) Capacit
y (€)
Active
Energy (€)
Reactive
Energy (€)
Total (€) Average
network
cost (cent
€/kwh)
Small Industrial
Large Industrial
Czech Republic Household Tariff D 02d; circuit
breaker over 3x20A up to
3x25A, inclusive
Data provided by the Energy Regulatory Office (ERO) 28 ‐ 234 ‐ 262 7,49
Small Industrial Tariff C 02d; circuit
breaker over 3x20A up to
3x25A, inclusive
1206 ‐ 2121 ‐ 3327 6,65
Large Industrial Industrial consumer,
connected to MV
‐ 238001 73689 ‐ 311690 1,30
Denmark Household Data not available according the National Regulator
Small Industrial
Large Industrial
France Household CRE hypothesis: voltage level LV < 36 kVA, base tariff (no temporal
differentiation), power contracted 6kV, usual metering system (for the metering
component: power control through circuit breaker, variables measured through
index, user is not the owner of the metering system; for the administrative
management component: user has only one contract with his supplier ‐ no direct
contract with the DSO).
9 22 121 ‐ 151 4,32

156
Country Consumer group National Tariff
reference
Sources/ Observations Average distribution network cost for the year 2013
Fixed (€) Capacit
y (€)
Active
Energy (€)
Reactive
Energy (€)
Total (€) Average
network
cost (cent
€/kwh)
Small Industrial CRE hypothesis: voltage level LV > 36 kVA, Medium Usage, power contracted
40kV, usual metering system (for the metering component: power control
through overshoot, variables measured through measurement curve, user is not
the owner of the metering system; for the administrative management
component: user has only one contract with his supplier ‐ no direct contract with
the DSO‐)
69 475 1298 ‐ 1842 3,68
Large Industrial CRE hypothesis: voltage level HVA, base tariff (no temporal differentiation),
power contracted 3,450kV, usual metering system (for the metering component:
power control through overshoot, variables measured through measurement
curve, user is not the owner of the metering system; for the administrative
management component: user has only one contract with his supplier ‐ no direct
contract with the DSO‐).
69 74106 252896 ‐ 327071 1,36
Estonia Household ‐ ‐ 195 ‐ 195 5,56
Small Industrial ‐ ‐ ‐ ‐ ‐ ‐
Large Industrial ‐ ‐ ‐ ‐ ‐ ‐
Finland Household 163 ‐ 209 ‐ 372 10,63
Small Industrial 67 1686 1941 ‐ 3694 7,39
Large Industrial 67 56046 643920 ‐ 700033 2,92
Germany Household Low voltage consumer non measured. 3500 kWh. Data on tariff structures
The average network cost includes transmission revenues. Transmission costs are not charged separately but are part of distribution tariffs. On
40 188 0 228 6,52

157
Country Consumer group National Tariff
reference
Sources/ Observations Average distribution network cost for the year 2013
Fixed (€) Capacit
y (€)
Active
Energy (€)
Reactive
Energy (€)
Total (€) Average
network
cost (cent
€/kwh)
were only available for DSOs in BNetzA responsibility
the LV average share is very roughly about 5%‐15% Tariff components are calculated of the average shares for the consumer groups from these BNetzA regulated DSOs. The average network cost per energy is taken from the "Monitoringbericht 2014" and is calculated as an average of all german DSOs.
Small Industrial Low voltage costumer non
measured. 50000 kWh and
50 KW.
Average costs for all DSOs
are only available for the
national tariff reference.
The given case hence
differs from the small
industrial consumer case
listed above. The average
includes measured and non
measured consumers. Data
on the share of measured
consumers is not available
The given average network cost include transmission revenues. Transmission costs are not charged separately but are part of distribution tariffs. The share of transmission costs within the distribution revenues can only very roughly be approximated and can vary greatly from DSO to DSO. On the low voltage level average share is very roughly about 5%‐15%.
Data on tariff structures were only available for DSOs in BNetzA responsibility. The given shares for fixed, capacity and energy charges are calculated of the average shares for the consumer groups from these BNetzA regulated DSOs. Hereby only the typical case of non measuered (small industrial) consumers was taken into account. The average network cost in cent €/kWh is taken from the "Monitoringbericht 2014" and is calculated as an average of all german DSOs.
41 0 2764 0 2805 5,61
Large Industrial Measured MV consumer usage hours above 2500.
The given average network cost include
transmission revenues. Transmission costs are not charged separately but are part of distribution tariffs. The share of transmission costs within the distribution revenues can only very roughly be approximated and can vary greatly from DSO to DSO. On the medium voltage level average share is
840 248695 180065 429600 1,79

158
Country Consumer group National Tariff
reference
Sources/ Observations Average distribution network cost for the year 2013
Fixed (€) Capacit
y (€)
Active
Energy (€)
Reactive
Energy (€)
Total (€) Average
network
cost (cent
€/kwh)
very roughly about 15‐30%. Average network costs for distribution only could not be calculated from these value.
Data on tariff structures were only available for DSOs in BNetzA responsibility. The given shares for fixed, capacity and energy charges are calculated of the average shares for the consumer groups from these BNetzA regulated DSOs. The average network cost in cent €/kWh is taken from the "Monitoringbericht 2014" and is calculated as an average of all German DSOs.
Greece Household Residential tariff Data provided by the Regulatory Authority for
Energy (RAE).
5 71 ‐ 76 2,17
Small Industrial LV w. reactive power
metering
126 795 ‐ 921 1,84
Large Industrial MV tariff 57216 69600 ‐ 126816 0,53
Hungary Household "KIF I." (LV I) Data provided by Hungarian Energy and Public
Utility Regulatory (MEKH)
Authority1092/2012. HEO Resolution and 4/2013.
HEA Decree
6 0 141 0 147 4,20
Small Industrial "KIF III." (LV III) 119 1012 1284 1 2415 4,83
Large Industrial 356 102131 233231 44 335762 1,40
Ireland Household
Small Industrial

159
Country Consumer group National Tariff
reference
Sources/ Observations Average distribution network cost for the year 2013
Fixed (€) Capacit
y (€)
Active
Energy (€)
Reactive
Energy (€)
Total (€) Average
network
cost (cent
€/kwh)
Large Industrial
Italy Household Data provided by the National Regulator.
Because of the regime of progressivity , the
components of the D2 and D3 tariffs do not allow
to distinguish the relative shares of the various
regulated services ( Trans. , dist. , measure) was
made an estimate based on the data tariff
reference D1.
Capacity charge includes the value of the
component UC6.
Energy charge includes the value of the
components UC3 and UC6
6 17 118 ‐ 141 4,03
Small Industrial Data provided by the National Regulator.
Fixed charge includes the value of the MIS and the
fixed component UC6.
Energy charge includes the value of the
components TRAS , UC3 and UC6.
7 629 184 ‐ 820 1,64
Large Industrial Provided by the National Regulator.
Fixed charge includes the value of the MIS and the
fixed component UC6.
Energy charge includes the value of the
components TRAS , UC3 and UC6.
563 12784 42480 ‐ 55827 0,23
Lithuania Household

160
Country Consumer group National Tariff
reference
Sources/ Observations Average distribution network cost for the year 2013
Fixed (€) Capacit
y (€)
Active
Energy (€)
Reactive
Energy (€)
Total (€) Average
network
cost (cent
€/kwh)
Small Industrial
Large Industrial
Luxembourg Household LV not metered final
customer. Consultant estimates on Creos tariffs as approved
for the year 2013 by the NRA
24 ‐ 211 ‐ 235 6,71
Small Industrial Final customers 65 kV, 10
kW demand, > 3000 h/year
time of use.
Consultant estimates on Creos tariffs as approved
for the year 2013 by the NRA 1,136 200 250 ‐ 1586 3,17
Large Industrial Final customers 220 kV,
5000 kW, 7000 h/year time
of use.
Consultant estimates on Creos tariffs as approved
for the year 2013 by the NRA ‐ 183450 52800 ‐ 236250 0,98
Malta Household Data provided by the National Regulator.
This is an overall average per kWh of all network
cost charges‐fixed and €/kWh components.
2,20
Small Industrial 2,20
Large Industrial 2,20
Poland Household 56 ‐ 148 ‐ 204 5,83
Small Industrial 1250 ‐ 709 ‐ 1959 3,92
Large Industrial 2427 11059 244255 ‐ 257741 1,07
Portugal Household Data provided by the National Regulator (ERSE) 41 ‐ 68 ‐ 109 3,11

161
Country Consumer group National Tariff
reference
Sources/ Observations Average distribution network cost for the year 2013
Fixed (€) Capacit
y (€)
Active
Energy (€)
Reactive
Energy (€)
Total (€) Average
network
cost (cent
€/kwh)
Small Industrial Network tariffs are determined and approved by
the NRA. These tariffs are one of 3 components of
the TPA tariff, which results from adding each of
the previous.
TPA tariff includes: 1) Distribution network tariff
(used here), 2) transmission network tariff and 3)
global use of the system (which accounts for
several type of levies, e.g. renewable support
costs).
255 781 160 ‐ 1196 2,39
Large Industrial 10739 92168 21022 ‐ 123929 0,52
Romania Household Data provided by the National Regulator 0 ‐ 159 ‐ 159 4,55
Small Industrial 0 ‐ 700 ‐ 700 1,40
Large Industrial 0 ‐ 114240 ‐ 114240 0,48
Slovakia Household Tariff D2 Data provided by the Regulatory Office for
Network Industries (RONI)
58 ‐ 109 ‐ 168 4,79
Small Industrial Tariff C3; circuit breaker
over 3x50A up to 3x63A,
inclusive because capacity
35 kW
‐ 606 2424 ‐ 3030 6,06
Large Industrial Industrial consumer,
connected to MV
‐ 239098 277844 ‐ 516941 2,15
Slovenia Household ‐ 56 135 ‐ 191 5,46

162
Country Consumer group National Tariff
reference
Sources/ Observations Average distribution network cost for the year 2013
Fixed (€) Capacit
y (€)
Active
Energy (€)
Reactive
Energy (€)
Total (€) Average
network
cost (cent
€/kwh)
Small Industrial ‐ 1938 998 ‐ 2936 5,87
Large Industrial ‐ 152949 173280 ‐ 326229 1,36
Spain Household Household (Sin DH) (1P)
with a Power contracted of
3,5KW (15A) Tariff 2.0
(Only distribution tariff)
Memo of Notice (Circular) 3/2004 (July 2) by
National Commission of Markets and Competition
(CNMC) , Establish the methodology for the
calculation of Tariff access for transport and
distribution of Electricity (02 /07/ 2014)
http://www.cnmc.es/Portals/0/Ficheros/Energia/C
irculares/Circular_3_2014/03_2014_Circular_mem
oria.pdf
Table 47 Pag 73
‐ 78 15 ‐ 93 2,66
Small Industrial Small industrial LV with a
Power contracted of 35KW.
Tariff 3.0 TD (Only
distribution tariff)
‐ 780 200 ‐ 980 1,96
Large Industrial Industrial consumer (NT3)
with a Power contracted of
3429 KW. Tariff 6.3 TD
(Only distribution tariff)
‐ 36657 22135 ‐ 58792 0,24
Sweden Household Average of DSO tariffs of
Consumer with an annual
consumption of 5 000
kWh/year and 16A. Data at
January 1, 2014.
Fixed component: include DSO average of
regulatory fees (54 SEK/ 6 €) and fixed fees (2066
SEK / 239€).
Energy component: based on DSO average (0.1595
SEK /KWh, 0.0184 €/KWh). Calculate the energy
245 ‐ 65 ‐ 310 8,86

163
Country Consumer group National Tariff
reference
Sources/ Observations Average distribution network cost for the year 2013
Fixed (€) Capacit
y (€)
Active
Energy (€)
Reactive
Energy (€)
Total (€) Average
network
cost (cent
€/kwh)
component 3,500KWh X 0.0184 €/KWH
Exchange rate: 1eur= 8,6515 SEK Average 2013
according European Central Bank
Small Industrial Average of DSO tariffs of
Consumer with an annual
consumption of 30 000
kWh/year and 26A. Data at
January 1, 2014.
Fixed component: include DSO average of
regulatory fees (54 SEK/ 6 €) and fixed fees (4026
SEK / 465€).
Energy component: based on DSO average of 2
type of fees. Energy charge1 (0.1577 SEK/KWh,
0.01820 €/KWH), Energy charge 2 (0.111 SEK/KWh,
0.01239 €/KWH).
Calculate of the energy component 50,000 KWh X
0.0155 €/KWH (Average of 2 energy fees)
471 ‐ 777 ‐ 1248 2,50
Large Industrial Average of DSO tariffs of
Consumer with an annual
consumption of 50Ghz and
1MW. Data at January 1,
2014.
Fixed component: include DSO average of
regulatory fees (2800 SEK/ 324 €) and fixed fees
(14954 SEK / 1729€).
Capacity component: based on DSO average and
50% in Power charge off‐peak (170 SEK/KW/year,
20€/KW/year) and 50% Power Charge peak (141
SEK/KW/year, 16€/KW/year) for a total of
18€/KW/Year. Calculate the capacity component
4,000 KW/year X 18€/KW/year.
Energy component: based on DSO average of 4
type of fees. Energy charge winter peak (0.0456
2052 71824 104044 ‐ 177920 0,74

164
Country Consumer group National Tariff
reference
Sources/ Observations Average distribution network cost for the year 2013
Fixed (€) Capacit
y (€)
Active
Energy (€)
Reactive
Energy (€)
Total (€) Average
network
cost (cent
€/kwh)
SEK/KWh, 0.00527 €/KWH), Energy charge winter
off peak (0.0346 SEK/KWh, 0.00400 €/KWH),
Energy charge summer peak (0.0353 SEK/KWh,
0.00408 €/KWH) and Energy charge summer off
peak (0.0344 SEK/KWh, 0.00399 €/KWH). Calculate
of the energy component 24 Gown X 0.00433
€/KWH (Average of 4 energy fees)
The Netherlands Household 215 ‐ ‐ ‐ 215 6,14
Small Industrial 1817 3,63
Large Industrial 113441 ‐ 125000 ‐ 238441 0,99
Great Britain Household 18 ‐ 114 ‐ 132 3,77
Small Industrial 140 ‐ 1467 ‐ 1607 3,21
Large Industrial 303 81934 253258 ‐ 335495 1,40
Household consumer with an annual consumption of 3500 kWh connected to the low voltage grid and a contracted capacity of 6 KW. Small industrial consumer with an annual consumption of 50000 kWh connected to the low voltage grid and a contracted capacity of 35 KW. Large industrial with an annual consumption of 24000 MWh and 7000 use hours connected to the medium voltage grid and a contracted capacity of 4000 KW.

165
Annex 6: Breakdown of gas network annual charges by country – customer types
Country Consumer group National Tariff reference Sources/ Observations Average distribution network cost for the year 2013
Fixed (€) Capacity (€)
Energy (€) Total (€) Average network cost (cent €/kwh)
Austria Household Data provided by E‐Control based on Gas System Charges Ordinance 2013
http://www.e‐control.at/portal/page/portal/medienbibliothek/recht/dokumente/pdfs/GSNE‐VO%202013%20konsolidierte%20Fassung%2027.12.2012.pdf
30 ‐ 229 259 1,73
Industrial consumer (50GWh)
‐ 28284 160042 188326 0,38
Industrial consumer (90 GWh)
‐ 58186 144740 202926 0,23
Belgium Household Industrial consumer (50GWh)
Industrial consumer (90 GWh)
Bulgaria Household Industrial consumer (50GWh)
Industrial consumer (90 GWh)
Croatia Household Industrial consumer (50GWh)
Industrial consumer (90 GWh)
Czech Republic Household Data provided by the Energy Regulatory Office (ERO) 53 ‐ 98 151 1,01
Industrial consumer (50GWh)
‐ 80349 28180 108529 0,22
Industrial consumer (90 GWh)
‐ 132701 50274 182975 0,20

166
Country Consumer group National Tariff reference Sources/ Observations Average distribution network cost for the year 2013
Fixed (€) Capacity (€)
Energy (€) Total (€) Average network cost (cent €/kwh)
Denmark Household Data not available according the national regulator Industrial consumer (50GWh)
Industrial consumer (90 GWh)
Estonia Household Data provided by the national regulator through questionnaire.
Network tariffs for all customers in network area are same. There is only an energy component.
Largest DSO (86% of all) tariff is 0,03858 €/m3
‐ ‐ 50 50 0,33
Industrial consumer (50GWh)
‐ ‐ 165864 165864 0,33
Industrial consumer (90 GWh)
‐ ‐ 298555 298555 0,33
Finland Household Industrial consumer (50GWh)
Industrial consumer (90 GWh)
France Household Data provided by CRE.
http://www.cre.fr/documents/deliberations/decision/tarif‐de‐distribution‐de‐gaz‐de‐grdf
120 ‐ 108 228 1.52
Industrial consumer (50GWh)
13737 30631 35500 79868 0,16
Industrial consumer (90 GWh)
13737 55135 63900 132772 0,15
Germany Household Data not available according the national regulator Industrial consumer (50GWh)
Industrial consumer (90 GWh)
Greece Household Data not available according the national regulator Industrial consumer

167
Country Consumer group National Tariff reference Sources/ Observations Average distribution network cost for the year 2013
Fixed (€) Capacity (€)
Energy (€) Total (€) Average network cost (cent €/kwh)
(50GWh)
Industrial consumer (90 GWh)
Hungary Household Data not available according the national regulator Industrial consumer (50GWh)
Industrial consumer (90 GWh)
Ireland Household Industrial consumer (50GWh)
Industrial consumer (90 GWh)
Italy Household 43 ‐ 80 123 0,82
Industrial consumer (50GWh)
43 ‐ 27780 27823 0,06
Industrial consumer (90 GWh)
43 ‐ 39889 39932 0,04
Lithuania Household Data provided by the National Regulator
http://www.lietuvosdujos.lt/index.php/gas‐distribution‐system‐/natural‐gal‐distrubution‐tariffs/248?year=2013
‐ ‐ 102 102 0,68
Industrial consumer (50GWh)
‐ ‐ 250000 250000 0,50
Industrial consumer (90 GWh)
‐ ‐ 304218 304218 0,34
Luxembourg Household ‐ ‐ 111 111 0,74
Industrial consumer (50GWh)
‐ 38993 173254 212247 0,42
Industrial consumer (90 GWh)
‐ 57185 308218 365403 0,41
Poland Household Industrial consumer

168
Country Consumer group National Tariff reference Sources/ Observations Average distribution network cost for the year 2013
Fixed (€) Capacity (€)
Energy (€) Total (€) Average network cost (cent €/kwh)
(50GWh)
Industrial consumer (90 GWh)
Portugal Household Data provided by the National Regulator (ERSE)
Network tariffs are determined and approved by the NRA. These tariffs are one of 3 components of the TPA tariff, which results from adding each of the previous.
TPA tariff includes: 1) Distribution network tariff (used here), 2) transmission network tariff and 3) global use of the system (which accounts for several type of levies)
29 ‐ 507 536 3,57
Industrial consumer (50GWh)
5116 118557 35748 159421 0,32
Industrial consumer (90 GWh)
5116 213403 64346 282865 0,31
Romania Household Industrial consumer (50GWh)
Industrial consumer (90 GWh)
Slovakia Household Data provided by the National Regulator (URSO) 50 15 140 205 1,37
Industrial consumer (50GWh)
45145 82254 22,939 150,338 0,30
Industrial consumer (90 GWh)
45145 148057 41,291 234,493 0,26
Slovenia Household 48 ‐ 123 171 1,14
Industrial consumer (50GWh)
‐ 55227 342,989 398,216 0,80
Industrial consumer (90 GWh)
‐ 62089 338660 400749 0,45
Spain Household Tariff 3.2 and a contracted capacity of 116KWh/day. Include network transmission access tariff.
Tariff access price based on: Orden IET/2812/2012 27/12/2012
In the Spanish gas system, consumers pay a single access tariff for the use of the transmission and distribution network. There is no a tariff for the use of the transmission network and a tariff for the distribution
81 ‐ 322 403 2,69
Industrial consumer (50GWh)
Tariff 2.4 and a yearly load factor of 7000 hours
159500 0,32

169
Country Consumer group National Tariff reference Sources/ Observations Average distribution network cost for the year 2013
Fixed (€) Capacity (€)
Energy (€) Total (€) Average network cost (cent €/kwh)
Industrial consumer (90 GWh)
Tariff 2.4 and a yearly load factor of 5157 hours. Include network transmission access.
network 188427 ‐ 98640 287067 0,32
Sweden Household Data provided by the National Regulator 122 ‐ 417 539 3,59
Industrial consumer (50GWh)
213 ‐ 1085000 1085213 2,17
Industrial consumer (90 GWh)
213 ‐ 1953000 1953213 2,17
The Netherlands Household Data provided by the National Regulator 18 127 ‐ 145 0,97
Industrial consumer (50GWh)
Industrial consumer (90 GWh)
Great Britain Household Industrial consumer (50GWh)
Industrial consumer (90 GWh)
Household consumer with an annual consumption of 15000 kWh. Industrial consumer with an annual consumption of 50000000 kWh and 7000 use hours. Industrial consumer with an annual consumption of 90000000 kWh and 7000 use hours.

170
Annex 7: Allowed electricity distribution revenues across EU Member states in 2013. (Include only distribution activities). Do not include transmission costs, taxes and levies
Country Voltage level
Connection points
Total of electricity delivered (MWh)
Distribution circuit length (Km)
Total Allowed revenues (€)
Total Allowed revenues
excluding losses (€)
Distribution
(€)
Metering
(€)
Customer Service & Administrat
ive (€)
Distributions Losses (€)
Other Observations
Austria HV 550 18025000 9760 92369850 77871200 Customer Service revenues are included in Distribution revenues.
Other are Costs for monition, disconnection fees etc. and have a social component (thus are not cost reflective)
MV 30200 19102000 65550 443375280 373781760
LV 5731000 24930000 160300 1293177900 1090196800
Total 5761750 62057000 235610 1847397000 1734551000 1557424000 171521000 112846000 5,606000
Croatia MV 2126 3507000 64389563
LV 2349239 10878000 364,874,188
Total 2351365 14385000 ‐ 429263750 429263750 382567161 46696590
Cyprus MV 646 8788
LV 512972 13640
Total 513618 22428 91964000 91964000
Czech Republic
HV 127 6401368 12258 205194315 172654807 389711 6937161 32149797 Exchange rate average 2013: 25,974 CZK/EUR
Total Allowed revenues include distribution losses.
MV 25433 22168303 71713 551111898 479487837 6202035 17238139 65422026
LV 5837922 23809058 137470 667634937 468352302 82856607 29383281 116426028
Total 5863482 52378729 221441 1423941149 1263501879 1120494946 89448352 53558581 213997851
Denmark HV 1743 Total allowed revenues do not include revenues for energy saving activities
MV 73983
LV 96093
Total 3277000 36802894 171819 903668042 903668042
Estonia MV 26000
LV 34000
Total 560381 8000000 60000 274040000 274040000
Finland HV 117 6622
MV 3761 138153
LV 3305268 237996

171
Country Voltage level
Connection points
Total of electricity delivered (MWh)
Distribution circuit length (Km)
Total Allowed revenues (€)
Total Allowed revenues
excluding losses (€)
Distribution
(€)
Metering
(€)
Customer Service & Administrat
ive (€)
Distributions Losses (€)
Other Observations
Total 3309146 60000000 382771 1550000000 1550000000
France HV 162800000 608053 3956957022 197229608 27747610 Connection points according CRE forecast 2013.
Distribution revenues exclude losses.
“Other” is the amount of transmission grid access grid.
MV 189000000 685413 8310045030 636554086 300587374
LV
Total 34838361 351800000 1293466 12267002052 9332113907 8169995228 833783695 328334983 1157708794 3355487305
Germany HV 3923 96084 Data on connection points is not available. The values used here are the number of measurement points in the grid. Also only aggregated values over all voltage levels are available for all German DSOs.
Allowed revenues, distributions, metering and customer service data is not complete. There is revenues data available for DSOs in responsibility of Bundesnetzagentur.
The share of revenues of DSOs regulated by BNetzA from total revenues is roughly 85‐90% and can vary from year to year.
The data is based on planned values. The revenues are not approved as the final formal approval of revenues including volatile costs and permanent not controllable costs is only commenced with approval of revenues in
MV 72336 509866
LV 39714305 1156785
Total 49934777 469600000 1762735 12982849654 12982849654 11783229974 625782338 573837341

172
Country Voltage level
Connection points
Total of electricity delivered (MWh)
Distribution circuit length (Km)
Total Allowed revenues (€)
Total Allowed revenues
excluding losses (€)
Distribution
(€)
Metering
(€)
Customer Service & Administrat
ive (€)
Distributions Losses (€)
Other Observations
3RD regulatory Period starting from 2019. Revenue data do not contain revenues for elements that are not within network charges but are passed through by the DSO (e.g. concession fee, renewable energy support levy).
Total allowed revenues have been reduced by the amount of upper grid charge to avoid double counting of costs (and inclusion of transmission costs in revenue figures).
Greece HV 777
MV 11207 10865762 109686 66295162 64313052 1982111
LV 7381515 33276044 123352 710468512 689226732 21241780
Total 7392722 44141806 233815 776763674 776763674 753539784 23223890
Hungary HV 135 5050000 7872 16778720 Data of connection points and electricity delivered from 2012
Average HUF / eur rate 2013: 296,8730HUF/Eur . Source: European Central Bank.
Other include: local taxes, public authority fees, transfer costs
MV 6209 9479000 66816 166787833
LV 7246562 19428000 87266 737305018
Total 7252906 33957000 161954 920871572 687432260 518814034 78969107 63504769 233493784 26144350
Ireland HV 6 538
MV 1545 97790
LV 2235681 69200
Total 2237232 23000000 167528 729000000 729000000
Italy MV 342600

173
Country Voltage level
Connection points
Total of electricity delivered (MWh)
Distribution circuit length (Km)
Total Allowed revenues (€)
Total Allowed revenues
excluding losses (€)
Distribution
(€)
Metering
(€)
Customer Service & Administrat
ive (€)
Distributions Losses (€)
Other Observations
LV 762616
Total 37099007 264000000 1105216 5650000000 5650000000
Lithuania MV 54017 34600000 Distribution revenues in 2013 were 450,69 (130,53 million EUR, when 1 EUR=3.4528 LTL). MV revenue was 34,6 million EUR (26%), LV revenue – 96 million EUR (74%).
LV 69732 96000000
Total 1619530 8040000 123749 130600000 130600000
Luxembourg
HV ‐
MV 3160
LV 5318
Total 281428 5040000 8478 162250000 162250000
Malta HV 48
MV 1400
LV 2847
Total 285214 2132990 4295 29003000 29003000
Poland HV 379 24109000 32671 316140560 Planned revenue for 2013 in tariffs of 5 biggest DSOs
Currency rate Average 2013: 1 eur= 4,1975 PLN Source European Central Bank
MV 34518 43209000 305492 992257296
LV 16775752 54066000 435978 2931983323
Total 16810649 121384000 774141 4240381179 4240381179
Portugal HV 280 6648000 ‐ 12796670 There is no separate determination of network cost allowance. More so, the total allowed revenues include cost items which hardly derive from "regular" DSO technical activity like concession fees for LV network.
MV 23538 13793000 83256 204746720
LV 6061698 21322000 139371 1049326940
Total 6085516 41763000 222627 1279667000 1279667000

174
Country Voltage level
Connection points
Total of electricity delivered (MWh)
Distribution circuit length (Km)
Total Allowed revenues (€)
Total Allowed revenues
excluding losses (€)
Distribution
(€)
Metering
(€)
Customer Service & Administrat
ive (€)
Distributions Losses (€)
Other Observations
As consequence of Portuguese legislation, the meters cannot be remunerated in any way, nor charged separately to the customers. Hence the meter assets (only the devices on customer permisses) are not a part of the RAB.
Other metering related costs are not treated separately from other cost items.
Energy losses are provided by each market agent as they must procure in the wholesale market an energy quantity which is the consumption plus an added percentage for losses.
This percentage is adjusted to account the actual losses verified in the transmission and distribution networks.
Hence there is no cost allowance to the DSO to procure losses. Besides this, there is an incentive mechanism for the DSO to promote overall losses reduction.
Romania HV 256 7441406 6584
MV 17852 13438200 34665
LV 8824027 20124416 48695
Total 8842135 41004022 89944 1140000000 1140000000
Slovakia HV 96 3172000 6743 19433445
MV 12944 7710000 32361 177117554
LV 2421057 7683000 52250 318925001

175
Country Voltage level
Connection points
Total of electricity delivered (MWh)
Distribution circuit length (Km)
Total Allowed revenues (€)
Total Allowed revenues
excluding losses (€)
Distribution
(€)
Metering
(€)
Customer Service & Administrat
ive (€)
Distributions Losses (€)
Other Observations
Total 2434097 18565000 91354 515476000 515476000
Slovenia
MV 1530 4485266 17422 40440248
LV 931505 5833844 46718 212438426
Total 933035 10319110 64140 252878674 252878674
Spain HV 2572 49127000 31380 99574000 5093 Revenues data for 2014.
Metering include commercial cost.
MV 105591 70703000 280345 1024527000 209070
LV 28592609 114669000 383202 3828944000 56613366
Total 28700772 234499000 694927 5069743000 5069743000 4953646000 56827529
Sweden HV
MV 7081 28235857 197024
LV 5358028 66651246 312044
Total 5365109 94887103 509068 4965480341 4965480341 4374181579 159905000 190038731 431393762
Netherlands
MV 32935 44690000 104592 1220000000 No regulatory tariffs apply
Distribution revenues include distribution losses
LV 8119161 64310000 145213 1990000000 210000000
Total 8152096 109000000 249805 3210000000 2994018606 3000000000 210000000 215981394
Great Britain
HV 75440 Average currency rate 2013: EUR 1 = GBP 0,84926
MV 352841
LV 408875
Total 29907234 355340000 837156 6265454631 6201869863 63584768

176
Annex 8: Allowed gas distribution revenues across EU Member states in 2013.
(Include only distribution activities). Do not include transport costs, taxes and levies
Country Connection points Total of energy delivered (MWh)
Total Allowed revenues (€)
Distribution
(€)
Metering
(€)
Customer Service & Administrative (€)
Others (€) Observations
Austria 1349012 94000000 547154245 541600000 24552014 Croatia 651099 10646000 61959437
Czech Republic 2860345 86346200 564000000 278953935 43710677 22938878 22053971 Denmark ‐ 41370000 201000000 Estonia 25500000 Finland 33200000 72000000 France 11027387 327000000 3300000000 3138500000 161500000
Germany 10564000 739000000 4500000000 Allowed revenue for DSO within the responsibility of the BNetzA. The allowed revenues of DSOs within the responsibility of the Federal States are unknown.
Greece 307060 8490219 Allowed revenues are not available according the national regulator
Hungary 3057779 74847608 278357213 247591846 36164 30729204 Exchange rate: 296,8730 HUF/EUR
Metering only include the cost of meter reading.
Ireland 657000 13955000 185200000 129640000 37040000 18520000 Italy 21523072 355722266 3200000000 Data provided by the National regulator.
Correction factor used: 0,01170 MWh/SCM Lithuania 561554 8899179 48860924
Luxembourg 84277 11276014 33460000 Poland 6471100 159541200 954000000 Portugal 1341037 25153000 301609000 There is no separate determination of
network cost allowance. Contrary to the electricity sector, the total allowed revenues do not include concession fees which are

177
Country Connection points Total of energy delivered (MWh)
Total Allowed revenues (€)
Distribution
(€)
Metering
(€)
Customer Service & Administrative (€)
Others (€) Observations
charged to consumers separately to the network tariff.
Metering. As consequence of Portuguese legislation, the meters cannot be remunerated in any way, nor charged separately to the customers.
Hence the meter assets (only the devices on customer permisses) are not a part of the RAB.
Slovakia 1510749 53726699 380968346 205652033 37504645 5601495 12673 Slovenia 132806 3478465 50820000 42630000 3350000 4840000 Spain 7388850 168224224 1475271000 According to the memory of the proposal of
the CNMC to establish a access tariff methodology (table 23, page 47), the number of connection points in 2013 was 7388850 and total of energy delivered was 168224224 MWh
Data includes also transmission activities Sweden 37385 9805699 83759349 The
Netherlands 7194105 526500000 1271000000 1131000621 140445500
Great Britain 916110000 3291000000 3237800000 53800000

178
7. Task 6 ‐ Recommendations to the Commission
In this chapter we present recommendations to the Commission based on the findings of our investigation of various aspects of the Member States’ regulation of electricity and gas distribution. Our survey of the regulatory frameworks implemented in the Member States highlights that:
The existing regulatory frameworks for electricity and gas distribution appear to be well tailored to the traditional role and technology of distribution networks;
Multiple indications point at an evolving role of distributors, in particular in electricity.
Two caveats are in order at this point. First, recommendations cannot be cast in terms of individual tools or mechanisms, as multiple features of the regulatory framework interact to determine its outcome in terms of incentives for regulated firms and cost to consumers.
Second, some features of optimal regulatory models depend on the content of distributors’ activity, which in Europe will be shaped by policies that are still being developed, for example on electric mobility and on commercial arrangements to exploit small consumers’ demand flexibility .
The existing regulation of electricity and gas distribution tariffs is in most Member States consistent with the traditional features of the distribution business, i.e.:
Little generation connected to distribution networks and inflexible demand, so that the primary role of distribution consists in transferring a basically unidirectional power from the transmission network to the consumers’ premises, trough relatively passive networks;
The distributor’s main “outputs” are ensuring universal access to the service or a target network coverage, respectively for electricity and gas, and continuity of supply;
Consolidated technology and network planning methodologies, implying limited uncertainty optimal investment decisions and ease of auditing by regulators;
Very diverse industry structures among Member States, with high fragmentation in some countries.
Those features of the distribution business appear to be reflected in the regulatory systems currently implemented in most European countries. In particular:
With the exception of Great Britain, current incentive‐based regulatory schemes place little emphasis on characterizing the outputs delivered by the distributor, but for quality of service schemes in some countries;
Typically distributors are not exposed to volume risk and to the risk that their investment, for example because of lower than expected demand, turn out to be less useful than expected when they were decided;

179
Revenue setting mechanisms based on benchmarking are implemented in countries where the distribution sector is highly fragmented;
Regulators and stakeholders are generally less involved in the decision‐making process on distribution network development, compared to transmission;
Traditional tariff structures reflect limited availability of information on each consumer’s responsibility in causing the distribution system’s peak and by affordability and fairness considerations.
Next we discuss the main trends that European distribution business is undergoing and their implications for tariff regulation.
An investment cycle is being spurred by the need to increase the distribution network’s capacity to host an expanding fleet of renewable generators. Future investments appear to depart from traditional distribution upgrades in several respects:
They involve innovative technologies whose cost and performances are more uncertain and on which information asymmetries between regulators and firms might be greater;
Multiple options to achieve the same results are available, such as deployment of storage capacity in alternative to increasing demand response, upgrading lines and substations or deploying smart technologies, distributing or centralising network intelligence, developing new telecommunication infrastructures or exploiting existing ones;
Distribution investment decisions interact with the outcome of decisions in areas beyond the distributors’ control, such as renewable production targets or national deployment strategies of IT infrastructures.
Regulatory frameworks that, in our view, are most effective in the new environment share the following features, which we present next in the form of recommendations.
Recommendation 1: Distributors should not be exposed to risks related to events that are not under their control. This implies, in particular, that distributors do not be exposed to:
Volume risk given their limited control on power and gas consumption; this is a feature of regulatory schemes already deployed in most Member States.
The risk of cost under‐recovery in case investments turn out to be ex‐post less useful than expected.
The downside of the latter feature is, ceteris paribus, less incentives for distributors to select the efficient investment strategy53. However, such negative impact on the quality of distributor’s investment decisions can be more than offset by greater ex‐ante scrutiny, which leads us to the next recommendation.
Recommendation 2: major distribution network investment decisions should be subject to structured and open ex‐ante scrutiny by stakeholders and regulators. A transparent and open process to assess the investment’s opportunity should be implemented,
53 This is particularly could result even result incentives to distort investments if other

180
including publication of cost benefit analyses by the distributors, public consultation, independent technical audit and, finally, some form of regulatory approval.
The outcome of such process would be a thoroughly audited investment strategy which consumers could be safely required to undertake the risk of. In addition, an open and inclusive decision‐making process would ease coordination of distribution investment decisions and the outcomes of related decision making streams. For example, as part of this process:
The implications of alternative investment options in terms of generation hosting capacity at different locations should be assessed;
Distributors should be required to consider, assess and consult stakeholders about any opportunities to exploit synergies with other sectors, and in particular with suppliers of non‐energy local services. Such synergies, for example, could result from:
o Distributors procuring telecommunication services from existing providers;
o Distributors granting access to passive infrastructures to telecommunication service providers
o Distributors sharing the services of IT infrastructures built for their purposes with other users ‐ such as suppliers of street lighting, traffic control or waste collection services.
Complex investment approval proceedings may place an unjustified administrative burden on small distributors and, if the distribution sector is highly fragmented, on the regulator; such cost would ultimately be passed on to consumers via distribution tariffs. Arrangements to mitigate administrative costs are conceivable; for example, in case one large distributor and several small distributors operate in geographical area, the larger distributor could act as the aggregator of the smaller distributors’ investment plans in order to ensure consistency of the plans submitted to the regulator. Further, streamlined scrutiny processes, possibly boiling down just to transparency requirements, could be envisaged for investment plans meeting certain predefined conditions, set by the regulator for example via benchmarking.
Financial incentives have proved very effective in aligning the distributors’ objectives with the regulator’s and, ultimately, the consumers’ and can be expected to be core elements of effective regulatory schemes in the future. Incentive‐based mechanisms place some risk on the regulated firms and the optimal balance between risk and incentive power is to be assessed on a case by case basis. In Recommendation 1 we have addressed the two perhaps most important sources of risk for distributors, arguing in favour of shielding distributors from their effects. However, incentive based mechanisms have and can be effectively implemented in order to steer the distributors’ behavior in areas such as cost minimisation and quality of service.
The next recommendation focuses on these mechanisms.
Recommendation 3: The following features increase the power or reduce the cost for consumers of incentive‐based regulatory schemes:
Use of all available information on the efficient costs of distributors: the more information are available to the regulator on the distributor’s efficient cost, the smaller the economic rents that need to left with distributors in order to align their objectives with the regulator’s. Multiple sources of information are and

181
should be used by regulators, including benchmarking analyses, technical audits, standard costing exercises. The Commission should promote publication of information and data about technical features, revenue setting methodologies, output targets and allowed revenues set for distributors in all Member States. Cost unbundling of activities for which a large part of costs can be assessed in isolation – such as metering – should be promoted, as this improves the quality of the information which incentive schemes can be based on.
Focus on outputs: multiple performance dimensions, or outputs, have to be addressed by incentive‐based regulatory schemes as distributors acquire increasing responsibilities in areas such as system operations, facilitation of retail competition, smart metering and energy conservation. Effective financial incentives in this context can be provided via premiums and penalties related to the achievement of pre‐determined output targets. Targets should be selected such that they directly impact on the value of the service delivered by the distributor for network users’ and, ultimately, consumers. We note incidentally that output based mechanisms can be implemented on top of a baseline tariff and investment scenario approved by the regulator along the lines of Recommendation 2.
Focus on total cost and long regulatory periods: setting allowed revenues in terms of total costs provides incentives to distributors to select the efficient combination of operating and capital costs and to exploit any opportunities to create synergies with other sectors. Long regulatory periods increase the power of such incentives by allowing distributors to appropriate a material share of the savings that they achieve.
Incentives to innovation and inter‐sectorial synergies: a corollary of the previous two recommendations is that – in general – incentives for distributors to deploy innovative technologies should be mainly a by‐product of regulatory schemes targeting outputs, rather than being pursued through schemes targeting specific technologies or solutions. This would ensure that only innovation directly impacting on the value of the service for network users’ be implemented and, more generally, that regulation be technology neutral. The same recommendation holds for incentives to exploit synergies between distribution investments and the supply of non‐energy local services; such incentives should be a by‐product of regulatory schemes targeting total cost minimisation rather than of schemes targeting specific technologies or solutions;
Re‐openings and allowed revenue indexation: rare and unpredictable events beyond the distributors control may cause major departures from allowed revenues during the regulatory period54. Allowed revenue updates during the regulatory period (so called: re‐openings) to account for such events are also desirable. However, such updates should be triggered only by very major events, whose occurrence and impact on cost are clearly beyond the distributor’s control.
54 These might include changes in the national or regional policy and regulatory framework.

182
Some major cost items beyond the distributors control are known to be variable in time. This might be the case, for example, for copper and steel prices. When robust indexes of such costs are available, the distributor’s allowed revenues should be parametrized, in order to reduce the risk borne by distributors.
Notice that in both cases placing risk on distributors is of little or no use from an incentive perspective, since distributors don’t have control on the events impacting on cost. On the other hand, the more risk is placed on distributors the higher is expected return necessary to attract capital in the industry and, therefore, the cost ultimately borne by consumers.
Sending correct price signals to consumers via distribution tariffs is consistent with the broad objective of developing demand flexibility pursued, by the Commission and by Member States. Our recommendations on distribution tariff structure are presented next.
Recommendation 4: efficient distribution tariffs should be designed to send long term incremental cost signals to consumers. In general, this requires that:
Costs for consumer specific infrastructures be covered through standing charges or connection charges;
Costs for shared infrastructures be split among network users based on each one’s contribution to the infrastructure’s peak load55.
This recommendation is based on the conjecture that distribution capacity shortages are optimally addressed through network upgrades and that therefore scarcity conditions in distribution are typically transitory. If that condition holds, sending scarcity signals through distribution tariffs is not necessary.
If, instead, congestions turned out to be a permanent feature of optimally dimensioned distribution systems, dynamic pricing systems are far more effective in rationing available capacity than time‐of‐use tariffs set long before real time. We are not aware of any applications of dynamic charging to distribution services; therefore, any assessment of the relative merits of alternative models is speculative. However, experience in transmission pricing suggests that schemes addressing transportation capacity scarcity via locational energy price differentiation are more effective than schemes based on dynamic network charges.
55 Large scale deployment of smart meters, capable of collecting high frequency withdrawal data will make it possible to assess each consumer’s contribution to peak usage of distribution networks directly, while proxies are currently adopted in most countries.

183
Appendix 1: Country Reports

184
Country Report – Austria (electricity distribution)
2. Overview of the distribution sector
2.1. Institutional structure and responsibilities In Austria there are approx. 124 distributors supplying electricity to 5.87 million
customers covering the whole country. Total distribution in 2013 amounted to ca. 62.5
TWh.
Detailed information about unbundling status is not available. The general requirement is that DSO over 100,000 customers are legally unbundled, but smaller ones may be also legally unbundled.
Smaller DSOs with less than 100,000 customers cover 8% of total demand.
Table 29: DSO characteristics
Total number DSOs
Ownership unbundled
Legally unbundled
Less than 100,000 customers
Exemption*
Share of total demand
Country 124 11 113 NA NA
*exemption from distribution network charges for certain types of grid users, such as low‐carbon generation connected to distribution networks.
The responsibility for setting the principle and the calculation methodology of
distribution tariffs, as well as for approving their values, belongs to the regulatory
authority (E‐Control). The determination of tariffs involves a two‐step procedure: at
first, costs and volumes are approved by the board of directors of E‐Control, providing
the base for tariff determination. At second, the E‐Control Commission is responsible for
tariff determination (incl. tariff structure decisions). The E‐Control Commission consists
of different members of the National Chambers (representing interests of stakeholders,
notably companies’ and workers’ interests). The E‐Control Commission is appointed by
the government based on the proposal of the federal minister of science, research and
economy (§10 E‐Control law). Decisions have to be taken by majority vote. The
In Austria, the electricity distribution sector is rather fragmented with a relatively large
(over 100) number of small DSOs, and few large federal state operators as well as
some centered in the cities. The sector is fully regulated. The regulator has a peculiar
structure, with an independent external Commission required to approve the main
tariff related decisions. This Commission also acts as an appeals body with certain
competences (no tariff related appeals).

185
Commission is responsible for tariff determination (including tariff structure) but is no
longer (since 1.1.2014) the main appeals body for tariff related decisions regarding the
tariff ordinance. Besides tariff setting, it is for example responsible for dispute
settlement, standard terms and conditions for DSOs, etc.
The breakdown of responsibilities as it related to tariff setting is summarized in the table
below.
Table 30: Legal basis for tariff structure – Roles and Responsibilities in setting distribution tariffs
Actor Allowed revenues (tariff level)
Tariffs (tariff structure) Connection charges
DSO Providing opinions Providing opinions
Government Issues principles Issues principles Issues principles
NRA (Board of Directors and E‐Control Commission
Board of Directors: Cost and volume approval
E‐Control Commission: approves tariffs sets principles for tariff structure
Principles set by law. Amount is determined by E‐Control Commission.
(*) subject to E‐Control Commission approval
The regulatory process adopted to set distribution tariffs involves the following steps:
1. E‐Control Commission issues one consultation draft of the network tariff Ordinance.
2. Afterwards comments are discussed with the E‐Control Commission.
3. Finally the Ordinance is published. Its effective date is (usually) always the 1st of
January.
2.2. Key figures on revenue and tariffs Distribution revenues in Austria in 2013 were approx. € 1,8 billion. Approx. ¾ of total
revenues are related to distribution (system utility and network losses and other
distribution related tasks) tariffs. Connection charges, system services and metering
charges make share the rest equally.
A breakdown of revenue by customer category, including information on available tariff
components and the number of customers in each category is set out in the table below.
In Austria there are 7 voltage levels, but end users are mostly connected to 5 of them:
- Level 1: Ultra‐high 380/220 kV (not applicable to distribution customers)
- Level 2: Transformation between UHV and HV
- Level 3: High 110 kV (typically large industrial customers belong here)
- Level 4: Transformation between HV and MV
- Level 5: Medium 35 kV (typically small industrial customers belong here)
- Level6: Transformation between HV and MV
- Level 7: Low 230/400 V (typically small businesses and households belong here)

186
Table 31: Tariff components, customers and revenues per customer class
Customer classes Tariff components Number of customers Revenue
Level 3 & 4 kWh, kW 100 7%
Level 5 & 6 kWh, kW 150000 24%
Level 7 kWh, kW, fixed 5700000 69%
Figure 25: Proportion of revenue and energy accounted by voltage level
The typical customers for the main categories as well as their typical features are
illustrated below:
Table 32: Typical customer types
Customer type Service level Notional Energy usage/y Load
Residential 7 3500 kWh Flat
Small business 7 210 MWh 75 kW
Small industrial 6 1140 MWh 300 kW
Small industrial 5 9000 MWh 2 MW
Large industrial 4 58 GWh 10 MW
Large industrial 3 195 GWh 30 MW

187
Distribution tariffs are segmented by voltage level, measurement, service type, time and
geographical zone. There are four time brackets (winter and summer, both split in a
peak and off‐peak time) and 14 zones, amounting to the nine Austrian Provinces (incl.
Vienna as state capital and province) plus special tariffs for the cities of Graz, Linz,
Klagenfurt, Innsbruck and for Kleinwalsertal56. As a consequence there are more than
500 different tariff levels.
For the latest amendment of the System Utility Ordinance 2012 ‐ amendment 2014
(Systemnutzungsentgelte‐Verordnung 2012 – Novelle 2014; SNE‐VO 2014) for voltage
levels 3 ‐ 5, there is a capacity charge comprised between approx. 12 and 39 €/kW,
structured by zone; and an energy charge, structured by time and zone and comprised
between 0,17 and 1,23 cents/kWh.
For voltage levels 6 and 7, the tariffs differ also by measurement and service type. The
capacity charge is only applied for measured capacity (between 29 and 66 €/KW) and is
added to an energy charge between 0,74 and 3,5 cents/kWh.
In case the capacity is not measured there is either an interruptible service (energy
related) comprised between 1,5 and 4 cents/kwh; or (for Level 7 only, i.e. low voltage), a
mix of a fixed (standing annual) charge (between 13,80 and 23,32 €/year, zone related)
and an energy charge (between 3,137 and 5,69 cents/kWh, time and zone‐related).
Moreover, there are 4 tariff times (summer and winter high and low) and there are
major differences within the network areas. Thus this information only provides a broad
range of variability and cannot be interpreted as any meaningful comparison between
the zones.
The average tariffs per kWh are illustrated below.
56 This is a small, isolated Tyrolean valley that is supplied through the German network and has therefore higher tariffs, it is excluded from the following analyses.

188
Table 33: Breakdown of annual charges – typical customer types, SNE‐VO 2014 (€)
Customer type Notional Energy usage
Fixed charges, €/year (*)
Energy charges, €c/kWh (*)
Load charges, €/kW/year (*)
Total (national average, €c/kWh)(+)
Residential grid level 7 not metered
3500kWh 17,28 3,88 0
4,93
Small commercial grid level 7 metered
50MWh 1,87 43,08
2,27
Industrial grid level 4 24000MWh 0,50 27,96 0,68
(*) Charges are segmented by time and geographical zone. Indicative values are provided for Vienna (industrial and commercial) and Lower Austria (residential), which are intermediate in the range.
(+) Data provided by E‐Control
Figure 26: Average network charges (€c/kWh), 2013
3. Regulation of distribution activities
3.1. General overview
The role of the DSO in Austria is to provide and operate a distribution network able to
cover the demand of the connected customers. Both CAPEX and OPEX are subject to
regulation with benchmarking performed on TOTEX. The NRA (Board of Directors and
Commission) sets the principles, issues the methodology and approves network tariffs
(see two‐step procedure described above). There are no formal end user price controls
and the market is fully open. However, it is worth noticing that a large part of the supply

189
industry is controlled by the state or local public sector, who may be subject to moral
suasion by local government authorities.
The distribution tariff is itemized separately to end‐users, within the same bill.
Key features of the regulatory regime are set out in the following table:
Table 34: Main features of the regulatory regime
Issue Approach
Type of regime (concession/licence) Competencies are delegated to Austria’s provinces
Regulatory period (cost determination principles)
5 years
Validity of tariff ordinance 1 year
Form of determination (distributor propose/regulator decide)
Regulator decides
Scope for appeal regarding cost and volume determination
Federal administrative court
Scope for appeal regarding tariff ordinance
No appeal as such possible. However courts, the federal government and regional governments can initiate a constitutional review of the ordinance at the Constitutional Court. The Constitutional Court can then annul the ordinance.
3.2. Main incentive properties of the distribution regulatory model
Allowed (controllable) costs/revenues are subject to an RPI‐X annual adjustment, where
X is composed of a general (Xgen) and an individual component (Xind). Certain factors
are used to take into account the expansion of services during the regulatory period
New investments (CAPEX) are treated within a so‐called “investment factor”, a cost
reimbursement approach based on realized book values based on a yearly audit
procedure. There is no efficiency offset applied to new investments (undertaken during
the regulatory period). In addition to the “investment factor”, an “operating cost factor”
accounts for changes in OPEX‐levels during the regulatory period. The operating cost
factor involves changes in network connections (no distinction between conventional
and smart meters) and network length as relevant output parameters. Extra OPEX for
Smart Metering which are not yet reflected in the operating cost factor are treated
under a separate cost‐plus system, subject to a yearly audit. Tariffs are calculated by the
NRA based on regulated costs and are set by a yearly tariff ordinance. The individual X‐
factor is determined via benchmarking. A TOTEX benchmarking approach is applied,
involving standardised CAPEX and using DEA and MOLS techniques. Xgen is determined
via a TFP calculation (Thornquist Index).

190
The WACC structure involves a goal capital structure of 40% equity and 60% debt. If the
actual equity ratio of a company is more than 10% below 40%, the actual equity rate will
be used.
At the same time the following tools are provided to mitigate risks:
- Recalculation happens to avoid the t‐2 problem in cost recognition;
- A regulatory account takes care of differences due to volume changes;
- DSOs might call for a rate revision on the basis of extraordinary events – these cases will be treated on a case by case basis and will be subject to an audit procedure.
There is no quality element in the tariff regulatory formula. However, various quality
standards are defined and monitored (based on an Ordinance).
3.3. Determination of cost of service parameters
The approach to determining key cost of service parameters are summarized in the
following table.
Table 35: Approach to key cost of service parameters
Parameter Approach
Form of price control Price‐cap
Regulatory asset base Tangible and non‐tangible assets (no working capital), based on book values
Capital expenditure (Controllable) CAPEX are subject to benchmarking, changes (basis is the audit year) during the regulatory period are reflected within a so‐called “investment factor”.
Approach to operating expenditure (Controllable) OPEX are subject to benchmarking, changes in service provision (connections, network length) with the audit year as reference, are reflected in a so‐called “operating cost factor”
Form of WACC applied Nominal, pre‐tax
Additional revenue items (where applicable) Non‐controllable costs.
The following formula is applied in determining the WACC:
WACCpre‐tax = D * (Rf + DP) + E * (Rf + eβ*RP) / (1‐T)
Where:
- Risk‐free rate (%) Rf
- Debt premium (%) DP
- Pre‐tax cost of debt (%) CofD = Rf + DP
- Asset beta aβ
- Equity beta eβ = aβ*(E+D*(1‐T))/E
- Risk premium (equity, market) (%) RP
- Pre‐tax cost of equity (%) CofEpre = Rf + eβ*RP
- Post‐tax cost of equity (%) CofEpost = CofEpre*(1‐T)

191
- Equity (share) E
- Debt (share) D = 1 ‐ E
- Pre‐tax WACC, nominal (%) WACCpre = D * CofD + (E*CofEpost)/(1‐T)
No further information is available. Criteria for the calculation of parameters are not
published.
4. Tariffs for distribution services
4.1. Distribution tariffs
The cascading approach is adopted to allocate costs between customer categories with the following key features:
- Costs are cascaded from the upstream level, up to a maximum of 70%
- Secondary control and losses are not included
- Energy injected at the various voltage levels are considered in the calculation
The main services users pay for are:
- Network usage
- Network losses
- Metering
- For additional services
Large industrial customers pay a reduced tariff for the volume and load of electricity which is taken from the network in order to avoid destabilization.
Generators with a contracted power of more than 5 MW pay the tariff for network losses and system‐ service charges for system balancing costs.
Table 36: Approach to key issues in setting distribution tariffs
Issue Approach
Treatment of distribution losses Own tariffs for losses
Presence of uniform tariffs For ultra‐high voltage only
Presence of non‐linear tariffs Yes (degressive)
Presence of regulated retail tariffs No
Presence of social tariffs No
4.2. Connection charges Connection charges include:
- a system admission charge, which reflects the costs for the preparation of the grid connection;
- a system provision charge, which reflects the costs of the power deployment of the DSO.
Table 37: Summary of key issues relating to connection charges
Issue Approach

192
Determination of charges
Type of charges (shallow/deep) Deep
Methodology adopted Admission charge negotiated, provision charge regulated
Hosting capacity Scope to refuse connection Lack of capacity
Requirements to publish hosting capacity
No
Targets and/or incentive schemes to enhance hosting capacity
No
5. Distribution system development and operation
5.1. Distribution system development
The key features of distribution system planning are summarized below.
Table 38: Approach to distribution planning
Issue Approach
Form of distribution planning document DSO plans notified to NRA but not subject to approval
‐ Key responsibilities for its development DSO
‐ Degree of integration with renewables plan No specific relationship
‐ Relationship with consumption trends No specific relationship
‐ Relationship with quality of service targets No specific relationship
‐ How trade‐offs between network development and alternative technologies are treated
No specific relationship
‐ Requirements to integrate cost benefit analysis No specific relationship
5.2. Distribution system operations
The key features of distribution system operations are summarized below.
Table 39: Approach to distribution planning
Issue Approach
Requirements for dispatch of renewable plants connected to DSO network
Only in emergency
Possibility to dispatch flexible loads Yes
Other sources of flexibility open to DSO Demonstration projects only
System development is decided by DSOs, which must satisfy demand and are subject
to capital cost monitoring and benchmarking. However the NRA does not approve
their investment plans.
DSOs do not have the right to dispatch, excepts in special cases, but can influence the
location of new generators.

193
The DSO has a role in the location of new generation plants, which it proposes with a
view to minimise connections and network expansion.
5.3. Metering
Key issues regarding metering, and the role of the DSOs, are set out in the following
table.
Table 40: Key approach to metering
Issue Approach adopted
Discos role in metering Own (normally, not by law) and operate the meters
Monopoly services in the metering Yes
Smart metering functionality (see below)
There were 237,085 smart meters installed by the end of 2013.
The plans for smart meter deployment are as follows:
‐ till 2015 10 %
‐ till 2017 70%
‐ 2019 95 % of all consumers (5.7 million)
The main features of the smart meters will be:
a) quarter‐of an hour measurement,, but only in case the customers do agree to this
b) remote reading
c) remote disconnection/reconnection of customers
d) remote control of the maximum power that can be withdrawn
e) remote operation of appliances at the consumer's premises
f) local port to send real time consumption, but only in case the customers do agree to this
information to a local screens or computers
These features and the deployment plan are required by an Ordinance of the Ministry
for Economic Affairs.
There is no distinction between consumer categories.

194
Country Report – Austria (gas distribution)
1. Overview of the distribution sector
1.1. Institutional structure and responsibilities In Austria there are 20 distributors supplying electricity to 1,35 million customers
covering about one third of the population, with a network of about 36000 Km. Total
distribution in 2013 amounted to about 84 TWh.
Detailed information about unbundling status is not available. The general requirement
is that DSO over 100000 customers are legally unbundled, but smaller ones may be also
legally unbundled.
Smaller DSO with less than 100000 customers cover 8% of total demand.
Table 41: DSO characteristics
Total number DSOs
Ownership unbundled
Legally unbundled
Less than 100,000 customers
Exemption* Share of
total deman
d
Country 20 9 14 NA NA
*exemption from distribution network charges for certain types of grid users, such as low‐carbon generation connected to distribution networks.
The responsibility for setting the principle and the calculation methodology of
distribution tariffs, as well as for approving their values, belongs to the regulatory
authority (E‐Control). The determination of tariffs involves a two‐step procedure: at
first, costs and volumes are approved by the board of directors of E‐Control, providing
the base for tariff determination. At second, the E‐Control Commission is responsible for
tariff determination (incl. tariff structure decisions). The E‐Control Commission consists
of different members of the National Chambers (representing interests of stakeholders,
In Austria, the electricity distribution sector is rather fragmented with a relatively
large (over 100) number of small DSOs, and few large federal state operators as well
as some centered in the cities. The sector is fully regulated. The regulator has a
peculiar structure, with an independent external Commission required to approve
the main tariff related decisions. This Commission also acts as an appeals body with
certain competences (no tariff related appeals).

195
representing companies’ and workers’ interests). The E‐Control Commission is
appointed by the government based on the proposal of the federal minister of science,
research and economy (§10 E‐Control law). Decisions have to be taken by majority vote.
The Commission is responsible for tariff determination (including tariff structure) but is
(no longer ‐ since 1.1.2014) the main appeals body for tariff related decisions regarding
the tariff ordinance. Besides tariff setting, it is for example responsible for dispute
settlement, standard terms and conditions for DSOs, etc.
The breakdown of responsibilities as it related to tariff setting is summarized in the table
below.
Table 42: Legal basis for tariff structure – Roles and Responsibilities in setting distribution tariffs
Actor Allowed revenues (tariff level)
Tariffs (tariff structure) Connection charges
DSO Providing opinions Providing opinions
Government Issues principles Issues principles Issues principles
NRA (Board of Directors and E‐Control Commission
Board of Directors: Cost and volume approval
E‐Control Commission: approves tariffs sets principles for tariff structure
Principles set by law. Amount is determined by E‐Control Commission.
(*) subject to E‐Control Commission approval
The regulatory process adopted to set distribution tariffs involves the following steps:
4. E‐Control Commission issues one consultation draft of the network tariff Ordinance.
5. Afterwards comments are discussed with the E‐Control Commission.
6. Finally the Ordinance is published. Its effective date is (usually) always the 1st of
January.
1.2. Key figures on revenue and tariffs
Distribution revenues in Austria in 2013 were € 541,5 million.
A breakdown of revenue by customer category, including information on available tariff
components and the number of customers in each category is set out in the table below.
In Austria there are 3 network levels, of which 2 belong to distribution:
‐ Level 2: Pressure delivery over 6 bar
‐ Level 3 Pressure delivery under 6 bar
Table 43: Tariff components, customers and revenues per customer class
Customer classes Tariff components Number of customers Revenue
Level 2 KWh, KWh/h 352 85,1 MM€
Level 3 KWh, KWh/h 1348660 456,5 MM€
Total 1349012 541,5 MM€

196
There are four system tariff components, but in fact only the system utilisation charge
(Systemnutzungsentgelt), covers cost of constructing, expanding, maintaining and
operating the system, including the costs arising in connection with installing and
operating meters as well as their calibration and meter reading at injection and
withdrawal points, except at customer facilities.
Other tariff components are related to connections and metering and are therefore
discussed in the next sections.
System utilization charges are segmented by network (delivery pressure) level,
measurement, consumption level and geographical zone. Since there are 2 network
levels, 2 measurement types (for level 3 only: with or without hourly peak measure), 9
geographical zones (the 9 Austrian Provinces or Länder) and 10 consumption blocks,
there are more than 300 values.
The cascading approach is adopted to allocate costs between customer categories with
the following key features. Costs are cascaded from the transmission level (Level 1), up
to a maximum of 70%, and from level 2 to level 3 within distribution.
BY NRA’s decision, costs are allocated for 70% to the capacity or fixed sub‐components
and for 30% to the energy related sub‐components.
Commodity related charges are differentiated by province and consumption block,
whereas fixed and capacity related charges only by province. Smaller customers pay a
fixed charge rather than a capacity related one. Large customers (with peak over
400,000 kWh/h), connected to level 2, can also opt for a different combination,
featuring higher energy‐related and lower capacity related sub‐components. This is
particularly useful for a flexible use of peak‐shaving power stations.
A discount of the capacity charge applies to industries consuming between March and
October only.
Tariffs by connection levels and consumption block are shown in the Table below.
Ranges are shown for subcomponents that are differentiated by province.
Table 44: Breakdown of annual charges – typical customer types (network area lower Austria), 2013 (€)
Zone Consumption block (kWh/year)
Network level
Energy related charge range (€c/kWh)
Capacity related charge range (€/kWh/h/year)
Fixed Charge (€/year)
A 0 – 5000 2 0,06 2,7 – 5,4 ‐
B 5001 – 10000 2 0,06 2,7 – 5,4 ‐
C 10001 – 100000 2 0,06 2,7 – 5,4 ‐
D 100000001 – 200000000 2 0,05 2,7 – 5,4 ‐
E 200000001 – 900000000 2 0,05 2,7 – 5,4 ‐
F From 900000001 2 0,05 2,7 – 5,4 ‐
1 0 3 1,6 ‐ 30

197
Zone Consumption block (kWh/year)
Network level
Energy related charge range (€c/kWh)
Capacity related charge range (€/kWh/h/year)
Fixed Charge (€/year)
2 40 3 1,0 ‐ 30
3 80 3 0,9 ‐ 30
4 200 3 0,9 ‐ 30
A 0 – 5000 3 0,37 4,5 ‐
B 5001 – 10000 3 0,16 4,5 ‐
C 10001 – 100000 3 0,03 4,5 ‐
D From 100000001 3 0,03 4,5 ‐
Figure 27: Average network charges (€c/kWh), 2013
2. Regulation of distribution activities
2.1. General overview
The role of the DSO in Austria is to provide and operate a distribution network able to
cover the demand of the connected customers. Both CAPEX and OPEX are subject to
regulation with benchmarking performed on TOTEX. The NRA (Board of Directors and
Commission) sets the principles, issues the methodology and approves network tariffs
(see two‐step procedure described above).
There are no formal end user price controls and the market is fully open. The distribution tariff is itemized separately to end‐users, within the same bill.
Key features of the regulatory regime are set out in the following table

198
Table 45: Main features of the regulatory regime
Issue Approach
Type of regime (concession/licence) Competencies are delegated to Austria’s provinces
Regulatory period (cost determination principles)
5 years
Validity of tariff ordinance 1 year
Form of determination (distributor propose/regulator decide)
Regulator decides
Scope for appeal regarding cost and volume determination
Federal administrative court
2.2. Main incentive properties of the distribution regulatory model
Allowed (controllable) costs/revenues are subject to an RPI‐X annual adjustment, where
X is composed of a general (Xgen) and an individual component (Xind). Certain factors
are used to take into account the expansion of services during the regulatory period.
New investments (CAPEX) are treated within a so‐called “investment factor” and an
“operating cost factor” accounts for changes in OPEX‐levels during the regulatory
period. Tariffs are calculated by the NRA based on regulated costs and are set by a
yearly tariff ordinance.
The individual X‐factor is determined via benchmarking. A TOTEX benchmarking
approach is applied, involving standardised CAPEX and using DEA and MOLS techniques.
Xgen is determined via a TFP calculation (Thornquist Index).
The WACC structure involves a goal capital structure of 40% equity and 60% debt. If the
actual equity ratio of a company is more than 10% below 40%, the actual equity rate will
be used
At the same time the following tools are provided to mitigate risks:
‐ Recalculation happens to avoid the t‐2 problem in cost recognition;
‐ Recurring recalculation of “planned” and “actual” expansion factors reflecting OPEX and
CAPEX divergences. The system works similarly to the mechanism of the regulatory
account;
‐ DSOs might call for a rate revision on the basis of extraordinary events – these cases will
be treated on a case by case basis and will be subject to an audit procedure
There is a quality element in the tariff regulatory formula, but it is currently set to zero.
However, various quality standards are defined and monitored (based on an
ordenance).
2.3. Determination of cost of service parameters
The approach to determining key cost of service parameters are summarized in the
following table.

199
Table 46: Approach to key cost of service parameters
Parameter Approach
Form of price control Price‐cap
Regulatory asset base Tangible and non‐tangible assets (no working capital), based on book values
Capital expenditure (Controllable) CAPEX are subject to benchmarking, changes (basis is the audit year) during the regulatory period are reflected within a so‐called “investment factor”.
Approach to operating expenditure (Controllable) OPEX are subject to benchmarking, changes in service provision (metering points, network length) with the audit year as reference, are reflected in a so‐called “operating cost factor”
Form of WACC applied Nominal, pre‐tax
Additional revenue items (where applicable) Costs of smart metering, non‐controllable costs.
The following formula is applied in determining the WACC:
WACCpre‐tax = D * (Rf + DP) + E * (Rf + eβ*RP) / (1‐T)
Where:
‐ Risk‐free rate (%) Rf ‐ Debt premium (%) DP ‐ Pre‐tax cost of debt (%) CofD = Rf + DP ‐ Asset beta aβ ‐ Equity beta eβ = aβ*(E+D*(1‐T))/E ‐ Risk premium (equity, market) (%) RP ‐ Pre‐tax cost of equity (%) CofEpre = Rf + eβ*RP ‐ Post‐tax cost of equity (%) CofEpost = CofEpre*(1‐T) ‐ Equity (share) E ‐ Debt (share) D = 1 ‐ E ‐ Pre‐tax WACC, nominal (%) WACCpre = D * CofD + (E*CofEpost)/(1‐T)
No further information is provided. Criteria for the calculation of parameters are not
published.

200
3. Tariffs for distribution services
3.1. Distribution tariffs
Table 47: Approach to key issues in setting distribution tariffs
Issue Approach
Treatment of distribution losses Own tariffs for losses
Presence of uniform tariffs For ultra‐high voltage only
Presence of non‐linear tariffs Yes (degressive)
Presence of regulated retail tariffs No
Presence of social tariffs No
3.2. Connection charges Connection charges include:
‐ System admission charge, covering costs of direct connection, set by the DSOs. Thy are
uniform for small customers.
‐ System provision charge covering further network reinforcement costs that may be
necessary for connection. Currently set by the regulator at 3 €/kWh/h.
Table 48: Summary of key issues relating to connection charges
Issue Approach
Determination of charges
Type of charges (shallow/deep) Deep
Methodology adopted Admission charge negotiated, provision charge regulated
Hosting capacity Scope to refuse connection Only if capacity inadequate or connection of new customer not cost‐efficient
Requirements to publish hosting capacity
No
Targets and/or incentive schemes to enhance hosting capacity
No
4. Distribution system development and operation
System development is decided by DSOs, which must satisfy demand and are subject
to capital cost monitoring and benchmarking. However the NRA does not approve
their investment plans.

201
4.1. Distribution system development
The key features of distribution system planning are summarized below.
Table 49: Approach to distribution planning
Issue Approach
Form of distribution planning document No DSO development plans are foreseen. Entry capacities requirements implicit in transmission development plans.
Key responsibilities for its development DSO
Degree of integration with renewables plan No specific relationship
Relationship with consumption trends No specific relationship
Relationship with quality of service targets No specific relationship
How trade‐offs between network development and alternative technologies are treated
No specific relationship
Requirements to integrate cost benefit analysis
No specific relationship
4.2. Metering
Key issues regarding metering, and the role of the DSOs, are set out in the following
table.
Table 50: Key approach to metering
Issue Approach adopted
Discos role in metering Own (normally, not by law) and operate the meters
Monopoly services in the metering Yes
Smart metering functionality (see below)
Non hourly metered consumption Published load profiles by DSO
The share of non‐hourly metered consumption is 41%. Only some smart gas meters are installed in Austria. There are no plans for smart meter deployment.

202
Country Report – Cyprus (electricity distribution)
1. Overview of to the distribution sector
1.1. Institutional structure and responsibilities In Cyprus there is 1 distributor supplying electricity to 549448 customers. Summary data
on industry structure is set out below.
Table 51: DSO characteristics
Total number DSOs
Ownership unbundled
Legally unbundled
Less than 100000 customers
Exemption* Share of total demand
Country 1 N.a. N.a. 0 Yes, embedded generators do not pay any distribution tariffs
N.a.
*exemption from distribution network charges for certain types of grid users, such as low‐carbon generation connected to distribution networks.
The DSO is owned by the EAC, which is a vertically‐integrated utility and includes the
largest retail company.
The responsibility for setting distribution tariffs is spread between the following
jurisdictions (for example):
The DSO calculates the allowed revenue
The NRA issues a methodology; and approves or not the DSO´s calculated proposal of
allowed revenue
Government issues the principles in primary law
The breakdown of responsibilities as it related to tariff setting is summarized in the table
below.
There is only one DSO operating in Cyprus, and it is part of the country´s vertically‐
integrated utility.
The NRA is responsible for approving the allowed tariffs (revenues) of the DSO, as well
as the tariff structures and connection costs. The DSO develops proposals for each of
these components, for the NRA.

203
Table 52: Legal basis for tariff structure – Roles and Responsibilities in setting distribution tariffs
Actor Allowed revenues (tariff level)
Tariffs (tariff structure)
Connection charges
DSO Calculates the allowed revenue
Prepare a tariff proposal and submit it to the NRA for their approval
Calculates for NRA approval
Government Defines main principles in primary law
Not involved Not involved
NRA Sets the tariff calculation methodology, and approves (or not) the DSO´s proposed allowed revenues
Prepares the tariff methodology (issued as a regulation)
Approves (or not) the DSO´s proposal
X = main responsibility; other options to fill the table: sets rules; monitors ex‐post; defines main principles;
calculates for NRA approval; also involved;
The regulatory process used for setting distribution tariff structures is that the NRA
prepares the tariff methodology, which is issued as a regulation. The DSO, in
collaboration with other departments of the incumbent (EAC), prepare a tariff proposal
which is submitted to the NRA for their approval.
A consultation process is used within tariff decisions. Specifically, the NRA issues one
consultation paper and held public hearings.
1.2. Key figures on revenue and tariffs Distribution revenues in Cyprus in 2013 were € 91,96 million. A breakdown of this total
amount between different distribution activities is not available at the current time. In
fact, the NRA is currently in the process of unbundling the accounts of the vertically‐
integrated company and of implementing a revised Electricity Tariffs Methodology.
A breakdown of revenue by customer category, including information on available tariff
components and the number of customers in each category is set out in the table below.
Table 53: Tariff components, customers and revenues per customer class
Customer classes Tariff components Number of customers Revenues
Domestic KWh, fixed charge 428616 33,9 million
Industrial KWh, fixed charge 10222 13,7 million
Commercial KWh, fixed charge 84695 39,2 million
Public lighting KWh, fixed charge 10365 2,1 million
Water pumping KWh, fixed charge 15280 3,0 million
Total ‐ 549448 91,96 million
The breakdown of energy volumes and distribution revenue by customer category are
set out in the charts below.

204
Figure 28: Proportion of energy and revenue accounted by customer categories
As can be seen from the figures above, according to the NRA the allowed revenues of
each customer category in 2013 exactly matched the energy consumption shares of
each category.
Customer categories are defined as follows:
Domestic – where the electricity is solely used for domestic purposes to private
dwellings;
Commercial – where the electricity is solely used for commercial purposes or for any
other purposes related to commerce or profession;
Industrial – where the electricity is for the purpose of electromotive power or
electromechanical or electro‐thermal processes in factories, workshops, foundries,
mills, pumping stations or other industrial installations;
Public lighting – where the electricity is supplied for the purpose of public lighting or
other purposes approved by EAC and it is offered to Municipalities or Local Authorities
or other Public Organisations;
Water Pumping – where the electricity is solely used for water‐pumping, for the purpose
of water supply and/or irrigation and/or drainage of rain water, with restricted hours of
supply.
The typical network tariff in 2013 for residential, small and large industrial customers is
illustrated below:

205
Table 54: Breakdown of annual charges – typical customer types, 2013 (€)
Customer type
Notional Energy usage
Fixed charges Energy charges Demand and reactive charges
Total
Residential 3500kWh 177 545 ‐ 722
Small commercial
50MWh 126 7980 ‐ 8106
Industrial 24000MWh 120 3768000 ‐ 3815049
The resulting average tariffs per kWh are illustrated below.
Figure 29: Average network charges (€cents/kWh), 2013
2. Regulation of distribution activities
2.1. General overview
The distribution sector is regulated under cost‐plus regulatory regime. This regime does
not use incentives and no risk mitigation measures are used.
Key features of the regulatory regime are set out in the following table:
A cost‐plus approach is used to determining allowed revenues, wherein the DSO proposes and
the NRA makes a final decision of approval.
Reasonably‐incurred costs are rolled into the Regulatory Asset Base. A WACC is not used.

206
Table 55: Main features of the regulatory regime
Issue Approach
Type of regime (concession/licence) N.a.
Duration of tariff setting regime N.a.
Form of determination (distributor propose/regulator decide)
DSO proposes and the NRA approves (or not) the proposal
Scope for appeal regulatory decision N.a.
2.2. Main incentive properties of the distribution regulatory model
No regulatory incentives are applied for the DSO. There is no specific quality of service
regulation in place either.
2.3. Determination of cost of service parameters
The approach to determining key cost of service parameters are summarized in the
following table.
Table 56: Approach to key cost of service parameters
Parameter Approach
Form of price control Cost‐plus, without performance incentives
Regulatory asset base Reasonably‐incurred costs are included in the RAB (based on actual costs). No benchmarking of costs.
Capital expenditure Historic costs, no benchmarking, no ex ante approval of CAPEX investments
Approach to operating expenditure Cost‐plus on incurred OPEX costs
Form of WACC applied No WACC is applied. A fixed 6% rate is used
Additional revenue items (where applicable) N.a.
The regulatory period for setting tariffs is 5 years. At the end of each year an ex post
assessment is performed and distributions tariffs are revised if necessary. Investments
of the DSO are not required to obtain ex ante approval from the NRA.
In assessing the DSO´s investment requirements, the NRA checks the reasonableness of
the investment requirements and approves accordingly.
The regulator is allowed to include, in the DSO´s RAB, the investments that are
determined to be necessary for the operation of the business. If any investments are
considered to be unnecessary they may be excluded. However, this has not happened
before.
3. Tariffs for distribution services
All customer groups pay a charge on energy which is effectively uniform, and tariffs are
linear.
Retail tariffs are regulated for all customers, and there are no social tariffs in effect.

207
3.1. Distribution tariffs In the process of allocating distribution costs to tariffs, the total distribution cost is
allocated on the basis of the estimated (future) amount of kWh sold. All customers pay
the same amount on each kWh consumed. Therefore, there is a fixed charge on energy.
Tariff components are not further split into sub‐components, corresponding to the
different activities carried out by the DSO.
Various other aspects of distribution tariff setting are summarized in the table below.
Table 57: Approach to key issues in setting distribution tariffs
Issue Approach
Treatment of distribution losses Not charged as part of the distribution tariffs
Presence of uniform tariffs Yes
Presence of non‐linear tariffs No
Presence of regulated retail tariffs Yes, retail tariffs are regulated for all customers
Presence of social tariffs No
There are no further components included in the distribution tariffs that do not
correspond to distribution costs.
3.2. Connection charges
Key issues in the setting of connection charges are set out in the table below.
Table 58: Summary of key issues relating to connection charges
Issue Approach
Determination of charges
Type of charges (shallow/deep) In general, connection charges are shallow in nature. In some exceptional cases, charges are deep.
Methodology adopted The connection charges used, and which are approved by the NRA, include: standard costs for distribution equipment and labour, as well as generalised cases based on simulations.
Hosting capacity Scope to refuse connection It must always provide a connection proposal for all consumers and generators
Requirements to publish hosting capacity
It is not obliged to publish all the details of the available capacity in its network; however, it must provide such information in the event that the NRA requests it.
Targets and/or incentive schemes to enhance hosting capacity
None, the DSO is assumed to have a duty to connect all the capacity requiring a connection (and therefore it is assumed that the DSO will naturally implement the necessary measures to ensure that).

208
There is no specific regulation in force that does not hamper investment which implies
additional OPEX (such as smart grid technology, use of demand side flexibility for grid
services, or voltage regulation by decentralised resources, etc.). However, any large
scale implementation of specific plans, e.g. smart grids, requires their cost viability to be
proven through relevant studies.
4. Distribution system development and operation
4.1. Distribution system development
The key features of distribution system planning are summarized below.
Table 59: Approach to distribution planning
Issue Approach
Form of distribution planning document
There is no specific distribution planning document, but the DSO carries out long‐term development studies for specific geographic areas (i.e. cities).
‐ Key responsibilities for its development
N.a.
‐ Degree of integration with renewables plan
In general terms, plans for future RES connections are taken into consideration when they are quantified and known.
‐ Relationship with consumption trends
The likely evolution of consumption is taken into full consideration in the DSOs long‐term analyses (not planning documents).
‐ Relationship with quality of service targets
Quality of service factors (however, not targets) are taken into consideration by the DSO in planning. Particularly, aspects related to reinforcement are considered, that is, improving voltage conditions or security of supply aspects.
‐ How trade‐offs between network development and alternative technologies are treated
No specific treatment in place at the present time.
‐ Requirements to integrate cost benefit analysis
The DSO takes into consideration CBA, but the results are not required to be published.
4.2. Distribution system operations
The key features of distribution system operations are summarized below.
The DSO considers long‐term electricity distribution sector development for certain
regions of the country (in an informal approach), which takes into consideration
likely RES development, and the evolution of consumption.
The DSO is responsible for metering services provision; a pilot study is being
undertaken on smart meters in Cyprus, focusing mainly on net metering of small‐
scale PV power generation.
In 2013 there was no significant level of smart meter installment in the country. The
roll out of smart meters may take place in the future, and the roll out strategy will
likely be informed by the results of pilot studies and trials.

209
Table 60: Approach to distribution planning
Issue Approach
Requirements for dispatch of renewable plants connected to DSO network
DSOs do not have any scope to dispatch embedded RES generators. This requirement falls on the TSO for RES generators above a certain production level
Possibility to dispatch flexible loads No possibility for dispatching flexible loads at the present time
Other sources of flexibility open to DSO A small pilot project being developed for introducing batteries. The study is being led by the distribution system owner.
4.3. Metering
Key issues regarding metering, and the role of the DSOs, are set out in the following
table.
Table 61: Key approach to metering
Issue Approach adopted
Discos role in metering DSO is responsible for metering; the meters are owned by the network owner
Monopoly services in the metering Yes, the (one) DSO active in Cyprus is a monopolist in metering services
Smart metering functionality A pilot study on the use of smart meters in Cyprus is being undertaken, on around 3.000 customers. The exact details of the smart meters being tested are unconfirmed, but it is known that net‐metering of small‐scale RES generation is a key feature of the technology.
In 2013 there was no substantial level of smart meter instalments in the electricity
distribution sector. However, a pilot study was underway. The study was part of a 3‐
country analysis (Cyprus, Slovenia and Portugal) and was mainly focused on analysing
metering technologies for small‐scale solar PV generators feeding power into the
distribution system.
The project, “Promotion of PV energy through net metering optimization” (PV‐NET),
aims to develop better energy policy for the promotion of renewable energies in the
Mediterranean countries, targeting the best and most cost efficient use of PV
technology.
The approach used made use of an optimization tool to help design a best‐practice net‐
metering policy of the region based on various factors. Some factors include the
environmental profile and the electricity consumption patterns of consumers in the
investigated region.
The pilot sites are divided into two parts. The first concerns weather stations, where the
POA irradiance, ambient and module temperature are measured. The other part is the
smart meter solution, where smart‐meters are installed in domestic or public buildings
which own a PV electricity generation system, and measures the electricity consumed

210
and produced. Data are gathered remotely every 15 minutes; the data is stored,
monitored and analyzed. The data is viewable and downloadable online.
The study will later draw conclusions on the efficacy of such technologies, before
developing its tentative advice for the region in terms of the practicability and best
approach for promoting such smart meter applications in Cyprus (and the broader
Mediterranean region).

211
Country Report – Czech Republic (electricity distribution)
1. Overview of to the distribution sector
1.1. Institutional structure and responsibilities In the Czech Republic there are 3 large distribution system operators, each DSO has a
specific area of service and none of them operates in the whole country. Additionally
there are some others small local regional DSO´s.
Total distributed amount of energy in 2013 was 52,3 TWh to 5863 million of customers.
The DSO´s in the Czech Republic have legal unbundling in accordance with the rules of
unbundling laid down in the Article 26 of Directive 2009/72/EC. However for the DSO´s
with less than 90000 connected customers there are no unbundling obligations in place.
Table 62: DSO characteristics
Total number DSOs
Ownership unbundled
Legally unbundled
Less than 90000
customers
Exemption* Share of total demand**
Country 308 0 3 305 N/A 16,81%
*exemption from distribution network charges for certain types of grid users, such as low‐carbon generation connected to distribution networks.
** Share of total demand expresses share of total consumption of energy inside areas of distribution networks with less than 90,000 connected customers to total consumption of energy in the Czech republic.
In The Czech Republic, DSO´s cover all demand because there are not customers connected directly to the transmission network.
According to Energy Act 458/2000 COLL, the responsibility of regulation the prices for
the transmission and distribution of electricity and for system services, as well as
electricity prices for the supplier of last resort shall be regulated by the Energy
Regulatory Office (ERO) hereinafter The NRA.
The breakdown of responsibilities as it related to tariff setting is summarized in the table
below.
In the Czech Republic operates 3 legally unbundled DSO and some other small DSO
with less than 90000 customers that are not unbundling obligations in place. The
main responsible of regulation and tariff setting is the NRA.

212
Table 63: Legal basis for tariff structure – Roles and Responsibilities in setting distribution tariffs
Actor Allowed revenues (tariff level)
Tariffs (tariff structure)
Connection charges
DSO
Government
NRA X X X X = main responsibility; other options to fill the table: sets rules; monitors ex‐post; defines main principles;
calculates for NRA approval; also involved;
1.2. Key figures on revenue and tariffs Distribution revenues in 2013 were € 1179 million, broken down by the following
activities:
Depreciation – 361,953 € million (30,7%)
Profits –301,824 € million (25,6%)
Allowed cost – 515,223 € million (43,7%)
The allowed cost can be divided to:
Operation and management of the distribution system – 166,932 € million (32,4%)
Repairs and maintenance– 165,387 € million (32,1%)
Metering – 83,466 € million (16,2%)
Customer management– 49,977 € million (9,7%)
Strategy and planning of development and renovation of distribution system – 49,491 €
million (9,6%)
Distribution tariff are defined by voltage levels:
High Voltage
Medium Voltage
Low Voltage. Consumer categories in LV are divided in LV residential (D) and other LV
consumer (C). Consumer categories on LV are further divided according to main use of
electricity consumed ( C01d, C02d, … C62d for LV and D01d, D02d, … D61d for LV
residential)
Each tariff has the following components:
Monthly Capacity charge: based on the rated current of contractual capacity for HV and
MV, and the main circuit breaker upstream of the electricity meter for LV.
(CZK/MW/month for HV and MV customers and CZK/A/month for LV customers)
Distributed Energy charge: based of the quantity of energy distributed. (CZK/ MWh).
A breakdown of revenue by customer category, including information on available tariff
components and the number of customers in each category is set out in the table below.

213
Table 64: Tariff components, customers and revenues per customer class
Customer classes Tariff components N. of customers Revenue (€ million)
High Voltage Capacity charge (CZK/MW.month), Distributed Energy (CZK/ MWh)
127 50,395
Medium Voltage Capacity charge (CZK/MW.month), Distributed Energy (CZK/ MWh)
25433 446,800
Low Voltage Others‐ C01d Capacity charge (CZK/MW.month), Distributed Energy (CZK/ MWh)
259799
485,585
Low Voltage Others‐ C02d Capacity charge (CZK/MW.month), Distributed Energy (CZK/ MWh)
267218
Low Voltage Others‐ C03d Capacity charge (CZK/MW.month), Distributed Energy (CZK/ MWh)
15299
Low Voltage Others‐ C25d Capacity charge (CZK/MW.month), Distributed Energy (CZK/ MWh)
119874
Low Voltage Others‐ C26d Capacity charge (CZK/MW.month), Distributed Energy (CZK/ MWh)
8846
Low Voltage Others‐ C27d Capacity charge (CZK/MW.month), Distributed Energy (CZK/ MWh)
0
Low Voltage Others‐ C35d Capacity charge (CZK/MW.month), Distributed Energy (CZK/ MWh)
1830
Low Voltage Others‐ C45d Capacity charge (CZK/MW.month), Distributed Energy (CZK/ MWh)
53304
Low Voltage Others‐ C55d Capacity charge (CZK/MW.month), Distributed Energy (CZK/ MWh)
434
Low Voltage Others‐ C56d Capacity charge (CZK/MW.month), Distributed Energy (CZK/ MWh)
1433
Low Voltage Others‐ C62d Capacity charge (CZK/MW.month), Distributed Energy (CZK/ MWh)
36047
Low Voltage Residential D01d Capacity charge (CZK/MW.month), Distributed Energy (CZK/ MWh)
689587
721,782
Low Voltage Residential ‐ D02d Capacity charge (CZK/MW.month), Distributed Energy (CZK/ MWh)
2753015
Low Voltage Residential ‐ D25d Capacity charge (CZK/MW.month), Distributed Energy (CZK/ MWh)
1076816
Low Voltage Residential ‐ D26d Capacity charge (CZK/MW.month), Distributed Energy (CZK/ MWh)
72870
Low Voltage Residential ‐ D27d Capacity charge (CZK/MW.month), Distributed Energy (CZK/ MWh)
3
Low Voltage Residential ‐ D35d Capacity charge (CZK/MW.month), Distributed Energy (CZK/ MWh)
12675
Low Voltage Residential ‐ D45d Capacity charge (CZK/MW.month), Distributed Energy (CZK/ MWh)
420344
Low Voltage Residential ‐ D55d Capacity charge (CZK/MW.month), Distributed Energy (CZK/ MWh)
5997
Low Voltage Residential ‐ D56d Capacity charge (CZK/MW.month) , Distributed Energy (CZK/ MWh)
35385
Low Voltage Residential ‐ D61d Capacity charge (CZK/MW.month), Distributed Energy (CZK/ MWh)
7146
Total ‐ 5863482 1704,562

214
Currency rate used CZK/EUR: 27,82 (21. August 2014). Revenues showed by consumer class include TSO
revenues.
Above revenue data for consumer class is from DSO with more of 90000 customers (3 DSO´s) in
2013. This revenue includes allowed revenues of DSOs, TSO (which is in effect a pass‐through
cost within DSOs’ allowed revenue) and allowed cost of losses in systems. These revenues were
paid by costumers in price for reserved capacity and price for distributed energy
The breakdown of energy volumes and distribution revenue by customer category are
set out in the charts below.
Figure 30: Proportion of energy and revenue accounted by customer categories

215
The figure above shows that the households (LV‐ Residential) pay on average less than
small commercial users (LV‐Others).
The typical network tariff in 2013 for LV‐Residential, LV‐ Others and industrial customers
is illustrated below:
Table 65.1: Breakdown of annual charges – typical customer types, 2013 (Kč, prices without VAT)
Customer type
Tariff Average
Energy usage
Fixed charge (Average of DSO prices )
Capacity charge
(Average of DSO prices )
Distributed Energy charge
Total
LV residential
Tariff D 02d; circuit breaker over 3x20A up to 3x25A, inclusive 2300 kWh 959 x 4185 5144
LV other
Tariff C 02d; circuit breaker over 3x20A up to 3x25A, inclusive 4123 kWh 1333 x 9515 10848
Industrial consumer, connected to MV. (Average contractual capacity per consumer is 0.22 MW). 870 MWh x 409035 69664 478699
Data provided by national regulator according to the average energy usage in the country.
For ease of comparison, the Table is also reported in Euros.
Table 65.2: Breakdown of annual charges – typical customer types, 2013 (€, prices without VAT)
Customer type
Tariff Average
Energy usage
Fixed charge (Average of DSO prices )
Capacity charge
(Average of DSO prices )
Distributed Energy charge
Total
LV residential
Tariff D 02d; circuit breaker over 3x20A up to 3x25A, inclusive 2300 kWh 36,92 x 161,11 198,03
LV other
Tariff C 02d; circuit breaker over 3x20A up to 3x25A, inclusive 4123 kWh 51,32 x 366,30 417,61
Industrial consumer, connected to MV. (Average contractual capacity per consumer is 0.22 MW). 870 MWh x 15476,47 2681,83 18428,30
1€ = 25.9763 CZK (Average 2013)

216
The resulting average tariffs per kWh are illustrated below.
Figure 31.1: Average network charges ( Kč/kWh), 2013
For ease of comparison, the figure is also reported in cent of Euros.
Figure 31.2: Average network charges (€ Cent /kWh), 2013

217
2. Regulation of distribution activities
2.1. General overview
The Act 458/2000 COLL provides the main rules of the whole Energy Sector, including
electricity distribution. The Act establishes that to develop business activities in the
energy sector as distribution activities a government authorisation in the form of a
licence granted by the Energy Regulatory Office is required.
According to section 25, the DSO´s shall: “Provide reliable operation and development of
the distribution system in the territory delineated by the licence; Enable electricity
distribution on the basis of concluded contracts; and Control the electricity flows within
the distribution system while respecting electricity transmissions between other
distribution systems and the transmission system, doing so in co‐operation with
operators of other distribution systems and the transmission system operator”.
The NRA (Energy Regulatory Office‐ ERO) is the administrative authority to regulate the
energy sector. “The mission of the Energy Regulatory Office is to support economic
competition, to support the use of renewable and secondary energy sources, and to
protect consumers’ interests in those areas of the energy sector where competition is
impossible, with the aim to meet all reasonable requirements for the supply of energy”.
The distribution activities are regulated under a licence regime. The DSO licence is for a
maximum of 25 years period. The NRA should revoke a licence to the holder in some
cases, detailed in Section 10 of the Energy Act.
The broad regulatory model implement in the Czech Republic is a mix of “cost
reimbursement” and “incentive based”. Capital costs are subject to “cost
reimbursement”, while operating cost are subject to a “revenue cap” system.
Key features of the regulatory regime are set out in the following table
Table 65: Main features of the regulatory regime
Issue Approach
Type of regime (concession/licence) Licence. Maximum 25 years period
Duration of tariff setting regime Regulatory period is set for 5 years. However the tariffs are setting annually.
Form of determination (distributor propose/regulator decide)
Regulator decides
Scope for appeal regulatory decision No
The distribution sector is regulated under a mix of cost reimbursement and incentive
based model.
DSO operates in a licence regimen. Licences are not allocated through competition;
every DSO who meets the requirements will get the licence
The model ensures to DSO achieve the allowed revenues. The regulatory system
does not place volume risk or market conditions risks on the DSO.

218
2.2. Main incentive properties of the distribution regulatory model
The following key regulatory incentives apply for the DSOs:
Revenue CAP for operating costs of DSO
Losses. A percentage of losses are fixed for whole regulatory period. If DSO is able to
decrease the percentage of losses within the regulatory period, it will be allowed to
obtain additional revenues. If the percentage of losses within the regulatory period
increases, DSO will bear additional costs.
Quality of service. If DSO achieves better parameters of SAIFI and SAIDI, it will receive
additional revenues and vice versa.
Unauthorized consumption ‐ DSO is allowed to receive additional revenue from detected
unauthorised consumption
The allowed revenue is balanced with a two‐year lag. There is an ex‐post regulatory
account (called correction factor) for allowed revenues; the difference between actual
and allowed revenue is settled two years later (year+2)
At the same time the following tools are provided to mitigate risks:
The regulatory framework may be altered during the regulatory period in case the
electricity market conditions or general economic situation change significantly
compared to the original situation.
The cost base for each subsequent regulatory period is set based on actual costs
incurred in a certain period of the previous regulatory period.
If DSO is able to decrease the percentage of losses within the regulatory period, it will be
allowed to obtain additional revenues. After the end of the regulatory period, the
allowed percentage of losses will decrease and consumers will gain from lower cost for
losses.
Regulatory system does not place volume risk on the DSO. Tariffs are adjusted year to
year through a regulatory account.
Regulatory framework evaluates risk for infrastructure projects as a systematic risk for
DSO using capital asset pricing model. Risk of cost overrun is partly mitigated (CAPEX is
cost‐plus)
Quality service is monitored since 2008 (in the required structure). Since 2013 an
incentive mechanism (based on bonus and penalty) for quality of supply has been
introduced into the regulation. Allowed revenues are increased (decreased) if he DSO
performs better (worse) than predefined quality targets.
There are several guaranteed standards (technical and commercial) that should be met. If
not, a consumer can claim compensation. The compensation is not automatic. Consumer
must apply for compensation.
2.3. Determination of cost of service parameters
The approach to determining key cost of service parameters are summarized in the
following table.

219
Table 66: Approach to key cost of service parameters
Parameter Approach
Form of price control Capital costs are subject to “cost reimbursement”, while operating cost are subject to a “revenue cap” system.
Regulatory asset base Before this regulatory period, there was revaluation of assets because of unbundling. The current RAB is based on this revaluated (based on replacement values) book value of assets and is not further indexed
Capital expenditure There is no approval process of investment in the regulation.
There is no methodology implemented by the regulator to assess the DSO investment requirements
Approach to operating expenditure OPEX of regulated subjects is compared only in special cases.
There are not different costs assessment for some activities or special projects
Form of WACC applied Nominal, pre‐tax WACC
Additional revenue items (where applicable) Not applicable
The following formula is applied in determining the real‐pre‐tax WACC:
ED
DR
ED
E
T
RWACC D
E
1
Where:
RE: is the real price of equity and own funds calculated according to the formula:
ERPRR LFE
RD: is the cost of debt. The regulator calculated the value for the year 2014 (3.78%).
RF is profitability of an risk‐free asset, calculated average revenue from 10+ year
government bonds issued in between May 2012 and April 2013 for the year 2014 at
2.3%,
The NRA set ERP as the sum of the basis ERP and the Czech Republic´s risk premium.
In the years of III. regulatory period the Czech Republic´s risk premium has been set on
the basis of the published data on the basis points of default spread from Professor
Damodaran’s database and in relation to the then current rating of the Czech Republic.
The value of the basis ERP is 5% for whole III. regulatory period. For 2014, the risk
premium for the Czech Republic is 0,85%
βL is weighted ratio β, which defines the sensitivity of a company share to the market
risk, taking into account the income tax rate and the debt share, calculated according to
the formula:
E
DTUNLEVL )1(1

220
Bunleverage. The regulator calculated the value for the regulatory period (0.35).
T is the effective tax shield. The Authority will apply during the III. Regulatory period
always effective tax rate. In 2014, the applied tax rate of 19%.
The debt leverage (Ratio E/D) is set at target considered as efficient by the regulator.
The ratio of debt for distribution and activities in electricity and GAS is 40% in favor of
foreign capital (Debt)
Every year for applicable price indices, capital costs (depreciation allowance, WACC, RAB
adjustment for activated investment and depreciation), pass through OPEX (price of
electricity to cover losses) are revised and assessed the allowed revenues. Once for a
regulatory period for OPEX, X‐factor, and amount of electricity to cover losses are revised.
3. Tariffs for distribution services
3.1. Distribution tariffs The regulator is in charge of setting the distribution tariffs (based on allowed revenues).
Two categories of costs are identified:
Modified allowed revenues (HV, MV, and LV) are recovered through reserved capacity
[CZK/MW and month].
Allowed costs of losses (HV, MV, LV) are recovered through distributed energy
[CZK/MWh]
There are four classes of consumers: HV, MV, LV residential, and other LV consumers:
HV and MV consumers are charged a distribution tariff including components:
o "Per capacity reservation" component equal for all consumers in the same class
(CZK/MW and month)
o "Per usage of network" component equal for all consumers in the same class
(CZK/MWh)
LV consumers are charged a distribution tariff including components:
o "Per capacity reservation" component equal for all consumers in the same class
(CZK/A of circuit breaker and month)
o per consumption ‐ KWh charge.
There are some tariffs when the energy component is different in peak and off‐peak
times, in order to reflect the degree of utilization of shared distribution network assets.
The start and end of off peak periods during the day are decided by each DSO based on
The regulator is in charge of setting the distribution tariffs (based on allowed revenues).
The methodology to allocate distribution costs is based in the reserved capacity distributed
energy.
There are four classes of consumers: HV, MV, LV residential, and other LV consumers.
In the Czech Republic, Connection fee was defined by the regulator and hasn't changed since
2006. The customers pay a fixed fee depending of the type of connection.

221
grid conditions and activated via remote control system; the total duration of off‐peaks
per day has to amount to the value set out in the tariff specifications. The tariff category
the customer is eligible for depends on the type of appliances they use. In LV residential
are 8 tariffs from 10 have off peak and LV other are 7 tariffs from 13 have off peak.
The details of distribution tariff by voltage class and their components are summarized in
section 1.2 Key figures on revenue and tariffs.
Various other aspects of distribution tariff setting are summarized in the table below.
Table 67: Approach to key issues in setting distribution tariffs
Issue Approach
Treatment of distribution losses Allowed costs of losses are recovered through distributed energy component
Presence of uniform tariffs The tariff structure applies across the country. However each DSO charges different tariff set by the regulator
Presence of non‐linear tariffs No, all tariff components are linear.
Presence of regulated retail tariffs No
Presence of social tariffs No
Generators connected to the distribution grid do not pay any distribution tariff. There are
not special incentives in network tariffs for large users like power plants.
The distribution tariffs are published at next links:
http://www.eru.cz/documents/10540/486799/ERV10_2012.pdf/560c98e4‐2b99‐453d‐
9917‐7c09a30015aa
http://www.eru.cz/documents/10540/486799/ERV9_2012.pdf/88d058cb‐3c2a‐40a4‐
aea4‐fef5450c7f46
3.2. Connection charges Key issues in the setting of connection charges are set out in the table below.
Table 68: Summary of key issues relating to connection charges
Issue Approach
Determination of charges
Type of charges (shallow/deep) There is just fee for connection. This fee has no direct connection with real price of connection. The fee was determined to cover approximately half of the average connection cost.
Methodology adopted to determine connection costs
Connection fee was defined by the regulator and hasn't changed since 2006. Depending of the kind of connection to grid (HV,VHV,LV level) and type of connection (A, B, 3 Phase, 1 Phase), the customers pay a fee (CZK /MW on HV and MV, CZK/A on LV).
Hosting Scope to refuse connection The DSO´s may refuse connection to

222
Issue Approach
capacity the distribution of consumer or generator in case of lack of capacity
Requirements to publish hosting capacity No
Targets and/or incentive schemes to enhance hosting capacity
The DSO is assumed to have a duty to connect all the renewable capacity that applies for connection except lack of capacity in the area. There are not incentive schemes to enhance hosting capacity
The connection fee is set by the NRA. For information about connection fee, see the table
below:
Connection to grid Type of connection Customers payment
TSO grid 200000 CZK/MW
DSO grid vhv level Type A 600000 CZK/MW
DSO grid vhv level Type B 150000 CZK/MW
DSO grid hv level Type A 800000 CZK/MW
DSO grid hv level Type B1 200000 CZK/MW
DSO lv level 3 Phase 500 CZK/A
DSO lv level 1 Phase 200 CZK/A
The difference between type A connection and type B/B1 connection are simply in the
range of changes in the grid. When DSO has to build new infrastructure, then charge the
customer by type A price. When DSO can connect customer to the existing grid then
charge the customer by type B/B1 price.
More information is available in next link (Czech Only): http://www.eru.cz/cs/‐/vyhlaska‐c‐51‐2006‐sb‐
4. Distribution system development and operation
4.1. Distribution system development
The key features of distribution system planning are summarized below.
In the Czech Republic, the DSO´s do not have to notify their Network Development Plans.
Only TSO development plans are submitted and approved by the NRA.
DSOs have full responsibility for metering and own the meters.
A cost‐benefit analysis of smart meters done in the Czech Republic, showed negative
results. There are not Smart meters implemented in the network on LV except pilot
projects.

223
Table 69: Approach to distribution planning
Issue Approach
‐ Form of distribution planning document Network development plans are not notified to the regulator. Only TSO publishes development plans.
‐ Key responsibilities for its development Not applicable. There is not DSO network plan.
‐ Degree of integration with renewables plan Not applicable. There is not DSO network plan.
‐ Relationship with consumption trends Not applicable. There is not DSO network plan.
‐ Relationship with quality of service targets Not applicable. There is not DSO network plan.
‐ How trade‐offs between network development and alternative technologies are treated
Not applicable. There is not DSO network plan.
‐ Requirements to integrate cost benefit analysis
Not applicable. There is not DSO network plan.
4.2. Distribution system operations
The key features of distribution system operations are summarized below.
Table 70: Approach to distribution planning
Issue Approach
Requirements for dispatch of renewable plants connected to DSO network
Smaller embedded generators (like residential PV) are not dispatched. Larger embedded generators are dispatched technically by the DSO asked by system operator.
Possibility to dispatch flexible loads Yes, the DSO can directly control flexible loads through remotely operated switches
Other sources of flexibility open to DSO Yes, the DSO can use a remote (ripple) control system to switch on or off participating appliances
4.3. Metering
Key issues regarding metering, and the role of the DSOs, are set out in the following
table.
Table 71: Key approach to metering
Issue Approach adopted
Discos role in metering DSOs have full responsibility for metering and for the installation, calibration and maintenance of metering. DSO owns the meters or its service company owns the meters..
Monopoly services in the metering Yes
Smart metering functionality Smart Meters are under discussion.
A cost‐benefit analysis performed in accordance with directive 2009/72/EC has shown
negative results. The Czech Republic does not have plans for a large‐scale rollout of
smart meters. Smart Meters have so far been only deployed on the LV level as part of
pilot projects. HV and MV level and all producers of electricity are metered by industrial
meters with higher quality of metering and scope of metered data than Smart Meters
offers.

224
Country Report – The Czech Republic
(Gas distribution)
1. Overview of to the distribution sector
1.1. Institutional structure and responsibilities In the Czech Republic are six (in 2013, since 2014 there are three DSOs in the Czech
Republic) regional distributions companies with a total of 61265 km of pipelines
distributed gas. Additionally, there are local DSOs which distribute to delineated areas.
These local DSOs are connected via entry points to the regional distribution system.
Distributions gas companies in Czech Republic have legal unbundling in accordance with
section 59A “Separate Status of the distribution system operators” Act 458/2000 Coll.
Since 2007, DSO has been in terms of legal form, organization and decision making,
independent of other activities unrelated to gas distribution, gas transmission and gas
storage. However for the DSO´s with less than 90000 connected end customers have not
unbundling obligations in place.
Table 72: DSO characteristics in 2013
Total number DSOs
Ownership unbundled
Legally unbundled (1)
Less than 90000 customers
Exemption*
Share of total demand
Country 79
6
73
*exemption from distribution network charges for certain types of grid users, such as low‐carbon generation connected to distribution networks.
(1) Since 2014 there are 3 large gas DSO (3 companies have merged into one company by the end 2013)
In the Czech Republic, the gas distribution sector is divided in concentrated mainly in
six (in 2013, since 2014 there are three DSOs in the Czech Republic) regional
distribution companies. There are another locals DSO which distributed to delineated
areas.
Since 2007, DSO´s are legal unbundled. However DSO´s with less of 90,000 end
customers have not unbundling obligations in place.
The main responsible of regulation and tariff setting is the NRA. The pricing
methodology is laid down in the NRA public notice and it the same for all DSO.

225
According to Energy 458/2000 COLL, The Energy Regulatory Office‐ERO (Hereinafter the
NRA) is the administrative authority charged with the exercise of regulatory powers in
the energy sector. NRA issues principles in secondary law, define methodology, set
values and calculate the allowed revenue. One of the many responsibilities of the DSO is
prepare and submit to the NRA the data needed for decision on prices charged for gas
distribution.
The tariff (price) decision is published by the NRA once every year. Before publication a
2‐weeks consultation process is started.
The breakdown of responsibilities as it related to tariff setting is summarized in the table
below.
Table 73: Legal basis for tariff structure – Roles and Responsibilities in setting distribution tariffs
Actor Allowed revenues (tariff level)
Tariffs (tariff structure)
Connection charges
DSO
Government
NRA X X X X = main responsibility; other options to fill the table: sets rules; monitors ex‐post; defines main principles;
calculates for NRA approval; also involved;
1.2. Key figures on revenue and tariffs Distribution allowed revenues of all DSO in 2013 were € 564 million, broken down by the
following activities:
Depreciation – 184,992 € million (32,8%)
Profits –153,408 € million (27,2%)
Allowed cost – 225,600 € million (40,0%)
Distribution tariff are defined in two categories by consumer consumption:
Medium and large off take consumers (consumption over 630 MWh/year)
Households and small offtake consumers
A breakdown by customer category, including information on available tariff
components and the number of customers in each category is set out in the table below.

226
Table 74: Tariff components, customers and revenues per customer class
Customer classes Tariff components Number of customers
Revenue
(€ million)
Large offtake customers
Capacity component, Consumption component
1637 203,040
Medium offtake customers
Capacity component, Consumption component
6946
Small offtake customers
Capacity component, Consumption component
201274 100,956
Households Capacity component, Consumption component
2650488 260,004
Total ‐ 2860345 564,000
The breakdown of energy volumes and distribution revenue by customer category are
set out in the charts below.
Figure 31: Proportion of energy and revenue accounted by customer categories

227
The typical network tariff in 2013 for residential, small and large industrial customers is
illustrated below
Table 75: Breakdown of annual charges – typical customer types, 2013 (CZK)
Customer type Notional Energy usage
Capacity component
Consumption component
Total
Households with annual consumption of 15000 kWh
15000 kWh 1467 CZK/year
2731 CZK/year 4198 CZK/year
Industrial Consumer with an annual consumption 50000 MWh and 7000 use hours
50000 MWh 2232541 CZK/year
783000 CZK/year 3015541 CZK/year
Industrial Consumer with an annual consumption 90000 MWh and 7000 use hours
90000 MWh 3687150 CZK/year
1409400 CZK/year 5096550 CZK/year
In the next table, the tariff amounts are in euros.

228
Table 76: Breakdown of annual charges – typical customer types, 2013 (€)
Customer type Notional Energy usage
Capacity component
Consumption component
Total
Households with annual consumption of 15000 kWh
15000 kWh 53 € 98 € 151 €
Industrial Consumer with an annual consumption 50000 MWh and 7000 use hours
50000 MWh 80349 € 28180 € 108529 €
Industrial Consumer with an annual consumption 90000 MWh and 7000 use hours
90000 MWh 132701 € 50724 € 183425 €
The resulting average tariffs per kWh are illustrated below.
Figure 32: Average network charges (€/kWh), 2013

229
2. Regulation of distribution activities
2.1. General overview
The Act 458/2000 COLL provides the main rules of the whole Energy Sector, including
electricity distribution. The Act establishes that to develop business activities in the
energy sector as distribution activities a government authorisation in the form of a
licence granted by the Energy Regulatory Office is required.
According to section 25, the DSO´s shall: “Provide reliable operation and development of
the distribution system in the territory delineated by the licence; Enable electricity
distribution on the basis of concluded contracts; and Control the electricity flows within
the distribution system while respecting electricity transmissions between other
distribution systems and the transmission system, doing so in co‐operation with
operators of other distribution systems and the transmission system operator”.
The NRA (Energy Regulatory Office‐ ERO) is the administrative authority to regulate the
energy sector. “The mission of the Energy Regulatory Office is to support economic
competition, to support the use of renewable and secondary energy sources, and to
protect consumers’ interests in those areas of the energy sector where competition is
impossible, with the aim to meet all reasonable requirements for the supply of energy”.
The distribution activities are regulated under a licence regime. Licences are not
allocated through competition, been every DSO who meet the requirement will get the
licence
The DSO licence is for a maximum of 25 years period. The NRA should revoke a licence
to the holder in some cases, detailed in Section 10 of the Energy Act.
The broad regulatory model implement in The Czech Republic is a mix of “cost
reimbursement” and “incentive based”. Capital costs are subject to “cost
reimbursement”, while operating cost are subject to a “revenue cap” system.
Key features of the regulatory regime are set out in the following table:
The distribution sector is regulated under a mix of cost reimbursement and incentive
based model.
DSO operates in a licence regimen. Licences are not allocated through competition,
every DSO who meet the requirements will get the licence
The model ensures to DSO achieve the allowed revenues. The regulatory system does
not place volume risk or market conditions risks on the DSO.

230
Table 77: Main features of the regulatory regime
Issue Approach
Type of regime (concession/licence) Licence. Maximum 25 years period
Duration of tariff setting regime Regulatory period is usually 5 years
Form of determination (distributor propose/regulator decide)
Regulator decides
Scope for appeal regulatory decision No
2.2. Main incentive properties of the distribution regulatory model
The following key regulatory incentives apply for the DSOs:
The NRA sets cost base for regulatory period (Usually 5 years). Cost base is yearly update
by price indexes and X‐factor.
The difference between set (allowed) costs and actual costs is DSO´s profit or loss. This
incentive to the DSO to a cost optimization.
In addition, targets with premiums and penalties are set on the losses.
The allowed revenue is balanced with a two‐year lag. There is an ex‐post regulatory
account (called correction factor) of allowed revenue, so this difference between actual
and allowed revenue is settled two years later (year+2)
At the same time the following tools are provided to mitigate risks:
The regulatory framework may be altered during the regulatory period in case the
energy market conditions or general economic situation change significantly compared
to the original situation.
The cost base for each subsequent regulatory period is set based on actual costs
incurred in the certain period of the previous regulatory period.
Regulatory system does not place volume risk on the DSO. The allowed revenue target is
set for particular year. If DSO does not obtain or exceed the revenue target in one year
because of different demand revenues are corrected in the following year tariffs
The revenue target is set for particular year. If DSO does not obtain or exceed the
revenue target in one year because of different demand revenues are corrected in the
following year tariffs. The tariff will be adjusted to make up for the missing revenue (two
years later)
Legislation allows to reassess determined parameters for regulatory period or regulatory
year only in exceptional cases (e.g. supply security disruption).
Quality of service is determined by a public notice issued by The NRA. Public notice sets
demanded level of provided service, deadlines for solving customer´s requests and
assesses penalties for Gas market participants. In case the standard is not met the
customer is entitled to a compensation payment which must be requested.
However the quality of service is not related to the distribution tariff system. No
penalties /compensation are implemented in the regulatory framework.

231
2.3. Determination of cost of service parameters
The approach to determining key cost of service parameters are summarized in the
following table.
Table 78: Approach to key cost of service parameters
Parameter Approach
Form of price control Capital costs are subject to “cost reimbursement”, while operating cost are subject to a “revenue cap” system.
Regulatory asset base Before this regulatory period, there was revaluation of assets because of unbundling. The current RAB is based on this revaluated (based on replacement values) book value of assets and is not further indexed
Capital expenditure There is no approval process of investment in the regulation. There is no methodology implemented by the regulator to assess the DSO investment requirements
Approach to operating expenditure OPEX of regulated subjects is compared only in special cases. There are not different costs assessment for some activities or special projects
Form of WACC applied Nominal, pre‐tax WACC
Additional revenue items (where applicable) Not applicable
The following formula is applied in determining the real‐pre‐tax WACC:
ED
DR
ED
E
T
RWACC D
E
1
Where:
RE: is the real price of equity and own funds calculated according to the formula:
ERPRR LFE
RD: is the cost of debt. The regulator calculated the value for the year 2014 (3.78 %).
RF is profitability of an risk‐free asset, calculated average revenue from 10+ year
government bonds issued in between May 2012 and April 2013 for the year 2014 at
2.3%,
The NRA set ERP as the sum of the basis ERP and the Czech Republic´s risk premium. In
the years of III. regulatory period the Czech Republic´s risk premium has been set on the
basis of the published data on the basis points of default spread from Professor
Damodaran´s database and in relation to the then current rating of the Czech Republic.
The value of the basis ERP is 5% for whole regulatory period. For 2014, the risk premium
for the Czech Republic is 0.85%
βL is weighted ratio β, which defines the sensitivity of a company share to the market
risk, taking into account the income tax rate and the debt share, calculated according to
the formula:

232
E
DTUNLEVL )1(1
Bunlev. The regulator calculated the value for the regulatory period (0,40).
T is the effective tax shield. The Authority will apply during the III. Regulatory period
always effective tax rate. In 2014, the applied tax rate of 19%.
The debt leverage (Ratio E/D) is set at target considered as efficient by the regulator.
The ratio of debt for distribution activities in electricity and GAS is 40% debt and 60%
equity. The actual DSO financial structure is not used to set on the regulated allowed
revenues.
Every year for applicable price indices, capital costs (depreciation allowance, WACC, RAB
adjustment for activated investment and depreciation), pass through OPEX (price of gas
to cover losses) are revised and assessed the allowed revenues.
Once for a regulatory period for OPEX, X‐factor, and amount of gas to cover losses are
revised. The X factor is based on past performance of the companies and on
international experience.
3. Tariffs for distribution services
3.1. Distribution tariffs The regulator is in charge of setting the distribution tariffs (based on allowed revenues).
The tariffs are based on an economic approach when users pay for the costs that they
generate. The allowed amount of losses defined by the NRA is part of the distribution
tariffs.
The methodology to allocate distribution costs is based in the partial assignment on
capacity and consumption (variable) costs. For each category of consumers the ratio
between consumption and capacity is different.
Distribution tariff are defined in two categories by consumer consumption:
Households and small offtake consumers.
Medium and large off take consumers (consumption over 630 MWh/year)
The regulator is in charge of setting the distribution tariffs (based on allowed
revenues).
The methodology to allocate distribution costs is based in the partial assignment on
capacity and consumption costs.
Distribution tariff are defined in two categories by consumer consumption:
Households and small offtake consumers and Medium and large off take consumers.
The tariff structure is the same for all the DSO, but prices are different.

233
In each category there are subcategories or bands of consumption. The following
subcategories are for households and small industry:
63 ‐ 630 (MWh/y)
55 ‐ 63 (MWh/y)
50 ‐ 55 (MWh/y)
45 ‐ 50 (MWh/y)
40 ‐ 45 (MWh/y)
35 ‐ 40 (MWh/y)
30 ‐ 35 (MWh/y)
25 ‐ 30 (MWh/y)
20 ‐ 25 (MWh/y)
15 ‐ 20 (MWh/y)
7,56 ‐ 15 (MWh/y)
1,89 ‐ 7,56 (MWh/y)
0 ‐ 1,89 (MWh/y)
Otherwise the Medium and large off take consumers have bands of consumption:
High pressure
Low and medium pressure
The tariff components are summarized in section 1.2 Key figures on revenue and tariffs.
Various other aspects of distribution tariff setting are summarized in the table below.
Table 79: Approach to key issues in setting distribution tariffs
Issue Approach
Treatment of distribution losses Allowed costs of losses are part of allowed revenue, which is divided into capacity and energy component
Presence of uniform tariffs General structure of tariff is geographically uniform. However each DSO has different tariff (prices) set by the regulator. No time of use tariff differentiation.
Presence of non‐linear tariffs Yes, tariffs are not linear. There are bands of consumption for households and small offtake consumers with different unit prices.
Presence of regulated retail tariffs No
Presence of social tariffs No
There are not special incentives in network tariffs for large users like power plants.
The distribution tariffs are published at next link (Czech only): http://www.eru.cz/documents/10540/547837/CR_plyn_3‐2012.pdf/7e954a9c‐e0d6‐41fe‐bd7a‐
1b2d20c2c438

234
3.2. Connection charges Key issues in the setting of connection charges are set out in the table below.
Table 80: Summary of key issues relating to connection charges
Issue Approach
Determination of charges
Type of charges (shallow/deep) Connection charges are not used.
Methodology adopted to determine connection costs
Connection charges are not used.
Hosting capacity Scope to refuse connection DSO is allowed to refuse connection only if supply points did not meet technical and security requirements.
Requirements to publish hosting capacity
No requirement on the DSO
4. Distribution system development and operation
4.1. Distribution system development
The key features of distribution system planning are summarized below.
Table 81: Approach to distribution planning
Issue Approach
‐ Form of distribution planning document DSO Network development plans are not notified to the regulator nor published. Only TSO development plans are approved by The NRA and published
‐ Key responsibilities for its development Not applicable.
‐ Degree of integration with renewables plan Not applicable.
‐ Relationship with consumption trends Not applicable.
‐ Relationship with quality of service targets Not applicable.
‐ How trade‐offs between network development and alternative technologies are treated
Not applicable.
‐ Requirements to integrate cost benefit analysis Not applicable.
4.2. Metering
Key issues regarding metering, and the role of the DSOs, are set out in the following
table.
In the Czech Republic, the DSO´s do not have to notify their Network Development
Plans. Only TSO development plans are submitted and approved by the NRA.
DSOs have full responsibility for metering and own the meters.
A cost‐benefit analysis of smart meters done in the Czech Republic, showed negative
results. There are not Smart meters implemented in the network.

235
Table 82: Key approach to metering
Issue Approach adopted
DSO role in metering DSOs have full responsibility for metering and own the meters.
Monopoly services in the metering Yes
Smart metering functionality A cost‐benefit analysis performed in accordance with directive 2009/72/EC has shown negative results. The Czech Republic does not have plans for a large‐scale rollout of smart meters. Smart Meters are just in pilot projects

236
Country Report – Germany (electricity distribution)
1. Overview of the distribution sector
1.1. Institutional structure and responsibilities In Germany there are 883 distributors supplying electricity to 49.3 million customers,
covering the whole country. Summary data on industry structure is set out below.
Table 83: DSO characteristics
Total number DSOs
Ownership unbundled
Legally unbundled
Less than 100000 customers
Exemption* Share of total demand
883 N.A. N.A.t 780 (26.4% of energy) Yes N.A.
The responsibility for setting distribution tariffs is spread between the following
jurisdictions (for example):
Government in cooperation with the Council of the States (Bundesrat) issues secondary
laws (ordinances), including on the framework for tariff structure rules.
The NRA (Bundesnetzagentur) approves cost allocation methodologies, performs the
efficiency benchmark and calculates the allowed revenues..
The DSO applies the tariff structure consistently with the allowed revenue.
DSOs with fewer than 100000 final customers are predominantly under the
responsibility of the regulatory authorities of the German federal states (Land
Regulatory Authority). Such regulatory authorities exist in Schleswig‐Holstein, Lower
Saxony, North Rhine‐Westphalia, Rhineland‐Palatinate, Saarland, Hessen, Baden‐
Württemberg, Bavaria, Saxony and Saxony‐Anhalt
The breakdown of responsibilities as it related to tariff setting is summarized in the table
below.
Germany has a rather fragmented distribution industry, mostly controlled by state
and local government. All DSOs apply functional and accounting unbundling, DSOs
with more than 100000 connected customers also legal and operational unbundling,
marketing and branding included. Occasionally DSOs operate (as ISOs) grids owned
by third parties not affiliated with them.

237
Table 84: Legal basis for tariff structure – Roles and Responsibilities in setting distribution tariffs
Actor Allowed revenues (tariff level)
Tariffs (tariff structure) Connection charges
DSO Implements Submits charging proposal
Government Defines main principles
Issues tariff structure rules
Issues principles law
NRA/LRA X X Monitors ex post
X = main responsibility; other options to fill the table: sets rules; monitors ex‐post; defines main principles;
calculates for NRA approval; also involved;
The legislator determines the regulatory principles in primary law.
The government, partly together with Federal Council of States issues secondary laws (ordinances).
The framework for tariff structure rules are generally set in the Ordinance on Electricity Network Charges (StromNEV).
The regulator applies ordinances, provides opinions and initiates formal procedures in case of misapplication of the regulatory framework or discrimination by network operators. For each regulatory period, BNETZA calculates the allowed revenues based on DSO costs. A (non public) hearing is held before the allowed revenues are approved.
The DSO converts the revenue cap into a price sheet and tariff structure. There is no consultation on this process, as it follows rules defined by law in detail (see section 3.1 below).
1.1. Key figures on revenue and tariffs There are about 890 German DSOs for electricity. A great number of DSOs are not
directly connected to the transmission grid but to upper voltage level grids of other
DSOs. For the electricity consumed from the upper level grid (and distributed to the
consumers) the DSOs are charged network tariffs which are included in their annual
revenues (upstream network charges). Due to this effect, the sum of allowed revenues
over all DSOs is higher than the sum of tariffs charged to end costumers.
The upper level DSOs will treat lower level DSOs like end costumers within their charging
methodology. Hence the sum of consumed energy on all voltage levels will contain end
consumers as well as delivered electricity to lower level DSOs. Hence the data shows a
higher level than net consumption.
All following data only consists of DSOs in responsibility of Bundesnetzagentur and
consist of about 85‐90% of total revenue. (DSOs with fewer than 100,000 final
customers are predominantly under the responsibility of the regulatory authorities of
the German federal states.
Such regulatory authorities exist in Schleswig‐Holstein, Lower Saxony, North Rhine‐
Westphalia, Rhineland‐Palatinate, Saarland, Hesse, Baden‐Württemberg, Bavaria,

238
Saxony and Saxony‐Anhalt.) The data is based on planned values. The revenues are not
approved as the final formal approval of revenues including volatile costs and
permanent not controllable costs is only commenced with approval of revenues in 3RD
regulatory Period starting from 2019. Revenue data do not contain revenues for
elements that are not within network charges but are passed through by the DSO (e.g.
concession fee, renewable energy support levy).
Planned revenues in in 2013 were €18,1 billion, broken down by the following activities:
Distribution 16,8 93%
Metering 0,17 1%
Metering point operation 0,49 3%
Customer management 0,6 3%
A breakdown of revenue by customer category, including information on available tariff
components and the number of customers in each category is set out in the table below.
Table 85: Tariff components, customers and revenues per customer class
Customer classes Tariff components Number of customers* Revenue
HV KWh only 4000 500
HV/MV** KWh only 75000
300
MV KWh only 1400
MV/LV** KWh only 201000
100
LV with load measure KWh only 500
LV non load KWh only 31586000 7500
All load measured KW 288000 5300
Non load measured Fixed 31586000 500
Other*** ‐ ‐‐ 700
Total ‐ ‐‐ 16800
(*)For Non load measured costumers planned values are available. For all other
categories the number of costumers is measured with the (planned) number of installed
meters.
(**)The HV/MV respectively MV/LV level is defined for busbar to busbar. If a customer is
connected to the busbar and paying tariffs for the HV/MV‐level (not MV‐level), he is
classified as a costumer in MV
(***).Some DSOs operate small transmission voltage level grinds. Other revenues
comprise of esp. of the transmission revenues. But also of other revenue elements
(charges for reactive energy, network reserve, special tariffs for night saving heating
etc.)
The breakdown of energy volumes and distribution revenue by customer category is not
available.

239
BNetzA employs Eurostat consumer categories Eurostat (Dc, Ib and Ig):
‐ Household, Dc: 3500 kWh/p.a.
‐ Small industrial, Ib: 50000 kWh/p.a.
‐ Large industrial, Ig: 4000 kW, 24000000 kWh/p.a. (6000 hours)
The typical network tariff in 2013 for residential, small and large industrial customers is
not available, as tariffs are differentiated by DSO, and there about 880 of them. For the
same reason, the share of total distribution revenues corresponding to each customer
group (household, small industrial, large industrial) is not available However, the
following Table shows the best available detail of the total revenue of fixed, energy
related and load related tariffs, by voltage level:
Table 86: Breakdown of annual charges – typical customer types, 2013 (million €)
Customer type Fixed charges
Energy charges Load and reactive charges
Total
LV non load measured 500 7500 ‐ 8000
LV – MV load measured ‐ 500 400‐
1800
900
2300 HV load measured ‐ 500
The average tariffs per kWh for the typical customers in 2012 (latest available year) are
illustrated below. 57
Figure 33: Average network charges (€c/kWh), 2012
57 In contrast to the data above these values are based on a survey of all German DSOs. (See Bundesnetzagentur und Bundeskartellamt (2013): Monitoring Report 2013 available at: http://www.bundesnetzagentur.de/cln_1422/DE/Sachgebiete/ElektrizitaetundGas/Unternehmen_Institutionen/DatenaustauschundMonitoring/Monitoring/Monitoringberichte/Monitoring_Berichte_node.html;jsessionid=4A93EAB609B7D046C726397F63CC1E13)

240
2. Regulation of distribution activities
2.1. General overview
The distribution sector is regulated under a concession regime, with a maximum
duration of 20 years. Revenue cap form of incentive regulation is applied, for service
expansion and for costs that cannot be influenced by the DSO or that are highly volatile,
which are passed through.
Key features of the regulatory regime are set out in the following table:
Table 87: Main features of the regulatory regime
Issue Approach
Type of regime (concession/licence) Concession
Duration of tariff setting regime (regulatory period)
5 years
Form of determination (distributor propose/regulator decide)
NRA defines allowed revenue, DSO implements tariff structure methodology
2.2. Main incentive properties of the distribution regulatory model
The following key regulatory incentives apply for the DSOs: ‐
‐ The adoption of a TOTEX benchmarking approach for the determination of the X factor;
‐ The maximum share of equity (40%) for the calculation of rate of returns;
‐ The use of a quality parameter for the repayment of the benefits of reduced service
interruptions.
At the same time the following tools are provided to mitigate risks:
Regulatory account, which is settled at the end of the 5‐year regulatory periods unless
realized revenues exceed the revenue cap by more than 5%, in such case tariffs must be
reduced; If revenues are more than 5% below the revenue cap, tariffs can be increased
previous to the end of the regulatory period.
Expansion factor. In case that the distribution task of the DSO changes (measured by
different output indicators such as supplied area, number of connection points, annual
peak load, number of feed‐in points of distributed generation) and costs increase by
more than 0,5% the DSO may apply for a factor increasing the revenue cap. Network
related capex is normally accepted by the regulator, as efficiency is promoted by the
TOTEX benchmarking;
Use of actual financial costs, within the limits of normal practice for similar companies;
The use of standard cost parameters related to the expansion of the service.
Key components of quality of service regulation are:
‐ Service quality
‐ Grid capacity
‐ Technical standards
‐ Interruptions, measured by SAIDI and ASIDI indices.

241
Only the latter is related to tariffs. The individual level of quality of supply of the
respective network operator is measured against a key performance indicator reflecting
the average level of quality of supply. Underperformers incur a penalty, outperformers
receive a reward.
The revenue cap is adjusted by the X‐component considering that the network industry
has specific productivity gains, which are different from the overall economy.
The general sector‐specific productivity factor results from the difference between the
grid‐specific economic productivity progress and the general economic productivity
progress, as well as the difference between the general development of acquisition
prices and the development of grid specific acquisition prices.
The factor is based on data from grid operators from the entire German territory going
back at least four years. For the first periods the X‐component was set to 1.25%. In the
second period 1.5% is applied.
There is also a DSO‐specific productivity factor, which is calculated as follows:
After an assessment of the costs, the regulator splits total costs (e.g. € 150 m) into so‐
called “non‐controllable costs” (which are not benchmarked, e.g. taxes, concessions etc.;
e.g. € 50 m) and the residual costs (e.g. € 100 m). The residual costs are benchmarked
using the DEA and SFA methods.
The costs serve as input, and the output is the supply task of the DSOs, defined by ca. 10
parameters (e.g. area supplied, peak load, meters etc.).
The individual efficiency values that result from the benchmarking (e.g. 80%) are used to
divide the residual costs (€ 100 m) into “temporarily non‐controllable costs” (efficient
costs; € 80 m) and “controllable costs” (inefficient costs; € 20 m).
2.3. Determination of cost of service parameters
The approach to determining key cost of service parameters are summarized in the
following table.
Table 88: Approach to key cost of service parameters
Parameter Approach
Form of price control Revenue cap
Regulatory asset base Used actual value at historical costs at least 60%; revaluated starting from oldest for max. 40%
Capital expenditure Expansion factor
Approach to operating expenditure Actual and benchmarking
Form of capital remuneration applied Actual financial costs, up to a max E/D+E of 40%
Additional revenue items (where applicable) Research funds provided by state. Quality remunerations for reduced interruptions. Non controllable costs (e.g. concession fees, cost of required smart meters) are passed through..

242
In contrast to other EU Member States, the regulatory framework in Germany does not
use WACC and RAB, but instead takes into account the effective capital structure of the
DSO.
New assets (capitalised since 01.01.2006) are valued at historical costs.
Old assets (capitalised before 01.01.2006) are valued at replacement costs if they are
financed by equity (indexed historical cost, maximum equity ratio of 40%) and at
historical costs if they are financed by debt capital (debt ratio at least 60% of all old
assets).
The return on equity for new assets is currently set at 9.05 % pre‐tax (nominal) and
7.39% post‐tax for the second regulatory period (for both electricity and gas as well as
TSO and DSO levels).
The return on equity is determined using the Capital Asset Pricing Model (CAPM):
‐ Risk premium: 3,59%
‐ Beta: 0,79
‐ Market risk premium: 4,55%
‐ Risk free rate: 3,8%
‐ Inflation: 1,56%
The allowed rate of return is updated in advance of each regulatory period. The return
on equity on old assets is lower as inflation is already considered in the replacement
costs.
To the extent the equity exceeds 40 %, the excess portion of such equity is covered at an
interest level, which is calculated as an arithmetic mean of the yields on debt securities
outstanding issued by residents (in detail ‐ public debt securities, corporate bonds
(excluding non‐profit institutions at banks [MFIs]), mortgage bonds). These yields are
published by the German Central Bank (Deutsche Bundesbank) and as arithmetic means
for the last ten completed calendar years. For electricity (base year 2011 it is 3,98 %.
3. Tariffs for distribution services
3.1. Distribution tariffs The following approach is adopted to allocate costs between customer categories with
the following key features:
1. Parameters required to allocate the distribution costs:
‐ specific annual cost (so‐called “postage stamp”)
A detailed methodology based on cost cascading is envisaged for the determination of
tariff structures. Several tariff options are available for higher or lower utilization
rates. Smaller customers pay standing charges and energy related charges.

243
‐ so‐called “concurrency function” (g‐function)
First of all the DSO must calculate the specific annual cost for each voltage level. The
specific annual cost are called “postage stamp”:
The g‐function allocates a concurrency degree between 0 and 1 to the final customers.
The concurrency degree reflects the probability which proportion the sampling point of
the customer (at time of annual peak load) takes from the simultaneous annual peak
load of all sampling of this grid or transformer level.
g1: Starting point of the first line, t= between 0 and 0,2 operating hours (is set by the
DSO)
g2: Starting point of the second line, t=2500 operating hours
2. Methodology to calculate tariffs for load measured final customers
a) Tariff for customers with fewer than 2500 operating hours:
Capacity charge <2500 =
Energy charge <2500 =
b) Tariff for customers with more than 2500 operating hours:
Capacity charge >2500 =
energy charge >2500 =
3. Methodology to calculate tariffs for non‐load measured final customers
The tariff consists of a basic charge and an energy charge (per used kWh). After setting a
basic charge, the DSO calculates the energy charge by dividing the low voltage level
costs (excluding performance‐based final customers) reduced by basic price part (basic
price * final customers) by the amount of predicted annual consumption.
Hence, the tariff structure implies that:

244
Lower tariffs apply for higher consumption and voltage level;
Customers with over 2500 hours utilization have higher peak related and lower energy
related charges.
Tariffs for measurement, metering point operation and accounting are calculated by
dividing all cost centre costs by the predicted volume.
Various other aspects of distribution tariff setting are summarized in the table below.
Table 89: Approach to key issues in setting distribution tariffs
Issue Approach
Treatment of distribution losses Included in distribution tariffs
Presence of uniform tariffs No, each DSO has separate tariffs
Presence of non‐linear tariffs No
Presence of regulated retail tariffs No
Presence of social tariffs No
There is no G‐ component, but power plants connected to distribution network receive
an avoided cost allowance related to costs of upper voltage levels.
Different tariffs per voltage level:
Tariffs in higher voltage level must be lower than lower voltage tariffs for the same
consumption profile.
Load‐measured consumers (see 2.2. above) have a per KW per year and KWh charge, to
be defined in this way:
‐ For Full load hours<2500 : higher kwh and lower kw/a.
‐ For full load hours>2500 : lower kwh and higher kw/a.
‐ For full load hours=2500: Both price systems must result in same tariff.
Non‐load measured consumers pay a lump sum (fixed charge) and kwh charge
Special tariffs apply for:
a) So‐called “Atypical customers” (Peak load differs significantly from peak in grid): 20%
less than normal tariff.
b) So‐called “Intensive customers” (Full load hours >7000 and consumption > 10 Gwh):
Individual tariff with 10‐20% discount on regular tariff. Tariff depends on physical
proximity of load to local generation.
c) New or enlarged pump storages, which are exempted from network tariffs for 20
years.
d) Short time consumers, who are eligible for monthly kw and kwh prices.

245
e) Interruptible load in low voltage area (in particular night saving heating), who are
granted special reduced tariffs, often with separate prices for daytime and nighttime.
f) Network reserve: pay reduced network tariffs for consumers only using the network
for fewer than 600 h/a (typically consumers with own generation).
3.2. Connection and capacity issues Key issues in the setting of connection charges are set out in the table below.
Table 90: Summary of key issues relating to connection charges
Issue Approach
Determination of charges
Type of charges (shallow/deep) Deep
Methodology adopted DSO estimates, customer chooses supplier
Hosting capacity Scope to refuse connection No
Requirements to publish hosting capacity
No
Targets and/or incentive schemes to enhance hosting capacity
No target but the expansion factor is an incentive to enhance capacity if needed
The connection charge is meant to cover the cost of the facilities that are specifically set
up to serve the customer and the connection to his housing. In addition, the consumer is
obliged to pay a contribution towards the cost of the reinforcement of networks and
shared resources.
Consumers are obliged to pay the costs for the building connection and a contribution
towards the network costs.
The DSO prepares an estimate based on its cost but the customer is free to procure the
necessary works from a different provider.
For consumers and generators alike, the DSO may refuse connection only if it is
impossible or if it would entail an unreasonable cost.
Upon request of the requesting party, in the case of lack of capacity the reasons must
also contain meaningful information regarding the concrete measures and the costs
associated therewith would be individually necessary for development of the system to
achieve connection to the system.
4. Distribution system development and operation
Decisions are taken by DSOs, which have an obligation to supply all customers

246
4.1. Distribution system development
The key features of distribution system planning are summarized below.
Table 91: Approach to distribution planning
Issue Approach
Form of distribution planning document
Network status report to NRA on HV level
‐ Key responsibilities for its development
DSO
‐ Degree of integration with renewables plan
Net development based on regionalises RES development plan
‐ Relationship with consumption trends
Demand trend must be taken into account
‐ Relationship with quality of service targets
No explicit connection
‐ How trade‐offs between network development and alternative technologies are treated
No
‐ Requirements to integrate cost benefit analysis
No
For the high voltage level (110 kV), DSOs must issue a network status report to the
regulator. On the basis of this report BNetzA may require the TSO to prepare a network
development plan (see 1.9 above). No such distribution system development plan has
ever been requested so far.
4.2. Distribution system operations
The key features of distribution system operations in dispatching are summarized below.
Beside this they are responsible for development (see above), network expansion,
maintenance and connection.
Table 92: Approach to distribution planning
Issue Approach
Requirements for dispatch of renewable plants connected to DSO network
Full dispatching authority by DSO. Dispatching priority for RES
Possibility to dispatch flexible loads Yes
Other sources of flexibility open to DSO No, but many DSOs are analysing battery storage potential
DSOs are allowed to dispatch flexible load. On the 110kV‐level 2 out of 55 DSOs
currently dispatch flexible loads. 6 other DSOs plan to do this in future.
4.3. Metering
Key issues regarding metering, and the role of the DSOs, are set out in the following
table.

247
Table 93: Key approach to metering
Issue Approach adopted
Discos role in metering Primary responsibility
Monopoly services in the metering No, customers can choose another provider
Smart metering functionality N.A.
BNetzA estimates that ca. 370,000 metering points (app. 1% of all metering points) are
equipped with smart meters (i.e. electronic bidirectional meters).
The Ministry of Economics and Energy (BMWi) has performed a cost benefit analysis and
envisages a corresponding rollout plan that aims to install smart meter for households
with an annual consumption of more than 6000 kWh, for small sized generators
(prosumers) and for new buildings. It is estimated that this mandatory rollout will result
in 30‐50% of all metering points being equipped with smart meters. No relevant
legislation has been introduced so far.
No breakdown by customer category is available.
No further preliminary information on the impact of smart meter roll out is available.

248
Country Report – Germany (gas distribution)
1. Overview of the distribution sector
1.1. Institutional structure and responsibilities In Germany there are 720 distributors supplying gas to over 14 million customers,
covering almost the whole country. Summary data on industry structure is set out
below.
Table 94: DSO characteristics
Total number DSOs
Ownership unbundled
Legally unbundled
Less than 100000 customers
Exemption* Share of total demand
728 N.A. N.A.t 640 (56,8% of energy) N.A. N.A.
*exemption from distribution network charges for certain types of grid users, such as low‐carbon generation connected to distribution networks.
The responsibility for setting distribution tariffs is spread between the following
jurisdictions (for example):
Government in cooperation with the Council of the States (Bundesrat) issues secondary
laws (ordinances), including on the framework for tariff structure rules.
The NRA (Bundesnetzagentur) approves cost allocation methodologies, performs the
efficiency benchmark and calculates the allowed revenues.
DSOs with fewer than 100000 final customers are predominantly under the
responsibility of the regulatory authorities of the German federal states (Land
Regulatory Authority). Such regulatory authorities exist in Lower Saxony, North Rhine‐
Westphalia, Rhineland‐Palatinate, Saarland, Hessen, Baden‐Württemberg, Bavaria,
Saxony and Saxony‐Anhalt
The breakdown of responsibilities as it related to tariff setting is summarized in the table
below.
Germany has a rather fragmented distribution industry, mostly controlled by state
and local government. All DSOs apply information and accounting unbundling, DSOs
with more than 100000 connected customers also legal and operational unbundling,
marketing and branding included. Occasionally DSO operates (as an ISO) a grid owned
by a third party not affiliated with DSO.

249
Table 95: Legal basis for tariff structure – Roles and Responsibilities in setting distribution tariffs
Actor Allowed revenues (tariff level)
Tariffs (tariff structure)
Connection charges
DSO Implements Submits charging proposal
Government Defines main principles
Issues tariff structure rules
Issues principles law
NRA/LRA X NRA approval Monitors ex post
X = main responsibility; other options to fill the table: sets rules; monitors ex‐post; defines main principles;
calculates for NRA approval; also involved;
The legislator determines the regulatory principles in primary law.
The government, partly together with the Federal Council or Council of States
(Bundesrat) issues secondary laws (ordinances).
The framework for tariff structure rules are generally set in the Ordinance on Gas
Network Charges (GasNEV).
The regulator applies ordinances, provides opinions and initiates formal procedures in
case of misapplication of the regulatory framework or discrimination by network
operators. For each regulatory period, BNETZA calculates the allowed revenues based
on DSO costs. A (non public) hearing is held before the allowed revenues are approved.
The DSO converts the revenue cap into a price sheet and tariff structure. There is no
consultation on this process, as it follows rules defined by law in detail (see section 3.1
below).
1.2. Key figures on revenue and tariffs Distribution revenues in in 2013 were €4,5 billion for DSOs under the responsibility of
BNetzA, broken down by the following activities. No further segmentation is available.
Transmission and upstream costs and biogas‐related costs are included. Other cost
elements that are passed through by the DSO (e.g. concession levy) are however not
included.)
Separate tariff components are network use, metering, metering point operation, billing
and concession levy.
There are no official consumer categories. In line with Eurostat, consumers below
1,500,000 kWh are classified as standard load profile (SLP), whereas those above this
threshold are load metered (RLM)
The typical network tariff in 2013 for residential, small and large industrial customers is
not available, as tariffs are differentiated by DSO, and there are about 720 of them. For
the same reason, the share of total distribution revenues corresponding to each
customer group (household, small industrial, large industrial) is not available.

250
2. Regulation of distribution activities
2.1. General overview
The distribution sector is regulated under a concession regime, with a maximum
duration of 20 years. Revenue cap form of incentive regulation is applied, for service
expansion and for costs that cannot be influenced by the DSO or that are highly volatile,
which are passed through.
Key features of the regulatory regime are set out in the following table
Table 96: Main features of the regulatory regime
Issue Approach
Type of regime (concession/licence) Concession
Duration of tariff setting regime (regulatory period)
5 years
Form of determination (distributor propose/regulator decide)
NRA defines allowed revenue, DSO implements tariff structure methodology
Scope for appeal regulatory decision N.A.
2.2. Main incentive properties of the distribution regulatory model
The following key regulatory incentives apply for the DSOs: ‐
‐ The adoption of a TOTEX benchmarking approach for the determination of the X factor;
‐ The maximum share of equity (40%) for the calculation of rate of returns.
At the same time the following tools are provided to mitigate risks:
Regulatory account, which is settled at the end of the 5‐year regulatory periods unless
revenues exceed revenue cap by more than 5%, in such case tariffs must be reduced. If
revenues are more than 5% below the revenue cap, tariffs can be increased previous to
the end of the regulatory period.
Expansion factor: In case that the distribution task of the DSO changes (measured by
different output indicators such as supplied area, number of exit points, annual peak
load) and costs increase by more than 0,5% the DSO may apply for a factor increasing
the revenue cap;
Network related capex is normally accepted by the regulator, as efficiency is promoted
by the TOTEX benchmarking;
Use of actual financial costs, within the limits of normal practice for similar companies;
The use of standard cost parameters related to the expansion of the service.
No quality of service regulation has been implemented yet.
The revenue cap is adjusted by the X‐component, considering that the network industry
has specific productivity gains, which are different from the overall economy.
The general sector‐specific productivity factor results from the difference between the
grid‐specific economic productivity progress and the general economic productivity

251
progress, as well as the difference between the general development of acquisition
prices and the development of grid specific acquisition prices.
The factor is based on data from grid operators from the entire German territory going
back at least four years. For the first two periods the X‐component was set to 1,25%. In
the second period 1,5% is applied.
There is also a DSO‐specific productivity factor, which is calculated as follows:
After an assessment of the costs, the regulator splits total costs (e.g. € 150 m) into so‐
called “non‐controllable costs” (which are not benchmarked, e.g. taxes, concessions etc.;
e.g. € 50 m) and the residual costs (e.g. € 100 m). The residual costs are benchmarked
using the DEA and SFA methods.
The costs serve as input and the output is the supply task of the DSOs defined by ca. 10
parameters (e.g. area supplied, peak load, meters etc.).
The individual efficiency values that result from the benchmarking (e.g. 80%) are used to
divide the residual costs (€ 100 m) into “temporarily non‐controllable costs” (efficient
costs; € 80 m) and “controllable costs” (inefficient costs; € 20 m).
2.3. Determination of cost of service parameters
The approach to determining key cost of service parameters are summarized in the
following table.
Table 97: Approach to key cost of service parameters
Parameter Approach
Form of price control Revenue cap
Regulatory asset base Used actual value at historical costs at least 60%; revaluated starting from oldest for max. 40%
Capital expenditure Expansion factor applied related to output (network, peak load, area, connection points
Approach to operating expenditure Actual and benchmarking
Form of capital remuneration applied Actual financial costs, up to a max E/D+E of 40%
Additional revenue items (where applicable) Research funds provided by state. Quality remunerations for reduced interruptions. Non controllable costs (e.g. concession fees, cost of smart meters) are passed through.
In contrast to other EU Member States, the regulatory framework in Germany does not
use WACC and RAB, but instead takes into account the effective capital structure of the
DSO.
New assets (capitalised since 01.01.2006) are valued at historical costs.
Old assets (capitalised before 01.01.2006) are valued at replacement costs if they are
financed by equity (indexed historical cost, maximum equity ratio of 40%) and at
historical costs if they are financed by debt capital (debt ratio at least 60% of all old
assets).

252
The return on equity for new assets is currently set at 9.05 % pre‐tax (nominal) and
7.39% post‐tax for the second regulatory period (for both electricity and gas as well as
TSO and DSO levels).
The return on equity is determined using the Capital Asset Pricing Model (CAPM):
‐ Risk premium: 3.59%
‐ Beta: 0.79
‐ Market risk premium: 4.55%
‐ Risk free rate: 3.8%
‐ Inflation: 1.56%
The allowed rate of return is updated in advance of each regulatory period. The return
on equity on old assets is lower as inflation is already considered in the replacement
costs.
To the extent the equity exceeds a portion of 40 %, the excess portion of such equity is
covered at an interest level, which is calculated as an arithmetic mean of the yields on
debt securities outstanding issued by residents (in detail ‐ public debt securities,
corporate bonds (excluding non‐profit institutions at banks [MFIs]), mortgage bonds).
These yields are published by the German Central Bank (Deutsche Bundesbank) and as
arithmetic means for the last ten completed calendar years. For gas (base year 2010) it is
4.19 %
3. Tariffs for distribution services
3.1. Distribution tariffs
The GasNEV does not prescribe a specific calculation model to derive network charges. A number of criteria to be met by the calculation model are however set out:
• Tariffs must be non‐discriminatory; • Tariffs shall be set in a way that the difference between the actual revenue and
the distribution costs is as small as possible. Gas DSOs must set both commodity and capacity charges. The allocation of costs to capacity and commodity charges is required to be “adequate“ (§ 18 (5) GasNEV). The ordinance does not specify a fixed split. In practice most DSOs apply a 30% (commodity) / 70% (capacity) split. The tariff structure is as follows:
‐ Annual consumption of up to 1,5m kWh and a maximum exit load of 500 kWh/h: A
tariff consisting of a basic charge (per month) and an energy‐related charge is applied.
No detailed criteria are envisaged for the calculation of tariff structures, but only a set
of general principles. Capacity related charges are used for load meered connection
points, and normally cover most of the costs.

253
‐ Within the range (0‐1,5m kWh) there are several steps with increasing basic charges
and decreasing energy related charges. The lowest basic charge and the highest energy
related charge is applied in case of a low annual consumption. This structure is applied
for standard load profile (SLP) customers
‐ Annual consumption above 1,5m kWh/a: Tariffs consist of a price per kWh and a price
per kW where both prices are derived out of respective formulas. This structure is
applied for load‐metered (RLM) customers.
If justified, the DSO may change the threshold of 1,5m kWh/a to a higher or lower value.
Large gas users are mostly connected to the transmission system and pay the ordinary
tariff applied by the TSOs
Charges for network usage, metering, metering point operation and billing are shown
separately on the bill. Various other aspects of distribution tariff setting are summarized
in the table below.
Table 98: Approach to key issues in setting distribution tariffs
Issue Approach
Treatment of distribution losses Included in distribution tariffs
Presence of uniform tariffs No, each DSO has separate tariffs
Presence of non‐linear tariffs Yes
Presence of regulated retail tariffs No
Presence of social tariffs No
Costs resulting from activities related with biogas and quality conversion (local
conversion of gas quality as well as network adaption from L‐ to H‐gas) are funded via
additional tariff components.
3.2. Connection and capacity issues
Key issues in the setting of connection charges are set out in the table below.
Table 99: Summary of key issues relating to connection charges
Issue Approach
Determination of charges
Type of charges (shallow/deep) Deep
Methodology adopted DSO sets by standard costs
Hosting capacity Scope to refuse connection No
Requirements to publish hosting capacity
No
Targets and/or incentive schemes to enhance hosting capacity
No target but the expansion factor is an incentive to enhance capacity if needed
For residential and small low pressure consumers and for residential installations (below
100 mbar) a uniform one‐off connection fee set by the DSO applies.
For larger consumers (above 100 mbar) and generators connection costs are computed
case by case. The DSO prepares an estimate based on its cost but the customer is free to
procure the necessary works from a different provider.

254
For consumers and generators alike, the DSO may refuse connection only if it is
impossible or if it would entail an unreasonable cost.
Upon request of the requesting party, in the case of lack of capacity the reasons must also contain meaningful information regarding the concrete measures and the costs associated therewith would be individually necessary for development of the system to achieve connection to the system
4. Distribution system development and operation
4.1. Distribution system development
The key features of distribution system planning are summarized below.
Table 100: Approach to distribution planning
Issue Approach
Form of distribution planning document Not applicable
Key responsibilities for its development DSO
Degree of integration with renewables plan
Not applicable
Relationship with consumption trends Not applicable
Relationship with quality of service targets
Within ordinance on incentive regulation
How trade‐offs between network development and alternative technologies are treated
Not applicable
Requirements to integrate cost benefit analysis
No
4.2. Metering
Key issues regarding metering, and the role of the DSOs, are set out in the following
table.
Table 101: Key approach to metering
Issue Approach adopted
Discos role in metering Primary responsibility
Monopoly services in the metering No, customers can choose another provider, but very few in practice
Smart metering functionality Not applicable
Smart gas meters are not covered by BNetzA’s monitoring report.
There are no useful applications available for the gas market at present.
Decisions are taken by DSOs, which have an obligation to supply all customers,
except if an unreasonable connection cost applies.

255
Country Report – Denmark (electricity distribution)
1. Overview of the distribution sector
1.1. Institutional structure and responsibilities
In Denmark there are around 70 distributors supplying electricity to more than 3 million
customers with an overall circuit length of 168592 km. Summary data on industry
structure is set out below.
Table 102: DSO characteristics
Total number DSOs
Ownership unbundled
Legally unbundled
Less than 100000 customers
Exemption* Share of total demand(DSOs <100,000 customers)
Country 71 0 71 64 No 29,8% (in 2012)
*exemption from distribution network charges for certain types of grid users, such as low‐carbon generation connected to distribution networks.
The responsibility for setting distribution tariffs is spread between the following
jurisdictions (for example):
The DSO
The NRA (The Danish Energy Regulatory Authority –DERA‐)
Government (Ministry of Climate, Energy and Building)
Parliament
The breakdown of responsibilities as it is related to tariff setting is summarized in the
table below.
In Denmark, the distribution sector consists of 71 DSOs, most of which have less than
100000 end customers. 20% of end customers are served by the largest DSO which is
partly owned by the government. Competences for energy regulation in Denmark are
split between the Danish Energy Regulatory Authority (DERA)and the Danish Energy
Agency.

256
Table 103: Legal basis for tariff structure – Roles and Responsibilities in setting distribution tariffs
Actor Allowed revenues (tariff level)
Tariffs (tariff structure)
Connection charges
Regulated services
DSO Provide data to NRA
N/A N/A N/A
Government Issue detailed methodology for the revenue caps
N/A N/A N/A
NRA
X N/A N/A N/A
Parliament Defines main principles and issue the general methodology
N/A N/A N/A
X = main responsibility; other options to fill the table: sets rules; monitors ex‐post; defines main principles;
calculates for NRA approval; also involved;
The regulatory process adopted to setting distribution tariffs involves the following
steps:
The Parliament issues the principles in the primary law and issues the general
methodology. The Parliament also sets the value for the maximum return on investment
a DSO can obtain (a specific bond +1 pct.)
The Ministry issues a detailed methodology for the revenue caps.
The NRA calculates the allowed revenue on the basis of data provided by the DSO. If the
DSO has obtained excess revenue, the regulator approves the settlement plan for the
DSO to give the money back to the consumers.
1.2. Key figures on revenue and tariffs
The sum of revenue caps in Denmark 201258 were DKK 673034541159. No further split
by service type or number of customers in each category is available.
2. Regulation of distribution activities
58 DKK 6 670 145 717 is the sum of revenue caps in Denmark for 2013. The number is under revision at the moment. 59 This number is the maximum revenue cap. However some companies are bound by a maximum return on capital, so this number is higher than the real number.
The distribution sector is regulated under a concession regime. An “incentive‐based” form of
regulation is applied with a revenue cap system combined with a maximum level of return on

257
2.1. General overview
The Danish Energy Regulatory Authority (DERA) regulates the Danish markets for
electricity, natural gas and district heating. In the electricity market, the regulation
focuses on the network companies. However, DERA also sets the allowed price for
electricity companies with an obligation to supply (i.e. the companies that supply
customers who have not chosen their own supplier in the free market).
The distribution sector is regulated under a concession regime. Concessions last for a
period of 20 years. They will be renewed in the period of 2021‐24. Concessions are not
allocated through a competitive mechanism. When introducing the concession‐regime
the concessions where allocated for distributors who were already distributors in the
specific geographical area. If a DSO loses a concession the reimbursement of non‐
depreciated investments is unclear under Danish legislation. Withdrawal of a concession
is possible under certain circumstances, and – in majority of cases – subject to a judge’s
decision (because of expropriative character of such a decision). There is an obligation
on previous concessionaire to make installations available to new concessionaire.
Minister can in such cases tender a concession. In the interim, the minister can enjoin
Energinet.dk to carry out the activity. In those cases, the DSO losing the concession may
retain ownership of installations, and the new concessionaire is exempted from the
otherwise applicable legal obligation that the one who has the concession has to have
ownership of installations. The previous DSO is obliged to make installations available
“at reasonable terms.”
An “incentive‐based” form of regulation is applied with a revenue cap system combined
with a maximum level of return on capital and benchmarking of depreciations, operating
costs and quality in supply.
The distribution tariff is itemized separately to end‐users.
Key features of the regulatory regime are set out in the following table:
Table 104: Main features of the regulatory regime
Issue Approach
Type of regime (concession/licence) Concessions
Duration of tariff setting regime The current regulatory period has been in place since the beginning of 2005, and revenue caps are dependent on the DSOs income in 2004. The revenue caps are announced every year.
Form of determination (distributor propose/regulator decide)
Regulator decides
Scope for appeal regulatory decision DERA decisions can be appealed to the Energy Board of Appeal

258
2.2. Main incentive properties of the distribution regulatory model
The following key regulatory incentives apply for the DSOs:
Allowed revenues depend on kWh delivered through the distribution network.
Since income is restricted by a revenue cap, the DSO is incentivised to reduce costs.
Since return on capital is restricted by a maximum level of return on capital, the DSO is
incentivised to reduce costs to increase profits until it reached the maximum allowed
level.
The DSO is also incentivised to reduce costs while maintaining quality in supply by an
annual benchmarking of depreciations, operating costs and quality in supply. The
outcome of benchmarking is reductions in the revenue cap. The revenue cap does
however strongly depend on demand (because the largest part of the revenue cap is
calculated on the basis of a price cap).
Certain types of investment can lead to an increase in revenue cap corresponding to an
amount which covers depreciation, differences in operating expenses, and a set
percentage of return on investment. For instance, this is the case for investments which
replace overhead power lines by underground cables.
At the same time the following tools are provided to mitigate risks:
If DSOs do not set tariffs such that the revenue cap is not fully utilised, the gap between
income and revenue cap can be transferred to the following two years. That is, allowed
revenue in the following two years will increase in this case. On the other hand, if
income exceeds tariffs by a certain amount of money, the DSO must pay back this
amount by lowering tariffs over the following two years.
If revenues fall short of the revenue cap because of a reduction in demand, the missing
revenues can be recovered over the following two years. Differences between actual
and allowed revenue must be collected or paid back over the following two years.
DSOs are benchmarked against each other on operating costs. If however an
extraordinary event occurs which forces extraordinary costs on the DSO in a particular
year, the DSO can apply for an exemption of these costs from benchmarking.
Key components of quality of service regulation are:
DSOs are benchmarked on quality in supply which includes the number and duration of
interruptions in supply.
Allowed revenues are decreased if the DSO performs worse than certain thresholds.
2.3. Determination of cost of service parameters
The approach to determining key cost of service parameters are summarized in the
following table.

259
Table 105: Approach to key cost of service parameters
Parameter Approach
Form of price control Revenue cap combined with a maximum rate of return
Regulatory asset base Book value
Capital expenditure Benchmarked
Approach to operating expenditure Benchmarked
Form of capital remuneration applied” (WACC real, nominal, ten years Treasury bond + adder, …)
No explicit remuneration issecured because the income cap are set on the grounds of the actual revenue in 204”
Additional revenue items (where applicable) N/A
The allowed rate of return is fixed annually as the average long mortgage bond rate plus
one percentage point. The allowed rate of return does not depend on the financial
structure of DSOs in Denmark.
The allowed revenue is bound by two ceilings, 1) the revenue the DSO had in year 2004
and 2) a maximum return on capital.
Revenue caps are calculated by the following method:
1) In 2004, the DSO’s revenues are divided by delivered kWh which gives a so called
regulatory price.
2) The revenue cap in each following year is obtained by multiplying the inflation‐
adjusted regulatory price by delivered kWh in this year. A number of adjustments on the
revenue cap is carried out. For example, if DSOs change accounting methodologies when
comparing to 2004.
3. Tariffs for distribution services
3.1. Distribution tariffs: additional issues
The distribution company is in charge of setting the distribution tariffs (based on
allowed revenues). However, the method of setting tariffs must be approved by the
regulator.
Costs are split on the voltage‐level. This is done with either a direct distribution, with
used MWh, or by the number of consumers depending on the nature of the cost. From
Costs are split on the voltage‐level .Fixed costs are billed through subscription and
costs that vary in the amount delivered are variable costs. Each DSO sets different
tariffs. For small consumers the connection cost is a standard cost calculated by
standard needs and standard costs. For larger consumers a calculation is done on the
basis of an average grid. The DSO is not allowed to refuse connection of consumers
and generators.

260
here they are split on either the variable tariff or the subscription. The rule of thumb is
that the fixed costs are billed through subscription and costs that vary in the amount
delivered is variable costs.
Consumer classes are divided from their point of entry in the grid. A, B and C consumers
is used. C‐consumers entry point is the low‐voltage network. The point of entry is
decided by amount delivered. All consumers pay a subscription that is equal for all in the
same class. And then a variable tariff depending on the amount delivered, that covers
both costs in their own voltage‐level, but also the costs caused upward in the system.
Various other aspects of distribution tariff setting are summarized in the table below.
Table 106: Approach to key issues in setting distribution tariffs
Issue Approach
Treatment of distribution losses The revenue cap is notdependent on the actual oses (but only the price of energy). This implies that DSOs canbenefit from reducing loses
Presence of uniform tariffs Each DSO sets different tariffs.
Presence of non‐linear tariffs All tariff components are linear.
Presence of regulated retail tariffs None
Presence of social tariffs None
There’s no time of use differentiation except for large consumers with consumption
above 100.000 kWh.
The costs for the DSOs energy‐saving activities is included in the distribution tariff.
3.2. Connection and capacity issues
For residential and small BT consumers and for residential installations a uniform one‐
off connection fee set by the DSO applies. For larger consumers and generators
connection costs are computed case by case.
Key issues in the setting of connection charges are set out in the table below.
Table 107: Summary of key issues relating to connection charges
Issue Approach
Determination of charges
Type of charges (shallow/deep) Shallow charges
Methodology adopted For small consumers the connection cost is a standard cost calculated by standard needs and standard costs. For larger consumers a calculation is done on the basis of an average grid. The calculation covers what the costs of building an average grid from daily prices and technology and how many ampere the consumer

261
Issue Approach
requires. The DKK/A is then multiplied by how much capacity the consumer needs.
Hosting capacity Scope to refuse connection The DSO is not allowed to refuse connection of consumers and generators. Anyone has the right to use the collective grid to transport electricity against payment.
Requirements to publish hosting capacity
None
Targets and/or incentive schemes to enhance hosting capacity
None, the DSO is assumed to have a duty to connect all the capacity that applies for connection
4. Distribution system development and operation
4.1. Distribution system development
The key features of distribution system planning are summarized below.
Table 108: Approach to distribution planning
Issue Approach
Form of distribution planning document
‐ Key responsibilities for its development There is no public system development plan for Danish DSOs.
‐ Degree of integration with renewables plan
RES targets are not set on a regional level. Internal plans are developed by DSOs based on known and expected RES sites.
‐ Relationship with consumption trends The evolution of consumption in the distribution area is considered in internal plan. Flexibility might play a role in future planning if the regulation offers the right incentives for investment.
‐ Relationship with quality of service targets
Quality of service targets are considered when general system layout is determined. Cost benefit Analysis (CBA) is generally not used in this respect.
‐ How trade‐offs between network development and alternative technologies are treated
N/A
‐ Requirements to integrate cost benefit analysis
N/A
DSOs can demand that the embedded generator is removed from the collective grid
when making work on the grid. As of 2013 there were 1,719,531 smart meters
installed in Denmark. DSOs have to extend the installation of smart meters to all end
customers by the year 2020.

262
4.2. Distribution system operations
The key features of distribution system operations are summarized below.
Table 109: Approach to distribution planning
Issue Approach
Requirements for dispatch of renewable plants connected to DSO network
DSOs can demand that the embedded generator is removed from the collective grid when making planned work on the grid. They have to give notice in good time. If a situation arises that require immediately work on the grid the DSO can remove it without warning. The DSO can remove the embedded generator from the collective grid without warning also in cases of breach of contract.
Possibility to dispatch flexible loads None
Other sources of flexibility open to DSO None
4.3. Metering
Key issues regarding metering, and the role of the DSOs, are set out in the following
table.
Table 110: Key approach to metering
Issue Approach adopted
DSOs role in metering a) DSOs own most part of the metersb) DSOs are responsible for the collection of data from the meter c) the DSOs are responsible for sending the information to a Datahub. This datahub is controlled by the TSO which also has the responsibility for the easy access to that data for relevant third‐parties.
Monopoly services in the metering
DSOs are monopolists in metering activities
Smart metering functionality
The technical requirements for smart meters are provided by the executive order about smart meters and metering of electricity consumption. (https://www.retsinformation.dk/Forms/R0710.aspx?id=160 434). This shows that the smart meters should be able to: a) quarter‐of an hour measurement (registration every 15 minutes or at shorter intervals) b) remote reading f) local port to send real time consumption information to a local screens or computers In addition, the smart meters should be able to: • Change the settings for the recording rate via a remote reading system • Store the measured data for use of billing • Register supply interruptions and on request from the grid company transfer data about interruptions • Show accumulated values delivery of electricity and the current electrical power Finally, it should be possible for the consumer by open standards to connect external devices to the remote reading of smart meters and extract relevant current consumption data.

263
As of 2013 there were 1,719,531 smart meters installed in Denmark.
The Danish Energy Agency issued in December 2013, an executive order requiring to
network operators to install electricity smart meters for all electricity consumers by the
year 2020.

264
Country Report – Denmark (Gas)
1. Overview of to the distribution sector
1.1. Institutional structure and responsibilities
In Denmark there are 3 distributors. Data on total number of gas supplied customers is
not available. Summary data on industry structure is set out below.
Table 111: DSO characteristics
Total number DSOs
Ownership unbundled
Legally unbundled
Less than 100,000 customers
Exemption* Share of total demand(DSOs <100,000 customers)
Country 3 0 3 260 Yes <10%
*accounting/functional only unbundling requirements for DSO with less than 100,000 customers.
The responsibility for setting distribution tariffs is spread between the following
jurisdictions (for example):
The DSO
The NRA (The Danish Energy Regulatory Authority –DERA‐)
Government (Ministry of Climate, Energy and Building)
The breakdown of responsibilities as it related to tariff setting is summarized in the table
below.
60 CEER, Status Review on the Transposition of Unbundling Requirements for DSOs and Closed Distribution System Operators, 2013.
In Denmark, the distribution sector is concentrated, with the state owned DSO DONG
Disttribution serving more than 90% of gas end customers. Competences for energy
regulation in Denmark are split between the Danish Energy Regulatory Authority –
Energistyrelsen‐ and the Danish Energy Agency.

265
Table 112: Legal basis for tariff structure – Roles and Responsibilities in setting distribution tariffs
Actor Allowed revenues (tariff level)
Tariffs (tariff structure)
Connection charges
Regulated services
DSO Also involved Calculates for NRA approval
Calculates for NRA approval
N/A
Government Defines main principles
Defines main principles
Defines main principles
N/A
NRA Calculates and approves
Approves methodology
Approves methodology
N/A
X = main responsibility; other options to fill the table: sets rules; monitors ex‐post; defines main principles;
calculates for NRA approval; also involved;
The regulatory process adopted to setting distribution tariffs involves the following
steps:
The Ministry issues principles in the primary law.
The regulator held a public hearing and issues a consultation paper on methodology.
The regulator approves methodology for tariff structure proposed by the DSO.
The DSO calculates the tariffs and reports these to regulator.
1.2. Key figures on revenue and tariffs
Distribution revenues in 2013 were DKR 1,500 million. No further split by service type or
number of customers for each category is available.
2. Regulation of distribution activities
2.1. General overview
The Danish Energy Regulatory Authority (DERA) regulates the Danish markets for
electricity, natural gas and district heating. In the natural gas market, the regulation
focuses on network companies. DERA also controls the prices and access conditions of
the two Danish storage facilities. Finally, DERA sets the price for natural gas supplied by
the natural gas companies with an obligation to supply.
The distribution sector is regulated under a concession regime. An incentive‐based form
of regulation is applied.
The distribution tariff is itemized separately to end‐users.
Key features of the regulatory regime are set out in the following table
The distribution sector is regulated under a concession regime. An incentive‐based form
of regulation is applied with a revenue cap and benchmarking of operating expenditure.

266
Table 113: Main features of the regulatory regime
Issue Approach
Type of regime (concession/licence) Concessions are tendered for a period of 20 years.
Duration of tariff setting regime 4 years regulatory period. Allowed revenue is assessed annually and distribution tariffs are revised accordingly.
Form of determination (distributor propose/regulator decide)
Regulator approves methodology
Scope for appeal regulatory decision DERA decisions can be appealed to the Energy Board of Appeal
2.2. Main incentive properties of the distribution regulatory model
The following key regulatory incentives apply for the DSOs:
Revenues may depart from actual costs in order to provide incentives to reduce costs.
Elements of output regulation: the regulator focus on costs based on the assumptions
that the DSO will have to satisfy all the reasonable demands for service
At the same time the following tools are provided to mitigate risks:
If DSOs do not set tariffs such that the revenue cap is fully utilised, the gap between
income and revenue cap can be transferred to the following two years. That is, the
allowed revenue in the following two years will increase in this case. On the other hand,
if income exceeds tariffs by a certain amount of money, the DSO must pay back this
amount by lowering tariffs over the following two years.
If revenues fall short of the revenue cap, for instance because of a reduction in demand,
the missing revenues can be recovered over the following years.
DSOs are benchmarked against each other on operating costs. If however an
extraordinary event occurs which forces extraordinary costs on the DSO in a particular
year, the DSO can apply for an exemption of these costs from benchmarking.
There’s no quality of service regulation implemented. However, technical standards on
quality of service are set by the Danish Safety Technology Authority
(Sikkerhedsstyrelsen).
2.3. Determination of cost of service parameters
The approach to determining key cost of service parameters are summarized in the
following table.

267
Table 114: Approach to key cost of service parameters
Parameter Approach
Form of price control Revenue Cap
Regulatory asset base Book Value
Capital expenditure N/A
Approach to operating expenditure Benchmarking of operating costs. The results enters into the revenue cap. Benchmarking is based on a unit cost model.
Form of capital remuneration applied” (WACC real, nominal, ten years Treasury bond + adder, …)
N/A
Additional revenue items (where applicable) N/A
The following formula is applied in determining the WACC:
Where:
KE = rf + β MRP is the cost of equity
MRP is the Market RiskPremium
KD is the cost of debt
te is the corporate tax rate
The WACC is updated every fourth year ahead of a new regulatory period. Latest update
was in 2013 counting for the regulatory period 2014‐17.
The debt leverage is set by law.
3. Tariffs for distribution services
All consumers are charged only an energy‐related (per m3) distribution tariff. There are
3 DSOs, each one charges different tariffs (corresponding to its allowed revenues). Small
consumers pay a standard connection charges depending on the expected consumption.
For larger consumers the connections charge is the part of the investment which is not
covered by tariff payment within 3‐5 years.

268
3.1. Distribution tariffs: additional issues
The DSO is in charge of setting the distribution tariffs (based on allowed revenues). All
costs are recovered by an energy‐related (per m3) distribution tariff. All consumers are
charged only an energy‐related (per m3) distribution tariff.
Various other aspects of distribution tariff setting are summarized in the table below.
Table 115: Approach to key issues in setting distribution tariffs
Issue Approach
Treatment of distribution losses Yes the energy related component of the distribution tariff includes the cost of losses.
Presence of uniform tariffs There are 3 DSOs, each one charges different tariffs (corresponding to its allowed revenues)
Presence of non‐linear tariffs The first m3 consumed in a year are more expensive, for higher consumption the unit tariff is lower.
Presence of regulated retail tariffs Some suppliers have (through a tender) won a concession for an obligation to supply natural gas at a specific price (revenue cap) set by the tender. The obligation to supply is for a specific geographical area, and all consumers have the possibility to choose the obligation to supply product.
Presence of social tariffs None
DSOs cost to generate energy savings is funded via an additional tariff component of the
distribution tariff
3.2. Connection and capacity issues
Key issues in the setting of connection charges are set out in the table below.
Table 116: Summary of key issues relating to connection charges
Issue Approach
Determination of charges
Type of charges (shallow/deep)
Shallow charges for consumersand embedded generators
Methodology adopted
Small consumers pay a standard connection charges depending on the expected consumption. For larger consumers the connections charge is the part of the investment which is not covered by tariff payment within 3‐5 years. The difference must be paid up front. Very large consumers can choose between the model for large consumers or pay the whole installation cost up front – in return they get a reduced tariff over a ten year period.
Hosting capacity Scope to refuse connection
In principle obligation to connect (subject to payment), but right to refuse access if
capacity not sufficient

269
Issue Approach
substantial economic or financial problems with take‐or‐pay‐clauses, in which case DSOs can ask minister for a temporary derogation from obligation to give access.
Requirements to publish hosting capacity
The DSO has a duty to map and publish the consumption of natural gas in the supply area.
Targets and/or incentive schemes to enhance hosting capacity
None
4. Distribution system development and operation
4.1. Distribution system development
The key features of distribution system planning are summarized below.
Table 117: Approach to distribution planning
Issue Approach
Form of distribution planning document
‐ Key responsibilities for its development Distribution system development plans are not regulated.
‐ Degree of integration with environmental policies
There is a provision in the Natural Gas Act which obliges DSOs and the TSO to connect installations for the upgrading of biogas in view of injection in the natural gas network.
‐ Relationship with quality of service targets
None
‐ How trade‐offs between network development and alternative technologies are treated
N/A
‐ Requirements to integrate cost benefit analysis
N/A
4.2. Metering
Key issues regarding metering, and the role of the DSOs, are set out in the following
table.
Distribution system development plans are not regulated. There is a provision in the Natural
Gas Act which obliges DSOs and the TSO to connect installations for the upgrading of biogas
in view of injection in the natural gas network. DSOs have full responsibility for metering,
and own the meters.

270
Table 118: Key approach to metering
Issue Approach adopted
DSOs role in metering DSOs have full responsibility for metering, and own the meters.
Monopoly services in the metering DSOs are monopolists in metering activities
Smart metering functionality N/A

271
Country Report – Spain (electricity distribution)
1. Overview of to the distribution sector
1.1. Institutional structure and responsibilities
In Spain there are five large distributors supplying electricity to 29.5 million customers
covering an area of 600.000 km2. Summary data on industry structure is set out below.
Table 119: DSO characteristics
Total number DSOs
Ownership unbundled
Legally unbundled
Less than 100,000 customers
Exemption* Share of total demand
Country 342 N.a. All 325 Yes, embedded generators pay a € 0.5 / MWh rate
Less than 5%
*exemption from distribution network charges for certain types of grid users, such as low‐carbon generation connected to distribution networks.
The responsibility for setting the distribution tariff level is split between the Government
(specifically, the Ministry of Industry, Energy and Tourism) and the Regulator. The
Government (the Ministry of Industry, Energy and Tourism) is responsible for setting the
methodology, setting the values and providing final approval of the allowed revenues
(tariff levels). The regulator provides its opinion on the Ministry´s proposals.
In relation to the definition of the tariff structure, the regulator is responsible for setting
the tariff structure. However, a draft amendment to the Electricity Act, which is still
under parliamentary procedure, provides that the definition of the tariff structure will
be assumed by the Ministry of Industry, Energy and Tourism. Connection charges are
defined and set under the following approach: the regulator proposes, and the Ministry
approves.
There are 26 large scale electricity distributors in Spain; distributors with a customer
base of less than 100.000 customers are responsible for supplying less than 5% of
national electricity demand.
The Government has the main responsibility for setting the allowed revenues of
DSOs; the regulator establishes the tariff structure.

272
The breakdown of responsibilities as it related to tariff setting is summarized in the table
below.
Table 120: Legal basis for tariff structure – Roles and Responsibilities in setting distribution tariffs
Actor Allowed revenues (tariff level)
Tariffs (tariff structure)
Connection charges
DSO Not involved Not involved ‐
Government Sets methodology, values and provides final approval
Not involved Provides approval (or not) on NRA´s proposals
NRA Provides opinion on Governments proposals
Sets the tariff structure (1)
Proposes the connection charges
X = main responsibility; other options to fill the table: sets rules; monitors ex‐post; defines main principles;
calculates for NRA approval; also involved;
(1) A draft amendment to the Electricity Act, which is still under parliamentary procedure, provides that the
definition of the tariff structure will be assumed by the Ministry of Industry, Energy and Tourism.
1.2. Key figures on revenue and tariffs
Distribution revenues in Spain in 2013 were € 5070 million, broken down by the
following activities:
Distribution – € 4.906 million (y%), of which:
o Revenues for DSOs with More than 100.000 customers: € 4.580 million
o Revenues for DSOs with Less than 100.000 customers: € 325,2 million
Quality of service ‐ € 74.2 million
Loss incentive – € 90.000
A breakdown of revenue by customer category, including information on the number of
customers in each category is set out in the table below. It must be noted that typical
customer categories (such as ´residential´, ´small industry´, etc.) are not used in Spain.
Instead, customer tariff groups (customer classes) are generally based on the customer´s
voltage connection. The final amount that each customer pays is based on two
components: a per‐kW charge (contracted power) and a per‐kWh charge.

273
Table 121: Tariff components, customers and revenues per customer class
Voltage Customer classes
Contracted power
Tariff components
Number of customers
Revenue
Low Voltage (< 1 kV)
2.0A
< 10 kW
KWh, KW 24848664 Not publicly‐available
2.0DHA KWh, KW 1098107 Not publicly available
2.0DHS KWh, KW 1032 Not publicly available
2.1A >10 kW and < 15 kW
KWh, kW 686640 Not publicly available
2.1DHA KWh, kW 171844 Not publicly available
2.1DHS KWh, kW 15 Not publicly available
3.0A > 15 kW KWh, kW 742267 Not publicly available
More than (or equal to) 1 kV and less than 36 kV
3.1A < 450 kW KWh, kW 83390 Not publicly available
6.1A > 450 kW KWh, kW 19538 Not publicly available
More than (or equal to) 36 kV and less than 72,5 kV
AT2 KWh, kW 1604 Not publicly available
More than (or equal to) 36 kV and less than 72,5 kV
AT3 KWh, kW 423 Not publicly available
More than (or equal to) 145 kV
AT4 KWh, kW 546 Not publicly available
Total ‐ 26961043 Not publicly available
Customers can be grouped based on the voltage level of their connection, as follows:
Low voltage (< 1 kV) with contracted power less than 15 kW, includes groups 2.0A;
2.0DHA; 2.0DHS; 2.1A; 2.1DHA; 2.1DHS. This group can be considered as being roughly‐
equivalent to ´Household´;
Low voltage (< 1 kV) with contracted power higher than 15 kW (3.0A) and More than (or
equal to) 1 kV and less than 36 kV with contracted power less than 450 kW (3.1A): This
group can be considered as being roughly‐equivalent to ´Commercial´;
More than (or equal to) 1 kV and less than 36 kV with contracted power higher than 450
kW: this group includes the 6.1A. This group can be considered as being roughly‐
equivalent to ´small industry´;
More than (or equal to) 36 kV and less than 72,5 kV: this is AT2 customers, which are
generally large industrial customers;
More than (or equal to) 72,5 kV and less than 145 kV: this is AT3 customers, which are
generally large industrial customers; and
More than (or equal to) 145 kV: this is AT4 customers, which are generally large
industrial customers.
The breakdown of energy volumes by customer category are set out in the charts below.

274
Figure 34: Proportion of energy accounted by customer categories
In general, the revenues received per customer category in 2013 were roughly in‐line
with the actual energy consumed per category. However, the revenue contribution of
residential customers is slightly higher than that of industrial customers, based on the
unit consumption of energy. Commercial customers provide a disproportionally low
share of costs; that is, based on its actual energy consumption (30% of all consumption)
its contribution to total revenues is low (23% of all allowed revenues).
2. Regulation of distribution activities
2.1. General overview
DSOs in Spain to provide feedback to the Government on its proposals for the allowed
revenues; they also propose and apply connection charges. DSOs are also driven to
improve the efficiency of their activities, through the use of incentives, and hence they
are partly responsible for promoting competition in the retail markets.
The distribution sector is regulated mainly under an incentive‐based regime (based on reference unit investment costs and O&M costs).
The remuneration of the distribution activity provides incentives to increase the efficiency of the management, the economic and technical efficiency and the quality of the electricity supplied.

275
The distribution sector is regulated mainly under an incentive‐based regime (which
considers reference unit investment costs and O&M costs).
The distribution tariff is bundled into an integrated tariff, which also includes the
transmission tariff component; the overall tariff is known as the Access Tariff. The
Access Tariffs also includes the transmission and distribution costs, but also, other cost
like the removable premium scheme incentives, the nuclear moratorium, deficit of
previous years, and non‐peninsular compensation.
Key features of the regulatory regime are set out in the following table
Table 122: Main features of the regulatory regime
Issue Approach
Type of regime (concession/licence) N.a.
Duration of tariff setting regime Allowed revenues are assessed annually, and tariffs are review every three months
Form of determination (distributor propose/regulator decide)
The Government proposes and develops the methodology and allowed tariffs / revenues values; the regulator provides its opinion on the Government´s proposals
Scope for appeal regulatory decision DSOs can appeal to the Court of Law
2.2. Main incentive properties of the distribution regulatory model
The following key regulatory incentives apply for the DSOs:
Incentives to reduce the actual investment cost (compared to the unit investment cost);
Incentives to reduce losses;
O&M efficiency improvement incentives
Quality of service; and
Incentives for combating fraud.
No specific tools or mitigation measures are used to mitigate risks.
The remuneration of the distribution activity provides incentives to increase the
efficiency of the management, the economic and technical efficiency and the quality of
the electricity supplied. CNMC monitors compliance with quality of service standards in
distribution through two main indexes, TIEPI and NIEPI, which measure, respectively, the
time and number of supply interruptions (in terms of equivalent power interrupted). A
DSO´s allowed revenues are increased (or decreased) if they perform better (or worse)
than some predefined quality targets.
2.3. Determination of cost of service parameters
The approach to determining key cost of service parameters are summarized in the
following table.

276
Table 123: Approach to key cost of service parameters
Parameter Approach
Form of price control Revenue‐cap based with efficiency adjustments
Regulatory asset base The unit investment costs used to determine investment values, and which determine the RAB, are updated yearly according to a methodology established by the regulator.
Capital expenditure Allowed CAPEX is based on a comparison of unit investment costs plus incentives to reduce investment costs
Approach to operating expenditure Incurred OPEX plus efficiency incentives
Form of WACC applied The WACC formula is not currently applied in the calculation of allowed RoR. The allowed RoR is based on the Spanish 10‐year bond plus 200 basis points
3. Tariffs for distribution services
3.1. Distribution tariffs
In the allocation of costs between customer categories, the methodology established by
the regulator (Circular 3/2014) considers two types of costs: distribution network costs and
commercial service costs provided by the distributors.
The Distribution network costs methodology involves the:
Breakdown of the distribution cost by voltage level;
Breakdown of the distribution cost of each voltage level between cost associated with
power and cost associated with energy;
Breakdown of the distribution cost associated with power of each voltage level by time
period. The cost associated with power of each time period is allocated to each tariff
using a simplified network model; and
Breakdown of the distribution cost associated with energy of each voltage level by time
period. The cost associated with energy of each time period is allocated to each tariff
using a simplified network model.
The Commercial service costs are distributed among tariffs depending on the number of
consumers supplied under each tariff.
In the allocation of costs between customer categories, distribution network costs
and commercial service costs are both taken into account.
Tariffs are geographically uniform, linear and are not regulated.
Connection costs are shallow in nature, and are based on standard costs (but these
can be challenged).

277
The tariff structure for each class of electricity consumers (excluding connection
charges) includes that all tariffs have two components, a per kW charge (contracted
power) and a per kWh charge. The available tariffs include:
Low Voltage (< 1 kV):
Contracted power < 15 kW
2.0TD – 1 time period (energy and power)
2.02TD – 2 energy time periods and 1 power time period
2.03TD – 3 energy time periods and 1 power time period
Contracted power > 15 kW
3.0A – 3 time periods (energy and power)
High Voltage (> 1 kV):
All tariffs have 6 time periods (energy and power)
6.1TD: Voltage level 1 – 36 kV
6.2TD: Voltage level 36 – 72.5 kV
6.3TD: Voltage level 72.5 – 145 kV
Various other aspects of distribution tariff setting are summarized in the table below.
Table 124: Approach to key issues in setting distribution tariffs
Issue Approach
Treatment of distribution losses Not included as separate tariff component. The distribution losses, as the transmission losses, are part of the generation costs.
Presence of uniform tariffs Yes
Presence of non‐linear tariffs No
Presence of regulated retail tariffs No
Presence of social tariffs Yes, social tariffs are available for consumers who meet certain criteria including: being a large family; a pensioner older than 60 years with a minimum pension; families where all members are unemployed; or low voltage consumers (less than 1 kV) with contracted demand lower than or equal to 3 kW.
As of 1st April 2014, “last resort tariffs” are only available to the following types of
consumers, and in the following terms:
Vulnerable consumers: in this case, the last resort tariff will be 25% lower than the PVPC;
and
Consumers that do not have the right to be supplied under the regime of voluntary price
for small consumers, and do not have a free market supply contract in force. In this case,
the last resort tariff will be 20% higher than the PVPC.
Embedded generators pay a transmission/distribution tariff of 0.5 €/MWh.

278
3.2. Connection charges
Key issues in the setting of connection charges are set out in the table below.
Table 125: Summary of key issues relating to connection charges
Issue Approach
Determination of charges
Type of charges (shallow/deep)
Shallow
Methodology adopted Standard costs (to determine the connection charges) are approved by the Ministry following the proposal of the NRA. The proposal is based on actual costs declared by the DSOs. For new supply points or the extension of existing points below 100 kW in LV and 250 kW in HV in urbanized areas, connection fees are established through regulation. For other situations, connection costs are computed on a case‐by‐case basis and paid by the applicant.
Hosting capacity Scope to refuse connection It may only refuse a connection if it lacks the required capacity to make the connection.
Requirements to publish hosting capacity
No
Targets and/or incentive schemes to enhance hosting capacity
No
The DSOs are not required to notify the regulator of their hosting capacities. There is
also no specific regulation which does not hamper investment and which implies
additional OPEX (for example, smart grid technology, the use of demand side flexibility
for grid services, etc.).
4. Distribution system development and operation
4.1. Distribution system development
The key features of distribution system planning are summarized below.
DSOs develop investment plans with 3‐year horizons; these plans take into
consideration consumption forecasts and quality of service targets.
DSOs are not permitted to dispatch renewable and flexible loads.
DSOs have full responsibility for metering activities and there are plans to roll out
smart meters in the distribution sector in three time stages in the period out to 2018.

279
Table 126: Approach to distribution planning
Issue Approach
Form of distribution planning document Investment plan looking 3 years ahead
‐ Key responsibilities for its development Distribution Companies must submit their investment plans for the following 3 years to the Government and Regional Authorities for approval by 1 May of each year. The information is assessed by the regulator and there is a maximum level of investment established
‐ Degree of integration with renewables plan
No relation
‐ Relationship with consumption trends The evolution of consumption in the distribution area is explicitly considered in the development plan
‐ Relationship with quality of service targets
Quality of service targets are explicitly taken as an input in the distribution development plan
‐ How trade‐offs between network development and alternative technologies are treated
Not treated
‐ Requirements to integrate cost benefit analysis
No requirements; only general targets are included and integrated
4.2. Distribution system operations
The key features of distribution system operations are summarized below.
Table 127: Approach to distribution planning
Issue Approach
Requirements for dispatch of renewable plants connected to DSO network
Small and embedded renewable plants (such as domestic PV) are not dispatched. Larger embedded generators are dispatched, but not by the DSO. Rather, they are dispatched by the transmission system operator.
Possibility to dispatch flexible loads No
Other sources of flexibility open to DSO DSOs do have access to other sources of flexibility, such as batteries and capacitors
4.3. Metering
Key issues regarding metering, and the role of the DSOs, are set out in the following
table.
Table 128: Key approach to metering
Issue Approach adopted
Discos role in metering DSOs have full responsibility for metering
Monopoly services in the metering DSOs are monopolists in metering
Smart metering functionality Meters have the following functions:
Active Energy and Reactive Energy.
Maximum demanded power (15 ‘)
Hourly meter ‐> Capacity to store data

280
Issue Approach adopted
about 3 months.
Able to manage flexible tariffs: 6 Tariff Periods ‐> Capacity to store data for 3 bills.
Registers have the following functions:
Quality Parameters
Events (alarms, changes in billing configuration, fraud detection, etc.)
Shows different information to user. Regarding power control, the following functionalities:
Power Limiter (contracted power)
Cut‐off elements: inside or, at least, controlled by the meter
Manual or Automatic Reconnection
The rollout of smart meters in Spain is planned to be undertaken in stages, to the period
up to the end of 2018. Specifically, the deadlines for the replacement of electricity
metering systems for consumers with contracted power lower than 15 kW, and the
installation of new intelligent metering systems able to provide time discrimination and
remote control are:
a) Before 31th December 2014, 35% of all the meters of each distribution company
shall be replaced with a smart meter. This is equivalent to around 10.000.000
smart meters.
b) Between January 1st, 2015 and December 31st, 2016, another 35% of all the
meters of each distribution company shall be replaced with a smart meter.
c) Between January 1st, 2017 and December 31st, 2018, the final 30% of all the
meters of each distribution company shall be replaced with a smart meter.
Data related to the numbers of smart meters currently installed per customer category
is not available. Similarly, information on the cost‐ and energy‐saving impacts resulting
from roll out of smart meters to‐date is not available.

281
Country Report – Spain (gas distribution)
1. Overview of to the distribution sector
1.1. Institutional structure and responsibilities
In Spain there are 4 distribution groups supplying gas to 7448827 customers (in 2013).
Summary data on industry structure is set out below.
Table 129: DSO characteristics
Total number DSOs
Ownership unbundled
Legally unbundled
Less than 100000 customers
Exemption* Share of total demand
Country 6 DSO groups (some of them have several affiliates, but under the same branch)
‐2 All 2 No Negligible
*exemption from distribution network charges for certain types of grid users, such as low‐carbon generation connected to distribution networks.
In the process of setting distribution tariffs the responsibilities of the involved parties is
as follows. The Government (Ministry) issues the revenue calculation methodology and
relevant principles in the primary law. It also calculates the allowed revenue and
approves that amount. The regulator is involved in the process, insomuch as it is allowed
There are four main large DSOs groups operating in Spain´s gas distribution sector,
and of which 2 are ownership unbundled and the other 2 are legally unbundled. The
share of total gas demand met by two DSOs which serve a customer base of 100000
or fewer is very limited.
The Government is the main entity responsible for deciding the level of allowed
revenues; the NRA is responsible for proposingthe tariff structure. It must be noted,
however, that the actual TPA tariff is bundled into a single tariff which includes the
gas transmission tariff. The current TPA tariffs are published on the Spanish Official
Botelin (BOE)

282
to provide a non‐binding opinion, which the Government can choose to take into
consideration or not.
CNMC is currently developing the methodology to allocate the distribution costs to the
tariffs. Until CNMC not approve this new methodology, the Ministry of Industry, Energy
and Tourism will establish the distribution and transmission tariff. The methodology
used by the Ministry is not publicly available.
The breakdown of responsibilities as it related to tariff setting is summarized in the table
below.
Table 130: Legal basis for tariff structure – Roles and Responsibilities in setting distribution tariffs
Actor Allowed revenues (tariff level)
Tariffs (tariff structure)
Connection charges
DSO Not involved Not involved Calculates and offers clients a quote, when pressure >4 bar. Not involved for clients connected with pressure <4 bar
Government Defines main principals and calculates and proposes amounts
Not involved Not involved
NRA Can offer a non‐binding opinion on the Government´s proposals
Sets the tariff structure
The Regional Authorities (not the NRA) may review a DSO´s price estimate if the client requests
X = main responsibility; other options to fill the table: sets rules; monitors ex‐post; defines main principles;
calculates for NRA approval; also involved;
1.2. Key figures on revenue and tariffs
Distribution revenues in Spain in 2013 were € 1.502.238 million; the breakdown of
allowed revenues for each component activity is not published.
Moreover, it must be understood that in Spain, distribution tariffs are paid within a
single tariff package which also includes the transmission tariffs. Indeed the two tariffs –
distribution tariffs and transmission tariffs – are not separated: only the final tariff is
published. Hence it is not possible to calculate the revenues allowed for distribution
activities by individual customer categories. However, it is possible to define the various
customer categories used and the tariff components (albeit without costs) within each
customer category.
All tariffs paid by end‐customers (which include both distribution and transmission
tariffs) have two components:
For consumers connected to a gas pipeline whose design pressure is higher than 4 bars
(also including the tariff 3.5), the following charges apply: (1) a capacity‐related charge,

283
based on the contractual maximum daily withdrawal capacity, and (2) an energy‐related
component; and
For consumers connected to a gas pipeline whose design pressure is less than or equal
to 4 bars, (with the exception of the tariff 3.5), the following charges apply: a per‐
customer component and an energy‐related component.
Group 1 ‐ Consumers connected to a gas pipeline whose maximum design pressure is
higher than 60 bars.
Tariff 1.1: consumption less than or equal to 200,000,000 kWh/annum;
Tariff 1.2: consumption of more than 200,000,000 kWh/annum and less than or equal to
1,000,000,000 kWh/annum; and
Tariff 1.3: consumption of more than 1,000,000,000 kWh/annum.
Group 2 ‐ Consumers connected to a gas pipeline whose design pressure is higher than 4
bars and lower than or equal to 60 bars
Tariff 2.1: consumption less than or equal to 500000 kWh/annum;
Tariff 2.2: consumption of more than 500000 kWh/annum and less than or equal to
5000000 kWh/annum;
Tariff 2.3: consumption of more than 5000000 kWh/ annum and less than or equal to
30000000 kWh/annum;
Tariff 2.4: consumption of more than 30000000 kWh/ annum and less than or equal to
100000000 kWh/annum;
Tariff 2.5: consumption of more than 100000000 kWh/ annum and less than or equal to
500000000 kWh/annum; and
Tariff 2.6: consumption of more than 500000000 kWh/ annum
Group 3 ‐ Consumers connected to a gas pipeline whose design pressure is less than or
equal to 4 bars
Tariff 3.1: consumption less than or equal to 5000 kWh/annum;
Tariff 3.2: consumption of more than 5000 kWh/annum and less than or equal to 50000
kWh/annum;
Tariff 3.3.: consumption of more than 50000 kWh/annum and less than or equal to
100000 kWh/annum;
Tariff 3.4: consumption of more than 100000 kWh/annum less than or equal to 8
GWh/annum; and
Tariff 3.5: consumption of more than 8 GWh/annum
Group 4 ‐ Industrial gas consumers which are interruptible.
Table 131: Tariff components, customers and revenues per customer class
Customer classes Tariff components Number of customers (2013)
Revenue
Group 1 KWh; capacity charge 114 Data unavailable
Group 2 KWh; capacity charge 4108 Data unavailable
Group 3 kWh; customer component
7444598 Data unavailable
Group 4 kWh; customer 7 Data unavailable

284
component
Total ‐ 7448827 Data unavailable
The breakdown of energy volumes by customer category is set out in the chart below.
Information concerning the breakdown of allowed revenues by customer category is not
publicly‐available.
Figure 35: Proportion of energy consumed by customer categories
35%
40%
24%
1%
Energy share
Group 1 Group 2 Group 3 Group 4
The typical network tariff in 2013 for residential, small and large industrial customers is
illustrated below. It must be noted that the tariffs include the costs applied for both
distribution and transmission services. Tariffs for distribution and transmission services
are applied as a single tariff in the Spanish gas sector and it is not possible to separate
the two activities´ tariff components (because this is not published by the Government
and is therefore not publicly‐available).
Table 132: Breakdown of annual charges – typical customer types, 2013 (€)
Customer type
Notional Energy usage
Fixed charges Energy charges Total
Residential (1) Tariff 3.2
15000kWh 81,15 321,692,1446 c€/kWh
403
Industrial and 7,000 use hours (Tariff 2.4)
50000000 kWh 104682 548000,1096 c€/kWh
159482
Industrial and 7,000 use hours (Tariff 2.4)
90000000 kWh 188428 986400,1096 c€/kWh
287068

285
The resulting average tariffs per kWh are illustrated below. Again, please note that these
average charges include both the distribution and transmission tariff components.
Figure 36: Average network charges (€cents/kWh), 2013
2.686
0.319 0.3190.0000
0.5000
1.0000
1.5000
2.0000
2.5000
3.0000
Household Small industrial Large industrial
2. Regulation of distribution activities
2.1. General overview
The role of DSOs in the Spanish gas sector is to deliver gas to customers as cost‐
efficiently as possible and also to promote the consumption of gas (switching from fuel
consumption with higher levels of greenhouse gas emissions, or with a higher price or
more inconvenient)) by increasing the numbers of gas grid‐connected customers.
The distribution sector is regulated under a mixed regulatory regime which specifically
includes:
Cost reimbursement: Asset value and OPEX were first evaluated in 2002 in order to fix
the allowed revenues; a recent revision of allowed revenues was done in 2014
Price cap: After 2002, the allowed income was incremented every year by
[0,85*Inflation index] plus the incentive; the yearly update by Inflation was removed
from the methodology in 2014.
Incentive based (or output‐based) important incentives (positive o negative) according
the evolution of 2 outputs:
Distribution activities are regulated under a mixed regulatory regime, composed of
cost reimbursement, an income Price cap and incentives. Performance incentives are
based on energy delivered and the number of customers connected to the grid.
The regulator does not monitor DSOs´ planned investments, and DSOs do not require
the regulator´s approval to make specific investments.

286
o Energy delivered through the distribution network; and
o Number of consumers connected.
Key features of the regulatory regime are set out in the following table
Table 133: Main features of the regulatory regime
Issue Approach
Type of regime (concession/licence) DSOs are subject to an authorisation regime (not concession regime) – authorisations do not have limited durations.
Duration of tariff setting regime Tariffs are examined (and adjusted if necessary) every year
Form of determination (distributor propose/regulator decide)
Government proposes and decides; regulator is allowed to offer an opinion
Scope for appeal regulatory decision None
2.2. Main incentive properties of the distribution regulatory model
DSOs are incentivised to reduce their costs because their allowed revenues are based on
the energy supplied through their distribution network and the number of connected
customers. This arrangement contrasts with a hypothetical situation where costs could
be, for example, based on actual incurred costs: under such a regime, the DSO would
not be incentivised to reduce its costs (because it would know that its costs would be
reimbursed in any case).
There are no specific risk mitigation measures in effect in the Spanish gas distribution
sector. The revenues are allowed to be adjusted at the end of the regulatory period, but
there are no automatic adjustment mechanisms envisaged within the regulation.
By allowing that the changes in DSOs´ allowed revenue are based on two factors, namely
the energy delivered through the distribution network, and the number of consumers
connected to the network, DSOs should be incentivised to expand the gas grid to new
consumers and new areas.
The regulator does not monitor DSOs´ planned investments, and DSOs do not require
the regulator´s approval for making specific investments. This is because the output
model ensures that DSOs should not make inefficient investments, because they would
lose money on those (inefficient) investments.
Key components of quality of service regulation are that there are discounts in DSOs´
tariffs in the event of disruptions to the gas supply occurring, specifically:
A 10% discount is allowed in compensation for gas interruptions of between 5 and 24
hours duration, and
Progressive discounts are allowed in compensation for longer interruptions, and
equivalent of up to 50% discount on the DSO tariff.

287
2.3. Determination of cost of service parameters
The approach to determining key cost of service parameters are summarized in the
following table.
Table 134: Approach to key cost of service parameters
Parameter Approach
Form of price control Price cap, with output‐based incentives
Regulatory asset base The RAB was first evaluated in 2002, and allowed initial income and then adjusted annually based on inflation, the increase/decrease in gas demand and changes in the number of customer connections. This method was then discontinued in 2014, and the Ministry adjusted the allowed income manually; however, the methodology used to adjust the allowed revenue is not publicly‐disclosed.
Capital expenditure Not specified / publicly‐available
Approach to operating expenditure Not specified / publicly‐available
Form of WACC applied Unknown
The WACC formula is not published by the Government in its calculations of allowed
revenues and tariffs.
3. Tariffs for distribution services
3.1. Distribution tariffs
The methodology for the allocation of costs between customer categories is currently
under review. CNMC, the Competition and Markets Commission, is currently developing
the methodology to allocate the distribution costs to the tariffs. Once CNMC approves
this new methodology the Ministry of Industry, Energy and Tourism will establish the
distribution and transmission tariffs using a currently‐unknown (not publicly‐available)
methodology.
The Ministry of Industry, Energy and Tourism publishes the distribution and transmission
tariff structures and values in the Official Gazette.
The Government is responsible for establishing the level of allowed tariffs, and the
regulator sets the tariff structure. Distribution tariffs are not published (or publicly‐
viewable); instead tariffs for distribution and combined with those of gas transmission,
into a single tariff which end‐users pay.
Connection charges are shallow in nature and based on standard costs.

288
Tariffs components are not differentiated based on the time of use, but there are
multiplier factors, with a level between 1 and 3, for short term contracts.
Various other aspects of distribution tariff setting are summarized in the table below.
Table 135: Approach to key issues in setting distribution tariffs
Issue Approach
Treatment of distribution losses Losses are settled between DSOs and retailers according to real losses, up to a 1% limit (over this limit, losses are covered by the DSO at their own expense)
Presence of uniform tariffs Yes, they are uniform throughout the entire country
Presence of non‐linear tariffs No
Presence of regulated retail tariffs Yes. For consumers connected to a gas pipeline whose design pressure is less than or equal to 4 bars and whose annual consumption is lower than or equal to 50,000 kWh/annum. Currently, around 30% of households in Spain are served under the regulated gas tariff
Presence of social tariffs No
The Ministry of Industry, Energy and Tourism publishes the distribution and transmission
tariff structures and values in the Official Gazette.
Tariffs components are not differentiated based on the time of use.
3.2. Connection charges
Key issues in the setting of connection charges are set out in the table below.
Table 136: Summary of key issues relating to connection charges
Issue Approach
Determination of charges
Type of charges (shallow/deep) Shallow
Methodology adopted Standard costs are approved by the Ministry for the connection fees (for connections of up to 4 bar pressure). For high pressure pipeline connections, the DSO makes an estimate based on its cost but the client is free to procure the necessary works from a different source. In both cases (low and high pressure), the client can ask the Regional Authorities to set the price

289
in the event that they do not agree with the DSO’s estimate.
Hosting capacity Scope to refuse connection No
Requirements to publish hosting capacity
DSOs are obliged to supply the gas system operator with a list of regional pipelines that are close to full capacity; it must do this on an annual basis. The system operator then publishes these lists.
Targets and/or incentive schemes to enhance hosting capacity
Not specified
The DSOs are not required to notify the regulator of the technical capacity of their
network.
Connection charges are composed of 2 different charges:
Grid connection charges – €106/m per building/premises (the first 6 meters of the
connection are free of charge) in low pressure pipeline connections; for pipeline
connections of up to 4 bar, the DSO is required to develop its quote; and
Customer connection charge – Around €200 per customer, including a full security check
of the customer´s gas installation, installing the meter and open de‐gas valve.
4. Distribution system development and operation
4.1. Distribution system development
The key features of distribution system planning are summarized below.
Table 137: Approach to distribution planning
Issue Approach
Form of distribution planning document Annual planning document describing the plans for developing the gas distribution grid
‐ Key responsibilities for its development DSOs develop the plans and submit them to the local governments/authorities, each year
‐ Degree of integration with renewables plan
N.a.
DSOs develop distribution planning documents once a year, and these are submitted to
the local authority; they are not integrated with renewable plans or quality of service
targets.
DSOs are fully responsible for providing metering services, and are monopolists.
The rollout of smart meters in the Spanish gas distribution segment has not been
successful in the past. There are no specific plans to rollout smart meters in the near
term future; indeed a decision has been taken not to pursue the rollout of smart meters
in the distribution sector.

290
‐ Relationship with consumption trends Not specifically addressed
‐ Relationship with quality of service targets
No relationship
‐ How trade‐offs between network development and alternative technologies are treated
The Spanish National Competition and Markets Commission (CNMC) undertook a Cost Benefit Analysis for the introduction of gas smart meters in Spain. The CNMC found that the CBA result was overall negative and has therefore recommended not to include any obligation of introducing smart meters in the gas distribution sector in Spain
‐ Requirements to integrate cost benefit analysis
No strict requirements to integrate; however, the CBAresults are public and have been shared with the regulator
4.2. Metering
Key issues regarding metering, and the role of the DSOs, are set out in the following
table.
Table 138: Key approach to metering
Issue Approach adopted
Discos role in metering DSOs have full responsibility for metering, and they own the majority of household meters: meters are rented to gas customers, but customers can also buy their own meters. Industrial customers usually own their own meters.
Monopoly services in the metering Yes
Smart metering functionality Not applicable, because smart meters have basically not been deployed to gas consumers in Spain.
The rollout of smart meters in Spain has neither been successful in the past nor are
there plans to do so in the near term future.
A Cost Benefit Analysis (undertaken by the Competition and Markets Commission) of the
scope for rolling out smart meters returned a negative overall result; hence, Spain
decided to not obligate to roll out smart meters for gas customers.
The cost benefit analysis was undertaken taking into consideration optimal future
development assumptions of smart meter systems, as well as costs taken from smart
meter CBAs in France and Great Britain.
At the current time, around 4.000 large customers have meter systems installed which
are capable of daily measurements, covering 80% of gas demand. There is no obligation

291
for smart meters to be installed for the approximately 7,5 million small customers in the
country.

292
Country Report – Finland (electricity distribution)
1. Overview of to the distribution sector
1.1. Institutional structure and responsibilities
Finland’s 15 largest electricity network companies are responsible for around 70% of the
distribution networks. The smallest electricity network companies in Finland operate
within the area of a single municipality, serving a few thousand customers.61 In Finland
there are 81 distributors supplying electricity to 3,1 million customers. The majority of
the DSOs are owned by municipalities or are listed companies controlled by the relevant
municipality. Summary data on industry structure is set out below.
Table 139: DSO characteristics
Total number DSOs
Ownership unbundled
Legally unbundled
Less than 100,000 customers
Exemption* Share of total demand
Finland 81 ‐ 52 73 No Approx.80%
*exemption from distribution network charges for certain types of grid users, such as low‐carbon generation connected to distribution networks.
The responsibility for setting distribution tariffs is held by the DSO only.
The breakdown of responsibilities as it related to tariff setting is summarized in the table
below.
61 Energy Market Authority, Key figures for electricity system operations in 2011
There are 80 DSOs operating in Finland, supplying power to some 3,1 million
customers.
DSOs set their own tariffs (including deciding on the structure of those tariffs) for
consumers.

293
Table 140: Legal basis for tariff structure – Roles and Responsibilities in setting distribution tariffs
Actor Allowed revenues (tariff level)
Tariffs (tariff structure)
Connection charges
DSO Calculates the tariffs Sets the tariff levels Sets the charges
Government Proposes the primary law to the Parliament
Not involved Not involved
NRA Issues the methodology for the revenue cap
Not involved Sets the methodology for the connection charges
X = main responsibility; other options to fill the table: sets rules; monitors ex‐post; defines main principles;
calculates for NRA approval; also involved;
The regulatory process adopted to setting distribution tariffs is such that the
Government develops the primary law which will guide the process, and based on this
the NRA issues the methodology to be used in calculating the revenue cap. Following
this methodology, the DSOs then calculate the tariffs to be offered to customers. In
terms of deciding the structure of the tariffs, the DSO has full responsibility and neither
the NRA nor the Government are involved.
If a DSO is considering affecting a price change, it is required to notify the Energy
Authority. However, it is not necessary to undertake a public consultation on any
proposed price change.
1.2. Key figures on revenue and tariffs Distribution revenues in Finland in 2013 were € 1.550 million. The breakdown of allowed
revenues to specific regulated activities is not publicly‐available.
Information on the available tariff components of each customer class is set out in the
table below. Information on the amounts of allowed revenues received, per customer
class, is not publicly‐available, and the Finnish NRA does not have that data.
Table 141: Tariff components, customers and revenues per customer class
Customer classes Tariff components Revenue
Residential KWh, kW, kVA Not available
Farming KWh, kW, kVA Not available
Small industry KWh, kW, kVA Not available
Mid‐sized industry KWh, kW, kVA Not available
Total ‐ Not available
The specific customer categories used for setting individual tariffs, are further broken
down from the tariff categories shown in the table above, and are defined as follows:
K1. A flat without sauna, main fuse 1x25 A, usage 2 000 kWh/annum
K2. Small house or apartment, with sauna, no electrical heating, main fuse 3x25 A,
usage 5000 kWh/annum
M1. Farm, no electrical heating, main fuse 3x35 A, usage 10000 kWh/annum

294
M2. Farm with live stock breeding, electrical heating, main fuse 3x35 A, usage 35000
kWh/annum
L1. House with electrical heating in every room,3x25 A, usage 18000 kWh/annum
L2. House with a partially storing electrical heating system, main fuse 3x25 A, usage
20000 kWh/annum
T1. Small industry, usage 150000 kWh/annum, peak power, 75 kW
T2. Small industry 600000 kWh/annum, peak power 200 kW
T3. Middle size industry, usage 2000000 kWh/annum, peak power 500 kW
T4. Middle size industry, usage 10000000 kWh/annum, peak power 2500 kW
Customer categories K1, K2, L1, L2, M1, M2, T1 and T2 are assumed to be connected to
the 0,4 kV network, and T3 and T4 are assumed to be connected to the 20 kV network.
The typical network tariff in 2013 for residential, small and large industrial customers is
illustrated below:
Table 142: Breakdown of annual charges – typical customer types, 2013 (€)
Customer type
Notional Energy usage
Fixed charges Energy charges Demand and reactive charges
Total
Residential 3500kWh 163 209 ‐ 372
Small commercial
50MWh 67 1941 1686 3694
Industrial 24000MWh 67 643920 56046 700033
The resulting average tariffs per kWh are illustrated below.
Figure 37: Average network charges (€cents/kWh), 2013

295
2. Regulation of distribution activities
2.1. General overview
2.1. General overview
The role of the DSOs in Finland is to set the distribution grid tariffs, and hence promote
retail market competition through providing customer choice of distribution service
provider. Neither the Government nor the NRA is involved in setting the actual
distribution tariffs. The distribution sector is regulated under an incentive‐based
regulatory regime.
Projects which are developed by DSOs require a license in order to be built.
All components within the distribution tariffs correspond to specific distribution cost
factors.
Lastly, in the case of embedded generators they pay distribution tariffs (which are
equivalent to transportation tariffs), but the fee is lower than those levied for standard
customers.
Key features of the regulatory regime are set out in the following table.
Table 143: Main features of the regulatory regime
Issue Approach
Type of regime (concession/licence) License
Duration of tariff setting regime Allowed revenues are assessed for a 4‐year horizon, but some parameters are updated annually. Distribution tariffs are set independently by the DSOs
Form of determination (distributor propose/regulator decide)
DSO sets the tariffs
Scope for appeal regulatory decision N.a.
2.2. Main incentive properties of the distribution regulatory model
The following key regulatory incentives apply for the DSOs:
Investment incentive
Innovation incentive
Efficiency incentive
Quality incentive
Security of supply incentive
At the same time the following tools are provided to mitigate risks:
DSOs design and set their own tariffs, and all tariff components must correspond to specific
distribution cost components.
Incentives are applied as follows: Investment incentive; Innovation incentive; Efficiency
incentive; Quality incentive; and a Security of supply incentive.

296
Volume risk. According to the current legislation, if revenue target is exceeded over the
regulatory period of four years, the DSO has to take it into account when deciding tariffs
in the following regulatory period. However, if the target is not met and the DSO has
revenues to be recovered after the regulatory period, then the DSO has a possibility to
recover them within the next regulatory period, but no obligation to do so.
Some of the volume risk is covered in the efficiency incentive due to the fact
that network expansion and number of customers is updated annually.
No other specific forms of risk mitigation measures are in effect in Finland, but a DSO
can apply for a methodology amendment under exceptional circumstances.
The quality of the service incentive is based on the cost of interruptions to the customer.
The quality of service regulation interacts with the tariff system in that allowed revenues
are increased (or decreased) if the DSO performs better (or worse) than in its predefined
quality targets. Revenues can increase or decrease up to a level which is equivalent to
20% of the annual rate of return (€). For example, 20% in 2014 means 60 basis points in
the WACC calculation.
2.3. Determination of cost of service parameters
The approach to determining key cost of service parameters are summarized in the
following table.
Table 144: Approach to key cost of service parameters
Parameter Approach
Form of price control Revenue based with performance incentives
Regulatory asset base Efficient investment included in the RAB and reconciliation mechanisms are used to ensure that actual revenues are in‐line with allowed revenues
Capital expenditure Incentive‐based
Approach to operating expenditure Incentive‐based
Form of WACC applied Real reasonable rate of return, after corporate tax
The following formula is applied in determining the WACC:
EDWACCR taxposttaxpostk ,
where
taxpostkR , = weighted average cost of capital, i.e. real reasonable rate of return after corporate tax, in euros
taxpostWACC = real reasonable rate of return after corporate tax

297
D = adjusted amount of interest‐bearing debt, in euros
E = adjusted amount of equity, in euros
ED = adjusted capital invested in the DSO’s network operations, in euros
ED
DtC
ED
EC DEtaxpost
1WACC
where
taxpostWACC = weighted average cost of capital, i.e. real reasonable rate of return after corporate tax
EC = cost of equity
DC = cost of interest‐bearing debt
t = rate of corporate tax during the period under review
D = amount of interest‐bearing debt
E = amount of equity
3. Tariffs for distribution services
3.1. Distribution tariffs The methodologies used to allocate distribution costs to tariffs vary considerably
between the different DSOs.
However, the tariff structure for the different classes of electricity consumers is that:
LV customers´ tariffs vary and tariff structures include both KW and KWh parts.
For larger LV customers there are possibilities to choose time‐of‐use tariffs based on
day and night time of use or winter and summer time of use.
MV customers´ tariffs are mainly based on a KW charge.
Various other aspects of distribution tariff setting are summarized in the table below.
Table 145: Approach to key issues in setting distribution tariffs
Issue Approach
Shallow and deep connection charges can be used for connection charges. Standard
costs are approved by the regulator.
There are no specific targets or incentive schemes in use to encourage DSOs to enhance
their hosting capacities and DSOs are assumed to have a duty to connect all the
renewable capacity that applies for connection.

298
Treatment of distribution losses Charged within the tariffs
Presence of uniform tariffs No
Presence of non‐linear tariffs No, they are all linear
Presence of regulated retail tariffs No
Presence of social tariffs No
If a DSO uses special incentives in their network tariffs, for example for large consumers
such as power plants, it must offer those same incentives it to all plants under equal
terms and conditions.
3.2. Connection charges Key issues in the setting of connection charges are set out in the table below.
Table 146: Summary of key issues relating to connection charges
Issue Approach
Determination of charges
Type of charges (shallow/deep) Both. Shallow charges for small consumers and small embedded generators. Deep charges for larger consumers and generators
Methodology adopted Standard costs are approved by the regulator for both uniform and client‐specific connection fees. For larger consumers or generators the DSO makes an estimate based on its costs, but the client can ask the regulator to set the price in case he does not agree with the DSO's estimate.
Hosting capacity Scope to refuse connection Not allowed to refuse connection
Requirements to publish hosting capacity
No requirement
Targets and/or incentive schemes to enhance hosting capacity
None
Shallow connection charges are used for small consumers and small embedded
generators. In contrast, deep charges are used for larger consumers and generators: this
includes the costs of new infrastructures at the same voltage level and the costs of the
reinforcement of networks at the voltage level immediately above.
There are no specific targets or incentive schemes in use to encourage DSOs to enhance
their hosting capacities. The DSO is assumed to have a duty to connect all the renewable
capacity that applies for connection.

299
4. Distribution system development and operation
4.1. Distribution system development
The key features of distribution system planning are summarized below.
Table 147: Approach to distribution planning
Issue Approach
Form of distribution planning document Distribution network development plans are notified to the regulator. The documents are not published.
‐ Key responsibilities for its development DSOs develop the plans every 2 years
‐ Degree of integration with renewables plan
Not integrated or connection with renewable targets/plans
‐ Relationship with consumption trends No connection
‐ Relationship with quality of service targets
Quality of service targets are explicitly taken as an input in the distribution development plan and the plan illustrates the relation between the investments and the quality objectives in the distribution area.
‐ How trade‐offs between network development and alternative technologies are treated
No particular treatment specified
‐ Requirements to integrate cost benefit analysis
Not required. The plan only reports the decisions taken by the DSOs
4.2. Distribution system operations
The key features of distribution system operations are summarized below.
DSOs develop their respective distribution planning documents, which are provided to
the regulator, every 2 years.
Flexible loads are all only controlled by the system operator or self‐dispatched (i.e. are
not dispatched by the DSO).
DSOs are fully responsible for metering and in 2013 around 93% of all consumers had
a smart meter installed and operating.

300
Table 148: Approach to distribution planning
Issue Approach
Requirements for dispatch of renewable plants connected to DSO network
Smaller embedded generators (like residential PV) are not dispatched but larger embedded generators are dispatched by the system operator (not by the DSO)
Possibility to dispatch flexible loads Flexible loads are all only controlled by the system operator or self‐dispatched
Other sources of flexibility open to DSO No other sources
4.3. Metering
Key issues regarding metering, and the role of the DSOs, are set out in the following
table.
Table 149: Key approach to metering
Issue Approach adopted
Discos role in metering DSOs have full responsibility for metering, and they own the meters in most cases (some have leasing contracts).
Monopoly services in the metering DSOs are monopolists in metering activities
Smart metering functionality Remote readingRemote disconnection and reconnection of customers
As of 2013 there were 3,1 million smart meters installed (up to fuse size 63A) in Finland.
This is equivalent to 93% of all customers.
There are no approved plans to further deploy smart meters, but the final target is near
about 100 % of the DSOs´ customers.
The impacts of the roll out of smart meters in Finland was initially planned to be
analysed through the use of a cost‐benefit‐analysis tool (available for use by the major
Finnish utilities) as well as the collection of feedback on smart meter impacts. However,
the decision was taken in 2009 to rapidly‐roll out smart meters to the overwhelming
majority of electricity customers in the country, and this aim was largely achieved (only
7% of customers did not have a smart meter in 2013) in a short period of time.
Consequently, the NRA reported that the cost‐benefit tool became less necessary as a
decision support tool for monitoring the roll out process. It is understood that specific
information on energy consumption reductions (following smart meter installations) and
monetary savings per household, for example, are neither currently publicly‐available
nor used by the Finnish NRA.

301
Country Report – Finland (gas distribution)
1. Overview of to the distribution sector
1.1. Institutional structure and responsibilities
In Finland there are 25 distributors supplying gas to 75742 customers with a gas
distribution network length of 1959 km. Summary data on industry structure is set out
below.
Table 150: DSO characteristics
Total number DSOs
Ownership unbundled
Legally unbundled
Less than 100000 customers
Exemption* Share of total demand
Finland 25 N.a. N.a. 25 N.a. 100% *exemption from distribution network charges for certain types of grid users, such as low‐carbon generation connected to distribution networks.
It should be noted that all Finnish DSOs fall below the size requirements for being
required to implement legal and ownership unbundling requirements, as set by the
Natural Gas Market Directives. That is, all Finnish DSOs have fewer than 100000
customers each. All Finnish DSO are required to, and have implemented, account
unbundling.
The responsibility for setting the allowed revenues (distribution tariffs) in Finland is held
by the NRA. Allowed revenues are assessed in every four years, but some of the
parameters are updated annually. Investments by DSOs are not subject to any form of
ex ante approval by the NRA. A partial ex post assessment of the usefulness of DSOs´
investments is carried out by the NRA, but it is not published.
The breakdown of responsibilities as it related to tariff setting is summarized in the table
below.
There are 25 DSOs operating in the Finnish gas sector, each of which serves an
individual customer base of less than 100000 customers.
The NRA is responsible for setting the level of allowed revenues and individual DSOs
are responsible for setting their own tariff structures to be offered to customers.

302
Table 151: Legal basis for tariff structure – Roles and Responsibilities in setting distribution tariffs
Actor Allowed revenues (tariff level)
Tariffs (tariff structure)
Connection charges
DSO Sets the tariff structure
Calculates (on a case‐by‐case basis)
Government
NRA Sets the revenue cap Approves (or not) the costs calculated by the DSOs
X = main responsibility; other options to fill the table: sets rules; monitors ex‐post; defines main principles;
calculates for NRA approval; also involved;
Individual DSOs set the tariff structures of the tariffs they offer to customers.
1.2. Key figures on revenue and tariffs
Distribution revenues in Finland in 2013 were € 72 million. The proportions of allowed
revenues per regulated activity (e.g. metering, distribution, customer management) are
not published.
The gas distribution sector is fully liberalised and each DSO sets its own tariff structures.
Information is not publicly‐available on the revenues received from each customer class,
and the energy consumption of each customer class. The NRA is unable to provide this
information.
The typical network tariff in 2013 for residential, small and large industrial customers is
illustrated below:
Table 152: Breakdown of annual charges – typical customer types, 2013 (€)
Customer type
Notional Energy usage
Fixed charges Energy charges Demand and reactive charges
Total
Residential 15000kWh Included, varies
depending on the DSO
Included, varies depending on
the DSO
Not included Varies depending on
the DSO
Small commercial
50000000 kWh Included, varies
depending on the DSO
Included, varies depending on
the DSO
Not included Varies depending on
the DSO
Industrial 90000000 kWh Included, varies
depending on the DSO
Included, varies depending on
the DSO
Included, varies
depending on the DSO
Varies depending on
the DSO

303
Distribution tariffs are itemised separately (i.e. are not bundled into an integrated retail
tariff) for end‐users. Tariffs vary significantly between DSOs
The average tariffs per kWh for a small municipal‐level DSO are shown below. These
values should be considered as an example only.
Figure 38: Average network charges (€cents/kWh), 2013
2. Regulation of distribution activities
2.1. General overview
The distribution sector is regulated under a cost plus regime with an incentive‐based
component.
Key features of the regulatory regime are set out in the following table
Table 153: Main features of the regulatory regime
Issue Approach
Type of regime (concession/licence) License
Duration of tariff setting regime 4 years
Form of determination (distributor propose/regulator decide)
The regulator sets the methodology for the revenue cap but distribution tariffs are set by the DSO independently.
Scope for appeal regulatory decision DSOs can appeal to the Market Court on regulatory decisions on allowed revenues.
The regulatory regime is based on cost plus, and an incentive mechanism.
A revenue adjustment mechanism is in place and can be applied in the event that
revenues are substantially different from previously‐planned values. There is no quality
of service incentive.

304
2.2. Main incentive properties of the distribution regulatory model
An investment incentive is used within the regulatory model for the DSOs.
At the same time the following tools are provided to mitigate risks:
According to the current legislation, if revenue target is exceeded over the regulatory
period of four years, the DSO has to take it into account when deciding tariffs in the
following regulatory period. However, if the target is not met and the DSO has revenues
to be recovered after the regulatory period, then the DSO has a possibility to recover
them within the next regulatory period, but no obligation to do so.
DSOs can also apply for a methodology amendment (to the regulatory model) due to
exceptional events.
No quality of service regulation is in effect in Finland.
2.3. Determination of cost of service parameters
The approach to determining key cost of service parameters are summarized in the
following table.
Table 154: Approach to key cost of service parameters
Parameter Approach
Form of price control Cost plus
Regulatory asset base Efficient investments included in the allowed RAB, with ex‐post adjustments if necessary
Capital expenditure Cost plus, no benchmarking
Approach to operating expenditure Cost plus, no benchmarking
Form of WACC applied Real reasonable rate of return after corporate tax
The following formula is applied in determining the WACC:
EDWACCR taxposttaxpostk ,
Where:
taxpostkR , = weighted average cost of capital, i.e. real reasonable rate of
return after corporate tax, in euros
taxpostWACC = real reasonable rate of return after corporate tax
D = adjusted amount of interest‐bearing debt, in euros
E = adjusted amount of equity, in euros
ED = adjusted capital invested in the DSO’s network operations, in
euros

305
ED
DtC
ED
EC DEtaxpost
1WACC
Where:
taxpostWACC = weighted average cost of capital, i.e. real reasonable rate of
return after corporate tax
EC = cost of equity
DC = cost of interest‐bearing debt
t = rate of corporate tax during the period under review
D = amount of interest‐bearing debt
E = amount of equity
The financial structure in the WACC formula reflects the average financial structure of all
DSOs. Current debt/equity ratio is 70/30 for DSOs.
3. Tariffs for distribution services
3.1. Distribution tariffs There is no single approach used by DSOs to allocate distribution costs to the tariffs.
DSOs have the freedom to use the approach they prefer. DSOs are in charge of setting
the distribution tariffs.
Various other aspects of distribution tariff setting are summarized in the table below.
DSOs design and implement their preferred tariffs. DSOs are obliged to publish all the
tariffs they offer.
Connection charges are shallow in nature and DSOs are obliged to inform the regulator
of the hosting capacity of their networks.

306
Table 155: Approach to key issues in setting distribution tariffs
Issue Approach
Treatment of distribution losses Included as a part of the distribution tariffs
Presence of uniform tariffs No
Presence of non‐linear tariffs Yes
Presence of regulated retail tariffs No
Presence of social tariffs No
Distribution tariffs are published, and indeed every DSO has an obligation to publish
every distribution tariff they offer to customers.
There are no aspects included within the distribution tariffs which do not correspond to
distribution costs. Tariff components are not differentiated according to the time‐of‐use.
3.2. Connection charges
Key issues in the setting of connection charges are set out in the table below.
Table 156: Summary of key issues relating to connection charges
Issue Approach
Determination of charges
Type of charges (shallow/deep) Shallow
Methodology adopted For residential and for residential customers there is case‐by‐case pricing, but connection fees are not set by regulator. For larger consumers and generators connection costs are also computed on a case‐by‐case basis.
Hosting capacity Scope to refuse connection DSOs are not allowed to refuse connections for consumers and generators
Requirements to publish hosting capacity
No requirement
Targets and/or incentive schemes to enhance hosting capacity
N.a.
The DSOs are not required to notify the regulator of the hosting capacity of their
individual networks.

307
4. Distribution system development and operation
4.1. Distribution system development
The key features of distribution system planning are summarized below.
Table 157: Approach to distribution planning
Issue Approach
Form of distribution planning document None – network development plans are neither notified to the regulator nor published
‐ Key responsibilities for its development N.a.
‐ Degree of integration with renewables plan
N.a.
‐ Relationship with consumption trends N.a.
‐ Relationship with quality of service targets
No relationship
‐ How trade‐offs between network development and alternative technologies are treated
None
‐ Requirements to integrate cost benefit analysis
None
4.2. Distribution system operations
The key features of distribution system operations are summarized below.
Table 158: Approach to distribution planning
Issue Approach
Requirements for dispatch of renewable plants connected to DSO network
N.a.
Possibility to dispatch flexible loads N.a.
Other sources of flexibility open to DSO N.a.
DSOs are not required to develop and publish planning documents. DSOs are fully responsible for, and are monopolists, of metering activities.

308
4.3. Metering
Key issues regarding metering, and the role of the DSOs, are set out in the following
table.
Table 159: Key approach to metering
Issue Approach adopted
Discos role in metering Full responsibility for metering activities, and they own the meters
Monopoly services in the metering Yes, DSOs are monopolists in metering activities
Smart metering functionality Not specified
Almost all gas customers in Finland are standard (non‐smart meter) metered customers.
Specifically, only one DSO has installed smart meters, which, according to the NRA,
altogether totalled a few thousand customers. No information is available on the
impacts on those smart meter installations (such as, for example, the electricity
consumption reduction achieved or the average household cost saving).

309
Country Report – France (electricity distribution)
1. Overview of the distribution sector
1.1. Institutional structure and responsibilities
In France there are around 160 distributors supplying electricity to approximately 35
million of customers with an overall circuit length of 1293466 km62. Summary data on
industry structure is set out below.
Table 160: DSO characteristics
Total number DSOs
Ownership unbundled
Legally unbundled
Less than 100000 customers
Exemption* Share of total demand
Country 14863 5 143 Yes < 5% * Embedded generators do not pay any distribution tariffs.
The responsibility for setting distribution tariffs is spread between the following
jurisdictions:
The DSO
The NRA (Commission de régulation de l'énergie‐CRE) regulates the electricity and gas
networks guaranteeing the right of access to public electricity grids and natural gas
networks and facilities, ensuring the proper functioning and development of electricity
and liquefied natural gas networks and infrastructure, ensuring the independence of
system operators and contributing to building the European Internal Market for
electricity and gas. It also regulates the electricity and gas markets monitoring
transactions on the electricity, natural gas and CO2 markets, ensuring the proper
functioning of retail markets, contributing to the implementation of measures to
62 Eurelectric, Power Distribution in Europe – Facts & Figures, 2013. 63 CEER, Status Review on the Transposition of Unbundling Requirements for DSOs and Closed Distribution System Operators, 2013.
In France the distribution sector is rather concentrated, with ERDF representing
around 95% of the distribution network. The sector is regulated. The DSO has a rather
limited role in setting the allowed revenue and the distribution tariffs. The
government retains the power to revert ask the NRA to revise its deliberations if it
considers that its general policy orientations have been disregarded.

310
support electricity generation and supply of electricity and gas and informing all
consumers)
Government (Ministère de l’écologie, du développement durable et de l’énergie)
The breakdown of responsibilities as related to tariff setting is summarized in the table
below.
Table 161: Legal basis for tariff structure – Roles and Responsibilities in setting distribution tariffs
Actor Allowed revenues (tariff level)
Tariffs (tariff structure)
Connection charges
DSO Sends accounting and financial data to NRA
Calculates for NRA approval
Government Defines main principles, can ask the NRA for a new deliberation
Defines main principles
Defines main principles, sets rules64
NRA X X XX = main responsibility; other options to fill the table: sets rules; monitors ex‐post; defines main principles;
calculates for NRA approval; also involved;
The regulatory process adopted to setting distribution tariffs involves the following
steps:
the Government elaborates general policy orientations;
the methodologies used to establish tariffs for the use of public electricity transmission
and distribution grids are set by the CRE;
the DSO sends to the CRE its business plan, including justification for the planned costs
level in order to allow the regulator to fix/modify the distribution tariff levels; the
financial and accounting document are sent for ex‐post adjustments on non‐controllable
items
The CRE takes into account the energy policy guidelines indicated by the Government
and it regularly informs the Government during the tariff establishment phase;
The CRE consults energy market stakeholders as it sees fit65;
The CRE transmits to Government, for publication in the Journal Officiel de la République
Française its reasoned decisions on changes in the level and structure of distribution
tariffs;
In the following two months, the Government can ask the CRE for a new deliberation if it
believes the CRE has not taken in due account the governmental general principles
adopted in the domain of energy policy.
1.2. Key figures on revenue and tariffs
Distribution revenues in 2013 were € 12496,8 million. No further split by service type is
available.
64 Precise charging perimeters are specified by decree; costs estimates and charging methodology is set forth by a decree proposed by the regulator and enacted by the Minister of energy. 65 In the last case, the regulator issued 5 consultations papers and held public hearings.

311
Users are differentiated by their voltage level.
For a given voltage level, the user (or supplier for him) is free to choose the distribution
tariff he wants. All users face a similar tariff structure, but values change depending on
the voltage level and the tariff chosen. Each tariff consists of:
A fixed component reflecting the cost of administrative management and metering.
This latest component depends on the ownership regime of the metering system.
A per kW component, which could be time differentiated, based on the contractual
power ;
A per kWh component, which could be time differentiated, based on actual
withdrawals from the grid.
A breakdown of revenue by customer category and the number of customers in each
category is set out in the table below.
Table 162: Tariff components, customers and revenues per customer class
Customer classes Number of customers66 Revenue (M€)
HV Around 94000 About 2000
LV > 36 kVA Around 370000 About 1500
LV < 36 kVA Around 34000000 About 7500
Total Around 35000000 About 11000
The breakdown of energy volumes and distribution revenue by customer category are
set out in the charts below.
66 CRE forecast 2013.

312
Figure 39: Proportion of energy67 and revenue accounted by customer categories
The typical network tariff in 2014 for residential, small and large industrial customers is
illustrated below68:
Table 163: Breakdown of annual charges – typical customer types, 2014 (€)
Customer type
Notional Energy usage
Fixed charges
Energy charges
Metering charges
Load and reactive charges
Total
Residential69 3500kWh 8,9 120,8 18,8 21,6 170,1
Small 50MWh 68,9 1298 398 475 2239,9
67 CRE forecast 2013. 68 REF‐E estimates based on ERDF tariffs in 2014 and CRE hypotheses. 69 CRE hypothesis: voltage level LV < 36 kVA, base tariff (no temporal differentiation), power contracted 6kV, usual metering system (for the metering component: power control through circuit breaker, variables measured through index, user is not the owner of the metering system; for the administrative management component: user has only one contract with his supplier ‐ no direct contract with the DSO‐).

313
industrial70
Industrial71 24000MWh 68,9 252896,3 1206,5 74106 328277,7
The typical network average tariffs in 2014 per kWh are illustrated below.
Figure 40: Average network charges (€cent/kWh), 2014
An example of network tariffs applied in 2014, by ERDF is available at the following link:
http://www.erdf.fr/medias/Institutionnel/TURPE_4_Plaquette.pdf .
2. Regulation of distribution activities
2.1. General overview
The role of the DSO in France is to define and to do the necessary investments in order
to connect users to the grid it manages, respecting the environment and ensuring
energy efficiency. It has a duty to report every year to the local administrations (which
own the gas distribution network) the state of the infrastructure developments. The
70 CRE hypothesis: voltage level LV > 36 kVA, Medium Usage, power contracted 40kV, usual metering system (for the metering component: power control through overshoot, variables measured through measurement curve, user is not the owner of the metering system; for the administrative management component: user has only one contract with his supplier ‐ no direct contract with the DSO‐) 71 CRE hypothesis: voltage level HVA, base tariff (no temporal differentiation), power contracted 3,450kV, usual metering system (for the metering component: power control through overshoot, variables measured through measurement curve, user is not the owner of the metering system; for the administrative management component: user has only one contract with his supplier ‐ no direct contract with the DSO‐).

314
DSO stipulates and manages the concession with the local administration and ensures
transparent, objective and non‐discriminatory access conditions to the gas distribution
grid. It also has a duty to give to grid users the information they need in order to access
the grid. The DSO manages and maintains the distribution grid and is in charge of the
metering activities.
The distribution sector is regulated under a concession regime. A mix of “cost‐
reimbursement” and “incentive‐based” form of regulation is applied. The regulatory
framework involves a period of regulation of 4 years and an annual indexation of tariffs.
The final user can choose a distribution tariff integrated into the retail tariff (regulated
or not): in this case, the supplier chosen by the customer is the one who has a contract
with the DSO. Otherwise, the final user can choose a separated billing between supplier
and DSO: in this case he receives two different bills and has a contract with the supplier
and another one with the DSO. For electricity distribution, integrated retail tariff
represents about 99% of the situations.
Key features of the regulatory regime are set out in the following table
Table 164: Main features of the regulatory regime
Issue Approach
Type of regime (concession/licence) Concession (duration between 20‐30 years)
Duration of tariff setting regime 4 years
Form of determination Regulator decides
Scope for appeal regulatory decision Not available
Tariffs take into account costs actually paid by the operator: the concession lease and
other concession costs are covered as an OPEX. Following State Council decision on
electricity distribution tariff for period 2009‐2013 (TURPE 3), the TURPE 4 (2014‐2017)
takes into account the specificities of the concession regime to define the remuneration
of the operator through different rate components.
2.2. Main incentive properties of the distribution regulatory model
The following key regulatory incentives apply for the DSOs:
Productivity factor is applied on some predefined OPEX. Under this scheme, DSO keeps
100% of the earnings or of the losses with respect to the predefined cost trajectory.
Targets with premium and penalties are set on the following matters : quality of supply,
quality of service

315
The smart metering project is treated under a specific incentive based regulation
scheme72.
Incentive regulation interacts with the tariff level for indicators with financial incentives
(bonus/malus mechanism). For instance, CRE has set a target for ERDF in 2017 of 94% of
user connection to be completed within the timeframe requested by users. This rate
was estimated at about 84% in 2011. Better performance than the target goal will result
in a financial bonus. A lower performance than the target goal will result in a financial
penalty.
At the same time the following tools are provided to mitigate risks:
Tariff components are updated every year following a predetermined formula
For charges which are considered to be uncontrollable by the DSO, an expense and
income clawback account mechanism (CRCP) is defined73. For these items, it measures
and offsets the differences between projected and actual expenses and income on
which the tariffs are based.
As income received for all tariff components are part of CRCP, the entire volume risk is
born by consumers. Thus if demand goes down and the DSO does not obtain the
revenue target in one regulatory period, in the following period tariffs will be adjusted
to make‐up for the missing revenues in the previous period.
Ex‐ante approval of the investments by DSO for the smart metering program74.
Key components of quality of service regulation are:
Monitoring of two type of indicators:
72 An extra‐remuneration is granted to the DSO in case of good performance in terms of costs, deadlines and quality of service. The maximum amount of this extra‐remuneration is equal to 300 points applied to the reference costs. The operator can also get penalties in case of bad performance. The total remuneration of the project cannot be below 200 points of the specific return of the project. 73 The CRCP is also the vehicle used for financial incentives resulting from the application of incentive regulation mechanisms. It is the account to which is posted, where relevant, DSO’s surplus earnings and shortfalls. It is reconciled by adjusting the tariff scale during the annual change in tariffs. The contribution of CRCP reconciliation to the annual variation of the tariff scale is limited to +/‐ 2%. The expense and income items covered by the mechanism are as follows: capital expenses; the expenses related to compensation for losses on the grids; the expenses related to access to the transmission grid; expenses related to the net book value of decommissioned fixed assets; income received for all tariff components ; income received for additional services (but those created during the regulatory period and that had not been included in tariff trajectory); income received for connection charges; R&D operating expenses (under conditions explained in section D.3.2.1 of the deliberation); financial incentives related to the various incentive‐based regulation mechanisms; the results of audits conducted by CRE will be taken into account within the scope of the CRCP. 74 For the smart metering program, the regulator appealed to an extern consultant to carry on the cost‐benefit assessment of the project. This study was used to elaborate the decision leading to the launch of the project (Délibération de la CRE du 7 juillet 2011), and to evaluate the cost projection provided by the DSO and help CRE to target the regulatory scheme of the project.

316
o Indicators being tracked by the CRE with financial incentives allocated in
function of pre‐defined objectives75.
o Indicators that are only followed up.
The areas covered by the incentive regulation of quality of service are: interventions,
connections, relationship with users, relationship with suppliers, and billing.
For quality of supply, the DSO has incentive to reduce the annual duration of power cuts
(expressed in minutes) under predefined thresholds, excluding incidents caused by
exceptional events (see definition below) and excluding causes relating to the public
transmission network.
The average frequency of power cuts is also followed by CRE since 2014
DSOs shall fulfil additional requirements related to the number of interruptions and the
slow voltage variations with the obligation to reinforce the network in case of
complaints.
There are contractual requirements between customers and system operators, with the
obligation for system operators to compensate any damage caused to the customer
whenever the requirements are not fulfilled.
2.3. Determination of cost of service parameters
The approach to determining key cost of service parameters are summarized in the
following table.
75 The form of these financial incentives are: • Either bonus or penalty charged on the tariff ; • Or financial penalties paid directly by ERDF to users.

317
Table 165: Approach to key cost of service parameters
Parameter Approach
Form of price control Some costs components are regulated under “cost reimbursement” but there are “incentive based” measures
Regulatory asset base Assets enter the rate base at their book value which is then amortized over the regulatory asset life.
Capital expenditure Subject to benchmarking
Approach to operating expenditure
Base on the trajectory proposed by the DSO and analysis conducted by the CRE
Form of WACC applied Although there is no WACC formula per se, the actual financial structure of the main distribution operator is taken into account to calculate the authorized revenue.
Additional revenue items Not applicable
3. Tariffs for distribution services
3.1. Distribution tariffs: additional issues
The Regulator is in charge of setting the distribution tariffs (based on allowed revenues).
Distribution costs (especially capital costs and costs of losses) are allocated to tariffs
through hourly unit costs for using the grids and the consumption characteristics of
different user categories (voltage domain, profile of consumption and duration of
usage).
The total hourly unit cost attributable to a withdrawal for a given voltage domain is
obtained by adding the hourly unit cost for the voltage domain in question and the
hourly unit costs for the voltage domains located upstream, pro rata with the energy
flows created within the latter.
Users of a given voltage domain are classed according to the duration of their usage.
Each user’s duration of usage represents their rate of use of the grids and therefore
forms, together with the power subscribed to, an essential variable for calculating prices
for access to electrical grids.
Annual unit costs for using the grid can be expressed in terms of duration of usage. This
cost function is concave given that users with a short duration of usage show a strong
tendency to withdraw during peak hours. The slope and value of the origin of the
tangents to the cost function correspond respectively to the energy and power

318
coefficients for each two‐part tariff with and without time differentiation. The tariff
structure which follows this methodology is aimed to reduce peak consumption. Indeed
users with a short duration of usage face a large energy tariff component, which is an
incentive to restrict their consumption. While the economic incentive to reduce
consumption is the same for any hour of the year, it is hoped that it might be effective
during peak‐time since a larger part of the consumption of those users occurs
statistically during peak times. On the other hand, users with a long duration of usage
face a large power tariff component, which is an incentive to reduce the contracted
capacity, and thus their maximal consumption over the year and in particular during
peak time.
The tariff charged to grid users is the sum of sub‐components, all published by the
regulator. The main subcomponents are:
withdrawal components
metering component
administrative management component
For residential customers, the supply has to be offered and billed as integrated retail
tariff. Withdrawal components of the distribution tariff could be differentiated
according to time of use. Options with time differentiation are calculated such as the
share of energy for each time interval is in proportion with the average unit cost for the
time interval concerned76.
Various other aspects of distribution tariff setting are summarized in the table below.
Table 166: Approach to key issues in setting distribution tariffs
Issue Approach
Treatment of distribution losses Cost of losses is included in the distribution tariff
Presence of uniform tariffs The same tariff for consumers applies everywhere in the country.
Presence of non‐linear tariffs All tariff components are linear but one tariff proposed for users connected to HVA voltage domain which is concave.
Presence of regulated retail tariffs
Regulated tariffs will be abolished for consumers whose contracted power is above 36kVA in 2016. Households and small consumers (P<36kVA) will still benefit from regulated tariffs after 2016
Presence of social tariffs There is no social network tariff implemented. Social retail tariff are implemented, under the form of a standardised bill reduction, financed by a tax paid by all consumers, called CSPE (contribution au service public de
76 For HVA (between 50kW and 63kW), three different tariffs are proposed. Two of them have per kW and per kWh components which are time differentiated. For LV > 36kV, two different tariffs are proposed. One tariff has both per kW and per kWh time differentiated component. The other has only per kWh time differentiated components. There is no flat tariff. For LV > 36kV, three different tariffs are proposed. One of them has per kWh time differentiated component (two index, intra‐day time differentiation).

319
l'électricité).
3.2. Connection charges As a general principle, grid users bear the cost of creating new electrical equipment and
replacing existing equipment at the same voltage level, and the cost of creating new
equipment at the voltage level immediately above. Only the works strictly necessary to
the connection of a specific grid user are taken into account when calculating
connection charges.
For consumers, 40% of these costs are mutualized through grid tariffs. Moreover, for
residential consumers, connection charges do not include the cost of grid
reinforcements in low voltage.
For RES generators, connection charges include, since the end of 2012 / beginning of
2013, on top of the aforementioned costs, a portion of the costs of the HV/MV
substations and transmission lines required to reach a certain RES target on a regional
basis.
Key issues in the setting of connection charges are set out in the table below.
Table 167: Summary of key issues relating to connection charges
Issue Approach
Determination of charges
Type of charges (shallow/deep)
Shallow for residential consumers and deep for generators.
Methodology adopted For the smallest connection works (low voltage, power ≤ 36 kVA and distance to the distribution transformer ≤ 250 meters), connection charges are approximated, breaking down into a fixed term and, optionally, a length‐dependent term. These price estimates are approved or controlled by the regulator.
For other grid users, connection charges are based on real costs.
For RES connection charges, a new scheme has been put into place since the end of 2012 / beginning of 2013: on top of their own connection charges, on a regional basis, the costs of HV/MV substations and transmission lines required to reach a certain RES target are borne by all RES generators, proportionally to their rated capacity.
Hosting capacity Scope to refuse connection DSOs can refuse connection of any grid user only for safety or security reasons. DSO has to refuse the commissioning of the connection of an unauthorised generator.
Requirements to publish hosting capacity
DSOs have to publish the generation hosting capacity for each HV/MV

320
substation, comprising:
Transformers capacity left
Hosting capacity of the transmission network
Total power of the power plants awaiting connection at the same substation
For other voltage levels, hosting capacity is announced by the DSO when a generator asks for a binding or a non‐binding connection estimate. DSOs are not required to notify to the regulator the hosting capacity of his network.
Targets and/or incentive schemes to enhance hosting capacity
The DSO is assumed to have a duty to connect all the generation capacity or consumers which apply for connection. Moreover, hosting capacity targets for RES are set on a regional basis, at the HV/MV substations level.
4. Distribution system development and operation
4.1. Distribution system development
The key features of distribution system planning are summarized below.
Table 168: Approach to distribution planning
Issue Approach
Form of distribution planning document N.A.
‐ Key responsibilities for its development Local authorities are the owners of the distribution grid. By the law they are responsible for the development of the grid. However a concession regime is in place: local authorities delegate, within the framework of the concession contract, part of their responsibilities to the DSO (which is finally in charge to connect users to the grid). For electricity, about 80% of the investments on distribution grids
Local administrations are the owners of the distribution network. Responsibility for
network development is split between the DSO and local administrations.
Generally, DSOs do not have the right to dispatch. Smart grids pilot projects are in place in
which battery packs or flexible loads are controlled by the DSOs.
Smart meters are already installed or are being deployed in companies. Roll‐out in
residential sector will start in 2015.

321
are done by DSO and about 20% are done by local authorities. Local administrations organize local conferences to define the distribution grid development plan. The distribution Network development plans are not notified to the regulator nor published.
‐ Degree of integration with renewables plan
Renewable generation targets are set by the Government at national level and declined at regional level through “Schéma régional du climat, de l’air et de l’énergie” (named “SRCAE”, regional plan of climat, air and energy), who decline their objectives renewable energy production by “Schéma regional de raccordement des énergies renouvelables” (named “S3REnR, regional plan of connecting to the network of the renewable energies). The renewable targets are thus defined by the Government and not by the regulator. The S3REnR are developed by the TSO (RTE) in agreement with the DSOs and approved by the regional prefects
‐ Relationship with consumption trends The DSO has the duty to define and do the necessary investments in order to connect users to the grid he manages.
‐ Relationship with quality of service targets
ERDF provides during the tariff discussions the projected budget of investments which is split into big finalities. One of these finalities is the quality of supply and the modernization of the network. There has been progress in the amounts assigned to this finality: ‐ 607M€ in 2009, ‐ 942M€ planned for 2014, ‐ 1 026M€ planned for 2017.
‐ How trade‐offs between network development and alternative technologies are treated
Not treated
‐ Requirements to integrate cost benefit analysis
There is no legal requirements but DSOs, especially large ones, rely on cost‐benefit analysis for large investments, such as primary substations. They also rely on technical‐economic analysis to design broad investment policies, for instance to define sub‐sections to be used at connection time, which aim to obtain an optimal balance between investment cost, future losses, and quality. Smaller DSOs tend to rely on these policies as well.
4.2. Distribution system operations
The key features of distribution system operations are summarized below.
Table 169: Approach to distribution planning
Issue Approach
Requirements for dispatch of renewable plants connected to DSO
The DSO can only require embedded units to disconnect in case the distribution system cannot host their

322
network injections.
Possibility to dispatch flexible loads Flexible loads are all only self‐dispatched. Since there is no balancing mechanism for local congestion management, DSOs are not able to dispatch flexible loads for any purpose.
Other sources of flexibility open to DSO
The DSO does not access (unless in pilot projects) to other sources of flexibilities (i.e. dynamic controllable electricity load). Nevertheless, several million households already have a time‐of‐use distribution tariff that includes ripple control to stagger the switch on and switch off time of electric water heaters. Currently, these switching times are defined by the DSOs for each network pocket in order to optimize peak‐shaving at the global and local level. The impact of this load management is taken into account in the planning – investment and operations‐ of the distribution networks.
4.3. Metering
Key issues regarding metering, and the role of the DSOs, are set out in the following
table.
Table 170: Key approach to metering
Issue Approach adopted
Discos role in metering DSOs have full responsibility for metering (pose, metrological control, maintenance and renewal of metering device and to manage the date and all responsibilities related to all of these activities), but the meters are owned by local authorities (such as a large part of the distribution network).
Monopoly services in the metering
DSOs are monopolists in metering activities
Smart metering functionality a) 10 minutes, half an hour or an hour measurement
(remotely definable)
b) remote reading
c) remote disconnection/reconnection of customers
d) remote control of the maximum power that can be
withdrawn
e) remote operation of appliances at the consumer's
premises
f) local port to send real time consumption
information to a local screens or computers
As of 2013 there were approximately 185,000 smart meters installed in the country. A
breakdown by customer category is illustrated below.

323
Table 171: State of smart meters deployment‐2013
Customer category
Residential For retail market (LV less than 36 kVA), an experimentation project has been done. The effective roll‐out will begin of 2015 and finish in 2021.
Small companies For small companies (LV more than 36 kVA –around 350,000 meters), the roll‐out already began and 27% of meters are smart (around 94,500). Others will be changed by 2020.
Medium companies For medium companies (MV – around 125,000 meters), many ‘old’ meters were already smart (42 %, around 52,500) and some which were not had been changed for smart ones (23 %, around 28,750). Others will be changed by 2020.
Big companies For big companies (HV and VHV ‐ around 8,000 meters) ‘old’ meters were already smart.

324
Country Report – France (gas distribution)
1. Overview of the distribution sector
1.1. Institutional structure and responsibilities
In France there are 26 distributors supplying gas to approximately 11 million of
customers through a roughly 200,000 km gas distribution grid. Data on gas grid coverage
are not available.
Summary data on industry structure is set out below.
Table 172: DSO characteristics
Total number DSOs
Ownership unbundled
Legally unbundled
Less than 100000 customers
Exemption* Share of total demand(DSOs <100000 customers)
Country 26 ‐ 4 23 Yes < 1%
*DSO’s with less than 100000 customers can choose between legal unbundling or accounting/functional unbundling
The responsibility for setting distribution tariffs is spread between the following
jurisdictions:
The DSO
The NRA (Commission de régulation de l'énergie‐CRE)
Government (Ministère de l’écologie, du développement durable et de l’énergie,
Ministère de l'Economie, de l’Industrie et du Numérique)
The breakdown of responsibilities as it related to tariff setting is summarized in the table
below.
In France the distribution sector is rather concentrated, with GRDF representing around
96% of the distribution network. The sector is regulated. The DSO has a rather limited role
in setting the allowed revenue and the distribution tariffs. The government maintains the
power to revert the NRA deliberations if it considers that its general policy orientations have
been disregarded.

325
Table 173: Legal basis for tariff structure – Roles and Responsibilities in setting distribution tariffs
Actor Allowed revenues (tariff level)
Tariffs (tariff structure)
Connection charges
DSO Sends accounting and financial data to NRA
Calculates for NRA approval
Government Defines main principles, can ask the NRA for a new deliberation
Defines main principles
Defines main principles
NRA X X X X = main responsibility; other options to fill the table: sets rules; monitors ex‐post; defines main principles;
calculates for NRA approval; also involved;
The regulatory process adopted to setting distribution tariffs involves the following
steps:
The Government elaborates general policy orientations
The methodologies used to establish tariffs for the use of public gas transmission and
distribution grids are set by the CRE;
The DSO sends to the CRE the financial and accounting document in order to allow the
regulator to fix/modify the distribution tariff levels
The CRE takes into account the energy policy guidelines indicated by the Government
and it regularly informs the Government during the tariff establishment phase.
The CRE consults energy market stakeholders as it sees fit77.
The CRE transmits to Government, for publication in the Journal Officiel de la République
Française its reasoned decisions on changes in the level and structure of distribution
tariffs.
In the following two months, the Government can ask the CRE for a new deliberation if it
believes the CRE has not taken in due account the governmental general principles
adopted in the domain of energy policy.
1.2. Key figures on revenue and tariffs
Distribution revenues in 2013 were € 3,3 billion. No further split by service type is
available.
Distribution tariffs are not defined on “category of consumers” but on tariff options.
Thus for a given consumption level, the supplier is free to choose the distribution tariff
he wants.
Information on available tariff components and the number of customers in each
category is set out in the table below.
77 In the last case (almost one year process), the regulator issued one public consultation on the tariff structure and the main principles and one public consultation on the allowed revenue. It also held public hearings.

326
Table 174: Tariff components, customers and revenues per customer class
Customer classes Tariff components Number of customers78
Revenue
Forfait €/year 3000 NA
T1 €/year, €/MWh 3079841 NA
T2 €/year, €/MWh 7839177 NA
T3 €/year, €/MWh 105507 NA
T4 €/year, €/MWh, €/MWh/day
2862 NA
TP €/year, €/MWh/day, €/m79
58
Total ‐ 11030445 NA
.
The breakdown of energy volumes and distribution revenue by customer category are
set out in the charts below.
Figure 41: Proportion of energy by tariff options80
The tariff structure comprises four main tariff options corresponding to the following
customer segments:
two‐part option T1: annual consumption from 0 to 6000 kWh;
two‐part option T2: annual consumption from 6000 to 300000 kWh;
two‐part option T3: annual consumption from 300000 to 5000000 kWh;
three‐part option T4: annual consumption over 5000000 kWh.
78 Forecasts, ATRD4 for GRDF. (year 2013) 79 Annual distance charge. 80 Forecasts, ATRD4 for GRDF. (year 2013)

327
For end customers with no individual meter or communal meter associated with a
communal supply contract the tariff applicable is an annual fixed charge (forfait).
The above thresholds have been established taking account of the tariff‐based supply
levy ("contribution tarifaire d’acheminement" – CTA) which applies to the tariff set of
charges and for a modulation of 160 days for option T4.
There is also a special tariff option, known as the "proximity tariff" (three‐part TP
option), reserved for end customers having a statutory entitlement to connect to the
natural gas transmission network.
The shipper chooses the tariff option for a given delivery point. The tariff is applied per
delivery point. A penalties mechanism applies for exceeding contracted capacities for
tariff options T4 and TP.
The typical network tariff in force from the 1st of July 2012 to the 30th of June 2013 for
residential, small and large industrial customers is illustrated below.
Table 175: Breakdown of annual charges – typical customer types, 2013 (€)
Customer type
Notional Energy usage
Fixed charges
Energy charges
Annual subscription
charge for daily capacity
Total
Residential 15000 kWh 119,64 108,45 228,09
Small industrial
50000 MWh 13737,72 35500 30630,86 79868,58
Industrial 90000 MWh 13737,72 63900 55135,54 132773,26
The average tariffs per kWh are illustrated below.
Figure 42: Average network charges (€cent/kWh), 2013

328
An example of network tariffs applied in 2013, by GRDF DSO is available at the following
link: http://www.cre.fr/en/documents/deliberations/decision/grdf‐public‐natural‐gas‐
distribution‐networks.
2. Regulation of distribution activities
2.1. General overview
The role of the DSO in France is to define and to do the necessary investments in order
to connect users to the grid it manages, respecting the environment and ensuring
energy efficiency. It has a duty to report every year to the local administrations (which
own the gas distribution network) the state of the infrastructure developments. The
DSO stipulates and manages the concession with the local administration and ensures
transparent, objective and non‐discriminatory access conditions to the gas distribution
grid. It also has a duty to give to grid users the information they need in order to access
the grid. The DSO manages and maintains the gas distribution grid and is in charge of the
metering activities.
The CRE regulates the electricity and gas networks guaranteeing the right of access to
public electricity grids and natural gas networks and facilities, ensuring the proper
functioning and development of electricity and natural gas networks and infrastructure,
ensuring the independence of system operators and contributing to building the
European Internal Market for electricity and gas. It also regulates the electricity and gas
markets monitoring transactions on the electricity, natural gas and CO2 markets,
ensuring the proper functioning of retail markets, contributing to the implementation of
measures to support electricity generation and supply of electricity and gas and
informing all consumers).
The distribution sector is regulated under a concession regime. A mix of “cost‐
reimbursement” and “incentive‐based” form of regulation is applied. The regulatory
framework involves a period of regulation of around 4 years and an annual indexation of
tariffs. Main incentive mechanisms are related to OPEX that can be controlled, quality of
services and smart metering.
The distribution tariff is bundled into an integrated retail tariff.
Key features of the regulatory regime are set out in the following table
Table 176: Main features of the regulatory regime
Issue Approach
Type of regime (concession/licence) Concession (20‐30 years)
Duration of tariff setting regime Distribution tariffs are revised every 4 years. Current tariffs are updated every year following a predefined formula which takes

329
into account predefined elements such as inflation and other elements not controlled by the DSO, such as the volume of flowed gas.
Form of determination (distributor propose/regulator decide)
Regulator decides
Scope for appeal regulatory decision Not available
2.2. Main incentive properties of the distribution regulatory model
The following key regulatory incentives apply for the DSOs:
Productivity factor on the OPEX Capital expenditure efficiencies (since prices are
automatically updated each year according to a predefined rule, the DSO is incentivised
to reduce costs via a productivity factor on the OPEX)
Output based incentive regulation in the domain of quality of service and smart
metering81.
At the same time the following tools are provided to mitigate risks:
At the end of the regulatory period (4 years), the DSO keeps 100% of OPEX savings (or
losses).
The volume (i.e. kWh only, not the number of customers connected) risk is born by
consumers (if demand goes down and the DSO does not obtain the volume target for
year 1, the tariff in year 2 will be adjusted to make‐up for the missing revenues in year 1.
The OPEX trajectory of DSOs may be modified after 2 years (within a 4 year tariff period)
if, as a consequence of new legislation, the projected net OPEX for the remaining two
years are modified by at least 1%.
Investments for the Smart Metering Programme are approved ex‐ante
For some categories of expenses and income that are hard to predict or control, CRE has
defined an expense and income clawback account (CRCP) mechanism82. It measures and
81 The smart metering project is treated under a specific incentive based regulation scheme. An extra‐remuneration is granted to the DSO in case of good performance in terms of costs, deadlines and quality of service. The maximum amount of this extra‐remuneration is equal to 200 points of the specific return of the project. Besides the penalties cannot decrease the remuneration below 100 points of the specific return of the project. 82 The CRCP is also the vehicle used for financial incentives resulting from the application of incentive regulation mechanisms. The CRCP is the account to which is posted, where relevant, DSO’s surplus earnings and shortfalls. It is reconciled by adjusting the tariff scale during the annual change in tariffs. The contribution of CRCP reconciliation to the annual variation of the tariff scale is limited to +/‐ 2%. The expense and income items covered by the mechanism are as follows: capital expenses, the expenses related to compensation for losses on the grids, income received for all tariff components depending on consumption, income received for additional services , financial incentives related to the various incentive‐based regulation mechanisms, income received for capacities overtaking penalties, the results of audits conducted by CRE will be taken into account within the scope of the CRCP.

330
offsets, for previously identified items, the differences between projected and actual
expenses and income on which the present tariffs are based.
Key components of quality of service regulation:
• Bonuses/penalties are applied depending on predefined targets.
• Level of bonuses, penalties and targets may be revised during the tariff period (4 years)
to maintain/improve quality of service.
• Monitoring of two types of indicators by the CRE:
o Indicators being tracked by the French NRA with financial incentives allocated in
function of pre‐defined objectives. The form of these financial incentives are
either bonus or penalty charged on the tariff or financial penalties paid directly
by the DSO to suppliers.
o Indicators that are only followed up.
The areas covered by the incentive regulation of quality of service are: interventions,
connections, relationship with users, relationship with suppliers, and billing.
2.3. Determination of cost of service parameters
The approach to determining key cost of service parameters are summarized in the
following table.
Table 177: Approach to key cost of service parameters
Parameter Approach
Form of price control Some costs components are regulated under “cost reimbursement” but there are “incentive based” measures
Regulatory asset base Assets enter the rate base at their gross value which is then amortized over the regulatory asset life and updated by a Consumer Price Index
Capital expenditure Historic assets and investment forecasts submitted by the operator
Approach to operating expenditure Benchmark with the efficient operator
Form of capital remuneration applied” (WACC real, nominal, ten years Treasury bond + adder, …)
Real before tax WACC, that is updated at the beginning of each new regulatory period (i.e. every four years)
Additional revenue items (where applicable)
The following formula is applied in determining the WACC:

331
Where:
Ke = rf + β MRP is the cost of equity
MRP is the Market Risk Premium
Kd is the cost of debt
t is the corporate tax rate
The gearing level taken into account in the WACC formula corresponds to a normative
financial structure that is in line with European practices and sector average.
The cost of capital is estimated using the methodology known as the capital asset pricing
model (CAPM).
Allowed revenue assessments are based, on assumptions of the following outputs:
• Quality of service
• Productivity factor
• Cost of gas losses and metering difference
• Investment regulation
• Promoting gas use
The regulator introduced in 2012 an incentive regulation on unit investment costs: the
regulator assesses the realization of the projected investment volumes and gives a
bonus to the operator if unit costs are lower than projected.
For the smart metering program, the regulator appointed an external consultant to carry
on the cost‐benefit assessment of the project. The incentive regulation put in place by
CRE targets the consultant’s cost projections.
3. Tariffs for distribution services
3.1. Distribution tariffs: additional issues
Distribution tariffs includes a commodity fee (predominant for small consumers), a
capacity fee (predominant for big consumers), a fee proportional to the distance to
the transmission network (only applied to the very large consumers).
For consumers the DSO cannot refuse requests of connections, except for safety and
security reasons . For generators the DSO cannot refuse connection but it can enforce
a waiting list

332
In France, the DSOs only operates low pressure network (TSOs are responsible for
regional transmission networks).
The CRE is in charge of setting the distribution tariffs, which includes three different
components :
• A commodity fee (predominant for small consumers)
• A capacity fee (predominant for large consumers)
• A fee proportional to the distance to the transmission network (only applied to the
very big consumers)
Distribution tariffs cover the costs of an efficient operator. Thus, it could be theoretically
possible to exclude investments if proven useless. In practice, CRE does not conduct ex‐
post assessments of the usefulness of distribution investments.
Tariffs take into account costs actually paid by the operator: investments paid for by the
concession owner are not included in the RAB, however, some concession leases and
other concession costs are covered as an OPEX.
Various other aspects of distribution tariff setting are summarized in the table below.
Table 178: Approach to key issues in setting distribution tariffs
Issue Approach
Treatment of distribution losses Cost of losses is included in the distribution tariff.
Presence of uniform tariffs There are 26 DSOs charging different tariffs (corresponding to its allowed revenues) set by the regulator. However, GRDF represents 96% of demand.
Presence of non‐linear tariffs All tariff components are linear
Presence of regulated retail tariffs Regulated tariffs will disappear for non‐household consumers consuming more than 30 MWh/year before January the 1st, 2016. Will remain for smaller consumers.
Presence of social tariffs There is no social network tariff implemented. Social retail tariffs are implemented, under the form of a “Tarif spécial de solidarité”.
3.2. Connection and capacity issues
Connection fees for small consumers (metered every 6 months) include either:
Uniform fixed fee;
Uniform fixed fee plus the cost of network expansion;
Exclusively cost based when connections are particularly long or expensive.
Key issues in the setting of connection charges are set out in the table below.
Table 179: Summary of key issues relating to connection charges
Issue Approach
Determination of Type of charges Shallow. Costs of reinforcement are not

333
charges (shallow/deep) covered
Methodology adopted Standard costs are approved by the regulator for both uniform and client‐specific connection fees. For larger consumers or generators the DSO makes an estimate based on its cost but the client is free to procure the necessary works from a different source.
Hosting capacity Scope to refuse connection For consumers the DSO cannot refuse requests of connections, except for safety and security reasons83. For generators the DSO cannot refuse connection but it can enforce a waiting list. In case of refusal of connection, the regulator is notified and can be asked by the party seeking connection to revert the DSO's decision
Requirements to publish hosting capacity
None, but the CRE can ask for it during a settlement of dispute
4. Distribution system development and operation
4.1. Distribution system development
The key features of distribution system planning are summarized below.
Table 180: Approach to distribution planning
Issue Approach
Form of distribution planning document
‐ Key responsibilities for its development Quite all of the investments on distribution grids are done by DSO except small development supported by land developers for example
‐ Degree of integration with environmental policies
None
‐ Relationship with quality of service targets
None
‐ How trade‐offs between network development and alternative technologies are treated
The network development plan reports only the decisions of the DSOs. The analysis on which those decisions are based are not public.
83 In case of no rentability of the connection, the DSO can ask for a financial contribution to the consumers.
Local administrations are the owners of the distribution network. Responsibility for
network development is split between the DSO and local administrations.
Only the smart meter roll‐out (starting in 2016 for retail market and small companies)
is subject of an ex‐ante form of approval by the regulator.

334
‐ Requirements to integrate cost benefit analysis
Only smart meters roll out is conditioned by a CBA conducted by the regulator, which is published.
4.2. Metering
Key issues regarding metering, and the role of the DSOs, are set out in the following
table.
Table 181: Key approach to metering
Issue Approach adopted
DSOs role in metering The DSO:a) owns the meter b) is responsible for the collection of data from the meter c) is responsible for all other data management functions (validation, storing, sending the data to parties entitled access to them ...)
Monopoly services in the metering
DSOs are responsible for metering. However, DSOs can externalize the collection of the metering data.
Smart metering functionality Remote reading
Automatic collection and transmission of the metering data to the gas suppliers (on a monthly basis)
Local port and web site to give real time access to estimated consumption information
As of 2013 there were no smart meters installed in France. In early 2016 a project pilot
concerning the installation of 150000 smart meters for the retail market and small
companies will start. This project will end in 2022 (installation of 11 million of smart
meters).

335
Country Report ‐ Greece (electricity distribution)
1. Overview of to the distribution sector
1.1. Institutional structure and responsibilities
In Greece there is 1 distributor supplying electricity to 7179314 customers. Summary
data on the industry structure is set out below.
Table 182: DSO characteristics
Total number DSOs
Ownership unbundled
Legally unbundled
Less than 100000 customers
Exemption* Share of total demand
Country 1 Ex‐Vertically‐integrated monopoly
0 Yes, embedded generators do not pay distribution tariffs
0%
*exemption from distribution network charges for certain types of grid users, such as low‐carbon generation connected to distribution networks.
The responsibility for setting distribution tariffs is spread between the following
jurisdictions (for example):
The DSO submits proposals for the allowed revenues
The NRA issues a distribution tariff calculation methodology; it also approves the final
allowed revenues and tariffs.
Government issues the guiding principles in the primary law.
The breakdown of responsibilities as it related to tariff setting is summarized in the table
below.
The distribution sector is dominated by the one DSO operating in Greece; that DSO is
part of a vertically‐integrated company which also undertakes activities in the
generation and supply segments.
The NRA is responsible for setting the distribution tariffs for electricity customers, and
the DSO publishes and applies them.

336
Table 183: Legal basis for tariff structure – Roles and Responsibilities in setting distribution tariffs
Actor Allowed revenues (tariff level)
Tariffs (tariff structure)
Connection charges
DSO Submits proposals to NRA
Not involved
Government Defines main principles
Not involved Issues the principles in the primary law
NRA Issues the calculation methodology and approves final values
Sets the structure (following consultation)
Sets and issues the methodology
X = main responsibility; other options to fill the table: sets rules; monitors ex‐post; defines main principles;
calculates for NRA approval; also involved;
The regulatory process to setting distribution tariffs involves a consultation process,
wherein only the methodology undergoes public consultation. Tariffs are set by the
Regulator following a proposal by the DSO.
1.2. Key figures on revenue and tariffs
Distribution revenues in Greece in 2013 were €776,8 million. There is no separation of
the total allowed revenues for different activities.
A breakdown of revenue by customer category, including information on available tariff
components and the number of customers in each category is set out in the table below.
Table 184: Tariff components, customers and revenues per customer class
Customer classes Tariff components Number of customers
MV KWh; max. demand 10241
LV (w. Reactive power metering)
KWh, KVA 36244
LV (w/o reactive power metering)
KWh, KVA 113107
Domestic w. Social tariff KWh, KVA 5704485
Other LV (subscribed demand <25 kVA
KWh, KVA 1315237
Total ‐ 7179314
The breakdown of energy volumes and distribution revenue by customer category are
set out in the charts below.

337
Figure 43: Proportion of energy and revenue accounted by customer categories
These show a disproportionate share of costs borne by residential and commercial
consumers. Industrial consumers consume a significantly larger proportion of the overall
energy consumed, in comparison to their collective contribution to the total revenues.
The typical network tariff in 2013 for residential, small and large industrial customers is
illustrated below:
Table 185: Breakdown of annual charges – typical customer types, 2013 (€)
Customer type
Notional Energy usage
Fixed charges Energy charges Demand and reactive charges
Total
Residential 3500kWh 16 71 ‐ 87
Small commercial
50MWh 108 795 ‐ 903
Industrial 24000MWh 177840 69600 ‐ 247440
The resulting average tariffs per kWh are illustrated below.

338
Figure 44: Average network charges (€cents/kWh), 2013
2. Regulation of distribution activities
2.1. General overview
The distribution sector is regulated under a cost‐plus regulatory regime, wherein
allowed revenues are decided each year by the regulator. The regulator is currently
considering adjusting the regime to include a multi‐year incentive based regulatory
regime. The current model does not provide for any explicit performance incentives.
No formal methodology exists to analyse the DSO´s investment requirements and no ex
post assessment of investment usefulness is undertaken.
Key features of the regulatory regime are set out in the following table
Table 186: Main features of the regulatory regime
Issue Approach
Type of regime (concession/licence) License. There is one nationwide distribution network, owned by the ex‐vertically integrated utility (PPC). The system operator of the nationwide distribution network (the PPC distribution division spin‐off) has been appointed by law and licensed by the Regulator for an indefinite period of time.
Duration of tariff setting regime Allowed tariffs are only set for one year ahead.
A cost‐plus regulatory regime is used, and allowed revenues are decided on an
annual basis by the regulator.
There are no specific performance incentives in use.

339
The regulator is considering the possibility of switching to a multi‐year tariff model.
Form of determination (distributor propose/regulator decide)
The DSO proposes and the NRA decides on the final structure / calculation methodology
2.2. Main incentive properties of the distribution regulatory model
There are no explicit regulatory incentives provided for DSOs in the Greek electricity
distribution regulation. However, the DSO is incentivised to realise efficiency
improvements because their OPEX allowance is set that any realised OPEX within a +/‐
3% range of the agreed OPEX is allowed to be kept by the DSO. Outside of this range,
there may be ex post adjustments.
There is no quality of service regulation.
At the same time the following tool is provided to mitigate risks. The revenue target is
set in terms of total revenues and the entire volume risk is born by consumers (hence, if
demand goes down and the DSO does not achieve its revenue target in a year, in the
following period the tariffs will be adjusted to make‐up for the missing revenues).
Therefore, allowed revenues are always effectively recovered.
2.3. Determination of cost of service parameters
The approach to determining key cost of service parameters are summarized in the
following table.
Table 187: Approach to key cost of service parameters
Parameter Approach
Form of price control Cost‐plus
Regulatory asset base Based on the book values in 2009 without taking into account the latest revaluations for IFRS purposes. RAB is adjusted each year for new investments and assets taken off‐line.
Capital expenditure Not specifically analysed. A ‘soft’ approval approach is followed, whereby DSO annual investment proposals are loosely examined considering historic trends and future projections, with emphasis on significant deviations
Approach to operating expenditure Price cap, with allowed +/‐ 3% range (deviations outside this range are recovered in the following year tariffs).
Form of WACC applied Not applied

340
3. Tariffs for distribution services
3.1. Distribution tariffs There is currently no formal methodology set for the calculation of the allowed
distribution revenue, given that the Distribution Network Code (which will include the
methodology for estimating the annual distribution costs) has not been adopted yet.
For the purpose of calculating Distribution Use of System (DUoS) charges, customers are
categorised based upon their connection voltage and metering capabilities. Consumers
are separated into five (5) categories: MV customers, LV customers with subscribed
demand >25 kVA (with and without reactive power metering), LV residential customers,
and other non‐residential LV customers. For MV customers, 50% of the cost is recovered
through a capacity charge and 50% through an energy charge. For domestic customers,
10% of the cost is recovered through a capacity charge and 90% through an energy
charge. For Other LV customers the splits between capacity charges and energy charges
are 20% and 80%, respectively.
Various other aspects of distribution tariff setting are summarized in the table below.
Table 188: Approach to key issues in setting distribution tariffs
Issue Approach
Treatment of distribution losses Network use of system charges are applied on metered (delivered) energy. As a result, charges do not include the effect of network losses. All network losses are incorporated in the competitive tariff element (covering the cost of generation and supply activities)
Presence of uniform tariffs Yes
Presence of non‐linear tariffs No, all tariff components are linear
Presence of regulated retail tariffs No
Presence of social tariffs Yes
3.2. Connection charges Key issues in the setting of connection charges are set out in the table below.
Tariffs are set annually by the regulator; they are established using an informal
methodology, and costs which were not recovered in prior years are recovered
within the subsequent year´s tariffs.
Connection charges are generally deep in nature. The DSO is generally required to
provide a connection to all new renewable generation capacity.

341
Table 189: Summary of key issues relating to connection charges
Issue Approach
Determination of charges
Type of charges (shallow/deep) Deep charges for embedded generators and isolated/remotely located consumers. Partially deep charges for all other consumers
Methodology adopted Standard costs and cost coefficients approved by the regulator for both for uniform and client‐specific connection fees. Generators are free to procure the necessary works from a different source.
Hosting capacity Scope to refuse connection For consumers and generators the DSO can temporarily refuse connection only in case where it lacks the necessary network capacity.
Requirements to publish hosting capacity
There is no explicit requirement on the DSO to publish hosting capacity information. However there have been specific circumstances where the Regulator requested such a publication to be made for transparency reasons.
Targets and/or incentive schemes to enhance hosting capacity
No, the DSO is assumed to have a duty to connect all the renewable capacity that applies for connection, notwithstanding the case it lacks necessary network capacity
The DSO is required to notify the regulator of the hosting capacity of their network,
upon request and also when the hosting capacity is exhausted or nearing exhaustion on
the basis of existing connection requests in any particular area.
4. Distribution system development and operation
A distribution network development plan is supposed to be published, but in practice
this does not happen; instead the DSO submits its annual investment plan, which is
informed by, and informs, the annual revenue setting process.
Renewable generators are ´must run´ on the basis that they do not compromise
system security.
Around 11.000 medium voltage customers currently have a smart meter installed and
there are plans for further rollout of meters to other customers in Greece.

342

343
4.1. Distribution system development
The key features of distribution system planning are summarized below.
Table 190: Approach to distribution planning
Issue Approach
Form of distribution planning document Multi‐year distribution network development plan
‐ Key responsibilities for its development Legislation provides for regulatory approval of a multi‐year distribution network development plan. However these provisions are yet to be put into practice and no such development plan has been submitted by the DSO for regulatory approval. The DSO currently submits an annual investment program, as part of the annual revenue setting process.
‐ Degree of integration with renewables plan
The DSO, in developing its plan, generally takes into account the foreseeable demand for connection of renewable generation connections in drafting its annual network investment program.
‐ Relationship with consumption trends No specific relationship, but forward consumption is generally considered.
‐ Relationship with quality of service targets
No quality of service targets are set by the regulator
‐ How trade‐offs between network development and alternative technologies are treated
No specific treatment. The annual network investment program refers only to the result of the decisions of the DSO. The analyses on which those decisions are based are not public.
‐ Requirements to integrate cost benefit analysis
No requirement to integrate the CBA results. The annual network investment program refers only to the result of the decisions of the DSO. The analyses on which those decisions are based are not public.
4.2. Distribution system operations
The key features of distribution system operations are summarized below.
Table 191: Approach to distribution planning
Issue Approach
Requirements for dispatch of renewable plants connected to DSO network
All renewable generation is injected in the distribution network without being subject to dispatch instructions (priority dispatch), and on the condition that system security is not compromised.
Possibility to dispatch flexible loads The system operator controls all flexible loads.
Other sources of flexibility open to DSO There are no market‐based balancing or voltage regulation mechanisms / resources.

344
4.3. Metering
Key issues regarding metering, and the role of the DSO is set out in the following table.
Table 192: Key approach to metering
Issue Approach adopted
Discos role in metering The DSO has full responsibility for metering and also own the meters.
Monopoly services in the metering The DSO is a monopolist in metering services
Smart metering functionality Quarter of an hour measurements Remote reading Remote disconnection and reconnection of customers Remote control of the maximum power that can be withdrawn Local port to send real time consumption information to local screens/computers.
As of 2013 there were around 11.000 smart meters installed in Greece. Specifically, all
medium voltage customers are equipped with smart meters. A breakdown by customer
category is illustrated below.
Table 193: Number of smart meters installed – by end of 2013
Customer category Number
Residential 0
Commercial (Medium Voltage customers)
Approximately 11000
Industrial 0
Total Approximately 11000
The following information describes the plans for rolling out smart meters in Greece:
All large (≥85kVA) low voltage consumers (approx. 60000) in 2016;
Large pilot on smart meter deployment for LV customers (160000 metering points, all LV customer categories) in 2017; and
Eventually, there will be a full‐scale smart meter rollout.
At the current time, there has been no formal evaluation of the impact of smart meter
rollout, for example no information exists concerning the reduction in energy
consumption of an average medium voltage electricity customer.

345
Country Report – Greece (gas distribution)
1. Overview of to the distribution sector
1.1. Institutional structure and responsibilities
In Greece there are 3 distributors supplying electricity to 307060 customers. Summary
data on industry structure is set out below.
Table 194: DSO characteristics
Total number DSOs
Ownership unbundled
Legally unbundled
Less than 100000 customers
Exemption* Share of total demand
Country 3 0 0 2 Unconfirmed Unknown %*exemption from distribution network charges for certain types of grid users, such as low‐carbon generation connected to distribution networks.
At the current time, distribution tariffs are included in the final supply tariff to
customers. Distribution tariffs are not calculated separately from supply tariffs. Similarly,
the allowed revenues of each Greek DSO are not separated into distribution‐related
costs and supply‐related costs. Rather, each DSO has allowed revenues which are a
single value and is supposed to cover all aspects of gas supply (i.e. distribution and
supply).
DSOs´ activities have not yet been unbundled from supply activities. However, this
situation is under review and a major reform of the regulatory regime for gas
distribution is currently underway; the outcome will be that the gas distribution sector is
unbundled from other supply activities.
The allowed revenues of DSOs for distribution activities are set on a DSO‐specific basis
by the NRA, and are established within the company´s concession agreement. The
overall allowed revenues of each DSO cover all activities, including supply and
distribution.
The breakdown of responsibilities as it related to tariff setting is summarized in the table
below.
The regulatory regime covering the distribution sector is currently being reformed. At
present, distribution activities are not unbundled from other gas supply activities.

346
Table 195: Legal basis for tariff structure – Roles and Responsibilities in setting distribution tariffs
Actor Allowed revenues (tariff level)
Tariffs (tariff structure)
Connection charges
DSO Not involved N.a. (Distribution tariffs are not established; rather, distribution costs are included in overall supply tariffs).
Calculates on case‐by‐case basis for customers with demand < 100 m3/h.
Government Not involved N.a. (Distribution tariffs are not established; rather, distribution costs are included in overall supply tariffs).
Not involved
NRA Sets allowed revenues (within each DSO´s concession agreement)
N.a. (Distribution tariffs are not established; rather, distribution costs are included in overall supply tariffs).
Sets a standard connection fee which applies for all residential, commercial and small industrial customers.
X = main responsibility; other options to fill the table: sets rules; monitors ex‐post; defines main principles;
calculates for NRA approval; also involved;
1.2. Key figures on revenue and tariffs
According to the Greek regulator, it is not possible to ascertain the amount of allowed
revenues for DSOs operating in the Greek gas sector, because distribution allowed
revenues are bundled together with the allowed revenues of other activities, particularly
gas supply. A similar situation exists concerning understanding the different tariff
components used by a DSO to recover costs for distribution activities. Specifically, DSOs
are not required to, and do not, publish the specific tariff components they use to
recover costs related to their distribution activities. Distribution tariffs are bundled
together with retail tariffs: retail and distribution tariffs are calculated using the same
methodologies.
The gas distribution sector is currently undergoing a significant regulatory reform
process, and the outcome will be that the distribution segment is unbundled from other
segments. This implies that in the future allowed revenues will be calculated for gas
DSOs´ distribution activities, and a responsible entity (most likely the DSOs themselves,
or the NRA) will be required to develop tariffs for customers specifically for distribution
services.

347
As a result of the above‐described current tariff arrangement, it is not possible to
calculate the respective revenues which DSOs received from each customer class in
2013 (this information is not available). For the same reason, it is not possible to
calculate an average per‐kWh distribution network tariff for residential, small
commercial and industrial customers in Greece. However, it is possible to provide a
breakdown of the energy volumes by customer category in 2013, as shown in the chart
below.
Figure 45: Proportion of energy accounted by customer categories
2. Regulation of distribution activities
2.1. General overview
The distribution sector is regulated under a revenue cap regulatory regime. The NRA
sets the allowed revenues of each DSO. DSOs are then allowed to maximise their
revenue by using any pricing methodology they choose, but their revenues must not be
above the maximum revenue level as set in their licenses and which takes into account
revenues, Opex and Capex.
The distribution tariff is bundled into an integrated retail supply tariff.
Key features of the regulatory regime are set out in the following table
Distribution tariffs are bundled within an integrated retail supply tariff. A revenue cap, set
by the NRA for each DSO, is used to limit the revenues of each DSO.
Concessions of 30 years are currently used; this arrangement is likely to change following
the reform of the distribution sector regulatory regime (currently underway).

348
Table 196: Main features of the regulatory regime
Issue Approach
Type of regime (concession/licence) Concessions, typically of 30 years. However, according to the NRA, existing concessions are will be broken because the distribution regulatory regime is currently being adjusted.
Duration of tariff setting regime N.a.
Form of determination (distributor propose/regulator decide)
The NRA sets the allowed revenue, through a revenue cap
Scope for appeal regulatory decision No scope of appeal.
2.2. Main incentive properties of the distribution regulatory model
DSOs are incentivised in their regulated activities not through specific incentive
mechanisms, but rather through the potential to maximise their revenues using any
pricing methodology they choose. This is bound by the revenue cap set by the NRA. For
example, assuming they stay within the revenue cap, DSOs can, for example, be
incentivised to improve performance efficiency through being able to keep any cost
savings as a result of operating more efficiently.
There are no types of risk mitigation measures in use. Similarly, there is no specific
quality of service regulation in use in the distribution sector.
2.3. Determination of cost of service parameters
The approach to determining key cost of service parameters are summarized in the
following table.
Table 197: Approach to key cost of service parameters
Parameter Approach
Form of price control Revenue cap
Regulatory asset base There is currently no RAB
Capital expenditure Not specifically assessed, to be covered within the allowed revenue value of each DSO
Approach to operating expenditure Not specifically assessed, to be covered within the allowed revenue value of each DSO
Form of WACC applied N.a.
Additional revenue items (where applicable)
N.a.

349
3. Tariffs for distribution services
3.1. Distribution tariffs As described above, there is no specific methodology in place to allocate distribution
costs to tariff components.
Various aspects of the current arrangements for distribution tariff setting are
summarized in the table below.
Table 198: Approach to key issues in setting distribution tariffs
Issue Approach
Treatment of distribution losses N.a.
Presence of uniform tariffs No
Presence of non‐linear tariffs N.a.
Presence of regulated retail tariffs NRA sets a revenue cap for retail tariffs
Presence of social tariffs No
3.2. Connection charges Key issues in the setting of connection charges are set out in the table below.
Table 199: Summary of key issues relating to connection charges
Issue Approach
Determination of charges
Type of charges (shallow/deep) Shallow
Methodology adopted For residential, commercial and small industrial (<100m3/h) there is a one‐off connection fee. For larger consumers connection fees are computed case by case.
Hosting capacity Scope to refuse connection DSOs cannot refuse requests for connection that lie up to 25 meters away of its system. In the event that a connection is refused the NRA is notified
Requirements to publish hosting capacity
N.a.
Targets and/or incentive schemes to enhance hosting capacity
N.a.
It is not possible to isolate and examine the tariffs for distribution services, and there is no
specific methodology in use to allocate the costs of distribution activities to tariff
components.

350
4. Distribution system development and operation
4.1. Distribution system devlopment
The key features of distribution system planning are summarized below.
Table 200: Approach to distribution planning
Issue Approach
Form of distribution planning document DSO system development plan
‐ Key responsibilities for its development DSOs develop their plans and submit them to the NRA. The NRA is not required to approve the plan
‐ Degree of integration with renewables plan No integration
‐ Relationship with consumption trends Not explicitly considered
‐ Relationship with quality of service targets Not explicitly considered
‐ How trade‐offs between network development and alternative technologies are treated
Not explicitly considered
‐ Requirements to integrate cost benefit analysis
No requirement
4.2. Metering
Key issues regarding metering, and the role of the DSOs, are set out in the following
table.
Table 201: Key approach to metering
Issue Approach adopted
Discos role in metering DSOs (which are the same companies as the retail service providers) are fully‐responsible for metering services provision, they also own the meters.
Monopoly services in the metering Yes, they are monopoly service providers
Smart metering functionality Such meters are not currently deployed or in use.
As of 2013 smart meters were basically not installed in the gas distribution sector of
Greece. The decision not to proceed with installing smart meter technologies was based
on the findings of a cost benefit analysis undertaken. According to the NRA the analysis
found that, overall, the installation of smart meters would result in an increase in tariffs.
DSOs develop and provide distribution planning documentation to the NRA; however,
the NRA is not required to provide any form of approval on the documents. Moreover,
the guidelines for developing the planning documents are not stringent, and do not
require the DSOs to specifically consider, for example, consumption trends, quality of
service targets, or the integration of new technologies.
DSOs are fully responsible for metering activities. There are no smart meters currently
installed in the Greek gas distribution segment.

351
Country Report – Croatia (electricity distribution)
1. Overview of the distribution sector
1.1. Institutional structure and responsibilities In Croatia a single company operates distribution. It is legally unbundled and owned by
the integrated state‐owned operator (HEP) supplying more than 2,3 million customers
and covering the whole country.
Table 202: DSO characteristics
Total number DSOs
Ownership unbundled
Legally unbundled
Less than 100000 customers
Exemption* Share of total demand
1 ‐ 1 ‐ Embedded generators only pay metering
N.A.
*exemption from distribution network charges for certain types of grid users, such as generation connected to distribution networks.
The breakdown of responsibilities as it related to tariff setting is summarized in the table
below.
Table 203: Legal basis for tariff structure – Roles and Responsibilities in setting distribution tariffs
Actor Allowed revenues (tariff level)
Tariffs (tariff structure)
Connection charges
DSO Proposes
Parliament Issues principles in the primary law
Issues principles in the primary law
NRA Approves proposal or rejects – if rejects, sets AR
Sets tariff structure after public consultation
Issues a methodology, calculates
X = main responsibility; other options to fill the table: sets rules; monitors ex‐post; defines main principles;
calculates for NRA approval; also involved;
There are no public consultations.
There is a single DSO, which is legally unbundled but controlled by the integrated
electricity company (HEP). Tariffs are still regulated on a rate of return, annual basis.
Quality of service regulation is under preparation. There is no information about smart
meters or their development plans.

352
1.2 Key figures on revenue and tariffs
Distribution allowed revenues in 2013 were 429,26 million EU, of which 382,57 for
distribution and 46,7 for metering activities. No further revenue breakdown is available.
A breakdown of the number of customers, energy delivered and the revenue by
customer category, including information on available tariff components, is set out in
the table below.
Table 204: Tariff components, customers and revenues per customer class
Customer classes Tariff components Number of customers
Delivered energy (TWh)
Revenue (million EUR)
MV kWh & KW &fixed 2126 3,507 64,4
LV > 30 kW kWh & KW & fixed 17828 2,629
163,1
LV <= 30 kW, non‐households, dual tariff
kWh &fixed 125288 1,262
LV <= 30 kW, non‐households, single tariff
kWh & fixed 46920 0,248
Public lighting kWh only 21731 0,432
Households dual tariff kWh & fixed 1376617 4,668
201,8 Households single tariff kWh & fixed 757757 1,561
Households with load control kWh & fixed 3098 0,078
Total 2309137 14,385 426,3
The breakdown of energy volumes and distribution revenue by customer category are
set out in the charts below.
Figure 46: Proportion of energy and revenue accounted by customer categories

353
The split seems to favour households, which pay on average less than small commercial
users, due to higher costs of metering services for small commercial users (See also
Figure 2 below).
The official consumer categories are related to supply voltage, peak power and usage,
and are described in Table 3 above. Typical customers are:
A. Household: 3,5 MWh/y; HT/LT: 70/30
B. Middle business: 150 MWh/y; HT/LT: 70/30; Peak power: 50 kW
C. Middle industry: 2000 MWH/y.; HT/LT: 65/35; Peak power: 500 kW
D. Big industry: 24000 MWh/y; HT/LT: 60/40; Peak power 4000 kW
The average tariffs per kWh for the standard typical customers in 2012 (latest available
year) are illustrated below.
Figure 47: Average network charges (€c/kWh), 2013
2. Regulation of distribution activities
2.1. General overview
Key features of the regulatory regime are set out in the following table.
Table 205: Main features of the regulatory regime
Issue Approach
Type of regime (concession/licence) License
Duration of tariff setting regime 1 year
Form of determination (distributor DSO proposes allowed revenue, NRA

354
propose/regulator decide) approves and sets the tariff structure
Scope for appeal regulatory decision N.A.
2.2. Main incentive properties of the distribution regulatory model
Croatia uses a rate of return (cost of service) regulatory approach. The Allowed Revenue
comprises planned capex and opex for the next regulatory period (year). Thus, the
incentive properties of the regulatory regime are very limited.
There are no specific risk mitigation provisions. However, the planned revenue for the
next year is corrected by the difference between planned and realised revenue for the
past year. Moreover, riskier investments receive a more favourable treatment, as
explained in the below description of the WACC formula.
Quality requirements are under preparation, pursuant to the electricity law.
2.3. Determination of cost of service parameters
The approach to determining key cost of service parameters are summarized in the
following table.
Table 206: Approach to key cost of service parameters
Parameter Approach
Form of price control Rate of return (cost of service)
Regulatory asset base Book value of assets
Capital expenditure Assessed every year
Approach to operating expenditure Assessed every year
Form of capital remuneration applied Real WACC;
Additional revenue items (where applicable)
Not applicable
Weighted average costs of capital (PPTK) after taxation is calculated in the following
way:
E – equity capital,
D – debts,
re – return on equity [%],
rd – average interest rate on liabilities [%] and

355
pd – profit tax [%]
‐return on equity re is determined as:
re = rf + (rm – rf) . β
Whereby individual items are the following:
rf – return on risk‐free investments [%],
rm – average return on risky investments (expected return on market portfolio)
[%],
(rm – rf) – market risk premium [%],
β – variability coefficient of return on energy operator's shares in relation to
average variability of return on all shares quoted on the market and
(rm – rf) . β – market risk premium for own capital [%].
The debt leverage is set at the real ratio of the distributor’s mother company.
3. Tariffs for distribution services
3.1. Distribution tariffs
Customers are divided in the following categories:
1. Entrepreneurs (non‐households):
(a) customers on high voltage grid who pays only transmission fee
(b) customers on medium voltage grid
(c) customers on low voltage grid:
‐ with power metering
‐ without power metering
‐ public lightning
2. Households
The tariff structure includes two time zones and is based on energy only for smaller
customers, and on peak and energy for metered loads. There are also fixed terms,
which cover metering costs.

356
For all consumers, tariff elements cover the costs for usage of the distribution network as follows:
1. Charge for metering service (Kn/monthly),
2. Active power (Kn/kW) for MV and LV customers (> 30 kW),
3. Active energy for all customers (Kn/kWh) and
4. Excess reactive energy (Kn/kvarh) for entrepreneurs (non‐households).
There are two different active energy components in peak (8 – 21 hours) and off‐peak (21 – 8 hours) times. The ratio between the higher daily rate (VT) and the lower night rates (NT) for electricity taken over for customer categories with dual‐tariff meters is approximately 2:1. Various other aspects of distribution tariff setting are summarized in the table below.
Table 207: Approach to key issues in setting distribution tariffs
Issue Approach
Treatment of distribution losses Included in distribution tariffs
Presence of uniform tariffs Yes, for the whole country%
Presence of non‐linear tariffs No
Presence of regulated retail tariffs For households only
Presence of social tariffs No
Embedded generators only pay any metering charges.
3.2. Connection and capacity issues
Key issues in the setting of connection charges are set out in the table below.
Table 208: Summary of key issues relating to connection charges
Issue Approach
Determination of charges
Type of charges (shallow/deep) Deep
Methodology adopted Standard or actual cost
Hosting capacity Scope to refuse connection No, if connection fee is paid
Requirements to publish hosting capacity
No
Targets and/or incentive schemes to enhance hosting capacity
No. The DSO has the duty to connect all generators.
Customers’ connection fee is fixed in kn/kW, based on standard costs. If planned connection costs exceed 20 % of costs based on fixed amount (kn/kW) x power (kW) than the customer has to pay all real costs.
Generators must pay all real costs.

357
4. Distribution system development and operation
4.1. Distribution system development
Investments plans (10 years, 3 years, 1 year investments plans) are subjects of official approval.
The key features of distribution system planning are summarized below.
Table 209: Approach to distribution planning
Issue Approach
Form of distribution planning document Approved by regulator and published
Key responsibilities for its development DSO
Degree of integration with renewables plan
RES targets and the distribution development plan are not explicitly related.
Relationship with consumption trends Explicitly taken into account, with spatial detail
Relationship with quality of service targets
No explicit connection
How trade‐offs between network development and alternative technologies are treated
The network development plan reports only the decisions of the DSOs. The analysis, on which those decisions are based, are not public.
Requirements to integrate cost benefit analysis
No
The analysis of the link between grid investment (including smart grid technologies), RES
targets, and quality of service and demand flexibility is under preparation.
4.2. Distribution system operations
The key features of distribution system operations are summarized below.
Table 210: Approach to distribution planning
Issue Approach
Requirements for dispatch of renewable plants connected to DSO network
Smaller embedded generators (like residential PV) are not dispatched. The DSO can only require larger embedded units to disconnect in case the distribution system cannot host their injections
Possibility to dispatch flexible loads The DSO can directly control flexible loads through remotely operated switches – ripple control.
Other sources of flexibility open to DSO
No
DSOs must comply with TSO directives.
Decisions are taken by DSOs, which have an obligation to supply all customers

358
4.3. Metering
Key issues regarding metering, and the role of the DSOs, are set out in the following
table.
Table 211: Key approach to metering
Issue Approach adopted
Discos role in metering Full responsibility
Monopoly services in the metering
Yes, DSO
Smart metering functionality Yes, for customers with subscribed power > 30 kW
There is no information about deployment or plans for smart meters.

359
Country Report – Croatia (gas distribution)
1. Overview of the distribution sector
1.1. Institutional structure and responsibilities
Gas distribution is operated on a concession regime for the distribution system and
another for construction, which are tendered for a period of a minimum of 20 and a
maximum of 30 years. A concession is issued by regional self‐government.
In case of renewal, the DSO that loses the concession is remunerated on the basis of its
concession contract terms.
All DSO that came from horizontally integrated undertakings are at least legally
unbundled from non‐energy activities, and those from vertically integrated ones have at
least implemented accounting and functional unbundling provisions.
The only DSOs with more than 100000 customers is Gradska plinara Zagreb d.o.o.
(Zagreb Gas Works Ltd).
Table 212: DSO characteristics
Total number DSOs
Ownership unbundled
Legally unbundled
Less than 100000 customers
Share of total demand (< 100,000 customers)
36 ‐ 13 34 61.8%
The breakdown of responsibilities as it related to tariff setting is summarized in the table
below.
There are 35 DSOs, but only one has more than 100000 end customers and is legally
unbundled. All other DSOs are functionally unbundled.

360
Table 213: Legal basis for tariff structure – Roles and Responsibilities in setting distribution tariffs
Actor Allowed revenues (tariff level)
Tariffs (tariff structure)
Connection charges
DSO Calculates after methodology
Defines within methodology
Calculates after methodology
Ministry/Parliament Issues principles in the primary law
Issues principles in the primary law
Issues principles in the primary law
NRA Defines a methodology, approves/rejects.
Defines a methodology, approves/rejects.
Defines a methodology, approves/rejects.
X = main responsibility; other options to fill the table: sets rules; monitors ex‐post; defines main principles;
calculates for NRA approval; also involved;
In the process of adopting the methodology, the Regulatory Agency ensures appropriate
participation of all stakeholders and conduct a public consultation which should last at
least 15 days. In the last case, it lasted for 25 days.
1.2. Key figures on revenue and tariffs
Distribution allowed revenues approved for 2014 amounts to 72,9 million EU, of which
2,5 for connection fees and capacity enhancements, 2,4 for non‐standard services and
5,9 for other services, the remaining 62,1 for distribution and metering activities.
A breakdown of the number of customers, energy delivered and the revenue by
customer category, including information on available tariff components, is set out in
the table below.
Table 214: Tariff components, customers and revenues per customer class
Customer classes Tariff components
Number of customers
Delivered energy (GWh)
Revenue (thousand
EUR)
TM1 (households) kWh &fixed 599019 6153 44049,3
TM2 ≤ 10 GWh kWh &fixed 52013 3260 14582,0
TM3 > 10 ≤ 50 GWh kWh &fixed 63 1109 3187,3
TM4 > 50 GWh kWh & fixed 4 124 140,9
Total 651099 10646 61959,4
The breakdown of energy volumes and distribution revenue by customer category are
set out in the charts below.

361
Figure 48: Proportion of energy and revenue accounted by customer categories
The split seems reasonably in line with costs.
There are no official typical customers in Croatian gas industry.
The average distribution tariffs per kWh for the standard typical customers in 2013 and
for the official customer groups are illustrated below.
Figure 49: Average network charges for standard customers (€c/kWh), 2013

362
Figure 50: Average network charges for official customer groups (€c/kWh), 2013
2. Regulation of distribution activities
2.1. General overview
Key features of the regulatory regime are set out in the following table.
Table 215: Main features of the regulatory regime
Issue Approach
Type of regime (concession/licence) Concession
Duration of tariff setting regime 3 years since 2014 (5 years since 2017)
Form of determination (distributor propose/regulator decide)
DSO proposes allowed revenue and tariff structure, NRA approves or (if proposal rejected) sets the tariff structure
Scope for appeal regulatory decision N.A.
2.2. Main incentive properties of the distribution regulatory model
The gas distribution tariff system has been reformed recently. An Incentive‐based
method of maximum allowed revenue (revenue cap) has been introduced. The allowed
revenue is set for regulatory period, based on planned CAPEX, with an ex‐post
adjustment based on real values (but only up to the economically efficient level). OPEX is
projected for the regulatory period based on 1+CPI‐X formula, without ex‐post
adjustment, and if realized below projected level profit‐sharing mechanism applies. For
the first period (2014‐16) the X‐factor is set to zero.
The 1st reg. period lasts 3 years (2014‐2016) and the subsequent regulatory periods will
last 5 years.

363
By the “profit sharing mechanism”, at the beginning of a new regulatory period the new
starting OPEX (as part of allowed revenue) is set in a way that 50% of the efficiency gains
(in excess of the OPEX cap) obtained by the firm in the previous period are not
transferred to consumers in the form of reduced tariff.
The revenue target is set in terms of total allowed revenues (calculated per year and
then smoothed throughout regulatory period to avoid sharp tariff variations) and the
entire volume risk is born by consumers: if demand goes down and the DSO does not
obtain the revenue target in one regulatory period, in the following period tariffs will be
adjusted to make‐up for the missing revenues in the previous period. The entire
revenues in gas distribution come from “per KWh” tariff components (i.e. from rates
based on distributed quantity) and from fixed monthly fee per measuring point aimed
for covering fixed costs related to reading, measuring, calibration etc.
2.3. Determination of cost of service parameters
Assets are included into RAB ex‐ante. After expiry of the reg. period CAPEX is revised
and the difference between planned and real values (positive or negative) is shifted to
the following reg. period, whereas CAPEX overruns are recovered only up to an efficient
margin. The ex‐post assessment is planned for 2017.
A simplified benchmarking method was applied to define allowed base OPEX (for year T‐
2) for each of 36 DSOs. The benchmark was performed separately on a few segments of
OPEX and simultaneously took into account following outputs:
‐ Energy delivered through the distribution network
‐ Number of consumers connected
‐ Length of distribution network
The Agency plans to perform benchmark analysis based on some of the recognized
methods (DEA, COLS, SFA, etc.) in 2015/16 and to apply results/efficiency factors for the
2nd regulatory period.
Exceptional rate revision could be carried out during the regulatory period in case of
unexpected changes in the market that have a significant impact on the gas distribution
activity and that DSO could have not anticipated, prevented, eliminated or avoided. The
approach to determining key cost of service parameters are summarized in the following
table.
Differences between actual and allowed (revised) revenues are summed to a special
account and shifted to the next reg. period ‐ tariffs are increased or decreased so that
the account is brought back to zero (no threshold).

364
Table 216: Approach to key cost of service parameters
Parameter Approach
Form of price control Revenue cap
Regulatory asset base Net book value
Capital expenditure Planned value subject to ex‐post assessment
Approach to operating expenditure Benchmarking and revenue cap revision
Form of capital remuneration applied Pre‐tax nominal WACC
Additional revenue items (where applicable)
Excess losses in exceptional cases
The concession lease is covered as an OPEX. Also, in case DSO is not owner of the
network, OPEX include the cost of the network rent.
The weighted average costs of capital (PPTK) before taxation is calculated in the
following way:
ED
Dr
ED
E
P
rWACC D
E
1
Where:
rE = rf + β x MRP is the cost of equity
MRP is the Market Risk Premium
rD is the cost of debt
P is the corporate tax rate
E is equity capital
D is debts
rf is the return on risk‐free investments [%]
β is the variability coefficient of return on energy operator's shares in relation to average
variability of return on all shares quoted on the market.
The debt leverage is set at a target ratio considered as efficient by the regulator (D/E
ratio 50/50% defined by the Methodology). There is no adjustment ex‐post.
3. Tariffs for distribution services
3.1. Distribution tariffs
The tariff structure is based on tariff item for the distributed gas quantity and fixed
monthly fee for covering the corresponding part of fixed expenses of gas distribution
related to a metering point.

365
The regulator is in charge of setting the distribution tariffs for a regulatory period (based
on allowed revenues) after distribution companies submit their requests or after the
regulator initiates a tariff setting process
Allowed revenue for each year of regulatory period is allocated to two tariff items:
‐ tariff item for the distributed gas quantity (kn/kWh)
‐ fixed monthly fee for covering the corresponding part of fixed expenses of gas
distribution which are related to a metering point (kn).
Both of the tariff items are set for 12 tariff models84 (derived according to yearly gas
consumption).
Tariff item for the distributed gas quantity is calculated by using coefficients of
consumption and fixed monthly fee is calculated by metering point.
Values of those coefficients are prescribed by the Methodology in the corresponding
ranges of values for each tariff model, and DSOs submit them to the Regulator in their
tariff requests.
Various other aspects of distribution tariff setting are summarized in the table below.
Table 217: Approach to key issues in setting distribution tariffs
Issue Approach
Treatment of distribution losses Included in distribution tariffs (up to allowed level of 3%)
Presence of uniform tariffs No
Presence of non‐linear tariffs No
Presence of regulated retail tariffs For households only, temporary
Presence of social tariffs Under preparation
There are currently 35 DSOs in the country and each DSO charges different tariffs
corresponding to its allowed revenues. The energy related component is different for
each DSO, whereas the fixed monthly fee is the same for all DSOs. Tariffs are equal for
all customers of the certain tariff model in the whole distribution area of a DSO (post‐
stamp principle). There are no further differentiation or nonlinearities.
Distribution tariff includes the cost of losses. The maximum value of allowed quantity of
gas for covering losses that is recognised in allowed revenue is 3% of gas entering the
distribution system.
On an exceptional basis it may be justified to approve a greater amount of allowable
losses, taking into account the specificities of business conditions and the characteristics
84 From 1 Jan 2014

366
of the distribution system, whereby the operator is obliged to submit an operational
plan for reducing gas losses that is feasible within a reasonable time.
End‐user tariffs are regulated for households only and on a temporary basis. A
mechanism for support to vulnerable customers is currently being created at State level.
3.2. Connection and capacity issues
The connection fee consists of:
‐ Connection construction cost
‐ Cost of preliminary/final works
‐ Cost of the regular creation of technical conditions in the distribution system or cost of
the extraordinary creation of technical conditions in the distribution system (on case by
case basis).
The cost of the regular creation of technical conditions exists only for DSOs for which a
regulatory account (special long‐term incentive model for Greenfield or significant
investments) has been established by the Regulator. For the rest of DSOs the regular
creation of technical conditions is covered by the distribution tariff.
There are 4 categories of connections to the distribution system:
Category I ‐ connection of the building with a connection capacity determined by
energy conditions in an amount less than or equal to 100 kWh/h,
Category II ‐ connection of the building with a connection capacity determined by
energy conditions in an amount higher than 100 kWh/h and less than or equal to 400 kWh/h,
Category III ‐ connection of the building with a connection capacity determined by
energy conditions in an amount higher than 400 kWh/h and less than or equal to 4000
kWh/h
Category IV ‐ connection of the building with a connection capacity determined by
energy conditions in an amount higher than 4000 kWh/h.
The connection fee is generally based on a shallow approach. The deep approach is
applied only when the cost of regular creation of technical conditions in the distribution
system (applies to 4 out of 35 DSOs) or the cost of extraordinary creation of technical
conditions in the distribution system is charged. This exists only for DSOs for which a
special long‐term incentive model for greenfield or significant investments has been
established by the Regulator.
Connection charge segments are calculated as follows:

367
Connection construction cost ‐ according to market conditions, i.e. client is free to
procure the necessary works from a DSO or from a different source certified by DSO;
Cost of preliminary/final works ‐ standard costs approved by the regulator;
Cost of the extraordinary creation of technical conditions in the distribution system ‐
according to prepared study, on case by case basis;
Cost of the regular creation of technical conditions ‐ standard costs per kW approved
by the regulator.
The DSO is allowed to refuse access to the system to third parties:
1. When there is lack of capacity
2. When access to the system would prevent DSO from performing a public service
obligation
3. When access to the system could cause serious financial and economic difficulties for
DSO considering "take or pay" contracts concluded prior to the application for approval
of access.
In case of refusal of access to the system, DSO must deliver to the third party a decision
with reasons for denying access, and afterwards third party can file a complaint to the
Regulator.
The Regulator must issue a decision within 60 days since the filing of the appeal. The
decision of the Regulator is executive, and the injured party can initiate an
administrative dispute against the Regulator's decision.
Also, DSO which refuses access to the system because the lack of capacity or other
justifiable reason must, within a reasonable time, make the necessary enhancements in
the system in order to allow access to the system, if they are economically feasible or if
potential user is willing to finance those enhancements of the system.
Key issues in the setting of connection charges are set out in the table below.
Table 218: Summary of key issues relating to connection charges
Issue Approach
Determination of charges
Type of charges (shallow/deep) Mostly shallow. Deep if special investment required (4/35 DSOs)
Methodology adopted Standard or market cost
Hosting capacity Scope to refuse connection Yes
Requirements to publish hosting capacity
No
Targets and/or incentive schemes to enhance hosting capacity
Yes. The DSO has the duty to enhance capacity in case this is a reason to reject connections.

368
4. Distribution system development and operation
The distribution system development plan is prepared for the regulatory period and
submitted to the regulator for approval, in line with DSO’s request for determination of
the amount of tariff items for gas distribution.
The plan must include a feasibility study of the planned investments, including a
projection of the gas supply and demand, a projection of the schedule for connecting
system users, and the financing sources for the planned investments. These analysis are
not public.
Table 219: Approach to distribution planning
Issue Approach
Form of distribution planning document Approved by regulator and published
Key responsibilities for its development DSO
Degree of integration with renewables plan
N.A.
Relationship with consumption trends Explicitly taken into account
Relationship with quality of service targets
No explicit connection
How trade‐offs between network development and alternative technologies are treated
The network development plan reports only the decisions of the DSOs. The analysis, on which those decisions are based, are not public.
Requirements to integrate cost benefit analysis
No. Only feasibility study required with demand and supply scenarios
Pursuant to the Act on Gas Market, DSO’s duty is to provide attention to energy
efficiency and the protection of nature and environment. Accordingly, distribution
network plan has to tend and to enable system development in a way to align with
current environmental policies.
General Conditions for Gas Supply (Official Gazette No. 158/13) prescribe general
standards as well as guaranteed standards of quality of gas supply. Quality of service
parameters are planned to be implemented starting from 2nd regulatory period.
Providing optimal quality of gas supply will be encouraged through incentives (revenue
formula) and reimbursement for services provided outside of the guaranteed standards,
both starting from 2nd reg. period (1 Jan 2017)
4.1. Metering
DSO owns the meter after have invested in meter replacement or have the responsibility
of the economic management of the connection, including meter, in case the investor of
the connection was the customer. In both cases, DSOs have full responsibility for
metering.
Decisions are taken by DSOs, which have an obligation to supply all customers

369
Key issues regarding metering, and the role of the DSOs, are set out in the following
table.
Table 220: Key approach to metering
Issue Approach adopted
Discos role in metering Full responsibility
Monopoly services in the metering
Yes, but customers can choose another provider of the meters
Smart metering functionality N.A.
There are pilot projects planned for the deployment of smart meters.
Information about the features of such meters is not available to the Agency.
By the end of 2014 the Agency is planning to launch the procurement procedure for the
preparation of the methodology for analysing the costs and benefits of introducing
advanced measuring devices in the field of gas.
The share of consumption by non‐daily metered end customers connected to
distribution system is 88.4% (2013).

370
Country Report – Hungary (electricity distribution)85
1. Overview of to the distribution sector
1.1. Institutional structure and responsibilities
In Hungary there are 6 distributors supplying electricity to 5.5 millions of customers
covering the whole country. Each of the 6 DSO´s are mainly owned by foreign investors
through their respective parents companies. Total energy distributed in 2013 amounted
to ca. 37 Twh.
All DSO´s in Hungary are by legal unbundling in accordance with the rules of unbundling
laid down in the Electricity Act basis of Directive 2003/54/EC. Otherwise there are no
special rules for the DSO with less than 100,000 customers.
Table 221: DSO characteristics
Total number DSOs
Ownership unbundled
Legally unbundled
Less than 100,000 customers
Exemption*
Share of total demand
Country 6 6 0 N/A N/A *exemption from distribution network charges for certain types of grid users, such as low‐carbon generation connected to distribution networks.
The breakdown of responsibilities as it related to tariff setting is summarized in the table
below.
Table 222: Legal basis for tariff structure – Roles and Responsibilities in setting distribution tariffs
Actor Allowed revenues (tariff level)
Tariffs (tariff structure)
Connection charges
85 Pending validation from the NRA.
In Hungary operates six legally unbundled DSO, covering the whole territory of the
country. The main responsible of the definition of the distribution tariff is the NRA,
with some recommendation and principles defined by the government.

371
DSO
Government – Ministry of National Development
Defines main principles
X
NRA X X X X = main responsibility; other options to fill the table: sets rules; monitors ex‐post; defines main principles;
calculates for NRA approval; also involved;
The main responsible of the definition of the distribution tariff is the NRA, with some
recommendation and principles defined by the government.
Until the 1st of October 2014, the responsibilities for the definition of connection
charges are split between the Ministry of National Development and the NRA
(Hungarian Energy Office). Since the 1st of October 2014, the NRA is going to be
responsible for the whole process.
1.2. Key figures on revenue and tariffs Distribution revenues in 2013 were 274 billion HUF (920 Millions of Euros), broken down
by the following activities:
Operation expenditure – 89 billion HUF‐ 304 Millions of Euros (33%)
Depreciation – 65 billion HUF‐ 221 Millions of Euros (24%)
Capital Cost – 50 billion HUF – 165Millions of Euros (18%)
Network loss – 69 billion HUF ‐ 230 Millions of Euros (25%)
In Hungary, there are 5 classes of consumers according to the voltage level, but some
level have some particularities in Medium and Low voltage connections:
High voltage Connection point higher than 35 kV
High/medium voltage. Connection higher than 1 kV
Medium voltage connection
Medium/low voltage connection
o Profile based, all day. With contracted capacity not exceeding 55,2 kW or 3x80A
o Profile based, controlled
o Not profile based. With contracted capacity exceeding 55,2 kW or 3x80 A
Low voltage connection
o Profile based, all day. With contracted capacity not exceeding 55,2 kW or
3x80A. The residential customers supplied by the Universal Service Providers
belong to those categories.
o Profile based, controlled. The residential customers supplied by the Universal
Service Providers belong to those categories.
o Not profile based. With contracted capacity exceeding 55.2 kW or 3x80A.
Each tariff has the following components:
Basic charge. A per connection component for all consumers, equal for all consumers in
the same class. (HUF/connection point/year)

372
Capacity charge. A per KW charge based on the contractual maximum withdrawal power
(enforced via the meter), for consumers with HV, HV/MV transformation, MV
connections, and for not profile based MV/LV transformation and LV consumers
HUF/kW/year).
Energy charge. A per kWh charges equal for all consumers in the same class ‐
(HUF/kWh)
Distribution reactive power charge. For all consumers except consumers with controlled
meters (MV/LV transformation and LV), if the meter installed can measure the reactive
power (this charge represents only a very small part of the DSO’s income). (HUF/kVa rh)
Distribution loss charge. A per kWh charges equal for all consumers in the same class
(HUF/kWh)
Distribution time schedule balancing fee ‐ A per kWh charges equal for all consumers in
Profile based in MV/LV connection and LV connection. (HUF/kWh)
A breakdown of revenue by customer category, including information on available tariff
components and the number of customers in each category is set out in the table below.
Table 223: Tariff components, customers and revenues per customer class
Customer
classes
Tariff components Connection
points
(Based in 2012
data)
Total of
electricity
delivered
(MWh)
Revenue
(€)
HV Basic charge, Capacity
charge, Energy charge,
Reactive power charge
and Loss charge
135 5050000
16778720
HV/MV Basic charge, Capacity
charge, Energy charge,
Reactive power charge
and Loss charge
98 9479000 166787833
MV Basic charge, Capacity
charge, Energy charge,
Reactive power charge
and Loss charge
6111
MV/LV
(Profile based
settlement, all
day)
Basic charge, Distribution
time schedule balancing
fee, Energy charge,
Reactive power charge
and Loss charge 21353
19428000 737305018
MV/LV
(Profile based
settlement,
Basic charge, Distribution
time schedule balancing
fee, Energy charge,
Reactive power charge

373
controlled) and Loss charge
MV/LV (Not
profile based
settlement)
Basic charge, Capacity
charge, Energy charge,
Reactive power charge
and Loss charge
LV (Profile
based
settlement, all
day)
Basic charge, Distribution
time schedule balancing
fee, Energy charge,
Reactive power charge
and Loss charge
7225209
LV (Profile
based
settlement,
controlled)
Basic charge, Distribution
time schedule balancing
fee, Energy charge,
Reactive power charge
and Loss charge
LV (Not profile
based
settlement)
Basic charge, Capacity
charge, Energy charge,
Reactive power charge
and Loss charge
Total ‐ 7259906 33957000 920871572
Average HUF / eur rate 2013: 296.8730 HUF/Eur
The breakdown of energy volumes and distribution revenue by customer category are
set out in the charts below.
Figure 51: Proportion of energy accounted by customer categories
15%3%
25%
13%
44%
Energy Share
HV
HV/MV
MV
MV/LV
LV

374
Revenue share information by voltage level is not available.
There is not official definition of typical consumer or consumer group in Hungary.
The typical network tariff in 2013 for House Hold, small and large industrial customers is
illustrated below:
Table 224: Breakdown of annual charges – typical customer types, 2013 (HUF)
Customer
type
Notional
Energy
usage
Fixed
charges
(Basic
charge)
Fixed
charges
(Capacity
charge)
Energy
charges
Loss
Charges
Time
schedule
balancing
fee
Demand
and
reactive
charges
Total
(includes:
Basic, Energy ,
Loss & Time
charges)
Household
s
3500
kWh
1,446
HUF/year
Not
applicable
30030 HUF
(8,58
HUF/kWh)
10325 HUF
(2,95
HUF/kWh)
1260 HUF
(0,36
HUF/kWh)
3,67
HUF/kVArh
4,061 HUF
Industrial
LV (MV/LV
transforma
tion
voltage)
50MW
h
3516
HUF/year
Not
applicable
294500 HUF
(5,89
HUF/kWh)
96000 HUF
(1,92
HUF/kWh)
8640 HUF
(0.36
HUF/kWh)
3,67
HUF/kVAr
h
402656 HUF
Industrial
VHV
24000
MWh
210912
HUF/year
1464
HUF/kW‐
5520000 HUF
(0.23
4560000
HUF (0,19
Not
applicable
2,19
HUF/kVAr
10290912

375
Year HUF/kWh) HUF/kWh) h
The resulting average tariffs per kWh are illustrated below. These include the Basic fixed
charges, Energy Charges, Loss Charges and Distribution Time schedule balancing fee.
These not includes Capacity charges and reactive charges.
Figure 52: Average network charges (HUF/kWh), 2013
2. Regulation of distribution activities
2.1. General overview
The Act LXXXVI of 2007 provides the main rules of the whole Electricity market, including
the distribution activities. According to article 29, the responsibilities of DSO´s shall
include: “Operating the network covered by the operating licence in a seamless and safe
manner, serving all market operators in a competitively neutral manner, transmitting
electricity to users, operating, maintaining and, if necessary, developing the distribution
network of the given area”.
In addition to the duties referred to in paragraph before, the DSO´s shall ensure the long
term ability of the distribution network to meet reasonable demands for the distribution
of electricity. The DSO´s must be in possession of the network, system and operation
The distribution networks operators are regulated under a licence regime. An
incentive based revenue cap model is form of regulation is applied.

376
control, and tariff metering and information technology equipment necessary for its
activities.
The NRA (Hungarian Energy Office) main responsibilities is consumers protection is
strategic markets: Electricity, Natural GAS, District Heating and Water, “Providing
regulated access to networks and systems, carrying out regulatory competencies in
order to maintain security of supply and fostering competition”.
The distribution sector is regulated under a licence regime. An incentive based revenue
cap model is form of regulation is applied. The regulation is primarily based on the asses
on the cost side, but there is a penalties system to ensure quality standards.
Key features of the regulatory regime are set out in the following table
Table 225: Main features of the regulatory regime
Issue Approach
Type of regime (concession/licence) Licence
Duration of tariff setting regime 4 years
Form of determination (distributor propose/regulator decide)
Regulator decides
Scope for appeal regulatory decision No
2.2. Main incentive properties of the distribution regulatory model
The NRA is responsible for the definition of the allow revenues. All costs are assessed in
details once in every 4 years. After a cost review justified operational costs, regulatory
asset base, cost of capital and costs of losses are indexed with an (inflation‐X) type
method. There are different inflation indices for the different cost elements (e.g. CPI for
the operational costs).
To determine next year’s (T) tariffs, justified revenues are divided with T‐2 year’s
quantities, reducing quantity risk of DSOs.
The following key regulatory incentives apply for the DSOs:
Since allowed revenues of the DSOs are indexed following an inflation‐X based rule for 4
years, the DSOs are incentivised to reduce costs.
In addition, Cost of losses (quantity and price) are supervised yearly. When justified cost
of losses is less than the real value, the regulation reimburses only a part of the
difference to the DSO.
There is also a penalties system in connection with the service quality. Automatic
compensations (price discount) are granted to consumers in case some quality
standards are not met.
At the same time the following tools are provided to mitigate risks:
Energy consumption: To mitigate risk of energy consumption reduction and their impact
in next year’s tariffs, justified revenues are divided with T‐2 year’s quantities. This way
The DSO´s are reducing the risk by decreasing consumption.

377
Cost of losses: when justified cost of losses is less than the real value, the regulation
reimburses a part of the difference to the DSO.
The regulator sets the required (minimum) values for quality of service standards and
the DSOs have to meet these standards. The regulator monitors the DSO’s quality of
service values. There are 4 elements (3 at DSO level, 1 at consumer level) that quality
services interact with the system tariff:
During a cost review: a bonus‐malus system in connection with the service quality
An interim obligatory price discount if the DSO doesn’t fulfil a quality standard,
During price indexation: a bonus‐malus system in connection with the service quality,
Automatic compensations are granted to consumers in case some quality standards are
not met. The cost of those compensation is not included in the allowed returns of the
DSOs
2.3. Determination of cost of service parameters
The approach to determining key cost of service parameters are summarized in the
following table.
Table 226: Approach to key cost of service parameters
Parameter Approach
Form of price control Revenue Cap model
Regulatory asset base The value of the asset base is based on a re‐evaluation process, so the regulatory asset value replaced all DSO’s book asset values. Every year the value of the DSO´s assets are update with the net of investments. The update of the DSO´s assets are indexed by a price index of “investment goods” (Publishes by the central statistical office”.
Capital expenditure n.a.
Approach to operating expenditure The justified costs of the DSOs are calculated with benchmarking the different DSO activities. The average activity cost. The DSO better than the average receives only its own costs, the DSO doing worse receives only the average
Form of WACC applied Real, pre‐tax WACC
Additional revenue items (where applicable)
Not applicable
The following formula is applied in determining the real‐pre‐tax WACC:

378
De
E KDE
D
t
K
ED
EWACC
)1(
Where:
KE = Rf + β MRP is the cost of equity
Rf is the risk free rate (based on historic German state bond data, and USA data)
β is based on international regulatory practice
MRP is the Market Risk Premium (based on historic German and USA data)
KD is the cost of debt based on Hungarian and international data and international
regulatory practice
te is the corporate tax rate (the rate is given by the Hungarian law)
D/E is the ratio of debt to equity, the base year has been set to 60 % in favour of debt
The debt leverage (Ratio E/D) is set at a target ratio considered as efficient by the
regulator based on the sector’s real data, international regulatory practice, and
historical Hungarian regulatory debt leverage values. There is no adjustment ex‐post.
The regulation formula includes the “X‐component” in the revenue cap. To calculate the
“X‐component”, the regulator keeps in account the international experience and past
performance of the company.
3. Tariffs for distribution services
3.1. Distribution tariffs
The regulator is in charge of setting the distribution tariffs (based on allowed revenues).
The following approach is adopted to allocate costs between customer categories with
the following key features:
Distribution justified costs are split into fixed and variable costs (estimation based on the
DSO’s data).
o Fixed costs are assigned to each voltage levels and are covered with a per
connection point base charge (a minor part of fixed costs is covered with the
HUF/kWh public lighting charge).
o Variable costs are allocated to voltage levels (estimation based on the DSO’s
data).
Then, on each voltage levels costs are split and allocated to be covered with per kWh,
per kW (and per kVArh) charges
The cost of losses is similarly allocated to per kWh charges of the different voltage levels.
The details of distribution tariff by voltage class and their components are summarized
in section 1.2 Key figures on revenue and tariffs.
Tariff components can be downloaded from here (in English):
http://www.mekh.hu/en/regulated‐prices/electricity.html. A direct link for the distribution tariffs

379
valid since 1st November 2013 (Excel): http://www.mekh.hu/gcpdocs/51/System%20use%20tariffs%202013%20nov.xlsx
Various other aspects of distribution tariff setting are summarized in the table below.
Table 227: Approach to key issues in setting distribution tariffs
Issue Approach
Treatment of distribution losses Distribution losses is a component of the distribution tariff system
Presence of uniform tariffs Yes, the same tariff for the same voltage level in the country
Presence of non‐linear tariffs No, all tariff components are linear No tariff components differentiated according to time of use.
Presence of regulated retail tariffs
Presence of social tariffs No
According to the decree of the Hungarian Energy and Public Utility Regulatory Authority,
generators connected either to the transmission or the distribution grid have to pay
(principally) TSO/DSO tariffs, but the value of these tariffs for generators is 0 HUF/kWh.
There are not special incentives in network tariffs for large users like power plants.
3.2. Connection charges
Key issues in the setting of connection charges are set out in the table below.
Table 228: Summary of key issues relating to connection charges
Issue Approach
Determination of charges
Type of charges (shallow/deep) Connection charges are shallow (or rather shallow) first of all for small consumers at Low voltage.
Methodology adopted to determine connection costs
Standard charges and rules set by the regulator for smaller consumers (LV, MV). For larger consumers or generators the DSO makes an estimation based on its cost, but the client is free to procure the necessary works from a different source.
Hosting capacity Scope to refuse connection The DSO´s may refuse connection to the distribution network at any specific connection point due to technical reasons. The DSO´s, when refusing connection to the distribution

380
network, expressly specify the conditions under which connection may be authorized, and offer another connection point, if the necessary technical facilities are available or can be provided. The regulator, at the network user's request, conducts an inquiry concerning the refusal of the access. If the access was refused in violation of the statutory provisions referred to the regulator adopts a resolution to compel the DSO affected to allow access to the distribution network. Where network access is provided under the conditions set out in the regulator’s resolution, the network user is liable to pay the access charges specified in the regulator’s resolution.
Requirements to publish hosting capacity
No
Targets and/or incentive schemes to enhance hosting capacity
No, the DSO is assumed to have a duty to connect all the capacity that applies for connection. For exemptions (refusing connecting consumers) see above.
The connection fee is set by the Hungarian Energy and Public Utility Regulatory
Authority. The charges are to be paid in the case of:
New connection to the public network, or
Increasing capacity demand.
Generators have to make an individual agreement on connection charge with the
network licensee (connection charge = max. 100 % of the value of activated assets
installed for connecting the generator to the public network) or to install the assets
necessary for connection on their own (agreement with the network licensee is
necessary).
Consumers have to pay:
Connection standing charge,
Charge for installing connecting wire or cable,
Charge for installing public line.

381
4. Distribution system development and operation
4.1. Distribution system development
The key features of distribution system planning are summarized below.
Table 229: Approach to distribution planning
Issue Approach
Form of distribution planning document
There is not a Distribution network plan submitted to the regulator. DOS´s has to facilities a network development plant to the TSO.
‐ Key responsibilities for its development
Not applicable
‐ Degree of integration with renewables plan
There is no published plan but the licensees own plans are in relation with the renewable generation targets.
‐ Relationship with consumption trends
There is no published plan but the licensees own plans are in relation with other targets.
‐ Relationship with quality of service targets
There is no published plan but the licensees own plans are in relation with the quality of service targets.
‐ How trade‐offs between network development and alternative technologies are treated
Actually there are not smart grid deployment.
‐ Requirements to integrate cost benefit analysis
Not applicable. However cost‐benefit analyses are used to select the network investments.
Each DSO according Act LXXXVI of 2007 on electricity, have to drawing up a network
development plan annually and submitting it to the transmission system operator
according to the procedure laid down in the Operating Code.
Thus, Licensees have their own development strategy for distribution network but there
is no separated development plan submitted to the regulator. The distribution lines with
the rated voltage of 132 kV are the part of National Development Plan (NDP) for
transmission lines which is submitted to the regulator every year. NDP is published for
the public.
4.2. Distribution system operations
The key features of distribution system operations are summarized below.
Table 230: Approach to distribution planning
Issue Approach

382
Requirements for dispatch of renewable plants connected to DSO network
The DSO can only require larger embedded units to disconnect in case the distribution system cannot host their injections
Possibility to dispatch flexible loads Flexible loads are all only controlled by the system operator or self‐dispatched
Other sources of flexibility open to DSO There is no storage function on distribution networks.
4.3. Metering
Key issues regarding metering, and the role of the DSOs, are set out in the following
table.
Table 231: Key approach to metering
Issue Approach adopted
Discos role in metering DSOs have full responsibility for metering and for the installation, calibration and maintenance of metering. They shall provide for the collection and processing of metering data and for forwarding such data to the electricity suppliers.
Monopoly services in the metering Yes
Smart metering functionality Final implementation of Smart meter is still in progress. There is no final decision on deployment of Smart metering system. The smart meters should have basic functions. a) quarter‐of an hour measurement b) remote reading
There are not smart meters massive installed at Hungary.

383
Country Report – Hungary (gas distribution)86
1. Overview of to the distribution sector
1.1. Institutional structure and responsibilities
In Hungary there are 10 regional DSO, five of them being predominant and diving up the territory of the country among themselves. DSO´s are supplying gas to approximately 3,06 million of customers with a gas network of 82018 km.
The five large DSO are completed legally unbundled in 2007. DSO´s with less of 100000 consumers must be accounting unbundled. Summary data on industry structure is set out below.
Table 232: DSO characteristics
Total number DSOs
Ownership unbundled
Legally unbundled
Less than 100000 customers
Exemption* Share of total demand
Country 10 The majority of the DSOs are owned by retailers For the DSOs with more than 10000 consumer it is obligation to use legal unbundling
5 5 n.a. 1,3% of total demand is supplied by small DSO with less than 100.000 consumers
*exemption from distribution network charges for certain types of grid users, such as low‐carbon generation connected to distribution networks.
The responsibility for setting distribution tariffs is spread between the following
jurisdictions
86 Pending final validation from the NRA.
The main stakeholders in the distribution tariffs are the DSOs, the Governance and
the NRA.
Natural gas distribution systems are operated by 10 regional distributors, five of them
being predominant and dividing up the entire territory of the country among
themselves (which have more than 100000 customers each).
The customer classes are classified by the size of the gas meters and not by theirs

384
The DSO
Government (through the Ministry of National Development )
The NRA (Hungarian Energy Office; the main responsibilities are consumer protection,
providing regulated access to networks and systems, carrying out regulatory
competencies in order to maintain security of supply and fostering competition)
The breakdown of responsibilities as it related to tariff setting is summarized in the table
below.
Table 233: Legal basis for tariff structure – Roles and Responsibilities in setting distribution tariffs
Actor Allowed revenues (tariff level)
Tariffs (tariff structure)
Connection charges
DSO Provides data for the calculation
‐ ‐
Government Puts in place the rules for determining the allowed revenue
‐ ‐
NRA X X X X = main responsibility; other options to fill the table: sets rules; monitors ex‐post; defines main principles;
calculates for NRA approval; also involved;
The regulatory process adopted to setting distribution tariffs involves the following
steps:
1. The framework for the setting and regulation of use‐of‐system charges and the general rules for the application of charges shall be laid down by the Minister in a decree adopted on the basis of the proposal of the Office
2. The Office shall consult the authorised operators concerned and representative customer advocacy groups. The Office shall publish its proposal for the decree on its website by 15 May of the year preceding the beginning of the new price regulation cycle, and it shall submit request the minister to promulgate the proposal by way of decree.
3. The minister shall adopt or reject the proposal of the Office within thirty days of the submission thereof.
(a) If the proposal is adopted, the minister shall promulgate by way of decree the framework for the setting and regulation of use‐of‐system charges and the general rules for the application of charges within thirty days after the adoption of the proposal of the Office.
(b) If the proposal is rejected, the minister shall publish his reasoned rejection within fifteen days after adopting the decision on the rejection of the proposal.
4. The use‐of‐system charges set by the Office in a decision shall be treated as maximum
prices. By way of derogation from the maximum price, lower non‐discriminatory prices may be applied, provided that such prices are published in advance.
5. Use‐of‐system charges shall be regulated in four‐year price regulation cycles. Before the beginning of each price regulation cycle, the Office shall review costs, and it shall use the outcome thereof to set use‐of‐system charges.

385
1.2. Key figures on revenue and tariffs Distribution revenues in 2013 were 82.636.740.981 HUF, No further slit by service is
available.
Customer categories are defined by the size of their gas meters and not by their
consumption:
Below 20m3 / h
20‐100 m3 / h
100‐500 m3 / h
Above 500 m3 / h
Information on available tariff components and the number of customers in each
category is set out in the table below.
Table 234: Tariff components, customers and revenues per customer class
Customer classes Tariff components Number of
customers
Energy
delivered
(MWh)
Revenue
€
Below 20m3 / h Fixed: Standing Fee
Variable:
Commodity charge
3037496
20‐100 m3 / h Fixed: Standing Fee
Variable:
Commodity charge
16767
100‐500 m3 / h Fixed: Capacity Fee
Variable:
Commodity charge
3026
Above 500 m3 / h Fixed: Capacity Fee
Variable:
Commodity charge
490
Total 3057779 74847608 278357213
Currency rate Average 2013: 296.8730 HUF/EUR
The breakdown of energy volumes by customer category are set out in the charts below.
The information about revenues by category is not available.

386
Figure 53: Proportion of energy by category
The tariff structure has two components:
Fix component covering costs which do not depend on the volume flown(Standing fee or
Capacity fee)
Variable component covering costs which are strongly related to the flown amount
(Commodity charge)
The typical network tariff for segments of consumers (Residential, Small industries,
Large Industrial) is not available.
2. Regulation of distribution activities
2.1. General overview
The GAS supply GAS Supply Act XL of 2008 provides the rules of the whole gas market,
including the distribution activities. The role of the DSO is to operate, develop, and
maintain the distribution lines of natural gas to ensure high level of systems secure,
reliability and quality. DSO must facilities data to services providers and to the
regulators and government agencies.
DSO requires licenses to operate and shall:
Majority ownership of the operated distribution line.
Measurement and data transmission tools
The distribution sector is regulated under a licence regime. A “cost‐reimbursement” form
of regulation is applied.

387
Data communication and information technology system to support of data with system and
transmission operators
Cooperate with the connected system operators, premises based service providers and
system users in order to ensure the development and operation of the interoperable natural
gas system
The NRA (Hungarian Energy Office) main responsibilities is consumers protection is
strategic markets: Electricity, Natural GAS, District Heating and Water, “Providing
regulated access to networks and systems, carrying out regulatory competencies in
order to maintain security of supply and fostering competition”.
The distribution sector is regulated under a licence regime. A “cost‐reimbursement”
form of regulation is applied.
Key features of the regulatory regime are set out in the following table
Table 235: Main features of the regulatory regime
Issue Approach
Type of regime (concession/licence) The regime which Hungarian natural gas market is based is by licence
Duration of tariff setting regime Use of system charges shall be regulated in four year price regulation cycles
Form of determination (distributor propose/regulator decide)
The framework for the setting and regulation of use of system charges and the general rules for the application of charges shall be laid down by the minister in a decree adopted on the basis of the proposal of the Office
Scope for appeal regulatory decision No such legislation is in place.
2.2. Main incentive properties of the distribution regulatory model
The implanted Hungarian model does not have any incentives.
At the same time the following tools are provided to mitigate risks:
Annual revenue reconciliation
Adjustment of the volume every year using the day degree corrected with the actual
consumption of the previous year this way the system compensates for the change in
volumes
Yearly correction if the inflation exceeds a certain threshold
Extraordinary tariff review to compensate for big unexpected changes in the market
environment
Ex‐ante approval of capex by the NRA
Quality of service factor
2.3. Determination of cost of service parameters

388
The approach to determining key cost of service parameters are summarized in the
following table.
Table 236: Approach to key cost of service parameters
Parameter Approach
Form of price control Revenue CAP regulation
Regulatory asset base Based on the revaluation of the book value of the DSOs assets. This asset base is indexed after the revaluation.
Capital expenditure CAPEX are separately approved by NRA
Approach to operating expenditure OPEX is revised at the start of each regulatory period when the NRA undertakes a cost and asset review to determine the cost level for the period
Form of WACC applied Nominal Pre‐tax
Additional revenue items (where applicable) There are no additional revenue items
WACC is recalculated at the beginning of every regulatory period after updating its
parameters. The following formula is applied in determining the WACC:
DE
taxpre RDE
D
T
R
DE
EWACC
)1(
Where:
E: equity
D: Debt
T: corporation tax
RE: Cost of equity before taxation, calculated according to the formula:
)( FMFE RRRR ,
Where:
RF: Real risk free rate
β: Equity beta
(RM – RF): is the overall equity risk premium
RD: cost of debt, calculated according to the formula:
FD RR
Α: debt premium
No further information is available. Criteria for the calculation of parameters are not
published.

389
3. Tariffs for distribution services
3.1. Distribution tariffs
The costs are allocated to tariffs in the following way:
First the cost base is determined for each DSO with the help of the cost and asset review
Next, the costs are split up between consumption categories
Following this, the cost in each category are split up into fix and variable part
If there are corrections necessary it is done in this phase
And finally the fix cost are divided by the corresponding quantities and variable costs
are divided by the day degree corrected volumes
Various other aspects of distribution tariff setting are summarized in the table below.
Table 237: Approach to key issues in setting distribution tariffs
Issue Approach
Treatment of distribution losses There is not charged in the tariff as a consequence of distribution losses
Presence of uniform tariffs There is not a uniform tariff. There is a regional tariff for each DSO. Also there is a reduced capacity fee for consumers who have consumption in the summer period but do not consume in winter.
Presence of non‐linear tariffs All tariff components are linear
Presence of regulated retail tariffs In general, the tariffs are regulated between system operator and system user, but not end consumer. There is an exception for the above because in case of consumers consuming under universal supply the regulated price incorporates the distribution charges so in this case there is an indirect regulation for the retail prices
Presence of social tariffs There is not social tariff
There are no additional components included in the distribution tariff except
distribution costs. The distribution losses are not charged in the tariff. The tariffs are
published in the tariff decree.
The NRA is in charge of setting the distribution tariffs through a methodology. The tariff is
composed by a fix and a variable part, being all the cost associated to the distribution
costs.

390
3.2. Connection charges Key issues in the setting of connection charges are set out in the table below.
Table 238: Summary of key issues relating to connection charges
Issue Approach
Determination of charges
Type of charges (shallow/deep) Shallow(er) charges for small and medium‐sized consumers, too. Above the DSO level the cost are spread between the consumers. The reinforcements are covered mainly through the system usage tariffs; however in some cases the charges for big consumers contain the development of the TSO system.
Methodology adopted The NRA set the methodology by publishing the decree. Therefore the DSOs apply the methodology and calculate accordingly the separate connection costs/charges. If the consumer has any problem with the calculated connection charge, the proposal could be revised by the NRA. If fixed charges would be set the DSO only applies the prices.
Hosting capacity Scope to refuse connection There is a specific option for the DSO to refuse the connection in that case if the connection cost per consumption factor is really high (for instance: small future consumption goes with expensive investment cost).
Requirements to publish hosting capacity
No requirement on the DSO to publish hosting capacity information. But the DSO is required to notify to the regulator the technical capacity of his network in order to the NRA gets familiar with these data
Targets and/or incentive schemes to enhance hosting capacity
The current regulation dose not applies any incentives
4. Distribution system development and operation
4.1. Distribution system development
In the current regulation the DSOs do not have to provide a network development plan.
Investment projects are assessed individually as they come up.

391
The key features of distribution system planning are summarized below.
Table 239: Approach to distribution planning
Issue Approach
Form of distribution planning document N/A
‐ Key responsibilities for its development N/A
‐ Degree of integration with renewables plan
N/A
‐ Relationship with consumption trends N/A
‐ Relationship with quality of service targets
N/A
‐ How trade‐offs between network development and alternative technologies are treated
N/A
‐ Requirements to integrate cost benefit analysis
N/A
4.2. Distribution system operations
The key features of distribution system operations are summarized below.
Table 240: Approach to distribution planning
Issue Approach
Requirements for dispatch of renewable plants connected to DSO network
They have to comply with the overall quality standard and with the DSOs technical criteria.
Possibility to dispatch flexible loads No
Other sources of flexibility open to DSO No
4.3. Metering
Key issues regarding metering, and the role of the DSOs, are set out in the following
table.
Table 241: Key approach to metering
Issue Approach adopted
DSO role in metering The DSO owns the gas meters and it has the obligation for reading the gas meters. The DSO is also obliged to provide the traders with their respective metering data.
Monopoly services in the metering The DSOs are monopolists in metering activities
Smart metering functionality There are several ongoing pilot projects. There is not information about his functionality
There are ongoing pilot projects but no data is currently available about smart metering.

392
Country Report – Ireland (electricity distribution)
1. Overview of to the distribution sector
1.1. Institutional structure and responsibilities
In Ireland there is only 1 distributor supplying electricity to roughly more than 2 million
customers with an overall circuit length of 167528 km87 . Summary data on industry
structure is set out below.
Table 242: DSO characteristics
Total number DSOs
Ownership unbundled
Legally unbundled
Less than 100000 customers
Exemption* Share of total demand
Country 1 0 188 0 No % *exemption from distribution network charges for certain types of grid users, such as low‐carbon generation connected to distribution networks.
The responsibility for setting distribution tariffs is spread between the following
jurisdictions (for example):
The DSO
The NRA (Commission for Energy Regulation ‐ CER)
Government (Department of Communications, Energy and Natural Resources)
The breakdown of responsibilities as it related to tariff setting is summarized in the table
below.
87 Eurelectric, Power Distribution in Europe – Facts & Figures, 2013. 88 The DSO is owned by the former vertically integrated state owned electricity company. However, it has legal and functional independence from its parent. The parent company still owns supply and generation facilities.
The distribution sector in Ireland is concentrated in a single state owned statutory
monopoly that has a permanent licence to operate as DSO. An incentive based
model is used for distribution regulation.

393
Table 243: Legal basis for tariff structure – Roles and Responsibilities in setting distribution tariffs
Actor Allowed revenues (tariff level)
Tariffs (tariff structure)
Connection charges
Regulated services
DSO Also involved Calculates for NRA approval
Calculates for NRA approval
N/A
Government Defines main principles
N/A
NRA X X X N/A X = main responsibility; other options to fill the table: sets rules; monitors ex‐post; defines main principles;
calculates for NRA approval; also involved;
The regulatory process adopted to setting distribution tariffs involves the following
steps:
The CER issues a public consultation on tariff
The CER approves the tariff methodology
The DSO calculates the tariff based on the allowed revenue
The CER approves the tariff based on the approved revenues.
1.2. Key figures on revenue and tariffs
Distribution revenues in Ireland in 2013 were €729 million. No further split by service
type or number of customers is available.
2. Regulation of distribution activities
2.1. General overview
The role of the DSO in Ireland is to builds, operates and maintains a nationwide
electricity distribution system, connect customers and provide metering services. ESB
Networks Ltd, as the only DSO is a state owned statutory monopoly that has a
permanent licence to operate as DSO. ESB Networks Ltd is a separate company within
ESB.
CER’s primary economic responsibilities in energy are to regulate the Irish electricity and
natural gas sectors. The overall aim of the CER’s economic role is to protect the interests
of energy customers, maintain security of supply, and to promote competition in the
generation and supply of electricity/natural gas. It also has functions in customer
protection by resolving complaints that customers have with energy companies. Other
CER’s competencies are safety regulation of electrical contractors, gas and LPG installers
and gas pipelines and safety regulation of upstream petroleum safety extraction and
exploration activities.

394
An “incentive‐based” form of regulation is applied.
Distribution tariffs are not itemised in final retail tariffs for either gas or electricity.
Customers see a Standing Charge and a Unit Price (plus applicable environmental levies‐
electricity) and VAT.
Key features of the regulatory regime are set out in the following table
Table 244: Main features of the regulatory regime
Issue Approach
Type of regime (concession/licence) Licence.
Duration of tariff setting regime Allowed revenues are assessed for five year revenue control periods. Within each five year period allowed revenues are assessed annually and the corresponding tariff component is updated accordingly.
Form of determination (distributor propose/regulator decide)
Distributor proposes, regulator approves
Scope for appeal regulatory decision Not available
2.2. Main incentive properties of the distribution regulatory model
The following key regulatory incentives apply for the DSOs:
As the revenue is set for a five year period the DSO is also incentivised to reduce costs.
Expenditures are reviewed for efficiency and the DSO is at risk to have costs disallowed
that the NRA decides were not efficiently expended. There is a cap on the incentive (and
penalty) that the DSO can achieve. Where the DSO underspends compared to the
allowed Opex or Capex and that amount is not due to efficiency gains, the DSO is
required to pay back that amount (or have it offset against revenue allowed in the
following year).
Performance targets are set by the CER for the DSO. These targets are set for quality of
supply, electrical losses and customer service.
Incentives for connecting renewable generation.
Adjustment factor where inflation in any year does not match the inflation forecast in
the 5 year projection
At the same time the following tools are provided to mitigate risks:
Opex is fixed for a five year period. If the DSO spends more than it is allowed, it bears
the cost. On the other hand if the DSO spends below what it is allowed it can keep the
surplus made any one year for a period of five years as a means of incentivising
efficiency.
Revenue and expenditure are reviewed annually and compared to forecast. Deviations
from forecast may be corrected by an annual adjustment factor for reduced revenue or
higher than expected costs.

395
An allowance is made in the forecast revenues for expected increases in numbers of
customers each year and there is an annual adjustment factor to allow for a larger or
smaller number of new customers in that year.
The regulator will consider any major event that impacts the DSOs profitability during
the annual revenue review.
Key components of quality of service regulation are:
Incentive mechanisms on quality of service: the incentives relate to continuity of supply,
improving service to ‘worst served customers’, improving customer satisfaction,
incentives to reduce electrical losses, incentives for meter reading. Allowed revenues
are increased (decreased) if the DSO performs better (worse) than the predefined
targets for each of the quality of service criteria.
2.3. Determination of cost of service parameters
The approach to determining key cost of service parameters are summarized in the
following table.
Table 245: Approach to key cost of service parameters
Parameter Approach
Form of price control Revenue cap
Regulatory asset base The CER uses a replacement cost approach, it uses acquisition cost, indexed with inflation, as a proxy for the replacement cost
Capital expenditure Capital Asset Pricing Model (CAPM) and the Weighted Average Cost of Capital (WACC). Primarily as part of the five yearly price control process and also the annual revenue review, the CER review the capital expenditure and investments made by the DSO. CER does not approve specific projects but approves an overall capital expenditure amount following submission of the DSO’s planned capital programme for the forthcoming five year period. The DSO makes a submission to the regulator as part of the 5 year price control. This submission is reviewed by the regulators technical consultants to check if the proposed expenditure is necessary and efficient.. The review uses a review of the DSO’s historic expenditures from the previous price control period to assist in assessing the need and efficiency of the DSO’s proposed capital expenditure and includes efficiency requirements.
Approach to operating expenditure Review of the DSO’s historical operational

396
expenditure to assess whether the DSO‟s expenditure has been incurred efficiently while delivering the expected benefits for customers in line with the package agreed as part of the previous price control determination.
Form of capital remuneration applied” (WACC real, nominal, ten years Treasury bond + adder, …)
Real, pre‐tax cost of capital
Additional revenue items (where applicable)
N/A
As part of the price control, CER’s consultants review the efficiency of capital
expenditure from the previous price control period. However, no express “utility”
review of individual investments is undertaken. CER is entitled to request such a review
and could exclude the investment from the regulated asset base. Although some
operating expenses have been disallowed in the past for not being efficient, no capital
investments have been disallowed, that I am aware of.
Benchmarking is used in the setting of the five year price control period. Benchmarking
is conducted against best international companies in this field. A sample of areas of the
DSO’s functions is selected each year for comparison where appropriate examples from
DSOs in other jurisdictions can be identified and costs identified.
The following formula is applied in determining the WACC:
Where:
rE is the cost of equity
rD is the cost of debt
E and D are the total values of equity and debt respectively used to determine the level
of gearing in the company, so giving the relative weights between the cost of equity and
debt finance.
Allowed revenue is based on certain assumptions including
‐ GWh
‐ No of consumers connected
‐ Quality of service
Assumptions are updated annually.

397
The CER has used a notional gearing level and a forward looking cost of debt as used in
the WACC calculation. The level of net debt is set based on a historic cost RAB i.e. this
assumes that the DSO has only conventional debt and only efficiently incurred
expenditure has been added to the RAB
The X factor is used to smooth out the allowed revenue over the period so consumers
are not faced with volatile tariffs and also to ensure that the DSO has sufficient cash to
meet its requirements over the p rice control period.
3. Tariffs for distribution services
3.1. Distribution tariffs: additional issues
The DSO calculates the tariff and the CER approves it. Tariffs comprise five elements:
Fixed Charge per month
Energy Charge per kWh consumed
Capacity Charge per kVA of MIC
Maximum Import Capacity Penalty
Power Factor Penalty KVArh
Capital and operating costs are allocated across different system levels and then divided
by the number of customers in each level.
There are ten distribution tariff groups. The categories of distribution groups are listed
in the document “rules for application of duos tariff group” which can be found at this
link: http://www.esb.ie/esbnetworks/en/commercial‐downloads/Rules‐for‐Application‐of‐DUOoS‐Tariff‐
Groups.pdf
All consumers are charged a distribution tariff including two components
A per KWH charge
An annual standing charge.
There is an element of time differentiation. There is a day/night tariff.
The current distribution charges can be found at this link (pages 18‐22): http://www.esb.ie/esbnetworks/en/commercial‐downloads/ESB‐Networks‐Statement‐of‐
Charges.pdf?v=2014
Capital and operating costs are allocated across different system levels and then divided by the
number of customers in each level. All consumers are charged a distribution tariff including a per
KWH charge and an annual standing charge. A combination of standards costs and client specific
connection fees are used. The DSO cannot refuse reasonable requests of connections, it can only
enforce a waiting list in the case of generators.

398
Various other aspects of distribution tariff setting are summarized in the table below.
Table 246: Approach to key issues in setting distribution tariffs
Issue Approach
Treatment of distribution losses Distribution Losses are charged for separately. Distribution Loss Adjustment Factors (DLAFs) are applied to the metered consumption of relevant customers to apportion distribution losses to energy consumption or production metered at end user sites.
Presence of uniform tariffs For domestic customers there is a separate urban and rural tariff category. Urban domestic connections are defined as domestic connections that are fed from three‐phase overhead or underground LV network. Rural domestic connections are defined as domestic connections that are fed from single phase overhead network.
Presence of non‐linear tariffs All tariff components are linear
Presence of regulated retail tariffs No
Presence of social tariffs No
Embedded generators pay “Generator Distribution O&M Charges” to cover ongoing
O&M on the connection asset and facilities added for reinforcement. Renewable
generation support is funded via an additional tariff component of the retail tariff.
A decision was made to rebalance distribution tariffs in favour of large energy users.
The savings for large energy users were to be funded by a rebalancing of domestic
network tariffs. The amount of savings for large energy users was to be €50million per
year.
3.2. Connection and capacity issues
Consumers and small customers generally pay a once off fee – larger connection feeds
can be paid installations – this is agreed with the DSO.
Key issues in the setting of connection charges are set out in the table below.

399
Table 247: Summary of key issues relating to connection charges
Issue Approach
Determination of charges
Type of charges (shallow/deep) Charges are shallow for small connections. Larger connections are required to pay a contribution towards network reinforcements.
Methodology adopted A combination of standards costs and client specific connection fees are used. Contestability is available for distribution connections.
Hosting capacity Scope to refuse connection For consumers the DSO cannot refuse reasonable requests of connections. For generators the DSO cannot refuse connection but it can enforce a waiting list
Requirements to publish hosting capacity
None
Targets and/or incentive schemes to enhance hosting capacity
None. However, the DSO provides its proposed capital expenditure programme and the network connection scenarios on which its proposed capital expenditure is based. CER and its advisors assess the appropriateness of the DSO’s connection scenarios and forecasts.
4. Distribution system development and operation
4.1. Distribution system development
The key features of distribution system planning are summarized below.
Table 248: Approach to distribution planning
Issue Approach
Form of distribution planning document
‐ Key responsibilities for its development Network development plans are normally notified to the regulator but they are not published
‐ Degree of integration with renewables plan
Renewable generation targets are set by the Government only at national level. These targets are taken as an input in the distribution development plan. The development plans pursue the objective of
System development is decided by the DSO and the development plan is notified to the
NRA. Renewable generation targets, consumption trends and quality of trends targets
are taken as inputs in the distribution development plan. The DSO can require larger
generators to disconnect in cases of system security. The mass rollout of smart meters is
not expect to commence until 2018

400
creating hosting capacity consistent with the national plan.
‐ Relationship with consumption trends The DSO takes a range of factors into account when proposing its distribution network plan. They will include items such as the national spatial development plans, national economic forecasts etc.
‐ Relationship with quality of service targets
There is no express link between the distribution network plan and the quality of service targets. However, the DSO will take quality of service targets into account when developing the distribution plan because of the incentives/penalties attached to the quality of service targets
‐ How trade‐offs between network development and alternative technologies are treated
Not treated
‐ Requirements to integrate cost benefit analysis
The DSO conducts internal cost‐benefit analyses of network development investments proposed by its staff when deciding which ones to include in its capital expenditure proposals to CER. However, CER does not normally review those CBAs.
The DSO publishes a strategy document which describes its approach to network
development. The document can be find at:
http://europe.nxtbook.com/nxteu/zahra/esb_networks2027/#/0
4.2. Distribution system operations
The key features of distribution system operations are summarized below.
Table 249: Approach to distribution planning
Issue Approach
Requirements for dispatch of renewable plants connected to DSO network
The DSO cannot dispatch any generators. Only the TSO can dispatch some distributed connected generators. The DSO can require larger generators to disconnect in cases of system security.
Possibility to dispatch flexible loads Only the TSO can dispatch flexible loads.
Other sources of flexibility open to DSO None
4.3. Metering
Key issues regarding metering, and the role of the DSOs, are set out in the following
table.
Table 250: Key approach to metering
Issue Approach adopted
DSOs role in metering DSOs have responsibility for metering and own the meter
Monopoly services in the metering DSOs are monopolists in metering activities

401
Smart metering functionality Half hourly measurement/ Daily Polling
Remote reading
Remote reconnection/disconnection of customers
The Smart Metering Programme is entering Phase 3 “Detailed Design”. The mass rollout
of smart meters is not expect to commence until 2018. The plan is to roll out 2,2million
smart meters to residential electricity customers and 200000 to Small and Middle
Enterprises (SME).

402
Country Report – Ireland (Gas distribution)
1. Overview of to the distribution sector
1.1. Institutional structure and responsibilities
In Ireland there is 1 distribution system operator supplying gas to 657000 customers
with a gas network of 11160 km lower pressure distribution pipelines.
Prior to Ireland’s implementation of Directive 2009/73/EC (concerning common rules for
the internal market in natural gas), Gaslink (i.e. Ireland’s gas TSO & DSO) operated as the
Independent System Operator (ISO) under the Second Energy Package and forms part of
the semi‐state company Bord Gáis Éireann (BGÉ).
Gaslink is responsible for the operation and planning of Ireland’s gas transmission and
distribution system, which is owned by Bord Gáis Éíreann (i.e. Ireland’s gas Transmission
& Distribution Asset Owner). In order to facilitate Gaslink in carrying out its role, an
Operating Agreement was signed between BGÉ and Gaslink, and approved by the
National Regulatory Authority, Commission for Energy Regulation (CER).
Under the Operating Agreement, BGÉ through its division Bord Gáis Networks (BGN)
carries out works at the direction of Gaslink in respect of the development, maintenance
and operation of BGÉ’s network. With reference to Directive 2009/73/EC, the CER
received an ITO application from BGE in 2012. Following a review of the ITO application,
the CER issued its preliminary decision (in March 2013) with respect to BGÉ ITO
certification application. In May 2013, the CER received the European Commission
Opinion with respect to the certification of BGÉ as an ITO. Taking utmost account of the
EU Commission’s opinion, the CER decided (in July 2013) to grant BGÉ preliminary
certification as an ITO, subject to the completion of all outstanding ITO items identified
in the CER’s preliminary certification decision. The rationale for the delay in full ITO
certification was due to the impending sale of BGÉs energy business (Bord Gáis Energy),
which would result in BGÉ becoming Fully Ownership Unbundled (FOU). Specifically, the
CER was of the view that the imposition of a full ITO model, with costs such as for
The distribution sector in Ireland is concentrated in a single semi‐state company
which operates the distribution of natural gas. The regulation regime in place
involves several components of “incentive based regulation”.

403
rebranding, would impose unnecessary transaction costs on BGÉ in the likely event that
BGÉ became FOU by 2014.
In December 2013, the Irish Government confirmed that a preferred bidder (i.e. a
consortium involving Centrica plc, Brookfield Renewable Energy and Icon Infrastructure)
was selected for the purchase of Bord Gáis Energy. This sale was completed on the 30th
of June 2014.
The outcome from the sale will result in BGÉ becoming a networks only company (with
Gaslink being re‐integrated back into BGÉ), which will result in BGÉ becoming certified as
Full Ownership Unbundled (FOU) under Directive 2009/73/EC At present, BGÉ is
working towards FOU certification, and it is envisaged that an application will be
submitted to the CER in the coming months.
Summary data on industry structure is set out below.
Table 251: DSO characteristics
Total number DSOs
Ownership unbundled
Legally unbundled
Less than 100,000 customers
Exemption* Share of total demand(DSOs <100000 customers)
Country 1 0 1 0 NA 0% *exemption from distribution network charges for certain types of grid users, such as low‐carbon generation connected to distribution networks.
The regulator carries out a review of the distribution allowed revenue every 5 years. The
review which is in force at the moment is “Price Control 3” (PC3), which covers the
period from October 2012 to September 2017.
The responsibility for setting distribution tariffs is spread between the following
jurisdictions:
The DSO
The NRA (Commission for Energy Regulation ‐ CER)
Government (Department of Communications, Energy and Natural Resources)
The breakdown of responsibilities as it related to tariff setting is summarized in the table
below.
Table 252: Legal basis for tariff structure – Roles and Responsibilities in setting distribution tariffs
Actor Allowed revenues (tariff level)
Tariffs (tariff structure)
Connection charges
Regulated services
DSO Calculates for NRA approval
Calculates for NRA approval
Calculates for NRA approval
NA

404
Government Grants powers via primary law.
Usually not involved89
NA
NRA Sets rules, approves90
X X NA
X = main responsibility; other options to fill the table: sets rules; monitors ex‐post; defines main principles;
calculates for NRA approval; also involved;
The regulatory process adopted to setting distribution tariffs (Price Control Process)
involves the following steps:
DSO sends a submission to the CER on its business plan and revenue requirements; this
includes demand forecasts.
The CER analyses this submission
The CER issue a consultation
The CER decides on an annual allowed revenue for the five years ahead, with the aim of
providing incentives for DSO to seek out efficiencies.
1.2. Key figures on revenue and tariffs
Distribution revenues in gas year 2013/2014 were € 185.2 million, broken down by the
following activities:
Distribution 70%
Metering 20%
Other 10%
A breakdown of revenue by customer category, including information on available tariff
components and the number of customers in each category is set out in the table below.
Table 253: Tariff components, customers and revenues per customer class
Customer classes Tariff components Number of customers
Revenue
Daily Metered €cent/pk day kWh, c/kWh
220 NA
Non Daily Metered €cent/pk day kWh, c/kWh
NA NA
Total ‐ Ca. 657000 NA
The breakdown of energy volumes and distribution revenue by customer category are
set out in the charts below.
89 The Department has no role in tariff setting unless a Ministerial policy is issued to the regulator. 90 Sets out allowed revenues via the Price Controls.

405
Figure 54: Proportion of energy accounted by customer categories
Customer categories are defined by Supply Point Annual Quantity for each connected
site in MWh:
≤ 73 MWh
> 73 MWh ≤ 14653 MWh
> 14653 MWH ≤ 57500 MWh
> 57500 MWh
Using tariff information from Gaslink’s website and applying this to notional customer
types, illustrative tariffs are shown below in Table 4. However, it should be noted that
these notional customer categories are not necessarily representative of typical Irish gas
customers.
Table 254: Breakdown of annual charges – typical customer types, 2013 (€)
Customer type
Notional Energy usage
Customer Maximum Daily
Quantity
Capacity Charge
Commodity Charge
Total
Customer 1 50 MWh 0,37 MWh 572,82 178,9 751,72
Customer 2 10000 MWh 54,79 MWh 66349,88 17450,2 83800,08
Customer 3 40000 MWh 182,56 MWh 158042,81 41755,04 199797,85
Customer 4 80000MWh 313,11 MWh 132206,94 52080 184286,94
The resulting average tariffs per kWh are illustrated below.

406
Figure 55: Average network charges (€cent/kWh), gas year 2013/2014
An example of network tariffs applied in 2013, by BGN DSO is included as Annex 1.
As reported by CER, the average annual distribution network cost for an average
household is approximately €23091.
2. Regulation of distribution activities
2.1. General overview
The role of the DSO in Ireland is to operate, develop and maintain a system for the
transmission and distribution of natural gas being a system that is both economical and
efficient, ensure the safety and security of the transmission, distribution and supply of
natural gas.
CER’s primary economic responsibilities in energy are to regulate the Irish electricity and
natural gas sectors. The overall aim of the CER’s economic role is to protect the interests
of energy customers, maintain security of supply, and to promote competition in the
generation and supply of electricity/natural gas. It also has functions in customer
protection by resolving complaints that customers have with energy companies. Other
CER’s competencies are safety regulation of electrical contractors, gas and LPG installers
and gas pipelines and safety regulation of upstream petroleum safety extraction and
exploration activities. More recently, the CER was also appointed as economic regulator
for water services in Ireland.
91 Based on an average usage of 13,800 KWh.

407
The distribution sector is regulated under a licence regime. A mix of “cost‐
reimbursement” and “incentive‐based” form of regulation is applied.
Distribution tariffs are not normally itemised in final retail tariffs for either gas or
electricity. Customers see a Standing Charge and a Unit Price (plus applicable
environmental levies) and VAT.
Key features of the regulatory regime are set out in the following table.
Table 255: Main features of the regulatory regime
Issue Approach
Type of regime (concession/licence) Licence92
Duration of tariff setting regime 5 years (from October 2012 to September 2017)
Form of determination distributor propose/regulator decide
Scope for appeal regulatory decision Not available
2.2. Main incentive properties of the distribution regulatory model
The following key regulatory incentives apply for the DSOs: ‐
Revenue Cap regime
An efficiency factor of 1% is applied for certain items as part of the Price Control
decisions.
The DSO may keep 50% of underspend pass through costs in certain circumstances.
At the same time the following tools are provided to mitigate risks:
Tariffs are revised annually and are to recover the Allowed Revenues as set out for that
particular year of the Price Control. There is discretion to re‐profile revenues within the
Price Control period. Revenues were re‐profiled as part of the 2013/14 Transmission
tariffs.
The WACC that is applied is subject to a floor and ceiling of 5,2% and 8,2%. This is
triggered automatically when market rates change significantly. This ensures the
benefits are passed onto consumers annually or conversely that financial risk of the DSO
is not carried forward if market conditions deteriorate.
Ex ante approval of all investments is required. This includes both those set out in the
Distribution Price Control and in certain instances where a new town is connected under
the Connections policy the capex is added to the Regulated Asset Base ex ante as well.
Key components of quality of service regulation:
Quality of service regulation has no impacts on tariffs;
The DSO performance is monitored as part of the licence conditions;
92 While any party may seek a licence to own or operate a distribution network, at present Gaslink is the only participant in that market.

408
Each year Gaslink publishes a Performance Report detailing KPIs for the year;
The regulator has powers via an energy customer section to impose charter payments to
gas customers where appropriate (when the DSO is found to be in breach of its
customer charter code of practice);
If necessary a direction from the CER would be given to the DSO where the quality
standards are not reached.
2.3. Determination of cost of service parameters
The regulator along with external consultants assess the DSO submission. There is use
of benchmarking vis‐à‐vis other systems, in particular GB distribution companies. The
DSO is benchmarked as part of the Price Control review.
The approach to determining key cost of service parameters are summarized in the
following table.
Table 256: Approach to key cost of service parameters
Parameter Approach
Form of price control Mixture of fixed cost reimbursement controlled via Price Controls and pass through costs adjusted on an annual basis. Certain pass through costs have an incentive mechanism where controllable.
Regulatory asset base Replacement value updated to consider inflation ( from Central Statistics Office)
Capital expenditure Overview of the DSO historic and forecasted CAPEX.
Approach to operating expenditure
Overview of the DSO historic and forecasted OPEX
Form of capital remuneration applied”
Not available
Additional revenue items (where applicable)
Not available
The formula applied in determining the WACC is not available. To determine the WACC,
the regulator adopts the Capital Asset Price Model (CAPM).
3. Tariffs for distribution services
Revenues are recovered via an 80:20 Capacity: Commodity split. Capacity charges are
based on expected peak day withdrawal. Commodity based flows charges are based
on actuals.
The DSO values the Net Present Value (NPV) of a new connection in order to connect
new towns.

409
3.1. Distribution tariffs: additional issues
The CER is in charge of setting the distribution tariff (based on allowed revenues).
Revenues are recovered via an 80:20 Capacity: Commodity split. This applies to the
entire Distribution network which is maintained at 16 bar, and 4 bar for service
pipelines. Capacity charges are based on expected peak day withdrawal. Commodity
based flows charges are based on actuals.
There are 4 categories of customers‐with difference volume ranges.
Various other aspects of distribution tariff setting are summarized in the table below.
Table 257: Approach to key issues in setting distribution tariffs
Issue Approach
Treatment of distribution losses Shrinkage costs are socialised across all network users. Shippers are responsible for balancing their portfolio and the DSO also procures gas for balancing purposes.
Presence of uniform tariffs Tariffs are postalised Presence of non‐linear tariffs The natural log element of the tariffing regime is non‐
linear. In other words tariffs increase as customers get smaller and because of the natural log effect (ln) this increase is not linear(i.e. directly proportional) with the change in size.
Presence of regulated retail tariffs The last remaining regulated domestic tariff was abolished from 1t July 2014 as the criteria for deregulation had been met.
Presence of social tariffs No
3.2. Connection charges
Connection charges are based on Industrial & Commercial connections (Large, Medium
and Small) and Domestic (One off, new housing, non‐gas estates, local authority
housing). Also included are mixed developments.
Key issues in the setting of connection charges are set out in the table below.

410
Table 258: Summary of key issues relating to connection charges
Issue Approach
Determination of charges
Type of charges (shallow/deep)
Both
Methodology adopted Standard costs and costs specific to projects as well as based on a cost per metre of pipeline.
Hosting capacity Scope to refuse connection Net Present Value (NPV) of a new connection must be positive to connect new towns. If a party wishes to connect it must pay upfront connection charges which are partially determined by the length from the gas mains. This discourages requests beyond reasonable distances. The DSO always attempts to meet reasonable requests for connections. What generally arises is that a so called “New Town” is connected where the NPV is positive. An anchor load (large factory etc.) is required in general.
Requirements to publish hosting capacity
The DSO is required to notify to the CER the technical capacity of the network for Price Control mechanism purposes. Unlike transmission there is no annual report setting out the technical distribution network capacity.
Targets and/or incentive schemes to enhance hosting capacity
4. Distribution system development and operation
4.1. Distribution system development
The key features of distribution system planning are summarized below.
System development is decided by the DSO and supervised by the NRA through the
examination of the development plan for transmission and distribution grids. The NRA
is working on facilitating the use of Compressed Natural Gas (CNG) and biogas injection
at the distribution level.

411
Table 259: Approach to distribution planning
Issue Approach
Form of distribution planning document
‐ Key responsibilities for its development
There is no development plan published for the distribution network. Any CAPEX for the network is laid out in the Price Control and the DSO updates the regulator on progress. This would then be an input into the setting of the annual distribution tariffs. A Network Development Plan (NDP) is only required for the Transmission system and data from this applies to the distribution system too. Gaslink, as TSO is obliged to publish the NDP and the CER is responsible for examining the ten‐year network development plan and facilitating a public consultation on its contents.
‐ Degree of integration with environmental policies
There is an innovation fund focusing on Compressed Natural Gas (CNG) which is progressing. In addition the regulator is working towards facilitating biogas injection at the distribution level. These issues are outlined in the NDP.
‐ Relationship with quality of service targets
A Separate Performance Report is published that outlines service targets and performance.
‐ How trade‐offs between network development and alternative technologies are treated
Not treated
‐ Requirements to integrate cost benefit analysis
The NDP outlines the projects that will be realized (as per the Price Control) and those that may be required over the reporting period.
4.2. Metering
Key issues regarding metering, and the role of the DSOs, are set out in the following
table.
Table 260: Key approach to metering
Issue Approach adopted
DSOs role in metering DSOs have full responsibility for metering, and these meters are on the Regulated Asset Base.
Monopoly services in the metering DSOs are monopolists in metering activities
Smart metering functionality Not yet decided, currently CER is heading up the Smart Metering Program which is ongoing93.
A dynamic load profiling model is used to define ex ante the consumption level of each
Non Daily Metered (NDM) point.
93 The CER, working with the Department of Communications, Energy and Natural Resources (DCENR), established Phase 1 of the National Smart Metering Programme (NSMP) in late 2007. Phase 1 included a plan to conduct a nationally representative smart metering trial in order to assess the costs and benefits of smart meters and to inform decisions relating to the full rollout of an optimally designed universal National Smart Metering Programme. Phase 2 is the requirements capturing phase of the programme. CER is currently conducting extensive stakeholder engagement and consultation to inform the optimal smart metering solution. Source: http://www.cer.ie/electricity‐gas/smart‐metering.

412
Country Report – Italy (electricity distribution)
1. Overview of to the distribution sector
1.1. Institutional structure and responsibilities In Italy there are 151 distributors supplying electricity to around 27 million customers.
Summary data on industry structure is set out below.
Table 261: DSO characteristics
Total number DSOs
Ownership unbundled
Legally unbundled
Less than 100000 customers
Exemption* Share of total demand
Country 136 ‐ All 126 Embedded generators do not pay distribution tariffs
3%
*exemption from distribution network charges for certain types of grid users, such as low‐carbon generation connected to distribution networks.
In most cases DSOs belong to vertically integrated groups (they have legal separation).
Accounting and functional separation obligations are enforced. As for brand and
communication policy separation, a consultation is currently pending within a wide
review of functional separation.
For DSOs which have 100.000 customers or fewer, functional separation obligations are
not in place. Such DSOs provide around 3% of the country´s electricity, to a customer
base which is also around 3% of the total population.
The responsibility for setting distribution tariffs is spread between the following
jurisdictions (for example):
The DSO provides data to the regulator on their costs and quality levels
DSOs belong to vertically integrated groups. For DSOs which have 100000 customers or
fewer, functional separation obligations are not in place.
The regulator is responsible for setting the level of allowed revenues and for specifying
the tariff structure to be used by DSOs.

413
The NRA issues the tariff methodology (for allowed revenues, tariff structure and
connection charge) and quality of service regulation, after wide public consultation with
all stakeholder
Government defines the high‐level principles for tariff regulation, through primary law
For the regulatory period 2012‐15, the regulator issued 3 consultation papers for tariff
regulation and 3 consultation papers for quality of service regulation of DSOs. All
submission received during each consultation phase were published in the regulator’s
website and RIA reports have also been published.
The breakdown of responsibilities as it related to tariff setting is summarized in the table
below.
Table 262: Legal basis for tariff structure – Roles and Responsibilities in setting distribution tariffs
Actor Allowed revenues (tariff level)
Tariffs (tariff structure)
Connection charges
DSO Provides the regulator with data on its cost and quality levels
Provides the regulator with data on its cost and quality levels
Provides the regulator with data on its cost and quality levels
Government Defines main principles
Defines main principles
Defines main principles
NRA Issues the allowed revenues
Issues the tariff structure
Issues the connection charges
X = main responsibility; other options to fill the table: sets rules; monitors ex‐post; defines main principles;
calculates for NRA approval; also involved;
1.2. Key figures on revenue and tariffs Distribution revenues in Italy in 2013 have not been made publicly available.
Information on available tariff components and the number of customers in each
category is set out in the table below.
Table 263: Tariff components, customers and revenues per customer class
Customer classes Tariff components Number of customers
Household KWh, KW, charge per withdrawal point
29427000
All others (non‐household)
KWh, KW, charge per withdrawal point
7672007
Total ‐ 37099007
The breakdown of energy volumes by customer category are set out in the charts below.

414
Figure 56: Proportion of energy and revenue accounted by customer categories
The typical network tariff in 2013 for residential, small and large industrial customers is
illustrated below:
Table 264: Breakdown of annual charges – typical customer types, 2013 (€)
Customer type
Notional Energy usage
Fixed charges
Energy charges
Demand and reactive charges
Total
Residential 3500kWh 6 17 118 141
Small commercial
50MWh 7 639 184 820
Industrial 24000MWh 563 12784 42480 55827 Household user connected to a low voltage network with an annual consumption of 3,500 MWh and 6 kW of contractual power. Small Industrial connected to a low voltage network, an annual consumption of 50 MWh and 20 kW of contractual power. Large industrial user with an annual consumption of 24000 MWh, 7000 use hours and 400 kW of contractual power.
As can be seen from the table above, tariffs have three components: a withdrawal point
charge, a rated power charge, and a per‐unit energy charge. Tariffs are differentiated by
voltage level, wherein the ´residential´ customer voltage level is 3 kW; the ´small
commercial´ voltage level is from 16,5 kW to 20 kW; the ´industrial´ voltage level is a
maximum of 400 kW.
It should be noted that the calculated values for the distribution tariff of the residential
customer shown above also includes the tariffs for transmission. The distribution and
transmission tariffs are not typically separated.
It should also be noted that two other components are accounted for within the tariffs
for the residential customer (that is, included within the values shown above),
specifically:

415
A quality of service component; and
A cost compensation mechanism for the various DSOs.
The resulting average tariffs per kWh are illustrated below.
Figure 57: Average network charges (€cents/kWh), 2013
2. Regulation of distribution activities
2.1. General overview
The distribution sector is regulated under a mixed regulatory regime. A “cost‐
reimbursement” form of regulation is applied for CAPEX incurred by DSOs. In addition, a
number of both “input‐based” and “output‐based” incentives apply for priority
investments (including pilot projects for smart grids) as well as for service quality.
Operating costs are subject to a price cap system.
Key features of the regulatory regime are set out in the following table
Table 265: Main features of the regulatory regime
Issue Approach
Type of regime (concession/licence) Concession regime
Duration of tariff setting regime 4 years (there are some suggestions to extend this to 6 years)
Form of determination (distributor Distributor provides data on its costs, etc.,
There is cost‐reimbursement of CAPEX and a number of input‐based and output‐based
incentives are used within the regulatory regime. OPEX is limited by a price cap. Quality
of service targets are in effect.
Concessions are tendered for a 30 year period

416
propose/regulator decide) and the regulator sets the allowed tariffs based on cost‐reimbursement (CAPEX) and a price cap (OPEX)
Scope for appeal regulatory decision Appeals may be made at the Regional Administrative Court (TAR, Lombardia) and, as a second stage, at the Council of State
Concessions are tendered for a period of 30 years by the Ministry of economic
development. The current concessions have not been allocated through competitive
mechanisms.
According to the law, when concessions are renewed, non‐depreciated assets are
expected to be remunerated on the basis of their replacement cost.
2.2. Main incentive properties of the distribution regulatory model
The following key regulatory incentives apply for the DSOs:
Price caps on operating costs
Standard losses are defined
Input‐based incentives apply for priority investments (including pilot projects for smart
grids)
Quality of service regulation / targets
At the same time the following tools are provided to mitigate risks.
Almost all allowed revenues are calculated using “withdrawal points” as the unit of
measurement (i.e., allowed revenue is expressed in euro/connected customer). The only
exception is revenues for distribution to public lighting systems (which are still
calculated in euro/kWh). The volume risk on the DSOs is fully sterilised from allowed
revenues related to capital costs, through an ex‐post reconciliation mechanism
(perequazione). However, this is not the case for operational costs; given that the
number of connected customers is used as the unit of measurement, this also reduces
the volume risk for operational costs.
OPEX are subject to a price cap. At the beginning of a new regulatory period the new
starting price is set in a way such that 50% of the efficiency gains (the difference
between actual costs and allowed costs) obtained by the firm in the previous period are
not transferred to consumers in the form of reduced tariffs (i.e. they may be retained by
the DSO).
Lastly, in the price cap formula used for updating OPEX, a specific parameter can be
introduced in the case of unforeseen and exceptional events and changes in the
regulatory framework.
Key components of quality of service regulation are:

417
SAIDI and SAIFI+MAIFI reward/penalty regulation
Guaranteed standards and automatic compensations for interruptions exceeding the
maximum number of interruptions allowed for MV customers
Guaranteed standards and automatic compensations for interruptions exceeding the
maximum duration of interruptions allowed by MV and LV customers
Voltage quality: voltage drops recording obligation
Guaranteed standards of automatic compensations for “distribution‐related commercial
quality” issues (including the maximum time for connections) for MV and LV customers.
Even though there is no direct interaction between the quality of service regulation and
the tariff system, it can be noted that:
As for SAIDI and SAIFI+MAIFI reward/penalty regulation, rewards (penalties) have the
concrete effect of increasing (decreasing) the allowed revenues;
As for guaranteed standards, the cost of automatic compensation paid by DSOs is not
included in the allowed returns of the DSOs.
2.3. Determination of cost of service parameters
The approach to determining key cost of service parameters are summarized in the
following table.
Table 266: Approach to key cost of service parameters
Parameter Approach
Form of price control Hybrid system, partly price‐cap (OPEX) and partly cost of service (CAPEX)
Regulatory asset base Assets within the RAB are evaluated on the basis of a ‘historical revaluated cost’ approach. Every year the value of the DSOs’ assets are updated by the inflation index of the price of “investment goods”
Capital expenditure Cost reimbursement. Efficient CAPEX costs are rolled into the asset base, and costs are revised every year
Approach to operating expenditure Price cap, with the tariff component related to OPEX is reset every 4 years.
Form of WACC applied Real WACC, pre‐tax
The following formula is applied in determining the WACC:
e
De
E
t
t
ED
DK
ED
E
t
KWACC
1
1
1
KE = rf + β MRP is the cost of equity
MRP is the Market Risk Premium
KD is the cost of debt
t is the debt tax shield
te is the corporate tax rate

418
rf is the nominal rate for risk free activities and is updated every two years
The debt leverage is set at a target ratio considered as efficient by the regulator. The
level of the allowed rate of return on investments is revised every two years.
At the beginning of each regulatory period, allowed OPEX are aligned to actual OPEX,
net of a profit‐sharing mechanism if the efficiency targets of the previous period have
been met (i.e. if companies have been more efficient than what was required by the X‐
factor of the previous period).
The X‐factor for the new regulatory period is calculated in such a way that the allowed
OPEX for the first year of the next regulatory period is aligned to actual OPEX plus 50%
of the efficiency gains obtained during the previous period. Efficiency gains are defined
as the difference between allowed OPEX and actual costs (based on the last available
final statement).
3. Tariffs for distribution services
3.1. Distribution tariffs
In the allocation of costs between customer categories, a DSO´s allowed revenues are
based only on the number of connected customers; this is in order to fully decouple DSO
revenues from energy volumes.
The costs per voltage level (LV, MV and residually HV) are separately accounted for in
the process of allocating distribution costs to tariffs.
The network tariff paid by final customers has a trinomial form and consists of:
A fixed component (euro/customer)
A component related to capacity (euro/kW)
A variable component related to energy (euro/kW)
Some exceptions are for public lighting systems and EV recharge points, for which a
monomial tariff applies (only euro/kWh).
The actual values of the components of network tariffs are articulated per customer
class:
Household (LV), currently sub‐differentiated between residential (first houses) and
non‐residential (second houses, i.e. cottages)
Business customers, differentiated by voltage levels (LV, MV, HV, EHV)
DSOs´ allowed revenues are based on the number of customer connections a DSO
has. Network tariffs are formed through three charges, including a fixed component,
a capacity component, and an energy consumed component.

419
Public lighting systems, differentiated by voltage levels (LV and MV)
Public recharging of electric vehicles (LV only for the time being).
Various other aspects of distribution tariff setting are summarized in the table below.
Table 267: Approach to key issues in setting distribution tariffs
Issue Approach
Treatment of distribution losses Not included in tariffs
Presence of uniform tariffs Yes
Presence of non‐linear tariffs Yes, for household tariffs
Presence of regulated retail tariffs No
Presence of social tariffs Yes (they act as a subsidy mechanism)
Distribution losses are not charged as a part of the distribution tariffs. Losses are made
up for by requiring each balance responsible entity to deliver more power than that
consumed by its loads.
Tariffs are geographically‐uniform. It is a legal requirement that the same network tariff
for final customers is applied throughout the country. Retail prices are not regulated.
For household customers, the distribution tariff components are not linear, but are
progressive instead. The review of the structure of the network tariff paid by household
customers is currently ongoing. The progressive structure currently used is going to be
discontinued because it provides negative signals and incentives with regard to
improving energy efficiency. As a temporary measure, a specific experimental network
tariff, which is non‐progressive, is in place for heat pumps.
A social tariff system is in place (known as a social bonus), warranting a tariff discount
for consumers with a household income inferior to a fixed threshold. The social bonus is
given to families with low income in the form of a reduction in the cost of electricity,
independent of the DSO. The costs of the scheme are paid by all consumers through an
overall system charge (named “As”).
3.2. Connection charges Key issues in the setting of connection charges are set out in the table below.

420
Table 268: Summary of key issues relating to connection charges
Issue Approach
Determination of charges
Type of charges (shallow/deep) Both. Shallow charges are used for consumers and embedded generators. A mainly‐shallow approach, with deeper charges, is adopted for HV network users. That is: (1) for connections of HV final customers, 50% of the costs of new infrastructures at the same voltage level for final users; and (2) for connections of HV producers, the cost of the standard solution for the work to be done with discounts for RES and CAR.
Methodology adopted For LV/MV connections and for RES or CAR connections, a lump sum (single) charge is defined by the regulator on the basis of the average costs of all possible solutions. It is not related to the real work to be done, in the specific case context. For HV connections, the connection charge is related to the cost of the standard solution for the work to be done. So this charge is related to the real work to be done, on the specific case‐by‐case basis. For the connection of generation units, for MV or HV the generator is free to procure the necessary works from a different source, under given conditions that are specified in the regulations for the connection of generators (“TICA”, Testo integrato connessioni attive)
Hosting capacity Scope to refuse connection A DSO cannot refuse reasonable requests of connections. For generators, the DSO cannot refuse a connection but it can enforce a waiting list
Requirements to publish hosting capacity
Yes, this must be published
Targets and/or incentive schemes to enhance hosting capacity
The Development Plans of DSOs contain hosting capacity targets
DSOs are not required to notify the regulator of the hosting capacity of its network
unless a specific request of information is issued; but DSOs are obliged to publish the
level of HC in each area according to TICA regulation.

421
At the moment, targets for hosting capacity are not set for DSOs as part of the process
of setting allowed revenues. However, output‐based incentives related to HC and with
smart grid deployment on a large‐scale could be introduced from the next regulator
period onwards.
At the moment, there is no specific regulation or scheme in place which does not
hamper investment but which implies additional OPEX (such as smart grid technology,
use of demand side flexibility for grid services, voltage regulation by decentralised
resources, etc.).
4. Distribution system development and operation
4.1. Distribution system development
The key features of distribution system planning are summarized below.
Table 269: Approach to distribution planning
Issue Approach
Form of distribution planning document For each DSO, a distribution system development plan must be prepared, and updated annually, and published, according to legislative obligation. Each DSO should also notify its distribution system development plan to Ministry of Economic Development and to the regulator; however, the distribution plan doesn´t need to be approved by the regulator.
‐ Key responsibilities for its development DSO must prepare it and notify the plan to the Government. DSO must update the plan each year.
‐ Degree of integration with renewables plan
The planned development of distributed generation in the distribution area is explicitly considered in the DSO development plans
‐ Relationship with consumption trends The evolution of consumption in the distribution area is explicitly considered in DSO development plans, according to overall TSO forecasts, and not only for energy consumption but also taking peak power into consideration.
‐ Relationship with quality of service targets
The improvement of quality of service is explicitly considered in DSO development plans, with consideration also given to the improvement targets set by the regulator
‐ How trade‐offs between network development and alternative
Some DSOs include detailed descriptions of their smart grid projects and plans in their development
DSOs must create system development plans, which are to be updated on an annual
basis. DSOs cannot dispatch renewable generators.
DSOs are fully responsible for metering of distribution consumers. There is a very
high level of smart meter installation: in 2013 there was almost complete
installation of smart meters across all consumer groups in Italy.

422
technologies are treated plans. For the time being, trade‐offs between the deployments of smart grid technologies and alternative investments are not explicitly addressed, but this is likely to be incorporated in the next future.
‐ Requirements to integrate cost benefit analysis
No specific requirement to integrate CBA
4.2. Distribution system operations
The key features of distribution system operations are summarized below.
Table 270: Approach to distribution planning
Issue Approach
Requirements for dispatch of renewable plants connected to DSO network
Only the TSO can dispatch resources, but DSO have a role in ensuring the procedure called RIGEDI (Riduzione generazione distribuita) for system security: distributed generation resources that are connected to MV distribution grid are required to be curtailable in case of TSO order, implemented through DSOs.
Possibility to dispatch flexible loads The possible role of DSO in “new” dispatching of flexible loads has been explored in a public consultation; the final decision is still pending and might require legislative changes to be made before dispatching rights are granted.
Other sources of flexibility open to DSO A few trials for battery storage systems are in place, even though no incentive regulation is in place for storage systems at the distribution level.
In the coming future, the regulator intends to lower the threshold for participating in
the balancing market (including several ancillary services) from the current value of 10
MVA to 1 MW, thus involving many generation units connected to MV distribution grids.
In this case the role of DSOs in “new” dispatching requires to be defined (see also
answer to the following question).
4.3. Metering
Key issues regarding metering, and the role of the DSOs, are set out in the following
table.
Table 271: Key approach to metering
Issue Approach adopted
Discos role in metering DSOs have full responsibility for metering, and own the meters (except for larger generation units – in reference to each voltage level ‐ whose meters are owned by the generation company; on

423
this issue there is a consultation pending).
Monopoly services in the metering DSOs have a monopoly on consumer‐side metering; they do not have a monopoly on generation‐side metering
Smart metering functionality Interval metering: 1 hour for LV, 15m for HV and MV Remote reading Remote disconnection and reconnection of customers Remote control of the maximum power that can be withdrawn for LV meters for consumers with smaller contractual power An external device for sending real time consumption information to a local screen or computers, linked to smart meter via PLC, has been developed and tested in field. A consultation is open on this issue, according to Directive on energy efficiency Active energy/power withdrawn/injected Reactive energy/power withdrawn Measurement of voltage variations according to EN 50160 Continuity of supply (interruptions) recording
As of 2013 there was almost complete installation of smart meters across all consumer
groups in Italy. A breakdown by customer category is illustrated below.
Table 272: Number of smart meters installed – by end of 2013
Customer category Number
LV network users; up to 1 kV (typically 230‐400 V)
37 million
MV network users; 1‐36 kV (typically 20 kV, but other nominal voltage levels are operated as well, for instance 23 kV)
98000
HV network users; 36 kV (typically 130‐150 kV, 220‐380kV; in few areas also 60 kV)
1500
Total 37, 1 million
Some analysis has been undertaken of the impact(s) of installed smart meter technology
within Italy, under a trial study which involved the installation and operation of
advanced meters in Italian households. The meter technology had the following
capabilities:
On‐screen display of current, historical and average consumption;
On‐screen display of the distribution of consumption within the household;
Ability to limit consumption levels (set maximum thresholds);
Monitoring of maximum power consumption;
Measurements of individual load;
Ability to send consumption messages to users;
Detailed analysis of consumption or micro‐generation, particularly solar PV generation;
and

424
Ability to make comparisons between different times of use.94
Analysis was undertaken of the impact of the installed meter technology on energy
consumption of households. It was found that 66% of the trial participants reported a
reduction in power consumption during the trial period, as compared against their
baseline consumption (when smart metering technology was not used). Of those 66% of
trial participants, an average power consumption reduction of 7% was achieved during
the meter trial period.
It was also found that when the household customers with the highest levels of
consumption were considered as a single group, their average power consumption
saving during the meter trial period was 8%.94
94 Italian Energy Authority, 2014. Received from: http://www.autorita.energia.it/allegati/docs/14/232-14.pdf

425
Country Report – Italy (gas distribution)
1. Overview of to the distribution sector
1.1. Institutional structure and responsibilities In Italy there are 233 distributors supplying gas to 21523072 customers. Summary data
on industry structure is set out below.
Table 273: DSO characteristics
Total number DSOs
Ownership unbundled
Legally unbundled
Less than 100000 customers
Exemption* Share of total demand
Country 233 ‐ All DSOs 203 No charges are applied for the use of the gas network in the case of injections into the network
19,2%
*exemption from distribution network charges for certain types of grid users, such as low‐carbon generation connected to distribution networks.
DSOs with less than 100000 customers are subject to the same unbundling obligations
as other DSOs.
The responsibility for setting distribution tariffs is spread between the following
jurisdictions (for example):
The NRA issues a methodology and calculates the allowed revenue and the tariff
parameters
Government and Parliament issues the tariff principles in national and decree legislation
The breakdown of responsibilities as it related to tariff setting is summarized in the table
below.
Table 274: Legal basis for tariff structure – Roles and Responsibilities in setting distribution tariffs
Actor Allowed revenues (tariff level)
Tariffs (tariff structure)
Connection charges
The NRA sets the allowed revenues for DSOs. All DSOs, regardless of their size, are
subject to the same unbundling obligations.

426
DSO Not involved Not involved Connection charges are defined and agreed in the concessions between DSOs and local authorities
Government (and Parliament)
Issues the tariff principles in law
Not involved Not involved
NRA Issues methodology, calculates allowed revenues and tariff parameters
Sets the tariff structure
Not involved
X = main responsibility; other options to fill the table: sets rules; monitors ex‐post; defines main principles;
calculates for NRA approval; also involved;
1.2. Key figures on revenue and tariffs Information on the allowed revenues of DSOs is confidential and not publicly‐available.
However, a breakdown of gas sales by customer category, including information on
available tariff components and the number of customers in each category is set out in
the table below.
Table 275: Tariff components, customers and revenues per customer class
Customer classes (smc)
Tariff components Number of customers
Distributed volumes (smc)
0 – 120 M3; customer class 3.650.498 172.017.292
121 – 480 M3; customer class 4.993.620 1.531.677.433
481 – 1.560 M3; customer class 9.425.240 8.851.477.466
1.561 – 5.000 M3; customer class 2.988.699 6.997.925.950
5.001 – 80.000 M3; customer class 443.267 7.150.209.474
80.001 – 200.000 M3; customer class 13.664 1.704.863.671
200.000 – 1 million M3; customer class 6.530 2.793.467.405
More than 1 million M3; customer class 1.554 4.334.918.894
Total ‐ 21.523.072 33.536.557.585
The breakdown of energy volumes by customer category is set out in the charts below.
Information on the breakdown of revenues by customer category has not been
published by the NRA.

427
Figure 58: Proportion of energy accounted by customer categories (customer categories in Standard Cubic Meters)
Customer categories are not defined in terms of typical (´residential´, ´small
commercial´, etc.) groupings, but rather in terms of volume of gas consumed.
Specifically, customers are grouped (and pay the relevant tariffs) depending on which of
the consumption groups they fall into. The consumption groups include:
0 – 120 smc per year
121 – 480 smc per year
481 – 1.560 smc per year
1.561 – 5.000 smc per year
5.001 – 80.000 smc per year
80.001 – 200.000 smc per year
200.000 – 1 million smc per year
Over 1 million smc per year
The typical network tariff in 2013 for residential, small and large industrial customers is
illustrated below:
Table 276: Breakdown of annual charges – typical customer types, 2013 (€)
Customer type
Notional Energy usage
Fixed charges Energy charges Demand and reactive charges
Total
N.a. 15.000kWh 43,42 79,53 122,95
N.a. 50.000.000 kWh
43,42 27.780,16 27.823,58
N.a. 90.000.000 kWh
43,42 39.888,59 39.932,01
The resulting average tariffs per kWh are illustrated below.

428
Figure 59: Average charges (€cents/kWh), 2013
0.00
0.10
0.20
0.30
0.40
0.50
0.60
0.70
0.80
0.90
Residential Small commercial Industrial
€c/kWh
2. Regulation of distribution activities
2.1. General overview
The role of the NRA is to issue the methodology for tariff calculations (and to set tariffs)
and to calculate allowed revenues. The Government and Parliament is involved in so
much as it sets the main principles for the tariffs.
The distribution sector is regulated under a mixed regulatory regime. Capital costs are
subject to cost reimbursement and operating costs are subject to a price cap system.
The distribution tariff is itemized separately to end‐users. Basically, the tariff paid by
consumers consists of a fixed component and a variable component. The variable
component is articulated per consumption classes (that is, based on consumed volume
and not based on categories such as ´residential´, ´industrial´, etc.).
Key features of the regulatory regime are set out in the following table
Table 277: Main features of the regulatory regime
Issue Approach
Type of regime (concession/licence) Concessions at local level are tendered for a
A mixed regulatory regime is used in Italy wherein capital costs are subject to cost
reimbursement and operating costs are subject to a price cap system.
Assets within the RAB are evaluated on the basis of a ‘historical revaluated cost’
approach. Every year the value of the DSOs’ assets are updated by the inflation index of
the price of “investment goods”
Concessions are tendered for a (maximum) period of 12 years.

429
(maximum) period of 12 years
Duration of tariff setting regime 6 years (2014 – 2019)
Form of determination (distributor propose/regulator decide)
The Government and Parliament proposes the general principles, and the regulator calculates the tariffs to be used
Scope for appeal regulatory decision All of the NRA´s decisions can be appealed at the Regional Administrative Court (TAR Lombardia) and, as a second stage, at the Council of State
2.2. Main incentive properties of the distribution regulatory model
The following key regulatory incentives apply for the DSOs:
Operating costs are automatically updated according to a predefined rule for 6 years;
hence the DSO is incentivised to reduce these costs.
At the same time the following tools are provided to mitigate risks:
Profit sharing. It is planned that, at the end of the regulatory period 2014‐2019, in
setting initial values of operating costs for the next regulatory period, efficiency recovery
during 2014‐2019 will be shared between consumers and distributors.
Volume risk. In Resolution 633/2013/R/gas relevant volumes for the setting of tariffs
paid by consumers were considered the average volumes during the last four years, in
order to reduce yearly variability of tariffs due to volume volatility. Allowed revenues in
year t with reference to capital costs are based on scale variables in year t‐2, while those
with reference to operating costs are based on scale variables in year t.
Key components of quality of service regulation are that two premium/penalty
mechanisms are implemented regarding:
Additional yearly gas odorization degree measurements with respect to a minimum
number set ex‐ante by the AEEGSI;
Reduction of the number of gas leaks reported by third parties.
Moreover, the regulation introduced obligations related to:
Prompt intervention service;
Included contact centre service;
Inspection of pipes;
Cathodic protection of steel pipes;
Incidents and emergencies;
Continuity of supply;
Commercial quality.
In case commercial quality guaranteed standards are not respected, a system of
automatic compensations to consumers is put into operation.

430
2.3. Determination of cost of service parameters
The approach to determining key cost of service parameters are summarized in the
following table.
Table 278: Approach to key cost of service parameters
Parameter Approach
Form of price control Hybrid system, partly price cap (OPEX) and partly cost of service (CAPEX)
Regulatory asset base Assets within the RAB are evaluated on the basis of a ‘historical revaluated cost’ approach. Every year the value of the DSOs’ assets are updated by the inflation index of the price of “investment goods”
Capital expenditure Cost reimbursement. CAPEX are assessed every year and the corresponding tariff components are updated accordingly.
Approach to operating expenditure Price cap. The tariff components meant to cover OPEX are updated every year following the price cap formula
Form of WACC applied Real WACC, pre‐tax
Additional revenue items (where applicable) N.a.
The following formula is applied in determining the WACC:
e
De
E
t
t
ED
DK
ED
E
t
KWACC
1
1
1
where:
KE = rf + β MRP is the cost of equity
MRP is the Market Risk Premium
KD is the cost of debt
t is the debt tax shield
te is the corporate tax rate
The debt leverage is set at a target ratio considered as efficient by the regulator. The
level of the allowed RoR on investments is revised every two years.
The X‐component in the revenue cap or price‐cap formula was calculated to allow the
recovery, by 2020, of efficiency gains already achieved in year 2011. In particular, the x
component for large enterprises was fixed so as to determine an operating cost in 2020
equal to 2011 average costs for the same typology of enterprises (updated to 2020),
determined on the basis of their accounts.
The x‐component for medium enterprises was fixed so as to determine an operating
cost in 2020 equal to the weighted average of the 2011 costs for large and medium

431
enterprises. The x‐component for small enterprises was fixed equal to that of medium
enterprises.
There is no direct formal interaction between the quality of service regulation and the
tariff system. However, allowed revenues are de facto increased (decreased) if the DSO
performs better (worse) than some predefined quality targets. Of course the costs of
automatic compensations to consumers are not included in the allowed returns of the
DSOs. Deficits deriving from the premium/penalty mechanisms are financed with tariffs
paid by final consumers.
Concessions are tendered for a (maximum) period of 12 years. In the case of renewal,
the DSO that loses the concession is remunerated on the basis of its concession terms.
New concessions are, on the basis of decree 12 November 2011, n. 226, at a more
aggregate level, and are planned to be tendered with reference to a period of 12 years.
At the end of the first concession period, non‐depreciated assets are remunerated on
the basis of their replacement cost.
3. Tariffs for distribution services
3.1. Distribution tariffs
50% of capital costs are allocated to the fixed component of the distribution tariffs (and
are expressed in €/customer). Operating costs and the other 50% of capital costs are
allocated to the variable component of the tariff (and are expressed in €/m3). The
variable component is articulated per consumption classes: there is no distinction
between residential, industrial and other consumers.
As regards metering, capital costs and operating costs are allocated to the (unique) fixed
component of the tariff (expressed in euro/customer).
From 2015 onwards, fixed components of the tariffs will be split in three categories,
depending on the meter class.
Various other aspects of distribution tariff setting are summarized in the table below.
Table 279: Approach to key issues in setting distribution tariffs
Issue Approach
Treatment of distribution losses No explicit component for distribution losses within the tariffs
In addition to the fixed and variable components of the tariff paid by customers, the
end‐user tariff includes other aspects which are designed to support: energy
efficiency interventions; RES development; quality of service; the social tariff system;
district heating promotion; and the last supply service.

432
Presence of uniform tariffs No, tariffs are differentiated between six tariff zones. The variable component of the tariff in each zone is defined on the basis of a reference tariff structure per consumption classes and considering costs incurred in each zone, compared to costs in other zones.
Presence of non‐linear tariffs Yes, the variable component of the tariff is linked to the different consumption classes
Presence of regulated retail tariffs Retailers are obliged to offer to their client the possibility to choose a regulated tariff. This option is offered only to residential customer with an annual consumption less than 200.000 m3.
Presence of social tariffs A social tariff system is in place (bonus gas), warranting a tariff discount (therefore operating as a subsidy) or a direct payment to consumers with a household income inferior to a fixed threshold, depending on the number of components. The value of the bonus depends on the category of use of the gas, the climatic zone and the number of component of the household.
Tariffs are published as an annex of the regulator´s Resolutions and are publicly‐
available on the organisation´s internet website.
In addition to the fixed and variable components of the tariff paid by customers, the
tariff consists of other components aimed at financing:
Energy efficiency interventions,
RES development,
Quality of services,
The social tariff system,
District heating promotion, and
The last supply service.
3.2. Connection charges Key issues in the setting of connection charges are set out in the table below.
Table 280: Summary of key issues relating to connection charges
Issue Approach
Determination of charges
Type of charges (shallow/deep) Overall, charges are of a shallow nature
Methodology adopted Connection charges are not regulated at the moment. The regulator has initiated a process to determine connection charges. One consultation paper was issued in 2013 concerning the principles

433
and first proposals on the topic. In general, for small residential installations located not far from the existing network (typically within 10 meters) a uniform one‐off connection fee applies. In other cases, connection charges basically depend on the actual costs of the connection.
Hosting capacity Scope to refuse connection DSOs have an obligation to connect customers requiring the connection, if capacity exists and the necessary works for the connection of the customer are technically and economically feasible
Requirements to publish hosting capacity
No.
Targets and/or incentive schemes to enhance hosting capacity
N.a.
The DSOs are not required to notify the regulator of the technical capacity of their
networks.
4. Distribution system development and operation
4.1. Distribution system development
The key features of distribution system planning are summarized below.
Table 281: Approach to distribution planning
Issue Approach
Form of distribution planning document There is no planning document which is to be developed and submitted to the regulator. Decisions related to network development are governed by the local authorities, whom are responsible for the granting of distribution concessions.
‐ Key responsibilities for its development In the tenders for the new concessions, participants have to propose network development plans. The contents of the network development plans
DSOs are not required to develop or publish planning documents as local government
is responsible for taking decisions on the network development. However, in the
process of tendering for new concessions, the participants are required to propose
network development plans.
In 2012 there were about 22.000.000 meters installed in Italy. Nearly 1.400 electronic
meters were installed in the same year, of which almost 90% belonged to class G16
and over. Traditional meters with the so‐called ´add on´ (volume converter with a data
transmission system) were nearly 118.000.

434
proposed (included aspects related to quality of service, technological innovation) is relevant for the tender.
‐ Relationship with environmental policies
Indirect relationship; tenders for new concessions, which require network development plans to be drafted, require attention to be given to relevant environmental policies
‐ Relationship with quality of service targets
There is an indirect relationship. In the tenders for the new concessions, participants have to propose network development plans. The contents of the network development plans proposed (included aspects related to quality of service, technological innovation) is relevant for the tender.
‐ How trade‐offs between network development and alternative technologies are treated
No explicit trade‐off
‐ Requirements to integrate cost benefit analysis
Parties which submit a tender must also submit to local authorities the results of the cost‐benefit analyses supporting some of the investment decisions included in the proposed network development plan.
4.2. Metering
Key issues regarding metering, and the role of the DSOs, are set out in the following
table.

435
Table 282: Key approach to metering
Issue Approach adopted
Discos role in metering Responsible for: meter installation and maintenance; collection, validation and registration of data. It also normally owns the meter. One point to note is that the DSO is not responsible for collecting or managing data from meters at the point of delivery from the TSO (that is the TSO´s role).
Monopoly services in the metering Yes, at present DSOs are the only suppliers of metering services
Smart metering functionality Hourly measurement (excluded mass market meters); Remote reading Remote disconnection Local port to send real time consumption information to a local screens or computers (upon request of the customer).
In 2012 there were about 22.000.000 meters installed in Italy. In the same year, nearly
1.400 electronic meters were installed in the same year, of which almost 90% belonged
to class G16 and over. There were nearly 118.000 traditional meters with the so‐called
´add on´ (volume converter with a data transmission system) in use.
Resolution 631/2013/R/gas established plans to deploy smart meters for gas in Italy,
under the following timetable:
G40 unit customers: 100% by 31 December. 2014;
G16 and G25 unit class customers: 60% by 31 December 2014 and 100% by 31
December 2015;
G10 unit class customers: 15% by 31 December 2014 and 30% by 31 December 2015
Small customers (G6 units or lower): for distributors with more than 200,000 delivery
points (as at 31 December 2013): 3% by 31 December 2014;3% by 31 December 2015;
60% by 31 December 2018.95
It should be understood that Resolution 631/2013/R/gas introduced a mechanism to
reduce the variability of the volumes considered for the calculation of mandatory tariffs
paid by end consumers; and that this provision has no effect on the tariff reference
recognised to distribution companies.
95 Italian Regulatory Authority for Electricity and Gas. Annual report to ACER. 31 July 2013. Received from: http://www.autorita.energia.it/allegati/relaz_ann/13/C13_NR_Italy-EN.pdf

436
Country Report – Lithuania (electricity distribution)
1. Overview of the distribution sector
1.1. Institutional structure and responsibilities
In Lithuania a single, state‐owned company operates distribution, supplying 1,62 million
customers and covering the whole country; with the exception of 5 small local DSO that
cover less than 1% of customers’ demand.
Table 283: DSO characteristics
Total number DSOs
Ownership unbundled
Legally unbundled
Less than 100000 customers
Exemption* Share of total demand
6 ‐ 1 5 Yes, for RES N.A. *exemption from distribution network charges for certain types of grid users, such as low‐carbon generation connected to distribution networks.
The breakdown of responsibilities as it related to tariff setting is summarized in the table
below.
Table 284: Legal basis for tariff structure – Roles and Responsibilities in setting distribution tariffs
Actor Allowed revenues (tariff level)
Tariffs (tariff structure)
Connection charges
DSO Calculates the AR Proposes after consultation
Provides data
Government Issues principles in the primary law
Issues principles in the primary law
Issues principles in the primary law
NRA Issues a methodology, approves proposal
Issues a methodology, approves proposal
Issues a methodology, calculates
X = main responsibility; other options to fill the table: sets rules; monitors ex‐post; defines main principles;
calculates for NRA approval; also involved;
Almost all power distribution in Lithuania is operated by a single company, which is
state‐owned (unlike suppliers) and subject to regulation.

437
The regulator publishes the tariff structure one month before the official approval, and
after consultations, if any, holds a public hearing. Tariffs are valid one month after
approval.
1.3 Key figures on revenue and tariffs
Distribution revenues in 2013 were 450,69 million LTL (130,53 million EUR, when 1
EUR=3.4528 LTL). MV revenue was 34,6 million EUR (26%), LV revenue – 96 million EUR
(74%).
A breakdown of the number of customers, energy delivered and the revenue by
customer category, including information on available tariff components for all 3 options
(I, II and III tariff plans by different load factors for commercial customers), is set out in
the table below.
Table 285: Tariff components, customers and revenues per customer class
Group Customer classes Tariff components
Number of customers
Delivered energy (TWh)
Revenue
(million EUR)
III Commercial > 400KW kWh & kW
123752
3,30 44,38
III Commercial 30‐400 KW kWh & kW 2,10 41,77
II Commercial <= 30KW kWh & kW
I Households kWh & fixed 31503 2,64 44,38
I Households kWh only 1464275
Total 1619530 8,04 130,53
The breakdown of energy volumes and distribution revenue by customer category are
set out in the charts below.

438
Figure 60: Proportion of energy and revenue accounted by customer categories
The split seems to favour households, which pay on average less than small commercial
users, although their costs are probably higher (See also Figure 2 below).
The official consumer categories are:
‐ Group I clients: households – physical persons, purchasing electricity for own, family or
home, not related with business or profession needs (individual houses, buildings in the
house territory, apartments, summerhouses, garden’s plot, garages, for personal needs and
vehicles, and other living objects, not used for business or profession needs);
‐ Group II clients: clients (except Group I clients) with their facility capacity allowance of
30 kW or less;
‐ Group III clients: (except Group I clients) with capacity allowance of more than 30 kW.
The breakdown of network charges by typical customer types and by component is not
available.
The average tariffs per kWh for the standard typical customers in 2013 are illustrated
below.

439
Figure 61: Average network charges (€c/kWh), 2013
2. Regulation of distribution activities
2.1. General overview
Key features of the regulatory regime are set out in the following table.
Table 286: Main features of the regulatory regime
Issue Approach
Type of regime (concession/licence) License
Duration of tariff setting regime 5 years
Form of determination (distributor propose/regulator decide)
DSO proposes allowed revenue and tariff structure, NRA approves
Scope for appeal regulatory decision N.A.
2.2. Main incentive properties of the distribution regulatory model
Lithuania adopts a 50/50 Price/Revenue‐cap model, integrated by several provisions
that mitigate the risk of losses or supra‐normal profits for DSOs. The allowed revenue is
set for five years, but is modified every year by:
a) efficiency and CPI values;
b) volume change index;
c) contingency index;
d) under/over‐revenue recovery;
e) quality of services;
f) profit‐sharing mechanism
In general, there is a balance between incentives and risk mitigation. In particular:

440
• The profit sharing mechanisms transfers to tariff reduction 50% of productivity increases
between 2 and 6%, and 100% of those achieved beyond 6%.
• The DSOs bear 50% of the volume risk through volume adjustment factor.
• The correction factor evaluates the revenue over/under recovery due to data changes.
• The contingency factor reflects the impact of external changes, i.e. taxes, and of major
events affecting the activity of the DSOs.
• X factor applies to OPEX only.
• Capital costs are assessed every year.
• Larger investments (over 5 million LTL or about 1.5 million EUR) are approved
separately.
• Both the technical requirements and the forecast investment submitted by each DSO
costs are assessed by the regulator using a simple benchmark model.
• Investment size is valued from the perspective of utilities’ technical, financial and
managerial capacity.
• Investment plan is assessed by the indices set in the plan (separately from other utility’s
activity).
In the next regulatory period, the introduction on an LRAIC model should entail the
inclusion of more output based regulation, with components related to energy, capacity,
and service quality.
The reliability of the electricity transportation by the distribution network is assessed by
SAIDI and SAIFI indicators. The minimum reliability levels of the electricity transportation
are set to the distribution network operator.
Measures (sanctions, penalties) could be applied, if the following indicators of the
quality of service have worsened:
• % of the timely connected new customers;
• The restoration of the interrupted electricity supply in accordance with the set
deadlines;
• % of the timely analysed claims of the customers and network users.
The price ceilings of the service is decreased/increased by 0.05 or 0.1 percent, if actual
annual indices increased/decreased accordingly 5‐10% or >10%, as compared to the set
minimum quality level by the regulator for the 5‐year regulatory period.
2.3. Determination of cost of service parameters
The approach to determining key cost of service parameters are summarized in the
following table.

441
Table 287: Approach to key cost of service parameters
Parameter Approach
Form of price control 50/50 Revenue / Price cap
Regulatory asset base Value at historical costs.
Capital expenditure Assessed every year, subject to benchmarking and special analysis
Approach to operating expenditure Actual and price cap, international benchmarking may be considered
Form of capital remuneration applied Real WACC; E/D+E set at 30%
Additional revenue items (where applicable)
Not applicable
The following formula applies for WACC calculation:
ED
DK
ED
E
t
KWACC D
e
E
1
Where:
KE = rf + β MRP is the cost of equity MRP is the Market Risk Premium KD is the cost of debt te is the corporate tax rate.
The WACC is updated once a regulatory period.
3. Tariffs for distribution services
3.1. Distribution tariffs Network tariffs include both transmission and distribution, as well as a fee for public
service obligations. Here is an outline of the tariffs by group (see section 1.2 above for
description of the consumer groups).
Households (Group I):
‐ One‐part tariff (energy component with one and two time zones);
‐ Options by consumption factor of two‐part tariff: fixed and energy component
with one and two time zones).
Commercial customers <30kW (Group II) in MV and LV:
The two‐part (kWh+kW) tariff structure includes one, two or four time zones and is
based on energy(kWh) only for households, and on peak (maximum allowed capacity)
and energy for metered loads. There are 3 tariff groups, one for households and two
for business usage.

442
‐ 3 options by load factor of two‐part tariff: demand and energy component
with one and two time zones);
‐ Reliability (per kW) component by 2 categories.
Commercial customers >30kW (Group III) in MV and LV (<400kW and >=400kW):
‐ 3 options by load factor of two‐part tariff: load and energy component with
one and four time zones);
‐ Reliability (per kW) component by 2 categories.
For the calculation of the tariff components, 2 main categories of costs are identified:
MV costs and LV costs. The first cost category is recovered through the per kWh and kW
tariff components equal for LV and MV consumers; the second cost component is
recovered through the per kWh and kW tariff components paid by the LV consumers
only, except the part of LV consumers (households), which may pay per kWh only.
Tariffs are published (Lithuanian only) at:
http://old.regula.lt/lt/elektra/tarifai/visuomeniniai_tarifai_lesto_nuo_2013%20m_sausio_1d/visuomeniniai
_tarifai_lesto_nuo_2013m_sausio%20_1d/
Various other aspects of distribution tariff setting are summarized in the table below.
Table 288: Approach to key issues in setting distribution tariffs
Issue Approach
Treatment of distribution losses Included in distribution tariffs
Presence of uniform tariffs Each DSO has separate tariffs but main one has over 99% of customers
Presence of non‐linear tariffs No
Presence of regulated retail tariffs For households and incumbent only
Presence of social tariffs No
The Public Service Obligation (PSO) price reflects the support of renewable generation,
effective CHPP, power system safety (reserves), nuclear decommissioning, and strategic
projects mainly.
Embedded generators do not pay any distribution tariffs (or G=0).
3.2. Connection and capacity issues
Key issues in the setting of connection charges are set out in the table below.
Table 289: Summary of key issues relating to connection charges
Issue Approach
Determination of Type of charges (shallow/deep) (Mostly) Deep

443
charges
Methodology adopted Tender or regulated cost
Hosting capacity Scope to refuse connection Unreasonable request
Requirements to publish hosting capacity
No
Targets and/or incentive schemes to enhance hosting capacity
Yes, for each area. Reasonable connection requests must be accepted anyway.
There are two ways to determine connection charges:
1. Public procurement. This method is applied if increased permissible capacity exceeds
500 kW. In that case household consumers pay 20 %, other consumers (except
household) – 40 %, producers of electricity – 100 % of contractor's working price. Also,
for project preparation household consumers get 20 %, other consumers – 10 %
discount.
2. Formula and Commission approved fees. This method is applied if total connected
permissible capacity does not exceed 500 kW. Formula:
• Price = Fee for 1 kW * Increased permissible capacity + Fee for 1 m * Shortest
geometrical distance from connection point to consumer object.
The basis for cost calculation is “semi‐deep” charges for consumers and generators: the
costs of new infrastructures at the same voltage level and the costs of the reinforcement
of networks at the voltage level immediately above, but taking into account the rebates
mentioned above.
The regulator approves connection fees based on DSO’s connection cost report of last
years. There are households, non‐household and 100%‐paid customer groups. They are
divided into 4 subgroups according to the connection capacity.
4. Distribution system development and operation
4.1. Distribution system development
DSO all voltages network development plan is submitted at the beginning of the
regulatory period of 5 years and more.
The key features of distribution system planning are summarized below.
Table 290: Approach to distribution planning
Issue Approach
Form of distribution planning document Development plan to NRA on all levels at start of 5‐
Decisions are taken by DSOs, which have an obligation to supply all customers

444
year regulatory period
Key responsibilities for its development DSO
Degree of integration with renewables plan
RES targets set by Government are explicitly taken as an input in the distribution development plan, which must create consistent hosting capacity.
Relationship with consumption trends Demand trend must be taken into account
Relationship with quality of service targets
No explicit connection
How trade‐offs between network development and alternative technologies are treated
Options for TSO / DSO explicitly discussed in network development plan.
Requirements to integrate cost benefit analysis
Yes. Used for smart grid development in 2012 but results mostly negative.
In 2012, performed smart grid cost‐benefit analysis showed not so favourable results,
but combining with other energy sectors, the outcome may be positive. The pilot project
is under preparation and foreseen implementation in 2015.
No other DSO investments CBA is used.
4.2. Distribution system operations
The key features of distribution system operations are summarized below.
Table 291: Approach to distribution planning
Issue Approach
Requirements for dispatch of renewable plants connected to DSO network
Dispatching priority for RES. Any other dispatching by TSO
Possibility to dispatch flexible loads No
Other sources of flexibility open to DSO No
DSOs must comply with TSO directives. Dispatching of generators and loads by TSO only.
4.3. Metering
Key issues regarding metering, and the role of the DSOs, are set out in the following
table.
Table 292: Key approach to metering
Issue Approach adopted
Discos role in metering Full responsibility
Monopoly services in the metering
Yes
Smart metering functionality a) One hour measurementb) remote reading

445
c) remote detection of emergency situation and faster elimination of it d) foster the effective usage of electricity by households: real time consumption information to a local screens or computers
More than 20,000 commercial customers have smart meters. In 2015 the pilot project
should be launched for 3,000 households. The results will be examined and plans
approved.

446
Country Report – Luxembourg (electricity distribution)
1. Overview of to the distribution sector
1.1. Institutional structure and responsibilities
In Luxembourg there are 5 distributor companies supplying electricity to 281428
customers with an overall circuit length of 8477 km
Summary data on industry structure is set out below.
Table 293: DSO characteristics
Total number DSOs
Ownership unbundled
Legally unbundled
Less than 100000 customers
Exemption* Share of total demand
Country 5 0 1 4 Yes 10% *exemption from distribution network charges for certain types of grid users, such as low‐carbon generation connected to distribution networks.
The responsibility for setting distribution tariffs is spread between the following
jurisdictions:
The DSO;
The NRA (Institut Luxembourgeois de Régulation), an independent actor whose duties
include overseeing and ensuring the full functioning of the energy market, as well as a
basic universal service in the interest of consumers. The Institute ensures effective and
sustainable competition by avoiding discrimination in access for new entrants.
Government (Ministry of the Economy and Foreign Trade).
The breakdown of responsibilities as related to tariff setting is summarized in the table
below.
The electricity distribution sector in Luxembourg is rather concentrated with CREOS
managing more than 90% of the total distribution grid. The regulation regime in place
involves a “revenue cap” with some components subject to cost reimbursement.

447
Table 294: Legal basis for tariff structure – Roles and Responsibilities in setting distribution tariffs
Actor Allowed revenues (tariff level)
Tariffs (tariff structure)
Connection charges
Regulated services
DSO Calculates for NRA approval
NA
Government Defines main principles
NA
NRA Set rules, approves
X X NA
X = main responsibility; other options to fill the table: sets rules; monitors ex‐post; defines main principles;
calculates for NRA approval; also involved;
The regulatory process adopted to setting distribution tariffs involves the following
steps:
the Ministry of the Economy issues principles in the primary law (Loi du 1er août 2007
relative à l’organisation du marché de l’électricité modified by Loi du 18 décembre 2009,
Loi du 17 décembre 2010, Loi du 7 août 2012);
the Institut Luxembourgeois de Régulation regulator issues consultation papers and
holds public hearings in order to adopt a methodology for the determination of the
distribution tariffs96;
the Institut Luxembourgeois de Régulation issued a methodology through Règlement
E12/05/ILR du 22 mars 2012 fixant les méthodes de détermination des tarifs d’utilisation
des réseaux de transport, de distribution et industriels et des services accessoires à
l’utilisation des réseaux pour la période de régulation 2013 à 2016 et abrogeant le
règlement E09/03/ILR du 2 février 2009;
the DSO calculates the allowed revenue;
the Institut Luxembourgeois de Régulation approves it.
1.2. Key figures on revenue and tariffs
Distribution revenues in 2013 were € 162.25 million. No further split by service type is
available.
A breakdown of revenue by customer category, including information on available tariff
components and the number of customers in each category is set out in the table
below97.
96http://www.ilr.public.lu/electricite/consultations/conspub301111/index.html;http://www.ilr.public.lu/electricite/consultations/conspub050711/index.html 97 In Luxembourg there isn’t a definition of typical consumer, which is normally used to allow tariff comparisons. When such comparisons are done, than customer profiles of Eurostat are used.

448
Table 295: Tariff components, customers and revenues per customer class
Customer classes Tariff components Number of customers
Revenue98
Household KWh, fixed charge99 224084 54490506
Small industrial KWh, KW 57140 107759494
Large industrial KWh, KW 204
Total ‐ 281428
The breakdown of energy volumes and distribution revenue by customer category are
set out in the charts below.
Figure 62: Proportion of energy and revenue accounted by customer categories100
18%
32%
50%
Energy share
Residential Small industrial Large Industrial
34%
66%
Revenue share
Residential Industrial
98 Estimated. 99 2€/month 100 Average annual network cost is available only for residential customers. Revenue shares are estimated by REF‐E according to available data.

449
These show a larger share of costs borne by residential category of consumers, which
may be in line with costs.
Customer categories are defined as follows101:
Non metered Low Voltage Synthetic Load Profile (LV SLP)
Low voltage final customer (LV)
Final customers 20 kV
Final customers 65 kV
Final customers 220 kV
The typical network tariff in 2013 for residential, small and large industrial customers is
illustrated below102:
Table 296: Breakdown of annual charges – typical customer types, 2013 (€)
Customer type
Notional Energy usage
Fixed charges
Energy charges
Load and reactive charges
Meter Total
Residential (LV)103
3500kWh 24 210,7
‐ 30,96 265,66
Small industrial104
50MWh ‐ 250 200
1136,76 1586,86
Industrial105 24000MWh ‐ 52800 183450 1632,72 237883
The resulting average tariffs per kWh are illustrated below.
101 Those categories refer to CREOS which manages more than 90% of the distribution grid in Luxembourg. 102 REF‐E estimates on Creos tariffs as approved for the year 2013 by the NRA. 103 REF‐E Hyphotesis: LV not metered final customer. 104 REF‐E Hyphothesis: final customers 65 kV, 10 kW demand, > 3000 h/year time of use. 105 REF‐E Hyphothesis: final customers 220 kV, 5000 kW, 7000 h/year time of use.

450
Figure 63: Average network charges (€cent/kWh), 2014
An example of network tariffs applying in 2014, by CREOS DSO is available at the
following link: http://www.creos‐
net.lu/fileadmin/dokumente/creos_luxembourg/Documentation/Condition_generales/T
arif_Electricite.pdf
2. Regulation of distribution activities
2.1. General overview
The role of the DSO in Luxembourg is to operate, develop and maintain the distribution
grid, ensuring a non‐discriminatory treatment to all grid users. It has a duty to give to
grid users the information they need in order to access the grid, it is in charge of
metering activities and it ensures the supplier access to metered data.
The Institut Luxembourgeois de Régulation’s duties include overseeing and ensuring the
full functioning of the energy market, as well as a basic universal service in the interest
of consumers and ensure effective and sustainable competition by avoiding
discrimination in access for new entrants.
The distribution sector is regulated under a concession regime. A mix of “cost‐
reimbursement” and “incentive‐based” form of regulation is applied.
Key features of the regulatory regime are set out in the following table:
Table 297: Main features of the regulatory regime
Issue Approach
Type of regime (concession/licence) Concession (10 years). Tariffs take into account costs actually paid by the operator: the concession lease and other concession costs are

451
covered as an OPEX
Duration of tariff setting regime 4 years (2013‐2016)
Form of determination (distributor propose/regulator decide)
distributor propose/regulator decide
Scope for appeal regulatory decision Not available
2.2. Main incentive properties of the distribution regulatory model
The following key regulatory incentives apply for the DSOs:
Controllable OPEX are updated automatically according to a predefined rule, thus the
DSO is incentivised to reduce costs.
Investment projects that cost more than 1 million EUR are considered as planned in the
RAB during the regulatory period. Thus the DSO is incentivised to realize the project with
less costs than budgeted.
At the same time the following tools are provided to mitigate risks:
Distribution tariffs are updated every year in order to mitigate the “volume risk”;
The yearly difference between the revised maximum allowed revenue and the actual
income is put on a regulatory accounting term (RAT). If the total amount of the RAT
exceeds +‐5% of the allowed revenue, the part exceeding 5% is transferred to the
consumers via the tariffs for the next year of the regulatory period;
Investments by the distribution companies are subjected to a form of soft approval.
Every year the DSO publishes an investment plan. Although this plan is not formally
approved or assessed by the regulator, it allows the regulators to spot issues and
intervene to address them.
For tariff related quality of service regulation, at the moment not enough data has been
collected. The regulation of the quality of service is set to zero for this regulatory period.
This is going to change for the subsequent regulatory periods. For non‐tariff related
regulation there are technical standard set by the DSO and approved by the regulator.
2.3. Determination of cost of service parameters
The approach to determining key cost of service parameters are summarized in the
following table.
Table 298: Approach to key cost of service parameters
Parameter Approach
Form of price control Mixed “cost reimbursement”‐“revenue cap”
Regulatory asset base Historic or re‐evaluated cost, book value
Capital expenditure Some capital costs are subject to “cost reimbursement” and some are subject to a “revenue cap”

452
Approach to operating expenditure Non‐controllable operating costs are estimated and subject to “cost reimbursement” while controllable operating costs are subject to a “revenue cap” and updated automatically according to a predefined rule thus the DSO is incentivised to reduce costs.
Form of capital remuneration applied WACC nominal pre‐tax evaluated according to historic costs
Additional revenue items (where applicable)
Not available
The following formula is applied in determining the WACC:
DP= Debt Premium T= Tax rate G= Gearing ERP= (Equity Risk Premium) ßE= Equity Beta RFRnom =(Nominal Risk Free Rate) To determinate the WACC formula the regulator adopts the Capital Asset Price Model
(CAPM). In order to estimate the WACC parameters, the Regulator adopts a medium
term approach106 with the aim to adapt to financial market trends and to avoid volatility.
The medium term approach allows to fix a remuneration tax which parameters can be
updated every four years, unless the financial markets’ evolution require an earlier
adaptation.
No formal document is published explaining how the regulator has selected the X value.
3. Tariffs for distribution services
106 Pour la détermination des taux de rémunération des capitaux investis, l’Institut fait appel au modèle d’évaluation des actifs financiers (Medaf) communément utilisé en finance et dans le contexte des secteurs régulés en Europe. Pour l’estimation des paramètres du coût moyen pondéré du capital (WACC ou Weighted Average Cost of Capital), l’Institut adopte une attitude à moyen terme à visibilité suffisante, qui a pour objectif d’être proche des marches financiers tout en évitant une volatilité non souhaitée. L’optique moyen terme permet de fixer un taux de remuneration dont les paramètres pourraient être revus après une période de 4 ans à moins que l’évolution sur les marchés financiersb rende une adaptation préalable indispensable.

453
3.1. Distribution tariffs: additional issues
The DSO is in charge of setting the distribution tariffs (based on the allowed revenue).
Where possible costs are assigned directly to the concerned voltage level. Indirect costs
are assigned to the different voltage levels by using a key (different for each DSO). Then,
those costs are conventionally split (different for each DSO) between a per kW tariff
component (where KW represents the maximum power used by the consumer during
the year) and a kWh tariff. All, except LV SLP customers are charged a distribution tariff
including:
a per kW based on actual peak demand over the year
a per kWh charge on the actual consumption
These tariffs differ according to the time of use (< 3000 h/year, > 3000 h/year).
LV clients with a SLP only pay 2€ per month and a per kWh charge on the actual
consumption.
For residential customers, the supply has to be offered and billed as integrated retail
tariff.
Various other aspects of distribution tariff setting are summarized in the table below.
Table 299: Approach to key issues in setting distribution tariffs
Issue Approach
Treatment of distribution losses The distribution tariffs include the cost of losses
Presence of uniform tariffs Each DSO charges different tariffs but within each DSO network they are the same
Presence of non‐linear tariffs All tariff components are linear, except a 2 EUR flat monthly charge for LV SLP
Presence of regulated retail tariffs No
Presence of social tariffs No
Presence of other components The tariffs charged by DSOs includes financing of the NRA and, in the future, charging stations for electric vehicles
Distribution tariff for generators Embedded generators do not pay any distribution tariffs
3.2. Connection charges
Distribution tariffs are conventionally split between a per kW tariff component and a kWh tariff.
Connection charges are set using standard costs proposed by DSO and approved by the regulator
for small consumers. For large consumers an estimation is carried out by the DSO. DSO can
refuse connection for economic and security of supply reasons.

454
Key issues in the setting of connection charges are set out in the table below.
Table 300: Summary of key issues relating to connection charges
Issue Approach
Determination of charges
Type of charges (shallow/deep) Shallow charges for small customers, deep(er) charges for larger customers.
Methodology adopted Standard costs are proposed by the DSOs and approved by the regulator for small consumers; for larger consumers the DSO makes an estimate based on its cost
Hosting capacity Scope to refuse connection The DSO can refuse connection only if that would entail an unreasonable cost or may be dangerous for the security of supply. In case of refusal of connection, the regulator is notified and can be asked by the party seeking connection to revert the DSO's decision
Requirements to publish hosting capacity
No
Targets and/or incentive schemes to enhance hosting capacity
No
4. Distribution system development and operation
4.1. Distribution system development
The key features of distribution system planning are summarized below.
Table 301: Approach to distribution planning
Issue Approach
Form of distribution planning document
‐ Key responsibilities for its development The distribution system development plan is made by DSOs and notified to the Regulator but not approved nor published
‐ Degree of integration with renewables plan
The distribution network development plans are not (at least explicitly) connected with the renewable generation targets.
‐ Relationship with consumption trends The evolution of consumption in the distribution area is explicitly considered in the development plan based on a detailed spatial demand forecast
‐ Relationship with quality of service The plan does not explicitly illustrate the relationship
System development is decided by the DSO and the NRA is only kept informed. The
DSO can require large embedded generators to disconnect in case of grid congestion
and can directly control flexible loads. Deployment of smart meters will start soon.

455
targets between each (type of) investment and the benefits in terms of increased quality of services
‐ How trade‐offs between network development and alternative technologies are treated
The network development plan reports only the decisions of the DSOs. The analysis on which those decisions are based are not public.
‐ Requirements to integrate cost benefit analysis
The network development plan reports only the decisions of the DSOs. The analysis on which those decisions are based are not public.
4.2. Distribution system operations
The key features of distribution system operations are summarized below.
Table 302: Approach to distribution planning
Issue Approach
Requirements for dispatch of renewable plants connected to DSO network
DSOs can only require larger embedded units to disconnect in case the distribution system cannot host their injections
Possibility to dispatch flexible loads The DSOs can directly control flexible loads through remotely operated switches
Other sources of flexibility open to DSO
None
4.3. Metering
Key issues regarding metering, and the role of the DSOs, are set out in the following
table.
Table 303: Key approach to metering
Issue Approach adopted
DSOs role in metering DSOS have full responsibilities for metering and own the meters
Monopoly services in the metering DSOS are monopolists in metering activities
Smart metering functionality a) quarter‐of an hour measurement b) remote reading c) remote disconnection/reconnection of
customers d) remote control of the maximum power that
can be withdrawn e) remote operation of appliances at the
consumer's premises
f) local port to send real time consumption information to a local screens or computers

456
At the moment no smart meters are installed. The DSOs however have to start soon
with the deployment and have to prove to the Regulator that by 31st December 2018
95% of their clients have a smart meter. A breakdown by customer category is
illustrated below.
The following preliminary information on the impact of smart meter roll out is
available107
Table 304: Effects from the smart meters deployment.
DSO Total number of households
Number of households with a SM
Electricity consumption reduction
Euro saved per year for an average
household
224,084 0 1%‐5% peak consumption (theoretical)
26.5‐39.9 (theoretical)
107 Schwartz & Co. Etude économique à long terme pour la mise en place de compteurs intelligents dans les réseaux électriques et gaziers au Luxembourg, préparé pour le Ministère de l’Économie et du Commerce Extérieur du Luxembourg, 2011.

457
Country Report ‐ Luxembourg (Gas)
1. Overview of to the distribution sector
1.1. Institutional structure and responsibilities
In Luxembourg there are 3 distributors supplying gas to 84277 customers through a
1214 km2 gas distribution grid. Summary data on industry structure is set out below.
Table 305: DSO characteristics
Total number DSOs
Ownership unbundled
Legally unbundled
Less than 100000 customers
Exemption* Share of total demand
Country 3 0 1 (Creos)108 3 Yes 100 %*exemption from legal unbundling: DSO with less than 100,000 customers are subjected to accounting unbundling
The responsibility for setting distribution tariffs is spread between the following
jurisdictions (for example):
The DSO;
The NRA (Institut Luxembourgeois de Régulation, it’s an independent actor whose duties
include overseeing and ensuring the full functioning of the energy market, as well as a
basic universal service in the interest of consumers. Ensuring effective and sustainable
competition by avoiding discrimination in access for new entrants, the Institute allows
consumers to freely choose between a growing number of offers and products at fair
and competitive prices);
Government (Ministry of the Economy and Foreign Trade).
108 Rapport de l’Institut Luxembourgeois de Régulation sur ses activités et sur l’exécution de ses missions dans les secteurs de l’électricité et du gaz naturel, année 2012. Creos is also the main electricity DSO. It has more than 100000 customers in the electricity distribution sector, therefore it is subject to unbundling provisions.
The gas distribution network is less concentrated than the electricity one, with CREOS
supplying around 50% of total customers connected to the gas grid. The regulation
regime in place involves a “revenue cap” with some components subject to cost
reimbursement.

458
The breakdown of responsibilities as it related to tariff setting is summarized in the table
below.
Table 306: Legal basis for tariff structure – Roles and Responsibilities in setting distribution tariffs
Actor Allowed revenues (tariff level)
Tariffs (tariff structure)
Connection charges
Regulated services
DSO Calculates for NRA approval
NA
Government Defines main principles
NA
NRA Set rules, approves
X X NA
X = main responsibility; other options to fill the table: sets rules; monitors ex‐post; defines main principles;
calculates for NRA approval; also involved;
The regulatory process adopted to setting distribution tariffs involves the following
steps:
the Ministry of the Economy and Foreign Trade issued principles in the primary
law (Loi du 1er août 2007 relative à l’organisation du marché du gaz naturel
modified by Loi du 18 décembre 2009 and by Loi du 7 août 2012);
the Institut Luxembourgeois de Régulation regulator issued two consultation
papers and held public hearings in order to adopt a methodology for the
determination of the distribution tariffs109;
the Institut Luxembourgeois de Régulation issued a methodology through
Règlement E12/06/ILR du 22 mars 2012 fixant les méthodes de détermination
des tarifs d’utilisation des réseaux de transport, de distribution et industriels et
des services accessoires à l’utilisation des réseaux pour la période de régulation
2013 à 2016 et abrogeant le règlement E09/04/ILR du 2 février 2009;
the DSO calculates the allowed revenue;
the Institut Luxembourgeois de Régulation approves it.
1.2. Key figures on revenue and tariffs Distribution revenues in 2013 were € 33,46 million. No further split by service type is
available.
A breakdown of revenue by customer category, including information on available tariff
components and the number of customers in each category is set out in the table below.
Table 307: Tariff components, customers and revenues per customer class
Customer classes Tariff components Number of customers
Revenue
Household Nm3, KW 79157 NA
109http://www.ilr.public.lu/electricite/consultations/conspub301111/index.html;http://www.ilr.public.lu/electricite/consultations/conspub050711/index.html

459
Small industrial Nm3, KW 5024 NA
Large Industrial Nm3, KW 5 NA
Electricity producers Nm3, KW 91 NA
Total ‐ 84277
The breakdown of energy volumes by customer category are set out in the charts below.
Figure 64: Proportion of energy by customer categories
All consumers are charged a distribution tariff including two components:
a capacity related charge, based on the contractual or actual maximum yearly
withdrawal
an energy related component.
There are no classes of consumers.
The typical network tariff in 2013 for residential, small and large industrial customers is
illustrated below110:
Table 308: Breakdown of annual charges – typical customer types, 2013 (€)
Customer type
Notional Energy usage
Fixed charges
Energy charges
Meter Total
Residential
15000 kWh ‐ 111,36 37,56 148,9
Small industrial
50000 MWh 38992,6
173253,6 1554 213799,2
Industrial 90000 MWh 57185,3 308217,2 2455,6 367858,1
110 REF‐E estimates based on Creos tariffs for the year 2013 as approved by the NRA.

460
The resulting average tariffs per kWh are illustrated below111.
Figure 65: Average network charges (€cent/kWh), 2013
An example of network tariffs applied in 2014, by CREOS DSO is available at the
following link: http://www.creos‐
net.lu/fileadmin/dokumente/creos_luxembourg/Documentation/Condition_generales/T
arif_Gaz.pdf
2. Regulation of distribution activities
2.1. General overview
The role of the DSO in Luxembourg is to operate, develop and maintain the distribution
grid, ensuring a non‐discriminatory treatment to all grid users. It has a duty to give to
grid users the information they need in order to access the grid and it is in charge of
metering activities and it ensures the supplier access to metered data.
The Institut Luxembourgeois de Régulation’s duties include overseeing and ensuring the
full functioning of the energy market, as well as a basic universal service in the interest
of consumers and ensure effective and sustainable competition by avoiding
discrimination in access for new entrants.
The distribution sector is regulated under a licence regime. A mix of “cost‐
reimbursement” and “incentive‐based” form of regulation is applied.
111 Data from the NRA were only available for the meter sub‐component. All the other components were calculated as REF‐E estimates based on CREOS tariffs.
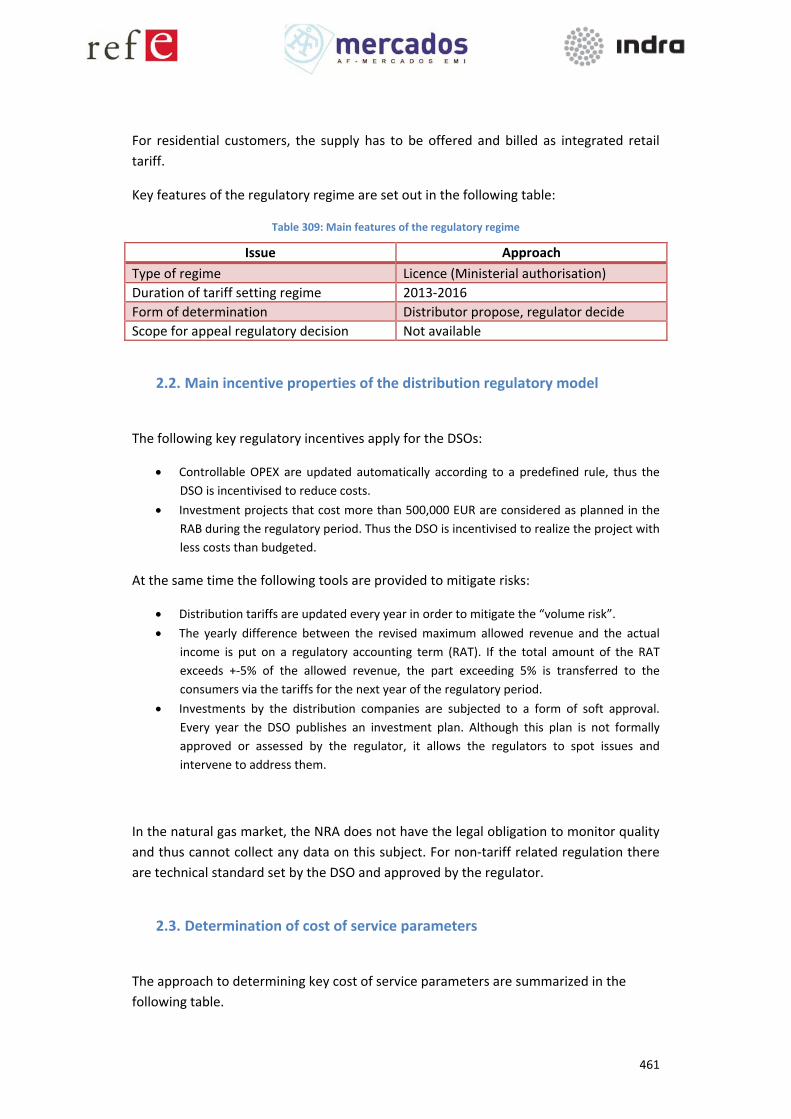
461
For residential customers, the supply has to be offered and billed as integrated retail
tariff.
Key features of the regulatory regime are set out in the following table:
Table 309: Main features of the regulatory regime
Issue Approach
Type of regime Licence (Ministerial authorisation)
Duration of tariff setting regime 2013‐2016
Form of determination Distributor propose, regulator decide
Scope for appeal regulatory decision Not available
2.2. Main incentive properties of the distribution regulatory model
The following key regulatory incentives apply for the DSOs:
Controllable OPEX are updated automatically according to a predefined rule, thus the
DSO is incentivised to reduce costs.
Investment projects that cost more than 500,000 EUR are considered as planned in the
RAB during the regulatory period. Thus the DSO is incentivised to realize the project with
less costs than budgeted.
At the same time the following tools are provided to mitigate risks:
Distribution tariffs are updated every year in order to mitigate the “volume risk”.
The yearly difference between the revised maximum allowed revenue and the actual
income is put on a regulatory accounting term (RAT). If the total amount of the RAT
exceeds +‐5% of the allowed revenue, the part exceeding 5% is transferred to the
consumers via the tariffs for the next year of the regulatory period.
Investments by the distribution companies are subjected to a form of soft approval.
Every year the DSO publishes an investment plan. Although this plan is not formally
approved or assessed by the regulator, it allows the regulators to spot issues and
intervene to address them.
In the natural gas market, the NRA does not have the legal obligation to monitor quality
and thus cannot collect any data on this subject. For non‐tariff related regulation there
are technical standard set by the DSO and approved by the regulator.
2.3. Determination of cost of service parameters
The approach to determining key cost of service parameters are summarized in the
following table.

462
Table 310: Approach to key cost of service parameters
Parameter Approach
Form of price control Mixed “cost reimbursement”‐“revenue cap”
Regulatory asset base Historic or re‐evaluated cost, book value
Capital expenditure Some capital costs are subject to “cost reimbursement” and some are subject to a “revenue cap”
Approach to operating expenditure Non‐controllable operating costs are subject to “cost reimbursement” while controllable operating costs are subject to a “revenue cap”. Controllable OPEX are updated automatically according to a predefined rule thus the DSO is incentivised to reduce costs.
Form of WACC applied WACC nominal pre‐tax evaluated according to historic costs
Additional revenue items (where applicable)
Not available
The following formula is applied in determining the WACC:
DP= Debt Premium T= Tax rate G= Gearing ERP= (Equity Risk Premium) ßE= Equity Beta RFRnom =(Nominal Risk Free Rate)
To determine the WACC formula, the regulator adopts the Capital Asset Price Model
(CAPM). In order to estimate the WACC parameters the Regulator adopts a medium
term approach112 with the aim to adapt to financial market’s trends and to avoid
volatility. The medium term approach allows to fix a remuneration tax which parameters
can be updated every four years, unless the financial markets’ evolution require an
earlier adaptation.
112 Pour la détermination des taux de rémunération des capitaux investis, l’Institut fait appel au modèle d’évaluation des actifs financiers (Medaf) communément utilisé en finance et dans le contexte des secteurs régulés en Europe. Pour l’estimation des paramètres du coût moyen pondéré du capital (WACC ou Weighted Average Cost of Capital), l’Institut adopte une attitude à moyen terme à visibilité suffisante, qui a pour objectif d’être proche des marches financiers tout en évitant une volatilité non souhaitée. L’optique moyen terme permet de fixer un taux de remuneration dont les paramètres pourraient être revus après une période de 4 ans à moins que l’évolution sur les marchés financiersb rende une adaptation préalable indispensable.

463
No formal document is published explaining how the regulator has selected the X value.
3. Tariffs for distribution services
3.1. Distribution tariffs: additional issues
The DSO is in charge of setting the distribution tariffs. Where possible costs are assigned
directly to the concerned pressure level. Indirect costs are assigned to the different
pressure levels by using a key (different for each DSO). Then, those costs are
conventionally split (different for each DSO) between a capacity (kW) tariff component
and an energy (m3) tariff component.
Various other aspects of distribution tariff setting are summarized in the table below.
Table 311: Approach to key issues in setting distribution tariffs
Issue Approach
Treatment of distribution losses The cost of losses are included in the tariff
Presence of uniform tariffs There are 3 DSOs with different tariffs
Presence of non‐linear tariffs There are different tariff blocks depending on the consumption. For one DSO (Ville de Dudelange) there are two tariffs blocks depending on the installed capacity.
Presence of other components The tariffs charged by DSOs includes financing of the NRA.
Presence of regulated retail tariffs No
Presence of social tariffs No
3.2. Connection charges
For residential installations and small LP consumers a uniform one‐off connection fee set
by the DSO applies. For larger consumers and generators connection costs are
computed case by case
Key issues in the setting of connection charges are set out in the table below.
There are 3 DSOs with different tariffs and generally for each DSO there are different
tariff blocks depending on the consumption volume.
The DSO is obliged to connect the customer only when the network is already in place.

464
Table 312: Summary of key issues relating to connection charges
Issue Approach
Determination of charges
Type of charges (shallow/deep)
Shallow charges for small consumers. Deep (er) charges for larger consumers.
Methodology adopted For residential installations and small LP consumers a uniform one‐off connection fee set by the DSO applies. For larger consumers and generators connection costs are computed case by case.
Hosting capacity Scope to refuse connection The DSO is obliged to connect the customer only when the network is already in place (no universal service obligation). The DSO can refuse connection only if that would entail an unreasonable cost or may be dangerous for the security of supply. In case of refusal of connection, the regulator is notified and can be asked by the party seeking connection to revert the DSO's decision
Requirements to publish technical capacity capacity
None
4. Distribution system development and operation
4.1. Distribution system development
The key features of distribution system planning are summarized below.
Table 313: Approach to distribution planning
Issue Approach
Form of distribution planning document
Key responsibilities for its development The distribution system development plan is made by DSOs and notified to the Regulator but not approved nor published
Degree of integration with environmental policies
Not available
Relationship with quality of service targets
The plan does not explicitly illustrate the relationship between each (type of) investment and the benefits in terms of increased quality of services
How trade‐offs between network development and alternative technologies are treated
The network development plan reports only the decisions of the DSOs. The analysis on which those decisions are based are not public.
Requirements to integrate cost benefit analysis
The network development plan reports only the decisions of the DSOs. The analysis on which those
System development is decided by the DSO and the NRA is only kept informed.
Deployment of smart meters will start soon.

465
decisions are based are not public.
4.2. Metering
Key issues regarding metering, and the role of the DSOs, are set out in the following
table.
Table 314: Key approach to metering
Issue Approach adopted
DSOs role in metering DSOa) owns the meter b) is responsible for the collection of data from the meter c) is responsible for all other data management functions (validation, storing, sending the data to parties entitled access to them ...)
Monopoly services in the metering
DSO’s are monopolists in metering activities
Smart metering functionality a) hourly measurementb) remote reading c) remote disconnection/reconnection of customers d) remote control of the maximum power that can be withdrawn e) remote operation of appliances at the consumer's premises f) local port to send real time consumption information to a local screens or computers
At the moment no smart meters are installed. The DSOs however have to start soon
with the deployment and have to prove to the regulator that by 31st December 2020
95% of their clients have a smart meter.
The following preliminary information on the impact of smart meter roll out is
available113.
Table 315: Effects from the smart meters deployment.
DSO Total number of households
Number of households with a SM
Electricity consumption reduction
Euro saved per year for an
average household
Name 79157 0 0,5%‐2% (theoretical)
70,6‐91,8 (theoretical)
113 Schwartz & Co. Etude économique à long terme pour la mise en place de compteurs intelligents dans les réseaux électriques et gaziers au Luxembourg, préparé pour le Ministère de l’Économie et du Commerce Extérieur du Luxembourg, 2011.

466
Country Report – Malta (electricity distribution)
1. Overview of to the distribution sector
1.1. Institutional structure and responsibilities
In Malta there is just one Distributor, Enemalta PLC. They are supplying electricity to
285214 customers covering the whole country. In 2012, the total amount of electricity
generated in the country was 2,291TWh, 99%, 2,268TWh, from fossil fuel coming from
the two power stations owned by Enemalta PLC, and the rest produced from renewable
energy sources estimated at 0,0225TWh.
Summary data on industry structure is set out below.
Table 316: DSO characteristics
Total number DSOs
Ownership unbundled
Legally unbundled
Less than 100000 customers
Exemption Share of total demand
Malta 1 Not applicable
Not applicable114
0 NO 100%
The responsibility for setting distribution tariffs is spread between the following
jurisdictions:
114ByvirtueofArticle44‐Derogations,therequirementsofArticle9(Unbundlingofthetransmissionsystemsandtransmissionsystemoperator)andArticle26(Unbundlingofdistributionsystemoperators)donotapplytoMalta.
In Malta, the electricity distribution sector is completely concentrated in just one DSO,
Enemalta PLC, mostly owned by the state, which is also the main producer of electricity
(except for small RES) and is the only licensed supplier to final customers.
There are no transmission systems and no transmission system operators.
The sector is fully regulated: All customers of electricity are on a regulated retail tariff.
In view of the fact that there is only one supplier of electricity it is not possible to
implement customer switching.
The regulator, the Malta Resources Authority (MRA), approves the tariffs proposed by
the DSO.

467
The DSO, Enemalta, proposes the methodologies to use in the tariffs valuation and
calculates tariffs
The Regulator, the Malta Resources Authority (MRA), has the duty and the authority to fix or approve tariffs or methodologies used to calculate or establish the terms and conditions for connection and access to the distribution system. The regulator may also require the DSO to change the tariffs or methodologies used for determining the distribution tariffs to ensure that these are proportional and non‐discriminatory.
The Ministry issues principles in the primary law and publishes the applicable tariffs and methodologies in the Electricity Supply Regulations (S.L.423.01).
The breakdown of responsibilities as it related to tariff setting is summarized in the table
below.
Table 317: Legal basis for tariff structure – Roles and Responsibilities in setting distribution tariffs
Actor Allowed revenues (tariff level)
Tariffs (tariff structure)
Connection charges
Regulated services
DSO Calculates for NRA approval
Calculates for NRA approval
Calculates for NRA approval
NA
Government Issues principles in primary law
Consulted by Regulator
Consulted by Regulator
NA
NRA Approves Approves Approves NA X = main responsibility; other options to fill the table: sets rules; monitors ex‐post; defines main principles;
calculates for NRA approval; also involved;
The regulatory process implemented to set distribution tariffs involves the following
steps:
The Ministry issues principles in the primary law. The DSO calculates the allowed
revenue and the regulator approves it.
The DSO proposes the tariff structure. The regulator approves it after consultation with
stakeholders, including ministries
1.2. Key figures on revenue and tariffs
The Distribution revenues in 2013 separate from other revenues are not available. No
further split by service type is available. Total distribution network cost was 29003000€
in 2013.
A breakdown of the total revenue by customer category, including information on
available tariff components and the number of customers in each category is set out in
the table below.

468
Table 318: Tariff components, customers and revenues per customer class for 2013
Customer classes
Tariff components Number of customers
Revenue115
Primary residence
Fixed Charge + Energy charge €c/ kWh tariff
structure based on consumption level +
€/kW maximum demand charge for connection services rated
above 60A/phase
148173 71270176,86
Domestic premises
Fixed Charge + Energy charge €/kWh tariff
structure based on consumption level +
€/kW maximum demand charge for connection services rated
above 60A/phase
85820 43240877,29
Non‐residential premises
Fixed Charge + Energy charge €/ kWh tariff
structure based on consumption level +
€/kW maximum demand charge for connection services rated
above 60A/phase
51221 215563088,12
Total ‐ 285214 330074142,27
The breakdown of energy volumes and total116 revenue by customer category are set out
in the charts below.
115 Total revenues including energy and distribution and supply charges. Total distribution network cost was 29003000 €. Split by customer class is not available. 116 Energy and distribution and supply costs

469
Figure 66: Proportion of energy and revenue accounted by customer categories
Customer categories differentiate between Primary residences, Domestic and Non‐residential, which are defined as follows:
Primary Residences (Residential) – Electricity consumed in premises intended for
domestic use and which are registered as a primary residence.
Domestic ‐ The domestic tariffs are applicable for electricity consumed in premises
intended for domestic use and which are not registered as a primary residence.
Non‐Residential: The non‐residential tariffs are applicable for electricity consumed in all
the other premises which are not registered either as a primary residence or as
domestic premises.
All consumers of electricity are on regulated retail tariffs which consist mainly of a kWh rate and a fixed annual service charge. In addition, consumers with a service connection capacity exceeding 60Amps/phase have to pay a maximum demand tariff.

470
The tariff structure provides the possibility for households to benefit from a percentage eco reduction on their electricity consumption bill on one registered primary residence as follows:
Households composed of two or more persons may benefit from a two tier eco reduction mechanism provided that the consumption per person does not exceed 1750kWh per annum. A reduction of 25% in the consumption bill is possible if the consumption does not exceed 1000kWh per person for the first tier. The second tier consists of a reduction of 15% in the bill on the next 750 kWh per person/household.
Single person households enjoy a reduction of 25% in their consumption bill if their annual electricity consumption does not exceed the 2000kWh/annum.
The kWh tariff structure consists of a number of tiers of consumption bands with the corresponding kWh tariff.The typical network tariff in 2013 for residential, small and large industrial customers is illustrated below:
Table 319: Breakdown of average annual network charges – typical customer types, 2013 (€)
Customer type
Notional Energy usage
Network cost117
Total
Households 3.500 kWh 77 € (0,022€/kWh)
77 € (0,022€/kWh)
Small Industrial
50 MWh 1100 € (0,022€/kWh)
1100 € (0,022€/kWh)
Large Industrial
24000 MWh 528000 € (0,022€/kWh)
528000 € (0,022€/kWh)
Table 320: the retail tariffs118 applied in 2013 to final customers in Malta
Customer Type
Fixed Charges
Service
charge/annum
Energy Charges Maximum Demand
(connection capacity >
60Amps/phase)
Bands Cumulative consumption (kWh)
Consumption Tariff Incl. 5% VAT119 (€)
Primary Residence
Single Phase (SP) ‐ € 65,00 Triple Phase (3P) ‐ € 195,00
Band 1 0‐20000,161
MD‐€21,05/kW/annum for service capacity
>60A/phase
Band 2 2001‐60000,173
Band 3 6001‐100000,189
Band 4 10001‐20000 0,36
Band 5 >20000 0,62
117 This is an overall average per kWh of all network cost charges‐fixed and €/kWh components 118 The retail tariffs cover the generation, distribution and supply costs 119 Tariffs for primary residence and domestic premises include 5% VAT. Non‐residential tariffs are exclusive of VAT.

471
Domestic premises
SP ‐ €65,00 3P ‐ €195,00
Band 1 0‐2000 0,21MD‐
€21,05/kW/annu
m for service
capacity
>60A/phase
Band 2 2001‐6000 0,223
Band 3 6001‐10000 0,238
Band 4 10001‐20000 0,44
Band 5 >20000 0,7
Non‐Residential (kWh)120
SP ‐ € 120,00 3P ‐ € 360,00
Band 1 0‐2000 0,162 MD ‐
€20,50/kW/annu
m
consumption >
5000 MWh /year
– MD charge‐
€17,20/kW/annu
m
Band 2 2001‐6000 0,170
Band 3 6001‐10000 0,183
Band 4 10001‐20000 0,198
Band 5 20001‐60000 0,215
Band 6 600001‐100000 0,200
Band 7 1000001‐1000000 0,187
Band 8 1000001‐5000000 0,170
Band 9 >5000000 0,144
Non‐Residential (kVAh)121
SP ‐ € 120,00 3P ‐ € 360,00
Band 1 0‐2000 0,149 MD ‐
€19,20/kVA/annu
m
consumption >
5500 MVAh
/year: MD‐
€17,20/kVA/annu
m
Band 2 2001‐6000 0,156
Band 3 6001‐10000 0,168
Band 4 10001‐20000 0,182
Band 5 20001‐60000 0,198
Band 6 600001‐100000 0,184
Band 7 1000001‐1000000 0,172
Band 8 1000001‐5000000 0,156
Band 9 >5000000 0,132
The resulting average tariffs per kWh are illustrated below.
120 Non‐residential consumers with consumption exceeding 5GWh may choose to be billed on a night and day tariff. 121 Non‐residential consumers with consumption exceeding 5,5GVAh may choose to be billed on a night and day tariff.

472
Figure 67: Average network charges (€/kWh), 2013
2. Regulation of distribution activities
2.1. General overview
Enemalta PLC 122is a vertically integrated public liability company licensed to perform the
activities of generation, distribution system operator and supply of electricity to final
customers. Malta was granted derogation from the requirements of Article 26 of
Directive 2009/72EC (unbundling of distribution system operators), and unbundling is
required at management accounts level only.
As the DSO, Enemalta PLC has the following tasks and responsibilities assigned by law:
Ensuring the long‐term ability of the system to meet reasonable demands for the distribution of electricity, for operating, maintaining and developing under economic
122 Enemalta Corporation became Enemalta PLC as from the 27th August, 2014.
The distribution sector is regulated under a cost reimbursement regulatory model.
This model has neither incentive based‐elements, nor risk mitigation methods or
systems of financial compensation/penalties in terms of quality service implemented.
There is no defined tariff revision timetable. In addition no ex post assessment of
“usefulness” is carried out.
The regulator focus on the cost estimates provided by the DSO based on the
assumptions that the DSO will have to satisfy all the reasonable demands for service,
in order to fix and approve the distribution tariffs.

473
conditions a secure, reliable and efficient electricity distribution system so as to ensure continuity of electricity supplies in Malta with due regard for the environment and energy efficiency. In any event, it must not discriminate between system users or classes of system users.
Providing system users with the information they need for efficient access to, including use of the system.
When dispatching generating installations, giving priority to generating installations using renewable energy sources or waste or producing combined heat and power.
Procuring the energy it uses to cover energy losses and reserve capacity in its system according to transparent, non‐discriminatory and market based procedures.
Dispatching generation plant and balancing the distribution system.
Ensuring the availability of any necessary ancillary services, as prescribed by the Authority:
o Rules for scheduling and criteria for dispatching that take into account contractual obligations;
o Rules for balancing the electricity distribution system and for the charging of system users of their networks for energy imbalance and balancing services. Terms and conditions, including rules and tariffs, for the provision of such services shall be cost reflective:
When planning the development of the distribution network, considering energy efficiency or demand‐side management measures or distributed generation that might supplant the need to upgrade or replace electricity capacity. Demand‐side management may include real‐time management technologies such as advanced metering systems.
When planning interconnections with other systems, giving special consideration to the specific geographical situation of Malta, the need to maintain a reasonable balance between the costs of building new interconnectors and the benefit to final customers of such interconnection, and if appropriate, ensuring that existing interconnectors are used as efficiently as possible.
Setting and meeting quality of supply and network security performance objectives. The performance objectives shall be objective, transparent and non‐discriminatory and be published: Provided that such performance objectives shall be subject to the approval and monitoring of the Authority.
Taking into account the impact of any measure on the cost of electricity to final customers, before its adoption.
The role of the MRA, as the regulator, has the following duties, established by law:
o Approving, in accordance with transparent criteria, electricity generation, distribution
and supply tariffs or their methodologies;
o Approving, in accordance with transparent criteria, the tariffs for the purchase of
electricity by Enemalta where appropriate;
o Ensuring compliance of the distribution system operator, with their obligations under
the regulations, other relevant legislation and Community legislation, including as
regards cross‐border issues;
o Cooperating in regard to cross‐border issues with the regulatory authority or authorities
of the Member States concerned and with the Agency;
o Complying with, and implementing, any relevant legally binding decisions of the Agency
and of the Commission;
o Reporting annually on its activity and the fulfilment of its duties to the relevant
authorities, the Agency and the Commission.
o Ensuring that there are no cross‐subsidies between generation, distribution, supply and
other activities;

474
o Monitoring the DSO investment plans, and providing in its annual report an assessment
of them, including recommendations to amend them;
o Monitoring compliance with and reviewing the past performance of network security
and reliability rules and setting or approving standards and requirements for quality of
service and supply or contributing thereto together with other competent authorities;
o Monitoring the level of transparency and ensuring compliance of electricity undertakings
with transparency obligations;
o Monitoring the time taken by the DSO to make connections and repairs;
o Helping to ensure, together with other relevant authorities, that the consumer
protection measures are effective and enforced;
o Ensuring access to customer consumption data;
o Monitoring the implementation of rules relating to the roles and responsibilities of the
DSO, suppliers and customers and other market parties;
o Monitoring investment in generation capacities in relation to security of supply;
o Monitoring technical cooperation between Community and third‐country transmission
system operators;
o Monitoring the implementation of safeguards measures;
o Contributing to the compatibility of data exchange processes for the most important
market processes at regional level.
According to this, the distribution sector is regulated under a cost reimbursement
regulatory model, where the DSO estimates the actual distribution costs, according to
the approved methodologies, and the regulator fixes and approves the final tariffs.
There’s no a defined revision tariff timetable.
Key features of the regulatory regime are set out in the following table
Table 321: Main features of the regulatory regime
Issue Approach
Type of regime (concession/licence) Licence
Duration of tariff setting regime Not fixed
Form of determination (distributor propose/regulator decide)
Distributor proposes/regulator approves
Scope for appeal regulatory decision All decisions taken by the regulator may be appealed with the Administrative Review Tribunal
2.2. Main incentive properties of the distribution regulatory model
The system does not include regulatory incentives nor risk mitigation tools.
The key components of quality are described under the network code which provides
technical standards for the use of the network and voltage regulation (incident
management, operating planning, required information...). There is no interaction
between the quality of service regulation and the tariff system, no system of financial
compensation/penalties is implemented.

475
2.3. Determination of cost of service parameters
The approach to determining key cost of service parameters are summarized in the
following table.
Table 322: Approach to key cost of service parameters
Parameter Approach
Form of price control Regulatory Part of regulated retail tariff.
Regulatory asset base Full cost recovery method. No components which do not correspond to distribution included in tariffs
Capital expenditure SPV rentals, maximizing of return on owned properties, increasing efficiency and productivity
Approach to operating expenditure Adequate maintenance, depreciation, interest payments on borrowings, and other interest payments, to create reserves
Form of WACC applied NA Working capital management plan earmarked at reducing collection periods
Additional revenue items (where applicable)
Government compensation for street lighting, eco‐reduction expense and feed‐in tariffs expense , Moving to cheaper and cleaner energy solution (new independent power producers, conversion to natural gas, electricity interconnection with Italy(Sicily), closure of old steam plants), long term purchase agreements, increasing efficiency...
The full cost recovery method assumes the total variable retail tariffs should be equal to
the sum of.
Energy costs
Wages
Overheads
Return on capital
After making appropriate deductions and/or add backs in respect of:
Government subventions
Fixed income charges
Other services revenue

476
3. Tariffs for distribution services
3.1. Distribution tariffs The cost allocation is a discretionary choice by the DSO as part of the overall tariff
setting.
Various other aspects of distribution tariff setting are summarized in the table below.
Table 323: Approach to key issues in setting distribution tariffs
Issue Approach
Treatment of distribution losses Retail tariffs cover distribution losses
Presence of uniform tariffs Geographical tariffs are uniform
Presence of non‐linear tariffs Yes
Presence of regulated retail tariffs Yes (All end user tariffs are regulated)
Presence of social tariffs No. Although presence of energy vouchers
The three consumer classes described in section 1.2 herein are charged a retail tariff
that covers also the distribution costs. The retail tariff is composed of
a) A fixed charge per annum
b) Tiered €c/ kWh tariff structure based on consumption level
c) €/kW maximum demand charge for connection services rated above 60A/phase
3.2. Connection charges
Key issues in the setting of connection charges are set out in the table below.
Table 324: Summary of key issues relating to connection charges
Issue Approach
Determination of charges
Type of charges (shallow/deep) For connection ratings above 60A charges are deep the consumers and generators pay for the infrastructure up to the most suitable point of connection
Methodology adopted For connections above 60A/phase the DSO makes an estimate based on its cost but the client is free to
The distribution tariffs are part of the regulated retail tariff:
o The retail tariff paid by consumers for electricity covers the costs and revenues
pertaining to the operation of the distribution network apart from those related to
the generation and supply activities.
o It applies the full cost recovery method in retail tariff.

477
procure the necessary works from a different source. An applicant who does not agree with the connection fee charged by the DSO can submit the complaint to the regulator and the regulator can issue decisions which are binding subject to appeal with the Administrative Review Tribunal
Hosting capacity Scope to refuse connection Household consumers and small non household consumers are protected by the universal service obligation. For consumers and generators the DSO can refuse connection only if that would entail unreasonable costs. In case of refusal of connection, the regulator is notified and can be asked by the party seeking connection to revert the DSO’s decision.
Requirements to publish hosting capacity
There is no obligation required to the DSO to publish the hosting capacity of its network.
Targets and/or incentive schemes to enhance hosting capacity
There is no such incentive system.
4. Distribution system development and operation
4.1. Distribution system development
The key features of distribution system planning are summarized below.
Table 325: Approach to distribution planning
Issue Approach
Form of distribution planning document Distribution system development plan notified to the regulator but not approved nor published
‐ Key responsibilities for its development NA
‐ Degree of integration with renewables plan
Takes into account RES plans on a site by site basis, and generically overall RES targets
‐ Relationship with consumption trends It considers major developments foreseen during the next 5 years
‐ Relationship with quality of service targets
Limited relationship with QoS and network plans
‐ How trade‐offs between network development and alternative technologies are treated
Smart metering technology is currently being implemented and is taken into account in the network plan, but no further consideration is given to smart grid technology
‐ Requirements to integrate cost benefit analysis
No cost benefit analysis is used to select the investments in the network development

478
4.2. Distribution system operations
The key features of distribution system operations are summarized below.
Table 326: Approach to distribution planning
Issue Approach
Requirements for dispatch of renewable plants connected to DSO network
Smaller embedded generators are not dispatched. Larger embedded generators � 5MW are subject to dispatch by the DSO
Possibility to dispatch flexible loads No possibility to dispatch flexible loads
Other sources of flexibility open to DSO NA
4.3. Metering
Key issues regarding metering, and the role of the DSOs, are set out in the following
table.
Table 327: Key approach to metering
Issue Approach adopted
Discos role in metering Full responsibility for metering, and own the meters
Monopoly services in the metering Yes
Smart metering functionality Yes.
As of 2013 there were 236248 smart meters installed in Malta, whose main features
were:
o Quarter‐of an hour measurement
o Remote reading
o Remote disconnection/reconnection of customers
o Remote control of the maximum power that can be withdrawn
A breakdown by customer category is illustrated below.
Table 328: Number of smart meters installed and remote billing functional by consumer category – by end of 2013
Customer category Number
Residential 73257
Domestic 32310
Non‐Residential 11816
Total 117383
The number of smart meters installed does not correspond exactly to the number of consumers with smart meters because consumers with an RES generator are normally provided with two smart meters: A generator meter and import/export meter. The information on the impact of smart meter roll out is not available.

479
Country Report – The Netherlands (electricity distribution)
1. Overview of to the distribution sector
1.1. Institutional structure and responsibilities In the Netherlands there are 8 distributors supplying electricity to around 8 million
customers covering an area of 337.000 km2. Summary data on industry structure is set
out below.
Table 329: DSO characteristics
Total number DSOs
Ownership unbundled
Legally unbundled
Less than 100,000 customers
Exemption* Share of total demand
Country 8 Yes Yes 3 Yes Generators (Decentralised or larger centralised units) do not pay any transport/distribution tariff.
Unknown
*exemption from distribution network charges for certain types of grid users, such as low‐carbon generation connected to distribution networks.
The breakdown of responsibilities as it related to tariff setting is summarized in the table
below.
Table 330: Legal basis for tariff structure – Roles and Responsibilities in setting distribution tariffs
Actor Allowed revenues (tariff level)
Tariffs (tariff structure)
Connection charges
DSO Proposes tariff levels Proposes tariffs (and allocations of total income) to the NRA
Proposes charges (to the regulator for approval)
Government Not involved Sets the principal of the tariff structure
Not involved
DSOs in the Netherlands are required to be both ownership‐unbundled and legally‐
unbundled.
The regulator is responsible for deciding on the final allowed revenues, tariff
structures and connection charges.

480
NRA Sets allowed revenues
Makes final decision on proposed tariffs
Sets charges
X = main responsibility; other options to fill the table: sets rules; monitors ex‐post; defines main principles;
calculates for NRA approval; also involved;
The responsibility for setting distribution tariffs is as follows. The principle of the tariff
structure is set by the minister of Economic Affairs (the Government). The tariff
principles are then further detailed by the NRA in a ‘tariff code’ based on a proposal by
the joint network operators, and in consultation with representatives of energy market
players.
The DSO proposes the value of tariffs and the allocation of the total income. These final
values and allocations are set by the NRA.
1.2. Key figures on revenue and tariffs Distribution revenues in the Netherlands in 2013 were € 3210 million, broken down by
the following activities:
Distribution and connection – € 3000 million (93,5%)
Metering (only small customers) – € 210 million (6,5%)
A breakdown of revenue by customer category, including information on available tariff
components is set out in the table below.
Table 331: Tariff components, customers and revenues per customer class
Customer classes Tariff components Number of customers
Revenue Millions (€)
Household KWh; kW 7500000 1612,500
Small industrial KWh; kW 46000 83
Large industrial KWh; kW 24000 510
Total ‐ 7570000 2205,500
The breakdown of energy volumes and distribution revenue by customer category are
set out in the charts below.

481
Figure 68: Proportion of energy and revenue accounted by customer categories
These show a disproportionate share of costs borne by residential consumers, and to a
lesser extent by commercial consumers. Industrial consumers provide a lower
proportion of total revenues than might be expected based on their energy
consumption.
Customer categories are defined as follows:
Residential – typically defined as having a 3*25A connection and using 3750 kWh a year.
However, the actual average usage has shifted (the average is now about 3500 kWh).
Small industrial – with the assumption of 50 kVA, would fall in the category of 3*63A to
3*80A
Large industrial – with the assumption of 4000 kVA, would fall in the (high end) category
for Medium Voltage – Transport or Medium Voltage – Distribution category in the
Netherlands
The typical network tariff in 2013 for residential, small and large industrial customers is
illustrated below:

482
Table 332: Breakdown of annual charges – typical customer types, 2013 (€)
Customer type
Notional Energy usage
Fixed charges Energy charges Total
Residential 3500kWh 215 215
Small commercial
50MWh 55 1762 1807
Industrial 24000MWh 113441 125000 238441
The resulting average tariffs per kWh are illustrated below.
Figure 69: Average network charges (€cents/kWh), 2013
2. Regulation of distribution activities
2.1. General overview
The distribution sector is regulated under a regime which focuses on output and total
cost, and which is incentive‐based.
The minor exception to the above‐described regulatory regime is with regard to the
costs of DSOs that are cost‐reimbursed (that is, payments to other DSOs/TSOs and local
taxes).
Another regulatory regime exception is in place for metering. For metering for small
users there is a yearly CPI indexation on the 2005 metering tariffs. At the current time,
the Dutch Competition Authority monitors the margin of the metering tariffs above the
metering costs. The cumulative margin will be used to cover the costs of deploying
smart meters.
The tariff‐setting regime lasts for 3 years, and the regime focuses on total costs and
outputs. DSOs propose the tariff levels and the regulator makes a final decision on

483
The broad regulatory model is output‐based. The output of the DSOs is based on the
capacity/volume of the consumers connected, the electricity generation above demand
per connection and the quality of service (frequency and duration of disruptions).
The basis of the income of the DSOs is set in regulatory periods through the x‐factor and
q‐factor decisions, but can be adjusted in yearly tariff decisions.
Key features of the regulatory regime are set out in the following table
Table 333: Main features of the regulatory regime
Issue Approach
Type of regime (concession/licence) No concessions
Duration of tariff setting regime 3 years
Form of determination (distributor propose/regulator decide)
The DSO submits a proposal. The regulator sets the final tariffs.
Scope for appeal regulatory decision DSOs can appeal against any decisions related to tariff methodology, x‐ and q‐ factor decisions, and tariff decisions.
2.2. Main incentive properties of the distribution regulatory model
The broad regulatory model is output based. The output of the DSOs is based on the
capacity/volume of the consumers connected, the electricity generation above demand
per connection and the quality of service (frequency and duration of disruptions).
The basis of the income of the DSOs is set in regulatory periods through the x‐factor and
q‐factor decisions, but can be adjusted in yearly tariff decisions.
A quality of service measure is in effect, which has the following characteristics:
Technical standards are set in codes.
The regulator reports quality of services performances annually.
Quality of services interacts with the income of DSOs through the quality factor in the
regulation method (the Q‐factor).
At the same time the following tools are provided to mitigate risks:
Profit sharing. The regulator has the choice to apply a gradual shift or an instant shift in
tariffs from the previous regulatory period. That is, whilst a gradual and phased (multi‐
year) realignment towards efficient costs can be used, realignment towards efficient
costs can also be done in one step (i.e. directly within one year) by the NRA. For the
electricity DSOs the regulator applied an instant shift in the current period (2014‐2016).
Volume risk. Although the volume risk falls entirely on the DSOs, the largest part of a
DSO´s revenues come from “per KW” tariff components (i.e. from rates based on
capacity). The capacity tariff is applied to all connections ≤ 3*80A. Also, on bigger
connections revenues are mainly or totally based on capacity. This contributes to
reducing the volume risk.

484
Intervention in the tariffs, by the regulator. The regulator can adjust the yearly tariffs
during a regulatory period when realisations differ from expectations, when incorrect or
incomplete information is used and when certain activities are no longer performed.
Key components of quality of service regulation include that technical standards are set
in codes. The regulator reports quality of services performances annually. Quality of
services interacts with the income of DSOs through the quality factor in the regulatory
regime. There is a yardstick on quality of supply in place for electricity DSOs. This is
based on the frequency and duration of the disruption and valuation of consumers. The
performance of the DSO compared to the average performance leads to a bonus or a
malus on the DSO´s income (q‐factor).
2.3. Determination of cost of service parameters
The approach to determining key cost of service parameters are summarized in the
following table.
Table 334: Approach to key cost of service parameters
Parameter Approach
Form of price control Output‐based with cap, also includes incentives
Regulatory asset base RAB is based on historic investments; new investments added annually and depreciation is subtracted. Adjusted for inflation. Allowed revenues are based on realised investments (use of yardstick/output regulation).
Capital expenditure Totex approach used. DSO decides on Capex – Opex split.
Approach to operating expenditure Totex approach used. DSO decides on Capex – Opex split.
Form of WACC applied WACC with corporate tax rate included
The following formula is applied in determining the WACC:
e
De
E
t
t
ED
DK
ED
E
t
KWACC
1
1
1
Where:
KE = rf + β MRP is the cost of equity
MRP is the Market Risk Premium
KD is the cost of debt
t is the debt tax shield
te is the corporate tax rate

485
3. Tariffs for distribution services
3.1. Distribution tariffs
DSOs are obliged to propose cost‐reflective tariffs. Requirements are placed in tariff
codes. Among the requirements are:
Allocations of costs to transport or connection;
(Fixed) administrative or transport dependent costs;
Grid voltage level;
Cost put through from other grid levels (based on capacity demanded from each grid
level).
There are several types of customers, depending mostly on voltage level and the
presence of a transformer. Also, there is a differentiation for certain electricity demand
profiles. Tariffs are differentiated in a fixed annual fee for (mostly) administrative costs
and tariffs for transport‐related costs. The tariffs of transport‐related costs are based,
depending on voltage level, on:
contracted kW;
peak kW;
kWh (at MV; households do not pay an energy‐related tariff component); and
kVArh.
For small consumers (≤ 3*80A) there is a capacity tariff based on their connection
capacity.
There is also a separate nationally‐uniform metering tariff in application for all
customers except for large industrial (>3*80A) customers (for which the market for
metering is liberalised).
Tariffs are set per DSO. Each same type of customer is charged a similar tariff (non‐
discrimination). Tariff components are linear within groups / categories.
There is no differentiation of the tariff components according to time of use. However,
there is a differentiation (that is, lower tariffs) for large customers (on HV) who have:
(1) A small peak and nearly no usage in the rest of the year, or
(2) Use their maximum capacity nearly all the time during the year.
Distribution costs for decentralised (embedded) generation are covered in tariffs
which are paid by end‐users
Tariffs vary by DSO, and also vary depending on the voltage level
Connection charges are shallow in nature, and standard connection fees are generally
used (which have been approved by the regulator)

486
Distribution costs for decentralised (embedded) generation are covered in tariffs which
are paid by end‐users. Generators (that is, decentralised or larger centralised units) do
not pay any transport or distribution tariff.
Various other aspects of distribution tariff setting are summarized in the table below.
Table 335: Approach to key issues in setting distribution tariffs
Issue Approach
Treatment of distribution losses Included in tariffs
Presence of uniform tariffs The metering tariff is nationally‐uniform, except for large industrial (>3*80A) customers (for which the market for metering is liberalised)
Presence of non‐linear tariffs No
Presence of regulated retail tariffs No, regulation of retail tariffs was discontinued in 2004
Presence of social tariffs No
3.2. Connection charges
Key issues in the setting of connection charges are set out in the table below.
Table 336: Summary of key issues relating to connection charges
Issue Approach
Determination of charges
Type of charges (shallow/deep) Uniform connection fees are used, except in the case of special connections. Charges are shallow in nature.
Methodology adopted Cost‐reflective standard fees (for connection charges) are proposed by the DSOs and set by the regulator.
Hosting capacity Scope to refuse connection DSOs are generally not permitted to refuse connections
Requirements to publish hosting capacity
The DSO is required to publish the hosting capacity of its network. This encompasses bottlenecks of capacity in the grid and grid expansion plans.
Targets and/or incentive schemes to enhance hosting capacity
None
Regarding connection charges, only shallow charges are in effect for consumers and
embedded generators. It is forbidden by law to have individual customers directly‐
compensate deep investments (other than the distribution tariffs).
For all connections up to 1 MVA and standard connections up to 10 MVA uniform
connection fees apply. For special connections up to 10 MVA and connections larger

487
than 10 MVA connection costs are computed case by case. Above 10 MVA a customer
can have the connection be created and maintained by a third party instead of the DSO.
There exists an initial fee for the creation of the connection and a periodical fee for
maintaining the connection. For long connections (>25m) a fee per meter is also applied.
The uniform fees are fees per DSO. The uniform tariffs can differ for each DSO.
In determining the connection costs, the standard fees (which are proposed by the DSO
and set by the regulator) should be cost‐reflective.
The connections based on a case‐by‐case calculation have minimum requirements set in
the tariff codes.
Customers have the opportunity to start a legal procedure against the DSO in the case of
a conflict over the tariffs. The regulator will primarily deal with the conflict. After a
decision of the regulator in the conflict, parties have an additional possibility to go to
court.
DSOs are not allowed to refuse connections of consumers and generators.
The DSO is required to publish quality and capacity documents concerning the hosting
capacity of their network. This encompasses bottlenecks of capacity in the grid and grid
expansion plans. This information is public. It is custom (not binding) that the DSO
presents location‐specific plans upon connection requests.
Availability of capacity is not a criterion for the connection tariff calculation for
connections up to 10 MV. In the case of a dispute, the regulator can demand the
locational plans. In general the DSO is obliged to have sufficient capacity on the network
and the regulatory also has a duty to connect all the renewable capacity that applies for
connection.
4. Distribution system development and operation
Each DSO must publish a distribution planning document every two years.
All renewable plants self‐dispatch; DSOs do not intervene in the dispatching process.
DSOs have full responsibility for managing and owning the meters, for small
customers. Suppliers are responsible for the collection and validation of the data.
There are currently 600.000 smart meters installed in small customers´ homes in the
Netherlands. The total amount of small customers is about 7.5 million, and there are
targets in effect to have all small customers´ homes supplied with a smart meter by
2020.

488
4.1. Distribution system development
The key features of distribution system planning are summarized below.
Table 337: Approach to distribution planning
Issue Approach
Form of distribution planning document DSOs are obliged to compose a biennial Quality‐ and Capacity Report, equivalent to a distribution system planning document. The document describes all assets of network operators, and based on demand and generation prognoses, the required and planned investments.
‐ Key responsibilities for its development DSOs are required to develop the document
‐ Degree of integration with renewables plan
There is a national target for renewable production. The target does not include specific details on the locations of projects, hence the target doesn´t directly influence network development plans. The link between the two plans can be made in case the Government grants a sitting permit, e.g. for a windfarm. The DSO in this region then includes this input in its generation and demand forecasts and adapts its network development plan accordingly.
‐ Relationship with consumption trends The DSO includes consumption as an input in its generation and demand prognoses and adapts its network development plan accordingly. The input may come from various sources, e.g. proclaimed connection requests, and (amendments to) zoning plans for municipalities, provinces or states.
‐ Relationship with quality of service targets
Quality of service targets are explicitly taken as an input in the distribution development plan and, where relevant, the plan illustrates the relation between the investments and the quality objectives in the distribution area
‐ How trade‐offs between network development and alternative technologies are treated
As the regulatory regime is output‐ and total‐costs based an incentive is created for DSOs to invest and operate their networks as efficiently as possible. Where smart grids lead to a total cost decrease, the DSOs are incentivised to deploy them.
‐ Requirements to integrate cost benefit analysis
The results of the cost‐benefit analyses used to select the network development investments and technologies, reported in the network development plan. In particular, the network development plans of the DSOs contain concrete examples of large investment projects to illustrate the cost‐benefit analyses done by the DSO when deciding on investments. The examples contain only an overview of the analysis and are publicly available.
4.2. Distribution system operations
The key features of distribution system operations are summarized below.

489
Table 338: Approach to distribution planning
Issue Approach
Requirements for dispatch of renewable plants connected to DSO network
Renewable plants self‐dispatch;
Possibility to dispatch flexible loads There are some early‐stage pilot projects in effect in which DSOs test the capabilities of storage options / technologies.
Other sources of flexibility open to DSO Demand response and flexibility provided by decentralised generation.
In the Netherlands, an arrangement of generators´ self‐dispatching is in effect. DSOs do
not dispatch generation.
With regards to whether DSOs have access to other sources of flexibility/regulation like
batteries, capacitors, there are some small pilot studies where DSOs test the capabilities
of storage.
4.3. Metering
Key issues regarding metering, and the role of the DSOs, are set out in the following
table.
Table 339: Key approach to metering
Issue Approach adopted
Discos role in metering Full responsibility for managing and owning meters for small customers.
Monopoly services in the metering DSOs are monopolists for managing and owning meters for small customers. Larger customers can procure metering services on the market.
Smart metering functionality Quarter of an hour measurement Remote reading Local port to send real‐time consumption information to local computer screens or computers.
DSOs have full responsibility for managing and owning the meters of small customers.
Suppliers are responsible for the collection and validation of the data.
Plans have been approved to start the broad deployment of smart meters for small
customers. In 2020 all small customers should have a smart meter. The smart meter can
be refused; however, in pilot studies less than 2% of the customers refused a smart
meter.
As of 2013 there were 600.000 smart meters installed in the Netherlands. Smart meters
were distributed according to postal code, and hence the proportions of smart meters
installed in each customer category is likely to be directly in‐line with each customer
category´s proportion of the total number of customers. The regulator does not know
the number of smart meters installed per customer category.
The impact of smart meter roll out is estimated by the regulator as:

490
A 6,4% consumption saving can be achieved when the customer has direct feedback via
a display unit; and
A 3,2% consumption saving can be achieved when the customer receives indirect
feedback, for example through a website.

491
Country Report – the Netherlands (gas distribution)
1. Overview of to the distribution sector
1.1. Institutional structure and responsibilities
In the Netherlands there are 9 distributors supplying gas to around 7,5 million
customers (estimation). Summary data on industry structure is set out below.
Table 340: DSO characteristics
Total number DSOs
Ownership unbundled
Legally unbundled
Less than 100000 customers
Share of total demand
Country 9 Every DSO, aside from 2
All 2 Unknown
The responsibility for setting distribution tariffs ultimately lies with the regulator, which
approves (or requests adjustments to) DSOs´ tariff proposals. The Government is not
involved in setting distribution tariffs.
The breakdown of responsibilities as it related to tariff setting is summarized in the table
below.
Table 341: Legal basis for tariff structure – Roles and Responsibilities in setting distribution tariffs
Actor Allowed revenues (tariff level)
Tariffs (tariff structure)
Connection charges
DSO Proposes tariff level to the NRA
Proposes tariff level to the NRA
Proposes standard fees
Government Not involved Not involved Not involved
NRA Approves (or not) the DSOs´ proposals
Approves (or not) the DSOs´ proposals
Sets the fees
X = main responsibility; other options to fill the table: sets rules; monitors ex‐post; defines main principles;
calculates for NRA approval; also involved;
Allowed distribution revenues in the Netherlands in 2013 were € 1270 million.
Customers categories are in the Netherlands are generally split as ´small customer´,
and those which do not fall into the ´small customer´ category.

492
The regulatory model uses yardstick competition (with a price cap) in the process of
setting the amount of allowed revenues. The allowed revenue of a company is adjusted
annually by (1+cpi‐x+q), wherein cpi is the consumer price index, q represents the
quality factor and x is the efficiency incentive.
The yardstick of allowed revenues is equal (except allowing for some regional variations)
for all DSOs and is determined by the sector average cost per output, including an
estimate of the growth in total factor productivity during the regulatory period. The
yardstick competition system provides incentives to DSOs to improve their productivity;
this happens because DSOs can achieve higher profits when they achieve productivities
above the average level. Costs are determined based on average methodologies, and
the regulator collects, on an annual basis, actual OPEX, investments, depreciation and
the volumes of gas charged to customers.
1.2. Key figures on revenue and tariffs
Distribution revenues in the Netherlands in 2013 were € 1271 million, broken down by
the following activities:
Distribution and connection – € 1131 million (88,8%)
Metering – € 140 million (11,2%)
A breakdown of revenue by customer category, including information on available tariff
components and the number of customers in each category is set out in the table below.
Table 342: Tariff components, customers and revenues per customer class
Customer classes Tariff components Number of customers Revenue
Small customers Administrative costTransport‐related capacity Connection cost Metering
6800000 € 1110 million
Large customers Administrative costTransport‐related capacity Connection cost
Unknown € 161 million
Total ‐ € 1271 million
The breakdown of distribution revenue by customer category is set out in the chart
below. The regulator understands that volumes of gas consumed by each customer
category are not publicly‐available because the tariffs are based on capacity (not
volume).

493
Figure 70: Proportion of revenue accounted by customer categories
Customers categories are in the Netherlands are generally split as ´small customer´, and
those which do not fall into the ´small customer´ category. That is, there is no specific
definition of typical small and large industrial consumers. These are defined as follows:
Small customer – customers which have a G6 connection (capacity up to 10 m3/h) and
using 2000 m3 of gas (‘Groningen standard’) per year. Actual average usage has shifted
however (the average is now about 1650 m3).
Non‐small customer – all customers which do not fall under the ´small customer´
category
2. Regulation of distribution activities
2.1. General overview
The role of the DSOs in the Netherlands is to propose allowed revenues and distribution
grid tariffs, and the NRA sets the final versions of the maximum tariffs to be applied. The
Government is not involved in this process.
The Dutch regulatory model is focused on output and total cost, and is also incentive‐
based. The minor exception is with regard to the costs of DSOs that are cost‐reimbursed
(local taxes).
There is ex‐ante regulation (3‐year regulatory period) with fixed yearly tariffs. The DSO
takes on the volume risk (mostly capacity based).
The regulatory model is incentive‐based, and focused on outputs and total costs. The
regulatory regime is 3 years duration.
DSOs are obliged to propose cost‐reflective tariffs.
Mitigation mechanisms are in place concerning volume risks, tariff adjustments and
profit sharing.

494
The broad regulatory model is output based. The output of the DSOs is based on the
capacity/volume of the consumers connected. The basis of the income of the DSOs is set
in regulatory periods through the x‐factor decisions, but can be adjusted in yearly tariff
decisions.
In general the regulator does not give specific approval to investments (due to output
regulation). The ex‐ante regulation includes an estimation of investments.
The DSO is obliged to propose cost‐reflective tariffs. Requirements are placed in tariff
codes. Among the requirements are: the allocation of costs to transport or connection;
(fixed) administrative or transport dependent costs; grid pressure; and cost pass through
from other grid levels.
Key features of the regulatory regime are set out in the following table:
Table 343: Main features of the regulatory regime
Issue Approach
Type of regime (concession/licence) N.a.
Duration of tariff setting regime 3 year regulatory period, with fixed yearly tariffs
Form of determination (distributor propose/regulator decide)
DSO proposes and the regulator decides and finalises
2.2. Main incentive properties of the distribution regulatory model
The following key regulatory incentives apply for the DSOs:
There is ex‐ante regulation (3 year regulatory period) with fixed yearly tariffs. The DSO
has volume risk (mostly capacity based).
Quality of service performance is assessed, but it does not impact on income; in other
words, it does not act as an incentive.
At the same time the following tools are provided to mitigate risks:
Profit sharing. The regulator has the choice to apply a gradual shift or an instant shift in
tariffs from the previous regulatory period. That is, whilst a gradual, phased realignment
towards efficient costs can be used, realignment towards efficient costs can also be
done in one step by the NRA. For the gas DSOs, the regulator applied a gradual shift in
the current period (2014‐2016).
Volume risk. Whilst the volume risk is carried entirely by the DSOs, the largest part of
the revenues come from “per m3/hour” tariff components (i.e. from rates based on
capacity). This contributes to reducing the volume risk.
Tariff adjustment. The regulator can adjust the yearly tariffs during a regulatory period
when realisations differ from expectations, when incorrect or incomplete information is
used and when certain activities are no longer performed.

495
2.3. Determination of cost of service parameters
The Dutch regulatory model is focused on outputs and total costs, and includes
incentives. Tariffs are fixed for one year, as set through ex‐ante regulation (which has a
3‐year period).
ACM can adjust the yearly tariffs during a regulatory period when realisations differ
from expectations, that is, when incorrect or incomplete information is used and when
certain activities are no longer performed.
The approach to determining key cost of service parameters are summarized in the
following table.
Table 344: Approach to key cost of service parameters
Parameter Approach
Form of price control Price cap, with efficiency incentives
Regulatory asset base The RAB of DSOs is set in regulatory periods based on the capacity/volume of customers connected and through the x‐factor decisions (which can be adjusted in yearly tariff decisions).
Capital expenditure Annual benchmarking based on real costs
Approach to operating expenditure Annual benchmarking based on real costs
Form of WACC applied Real WACC, before tax
Additional revenue items (where applicable)
The following formula is applied in determining the WACC:
e
De
E
t
t
ED
DK
ED
E
t
KWACC
1
1
1
Where:
KE = rf + β MRP is the cost of equity
MRP is the Market Risk Premium
KD is the cost of debt
t is the debt tax shield
te is the corporate tax rate

496
3. Tariffs for distribution services
3.1. Distribution tariffs
In the tariff‐setting process, the DSO submits a proposal and the regulator sets the final
tariff values.
DSOs are obliged to propose cost‐reflective tariffs and the requirements are placed in
tariff codes. Among the requirements are:
The allocation of costs to transport or connection;
(Fixed) administrative or transport dependent costs;
Grid pressure; and
Cost pass‐through from other grid levels.
The tariffs are set per DSO. Each same type of customer is charged a similar tariff (there
is non‐discrimination). Metering tariffs for small users are nationally‐uniform; for large
industrial consumers metering tariffs are liberalised. There is no time‐of‐use
differentiation of tariffs, and all tariff components are linear within groups and
categories.
Renewable generation are charged distribution tariffs similar to other users. Currently
this is being reviewed by the Ministry of Economic Affairs.
Various other aspects of distribution tariff setting are summarized in the table below.
Table 345: Approach to key issues in setting distribution tariffs
Issue Approach
Treatment of distribution losses Charges as part of the distribution tariffs
Presence of uniform tariffs Yes, except for large industrial (>3*80A) customers (for which the market for metering is liberalised)
Presence of non‐linear tariffs No
Presence of regulated retail tariffs No, it has been an open market since 2004
Presence of social tariffs No
3.2. Connection charges Key issues in the setting of connection charges are set out in the table below.
Table 346: Summary of key issues relating to connection charges
Issue Approach
The regulator sets the allowed tariffs, following a proposal submitted by each DSO.
Tariffs are geographically‐uniform, linear, not regulated and social tariffs are not used.
Connection charges are shallow in nature, and DSOs are generally not allowed to
refuse new customer connections.

497
Determination of charges
Type of charges (shallow/deep) Shallow
Methodology adopted For all connections up to 40m3/h uniform connection fees apply. Above 40m3/h only a uniform connection fee applies to the connection point on the grid. The other components (pipe, security before the installation) are computed on a case‐by‐case basis.
Hosting capacity Scope to refuse connection In principle all consumers have a right to have a connection, and connected to the closest suitable location on the grid. There is an exception for remote locations where it is not feasible to extend the grid or to achieve a connection.
Requirements to publish hosting capacity
DSOs are required to publish quality and capacity documents of the grid
Targets and/or incentive schemes to enhance hosting capacity
No specific measures, but DSOs are obliged to ensure they have sufficient capacity on the network.
Above 40m3/h a customer can have the connection (except for the connection point on
the grid) created and maintained by a third party instead of the DSO.
There is an initial fee for the creation of the connection and a periodical fee for
maintaining the connection. For connections of over 25m a fee per meter is also applied.
Charges are shallow in nature, for both gas consumers and embedded generators. It is
forbidden by law to have individual customers directly compensate deep investments.
In determining the connection fees, the standard fees proposed by the regulator should
be cost‐reflective. The connections based on a case‐by‐case calculation have minimum
requirements set in the tariff codes.
Customers may initiate legal procedures against the DSO in the case of a conflict over
tariffs and the regulator will primarily deal with the conflict. After the regulatory delivers
its decision the involved parties may opt to take the matter to court if they are still
unsatisfied with the result.
DSOs are required to publish quality and capacity documents of the grid. These
encompass capacity bottlenecks in the grid and grid expansion plans. This information is
publicly‐available. It is not required to publish all available capacity on the grid; it is
customary practice (but not binding) that the DSO presents location‐specific plans upon
connection requests.

498
4. Distribution system development and operation
4.1. Distribution system development
The key features of distribution system planning are summarized below.
Table 347: Approach to distribution planning
Issue Approach
Form of distribution planning document DSOs are required to develop a biennial Quality and Capacity Report. This document must meet the Ministerial Regulations in Relation to Quality Aspects of Electricity Grid and Gas Network Management. It is formulated and then provided to the NRA for the NRA´s review and assessment.
‐ Key responsibilities for its development DSOs are required to develop the document; the NRA approves
‐ Degree of integration with renewables plan
N.a.
‐ Relationship with consumption trends No direct relationship
‐ Relationship with quality of service targets
Included as an explicit input.
‐ How trade‐offs between network development and alternative technologies are treated
Generally, as the regulatory model is output and incentive based, DSOs are incentivised to invest and operate the network as efficiently as possible, meaning that DSOs are incentivised to invest in smart grid and alternative technologies where there is a resulting regulated cost decrease.
‐ Requirements to integrate cost benefit analysis
Yes, the network development plans of the DSOs contain concrete examples of large investment projects to illustrate the cost‐benefit analyses done by the DSO when deciding on investments.
Network operators are obliged to compose a biennial Quality and Capacity Report. The
document describes all the assets of network operators, and based on demand and
generation prognoses, the required and planned investments.
The network development plan does not have to include any information on
environmental policies. However, the DSOs do have to monitor the release of methane
DSOs are required to develop a biennial Quality and Capacity Report; the document is
reviewed and approved by the NRA. Targets for quality of service are explicitly taken as
an input in the distribution development plan and, where relevant, the plan illustrates
the relationship between the investments and the quality objectives in the distribution
area.
DSOs have full responsibility for managing and owning the meters, for small customers.
Suppliers are responsible for the collection and validation of the data.
As of December 2013 there were 600.000 smart meters installed in the Netherlands.

499
into the atmosphere (they use a model for this, which was developed by a research
institution) and report on this to the Ministry in a yearly report.
Targets for quality of service are explicitly taken as an input in the distribution
development plan and, where relevant, the plan illustrates the relationship between the
investments and the quality objectives in the distribution area. For example, this can be
the case with regard to investments to reduce voltage issues in certain areas.
4.2. Metering
Key issues regarding metering, and the role of the DSOs, are set out in the following
table.
Table 348: Key approach to metering
Issue Approach adopted
Discos role in metering DSOs are fully responsible for managing and owning meters for small customers; for large customers, metering services can be procured on the market.
Monopoly services in the metering For small customers, DSOs are monopoly service providers.
Smart metering functionality Use hourly measurement; have a default remote reading capability; cannot be remotely disconnected and reconnected, nor have remote control of the maximum gas flow. The smart meters do allow the remote operation of the consumers´ appliances.
DSOs have full responsibility for managing and owning the meters, for small customers.
For large customers, where metering services can be procured on the market, the
suppliers are responsible for the collection and validation of the data.
As of December 2013 there were 600000 smart meters installed in the Netherlands. This
is of a total small customer base of around 7,5 million. The following preliminary
information on the impact of smart meter roll out is available.123 No specific analysis has
been undertaken on the per‐household average cost saving resulting from the
installation of a smart meter.
Table 349: Effects from the smart meters deployment.
DSO Total number of households
Number of households with a SM
Gas consumption reduction
All DSOs considered together 7500000 600000 0,9%
123 Rijksoverheid, 2014. Received from: file:///C:/Users/A406918/Downloads/kamerbrief-over-besluit-grootschalige-uitrol-slimme-meters.pdf

500
Country Report – Poland (electricity distribution)
1. Overview of the distribution sector
1.1. Institutional structure and responsibilities
In Poland there are 169 DSOs supplying electricity to around 16,8 million customers
covering 312884 km2. Summary data on industry structure is set out below.
Table 350: DSO characteristics
Total number DSOs
Ownership unbundled
Legally unbundled
Less than 100000 customers
Exemption* Share of total demand
Country 169 separated from energy trading companies
Yes 164 Yes, embedded generators do not pay tariffs
9,2%
*exemption from distribution network charges for certain types of grid users, such as low‐carbon generation connected to distribution networks.
A concession regime is in place for DSOs´ undertaking of activities, under which the
energy law states that concessions should last from 10 to 50 years, although most of
them are issued for 10‐year periods. Concessions are granted to those who hold rights
to distribution assets (ownership, leasing, other).
The concession owner mostly acts as a DSO on their own physical distribution network.
There is a possibility that the grid proposed to be used by the concession owner is
operated by another operator which also has a concession for distribution. The tariff is
set and approved for the enterprise which is the owner of the grid. The cost of operating
the grid is a subject of contract between the owner of the grid and operator.
There are 5 large DSOs and 164 smaller‐scale ´energy enterprises´ which effectively
act as DSOs in their respective jurisdictions.
The regulator determines the allowed revenue; the DSOs propose their respective
tariff levels which are implemented subject to approval being received from the
regulator.
Allowed revenue calculations and tariff setting is exclusively the role of the DSOs
and the regulator; the government is not involved.

501
Tariffs are set by the DSO and are approved by the President of ERO, the regulator. The
Law stipulates that there should be no cross‐subsidies. The maintenance and
modernisation of the grid, taxes and depreciation should be covered by a fixed
distribution fee. Nevertheless, some parts of the fixed costs are covered by a variable
distribution fee (which is calculated mostly in order to cover losses) due to the need to
protect the customers. The share of fixed fees is determined by the President of ERO.
The NRA, in the process of agreeing a development plan, sets a justified level of
expenditures for connection to the network. In addition, the NRA ‐ based on data from
the DSO development plans, including the level of investment expenditures, the number
of consumers and connected load ‐ periodically verifies the level of connection fees for
consumers connected to the LV grid.
The breakdown of responsibilities as it related to tariff setting is summarized in the table
below.
Table 351: Legal basis for tariff structure – Roles and Responsibilities in setting distribution tariffs
Actor Allowed revenues (tariff level)
Tariffs (tariff structure) Connection charges
DSO Proposes revenues to the NRA
Proposes tariff structure to NRA
Not involved
Government Not involved Not involved Not involved
NRA Approves allowed revenues
Takes decision on tariff structure based on DSO proposal
Defines main principles
X = main responsibility; other options to fill the table: sets rules; monitors ex‐post; defines main principles;
calculates for NRA approval; also involved;
Tariffs are set by the DSO and approved by the President of ERO, the regulator. The
tariffs are published in the ERO bulletin.
1.2. Key figures on revenue and tariffs
The regulated revenues of the five large DSOs in Poland was 17,8 billion PLN. The
allowed distribution revenue is approved according to justified costs and the justified
level of RoC. There is no split of allowed revenue for different activities.
Customers are categorised based on various factors, including voltage, contractual load
power and consumption in time zones (1,2 or 3).
Residential customers are connected to the grid independent of voltage level, but
mostly to the LV network.
Industrial customers could be:
“large” – A group ‐HV
“medium”‐B group ‐MV – mostly: contractual capacity > 40 kW, rarely: contractual
capacity < 40 kW

502
“small” C group – LV, with : contractual capacity up to 40 kW (C1 groups) and higher
than 40 Kw (C2 groups) .
The tariff components applied to industrial customers include: distribution rates:
variable and fixed rate components, quality rate (variable), transition fee (fixed),
subscription fee (fixed PLN/month). Variable rates are in PLN/MWh or PLN/kWh, fixed
(except subscription fee) in PLN/kW/month.
The tariff components applied to residential customers include: variable and fixed rate
components, quality rate (variable), transition fee (fixed), and subscription fee (fixed).
Variable rates are calculated in PLN/kWh; and fixed rates are calculated in PLN/month.
In 2013 the following numbers of customers were connected to the respective voltage
networks:
HV – 379 customers
MV – 34.518 customers
LV – 1.619.348 customers
Residential – 15.150.566 customers
Others (temporary connected) – 5.838 customers
A breakdown of revenue by customer category, including information on available tariff
components and the number of customers in each category is set out in the table below.
Table 352: Tariff components, customers and revenues per customer class
Customer classes Tariff components Number of customers
Revenue (PLN million)
A – Large Industrial (HV)
KWh, kW 379 1327
B – Medium Industrial (MV)
KWh, kW 34518 4165
C – Small Industrial (LV) KWh, kW 1619348 5325
G – Residential KWh, kW 15150566 6974
R ‐ temporary KWh, kW 5388 8
Total KWh, kW 16810649 17799
The breakdown of energy volumes and distribution revenue by customer category are
set out in the charts below.

503
Figure 71: Proportion of energy and revenue accounted by customer categories
20%
36%19%
25%
0%
Energy share
A – Large Industrial (HV) B – Medium Industrial (MV)
C – Small Industrial (LV) G – Residential
R ‐ temporary
8%
23%
30%
39%
0%
Revenue share
A – Large Industrial (HV) B – Medium Industrial (MV)
C – Small Industrial (LV) G – Residential
R ‐ temporary
These show a disproportionate share of costs borne both residential and small industrial
consumers in relation to their respective energy shares. Large industrial consumers on
the other hand, consume one fifth of total energy consumption but only contribute 8%
of the total revenues.
The typical network tariff in 2014 has been calculated below for the following classes of
industrial customers:
A ‐ “large” HV
B ‐ “medium” MV – mostly: contractual capacity > 40 kW, rarely contractual capacity <
40 kW:
C ‐ “small” – LV, with: contractual capacity up to 40 kW (C1 groups) and higher than 40
kW(C2 groups)
The tariff components applied to industrial customers: distribution rates: variable and
fixed rate components, quality rate (variable), transition fee (fixed), subscription fee
(fixed PLN/month).
The tariff components applied to residential customers include:

504
Variable and fixed rate components
Quality rate (variable)
Transition fee (fixed)
Subscription fee (fixed).
A representative network tariff in 2013 for residential, small and large industrial
customers is illustrated below:
Table 353: Breakdown of annual charges – typical customer types, 2013 (€)
Customer type
Notional Energy usage
Fixed charges
Energy charges
Demand and reactive charges
Total
Residential 3500kWh 56 148 204
Small commercial
50MWh 1250 709 1959
Industrial 24000MWh 2427 230769 11059 244255
The resulting average tariffs per kWh are illustrated below.
Figure 72: Average network charges (€cents/kWh), 2013
An example of network tariffs applied in 2013, by PPC Rokita SA is included as Annex 1.
2. Regulation of distribution activities
Regulatory revenues are set under a mixed approach, wherein a revenue cap is used as well as certain performance incentives. The regulatory regime has 4 year duration. Sharing mechanisms for under‐spend are in effect.

505
2.1. General overview
Key features of the regulatory regime are set out in the following table.
Table 354: Main features of the regulatory regime
Issue Approach
Type of regime (concession/licence) The law provides that concessions last from 10 up to 50 years although most of them are issued for a 10‐year period. Concessions are granted, after administrative procedure, to those who hold rights to distribution assets (ownership, leasing, other).
Duration of tariff setting regime The OPEX and losses model is set for 4 years regulatory period 2012‐2015. The return on capital method / regime is set for a 4‐year period (currently 2011‐2015), but RoC is updated annually. Other components of costs and revenue are set every year.
Form of determination (distributor propose/regulator decide)
Tariffs are set by the DSO and approved by the regulator. A fixed distribution fee is used to cover the maintenance and modernisation of the grid, taxes, depreciation. Nevertheless some part of the fixed costs is covered by a variable distribution fee (which is calculated mostly in order to cover the losses) due to the need to protect the customers. The share of fixed fees is determined by the regulator.
The broad regulatory model in effect in Poland can be characterised as being mixed,
with the model based partly on revenue cap regulation. The regulatory model provides
for performance incentives. In particular:
The OPEX level is changed by the RPI‐X method during each regulatory period;
Losses indicators (ratio for voltage level) are also set for each regulatory period; and
During the regulatory period, the DSO can profit from savings resulting from efficiency
achievements in DSO activities. Costs are reviewed at the end of each regulatory period.
Allowed revenue assessments are based on assumptions of three outputs:
GWh delivered through the distribution network;
Number of consumers connected; and
Capacity of consumers connected.
The electricity tariff is composed of various sub‐components, namely:
Variable component of distribution fee (mostly cost of losses and some amount of fixed
costs).
Quality fee (costs of maintaining the system‐related standards of quality and reliability
of current electricity supplies).
Fixed component of distribution fee (maintaining and modernisation of the grid, taxes,
depreciation).

506
Transitional fee (costs resulting from termination of PPA)
Subscription fee (costs of reading and inspecting the metering systems).
2.2. Main incentive properties of the distribution regulatory model
The following key regulatory incentives apply for the DSOs:
Operating expenditure efficiency requirements (DSOs allowed to keep a portion of
savings resulting from efficiency improvements)
Quality of service factor will be introduced in 2016
At the same time the following tools are provided to mitigate risks:
Cost reviews are undertaken at the end of each regulatory period
Volume risk is taken by the DSOs, but planned volume for tariff in the next year can be
adjusted according to trend (in volume) in the previous few years.
A DSO can ask for a correction of the tariff during the year of its validity.
Regarding quality of service regulation, the regulatory model will change from 2016
onwards. The model will take into account quality of service issues. It is currently under
preparation.
2.3. Determination of cost of service parameters
A mixed model is used, wherein costs of service are based partly on revenue cap
regulation and the return on capital (WACC). The model also includes an efficiency
improvement requirement applied to OPEX (via the RPI‐X method).
Advanced Metering Infrastructure investments are remunerated by higher WACC than
“usual” grid investments.
A benchmarking model is used to allow a comparison of DSOs´ costs with other relevant
cost references; the model is based on Bayesian inference for regulatory period 2012‐
2015 for OPEX and losses. A benchmarking model for CAPEX is also used.
The approach to determining key cost of service parameters are summarized in the
following table.
Table 355: Approach to key cost of service parameters
Parameter Approach
Form of price control Revenue cap based with efficiency adjustments
Regulatory asset base The deprival value method is used to set the RAB. In the subsequent years the RAB is updated due to investments, deprecation and connection fees
Capital expenditure Total expenditure benchmarking
Approach to operating expenditure Total expenditure benchmarking
Form of WACC applied Calculation of WACC (pre‐tax)
Additional revenue items (where applicable) Service quality measures will be implemented from 2016 onwards

507
The following formula is applied in determining the WACC:
( − )= × /( + )+ /( − )× /( + )
where:
rd – cost of debt,
re – cost of equity,
D – debt,
E – equity,
t – tax rate.
The debt leverage ratio is set for every year of period covered by WACC model, i.e.
2011‐2015. The debt share increases every year in this period.
3. Tariffs for distribution services
Embedded generators are not required to pay distribution charges. Tariffs vary by DSO and so‐called “special” (large‐volume) end‐users pay a smaller quality fee and transitional fee. Connection charges are calculated based on cost of the work involved, and are shallow in nature.
3.1. Distribution tariffs
Distribution tariffs are set by the DSOs and the regulator has responsibility to approve
them or not. In the allocation of distribution costs to the tariffs, the principle that no
cross‐subsidies of distribution costs is applied. Tariffs are composed of a fixed and a
variable distribution fee.
Within the tariffs, the following cost factors are covered by the fixed fee: grid
maintenance and modernisation costs, taxes, and depreciation. Nevertheless, some
parts of the fixed costs are covered by the variable distribution fee. The variable
distribution fee is calculated mainly with the objective of covering the losses. The
regulator determines the share of fixed fees within tariffs.
There are 4 classes of electricity consumers:
HV (A group),
MV(B group),
LV non‐residential (C group),and
Residential (household)‐regardless of voltage but most of them are connected to LV grid
(G group).

508
Consumers are charged related to the following components:
Per kWh charges (PLN/kWh) ‐ variable and quality rates (all end‐users). This is mainly the
cost of losses and some amount of fixed costs;
Per kW charge (PLN/kW/month) – fixed component of distribution rates and transitional
fee (rate of charge resulting from termination of PPA)‐ (A,B,C groups end‐users). This is
mainly the costs of modernising the grid, taxes and depreciation. Transitional fees are
costs which have resulted from the termination of PPAs;
Per end‐user (PLN/month) charge ‐ fixed component of distribution rates and
transitional fee (rate of charge resulting from termination of PPA) (G groups end‐users).
This is mainly the costs of modernising the grid, taxes and depreciation. Transitional fees
are costs which have resulted from the termination of PPAs; and
Per end‐user – (PLN/month) subscription fee (all end‐users). Subscription fees cover
the costs of reading and inspecting the metering systems.
Tariffs are proposed by each of the 5 DSOs (“Big”) and approx. 160 smaller DSOs ‐ so‐
called industrial energy enterprises.
The per‐KWh component of tariffs is different in peak and off‐peak time (2 or 3 time
zones). The zones are defined in different ways. For example, for the A23 tariff group
(big industrial end‐user HV) in April to September:
I zone, morning (antemeridian) peak: 7‐13,
II zone, afternoon peak 19‐22, and
III zone 13‐19 and 22‐7.
Tariff variable components are linear. But for the transition fee (fixed rate) for groups G
(residential), the tariff differs depending on the amount of purchased energy. For
instance, in 2013 the G group had the following (non‐linear) transitional fee components
in effect.
Energy consumption annually
Transitional fee PLN/month
Less than 500 kWh
0,08
From 500 to 1200 kWh
0,36
More than 1200 kWh
1,13
No distribution tariffs are charged to embedded generators.
Distribution losses are charged as part of the distribution tariffs, via the per‐KWh
component of the distribution tariff (variable component of distribution fee) includes
the cost of losses.

509
Only the supply tariff for households (energy retail trade) is regulated (other tariffs are
not regulated). Nevertheless, every end‐user has possibility to switch supplier.
So called “special” end‐users pay a smaller quality fee and transitional fee. “Special”
end‐users are end‐users who consume more than 400 GWh annually (and use not less
than 50% (in case of quality fee) or 60% (in case of transitional fee) of contract capacity
and the cost of energy is not less than 15% of production value).
No social tariffs are implemented. Social end‐users can receive monthly fixed rate
allowance (which is set for household – differentiated according to amount of
inhabitants of household). The allowance is paid by the municipality.
Various other aspects of distribution tariff setting are summarized in the table below.
Table 356: Approach to key issues in setting distribution tariffs
Issue Approach
Treatment of distribution losses Covered by the variable component of the distribution fee
Presence of uniform tariffs No – tariffs vary by DSO
Presence of non‐linear tariffs All components are linear, apart from the transition fee component
Presence of regulated retail tariffs The supply tariff for households is regulated; other tariffs are not regulated
Presence of social tariffs No
3.2. Connection charges
Key issues in the setting of connection charges are set out in the table below.
Table 357: Summary of key issues relating to connection charges
Issue Approach
Determination of charges
Type of charges (shallow/deep) Connection fees are calculated on the basis of expenditures incurred only in relation to the connection; these are shallow costs.
Methodology adopted In relation to the methodology used to determine connection costs, the NRA agrees a development plan that sets a justified level of expenditures for connection to the network.
Hosting capacity
Scope to refuse connection The DNO is required to connect those that require connection and which meet the relevant technical specificities
Requirements to publish hosting capacity
The DSO is required to publish information on the value of the total available connection capacity, as well as planned changes to these values in the next five years from the date of publication, for the entire enterprise network. It should update this publication at least once a quarter.
Targets and/or incentive schemes to enhance hosting capacity
No specific measures in place, but the allowed return on capital covers grid investment costs

510
Connection fees are calculated on the basis of expenditures incurred only in relation to
the connection (shallow costs). Expenditures for the expansion and modernization of the
network are not included in the fee calculation.
Broadly speaking, the fee for the connection to the grid is calculated according to the
following rules:
The fee for the connection to electricity grid of a rated voltage of more than 1 kV and
not higher than 110 kV, except for the connection of sources and grids, shall be
determined on the basis of a fourth part of the investment incurred in relation to the
connection,
The fee for the connection to an electricity grid of a rated voltage not higher than 1 kV,
except for the connections to sources or grids, shall be determined on the basis of the
fee rates included in the tariff, calculated on the basis of a fourth part of average annual
costs of investment in the construction of the grid sections used to connect such
entities, specified in the development plan; those rates may be calculated allowing for
the connection power, a unit of length of the grid used for connecting or the type of that
grid section,
The fee collected for the connection of sources cooperating with the grid or the grids of
energy enterprises whose activity consists in the transmission or distribution of energy is
calculated on the basis of the actual costs of investments incurred in relation to the
connection, except for:
o Renewable energy sources with an installed electrical capacity of no more than
5 MW and cogeneration units with an electrical capacity installed capacity
below 1 MW, shall be subject to a fee equal to a half of the fee calculated on
the basis of the actual costs of investment incurred,
o Micro‐installations, for which the connection to the electricity distribution
network are not charged.
In relation to the methodology used to determine connection costs, the NRA agrees a
development plan that sets a justified level of expenditures for connection to the
network.
In addition, the NRA ‐ based on data from the DSO development plans ‐ level of
investment expenditures, the number of consumers, connected load – periodically
verifies the level of connection fees for consumers connected to the LV grid.
Energy enterprises whose activities consist of the transmission and distribution of
gaseous fuels or electricity have an obligation to conclude a grid connection agreement
with entities requesting connection to the grid, on terms of equal treatment, if it is
technically and economically feasible to supply energy or fuels and the applicant meets
the requirements for being connected to the grid and taking supply. Should the energy
enterprise refuse to conclude a grid connection agreement, it is obliged to notify the
Regulator and the entity requesting the connection in writing of the refusal without
delay, stating the reasons for the refusal.
The energy enterprise (DSO) engaged in the transmission or distribution of electricity is
required to publish information on the value of the total available connection capacity,

511
as well as planned changes to these values in the next five years from the date of
publication, for the entire enterprise network at rated voltages above 1 kV, broken
down by power stations or groups in the network with a rated voltage of 110 kV and
higher. The enterprise updates the information at least once a quarter, taking into
account the expansion made, the modernization of the network and the connections
both established and in progress, and publishes this on its website.
The DSO is assumed to have a duty to connect all the renewable capacity that applies for
connection.
Within the regulatory model, the allowed return on capital covers grid investment costs,
and is employed as an incentive for the DSO to invest in the grid development. The
regulator has also introduced an incentive to invest in smart metering, through allowing
an increased return on capital for investments that meet the requirements set by the
regulator.
4. Distribution system development and operation
Each DSO prepares a development plan which looks ahead by at least 5 years. These are updated every 3 years. DSOs can enter into bilateral agreements with demand sources and embedded generators for dispatch and control purposes. DSOs have a monopoly on metering activities and are responsible for the distribution and rollout of smart meters; however, they are not bound to achieve specific meter rollout targets. The rollout of smart meters in Poland is in the preliminary stages.
4.1. Distribution system development
The key features of distribution system planning are summarized below.
Table 358: Approach to distribution planning
Issue Approach
Form of distribution planning document Each DSO must publish a development plan which looks at least 5 years ahead. The plan should be updated every 3 years. All DSOs are required to do this, except those which distribute electricity to less than 100 customers (and for which the DSO provides less than 50 GWh of electricity annually).
‐ Key responsibilities for its development The document is developed by each DSO, following agreement with the regulator on its scope.
‐ Degree of integration with renewables plan
DSOs are required to connect renewable energy sources which apply for connection. These sources are included in the development plans.
‐ Relationship with consumption trends Plan takes consumption trends into account.

512
Issue Approach
‐ Relationship with quality of service targets
Under development – quality of service targets due to be introduced in 2016.
‐ How trade‐offs between network development and alternative technologies are treated
DSOs are not required to explain (in the plan) the rationale behind these trade‐offs.
‐ Requirements to integrate cost benefit analysis
The network development plan reports only the decisions of the DSOs. The analyses on which those decisions are based are not public.
The energy enterprises involved in the transmission or distribution of electricity prepare
development plans for their area of operation in terms of satisfying current and future
demand for electricity, for a period not shorter than 3 years, excluding:
• Transmission System Operator (TSO), which prepares a development plan for a
10‐year period
• Distribution System Operators (DSOs), which prepare development plans for at
least 5 years
The plans are updated every 3 years.
Draft development plan shall be agreed with regulator, except for the development
plans of energy enterprises involved in the distribution of electricity to less than 100
customers to whom the energy enterprise provides annually less than 50 GWh of
electricity.
The support system for RES is mainly based on the obligation to purchase electricity
generated in the source by suppliers and to purchase the green certificates. DSOs are
required to connect renewable energy sources which apply for connection. These
sources are included in the development plans.
The forecast electricity consumption volume change of electricity supply is included in
the Balanced Scorecard of the development plan.
The development plan does not explicitly illustrate the relationship between each (type
of) investment and the benefits in terms of increased quality of services. Currently, work
is being undertaken on the introduction of a quality regulation model.
The development plan should ensure long‐term maximization of the efficiency of capital
expenditures and costs incurred by energy enterprises, so that in particular years the
capital expenditures and costs would not cause excessive increase in prices and fee rates
for the supply of energy, while ensuring continuity, reliability and quality of supply.
Regarding the results of analyses used to select the network development investments
and technologies, the network development plan reports only the decisions of the DSOs.
The analyses on which those decisions are based are not public. For parts of the
investment, DSOs provide justification for the necessity of their implementation (e.g.
due to age), or NPV, IRR.

513
4.2. Distribution system operations
The key features of distribution system operations are summarized below.
Table 359: Approach to distribution planning
Issue Approach
Requirements for dispatch of renewable plants connected to DSO network
DSOs are allowed to dispatch any generation units connected to the distribution network except for generation units with an installed capacity of 50MW or more.
Possibility to dispatch flexible loads DSOs do not dispatch any generation units connected to their grid unless (and only if) there is specific bilateral agreement between the DSO and generator. DSOs may curtail flexible loads if the safe operation of the grid is in danger.
Other sources of flexibility open to DSO DSOs do not have access to other sources of flexibility / regulation, unless there is specific bilateral agreement between the DSO and flexibility/regulation provider.
DSOs are allowed to dispatch any generation units connected to the distribution
network except for generation units with an installed capacity of 50MW or more
connected to the so‐called coordinated 110 kV network. The coordinated 110 kV
network is a distribution network over which the TSO has a coordination role as far as
planning and operational procedures are concerned.
In practice, according to the operational procedures described in distribution network
codes, the DSOs do not dispatch any generation units connected to their grid unless
(and only if) there is specific bilateral agreement between the DSO and generator. Also,
in emergency situations i.e. when the safe operation of the grid is endangered the DSO
may reduce/curtail the generation from any generation units.
DSOs do not have access to other sources of flexibility / regulation, such as batteries or
capacitors, unless there is a specific bilateral agreement between the DSO and
flexibility/regulation provider.
4.3. Metering
Key issues regarding metering, and the role of the DSOs, are set out in the following
table.
Table 360: Key approach to metering
Issue Approach adopted
Discos role in metering DSO is the main party responsible for meter rollout, although they are not bound by policy or law to meet specific meter rollout targets.
Monopoly services in the metering DSOs are monopolists in metering activities.
Smart metering functionality Main features and functionalities:
Quarter‐of‐an‐hour measurement;

514
Issue Approach adopted
Remote reading;
Remote disconnection and reconnection of customers;
Remote control of the maximum amount of power that a customer can withdraw; and
Local port to send real‐time consumption information to local screens/computers.
DSOs´ own householders´ and small businesses´ meters; the meters of other consumer
types are generally owned by the customers themselves. DSOs are monopolists in
metering activities.
Industry and (almost all customers within) heavy industry are equipped with remote
reading (smart) meters. The deployment of smart meters for householders is in its
beginning stage, and is being driven by the DSOs. There is no formal policy or binding
law related to the large‐scale deployment of smart meters.
The main features of the smart meters already deployed (and planned to be deployed)
include:
Quarter‐of‐an‐hour measurement;
Remote reading;
Remote disconnection and reconnection of customers;
Remote control of the maximum amount of power that a customer can withdraw; and
Local port to send real‐time consumption information to local screens/computers.
In terms of the numbers of smart meters that are installed in Poland, the following
information is available:
In the group of the largest‐scale customers, some 99% ‐ 100% of customers have meters
with remote reading capabilities in 4 of the 5 DSOs. For the remaining DSO, 50% of
large‐scale customers have meters with remote reading capabilities;
For small business customers, of the 5 large‐scale DSOs: around 100% of all customers
served by 2 DSOs have smart meters; 50% of customers served by another 2 DSOs have
smart meters; and 65% of customers served by the final DSO have smart meters;
For ´institutional customers´ (that is, some small and medium sized enterprises), almost
all customers (99,8% ‐ 100%) of customers served by 4 of the 5 large DSOs in Poland
have smart meters; 70% of such customers served by the other DSO have smart meters;
In the small business and household customer group, around 2,5% of customers have a
smart meter installed; this is around 420.000 customers.
The NRA understands that electricity consumption has fallen as a consequence of the
meter installations, by around 1% ‐ 4,5%. This result is based on an analysis that was
undertaken on 100.000 meters / customers. During some time periods, the power
reduction was as high as 10% to 30% of pre‐smart meter consumption levels.

515
Country Report – Poland (gas distribution)
1. Overview of to the distribution sector
1.1. Institutional structure and responsibilities
In Poland there are 57 distributors supplying gas to 6.47 million customers covering an
area of 180.122,7 km2. The main DSO in Poland serves more than 90% of gas demand in
the country. Summary data on industry structure is set out below.
Table 361: DSO characteristics
Total number DSOs
Ownership unbundled
Legally unbundled
Less than 100000 customers
Share of total demand
Poland 35 None All DSOs with more than 100.000 customers
29 5,5%
In Poland there is one major DSO which is present through all regions of the country and
which is composed of six (sub) DSOs (and which belongs to PGNiG capital group – the
polish incumbent company). The tariff level of this DSO differs within the six regions of
the country. In addition, there are 51 small DSOs, each of which has a small local
presence in its respective area.
There is both legal and accounting unbundling of DSOs; DSOs belongs to the capital
group of the trading company (no ownership unbundling). For DSOs with less than
100,000 customers, only accounting unbundling is effective.
There are 35 DSOs in Poland, with the majority only serving limited geographic areas
and a with small customer bases; there is one DSO with large geographic presence in
the country.
DSOs are unbundled (legal and accounting).
Tariffs are proposed by each DSO and are approved (by the regulator) for a one‐year
period, and allowed revenues are determined for this period (also requires regulatory
approval).

516
The responsibility for setting distribution tariffs is held by the DSO; the tariff must be
approved by the regulator before it can be implemented.
In relation to determining allowed revenues, Capital costs are subject to “cost
reimbursement”, while operating costs are subject to a “revenue cap” system. The
tariffs to be used are calculated on the basis of the costs planned for the regulatory
period. If the real costs differ from planned ones the DSO has the right to apply for the
tariff correction. There is no automatic mechanism of balancing planned and real
revenues from tariffs.
The assessment of allowed revenues takes into account assumptions of three outputs:
energy delivered through the distribution network
number of consumers connected
capacity booked
The tariffs are approved (by the regulator) for a one‐year period, and allowed revenues
are determined for this period.
The breakdown of responsibilities as it related to tariff setting is summarized in the table
below.
Table 362: Legal basis for tariff structure – Roles and Responsibilities in setting distribution tariffs
Actor Allowed revenues (tariff level)
Tariffs (tariff structure)
Connection charges
DSO Proposes revenues to the NRA, through its proposal of tariffs
Proposes tariffs to the NRA
DSO responsible for making calculations of individual connections on case‐specific basis
Government Not involved Not involved Not involved
NRA Takes decision on allowed revenues (for 1 year period) based on tariff proposal
Takes decision on tariff structure based on DSO proposal
Only involved if requested by a party which has been refused connection, and then the NRA has potential to reverse the decision
X = main responsibility; other options to fill the table: sets rules; monitors ex‐post; defines main principles;
calculates for NRA approval; also involved;
The regulatory process used for setting distribution tariffs involves the following steps.
The tariffs to be used are calculated on the basis of the costs planned for the regulatory
period. Planed, fixed and variable costs are identified; planned capacity bookings and
volumes are defined (they are subject to the regulator’s analysis – involving a
comparison with historical data and a benchmarking exercise) and rates of fees are
calculated.
Allowed revenues assessments take into account assumptions of three outputs:
Energy delivered through the distribution network
Number of consumers connected

517
Capacity booked
If the real costs differ from planned ones the DSO has the right to apply for the tariff
correction. There is no automatic mechanism of balancing planned and real revenues
from tariffs.
The regulator is responsible for approving or not the DSO´s proposed distribution tariffs.
1.2. Key figures on revenue and tariffs
The total amount of allowed distribution revenues in Poland in 2013 was € 954 million. It
is not known how this allowed revenue is split between the different customer types.
A breakdown of revenue by customer category, including information on available tariff
components and the number of customers in each category is set out in the table below.
Table 363: Tariff components and customers per customer class
Customer classes Tariff components Number of customers
Residential KWh, KW 6,274 million
Others (industrial) KWh, KW 0,198 million
Total ‐ 6,472 million
The breakdown of energy volumes by customer category are set out in the chart below.
Information on the allowed revenues by customer class is not available.
Figure 73: Proportion of energy and revenue accounted by customer categories

518
2. Regulation of distribution activities
2.1. General overview
The role of the DISCO in Poland is to propose distribution grid tariffs, propose revenues
per regulatory period, supply gas to end‐consumers, and ensure connections to the
distribution network are realised. The NRA has the role of reviewing and passing
judgement on the adequacy of DSOs´ proposed revenues and tariffs. The Government
develops sector‐related legislation but not does play any direct role in the sector such as
setting allowed revenue or tariffs.
The distribution sector is regulated under a mixed regulatory regime. Specifically, capital
costs are subject to “cost reimbursement”, while operating cost are subject to a
“revenue cap” system. The regulatory period is for one year, it has no incentive‐based
elements.
The distribution tariff is itemized separately to end‐users, and includes a fixed annual
charge and an energy use component.
Key features of the regulatory regime are set out in the following table
Table 364: Main features of the regulatory regime
Issue Approach
Type of regime (concession/licence) Licensing regime ‐ granted for the period not shorter than 10 years and no longer than 50 years
Duration of tariff setting regime 1 year
Form of determination (distributor propose/regulator decide)
The DSO proposes the tariffs and the proposed revenues for each (1 year) regulatory period, and the NRA has responsibility for approving them or not
Scope for appeal regulatory decision Unspecified
2.2. Main incentive properties of the distribution regulatory model
The regulatory regime has no incentive‐based elements.
At the same time a risk mitigation mechanism is in effect, specifically: tariffs are
calculated on the basis of the costs planned for the regulatory period (one year). If the
real costs differ from planned ones the company has the right to apply for the tariff
correction. There is no automatic mechanism of balancing planned and real tariff’s
revenue.
Regulatory revenues are derived under a regulatory model which includes cost
reimbursements for CAPEX and a revenue cap for OPEX.
A 1‐year regulatory regime is in place.

519
No regulatory measures are implemented related to quality of service.
2.3. Determination of cost of service parameters
The approach to determining key cost of service parameters are summarized in the
following table.
Table 365: Approach to key cost of service parameters
Parameter Approach
Form of price control Cost reimbursement (CAPEX) and revenue cap (OPEX)
Capital expenditure Total expenditure (no benchmarking)
Approach to operating expenditure Total expenditure (no benchmarking)
Form of WACC applied Reflective of actual structure of DSOs; WACC formula includes the following parameters: cost of equity, market risk premium, cost of debt, debt tax shield, and the corporate tax rate.
The following formula is applied in determining the WACC:
e
De
E
t
t
ED
DK
ED
E
t
KWACC
1
1
1
Where:
KE = rf + β MRP is the cost of equity
MRP is the Market Risk Premium
KD is the cost of debt
t is the debt tax shield
te is the corporate tax rate
3. Tariffs for distribution services
Tariffs are not geographically‐uniform and are regulated for all customers.
Connection charges take the form of uniform applicable fees, depending on the
capacity of the connection being developed. They cover both shallow and deep costs.

520
3.1. Distribution tariffs
The following approach is adopted to allocate distribution costs to the tariffs. Individual
DSOs are responsible for setting tariffs which are then subject to approval from the
regulator.
Planed, fixed and variable costs are identified; and planned capacity bookings and
volumes are defined (they are subject to the regulator’s analysis, including a comparison
with historical data, and the rates of fees are calculated.
Consumers are divided into two categories:
One category with an hourly capacity withdrawal not exceeding 110 kWh/h – four
groups of customers varied due to yearly consumption (monthly fixed fee + variable
fee), and
One category with capacity booked exceeding 110 kWh/hr – six groups, based on their
level of booked capacity (a capacity‐related fee and a variable component).
Tariff components are not further split into sub‐components. Tariff components are also
not variable depending on time of use; and tariff components are linear within customer
groups.
Tariffs are not geographically‐uniform. Whilst there is one DSO with nationwide
presence, the tariff applied by this entity varies between the six regions of the country.
Furthermore, there are some 51 small independent DSOs (serving localised customer
groups) which also have geographic variation in their tariffs.
Distribution losses are charged as a part of distribution tariffs: the energy‐related
component of the tariff includes the cost of losses.
Retail tariffs for end‐users are regulated for all customers connected to the distribution
network (which are not energy companies which purchase natural gas in order to resell
the gas – this may occur if the retailer obtained individual exemption from the obligation
to use regulated tariff). No special incentives are set, for large users such as gas power
plants, within network tariffs. Social network tariffs are not in effect either.
Various other aspects of distribution tariff setting are summarized in the table below.
Table 366: Approach to key issues in setting distribution tariffs
Issue Approach
Treatment of distribution losses Included within the energy‐related component of distribution tariffs.
Presence of uniform tariffs No.
Presence of non‐linear tariffs No, tariffs are linear within customer groups.
Presence of regulated retail tariffs Yes, tariffs are regulated for all customers connected to the distribution network.
Presence of social tariffs No.

521
3.2. Connection charges
Key issues in the setting of connection charges are set out in the table below.
Table 367: Summary of key issues relating to connection charges
Issue Approach
Determination of charges
Type of charges (shallow/deep) Deep
Methodology adopted Uniform fees depending on the connection capacity being developed
Hosting capacity Scope to refuse connection Yes, if the economic or technical conditions are not adequate
Requirements to publish hosting capacity
No requirements on the DSO
Targets and/or incentive schemes to enhance hosting capacity
None
For all consumers which are not energy companies (which have a connection to the
pipelines with a pressure level not exceeding 0,5 MPa) there are uniform fees depending
on connection capacity for connections (of up to 15 meters) and an additional fee for
each meter over 15 meters. For connections to the high pressure network (over 0,5
MPa) the connection fee is individually calculated on the basis of ¼ cost. In contrast,
energy companies pay 100% of their connection costs.
The connection fees (based on uniform rates as well as those calculated individually)
cover shallow and deep costs.
A DSO can refuse connection for consumers or generators only in the event that
economic or technical conditions for connections are not in place. In the case of a
refusal of a connection, the regulator is notified and can be asked by the party seeking
connection to reverse the DSO's decision.
There is no requirement on the DSO to publish, or notify the regulator of, the technical
hosting capacity of the distribution network.
4. Distribution system development and operation
4.1. Distribution system development
The key features of distribution system planning are summarized below.
The DSO develops a distribution planning document, which is agreed on with the
regulator through informal negotiations. Cost minimization is central within the
plan.

522
Table 368: Approach to distribution planning
Issue Approach
Form of distribution planning document The distribution planning document is agreed with the regulator, not approved by formal decision. It is published on the DSO´s website.
‐ Key responsibilities for its development The DSO develops the document, and the regulator is consulted and comments on it Adaptations are then made, and later it is published on the DSO´s website. It is not approved by formal decision.
‐ Relationship with quality of service targets
The plan should specify the anticipated scope of gaseous fuel supply, the projects aimed at the modernisation, expansion or construction of grids and possibly the new sources of gaseous fuels, and the projects which rationalise the use of fuels and energy by customers.
‐ How trade‐offs between network development and alternative technologies are treated
Trade‐offs are explicitly addressed in the development plan. The network plans shall be projects which rationalise the use of fuels; and projects in the field of acquisition, transmission and processing of measurement data from smart meters grid
‐ Requirements to integrate cost benefit analysis
No, the network plan only includes the decisions of the DSOs; there is no requirement to specify the CBAs.
According to the Polish Energy Law Act (art. 16 (1)) the DSOs and energy enterprises
whose activity consists in the distribution of gaseous fuels shall prepare development
plans for their respective areas of operation aimed at satisfying current and the future
demand for gaseous fuels with consideration of the local land utilisation plan (or the
development direction of the communities) as specified in the study of conditions and
directions of the communities´ spatial planning.
The network plan should minimise the costs of investments and the costs borne by the
energy enterprise so as to ensure that the expenses and costs associated with them do
not cause any significant increase of prices and fee rates of gaseous fuels, whilst
ensuring the continuity, reliability and quality of the supply.
DSOs hold full responsibility for metering, and own the meters. DSOs are monopolists in
metering activities.
No decisions have yet been taken regarding the deployment of smart meters.
Some 48% of the natural gas delivered by DSOs is consumed by non‐daily (or hourly)
metered customers.
With regard to estimating non‐daily metered consumption, metering data is collected
periodically and is the basis (together with a temperature model) for consumption
estimations for future periods.

523
4.2. Metering
Key issues regarding metering, and the role of the DSOs, are set out in the following
table.
Table 369: Key approach to metering
Issue Approach adopted
Discos role in metering Full responsibility, and owners of the meters
Monopoly services in the metering Monopolists in metering services
Smart metering functionality No decisions on smart metering in effect to date.
Information on the rollout status of smart meters in the gas distribution sector in Poland
has not been made available.

524
Country Report – Portugal (electricity distribution)
1. Overview of to the distribution sector
1.1. Institutional structure and responsibilities
In Portugal there are 11 DSO supplying electricity to above 6,086 million of connected
customers covering the whole country. Total energy consumption in 2013 amounted to
41,8 TWh at distribution level. If the islands of Azores and Madeira are considered, 2
more DSO must be added (making a total of 13) and the consumption is 45,4 TWh while
the customer number raises to 6,344 million.
DSO´s with more than of 100000 customers are legally unbundled from transmission,
generation, supply and other activities in accordance with the rules of unbundling laid
down in the Article 26 of Directive 2009/72/EC. However in the case of Portuguese
islands (Madeira and Azores), the EU directives are derogated and only separation of
accounts is enforced for regulation purposes.
For DSO´s with less than 100000 customers, there is only accounting unbundling.
Regulated accounts are audited by external entities.
Summary data on industry structure is set out below.
Table 370: DSO characteristics
Total number DSOs
Ownership unbundled
Legally unbundled
Less than 100000 customers
Share of total demand
Portugal 13 3 10 The 13 DSO in the country account for
95.2% of total demand. The rest is
consumption connected to the transmission
network.
In Portugal the distribution activity is mainly controlled by the NRA which
establishes the methodology to be used for calculating tariffs and prices and the
ways of regulating the allowed revenues.
There are 13 DSO that operate in local regions of the country. DSO´s with more
than 100000 customers are subject to legal unbundling according EU directives.
Small DSO´s have only accounting unbundling.

525
The responsibility for setting distribution tariffs and allowed revenues is spread between
the following jurisdictions:
The NRA, Entidade Reguladora dos Serviços Energéticos (ERSE) is the main responsible for the calculation of allowed revenues and setting the tariffs for electricity distribution. The NRA defines and applies the methodology and sends proposal to the Tariff board that includes the allowed revenues of regulated activities, tariff structure, prices, etc.
Tariff Board, Stakeholders including regulated companies, members of consumer associations and institution entities. The NRA receives the opinion of the Tariff board before taking its own decision.
The Ministry/Government issues principles in the primary law. Imposes legal obligations to the DSO that could impact in the allowed revenues (Electricity law DL 215A/2013)
The breakdown of responsibilities in relation to tariff setting is summarized in the table
below.
Table 371: Legal basis for tariff structure – Roles and Responsibilities in setting distribution tariffs
Actor Allowed revenues (tariff level)
Tariffs (tariff structure)
Connection charges
DSO
Tariff board1
Also involved Also involved Also involved
Government Defines main principles
Defines main principles
Defines main principles
NRA X X X X = main responsibility; other options to fill the table: sets rules; monitors ex‐post; defines main principles;
calculates for NRA approval; also involved;
1The Tariff Board is where the regulated companies of the electricity sector and consumers’ associations are
represented, to discuss regulation issues and the regulator’s proposals, including codes and tariffs.
2 Government approved the statutes of the regulator and the gas sector law where the main tariff principals
are set. These are general principals and do not prescribe how to calculate tariffs in detail
1.2. Key figures on revenue and tariffs
In the distribution activity the allowed revenues in Portugal were € 1,279 billion for 2013. The distribution costs are not treated separately.
In Portugal, distribution tariffs are defined by voltage levels:
High Voltage (HV). Voltage level more than 45kV, but equal or less than 110 kV. Typical
large industrial consumers.
Medium Voltage (MV). Voltage level more than 1KV but equal or less than 45kV. Typical
small industrial consumers.
Low Voltage (LV). Voltage level equal or less than 1kV. There are two subcategories:
o Special Low voltage (SpLV) with contracted power higher than 41,4kW. Typical
small business consumers
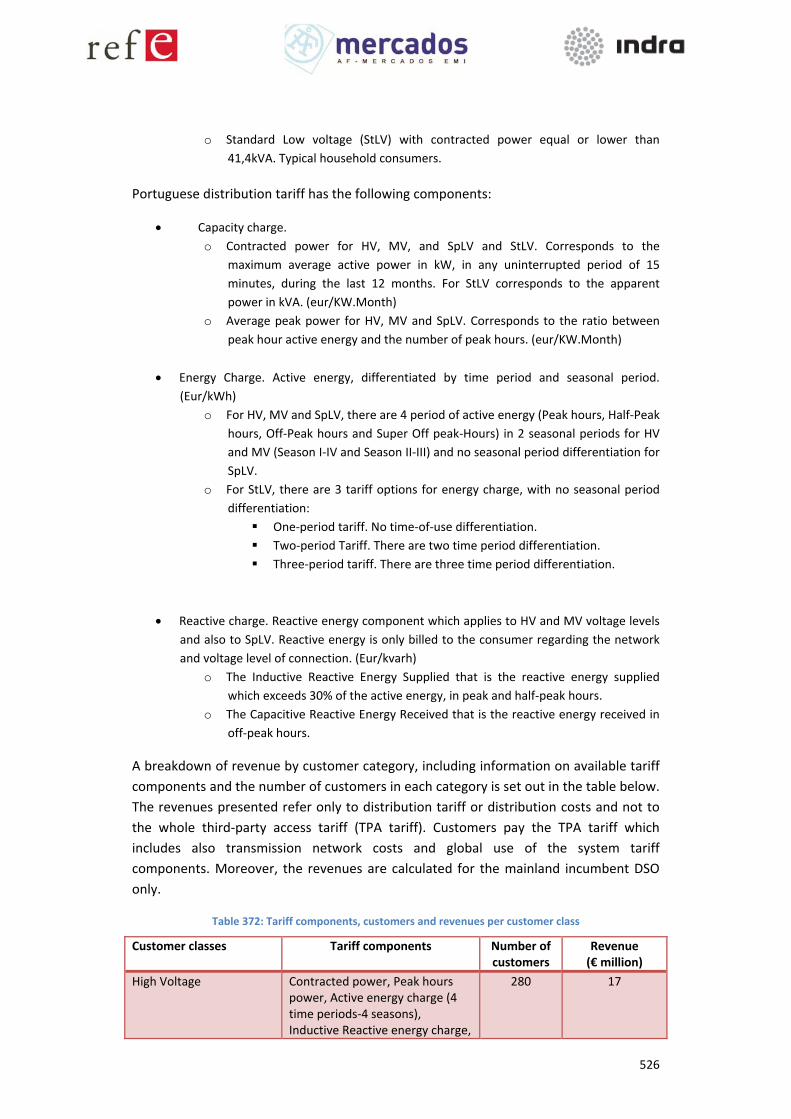
526
o Standard Low voltage (StLV) with contracted power equal or lower than
41,4kVA. Typical household consumers.
Portuguese distribution tariff has the following components:
Capacity charge.
o Contracted power for HV, MV, and SpLV and StLV. Corresponds to the
maximum average active power in kW, in any uninterrupted period of 15
minutes, during the last 12 months. For StLV corresponds to the apparent
power in kVA. (eur/KW.Month)
o Average peak power for HV, MV and SpLV. Corresponds to the ratio between
peak hour active energy and the number of peak hours. (eur/KW.Month)
Energy Charge. Active energy, differentiated by time period and seasonal period.
(Eur/kWh)
o For HV, MV and SpLV, there are 4 period of active energy (Peak hours, Half‐Peak
hours, Off‐Peak hours and Super Off peak‐Hours) in 2 seasonal periods for HV
and MV (Season I‐IV and Season II‐III) and no seasonal period differentiation for
SpLV.
o For StLV, there are 3 tariff options for energy charge, with no seasonal period
differentiation:
One‐period tariff. No time‐of‐use differentiation.
Two‐period Tariff. There are two time period differentiation.
Three‐period tariff. There are three time period differentiation.
Reactive charge. Reactive energy component which applies to HV and MV voltage levels
and also to SpLV. Reactive energy is only billed to the consumer regarding the network
and voltage level of connection. (Eur/kvarh)
o The Inductive Reactive Energy Supplied that is the reactive energy supplied
which exceeds 30% of the active energy, in peak and half‐peak hours.
o The Capacitive Reactive Energy Received that is the reactive energy received in
off‐peak hours.
A breakdown of revenue by customer category, including information on available tariff
components and the number of customers in each category is set out in the table below.
The revenues presented refer only to distribution tariff or distribution costs and not to
the whole third‐party access tariff (TPA tariff). Customers pay the TPA tariff which
includes also transmission network costs and global use of the system tariff
components. Moreover, the revenues are calculated for the mainland incumbent DSO
only.
Table 372: Tariff components, customers and revenues per customer class
Customer classes Tariff components Number of customers
Revenue (€ million)
High Voltage Contracted power, Peak hours power, Active energy charge (4 time periods‐4 seasons), Inductive Reactive energy charge,
280 17

527
Customer classes Tariff components Number of customers
Revenue (€ million)
Capacitive Reactive energy charge
Medium Voltage Contracted power, Peak hours power, Active energy charge (4 time periods‐4 seasons), Inductive Reactive energy charge, Capacitive Reactive energy charge
23538 210
Low voltage ‐ Special Contracted power, Peak hours power, Energy charge (4 time periods), Inductive Reactive energy charge, Capacitive Reactive energy charge.
33512 130
Low voltage ‐ Standard Contracted power, Energy charge (1 time period, 2 time period and 3 time period)
6028186 922
Total ‐ 6085516 1279
The breakdown of energy volumes and distribution revenue by customer category are
set out in the charts below.
Figure 74: Proportion of energy and revenue accounted by customer categories
The figure above shows that in 2013, Low Voltage Standards group (Typical Household
consumers) have paid on average 73% of distribution costs and they have consumed
only the 43% of active energy.

528
The typical distribution network tariff in 2013 for Households, Small industrial and Large
industrial customers is illustrated below. Note that the average cost given in the table
refers only to distribution tariff or distribution costs and not to the whole third‐party
access tariff (TPA tariff). Customers pay the TPA tariff which includes also transmission
network costs and global use of the system tariff components.
Table 373: Breakdown of annual charges – typical customer types, 2013 (€)
Customer type Notional Energy usage
Power charge
Average Peak hours charge
Distributed Energy charge
Reactive energy
Total
Household 3500 kWh
41 € 68 € 109 €
Industrial consumer
50MWh 255 € 690 € 160 € 91 € 1196 €
Industrial consumer with an 7.000 use hours
24000 MWh
10739 € 77858 € 21022 € 14340 € 123959 €
The resulting average tariffs per kWh are illustrated below.
Figure 75: Average network charges (€/kWh), 2013
2. Regulation of distribution activities

529
2.1. General overview
The Decree‐Law 29/2006, amended by Decree‐Law 215‐A/2012, provides the main rules
for the electric Portuguese system, including distribution activities. The law establishes
the main role of DSO. According to article 39, the DSO´s shall: “Provide to interested
parties, without discrimination, access to distributions networks, based on tariffs
applicable to all customers in terms of the Access to Networks and Interconnections
Code.”
The NRA (ERSE) is the administrative authority for regulating the energy sector and has a
range of powers and responsibilities defined by law. “The mission of ERSE is to regulate
the electricity and natural gas sectors, being an effective tool for the efficient and
sustainable operation of the respective markets while ensuring the protection of
consumers and the environment, transparently and impartially”. The NRA scope is focus
“… protecting consumers’ rights and interests as regards prices, services and service
quality; monitoring compliance with public service obligations and all other legal,
regulatory and similar requirements; guaranteeing economic and financial balance to
the activities of the regulated sectors exercised in the public interest companies within
the framework of appropriate and efficient management; promoting competition in the
energy markets between all their players”.
The distribution activities are regulated under a public concession regime, with a specific
regimen for HV and MV distribution networks and other for LV distribution networks.
The HV and MV electricity distribution are subject to a public concession between the
Government and the DSO lasting 35 years. The LV electricity distribution is also subject
to a public concession between the DSO and the municipalities. However, DSO and
municipalities signed contract (like sub‐concessions), whereat the DSO´s are responsible
for the operation, maintenance and investment in the LV electricity distribution for 20
years. Some of these concessions are facing their end in the coming years.
The broad regulatory model implemented in Portugal is a mix of “cost reimbursement”
and “incentive based”. Capital costs are subject to “cost reimbursement”, while
operating cost are subject to an “incentive based” regulation for controllable costs.
Key features of the regulatory regime are set out in the following table
The regulatory model of the distribution electricity sector is a mix of two. Capital
costs are subject to “cost reimbursement” while operating cost are subject to an
“incentive based” mechanism for controllable costs. DSO operates in a concession
regimen.
Allowed revenues are defined annually. CAPEX is assessed every year and OPEX is
defined in the first year of regulatory period and updated both with RPI‐X and the
evolution of the cost drivers set. The tariffs are updated accordingly.

530
Table 374: Main features of the regulatory regime
Issue Approach
Type of regime (concession/licence) Concession.HV‐MV networks, maximum 35 years period LV networks, maximum 20 years period
Duration of tariff setting regime 3 years
Form of determination (distributor propose/regulator decide)
Regulator decides
Scope for appeal regulatory decision No, except for the hearing of the Tariff Board that issues an Opinion on the tariff proposal
2.2. Main incentive properties of the distribution regulatory model
The NRA defines the annual allowed revenues for the regulatory period. Operating
expenditures (OPEX) are defined in the first year of regulatory period and updated
annually with RPI and X factor. The definition of x factor is based on benchmarking
studies through the application of non‐parametric methods and the analysis of
performance with comparison to efficiency targets. Capital cost (CAPEX) and
investments are assessed each year. The tariffs are updated accordingly.
The OPEX that are included on the allowed revenues of distribution activity are based on
assumptions of the following outputs:
Energy delivered through the distribution network
Average annual number of consumers connected to the distribution network
Quality of service
Level of losses
About the CAPEX, in the allowed revenues the NRA accepts all the investments paid by
DSO that are included in the RAB. The asset base considers the book value of assets.
Costs with metering devices are not accepted in the RAB according to the Portuguese
Law (Metering activities are not recognized for remuneration of DSO activities).
The following key regulatory incentives apply for the DSOs:
Incentive to reduce operating cost. There is an X factor to update the OPEX, however
innovative Investments have a remuneration premium and the x factor in OPEX is
increased so that the gain to the company is also a gain to consumers
The concession fees and the cost with restructuring plans of human resources are
accepted outside the price cap methodology
At the same time the following tools are provided to mitigate risks:
Regulatory system does not place the volume risk only on the DSO. Energy delivered
through the distribution network is one of the drivers included in the price cap
mechanism. By this way the risk of energy fluctuations is partially shared between the
DSO and consumers.

531
Until 2012, the role of NRA in quality of electricity distribution was focus on the
supervision of compliance with the quality of service code. In 2013, the NRA published a
new quality of electricity code with guaranteed standards (technical and commercial).
Allowed revenues are calculated two years later based on real values and increased (or
decreased) if the DSO performs better (or worse) than some predefined quality targets.
Automatic compensations are granted to consumers in case some guaranteed quality
standards are not met. Costs of those compensations are not included in the allowed
revenues of the DSOs. DSO can charge customers for a compensation in case of absence
of the customer during appointments to visit customers’ premises and in case of failure
on clients’ premises wiring for which customers are responsible.
2.3. Determination of cost of service parameters
The approach to determining key cost of service parameters are summarized in the
following table.
Table 375: Approach to key cost of service parameters
Parameter Approach
Form of price control Capital costs are subject to “cost reimbursement”, while operating cost are calculated in year one of the regulatory period and subject to an “incentive based” X factor system.
Regulatory asset base In the asset base is considered the book value of assets. Costs with metering devices are not accepted in RAB (Portuguese law).
Capital expenditure In order to assess the DSO’s investment requirements an ex‐ante analysis is performed on several indicators (quality of service, operational efficiency, network efficiency and security of supply). Furthermore the regulator supervises the schedule, the budget and the execution of the investment projects assessing their impact on the above mentioned indicators. The selection of the project investments is made by the DSO according to a Cost‐Benefit analysis. No ex‐post assessment of “usefulness” is carried out. All the investments paid by DSO are included in the RAB (Costs with metering devices are not accepted in RAB) and therefore accepted in the allowed revenues.
Approach to operating expenditure The definition of x factor is based on benchmarking studies through the application of non‐parametric methods and the analysis of performance with comparison to efficiency targets.
Form of WACC applied Nominal, pre‐tax WACC
Additional revenue items (where applicable)
The adjustment between the allowed revenues (based on estimated information) and actual revenues (recalculated with real information) are included in the allowed revenue two years later corrected by a financial compensation.

532
The following formula is applied in determining the weight average cost of capital
WACC:
ED
DR
ED
E
T
RWACC D
E
1
Where:
RD: is the cost of debt. Calculated according to the next formula:
DFD RPRR
RF: is the risk free rate (10 year yields for countries with AAA rating. Average over a 5
years period).
RPD: is the debt risk premium (Default spread for the theoretical optimal gearing value).
The debt leverage (Ratio E/D) is set at target considered as theoretical optimal value by
the regulator. (50%)
RE: is the real price of equity and own funds calculated according to the formula:
MEFD RPRR
RPM: is the market risk premium shows investor risk as the difference between the
yield of a country's market portfolio and the risk‐free rate of return. The value is bases
on benchmarking and market analysis.
βE is weighted ratio β, which defines the sensitivity of a company share to the market
risk, taking into account the income tax rate and the debt share, calculated according to
the formula:
E
DTAL )1(1
BA. Bottom‐up Betas based on benchmarking of similar companies and market analysis
T is the effective tax rate. (National level in the beginning of the regulatory period)
3. Tariffs for distribution services
3.1. Distribution tariffs
The regulator is in charge of setting the distribution tariffs (based on allowed revenues).
Contracted power, average peak power, active energy, differentiated by time period and
seasonal period, and reactive energy are the price variables. Together they allow to pass
on to consumers the multiplicity of factors that affect the costs of distribution networks.
There are three distribution network tariffs according to the voltage level. For each
distribution network (HV, MV and LV) the prices of capacity charges (contracted power
and average power in peak hours) are calculated through the long run average
incremental costs methodology.

533
The costs of the network sections closer to the delivery points are recovered by the
contracted power price, measured on short periods of time, as 15 minutes, because the
design of the peripheral sections is conditioned by the behaviour of a small number of
consumers (in some cases , only one consumer). The costs of the more central network
sections are recovered by the prices of average power in the periods of higher demand.
In fact, the most central network sections are used by a large number of clients and, due
to reduced synchronization of the peak occurrences of 15 minutes of each consumer
(annually or monthly), we may consider that the individual behaviour of a consumer
only affects the design of these more central sections of the network in proportion to its
average peak power on a wider period of time, coincident with the network aggregated
peak and not through its annual peak power, or even monthly. For these reasons, the
power measured in a more wide period of time, coincident with the time periods where
the network peak powers are observed, is a variable more adequate than the annual
peak power of each consumer to transmit to consumers the costs associated with the
more central sections of the distribution network, as well as the costs of the upstream
networks imputable to each voltage level.
The active energy delivered on each time period causes losses on distribution networks,
different in size and cost for each time period. Hence some investments are needed
because of losses. Technical losses depend on a set of factors, namely on the type of
network, underground or aerial, and on power, once losses are proportional to the
square of power. Being aware that losses, and its economic value, vary considerably
with the time and seasonal period of consumption, the adequate billing variables to give
consumers the adequate economic signal of the cost of losses are active energy, by time
period and seasonal period.
The reactive energy supplied (inductive demand) is a variable which should be used on
the billing of the network use on peak and half‐peak time periods, because its
compensation allows the reduction of the electric system global costs, either on the
minimization of energy losses on the peripheral network sections, or on its
reinforcement.
Concerning reactive energy received (capacitive demand), its compensation may also be
desirable in off‐peak periods, because it may lead to overvoltage situations on the
delivery points.
The details of distribution tariff by voltage class and their components are summarized
in section 1.2 Key figures on revenue and tariffs.
Various other aspects of distribution tariff setting are summarized in the table below.

534
Table 376: Approach to key issues in setting distribution tariffs
Issue Approach
Treatment of distribution losses Losses are covered by requiring each entity responsible for balance to deliver more power than the one consumed by its loads.
Presence of uniform tariffs The same tariff for consumers everywhere in the country. No tariff differentiation according to DSO.
Presence of non‐linear tariffs No, all tariff components are linear.Energy component is differentiated by time period (peak, half‐peak, off‐peak and super off‐peak times) and seasonal period.
Presence of regulated retail tariffs End‐user regulated tariffs published by ERSE for all customers ceased to exist on the 1st of July 2013. Until the end of 2015, consumers who have not chosen a supplier from the market are subject to the application of transitory tariffs, which may be revised quarterly by ERSE and subject to an incentive to encourage the transition of customers from the regulated market to the liberalized market. .
Presence of social tariffs Social network tariffs are implemented. A discount is given on the price of contracted power. Producers pay the burden.
Generators connected to the distribution network do not pay distribution tariffs, they
only pay generator specific transmission tariffs. There are not special incentives in
network tariffs for large users like power plants.
The distribution tariffs are published at (only available in Portuguese): http://www.erse.pt/pt/electricidade/tarifaseprecos/2014/Documents/Diretiva%2025‐2013.pdf
3.2. Connection charges
Key issues in the setting of connection charges are set out in the table below.
Table 377: Summary of key issues relating to connection charges
Issue Approach
Determination of charges
Type of charges (shallow/deep) Connection charges are deep for consumers and generators.
Methodology adopted to determine connection costs
Generators: Connection costs are calculated case by case and paid by the generators. Large consumers (S>=2 MVA): Connection costs are computed case by case and distributed between the DSO and the consumers on an agreement basis. To determine the connection cost in Generator and Large consumers, DSO makes an estimate but the

535
Issue Approach
client can ask the regulator to set the price in case he does not agree with the DSO's estimate. Small consumers (S<2MVA): Part of the cost is supported by the consumer and the other by the DSO taking into account the length of the connection, the demanded power and the use of the connection (exclusive and/or shared). There are a standard connection costs approved by the regulator.
Hosting capacity Scope to refuse connection DSO must accept all the connection requests once verified the technical and legal conditions.
Requirements to publish hosting capacity
No
Targets and/or incentive schemes to enhance hosting capacity
There are no incentive schemes to enhance hosting capacity. DSO is assumed to have a duty to connect all the requested capacity.
4. Distribution system development and operation
4.1. Distribution system development
The key features of distribution system planning are summarized below.
Table 378: Approach to distribution planning
Issue Approach
‐ Form of distribution planning document
According to the national legislation, the distribution system development plan is submitted every two years to the regulator which held a public consultation. The last investment plan proposed by the DSO for the period 2015‐2019, similarly to what happened to the TSO's one, was released by the
In Portugal, according to the national legislation, the distribution system development
plan is submitted every two years to the regulator which held a public consultation.
After collecting the responses, the regulator issues a reasoned opinion, proposing all
modifications considered relevant to the minister responsible for the energy sector,
which approves the plan.
DSOs have full responsibility for metering and own the meters.
There are some massive smart meters pilot projects in Portugal. A review of cost‐
benefit analyses is expected in 2014.

536
Issue Approach
regulator to public consultation
After collecting the responses, the regulator issues a reasoned opinion, proposing all modifications considered relevant to the minister responsible for the energy sector, which approves the plan.
The plan time horizon is 5 years and the voltage levels concerned are Medium Voltage and High Voltage.
The distribution network plan considers 4 main vectors of interest:
Quality of service, network efficiency, operational efficiency and security of supply
‐ Key responsibilities for its development Once approved (see previous answer), the DSO´s are responsible for implementing their network development plans, and the regulator supervises the schedule, the budget and the execution of the investments projects.
‐ Degree of integration with renewables plan
Renewable generation targets are set by the Government at national level. These targets are converted into planned facilities/connections by promoters and are explicitly taken as an input in the distribution development plan.
‐ Relationship with consumption trends The evolution of consumption in the distribution area is explicitly considered in the development plan based on a security of supply monitoring annual report defined by the legislation.
‐ Relationship with quality of service targets
Quality of service targets are explicitly taken as an input in the distribution development plan which quantifies the investments related to the quality objectives in the distribution area.
‐ How trade‐offs between network development and alternative technologies are treated
The distribution network development plan reports the decisions of the DSO and the corresponding operational savings, divided by project. The analysis on which those decisions are based are not public.
‐ Requirements to integrate cost benefit analysis
No. The network development plan reports only the select investment projects selected by the DSO. The analysis on which those decisions are based are not public.
4.2. Distribution system operations
The key features of distribution system operations are summarized below.
Table 379: Approach to distribution planning
Issue Approach
Requirements for dispatch of renewable plants connected to DSO network
DSO´s do not has any control on embedded generators. DSO is responsible for the security of their system. In case of network constraints the DSO may be forced to require generators to disconnect.
Possibility to dispatch flexible loads No. Flexible loads are controlled by the

537
Issue Approach
Transmission System Operator
Other sources of flexibility open to DSO The sources of flexibility that DSOs have access to are capacitor banks and transformer taps for voltage control. Additionally, in coordination with the measures of the transmission system operator to control the system frequency, the DSO has also relays of automatic load shedding.
4.3. Metering
Key issues regarding metering, and the role of the DSOs, are set out in the following
table.
Table 380: Key approach to metering
Issue Approach adopted
Discos role in metering DSOs have full responsibility for metering and own the meters.
Monopoly services in the metering Yes
Smart metering functionality The main features of the smart meters will be:
Quarter of an hour measurement, but only in case the customers do agree to this
Remote reading
Remote disconnection/reconnection of customers
Remote control of the maximum power that can be withdrawn
Local port to send real time consumption, but only in case the customers do agree to this information to a local screens or computers
The first economic evaluation of long‐term costs and benefits associated with the smart
metering roll‐out has been completed in 2012, but a review is expected during 2014.
Portugal continues with the deployment of large‐scale smart metering pilot projects.
Among these, the InovGrid project is covering to date 31000 Low Voltage customers
equipped with smart meters. The integrated and intelligent electricity system that
started in the municipality of Évora, will be developed in another seven regions in
Portugal with the additional installation of 100000 smart meters.

538
Country Report – Portugal (Gas distribution)
1. Overview of to the distribution sector
1.1. Institutional structure and responsibilities
In Portugal there are 11 DSO´s which operate with regional scope. The DSO´s are
delivering gas to 1,341 million of customers. Total energy consumption equivalent in
2013 was 25,152 TWh. There are also 11 Last Resort Suppliers, which belong to the
same company groups of the DSOs and operate in the same geography.
Generally, all DSO are legally unbundled from storage, regasification, transmission,
supply and other activities in accordance with the rules of unbundling laid down in the
Article 26 of Directive 2009/72/EC. Consequently DSO´s with more than 100,000
customers are legally unbundled from the last report supplier.
For DSO´s with less than 100000 customers, there is only accounting unbundling from
the last resort supply activity. Regulated accounts are audited by external entities. In
these cases, the DSO´s are also the regulated last resort suppliers.
Summary data on industry structure is set out below.
Table 381: DSO characteristics
Total number DSOs
Ownership unbundled
Legally unbundled
Less than 100000 customers
Share of total demand
Portugal 11 4 7 Total consumption delivered at
distribution level represents 47%
of total consumption, which includes also consumers connected at
transmission level
In Portugal, there are 11 DSO that operate in delimited regions. DSO´s with more
than 100000 customers are legal unbundled according EU directives. Small DSO´s
have only unbundling of accounts.
Distribution activity is regulated by ERSE which sets and approves the regulatory
methodology according to the general principles of the law.

539
The responsibility for setting distribution tariffs and allowed revenues is spread between
the following jurisdictions:
The NRA, Entidade Reguladora dos Serviços Energéticos (ERSE) is responsible for the calculation of allowed revenues and for setting the tariffs for gas distribution. The NRA defines and applies the methodology and sends proposal to the Tariff board that includes the allowed revenues of regulated activities, tariff structure, prices, etc.
Tariff Board, Stakeholders including regulated companies, members of consumer associations and Government entities. The NRA receives the opinion of the Tariff Board before taking its own decision.
The Ministry/Government issues principles in the primary law. Imposed legal obligations to the DSO that could impact in the allowed revenues.
The breakdown of responsibilities relating to tariff setting is summarized in the table
below.
Table 382: Legal basis for tariff structure – Roles and Responsibilities in setting distribution tariffs
Actor Allowed revenues
(tariff level)
Tariffs (tariff structure)
Connection charges
DSO
Tariff Board1
Also involved Also involved Also involved
Government2 Defines main principles
Defines main principles
Defines main principles
NRA X X X
X = main responsibility; other options to fill the table: sets rules; monitors ex‐post; defines main principles;
calculates for NRA approval; also involved;
1The Tariff Board is where the regulated companies of the natural gas sector and consumers’ associations
are represented, to discuss regulation issues and the regulator’s proposals, including codes and tariffs.
2 Government approved the statutes of the regulator and the gas sector law where the main tariff principals
are set. These are general principals and do not prescribe how to calculate tariffs in detail.
1.2. Key figures on revenue and tariffs
In the distribution activity the allowed revenues in Portugal were € 302 million from
July/2012 to June/2013 (Period called “gas year”). For the period from July/2013 to
June 2014, the allowed revenues were € 309 million.
The distribution costs are not treated separately between metering, distribution and
commercial service.
In Portugal there are three distribution tariff groups, defined according to pressure level
and annual consumption:
Medium pressure (relative pressure: 1 bar < p < 20 bar)
Low pressure and annual consumption above 10000 m3

540
Low pressure and annual consumption under 10000 m3
For medium pressure and Low pressure for consumers with annual consumption >10000
m3, there are four tariff options:
Long utilization:
o The capacity term is paid for a 12 months period and considers the maximum
used capacity in the last 12 months.
Short utilization:
o The capacity term is paid for a 12 months period and considers the maximum
used capacity in the last 12 months.
o The short utilization used capacity price is lower than the long utilization used
capacity price, due to a transfer to the energy price component, which is higher
in this option, comparing to the long utilization energy price.
Flexible:
o Flexible monthly (exclusively monthly):
There is no annual base capacity booking.
The monthly capacity equals the corresponding month maximum used capacity.
In the summer (April to September) the monthly capacity price is equal to the used
capacity price of the long utilization tariff option.
In the winter (October to March) the monthly capacity price is 2x the used capacity price
of the long utilization tariff option.
o Combined booking of annual base capacity and additional monthly capacity
(exclusively in the summer months):
The annual base capacity must equal the maximum capacity in the
winter months (October to March) of the last 12 months.
The additional monthly capacity in the summer months (April to
September) is the difference between the maximum used capacity in
that month and the annual base capacity.
The annual base capacity price is equal to the used capacity price of the
long utilization tariff option.
The additional monthly capacity price in the summer months (April to
September) is equal to the used capacity price of the long utilization
tariff option.
Distribution tariffs for medium pressure and Low pressure >10000 m3 include the
following components:
Fixed term, in Euros per month
Energy term, in Euros per kWh. Time period differentiation (Peak and off peak)
Used capacity term, in Euros per kWh/day per month. The used capacity term of the
monthly flexible distribution tariff is differenced per two year seasons.
For Low pressure and annual consumption <10000 m3, there are also four tariff
subgroups according to energy consumption:

541
Scale 1. Annual consumption less than 220 m3
Scale 2. Annual consumption between 221 m3 and 500 m3
Scale 3. Annual consumption between 501 m3 and 1000 m3
Scale 4. Annual consumption between 1001 m3 and 10000 m3
Distribution tariffs for Low pressure < 10000 m3 include the following components:
Fixed term, in Euros per month
Energy term, in Euros per kWh. No time differentiation.
The current prices of distribution tariffs, in gas year 2013‐2014, are presented in
annexes.
A breakdown of revenue by customer category, including information on available tariff
components and the number of customers in each category is set out in the table below.
The revenues presented in the table refer only to distribution tariff or distribution costs
and not to the whole third‐party access tariff (TPA tariff).
Table 383: Tariff components, customers and revenues per customer class 2013‐2014.
Customer classes Tariff components Number of customers
Revenue (€ million)
Medium pressure (MP) Fixed term, Energy term and Used capacity term
399 72,772
Low pressure (LP) higherthan 10 000 m3
Fixed term, Energy term and Used capacity term
4061 69,073
Low pressure (LP) less than10 000 m3
Fixed term and Energy term 1336577 167,098
Total ‐ 1341037 308,943
The breakdown of energy volumes and distribution revenue by customer category are
set out in the charts below.

542
Figure 76: Proportion of energy and revenue accounted by customer categories
The figure above shows that in 2013, Low pressure group with annual consumption of
less than 10,000 m3 (Typical Household consumers) has paid on average 54% of
distribution costs and has consumed only the 16% of gas. In the other hand, medium
pressure group (typical large industrial consumers) has paid on only 24% of the
distribution costs and has consumed 69% of the energy.
The typical network tariff in 2013 for Households, Small industrial and large industrial
customers is illustrated below. Note that the average cost given in the table refers only
to distribution tariff or distribution costs and not to the whole third‐party access tariff
(TPA tariff). Customers pay the TPA tariff which includes also transmission network costs
and global use of the system tariff components.
Table 384: Breakdown of annual charges – typical customer types, 2013‐2014 (€)
Customer type Notional Energy usage
Fixed term
Energy term Used capacity term
Total
Households with annual consumption of 15,000 kWh
15,000 kWh (Household
consumption in Portugal is below this value)
29€(2,43€/month)
507 €(0,03376014
€/kWh)
536€
Industrial Consumer with an annual consumption 50,000 MWh and 7,000 use
50,000 MWh5116 € (426,29 €/mont
35748 € (0,00071495
€/kWh)
118557 € (0,057632
EUR/(kWh/day)/month)
159421 €

543
Customer type Notional Energy usage
Fixed term
Energy term Used capacity term
Total
hours h)
Industrial Consumer with an annual consumption 90,000 MWh and 7,000 use hours
90,000 MWh5116 € (426,29 €/mont
h)
64346 € (0,00071495
€/kWh)
213403 € (0,057632
EUR/(kWh/day)/month)
282865 €
The resulting average tariffs per kWh are illustrated below.
Figure 77: Average network charges (€/kWh), 2013‐2014
2. Regulation of distribution activities
2.1. General overview
Thedecree‐law nr. 30/2006, amended by decree‐law 230/2012, provides the main rules
of the Portuguese natural gas system, including distribution activities. The law
establishes the main role of DSO. According to article 34, the DSO´s shall: “Provide to
interested parties, without discrimination, access to distributions networks, based on
The NRA is responsible of define, approve and publish the Tariff Code. This code is
presented to public consultation and to the Tariff Board for an opinion. Ultimately, the
NRA approves and publishes the code.
The regulatory model of the distribution natural gas sector is a mix of two. Capital costs
are subject to “cost reimbursement” while operating cost are subject to an “incentive
based” mechanism for controllable costs. The regulatory period is three years long.
There are DSO operating in a concession regime and another under licence regime.

544
tariffs applicable to all customers in terms of the Access to Networks, Infrastructures
and Interconnections Code.”
The NRA (ERSE) is the administrative authority responsible for regulating the energy
sector and has a range of powers and responsibilities defined by the law. “The mission
of ERSE is to regulate the electricity and natural gas sectors, being an effective tool for
the efficient and sustainable operation of the respective markets while ensuring the
protection of consumers and the environment, transparently and impartially”. The NRA
scope is focus “… protecting consumers’ rights and interests as regards prices, services
and service quality; monitoring compliance with public service obligations and all other
legal, regulatory and similar requirements; guaranteeing economic and financial balance
to the activities of the regulated sectors exercised in the public interest companies
within the framework of appropriate and efficient management; promoting competition
in the energy markets between all their players”.
In Portugal, there are licence and concession regimes. Five of the eleven DSO´s are
subject to a concession regime for a period of 40 years and other 6 DSO´s are subject to
a license regime for a period of 20 years.
The NRA is responsible for publishing the Tariff Code, which includes matters such as
calculation of allowed revenues, tariff design, tariff setting methodologies and
information requirements. This Tariff Code is submitted to public consultation and is
subject to an opinion from the Tariffs Board prior to its approval.
The public consultation procedure for tariff setting is defined in the Regulator’s statutes
and in the Tariff Code. By April 15 of every year, the NRA issues a proposal, along with
justification documents, to the Tariff Board. This board replies with an Opinion by May
15. The NRA acknowledges the opinion and issues a final decision which publishes in its
own webpage and on the Official Journal, by June 15.
Regulated tariffs are calculated for the period of one year going from July to June. The
allowed revenues are set on calendar year basis. The regulatory period is three years
long.
Key features of the regulatory regime are set out in the following table
Table 385: Main features of the regulatory regime
Issue Approach
Type of regime (concession/licence) Concession, maximum 40 years period License, maximum 20 years period The assets are property of the Portuguese Government as concession grantor.
Duration of tariff setting regime 3 years
Form of determination (distributor propose/regulator decide)
Regulator decidesTariff board could propose and give their opinion. This board includes DSO ´s representatives and other stakeholders.
Scope for appeal regulatory decision No

545
2.2. Main incentive properties of the distribution regulatory model
The broad regulatory model implement in Portugal is a mix of “cost reimbursement” and
“incentive based”. Capital costs are subject to “cost reimbursement”, while operating
cost are subject to an “incentive based” for controllable costs.
The following key regulatory incentives apply for the DSOs:
Price cap regulation for OPEX. OPEX cost base is fixed in the beginning of regulatory
period (every 3 years) and updated annually with RPI ‐X factor and evolution of the cost
driver set. The definition of x factor is based on benchmarking studies through the
application of non‐parametric methods and the analysis of performance with
comparison to efficiency targets. The tariffs are updated accordingly. Different X factors
in the price cap formula are set for different DSO, regarding the performance and the
maturity of each DSO.
Rate of return regulation for CAPEX, on annual basis and with adjustments by real values
ex post. Each DSO for year t‐2 is adjusted ex post in year t based on real values. The
difference between forecasted revenues and real revenues of year t‐2 are included on
allowed revenues of year t added by a financial compensation.
The OPEX that are included in the allowed revenue of distribution activity are based on
assumptions of the following outputs:
Energy delivered through the distribution network
Average annual number of consumers connected to the distribution network
In the other hand, CAPEX included on the allowed revenues are assessed every year.
At the same time the following tools are provided to mitigate risks:
Regulatory system does not place the volume risk only on the DSO. Energy delivered
through the distribution network is one of the drivers included in the price cap
mechanism. By this way the risk of energy fluctuations is partially shared between the
DSO and consumers.
There is no regulatory incentive on quality of supply. Automatic compensations are
granted to consumers in case some guaranteed quality standards are not met. These
compensations costs are not included in the allowed revenues of the DSO´s.
2.3. Determination of cost of service parameters
The approach to determining key cost of service parameters are summarized in the
following table.

546
Table 386: Approach to key cost of service parameters
Parameter Approach
Form of price control Capital costs are subject to “cost reimbursement”, while operating cost are calculated in year one of the regulatory period and subject to a “incentive based” Price cap system.
Regulatory asset base In the first regulatory period the asset base of DSOs was re‐evaluated by the Government, under the concessions contracts. New investments are considered in the RAB by its book values.
Capital expenditure Capital costs are assessed every year. There are ex‐post real values adjustments. DSO investment plans are subject to ministerial approval.
Approach to operating expenditure Opex cost base is fixed in the beginning of each regulatory period and updated both with RPI‐X and the evolution of the cost‐drivers set
Form of WACC applied Nominal, pre‐tax WACC
Additional revenue items (where applicable) The adjustment between the allowed revenue (based on estimated information) and actual revenue (recalculated with real information) is included in the allowed revenue two years later corrected by a financial compensation.
The following formula is applied in determining the weight average cost of capital
WACC:
ED
DR
ED
E
T
RWACC D
E
1
Where:
RD: is the cost of debt. Calculated according to the next formula:
DFD RPRR
RF: is the risk free rate. This value is based on German and Portuguese government
bonds. In Average over a 5 years period.
RPD: is the debt risk premium. This value is based on companies’ analysis.
RE: is the real price of equity and own funds calculated according to the formula:
MEFE RPRR
RPM: is the risk premium for mature market country spread. This value is based on
international market analysis and expert reports.

547
βE is weighted ratio β, which defines the sensitivity of a company share to the market
risk, taking into account the income tax rate and the debt share, calculated according to
the formula:
E
DTAL )1(1
BA. Bottom‐up Betas based on benchmarking of similar companies and market analysis.
T is the effective tax rate. National level in the beginning of the regulatory period.
The debt leverage (Ratio E/D) is based on regulated companies´ capital structure.
3. Tariffs for distribution services
3.1. Distribution tariffs
The regulator is in charge of setting the distribution tariffs, based on the calculation of
allowed revenues. The calculation of prices is based in the methodologies detailed in the
Tariff Code approved for the regulatory period, which has been put under public
consultation. Each year the tariffs are subject to consultation through the Tariff Board.
There are three distribution networks tariffs according to pressure and annual
consumption. These distribution network tariffs are Medium pressure (MP), Low
pressure (LP) with annual consumption higher than 10,000 m3 and Low pressure (LP)
with annual consumption less than 10,000 m3. The allocation of distribution costs to
medium pressure (MP) and low pressure (LP) distribution tariffs involves the
determination of long run average incremental costs for the MP network and for the LP
network, whereas for the latter, values are also different for the upper and lower 10 000
m3/year deliveries. These incremental costs are further differentiated by:
Incremental cost of used capacity
Incremental cost of energy in peak periods
Incremental cost of energy in off‐peak periods
Incremental cost per client, connected to the peripheral section, not incorporated into
the price of the connection charge; and
Incremental cost per customer, associated with meter reading and data processing
The regulator is in charge of setting the distribution tariffs according to the Tariff
Code.
The distribution tariffs are setting in such a way that their components reflects the
structure of marginal or incremental costs and also enables the recovery of allowed
revenue for each regulated activity.
There are three groups according pressure and annual consumption.

548
The Tariff Code also establishes the same distribution tariffs for all consumers,
regardless of the DSO that delivers the gas. The tariffs are determined in an aggregated
manner that is based on the total allowed revenues and on the total deliveries of all
DSO´s.
A regulated revenue reconciliation mechanism ensures every DSO gets its own allowed
revenues.
The general structure of gas tariffs defined in the Tariff code includes the following
components/terms:
Fixed term, in Eur per month
Energy term, in Eur per kWh. Time period differentiation (Peak and off peak)
Used capacity term, in EUR per kWh/day per month. The used capacity term of the
monthly flexible distribution tariff is differenced per two year seasons.
The details of distribution tariff groups and their components are summarized in section
1.2 Key figures on revenue and tariffs.
Various other aspects of distribution tariff setting are summarized in the table below.
Table 387: Approach to key issues in setting distribution tariffs
Issue Approach
Treatment of distribution losses Losses are made up for by requiring each entity responsible for balancing to deliver more gas than the one consumed by its loads.
Presence of uniform tariffs The same distribution tariff applies to consumers everywhere in the country. No distribution tariff differentiation according DSO.
Presence of non‐linear tariffs No, all tariff components are linear. Energy component is differentiated in two periods: off peak (august) and peak (rest of the year). The used capacity term of the flexible tariff is differenced per two year seasons.
Presence of regulated retail tariffs In compliance with national legislation and according to the calendar defined by the Government, end user tariffs published by the NRA for all customers ceased to exist on the 1st of July 2013 with the extinction of regulated end user tariffs to customers whose annual consumption is less than 500 m3, concluding the liberalization process of the natural gas retail market. Until the end of 2015, the NRA sets transitory tariffs every quarter to encourage the transition of customers

549
Issue Approach
from the regulated market to the liberalized market. Economically vulnerable customers will, however, continue to have access to regulated social tariffs, subject to the ceiling on tariff variation established annually by the Government. These vulnerable customers include consumers who are encompassed in a restricted group of government social support instruments.
Presence of social tariffs Social network tariffs are implemented. A discount is given on the fixed term and on energy. Consumers pay the burden
There are not special incentives in network tariffs for large users, but flexible tariffs have
been introduced to give more flexibility to these consumers.
Distributions tariff are published on legal NRA directive and are also available on their
website (only available in Portuguese).
http://www.erse.pt/pt/gasnatural/tarifaseprecos/201407a201506/Documents/Diretiva%20ERSE%206‐2014%20(Tarifas%20GN%202014‐2015).pdf
3.2. Connection charges
Key issues in the setting of connection charges are set out in the table below.

550
Table 388: Summary of key issues relating to connection charges
Issue Approach
Determination of charges
Type of charges (shallow/deep)
Connection charges are deep.
Methodology adopted to determine connection costs
Large consumers (annual consumption higher than 10000 m3): the cost is paid by the consumer according to a methodology established by the NRA which takes into account the pressure level, the investment and development plans of the distribution network and the extra cost of the connection. Small consumers (annual consumption less than 10000 m3 and length of the requested connection above 100 m): the cost is estimated by the DSO and paid by the consumer. Small consumers (annual consumption less than 10 000 m3 and length of the requested connection below 100 m): the cost of the first 10 m is paid by the DSO; the remaining cost is paid by the consumer based on prices approved by the regulator.
Hosting capacity Scope to refuse connection DSO must accept all the connection requests once verified the technical and legal conditions, except for small consumers if the length of the requested connection is above 100 m.
Requirements to publish hosting capacity
No
4. Distribution system development
4.1. Distribution system development
The key features of distribution system planning are summarized below.
In Portugal, the Distribution System Plans are subject to a ministerial approved. NRA
participates in the assessment of the Plan(s) with a reasoned opinion. The
implementation of a new assessment/approval process is taking in place during 2014.
DSO´s have full responsibility for metering and own the metering devices. The cost‐
benefit analysis concluded that in Portugal the investment in smart metering is not

551
Table 389: Approach to distribution planning
Issue Approach
‐ Form of distribution planning document
According to the national legislation (decree‐law nr 231/2012, of October 12), the investments plans of the distribution companies are subject to ministerial approval.
The NRA participates in the assessment of the Distribution Network Investment Plan(s) with a reasoned opinion, after conducting a public consultation.
The implementation of the assessment/approval process for the investments on the distribution networks is taking place in 2014, and a reviewing process will be held every two years.
The final and the consultation versions of the Distribution Network Investment Plan(s) should be published, according to Decree‐Law nr 231/2012 of October 12.
‐ Key responsibilities for its development Once approved (see previous answer), the DSO´s are responsible for implementing their network development plans and the regulator supervises the calendar, the budget and the execution of the investments projects.
‐ Degree of integration with renewables plan
Not applicable.
‐ Relationship with quality of service targets
The investment plan(s) does not explicitly illustrate the relationship between each (type of) investment and the benefits in terms of increased quality of services. However, some of the investments considered on the plans aim at maintaining a high level of continuity of supply
‐ How trade‐offs between network development and alternative technologies are treated
The investment plans for the distribution grids are based on conventional technologies. Up to now no relevant initiatives were taken regarding investment on smart grid technologies for gas.
‐ Requirements to integrate cost benefit analysis
The investment plans for the distribution grids present aseries of indicators such as:
EUR per new costumer
EUR per additional KWh supplied
EUR per additional length (m) of grid installed
Length of additional pipeline per new costumer
Others In general terms, the investment decisions are based on those indicators.
4.2. Metering
Key issues regarding metering, and the role of the DSOs, are set out in the following
table.
Table 390: Key approach to metering
Issue Approach adopted
Discos role in metering DSOs have full responsibility for metering and own the meters.
Monopoly services in the metering Yes
Smart metering functionality Not applicable

552
Portugal concluded in 2013 a cost benefit‐analysis with negative results and decided not
to proceed with large‐scale roll‐out of smart metering systems for natural gas. No smart
meters installed so far.
5. Annexes
The following tables present the regulated tariff prices for the gas year jul2013‐jun2014,
only referring to the distribution network cost component. Each component of the third‐
party access tariff is published separately by the regulator. The TPA tariff results from
adding all the components. Hence, users pay not only the distribution network costs but
also the transmission network and the global use of the system tariff components.
Nevertheless, here are presented the distribution network costs only.
5.1. Distribution network tariffs 2013‐2014. Medium pressure
Daily Monthly(EUR/kWh) (EUR/kWh) (EUR/(kWh/day)/month)
426,29 426,29 0,00077826 0,00001856 0,057632426,29 0,00077826 0,00001856 0,057632
Short utilization 426,29 0,00681756 0,00001856 0,01152610.000 - 100.000 460,44 0,00999942 0,00923971
620,96 0,00503418 0,004274480,00389739 0,00001862
Short utilization 0,00389739 0,00001862Flexible 0,00389739 0,00001862
10.000 - 100.000 0,00389739 0,000018620,00389739 0,00001862
Scale 1 0 - 220
Scale 2 221 - 500
Scale 3 501 - 1.000
Scale 4 1.001 - 10.000
Long utilization (monthly measurement)
Long utilization (monthly measurement)
Fixed termMeasurement
Off-peak
(EUR/month)
Distribution Network Tariff MP
MP
Long utilization (daily measurement)
0,003753320,00375332
Distribution Network Tariffs - Medium Pressure
TariffsTariffs options
Scale (m3/year)
EnergyUsed Capacity
Peak
≥ 100.001
LP>
Long utilization (daily measurement)
≥ 100.001
LP< Other
0,003753320,00375332
Distribution Network Tariffs - Medium Pressure (Flexible monthly)
Daily Monthly(EUR/kWh) (EUR/kWh) (EUR/(kWh/day)/month) (EUR/(kWh/day)/month)
MP Flexible 426,29 0,00077826 0,00001856 0,057632 0,115264
Fixed termMeasurement
TariffsTariffs options
Energy Additional Monthly Capacity
(April-September)
Additional Monthly Capacity
(October-March)Peak Off-peak
(EUR/month)
Distribution Network Tariffs - Medium Pressure (Flexible annual and monthly)
Daily Monthly(EUR/kWh) (EUR/kWh) (EUR/(kWh/day)/month) (EUR/(kWh/day)/month)
MP Flexible 426,29 0,00077826 0,00001856 0,057632 0,057632
Fixed termMeasurement
TariffsTariffs options
EnergyAnnual Base Capacity
Additional Monthly Capacity
(April-September)Peak Off-peak
(EUR/month)

553
5.2. Distribution network tariffs 2013‐2014. Low pressure with annual
consumption higher than 10,000 m3
Daily Monthly(EUR/kWh) (EUR/kWh) (EUR/(kWh/day)/month)
141,61 141,61 0,00569145 0,00010590 0,061100141,61 0,00569145 0,00010590 0,061100
Short utilization 141,61 0,01422862 0,00010590 0,01222010.000 - 100.000 213,27 0,01546741 0,00988187
487,92 0,00963944 0,00405389
Fixed term
(EUR/month)
Distribution Network Tariff LP>
LP>
Long utilization (daily measurement)
Long utilization (monthly measurement) ≥ 100.001
Distribution Network Tariffs - Low Pressure > 10 000 m3/year
Tariffs (m3/year)
EnergyUsed Capacity
PeakTariffs optionsMeasurement
Off-peak
Distribution Network Tariffs - Low Pressure > 10 000 m3/year (Flexible monthly)
Daily Monthly(EUR/kWh) (EUR/kWh) (EUR/(kWh/day)/month) (EUR/(kWh/day)/month)
LP> Flexible 141,61 0,00569145 0,00010590 0,061100 0,122200
TariffsTariffs options
Energy Additional Monthly Capacity
(April-September)
Additional Monthly Capacity
(October-March)Peak Off-peak
(EUR/month)
Fixed termMeasurement
Distribution Network Tariffs - Low Pressure > 10 000 m3/year (Flexible annual and monthly)
Daily Monthly(EUR/kWh) (EUR/kWh) (EUR/(kWh/day)/month) (EUR/(kWh/day)/month)
LP> Flexible 141,61 0,00569145 0,00010590 0,061100 0,061100
TariffsTariffs options
EnergyAnnual Base
Capacity
Additional Monthly Capacity
(April-September)Peak Off-peak
(EUR/month)
Fixed termMeasurement
5.3. Distribution network tariffs 2013‐2014. Low pressure with annual
consumption less than 10,000 m3
peak off-peak(EUR/kWh) (EUR/kWh) (EUR/(kWh/day)/month)
0,00950773 0,00010590 0,0611000 - 220
221 - 500
501 - 1.000
1.001 - 10.000
(EUR/month)
Scale 2 0,96 0,03494815Scale 3 2,39 0,03084184Scale 4 2,43 0,03000682
Distribution Network Tariff LP< 0,22
LP<
Scale 1 0,22 0,03908494
Distribution Network Tariffs - Low Pressure < 10 000 m3/year
TariffsScale
Consumption (m3/year)Fixed term
EnergyUsed Capacity

554
Country Report – Romania (electricity distribution)124
1. Overview of to the distribution sector
1.1. Institutional structure and responsibilities
In Romania there are 8 DSO supplying electricity to about 8,842 millions of customers
covering the whole country. In 2013, the total amount of electricity consumed in the
country was 41,010 TWh.
DSO´s with more of 100000 customers, there are legal unbundling. For small DSO´s with
less than of 100000 customers, there are only functional unbundling.
Summary data on industry structure is set out below.
Table 391: DSO characteristics
Total number DSOs
Ownership unbundled
Legally unbundled
Less than 100000 customers
Exemption* Share of total demand
Romania 8 8 0 NO 100% *exemption from distribution network charges for certain types of grid users, such as low‐carbon generation connected to distribution networks.
The responsibility for setting the allowed revenues tariffs is spread between the
following jurisdictions:
The Parliament, issues principles in the primary law. (Law of electricity and natural gases
no. 123/2012 issued by Parliament)
124 Pending validation from the NRA.
In Romania operates eight legally unbundled DSO, covering the whole territory of the
country.
The main responsible of the definition of the allowed revenue is the NRA. DSO´s
calculates revenues and send approval requests to the regulator.
About distribution tariff, NRA sets tariffs after analysing distribution company
proposals. There are public consultation processes to regulate distribution business

555
The Regulator, ANRE, has the duty and the authority to define the methodologies used to calculate the allowed revenues and approve the revenues calculated by DSO.
The DSO, calculates allowed revenue based in regulator methodology to the NRA approval.
The responsibility for the definition of distribution tariffs is spread between the following jurisdictions:
The Regulator, ANRE, sets and approves tariffs after analysing DSO proposals.
DSO may propose a change in the tariff structure and this new structure may be applied if the regulator accept the new tariff structure, but for a consistent period of time. All DSO apply the same tariff structure.
The breakdown of responsibilities as it related to tariff setting is summarized in the table
below.
Table 392: Legal basis for tariff structure – Roles and Responsibilities in setting distribution tariffs
Actor Allowed revenues (tariff level)
Tariffs (tariff structure)
Connection charges
DSO The DSO calculates and send approval requests to the regulator
May propose a change in the tariff and the NRA should asses the request. All DSO apply the same tariff structure.
The DSO calculates and send approval requests to the regulator
Parliament Defines main principles in primary law
Defines main principles in primary law
NRA Issues a methodology, sets and approves allowed revenues
Main responsibility. Issues a methodology, sets and connection charges
X = main responsibility; other options to fill the table: sets rules; monitors ex‐post; defines main principles;
calculates for NRA approval; also involved;
There are a public consultation processes and participation of DSO on distribution tariff
decision:
In the process of approving or modifying a methodology, the document is put on public
consultation for one month. The methodology is approved by the Regulatory Committee
in a public meeting.
In the process of establishing, the result of the analysis is sent to DSO´s. They are invited
to give their feedback about the analysis and explain their arguments. The NRA can
accept or no their arguments. After that, the tariff proposal from NRA specialized
department is sent to the Regulatory Committee in order to be approved. The
Regulatory Committee of the Regulatory discuss and approves the tariffs in a public
meeting.

556
1.2. Key figures on revenue and tariffs
The distribution activities revenues in 2013 were 1.14 billion of euros. No further split by
activity type is considered in the regulation.
A breakdown of revenue by customer category, including information on available tariff
components and the number of customers in each category is set out in the table below.
Table 393: Tariff components, customers and revenues per customer class
Customer classes Tariff components Number of customers
Revenue
High voltage Energy charge (€/kWh) 256 35421092 €
Medium voltage Energy charge 17852 188134800 €
Low voltage Energy charge 8824027 916063416 €
Total ‐ 8842135 1139619309 €
The breakdown of energy volumes and distribution revenue by voltage level are set out
in the charts below.
Figure 78: Proportion of energy and revenue accounted by customer categories

557
In Romania there is no formal definition of typical consumer category as households, small industrial and large industrial. Customer categories are defined by voltage level: High Voltage, Medium Voltage and Low Voltage. All consumers are charged only a per KWh distribution tariff. According to its electricity
level, a consumer pays the sum of cascaded charges, for example a consumer from LV
pays the sum of charges from HV, MV and LV. Each of the 8 DSO have the different
prices (same structure), according to the allowed revenues.
Table 394: Breakdown of annual charges – typical customer types, 2013 (€)
Customer type
Notional Energy usage
Fixed charges
Capacity charge
Energy charges
Reactive charges
Total
Low voltage 3500kWh No No 159 € (0,04552 €/kWh)
No 159 €
Medium voltage
50MWh No No 700 € (0,014€ /kWh)
No 700 €
High Voltage 24000MWh No No 114240 € (0,00476 €/kWh)
No 114240 €
The resulting average tariffs per kWh are illustrated below.
Figure 79: Average network charges (€/kWh), 2013
0,045
0,014
0,0050,00
0,01
0,01
0,02
0,02
0,03
0,03
0,04
0,04
0,05
0,05
Residential Small commercial Industrial
2. Regulation of distribution activities
Distribution activities are regulated by ANRE. Their main objectives are developing,
approving and monitoring national rules necessary for the functioning of the energy

558
sector, oriented to efficiency, competition, transparency and consumer protection.
The distribution sector is regulated under a price cap regulatory model. DSO profits are
not regulated, so there are reduction cost incentives. There are other incentives as
reduction of losses and quality improvement that impact in DSO profits.
2.1. General overview
According to the Electricity Law No. 13/2007, the electricity distribution shall be carried
out by DSO, legal person and holder of a license. The DSO´s provide non‐discriminatory
electricity distribution services to all network users, ensuring the access to the grid of all
applicants that meet the requirements hereof, while observing the performance
standards and norms provided by technical regulations in force.
“Distribution system operator (DSO) means any person that, under any title, holds a
distribution license that is operates, ensures the maintenance, and, if necessary,
develops the electricity distribution network in a certain area and, where it is applicable,
its interconnection with other systems, and the provide of the long term capacity of the
system to answer to reasonable demands on electricity distribution”.
The NRA (ANRE) is an independent and autonomous administrative regulatory authority
under parliamentary control. Its mission is developing, approving and monitoring
national rules necessary for the functioning of the energy sector, oriented to efficiency,
competition, transparency and consumer protection.
The role of the ANRE, as the regulator, has the following duties, established by primary
law:
Set up mandatory regulations for undertakings in electricity sector
Issue, grant, suspend or withdraw authorisations and licenses for undertakings in electricity sector
Define technical and commercial regulations, ensure users connection to the electricity and gas grid
Establish and approves pricing methodologies and tariffs
pricing methodologies and tariffs
Ensure the monitoring of electric power and gas market operation
Promote renewable energy production
According to this, the distribution sector is regulated under an Incentive‐based, price‐
cap regulatory model, where the DSO estimates tariff, according to the approved
methodologies, and the regulator fixes and approves the final tariffs.
Key features of the regulatory regime are set out in the following table

559
Table 395: Main features of the regulatory regime
Issue Approach
Type of regime (concession/licence) DSO are private owned. Concession refers only to the service providing. The period of concession is 49 years with a possibility to extend the contract for another half of this period. Also they have licence for distribution service for 25 years. Basically, the concession is allocated through a competitive mechanism in an indirect manner, because DSO were privatized through auctions.
Duration of tariff setting regime 5 year
Form of determination (distributor propose/regulator decide)
Distributor proposes/regulator approves
Scope for appeal regulatory decision Public consultation processes
2.2. Main incentive properties of the distribution regulatory model
The regulatory model provides the following incentives:
There is no limit on overall yearly profit
Reduction of OPEX (Operative and maintenance costs). Above 50% of operation and
maintenance costs efficiency gain is transferred to customers, the other 50% to the DSO.
Reduction of distribution network losses. Between 50% and 75% of losses efficiency gain
are transferred to customers, the rest to the DSO.
Quality improvement. Allowed revenues are increased (decreased) if he DSO performs
better (worse) than some predefined quality targets.
A methodology to implement a quality factor that will incentivize operators by
decreasing or increasing the total allowed revenue for each operator according to its
quality performance will be implemented soon.
Otherwise the DSO´s completely bear the costs of unrecognised losses, if the amount of
operation and maintenance costs that exceed the approved level.
At the same time the following tools are provided to mitigate risks:
Yearly correction according to (demand reducing/increasing), on each voltage level. The
influence of the demand changings is taken into account also in the correction of the
cost of yearly losses.
Some costs are considered non‐controllable as:
o Costs with taxes and royalties set according to the legal provisions in force or by
the local authorities
o Contributions to the health fund, special fund and other similar contributions
related to the wages but excluding the alternative health and pension systems
o The regulated transformation/connection, distribution costs generated by the
use of transformers/substations, lines owned by other companies
o Extraordinary costs determined by major force (maintenance caused by
important and not predictable natural events);

560
2.3. Determination of cost of service parameters
The approach to determining key cost of service parameters are summarized in the
following table.
Table 396: Approach to key cost of service parameters
Parameter Approach
Form of price control Price Cap regulation
Regulatory asset base Based on an initially RAB value (2004) at the moment of implementing the incentive based regulation. This value is depreciated for a period of 25 years and actualised with consumer price index. New investments enter with initial book value. The residual values are actualised with consumer price index.
Capital expenditure There are three main categories of investment, based on investment’s importance and necessity. There are also provisions that mention the criteria of accepting the investments The regulator analyzes investment programs submitted by DSO. Overall investment value based on investment programs and are subject to an ex‐ante approval by the regulator.
Approach to operating expenditure NRA used comparative analysis to set the operation and maintenance cost and the level of accepted electricity losses, but these were not based on DEA, COLS or SFA
Form of WACC applied The financial structure in the WACC formula is set by the regulator. There is no adjustment ex‐post
Additional revenue items (where applicable)
The following formula is applied in determining the WACC:
KiCCIT
KpCCPWACC
)1(
Where:
CCP is the after‐tax cost of equity in real terms, recognized by the competent authority
(%)
CCI ‐ the pre‐tax cost of debt in real terms, recognized by the competent authority (%)
Kp ‐ the share of equity in total capital structure, set by the competent authority
Ki ‐ the share of debt in total capital structure set by the competent authority. Ki = (1‐
Kp)
T ‐ the profit tax rate.
CCP = Rf + (Rm ‐ Rf) * , where: Rf ‐ the risk free rate (e.g. interest rate for T‐bonds/T‐bills)

561
Rm ‐ the capital markets risk (return over the market portfolio) (Rm ‐ Rf) is the market
risk premium
β the coefficient that express the correlation between the market return and company’s
return and represents a comparison of the market risk.
The WACC is not review during the regulatory period.
3. Tariffs for distribution services
3.1. Distribution tariffs
DSO is in charge of calculating the distribution tariffs according to the methodology
defined by the regulator. The NRA sets tariffs after analysing distribution company
proposals.
Three categories of costs are identified: HV costs, MV costs, LV costs. Costs (excepting
the electricity losses) are split on each level according to an allocation key determined
by the DSO according to economic causality and direct occurring of costs.
The cost of losses is calculated for each electricity level according to the amount on
losses on each level. The costs on each level (losses plus the other allocated costs) are
recovered through a per MWh tariff component set for each level.
Basically, the distribution tariff consists on an energy component which includes the
distribution losses for each consumers group. There is not use‐time differentiation.
Various other aspects of distribution tariff setting are summarized in the table below.
Table 397: Approach to key issues in setting distribution tariffs
Issue Approach
Treatment of distribution losses Losses are includes in the KWh component
Presence of uniform tariffs Each DSO has their own prices for the same voltage level (according allowed revenues)
Presence of non‐linear tariffs No, All tariff components are linear There are not use‐time differentiation
The NRA is in charge of setting and approval the distribution tariffs according to DSO
proposes.
The methodology to allocate distribution costs is based in cost categorization by
voltage level and regulator methodology.
There are three classes of consumers: HV, MV, LV consumers. The tariffs have only
one energy component. There is no time of use differentiation.
Connections charges for MV and LV consumers pay a fixed fee approved by NRA. For
HV consumers or generators the DSO makes an estimate based on its cost.

562
Issue Approach
Presence of regulated retail tariffs The retail tariffs are regulated only for households until 2017.
Presence of social tariffs No.
Generators connected to the distribution grid do not pay any distribution tariff. There
are not special incentives in network tariffs for large users like power plants.
3.2. Connection charges
Key issues in the setting of connection charges are set out in the table below.
Table 398: Summary of key issues relating to connection charges
Issue Approach
Determination of charges
Type of charges (shallow/deep)
For small generators/consumers, the generator bear the grid connection cost but not the grid reinforcement cost (shallow) For generators, they charge the costs of new infrastructures and the costs of the reinforcement of networks(deep)
Methodology adopted For the connection to low and medium voltage network, there are connection fees approved by the regulator. For larger consumers or generators, connection costs are computed case by case. the DSO makes an estimate based on its cost
Hosting capacity Scope to refuse connection The DSO can refuse connection only if the connection affects the safety of National Electricity System by non‐compliance with the technical and performance standards set out in technical regulations or where the transmission or distribution network lacks the necessary capacity. Refusing must be motivated on objective criteria, properly justified technically and economically.
Requirements to publish hosting capacity
No requirement on the DSO to publish hosting capacity information
Targets and/or incentive schemes to enhance hosting capacity
No
4. Distribution system development and operation
The distribution system development plans are design by DSO´s and approved by the
regulator. In order to be accepted by the regulator, investments should be prudent,
necessary, opportune, efficient and should reflect the market conditions.

563
4.1. Distribution system development
The key features of distribution system planning are summarized below.
Table 399: Approach to distribution planning
Issue Approach
Form of distribution planning document Distribution system development plan notified to the regulator but not approved nor published. Also there are detailed investment plans that can be treated as development plan. They are approved by the regulator and not published.
‐ Key responsibilities for its development DSO´s design and The NRA approves
‐Degree of integration with renewables plan
Distribution network plans are designed by DSO taking into account the connection requests
‐ Relationship with consumption trends Distribution network plans are designed by DSO taking into account the evolution of consumption on the base of their forecasts
‐Relationship with quality of service targets
Distribution network plans are designed by DSO taking into consideration the necessities of ensuring an appropriate level of quality by including the necessary investments. If the quality targets are not reached, DOS receive penalties. Also, it will be implemented soon a methodology to implement a quality factor that will incentivize DSO by decreasing or increasing the total allowed revenue for each operator according to its quality performance
‐How trade‐offs between network development and alternative technologies are treated
DSO should consider the necessity of implementing smart metering infrastructure, so there are trade‐offs imposed by the upper reasonable value of investment that can be accepted in tariff calculation.
‐ Requirements to integrate cost benefit analysis
The network development plan reports only the decisions of the DSOs. In order to be accepted by the regulator, investments should be prudent, necessary, opportune, efficient and should reflect the market conditions.
4.2. Distribution system operations
The key features of distribution system operations are summarized below.
Table 400: Approach to distribution planning
Issue Approach
Requirements for dispatch of renewable plants connected to DSO network
DSO is placed at the third level of dispatching rights, under the command of Den (National Dispatch Center)
Possibility to dispatch flexible loads The DSO is entitled to interrupt or can limit the load for safety reasons, in emergency cases
Other sources of flexibility open to DSO NA

564
4.3. Metering
Key issues regarding metering, and the role of the DSOs, are set out in the following
table.
Table 401: Key approach to metering
Issue Approach adopted
Discos role in metering Full responsibility for metering, and own the meters
Monopoly services in the metering DSO is the only authorized entity in charge of metering activities in its jurisdictions, but they may externalize the activity.
Smart metering functionality The main functions requires are:
Quarter‐of an hour measurement
Remote reading
Remote disconnection/reconnection of customers
Remote control of the maximum power that can be withdrawn
The deployment of smart meters is in the stage of approval of the pilot‐projects, there
are 120 000 clients included in this stage, whose main features were:
o Quarter‐of an hour measurement
o Remote reading
o Remote disconnection/reconnection of customers
o Remote control of the maximum power that can be withdrawn

565
Country Report – Sweden (electricity distribution)
1. Overview of to the distribution sector
1.1. Institutional structure and responsibilities
In Sweden there are 8 main distributors supplying electricity to around 5,2 million
customers. The electricity network consists of 538000 kilometers of conductors, of
which 320000 kilometers are underground cables and 218000 kilometers are overhead
lines.
Summary data on industry structure is set out below.
Table 402: DSO characteristics
Total number DSOs
Ownership unbundled
Legally unbundled
Less than 100000 customers
Exemption* Share of total demand
Country 8 All All 3 No 47,7% *exemption from distribution network charges for certain types of grid users, such as low‐carbon generation connected to distribution networks.
The DSO has the responsibility for deciding the tariff structure. Individual cases may be
assessed by the regulator according to the non‐discriminating requirements.
The breakdown of responsibilities as it related to tariff setting is summarized in the table
below.
Table 403: Legal basis for tariff structure – Roles and Responsibilities in setting distribution tariffs
Actor Allowed revenues (tariff level)
Tariffs (tariff structure)
Connection charges
DSO Not directly involved Decides on the tariff structure
Decides the connection charges
There are 8 large DSOs in Sweden; various DSOs supply small customer bases,
providing around one half of the total national electricity demand.
The NRA is responsible for calculating the amount of allowed revenues
DSOs are in charge of setting the tariffs, and that they can use any methodology they
prefer as long as that methodology is non‐discriminatory and objective.

566
Actor Allowed revenues (tariff level)
Tariffs (tariff structure)
Connection charges
Government Issues the principles to be followed through primary law
Not involved Issues the principles to be followed through primary law
NRA Issues a methodology and calculates the allowed revenues
May take decisions on tariff structures in individual cases, according to non‐discriminating requirements
May assess individual cases, according to a methodology that is decided by the NRA
X = main responsibility; other options to fill the table: sets rules; monitors ex‐post; defines main principles;
calculates for NRA approval; also involved;
The regulatory process for setting distribution tariffs specifies that the DSO is in charge
of setting the tariffs, and that they can use any methodology they prefer as long as that
methodology is non‐discriminatory and objective.
The structure for the calculation of a DSO´s revenue cap and allowed revenue is shown
Figure 80:
Figure 80: Methodology for the calculation of allowed revenue and the revenue cap
Source: Nordic Energy Regulators, 2013125
1.2. Key figures on revenue and tariffs
125 Nordic Energy Regulators, 2013. Economic regulation of electricity grids in Nordic countries. Received from: http://www.nordicenergyregulators.org/wp‐content/uploads/2013/02/Economic_regulation_of_electricity_grids_in_Nordic_countries.pdf

567
The allowed revenues were € 3,295 billion in 2012. However, information on the
revenues and energy consumption proportions of each customer category is not
available.
The typical network tariff in 2013 for residential, small and large industrial customers is
illustrated below:
Table 404: Breakdown of annual charges – typical customer types, 2013 (€)
Customer type
Notional Energy usage
Fixed charges Energy charges
Demand and reactive charges
Total
Residential 3500kWh 96 55 151
Small commercial
50MWh 760 985 1.745
Industrial 24000MWh 1.154 110.400 111.554
The resulting average tariffs per kWh are illustrated below.
Figure 81: Average network charges (€cents/kWh), 2013
2. Regulation of distribution activities
A mixed regulatory regime is in place, which includes both cost‐reimbursement and incentive‐
based components.
Incentive aspects include measures to reduce the controllable operational costs, and to achieve
quality of service targets.

568
2.1. General overview
The role of the DISCO in Sweden is to develop tariffs which are competitive and
therefore to promote retail market competition. The NRA is responsible for calculating
the allowed revenues, but is generally not involved with setting the allowed tariff
structures (which individual DSOs are required to do).
The distribution sector is regulated under a mixed regulatory regime, which includes
both cost‐reimbursement and incentive‐based components. Key features of this regime
are efficiency targets for costs that are considered controllable, service quality
measurements, and revenue caps.
Key features of the regulatory regime are set out in the following table
Table 405: Main features of the regulatory regime
Issue Approach
Type of regime (concession/licence) Concession regime
Duration of tariff setting regime 4 years
Form of determination (distributor propose/regulator decide)
Distributor develops and decides on the tariff. The distributor can use any methodology they prefer as long as it is non‐discriminatory and objective.
Scope for appeal regulatory decision Not specified
A concession regime is in effect. Concessions last indefinitely, and are not allocated
through a competitive mechanism.
2.2. Main incentive properties of the distribution regulatory model
The following key regulatory incentives apply for the DSOs:
To reduce the controllable operational costs, and
Quality of service targets
There are no risk mitigation mechanisms in place under the Swedish regulatory system.
In relation to quality of service aspects, the allowed revenues of a DSO are increased or
decreased if the DSO performs better or worse than the predefined quality targets.
Quality of service measures within the regulation are essentially the calculated costs of
interruptions for the customers. Actual interruption costs are compared to a reference
annual level. In the event that there are deviations from quality reference levels of +/‐ 3
% of the agreed revenue level, the revenue cap is adjusted accordingly.
2.3. Determination of cost of service parameters
The approach to determining key cost of service parameters are summarized in the
following table.

569
Table 406: Approach to key cost of service parameters
Parameter Approach
Form of price control Revenue based with efficiency and performance cost components
Regulatory asset base Planned investments in the forthcoming regulatory period are included within the RAB. Four methods can be used to value assets to be rolled into the RAB: standard values, acquisition value, book value and valuation by other way. The methods shall be used in descending order.
Capital expenditure A product of a decided rate of return on assets, the calculated capital base and chosen depreciation times.
Approach to operating expenditure Controllable and non‐controllable – as historical costs taken from audited data from book‐keeping; non‐controllable costs can be passed through to consumers
Form of WACC applied Real WACC, capital base is based on an annuity approach
Additional revenue items (where applicable)
The following parameters are used in the formula for determining the WACC:
Risk free rate: Nominal interest on government bonds on long run. Estimated to 4%
nominal and 2% real for a 30‐year perspective
Inflation: 1,99 %
Asset beta: 0,38 %
Equity beta: 0,66
Market risk premium: 4,75 %
Premium for lack of liquidity: 0,5 %
Capital structure (debt / equity): 50/50
Tax rate: 20 %
Debt premium: 1,49
3. Tariffs for distribution services
3.1. Distribution tariffs
In relation to the allocation of costs between customer categories, a DSO can use any
methodology it prefers as long as it is non‐discriminatory and objective.
DSOs can use any (objective and non‐discriminatory) methodology it chooses to allocate costs
between customer categories
Regarding connection costs, and determining the levels to be used, a deep charging methodology
can be applied in some instances. If the reinforcement costs are specific to the customer, they
are included in the connection costs.

570
Various other aspects of distribution tariff setting are summarized in the table below.
Table 407: Approach to key issues in setting distribution tariffs
Issue Approach
Treatment of distribution losses Yes, the network losses are included in the revenue limit and thus also in the tariffs.
Presence of uniform tariffs No
Presence of non‐linear tariffs Yes
Presence of regulated retail tariffs No
Presence of social tariffs No
3.2. Connection charges
Key issues in the setting of connection charges are set out in the table below.
Table 408: Summary of key issues relating to connection charges
Issue Approach
Determination of charges
Type of charges (shallow/deep) In some cases, yes.
Methodology adopted DSO decides the connection cost. Customer can request a review by the NRA if it is unsatisfied.
Hosting capacity Scope to refuse connection No.
Requirements to publish hosting capacity
No.
Targets and/or incentive schemes to enhance hosting capacity
No.
Regarding the means of determining the connection charges to be used, they can be
deep in some instances. Specifically, if the reinforcement costs are specific to the
customer, then they are included in the connection costs.
4. Distribution system development and operation
4.1. Distribution system development
There is no distribution system development plan in Sweden.
Neither the DSOs nor the NRA are required to create a distribution system development
plan
There are no restrictions placed on DSOs´ rights to dispatch renewable generators, and
other sources of flexibility / regulation, which are connected into their networks
As of 2013 every customer in Sweden had a smart meter installed capable of measuring
consumption on an hourly basis and which is read at least on a monthly basis

571
Table 409: Approach to distribution planning
Issue Approach
Form of distribution planning document None
‐ Key responsibilities for its development N.a.
‐ Degree of integration with renewables plan N.a.
‐ Relationship with consumption trends N.a
‐ Relationship with quality of service targets N.a.
‐ How trade‐offs between network development and alternative technologies are treated
N.a.
‐ Requirements to integrate cost benefit analysis N.a.
4.2. Distribution system operations
The key features of distribution system operations are summarized below.
Table 410: Approach to distribution planning
Issue Approach
Requirements for dispatch of renewable plants connected to DSO network
DSOs can dispatch renewable plants connected to their networks
Possibility to dispatch flexible loads Yes.
Other sources of flexibility open to DSO Not specified
There are no restrictions placed on DSOs´ rights to dispatch renewable generators, and
other sources of flexibility / regulation, which are connected into their networks.
4.3. Metering
Key issues regarding metering, and the role of the DSOs, are set out in the following
table.
Table 411: Key approach to metering
Issue Approach adopted
Discos role in metering Responsible for metering; cannot own the meters; responsible for collecting data from meters; responsible for all other data management functions (including the validation, storage and sending data to the parties entitled to access them).
Monopoly services in the metering Yes
Smart metering functionality Half‐hourly meter readingAbility to disconnect and reconnect remotely Remote data reading
As of 2013 every customer in Sweden had a smart meter installed capable of measuring
consumption on an hourly basis and which is read at least on a monthly basis. This is
around 5,2 million customers. No national definition of smart meters exists.
The Swedish NRA understands that no specific analysis has been undertaken on the
impacts of installed smart meters on consumption and costs for customers.

572
Country Report – Sweden (gas distribution)
1. Overview of to the distribution sector
1.1. Institutional structure and responsibilities
In Sweden there are 5 large distributors (of which the 3 largest had a collective market
share of around 85%) supplying gas to 37000 customers (of which 3600 are company
customers and the rest are household customers)126 covering an area of 14379 km2.
Summary data on industry structure is set out below.
Table 412: DSO characteristics
Total number DSOs
Ownership unbundled
Legally unbundled
Less than 100000 customers
Exemption* Share of total demand
Country 5 All All 5 No 100% *exemption from distribution network charges for certain types of grid users, such as low‐carbon generation connected to distribution networks.
The responsibility for setting distribution tariffs is spread between the following
jurisdictions:
The DSO decides on the tariff structure;
The NRA may assess the adequacy of a proposed tariff structure, on the basis of tariff
non‐discrimination requirements; and
Government is not involved.
126 CEER, 2012. National report – Sweden. Received from: http://www.ceer.eu/portal/page/portal/EER_HOME/EER_PUBLICATIONS/NATIONAL_REPORTS/National%20Reporting%202012/NR_En/C12_NR_Sweden-EN.pdf
The gas distribution market in Sweden is highly‐concentrated, with only a few DSOs
operational.
The NRA is responsible for calculating the amount of allowed revenues; DSOs are
responsible for deciding on the tariff structures they opt to use.
DSOs are also responsible for deciding on the connection charges they offer to new
customers seeking connections.

573
The breakdown of responsibilities as it relates to tariff setting is summarized in the table
below.
Table 413: Legal basis for tariff structure – Roles and Responsibilities in setting distribution tariffs
Actor Allowed revenues (tariff level)
Tariffs (tariff structure) Connection charges
DSO Not directly involved Decides the tariff structure
Decides on the connection charges to be implemented
Government Defines main principles in primary law
Not directly involved Defines main principles in primary law
NRA Issues a methodology and calculates the allowed revenues
May assess tariff structures on an individual basis, according to non‐discriminating requirements
Not directly involved
X = main responsibility; other options to fill the table: sets rules; monitors ex‐post; defines main principles;
calculates for NRA approval; also involved;
The regulatory process used to set distribution tariffs is that the DSOs decide on the
tariff structure to be implemented. The NRA may get involved in investigating tariff
structures on an individual basis according to non‐discriminatory requirements.
1.2. Key figures on revenue and tariffs
The Swedish NRA understands that information is not available concerning the revenue
from each Swedish customer category. Similarly, information is not available concerning
the proportional contribution of each customer category to total gas distribution for
consumption.
However, a typical network tariff in 2013 for residential, small and large industrial
customers is illustrated below. It must be noted that various tariffs exist in Sweden, and
which are specific to each particular DSO; therefore, please not that annual charges
stated below are to be considered as representative only.
Table 414: Breakdown of annual charges – typical customer types, 2013 (€)
Customer type
Notional Energy usage
Fixed charges Energy charges Total
Residential 15000kWh 122 417 539
Small commercial
50000000 kWh 313 1085000 1085313
Industrial 90000000 kWh 313 1953000 1953313
The resulting average tariffs per kWh are illustrated below.

574
Figure 82: Average network charges (€cents/kWh), 2013
2. Regulation of distribution activities
2.1. General overview
The role of the DSOs in Sweden is to set the distribution tariff structures they offer to
customers, based on their allowed revenues (which is decided by the NRA). The
Government is not involved in the process of calculating the allowed revenues, beyond
issuing the main guiding factors in the principle law.
The distribution sector is regulated under a mixed regulatory model, wherein capital
costs are calculated based on their fixed asset replacement values. Operational costs, on
the other hand, are divided into two parts, namely controllable and non‐controllable
costs. Efficiency targets are applied on costs that are considered to be controllable, and
actual costs are used for non‐controllable costs.
Key features of the regulatory regime are set out in the following table:
Table 415: Main features of the regulatory regime
Issue Approach
Type of regime (concession/licence) Concession regime, of 40 year duration. Concessions are not allocated via a competitive mechanism
A mixed regulatory model is used in Sweden´s gas distribution sector. CAPEX is
calculated based on fixed asset replacement values; OPEX are divided into controllable
costs (which include efficiency targets) and non‐controllable costs (where actual costs
are used).
Tariffs are set for 4 years.

575
Duration of tariff setting regime 4 years
Form of determination (distributor propose/regulator decide)
In determining the tariff levels (allowed revenues) the Government dictates the main principles of the tariffs, and the NRA develops the methodology for calculating the tariffs
2.2. Main incentive properties of the distribution regulatory model
Incentives to reduce controllable OPEX costs are used.
There are no tools in effect to mitigate risks. The risks relate to the cost of capital.
There are no regulatory measures in effect in relation to quality of service aspects of
performance.
2.3. Determination of cost of service parameters
The approach to determining key cost of service parameters are summarized in the
following table.
Table 416: Approach to key cost of service parameters
Parameter Approach
Form of price control Revenue based with efficiency adjustments
Regulatory asset base No regulatory approval required for rolling investment costs into the RAB.
Capital expenditure Calculated as fixed asset replacement value
Approach to operating expenditure Split out as controllable costs (efficiency targets applied) and non‐controllable costs (actual costs are used)
Form of WACC applied Currently under review
The WACC formula is currently under review in Sweden and three approaches to the
WACC calculation are (in October 2014) being analysed in terms of their potential
viability of application within the Swedish regulatory regime.
If there are any deviations from the decided revenue cap – that is, if the grid operator’s
actual revenue during the regulatory period deviates from the NRA’s decided revenue
cap – then the excess/deficit amount will decrease/ increase the subsequent regulatory
period’s revenue cap. If the actual revenue exceeds the cap by a value greater than 5%,
an overbilling addition will reduce the revenue cap for the subsequent regulatory
period. The overbilling addition is a rate equal to the average reference rate according
to 9 § Interest Act (1975:635), with an addition of fifteen percentage points.

576
3. Tariffs for distribution services
3.1. Distribution tariffs
DSOs are in charge of setting their respective distribution tariffs, based on its allowed
revenues. Specifically, DSOs can use any methodology they prefer as long as it is non‐
discriminatory and objective.
Various other aspects of distribution tariff setting are summarized in the table below.
Table 417: Approach to key issues in setting distribution tariffs
Issue Approach
Treatment of distribution losses Included within the tariffs
Presence of uniform tariffs No, structures vary between DSOs
Presence of non‐linear tariffs Yes
Presence of regulated retail tariffs No
Presence of social tariffs No
Tariffs are published individually by the DSOs.
3.2. Connection charges
Key issues in the setting of connection charges are set out in the table below.
DSOs set their own distribution tariff structures. Connection charges for new
customers can be either deep or shallow in nature. Connections can be refused if the
DSO does not have sufficient hosting capacity in its network.

577
Table 418: Summary of key issues relating to connection charges
Issue Approach
Determination of charges
Type of charges (shallow/deep) Can be either – if the costs of reinforcement of the grid are specific to a particular customer, that customer will have to pay them. A customer may therefore have to pay deep costs (related to grid reinforcement).
Methodology adopted The DSO decides the connection cost to be applied. If a customer is not satisfied with the DSO´s offered cost, it can request that the NRA re‐assess the costs.
Hosting capacity Scope to refuse connection A connection can be refused if the DSO believes the connection is not possible under reasonable conditions and/or if there is not adequate hosting capacity.
Requirements to publish hosting capacity
No.
Targets and/or incentive schemes to enhance hosting capacity
None.
DSOs are obliged to connect renewable plants into their distribution networks if it is
technically and economically feasible to do so.
4. Distribution system development and operation
4.1. Distribution system development
The key features of distribution system planning are summarized below.
Table 419: Approach to distribution planning
Issue Approach
Form of distribution planning document None. There is no document related to the distribution system plan, either published and/or submitted to the NRA
‐ Key responsibilities for its development N.a.
‐ Degree of integration with renewables plan
N.a
DSOs do not develop and submit distribution planning documents. There is no regulation
or specific requirements governing DSOs´ need to achieve a trade‐off between their
network development objectives and the treatment of alternative technologies.

578
Issue Approach
‐ Relationship with consumption trends N.a.
‐ Relationship with quality of service targets
N.a.
‐ How trade‐offs between network development and alternative technologies are treated
The relationship is not regulated, and hence the relationship will vary nationally, and informally, depending on the preferred approach of each DSO
‐ Requirements to integrate cost benefit analysis
The relationship is not regulated, and hence the relationship will vary nationally, and informally, depending on the preferred approach of each DSO
4.2. Metering
Key issues regarding metering, and the role of the DSOs, are set out in the following
table.
Table 420: Key approach to metering
Issue Approach adopted
Discos role in metering Responsible for metering and data management. Cannot own the meters
Monopoly services in the metering No
Smart metering functionality Information not available
The DSO is responsible for metering, but cannot own the meters. On the data
management side, the DSO is responsible for collecting the meter data, and is also
responsible for other data management functions, including the validation, storage and
sending data to parties which are entitled to access them.
As of 2013 there were 1265 smart meters installed in Sweden. A breakdown by
customer category is illustrated below.
Table 421: Number of smart meters installed – by end of 2013
Customer category Number
< 1,2MWh 0
1,2MWh ‐ 300MWh 502
300 MWh ‐ 3.000MWh 505
> 3.000 MWh 258
Total 1.265
It is understood that there is no specific information relating to the impact(s) of the roll
out of smart meters in Sweden. This is likely due to the fact that meter roll out is
currently in an early phase, and impact analysis will be undertaken in coming years
when the scope for measuring impacts is larger, when there will be a larger pool of
households on which to base analyses.

579
Country Report – Slovenia (electricity distribution)
1. Overview of the distribution sector
1.1. Institutional structure and responsibilities
There is only one electricity DSO for the entire territory of Slovenia. The state owned
electricity DSO leases the infrastructure and activities related to performance of the DSO
from the companies, which are legally separated from electricity suppliers.
Table 422: DSO characteristics
Total number DSOs
Ownership unbundled
Legally unbundled
Less than 100,000 customers
Exemption* Share of total demand
1 ‐ 1 ‐ Producers do not pay the network charge
N.A.
*exemption from distribution network charges for certain types of grid users, such as low‐carbon generation connected to distribution networks.
The breakdown of responsibilities about tariff setting is summarized in the table below.
Table 423: Legal basis for tariff structure – Roles and Responsibilities in setting distribution tariffs
Actor Allowed revenues (tariff level)
Tariffs (tariff structure)
Connection charges
DSO
Government Issues primary law Issues primary law
NRA Sets a general act with methodologies, and charges
Sets a general act with methodologies, and charges
Sets a general act with methodologies, and charges
X = main responsibility; other options to fill the table: sets rules; monitors ex‐post; defines main principles;
calculates for NRA approval; also involved;
The Energy Agency, in accordance with the legislation, before the start of the regulatory
period is obliged to publish draft terms and a general act, which sets the methodologies.
The documents and public consultation are published on the website of Energy Agency
for one month. During the public consultation, public hearings are organised for
individual areas. After that period, the Energy Agency publicly issues its position on
comments. The draft of the general act is approved by the Energy Agency’s Council.

580
1.4 Key figures on revenue and tariffs
Distribution allowed revenues in 2013 were 252,9 million EUR. No further split is
available.
A breakdown of the number of customers, energy delivered and the revenue by
customer category, including information on available tariff components, is set out in
the table below.
Table 424: Consumption, customers and revenues per customer class
The breakdown of energy volumes and distribution revenue by customer category are
set out in the charts below.

581
Figure 83: Proportion of energy and revenue accounted by customer categories
Considering also Figures 2 and e below, the split seems biased against intermediate
customers.
For benchmarking, Slovenia uses the definitions from EUROSTAT. (Households Da‐ De
and industries Ia – If).
The average tariffs per kWh for the main groups of customers and for representative
customers, as of 1.1.2013, are illustrated below.
Figure 84: Average network charges by main consumer groups(€c/kWh)

582
Figure 85: Average network charges for representative consumers
2. Regulation of distribution activities
2.1. General overview
Key features of the regulatory regime are set out in the following table.
Table 425: Main features of the regulatory regime
Issue Approach
Type of regime (concession/licence) Concession (50 years)
Duration of tariff setting regime 3 years
Form of determination NRA sets the allowed revenue and tariff structure
Scope for appeal regulatory decision N.A.
2.2. Main incentive properties of the distribution regulatory model
The broad regulatory model is incentive based. Incentives depend on:
‐ achieving lower costs than eligible;
‐ level of the quality of supply;
‐ investments in smart grids.
If the costs of the system operator are lower than actual eligible costs, the DSO may
keep the difference. The incentives for the achieved level of the quality of supply are
determined according to the deviations of the achieved level of the continuity of supply
from the reference level and it results in reducing or increasing the eligible costs. If the
system operator realizes investments in smart grids set by the methodology, a single
grant (stimulation) equal to 2% of the current value of the asset is recognized.

583
A “regulatory account” mechanism is at work. After every regulatory year, the system
operator determines the difference between planned and actual eligible costs of the
system operator and the difference between planned and actual financing sources for
covering eligible costs. By the methodology of regulated network charges, the system
operator is obliged to consider the surplus of the network charge as dedicated revenue
for covering the deficit of the previous years or the eligible costs of the following years.
At the same time, the system operator has the right to enforce the network charge
deficit in establishing the network charge in coming years.
If the Energy Agency establishes that in each year of the regulatory period significant
changes in the operation of the system operator occur (i.e. a change in electricity
consumption with respect to planned consumption to the extent that results in more
than 10% impact on the planned network charge), the regulatory framework planned
network charge revenues are amended. A change in percent of network charge tariff
rates should ensure that by the end of current regulatory period the planned network
charge, together with realised network charge from the beginning of the regulatory
period and until the corrections of tariffs rates, equals the planned network revenue in
the current regulatory period.
The regulatory framework can be modified during the regulatory period, if the Energy
Agency establishes that significant changes within the operation of the system operator
occur. The Energy Agency shall issue a separate decision, if it concludes that differences
between eligible and actual costs were not calculated in accordance with the
methodology.
The allowed revenue is defined on assumptions of the following outputs:
‐ GWh delivered through the distribution network
‐ Number of consumers connected
‐ Quality of service
2.3. Determination of cost of service parameters
The regulatory asset base includes only tangible fixed assets in use and the intangible
assets that constitute a prerequisite for carrying out the activity of the system operator.
The book value of the assets enters the rate base.
The approach to determining key cost of service parameters is summarized in the
following table.

584
Table 426: Approach to key cost of service parameters
Parameter Approach
Form of price control Revenue cap
Regulatory asset base Book value
Capital expenditure Assessed every year
Approach to operating expenditure Assessed every year
Form of capital remuneration applied Real WACC
Additional revenue items (where applicable) Allowance for smart grid investment (*)
(*) A one‐off additional 2% yield in the year of activation of the assets applies for the
Smart Grid projects of a total value exceeding € 200,000
In the current regulatory period (2013—2015) the Energy Agency requires the reduction of
annual controlled operating and maintenance costs for:
‐ The planned standard rate of productivity of the economy;
‐ The individual level of efficiency, which is determined on the comparative analysis of the
effectiveness (benchmarking study);
‐ Additional efficiency improvements related to the costs of meter reading (which are
determined on the basis of planned meters installed, enabling remote meter reading,
according to individual areas of the distribution network, and projected average savings per
meter).
The return on assets is evaluated on the basis of the average regulatory asset base,
considering pre‐tax weighted Average Cost of Capital (WACC).
where:
re = rf + β * MRP is the cost of equity
MRP is the Market Risk Premium
Rd is the cost of debt
t is tax shield
The debt leverage is set at a target ratio considered as efficient by the regulator. There is
no adjustment ex‐post.
Allowed revenues are increased (decreased) if the DSO performs better (worse) than
some predefined quality targets.
Also. automatic compensations are granted to consumers in case some quality
standards are not met. The cost of compensations is not included in the allowed returns
of the DSOs

585
3. Tariffs for distribution services
3.1. Distribution tariffs
The method of cost sharing between the network users is based on the gross method,
which determines that the costs of each level are allocated to consumers of established
tariffs groups on each voltage level in proportion to the consumption of this level, with
respect to the total consumption of other levels. In addition of their costs, the network
users of lower levels are charged for a proportional share of the use of higher levels of
the network. In determining the ratio between the individual tariffs groups, all eligible
costs, incurred to the transmission and distribution system operators, are taken into
account (operation and maintenance costs, depreciation, losses, return on assets).
For the identification of consumer groups, see Table 3 above.
There are no further splits by distribution activity.
Both components (for kW and Kwh) are different by time of use. In winter period tariffs
are higher than in summer period.
Energy components (for kWh) are time differentiated for working days. Tariffs are higher
from 6 to 22 and lower in rest of hours and in nonworking days.
No other costs are included in distributional tariffs.
Generators are obliged to pay distribution tariff only if they use (demand) energy from
the distribution grid. In these cases, DSO charge generators according to the tariff
structure for the consumers.
Table 427: Approach to key issues in setting distribution tariffs
Issue Approach
Treatment of distribution losses Included in distribution tariffs
Presence of uniform tariffs Yes, for the whole country
Presence of non‐linear tariffs No
Presence of regulated retail tariffs No
Presence of social tariffs No
Tariffs are published on the DSO website.
The tariff structure includes two time zones and is based on energy only for smaller
customers, and on peak and energy for metered loads. There are also fixed terms,
which cover metering costs.

586
3.2. Connection and capacity issues
New end users, or end user who increases their capacity, must pay to DSO a network
charge for connection load. This cost depends on consumer groups’ connection voltage
level (above 35 kV; 1‐35 kV; commercial 0.4 kV and households). The amount is
determined by the requested connection load times the connection load network
charge of the consumer group.
The regulator has adopted the methodology and the model “Calculation of average
connection cost factors for connecting consumers to the electricity network”, which
includes the following principles:
‐ Postage‐stamp method (gross principle) as it applies for determining the network
charge for the distribution and transmission network;
‐ Acquisition price of the network by voltage levels (HV, MV, LV) is taken into account.
The utilities’ costs are distributed by the voltage levels in the way they are used by the
consumers of different voltage level;
‐ Participation of consumer groups in peak load of the network, which is determined by
the calculated capacity and simultaneity factors assessed and acquired from the
previous years;
‐ Forecast of increased capacity bought in the regulatory period.
In accordance with Article 147 of the EA‐1, the system operator can refuse the
connection to the network, if:
‐ The prospective user fails to meet the required conditions for connection
‐ The connection would cause severe disruptions to the power supply, or
‐ The electricity system operator would incur disproportionate costs due to the
connection.
Key issues in the setting of connection charges are set out in the table below.
Table 428: Summary of key issues relating to connection charges
Issue Approach
Determination of charges
Type of charges (shallow/deep) Deep
Methodology adopted Standard and actual cost
Hosting capacity Scope to refuse connection Yes
Requirements to publish hosting capacity
No
Targets and/or incentive schemes to enhance hosting capacity
No.

587
4. Distribution system development and operation
4.1. Distribution system development
The distribution system plan is published every other year for a period of 10 years, for all
voltage levels up to 110kV. It is approved by the Ministry and notified to the regulator.
The DSO is a state company, so Ministry has own rights to manage the company.
Renewable generation targets are set by the Government. These targets are taken as an
input in the distribution development plan.
Overall, the distribution network plan considers:
‐ The number of newly connected customers;
‐ The consumption of new customers;
‐ The replacement of worn‐out infrastructure;
‐ The impact on network losses;
‐ Achieving the RES and efficient use of energy objectives;
‐ Economic impacts.
Table 429: Approach to distribution planning
Issue Approach
Form of distribution planning document Approved by Ministry, notified to regulator and published
Key responsibilities for its development DSO
Degree of integration with renewables plan
RES targets explicitly taken into account.
Relationship with consumption trends Explicitly taken into account, with spatial detail
Relationship with quality of service targets
Explicitly taken into account
How trade‐offs between network development and alternative technologies are treated
The network development plan reports only the decisions of the DSOs. The analysis, on which those decisions are based, are not public. Requirements to integrate cost benefit
analysis
4.2. Distribution system operations
The key features of distribution system operations are summarized below.

588
Table 430: Approach to distribution planning
Issue Approach
Requirements for dispatch of renewable plants connected to DSO network
The DSO has no control on embedded generators
Possibility to dispatch flexible loads No
Other sources of flexibility open to DSO Control of capacitors in primary substations
Flexible loads are only controlled by the transmission system operator or self‐
dispatched. The TSO is responsible for balancing the system and reliability of supply by
providing through ancillary services. Large customers can participate in balancing the
system through the contracts on ancillary services.
DSOs are only in control of capacitors in primary substations.
4.3. Metering
The DSO has full responsibility for metering, and owns the meters.
Beside this, DSO is responsible for all other data management functions (validation,
storing, sending the data to parties entitled access to them ...)
Key issues regarding metering, and the role of the DSOs, are set out in the following
table.
Table 431: Key approach to metering
Issue Approach adopted
Discos role in metering Full responsibility
Monopoly services in the metering Yes
Smart metering functionality See text below
The main features of the smart meters installed or planned to be deployed are:
a) quarter‐of an hour measurement
b) remote reading
c) remote disconnection/reconnection of customers
d) remote control of the maximum power that can be withdrawn
e) remote operation of appliances at the consumer's premises
a) local port to send real time consumption information to a local screens or computers
f) basic power quality – continuity of supply
Total number of consumers is ca.930,000. Industry and large commercial users (total ca.
15,000) are 100% equipped with smart meters. Households and small commercial users
(total ca. 915,000) are 30% equipped with smart meters.

589
Country Report – Slovenia (gas distribution)
1. Overview of the distribution sector
1.1. Institutional structure and responsibilities
Table 432: DSO characteristics
Total number DSOs
Ownership unbundled
Legally unbundled
Less than 100,000 customers
Share of total demand
16 ‐ ‐ 16 100%
The breakdown of responsibilities as it related to tariff setting is summarized in the table
below.
Table 433: Legal basis for tariff structure – Roles and Responsibilities in setting distribution tariffs
Actor Allowed revenues (tariff level)
Tariffs (tariff structure)
Connection charges
DSO Submits proposal Submits proposal
Government Issues primary law Issues primary law
NRA Sets a general act with methodologies, and charges
Sets a general act with methodologies, and charges
Sets a general act with methodologies, and charges
X = main responsibility; other options to fill the table: sets rules; monitors ex‐post; defines main principles;
calculates for NRA approval; also involved;
The system operator submits a request for obtaining approval for the proposed network
charge, eligible costs and other elements of the network charge for the regulatory
period no later than 4 months before the start of the three‐year regulatory period, for
which the network charge is being determined. The application shall include:
‐ A detailed description of the gas DSO services;
‐ The business plan for the regulatory period;
There are 16 gas DSOs in the territory of Slovenia, all of which are below 100,000
customers. They all belong to the same retailer, under accounting unbundling.

590
‐ data on the planned number of consumption points, leased capacity and distributed
volumes by individual consumer groups for the last year of the previous regulatory
period and for individual years of the regulatory period;
‐ Information on the costs of operation;
‐ Information on the planned investments;
‐ Data needed to determine the average regulatory asset value for each year of the
regulatory period;
‐ Information on identifiable deviation from the regulatory framework for the previous
regulatory period;
‐ Calculation of the network cost for each year of the regulatory period and for the
regulatory period in accordance with the act governing the methodology for calculating
the network cost for the gas distribution network;
‐ Estimation of the financial impact of the network charge on the users of the
distribution network, separately for each consumer group.
During the procedure of approval, the Energy Agency assesses the compliance between
the determined eligible costs and other elements and the methodology for determining
and calculating the allowed network revenue.
If the Energy Agency declines approval of a proposed network charge, 90% of the values
from the previous period are taken into account until a new proposal is approved.
Setting out the network charge and determining eligible costs for building and operating
the distribution network is specified in the Act laying down the methodology for setting
out the network charge and criteria for determining eligible costs for the natural gas
transmission network.
For the current regulatory framework (2013–2015) for distribution, the Energy Agency
issued several consultation papers and held several public hearings.
1.2. Key figures on revenue and tariffs
The total amount of the distribution allowed revenues in 2013 was 50.82 million EUR,
consisting of:
‐ Distribution: 42.63 million EUR
‐ Metering: 3.35 million EUR
‐ Commercial service: 4.84 million EUR.
A breakdown of the number of customers, energy delivered by customer category is set
out in the table below. Data about revenue are not available.

591
Table 434: Consumption, and number of customers by customer class
CDkiUpper limit (cubic
meters) Number of customers
Consumption (cubic meters)
CDK1 200 39,739 2,218,617
CDK2 500 14,688 5,787,497
CDK3 1500 45,587 44,216,695
CDK4 2500 19,497 34,073,128
CDK5 4500 8,563 22,036,329
CDK6 10000 2,067 12,784,732
CDK7 30000 1,497 23,947,526
CDK8 70000 637 25,694,981
CDK9 100000 188 17,427,637
CDK10 200000 151 18,585,441
CDK11 500000 100 30,631,017
CDK12 1000000 11 7,808,463
CDK13 5000000 57 26,653,133
CDK14 15000000 19 25,439,547
CDK15 No limit Less than 5 0
Household customers are usually the customers of category CDK1 ‐ CDK5, but household
customers who live in apartment blocks often belong to categories higher than CDK5.
The tariffs that apply to typical customers depend only on yearly consumption. No
breakdown is available by consumer classes. The average tariffs per kWh for the main
groups of customers and for representative customers, as of 1.1.2013, are illustrated
below.
Figure 86: Average network charges for representative consumers

592
2. Regulation of distribution activities
2.1. General overview
The distribution of natural gas, carried out as a service of a gas distribution system
operator (gas DSO), is an optional local service of general economic interest. It can be
organised:
• As a public company established by a local community;
• It can be regulated with a concession act between the concessionaire and the
local community as the awarding authority; or
• As an investment of public capital into the activity of private law.
The tasks of the gas DSO are listed in the provisions of the EA; these tasks mainly include
the following:
• The distribution of natural gas
• The operation, maintenance and development of a distribution network
• The provision of the long‐term network capacity.
In 2013, 61 local communities had this service organised with a concession act between
the concessionaire and the local community. In 15 local communities, this service was
provided by public companies; and in one community as an investment of public capital
into the activity of private law. These 77 local communities are served by the 16 DSOs.
In principle, the concessions are tendered for a maximum period of 35 years.
In case of renewal, the company that loses the concession is remunerated on the basis
of its concession terms.
Key features of the regulatory regime are set out in the following table.
Table 435: Main features of the regulatory regime
Issue Approach
Type of regime (concession/licence) Concession
Duration of tariff setting regime 3 years
Form of determination NRA sets the allowed revenue and tariff structure
Scope for appeal regulatory decision N.A.
2.2. Main incentive properties of the distribution regulatory model
The broad regulatory model is incentive based. In the current regulatory period (2013—
2015), the Energy Agency requires the reduction of annual controlled operating and
maintenance costs for:

593
• The planned standard rate of productivity of the economy;
• The individual level of efficiency, which is determined on the comparative
analysis of the effectiveness (benchmarking study).
Different X factors in the price cap formula are set for different DSOs.
If the costs of the system operator are lower than actual eligible costs, the DSO may
keep the difference.
A “regulatory account” is at work. After every regulatory year, the system operator
determines the difference between planned and actual eligible costs of the system
operator and the difference between planned and actual financing sources for covering
eligible costs. By the methodology of regulated network charges, the system operator is
obliged to consider the surplus of the network charge as dedicated revenue for covering
the deficit of the previous years or the eligible costs of the following years. At the same
time, the system operator has the right to enforce the network charge deficit in
establishing the network charge in coming years.
If the Energy Agency establishes that in each year of the regulatory period significant
changes in the operation of the system operator occur (i.e. a change in consumption
with respect to planned that results in more than 10% impact on the planned total
costs), tariffs should are changed to ensure that by the end of current regulatory period
the planned and actual revenue are equal.
2.3. Determination of cost of service parameters
The regulatory asset base includes only tangible fixed asset in use and the intangible
assets, which constitute a prerequisite for carrying out the activity of the system
operator.
The book value of the assets enters the rate base.
The approach to determining key cost of service parameters is summarized in the
following table.
Table 436: Approach to key cost of service parameters
Parameter Approach
Form of price control Revenue cap
Regulatory asset base Book value
Capital expenditure Assessed every year
Approach to operating expenditure Assessed every year
Form of capital remuneration applied Real WACC
Additional revenue items (where applicable) ‐
The return on assets is evaluated on the basis of the average regulatory asset base,
considering pre‐tax weighted Average Cost of Capital (WACC).

594
Where:
re = rf + β * MRP is the cost of equity
MRP is the Market Risk Premium
Rd is the cost of debt
t is tax shield
The debt leverage is set at a target ratio considered as efficient by the regulator. There is
no adjustment ex‐post.
There is no relation between allowed revenues and quality targets. No system of
financial compensation/penalties is implemented
3. Tariffs for distribution services
3.1. Distribution tariffs
Tariffs for the distribution networks are unified for individual customers groups for each
geographical areas. Prices for all typical customers in different areas are not the same as
the prices reflect different costs of distribution system operators in individual
geographical area. Individual customer groups are defined in line with the methodology
for charging for the network charge. Distribution system operators determine the tariffs
relating to an individual geographical areas, after prior consent of the Energy Agency.
For the identification of consumer groups, see Table 3 above.
All consumers are charged a distribution tariff including max. five components
1. a tariff item for flat rate per month in EUR
2. a tariff item for power per month, in EUR/kW
3. a tariff item for capacity per month, in EUR/(Sm3/day)
4. a tariff item for consumption, in EUR/ Sm3
Smaller consumers (categories CDK1 ‐ CDK5) mainly pay only flat rate (1) and variable
part (4). Which items are paid by the individual consumer groups depends on the leased
annual capacity or annual consumption.
5. a separate tariff item is paid for metering.
The energy related component of the distribution tariff includes the cost of losses in
amount of max. 2%. No other costs are included in distribution tariffs.

595
Generators are obliged to pay distribution tariff only if they use (demand) energy from
the distribution grid. In these cases, DSO charge generators according to the tariff
structure for the consumers.
Table 437: Approach to key issues in setting distribution tariffs
Issue Approach
Treatment of distribution losses Included in distribution tariffs
Presence of uniform tariffs No
Presence of non‐linear tariffs Yes
Presence of regulated retail tariffs No
Presence of social tariffs No
Tariffs are published on the Agency’s website.
3.2. Connection and capacity issues
In Slovenia, there are several models for connecting consumers to the natural gas network.
Connection costs depend on the ownership of the connecting pipeline (customer or gas DSO).
1. If the customer is the owner of the pipeline, the connection costs consists of:
‐ Costs of project document elaboration, monitoring, approvals, and if necessary road closures
‐ Costs of embedded material
‐ Costs of machining
‐ Costs of construction works
2. If the owner of the pipeline is a gas DSO, the customer is charged for:
‐ Flat‐rate connection fee or connection contribution with regard to the provisions of the concession agreement on the implementation of a gas DSO’s activities
When building the pipeline, individual gas DSO offers connection free of charge if a consumer binds himself to become its client.
Costs of the connection to the transmission network largely depend on the characteristics of planned consumption (annual leased capacity and planned amount and period of consumption), and scope of work necessary for the construction of the connection pipeline, or the execution of the connection.
If disproportionate costs for connection occur, a consumer can be connected if he covers the disproportionate costs for connection by himself.
When the owner of the connection is a gas DSO, the costs of the connection to the
distribution network are determined in accordance with the estimated scope of the use

596
of the connection (in terms of consumption volume), or as specified in the concession
contract between the DSO and local community.
For larger consumers, the DSO makes an estimate based on its cost but the client is free
to procure the necessary works from a different source.
Table 438: Summary of key issues relating to connection charges
Issue Approach
Determination of charges
Type of charges (shallow/deep) Shallow in general. Zero to deep charges for larger consumers (depending on the intended scope of use of the connection)
Methodology adopted Standard and actual cost
Hosting capacity Scope to refuse connection Yes
Requirements to publish hosting capacity
No
Targets and/or incentive schemes to enhance hosting capacity
No.
4. Distribution system development and operation
4.1. Distribution system development
In accordance with the new energy legislation the system operator shall prepare an
investment plan and submit it to the Energy Agency for the purpose of setting out the
regulatory framework. The operator's investment plan shall include a financial
evaluation of the investments under the applicable ten‐year development plan to be
carried out in the subsequent regulatory period. The Energy Agency shall examine and
evaluate the investment plan in the procedure for setting out the regulatory framework.
In evaluating investment plans and setting the eligible costs of the system operator, the
Energy Agency shall not be bound by the value of the investments and their time
schedule under the Slovenia’s energy concept, other development plans in the energy
sector or the development plans of system operators. If the Agency's evaluation of the
investment plans establishes an excessive impact on network charges and if all
investments from the investment plan are included in the eligible costs of the system
operator, it may take into account only some investments in accordance with the order
of priority specified in the investment plan.
Distribution network is planned and built in accordance with the energy concept of a
village or a town, or in line with the commitments set out in the concession contract.
When preparing energy concept for the supply of settlements and cities the
applicable environmental legislation is taken into account, as well as the
achievement of the environmental objectives.

597
In accordance with the provisions of the new Energy Act, the Energy Agency shall
establish the methodology for preparing and evaluating the investment plans, which will
include:
– The methodological approaches to investment assessment and evaluation;
– The types and mandatory content of investment plans;
– The procedures for preparing and evaluating investment documents and deciding on
investments;
– Minimum criteria for determining the efficiency of projects.
The DSO takes into account the deadlines for the preparation of the investment plan
and it submission to the Energy Agency for review and evaluation.
Table 439: Approach to distribution planning
Issue Approach
Form of distribution planning document Notified to regulator and published
Key responsibilities for its development DSO
Degree of integration with renewables plan
RES targets explicitly taken into account.
Relationship with consumption trends Explicitly taken into account, with spatial detail
Relationship with quality of service targets
Explicitly taken into account
How trade‐offs between network development and alternative technologies are treated
The network development plan reports only the decisions of the DSOs. The analysis, on which those decisions are based, are not public. Requirements to integrate cost benefit
analysis
4.2. Metering
Metering device may be owned by the gas DSO or the customer.
The DSO is responsible for the collection of data from the meter, and for all other data
management functions (validation, storing, sending the data to parties entitled access to
them ...).
Key issues regarding metering, and the role of the DSOs, are set out in the following
table.
Table 440: Key approach to metering
Issue Approach adopted
Discos role in metering Full responsibility
Monopoly services in the metering Yes
Smart metering functionality See text below

598
Out of 132.805 consumers on the distribution network, 46 consumption points are
equipped with smart meters, and 651 gas meters deliver a one‐way communication for
remote data reading. 99.5% of metering points are equipped with a conventional meter.
The deployment of smarts meters is foreseen for the customers with higher
consumption and with less predictable demand profile.
Individual DSO can independently decide for wider deployment of smart meters, if it
considers that there are great enough benefits, or economically justified reasons, and
that the deployment will not increase the recognised costs.
The main features of the smart meters installed or planned to be deployed are:
a) hour measurement
b) remote reading
c) Possibility for innovative tariff schemes
d) Information on current tariff
e) remote disconnection/reconnection of customers
f) remote control of the maximum flow
g) Load profiles registration
h) remote operation of appliances at the consumer's premises
i) local port to send real time consumption information to a local screens or computers
j) Possibility of prepaid mode of work
k) Remote operation of the meter (software update, parameterization and tests)
l) Detection of malicious interventions
Non daily meter customers cover 57% of the consumption of the distribution market.
For these customers, different ways are used:
1. Some DSOs read metering devices monthly.
2. Consumers read metering devices monthly, and submit data to DSO.
3. A static load profile model is used to determine monthly consumption of a consumer,
but consumption is harmonised with total daily consumption of each distribution
network.

599
Country Report – Slovakia (electricity distribution)
1. Overview of to the distribution sector
1.1. Institutional structure and responsibilities
In Slovakia there are 3 large distributions companies which cover the whole country. In
each DSO, the state is a 51% shareholder; however the management control in each
DSO is exercised by the owners of the remaining 49% shares.
These large DSO are legally unbundling, the range of action corresponds to the historical
regional structure of the country. (West, Central, East).The aim of unbundling was to
separate de distribution activities from other electricity activities as generation and
electricity supply in order to increase independence of system operators a reduce
possible discrimination of system users.
There are another 160 holders of electricity distribution licensed. There are small DSO
with less of 100.000 customers, been only functional/Accounting unbundling.
Table 441: DSO characteristics
Total number DSOs
Ownership unbundled
Legally unbundled
Less than 100000 customers
Exemption* Share of total demand
Slovakia 163 3 160 N/A Not available
*exemption from distribution network charges for certain types of grid users, such as low‐carbon generation connected to distribution networks.
The primary responsibility for setting distribution tariffs is spread between the following
jurisdictions
The Government ‐ Ministry of Economy is the main responsible of the energy sector.
Ministry of Economy issues the principles in the primary law.
In Slovakia operates three exclusives operators of the regional electricity distributions systems,
covering the whole territory of the country. These are legally unbundling from the original vertical
monopoly. There were are another 160 small DSO in the market with less of 100,000 consumers

600
The NRA (Regulatory Office for Network Industries‐RONI) according to Act 250/2012,
regulates the electricity and gas sector and distribution activities. They issues
methodologies and approves the allowed revenues
The DSO´s propose the tariff structure
The breakdown of responsibilities as it related to tariff setting is summarized in the table
below.
Table 442: Legal basis for tariff structure – Roles and Responsibilities in setting distribution tariffs
Actor Allowed revenues (tariff level)
Tariffs (tariff structure)
Connection charges
Regulated services
DSO Calculates for NRA approval
Calculates for NRA approval
Calculates for NRA approval
NA
Government – Ministry of Economy
Defines main principles
Defines main principles
Defines main principles
NA
NRA Set methodology and approves(LV)
Set methodology and approves(LV)
Set methodology and approves(LV)
NA
X = main responsibility; other options to fill the table: sets rules; monitors ex‐post; defines main principles;
calculates for NRA approval; also involved;
The regulatory process adapted to setting distribution tariffs involves the following
steps:
Ministry of Economy determines the regulatory principles in primary law.
DSO proposes the tariff structure and the regulator then approves it.
Distribution tariff decisions are not subject to public consultation. DSO and NRA (RONI)
are the participants in the pricing proceeding.
1.2. Key figures on revenue and tariffs
Distribution revenues in Slovakia in 2013 were € 515,476 million. No further revenue
breakdown is available.
A breakdown of revenue by customer category, including information on available tariff
components and the number of customers in each category is set out in the table below.
Table 443: Tariff components, customers and revenues per customer class
Customer classes Tariff components Number of customers
Revenue (Million €)
Household Capacity charge €/MW(A)Energy charge €/MWh Losses charge €/MWh
2143189 178,457
Small Businesses Capacity charge €/MW(A)Energy charge €/MWh Losses charge €/MWh
278028 140,467
MV customers Capacity charge €/MW(A)Energy charge €/MWh Losses charge €/MWh
12944 177,177

601
HV customers Capacity charge €/MW(A)Energy charge €/MWh Losses charge €/MWh
96 19,433
Total ‐ 2434257 515,476
The breakdown of energy volumes and distribution revenue by customer category are
set out in the charts below.
Figure 87: Proportion of energy and revenue accounted by customer categories
These show a MV and Households as the consumers providing greater revenue shares.
The definition of typical consumer is not used to tariffs analysis. However for the
purpose of the National Report CEER, NSR calculates the average yearly consumption of
some typical consumers.
The typical network tariff in 2013 for House Hold, small and large industrial customers is
illustrated below:

602
Table 444: Breakdown of annual charges – typical customer types, 2013 (€)
Customer type Notional Energy usage
Fixed charges
Capacity charges
Energy charges
Total
Residential 3500kWh 58,33 ‐ 109,27 167,60
Small Industrial 50MWh ‐ 606,37 2423,67 3030,04
Large industrial 24000MWh ‐ 239097,6 277843,52 516941,12
This network tariff includes electricity transmission (including losses), electricity distribution and electricity
distribution losses.
The resulting average tariffs per kWh are illustrated below.
Figure 88: Average network charges (€/kWh), 2013
2. Regulation of distribution activities
2.1. General overview
The roles of the DSO´s in Slovakia are to operate, develop and maintain the distribution
network, to ensure a non‐discriminatory access to the grid. They are also responsible of
facilities a quality customer service.
The Ministry of Economy of Slovakia and the Regulatory Office for Network Industries
(RONI) are the competent regulatory authorities to the electric distribution activities.
According Act 250/2012, The NRA (RONI) purpose is a transparent no discriminatory
The distribution networks operators are regulated under a licence regime. An
incentive based price cap model is form of regulation is applied.

603
manner, the availability of goods and regulated activities related therewith at
reasonable prices and in determined quality.
The distribution activities are subject to be authorized by the NRA. The DSO´s are
incentivised to reduce cost; a Price CAP methodology of regulation is applied.
The price regulation model covers the whole regulation period which is currently 5
years. The prices are fixed for the regulations period; however prices may be adjusted in
some specific circumstances.
Key features of the regulatory regime are set out in the following table
Table 445: Main features of the regulatory regime
Issue Approach
Type of regime (concession/licence) Licence
Duration of tariff setting regime 5 years (2012‐2016)
Form of determination (distributor propose/regulator decide)
DSO proposes allowed revenue and tariff structure, NRA approves
Scope for appeal regulatory decision N.A
2.2. Main incentive properties of the distribution regulatory model
The NRA has defined a model to calculate the maximum price and tariffs for access to
the distribution system and electricity distribution. This model is oriented to determine
a reasonable profit, necessary to ensure the long‐term, safe and efficient operation of
the distributions system, a reasonable return on operating assets and stimulate stable.
The details of the models included in the Ordinance 221/2013 Coll.
The main aspects of the model are:
Model is based in Price Cap, when the NRA approves a he maximum price and
tariffs for access to the distribution system.
The price regulation method covers the whole Price regulatory period
The NRA defines which are the eligible cost and what are not
The NRA defines the method to calculate a reasonable profit, based in the
WACC structure.
Prices are fixed for the regulatory period, however prices may vary from year
with regard to the capital expenditures invested or due to the variable cost
changes
There is not mitigation form implemented as correction factor to achieve revenues.
DSO´s are incentivized to optimize their costs. DSO may request to NRA to review and
adjust prices if the economic parameters which were based the price has been
substantially changed. (Ordinance 250/2012 Section 17)

604
Quality standards have been set by the respective ordinance issued by NRA. They are
not interconnected to the tariff system. In Slovakia, a system of automatic
compensation payments for failure to comply with the prescribed quality standards is in
place.
Automatic compensation is granted to consumers in case some quality standards are not
met. The cost of that compensation is not included in the allowed returns of the DSOs.
2.3. Determination of cost of service parameters
The approach to determining key cost of service parameters are summarized in the
following table.
Table 446: Approach to key cost of service parameters
Parameter Approach
Form of price control Price Cap method
Regulatory asset base Based on the performed DSO asset assessment in 2006. The RAB Value of 2012 takes in account CAPEX development in the given period and the value of depreciation. During the regulatory period the RAD values do not vary.
Capital expenditure
Approach to operating expenditure No benchmark approach
Form of WACC applied Real WACC, D/E has been set by NRA in the ratio 60/40
Additional revenue items (where applicable)
Not applicable
The following formula is applied in determining the WACC:
DE R
DE
D
T
R
DE
EWACC
)1(
Where:
T: is income tax rate for year t,
E: is equity in EUR as of Dec 31, 2010,
D: is debt in EUR as of Dec 31, 2010
RD: is the real price of debt, calculated average amount of loans given to non‐financial
companies for the period of 5 and more years with the loan amount more than 1 mil.
EUR for the base year at 5,13%,
RE: is the real price of equity and own funds calculated according to the formula:
)( FMLEVFE RRRR ,
Where:

605
RF: is profitability of an risk‐free asset, calculated average revenue from 5+ year
government bonds issued in the Slovak market between 2007 and 2011 for the base
year at 4,01%,
(RM – RF): is the overall risk premium for the base year set by NRA at 3%; for the
following years set by RONI between 3% and 6%.
βLEV is weighted ratio β, which defines the sensitivity of a company share to the market
risk, taking into account the income tax rate and the debt share, calculated according to
the formula:
E
DTUNLEVLEV )1(1
Where:
βUNLEV is the unweight ratio β free of the influence of income tax rate and debt share for
the base year at 0,30; for the following years it has been set by NRA between 0,30 and
0,65,
T is income tax rate for year t
D/E is the ratio of debt to equity, the base year has been set to 60 % in favour of debt
For the base year, the real ratio of regulatory asset base profitability (WACC) has been
calculated by NRA at 6.04%. Parameter values for the following years, which serve to
calculate the ratio of regulatory asset base profitability (WACC) before tax, are published
on the RONI web site by June 30 of the calendar year.
The regulation formula includes the “X‐component”. The so‐called “X – factor” has been
set in relation to OPEX. OPEX may then be changed through (JPI‐X), where JPI is the
development of core inflation for the given period. The X‐component is selected based
on monitoring the company´s performance.
3. Tariffs for distribution services
3.1. Distribution tariffs
The NRA determines the methodology of calculation of distribution tariffs and the tariffs
are calculated by each DSO.
DSO´s determined separately for each voltage level the maximum price for access to the
distribution system. For each voltage level, the value of the asset used in relation is
determined. The level of allowed profit is calculated using the WACC. Allowed profit
and operational expenditures represent the amount of allowed revenues for each
respective voltage level. These revenues are split 65/35 to fixed and variable part.
(Section 26, 27 of Ordinance 221/2013)

606
The price of access to the distribution system reflects the distribution and transmission,
including electricity transmission loses. Also is considered another variable tariff for the
losses of the distribution network.
There are four classes of consumers:
High Voltage
Medium Voltage
Low Voltage residential
Low Voltage another consumers
All consumers are charged a distribution tariff including three components:
Fixed, Eur per KW charge, based on the contractual maximum power (enforced via the
meter)
Variable Energy, ‐ Eur per KWh, register by metering units
Variable Distribution Losses, ‐ Eur per KWh distribution losses.
The price decision is published on NRA website and DSO website: http://www.urso.gov.sk
Various other aspects of distribution tariff setting are summarized in the table below.
Table 447: Approach to key issues in setting distribution tariffs
Issue Approach
Treatment of distribution losses Included in Distributions Tariff
Presence of uniform tariffs No, each DSO charges different tariff(Corresponding to its allowed revenues)
Presence of non‐linear tariffs No, all tariff components are linear
Presence of regulated retail tariffs Yes, for Households and Small business with a yearly consumption less than 30 MWh. (End‐use price)
Presence of social tariffs No
The renewable generation and CHP support is funded via an additional tariff component
of the distribution tariff. Tariff for the system services including costs of balancing
Embedded generators pay 30% per KW of the installed capacity.
3.2. Connection charges
Key issues in the setting of connection charges are set out in the table below.
Table 448: Summary of key issues relating to connection charges
Issue Approach
Determination of charges
Type of charges (shallow/deep) Half deep fees
Methodology adopted The NRA publishes a method to calculate the connection charges.

607
Issue Approach
Section 42, 44 Ordinance 221/2013
Hosting capacity Scope to refuse connection DSO is obliged to connect a consumer, if he meets the connection requirements and has capacity in the network. Generator can be refused, if the connection can jeopardize network´s safety and reliability
Requirements to publish hosting capacity
No
Targets and/or incentive schemes to enhance hosting capacity
The price method calculation induces to the DSO to invest in the network development
The methodology use to determine connection cost depends of the consumer class:
For Low Voltage
For the first year real costs for connection. For next years connection fee for the first year increased by inflation
For Medium Voltage
Principle post stamp
Half is paid by consumers and half is paid by DSO’s
Generators pay whole fee and RES pay 0,98 times fee
Connection costs of previously year divided by capacity connected previously year
For High Voltage
Real costs of connection
Half is paid by consumers and half is paid by DSO’s
Generators pay whole fee and RES pay 0,98 times fee
4. Distribution system development and operation
4.1. Distribution system development
Network development plans are not announced to the regulator, so are not published.
The Ministry of Economy is responsible for this issue
The key features of distribution system planning are summarized below.

608
Table 449: Approach to distribution planning
Issue Approach
Form of distribution planning document Not applicable
‐ Key responsibilities for its development Not applicable
‐ Degree of integration with renewables plan
Not applicable
‐ Relationship with consumption trends Not applicable
‐ Relationship with quality of service targets
Not applicable
‐ How trade‐offs between network development and alternative technologies are treated
Not applicable
‐ Requirements to integrate cost benefit analysis
Not applicable
4.2. Distribution system operations
The key features of distribution system operations are summarized below.
Table 450: Approach to distribution planning
Issue Approach
Requirements for dispatch of renewable plants connected to DSO network
DSO dispatches large embedded generators connected to their networks. Small embedded generators are not dispatched by DSO
Possibility to dispatch flexible loads Not applicable
Other sources of flexibility open to DSO Not applicable
4.3. Metering
Key issues regarding metering, and the role of the DSOs, are set out in the following
table.
Table 451: Key approach to metering
Issue Approach adopted
Discos role in metering DSOs have full responsibility for metering, and own the meters.
Monopoly services in the metering Yes, for each DSO in its geographic location
Smart metering functionality Currently test operations of smart meter on selected consumer groups. The smart meters planned to be installed have basic functions. c) quarter‐of an hour measurement d) remote reading
As of 2013 there were not smart meters massive installed in Slovakia.

609
Country Report – Slovakia (Gas
distribution)
1. Overview of to the distribution sector
1.1. Institutional structure and responsibilities
In Slovakia there is one main DSO, whose network covers the whole country. There are 39 locals DSO connected to the main DSO, distributing around 19 % of the total volume of natural gas distributed in the country. There is one local DSO (2%) directly connected to the TSO.
In 2013, the total of gas consumption was of 54,79 TWh to around 1,5 million customers.
Summary data on industry structure is set out below
Table 452: DSO characteristics
Total number DSOs
Ownership unbundled
Legally unbundled
Less than 100000 customers
Exemption* Share of total demand
Slovakia X 1 N/A *exemption from distribution network charges for certain types of grid users, such as low‐carbon generation connected to distribution networks.
The primary responsibility for setting distribution tariffs is spread between the following
jurisdictions
The Government ‐ Ministry of Economy is the main responsible of the energy sector.
Ministry of Economy issues the principles, the scope and method of price regulation is
set in the primary law.
The NRA (Regulatory Office for Network Industries‐RONI) regulates the electricity and
gas sector and distribution activities. They issues methodologies and approve the
allowed revenues, tariff structure and connections charges.
The DSO calculates the allowed revenue and proposes the tariff structure and
connections charges, the NRA approve it after consultation with DSO.
In Slovakia operates one main distributions system operator, covering the whole
territory of the country. These are legally unbundling from the original vertical
monopoly.

610
The breakdown of responsibilities as it related to tariff setting is summarized in the table
below.
Table 453: Legal basis for tariff structure – Roles and Responsibilities in setting distribution tariffs
Actor Allowed revenues (tariff level)
Tariffs (tariff structure) Connection charges
DSO Calculates for NRA approval
Propose the tariff structure
Calculates for NRA approval
National council Defines main principles of regulation network industries
Defines main principles of regulation network industries
Defines main principles of regulation network industries
NRA Set methodology and approves
Set methodology and approves tariff after consultation with DSO.
Set methodology and approves tariff after consultation with DSO.
X = main responsibility; other options to fill the table: sets rules; monitors ex‐post; defines main principles;
calculates for NRA approval; also involved;
The regulatory process adapted to setting distribution tariffs involves the following
steps:
Ministry of Economy determines the regulatory principles in primary law.
DSO proposes the tariff structure and the regulator then approves it.
Distribution tariff decisions are not subject to public consultation. The DSO and regulator
(RONI) are the participants in the pricing proceeding.
1.2. Key figures on revenue and tariffs
Distribution and metering revenues in The Slovakian Republic in 2013 was € 394 million.
No further revenue breakdown is available.
A breakdown of revenue by customer category, including information on available tariff
components and the number of customers in each category is set out in the table below.
Table 454: Tariff components, customers and revenues per customer class
Customer classes Tariff components Number of customers
Revenue (Million €)
Household Energy component €/m3Fixed component €/year
1417000 270,284
Small Businesses Energy component €/m3Fixed component €/year
75800
Medium customers Energy component €/m3Fixed component €/year Daily maximum component €/(m3/day)/year)
2890 27,196
Large customers Energy component €/m3Fixed component €/year Daily maximum component €/(m3/day)/year)
758 96,530
Total ‐ 1496448 394,000

611
The breakdown of energy volumes and distribution revenue by customer category are
set out in the charts below.
Figure 89: Proportion of energy and revenue accounted by customer categories
These show a Households and Small business as the consumer class providing greater
revenue shares (69%) according the their energy consumption (38%)
The definition of typical consumer is not used to tariffs analysis. However for the
purpose of the National Report CEER, NSR calculates the average yearly consumption of
some typical consumers.

612
The typical network tariff in 2013 for House Hold, small and large industrial customers is
illustrated below:
Table 455: Breakdown of annual charges – typical customer types, 2013 (€)
Customer type Notional Energy usage
Fixed charges Energy charges Total(€)
Households with annual consumption of 15000 kWh
15000 kWh (Household
consumption in Slovakia is 19050kWh)
76,2€(6,35€/month)
138 € 0,0092 €/kWh
214,20
Industrial Consumer with an annual consumption 50000 MWh and 7000 use hours
50MWh Not available Not available 150638,49
Industrial Consumer with an annual consumption 90000 MWh and 7000 use hours
90000MWh Not available Not available 235033,07
The resulting average tariffs per kWh are illustrated below.
Figure 90: Average network charges (€/kWh), 2013
2. Regulation of distribution activities
The distribution networks operators are regulated under a licence regime. An incentive
based price cap model is form of regulation is applied.

613
2.1. General overview
The role of the DSO in Slovakia is to operate, develop and maintain the distribution
network, to ensure a non‐discriminatory access to the grid. They are also responsible of
facilities a quality customer service.
The Ministry of Economy of Slovak Republic and the Regulatory Office for Network
Industries (RONI) are the competent regulatory authorities to the gas distribution
activities. According Act 250/2012, The NRA (RONI) purpose is a transparent no
discriminatory manner, the availability of goods and regulated activities related
therewith at reasonable prices and in determined quality.
A Price CAP methodology of regulation is applied. The price regulation model covers the
whole regulation period which is currently 5 years. The Prices are fixed for the
regulations period; it incentivised DSO to reduce costs.
DSO may request the regulator to adjust tariffs if the economic parameters on whose
basis the price was set have been substantially changed. For example in case of change
of gas price to make up for losses of profit and own consumption of DSO.
There is no correction factor implemented to achieve revenues.
Key features of the regulatory regime are set out in the following table
Table 456: Main features of the regulatory regime
Issue Approach
Type of regime (concession/licence) Licence
Duration of tariff setting regime 5 years
Form of determination (distributor propose/regulator decide)
DSO proposes allowed revenue and tariff structure, NRA approves
Scope for appeal regulatory decision N.A
2.2. Main incentive properties of the distribution regulatory model
The NRA has defined a model to calculate the maximum price and tariffs for access to
the distribution system. This model is oriented to determine a reasonable profit,
necessary to ensure the long‐term, safe and efficient operation of the distributions
system, a reasonable return on operating assets and stimulate stable. The details of the
models included in the Ordinance 193/2013 Coll.
The main aspects of the model are:
Model is based in Price Cap, when the NRA approves a he maximum price and
tariffs for access to the distribution system.
The price regulation method covers the whole Price regulatory period
The NRA defines which are the eligible cost and what are not
The NRA defines the method to calculate a reasonable profit, based in the
WACC structure.

614
Prices are fixed for the regulatory period, however prices may vary from year
with regard to the capital expenditures invested or due to the variable cost
changes
There is not mitigation form implemented as correction factor to achieve revenues.
DSO´s are incentivized to optimize their costs. DSO may request to NRA to review and
adjust prices if the economic parameters which were based the price has been
substantially changed. (Ordinance 250/2012 Section 17)
Quality standards have been set by the respective ordinance issued by NRA. They are
not interconnected to the tariff system. In the Slovakia Republic, a system of automatic
compensation payments for failure to comply with the prescribed quality standards is in
place.
Automatic compensation is granted to consumers in case some quality standards are not
met. The cost of that compensation is not included in the allowed returns of the DSOs.
2.3. Determination of cost of service parameters
The approach to determining key cost of service parameters are summarized in the
following table.

615
Table 457: Approach to key cost of service parameters
Parameter Approach
Form of price control Price Cap method
Regulatory asset base Based on the performed DSO asset assessment in 2006. The RAB Value of 2012 takes in account CAPEX development in the given period and the value of depreciation. During the regulatory
period the RAB values do not vary.
Capital expenditure
Approach to operating expenditure No benchmark approach
Form of WACC applied Real WACC, D/E has been set by NRA in the ratio 60/40
Additional revenue items (where applicable) Not applicable
The following formula is applied in determining the WACC:
DE R
DE
D
T
R
DE
EWACC
)1(
Where:
T: is income tax rate for year t,
E: is equity in EUR as of Dec 31, 2010,
D: is debt in EUR as of Dec 31, 2010
RD: is the real price of debt, calculated average amount of loans given to non‐financial
companies for the period of 5 and more years with the loan amount more than 1 mil.
EUR for the base year at 5.13%,
RE: is the real price of equity and own funds calculated according to the formula:
)( FMLEVFE RRRR ,
Where:
RF: is profitability of an risk‐free asset, calculated average revenue from 5+ year
government bonds issued in the Slovak market between 2007 and 2011 for the base
year at 4.01%,
(RM – RF): is the overall risk premium for the base year set by NRA at 3%; for the
following years set by RONI between 3% and 6%.
βLEV is weighted ratio β, which defines the sensitivity of a company share to the market
risk, taking into account the income tax rate and the debt share, calculated according to
the formula:
E
DTUNLEVLEV )1(1
Where:

616
βUNLEV is the unweight ratio β free of the influence of income tax rate and debt share for
the base year at 0,30; for the following years it has been set by NRA between 0,30 and
0,65,
T is income tax rate for year t
D/E is the ratio of debt to equity, the base year has been set to 60 % in favour of debt
For the base year, the real ratio of regulatory asset base profitability (WACC) has been
calculated by NRA at 6.04%. Parameter values for the following years, which serve to
calculate the ratio of regulatory asset base profitability (WACC) before tax, are published
on the RONI web site by June 30 of the calendar year.
The regulation formula includes the “X‐component”. The so‐called “X – factor” has been
set in relation to OPEX. OPEX may then be changed through (JPI‐X), where JPI is the
development of core inflation for the given period. The X‐component is selected based
on monitoring the company´s performance.
3. Tariffs for distribution services
3.1. Distribution tariffs
The NRA determines or approves the methodology of calculation of tariffs and setting
tariffs.
According to the Ordinance of the Office laying down the price regulation in gas industry maximum 60 % distribution costs comprise fixed amount (capacity component).
All of the costs are taken from the individual cost centres. Each cost centre is afterwards reallocated to the respective sales groups based on the best suitable allocation keys (actual usage of cost centre by the sale group ‐ e.g. number of customers, gas volumes sold, gas daily maximum). The amount of expected revenues should cover the total costs of the sale group. The legislation rules set the forbiddance of the cross donations of the sale groups.
The tariff system is not divided based on pressure levels, but tariffs are split based on
expected annual distributed gas volume. There is not time of use differentiation tariffs.
There are two classes of consumers:
Residential
Industrial (small businesses, medium customers, large customers)
The tariff components of each class of consumers is detail in table 3 of section 1.2
The price decision is published on NRA website and DSO website (Slovakian Only):
http://www.urso.gov.sk http://www.spp‐distribucia.sk/sk_obchodno‐technicke‐informacie/sk_cenniky

617
Various other aspects of distribution tariff setting are summarized in the table below.
Table 458: Approach to key issues in setting distribution tariffs
Issue Approach
Treatment of distribution losses Included in Distributions Tariff. The energy related component of the distribution tariff includes the cost of losses (2 %).
Presence of uniform tariffs Yes, the same tariff for consumers everywhere in the country (post stamp principle)
Presence of non‐linear tariffs No, all tariff components are linear
Presence of regulated retail tariffs YesEnd user price regulation for Households and with a yearly consumption less than 68.575 MWh and for small businesses with yearly consumption less than 100 MWh.
Presence of social tariffs No
3.2. Connection charges
Key issues in the setting of connection charges are set out in the table below.
Table 459: Summary of key issues relating to connection charges
Issue Approach
Determination of charges
Type of charges (shallow/deep)
Shallow
Methodology adopted The NRA approved the connection charges. There are Maximum prices for connecting to the distribution system:
‐ For household consumers ‐ For non‐household consumers
Hosting capacity Scope to refuse connection DSO is obliged to connect a consumer. DSO is allowed refuse connection of consumers only if the technical and commercial conditions for connection to the network are not met.
Requirements to publish hosting capacity
No
Targets and/or incentive schemes to enhance hosting capacity
No specific measures, but DSOs are obliged to ensure they have sufficient capacity on the network.
4. Distribution system development and operation
4.1. Distribution system development
Distributions system development plan is not approved, but it is published by the
regulator. Distribution development plan network consists only of brief information
about the numerical expansion of the distribution network.

618
The key features of distribution system planning are summarized below.
Table 460: Approach to distribution planning
Issue Approach
Form of distribution planning document Published but not approved by the regulator.
‐ Key responsibilities for its development DSO
‐ Degree of integration with renewables plan Not defined in network plan.
‐ Relationship with consumption trends Not applicable
‐ Relationship with quality of service targets Not defined in network plan
‐ How trade‐offs between network development and alternative technologies are treated
Not defined in network plan
‐ Requirements to integrate cost benefit analysis
Not defined in network plan
4.2. Metering
Key issues regarding metering, and the role of the DSOs, are set out in the following
table.
Table 461: Key approach to metering
Issue Approach adopted
Discos role in metering DSOs have full responsibility for metering, and own the meters.
Monopoly services in the metering Yes
Smart metering functionality Smart meters are currently standardly placed in the offtake category above 60 000 m3/year. Currently 4800 smart meters are placed. The smart meters provides the following information: e) remote reading f) max/min hourly flow (customers with consumption
above 400 000 m3/year), g) Daily consumption.

619
Country Report – Great Britain electricity distribution
1. Overview of the distribution sector
1.1. Institutional structure and responsibilities
In Great Britain there are 14 main Distribution Network Operators (DNOs) supplying
electricity to around 30 million customers covering an area of 229.848 km2. Summary
data on industry structure is set out below.
Table 462: DSO characteristics
Total number DNOs
Ownership unbundled
Legally unbundled
DNOs with less than 100,000 customers
Exemption* Share of total demand
Great Britain
14 major and 8 independent
6 are part of vertically integrated entities
All 6 Independent DNOs have to comply with the same unbundling requirements
0.5%
Every DNO licence is held by a company – that is, a distinct legal entity within any wider
corporate or ownership group. Licence conditions require compliance with the
requirements in the respective Internal Market Directives, and permit six DSOs to
remain in vertically integrated groups. The same requirements are in place for the
smaller independent DSOs.
The responsibility for setting distribution tariffs is shared between the NRA (Ofgem) and
the DNO. The definition of allowed revenue is determined solely by Ofgem. The DNO
There are 14 main DNOs of which 6 are part of vertically integrated entities
The regulator, Ofgem determines allowed revenue, while the DNO sets tariffs and connection
charges, subject to Ofgem approving its charging methodology
Revenue and tariff setting is exclusively the role of the DNO and Ofgem

620
proposes the tariff structure and Ofgem takes a decision, following consultation with
relevant stakeholders.
The DNO will also propose a methodology to calculate its connection charges. Ofgem
will assess this methodology and following consultation with stakeholders take a
decision on it. Note that Ofgem does not approve the actual connection charges, only
the principles in the methodology.
The breakdown of responsibilities as it related to tariff setting is summarized in the table
below. The setting of revenues and tariffs is solely the responsibility of Ofgem and the
DNOs
Table 463: Legal basis for tariff structure – Roles and Responsibilities in setting distribution tariffs
Actor Allowed revenues (tariff level)
Tariffs (tariff structure) Connection charges
DSO Proposes revenues to NRA
Proposes tariff structure to NRA
Calculates methodology for NRA approval
Government Not involved Not involved Not involved
NRA Takes decision on allowed revenues
Takes decision on tariff structure based on DSO proposal
Approves principles in the methodology and not charges
Any change to the tariff methodology is first developed by industry (DNOs, suppliers and
generators) as part of a working group. The working group will consult on the proposal
and take account of wider industry views. The proposal can then be submitted to Ofgem
for a decision. Ofgem can chose to consult on the proposal or move directly to taking a
decision. Once a decision is made, the new methodology can only become effective at 2
points in the year (1 April or 1 October). Industry must have 3 months warning of these
changes prior to implementation.
1.2. Key figures on revenue and tariffs
Net distribution revenues in Great Britain in 2013 for the 14 DNOs were £5,824 billion
(€7,250 billion). In addition the DNO received £54 million (€67.3 million) from metering
activities.
Customers are defined by voltage (LV, HV, EHV) and metering arrangements (half hourly,
non‐half hourly). Non half‐hourly customers are further split by settlement profile class.
Customers pay a fixed charge and a variable charge based on consumption (some
customer types pay time‐of‐use), which customers with half hourly meters also pay
capacity and reactive charges
A breakdown of revenue by customer category, including information on available tariff
components and the number of customers in each category is set out in the table below.

621
Table 464: Tariff components, customers and revenues per customer class, 2013
Customer classes Tariff components Number of customers Revenue (£)
Domestic KWh, per‐day standing charge
27.483.911 2.997.013.626
Smaller non‐domestic KWh, per‐day standing charge
2.123.382 691.413.232
Medium non‐domestic KWh, per‐day standing charge
161.544 321.699.418
Half hourly metered customers
KWh, KW, KVA 138.397 1.814.087.793
Total ‐ 29.907.216 5.824.214.069
The breakdown of energy volumes and distribution revenue by customer category are
set out in the charts below.
Figure 91: Proportion of energy and revenue accounted by customer categories
The above figure show a disproportionate share of revenue borne by domestic customer
categories in relation to the respective energy shares. However, the above graph does
not adjust for the respective cost of service provision by category and customer specific
costs.
A typical network tariff for one of the GB distribution companies in 2014 has been
calculated below for the following classes of customers:

622
Residential – domestic unrestricted (non‐half hourly)
Small commercial – low voltage medium non‐domestic (two rate, non half‐hourly)
Industrial – high voltage half hourly meter
Table 465: Breakdown of annual charges – typical customer types, 2014 (€)
Customer type
Notional Energy usage
Fixed charges Energy charges
Demand and reactive charges
Total
Residential 3500kWh 18 114 132
Small commercial
50MWh 140 1.467 1.607
Industrial 24000MWh 303 253.258 81.934 335.495
Note: Estimated from data from the CDCM of South Eastern Power Networks for 2014‐15
The resulting average tariffs per kWh are illustrated below.
Figure 92: Average network charges (€cents/kWh), 2013
The distribution tariff for half‐hourly metered customers is dependent upon the point of
network at which they are connected. Small industrial customers are typically connected
at low voltage (up to 6.6kV), largely industrial customers are most likely to be connected
at high voltage (above 6.6kV), while customers connected at 11kV or above (extra high
voltage) are charged in accordance with a different methodology that has site‐specific
properties and charges based on long‐term incremental cost. This is called the ´extra
high voltage distribution charging methodology´, called the EDCM. This model includes
customer specific information and so is not publicly‐available.
The charging methodology is based upon allocating the costs of an incremental increase
in demand of 500MW. These costs are allocated to customer types based on that
customer type’s contribution to peak network demand. The price signal generated by
the methodology is then scaled up or down based on a p/kWh scaling amount so that
tariffs allow DSOs to recover its allowed revenue under the price control.

623
2. Regulation of distribution activities
Regulatory revenues are set under an approach (RIIO) designed to incorporate allowance for incentives, innovation and outputs.
An 8 year regime is in place with specific focus on minimising total expenditure (capital and opex).
Sharing mechanisms for over and under spend are in place.
2.1. General overview
The approach to regulating distribution charges is termed RIIO (Revenues = incentives +
innovation + outputs). This approach replaced the previous RPI‐X approach and is
designed to focus to what the network company should deliver over the price control
period. The output categories are:
Reliability and availability
Safety
Customer satisfaction
Timely connections
Environmental impact
Social
Rewards and penalties for performance against these categories is subject to a mix of
financial and reputational incentives.
Revenues are set every 8 years as part of a price control process. Penalties or rewards
from incentive schemes automatically update these revenues (on a 2 year lag).
Distribution allowances are set ex ante by Ofgem as part of the price control. Business
plans are submitted, following extensive stakeholder engagement, to Ofgem to inform
the price control setting process.
The price control allows for some re‐opener mechanisms – for example, investment
schemes in cases where uncertainty existed at the time of setting the price control.
The application of a simple x factor is not applicable in RIIO price controls.
There are no concession schemes in place. However, there is competition for new
connections between incumbent DSOs, independent DSOs and independent connection
providers. Independent DSOs also compete with DSOs to adopt new connection assets
and operate and maintain them.
Summary features of the regulatory regime are set out in the following table
Table 466: Main features of the regulatory regime
Issue Approach
Type of regime (concession/licence) Licence
Duration of tariff setting regime 8 years
Form of determination (distributor propose/regulator decide)
Distributor propose, regulatory decide
Scope for appeal regulatory decision Merits appeal to the Competition Commission permitted

624
2.2. Main incentive properties of the distribution regulatory model
A key pillar of the regulatory framework is the use of a revenue control period of 8
years, which is set using a RIIO approach (Revenues = Incentives + Innovation +
Outputs). This is an incentive based approach involving:
Setting total expenditure (Totex) allowances;
Including Totex Incentive Mechanisms; and
Including an additional range of incentive adjustments in the allowed revenue formula,
including for quality of service.
The following risk mitigation on profit sharing is in place:
Under the Totex Incentive Mechanisms there is a sharing mechanism for over spend/
under spend by a company. Under the sharing mechanism, the DNO retains a fixed
percentage (around 60%) of any profit with the customers receiving the remainder
(around 40%). The same proportions apply to any over spend.
Analysis of the financial viability of the DSO at the price control review
The use of Uncertainty Mechanisms – for example related to expenditure requirements.
The DSO’s revenue is adjusted for a quality of service component that takes into account
performance against the following indicators:
Number of Customer interruptions;
Duration of Customer interruptions;
Community satisfaction;
Speed and quality of telephony response;
Ofgem’s Customer Service Reward Scheme;
Supply restoration under severe weather conditions;
Supply restoration under normal weather conditions.
DSO’s are required to come within 97% and 103% of revenue by managing charges.
Over/under recovery is then reflected in a “correction factor” term in the allowed
revenue formula. Penalty interest is applied to excessive over or under recovery.
2.3. Determination of cost of service parameters
In determining the revenue requirement Ofgem considers comparative efficiency
analysis, regional factors, an information quality incentive (IQI) and total cost
requirements. A toolkit approach is adopted that applies a combination of aggregated
and disaggregated econometric and engineering based approaches, totex and
disaggregated data as well as using historical and network company forecast data.
A key objective of the determination of a revenue requirement is to reduce total costs,
with total expenditure/aggregated models developed to identify the DSO’s opex‐capex
trade‐offs. In addition, disaggregated econometric and engineering/activity based
approaches are developed to enable the estimation of the relationship between a

625
disaggregated cost and a given cost driver. An efficient total expenditure allowance is
determined based on an average of the different approaches. A mix of approaches is
adopted to reflect Ofgem’s belief that there is no one correct model for assessing
comparative efficiency but a number of plausible ones.
The information quality incentive (IQI) matrix provides incentives for network
companies to reveal their efficient level of costs by providing a reward (or penalty)
according to their cost submission relative to Ofgem’s assessment. The mechanism also
sets the efficiency incentive rate which sets out the proportion of underspend (or
overspend) during the price control period incurred by shareholders.
The approach to determining key cost of service parameters are summarized in the
following table.
Table 467: Approach to key cost of service parameters
Parameter Approach
Form of price control Revenue based with efficiency adjustments
Regulatory asset base (RAB) Efficient investment is rolled forward into the RAB, with typically 85% of total expenditure assumed to be capital related
Capital expenditure Total expenditure benchmarking
Approach to operating expenditure Total expenditure benchmarking
Form of WACC applied Vanilla WACC, with tax modelling in the cashflow
Additional revenue items (where applicable) IQI incentives, service quality
The capitalised proportion of Totex – typically 85%, is incorporated into the RAB, with
depreciation and inflation indexation applied to the RAB balance at the end of the year.
Ofgem retains the right to challenge/ disallow inefficient expenditure and adjustments
made to the RAB, however, it informs that owing to business plan assessment and
annual reporting scrutiny, there have been few incidents of disallowances.
Ofgem’s approach to the cost of capital is to apply the Vanilla Weighted Average Cost of
Capital (WACC). Under this approach the DSO’s tax cost is separately calculated as a
discrete cash flow allowance. A real vanilla WACC is applied because the regulatory asset
base is indexed. The WACC incorporates notional gearing of 65%, which is broadly
reflective of business gearing levels (52.1% to 71.2%).
3. Tariffs for distribution services
The tariff methodology permits the setting of negative energy charges (in the event of export) for
embedded generators
Tariffs vary by DNO with different methods in place for extra HV customers (negotiated) and
other customers
Connection charges reflect the cost of work involved, and are predominately shallow in nature

626
3.1. Distribution tariffs
Two use of system charging methodologies are in place. One for extra high voltage
customers (EDCM) and another covering all other customers connected (CDCM).
The EDCM charges on a site specific way with forward investment costs included. The
CDCM differentiates charges by voltage connection and customer type/usage. For LV
and HV customers, costs are categorised as:
Network asset by voltage and transformation level: 132kV; 132kV/EHV; EHV; EHV/HV;
132/HV; HV; HV/LV; LV circuit
Transmission exit charges; and
Other expenditure split between being allocated: by network level; and to assets
dedicated to one customer.
There are a number of different tariff classes but the main four types are:
Domestic, with the following components:
o One or two rate (per KWh)
o Fixed charge (per day)
NHH metered (non‐domestic), with the following components:
o One or two rate (per KWh)
o Fixed charge (per day)
HH metered (LV, HV and HV substation), with the following components:
o Three rate (per KWh)
o Fixed charge (per day)
o Capacity charge (per day)
o Reactive charge (per KVArh)
EHV HH metered, with the following components:
o Super‐red rate (per KWh)
o Fixed charge (per day)
o Capacity charge (per day)
o Exceeded capacity charge (per day)
In the case of embedded generators, where a DNO considers that an embedded
generator is providing a benefit to the network, the per‐KWh network charges are
negative (a credit). Depending on the type of generator (e.g. intermittent), that
generator may pay fixed and reactive charges.
Various other aspects of distribution tariff setting are summarized in the table below.
Table 468: Approach to key issues in setting distribution tariffs
Issue Approach
Treatment of distribution losses These are covered by the supplier
Presence of uniform tariffs No – these vary by DNO
Presence of non‐linear tariffs All tariff components are linear
Presence of regulated retail tariffs No
Presence of social tariffs No

627
Suppliers pay the cost of losses on the network. DSOs include a loss adjustment factor
for each network level. This informs the supplier how much additional electricity it
needs to purchase to cover that which will be lost in transportation.
3.2. Connection charges
Key issues in the setting of connection charges are summarised in the table below.
Table 469: Summary of key issues relating to connection charges
Issue Approach
Determination of charges
Type of charges (shallow/deep) Charges are considered bespoke and based on the cost of the work. These are relatively shallow in nature (´shallow‐ish´)
Methodology adopted The DNO must publish a methodology that is to be approved by the regulator.
Hosting capacity Scope to refuse connection The DNO is required by the Act to connect those that require connection
Requirements to publish hosting capacity Hosting capacity is published in the annual Long Term Development Statement (LTDS)
Targets and/or incentive schemes to enhance hosting capacity
No specific targets are set. However, there are incentives such as the Load Index and the Interruption Incentive Scheme that provide incentives to invest in capacity
For most connections, charges are bespoke and based on the cost of the work required.
The costs are computed by the DSO. For certain tasks, such as scheme design approval
and inspection and monitoring of works, set fees apply.
Connection charges are predominately shallow in nature. Customers pay the full cost for
assets that will only be used by them or are not part of the minimum cost scheme for
connection. Customers will also pay a proportion of wider network reinforcement cost
where required. The proportion of wider reinforcement that they pay for is determined
by the amount of the created capacity that they use. Customers pay for reinforcement
at the voltage level they have connected at, plus reinforcement at one voltage level
higher. For example, if a customer connects to the 11kV network, they will pay charges
for reinforcement works on the 11kV and 33kV networks.
For distributed generation connections, the high cost project threshold applies. Any
reinforcement costs above £200/kW will be paid by the connecting customer.
DNOs are required to maintain and publish a connection charging methodology which
details how connection charges are calculated. Certain sections of the methodology are
common across distribution service areas but charges are specific to each DNO. The
regulator does not approve charges but does approve the methodology. Non‐
contestable work must be charged ‘at cost’ to the customer. Margins are permitted on
contestable work where the DNO has to compete with other parties).

628
Section 16 of the Electricity Act 1989 places a duty on the DNO to connect those
requiring a connection. It also lists the relevant parties that can request a connection as
being the owner or occupier of a premises or the authorised supplier operating on their
behalf. A DSO is required to issue a quote for the connection works within 3 months.
The connecting customer must then decide if it wants to go ahead with the work.
DNOs are required to publish hosting capacity through the long term development
statement. This statement contains details of parts of the DNO’s network that will reach
capacity within five years (e.g. thermal capacity, voltage capacity etc.) and the DNO’s
plans to improve capacity in the next two years. The statement is updated twice a year.
Ofgem has introduced incentives for DNOs to improve information provision to
connecting customers. In response some DNOs publish ‘heat maps’ which show hosting
capacity down to the 11kV network.
No specific targets for hosting capacity are set. There are however incentives, such as
the Load Index and the Interruption Incentive Scheme which encourage DNOs to invest
in an efficient and reliable distribution system. The Load Index is an output metric for
substation loading capturing a the loading risk on a substation taking account of load
(MVA) over firm, duration over firm and forecast load growth. The Interruption
Incentive Scheme sets targets for each DNO’s performance in provision of a reliable
service. DNOs are rewarded or penalised depending on their performance on the
number and duration of interruptions.
4. Distribution system development and operation
4.1. Distribution system development
The key features of distribution system planning are summarized below.
Each DNO publishes a 5 year Long Term Development Statement (LTDS), which is published
annually with a mid‐year update
The DNOs can enter into bilateral arrangements with Demand and Embedded Generators for
dispatch
The role of the DNO in metering is largely restricted to maintenance of meters installed prior to
March 2007.
There are currently more than 750,000 smart and advanced meters installed. A further 26.3
million smart meters are planned to be installed by the end of 2020

629
Table 470: Approach to distribution planning
Issue Approach
Form of distribution planning document Each DNO is required to publish a LTDS that looks 5 years ahead. This is published annually with a mid‐year update. It provides network data from the highest distribution voltage down to the lower voltage busbars of primary substations (typically 11kV)
‐ Key responsibilities for its development Plan is prepared by the DNO subject to an agreed scope
‐ Degree of integration with renewables plan No direct relationship
‐ Relationship with consumption trends The plan takes into account forecast demand growth over the 5 year period
‐ Relationship with quality of service targets The DNO is responsible for ensuring the network is developed consistent with the planning standard embedded in its licence and to meet its quality of service targets
‐ How trade‐offs between network development and alternative technologies are treated
The LTDS does not address this. However, the DNOs have to justify proposed investment decisions and address trade‐offs in its business plan price control submissions each 8 years
‐ Requirements to integrate cost benefit analysis
Cost benefit analysis is integrated into the business plan submissions at the 8 yearly price control review.

630
4.2. Distribution system operations
The key features of distribution system operations are summarized below.
Table 471: Approach to distribution planning
Issue Approach
Requirements for dispatch of renewable plants connected to DSO network
A DNO can enter into a bilateral arrangement with a generator connected to its network so that the DSO can issue dispatch instructions
Possibility to dispatch flexible loads A DNO can enter into bilateral agreements with a demand or generation customer
Other sources of flexibility open to DSO Trials related to use of storage are being undertaken
Generators in Great Britain self‐despatch. However, a DNO can enter into a bilateral
agreement with a generator connected to its network so that the DNO can issue
despatch instructions provided that such arrangements are consistent with any
operational obligations to the system operator. In addition, a DNO can enter a bilateral
agreement with a demand or generation customer connected to its network to modify
its load at the instruction of the DNO.
A number of trials are underway where a DNO has access to battery storage. Future
arrangements for the use of storage are under development.
4.3. Metering
Key issues regarding metering, and the role of the DNOs, are summarised in the
following table.
Table 472: Key approach to metering
Issue Approach adopted
Discos role in metering DNOs only have obligations to maintain meters installed prior to 31 March 2007.
Monopoly services in the metering Since 31 March 2007 the market has been liberalised, responsibility is generally on the suppliers
Smart metering functionality Half hourly measurementRemote reading Remote disconnection Remote control of maximum power Meters are capable of receiving tariff information and passing it on to appliances that can be programmed to react in a particular way Local port to send real time information to consumers
The market for meters was liberated at the end of March 2007. DNOs have legacy
obligations to provide (and operate) electricity meters installed prior to 31 March 2007,
which are subject to separate price control arrangements. Subsequently the

631
responsibility is largely on the suppliers. Suppliers can source metering services from
alternative suppliers or the DNOs. DNOs do not have to offer any services but are under
an obligation to report damage or interference of the metering equipment. However,
some DNOs continue to offer meter assets provision services for traditional electricity
meters.
While it is not expected that DNOs will directly provide smart metering meter assets
provision services, it is possible that parent companies may operate in the smart
metering market.
As of Q1 2014 there were more than 760,000 smart and advanced meters installed in
Great Britain, broken down as follows.
Table 473: Number of smart meters installed – by end of 2013
Customer category Number
Smart meter – domestic 234,336
Smart meter – non domestic 5,711
Advanced meter – non domestic 521,875
Total 761,922 Note: Advanced meters have a minimum requirement to store half hourly data to which the customer can
have timely access and the supplier remote access. These are to be replaced by smart meters by 2020.
The GB Government coordinates and approves the Smart Meter deployment plan. The
following roll out plan for smart meters is in place. This involves the installation of more
than 26.3 million smart meters by the end of 2020.
Table 474: GB Government Smart Metering roll out plan.
Year Domestic Non‐domestic
2014 488,220 120,396
2015 1,508,308 188,528
2016 3,219,830 213,879
2017 5,049,894 326,095
2018 5,678,206 341,320
2019 5,431,616 320,212
2020 3,910,045 284,314
4.4. Annex 1 – The RIIO Regulatory Price Control Framework
This section considers the RIIO regulatory framework. In particular, the various incentive
mechanisms and innovation drivers are discussed and quantified.
4.4.1. Introduction Since 2013 a new incentive regulation for natural gas DSOs has been in use, known as
RIIO (Revenue = Incentives + Innovation + Outputs). For electricity DSOs, RIIO regulation
is planned to be introduced in April 2015. The RIIO approach maintains certain central
aspects of the previously‐used approach (and in particular, continued use of strong

632
efficiency incentives, or rewards for spending less than planned). Importantly, RIIO also
uses measures which encourage network companies to focus on the outputs for their
customers; contribute to the development of a low carbon economy and innovate to
reduce network costs. Some of the most notable characteristics of RIIO include:
8‐year regulatory period (previously, a 5‐year period was used);
Upfront (ex‐ante) assessment to set base revenues and the basis for change in
revenues;
Cost‐sharing mechanism (i.e. cost savings are shared between the company and
customers);
Totex approach (takes opex and capex together, thereby incentivising the company
to opt for the most economic option when deciding between opex and capex
solutions);
Comprehensive quality outputs (e.g. network reliability level, emissions levels,
availability);
Uncertainty mechanisms (provisions available to manage specific cases of
uncertainty risk through possible revenue changes during the regulatory period);
Promotion of innovation (encourages DSOs to consider different ways of achieving
greater cost savings or increase the scope of future delivery).127 Innovation is
promoted in various ways, as discussed in Box 1.
Box 1. Promoting innovation under RIIO
The RIIO regulatory framework is designed with a view to promoting innovation in various ways. The use of an 8‐year price control is meant to offer DSOs greater certainty of the rewards for successful innovation. The NRA also takes into consideration past and future innovation funding provided to DSOs when setting the efficiency frontier for the regulatory period (higher levels of innovation funding suggest innovation should be achieved more cost‐efficiently). Furthermore, three financial stimuli are used to promote innovation:
1. Network innovation allowance – an allowance which each DSO receives to fund small‐scale innovative projects as part of their price control agreement/settlement. It is a use‐it‐or‐lose‐it allowance, meaning that the amount that a DSO receives depends on how effectively it shows, in its innovation strategy, that it has planned its innovation efforts to be realised over the price control period. The value of the Network Innovation Allowance will be between 0.5% and 1% of base revenues.
The default level of funding will be 0.5% unless the DSO produces a clear, coherent and well‐justified innovation strategy that exceeds the minimum requirements and fully‐justifies why additional funding of up to 1% is needed.
2. Network innovation competition – this is a single and annual competition which funds large‐scale and innovative projects with environmental and low‐carbon benefits. DSOs can receive up to 90% of project funding through the competition.
3. Innovation roll‐out mechanism – a revenue adjustment mechanism which is designed to provide funding for the roll‐out of proven low‐carbon and environmental innovations during the price control period. The criteria for eligibility for funding are set in a specific innovation roll‐out mechanism license condition; there are two license application periods.
In order to set the allowed base revenues and the incentives which will apply during the
regulatory period, DSOs and Ofgem must reach agreement, which is typically realised
127 Ofgem, 2014. Regulatory regimes in GB – a high level summary. Received from:
https://www.ofgem.gov.uk/ofgem-publications/90534/regulatoryregimesingb.pdf

633
following negotiations. The main elements of the RIIO process are shown in Figure 93.
The process is initiated with stakeholder consultations and the DSO undertaken internal
analysis on its future activities, which leads on to the development of the business plan.
Specifically, DSOs need to submit well‐justified business plans (covering the 8‐year
period), describing how they will meet the RIIO objectives. Plans are assessed against
certain criteria, including efficiency considerations, and evidence of DSOs´ having
engaged with stakeholders should be presented. Ofgem then makes a benchmarking
analysis of the plans.127
Figure 93 ‐ Main elements of the RIIO process
Source: Public Utilities Fortnightly, 2013128
In addition to projections of base revenues, DSOs´ business plans should either (1)
acknowledge that Ofgem´s proposed mechanisms to manage uncertainty over the 8‐
year period are appropriate, or (2) provide evidence justifying why further revenue
adjustment mechanisms will be needed. If DSOs also request changes from output
incentives put forward by Ofgem, their plans must provide solid justification for why

634
such changes are requested.128 The main outputs include high levels of network
reliability, availability, environmental impacts (decarbonisation and renewable targets),
safety and customer satisfaction.
If a DSO´s business plan is considered to be of particularly high quality, it may be
accepted by Ofgem as submitted and the company´s price control settlement will be
fast‐tracked. In other words, Ofgem can elect, at its discretion, to fast track a business
plan if it determines that it meets high standards. DSOs which submit business plans
which are not fast‐tracked are requested to resubmit (improved) business plans.
In determining whether a business plan is eligible to be fast tracked, Ofgem makes a
series of analyses of certain criteria. These are listed in Box 2. In order to qualify for
being fast‐tracked a business plan must demonstrate that it satisfactorily meets all of
the criteria. The onus is on DSOs to demonstrate the cost‐efficiency and long‐term value
for money of their business plans. Ofgem uses benchmarking of historical and forecast
data in order to inform its assessments of DSOs´ forecasts, rather than as a means of
setting specific allowances.
In making its costs assessments within the review of DSOs´ business plans, Ofgem uses a
toolkit approach, comprising both Totex analysis and the use of disaggregated
approaches. Totex analysis is claimed to assist in establishing the overall levels of
efficiency of network operators; disaggregated assessments comprise separate reviews
of operating and capital expenditures.
Box 2 – Five core criteria against which business plans are assessed
All DSOs´ business plans are assessed against the following questions under five core criteria. In order to be fast‐tracked a DSO must demonstrate that its plan meets the criteria in all of the sections.
Process – has the DSO followed a robust process?
Is the business plan clearly presented, with all key content included?
Has the DSO engaged with stakeholder, and explained how this has influenced its business plan?
Has the DSO submitted, and justified, all data tables and the PCFM?
Does the business plan provide a strategy for long‐term delivery?
Outputs – does the plan deliver the required outputs?
Has the business plan covered the outputs specified in our strategy decision or provided clear and compelling justifications for any departures from the strategy decision?
Has the DSO explained the resource implications for delivery of each output identified?
Has the DSO explained how it will deliver outputs, and justified output baseline/forecast?
Has the DSO explained the quality of its existing outputs and secondary deliverable (including information on asset health, criticality and asset risk) and how it plans to improve this information in the future?
Resources (efficient expenditure): Are the costs of delivering the outputs efficient?
Has the DSO demonstrated that cost projections are efficient?
How does the plan compare with others/does it reflect wider best practice?
Has the DSO demonstrated that their financial costs are efficient (e.g. through market testing)?
128 Public Utilities Fortnightly, 2013. A trip to RIIO in your future? Received from:
http://www.brattle.com/system/publications/pdfs/000/004/958/original/A_Trip_to_RIIO_in_Your_Future.pdf?1386706496

635
Has the DSO explained cost projections in the context of historical performance?
Has the DSO demonstrated a consideration of alternative approaches to achieving value for money in the delivery of its outputs?
Has the DSO clearly‐linked its expenditure to relevant outputs and secondary deliverables?
Resources (efficient financing): Are the proposed financing arrangements efficient?
Does the business plan conform to the financial policies specified in the strategy, are any departures well‐justified?
Has the DSO provided evidence that financial costs are efficient?
Is the data in the plan consistent and has the DSO explained cost projections in the context of historical performance?
Uncertainty and risk: How well does the plan deal with uncertainty and risk?
Has the DSO clearly articulated the key uncertainties it faces and considered how it will address them (e.g. including uncertainty mechanisms)?
Has the DSO considered risk and how to mitigate those risks?
Source: Ofgem, 2013129
During the process of developing their business plans, DSOs know the targets that
Ofgem has set. DSOs can choose to accept Ofgem´s stated targets and incorporate them
into their business plans; or alternatively, DSOs can propose the use of different targets,
providing justification for why targets should differ from those set by Ofgem. In the
second instance, a negotiation between the DSO and Ofgem is undertaken and a
decision is reached regarding whether the DSO‐proposed targets can be used.
DSOs which are put on the slow track are subjected to Ofgem´s analysis of appropriate
expenditures for their activities in the following price control, even in the event that the
price analysis differs significantly from the DSO´s submitted plan. The DSO can then
accept Ofgem´s analysis of expenditures and agree to its use in the following price
control. Or alternatively, the DSO can refer the final license amendments (suggested by
Ofgem) to the GB Competition Commission for appeal. Third parties must cover the
appeal costs themselves, and must prove to Ofgem´s satisfaction that they have
sufficiently engaged with stakeholders within the price control review process. The
appeal process should be resolved within 30 weeks.
4.4.2. Performance Rewards and Penalties under RIIO
RIIO provides DSOs with incentives which offer opportunities to benefit by receiving
financial rewards for good performances, as well as incentives to avoid profit‐reducing
penalties. In fact, RIIO imposes numerous incentives on DSOs, covering a variety of
performance criteria. In this section we explore those financial incentives.
One initial and straightforward incentive is the Information Quality Incentive, which
relates to DSOs´ success in having their submitted business plan being fast‐tracked.
DSOs which are fast‐tracked are allowed to receive upfront additional revenues
equivalent to 2.5% of their Totex.
129 Ofgem, 2013. Strategy decisión for the RIIO‐ED1 electricity distribution price control. Received from:
https://www.ofgem.gov.uk/ofgem-publications/47067/riioed1decoverview.pdf

636
The efficiency incentive on network investments is a measure which provides that DSOs
which have their business plans fast‐tracked also receive further advantage over those
that do not have their plans fast‐tracked, in that:
Fast‐tracked DSOs are allowed to retain 70% of their efficiency savings achieved
within network investments; whilst
DSOs which are not fast‐tracked are allowed to only retain 45% ‐ 65% of their
efficiency savings achieved within network investments.130
A further series of performance incentives acting on DSOs under RIIO are the potential
rewards or penalties through the adjustment of the Return on Regulatory Equity (RoRE)
under the Interruptions Incentive Scheme, which relates to network reliability. This
incentive is discussed in Table 475 below. Such adjustments affect the returns to
shareholders on the notional proportion of the Regulatory Asset Base that is financed by
equity finance. The Interruptions Incentive Scheme in RIIO is retained from the previous
regulatory scheme, the GB Distribution Price Control Review 5 (DPCR5).
Ofgem published analysis of a plausible RoRE penalty and reward range for fast‐tracked
electricity DSOs under RIIO‐ED1 (due to begin in April 2015). This is shown in Figure 94.
This is indicative of a possible range and should not be considered as binding. As
mentioned above, the final scale of these incentives will become clear when Ofgem
closes its price control, and following negotiations with individual DSOs.
For the purposes of comparison, the plausible RoRE penalty and reward range of Figure
94 is shown alongside that for the range used under the DPCR5, which was in effect
from 1 April 2010 to 31 March 2015. It can be noted that the likely returns for electricity
DSOs under RIIO are larger, in terms of both values and number of incentives, compared
to the previous (non‐RIIO) control period. Of particular note are the (larger) maximum
efficiency incentive rate and the incentives for connections.
130 DNV GL, 2014. UK´s RIIO and playing by the rules. Received from:
http://blogs.dnvgl.com/utilityofthefuture/uks-riio-and-playing-by-the-rules

637
Figure 94 – Network reliability. Plausible RoRE range for a fast‐tracked DSO in RIIO‐ED1 (compared with DPCR5)
Source: Ofgem, 2013131
131 Ofgem, 2013. Strategy decisión for the RIIO‐ED1 electricity distribution Price control. Financial issues. Received from: file:///C:/Users/A406918/Desktop/riioed1decfinancialissues.pdf

638
Table 475 – Overview of main incentives for electricity DSOs
´Output´/ performance to
be incentivised
How it is measured Trigger Scope of the
incentive
Expected impact on RORE
(or total allowed
revenues)
Submission of high quality
business plans for
regulatory period
The quality of a DSO´s business plan is assessed
based on five criteria, as described in Box 2
(above)
If a DSO´s business plan is fast‐tracked, the company is
provided with upfront additional revenue of 2.5% of totex.
If the DSO´s business plan is not fast‐tracked it does not
receive this reward.
2.5% of a
DSO´s totex
Between 0, and additional
allowed revenues of 2.5%
totex.
Efficiency improvements
across operations
Positive cost savings, measured as the
difference between realised and planned costs
The DSO can retain any cost savings it makes (the
difference between realised and anticipated costs). DSOs
can retain efficiency savings as follows:
DSOs with a fast‐tracked business plan: 70% of
efficiency savings;
DSOs without fast‐tracked business plans: 45%‐60%
of efficiency savings.
Difference
between
realised
(actually
incurred) and
planned costs
Increased innovation The degree to which Ofgem considers that a
DSO has shown, in its innovation strategy, that
it has planned sufficient innovation efforts
(which will be realised over the price control
period).
If the DSO´s innovation strategy is considered to be
acceptable, 0.5% of its base revenues are allowed to be
used to fund small‐scale innovative projects. If the DSO
produces a clear, coherent and well‐justified innovation
strategy that exceeds the minimum requirements and
fully‐justifies why additional funding is needed, a bonus,
equivalent to (a further) 0.5% of base revenues can be
allowed.
Between +0.5% and +1%
of base revenues
Improved DSO
performance in relation to
dealing with customer
complaints
The number and type of complaints received,
and the time taken to resolve them
Targets are set for dealing with complaints (targets are set
based on DSOs´ performance related to dealing with
customer complaints in the pre‐RIIO regulatory
framework. Specific information on target levels has not
been published). DSOs which fail to achieve target levels
face a penalty of up to 0.5% of base revenues. DSOs which
meet targets do not face any penalty (nor do they receive
Between 0 and ‐0.5% of
base revenues

639
´Output´/ performance to
be incentivised
How it is measured Trigger Scope of the
incentive
Expected impact on RORE
(or total allowed
revenues)
any reward).
Targets are set which measure performance in 4
categories, each with a specific weighting:
% of total complaints outstanding after 1 day (10%
weighting)
% of total complaints outstanding after 31 days
(30% weighting)
% of total complaints that are repeat complaints
(50% weighting)
Number of Energy Ombudsman decisions that go
against the DSO as a % of the total complaints (10%
weighting)
Improved DSO
performance in terms of
delivering customer
satisfaction
The Customer satisfaction survey measures
overall customer satisfaction within three
customer categories: (1) connections; (2)
interruptions; and (3) general enquiries.
According to Ofgem, ´DNO performance in the customer
satisfaction survey will be measured against fixed targets.
Ofgem will gather data on performance in DPCR5 (the pre‐
RIIO regulatory regime) and use this to set targets for
RIIO.´ The measure includes a factor of number of
´unsuccessful calls´ from customers experiencing an
interruption (e.g. calls terminated by the DSO or calls
abandoned by the customer in the queue). Overall
performance score deteriorates the more calls it fails to
answer.
± 1% of base revenues.
Comprised of:
Connections: ±0.5%;
Interruptions: ±0.3%; and
General enquiries: ±0.2%
Improved DSO
engagement with
stakeholders
The extent to which DSOs engage effectively
with a broad range of stakeholders and use the
outputs from the process to inform how they
plan and run their business.
An overall assessment of DSOs´ performance in terms of
engaging with stakeholder is made, with particular focus
on DSOs´ efforts to address customer vulnerability. The
DSO is eligible to receive up to 0.5% of base revenues
reward in‐line with Ofgem´s analysis of its stakeholder
Between 0 and +0.5% of
base revenues

640
´Output´/ performance to
be incentivised
How it is measured Trigger Scope of the
incentive
Expected impact on RORE
(or total allowed
revenues)
engagement performance.
Reduced levels of
electricity losses on the
distribution network
DSOs´ performance is measured based on:
Companies understanding of their losses
and preparation for a measurable losses
incentive in the second RIIO period
Effectiveness of actions taken to reduce
losses, including any actions which have
achieved losses reductions which are
substantially greater than forecast
The demonstrable engagement of DSOs
with their stakeholders (e.g. connection
customers, supply chain partners) on
losses
Innovative approaches to losses reduction
(outside of any projects funded through
the innovation stimulus mechanisms)
Performance against the strategy set out
to address losses
Sharing of best practice with other
companies
DSOs may receive payments from a limited fund amount.
Specifically, DSOs may receive rewards for good
performance, from money within the Losses Discretionary
Award of up to GBP 32 million across all electricity DSOs,
awarded in three tranches over the 8 year regulatory
period, as follows: one tranche of up to GBP 8 million in
year 2; a second tranche of up to GBP 10 million in year 4;
and a final tranche of GBP 14 million in year 6.
DNOs wishing to participate in the DR will be required to
submit evidence against the scorecard criteria. The criteria
could be weighted differently over the three tranches.
Ofgem will assess the submissions, with expert advice
where necessary, and make recommendations to the
Authority
Fixed amount
fund of GBP 32
million to be
dispersed over
the 8‐year
regulatory
period
Rewards only, with
amounts not linked
directly to RORE
Reduced levels (number,
frequency, duration) of
interruptions
Measurements of the number and duration of
network supply interruptions versus a target
derived from benchmark industry performance
DSOs are measured in relation to their performance
against interruptions targets, where separate targets are
used respectively for planned and unplanned
interruptions.
Annual DSO targets for planned interruptions will be set at
the annual average level of planned interruptions and
minutes lost over the previous 3‐year period. There is a 2‐
Reward or penalty of up to
250 RORE basis points per
year

641
´Output´/ performance to
be incentivised
How it is measured Trigger Scope of the
incentive
Expected impact on RORE
(or total allowed
revenues)
year lag on the years utilised in setting the targets. DSOs
are rewarded or penalised based on the difference
between their actual performance and the target (and
using an incentive rate that is 50% that of unplanned
interruptions).
With regard to unplanned interruptions targets, specific
targets are set for each DSO upfront (based on pre‐RIIO
framework performances).
Each DSO can receive a reward or penalty of up to 250
RORE basis points per annum, depending on how their
actual performance compares to set targets.
Source: Ofgem, 2013131

642
Country Report – Great Britain (gas distribution)
1. Overview of to the distribution sector
1.1. Institutional structure and responsibilities In Great Britain there are 31 distributors supplying gas to 23.329.812 customers covering an area of
230.000 km2. Gas distribution networks do not cover the full footprint of Great Britain; however,
DSOs are licensed to provide an emergency service to respond to any reported gas escape. Summary
data on industry structure is set out below.
Table 476: DSO characteristics
Total number DSOs
Ownership unbundled
Legally unbundled
Less than 100,000 customers
Exemption* Share of total demand
Country 31 ‐ 8 12 No 0,4%*exemption from distribution network charges for certain types of grid users, such as low‐carbon generation connected to distribution networks.
The responsibility for defining the allowed revenues of DSOs is set solely by the NRA, Ofgem. With
regard to defining the tariff structure, the DSO proposes the tariff structure and the NRA takes a final
decision on whether it is acceptable or not, following consultations with relevant stakeholders.
The breakdown of responsibilities as it related to tariff setting is summarized in the table below.
Table 477: Legal basis for tariff structure – Roles and Responsibilities in setting distribution tariffs
Actor Allowed revenues (tariff level)
Tariffs (tariff structure) Connection charges
DSO Not involved Proposes the tariff structure
Proposes methodology to calculate the charges.
Government Not involved Not involved
NRA Full responsibility for setting allowed revenues
Consults with stakeholders on the DSO´s proposed structure. Takes final decision
Consults with stakeholders, assesses the methodology. Takes a final decision on the methodology principles (not responsible for approving the actual connection charges)
There are 4 large‐scale DSOs active in the gas distribution sector in Great Britain, which are legally‐unbundled. The 12 DSOs which supply a customer base of less than 100.000 supply around 0,4% of total gas demand.
The regulator determines the amount of allowed revenues; in 2013 these were € 3.291 million.

643
X = main responsibility; other options to fill the table: sets rules; monitors ex‐post; defines main principles; calculates for
NRA approval; also involved;
The regulatory process adopted to setting distribution tariffs is that DSOs set charges using a
methodology approved by the regulator (i.e. the regulator does not technically approve the charges).
1.2. Key figures on revenue and tariffs Distribution revenues in Great Britain in 2013 were € 3.291 million, broken down by the following
activities:
Distribution – € 3.237,8 million (98,4%)
Metering – € 53,8 million (1,6%)
There are no typically customer category definitions. However, the NRA generally considers a typical
household to have a consumption of 15.000 kWh.
2. Regulation of distribution activities
2.1. General overview
The regulatory model includes incentives on efficiency (the totex incentive regime) and incentives to
perform well and/or outperform various quality output measures.
The up‐front revenue control of 8 years is set using the RIIO approach (Revenues = incentives +
innovation + outputs) price control. This is an ‘incentives‐based’ approach involving:
‐ Setting Totex allowances
‐ Totex Incentive Mechanisms
‐ Additional range of incentive adjustments included in allowed revenue formula
Key features of the regulatory regime are set out in the following table
Table 478: Main features of the regulatory regime
Issue Approach
Type of regime (concession/licence) License
Duration of tariff setting regime 8 years
Form of determination (distributor propose/regulator decide)
The regulator is the only organisation involved in setting and deciding on the allowed revenues
Scope for appeal regulatory decision DSOs may appeal to the Competition and Markets
The regulatory model includes incentives on efficiency and quality output incentives.
The tariff regime has duration of 8 years, to provide longer‐term regulatory stability.

644
Issue Approach
Authority, with respect to any license modifications, when the NRA goes against Panel Recommendations. DSOs may appeal to the Competition Appeal Tribunal (in respect of the Competition Act 1998 on competition law infringements, such as an abuse of dominance, the existence of cartels, etc.) A Statutory Appeal can be made to the High Court, in respect of the NRA´s enforcement decisions which imposed a penalty for the breach of license conditions or a relevant requirement. An appeal may also be made to the High Court for judicial review, with respect to any decision which cannot otherwise be appealed.
2.2. Main incentive properties of the distribution regulatory model
The following key regulatory incentives apply for the DSOs:
Efficiency incentives
Incentives to perform well and/or outperform various quality output measures.
At the same time the following tools are provided to mitigate risks:
Profit sharing
o Totex Incentive Mechanisms which includes a sharing mechanism for over‐spend and under‐
spend by a company. Under the sharing mechanism, the DNO retains a fixed percentage (around
60%) of any profit and the customers receive around 40%). The same applies to any over‐spend.
o Financeability analysis at the price control setting stage
o Uncertainty Mechanisms (The Annual Iteration Process for the RIIO‐GD1 Price Control Financial
Model allows factors to be taken into account on a real‐time basis)
Volume risk
o Gas DSOs are required to come within 88% and 112% of revenue by managing charges. Over‐ and
under‐recovery is then reflected in the ´correction factor´ term in the allowed revenue formula.
2.3. Determination of cost of service parameters
The approach to determining key cost of service parameters are summarized in the following table.
Table 479: Approach to key cost of service parameters
Parameter Approach
Form of price control Revenue based with efficiency adjustments
Regulatory asset base
Capital expenditure Total expenditure benchmarking
Approach to operating expenditure Total expenditure benchmarking
Form of WACC applied Real Vanilla WACC

645
The Vanilla Weighted Average Cost of Capital is the NRA´s preferred way of expressing the rate of
return allowed on the Regulatory Asset Values (RAV) of price controlled network companies. Using
Vanilla WACC means that the company’s tax cost is separately calculated as a discrete allowance so
that you only have to factor in:
The pre‐tax cost of debt ‐ i.e. the percentage charge levied by lenders, and
The post tax cost of equity – i.e. the percentage return equity investors expect to actually receive,
weighted according to the gearing assumption being used.
The NRA uses the "Real Vanilla WACC" which gives a lower percentage than "Nominal Vanilla WACC"
would (when inflation is positive). This is because they RPI index RAV balance values upon which the
Vanilla WACC return is given. The WACC formula uses notional gearing, which is broadly reflective of
business gearing levels.
3. Tariffs for distribution services
3.1. Distribution tariffs
In the process of recovering costs, two types of charges – system and customer charges – are
generally applied, and which have the following traits:
System charges: Costs include all work relating to assets upstream of the service pipe and for
managing the flow of gas through the system. These are attributed across the four main tiers and
eight sub‐tiers in the network.
Customer Charges: Costs comprise those associated with service pipes and those associated with
emergency work. These are divided across the consumption bands based on weighted consumer
numbers by consumption band. Total average costs per supply point are calculated for each
consumption band.
Various other aspects of distribution tariff setting are summarized in the table below.
Table 480: Approach to key issues in setting distribution tariffs
Issue Approach
Treatment of distribution losses Included in DSO tariffs. Note that this is subject to a volume cap to limit the exposure of consumers to loss levels
Customer and system charges are used in cost recovery via distribution tariffs.
Tariffs are not geographically‐uniform, are non‐linear, and are not regulated.
Connection charges are deep, and the connecting customer pays for the full costs of connection
including any reinforcement that may be needed to the network in that area.

646
Issue Approach
Presence of uniform tariffs No
Presence of non‐linear tariffs Yes
Presence of regulated retail tariffs No
Presence of social tariffs No
As part of the allowed revenues gas DSOs are given an allowance with which to replace the volume
of gas lost to shrinkage on its network. This allowance flows through into the tariffs paid for by
customers.
There are eight distribution networks owned by four different distribution licensees. Each one
charges different tariffs, depending on allowed revenue, cost of the specific network, etc. It can be
noted, however, that the methodology used to calculate the charges is the same for each company.
3.2. Connection charges
Key issues in the setting of connection charges are set out in the table below.
Table 481: Summary of key issues relating to connection charges
Issue Approach
Determination of charges
Type of charges (shallow/deep) Deep
Methodology adopted Each Company runs their own connection charging methodology which the NRA approves. Charges are calculated to reflect the cost of labour, materials, and any other expenses required to carry out the work.
Hosting capacity Scope to refuse connection No, a connection offer and quote must be provided
Requirements to publish hosting capacity None
Targets and/or incentive schemes to enhance hosting capacity
Not applicable
The connecting customer pays for the full costs of connection including any reinforcement that may
be needed to the network in that area.
Any upstream (wider) reinforcement required is not covered by the connecting customer. Upstream
reinforcement is only likely for quite large new connections in these cases a customer has to provide
an Advanced Reservation Capacity Agreement (ARCA) which commits the new supply point (or
increase to existing supply point) to use the additional capacity it requested. If following connection
it doesn’t use the capacity the customer may have to pay for the costs of the unused additional
upstream reinforcement.

647
DSOs must provide connection offers. That connection offer may have quite high costs and therefore
be unfeasible to the customer, but the DSO must least provide a quote.
GDNs are required to submit capacity information to us as part of their annual report (RRP) which
essentially relates to the capacity and utilisation of network off‐take stations and pressure reduction
stations (PRSs).
4. Distribution system development and operation
4.1. Distribution system development
The key features of distribution system planning are summarized below.
Table 482: Approach to distribution planning
Issue Approach
Form of distribution planning document There is a requirement to publish an annual Ten Year Statement which sets out the DSOs´ assessment of their future supply & demand position
‐ Key responsibilities for its development The plan is prepared by the DSO
‐ Degree of integration with renewables plan Indirect integration. Under the RIIO‐GD1 price control GDNs are incentivised to reduce leakage and energy consumption, to innovate through allowances and competitions, and to encourage / facilitate biomethane injection connections.
‐ Relationship with consumption trends The Ten Year Statement specifically describes the DSOs´ assessment of future consumption
‐ Relationship with quality of service targets A balance is struck between business plans and quality of service targets
‐ How trade‐offs between network development and alternative technologies are treated
No specific trade‐offs
‐ Requirements to integrate cost benefit analysis
The business plans for the price control are scrutinised and cost benefit analysis is used to ensure DSOs´ investment is appropriate and gives gas consumers good value for money. This happens every 8 years.
DSOs publish a planning document on an annual basis, and which has a 10‐year Outlook.
DSOs are responsible for providing metering services, and these can be out‐sourced if the DSO
chooses to do so.
As of 2013 there were 160.187 (domestic) smart meters installed in Great Britain (in the
residential sector).

648
In the price control, a balance is struck between the impacts of the GDNs business plans and the
quality of service targets that are consistent with the allowed network investments.
4.2. Metering
Key issues regarding metering, and the role of the DSOs, are set out in the following table.
Table 483: Key approach to metering
Issue Approach adopted
Discos role in metering Responsible for metering service provision, including providing meters to consumers
Monopoly services in the metering No the metering market is liberalised
Smart metering functionality Half‐hourly measurementsRemote reading Remote disconnection and reconnection of customers Smart meters are capable of receiving tariff information and passing it on to appliances which can be programmed to react in a particular way (i.e. to turn on once tariff is low enough/ turn off if it rises to a given price). The smart meter therefore facilitates remote operation of appliances at the customer’s premises. Local ports send real time consumption information to local screens or computers
DSOs are allowed to source metering services from alternative suppliers or National Grid (Gas DSO).
For meters owned by the gas DSO, the metering services are unbundled. This means, the metering
costs are separated out and subject to price control.
Gas DSOs still maintain an obligation to provide gas meters when requested to do so by a gas
supplier. Services are charged at a tariff not exceeding a regulated rate (i.e. as part of the Price
Control). The gas DSO obligation to provide meter services will end with the transition to smart
meters.
As of 2013 there were 122.707 (domestic) smart meters installed in Great Britain, and some 10.535
smart meters installed in non‐domestic properties. A breakdown by customer category is illustrated
below.
Table 484: Number of smart meters installed – by end of 2013
Customer category Number
Residential 122.707
Non‐residential / Industrial 10.535
Total 122.707

649
The Smart Meters deployment plan is coordinated and approved by the GB Government
(Department of Energy and Climate Change). The current deployment (unit installation) plan as of
February 2014 is as follows:
Domestic smart meters:
2014 – 311,752
2015 – 3,004,859
2016 ‐ 2,688,893
2017 – 4,112,739
2018 – 4,799,115
2019 – 4,602,174
2020 – 3,724,653
Non‐domestic meters:
2014 – 31,430
2015 – 27,729
2016 – 60,315
2017 – 78,070
2018 – 85,521
2019 – 86,643
2020 – 75,401
The share of consumption by non‐daily (or hourly) metered end‐customers is around 79%. Non‐daily
metered consumption is estimated through Data which is gathered from customers who are asked to
provide current meter readings. The regularity of these reading requests varies. Additionally,
suppliers do their own meter readings according to their own policy, but this must be at least every 2
years. The suppliers apply a proportionality test when deciding on the frequency of meter readings.
The following preliminary information on the impact of smart meter roll out is available.
Table 485: Effects from the smart meters deployment.
DSO Total number of
households
Number of households with a SM
Gas consumption reduction
Euro saved per year for an average household
North West 2.678.671 Data unavailable Approximately 2% Data unavailable
West Midlands 1.954.342 Data unavailable Approximately 2% Data unavailable
EoE 4.192.590 Data unavailable Approximately 2% Data unavailable
London 2.072.093 Data unavailable Approximately 2% Data unavailable
NGN 2.684.371 Data unavailable Approximately 2% Data unavailable
Scotland 1.790.322 Data unavailable Approximately 2% Data unavailable
Southern 4.063.607 Data unavailable Approximately 2% Data unavailable
WWU 2.485.923 Data unavailable Approximately 2% Data unavailable

650
Specific data on the impacts of the gas smart meter rollout is not publicly‐available. The GB
Government estimates that its gas smart meter rollout policy in GB (through a supplier‐led rollout
and with a centralised data and communications company) will deliver energy savings in the
residential sector which are equivalent to:
Low case – 1% gas saving;
Central case – 2% gas saving; and
High case – 3% gas saving.132
Anticipated savings in the non‐domestic sector are generally higher, as follows:
Low case – 3,5% gas saving;
Central case – 4,5% gas saving; and
High case – 5,5% gas saving.133
132 GB Government, https://www.gov.uk/government/uploads/system/uploads/attachment_data/file/276656/smart_meter_roll_out_for_the_domestic_and_small_and_medium_and_non_domestic_sectors.pdf 133 GB Government, https://www.gov.uk/government/uploads/system/uploads/attachment_data/file/276656/smart_meter_roll_out_for_the_domestic_and_small_and_medium_and_non_domestic_sectors.pdf