Internet Distribution of European Travel and Tourism Services
304
Internet Distribution of European Travel and Tourism Services The Market, Transportation, Accommodation and Package Tours by Carl H. Marcussen Research Centre of Bornholm August 1999
-
Upload
khangminh22 -
Category
Documents
-
view
1 -
download
0
Transcript of Internet Distribution of European Travel and Tourism Services

Internet Distribution of EuropeanTravel and Tourism Services
The Market, Transportation,Accommodation and Package Tours
by
Carl H. Marcussen
Research Centre of BornholmAugust 1999

This publication is available through:Research Centre of BornholmStenbrudsvej 55DK-3730 NexøTlf.: +45 56 44 11 44, Fax: +45 56 49 46 24E-mail: [email protected]
Copyright: 1999 Bornholms Forskningscenterand Carl Henrik Marcussen
Short extracts, including figures, tables and quotationsmay be quoted if there is given due credit to the source.Any publication mentioning this report, such asreviews, citations etc. should be sent to the ResearchCentre at the above address

Preface
This publication looks at Internet distribution of European travel and tourism servicesfrom a marketing, management and business oriented perspective.
The market chapter includes a baseline estimate of Internet sales on the Western Europeantravel and tourism market in 1998, a break-down of this into sub-sectors, and a compari-son with the US. Also there is a forecast for Europe to the year 2002 at the aggregate level.
More than 26 Western European case studies are presented from 10 different countries,and from 10 different sectors of the travel and tourism market. Additionally there is briefmentioning of a few other examples, mainly from the US. The emphasis is put on directsales via the Net and sectors within the travel and tourism industries which are typicallyEuropean - rather than airlines, hotel chains, car rental firms and online agencies whichnormally gets most of the attention, at least in American studies. (1) Airlines and (2) thecar rental sector are included, though, whereas hotel chains and online agents are not.Other sectors which are covered include (3) railways (long railway trips), (4) internationalferry lines, (5) long distance coaches, (6) umbrella systems for the booking of individualhotels (not necessarily in chains), (7) youth hostels, (8) holiday cottages, (9) camping, and(10) package tours.
The conclusion includes a summary, an assessment of a series of propositions of the effectsof the Internet on the marketing mix and competitive advantage, and a listing of some ofthe most successful European owned Web-sites in terms of Internet sales (to Europeans) in1998 and 1999 (estimated) in the different sub-sectors of travel and tourism services.
The research has been funded by the basic grant of the Research Centre of Bornholm, andhas been undertaken during about one man-year from September 1998 to August 1999. Atthis place the author has wished to convey special thanks to the respondents who haveprovided first-hand information for the case studies, as well as to Professor Stefan Klein,Institute for Information Systems, University of Münster, Germany, and to Professor andHead of Studies Georg Kamfjord, Department of Knowledge Management, The Norwe-gian School of Management BI, Norway, for providing constructive comments in the finalstage of the writing process.
Anders HedetoftActing Head of ResearchAugust, 1999


Contents
1. Introduction .............................................................................................................. 131.1 Background .................................................................................................... 131.2 Aims and objectives........................................................................................ 161.3 Emphasis and delimitation ............................................................................. 161.4 Formulation of propositions............................................................................ 18
2. Internet penetration and Internet travel sales in a European perspective .................... 232.1 Number of Internet users in Europe - and elsewhere ....................................... 232.2 Forecasts for the number of Internet users in Europe and the rest of the world 262.3 Internet commerce - 1998 and 2002 - in Western Europe and the USA........... 282.4 Status and forecasts for tourism/travel sales (distribu-tion) via the Internet ..... 292.5 Payment, security, and privacy issues in connection with trading on the net.... 36
3. Airlines selling tickets directly over the Internet........................................................ 393.1 Overview of major airline websites with respect to Internet bookings.............. 393.2 Lufthansa - InfoFlyway................................................................................... 433.3 British Airways - actual and expected Internet sales........................................ 473.4 Iberia, Spain ................................................................................................... 493.5 Finnair - World Wide Wings .......................................................................... 503.6 Braathens, Norway ......................................................................................... 523.7 SAS................................................................................................................ 543.8 LOT, the Polish Airlines................................................................................. 55
4. European railways on the Web .................................................................................. 574.1 Overview - Railways on the Web .................................................................... 574.2 German Rail on the net................................................................................... 624.3 Swiss Federal Railways on the net .................................................................. 674.4 Swedish Rail on the net .................................................................................. 704.5 Danish Rail on the net .................................................................................... 794.6 UK railways on the net ................................................................................... 874.6.1 Railtrack......................................................................................................... 874.6.2 North Western Trains ..................................................................................... 874.6.3 TheTrainLine - in association with Virgin Trains ........................................... 884.6.4 Eurostar.......................................................................................................... 894.6.5 National Express - trains ................................................................................ 894.7 North American railway websites ................................................................... 904.7.1 Amtrak, USA ................................................................................................. 904.7.2 VIA Rail, Canada ........................................................................................... 914.8 Some other railway sites of the world.............................................................. 914.9 Final discussion................................................................................................... 92

5. Booking road and sea transport services over the net: Express coach tickets andcar rentals - with deep discounts - and booking the ferry............................................ 975.1 Long distance scheduled express coaches........................................................ 975.1.1 Introduction to long distance express coaches ................................................. 975.1.2 Long distance scheduled coaches in Sweden: Svenska Buss ............................ 985.1.3 Long distance scheduled coaches in Norway ................................................. 1005.1.4 Long distance scheduled coaches in Denmark and Finland ........................... 1015.1.5 The UK and Germany................................................................................... 1025.1.6 The Eurolines organisation........................................................................... 1025.1.7 National Express/Eurolines UK - coaches ..................................................... 1045.1.8 Greyhound Lines, USA, Greyhound Canada - and Greyhound Pioneer
Australia....................................................................................................... 1065.1.9 Summary: Status and outlook in Europe and elsewhere for sales of tickets
for and reservation of long-distance coaches on the net ................................ 1085.2 Car rentals.................................................................................................... 1095.2.1 Brief introduction to the car rental industry .................................................. 1095.2.2 Europcar International - emphasising Europcar Germany............................. 1115.3 European international ferry lines................................................................. 1155.3.1 Overview of European international ferry lines on the net............................. 1155.3.2 Stena Line, Sweden (Scandinavia and the British Isles) ................................ 1175.3.3 Scandlines AG.............................................................................................. 1215.3.4 Irish Ferries .................................................................................................. 123
6. Distribution of European accommodation services via the net.................................. 1256.1 Introduction to booking of accommodation through the net........................... 1256.2 Hotels ........................................................................................................... 1276.2.1 An overview of hotels in Europe ................................................................... 1276.2.2 The Bookings NL on-line hotel reservation system, Netherlands - and Europe1286.2.3 Hotel Reservation Service, HRS, Germany.................................................... 1316.3 Brief introduction to destination-based reservation systems........................... 1336.3.1 TICcover - revenue generated by online bookings ......................................... 1346.3.2 Gulliver, Ireland: Moving towards online bookings ...................................... 1346.4 Youth hostels................................................................................................ 1356.4.1 Hostelling International - World-wide and in Europe - and IBN ................... 1356.4.2 Hostelling International Norway (HIN)......................................................... 1366.5 Holiday cottages ........................................................................................... 1496.5.1 The online cottage reservation system of Matka-Ruka Oy, Kuusamo, Finland1496.5.2 Danish holiday cottages - A general overview............................................... 1546.5.3 dansommer - A Danish cottage letting agency .............................................. 1566.5.4 Sol & Strand - A Danish cottage letting agency ............................................ 1606.6 Camping....................................................................................................... 1616.6.1 Camping in Europe - An overview................................................................ 161

6.6.2 eCamp, SASS GmbH, Germany.................................................................... 1637. Distributing European package tours on the net ........................................................ 167
7.1 Introduction to European tour operators on the net - A market overview....... 1677.1.1 The UK ........................................................................................................ 1687.1.2 Germany....................................................................................................... 1707.1.3 Switzerland .................................................................................................. 1717.1.4 The Nordic countries: Sweden, Denmark, Norway, Finland.......................... 1737.2 Tour operator packages on the Internet ......................................................... 1747.2.1 German tour operators on the net.................................................................. 1767.2.2 Major UK tour operators - and associated retail operations - on the net........ 1807.2.3 Tour operators in the Swiss market on the net............................................... 1847.2.4 Tour operators in Scandinavia and Finland on the net .................................. 1857.2.5 Rest of Europe - remaining players on the top 10 list of European tour
operators....................................................................................................... 1887.3 TUI, Germany, on the net ............................................................................. 1897.4 Kuoni, Switzerland, on the net...................................................................... 1927.5 Ving, Scandinavia, on the net ....................................................................... 1957.6 Apollo, Sweden/Scandinavia ........................................................................ 204
8. Summary, conclusions (accessing the propositions) and reflections........................... 2078.1 Summary...................................................................................................... 2078.1.1 The market ................................................................................................... 2078.1.2 Transportation.............................................................................................. 2088.1.3 Accommodation ........................................................................................... 2108.1.4 Package tours - tour operators....................................................................... 2108.1.5 Overview of case studies ............................................................................... 2128.2 Accessing the propositions............................................................................ 2138.2.1 Distribution over the net - and price.............................................................. 2138.2.2 Distribution over the net - and promotion ..................................................... 2148.2.3 Distribution over the net - which products?................................................... 2158.2.4 Distribution/sales over the net - how much?.................................................. 2168.2.5 Distribution over the net - and its effect on the different types of actors in the distribution chain.................................................................................... 2188.2.6 The Internet and competitive advantage........................................................ 2188.3 And the winners are... .................................................................................. 220
9. Bibliography ........................................................................................................... 22510. Appendices.............................................................................................................. 235
Appendix 1.1 General structure of the individual case studies ............................... 235Appendix 1.2 List of people and organisations interviewed ................................... 236Appendix 1.3. Exchange rates................................................................................ 238Appendix 2.1 Considerations behind Figure 2.6 - the assumed mix of Internet
travel sales in Western Europe in 1998............................................ 240

Appendix 2.2 Internet sales of cruises on the US market ....................................... 248Appendix 2.3 Travel market sizes - in the US and Western Europe. ...................... 250Appendix 2.4 Discussion of Internet travel sales in Western Europe - 1998 and
2002 - cf. Table 2.4 ......................................................................... 252Appendix 2.5 Shares of the online players on the US Internet travel market 1998 . 254Appendix 2.6. The Internet payment situation in Denmark .................................... 256Appendix 3.1. On the criteria for selecting the three times 20 major airlines in Table
3.1. ................................................................................................ 259Appendix 4.1. Overview of the 25 UK train operating units (franchises) + Eurostar260Appendix 4.2. Train operator website feature matrix - selected countries................ 261Appendix 5.1 Discussion of the size of the US and Western European market for
long-distance travel by scheduled coaches ....................................... 263Appendix 5.2 Revenue figures of some UK private sector players in bus, coach
and other forms of public transport.................................................. 265Appendix 5.3 The world-wide car industry at a glance .......................................... 266Appendix 5.4 Looking for lowest prices on two different Europcar sites ................ 267Appendix 5.5 Investment, costs and benefits of the Stena Line Internet booking site269Appendix 5.6 The Stena Line Internet booking system architecture - Phoenix....... 270Appendix 6.1 Number of hotels by country in Western Europe and the US............ 271Appendix 6.2 The Top 50 Hotel Brands ................................................................ 272Appendix 6.3 European Youth hostel statistics (1997)........................................... 273Appendix 6.4 A review of (lack of) booking functionality for European youth
hostels............................................................................................. 274Appendix 6.5 Why the hostels in IYHF’s IBN system cannot be booked through
the Web........................................................................................... 276Appendix 6.6 Hostelling and train-travel in the Nordic countries .......................... 277Appendix 6.7 Costs and benefits seen from the point of view of the
Matka-Ruka letting agency.............................................................. 280Appendix 7.1 The players in the Nordic package tour market - 1998..................... 282Appendix 7.2 Ving’s Internet package tour sales - and European totals –
1998-1999-2002, in volume and value (estimates) ........................... 284Appendix 7.3 Internet commerce in Sweden 1998................................................. 285Appendix 7.4 Ving: cost savings, break-even and pay-back................................... 287
11. Index....................................................................................................................... 289

List of Figures
Figure 1.1 Defining the scope and functionality of your tourism Web-site .................. 17Figure 1.2 Distribution over the Net as a marketing parameter - and its interr-
elations with the other marketing parameters. ........................................... 20Figure 2.1 Internet users by region of the World (late 1998)....................................... 23Figure 2.2 Internet users and Internet buyers in Western Europe (late 98 / early 99)... 24Figure 2.3 Internet penetration by country in Western Europe (Jan. 1999 ~ end of
1998) ........................................................................................................ 25Figure 2.4 Number of Internet users by region in the world, 1997-2005 (Datamonitor)27Figure 2.5 The mix of Internet travel sales - in the US - 1998 and 2003. .................... 30Figure 2.6 The mix of Internet travel sales to Western Europeans in 1998 - An
estimate..................................................................................................... 31Figure 2.7 Defining the Internet travel/ tourism market - where at least one overnight
stay is likely to be involved, i.e. excluding commuting/pendling etc. ........ 33Figure 3.1 The Lufthansa Multimedia Server ............................................................. 44Figure 4.1 Passengers per year for national Western European railways (1998).......... 58Figure 4.2 Number of page views for www.bahn.de per month, Jan. 98 - March 99.... 63Figure 4.3 DB timetable searches by time of day ........................................................ 64Figure 4.4 DB timetable searches by day of week ....................................................... 64Figure 4.5 Distribution of about 14 million page views on the Web-site of SBB in
1998.......................................................................................................... 68Figure 4.6 The SJ Web connection ............................................................................. 72Figure 4.7 Costs and savings of the SJ Web-site - A rough break-even chart. ............. 77Figure 4.8 Three levels of detail in the travel planner part of the DSB (Danish Rail)
site ............................................................................................................ 80Figure 4.9 A break-even chart for DSB InterNet......................................................... 85Figure 5.1 Revenue structure of the National Express Group PLC ............................ 105Figure 5.2 Market shares by value on the $ 16.4 billion US car rental market (1997) 109Figure 5.3 Approximate shares of the 6 billion $ European car rental market (1997) 110Figure 5.4 Number of Europcar rental stations by country (1999)............................. 112Figure 5.5 Interactive route map of Stena Line ......................................................... 118Figure 5.6 Break-even chart of Stena Line’s Internet investment (in mill. $) ............ 120Figure 5.7 Basic elements of an in-house bases Internet booking system................... 121Figure 5.8 Scandlines routes (Germany-Denmark-Sweden)...................................... 122Figure 5.9 The Irish Ferries route map ..................................................................... 124Figure 6.1 The booking pattern for Europeans who go abroad for their holidays....... 126Figure 6.2 No. of hotel properties per country in Western Europe............................. 128Figure 6.3 Break-even chart for Bookings NL BV .................................................... 130Figure 6.4 Average accommodation revenue per establishment - hostels and hotels.. 138

Figure 6.5 The Web, e-mail, and fax based booking request system of HIN, Norway 140Figure 6.6 Responding to booking requests to Norwegian hostels ............................. 141Figure 6.7 Seasonal pattern for overnight stays at hotels and at hostels in Norway ... 144Figure 6.8 Break-even chart for the Internet investment of Hostelling
International Norway .............................................................................. 145Figure 6.9 Break-down of guest nights by market (i.e. guests’ home country) for
hotels, for hostels in general and for Internet bookings of hostels (1998) . 146Figure 6.10 Booking pattern for international hostel guests, for national hostel guests,
and hostel guests in total ......................................................................... 147Figure 6.11 Total No. of bookings (all channels) received by Matka-Ruka per season
1996-99................................................................................................... 149Figure 6.12 Basic components of an Internet based booking system - e.g. for cottages 151Figure 6.13 Break-even chart for the Matka-Ruka Internet booking system ................ 153Figure 6.14 No. of camping sites per country in the eCamp Web-site ......................... 163Figure 7.1 The top 10 tour operators in Europe (financial year 1998) ....................... 167Figure 7.2 Market shares among tour operators on the British market (by value, ’98).169Figure 7.3 The top tour operators on the German market 1997/8.............................. 171Figure 7.4 Distribution of the Swiss package tour market (by value, 1998) ............... 172Figure 7.5 Distribution of the Nordic market for package tours by owners
(1997/8-volumes) .................................................................................... 173Figure 7.6 The activities of Kuoni at a glance (1997 data) ........................................ 193Figure 7.7 Ving sales by market, in general (1998) .................................................. 197Figure 8.1 No correlation between Internet penetration and % of users which are
buyers. .................................................................................................... 217Figure 8.2 Three basic architectures for Internet based booking systems................... 219

List of Tables
Table 1.1 Sectors and types of actors covered - and those not covered - in thispublication. ............................................................................................... 18
Table 2.1 Comparing Western Europe and North America ....................................... 26Table 2.2 Number of Internet users by region of the World - end of 1998 and 2002 .. 28Table 2.3 Differences between the US and Western Europe with respect to
tourism/travel............................................................................................ 34Table 2.4 Internet travel market in the USA and in Western Europe, 1998 and 2002.35Table 3.1 Twenty major airlines with Web-sites in each of three regions in the World40Table 3.2 Some published data for Lufthansa’s Internet sales - and analysis ............. 46Table 3.3 Key statistics of the Finnair Web-site. ....................................................... 51Table 3.4 Overall passenger revenue and Internet revenue for Braathens, 1998......... 53Table 4.1 European railways - and a few others - on the Net ..................................... 59Table 4.2 Investment (costs) and savings from usage of the DSB on-line timetable ... 84Table 4.3 Internet bookings with three railway companies (1998) ............................. 93Table 4.4 Internet Web-sites as ways to gain competitive advantage - via cost
savings or positive differentiation (more orders)? ...................................... 94Table 4.5 Penetration of mobile phones by total population, percentage, 1996 and
1998 - supplemented with Internet penetrations figures for 1998. .............. 95Table 5.1 Some bus operators in Sweden - with long routes - and their Web-sites ..... 99Table 5.2 National Web-sites of the Eurolines organisation..................................... 103Table 5.3 European international ferry lines on the Net & their booking
functionality (if any)................................................................................ 116Table 6.1 Opportunities for Internet bookings of European accommodation services127Table 6.2 The Bookings NL on-line hotel reservation system, Netherlands - and
Europe .................................................................................................... 129Table 6.3 Summary of key statistics for the www.bookings.org site......................... 130Table 6.4 Hostels in IYHF, and in the IBN system .................................................. 136Table 6.5 Comparing hotels and youth hostels in Norway ....................................... 137Table 6.6 Internet statistics and analysis - Hostelling International Norway ............ 139Table 6.7 E-mail penetration among Norwegian youth hostels, May 1999............... 140Table 6.8 IBN vs. Internet - the case of Norway ...................................................... 142Table 6.9 Internet investment appraisal - hostelling International Norway
(in NOK and $) ....................................................................................... 143Table 6.10 Realised and predicted Internet sales for Hostels International Norway.... 146Table 6.11 Internet bookings for Matka-Ruka 1996-1999 ......................................... 152Table 6.12 Internet bookings for dansommer - realised and expected ........................ 157Table 6.13 The great importance of the Internet for dansommer as a distribution
channel - for the booking period January-May, 1999 ............................... 158

Table 6.14 Some statistics of the eCamp Web-site..................................................... 164Table 7.1 The Web-sites of the top 10 tour operators in Germany ........................... 176Table 7.2 Tour operators on the Net - The UK market Part I (Thomson)................. 180Table 7.3 Tour operators on the Net - The UK market Part II (Airtours) ................. 181Table 7.4 Tour operators on the Net - The UK market Part III (Other majors)......... 182Table 7.5 Tour operators on the Swiss market - and their Web-sites........................ 184Table 7.6 SLG (Airtours) ........................................................................................ 185Table 7.7 Fritidsresor Group (Thomson)................................................................. 186Table 7.8 Finnair Travel Services (Finnish market only)......................................... 187Table 7.9 Apollo, Scandinavia (1998)..................................................................... 187Table 7.10 Kuoni - on the Danish market: Alletiders Group (1998) .......................... 187Table 7.11 Leading tour operators in the rest of Europe: Little Web-site functionality.188Table 7.12 Functionality of major tour operator Web-sites in Europe: The general
picture..................................................................................................... 189Table 7.13 Some statistics of www.tui.de: Visits, bookings, revenue, and forecast..... 191Table 7.14 Stepping-stones for TUI to reach 5% via Internet in the year 2003 .......... 192Table 7.15 Estimated market shares for the Ving brand and major tour operator
groups in the four Nordic markets ........................................................... 196Table 7.16 Summary and interpretation of published statements about Ving’s package
tour sales via Internet - compared with European tour operators in general:% of own volume and % of own revenue via Net for the years 1998,1999, and 2002. ...................................................................................... 202
Table 7.17 Packages sold via Internet by Apollo (mainly www.apollo.se).................. 205Table 8.1 Overview of case studies.......................................................................... 212Table 8.2 Some successful European owned, European oriented Web-sites 1998
- and 1999............................................................................................... 221

13
1. Introduction
1.1 BackgroundInformation and communication technologies (ICTs) on one hand, and tourism/travel onthe other are among the largest and fastest developing industries in the world. ICT con-tributes 6% of aggregate global GDP to the world economy, making it one of the top in-dustries world-wide.1 And the travel market is the world’s biggest IT spender, with IATAcompanies alone investing some $5bn annually on information systems.2
Within the ICT field, the Internet - in its different variants - is one of the most dynamicsub-sectors. And within the Internet, trading over the net, which is limited at the moment,is expected to grow exponentially, especially trading of travel/tourism services. Tour-ism/travel is a significant application of the Internet, in surveys typically found to accountfor between a fifth and up to a third of its use, both with respect to providing and search-ing for information, and when it comes to making purchases.
Western Europe plays a key role in the field of travel and tourism internationally, but itsposition is stagnating. Disregarding international tourist arrivals as a fair indicator formaking comparisons between North America and Western Europe, other indicators showthat North America is comparable to Western Europe with regard to the size of the tour-ism industry. For example, direct and indirect employment in tourism is exactly the samein North America as in Western Europe (excluding Turkey): 6.5 million people in bothregions. Tourism account for 5.9% of GDP in North America vs 5.1% in Western Europe.3
In the European Union (EU15) tourism accounts for 5.5% of GDP and 6% of employ-ment.4 For comparison, the IT industry should account for 10% of the US economy vs 6%for tourism, so obviously IT - as well as tourism – is a very important sector in the USeconomy. In absolute numbers, the total contribution of tourism to GDP in North Americawas about $440 billion in 1995 vs $330 billion in Western Europe (again excluding Tur-key).5 With regard to Internet use, both in terms of the number of users and their propen-sity to make (travel) purchases on the net, and in terms of the number of (travel) websitesand their functionality, Western Europe is (far) behind North America. In 1998 there were
1 www.witsa.org/ (was at: www.witsa.org/pr.htm).2 www.icl.co.uk/ (was at: www.icl.co.uk/news/consguide/markets/travel.htm).3 OECD, 1995, p. 33.4 http://europa.eu.int/en/comm/dg23/tourisme/tourismeu.html.5 Calculated as GDP in 1995 multiplied by the percentage of GDP which tourism accounts for per country
in each of the two regions, according to OECD (1995). The percentages in the mentioned source are probably from the first part of the 1990s (1992/93). For 1998 data covering the US only see www.ahma.com/infocenter/eco_impact98.htm

14
about 35 million users in Western Europe vs about 70 million in the US alone. In NorthAmerica consumers are more inclined to make purchases over the net than in WesternEurope and in the rest of the world.6 The US most likely has a great surplus on the Internetbalance of payments, meaning that international (actually intercontinental) purchases ingeneral on the Internet are often made at US websites. Also in the specific field of trans-actional travel/tourism websites - where bookings can be made - American sites are clearlydominant, although some air-ticket sites have been restricting Internet sales to the NorthAmerican market, while others are establishing branches in Europe. In the field of distri-bution of hotel accommodation as individual room nights (as opposed to packages), it isactually hard to find examples of European owned websites with on-line real-time bookingfacilities on the net. Most of those around seem to be headquartered in the US, and mainlyUS-owned.7 Measured by employment, the hotel and catering sector is, incidentally, themost important sector in tourism, accounting for around one third in OECD countries,whereas the transport sector (air, rail, road) accounts for around 15%, and the travelagency field for about 4%.8 When it comes to Internet travel purchases, airline ticketscurrently account for the bulk of purchases, both in North America and Europe.
It will be a major challenge for European actors to catch up with the American sites, andto figure out how they can establish themselves on the Internet, and utilise the medium notonly as a promotional medium, but also as a sales/distribution channel - without necessar-ily having to make a virtual Atlantic crossing to American middlemen to make or take on-line real-time bookings over the net.
During 1998 many owners of European websites have made statements about their expec-tations of the results of their own website or tourism/travel managers have tried to quantifytheir general expectations as to the percentage of all travel/tourism sales which will bemade over the net in a few years time. A typical statement is that in the year 2001 around20% of our sales of travel/tourism products will come through the Internet.
Nobody knows what the future will bring for the tourism/travel industry. But without anydoubt sales/distribution of European tourism products over the net will increase dramati-cally - at least in percentage terms. In absolute terms Internet travel sales are predicted torise from about $250 million in 1998 to about $4 billion in 2002 in Western Europe (bycontrast in North America they are predicted to rise from around $3 billion to $18 billion).Travel services are one of the top selling products on the Internet, with airline tickets asthe main product category.
6 While Americans constitute 62% of Internet users worldwide, the US generated 85% of global Internet reve-
nues during 1997 according to a IMRG report from 1998, http://www.hp.com/Ebusiness/imrg.html.7 Or powered by GDSs such as Sabre and Worldspan, which are headquartered in the US.8 OECD, 1995.

15
This writer holds that many of the firms in tourism/travel who expect 20% of their book-ings to come through the net in less than five years will have to revise their expectationsdownwards. Certainly, at the aggregate level, sales over the Internet of Europeantravel/tourism products will have to be measured by a small one digit percentage figure forat least five years, i.e. until and including the year 2003. In the US, even according to themost optimistic forecast, Internet travel sales will not exceed 12% of all (leisure) travel inthe year 2003.9 In Western Europe the corresponding figure would probably be less than athird of the US level, i.e. less than 4% at an aggregate level. Some suppliers will of coursebe able to exceed the average considerably (which a few have done already by a consider-able margin in 1999). There are many reasons why Internet commerce for tourism/travel(and other) products may not develop as smoothly and swiftly as expected, such as prob-lems with integrating internally and externally oriented systems.
This book will show state of the art examples of innovative Internet uses for distribution ofEuropean tourism/travel services and in this way indicate possible ways of further devel-oping Internet commerce in Europe for tourism.
Other studies have looked at IT uses in tourism in general,10 have emphasised the hotelsector and Destination Management Systems,11 Internet for general marketing purposes,12
or Internet uses for tourism and travel mainly from an American perspective.13 A numberof theses at the masters level have started appearing on the subject of the Internet appliedto tourism.14 This book focuses specifically on the Internet for tourism and travel. It doesso from a European rather than an American perspective. Emphasis is placed on com-merce (buying/selling) over the net rather than merely information provision or promo-tion.
In spite of the focus on Europe in the selection of examples of websites to be reviewed, theexamples will also be of interest to non-Europeans, since barriers, obstacles and opportu-nities are similar to those in Europe in some other parts of the world. A few non-Europeanwebsites will also be included, where deemed relevant, i.e. to illustrate certain technologi-cal possibilities or to make comparisons with Europe, and European tourism managersmay very well decide to distribute their products over non-European websites.
9 Forrester, 1998.10 E.g. Sheldon, 1997 and Werthner & Klein, 1999.11 O’Connor, Peter, 1999.12 Ellsworth & Ellsworth, 1997.13 Multiclient report from Jupiter Communications, March 1998, On-line Travel: Five Year Outlook, summary
at: www.jup.com/research/reports/travel; and The PhoCusWright Yearbook 1999,www.phocuswright.com/yearbook.htm, forthcoming.
14 Kristensen, Thomas, 1998, Ka Kei Ng, Samuel, 1998 and Fink, Karen, 1998.

16
1.2 Aims and objectivesThe objectives are as follows:
A. Review current innovative uses of the Internet/WWW for interactive information pro-vision and especially for distribution/sales of bookable European tourism products - inorder to illustrate ways ahead for tourism businesses and organisations.
B. Explore relations between the distribution parameter and the other parameters in themarketing mix in an Internet context (based on A in addition to a literature review).
C. Discuss if, how, and for whom - i.e. types of actors in the distribution chain – the In-ternet might be a way to gain a competitive advantage, and to discuss the challenges(threats, limitations, barriers and obstacles) and opportunities of the Internet as a dis-tribution channel - for different types of tourism products and tourism industry actors.
1.3 Emphasis and delimitationGeographic emphasis within Europe:The geographic emphasis will be on Germany, the UK, and the Nordic countries: the rea-sons for this - apart from the obvious advantages of a geographic delimitation in connec-tion with the undertaking of the fieldwork - are that Germany and the UK are the twocountries with the largest Internet user populations, whereas the Nordic countries have thegreatest Internet penetration in Europe. Germany, the UK, and the Nordic countries, ac-count for about two thirds of Internet users in Western Europe.
Product focus:All the main categories of tourism products will be covered. Since emphasis is placed ondistribution - and not just on information provision - the focus will be on bookable tour-ism/travel services, which are in fact services.
Functional emphasis of the websites reviewed:There will be an emphasis on websites which at least have availability data - where rele-vant - i.e. where pre-bookings are possible or necessary. Distribution can be with or with-out payment settlement on the net. Ideally there should also be payment facilities on thewebsites, but this is not a must. Price information will generally be included in thewebsites reviewed. In some instances, such as in the case of websites for low cost accom-modation, availability data is not included. But then there must at least be query-responsefunctions, where the user can search a database in some advanced fashion.15
15 Interactive information provision is typically based on the linking D-bases and websites in the form of query-
response functions.

17
User groups emphasised:Final customers: ***** InternetBetween trading partners: ** Extranet (not cov-ered)Within company (employees): * Intranet (not covered)
Figure 1.1 Defining the scope and functionality of your tourism website
Defining the scope and functionality of your tourism Web-site.
Promotion: Information only
Distribution: Availability! Payment?
Global / multinational
National
Regional/local
Single firm
Transport
- air, rail, coach, car
Accom
odation- hotels, others
Attractions
- bookable, others
Distribution
Promotion
1. Geographic spread of products contained:
2. Types of tourist products contained:
3. F
unct
iona
lity
Packages- standard- individualised
MIC
E- m
eetings, incentive
A 4th dimension:
Direct net sales or net sales through
intermediaries
Note: A 5th dimension Reach: Global: Internet; Inter-firm: Extranet; Intra-firm: Intranet.MICE and tickets for attractions are not covered at all. Intermediaries are not dealt with in depth.

18
Criteria in the selection process of websites for this book: Weight:• Transactional websites - with availability data and booking facilities - rather than without.
20• European - rather than non-European owned (and headquartered) websites. 10• The greater percentage of products presented in the website which are European, the better.
10• Websites from the Nordic countries, Germany or the UK rather than other European ones
10• Internet website (10) rather than extranets (5) - and intranets (0) 10• With payment functions on the net - rather than payment by other means. 5• Advanced D-base query functions rather than flat simple websites. 5• Websites with price information rather than without price information. 5• Websites with at least national coverage - rather than local coverage - are preferred. 5Total, max. Points 80
Figure 1.1 is a selection support scheme only. Scores for each website will not necessarilybe calculated before deciding whether or not to include it. It is meant to be a guideline.
Table 1.1 shows the sectors and types of actors that will be covered.
Table 1.1 Sectors and types of actors covered - and those not covered - in this publi-cation
The following is covered in this publication: The following is not covered in this publication:- Air transport, direct sales from airlines - GDS based - typically US - on-line agents- Rail transport, time-tables and direct sales - hotel chains- Coaches, rental cars, ferry lines - tickets for attractions and events- Individual hotels - via on-line intermediaries - individualised packages- Youth hostels - MICE (Meetings, incentives, conferences, exhibitions)- Camping- Holiday cottages
- National/regional/local destination marketing and reservation systems (mentioned briefly)
- Package tours - Extranets and Intranets- Simple one-property old-fashioned homepages
The general structure of the individual case studies are shown in Appendix 1.1.
1.4 Formulation of propositionsThe formulation of propositions takes its starting point in the 4Ps - representing the mar-keting mix - which have been part of most general and tourism marketing text books sincethe 4Ps were introduced by McCarthy four decades ago in 1960.16 Within the service mar-
16 McCarthy, J.E., 1960, and e.g. Kotler, Philip, any edition; Keegan, W.J., 1989, 4th ed., chap. 12-15 (or later
editions), Witt & Moutinho (eds.), 1994, 2nd ed., Part III section 2, Holloway & Robinson, 1995, chap. 5-13.Kotler, Philip, John Bowen and James Makens, 1999, 2nd ed., Prentice Hall, Porter, Michael J., 1980, the FreePress, New York; Porter, Michael J., 1985, the Free Press, New York.

19
keting field there have been attempts to twist the 4Ps into 7Ps or even 30Rs, but the 4Psstill stand.17
Figure 1.2 shows a split of the 4Ps into:• Product and Price, which represents the basic offer to the market, and Promotion - and• Promotion and Place(/distribution), which communication and contact with the mar-
ket.
This split is inspired by a Scandinavian tradition of dividing the marketing parametersinto basic parameters and contact parameters. The Norwegian professor Otto Ottesen, whotaught at the Copenhagen Business School for many years, is the father of this tradition (orat least one of them, cf. Frey, 1961, mentioned below). However, Ottesen - in his multi-edition text book in Norwegian on market communication - did not explicitly apply thissplit to the 4Ps.18 Therefore the explicit combination of Ottesen’s double-split of the mar-keting parameters and McCarthy’s 4Ps - may be a fresh way of perceiving the 4Ps. Ottesenonly classified four different forms of market communication (personal and impersonal;mass and individual, as a two-by-two matrix) as contact parameters, whereas physicaldistribution was classified among the basic parameters. Here, however, for tourism andtravel services there is no physical distribution, and the contact parameters are perceivedmore broadly, including Internet distribution.
In 1961 - or actually even earlier - Frey proposed a double-split of the marketing parame-ters, which corresponds fully with the split of the 4Ps shown in Figure 1.2. It may there-fore be considered a combination of McCarthy’s and Frey’s work.19 The origins of Figure1.2 can thus be traced back four decades.
The 4Ps as a basis for the propositions are supplemented with the notion of competitiveadvantage as introduced by Michael Porter (1980, 1985).
17 Palmer, Adrian, 1994, McGraw-Hill; Gummesson, Evert, 1998.18 Ottesen, Otto, 1981 (first published in 1977). There is no reference to McCarthy, 1960 (or any of Kotler’s early
work) in Ottesen, 1981 (p. 30ff.) where he introduces his split.19 Frey, Albert W., 1961, p. 30, New York: Ronald Press, according to Kotler, Philip, 1984, p. 68, note 25, or
Kotler, Philip, 1997, p. 107, note 33.

20
Figure 1.2 Distribution over the net as a marketing parameter - and its interrelationswith the other marketing parameters.
Distribution of bookable tourist products on the Webwith or without intermediaries:- availability data - payment functions ?
Pricing on the Web -vs. pricing in general: - list prices - discounts
Promotion on the Web:- providing information about the product offering and its price through interactive Web-sites
Products offered and sold on the Web: - commodities - standard package tours- self-tayloring the offer
The offer
Market communication
Distribution over the net - and price:P1. Prices to the end-user of the most commodity-like tourist/travel products are - or will
be - lower than the same products being sold through traditional distribution chan-nels.
P2. Prices are not commonly reduced for tourist/travel products offered over the Web.This is impeding sales over the net.
Distribution over the net - and promotion:P3. Promotion (information provision) and distribution are closely linked.P4. As the Internet matures as an advertising medium, reliable and comparable media
measurements will be developed as for other media.
Distribution over the net - which products?P5. The more standardised (commodity-like) the product, the more it is being sold over
the net.P6. In general, the lower the transportation costs, the more likely is it that products are
being sold over the net. Services - such as tourism and travel products - are ideal forbeing sold over the net, since there are no transportation costs.
Distribution/sales over the net - how much?

21
P7. The lookers to bookers ratio will improve as the willingness of end-users to placeorders - and make payments - over the net increases.
P8. The willingness of end-users to purchase tourism/travel products over the net is posi-tively correlated with factors such as the penetration of the net (percentage of thepopulation), and the penetration of international payment cards in different countries.
Distribution over the net - and its effect on the different types of actors in the distributionchain:P9. Tour operators and other players at the wholesale level in markets which traditionally
rely heavily on retail sales through independent travel agents - will start openingwebsites with the possibility of making bookings directly to them - thus bypassingtravel agents.
P10. Airlines will start taking bookings for simple return tickets over the net - thus by-passing travel agents - and increasing their percentage of direct sales.
The Internet and competitive advantage:P11. Cost savings will only be made by the big players to any measurable degree.P12. Advantages through a positive differentiation from competitors can no longer be
achieved through simple (non interactive, and non transactional) websites. Alreadytoday positive differentiation from competitors by means of the Internet requiresmore than just a basic website.

22

23
2. Internet penetration and Internet travel salesin a European perspective
2.1 Number of Internet users in Europe - and elsewhereHistorically, which in web terminology effectively means since about 1995, North Americahas accounted for the majority of Internet users, and still does. Estimates for the number ofInternet users world-wide by the end of 1998 range from 131 million (Datamonitor) to 158million (NUA - based on a number of different sources), of which the US alone accountedfor about half. For Europe (Western + Eastern), the number of Internet users by the end of1998 and in early 1999 has been estimated to about 37 million by both Datamonitor andNUA. According to data published on the NUA website, Western Europe accounts forabout 21% of the world’s Internet users, and Eastern Europe for another 2%.
Figure 2.1 Internet users by region of the world (late 1998)
USA50%
Canada6%
W.Europe21%
E.Europe & Turkey2%
Asia/Pacific17%
Rest of world4%
Source: Based on www.nua.ie/surveys/how_many_online/index.html.Based on data from a variety of sources typically from around October 1998, NUA mentions a world total ofabout 158 million (published in March 1999 on their website), 33.5 million of which are in Western Europe,and another 3.2 million in Turkey + Eastern Europe/Russia.
According to IDC, there were about 41 million Internet users in January 1999 in WesternEurope, which is interpreted as an end of 1998 estimate. The IDC estimate is somewhathigher than that of NUA, in spite of the fact that IDC actually counts World Wide Web

24
users only. On the other hand, the sources upon which NUA build in their somewhat lowerestimate, are generally from about October 1998 (although published in March 1999).Therefore there is a reasonable explanation of the difference between NUA and IDC as faras the Western European estimate is concerned. The IDC estimate of 41 million for West-ern Europe for the end of 1998 corresponds to 10.7% of the whole population. Of theseWWW users, Germany accounted for 25%, the UK for 22%, and the Nordic countries for15%.20 In the last quarter of 1998 only about 11% of the Internet (WWW) users purchasedsomething on the net. This percentage was a little higher for Germany, and a little lowerfor the Nordic countries.
Figure 2.2 Internet users and Internet buyers in Western Europe (late 98/early 99)
0% 10% 20% 30% 40%
Rest ofW.Europe
Nordic (4)
The UK
Germany
% of Internet-buyers
% of WWWusers
Source: Based on IDC, January 1999, European Internet Statistics: How many people are on-line in Europe?(www.eurointernet.idc.dk/euinet/stats.htm), which is being updated quarterly, and a graph from Computer-world Denmark, 5th February, 1999, p. 21 in an article in Danish by Stefan Elmer, IDC Nordic, showing theInternet buyers in Western Europe by country (last quarter of 1998).
Note: There were 40.9 million web users in total in Western Europe in January 1999, about 11% of which wereInternet buyers, according to IDC.
So Germany, Britain, and the Nordic countries account for 62% of the users, and about64% of the Internet buyers in Western Europe. This - together with the fact that there areabout 10 times more Internet users in Western than in Eastern Europe - underlines the
20 The Nordic countries are here defined as Sweden, Denmark, Norway and Finland. Being one of the smallest
nations in Europe, Iceland is not included, although Internet penetration is as high in Iceland as in Denmark orNorway.

25
relevance of the chosen geographic emphasis within Europe: Internet penetration variesconsiderably between countries or regions of Western Europe, cf. Figure 2.3.
Figure 2.3 Internet penetration by country in Western Europe (end 1998/Jan. 1999)
0% 5% 10% 15% 20% 25% 30% 35%
Western Europe
Greece
Portugal
Spain
Italy
France
Belgium
Ireland
Austria
Germany
Switzerland
UK
Netherlands
Denmark
Norway
Sweden
Finland
Internet - specifically Web - penetration by country
Source: Based on IDC, www.eurointernet.idc.dk/euinet/stats.htm, i.e. the number of Web-users by country, Jan.1999, divided by the latest official population counts.
In spite of the fact that Western Europe and North America have fairly comparableeconomies - total GDP is 14% higher in Western Europe than in North America - thereare less than half as many Internet users in Western Europe as in North America. Andalthough the economic stage of the two regions is relatively comparable - as indicated byGDP per capita - Internet penetration is much higher in North America than in WesternEurope.

26
Table 2.1. Comparing Western Europe and North America
(1) WesternEurope
(2) NorthAmerica
(3) of whichUSA alone
(1) W.Europe /(2) N.America
Total GDP (1996), $ billion 9054 7963 7388 1.14Population (1996) 384 297 267 1.29GDP per capita, $ 23 600 26 850 27 712 0.88Internet users, million (1998) ~37 (34-40) ~ 78 (69-88) ~70 0.47Internet penetration (% of pop.) ~ 10% ~ 26% ~26% 0.36
Telecommunications costs, which are an important determinant of Internet use, are aboutfive times higher in Europe than in the US (Forrester, 26th June, 1998). Some fall in costsis expected following deregulation of the telecom sector in Europe.
2.2 Forecasts for the number of Internet users in Europeand the rest of the world
Datamonitor predicts the number of Internet users world-wide to increase to about 250million by the year 2002, fairly equally split between Europe, the USA, and the rest of theworld. In Europe the number of Internet users is set to more than double from 1998 to2002 - to about 80 million - according to Datamonitor.

27
Figure 2.4 Number of Internet users by region of the world, 1997-2005(Datamonitor)
www.datamonitor.com/, press release 1st March, 1999.
IDC is considerably more optimistic than Datamonitor, predicting the number of users tomore than triple in Western Europe by the end of 2002 compared with 1998. That alsogoes for the world total, which they expect to reach as high as 500 million - albeit not untilthe end of 2003. For comparison Datamonitor predicts a world total of only 300 million -in the year 2005 - cf. Figure 2.4. These differences in forecast illustrate the considerableuncertainty margin involved in Internet-related forecasts, be it forecasts for the number ofInternet users or, as we shall see, forecasts for travel purchases via the Internet.

28
Table 2.2 Number of Internet users by region of the world - end of 1998 and 2002
Region Datamonitor(1998)
NUA(1998)
IDC(1998)
Datamonitor(2002)
IDC(2002)
(W.) Europe 38 (29%) 37 (23%) 40 79 (32%) 140USA 60 (46%) 79 (50%) 87 (35%)Rest of world 33 (25%) 42 (27%) 85 (34%)Total 131 (100%) 158 (100%) 150 251 (100%) 320+Source: Datamonitor, 1999, www.datamonitor.com, from graph in press release dated 1st March; NUA, March 1999,
How many on-line?, www.nua.ie, quoting sources from about October 1998. For the USA NUA quotes In-telliQuest (Jan. 1999) for a estimating 79 million users in the USA; IDC, January 1999,www.eurointernet.idc.dk/start.htm, European Internet Statistics: How many people are on-line in Europe?To be quite exact, IDC mentions the number 40.9 million Web users in Western Europe as of January 1999on the site.
There may be an almost inherent positive bias in studies of the number of Internet users.Thus Hoffman, Kalsbeek & Novak (1996) convincingly argued that one in three usersshould be knocked off a Nielsen (CommerceNet/Nielsen) estimate for 1995 for a numberof reasons.21 Since the risk is that positive bias creeps into almost any Internet estimateeven for a current year, when it comes to Internet forecasts it is even more obvious, thatthey may be positively biased. It has been argued by Wäsche (1998) that Internet forecastssuch as those of Forrester and Jupiter, which we shall discuss later, are partially the neces-sarily optimistic expectations of the market participants themselves.22 This means that thekey industry players who have been interviewed as part of the forecasting process simplyhave to be optimistic about the future. The danger is that the enthusiasm and optimism ofeach of the professional respondents is carried over too extensively into the aggregatedpublished Internet forecasts.
2.3 Internet commerce - 1998 and 2002 - in WesternEurope and the USA
The fact that not many more than one in 10 people in Western Europe are Internet(specifically Web) users, and that not many more than one in every 10 Internet users buysanything on the net means that only about 4.5 million out of a total population of 384million, i.e. 1.2%, were Internet buyers at the very beginning of 1999. However, IDCexpects that:
1. Internet penetration in Western Europe will increase to as much as 35% by the end of2002 (i.e. about 140 million Internet users out of a population of about 400 million bythen);
2. almost one in four (~24%) of the Internet users will also buy on the net; and 21 Hoffman, D.L., W.D. Kalsbeek and T.P. Novak, 1996, Communications of the ACM, 39 (December), 36-46,
http://ecommerce.vanderbilt.edu/baseline/internet.demos.july9.1996.html.22 Waesche, Nico, 1998, http://heise.xlink.de/tp/english/inhalt/te/1661/1.html.

29
3. the average amount spent by each Internet buyer will increase considerably.
Because of 1 and 2, IDC estimates that there will be 34 million Internet buyers in WesternEurope by year-end 2002,23 corresponding to 8.5% of the population by then (comparedwith only 1.2% by year-end 1998 as mentioned).
Internet penetration (Internet users as a percentage of the population) is about two and ahalf times greater in North America than in Western Europe (cf. Table 2.1). Furthermore,among those who actually use the net, the Western Europeans are no more than half aslikely as their North American counterparts to make purchases on the net. And finally, theaverage amount spent per Internet user is less for Europeans than for Americans. There-fore North America’s share of the world’s Internet commerce is much greater than itsshare of Internet users shown in Figure 2.1.24
2.4 Status and forecasts for tourism/travel sales (distribu-tion) via the Internet
For the US only, Internet sales of leisure travel services are projected to increase from $3billion in 1998 to almost $30 billion in 2003 - out of total Internet sales of $108 billion inthe business-to-consumer field by then. If this Internet travel sales forecast is realised itwill correspond to 12% of all travel sales in the US. The travel forecast goes via $21 bil-lion in 2001, and this is three times as high a forecast as previously made by the samemarket research firm, Forrester Research. For the year 2002 the Forrester (leisure) travelInternet sales forecast is about $25 billion. For comparison, Jupiter Communications havepredicted the US on-line travel revenue to reach $11.7 billion in 2002.25 At less than halfof the Forrester forecast for the same year, this indicates that the revised Forrester forecastis optimistic. A study by Bear Sterns & Co. also agrees with Jupiter rather than Forrester,i.e. about $12.4 billion in on-line travel sales in the US in the year 2002.26
23 www.idc.com/idc7/data/global/content/020899gb.htm.24 The numbers 85% of all Internet-based commerce for the US, 10% for Europe, and 5% for the rest of the world
have been mentioned (IMRG report), albeit not for 1998, but for 1997.25 www.thestandard.net, Industry Spotlight: Travel on the Web. - According to Jupiter, 59% of the $11.7 billion
will be airtravel in the year 2002. Also according to Jupiter, as much as 84% of Internet travel sales (of $0.911billion) back in 1997 concerned air travel. This indicates that the Forrester estimate for Internet hotel bookingsmay be an overestimate. The Jupiter forecast of $11.7 billion for travel for the US in 2002 is also adjusted upfrom $8.6 billion predicted earlier by Jupiter.
26 Bear Stearns & Co. predicts that 25% of this ($3.1 billion) will be on-line hotel bookings for the year 2002, upfrom just 9% in 1997 (www.nua.ie). The Forrester forecast for hotels for the year 2002 would be about $8 bil-lion - and $10.6 billion out of the $29.5 billion total in 2003.

30
Of Internet travel sales, airtickets accounted for 53% in 1998 in the US, which will drop to36% in 2003 (Forrester).27 The Forrester estimates and forecasts are supposed to excludebusiness travel. In reality this is probably not the case. For example airlines and on-linetravel agents which have contributed to the study have probably not excluded businesstravel sales from the numbers they have contributed, and Forrester themselves seem not tobelieve that much - if anything - should be added for business travel.28 The Forrester fore-cast for Internet sales of cruises on the US market is discussed in Appendix 2.2, and isconsidered to be much too optimistic by at least a factor of four.
Figure 2.5 The mix of Internet travel sales - in the US - 1998 and 2003
0% 5% 10% 15% 20% 25% 30% 35% 40% 45% 50% 55%
Airtickets
Hotels
Tour packages
Car rentals
Cruises
2003%
1998%
Source: Based on press release from Forrester Research, dated 30 September 1998.Note: The total in 1998 was $3.046 billion, and the 2003 Forrester on-line travel forecast is $29.5 billion for the
US. Therefore, in absolute numbers Internet sales of airtickets will also increase dramatically in the US.
Unfortunately not a single research firm has made an estimate of the magnitude of thevalue of Internet travel sales in Western Europe for the year 1998, and therefore a break-down by travel service categories has not been published. However, an estimate of thedistribution of the purchase of travel/tourism services over the net by Europeans is pro-vided in Figure 2.6.
27 To get a total estimate for North America in value, Canada has to be added to the US figures, which can proba-
bly be assumed to be additionally 8% in Internet travel sales, both for 1998 and 2003.28 This is inferred from the statement that most business travel is bound by a corporate travel policy.

31
Figure 2.6 The mix of Internet travel sales to Western Europeans in 1998 - an esti-mate
0% 10% 20% 30% 40% 50%
Air travel,scheduled
Hotel accom.,ex. tours
Tour packages
Rail, long trips
Scheduledcoach, long
Car rentals
International carferries
Camping &youth hostels
Percent of totalmarket, 1997/8
Percent of Internetsales, 1998
Source: Own estimate, cf. Appendix 2.1.Note: The black columns are estimated percentages of Internet sales. To put this into perspective, the corre-
sponding percentages for the estimated total market value, irrespective of distribution channel are also shown(the white columns). Total Internet travel/tourism sales in the Western European market in 1998 were about$250 million, cf. Table 2.4. In principle, any Internet travel sales to Western Europeans - irrespective ofwhether or not the site is European or not - are included. Correspondingly, in principle, any travel sales fromEuropean sites to non-Europeans are excluded.
The total of $250 million as well as the breakdown of this by type of travel product and byInternet channel (direct or through intermediary) is of course an estimate only. Unlessmore airlines and others come forward with realised Internet sales in 1998, broken downby sales to Europeans and non-Europeans, we will never know the true (or a more true)1998 figure.29 Some disappointing published Internet sales figures suggest that Internettravel sales on the European market are unlikely to have been over $250 million in 1998.At PhoCusWright LIVEurope99 in Brussels it was reported that nine leading Europeanairlines achieved combined (direct) Internet sales in 1998 of under $60 million - but it isnot stated how far under.30 This may even include some Internet sales to non-Europeans.31
29 By now it is too late to ask the consumers about their 1998 travel purchases on the net. In order to make mean-
ingful forecasts we must at least know the historical data, a base line estimate.30 PhocusWright, press release, Brussels, 7 May 1999, European airlines slow to jump on the Internet eCom-
merce bandwagon, www.phocuswright.com/EA050799.HTM.

32
The airlines polled by PhoCusWright represent roughly 60% of the passengers carried byscheduled airlines in Western Europe. The top four were included,32 but not the fifth, SAS.We do not know how much less than $60 million in Internet sales the the nine polledeuropean airlines achieved in 1998 though, and Internet sales figures for the individualairlines have not been published (except for Lufthansa). In percentage terms the amountmentioned roughly translates to less than 0.18% for the polled airlines, but we do notknow how much less.33
On this basis it seems fair to assume that the combined direct Internet sales of all WesternEuropean airlines were just below $60 million in 1998 ($57 million) - which was about0.10% of all revenue from scheduled flights by the top 20 Western European airlines. ForLufthansa this percentage was just 0.08% for 1998 (but will be 0.3% in 1999). The per-centage was certainly lower for several other major airlines, and no scheduled airlineshave come forward with a percentage of more than 0.15% (Braathens) (see the next chap-ter). Therefore the estimate is actually somewhat optimistic. On top of the $57 million indirect Internet sales from the airlines should be added on-line agents’ sales of airtickets onthe European market, which may have been another $57 million, i.e. roughly $114 millionin total. Then come direct and indirect Internet sales of other (selected) types of travel andtourism services, which may have been about $136 million in 1998, i.e. $250 million intotal in 1998, as a best - but not particularly conservative - estimate.
It was also announced at the PhoCusWright LIVEurope99 conference that the expectationfor 1999 was 1.5% for 1999 on average for the polled airlines (Air France, Alitalia, BA,Iceland Air, KLM, Lauda Air, Lufthansa, Sabena and Virgin). In light of the meagre 1998result (less than 0.16%) it seems very optimistic that the airlines should reach 1.5% in1999 (roughly a tenfold increase over 1998). And in fact in the announcement fromLIVEurope99 it is stated that the airlines expect Internet bookings to increase by about200%-300% over 1998. This writer believes that an expectation of less than 3 times 0.16%~ 0.5% would be a more realistic expectation for the Western European airlines in 1999(as a weighted average).
The considerations, estimates and assumptions behind Figure 2.6 are provided in Appen-dix 2.1. But basically the following two factors have been taken into account: firstly, thetotal market size per travel service category has been taken into account. Secondly, so hasthe willingness and ability of customers to place orders for different types of products via
31 In principle, Internet sales (for example by European airlines) to non-Europeans should be excluded from an
estimate of Internet sales on the European market. On the other hand, if US airlines sell anything to Europeanresidents via the net, this should be added. Whether these two elements cancel out we do not really know.
32 Press release from www.phocuswright.com, 10 May 1999.33 Estimated as less than 60 million $ in Internet sales/(152 million segments x $220 per segment) = less than
0.18%.

33
the net. For example, European travellers/holiday-makers have been assumed to be rela-tively willing and able to place orders for airtickets over the net (which is also the case inthe US), which means that airtickets have a larger share of Internet travel sales than of thetravel market, or rather of the selected types of travel services. The hotel element consti-tutes about half of the value of tour packages, both in Europe and in the US.
With respect to distribution channels, direct or via travel agents, in the US about 64% oftravel sales go via agents in the real world (varying between product categories), whereasin the virtual world (Internet world) roughly half of sales go via (on-line) agents in theUS.34 In Western Europe travel agents account for about the same share of travel sales asin the US in the real world, whereas on-line agents at this stage probably hold about athird (32%) of Internet travel sales in the European market, cf. Appendix 2.1.
Figure 2.7 Defining the Internet travel/tourism market - where at least one overnightstay is likely to be involved, i.e. excluding commuting, etc.
O r d i n a r y a g e n t s b u y i n g v i a t h e N e t
O n l i n e a g e n t s - s e l l i n g v i a t h e N e t
C . E x t r a n e t( b u s i n e s s - t o - b u s i n e s s )
T r a v e l s e r v i c e s u p p l i e r s ( P r o d u c e r s , p r o d u c t o w n e r s , p r i n c i p a l s )
C o n s u m e r s ( e n d - u s e r s o f t r a v e l / t o u r i s m s e r v i c e s ) :B u s i n e s s - a n d l e i s u r e t r a v e l l e r s / H o l i d a y - m a k e r s
A . I n t e r n e t ,d i r e c t l y
B . I n t e r n e t ,f r o m a g e n t
( N o t i n c l u d e d )
( I n c l u d e d ) ( I n c l u d e d )
( ~ 2 0 % ) ( ~ 8 0 % )
U S : 1 / 2 d i r e c t l y
E u r o p e : 2 / 3d i r e c t l y
( b u s i n e s s - t o - c o n s u m e r s )
There are some differences between the US and Western Europe with respect to the rela-tive value of the different product segments of the tourism market. In the following chap-ters the types of products (and actors), which are relatively important in Europe (comparedwith the US), will be emphasised, also because descriptions of the activities of US airlines,hotel chains, car rental companies, and US on-line travel agents are available in otherpublications such as multi-client reports.
34 A new piece of US research - not published in full at the time of writing - states that on-line intermediaries’
share was 54% in 1998. Press release from www.phocuswright.com, 10 May 1999. The forthcoming report ThePhoCusWright Yearbook 1999 also states that US Travel eCommerce was $2.5 billion in 1998, which is alower estimate than the $3 billion estimate for the US in 1998 published earlier by Forrester.

34
Table 2.3 Differences between the US and Western Europe with respect to tour-ism/travel
US Western EuropeRelatively important types of products: Relatively important types of products:Air transport (scheduled) and car rental.Long distance scheduled coaches.
Rail transport
Hotel accommodation, individual room nights Tour packages (charter flight & hotel)Cruises Ferry crossings (scheduled)Mobile homes Camping, youth hostels, holiday cottagesRelatively important types of actors: Relatively important types of actors:Scheduled airlines, hotel chains, car rental companies, cruiselines, on-line travel agents
Tour operators, railways, ferry lines, ownersof alternative forms of accommodation
So, compared to the US (and Canada) where was Western Europe in 1998 in terms ofInternet travel sales - and is Western Europe catching up?
Let us assume that each European Internet buyer spends $53 on leisure travel and relatedservices, corresponding to just 13% of the business-to-consumer spending,35 and another$13 on business travel, i.e. $67 per Internet buyer in total for travel. With 4.5 millionInternet buyers this equals $300 million in Western Europe in 1998 for leisure and (small)business travel sales over the net.36 This is what the writer considers to be the absolutemaximum Internet travel sales on the European market in 1998.
$250 million would seem to be a better estimate. Seen in relation to the total WesternEuropean leisure travel market, this would correspond to 0.10%, vs 1.2% for the US. It israther awkward to put an estimate for Internet sales of selected travel and tourism servicesin relation to the total for the leisure travel market, so let us quickly move on to a moreappropriate comparison: the $250 million European Internet travel sales in 1998 wouldcorrespond to 0.15% of selected travel and tourism categories (leisure and business) vsabout 1.5% for the US.37 So, Western Europe was roughly at a tenth of the US level inrelative terms with respect to travel and tourism sales via the Internet in 1998.
And where will Europe be in the year 2002 in terms of travel sales over the Internet? As-suming that the average purchase value of travel and related services will triple to $200per Internet buyer, and multiplied by the number of Internet buyers of 34 million whichIDC projects for Western Europe in the year 2002, this would equal Internet travel pur- 35 For comparison, in the US travel accounts for about 24% of Internet business-to-consumer sales
(www.emarketer.com, eStats, 25 March 1999), which is somewhere between Forrester and Jupiter estimates.Europe is assumed to be somewhat below the US level.
36 Actually, only one in every four of the 4.5 million Internet buyers in 1998 made a travel purchase at all, sothere must have been only 1.25 million Internet travel buyers in Europe in 1998. On the other hand the averagetravel purchase per Internet travel buyer was four times $90, so the total Internet travel sales value works outthe same either way.
37 1.5% as a medium estimate, or 1.7% using the maximum estimate for US Internet sales, cf. Appendix 2.1.

35
chases of $6.8 billion. This maximum would correspond to about 2.5% of the whole West-ern European leisure travel market, and this can be considered a maximum for the year2002, cf. Table 2.4.
Table 2.4 Internet travel markets in the US and Western Europe, 1998 and 2002
USA,1998
USA,2002
W. Europe1998
W. Europe2002
Total population (millions), approx. 267 278 384 400Internet users, end of year, max. (millions) 79 (a) 112 (c,x) 40 (b) 140 (b)Internet users, end of year, mean (millions) 73 (x) ~100 (x) 37 (x) 110 (x)Internet users, end of year, min. (millions) 60 (e) 87 (e) 33 (g) 80 (e)Internet penetration (% of whole population) (x) 23-27-30 31-36-40 8.6-9.5-10.4 20-28-35No. of net buyers, end of year, max. (millions) 20 (a) 68 (x,c2) (b) 34 (b)Travel purchase per Internet buyer, $ 152 (x) 375 (x) 100 (x) 300 (x)Internet travel purchases, $ million , max. 3,046 (c) 25,500 (c,x) 300 (x) 6,700 (b,x)Internet travel purchases, $ million, medium 2,675 (x,f) 18,000 (x) 250 (x) 4,000 (x)Internet travel purchases, $ million, min. 2,300 (d) 10,700 (d) 200 (x) 1,700 (e)Total leisure travel market, $ billion, approx. 223 (c,x) 241 (c,x) ~250 (x) ~270 (x) Internet travel sales as % of travel, max. (c,b,x) 1.4 10.6 0.12 2.5Internet travel sales as % of travel, mean (x) 1.2 7.5 0.10 1.5Internet travel sales as % of travel, min. (d,e) 1.0 4.4 0.08 0.6Total market for selected travel and tourism categories,$ billion, approx., cf. Appendix 2.1 182 197 168 178Internet sales as % of selected t & t cats, max. 1.7 13.0 0.18 3.7Internet sales as % of selected t & t cats, mean 1.5 9.2 0.15 2.2Internet sales as % of selected t & t cats, min. 1.3 5.4 0.12 0.9Sources: (a) IntelliQuest, Jan. 1999 (adults); (b) IDC; (c) Forrester; (c2) About 34 million households - up from nine
million in 1998 (Forrester). (d) Jupiter; (e) Datamonitor; (f) PhoCusWright’s forthcoming yearbook 1999will state $2.5bn for the US in 1998; (g) NUA, ~Oct. 98 sources; (x) Own estimate or calculation.
Note: Total leisure travel market sizes are discussed in Appendix 2.3, and the maximum and minimum for Internettravel purchases in Western Europe are discussed in Appendix 2.4.
Clearly, it is no simple matter to figure out the size of the Internet travel market actually ina year which has already passed. Therefore it should be even clearer that any Internetforecast for the year 2002 and beyond should be interpreted with great caution. But in anycase, there is no doubt about the strong trend towards more sales via the net of travel andrelated services, both for leisure and business purposes, on both sides of the Atlantic, andin due course in the rest of the world.
The regulatory environment for electronic commerce in the EU has been labelled a patch-work, which should be made more coherent and predictable. Otherwise the potential of theInternet economy in Europe may be reduced by as much as a third (Forrester, 18 February1999).
In summary, from 1998 to 2002 the Internet channel will go from accounting for about1.5% to about 9% of the market for selected travel and tourism categories in the USA, i.e.about a six-fold increase. During the same period the corresponding development in West-

36
ern Europe will be from only 0.15% to about 2.2%, i.e. a fifteen-fold increase. So, in rela-tive terms, i.e. after taking market size differences into account, Western Europe will startto catch up with the US from 1998 to 2002, going from a tenth to almost a fourth of thelevel in the US. However, in absolute terms (i.e. measured by the value of Internet travelpurchases) the gap between the US and Western Europe will widen, although there may bemore Internet users in Western Europe than in the US by the end of 2002.
US travel intermediaries - and also principal travel service suppliers such as transatlanticairlines - will be more than happy to fulfil the demand from European Internet buyers.38 Itwill be up to the European players themselves to make Internet offers which will capture -or lure - online travel service buyers, including non-European travel service buyers. In thefollowing chapters we will see what some European players - and a few American ones -have already done or plan to do in order to serve online travel service buyers.
2.5 Payment, security, and privacy issues in connectionwith trading on the net
The general considerations and concerns about payment, security, and privacy in connec-tion with trading on the net also apply to travel services. Payment may or may not be car-ried out on the net. Payment cards used are typically international payment cards such asVisa and MasterCard, but may also be ordinary bank cards. - Worldwide there are 800million holders of Visa-cards, and nearly 700 million MasterCard holders. Security stan-dards used are typically SSL, but may also be SET.39
95% of secure Web sites worldwide - i.e. over 125,000 in spring 1999 - use VeriSign Se-cure Server IDs to authenticate themselves and to enable SSL encryption to protect sensi-tive data and transactions.40
Actual and potential Internet buyers are very concerned about the possible misuse of theircredit card details. Also privacy is a concern.
Over half, 52 percent, of the respondents said they intend buying something on-line by the end of the year.When asked about their reluctance to buy on-line, 31 percent of users cited security risks ...Germans Doubt the Security of Net Shopping. Dec 16 1998: 60 percent of German users are not
confident about the security of on-line transactions, according to a recent study by First Surf. 41
38 One Dutch Internet commerce study found that almost half of purchases are made from US sellers ...
(www.nua.ie / Blauw, December 1998). Although this is a general study and for just one country not focusedon travel and strongly dominated by computer hardware/software it indicates the challenge for European travelservice suppliers.
39 Ready, SET..wait - SunWorld - May 1998, www.idg.net - And one year later (May 1999) we are still waiting.40 www.verisign.com/41 www.nua.ie/surveys/ - Durlacher Research Ltd: UK Ecommerce Demands Are Not Met. Feb 03 1999.

37
NUA quotes (http://www.nua.ie/surveys/ )Visa: Net Transactions Cause Credit Card DisputesMar 25 1999: Internet transactions generate 50 percent of credit card disputes and fraud transactions at VisaInternational. This is despite the fact that just 2 percent of the credit card company's overall business comesfrom Internet trade.In the majority of cases the blame lies with the consumer.Disputes about Internet transactions are more common than fraud.If there is to be widespread trust in ecommerce and protection for both consumer and merchant, good securitytechnology must be coupled with good authentication in the form of recognised certification authorities, ac-cording to Collimore (of Visa).
Equinus found the majority of the population now have access to a personal computer at home and one adultin two can use the Internet either at home or at work. What's more, many would be happy to buy a holidayand pay for it on the Internet, while many more were still happy to book a holiday on the Internet provided
they could give their credit card details in a phone call immediately afterwards instead.42
Even in the US, security is a concern: Skepticism about the security of credit cardnumbers also has slowed Internet sales. Advocates claim the Internet is safer than givingyour credit card number over the phone. But so far, many travellers don't believe it.43
The current payment situation in one of the small European markets, Denmark, whoseInternet users have been the most reluctant in Europe to make Internet purchases, is de-scribed in Appendix 2.5.
42 www.equinus.com/320.html.43 Volgenau, Gerry, 1999, Travel Writer, The going things: More E-tickets, less luggage, 3rd Jan., Free Press,
www.freep.com/news/airtravel/qtrend3.htm.

38

39
3. Airlines selling tickets directly over the Inter-net
This chapter contains two main sections:1. An introductory section, which gives an overview of Internet booking with airlines. In
this chapter the Internet booking functionality of European airlines is compared withtheir North American counterparts, and those of major airlines in the rest of the world.
2. A case studies section, where specific Western European (here: airline) websites aredescribed.
3.1 Overview of major airline websites with respect to In-ternet bookings
In this first section there will be a general review and comparison of the websites of• 20 major North American airlines;• 20 major Western European airlines;• 20 other major airlines in the rest of the world;with respect to Internet bookings. Given that the airlines have websites, we will investigatewhether bookings can be made on each of the sites, if special incentives for placing ordersover the Internet are given, and if on-line auctions are held.
The North American airlines have been dominating the air traffic market in the past threedecades, and they still do. Thus when looking at the current IATA top 50 list of airlines ofthe world ranked by number of passengers carried (1997 data), North American airlinesoccupy the first five (or six) places.44 Among the top 50 airlines in the world, 12 NorthAmerican airlines accounted for 49% of passengers carried, 15 Western European airlinesaccounted for 22%, and 23 airlines from the rest of the world accounted for 29%. In totalthe top 50 airlines included on the IATA list carried 1.03 billion passengers in 1997, 70%of which was for domestic flights.
Each airline on the IATA top 50 by passengers carried list in 1997 has a website, exceptIran Air and the Spanish domestic airline Aviaco, which has only put up an entry pagewith no information behind it. Iran Air and Aviaco have therefore been disregarded in thefollowing.
44 IATA. See www.british-airways.com/inside/factfile/industry/docs/rankings.shtml for a the top 10 list. South-
west Airlines of the US carry more passengers than the largest non-US airline, but Southwest is not included inthe IATA top 50 list by scheduled passengers carried in 1997.

40
Table 3.1 Twenty major airlines with websites in each of three regions of the world
20 North American airlines 20 Western European airlines 20 Other major airlines(1) Delta Airlines (8) Lufthansa (6) All Nippon Airways(2) United Airlines (9) British Airways (10) Japan Airlines(3) American Airlines (11) Air France (12) Korean(4) US Airways (13) Alitalia (16) Japan Air System(5) Northwest Airlines (15) SAS (18) Qantas, Australia( - ) Southwest Airlines (19) Iberia (20) Malaysia Airlines System(7) Continental Airlines (23) KLM (22) China Southern Airlines(14) TWA (28) Swissair (24) Thai Airways(17) America West Airlines (31) Turkish Airlines ( - ) Ansett Australia(21) Air Canada (37) Olympic Airways (26) Singapore Airlines(25) Alaska Airlines (39) Sabena (30) Cathay Pacific(32) Canadian Airlines (44) Finnair (33) Philippine Airlines( - ) Reno Air (46) British Midland Airways (38) Air New Zealand( - ) Hawaiian Airlines ( - ) Austrian Airlines, Vienna (40) Garuda Indonesian Airlines(49) Aloha Airlines (47) Braathens, Norway (41) China Eastern Airlines( - ) AirTran (prev. ValuJet) ( - ) Aer Lingus, Rep. Ireland (42) Indian Airlines( - ) American Trans Air ( - ) Ryanair, Rep. Ireland (27) Saudi Arabian Airlines( - ) Midway Airlines ( - ) TAP Air Portugal (29) Varig, Brazil( - ) Midwest Express ( - ) Air UK (now KLM UK) (34) Aeromexico( - ) Tower Air ( - ) Virgin Atlantic (36) Mexicana AirlinesNote: Within each region, the airlines have been ranked according to number of passenger carried in 1997, accord-
ing to IATA, World Air Transport Statistics. The ranking on the IATA top 50 list (by passengers) is given inbrackets.In Appendix 3.1 there is an explanation of the criteria for selecting the three times 20 major airlines.
In total, the three times 20 scheduled airlines shown in Table 3.1 carried 1.11 billion pas-sengers in 1997, of which 52% were carried by the 20 North American airlines, 22% bythe 20 Western European airlines, and 26% by the 20 largest airlines in the rest of theworld. The airlines in Table 3.1 represent three-quarters of all the passengers carried bythe more than 200 scheduled airlines in the world.45
Below are the key findings from the comparison of the top 20 airlines from three parts ofthe world.
1. Today, there is hardly any major airline in the world which does not have a website.However, there seems to be a hierarchy in terms of airlines’ website functionality aswell as in the field of providing incentives for making Internet bookings.
2. (a) On as many as 19 out of the 20 largest North American airline websites it is possi-ble to book tickets, and the twentieth, in fact the smallest on the top 20 list, has statedthat it intends to establish a booking function in future. (b) Bookings can be made on
45 According to the Annual Civil Aviation Report 1997 from ICAO, the International Civil Aviation Organization
(http://www.icao.org/icao/en/jr/5306_ar3.htm), the world's airlines are estimated to have carried 1448 millionpassengers in 1997, 70% of which were domestic, 30% international.

41
12 out of the 20 largest Western European airlines websites. On five of them only someticket types are sold, however. (c) It is only possible to book tickets on four of the 20largest airline websites in the rest of the world (ROW).
3. (x) By the middle of 1999, status for booking capabilities is as follows: (a) bookings
can still be made on 19 of the top 20 US airline sites. (b) Bookings can now be madeon 16 of the top 20 European airline sites, and (c) on seven of the sites of the 20 largestairlines in the rest of the world.
4. (a) Eleven of those 19 major North American airlines which sell tickets over the net
offer some kind of incentive for Internet bookings - apart from convenience. The mostcommon incentive used is extra bonus miles on the frequent traveller programmes,which are used by more than half of those airlines with Internet booking incentives.(b) In Western Europe, none of the 12 airlines selling tickets over the net offers incen-tives for Internet bookings. (Lufthansa does give bonus miles for Internet bookings, butapparently not extra bonus miles). However, Lufthansa sends out special offers by e-mail. TAP Portugal offers tickets through virtual auctions on a regular basis, (once aweek). Auctions with TAP are only for a few specific tickets, and are therefore notgeneral incentives for Internet bookings. Lufthansa has also held on-line auctions(monthly), in association with SAS.
(c) None of the major airlines in ROW offers general incentives for Internet bookings.Korean Airlines, like several American airlines, offers customers to receive special of-fers by e-mail.
5. In general, on the North American airline websites, as well as on the sites of the twolargest European airlines Lufthansa and British Airways, sales have been put in theforefront. On the majority of the other major airline websites things like corporate pro-file still get a relatively more prominent position.
No single airline in Europe was (even close to) getting 1% of their bookings through theInternet in 1998. Airtickets are almost ideal for being sold through the Internet. They areeasy to describe, and easy for the Internet user to book. The only two problem areas arepayment and ticketing. It is a technically complex process to complete an airticket book-ing. But it can be made easily understandable for the Internet user. The ability to makebookings via the net - for certain airlines - may move market share a little, for certainsegments of the population, but it does not creates much additional air travel. There mayalso be some shift from telephone sales to Internet sales.
Equant, formerly Novus, believes that airlines are saving costs per transaction when cus-tomers use their sites for bookings. Internet bookings are significantly cheaper than travelagent (TA) bookings for the airlines, since both the travel agent’s commission and the

42
GDS fee is saved. The TA commission can be up to 10%, and is typically 5%-10% of thevalue of the booking. The GDS fee is $2-3 per passenger segment. Gross savings = (8% x$300)+2($2.5) = $29. From this should be subtracted the costs of the Internet bookings,which may be $5-10, say $6. Net savings per Internet booking compared to TA bookingsmay therefore be $23. Savings are less if Internet bookings are compared with telephonebookings to an airline’s call centre. But there are significant initial investments to be madeto put the Internet bookings infrastructure in place. To reach break-even for the Internetinvestment, a high volume of Internet bookings is required. Few airlines - or major on-lineagents - in the world, and hardly any in Europe, have reached break-even.
Some of the largest airlines in the world (AA, Delta, United, BA, Lufthansa), have eachinvested $1-5 million in initial development costs. Slightly smaller airlines typically im-plement more standardised solutions at about $50,000-100,000 each for a small scalegenuine Internet booking system. If airlines just wanted to advertise fares and then takebookings by e-mail this can be done very cheaply, from an ordinary PC. The annual recur-rent costs are likely to be anywhere between 25% and 75% of the initial set-up costs, ac-cording to Equant.
Equant developed a solution for British Midlands, which was implement by the end of1995, and was the first of its kind.46 Equant has also developed Internet booking solutionsfor, among others, the following European airlines: Air UK (now KLM UK), British Air-ways, Lufthansa, Virgin Atlantic (UK), and Braathens (Norway).47
All of these sites comprise all the features of an Internet booking site, including paymentvia the net. The solutions of British Midlands, Air UK, Braathens48, and Virgin are allbased on the same technology. An application called Quick Seat stores all fares. Thenthere is a link to a reservation system to find out about availability. A choice among avail-able offers can then be made. Credit card information must be keyed in.
In future airlines may start tackling the issue of distressed inventory creatively, with re-spect to the possibilities of Internet sales. Airtickets may be packaged together with otherproducts - hotels - to make weekend-breaks. Some airlines even own hotels, and manyairlines have alliances with hotels etc., which may come in handy with respect to packag-
46 Cyberseat - British Midland Case Study, www.equant.com/company/customers/britmidland.html, and Equant,
formerly Novus, Delivers First Internet Booking System with On-line Payment for British Midland, press re-lease, November 1995, www.novus.com/3about/n3611.htm (under www.equant.com).
47 Equant, Customers, www.equant.com/company/customers/customers.html (e.g. Lufthansa), and On-line Busi-ness Solutions www.novus.com/3about/n323.htm (under www.equant.com). Additionally, in America Internetbooking solutions have been developed for US Air, EDS, and the train operating companies Amtrak (USA) andVIA Rail Canada.
48 Press release about Braathens, April 1997, www.equant.com/relations/news/pr/1997/braathens.html;links to seven live travel sites, www.novus.com/3about/n313.htm - under the www.equant.com domain.

43
ing offers. It this way the possibly deep discounts on the airtickets can be hidden. Since theairlines are reluctant to risk annoying the TA community they are looking for ways to sellthings which are not traditionally sold through TAs, and this can be things like distressedinventory (cheap flights), sold in creative ways, possibly through auctions (cf. thepriceline.com reverse auction concept). There will be a push towards e-ticketing especiallyfor business travellers (which is already gradually being implemented) and last minutesales.
3.2 Lufthansa - InfoFlywayEquant also developed the technical solution for Lufthansa’s Internet booking site, Info-Flyway. It is a multimedia server system, which here means that the Web front-end is notthe only presentation channel for the data.
The system offers reservations on both Lufthansa flights and other airlines. At least 90%of the bookings are for Lufthansa flights, but the possibility to book other airlines as wellis attractive to the end-user. The purpose of the system is both to encourage Internet usersto participate in the Lufthansa frequent flyer scheme, and to act as a real-time on-linebooking service for all Internet customers. As a basic prerequisite to enter the InfoFlyway,all users are asked to select a user-ID and a password. Customers who wish to make reser-vations are required to provide additional information pertaining to areas such as form ofpayment, ticketing methods and travel preferences. Additionally, the InfoFlyway providesa test booking functionality for users who perhaps do not wish to select a user-ID andpassword, or simply wish to try out the booking functionality. InfoFlyway is connected tothe Amadeus reservation system, which is how it offers the wide range of other airlines. Itis also connected to Lufthansa’s Miles and More system which holds the frequent flyerinformation.
The Lufthansa Live Auction is extremely popular world-wide, and is held on the firstThursday of every month for all German customers. The schedule for auctions for all othercountries is available on the website. The auctions contain flights to various Lufthansadestinations, as well as attractive offers from partners, e.g. car rental, flights with StarAlliance members and holiday trips from Condor or L’TUR.

44
Figure 3.1 The Lufthansa Multimedia Server
Flight information Reservation serverAmadeus LAN D-base & file system server WWW server Internet WWW users
Miles and More Host Multimedia Editing PCs Future access servers Other users
Source: www.equant.com/company/customers/lufthansa.html.Note: Lufthansa no longer supports the BTX Server (T-On-line) platform.
In 1997 Lufthansa realised sales of DM 10.5 million ($6.2 million) for just over 14 000bookings.49 The expectations for 1998 expressed by Mr Stefan Pichler at the ITB Congressin March 1998, was an increase to DM 40 million ($24 million) for 55 000 bookings.
At the following year’s congress in March 1999 it was reported, again by Mr Pichler,according to Jegminat in fvw 6/99, p. 26, that Lufthansa actually sold the following in1998 through the InfoFlyway site:
49 In light of this fact, the Datamonitor estimate of just $7.7 million for all Internet travel sales in Europe in 1997
appears to be too low, although Lufthansa was no doubt one of the big players (Datamonitor press release 24May 1999).

45
a) 4500 (return-)tickets for DM 1.3 million in 25 on-line auctions.b) 40 000 segments (~20 000 bookings/simple return tickets) for DM 11 million.
Total: ~24 500 direct Internet bookings, generating revenue of DM 12.3 million ($7million).
The average price per ticket in the auctions was DM 289 ($164). The average price foreach two segments sold over InfoFlyway was DM 550 ($313). This was actually a higherprice than for Lufthansa return tickets in general, for all channels in average, which wasabout $448 in 1998.
Clearly this actual result for 1998 of about 24,500 tickets/bookings, generating a revenueof DM 12.3 ($7 million) must be considered a disappointment both because it is only aquarter of the expectations, and also because there was no significant increase in Internetsales from 1997 to 1998 through the Lufthansa InfoFlyway site, according to the publishedsources. Both the quantities and the prices achieved on direct Internet sales were belowexpectations. In 1998 Lufthansa’s direct Internet sales, based on published data, remainedbelow 0.1% of all scheduled passenger revenue (i.e. excluding revenue from charterflights), cf. Table 3.2. However, the Lufthansa InfoFlyway team has been conscious of thegrowing momentum of the Internet. Restructuring for the future and content of servicesprovided by the website was taken as a higher priority than sales figures, for which Luf-thansa and the InfoFlyway team are now reaping the rewards: bookings for the first half of1999 reached 42 000. A conservative estimate for all of 1999 - based on the number ofInternet bookings actually received during the first half of 1999 - would then be 100 000bookings, i.e. $28 million - four times the 1998 level!

46
Table 3.2 Some published data for Lufthansa’s Internet sales - and analysis
Realised,1997
Expected,1998
Realised,1998
Projected,1999
Bookings (two-segment tickets) 14078 55000 24500 100000
Average price per ticket in on-line auctions $ 164
Average price per return ticket in InfoFlyway $ 313
Overall average price ($) per Internet booking 424 414 286
Direct Internet sales ($ mill.) 6.0 22.7 7.0 $ 28
As % of scheduled passenger revenue 0.07 0.26 0.08 0.32
As % of scheduled passenger numbers 0.08 0.29 0.13
Average price ($) per scheduled return ticket 461 448 448
Internet price as % of the average price perreturn ticket for all scheduled flights
92 92 64
Sources: ITB Press Conference 1998; Lufthansa Annual accounts, 1998; Jegminat in fvw 6/99, p. 26. IATA statisticsfor scheduled passengers in 1997.
Note: Exchange rate, $ per DM: 0.5687.
In addition to selling directly over the Internet through its own InfoFlyway site, Lufthansaalso sells through online intermediaries, including Microsoft Expedia. From 18 Novemberto 11 December 1998 and from 6 January to 15 March, Expedia offered 10% off Luf-thansa’s regular, published prices on flights between 10 different US gateways and 23European cities.50
Correspondingly, from 8 to 21 March, Preview Travel offered 50% off for the companionof a traveller who purchased a round-trip ticket at the lowest published fare. Tickets for athird and fourth companion were discounted by 60% and 70% respectively. The offermarked the kick-off of a marketing agreement between Lufthansa and Preview, the objec-tive of which is to boost on-line sales of Lufthansa tickets.51
In a study undertaken by the London School of Economics sponsored by Novell, the Luf-thansa website came out as number one among the sites of 100 of the world’s largest mul-tinational companies. Other major airlines included British Airways (ranked as number 5overall). The US airlines Delta and American were ranked as number 12 and 14, respec-tively, and Japan Airlines as number 17 overall.52
50 http://expedia.msn.com/promos/Lh/.51 Lufthansa and Preview Travel Announce Marketing Cooperation Agreement - Innovative Companion Fare
Program Kicks Off Alliance, press release, 8 March 1999.www.previewtravel.com/About/Mediaguide/Press/990308_lufthansa.html.
52 Novell, press release, 19 May 1999.

47
3.3 British Airways - actual and expected Internet salesThere is a Java version and an html-version of the BA site. In the former, the departureairport and destination are chosen on interactive maps. Dates for the outbound and returntrip are chosen from a calendar, which is aware of fare restrictions (such as requirement ofstaying over a Saturday night) and seat availability of flights. The user does not notice thecomplexity of the booking process.
Early in 1997 British Airways started using a Java-based Internet booking and credit cardpayment system developed by Equant. The Equant booking screens integrate seamlesslywith BA's website, allowing customers to view the availability of BA World Offers.53
BA has a large corporate site, from which cheap flights are sold under the brand name ofWorld Offers. Those who are interested in World Offers mainly focus on price. Thismeans that they may know where they want to travel from, but not necessarily where theywish to go, and they may be happy to consider many alternatives. Once the Internet userhas specified the departure airport, the system comes up with a number of alternativesfrom the World Offers database. The user then selects one of these, availability is checked,and the booking can be completed. Payment can be settled either on-line by entering creditcard details, which are then manually processed by BA, or these details can be given off-line via the telephone within a certain time period.
During the first 12 months after the launch of the site, i.e. during the year 1997, more than3200 tickets were sold via the site, bringing in a revenue of around £750 000 ($1.23 mil-lion).54
At the beginning of 1998 it was announced that - in the US - British Airways was to closeits 17 ticket offices in the US as customers are increasingly booking tickets via the Inter-net and telephone.55
In 1998 British Airways counted about a million visits to its Internet site per month. Thevisitors look for information on everything from seat availability, to schedules, to fares, todetails of inflight films. Fewer people are confident, as yet, about booking their seats via
53 British Airways deploys on-line booking service, Global Network News, Volume 3, issue 2, May 1997,
www.sita.int/index.html?/sita/; and Novus develops JAVA-based Internet Booking & Payment System forBritish Airways, press release, 10 January 1997,www.equant.com/relations/news/pr/1997/british_airways.html.
54 Press release from BA, 2 March 1998, British Airways Wins New Media Awards,http://www.british-airways.com/inside/media/archive/1998/9803/19980302_19.shtml.
55 Guglielmo, Connie, 1998, Travel business packs ‘Em in on-line, Interactive Week, 18 February,www4.zdnet.com/intweek/printhigh/21698/ds216b.html.

48
their computers - which is also possible but nevertheless, they get more beneficial infor-mation more immediately than has ever previously been possible.56
At the beginning of 1999 British Airways was receiving less than 1% of its bookings viathe Internet. Probably far less than 1%. But BA is investing heavily in this field and hasgot tremendous expectations of distribution via the net: British Airways is spending tens ofmillions of pounds to invest in an Internet infrastructure, including the challenging task ofintegrating legacy systems with the new Web front end. BA hopes to make 50% of its saleson-line by 2003.57
To put the BA goal into perspective it can be mentioned that United Airlines got as muchas 2% of its bookings through the net in 1998, and expects to reach 10% by 2002 at aconservative estimate.58
Its stated goal does not mean that BA hopes to make 50% of its sales through its ownwebsite only, it is also intending to take booking through other interactive, electronic, self-booking distribution channels such as the following:
• Internet based travel agents (like the well-known four big American ones).• Traditional travel agents who put up Internet sites.• Interactive TV.• Electronic kiosks.
BA is inspired by developments in the US, and expects something similar to happen inEurope. To fertilise a shift in mind sets, BA has to aim high.59
This writer is not the only person who has been puzzled by the 50% mentioned by BA:
56 Julia Groves, web publisher at British Airways, quoted in Gaby Huddart, Travelling With A Mouse, Global
View, June 1998, http://www.britishairways.com/travelqa/fyi/trnews/docs/1998/9806.shtml.57 Machlis, Sharon, 1999, British Airways plans more on-line sales, Computerworld, On-line News, 8 March,
www.computerworld.com/home/news.nsf/all/9903081airl.58 www.btnon-line.com/db_area/archives/1998/10/98102631.htm.59 Patricia Crossley-Smith, Senior Distribution Manager, BA.

49
BTN: Can you elaborate on the statement that BA wants to move half its bookings to the Internet?
Brewin: We're making a sort of planning assumption where we believe 50 percent of business will be on-line. Itcould be the Internet, but it could be extranet or agency. Dale Moss, my predecessor, is involved in that in hisnew role as director of sales worldwide. It's an assumption on which we're basing our investments in IT, prod-uct, airport systems, etc. It's not a goal, but rather a view of the future marketplace and it does match our needto spend less money actually transacting.
BTN: But at a certain point you have to go for headcount--does that mean fewer agents?
Brewin: That's a possibility, certainly, as a lot more of the work is done electronically. But I don't think weshould be predicting redundancy; I think people will change their roles. An Internet with a personal touch will
be far more successful than one that is just a mechanical process. 60
3.4 Iberia, SpainIberia is the sixth largest airline in Europe - and about 20th in the world by number ofpassengers carried.61 Iberia was founded in 1927 and has about 23 000 employees. About70% of the revenue is from the Spanish market (Spaniards living in Spain), with LatinAmerica being the most important foreign market. Iberia is the number one travel com-pany in Spain. Iberia’s first internal electronic booking system was installed in the late1960s. The current booking system is about 10 years old, a mainframe Unisys system, butit is constantly being updated and extended.
The Iberia website was first opened in January 1996. At the beginning of 1998 it becamepossible to book business class (full fare) tickets on the Iberia site, in cooperation withAmadeus.62
The site currently contains the following features:• corporate information;• last-minute offers;• business ticket sales function;• information about frequent flyer programme;• description of Iberia’s various services;• a news section.
60 Terrion, Pat (BTN), 1999, A Dozen Buyers, BA Try Extranets, BTN On-line (Business Travel News), Issue
Number 435, 7 June, www.btnon-line.com/db_area/archives/1999/06/99060727.htm.61 The number 20 ranking is given in Airline Business, September 1998, p. 55.62 Amadeus empowers Iberia’s website, www.global.amadeus.net/news/press/1998/iberia0298.htm.

50
The Iberia website contains all the main features of a booking site: interactive searchfunctions, prices, flight and seat availability data, booking function, and secure paymentby credit card. The seat availability data is completely on-line (real-time). No discounts orother forms of incentives are given for Internet bookings yet. But Iberia has got last-minute information, with departures from the following day and the rest of the currentweek on international and domestic flights. The last minute offers for domestic flights, e.g.Barcelona-Valencia, can now be purchased on the web. These last minute offers are onlyadvertised on the web, and can all be booked by phone, in any Iberia office, or in a travelagency. Iberia counted about 150 000 visits per month in 1998, but received very fewbookings, mostly from Spaniards. In the first half of 1999 there were about 300 000 visitsper month. The possibility of booking last minute domestic offers on the net is thought tohave led to a 20% increase in Internet bookings.
Airtickets are considered well suited to be sold over the net, in general, but the relativelylow Internet penetration in Spain, cf. Figure 2.3, inhibits Internet sales. In Spain airticketsare not among the key products sold via the Internet at the moment. It is considered rathersimple, technically, to sell airtickets via the Internet/WWW. Iberia does believe that it hasreceived additional orders because of its website, namely for last-minute offers. Iberia issaving costs when customers use the website, but has not reached the break-even point forits investment.
Future plans include the following:• Best buy: Cheapest fare to/from the various destinations, and booking of these.• Offer of the month, including booking.• Booking of last-minute offers on international flights.• On-line auctions.• Enhancing the information on the site permanently.• Access for frequent flyers to check their points status.• Flight tracking (on-time or delayed departures and arrivals).
Iberia believes that no European airline achieved any significant Internet sales in 1998. Inthe year 2001 Iberia expects to receive no more than 1% of its bookings via the Internet. Infive to 10 years, when the current heavy Internet users among the young population (intheir early 20s and below) become airticket buyers, Internet sales will take off, not before,certainly in Spain. In other countries in Europe, such as Finland, where Internet penetra-tion is even higher than in the US, the situation and outlook may be different.
3.5 Finnair - World Wide WingsFinnair is the national airline of Finland, and is one of the top 20 airlines in Europe bynumber of passengers carried on scheduled flights. There are 11 200 employees in the

51
Finnair Group, of which 9050 are in the core airline business. Development of the Finnairwebsite started in February 1995 and was opened in the middle of October 1995. The In-ternet booking function was implemented in February 1998, in cooperation with Amadeus,who have also worked with a number of other airlines to implement similar booking solu-tions.
The Finnair World Wide Wings site includes:• corporate information;• product information;• campaigns;• online sales to business travellers;• frequent flyer programme information;• possibility for corporate clients to track their use of tickets;• last-minute (stand-by) ticket offers (which are also displayed on text TV);• cargo tracking. The Finnair website contains all core functions of a booking site - and more - for businessclass tickets and for last-minute offers: real-time availability, prices, on-line booking andpayment by credit card, based on the Amadeus booking engine. Finnair count the number of hits on their site, as a means of following the development inthe use of the site, but not visits. No discounts or other incentives are given for Internetbookings. During the first half of 1998 Finnair received an average of five Internet book-ings per week, but no advertising was made for the new booking possibility. Obviously thiswas but a fraction of a percentage of all scheduled passenger traffic. In the year 2001 Fin-nair expects to receive between 1% and 2% of its bookings over the net.
Table 3.3 Key statistics of the Finnair website
Period No. of hits per day No. of bookings per week (each covering ~two segments)
Percent of all segments booked (2)
All of 1997 - - First half of 1998 84 000 (1) 5 bookings (10 segments) 0.01% Expected, year 2001 ~850 bookings (1700 segments) 1-2%
Notes: (1) Low: 30 000 in mid-summer holiday; High: 124 000 during a pilot strike, when informa tion aboutthe situation was provided on the net. (2) Total number of scheduled passengers (=segments) sold by Finnair was 5.9 million in the financial year
1998/9 (1.4.98-31.3.99), i.e. about three million per half year. On top of this come 1.5 million charter pas-sengers p.a. Average revenue per segment, for all channels and all ticket types is about FIM 1000 ($187),which of course is higher for business class tickets, which initially are the only types of tickets bookable onthe Finnair website.

52
Tourist class tickets, with their restrictions are considered to be more complex than busi-ness class tickets to sell over the net. In future, electronic ticketing is expected to boostInternet bookings. Finnair does not believe it received any additional orders in 1998 because of its website.No cost savings were gained, and therefore break-even has not been reached. Future plans include:• Campaign products.• Tourist class tickets.• The possibility for frequent fliers to book tickets using their accumulated air miles.• Booking of serial tickets (e-tickets).• Self-service ticket and check-in kiosks.• Connectivity from webbased information to mobile phones and text TV.• Possibly Internet-based travel shopping malls in association with other travel service
providers (shipping lines, train operators) and travel agents.
In Finland - like in Europe in general - Internet sales of airtickets have just started. Travelagencies play an important role in the distribution of airtickets in Finland now and in theforeseeable future.
The advent of electronic ticketing will fuel Internet sales of airtickets. An inhibitor ofelectronic ticketing is the current lack of technical compatibility between airlines (withinalliances) in this field.
3.6 Braathens, NorwayBraathens is the largest airline in Norway with a market share of 50%. The main share-holders are the Braathens family (38%) and KLM (30%), and Braathens is a partner in theKLM/Northwest alliance. Braathens carried almost seven million passengers in 1998 (5.7million excluding Swedish routes and charters, which are not relevant in connection withBraathens’ Internet sales in the Norwegian market).
More than 70% of Braathens’ ticket sales revenue currently comes from travel agents. According to Braath-ens’ annual report 1998, technological improvements will gradually lead to increased direct sales, especiallyin the holiday- and leisure market, but travel agents will remain Braathens’ most important distribution chan-nel. However, the technology will increasingly offer further direct distribution, both for business travellersand the holiday- and leisure market. The e-pass is Braathens concept for ticketless travel. The e-pass has beendeveloped in co-operation between Braathens and its largest customers and is expected to reach a broad ac-ceptance and utilisation in the market.63
63 Braathens Annual Report 1998, p. 10. Author’s translation from Norwegian.

53
Table 3.4 Overall passenger revenue and Internet revenue for Braathens, 1998
Year: 1998 Revenue Revenue Passengers Price in $ NOK mill. $ mill. Internet
NOK $ (segments) per segment Internet Internet revenue
million million X 1000 revenue revenue (%)
Norwegian routes 3571 473 5104 93
Foreign routes 678 90 558 161
To/from Norway 4249 563 5662 99 6.5 0.9 0.15
Swedish routes 821 109 991 110
Charter 361 48 320 149
Passenger transport 5431 719 6973 103
Other revenue 951
Total revenue 6382
Source: Based on Braathens’ annual accounts 1998 supplemented with data from Braathens’ Commercial SystemsDepartment.
In 1998 Braathens achieved Internet sales of NOK 6.5 million, corresponding to just under$0.9 million.64 Seen in relation to Braathens’ total revenue from domestic and interna-tional passenger traffic, which was NOK 4.25 billion in 1998 according to the annualaccounts, the NOK 6.5 million in Internet sales corresponds to 0.15%. (For local compari-son, Ving Norway reached about 0.8% in 1998 and Ving Sweden 2.5%).
Among scheduled airlines in Europe, no single airline has published Internet sales figuresfor 1998 which are better that the 0.15% of Braathens. Lufthansa reached just 0.08 % in1998, although the airline had expected to reach 0.26%, cf. Table 3.2. And as mentionedin chapter 2, nine named European airlines achieved less than 0.16% of their combinedsales in 1998 via the net. (It is not known how much less). So, although Braathens itself ishumble about its Internet sales achievement for 1998, the 0.15% is one of the best amongEuropean scheduled airlines in 1998 - and in fact the best result known by the writer, whohas asked and searched hard and long for published data about this. Lufthansa has beencourageous enough to come forward with their Internet sales figures, whereas others suchas British Airways, SAS and KLM have not. KLM has stated though, that in the spring of1998 it had 9000 daily website visitors, mostly seeking information. KLM in Europe getsmuch fewer Internet bookings that its partner Northwest.65 So, if any European airline didbetter that the 0.15% (in own direct Internet sales as a percentage of scheduled passengerrevenue) in 1998, it has not come forward with the data to prove it.
64 The writer has estimated Ving Norway’s Internet revenue in 1998 at $1.3 million, so Braathens in all probabil-
ity took second place in the Norwegian travel and tourism market in 1998.65 Ligerman, Hugo, 1998, 24 March, www.firstconf.com/c48/hugo.html.

54
For Braathens, it seems that on-line sales of airtickets are really taking off from 1999,following the introduction of ticketless travel for all members of its bonus programme,called WINGS. Thus Braathens achieved sales of NOK 10 million during the first threemonths of 1999, corresponding to roughly 0.94% of passenger revenue from routes to/fromand in Norway. Based on this first encouraging quarter of 1999, Braathens could reachsales of NOK 64 in 1999 ($5 million ~10 times the 1998 Internet sales), i.e. 1.5% of pas-senger revenue from routes to/from/in Norway (assuming same general revenue level as in1998).
Braathens was the first airline to test SET payments for cross-border transactions.66 How-ever, the initiative was never taken beyond the test phase. Let us all stop for a moment andmemorise the time when we all thought that SET was going to be the standard securepayments system for the net. Nevertheless, this comment may be premature, since Braath-ens is considering SET payments for its next generation Internet booking solution.
3.7 SASSAS, Scandinavian Airline System, is number five among the European airlines by num-ber of passengers. It carried 22 million passengers in 1998. SAS was founded in 1946 andwas originally owned by the Swedish, Danish and Norwegian states in the proportions 3/7,2/7 and 2/7, which are still the main shareholders in that proportion. Within the SASGroup there are 27 000 employees, of whom 24 000 work in the core airline business, and3000 in the hotel business.
In its Annual Report 1998 SAS has devoted a section to information technology - fromwhich the following excerpt is quoted:
As regards distribution of airline product offers, information technology has already led to a minor revolution,since it has enabled radical changes to be made to previous agents’ agreements. This means lower costs forthe airlines, and makes it easier to reach rational agreements with major purchasers of air travel, i.e. compa-nies and the public sector. Leisure travellers have constant access via the Internet to the airlines’ current rangeof products in relation to destinations, prices and conditions, and are able to book and pay directly via the net.
At the beginning of 1999 SAS enabled booking of business class tickets on its website - inaddition to the previous possibilities of booking weekend offers, tickets for those under 26,EuroBonus award trips and preordering tax-free purchases.
Only few statements about SAS’ Internet sales have been published. In 1997 SAS sold80% of its tickets through travel agents - 20% directly. At that time it was the expectation
66 Press release, 18 April 1997, www.equant.com/relations/news/pr/1997/setdemo.html -
and www.europe.ibm.com/nc/customer/case18x.html.

55
that about 33% of all trips would be sold directly to the consumer via telephone and espe-cially via the Internet within the next four years (2001). 67
In 1999, according to a newspaper, SAS is experiencing an explosive growth in the firm’sown sales of airtickets. Since the airline more than halved the commission paid to travelagencies at the beginning of 1999 sales via its own sales offices and the Internet haveincreased by almost 50%.68
In the first half of 1999 SAS has increased the number of employees in its ticket-salesdepartment by 25% in order to keep up with the growth of direct sales. In 1999 the situa-tion is that between 25% and 30% of the tickets are sold directly. SAS’ target is that 50%of all tickets in the course of three years (i.e. by 2002) should be sold via SAS’s own ticketoffice or via the Internet.69
3.8 LOT, the Polish AirlinesJust on the borders of Western Europe, LOT, the Polish Airlines, offers a booking facilityon their redesigned website for the US and Polish markets.70 LOT offers extra bonus milesfor Internet bookings, and from the end of 1998 LOT has several offers only found on theInternet.
For tickets bought in the US, LOT’s offer is to Buy One Get One Free (before a certainday). Also, for LOT tickets bought in the US, travellers are offered 5% off if payment ismade by MasterCard. And finally, for trips originating in Poland, the offer is to CelebrateLOT's 70th Anniversary and pay 70% of the fare value.
The LOT site includes the possibility of booking hotels and rental cars as well. LOT haspartnered with Microsoft® Expedia to establish this facility.
67 Tranberg, Pernille, 1997, Travelwar on the Internet (in Danish), Politiken, 7 August, 1st section page one and
in the Computer supplement (Book Travel over the Net and save money). But self-booked tickets can bemore expensive, as mentioned by Njor, John, 1999, Ticketprices: Do-it-yourself can become expensiv (inDanish), Politiken, 6 March, Lørdagsliv section p. 54. - The example Njor gives is that booking tickets directlywith the airlines may not give the customers the cheapest price. Some price examples are quoted by one of thebusiness travel bureaux, DanTransport, which has a system called PriceBuster (www.pricebuster.dk), whichchecks 480 airlines and about 50 million prices, thanks to Amadeus. The mentioned site comes both in Danishand English. Unfortunately time does not allow the writher to go into detail about the Amadeus solution fortravel agencies.
68 Rasmussen, Jens Erik, 1999, SAS success with [direct] sales of tickets (in Danish), Jyllands-Posten, 7 May,pp. 3 (and 1) in Erhverv & Økonomi section.
69 Ibid.70 www.lot.com and www.lot.com.pl. LOT carried 2.3 million passengers in 1997. This is only a third of the
number of passengers carried by the smallest airline in the rest of the world included in Table 3.1. See alsoLOT, 1998, LOT Polish Airlines upgrades its website, www.lot.com/news/1998/100698.html.

56

57
4. European railways on the Web
4.1 Overview - Railways on the WebIn this chapter the focus is entirely on passenger traffic by rail (not the freight traffic side)with respect to sales and distribution via the Internet. Since 1997 the International Unionof Railways (UIC) - and many of its 139 members over five continents - have been wellaware of the challenges and opportunities for rail transport posed by the explosion of theInternet phenomenon across the world.71 For example, it is held by the UIC Internet Clubthat railways should develop their [Internet] sales tools rapidly and that electronic com-merce via Internet is a unique opportunity for railway companies, most of which are al-ready currently represented in more or less advanced form on the net.
Most recently it has been stated by UIC that passengers want to have easy access to de-tails of timetables, seat availability, fares (including international tariffs), connectionswith other transport modes and ancillary services and be able to book or pay using newtechnologies such as Internet (from the home or office) or smart cards.72
Figure 4.1 shows the total number of passengers, i.e. the number of trips, for each of thenational railways. However, maybe only between 10% and 15% of all railway trips arelong enough to make it relevant - or possible - to make a reservation and buy the ticketbeforehand over the Internet.
71 www.uic.asso.fr/uk/news/ - Press release 1 October 1998, and Panorama, No. 10 1998, pp. 2-3.72 Ibid. Press release 15 June 1999, announcing an international seminar in Stockholm, 5-7 July 1999.

58
Figure 4.1 Passengers per year for national Western European railways (1998)
0 200 400 600 800 1.000 1.200 1.400
Germany
UK
France
Italy
Spain
Netherlands
Switzerland
Austria
Portugal
Denmark
Belgium
Sweden (SJ)
Finland (VR)
Norway (NSB)
Rep. Ireland
Millions of passengers per year (1998)
Sources: International Union of Railways (http://www.uic.asso.fr), Rail Traffic statistics of the UIC European Rail-ways.
Note: The ranking is somewhat different when looking at passenger km instead of just the number of journeys. Forexample, the number of passenger km is slightly higher for France than for Germany, greater for Italy thanfor the UK, and greater for Belgium and Sweden than for Denmark and Portugal.

59
Table 4.1 European railways - and a few others - on the net
Country No. ofemployees(1996)
Websiteaddress
Query-response
time-schedules forall city pairs
Pricesshown?
Bookingvia net?
Seatavailabilityand instant
confirmation
Paymenton-line?
Delaysin
arrivalsshown?
Germany 256,700 www.db.de Yes Yes Yes YesFrance 177,900 www..sncf.fr Yes Yes Yes Yes YesUK 100,000 www.rail.co.uk Yes - Virgin(Private)
virgintrains.co.uk /thetrainline.com
Yes Yes Yes Yes Yes
- Eurotunnel [3,114] .eurostar.com Simple tables YesItaly 123,400 .fs-on-line.com YesSpain 37,400 www.renfe.es Curtains YesNetherlands 24,000 www.ns.nl YesSwitzerland 30,000 www.ssb.ch Yes Yes Yes YesAustria 57,000 www.oebb.at Yes Yes YesPortugal 13,000 www.cp.pt YesBelgium 41,100 www.b-rail.be Curtains Yes YesDenmark 15,600 www.dsb.dk Yes Some Yes Yes YesSweden 13,700 www.sj.se Yes Yes Yes Yes YesFinland 14,800 www.vr.fi Simple tablesNorway 9,700 www.nsb.no Yes Yes Yes Yes Yes YesRep. Ireland 4,900 www.irishrail.ie CurtainsGreece 11,700 www.ose.gr Simple tablesLuxembourg 3,200 www.cfl.lu Link to DBWest.Europe ~935,000 ///////////////////// ///////////////////// /////////// ////////////// //////////////// /////////// ///////////Russian Fed.(unofficial)
1,590,300 pavel.physics.sunysb.edu:8080/5/
Yes
Poland 227,000 Walden.MO.NET:80/~jdobek/pkptrav.html
Link to DB
Czech+Slovak 101k+52k idos.datis.cdrail.cz
Yes Roughly
Romania 137,200 www.cfr.ro YesHungary 57,000 elvira.mavinform
atika.huYes
Bulgaria 48,700 www.bg400.bg
USA(Amtrak)
23,300 amtrak.com Only direct Yes Yes Yes Yes Yes
Canada 3,000 www.viarail.ca Curtains Yes Yes YesChina(unofficial)
1,927,000 http://severn.dmu.ac.uk/~mlp/crsg.html
No
India 1,586,400 www.indianrailway.com/
Curtains
Japan 190,200 www.jreast.co.jp/jehome.htm &.westjr.co.jp/
No Yes
Sources: UIC Member railway statistics - Synopsis 1996 (No. of employees) + the respective websites.Note: British Rail was privatised and split up into 25 train operating units + Eurostar during the 1990s. The num-
ber of employees for UK railways are from 1997, based on www.semagroup.com/, British Railways: keydates and statistics. Recent operating statistics of the UK train operating units are provided in Appendix 4.1.Only Yes have been written explicitly. Empty cells in the above table mean No. Curtains is short for dropdown curtains with lists of stations from which to choose. After separating the rail infrastructure part fromDanish Rail from the beginning of 1997 and other reductions, there are now about 11,000 employees withDanish Rail.
The number of employees for the railways of some countries, such as Sweden, excludespeople employed in building and maintaining the basic rail infrastructure. Other railways,such as German Rail, handle the basic rail infrastructure themselves (some 65 000 peo-ple), and also employ many people (45 000) in subsidiaries. The average length of a rail

60
trip varies between countries, and so does the relative importance of freight transport.73
Therefore the number of employ per railway organisation cannot be compared withoutfurther analysis.74
Many of the railways in Western Europe have been reducing their numbers of employeesduring recent years, by an average of 6.4% from 1995 to 1996 (and 3.5% in EasternEurope).75 There have been reductions in the number of employees by between 1% and 4%for each of the other major railway countries shown in Table 4.1. That trend will mostlikely continue, not only in Western Europe, but also in the rest of the world.
In Eastern Europe, the railways have a relatively high number of employees in relation tothe number of passengers, passenger kilometres and ton kilometres worked, compared tothe railways in Western Europe, so some major reductions in the number of employees bythe railways there can be foreseen. And in fact in the Czech Republic a reform projectincludes, among other things, a proposal for lowering the number of employees withCzech Railways by 17 000 from January 1999, which would correspond to a decrease of17%.76 In terms of Internet use, there seems to be nothing to learn from the railways inEastern Europe, as they include only a few features, as indicated in Table 4.1. Two of thelast three major railway nations shown in Table 4.1 seem to be lacking an interactivewebsite.
It is possible to find time-schedules on the net for each Western European railway as indi-cated in the above table - at least by a link to another site where that information can befound. The only exception for the time being is Greek Railways. And even for this organi-sation it has previously been possible to access the timetable directly from the web pages;however, the Greek server is currently not active.
The largest railways tend to have free-form query-response style timetables, where thetraveller just needs to fill in the departure and arrival stations, and the departure or arrivaldate and time. For some of the medium-sized railways the preferred interactive timetable
73 Amtrak of the US (the National Railroad Passenger Corporation) only carries passengers, whereas freight is
handled by the members of the Association of North American Railroads (AAR) (with a total of 182 000 em-ployees). Together the members of AAR constitute the largest freight carrier in the world (by ton km), butfreight is not the topic of this chapter.
74 Some of the reasons why Russian Railways, which carry about the same number of passengers as German Rail,have 70% more employees than all the Western European ones together are that the average trip is more thantwice as long as in Western Europe, and about four times as much freight is carried in Russia than in all ofWestern Europe. For timetables covering the railways of the former Soviet Republics, such as Ukraine (408600 employees), Kazakhstan (158 900 employees), Bielarussia (77 800 employees) and Uzbekistan (77 300employees), and the three small Baltic countries, see the site mentioned under the Russian Federation.
75 During the same period there was an increase in passenger kilometers of 3.4% and a decrease in freight tonkilometers of 1.2%.
76 www.questeconomics.com/pages/sample/aspsamp.htm.

61
style seems to be that the traveller has to select the departure and arrival stations from alist of stations, as a curtain. In a couple of instances only static timetables - as in the paperformat - are shown. This is the case for the Eurostar train, but that is the result of the fewstations served, which leaves Finnish Rail as the only national railway in Western Europewith only static timetables on the net.77 In Eastern Europe and Russia/CIS/Baltics severalrailways have interactive timetables on the net, the Polish one - like that of Luxembourg -only by a link to the timetable of German Rail, DB, which has a very good internationaltimetable, cf. separate section below about DB.
Norwegian Rail, Danish Rail and two of the regional railway companies in the UK werethe only ones with a delayed arrival notice facility in 1998 in Europe, and outside Europeonly Amtrak of the US had this facility. Norwegian Rail (NSB) started taking Internetbookings in November 1998. The NSB concern is serious about applying the Internet indifferent parts of the organisation (passenger transport, freight, travel agency).78
At the Belgian rail site it is possible to book international rail tickets - including the Euro-star and Thalys high speed train - by a filling-in-the-blanks type of form, and sending it(off-line) as an e-mail. Confirmation of seat availability must then be awaited from thetelephone booking centre, which handles the e-mailed booking requests manually.
At the moment, there are no other European railways than those mentioned in Table 4.1which have any Internet booking facility on their website. Of the European railway sites,only four gives access to seat availability data, and therefore only four are able to giveinstant confirmation of the booking. Outside Europe, only the two North American rail-ways have seat availability data and the associated instant booking confirmation, as far asthe writer has been able to establish.
HaCon Ingenieurgesellschaft mbH, Hannover, has supplied solutions to the national rail-ways in the following European countries - which all have up-and-running websites: Ger-many, Switzerland, Austria, Netherlands, Luxembourg.
At the moment Polish Rail, which is the largest national railway in Eastern Europe apartfrom those of Ukraine and the Russian Federation, only provides information in Polish atits website (www.pkp.com.pl), which is a slight drawback, if its objective is also to attractforeign tourists.
77 On the other hand it is noteworthy that Finnish State Railways launched timetable information services as GSM
text messages (for mobile phones) in the middle of 1998. (www.tagish.ltd.uk/ethos/news/lit1/100c2.htm).78 www.nsb.no, NSB annual report 1998 (in pdf-format).

62
4.2 German Rail on the netThe history of railways in Germany dates back to 1835.79 DB (Deutsche Bahn) AG wasfounded rather recently, namely at the beginning of 1994, and based on an amalgamationof the former railways of West and East Germany. By the end of 1998 there were 203 000employees in DB AG (which was a reduction of about 9% compared to 1997), with anadditional 50 000 in subsidiaries of the DB Concern. From the beginning of 1999 DB AGhas been split up into five separate companies:
1. DB Regio (short distance traffic) 56 083 employees2. DB Travel & Tourism (long distance traffic) 35 938 -3. DB Cargo 44 544 -4. DB Station & Service (railway stations) 5629 -5. DB Network (rail infrastructure).80 71 830 -
The new company which is relevant in connection with Internet and passenger transport isDB Travel & Tourism. In the following we will be dealing with the core rail business ofthe former DB AG only. A third of the employees of DB AG work on building and main-taining the basic rail infrastructure - unlike in Sweden, Denmark and the UK, for examplewhere this field is handled by separate organisations.
The DB website was established in the middle of 1996 and comprises two main parts: onewith company information and a description of the various service offers (with three mil-lion page views per month during 1998) and another with timetables (with eight millionpage views per month during 1998). With a total of 11 million page views per month theDB site is certainly one of the most visited in Germany, and according to DB the mostvisited travel site in Germany. The number of page views per month in all of 1999 is set toreach 25 million - since the number of page views per month during the first three monthsof 1999 was more that twice as high as for the first three months of 1998. At the very leastthere will be 20 million page views per month in 1999.
The day of the week where the greatest number of page views are counted is Tuesday -which is also the case for several other travel and tourism sites. On Saturdays and Sundaysthe number of page views are about half the level of normal weekdays. As to time of day,56% of the page views (for time-table information) lie within normal working hours, i.e.the eight hours from 09.00 to 16.59.
79 The first steam train in Germany made the journey from Nürnberg to the neighbour city Fürth on 7 December
1835, according to www.vmn.nuernberg.de/gesch_e.htm.80 Press release from DB, 2.12.98 and the DB Geschäftsbericht 1998 on the Web. - The number of employees for
DB in total mentioned above (203k), does not quite fit with the sum for No. 1-5 (214k), which must be the re-sult of some classification difference which the writer is unable to comprehend.

63
The DB timetables on the net are probably the most used timetables in the entire Internetworld.81 On peak days more that a million connections per day were provided in responseto almost 300 000 connection enquiries (Anfragen) in the last quarter of 1998 and the firstquarter of 1999.
Figure 4.2 Number of page views for www.bahn.de per month, Jan. 98 - March 99
0
2
4
6
8
10
12
14
16
18
98.0
1
98.0
2
98.0
3
98.0
4
98.0
5
98.0
6
98.0
7
98.0
8
98.0
9
98.1
0
98.1
1
98.1
2
99.0
1
99.0
2
99.0
3
Source: Based on graph published by DB in double-page advertisement in Handelsblatt in May 1999 according towww.hacon.de/hafas/dbanzeige.html.
A revamped version of the timetable part of the site was opened in April 1999.
81 Erfolg mit HAFAS im Internet, www.hacon.de/hafas/dbanzeige.html, beginning of June 1999. The Lufthansa
site is another much visited site, cf. www.100hot.com/travel, where LH was ranked as no. 12 in August 1999 -just after Travelocity(11) - and ahead of for example Amtrak (23), TIScover of Austria (14) and TISS of Ger-many (91). Expedia topped the list, in which DB is unfortunately not included. But it is a fact that Travelocityof the US counted 55 million page views per month in 1998, when DB counted 11 million per month.

64
Figure 4.3 DB timetable searches by time of day
0%
1%
2%
3%
4%
5%
6%
7%
8%
0-1
1-2
2-3
3-4
4-5
5-6
6-7
7-8
8-9
9-10
10-1
1
11-1
2
12-1
3
13-1
4
14-1
5
15-1
6
16-1
7
17-1
8
18-1
9
19-2
0
20-2
1
21-2
2
22-2
3
23-2
4
Source: HaCon, Hanover, www.hacon.de - for the DB timetables at http://bahn.hafas.de/
Figure 4.4 DB timetable searches by day of week
0%
5%
10%
15%
20%
Mon Tue Wed Thu Fri Sat Sun
Source: HaCon, Hanover, www.hacon.de - for the DB timetables at http://bahn.hafas.de/
The DB on-line timetables are not only good for finding train connections within Germanybut are also the best on the Web for international rail connections in Europe.82 This is alsoacknowledged by other national train operating organisations, such as Danish Rail, whichrefers to the DB site for international connections. The online schedules are updated sev-eral times a month and offer the same data as the host computer of DB AG in Frankfurt.
82 For example the schedule from Narvik in northern Norway to Palermo in Sicily, southern Italy (70 hours, six
changes), or from Lisbon in the west to Moscow in the east (83 hours, three changes), or from Inverness in thenorth-west to Istanbul in the south-east (72 hours, four changes).

65
When clicking on Graph one gets a simple map showing the departure city and time, arri-val city and time, and the cities along the route where changes have to be made. By click-ing on an enlargement bottom (+) some of the additional stops on the route are shown.The different connections may be seen in three different levels of detail.83
Normal prices for first and standard class domestic tickets are shown along with the dif-ferent connections. Prices for specific international connections are not provided, sincethis would involve the searching of databases in other countries. However, fixed prices fortrips between Germany and any of 11 other European countries - irrespective of the spe-cific stations travelled to and from - are provided as special offers (with certain restrictionsas to travel dates).
Currently it is not possible to check if there are available seats for the selected connections,but DB is working on implementing this facility (for domestic connections). Seat reserva-tions and train tickets may be ordered over the net by filling in a form on the website, andsending it either as an e-mail or it may be printed and sent as a fax. For domestic tripsorders must be placed three working days before the beginning of the trip, and for ticketswhich are to be sent abroad the order must be placed at least eight working days beforedeparture. Payment for orders placed via Internet can either be by DB Direct charge(which is for registered users only) or by credit card (American Express, Diners Club,Euro-/MasterCard, Visa). The amount is then drawn subsequently. The security standardused for order messages (to protect the credit card details) is SSL.
No discounts or other incentives - apart from convenience - are given for orders placedover the net. DB consider their Internet booking facility to be in an embryonic stage. Onthe other hand, another online booking channel for DB rail tickets, among other things, T-Online (formerly known as Bildschirmtext, Btx) has existed for many years. And if Inter-net bookings and T-Online bookings are considered as one, the number of rail tickets soldthrough these two on-line channels is significant. For DB, the future development of end-consumer oriented on-line services will be for the Internet rather than T-Online.
DB think that rail tickets lend themselves particularly well to being sold over the Internet.Research has shown that consumers are willing to buy products which are in the pricerange of typical (long distance) rail tickets (DM 100-150).
83 At the first level there is just one line per connection, the next level (overview) also shows where to change on
the way, and the third level (detail) shows all the stops on the route (although this third level of detail may notbe of interest for most travellers).

66
The complexity of selling rail tickets over the Internet - seen from the point of view of therail transport company - is high. Security aspects (SSL vs. SET) are adding to this com-plexity. DB are using SSL, but are also looking into SET.
DB do not believe that they have made any extra sales because of their website. DB do notthink - or at least they are not convinced - that they are saving money when customers areusing information from the website (such as the timetables), since they have not re-searched this. And in any case, the most important thing for DB is to give better service bymeans of their website, not to save money. DB also believe that among the many peoplewho are looking up train times and other DB information, there are many who would nothave come to the counters or made a phone call to DB (surfers).84
Research into this aspect could be done by analysing the nationalities of the website users,both timetables and corporate/product information (from the server statistics), by analysingwhich connections are being looked up (this data may also be collected automatically), andby analysing demographic profiles, their frequency of use, and their reasons for using, say,the timetables.85
A statement in the outlook section of the Travel and Tourism part of the DB annual reportof 1998 does seem to indicate an acknowledgement of efficiency gains for DB when cus-tomers use the Internet: call centre and Internet offers automatise business routines andprovide employees with (extra) time to advise those customers who need to make complextravel plans.86
DB have not reached the break-even point for their Internet investment. DB is testing anInternet kiosk in the ICE (Inter City Express) trains Hamburg-Basle and Hamburg-Stuttgart from which passengers can surf on the net for free.87 In the near future DB willdevelop their website with more content and more product (service) offers.Discussion - DB
84 Also, some of the people who are planning their international European railway trip, which may not begin or
end in or even pass through Germany can with great benefit for themselves use the DB site to get the informa-tion they need. And what do DB gain from this? Maybe nothing except publicity and an enhanced image amongInternet using travellers, travel agents who are using (or should be using) the net, and among other nationalrailway companies/organisations.
85 The latter could be collected by a self-selection questionnaire along the lines of that of Railtrack in the UK. Infact UK research findings published on the net show that users of the UK timetable information service are infact older than UK Internet users in general, which may be taken as an indication of seriousness among the us-ers, and that they are using the information for planning actual rail trips. The UK findings will be reviewed in asubsequent seperate section.
86 Call Center und Internet-Angebote automatisieren geschäftliche Routine und verschaffen den Mitarbeiternneue Spielräume, um die Kunden bei der umfassenden Reiseplanung gezielt zu beraten. DB Geschäftsbericht1998.
87 www.fvw.de/archive/member/news/data/news.912695981.20325.html, Deutsche Bahn: On-line-Kiosk im ICE.

67
The tremendous number of page views on the www.bahn.de site, the underlying greatnumber of visits to the site and in particular user sessions in the timetables part of the site,with its integrated possibilities of ordering tickets and making seat reservations, are boundto result in a good deal of revenue via the Internet for DB, at least from 1999 onwards.
With at least 20 million page views per month in 1999, which Figure 4.2 seems to con-firm, there will certainly be 240 million page views on the DB site for all of 1999. Withabout 10 page views per user session there will be 24 million Internet user sessions for allof 1999. These session will mainly be in the timetable section, where there is the opportu-nity to buy tickets and to make reservations. If just one in every 240 of the user sessionsresults in a purchase,88 this would result in 100 000 purchases (bookings). There are about1.5 single trips per purchase (maybe slightly more). This means that about 150 000 singlelong DB trips will be booked via the Internet in 1999.
For 1998 DB Internet sales are bound to have been negligible, i.e. below 0.1% of longtrips. DB had 1332 million passengers in 1998 (1388 million in 1997). Of these 6% or 77million travelled by the long distance trains ICE or IC/EC (262 km per single trip), whichare those of relevance in connection with Internet bookings.89 This means that in 1999 DBis set to get about 0.2% of its sales of long (ICE and IC/EC) trips via the Internet.
An average single trip by ICE or IC/EC costs about DM 50,90 which means that an Inter-net booking is worth DM 75 ($43). The DB Internet revenue in 1999 is thus estimated atDM 7.5 million ($4.3 million). This is obviously an uncertain - but relatively conservative- estimate. DB may have to wait until 2000 to get into the two-digit $ million Internetsales bracket, but DB should have a very good chance of being there by that year.
4.3 Swiss Federal Railways on the netSBB, the Swiss Federal Railways organisation, celebrated its 150th anniversary in 1997.The number of employees was reduced from 32 000 to under 30 000 in 1997. There are120 IT developers and 60 IT project managers/workers within SBB. These 180 IT peopleundertake about half of the software development of SBB. The other half is outsourced.About 20 of the IT people work with the Internet and especially Intranet applications, forwhich Java is now used. Three of the 20 people have been recruited for Intranet and Inter-net work from a pool of people from the railway stations, who have been made redundant.
88 This is a conservative guess, since in Scandinavia the railway operators get one booking per no more than 100-
125 visits (in 1998). On the other hand there are other players whose visits-to-bookings ratio is less favourable.89 Another 7% travelled by IR trains (or D or ICNight trains), with an average length of 153 km (1997 data from
DB Daten und Fakten 1997/98, p. 10). There was in fact a 3% increase in ICE/IC/IR trips from 1997 to 1998(according to DB Geschäftsbericht 1998, but here the 1997 data from Daten und Fakten 1997/98 are used.
90 Currently about DM 48 per passenger (single trip or segment) by ICE or IC/EC trains back in 1997. This is thewriter’s estimate based on data in DB Daten und Fakten 1997/98, p. 10. IR is thus not included in the estimate.

68
Previously the programming languages C and C++ were used. In the Intranet, Applets ofJava are used, whereas ordinary html-programming is used for the Internet pages.91
Transactions on the Intranet as well as on the Internet are carried out on the host com-puter, for example the pricing part. A ticketing system has been developed for automaticticket kiosks, and this is also used both on the Intranet and on the public Internet site.
The SBB website was first established in November 1995. About 80% of the informationon the SBB site is maintained in four languages, which is a labour intensive task. Sixtypercent of visitors chose the German language, 19% French, 19% English and 2% Italian.
Figure 4.5 Distribution of 14 million page views on the SBB website in 1998
15%
66%
1%
8%
7%
1%
2%
0% 10% 20% 30% 40% 50% 60% 70%
SSB-homepage
Timeschedule
Multimedia timeschedules
Price information
Rail travel centre
SSB Enterprise info.
Rest
Currently it contains a passenger transport section (timetables, etc.), a cargo section, cor-porate information, SBB real estate information, job offers, operations management(current situation and statistics, etc.) and information about open access (to the tracks).There are interactive search functions, prices can be found, it is possible to place orders(for domestic tickets), and to give payment card information via the website (electronicticketing, e-commerce). It is not possible to check seat availability on the site, and ordersplaced on the site are not confirmed immediately, since the website is not integrated withthe internal booking system. No discounts or other incentives are given for orders placedvia the website. Timetables account for two thirds of the page views.
91 http://www.sun.com/java/platform.jhtml; http://www.disordered.org/Java-QA.html;
http://www.apl.jhu.edu/~hall/java/

69
Domestic rail tickets lend themselves very well to being sold over the net, but not interna-tional tickets, and at the moment only tickets for travel in Switzerland are sold over thenet. The buyers are mainly Swiss people, but are also other nationalities such as Britons,Americans and Germans. In 1998 about 40 orders were received per week. The averageorder size was SFr 76, and therefore the weekly Internet revenue was about SFr 3000,corresponding to about SFr 160 000 for the full year.92 SBB has about 400 railway stationswith manned ticket offices and/or automatic ticket machines, so it is very easy to purchasethe ticket just before travelling, which is one explanation of the insignificant level of salesof tickets over the Internet. But lots of information, especially about travel connections(timeschedules) is provided over the net, cf. Figure 4.5. Internet orders for tickets (to bemailed to addresses within Switzerland) must be placed at least three working days beforethe beginning of the journey.
It is fairly complicated to sell rail tickets over the net for SBB. SBB do not believe thatthey have received any additional orders because of their website. The tickets for SwissRail would have been sold anyway, although perhaps not by SBB themselves, but for ex-ample by a foreign agent such as a train operating company or a travel agent in the trav-eller’s home country. Therefore, in a few instances the sales commission to a foreign agentis saved when orders are placed via the Internet, but it is a marginal saving only. SBB savecosts when customers use the on-line timetables, but the main rationale behind the Webpresence of SBB is to provide a better service. Also it is of benefit to SBB that the know-how and experience gained from Internet development can be applied in connection withthe internal SBB Intranet, which covers head office and 400 stations. The Intranet andInternet applications are placed on six web-servers each costing about SFr 5000, but thiscost is considered low. The main cost element is for staff.
In the near future SBB is not planning to make any big changes on their website apartfrom installing new timetables. Within two, three or four years, SBB will start sellinginternational rail tickets on the website. SBB do not think that a simple information-onlywebsite will do today. SBB was the first railway in the world to start accepting paymentson the web. It is not using the SET standard, but rather the SLL standard, although it wasoriginally invited to take part in SET pilot tests by IBM in Zurich.93 SBB had some diffi-culties in convincing the American SSL approval body that SBB is a solid company, sincethey are a state owned organisation, not a private company, and therefore SBB do not have
92 $115 000 - or DKK 735 000. The weekly average is based on the first 38 weeks of 1998, which is multiplied
by 52 to get an estimate for the year. The number of orders per week (~40) did not appear to be increasingduring 1998. Since total turnover for long distance passenger transport by SBB in Switzerland is about SFr 1billion p.a. according to the annual accounts, clearly Internet sales of rail tickets are very insignificant indeed,corresponding to less than 0.02% of sales. Each time SFr 6300 worth of long distance domestic rail tickets aresold, only one single Swiss franc’s of sales is attained through the Internet.
93 http://domino.www.ibm.com/e-business/casestudies.nsf/homepage/homemain - Swiss Federal Railway

70
a company registration number. Today they regard themselves among the leading railwaysin Europe with respect to Internet sales of tickets.
From 1999 in Switzerland there will be Internet access via cable TV, to which 80% of theSwiss households have access. The access will first be established in Zurich. Initially itwill be one-way communication (non-interactive access) only. From the year 2000 or 2001there will be interactive access to the Web via cable TV. By the last half of 1998 SBB hadalready started distributing timetable information via mobile phones as SMS messages(Short Message Service).94 It is possible to request the connection between any city pairsand get the two next connections (within eight or 10 seconds).
SBB has been a public company (SA) from 1 January 1999.
4.4 Swedish Rail on the netSwedish Rail (Svenske Jernväger, henceforward SJ) dates back to 1856. In 1998 therewere about 11 100 employees in the core rail part of the enterprise, and another 4600 insubsidiaries, i.e. 15 700 in total. The SJ Group reduced the number of employees by 5%from 1997 to 1998, corresponding to 820 people. The reduction in the number of employ-ees is set to continue: it is estimated that SJ’s personnel requirement will fall by 15% overthe next three years.95
When comparing the number of employees of SJ with that of other railways, it should benoted that SJ does not comprise the rail infrastructure, which has been handled by Ban-verket since 1998.96 A similar split is in operation in the UK, and since the beginning of1997 also in Denmark, and will be implemented in other EU countries.97 In general, thereis a deregulation process going on in the European railway industry, leading to increasingcompetition, both nationally and internationally. At the national level SJ holds sole rightsto long-distance passenger train transport, but there is competition from other modes oflong-distance passenger transport.
SJ Group revenue was SEK 14.8 billion in 1998. Eighteen percent of this was generated bylong-distance passenger transport, i.e. SEK 2.7 billion, or $335 million.98 In 1998 SJ car- 94 http://www.swisscom.com/gd/services/mobile_com/natel/pilot-en.html.95 The SJ Group Annual Report 1998.96 Banverket had about 7000 employees in 1998, but in October 1998 it was announced, that Banverket has 700
employees (10%) in surplus in certain divisions. A hundred of them can be moved to other divisions, but 600will have to be laid off (www.banverket.se).
97 ØresundsMagasinet, November 1998, p. 13.98 For comparison, SAS carried 4.3 million passengers on domestic Swedish routes, which generated about SEK
3.6 billion (~46% of the SEK 7.7 billion domestic passenger revenue in each of the three Scandinavian coun-tries). And Braathens (Malmö Aviation) carried one million passengers on Swedish routes, generating aboutNOK 821 (SEK 864 mill., $109 mill.).

71
ried 111 million passengers by train in total, of which about 8%, or 8.5 million were long-distance, i.e. over 100 km.99
In connection with Internet sales of rail tickets, it is these long-distance trips which are ofrelevance. They represent the potential for rail ticket sales via the Internet, so to speak. InSweden, the train has about 13% market share of trips over 100 km (vs 72% for cars, 8%for air, and 6% for long-distance coaches). Of total trips by long distance trains, 60% areundertaken by leisure/private travellers, 40% by business travellers.
The SJ Group is organised into five market-oriented sectors (SJ Passenger Traffic, SJCargo Group, SJ Ferry Traffic, SJ Real Estate, and SJ Engineering), support units (SJ ITDivision, and SJ Cleaning Services) and Group Functions.
In 1998 there were 234 employees in the SJ IT Division, and turnover is almost SEK 400million. Among other things, the SJ IT Division handles the technology behind the book-ing of 150 000 tickets per day, some of which are booked through the Internet (see below).A group of eight people within the SJ IT Division handles the technical side of the Inter-net.
The SJ website was established in March 1997, and a booking function was established atthe site from October 1997. The site includes interactive timetables; prices are shown; it ispossible to check seat availability when making bookings; and secure payments can bemade in two main ways:
1. Either on SJ’s site using the SET standard.2. Or through Torget (= the Market, www.torget.se/sj).
SET is a standard for Secure Economic Transactions. One disadvantage of SET for thetraveller is that special software has to be installed on the particular computer by whichpurchases are made.On Torget, private persons over 18 can become members and have the right to make pur-chases, for example in the SJ shop. Payments can be settled in two different ways:
a) By payment card account (bank card, Visacard, MasterCard, Eurocard, etc.).b) By post giro account. 99 SAS+Braathens carried 4.3+1=5.3 million passengers on Swedish domestic flights. If there were no other
domestic air-carriers, these 5.3 million would then correspond to the 8% share for aircraft passenger transportmentioned by SJ, and the 13% for trains mentioned by SJ would then correspond to 8.5 million passengers. Thisin turn means that 8.5/111 million = 8% of all rail-trips sold by SJ are long-distance, i.e. over at least 100 km.For DB 6% of the single trips were by IC or ICE trains (with an average length of 262 km). For all SJ traintrips (short and long) the average length (53 km) is a bit longer than for DB (47 km) - and much longer than forDSB (32 km).

72
If there is not enough money on the giro account when the post office try to debit the ac-count, an invoice will be sent instead, in which instance an invoice fee will be added.Since the post office acts much like a bank (it can administrate deposit accounts althoughit cannot lend money out), the difference between a and b seems rather insignificant.
At the moment the Internet booking solution used by SJ is based on an existing data com-munication line between SJ and SMART (Amadeus in Scandinavia). But the Internetusers actually access the train times and make the bookings through the web serverSMART.
Figure 4.6 The SJ Web connection
Internetuser
InternetWeb-
server at SMART
TheSMART
CRS
TheSJ internalelectronicbookingsystem
TheSJ internalelectronicbookingsystem
SJ Web-server Internet
Internetuser
Future
Now
SJ is working on a solution for the first half of 1999 which means that in future Internetusers will be accessing SJ’s own web server.
No discounts or other incentives are given for orders places over the Internet. In theautumn of 1998 there were 24 000 visits per week within the passenger transport sector ofSJ’s website, i.e. about 1.3 million visits p.a. For comparison, SJ’s five geographic tele-phone booking centres (which is a single virtual call centre) handled nine million calls in1998. Seventy-five percent of the website visitors look up train times.100 SJ states in its
100 SJ Annual Report 1998. According to the same source the remaining 25% of visitors look up fares. However,
there must be some visitors who neither look up train times nor prices. A minority may be interested just in cor-porate information and news.

73
annual report 1998 that booking and payment is now possible on the Internet [specificallyit has been possible for more than two full years since the beginning of 1997], but this hasnot yet had a major impact among its customers. The website visits (24k) resulted in about200 bookings via the net per week in 1998 (probably each containing an order for about1.6 single trips on average), i.e. about 120 visits per booking.101 Another comparisonwhich can be made is the number of trips sold over the net in relation to the total numberof long trips sold. This percentage was 0.2% for SJ in 1998.102
Today, when bookings are made via the Internet the ticket can be conveyed to the travellerin several different ways. Only for the last of these ways, is anything sent to the traveller:
1. The ticket (and the seat reservation) can be picked up at a railway station.2. It can be picked up at a travel agency.3. It can be picked up at one of the 2000 horse-betting agencies in Sweden (called ATG,
www.torget.se/atg/). Horse-betting is the largest type of gambling in the country.4. It can be retrieved from an automatic ticket machine.5. It can be sent by mail to the traveller - against a fee of SEK 20.
When ticketless travel becomes a reality one could imagine that the traveller will print outhis/her seat reservation and ticket number when making the booking via the net, and thenuse that as travel documentation. SJ is co-operating with Telia to develop mobile phonesas ticket carriers.
SJ do not believe that they have received any additional orders because of their website.They do believe, however, that there are great cost savings to be made when customers areusing the website instead of making phone calls or inquiries in person to the SJ counterstaff.
SJ had intended to add a function on their website which would inform users of delaysbefore the end of 1998, but this function did not seem to have been implemented by themiddle of 1999.
Running updates and improvements of the site will be undertaken. For example, thebooking procedure may be improved so that it becomes seat-specific. Also, in future it willbecome possible for potential passengers to get visual impressions of the station, the plat- 101 For comparison, during the same period (1998), DSB (Danish Rail), counted 100 000 visits per week, resulting
in about 1000 orders per week, where each order covered 1.5 trips. The 5.2 million website visits per year forDanish Rail exceed the number of telephone calls handled by the telephone booking centres of Danish Rail.
102 It is assumed that 8% (i.e. 8.5 million) of the trips sold by SJ are long-distance ones on trains such as Intercityor the special Swedish high speed train X2000, i.e. 8.5 million. The 0.2% for 1998 is calculated as follows:(200x52x1.6) ~ 17 000 single trips sold via the Internet out of 8.5 million long-distance single trips in total =0.2% sold via Internet in 1998.

74
forms, the wagons, the positions of the individual seats in the wagons and views from theindividual seats. This will be by still photos and diagrams rather that virtual reality, wherethe viewer can steer a camera around dynamically, since applications should not be toomuch ahead of the technological level of the users.
SJ do not believe that a basic information-only website is enough (to achieve a competitiveadvantage). The travel industry is leading the way in commerce over the Internet. SJ thinkthey currently have a good position with their website, also compared with air transport inScandinavia. SJ expect that, as a distribution channel for travel services such as transport,the Internet will gain dramatically in importance. Expected improvements in the areas ofpayment and security, as well as greater simplicity, will lead to a great increase in travelbookings via the Internet. In the payments field, SJ see SET as the only acceptable stan-dard. SSL is only seen as good enough for encrypting messages which are not directlypayment related.
SJ IT believes that for the year 2001, 15% of its bookings will come from the net. SJ modi-fies its prediction by mentioning that there are many factors of uncertainty, for examplehow much the Internet booking options will be promoted and developments in the pay-ment field. This must be interpreted as 15% of (the 8.5 million) long-distance trips onlyp.a. (by Intercity or X2000 trains), i.e. 1.3 million in 2001 - up from 17 000 in 1998 - andperhaps about 30 000 in 1999.
Furthermore, according to the SJ Group Annual Report 1998, SJ believes that by the endof 2002, between one third and one half of all sales within SJ Passenger Traffic will takeplace through IT-aided, self-service systems.
By the end of September 1999 SJ’s new Web-site for ticket booking will be launched. Itwill be based on a piece of Internet relationship management software called Sto-ryServer.103 It logs which destinations the Internet users searches in the train travel plan-ning process and suggests destinations next time the user logs in based on the stored his-tory of the user. The user can also specify which sorts of trips are of particular interest.Thus there will be targeted offers to the Web user based on the choices of the user. Finallythe user will be able to click on different stations via a product called MapInfo.104
Discussion - SJThe percentage of long-distance trips, which is booked through the Internet with SJ, iscurrently rather small, albeit the corresponding percentage for most other transport or-ganisations in Europe within rail or air with transactional websites is probably even
103 www.vignette.com104 www.mapinfo.com

75
smaller. Actually, few other passenger transport organisations have been willing to men-tion specific numbers. This general reluctance to provide the actual number of Internetbookings by any European passenger transport organisation must at least partly be inter-preted as suggesting that the number of Internet bookings are very, very low at the mo-ment, certainly far less than one percent. Most passenger transport organisations inEurope asked about this do in fact admit that the number of Internet bookings is very lowat the moment.
Whereas the percentage of bookings taken via the Internet by SJ is currently small - thelookers-to-bookers ratio (or rather visits to bookings ratio) with SJ is not bad compared toother (European) transactional tourism/travel sites: 24 000 visits per week resulting in 200bookings, which corresponds to a lookers-to-bookers ratio of 120:1. One explanation forthis ratio of more than 100:1 may be that on many trains seat availability is not so much ofa problem. Normally there are seats free on given trains. The problem - in the writer’s ownexperience - is in the first instance to find several suitable connections, and then, when itis certain that a given trip has to be made, a booking may be made for certain long jour-neys. Also the fact that payment has to be made on the net (unless via Torget and the postoffice) penalises the ratio of visits to bookings.
For comparison, TUI gave a ratio of 1200:1 in January 1997 (at ENTER’97) (see chapter7.3), and dansommer’s lookers-to-bookers ratio is about 64:1 for the domestic market, and143:1 for the German market (see chapter 6.5.2).
SJ estimate that 15% of the price of a ticket is connected with the handling of the bookingand ticket issuing. A certain part of this, maybe two-thirds, can be saved by Internet use. Ifa (long-distance) rail ticket costs SEK 300, and 10% of this can be saved, this results in asaving of SEK 30 per ticket booked via the Internet. With 200x52=10 400 bookings/ticketscorresponding to 15-17 000 trips per year booked through the Internet, obviously thissaving is only about SEK 0.4 million p.a.
But, very importantly, to this should be added a saving for the 24 000 users (user sessions)per week. Each enquiry may cost, say, SEK 8. (For comparison DSB put the savings peruser session on the net at about DKK 15 ~ SEK 18). 24 000 x 52 weeks x SEK 8 per usersession = SEK 10 million p.a. When adding the aforementioned saving of 0.4 million,total savings are SEK 10.4 million p.a. Obviously, with the current level of Internet book-ings, the savings are many times (i.e. about 25 times) greater in the time schedule use thanin the booking field.
SJ mention that their initial investment was as little as SEK 1 million! This obviously doesnot include the costs of the eight people within the SJ IT Division who work directly with

76
the Internet. The costs of each of these eight people could be about SEK 1 million, i.e.SEK 8 million p.a.
Here are some arguments for using SEK 1 million as the costs of a person p.a. in the In-ternet department of the SJ IT Division: revenue generated by 234-300 people within theSJ IT Division is almost SEK 400 million, according to www.sj.se/koncern/datadiv.html.So, each employee within SJ IT is generating about SEK 1.5 million p.a. The salary of acomputer programmer is hardly more than half a million SEK, but in order to arrive at thereal costs of any employee an allowance of overhead should be made. All in all this meansthat SEK 1 million p.a. would seem a likely opportunity cost or actual total cost of a com-puter person within SJ IT for Internet applications.

77
Figure 4.7 Costs and savings of the SJ website - A rough break-even chart
0
2
4
6
8
10
12
0 1 2 3 4 5 6 7 8 9 10 11 12
Month number from the introduction
Mill
ion
s o
f S
EK
Costs
Savings
Source: Writer’s rough estimates - based on statements by SJ IT Division.Note: In the diagram, break-even is reached in five months (based on the activity level in autumn of 1998). With a
given number of user sessions per week or month, the savings per user session determine the break-evenpoint. If the savings per user session are put at only SEK 6 rather than SEK 8, break-even will never bereached with the current (1998) activity level.
So, all the costs of developing and running SJ’s Internet activities seem to be very welljustified just by savings made, primarily by customers making time schedule enquiriesover the net - even if the savings per user session is put as low as SEK 8 each.
When interpreting SJ’s forecast that 15% of tickets will be sold through the Internet in theyear 2001 it is assumed that SJ means 15% of long distance train tickets, since these aretypically the type of tickets bought over the net. Fifteen percent of about 8.5 million long-distance single trips equals about 1.3 million SJ single trips sold over the Internet - com-

78
pared to about 17 000 single trips (0.2%) in the year 1998.105 To achieve this target agrowth rate of 320% p.a. is required for three consequtive years. If the growth rate from1998-1999 looks as if it is going to be about 100%, clearly it is hardly achievable to reachthe 15% by the year 2001.
Ways to evaluate how realistic it is to assume such high growth rates for SJ would be tocompare the above 320% with the increases from 1997 to 1998, since the booking facilitywas established in early 1997 - as well as with the increase from 1998 to 1999. Also com-parisons can be made with other forecasts for annual increases in Internet sales in othercountries with fairly high Internet penetration (like Sweden), and in other industries. Inthe US, which is a relatively mature Internet market, the projected growth rate for travelproducts in general is 67% per year in the period 1998 to 2000, according to ForresterResearch (vs a somewhat higher growth rate from 1996-98, i.e. 112% p.a.). This indicatesthat sustained growth rates in Internet sales of more than 100% per year are unusual inrelatively mature markets. However, a number of successful European players in travel andtourism are set to reach an average growth rate of 180% from 1998 to 1999, and this isabove the average growth rate of 100% p.a. for all travel and tourism services sold over theInternet from 1998 to 2002 predicted by this writer.
As discussed above, SJ planned to implement a delay information function, which Norwe-gian Rail (NSB, www.nsb.no), Danish Rail (through Banestyrelsen at www.bane.dk), andtwo regional train operating companies in England have already got at their sites, as hasAmtrak in the US. It could be argued, however, that any delay information function shouldcertainly be implemented for mobile phones simultaneously with implementing it on thenet, since by the time people need the delay information they might be on their way to thestation. A delay information service seems somewhat more relevant for airlines than forrail companies, since delays are generally much greater and occur relatively more fre-quently for passenger transport by air than by rail. On-time arrivals, i.e. arrival within fiveminutes after schedule, for SJ passenger trains excluding local trains was 88% in 1998.
105 The average length of a trip sold by SJ is 63 km vs about 42 km in Germany (and only 32 km in Denmark).
This indicates a somewhat larger proportion of long trips in Sweden than in Germany. In Germany, only aboutone in every 10 trips with DB are made by long distance trains (ICE, IC/EC, IR/D/ICNight). - Each rail ticket /each booking probably covers between 1.5 and 1.7 trips.

79
4.5 Danish Rail on the netThe first railway in Denmark was opened more than 150 years ago, in 1847. Currentlythere are about 11 000 employees with Danish Rail (DSB) the national railway (or rathertrain) operating company.106 Within DSB, there are about 200 people employed in theData Division. In addition to this there are six people working with the DSB Internetwebsite. These are placed in the Intercity Division, not in the Data Division. This group iscalled DSB InterNet, but could also be called DSB InterActive, since they define theirfunction broadly to include the application of other new communication technologies aswell (e.g. mobile communications).
Most DSB sales are transacted with Danes. In 1998, DSB sold 150 million train trips(segments), of which about 1% were for international trains, 6% for long-distance domes-tic trains, 30% for regional trains and the remaining 63% for rapid transit in the metro-politan area. According to DSB, for the time being it is only the 6% of domestic long-distance trips (nine million p.a.) which are of relevance in connection with Internet book-ings. In principle it should be possible and relevant to sell tickets for international trainsover the Internet to Danes, but this is not done at the moment.
The DSB website contains a travel planner section, which is the most visited part of thesite. The travel planner is interactive, like that of many other railways, since it is possiblejust to key in departure and destination city, and then get the connection. It is possible toplan not only the train travel part of the trip, but the entire trip, including other forms ofpublic transport, such as ferries and local buses.1. For the metropolitan area (with north-east Sealand) the level of detail goes down to the
specific address, which means that even the walking time required to reach the nearestbus stop is included.
2. In about half of the rest of the country bus stops and ferry harbours can be keyed in.3. Finally, at the remaining districts only railway stations can be keyed in (see white areas
in figure 4.8).
106 This does not include building and maintenance of the basic rail infrastructure, which is now handled by an-
other organisation, which has a further 3300 employees. Bus and ferry transport has been separated from DSBas well.

80
Figure 4.8 Three levels of detail in the travel planner part of the DSB (Danish Rail)site
1. Address level
2. Bus stop level
3. Station level
Source: www.dsb.dk.Note: Status middle of 1999.
There is no search facility in the corporate part of the site, however. Approximate pricesbetween main stations can be found on the site, but the prices are not provided directly forthe connections looked up in the timetable. To/from stations or main stations close to theseconnections have to be keyed in again subsequently, but further developments are beingundertaken in this and other fields.
The travel planner does not include any foreign stations. The DSB site does include de-scriptions of 46 destinations in continental Europe and the other Nordic countries, withbest buy rail offers to them. For international connections in general, reference is made tothe German Rail site (by link), since DSB is one of the smaller national railway operatorsin Europe. But as far as sales of railway tickets over the Internet is concerned, certainly inrelative terms and most likely even in absolute numbers, DSB leads in Europe. Thus in1998 DSB sold 0.8% of their nine million long-distance domestic trips via the Internet, i.e.70 000 trips in 1998, generating DKK 20 million in revenue ($3 million). This is set todouble to 140 000 trips in 1999. 107
From April 1999 it became possible to check seat availability and to make reservations ondomestic IC trains as little as half an hour before departure. These data are real-time, i.e.completely current. Also it is possible to purchase domestic tickets on-line, provided de-parture is at least 24 hours ahead. The ticket can either be mailed to the traveller or beretrieved from an electronic ticket and information kiosk at one of 22 major stations. As is
107 With 1.5 trips sold per Internet booking that corresponds to about 47 000 orders (bookings) for all of 1998 or
just under 1000 orders per week (125 orders per day). In the middle of 1999 DSB received 150 orders per day,still with an average of 1.5 trips (segments) sold per order.

81
the case for telephone ordering/sales of railway tickets, there is no fee for getting the tick-ets sent by ordinary mail. If tickets ordered over the net are sent by mail, an invoice and agiro card will be included. DSB says that its losses from non-payments in this instance arevery limited. If tickets are retrieved from one of the kiosks, payment is undertaken by bankcard or credit card.
All the orders which DSB receives over the net, are placed by Danes. The booking facilityis available in Danish only, and in fact no part of the site is currently in English, althoughthe travel planner part was available in an English version (before the revamping of thesite in April 1999).108 DSB does not give any discounts or other incentives - apart fromconvenience - for ticket orders placed over the Internet. The information provided aboutseat availability and the possibility of making reservations up to the last 30 minutes iscertainly very convenient.
Like other rail operators, DSB believes that rail tickets lend themselves well to selling overthe net. The products are fairly standardised, and they are not physical. Even the ticket,the proof that payment for the trip has actually been made, does not have to be physical. Infuture, the ticket may just be a short message on the display of a mobile phone (see Table4.5 below for penetration of mobile phones). Even today, tickets do not have to be sent tothe traveller, since they can be retrieved from one of the automatic ticket kiosks. Further-more, rail transport - like air transport - is a product (service), which is fairly easy to de-scribe unambiguously - even without the personal contact - by different classes and seatpreferences. Seat reservations - for trains which are frequently full - lend themselves evenbetter than rail tickets to being ordered over the net. And payment for the seat reservationcan be made just before departure, at which time the tickets can also be bought, for exam-ple in one of the automatic kiosks. On the booking form it is thus possible to order either:
a) seat reservations only;b) travel tickets only (without the seat reservation);c) both travel tickets and seat reservations.
Additionally, it is possible to renew season tickets on the site.
Technically, it is rather complex for DSB to make the Internet server communicate withthe underlying internal systems for reservation and ticket issuing such as the electronickiosks. But for the user it is very simple to buy DSB rail tickets.
108 One would guess that it is just a matter of time before the new version of the travel planner becomes available in
English.

82
DSB believes that it has achieved extra sales because of its website, although it has not yetmade any studies itself, which support this assumption. Investigations from other countriesshow that the more accessible any product is, the more it is sold. From its telephone salesdepartment, which has longer opening hours than the stations, DSB knows that there are anumber of calls which do not lead to conversions, and therefore sales. But on the net it isalways possible to place orders. DSB believes that it is saving money each time customersuse its timetables at its website.
Initially there was no automatic processing of the orders received over the net. Orderswere received off-line and had be manually entered into the legacy systems (internal sys-tems). But from April 1999 the processing of Internet orders has been automated. Ordersreceived through the website are now automatically entered into the legacy systems.Therefore DSB is now saving costs when orders are received via the Internet.109
Also, from April 1999 – and this is unique among train operators - it has been possible tofind best-buy international airtickets, and book them on the net on a request basis. At thesame time a number of other new features and content directed towards the different targetDSB groups were implemented, mostly in a place called Memphis Station, which is anarea containing information for and about (1) commuters, (2) trainspotting, (3) schoolgroup trips, (4) young people (including an online game), and (5) InterRail (which willinclude daily updates of descriptions by three InterRailer teams, who compete over how tomake the most interesting train trip around Europe).
DSB believes that it has reached break-even. Not because of Internet orders, but because ofthe time-schedule use, and the savings associated with this. DSB thinks that the time re-quired to reach break-even point was a number of months, and not years (see Table 4.2and Figure 4.9 in the discussion below).
In three (or four) years time DSB expects that as much as 30% to 40% of long domestictrips will be ordered through the Internet. With the current level of long-distance traffic,this would correspond to between 2.5 and 3.3 million trips. For comparison, after manyyears of existence, telephone sales currently account for 10% of DSB’s sales (of long-distance domestic and international tickets).
109 In 1998 about 125 orders were received per day, with an average of 1.5 trips sold per order.

83
Electronic trade and marketing on the Internet has five advantages for DSB.110
1. DSB is promoted.2. Extra sales are generated via easier re-ordering.3. Increased loyalty is created, especially in the business-to-business market.4. New products are possible via the Internet.5. Internet traffic can be utilised (net gains).
The vision of DSB’s Internet presence is the following:1. To support its commercial objectives.2. To interact with other forms of market communication.3. To create value for its customers, be well structured and well designed.4. To provide the possibility for interactivity/quick feed back.5. To inspire confidence (stimulate trade).6. To be run economically and effectively.7. To be well anchored in the organisation.
Some of the future plans of DSB InterNet are the following:• DSB sees itself as a potential hub of sales of railway tickets as well as tickets for sup-
plementary tourism, travel and leisure activities. DSB wants to sell experiences, notmerely trips.
• DSB will be suppliers of how-to-get-there information to strategic partners such asattractions. On these partner sites, DSB will keep a low profile, but still be the organi-sation which supplies the travel information and sells the travel tickets.
• Other strategic partnerships will be formed with publishers of What’s On calendars,etc., e.g. for the Copenhagen area (www.aok.dk).
• DSB will supplement its current Internet-based delay information with distribution ofthe same information to mobile phones as SMS messages. In this way the inconven-ience for the traveller associated with trains running late can be reduced (and therebymore customers can be retained).111
• DSB wants to expose potential travellers to relevant offers, based on the more or lesslimited information which it has about these travellers, for example travel plans andother information such as age and sex.112
110 Birnbacher, 1998.111 In July 1999 it was announced that this function had been implemented for the customers of one of the mobile
phone operators in Denmark, but the service would be extended to all operators in the country after a threemonth test period until 11 October 1999, cf. www.bane.dk/toginfo/toginfo.htm and Andersen, Jesper T. 1999,Traininfo to the mobile phones of pendlers (in Danish), www.computerworld.dk, 12 July, also in printedDanish version of Computerworld, 16 July, p. 5.
112 There are some general legal constraints to observe with respect to data which a company is allowed to keepabout customers. It may be time to introduce some kind of plastic (intelligent) card for all rail travellers or forthe frequent travellers, as many airlines are doing, and which VIA Rail of Canada has become first railway op-erator to do.

84
• In the more distant future, it may become possible to talk to the website, for examplevia mobile phones with mini-screens and Internet access.
Discussion - Danish Rail on the net The net saving per visitor using the time-schedule is estimated to be DKK 15. In this esti-mate, according to DSB, it has already taken into account the fact that customers tend tomake more enquiries when they can be easily undertaken. In the table below the saving ofDKK 15 per user session is considered a maximum. Along with this a more conservativeassumption about the savings made per Internet time-table user session is shown (DKK 10each), since the extra number of enquiries made because of the convenience of the Inter-net-based timetables may be greater than assumed in the 15 DKK estimate.
Table 4.2 Investment (costs) and savings from usage of the DSB online timetable
Year Investment (costs),
DKK mil-lion p.a.
Costs, accu-
mulated DKK
million
Number of timetable
usersessions (million)
Savingsper usersession,
maximum (DKK)
Savingsper usersession,
minimum (DKK)
Savings mill. p.a.,
minimum (DKK).
Savings, accu-
mulated, minimum
(DKK)
Net effect, accumulated
DKK million
minimum
1996 10 10 0 15 10 0 0 -10 1997 10 20 2.5 15 10 25 25 5 1998 12 32 5.2 15 10 52 77 45 1999 15 47 10 15 10 100 177 130
Note: DSB assumes a saving of DKK 15 per timetable user session. Using a more conservative number for the savings (DKK 10 per timetable user session) is the writer’s own choice. The reason is given above and below.
In April 1999 it was stated that the DSB site was visited by almost a million users permonth, which must have been the number for March 1999, of whom 80% were using thetravel planner part, i.e. 0.9x80%~0.7 million time-table user sessions per month in thefirst half of 1999. In the second half of 1999 in seems fair to assume at least 1.2x80%~1million time-table user sessions per month, i.e. about 10 million time-table user sessionsfor all of 1999. It remains to be proven by thorough analyses that the net saving is actually as high asDKK 15, although this amount is only half of what may be the full cost of a telephone orpersonal time-schedule enquiry (which cost DSB DKK 30 each). The writer believes that itmay very well be that less than half – maybe for example only a third - of the timetableuser sessions are actually substituting telephone or personal enquiries.

85
Figure 4.9 A break-even chart for DSB InterNet
0
50
100
150
200
250
300
1996 1997 1998 1999
Mill
ion
DK
K (
accu
mul
ated
)
Savings, accumulated,(DKK 15 per usersession)
Savings, accumulated,(DKK 10 per usersession)
Investment, accumulated
Source: Table 4.2
The graph shows that by the end of 1999, DSB will have made gross savings of at leastDKK 177 million (or more, optimistically) from an investment of DKK 47 million. So, thenet savings for DSB over the period 1996-1999, both years included, could be DKK 130million (almost $20 million), even as a somewhat (but not necessarily very) conservativeestimate. In any case, accumulated net savings seem certain to exceed DKK 100 million bythe end of 1999, and the website has been a tremendous success for DSB in this respect.Additionally, there has certainly been and still is an unquantifiable value of the imageboost, which DSB has been given by being in the forefront of the Internet commerce fieldin Denmark. The net savings estimate is totally dependent on the assumed saving per Internet timetableuser session. Whether one in two of these sessions substitutes a telephone call (and thesaving is therefore DKK 30/2 = DKK 15 per session), or it is one in three (DKK 30/3 =DKK 10) or it is less than that (e.g. DKK 30/4 = DKK 7.50) directly determines the as-sumed accumulated net savings. Since the resulting total numbers in terms of accumulatednet savings are so large, this issue (determination of a more precise savings figure perInternet timetable user session) easily justifies deeper research and analyses.

86
DSB is one of the very few online players within travel and tourism and indeed almost anyother industry to believe that Internet sales, albeit for a limited part of its product portfolio,could reach a level of about 35% within three years. This would correspond to about threemillion trips sold over the net out of a total of about nine million long-distance domestictrips, which is more than 40 times the 1998-level. From a starting point of less than 1% this writer believes that is too optimistic to expect tobe able to sell about 35% of long-distance trips in only three years. Certainly, the matterdeserves some really thorough analysis and there could be many reasons why Internet salesof long-distance tickets will remain far below the 30% mark for many years to come. Some of these reasons are the following:• The still limited number of frequent Internet users, even in the foreseeable future.• The fact that it is also rather convenient to go to the counter at the railway station and
buy your ticket just before you travel, since in most instances there are free seats avail-able.
• Many travellers may in fact not find it particularly convenient to reserve a seat andpurchase a ticket by computer several days ahead of the trip, either because they do notwant to purchase anything via computer or because their travel plans are made only ashort time ahead.
• There are many more telephone users than Internet users (i.e. penetration of stationaryand mobile phones is much higher than penetration of the Internet). Telephone sales ofrail tickets has existed for many year, and currently accounts for 10% of long-distancedomestic (and international trips). It seems unrealistic to expect that Internet sales canreach a level which is three or four times that of telephone sales in just three or fouryears, although Internet as a communication medium give the uses some advantagescompared to the telephone, such as not having to wait in a cue.
The writer believes that it would be more realistic to hope to sell between 15% and 20% oflong-distance domestic rail tickets via the Internet, not in three years by 2001, but in fouryears by 2002. With the current level of traffic this would correspond to about 1.5 milliontrips in the year 2002.113 And it would be a great achievement to reach this target.
113 With a possible increase in long-distance traffic from the 1997 level of 8.7 million trips to perhaps 10 million
long-distance domestic trips in the year 2002, the mentioned percentages would correspond to expected sales of1.5 to two million trips. With 1.5 trips sold per booking that would translate to at least one million bookings viathe net, which would also be a dramatic increase compared to the 1998 level of just under 50 000 bookings. A20-fold increase in four years seems achievable.

87
4.6 UK railways on the net
4.6.1 RailtrackRailtrack PLC has 11 000 employees and owns the basic rail infrastructure in the UK andis responsible for building and maintaining it. Railtrack hosts an Internet-based timetablecovering the whole of the UK.114 The various train operating companies in the UK thenlink to the Railtrack timetable from their respective websites.
A survey shows that during the period October 1997 to June 1998, the users of the Rail-track site tend to be slightly older than the average Internet user, which may indicate thatthe travel information is being used to plan actual trips, and is not just being retrieved forfun.
As for other international connections, connections from, e.g. Paris or Brussels, can befound to all destinations in the UK. But the cities served by Eurostar seem to be the onlyones on the continent which the Railtrack Internet timetable information service covers.Therefore, it is not surprising that more than 80% of its users are from the UK. The restmust be made up of those foreigners who are planning a trip to the UK.
Eighty percent of the users of the on-line timetable are men, reflecting the fact that mengenerally predominate among Internet users; men may also be travelling somewhat morethan women. Almost half of the users have found the Railtrack site via a search engine.Eighty percent of the visitors found the timetable service to be either good or excellent.About half of the timetable users look at the timetable once a month. Information aboutfares is the most important missing feature, whereas a booking feature is not on the top 10list of improvements desired by the users.
Sema Group provides the rail information web services of railtrack.co.uk. In 1998, thisweb site serviced 40 million international train journey enquiries on the UK timetable.115
(This is eight times as many enquiries as Danish Rail received during 1998 on their site).
4.6.2 North Western TrainsNorth Western Trains is one of 25 Train Operating Units in the UK (see Appendix 4.1).116
It carries 2% of the train passengers in the UK, and works 3% of the passenger-kilometres.The average rail trip on North Western is too short to justify seat reservations. But it was
114 http://timetables.railtrack.co.uk.115 UIC, 1998, Second Worldwide UIC Internet Club meeting on 22-23 October, CD-ROM.116 www.railinfo.freeserve.co.uk/privatisation/summary.html.

88
the first railway website in the UK to offer real-time information on train running.117 Inthe first five months since its launch, the North Western Trains Internet web sitehttp://nwt.rail.co.uk was visited 200 000 times.
4.6.3 TheTrainLine - in association with Virgin TrainsThe two Virgin Train operating companies, West Coast and Cross Country, carry 3.3% ofUK passengers and work 15.4% of the passenger-revenue-km.118 The average length oftrips by Virgin trains is relatively long (almost 200 km), seat reservations are possible,strongly recommended, and free of charge when purchasing a ticket for one of Virgin’strains. Given the length of trips and Virgin’s share of passenger-km in the UK, Virgin’sinterest is entering the online rail ticket field is easy to understand, and in fact no othergroup of train operating units in the UK seems better suited to enter this field, except per-haps Eurostar, in which both Virgin and National Express have stakes.
As the only bidder in connection with rail operating privatisation in the UK, West CoastTrains had as one of its Franchise Plan Commitments the introduction of a facility to re-serve or purchase tickets via the Internet by 30 Sept 1998. Due to technical difficulties, aderogation was been granted until 30 Sept 1999 for full implementation.119 However, inFebruary 1999 it actually became possible for the first time to make online bookings oftickets and seats, not only of tickets for trains operated by Virgin, but of tickets for anytrain operator in mainland UK. On TrainLine it is possible to book any kind of traintravel, whether business or leisure, except Sleeper, Motorail, Eurostar and ferry services.TheTrainLine offers only tickets which are available at the time of the enquiry. Payment isby credit card via Internet (SSL encrypted) - or by phone. Tickets are posted (within theUK only) or can be collected at one of 22 Virgin Train stations. Virgin receives a 9%commission from the other train operators when selling tickets for their services on-line.120
The Virgin Group as a whole (with a total of 20 000 employees) is investing heavily inInternet commerce: £50 million, including TheTrainLine site. A big investment has also
117 Hot News Article. Article Ref: Submitted: 11:17:39 30/1/98. Rail Web Site Hit: 200,000 Times!118 And - less flatteringly – receive 30.5% of written complaints, cf. Appendix 4.1. The announcement of the new
Internet train ticket service came on the same day (in late February 1999) that train companies were expecting adressing-down for their poor performance from the government at a rail summit, according to the BBC OnlineNetwork, 25 February 1999. Supplementary information about Virgin Trains:www.railinfo.freeserve.co.uk/companies/virgin.html
119 http://www.opraf.gov.uk/docs/bulletin/10/West%20Coast/west_coast_trains.htm120 Price example: Edinburgh-Paignton, one-way. By train, £89 (standard open). Comparison: By National Express
coach, £42 less 10% for Internet bookings (economy single).

89
been made in a train ticket telesales project.121 For comparison, British Airways is alsotalking of a figure of tens of millions of pounds for its Internet investment (see above).122
4.6.4 EurostarCurrently it is not possible to book tickets via the Eurostar website. But it would be a veryrelevant function to establish, since trips by Eurostar are fairly long,123 and tickets aretypically bought well in advance with a seat reservation. For Eurostar UK the Internet isthought to have limited scope in the short term - and is given only third priority after GDSsales and corporate Intranet capability.124
In Belgium Eurostar tickets (like those for other trains) can be booked off-line by e-mailon the Belgium Rail site (www.b-rail.be). Booking requests are handled by a call centre. InFrance, Eurostar tickets can (probably?) be booked on the SNCF (French Rail) site, butonly by French people.
4.6.5 National Express - trainsNational Express Group PLC has franchised five of the 25 UK train operating units, andhas a stake in Eurostar UK. Total sales were $1.87 billion in 1997, and the Group has 15200 employees. Its train service accounts for 67% of its sales; buses 15%; express coaches15%, and airports 3%.125 One of the train operating units of the National Express Group isMidland Mainline, which became only the second UK train company to offer real-timetrain running information on the web, and the first to give details of both departures andarrivals at every station on the route. This information is updated every 60 seconds. Mid-land Mainline carries 1% of the train passengers in the UK, and works 2% of the passen-ger-km. The modest share of passengers makes it hard to justify any big investments inWeb booking solutions for Midland Mainland alone, and the rest of the UK train operatingunits of National Express perform mainly rather short trips, which do not lend themselvesto pre-bookings via the Internet or other channels.
121 http://news.bbc.co.uk/hi/english/sci/tech/newsid_285000/285300.stm122 Machlis, Sharon, 1999, British Airways plans more on-line sales, On-line News, 03/08/99,
www.computerworld.com/.123 About 420 km on average: 360 km from London to Brussels or 480 km to Paris.124 Tomlin, Paul (Eurostar UK), 1998, GDS technology for rail, www.firstconf.com/c48/paul.html, March.125 www.opraf.gov.uk and www.industrystandard.net/

90
4.7 North American railway websites
4.7.1 Amtrak, USAAccording to www.100hot .com/travel, the Amtrak website gets many page views, sinceAmtrak ranks as number 23 on this particular travel hit list (18th August 1999).
The Amtrak timetable does not give connections between all city pairs, such as betweenKennedy Airport, which appears on an alphabetic list of stations, and Miami: The serviceyou have requested for your first city pair cannot be booked through Amtrak Reservationsonline. But six connections between New York-Pennsylvania (NYP) and Miami werefound.
It is possible to check arrival information for trains, which have already left. For example,the train which left NYP yesterday at 7:45AM was to arrive at Miami at 12:07PM today.But according to the train arrival information given on the Web that particular train wasrunning 3 hours late. This information is certainly relevant for anyone who is going topick somebody else up at the station.
Normally one would of course look for times of trains leaving sometime in the future. Forexample, one may see that three of the trains from NYP to Miami later today and tomor-row are sold out, some direct and some via Washington DC. Registered users may checkprices. For example on the leg from Washington DC to Miami the basic rail ticket costs$102, but the associated accommodation in a standard bedroom costs twice that amount,namely $203, i.e. $305 in total for a one-way trip. Europeans would probably expect theprice of the sleeping place to be a lot cheaper than the basic ticket itself, but that is ofcourse a commercial, not a technical matter.
More complex connections, for example a three leg trip from New York to San Francisco,can also be found in the Amtrak timetables. The technical solution is developed by Equant,who have also made the solution for Canadian Rail and for the Eurostar service throughthe Channel tunnel. The website of the latter has no booking function, however.
Late in 1998 Amtrak started giving incentives for placing orders over the net, namely inthe form of discounts. Amtrak was most probably the first train operating company in theworld to start giving incentives for Internet bookings, and to the writer’s knowledge noother railway has followed Amtrak’s example.126 The initiative is obviously inspired bysome of the airlines in America.
126 Press release, 5 November 1998, www.amtrak.com/news/pr/.

91
4.7.2 VIA Rail, CanadaThe Canadian national railway company is VIA Rail, which claims to have been theworld’s first railway company to provide interactive on-line access to its timetables andfares, followed by ticket reservation and payment - as does Swiss Rail. VIA Rail has beenupdating its interactive VIA Resernet system. It has replaced its main reservation system,and therefore had to re-develop VIA Resernet.
VIA Rail has introduced a Frequent Traveller Program, with an associated card (VIAPreference), with which it is possible to earn bonus points for every dollar spent on VIARail tickets, not necessarily bought through the Internet. The points can be spent for freetravel throughout Canada. VIA Rail is to the writer’s knowledge the first and so far onlyrailway in the world to introduce the FTPs known from airlines into rail travel. No extrapoints are given by VIA Rail for Internet bookings, but this is of course a possibility nowthat the card has been introduced. In future more functions may be added, such as choos-ing the seat, reserving sleeping-car accommodation, customer profile, etc.
In August 1998 VIA Rail counted 66 000 user sessions on its website all in all, whereas40 000 or 60% of the user sessions were counted within the fields of timetables and book-ings, which in fact led to 2300 bookings (tickets issued). The number of timetable usersessions in relation to the number of bookings was as impressive as only 17:1 (or 29:1 ifbookings are seen in relation to the total number of user sessions on the site). Forty-twopercent of the users were Canadians, and average user session length was about 10 min-utes.
4.8 Some other railway sites of the worldMost other railways of the world either have more or less interactive timetables or at leastsome simple timetables on the web. Interactive timetables can be found for example in theCIS, the Baltic States and Taiwan.127 Those of Australia, New Zealand, China, India, andJapan (whose Shinkansen bullet trains currently hold the world speed record128) are non-interactive, but they are there. For the latter two countries only a few connections areshown, though.
And what about Trans-Siberian time schedules? Yes, several possibilities are open here.You can buy a package trip of more than three weeks, one-way from Moscow to Beijing.129
127 http://gamayun.physics.sunysb.edu:8080/5/ (former USSR);
http://www.railway.gov.tw/taiwan/tai4ae-2.html.128 http://www.railgaz.co.uk/archive/speed.htm.129 http://www.trans-siberian.co.uk/ for a package. Prices range from £275 for a nine-day package to £1850 for a
22-day package. On the CIS Rail site mentioned in the previous note, schedules for the direct train may easilybe found.

92
Or you can plan the trip yourself by using the CIS Rail timetables mentioned above. Forexample you can go directly from Moscow to Vladivostok, which will last a little morethan six days for the 9300 km. The only problem is what to do there, so maybe one shouldrather take the direct train to Beijing via Mongolia instead (7661 km, five and a half days)to which could be added the trip from Berlin to Moscow (1912 km, one and a half days oftravel time unless you fly that bit). And then after a few days’ break one could take thehigh speed train from Beijing to Hong Kong (which will take three days - 2370 km),130
and then fly back via London. The booking of the Trans-Siberian package can be made byfilling in a form on the web, and then sending it as an e-mail to the organiser. If arrangingyour own itinerary you would buy the trip from a travel agent with a good knowledge ofboth Russia and China - and there would probably be a few questions you would like to askthe travel agent before making the booking.
4.9 Final discussionIn terms of actual Internet sales (for the year 1998) there is little to say about most of theEuropean railway operators. So, in the table below Danish Rail is shown along with thetwo North American passenger railway operators, Amtrak and VIA Rail.
130 http://minyos.its.rmit.edu.au/~tbmlc/btchina/ - http://severn.dmu.ac.uk/~mlp/beikow.html

93
Table 4.3 Internet bookings with three railway companies (1998)
DSB, Denmark Amtrak, USA VIA Rail, CanadaInternet bookings per month 3900 7000 (FY’98) 2000Web visits per month(in timetable/reservation part only)
420 000 ? 46 000
No. of timetable user sessionsper Internet-booking 107 ? 18Internet bookings per year 46 700 84 000 23 500No. of segments per Internet booking 1.5 3.0 (or 1.7?) 1.7Segments (trips) booked via net per year 70 000 253 000
(or 143 000?)40 000
Internet sales per year, $ (1998) 3.1 mill.(DKK 20 mill.)
12 million(FY’98)
1.32 million(CAD 2 mill)
Value per Internet booking $67(DKK 429)
$143 $56
Value per segment (single trip)booked over the net
$45(DKK 286)
$47.40 (or $84 ?) $33
Long-distance single trips p.a. (all channels) 8.3 million(long domestic)
21.1 million(All trips are long)
3.8 million(All trips are long)
Percentage of long-distance trips sold via net(1998)
0.8 1.2 (or 0.7 ?) 1.15
Total turnover (all channels) $1 billion (FY’98) $126 mill.Average price/trip (all channels) $47.40 $33Internet $ sales as percentage of whole 1.2 1.15Sources: Interview with DSB and published 1998 data (by month or full year) from/about Amtrak (press release, 16
September 1998) and VIA Rail (UIC Internet Club meeting, Paris, October 1998 + e-mail correspondence re.no. of segments per booking).
According to its press release of 16 September 1998, Amtrak got an average of 7000 In-ternet bookings generating $1 million in revenue per month, i.e. as much as $143 perInternet booking. The average price of a single trip (segment) sold by Amtrak was $47.40in FY’98. This means, that if the average overall segment price applies to Internet book-ings, then three segments are sold per Internet booking (which is a lot more than for VIARail in Canada, which sells only 1.7 segments per Internet booking). The other possibleexplanation is that the $143 per Internet booking covers only 1.7 segments on average,costing as much as $84 per segment.
These considerations mean that the share of the Internet for Amtrak measured on numberof segments sold may be either 0.7% or 1.2% (or something in between) - depending onwhich of the above two explanations is right. But in any case, the Internet dollar sales as apercentage of all Amtrak passenger revenue (1.2% for fiscal the year ending 30 September1998) cannot be questioned.131
The number of Internet bookings received by Amtrak is almost twice the number receivedby DSB (Danish Rail) - which is probably the railway in Europe which received the great- 131 And furthermore, Internet bookings with Amtrak will be somewhat higher in the calendar year 1998 than in the
fiscal year 1998.

94
est number of bookings via the net in 1998, and certainly the greatest percentage of Inter-net bookings. Furthermore, the average value of each net booking is twice as high forAmtrak than for DSB. Thus the Internet sales value is about four times greater for Amtrakthan for DSB.
All three railways in Table 4.3 sold about one percent of all their (long) trips via the net in1998.132 The Internet sales percentage of German Rail is not known, but it is most likelyconsiderably less than 0.1% (of long trips) in 1998. For Swedish Rail the Internet salespercentage was about 0.1% (of long trips), and for Swiss Rail much smaller.
So, as far as direct sales of railways tickets over the net are concerned, Amtrak is leadingboth in absolute and relative terms (i.e. percentage of passenger revenue generated throughthe Internet). DSB was number two in absolute terms, and VIA Rail number two in rela-tive terms. In 1998 the railways in Table 4.3 probably constituted the top three world-wideas to Internet sales of rail tickets, both in absolute and relative terms.
Table 4.4 Internet websites as ways to gain competitive advantage - via cost savingsor positive differentiation (more orders)?
Additional orders No additional ordersCost savings, break-even reached DSB, Denmark (Maybe SJ, according to writer)Cost savings, not break-even SJ, Sweden
SBB, SwitzerlandNo cost savings DB, Germany
Mobile phones have a very high penetration - as does the Internet - in all the Nordiccountries (see Table 4.5). For comparison the Internet penetration for each of the Euro-pean and a few other countries is also shown in the same table. The correlation betweenmobile phone and Internet penetration is highly significant.
132 For Amtrak and VIA Rail all trips are assumed to be long-distance - and relevant in connection with Internet
bookings. Since the average length per trip with Amtrak is as long as 414 kilometers, and 378 km for VIA Rail,this seems a very fair assumption.

95
Table 4.5 Penetration of mobile phones by total population, 1996 and 1998 - sup-plemented with Internet penetration figures for 1998
Country Mobile1996
Mobile1998
Index(‘96=100)
Internet 1998
Country Mobile1996
Mobile1998
Index(‘96=100)
Internet1998
Finland 29% 46% 159 35% Switzerland 9% 17% 189 12%
Norway 29% 41% 141 14%? UK 12% 16% 133 16%
Sweden 28% 41% 146 27% Ireland 7% 16% 229 11%
Denmark 27% 31% 115 22% Netherlands 7% 13% 186 8.3%
Iceland 18% N.A. 45%? Spain 8% 12% 150 6.6%
Italy 11% 24% 218 4,1% Germany 7% 12% 171 8.7%
Luxembourg 11% 19% 173 N.A. Belgium 5% 12% 240 4-14%?
Portugal 7% 18% 257 1.9% France 4% 12% 300 5.2%
Austria 7% 18% 257 5.5% Greece 5% 9% 180 1.0%
USA 16% ~26% ~163 28% Australia 23%
Canada 7% ~21% ~300 26% New Zealand 16%
Japan 15% ~31% ~207 9.6% Singapore 15%
Source: http://www.eto.org.uk/eustats/penetr.htm#mobiles (for mobile phones).http://www.nua.ie/surveys/how_many_on-line/ (Internet penetration figures as available end of 1998).
Note: The Internet penetration figure for Norway seems too low, and the one for Iceland too high. Published figuresfor Internet penetration in Belgium vary.
Given the data in the table it is easy to understand that both Danish Rail, Swedish Rail,Swiss Rail, German Rail and other railways (Finnish, US) as well as airline-related or-ganisations in several European countries (e.g. TISS of Germany133) are thinking of howto utilise both these communication media as different channels for distributing the samedata. In Switzerland cable TV will also be utilised as an information distribution mediumby the railway operator.
133 www.tiss.com (Travel Information Software Systems GmbH, Mr. R. Weissmann). TISS is further described in
www.europe.ibm.com/nc/customer/case17x.html.

96

97
5. Booking road and sea transport services overthe net: Express coach tickets and car rentals -with deep discounts - and booking the ferry
One thing car rentals and express coach transport have in common is that both sectors areroad based. But they operate in entirely different parts of the market. Car rentals are air-transport related and up-market, whereas coach transport is at the other end of the pricespectrum, even below rail transport. As far as the Internet is concerned, car rentals andexpress coach tickets are some of the few travel and tourism products which can be boughton the Internet directly from the principals, with a discount.
5.1 Long distance scheduled express coaches
5.1.1 Introduction to long distance express coachesAs is the case for train travel only long journeys are of relevance for Internet reservations,and international trips are of particular relevance. Therefore operators of local transport(buses, subways, commuter trains), in and around cities need not be considered here.134 InEurope - and in the rest of the world - few scheduled coach operators offer Internet reser-vations, be it for national or international trips.
The total bus and coach travel market in Europe is huge (more than £20 billion, $33 bil-lion)135 - some state up to $44 billion (probably for 1998), and it is estimated to grow by4% p.a. until 2002.136 However, in Europe only a small part of bus and coach revenue(between 2.4% and 3.4%, i.e. about 3%, vs about 8% in the US (see Appendix 5.1) is gen-erated by long-distance scheduled express coaches. Furthermore, only part of the trips bylong-distance scheduled coaches is bookable at all. In many instances, especially wheredomestic trips account for the majority of long-distance coach trips, places are (sometimesofficially) secured anyway.
134 Examples: London Transport (www.londontransport.co.uk), Greater Stockholm Local Transport - with 1200
buses operating which makes it the third largest bus operator in Sweden (Storstockholms Lokaltrafik AB, SL,www.sl.se), or the Berlin public transport company BVG (www.bvg.de/en/index.htm).
135 Arriva plc, 1999, The European Bus Market, www.arriva.co.uk/passenger/index.htp. - For comparison, the USbus and coach market is worth about US$ 19 billion p.a., about 8% of which is accounted for by long distancescheduled coaches, cf. Appendix 2.1.
136 Linjebuss AB, 1999, Ideas for the future, p. 6 of 10, in pdf-format at www.linjebuss.com/lbweb/home.nsf.

98
Some of the major private sector players in the increasingly deregulated and privatisedpublic European bus (and train) travel market are:
• CGEA Transport, owned by Vivindi, France (11 000 buses, 2500 train carriages, 28 000 employees, 600 million passengers);
• Via-GTI, another (large) French private operator of public transport (owned by Par-ibas, www.paribas.com);
• Stagecoach plc (12 000 buses, 5000 railway units, 32 000 employees);• National Express plc (15 400 employees, but just 12% of revenue - or £164 million
($272 million) - is from the continuing long-distance coach operations, cf. Figure5.1),137
• Arriva plc (8800 buses, 20 000 employees);• Go-Ahead plc (2400 buses, 8500 employees, 400 million passengers);• Metroline plc, based in London (900 buses in total - including Scottish Citylink with
75 vehicles, 2500 employees, 150 million passengers p.a.).138
5.1.2 Long distance scheduled coaches in Sweden: Svenska BussIn Sweden there are 13 000-15 000 buses, carrying about 625 million passengers p.a. onscheduled routes (part-trips, segments). Revenue generated was SEK 8.5 billion on sched-uled routes (68%) - including SEK 300 million on long-distance scheduled routes ($38million, 2.4%) - plus SEK 2 billion by non-scheduled tourist buses (16%), and SEK 2billion by non-scheduled school bus traffic (16%), i.e. SEK 12.5 billion in total ($1.6 bil-lion).
Long-distance scheduled buses in Sweden carried about three million passengers on about75 routes in 1997 and generated SEK 300 million in revenue. This means that only 0.5%or one in every 200 scheduled bus trips are long-distance (at least 100 km - whereas 5%-10% of rail trips are long-distance). However, the long-distance trips (100 km+) generated3.5% of the revenue generated by scheduled buses in Sweden in 1997 (vs typically about50% for train operators) - or 2.4% of total bus revenue. This situation - with the vast ma-jority of bus trips being short and therefore not of relevance for Internet reservations - is
137 www.hemscott.com/EQUITIES/company/cd02380.htm. Scottish Citylink, which was sold to Metroline gene-
rated £14 million in 1997. This largely corresponds to Scottish Citylink, which had £12 million in revenue inthe financial year to 31 December 1997, according to www.metroline.co.uk.
138 Some revenue figures of the major private sector players involved in buses and trains are presented in Appendix5.2.

99
no doubt also true for bus trips in other European countries.139 Furthermore, most longdistance trips by scheduled buses are domestic, which is no doubt also true for other coun-tries.140 This also contributes to limiting the scope for Internet reservations for bus travel,since pre-booking is more often required for international scheduled bus trips than fornational ones.
In Sweden, which is a country of great geographic extent, with fully deregulated expresscoach traffic as of 1 January 1999,141 and with tremendous Internet penetration, there isonly one player which offers Internet reservations, Svenska Buss.
Table 5.1 Some bus operators in Sweden - with long-distance routes - and theirwebsites
Name Owner Buses inSweden
Employeesin Sweden
Website Booking
Swebus Stagecoach, UK 3046 6200 www.swebus.se andexpress.swebus.se
No
Svenska Buss Swedish consortium svenskabuss.se YesYbuss AB Swedish owned www.ybuss.se Not yetEurolines Sweden Swedish owned www.eurolines.se NoNot long lines:Linjebuss (CGEATransport AB)
CGEA, France(www.vivendi.fr)
1800 3500 www.linjebuss.com No
Total in Sweden 13-15000 30 000, total25 000, inman-years
Relatively few of the buses are operating on long-distance scheduled routes, probably about200 on average over the week, i.e. 1.5% of the buses, and these generate about 2.4% of thetotal revenue generated by buses in scheduled and non-scheduled traffic in Sweden.
139 www.bussbranschen.se/statistik.htm, Statistics about the Swedish Bus Industry 1998 (in Swedish, 21 pp.),
published in pdf-format by the The Swedish Bus and Coach Federation (BR). According to a national Swedishtravel habit survey (RVU), also referred to by BR, the shares of various means of transport for 59.2 million longtrips of at least 100 km were as follows in 1997: car 72%, train 8% (~4.7 million ‘trips’, which - perhaps due todifferences in definitions of a trip - is considerably less than the no doubt accurate 14% share mentioned by SJin its annual accounts 1998), bus 7% (4.3 million, scheduled and non-scheduled), scheduled flights 7%, charterflights 2%, sea travel 3%, other means of transport 1%.
140 Of 8 million long-distance international trips made by Swedes p.a. (by any means of transport), 0.8 million aremade by bus. Clearly many of these international bus trips were undertaken by non-scheduled tourist buses -leaving relatively few for international scheduled buses.
141 www.bussbranschen.se/press281298.html, press release from The Swedish Bus and Coach Federation (BR) on28 December, 1998.

100
Comments to Table 5.1:1. With Swebus it is not possible to make reservations, but places in the bus are guaran-
teed anyway.2. With Svenska Buss, which operates in middle and southern Sweden, reservation is
mandatory, at least on some routes. Svenska Buss has a booking request function (as aform on the web, which can be submitted and retrieved as an e-mail).
3. With Ybuss, which operates in northern Sweden, reservations can be undertaken, butnot (yet) via the Internet.
4. With Eurolines Sweden booking is mandatory, but cannot be undertaken via the net!
Svenska Buss is a consortium of seven Swedish coach companies. Svenska Buss runsservices for 9 of the 75 long routes in Sweden (by an average over the week of about 24coaches), i.e. about 12%, which approximately corresponds to its market share of the totalmarket value of SEK 300 million p.a. ($38 million). The number of passengers is 1.6million p.a. for the market of which Svenska Buss carries about 200 000 (12.7%). Sincethe average price is about $24 per single trip, the estimated total sales of Svenska Buss are$4.8 million.
Svenska Buss started its Internet booking request function in 1997. In 1998 Svenska Bussreceived reservations for about 1.5% of its passengers via the net, and in 1999 about 3%.About 10 booking requests are received per day (by e-mail to a single/central e-mail-box),and the requests are normally also confirmed by e-mail.
The Internet revenue of Svenska Buss was about $70 000 in 1998 (1.5%), and will beabout $140 000 million in 1999 (3%).142 A real-time online booking function is notplanned for the near future.
5.1.3 Long distance scheduled coaches in NorwayIn Norway the members of Norwegian Transport Operators (TL), which represent 90% ofthe market, have among them about 6800 buses, carry 350 million passengers p.a., employ16 300 people, and have revenue of NOK 8 billion (90% of the market = $1.1 billion;100%=$1.2billion). Six groups of bus operators run 6100 buses in Norway, and employ atotal of 10 900 people.143
In Norway booking is mandatory with Nor-Way Bussekspress on international routes, butthe booking cannot be undertaken via the Internet! On national routes no booking is re-
142 This number can be verified or calculated as follows: For example 8-10 Internet bookings per day (1999), 1.8
segments per booking, 365 days per year, $24 per segment (single trip) ~ $140 000.143 www3.nho.no/transport/fakta/tabell4.htm.

101
quired, but places are guaranteed anyway. Nor-Way Bussekspress (www.nbe.no) co-operates with Eurolines in the field of advance bookings on international routes.
Links to 20 functioning bus operator sites in Norway may be found.144 On only a singleone of these can reservations be undertaken for scheduled routes, namely for the Express2000 service, which with its 2000 km (in 31 hours) is Europe’s longest combined passen-ger and cargo bus route, going from Oslo via Sweden and Finland to Nordkapp.145 Alreadyin 1998 3%-4% of the bookings for this route were received via the Internet, but unfortu-nately it will not be sold in 1999, since for part of the year (1999) the Internet-bookingfunction had been out of order. This has been fixed now, and it may be considered to givethe Internet-booking facility a more prominent position on the site, i.e. already on theentry page.
Apart from this route a couple of non-scheduled services can be booked on the net withother Norwegian bus operators.
5.1.4 Long distance scheduled coaches in Denmark and FinlandIn Denmark there is just one operator, apart from the Eurolines representative (see Table5.2) offering Internet reservations on a single one of its routes, actually the only routewhere reservation is required to secure a seat. For this single route, actually running be-tween Copenhagen and the island of Bornholm (via southern Sweden) two or three reser-vations are received via the Internet per day.146
In Finland there is an organisation called ExpressBus, which is a consortium of 30 expressbus companies. ExpressBus has about 1000 employees and 200 buses. It has a website(www.expressbus.com) with timetables, but no Internet reservations can be undertaken,not even on the route Turku-Helsinki-St. Petersburg. On that route reservations are rec-ommended, but have to be made by phone or fax. ExpressBus co-operates with Eurolines,since ExpressBus refers to Eurolines offices for reservations made from Western Europe.
With another Finnish bus operator, Onni Vilkas Ltd. (FIM40 million in total revenue p.a.~ $7.5 million, about 140 employees), reservations for the route Helsinki-St. Petersburgcan be requested via the site www.onnivilkas.planet.fi/. Payment cannot be undertakenonline. So far Onnivilkas receives very few Internet bookings (just one or two per day in1999), but the number is increasing. Much of the travel on the route are by groups, andmost of the reservations are received via travel agents, who typically provide the list ofpassengers to Onni Vilkas by fax. In future greater efforts will be put into Internet mar-
144 http://kvasir.sol.no/no/biz/branch/trans/bus/.145 http://sarah.trollnet.no/express2000/. Prices provided in pdf-format (NOK2800, return).146 www.graahundbus.dk/bestil.htm - Graahundbus is actually a direct translation of Greyhound.

102
keting, including design and basic things like getting the site registered in all relevantsearch engines, etc.No other bus operator in Finland offers Internet reservations.147
5.1.5 The UK and GermanyIn the UK, National Express (Eurolines UK) is the only operator of long-distance nationaland international coach trips which can be booked via the net (see chapter 5.1.7).148
However:• www.speedlink.co.uk (actually also run by National Express) has a special Internet
offer: pay £15 instead of £17 if you book your Heathrow-Gatwick or Gatwick-Heathrowtrip on the web. Payment is by credit card. Internet bookings have to be undertakenfour days before the trip to receive the coach tickets by mail in time within the UK, 11days before elsewhere.
• www.airbus.co.uk offer Internet reservations of the Airbus hotel shuttle, with paymentby credit card.
Furthermore:• www.busabout.com/ offers passes for unlimited travel between 60 European cities and
towns. These can be booked on the net, and paid for by credit card.• www.m-line.co.uk offers holiday packages from Scotland to Disneyland Paris, which
can be booked via the net, but obviously this is not a standard scheduled internationalcoach service.
In Germany there appears to be no other international scheduled bus operator (on the net)than the Eurolines member mentioned in Table 5.2, and this operator does not offer Inter-net bookings.149
5.1.6 The Eurolines organisationEurolines is Europe’s largest and best-connected scheduled coach operator. It connectsover 500 cities in 25 Western and Eastern European countries. The Eurolines organisationconsists of more than 35 European bus operators, which work independently of each othertowards a common goal: one European bus route network - with high quality and lowprices. The concept is similar to that of Greyhound in the US, which is a single corpora-
147 www.evreka.com/c/biz/branch/trans/bus/; www.annells.demon.co.uk/busstn.htm (links by country world-wide,
e.g. Finland).148 http://travel.world.co.uk/coaches.htm and www.pti.org.uk/docs/coach.htm. None of the members of the large
UK- based Stagecoach group offers Internet bookings. Neither does Scottish Citylink Coaches.149 www.deutsche-touring.com, cf. www.tii.de/index-oj.html (Busreisen) and
www.annells.demon.co.uk/busstn.htm (Germany).

103
tion, however. The members of the Eurolines organisation carries 3.5 million passengersper year.150 It must be assumed that this number mainly comprises international (single)trips, i.e. trips which are of relevance in connection with Internet reservations.
One would expect the Eurolines representatives to be at the forefront in Europe with re-spect to the possibilities of making Internet reservations, since in many countries the na-tional Eurolines members seems to be the main - or at least one of the main - long distance(international) scheduled coach operators. All the national sites of Eurolines have beenvisited to check if reservations can be made at any of the national sites.
Table 5.2 National websites of the Eurolines organisation
Country Website Timetables Reservations Payment1. UK www.eurolines.co.uk or
.nationalexpress.co.uk Yes Yes Yes
2. France www.eurolines.fr Yes Yes 3. Denmark .thinggaard-rejser.dk/ Yes Yes 4. Austria www.eurolines.at Yes 5. Germany .deutsche-touring.com Yes 6. Ireland www.buseireann.ie Yes 7. Italy www.eurolines.it Yes 8. Spain www.eurolines.es
www.enatcar.es Yes Yes
9. Sweden www.eurolines.se Yes 10. Switzerland .eurolines-schweiz.ch Yes 11. Netherlands www.eurolines.nl Only some 12. Belgium Only e-mail box 13. Portugal No site, no e-mail boxW. Europe in total 11 of 13 10 of 13 3 of 13 1 of 13+ 12 East Europeancountries and Turkey
5 of 12 in EasternEurope have functioningwebsites.
4 of 12 1 of 12 None
Note: In the case of Spain there are two members of the Eurolines organisation. The general site for the Eurolinesorganisation is www.eurolines.com, from which there are links to the national sites.
In 11 of 13 countries in Western Europe the Eurolines representative has a website. In allcases except one this comprises timetables. Only on three of these national Eurolines sitesis it possible to make reservations. And only in one instance is it possible to make pay-ments on-line.
About the Eastern European Eurolines sites:1) The Polish Eurolines site includes interactive timetables. No booking function
as such, but with the possibility to submit a relatively free-format enquiry fromthe website.
2) The Czech Eurolines site includes timetables. No booking function.
150 www.eurolines-schweiz.ch.

104
3) The Croatian site includes timetables (and it also includes Bosnian destina-tions), with chosen routes appearing on an interactive map. No booking func-tion.
4) It appears to be possible to submit reservation requests on the Bosnian Eu-rolines site, but there appear to be no time schedules!
5) The Estonian Eurolines site includes some static timetables. No booking func-tion.
6-7-8) The Latvian, Slovakian, and Yugoslavian Eurolines sites do not function.9-10-11) Eurolines in Hungary, Romania and Turkey have no websites, but do have an
e-mail box.12) Eurolines in Bulgaria has no website, and no e-mail box.
Outside the auspices of the Eurolines organisation few other European bus operators offerInternet reservations, namely one major player in Sweden, a single (cross-border) route inDenmark, one (cross-border) in Finland, one in Norway (also cross-border), two airbusesin the London area (one of which is owned by National Express), and none in Germany.Given the high Internet penetration in the Nordic countries, Eurolines in Sweden and theassociates of Eurolines in Norway and Finland ought to establish Internet reservation fa-cilities as soon as possible. It would be convenient for those planning multi-destinationinternational trips by Eurolines if there were an Internet-based timetable covering all theEuropean countries and destinations serviced by Eurolines, not least since it is possible tobuy a ticket (the Eurolines Pass) which is valid for a certain number of days covering allthe countries. For a start the proposed timetable should cover the 48 cities in the 21 coun-tries for which the pass is valid. Since the number of cities included is fairly limited, itshould be quite simple to construct such an Internet-based timetable. It should of course bepossible to buy the Pass as well as individual tickets as an integrated part of the proposedEurope-wide timetables.
5.1.7 National Express/Eurolines UK - coachesThe National Express Group PLC had 15 427 employees in 1997, and revenue was £1.13billion ($2.2 billion), which increased to £1.32 billion in 1998; 1) 69% of which was gen-erated by train services; 2) 2.5% by airport services; 3) 15% by buses; and 4) 13% by ex-press coach services.
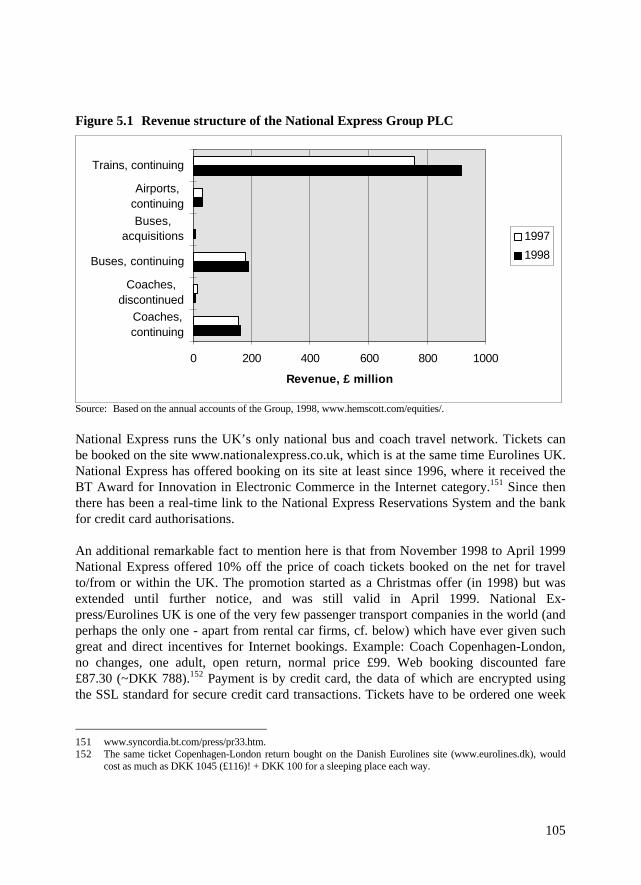
105
Figure 5.1 Revenue structure of the National Express Group PLC
0 200 400 600 800 1000
Coaches,continuing
Coaches,discontinued
Buses, continuing
Buses,acquisitions
Airports,continuing
Trains, continuing
Revenue, £ million
1997
1998
Source: Based on the annual accounts of the Group, 1998, www.hemscott.com/equities/.
National Express runs the UK’s only national bus and coach travel network. Tickets canbe booked on the site www.nationalexpress.co.uk, which is at the same time Eurolines UK.National Express has offered booking on its site at least since 1996, where it received theBT Award for Innovation in Electronic Commerce in the Internet category.151 Since thenthere has been a real-time link to the National Express Reservations System and the bankfor credit card authorisations.
An additional remarkable fact to mention here is that from November 1998 to April 1999National Express offered 10% off the price of coach tickets booked on the net for travelto/from or within the UK. The promotion started as a Christmas offer (in 1998) but wasextended until further notice, and was still valid in April 1999. National Ex-press/Eurolines UK is one of the very few passenger transport companies in the world (andperhaps the only one - apart from rental car firms, cf. below) which have ever given suchgreat and direct incentives for Internet bookings. Example: Coach Copenhagen-London,no changes, one adult, open return, normal price £99. Web booking discounted fare£87.30 (~DKK 788).152 Payment is by credit card, the data of which are encrypted usingthe SSL standard for secure credit card transactions. Tickets have to be ordered one week
151 www.syncordia.bt.com/press/pr33.htm.152 The same ticket Copenhagen-London return bought on the Danish Eurolines site (www.eurolines.dk), would
cost as much as DKK 1045 (£116)! + DKK 100 for a sleeping place each way.

106
before departure for airmail from the UK to continental Europe. The route network ofEurolines covers much of Europe and seems to be an up-front competitor to rail travel.
As an additional promotion, from January to March 1999, those over 50 could travel any-where around Britain on the National Express network with an Advantage 50 Coachcard(sold at £8 p.a.) for just £9.99 return - less 10% for Internet bookings. There is only oneother European example from the passenger transport sector of discounts given for ordersplaced over the net. This is Europcar, which will be discussed in 5.2.2.
National Express (Eurolines UK) is set to reach £1 million in Internet sales in 1999 ($1.6million), up from £300 000 ($500 000) in 1998.153 The Internet investment of NationalExpress was minimal, and had paid for itself several times by the middle of 1999.
5.1.8 Greyhound Lines, USA, Greyhound Canada - and Greyhound Pioneer Australia
A low cost competitor of Amtrak in the US is Greyhound Lines (the only nationwide pro-vider of scheduled intercity bus services in the country). It has about the same number ofpassengers (single trips) per year as Amtrak, namely 22.6 million (1998), with an averagelength per trip of 540 km (vs only 414 for Amtrak) at a lower average price per trip ($32per bus trip vs $47 per train trip). Greyhound Lines thus carries many more passengersp.a. than the entire Eurolines organisation (21 million vs only 3.5 million). The typicalGreyhound passenger travels to visit friends and relatives. Greyhound Lines is based inDallas, Texas and has 13 400 employees in the US and Canada, runs 2700 buses, andgenerated total operating revenues of $846 million in 1998.
For comparison the continuing coach operation of National Express of the UK was £164million ($272 million), i.e. about a third as much as for Greyhounds Lines, and ScottishCitylink, the discontinued coach business of National Express, generated another £12million ($20 million) in the full year 1997. National Express + Scottish Citylink thusgenerated almost $300 million in revenue p.a., which is 35% of Greyhound Lines. Sincethe population of the UK (59 million) only correspond to 22% of the population of theUSA (267 million), it appears that the market leaders in the UK have a relatively stronggrip of the travellers in their markets, even stronger than Greyhound Lines in the US.
The Greyhound site contains convenient interactive timetables. From May 1999 it hasbeen possible to buy Ameripasses online (for a certain number of days: 7, 15, 30, 60)which are valid on Greyhound Lines. Online orders must be placed not later than two
153 The 1999 Internet revenue figure corresponds to about 0.22% of the total coach service revenue of National
Express Group PLC. Two thirds of the revenue of the Group is generated by train services, and the remainingthird by coaches.

107
weeks before the first day of travelling, and paid for by credit card.154 By August 1999Greyhound Lines had not yet started selling ordinary tickets via the net. The explanationcould be that the typical Greyhound passenger has a relatively low income, and some arenot Internet users. Students, who also have low incomes, are Internet users, but they maynot have a credit card. And The majority of Greyhound Lines’ customers usually make thedecision to take a trip only a short time before actually travelling and, for the most part,pay cash for their tickets on the day of departure.155 Greyhound plans to start sellingpoint-to-point tickets through the Internet during the last months of 1999.156
On March 16, 1999, the shareholders of Greyhound Lines, Inc. approved a merger of thecompany with Laidlaw, Inc. As a result, Greyhound is now a wholly owned subsidiary ofLaidlaw Inc., Burlington, Ontario, Canada. Laidlaw had already acquired GreyhoundCanada Transportation Corporation in 1997. Greyhound of the US and Greyhound Canadaare thus different companies, but with the same owner. Greyhound Canada, is Canada'slargest inter-city bus company, with 1750 employees, nearly 400 coaches, carrying morethan 2 million passengers p.a., revenue of CAD 140 (US$ 90 million) and has a website ofits own with interactive timetables and associated prices, but with no possibility to buypasses or point-to-point tickets.
Down under totally outside the auspices of Greyhound Lines or Laidlaw there is a com-pany called Greyhound Pioneer Australia Ltd which is the country’s only national coachcompany. It has been operating since 1905, which is longer than Greyhound Lines in theUS. Revenue for Greyhound Pioneer was AUD71.2 million (US$ 44 million) in 1998.Greyhound Pioneer has recently split its operations into three divisions, one of which is e-Tourism Pty Ltd, which among other things will conduct the group’s rapidly growingInternet retail business.157 Greyhound Pioneer has a booking request form on its site.158
The facility was not available in 1998 and has only been functional since the re-launch ofGreyhound Pioneer Australia's new site in February 1999. The booking page receives onaverage over 1500 hits per month (1999), which varies by season, but the resulting numberof Internet bookings is not tracked at the moment. At this stage Greyhound PioneerAustralia does not offer real-time booking facilities but will be able to offer this facility toits users in the near future. When the real-time booking facility is introduced, GreyhoundPioneer will be able to track revenue generated via the Internet more accurately.159
154 Greyhound press release, 21 May 1999.155 http://www.greyhound.com/Company/reports.html - 1997 10K Report.156 Greyhound Today, July 1999, www.greyhound.com/Company/GHToday/1999/Jul99/index.htm.157 McCarthy, John, 1999, Greyhound streamlines, Courier Mail (newspaper), 12 May,
www.greyhound.com.au/mediareleases.htm. - In the spring of 1999 Greyhound Pioneer commissioned a newAUD2.5 million IT system called GYRO, the first application of which will be for seat reservations (cf. pressrelease dated 30 March, www.greyhound.com.au/gyrolive.htm).
158 www.greyhound.com.au/bookingform.htm.159 Mr. Aldwin Quizon, Market Research Officer, Greyhound Pioneer Australia.

108
5.1.9 Summary: Status and outlook in Europe and elsewhere for sales of tickets for and reservation of long-distance coaches on the net
The market value for travel by long distance scheduled coaches may be about $1.4 billionin Western Europe (1998) with significant market growth expected. In the US and Can-ada, where the market for these services is at least as large as in Europe, sales via theInternet of this service were nil in 1998, since the market leaders had not yet started sell-ing via the net, but the one in Australia had.160 In Europe National Express in the UK didachieve some Internet sales already in 1998 ($0.5 million), which will triple in 1999. Tothis can be added Internet sales of other European long-distance scheduled coach operatorssuch as Svenska Buss in Sweden (almost $0.1 million in 1998), Eurolines in France andDenmark and a few individual cross-border lines in the Nordic countries, i.e. about $1million in total.
Among those few players anywhere in the world in the field of long-distance scheduledcoach travel by August 1999, National Express in the UK was still the one who had madea real-time link to internal reservation system. But before the end of 1999 GreyhoundLines in the US will have implemented a solution for point-to-point tickets, which onemust assume will be fully integrated as well, and Greyhound Pioneer Australia will also beimplementing an online real-time booking function in the near future. Internet sales inpercentage of the total European market for long-distance scheduled coach travel werequite insignificant in 1998 (probably not much more than 0.05%, i.e. practically nothing),will remain rather small in 1999, perhaps staying below 1% for many years to come, inspite of the increases by players such as National Express and Svenska Buss, and a fewoperators of international coach routes in Europe (most likely from the Nordic countries).However, two qualifications should be made:1) If looking at Internet bookings for International coach routes only, the Internet sales
percentage would of course look much more favourable.2) And if looking at all Internet bookings for national and international coach trips, it
would be fairer to put them in relation to the pre-booked long-distance coach tripsonly, since the national long-distance coach trips (which account for most long-distance coach trips) are frequently not pre-booked (if pre-booking is at all possible ornecessary).
160 http://magellan.excite.com/travel/transportation/bus and www.prairienet.org/~scruffy/bus.htm. - One regional
scheduled coach service operator in Eastern Canada (SMT Bus) does have a ticket order facility on its site,www.smtbus.com/. - In the US tour coach market, the National Motorcoach Network does have a request forcoach charter quote form on its site.

109
5.2 Car rentals
5.2.1 Brief introduction to the car rental industryWorld-wide the car rental industry is heavily dominated by about 10 major US brands, cf.the following two diagrams and further details in Appendix 5.2.
Figure 5.2 Market shares by value in the $16.4 billion US car rental market (1997)
AutoNation: National+Alamo+
CarTemps20%
Enterprise19%
Hertz16%
Avis12%
Budget10%
Dollar4%
Thrifty2%
Others17%

110
Figure 5.3 Approximate shares of the $6 billion European car rental market (1997)
Avis14%
Europcar12%
Budget11%
Sixt10%Hertz
9%
Others36%
Thrifty3%
AutoNation: Eurodollar+Alamo
5%
The car rental industry is closely related to air transport, about two thirds of the revenuebeing airport related. Since air transport (e.g. measured by passengers carried) is veryimportant in the US, the car rental business is huge in the US, worth $16.4 billion in 1997,of which Hertz holds a share of about 16%. Hertz is the No. 1 car rental company in theUS and world-wide.
Hertz had car rental revenue of $3.4 billion in 1997, globally. About 75% of this is fromthe US ($2.56 billion), and 25% for international car rentals, with Europe accounting forthe majority, perhaps 20% (up to 4/5 of the 25%), i.e. about $684 million in car rentalrevenue in Europe in 1997. This makes Hertz number three in Europe. Avis Europe andEuropcar are number 1 and 2 in Europe (with $850 million and $740 million in car rentalrevenue in 1997, respectively). Hertz, which gets 80% of its car rental revenue from theimportant airport-related rental business, claims to have a leading (30%) share of airport-based car rentals both in the US and Europe, but has provided no geographic breakdown ofits global revenue. However, according to its own statement: Hertz is the third largestequipment rental company in France. In any case, the top three car rental companies in

111
Europe had car rental revenue of $2.27 billion in 1997, i.e. 28% of the assumed marketsize of $8 billion, which is certainly a maximum.
In the US the following car rental companies offer 20% off for Internet bookings:• Hertz www.hertz.com• Dollar www.dollar.com• Alamo www.bnm.com/alamo.htm - www.goalamo.com
5.2.2 Europcar International - emphasising Europcar GermanyEuropcar offers all-round car rental services. Europcar International, including EuropcarGermany, is owned jointly by Accor of France and Volkswagen of Germany. Accor statesthat Europcar holds the number two position in the European car rental market.161 Thisconfirms what was written in the previous section and shown in Figure 5.3 for the year1997. It is Europcar’s aim to become number one in Europe and it did make two acquisi-tions in 1998, namely British Car Rental and Trade Car AS in Norway.162
The history of Europcar Germany (Europcar Autovermietung GmbH) goes back to 1927,which is longer than Europcar France which was founded in 1949. Europcar Germany has1513 employees. With 420 stations in Germany (June 1999: 491) - out of a total of 2400Europcar stations in Europe (+Africa and the Middle East) - Europcar has the tightestservice network among the car rental firms in Germany.163 Europcar Germany has about26 000 vehicles (1998).164 This great number of vehicles - seen in relation to the totalnumber of vehicles (in 1997 and 1998) - as well as the fact that Europcar has more sta-tions in Germany than it has in any other country, shows the importance of the Germanmarket for Europcar. Of all Europcar stations 80% are in Western Europe (Germany 20%,France 15%), 6% in Eastern Europe and Turkey, and about 14% in the rest of the world(Africa, Middle East/India).
The number of leased vehicles (i.e. the number of renting contracts or reservations) in-creased by 19% from 1997 to 1998 (from 3.7 to 4.4 million), and revenue increased by15% (fwv). The fleet now comprises 116 000 cars and trucks (up from 78 000 in 1997).
161 www.accor.com/finance/le_groupe/activities.htm (Profile and Car Rental).162 www.accor.com/.163 For comparison, Sixt has 360 stations in Germany. Sixt appears to be Europcar’s greatest competitor on the
German market. Sixt claims to have the following market share in Germany, probably measured by car rentalrevenue: 1996: 4%; 1997: 29%; 1998: 31% (www.sixt.com). By this measure Sixt believes it is leading inGermany. According to www.fvw.de/ - 29 April 1999 – Avis holds a market share in Germany of 12.4%. Ob-viously Avis is a main competitors to Europcar, also in Germany. According to the fvw source, Avis is devel-oping a German website for direct Internet bookings.
164 www.sinner-schrader.de/proj_europcar_main.html.

112
Europcar is currently affiliated with Dollar Rent a Car in the US.165 Europcar’s largestmarkets in Europe, also by rental revenue, are Germany and France.
Figure 5.4 Number of Europcar rental stations by country (1999)
0 50 100 150 200 250 300 350 400 450 500
Germany
France
Spain
UK
Italy
Norway
Sweden
Greece
Portugal
Switzerland
Finland
Denmark
Netherlands
Belgium
Rest W.Europe
E.Europe & Turkey
Rest of world
Source: Based on www.europcar.com, June 1999.
Europcar International has an integrated electronic reservations system called Greenway,which is linked to all the major GDSs (Amadeus, Galileo, Sabre and Worldspan) used by
165 The agreement came into effect on 1 February 1998 (www.accor.com/ACCOR/english/3.htm). However,
according to www.fvw.de, it appears that the agreement will end on 1 March 2000, and therefore Europcar isnow looking for another US partner:(www.fvw.de/archive/member/news/data/news.924020931.8282.html; FVW, Autovermieter: Dollar wechseltzu Sixt).

113
travel agents and airlines.166 Cap Gemini will be further developing the reservations sys-tem of Europcar International during the next five years (according to fvw).
The europcar.de site was opened in July 1998. It functions exclusively in German. It ispossible to make reservations for cars with pick-up and return within Germany, but thesite can of course also be used by non-Germans - provided they speak a bit of German - tomake car reservations for their visit to Germany.
Europcar Germany gives up to 46% discount for Internet bookings. This is the deepestInternet discount known to the writer. Currently, there are very few examples of discountsfor Internet bookings anywhere in the passenger transport sector in Europe or in the US.The 10% discount which the long distance coach operator National Express of the UKgives for Internet bookings is the only other European example from the passenger trans-port sector known to the writer. None of the top 20 North American airlines or train orcoach operators (Amtrak, Via Rail, Greyhound) gives up front discounts for Internetbookings. But two of the top three car rental companies (Hertz and Budget, but not Avis)did offer 20% discount for Internet reservations in North America.167
Apart from the discount mentioned above, Europcar Germany offers extra frequent flyermiles as an incentive for making Internet bookings. This is done in co-operation betweenEuropcar and the Lufthansa Miles & More Frequent Traveller Programme. The initiativestarted on 1 April 1999.168 From time to time extra miles will be given for Europcar Inter-net reservations. Furthermore, co-operation between German Rail and Europcar will beintensified. From the summer of 1999 the new commuter trains between Hamburg andCologne will be fitted with Europcar reservation terminals (according to www.fvw.de).One would guess that this will be Internet-based in some way.
An Internet user who wants to rent a car in Germany can actually do this in one of twodifferent ways: either by going through the general Europcar site, www.europcar.com, orby going to the separate German site, www.europcar.de. Let us try to make a reservation
166 www.europcar.com/english/is_emain.htm. More about Greenway can be read at:
www.sequent.com/customers/profiles/europcar.html (Europcar. Sequent’s NUMACenter Platform StreamlineOperational Functions, 13 April 1999: The resulting implementation is one of the largest centralised Oracleclient/server database sites in the world, supporting more than 4000 workstations and 3000 concurrent users. Itincludes three distinct solutions: a revenue management system, a proprietary application known as Greenway,and an Oracle Financials migration). Some earlier material can be found atwww.oracle.com.sg/corporate/press/html/europcar.html (3 April 1995, from a meeting in Italy of the EuropeanOracle Users Group).
167 www.hertz.com; www.drivebudget.com; www.avis.com; www.avis-europe.com.168 Press release from Europcar Germany, 7 March 1999, www.europcar.com/english/ps_e03n1.htm. This is a
general initiative, not only relating to Internet reservations. Europcar International does have a Loyalty Pro-gramme for frequent drivers of its own, which is currently available to Belgian, French, Spanish and UK resi-dents.

114
for tomorrow (Friday) for 24 hours from 9.00 a.m., pickup and return of the car in centralHamburg. First we try the europcar.com site, giving a variety of different countries ofresidence, and afterwards we try out the europcar.de site (the German one).
1) First the Europcar International site: to say the very least it makes a lot of differencewhat country of residence one states on the europcar.com rate information and reservationprocedure, ranging from a high of DM 203 to a low of DM 113 for identical offers (seeAppendix 5.4). While we keep wondering why there is such great difference in price forthe same offer (data, car type, pick-up and return stations) to people from different coun-tries of residence, let us go on to the europcar.de site.
2) Now the Europcar Germany site: the cheapest offer made by the europcar.de site is DM54 for an Opel Corsa at EasyDrive rate + DM 43 for full hull insurance (collision damagewaiver, CDW), i.e. DM 97 in total - for exactly the same car type (two-door economy, i.e.the Opel Corsa), same period and same pick-up and return station as above.169 None of theabove attempts on the europcar.com site gave as low a price. Those who access the europ-car.de site can be confident that they are getting at least as low or lower rates as those whoaccess the europcar.com site for Europcar rentals in Germany.
For the Opel Corsa it was stated on the euopcar.de site that it was not necessary to checkavailability. This is also the case for most other car types - irrespective of pick-up andreturn station.170 But for two of the luxury cars types, availability has to be checked byEuropcar Germany, who subsequently report back to the Internet user - irrespective ofstations.171 This shows that the Europcar Germany Webserver is not directly linked to theEuropcar Germany or Europcar International central computerised reservation system(Greenway). Internet reservations with Europcar Germany are on-line in the sense thatthey are undertaken via the Internet, but these Internet reservations are not preceded by areal-time check of the availability data (in Greenway).
Europcar Germany does gain a lot of new business via the Internet. The clients save timeand money, and so does Europcar. Today customers expect a lot more from a car rental (orother travel) website than just a basic information-only site.
169 The next cheapest rate is DM 71 for a VW Polo + DM 43 for full insurance, i.e. DM 114 in total.170 Including the first of thee types in the luxury class, the Mercedes E 240: Für dieses Fahrzeug ist keine Prüfung
der Verfügbarkeit notwendig.171 For the Mercedes E 290 TD and the Mercedes S 320: Bitte haben Sie Verständnis, daß wir prüfen müssen, ob
dieses Fahrzeug gemäß Ihrem Wunsch zur Verfügung gestellt werden kann. Wir werden uns in Kürze beiIhnen melden.

115
In future Europcar in Germany expects to receive 15% of its bookings via the net.172 Theyear in which Europcar hopes to achieve this is not specified - but one would guess thatthe goal is for around 2002 (plus or minus one year). Europcar Germany regards the In-ternet as something which is becoming more important that anything else within theEuropean car rental industry.
5.3 European international ferry lines
5.3.1 Overview of European international ferry lines on the netThere are many European ferry lines with websites, of which we shall concentrate on 21 -all of which had already established websites in 1998.173 In 1998 eight of these (38%) hadimplemented some kind of Internet-based booking facilities on their sites, typically on arequest basis. Only two lines (10%) had online availability data for ferry reservations forcars on their sites in 1998.174 This was Stena Line (on their Scandinavian routes, not thosearound the British Isles) and Scandlines A/S (Denmark). In the middle of 1999 13 (62%)had implemented Internet booking facilities, and five (24%) now offer real-time availabil-ity data on their sites. In 1998 none of the ferry operators offered payments online, but inthe middle of 1999 four (19%) do, all by taking credit card details via the SSL encryptedpart of their sites.
172 www.fvw.de, Europcar: Buchung via Internet (April 1999), and
www.sinner-schrader.de/proj_europcar_main.html, (May 1999). In some sources the goal is even stated as15%-20% in the next few years.
173 A more comprehensive list can be found at www.budgettravel.com/eurofery.htm.174 In addition to this it can be mentioned that BornholmsTrafikken has established a booking request function for
their package tours to the island of Bornholm in the Baltic Sea.

116
Table 5.3 European international ferry lines on the net and their booking function-ality (if any)
Ferry line Website address Real-timeavailability
Internetbooking
Paymenton-line
1 Stena Line, Sweden www.stenaline.com(one site in six versions)
Yes Yes No: 5Yes: 1 (‘99)
2 Scandlines A/S, DK www.scandlines.dk Yes Yes No3 Scandlines, Germany & Sweden www.scandlines.de + .se Yes (’99) Yes (’99) No4 Irish Ferries, Rep. Ireland www.irishferries.ie Yes (’99) Yes (’99) Yes (’99)5 Corsica-Elba-Sadinia, France www.corsicaferries.com Yes (’99) Yes (’99) Yes (’99)6 Condor Ferries, UK www.condorferries.co.uk Yes (’99) Yes (’99)7 Superfast Ferries, Greece www.superfast.com Yes (’99) No8 BornholmsTrafikken, DK www.bornholmsferries.dk Yes No9 Brittany Ferries, France www.brittany-ferries.fr Yes * No10 Color Line, Norway www.colorline.no Yes No11 Hover Speed Ferries www.hoverspeed.co.uk Yes No12 Minoan, Greece www.minoan.gr Yes No13 P&O European Ferries www.poef.com Yes No14 Caledonian Macbrayne www.calmac.co.uk15 Caremar, Italy http://saremar.gestelnet.it/
caremar.html16 Ferrimaroc www.ferrimaroc.com17 Fjord Line, Norway hanstholmhavn.dk/fjordline18 Polferries www.polferries.com.pl19 Scandinavian Seaways (DFDS) www.scansea.com20 Silja Line, Finland www.silja.fi21 Smyril Line, Faroe Islands www.smyril-line.foNote: * Also a free telephone call back service (send an e-mail requesting a call).
The starting point in identifying the above international ferry websites was a list of 22selected European ferry companies’ websites in a Masters Thesis by Fink (1998). How-ever, Irish Ferries was not on Fink’s list (search undertaken in May 1998), but has beenadded by the writer (which makes 23), and the real-time availability column has beenadded as well. On the other hand two sites were no longer in operation.175 This leaves 21on the list, which is not a ranking per se. Clearly, the advantages of using a 1998-list asthe starting point is the possibility of documenting the swift development which has takenplace in this field.
In 1998 it was not possible to make a booking for the Corsica-Sardinia ferries. But from1999 it is:
175 Isnase (Spain) has been omitted, since the server www.isnase.es could not be located by the browser. The same
goes for Deutsche Seerederei (www.de.rostock.de), which now only exists as a trade name since the line wastaken over by Reederei F. Laeisz of Hamburg as of 1 January 1999 and a new website has not yet been estab-lished.

117
Welcome to the Online Booking System! You can book now your journey by the SSL security system(secure socket layer), which encrypts all credit card payments over the web.
Condor Ferries has recently implemented a booking request function:
You have now entered the Condor Ferries Secure Socket Layer. All information you enter in your browserwill be encrypted using Stronghold Secure SSL. Click on: BOOK NOW. Note: When we receive your com-pleted form, we will contact you to arrange payment details (if you are paying by cash or cheque) and to con-firm that there are seats available for your required sailing. Credit Card details are sent via a Secure Server(SSL).
Superfast Ferries, which is an operator sailing between Italy and Greece, currently onlyhas a booking request form at its site, but is working on establishing real-time Internetbookings, according to information provided on the site.
5.3.2 Stena Line, Sweden (Scandinavia and the British Isles)Stena Line is one of the world’s largest ferry companies. It has 12 ferry routes in Scandi-navia and around the UK. Stena has a 40% proprietary share of P&O Stena Line(including the routes Dover-Calais and Newhaven-Dieppe in the English Channel). Reve-nue, excluding English Channel Operations, was SEK 7.55 billion in 1998 ($950 million).There were 6554 employees in the Stena Line Group on average during 1998 (excl. Eng-lish Channel routes). In 1998 Stena carried five million passengers in Scandinavia, andanother five million around the UK (excl. 0.5 million on the Channel routes). In 1998Stena Line also carried 833 000 passenger cars on Scandinavian routes, and additionally948 000 on routes around the UK (excl. Channel routes), i.e. 1.8 million in total. We willassume the same numbers for 1999.

118
Figure 5.5 Interactive route map of Stena Line
Source: www.stenaline.se/.
Stena Line Sweden opened the first version of its website in March 1996. In the beginningit just provided information, but it has become increasingly commercial. A booking func-tion for cars was implemented in June 1998. The site also includes destination informationamong other things. The booking dialogue is interactive but there are no general searchfunctions on the site. Payment is settled off-line (by invoice) on all language versions ofthe site except on the British version, where payment is by credit card. So, technically it isobviously no problem to enable payment by credit card via the net.
On the entry page of www.stenaline.com/ the Internet user gets a choice between one ofsix languages. From the beginning of 1999 it became possible to make reservations fromall the six versions of the site. However, Scandinavians can only make Internet reserva-tions on routes on the right hand side of Figure 5.5, Britons only for those on the left handside, but for Germans and Dutch it is possible to make car reservations on all the StenaLine routes shown in Figure 5.5.
For 1998, there were about 100 reservations per week for 30 active weeks = 3000 Internet-reservations. Sixty-five percent of these were car reservations, and the rest for passengersonly. There were about 1.8 car crossings per Internet reservation. And twice this numberfor passenger-only reservations, since the average party is about two.

119
From the beginning of 1999 all the different language versions of the booking site wereactive. During the first six months of 1999, which is the period the UK version of theStena booking site was opened, there were steady and big increases in interest from UKmarket for making Internet reservations.
In June 1999 Stena Line received a record high number of car ferry reservations via thenet: 500 reservations, typically return trips. More than half of these were made by Swedes.It would probably be too optimistic to use that record week as an estimate of the averagefor 1999, so let us guess at 400 reservations per week as an average for all of 1999. Aconservative estimate for 1999 is the following: 400 reservations per week x 52 weeks =20 800 Internet-reservations, 65% of which are for cars. This will correspond to about1.5% of all those car reservations which are made.
For the year 2001 Stena Line predicts that it will receive 10% of its car reservations viathe net. So, for the year 2000 we must assume that it will be about 6%.
As with other modes of transport, ferry reservations are considered well suited to the In-ternet medium. Stena Line has received additional orders because of its site, and is savingcosts when customers use the site. The marginal costs in connection with taking an Inter-net booking are practically zero. The cost of taking a reservation over the phone is notknown by Stena. The writer’s guess is that it could be SEK 40 ($5), which then equals thesavings per Internet reservation. Stena Line has not reached break-even for its Internetinvestment, as shown below. The initial investment with establishing the booking functionalone was about SEK 3.5 million (almost SEK 0.5 million). To this should be added thecosts of establishing all the rest of the site (mainly text-based), but these costs are notknown (writer’s guess: another SEK 3.5 million). The annual maintenance costs are aboutSEK 2 million for the time being, but as the site is extended and is being considered amore mainstream part of the general marketing mix, the annual costs could rise to asmuch as SEK 10 million. Based on these statements and additional assumptions, as statedin Appendix 5.5, a break-even chart can be drafted. As can be seen from the graph, if thepredictions hold true, Stena Line will reach break-even for its Internet investment by theend of the year 2000.

120
Figure 5.6 Break-even chart of Stena Line’s Internet investment (in $ mill.)
0
1
2
3
4
1998 1999 2000 2001
Savings + extra GP,accumulated, in $ mill.
Investment + recurrentcosts, acc., in $ mill.
Note: Based on data, estimates, assumptions and forecasts as outlined in Appendix 5.5. Interest has not been takeninto account.
Stena Line currently gives no discount or other incentives for Internet reservations, butrelies on the convenience benefit for the Internet user. Later, when Stena Line has intro-duced its loyalty programme, there may be extra sea-miles for Internet reservations. But noup-front discounts for net bookings will be offered in the foreseeable future.
The internal reservation system (legacy system) of Stena Line dates from 1985, and is atraditional mainframe-based system. The Web server runs in a Microsoft environment, andis connected (integrated) with the internal reservation system (via a fire-wall betweenthem). The basic elements of an in-house-based Internet booking system like that of Stenais shown in the diagram below. A more detailed version, specifically for Stena, is shown inAppendix 5.6.

121
Figure 5.7 Basic elements of an in-house based Internet booking system
Firewall
Legacy system Web-server Internet us-ers (in house) (in house)
Planned extensions for the near future include:1) A booking function of agents.2) Adapting the loyalty programme to Internet reservations.3) General updating and refreshing of the site.In the more distant future the following will be undertaken:4) Extension of the freight booking part of the site.5) Adoption of the concept of relationship marketing.176
Stena Line considers itself to be among the top five or 10 travel and tourism firms in Swe-den in terms of Internet sales (both in 1998 and in 1999).
5.3.3 Scandlines AGThe history of the Danish Scandlines A/S goes back to 1872, when the Danish State Rail-ways (DSB) opened a short ferry route between Jutland and the island of Funen. In 1995Scandlines A/S was separated from DSB into a limited company, with the Danish Ministryof Traffic as the sole shareholder. After the bridge/tunnel between Funen and Sealand wasopened in 1998, the Danish state had no longer a strategic interest in Scandlines. Thepresent Scandlines AG was founded in the middle of 1998, through an amalgamationbetween Scandlines A/S in Denmark and DFO, Deutsche Fährgesellschaft Ostsee GmbH(DFO) in Germany, renamed Scandlines Deutschland GmbH. The former owners of thetwo companies, German Rail and the Danish Ministry of Traffic, each own 50% of thenew firm Scandlines AG. When a second major bridge, the one between the Danish islandof Sealand and Sweden, is opened in 2000, and tax-free sales have been discontinued, thenumber of employees in Scandlines AG is expected to stabilise around 2600. In 1998Scandlines AG had 195 000 departures and carried 29.4 million passengers, 5.8 millioncars and one million lorries. Revenue was about DM 1.13 billion ($643 million). Scan-
176 Gummesson, 1998.

122
dlines AG has 43 ferries, which service 20 ferry routes. Scandlines is one of the largestand most high-frequency ferry operators in the world.
Figure 5.8 Scandlines routes (Germany-Denmark-Sweden)
Source: www.scandlines.dk.
In April 1997 it was decided to supplement Scandlines existing text TV information sys-tem with an Internet version, which was opened two months later. In the first instance itwas information only, but soon later it became possible to make reservations for cars onferries via the net. Since the founding of Scandlines AG, the previous DFO has imple-mented the Internet reservation facility for its routes as well, mainly from Rostock andSassnitz. The Internet reservation facility has been implemented on all three languageversions of the Scandlines site (Danish, German, Swedish). Currently reservations can bemade for passenger cars, but the Internet reservation system is constantly being furtherdeveloped and it will shortly become possible to book other Scandlines products as well viathe net.
Before the Internet booking system of Scandlines was implemented, there was a push-button automatic telephone reservation system, and the Internet booking system gets itsdata the same way.177 Some of the reservations (for passenger cars) which would havebeen made by push-button telephone are now being made via the Internet. The Internetbooking system works as follows: first the Internet user selects route, then date and timefrom a drop-down curtain of choices, then he/she writes number of persons and telephonenumber, clicks on reservation, and that is all. A message appear on the screen that the
177 Scandlines-Digital Web, a customer story (in Danish) dated 30 March 1998, previously found at
www.digital.dk/, but it is no longer there. Instead there is a new customer story (also in Danish), at this Web-address: www.elk.dk/ref_scandlines.htm .

123
booking is confirmed, a booking number is given along with the departure details. It isthen possible to exit the site, to cancel the booking or to book the return car ferry trip.
The Internet reservation application - which comes in a Danish, German, and Swedishversion - runs on a 64bit Digital AlphaServer with Digital UNIX and Oracle RDBMS(relational database management systems) and has on-line transaction based integration toScandlines’ existing ticket and reservation system.178 Both the pre-existing reservationsystem and the Internet server are placed in facility management with Digital in the Co-penhagen area.
In 1998 about 8,000 reservations were made over the Internet per month.Assumed average price per Internet reservation in 1998: DKK 410 (for about 1.5 car-crossing-segments onaverage per reservation), i.e. Internet revenue in 1998 was roughly DKK 39 million ($5.9 million - at an ex-change rate of DKK 6.70 per $). Of 5.8 million car crossings, about 144 000 (8000 x 1.5 x 12) or 2.5%were booked via the Internet in 1998.
In 1999 about 10,000 bookings per month are received via Internet.Assumed average price per Internet reservation in 1999: DKK 430 (for about 1.5 car-crossing-segments perreservation). This means that Scandlines is set to receive Internet revenue of DKK 52 million in 1999 ($7.2million - at an exchange rate of DKK 7.17 per $). In volume terms about 3.8% of the car crossings will be
booked via the Internet in 1999.179
5.3.4 Irish FerriesIrish Ferries is Ireland’s largest shipping company. It carried 1.6 million passengers in1998, of whom 1.4 million on Irish Sea routes, and 0.2 million on the Ireland/Franceroute. Irish Ferries is owned by the Irish Continental Group PLC, which is an operator ofpassenger and freight ferry services. The Group had 1125 employees in 1998, and totalturnover of I£168 ($239 million). Apart from Irish Ferries, the Group comprises four otherdivisions, all involved in container sea transport activities.
178 www.elk.dk/ref_scandlines.htm - and Greenspun, Philip, 1997, Building Relational Database-Backed Web
Sites, for the Web Tools Review, http://photo.net/wtr/rdbms-backed.html.179 (10 000 x 1.5 x 12)/4.7 million) = 3.8 percent. This is the writer’s estimate.

124
Figure 5.9 The Irish Ferries route map
Source: www.irishferries.ie.
Irish Ferries opened its online reservation service during the spring of 1999. It is nowpossible to book and pay by credit card online (SSL). It is possible to check for availabilityand prices on the preferred sailings on the Irish Sea crossings.
On the Irish Ferries site, availability can be checked online for both foot passengers andthose travelling by car. When availability has been checked (for example for an ordinarycar including two adults and an infant), full address details should be filled into a form,and the payment method must be selected (i.e. by credit card only). Tickets can either becollected on departure or they can be posted.
Irish Ferries states that the volume of bookings has been increasing steadily since theservice was introduced and has matched the firm’s expectations. Following a scheduledinterim review of the effectiveness of the site and the booking facility, changes will bemade during the second half of 1999.
Irish Ferries is working on its online reservations service for Ireland/France sailings. Butin the middle of 1999 bookings for these services had to be done by contacting one of theIrish Ferries offices and agents, which are listed on the site. It is hoped that the bookingfacility for Ireland and France will be available in the autumn of 1999, but the design iscomplex because of the multiple cabin types.

125
6. Distribution of European accommodationservices via the net
6.1 Introduction to booking of accommodation through thenet
Half of all Europeans go away on holiday each year, some several times. About 58% ofEuropean holiday-makers stay in their home country. For European business travellerswho invariably stay at hotels, the percentage of nationals is higher. For business and lei-sure under one, let us guess that 2/3 of accommodation guests are nationals, and 1/3 for-eigners.
As a basis for looking at the possibilities of distributing accommodation services throughthe net it is appropriate to know something about the booking pattern in general. Data forDanes who take their holiday in their home country indicate that intermediaries are notcommonly involved in connection with the booking of holidays in the home country, i.e.66% book directly with the place of accommodation, 23% do not book in advance, whichleaves about 11% to intermediaries such as cottage letting agencies, travel agencies andlocal tourist bureaux.180 Among those nationals who do make pre-bookings, six out ofseven book directly.
For those 42% of holiday-makers who go abroad the most common thing is to go to an-other European country.181 Information on how those Europeans who take holidays in acountry than their home country book their accommodation.
Youth hostels and camping are the two forms of accommodation with the highest propor-tion of no pre-booking. On the other hand, those Europeans who go on holiday abroad andstay at hotels or similar (holiday centres) typically book through an agent in their homecountry.
Currently only 15% of the bookings among those Europeans who holiday abroad are madedirectly with the place of accommodation in the foreign country or through an intermedi-ary at the destination.
180 Source as Figure 6.1, p. 167.181 EC DG 23, 1998.

126
Figure 6.1 The booking pattern for Europeans who go abroad for their holidays
0%
10%
20%
30%
40%
50%
60%
70%
80%
90%
Hot
el
Hol
iday
cen
tre
Ren
ted
hous
e/co
ttage
/ap
artm
ent
Cam
ping
You
th h
oste
l
Tot
al
Directly to accommodation orbureau at the destination
Booking through agent ortransport firm in home country
No pre-booking
Source: Based on European screening data from Danish Tourist Board 1997, according to Marcussen, 1998, p. 36.Note: These markets (international holiday-makers from the following countries) are included: Germany, Sweden,
Norway, Netherlands, the UK and Italy, weighted according to their relative importance. The total is theweighted average for all the types of accommodation shown (Hotels: 48%; Holiday Centres: 33%; Rented:6%; Camping: 9%; Youth hostels: 4%). B&B, for example, is thus not included, but its booking pattern issomewhat like youth hostels.
We will disregard those who make no pre-booking. With respect to Internet bookings -directly with the place of accommodation or through intermediary (at the destination or aglobal one) by nationals or foreigners - interpretations of the booking patterns are shownin Table 6.1.

127
Table 6.1 Opportunities for Internet bookings of European accommodation services
Internet bookings directly with the accommodation(without availability data)Market potential, in volume: 57+5=62%
Internet bookings through anintermediary * (with availability data)Market potential, in volume: 10+28=38%
Nationals:
~67%
Market potential: ~6/7 of 67% = 57%Good opportunities of getting many visitors to site,who will mainly just look up basic information, and ina few instances for making direct bookings by tradi-tional communication channels (phone, fax) or insome instances via ordinary e-mail.Technical assessment: A hopeless scenario.Therefore the market potential cannot be exploited.
Market potential: 1/7 of 67% = 10%There are good opportunities for traditionalintermediaries to shift nationals from the phone tothe Internet, thus saving costs.Also there are opportunities for 100% new onlineplayers to create a totally new strictly Internet-based business( = a risk for the traditional players)
Foreigners:
~33%
Market potential: 1/6 of 33% = 5%Small sales potential only. But the home-page shouldbe home language + English(+ possibly German and/or French).Technical assessment: A hopeless scenario.
Market potential: 5/6 of 33% = 28%Great volume/sales potential,both for cost savings.Technical assessment: A very fine scenario (asabove)
Note: * This may be a hotel chain, a destination-based reservation organisation, or a more or less global intermedi-ary for hotels or other forms of accommodation. The percentages in this table are rough indications only,based on EC DG 23, 1998 (the assumed split between nationals and foreign leisure and business tourists). Asfar as foreigners are concerned, Figure 6.1 indicates that they mainly book through intermediaries. whereasnationals tend to book directly to the accommodation. This is certainly true for Danes (Danish Tourist Board,cf. Marcussen 1998, p. 167, in Danish), and is undoubtedly also true in other countries.
6.2 Hotels
6.2.1 An overview of hotels in EuropeCompared to North America, the European hotel industry is very fragmented, i.e. charac-terised by many relatively small hotels and similar establishments (cf. Appendix 6.1) manyof which are not a member of any form of hotel chain.182 As to chains it is a fact that mostof the 50 largest hotel chains in the world (cf. Appendix 6.1), which are typically US-owned and with most of their properties in the US, have little or no presence in Europe.
The total number of hotels and similar properties in Western Europe is about 188 000 -with a total of about 4.64 million rooms, i.e. 25 rooms per hotel on average. The corre-sponding number for the US is 49 000 hotels with 3.8 million rooms, i.e. 78 rooms perhotel on average. This shows that there are many relatively small hotels in Europe.
182 Cf. Cornell, 1999.

128
Figure 6.2 Countries’ share of hotel properties in Western Europe (%)
0% 5% 10% 15% 20% 25%
UK
Germany
Italy
France
Austria
Spain
Greece
Switzerland
Belgium
Portugal
Sweden
Netherlands
Norway
Finland
Denmark
Rep. Ireland
Luxembourg
% of rooms
% of hotels
Sources: As Appendix 6.1.Note: Total No. of hotels: 188 000. Total No. of rooms: 4.9 million.
6.2.2 The Bookings NL on-line hotel reservation system, Netherlands- and Europe
The firm behind the www.bookings.org site, Bookings NL (Boekingspunt Nederland BV),and the site itself were established in 1997. The sole activity of the firm is on-line hotelreservations. There are nine employees. Currently, the platform covers the followingcountries: Austria, Belgium, France, Germany, Ireland, the Netherlands and the UnitedKingdom.

129
Table 6.2 The Bookings NL on-line hotel reservation system, Netherlands - andEurope
Country No. of hotels inthe country
% insystem
No. of hotels in thesystem
No. with roomsavailable tonight
With special offers
Netherlands 1500 12 181 129 6
Germany 37 000 0.2 91 64 9
UK 40 000 0.2 63 58 11
Austria 19 000 0.3 61 57 5
Belgium 1900 3 60 43 3
France 21 000 0.2 47 33 5
Ireland 900 3 25 24 16
Seven countries 120 000 0.4 528 408 55
Source: Appendix 6.1 and www.bookings.org, Tuesday, 4 May 1999 (in the morning).
The hotel booking system and the associated website includes interactive search functions,prices, room availability data and a booking function. It is not possible to make paymentson-line, but payments are guaranteed by credit card. The guest settles the bill at the hotel.
Hotels can update their availability data by fax, phone, e-mail or Internet. The updatingfrequency depends on the hotels, but it is at least once a week, with once a day as the aver-age. During the high season (spring) only about 10% of the hotels show special offers onthe site, (see Table 6.2). But during the low season more than 50% of the hotels showspecial offers. Other incentives given by the hotels to the end-users for placing orders overthe net include things such as special Internet package offers, free drinks and free maps.
There are about 2500 unique visitors per day on the site, resulting in about 75 bookingsper day, which means that the unique visitors-to-booking ratio is as good as 33:1 (somevisitors may make more than one visit per day). There are about 10 page views - and 50hits - per visitor. In 1998 there were 400 000 visitors on the www.bookings.org platform(i.e. about 1100 unique visitors per day). They made a total of 8000 bookings, covering 15000 room nights. The average accommodation revenue per room night was about $125.

130
Table 6.3 Summary of key statistics for the www.bookings.org site
Period No. ofvisitors
Roomnights
No. ofbookings
Room nightsper booking
Visitors perbooking
Revenue perroom night, $
Revenuegenerated, $
1997 0 0
1998 400 000 15 000 8000 1.88 50 125 1 875 000
Per day, all of 1998 1096 41 22 1.88 50 125 5137
Per day, May 1999 2000 141 75 1.88 33 125 17 578
1999, predicted 1 million 56 250 30 000 1.88 33 125 ~7 million
All hotels participate in the same way, i.e. by paying commission on reservations, in therange of 8% - 12%. Bookings NL BV does not ask for any fixed fees. The investment (allcosts) was $100 000 in 1997, and $200 000 in 1998. In May 1999 it was stated that break-even had been reached. This is confirmed by the chart below, which is the writer’s freefantasy, but based on facts stated by Bookings NL BV.
Figure 6.3 Break-even chart for Bookings NL BV
0
100000
200000
300000
400000
500000
600000
700000
800000
900000
2ndhalf1997
1sthalf1998
2ndhalf1998
1sthalf1999
2ndhalf1999
Commission,accummulated,US $
Investment(costs),accummulated,US $
Bookings NL considers itself to be number one in the Netherlands in terms of Internethotel bookings, and believes it is about number 10 in Europe for Internet hotel bookingsoverall.

131
The Dutch market accounts for 10% of bookings. The largest market is the US, whichaccounts for 25% of the bookings. The system for handling the hotel and availability datais self-designed and runs off four PC servers in total, with the Linux operating system.
Although hotel room nights are well suited to being sold over the Internet, technically it isconsidered to be a relatively complex task to offer on-line bookings. Bookings are receivedthrough the Internet only, which is considered to be a cost-effective way of receiving abooking.
In the near future the www.bookings.org on-line hotel reservation system will extended tocover Italy, Spain, Denmark, Sweden, Czech Republic and Switzerland as well. In thesecond half of 1999 Bookings NL BV will set up Bookings USA and Bookings ASIA. It isthe vision is to make a world-wide hotel directory.
The firm will continue to distribute exclusively through the Internet. As to new functionsand features on the site, hotel videos are being considered. The Internet is considered to bean increasingly important distribution channel for hotels in general, a major selling point,partly replacing travel agencies.
6.2.3 Hotel Reservation Service, HRS, GermanyHRS is a world-wide hotel reservation system, founded in 1972 by Robert Ragge. Thereare 50 employees. Currently it is possible to book 30 000 hotels online with instant con-firmation through the Internet with HRS, 75% of which are shown with photos. About 11000 (37%) of the hotels are located in Germany. About 50% of the bookings come fromGermans. Other Europeans account for roughly a third, and the rest of the world 15%-20%.
HRS got its first internal electronic (stand alone) hotel booking system back in 1982. HRSstarted computerised online hotel booking in 1991 through what was then called Btx, aGerman Videotex system run by Deutsche Telekom, one of the predecessors of the Inter-net, which is now called T-online. T-online subscribers have been able to access the Inter-net since 1997.
HRS established its website in the very early days of the World Wide Web, in 1994. On theHRS site, Internet users will only see hotels which are bookable with instant confirmationin the second of access. One can get available hotel rooms for given dates in for exampleHelsinki or Frankfurt - unless one happens to pick a date when there is a trade fair andeverything is booked out or the hotels decide not to sell the hotel rooms on-line, since theyare able to get higher prices off-line - which is a yield management consideration, i.e. amanagement decision taken to maximise revenue. The rates - which are special HRS rates

132
- are updated frequently. So it is possible to search for hotels, see photos, see prices, andmake bookings with instant confirmation. Payment is settled at the hotel. HRS’s aim is togive the customers the best price they can get anywhere, which HRS believes it does in atleast 90% of cases. The hotels do not pay any participation fee. HRS lives from commis-sions. HRS is thus able to be a distributor of all sorts of hotels anywhere in the world tocustomers anywhere. The same - competitive - prices are given both on the Internet andfor telephone bookings to the HRS call centre, and no other special incentives are given forInternet hotel bookings. In addition to the Internet and the call centre HRS also takebookings through Swiss Online, Minitel in France and T-Online (Videotex systems), on-line services such as AOL, Compuserve, MSN and multiple other online services. In addi-tion HRS is an exclusive partner of German mobile telecom companies. HRS has a specialdepartment for trade fair reservations, group arrangements, conventions, meetings etc.
HRS has a wide range of companies which have direct access to the hotel database. Thismeans that companies which have been able to negotiate rates which may be lower thanthe HRS rates, are able to book at this rate - or according to the best-buy principle (i.e. tobook at whichever rate is lowest). Companies which have made such volume-based dealswith hotels directly, and then entered their special rates into the HRS system, includeVIAG.183 To remember how to access the system, companies (travel management) andfrequent bookers get a personal HRS card with their customer number.
The traffic to the HRS website is monitored by www.hitbox.com. HRS was ranked asnumber nine out of 2132 sites which had chosen to be included in the category Tourism.This category was changed to Travel with several sub-categories, one of which is Hotel-Lodging. HRS now ranks as number one out of 218 sites, which have chosen to be in-cluded in this category. During 1999 the average number of unique visitors per day was4025, up from an average of 1950 during the summer/autumn of 1998, indicating a trafficincrease of more than 100% in less than 12 months.184
HRS considers itself to be among the leaders in Europe in terms of hotel booking receivedvia the Internet. According to HRS the geographic distribution of Internet sales is the sameas for all HRS bookings in general: 1) Germany 2) Rest of Europe 3) Rest of the world.185
183 www.viag.de; With sales of approximately DM 50 billion and about 85 000 employees, VIAG Aktienge-
sellschaft is one of Germany's leading industrial corporations. In addition to the core business areas of energy,packaging, aluminium and chemicals, VIAG is also active in the fast-growing telecommunications market(mobile telecom network).
184 The two periods mentioned are specifically these: 6 July – 3 November 1998 and 30 March - 25 August 1999.During the first of the two periods mentioned the peak day was a Tuesday in October, and the peak hour was 3p.m.
185 One would expect that customers from the rest of the World, specifically from the US, account for a signifi-cantly greater proportion of HRS’ Internet bookers than of its bookings in general.

133
HRS gets many bookings via the net, and some of these can be considered to be additionalbooking which HRS would not have received if it had not had its website. HRS also savescosts when people make Internet bookings, since fewer staff are required in the call centre.HRS has reached break-even for its Internet investment.
During 1999 hotels at the site will get the opportunity to update their own information(rates, rooms available, etc.) themselves via the Internet. Access will be protected by key-word and password. Since March 1999 customers can get alternative hotels within a cer-tain radius, if there are no hotel rooms available in the preferred city, and it will becomepossible to find hotels which are located within 50 km of an attraction or other place ofinterest. HRS tries to sell to both business and leisure travellers. For hotels in Europe therewill be city maps, so that hotels can be located. For the hotels in German cities and theEuropean capitals this facility has already been established.
HRS gets a steadily increasing number of bookings through the Internet. In general, HRSbelieves that the Internet will become a significant distribution channel for hotels in fu-ture. Those suppliers who are able to offer the customer real online bookings (with allbasic data, photos, good rates, availability data, and instant confirmation) stand the bestchance in the future. Customers will not be prepared to send an e-mail and wait for ananswer which may never arrive.
6.3 Brief introduction to destination-based reservation sys-tems
It was not the intention of the writer to include destination based Web reservation systemsin this publications, cf. Table 1.1. But since it has turned out that one of them, TIScover.ator TIScover.com of Tyrol in Austria has already done very well in 1998 in terms of reve-nue generated for the properties involved, a short note will be made about this category ofsystems.
There is a bulk of literature about IT supported destination-based information and reser-vation systems, most of which was written before the Internet became a significant distri-bution channel.186 So, from a practical point of view there is good reason to reconsider thefunctionality of these breeds of systems, both those which do and those which currently donot comprise reservation functions, and to reconsider theoretical aspects and managerialimplications in light of the most current Internet and Internet commerce developments.
186 For example Archdale, 1993, pp. 3-14; Archdale, 1994, pp. 246-25; Buhalis, 1993, pp. 366-378; Sheldon,
1993, pp. 633-649; Sussman and Baker, 1996, pp. 99-112 (including further references).

134
6.3.1 TICcover - revenue generated by online bookingsTIScover has been described in depth by Pröll et.al. (1998), and by Werthner and Klein1999 to which readers are referred for details.187 In 1997, which was its first complete yearof operation, over 23 000 transactions were made through TIScover, generating about $8million in revenue.188
In 1998 TIScover.at generated accommodation revenue of about $20 million, which is setto increase to about $55 million in 1999. It is hoped that break-even for the TIScover In-ternet investment will be reached in 1999. 189
From 1998 until the middle of 1999, in Austria, England, Scotland, Ireland (Frew andO’Conner ,1999, p 404), and Denmark (Marcussen and Skjoldager, 1998), and the rest ofEurope as far as the writer knows, TIScover is the only or at least the most comprehensivedestination-based booking system which offers online bookings via the Internet (if youlike, Destination Management System, DMS, with internet booking functionality) andcertainly the one which generates most revenue.190
6.3.2 Gulliver, Ireland: Moving towards online bookingsIn Ireland there is a system called Gulliver, which is Ireland’s most advanced and mostcomprehensive tourism database. Since July 1997 Gulliver Infores Services Ltd. has beenjointly owned by FEXCO (74%), Bord Failte (Irish Tourist Board) and the Northern Ire-land Tourist Board (26%). FEXCO paid I£3.2 million for the stake in Gulliver, andplanned to spend I£2-£3 million revamping and expanding the system.191 From mid-1999(specifically from the end of September) it should be possible to make bookings via theInternet through the Bord Failte website, with instant confirmation, thanks to the avail-
187 Cf. also Pröll et.al., 1999. An additional description in English can be found in O’Connor, 1998 (pp. 81-86).
Earlier descriptions were made in Danish by Marcussen, 1996, pp. 29-37 and in German by Ebner, 1994 andWerthner, 1993. Originally it was an information-only system without booking facilities, like one of its fore-runners, the Danish dandata (Marcussen, 1996, pp. 19-28 and Marcussen and Skjoldager, 1998).
188 Werthner and Klein, 1999, p. 207.189 The amount for 1998 has been estimated as follows: almost 87 000 reservations and booking enquiries, 75% of
which are assumed to lead to actual stays, each generating $307 in revenue. For 1999 about200 000 reservations and booking enquiries are expected, 75% of which are assumed to lead to actual stays,each generating $364 in revenue.
190 The TIScover system has been licensed to www.deutschlandreise.de (the marketing and sales platform in theInternet for tourism to and in Germany of START Media Plus GmbH, a subsidiary of START Amadeus), cf.Werthner and Klein, 1999, pp. 207-210. - And in the Bodensee region in Switzerland there is a system calledElectronic Mall Bodensee (www.emb.net), which is described by Werthner and Klein, 1999, pp. 211-216.
191 Canniffe, Mary, 1997 in the Irish Times 9 July, www.fexco.com/, media, press release archive.

135
ability data of Gulliver.192 Thus there will be an additional European player in the desti-nation-based web reservation system category.
6.4 Youth hostels
6.4.1 Hostelling International - World-wide and in Europe - and IBNHostelling International is a brand name of youth hostels across the world. Its logo is ablue triangle, hut and tree. The International Youth Hostel Federation (IYHF) is the um-brella organisation for the national youth hostel organisations. World-wide there are some4500 hostels in more than 60 countries providing over 31 million overnight stays peryear.193 51% of these youth hostels and about 75% of the overnight stays are within youthhostels in Western Europe, so we can say that hostelling is a typically European phenome-non.
Youth hostels as a whole are a much smaller business in Europe than hotels. In WesternEurope there is a total of about 2300 youth hostels, with a total of about 23 million over-night stays per year. Remember there is a total of 188 000 hotels in Western Europe. Andfurthermore, the average price per overnight stay is much less for youth hostels than forhotels. Nevertheless, since youth hostels have a high proportion of students, who are heavyInternet users among their guests, the Internet is clearly a potentially interesting mediumfor information provision about youth hostels and possibly also for bookings, except for thefact that credit cards will have a low penetration among the typical youth hostel guest. Butif payment can be settled off-line, it should work fine with Internet bookings, providingno-show for Internet bookings is not a much greater problem than in connection withtelephone (or fax) bookings.
Out of 20 national Hostelling International organisations in Western Europe 80% haveactive websites. Only for Norway can booking request forms be transmitted from the web -by e-mail or by fax via the association - to individual hostels without any manual inter-vention. In addition to this Austria and Scotland appear to run a booking centre to whichthe customer can send a booking enquiry (see Appendix 6.4). None of the national youthhostel associations provides any availability data (for their member hostels) on the nationalhostel site. But the international system IBN does.
192 www.gulliver.ie/WhatIsGullNet.htm (last modified 20 February 1999, as read on 12 July 1999). Gulliver is
described by O’Connor, 1999, pp. 87-97, and by O’Connor & Rafferty, 1997. Cf. also Frew and O’Connor,1999a and 1999b; and Werthner and Klein, 1999, (pp. 210-211).
193 www.iyhf.org/iyhf/whatis.html

136
Table 6.4 Hostels in IYHF, and in the IBN system
Total IYHF No. in IBN % in IBN
Western Europe 2315 180 8
ROW 2185 93 4
Total 4500 273 6
Source: Mainly based on data from www.iyhf.org, cf. Appendix 6.3.
World-wide there are 273 major youth hostels bookable through the International BookingNetwork (IBN) system, which is run by IYHF in London. It has been in operation since1992. Currently the system can only be accessed by the national youth hostel associationsand by the member hostels, so it is not open to the general Internet user, and not based onweb technology.
It seems high time to transfer the IBN system to the Internet, open it up for Internet book-ings from the general public and to take credit card payments or deposits. This was in factsuggested to IYHF by the writer as early as June 1997.194 At that time it was stated that itwas the intention to offer bed availability (for the 273 hostels in IBN) on the Web by themiddle of 1998. Two to four years ahead, i.e. by 2000-2002, (!) it was the intention to offerInternet bookings.
In Appendix 6.5 the current considerations of IYHF as to why the hostels in IBN cannotbe booked via the net for the time being are stated.
6.4.2 Hostelling International Norway (HIN)We shall now focus on Norway. Four percent of the IYHF hostels in Europe are located inNorway, accounting for 1.7% of the overnight stays, so obviously the Norwegian hostelsare relatively small.
The Association of Youth Hostels in Norway (Hostelling International Norway, HIN) wasfounded in 1930, and is the Norwegian branch of Hostelling International. There are cur-rently 92 members of HIN, whose joint administration in Oslo has six employees. Its mainfunction is to market its members, nationally and internationally. Other functions includehandling the classification of the Norwegian hostels, producing statistics, providing in-formation to members and customers.
194 26 June 1997 by telephone to Mr. R. Lau, Secretary General, IYHF, London. Cf. Marcussen ,1998a, p. 149.
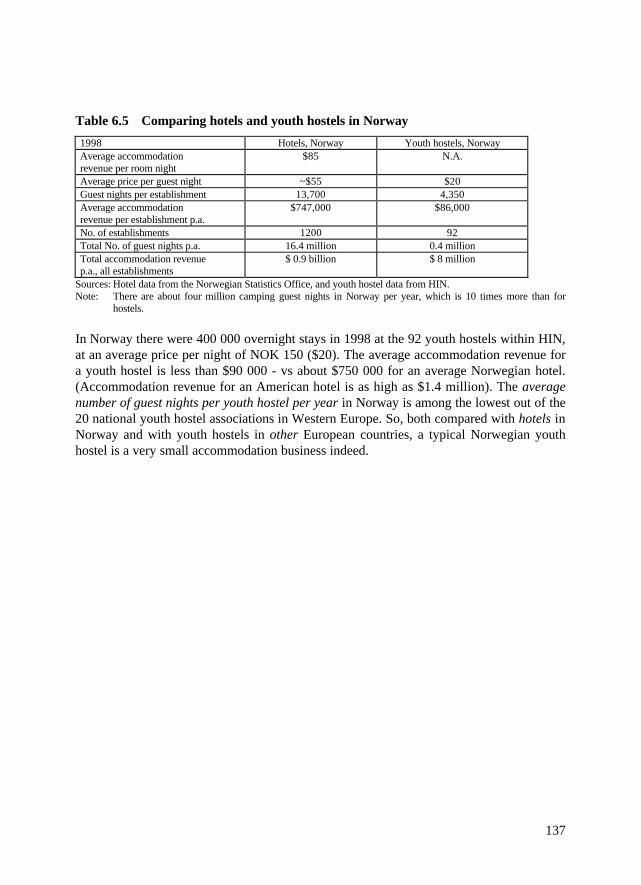
137
Table 6.5 Comparing hotels and youth hostels in Norway
1998 Hotels, Norway Youth hostels, NorwayAverage accommodationrevenue per room night
$85 N.A.
Average price per guest night ~$55 $20Guest nights per establishment 13,700 4,350Average accommodationrevenue per establishment p.a.
$747,000 $86,000
No. of establishments 1200 92Total No. of guest nights p.a. 16.4 million 0.4 millionTotal accommodation revenuep.a., all establishments
$ 0.9 billion $ 8 million
Sources: Hotel data from the Norwegian Statistics Office, and youth hostel data from HIN.Note: There are about four million camping guest nights in Norway per year, which is 10 times more than for
hostels.
In Norway there were 400 000 overnight stays in 1998 at the 92 youth hostels within HIN,at an average price per night of NOK 150 ($20). The average accommodation revenue fora youth hostel is less than $90 000 - vs about $750 000 for an average Norwegian hotel.(Accommodation revenue for an American hotel is as high as $1.4 million). The averagenumber of guest nights per youth hostel per year in Norway is among the lowest out of the20 national youth hostel associations in Western Europe. So, both compared with hotels inNorway and with youth hostels in other European countries, a typical Norwegian youthhostel is a very small accommodation business indeed.

138
Figure 6.4 Average accommodation revenue per establishment - hostels and hotels
- 0,2 0,4 0,6 0,8 1,0 1,2 1,4
Hostel, Norway
Hostel, Europe
Hotel, Norway
Hotel, Europe
Hotel, USA
Average accommodation revenue p.a. per establishment, million $
Note: Number of establishments: Hostels, Norway: 92; Hostels, Europe: 2134.Hotels, Norway: 1200; Hotels, Europe 188 000; Hotels, USA: 49 000.Prices applied, 1998 (or ‘97): Hostels in Norway and Europe, per guest night: $20.Hotels, price per room night: Norway: $85 (known, 1998); Europe $80 (assumed); USA $75 (known,1997).
In spite of the small revenue basis for the individual Norwegian youth hostels, some ofwhich are only open during the summer season, there are many of them, and together theymake hostelling a relatively important form of accommodation in Norway (since Norwayhas a larger share of European hostel nights than of European hotel nights (1.2% vs1.7%). The interesting thing to mention here is that HIN, on behalf of its 92 member hos-tels, has implemented a relatively cheap, uniform, well functioning and successful directbooking request system based on the Internet and supplemented with fax.
HIN opened a basic website in May 1997, whereas the Internet booking request systemwas opened at the beginning of May 1998. During the period of the basic site there wereonly 17 000 visitors to the site, but during the following 12 months, the number of visitsexploded (see Table 6.6), not least because of the extended content and booking requestfunctionality of the site.

139
Table 6.6 Internet statistics and analysis - Hostelling International Norway
12 month period: 98.05-99.04
Total guest nights 400,000
Hits on website 2,600,000
Hits per visit 5.8
No. of visits to site 425,350
No. of Internet bookings, 1st year 3,500
Visits per booking 122
Guests per booking 2.6
Length per stay 1.79
Guest nights per booking 4.65
Room nights sold through net 16,275
Internet booked guest nights in % 4.1%
Note: Based on data provided by HIN.
With respect to the number of accommodation bookings received through the net for staysin Norway, HIN believes it is number one in the country. HIN even claims slightly morevisits to its site than the Norwegian National Tourism Board, NORTRA, www.nortra.no.
The way the system functions is the following: all the 92 hostels are described in a com-pletely standardised manner, by text, photos and symbols. By means of interactive searchfunctions (by region, name, stars, amenities etc.) the Internet user finds an appropriatehostel, fills in the booking request form, and submits it through the net. HIN receives therequest and transmits it automatically within seconds on to the appropriate hostel either bye-mail or - in those instances where the hostel has no e-mail box - by fax.195 Only onesingle hostel in the north of the country has neither e-mail nor a fax, and in that singleinstance HIN phones or mails the request.
195 HIN keeps a copy of the request - and tracks how many of them turn into actual stays - for statistical purposes.

140
Figure 6.5 The Web, e-mail, and fax- based booking request system of HIN, Norway
8 , 0 0 0 + u n i q u eW e b u s e r s
p e r w e e k ( 9 9 )
N IH S ta f f : 6
@
@ F a x
F a x , p h o n e
o r m a i l
3 0 h o s t e l s w ithe - m a i l b o x
6 1 h o s t e l s w ith f a x ( + 1 w i t h p h o n e o n l y )
@
@
7 0 % 3 0 %
Table 6.7 E-mail penetration among Norwegian youth hostels, May 1999
(A) Hostels North West East Total1 * 8 6 5 192 ** 13 18 22 533 *** 2 4 14 20Total 23 28 41 92
(B) with @ North West East Total1 * 0 3 1 42 ** 2 11 5 183 *** 0 2 6 8Total 2 16 12 30
(C) % @ North West East Total1 * 0% 50% 20% 21%2 ** 15% 61% 23% 34%3 *** 0% 50% 43% 40%Total 9% 57% 29% 33%Source: Based on counting from www.vandrerhjem.no.Note: It is somewhat surprising that e-mail penetration is higher in the western region than in the east (which in-
cludes the metropolitan area). But it is expected that penetration is highest among 3-star hostels, and lowestamong 1-star.

141
A third of the hostels has an e-mail box, although fewer in the north, and among the onestar hostels, which at the same time are the smallest. Therefore a lot more than a third -namely 70% - of booking requests can be forwarded by e-mail, and therefore also an-swered by e-mail. It is the policy of Hostelling International Norway that e-mails should beanswered within 24 hours, which is quality checked from time to time, but many hostelsreply within 20 minutes. HIN claims that even those hostels which have a dial-up connec-tion to their e-mail box check it every half an hour, from their reception desk. Many hos-tels stay on-line all the time, and therefore receive e-mails immediately. The explanation isthat the rate for local telephone calls, such as for Internet access, is only NOK 0.36 perhour ~ $0.05).
Figure 6.6 Responding to booking requests to Norwegian hostels
A ll booking requests f rom the W eb: 100% , say 100 per week
70 are to hostels withan e-mai l box. Conf i rmat ion
is sent by e-mail direct ly by the hoste ls themselves
30 are to hostels
w ith fax only.
10 are not urgent and are therefore responded to
by snai l -mai l beause thereis plenty of t ime unti l arr ival
20 are urgent , all a re wi th phone number
8 a re f rom Norwegians ,and to these the hostel
phones the reply
12 are urgent , from foreigners ,
then what?
2 a re f rom Swedes ,1 f rom a Dane , which
m a y be answered by phone
9 of 100 remains :- HIN steps in (rarely) - OR: No rep ly in t ime
Feed-back goes directly from the hostels to the Internet user by e-mail, or if the hostel hasa fax machine (but not an e-mail box) the reply is faxed. If there is plenty of time untilarrival, and if no fax-number is written on the request, the hostel sends a confirmation bysnail-mail. If there is no fax-number, and the request is urgent, the hostel phones the con-firmation to the customer if the request is from within Norway, and perhaps also if it isfrom Sweden or Denmark.
A hostel (without an e-mail box) is not likely to be willing to confirm by phone outside ofScandinavia, even if the customer has stated his/her phone number, which has to be stated

142
in all instances, otherwise the booking request cannot be sent from the booking form onthe website in the first place.
In the relatively few remaining instances (nine out of 100) there are two possibilities leftfor the hostel to reply:a) By faxing/phoning HIN, and asking them if they would please e-mail a reply to the
customer;b) Or - if everything else fails - as a non-desirable quasi solution by default outside of the
system - the customer may just show up at the time stated on the request, and hope thatthe hostel has reserved a place as requested.196
The Internet bookings contain more guest nights than hostel bookings in general. Thismeans that the Internet’s share of guest nights is greater than its share of bookings. Afteronly 12 months of operation the Internet booking request solution on HIN must be said tohave turned out to be a tremendous success, since it reached the level of about 4% (~16000) of the guest nights sold.
For comparison with these 16 000 guest nights (4%) sold through the Internet, it can bementioned that only 2000 guest nights (0.5%) were booked at Norwegian hostels throughthe IBN closed-user-group-systems - which as mentioned have been in operation since1995.
To be fair it should be added that only two hostels in Norway can be booked through IBN,albeit two of the very largest ones. In fact these two large hostels get twice as many book-ings through the Internet via the HIN site than via the IBN system.
Table 6.8 IBN vs Internet - the case of Norway
Hostel IBN Internet
Oslo Haraldsheim *** 1200 2500
Bergen Montana *** 800 1500
Total No. of overnights per channel 2000 4000
Source: Based on data provided by HIN.Note: The numbers are numbers of overnights booked through each of the two channels. Period: 05.98-04.99.
The writer can, incidentally, recommend both hostels.
196 The writer has never been turned away by any youth hostel in the Nordic countries - even in the high season,
not even by a major one like Montana in Bergen, although when phoning the day before the planned arrival itwas stated that there were no places left. But anyone planning to stay at any of the busiest city hostels in Europe(London, Paris, Oslo, Bergen, and up to a few hundred others) would certainly like to book ahead, not only viaIBN but also via the net, and so would 2-3-4 person families planning to stay at any hostel anywhere, sincesupply of private rooms is limited.

143
Not only from a sales point of view but also economically the solution has been very suc-cessful, with a pay-back period of five months at an optimistic estimate, or a little morethan six months using conservative assumptions.
Table 6.9 Internet investment appraisal - hostelling International Norway (in NOKand $)
Exchange rate: 13.24 per NOK 100 In NOK In $
Price per guest night 150 NOK 20 $
+ Food 30 NOK 4 $
=Total revenue per guest night 180 NOK 24 $
Guest nights per booking 4.65 4.65
Total revenue per booking 837 NOK 111 $
Of which additional revenue: 50% = 419 NOK 55 $
Additional GP per booking: 80% = 335 NOK 44 $
The Internet investment was: 0.24 NOK mill. 0.03 $ mill.
No. of bookings required to break-even 717
Average No. of bookingsper month 1st year: 292a) No. of months required to break even 2.5 months
As (a), but adjusted for seasonal pattern:b) No. of months, adjusted, optimistic ~5 monthsc) No. of months, adjusted, conservative ~6 months
Break-even for the Internet investment was reached after five or six months, as shown (seealso Figure 6.8).
If the number of Internet bookings were the same throughout the first 12 months after theintroduction of the Internet booking facility, it would have taken only two and a halfmonths to reach break-even.
Obviously one would assume that: 1) the number of bookings per months would increasemonth over month after the introduction, ceteris paribus but 2) the season affects thenumber of bookings. Taking both of these factors into account, one would assume thatbreak-even was reached in the first five months after the introduction at the beginning ofMay 1998, i.e. by the end of September 98. The season for Norwegian hostels - and forhotels for comparison - is shown in Figure 6.7. The implications are two-fold. Firstly, ingeneral the season for hostel nights is relatively more concentrated in the summer monthsthan for hotels. Thus the season is relatively short, and the revenue basis limited. Sec-ondly, the seasonal pattern affects the assumed Internet sales via the net per month shownin Figure 6.8.

144
Figure 6.7 Seasonal pattern for overnight stays at hotels and at hostels in Norway
0,00
0,50
1,00
1,50
2,00
2,50
3,00
3,50
Janu
ary
Feb
ruar
y
Mar
ch
Apr
il
May
June
July
Aug
ust
Sep
tem
ber
Oct
ober
Nov
embe
r
Dec
embe
r
Sea
son
ind
ex, N
orw
ay
Hotel season index
Hostel season index
Average
Finally, it should be noted that the assumption stated by HIN that as many as 50% of theInternet bookings can be considered additional appears to be optimistic. If, for exampleonly 25% of the Internet bookings were additional, then of course it would take twice asmany Internet bookings to reach break-even (1434 instead of 717). It took a little morethan six months to reach this number of Internet bookings, as shown in Figure 6.8.

145
Figure 6.8 Break-even chart for the Internet investment of Hostelling InternationalNorway
0
500
1000
1500
2000
2500
3000
May
98
June
98
July
98
Aug
. 98
Sep
t. 98
Oct
. 98
Nov
. 98
Dec
. 98
No
. of
bo
oki
ng
s Acc. No. of bookings (estim.)
Bookings required to break-even, conservative
Bookings required to break-even, optimistic
Source: Based on data and analysis from previous table.Note: The number of bookings per month is estimated only. HIN is currently extending its statistics facilities.
Some readers may happily detect something which looks to them like a well-known S-shaped curve. How-ever, the accumulated sales is actually assumed to have increased steadily (like a straight line - since there isno data to support making other shapes), only adjusted for the seasonal pattern shown in Figure 6.7.
HIN regards the Internet as a cost-effective marketing and sales channel. Hostels have agreater share of guests from distant markets than hotels, but a smaller share of Norwe-gians. On the other hand, when comparing a breakdown of all hostel nights by market,with a breakdown of Internet bookings for hostels, it turns out that there is hardly anydifference, cf. Figure 6.9. This means that in the case of Norwegian hostels the data showsthat the Internet channel does not attract a greater proportion of guests from distant mar-kets (i.e. from markets other than Scandinavia and Germany).
Germans, Swedes and Danes book relatively frequently through the net. As far as Swedesand Danes are concerned, this can be explained by a high penetration of Web use in Swe-den and Denmark. As far as Germans are concerned, we must assume that their relativelyhigh preference for making Internet bookings at Norwegian hostels is because Germancustomers perceive the language barrier to be smaller when booking through the net thatwhen booking by phone, fax or letter.

146
Figure 6.9 Breakdown of guest nights by market (i.e. guests’ home country) for ho-tels, for hostels in general and for Internet bookings of hostels (1998)
0% 10% 20% 30% 40% 50% 60% 70%
Norway
Denmark
Germany
Sweden
Others
Hostels, Internet
Hostels, all channels
Hotels, all channels
Source: Based on data from the Norwegian Statistical Office and HIN.
HIN expects to receive a minimum 5% of its bookings - covering about 7% of overnightstays - in the year 2001 through the Internet. Since the corresponding figures for the 12-month period to end of April 1999 were 3% of bookings and 4% of overnight stays, the2001 expectation is quite conservative. The hope is for up to 7-8% of bookings, i.e. 10% ofthe overnight stays, but HIN officially aims at 5% of bookings (7% of stays) via the net in2001.
Table 6.10 Realised and predicted Internet sales for Hostels International Norway
Internet % % of overnights % of bookings
1998 (8 months) 3.2 2.4
98.05-99.04 (12 months) 4.1 3.1
1999 (12 months) ~5 3.8
2000 (12 months) ~6 4.5
2001, target 6.7 5
2001, hope 10 7.5
Maximum potential 58 44
The maximum potential for the HIN Web booking request site is not 100%, though, butprobably less that 60% (~58%), since based on European data it must be estimated that30% of the guest nights at Norwegian hostels are not pre-booked (i.e. walk-in), whereas12% are booked by international guests through an intermediary in their home country asshown in Figure 6.10.

147
Figure 6.10Booking pattern for international hostel guests, for national hostel guests,and hostel guests in total
0%
10%
20%
30%
40%
50%
60%
70%
80%
Youthhostels,
internationalguests *
Youthhostels,national
guests **
Youthhostels, total(Norwegianweight) ***
Directly to accommodation orbureau at the destination
Booking through agent ortransport firm in home country
No pre-booking
Source: Based on European screening data from Danish Tourist Board 1997, according to Marcussen, 1998, p. 36 forthe International data, and Marcussen, 1998, p. 167 for the national data.
Notes: * Basis: Youth hostel guests from six European countries who stay at a youth hostel in a country other thantheir home country.** These data actually only cover Danes staying at youth hostels in Denmark - but because there is no otherdata available these data are assumed to be similar to the booking pattern of other Europeans staying at youthhostels in their home country, for example Norwegians staying at a Norwegian youth hostel.*** Using the mix between national (37%) and international guests (63%) in Norway as weight.
Future plans of HIN include the establishment of links to transport partners, with how toget there functions, and general links to/from ferry lines (Color Line, DFDS, etc.), trainsand buses. Also, HIN would like to put more visual material on its site, showing the interi-ors, so that people who have not stayed at youth hostels before can form an impression oftheir appearance. Many people think that youth hostels are just sleeping in large dormito-ries. But in Norway the maximum number of beds per room is now only four. So photos ofthe rooms would help.
How could the 9-12 unsatisfactory outcomes out of each 100 Internet booking enquiries beminimised (Figure 6.6) On one the hand, it could be made mandatory to write fax replynumbers into the booking enquiry form, which the Swiss hostel association has done.Another possibility is to make the filling in of the fax number mandatory if and only if thechosen hostel has no e-mail box, and the enquiry is from abroad, and there is less than acertain number of days until arrival. Alternatively, under the same conditions a standard

148
message could appear on the screen, which the customer could be required to accept hav-ing read by checking a box:
Dear customer, Your booking enquiry has been forwarded to your chosen hotel by fax.You have not stated any fax reply number on your booking enquiry, and there is too littletime until your chosen arrival for a booking confirmation to reach you by mail. Thereforeyou are required to phone the hostel at your earliest convenience (now or when you get toNorway), in order to get your booking confirmed.
Other more or less intelligent solutions to this issue could of course be developed.
What are the factors which have led to the success of the HIN Internet booking requestsystem?• High penetration of e-mail among the accommodation (here: hostels).• An almost complete penetration of fax machines among the (remaining) accommoda-
tion.• High penetration of Web use in the home market and a couple of other nearby markets.• Especially high penetration of Web use among the young population, a key customer
group.• A well-known brand name.• An easily understandable classification scheme.• Link to an internationally well-known site (www.iyhf.org).• Central quality control of time taken to respond to booking requests and enquiries.• The existence of a well-established national as well as international marketing organi-
sation for the brand.
Clearly the HIN Internet booking request solution has implications for other youth hostelassociations as well as for associations and groups of other types of small accommodationestablishments such as small leisure hotels, B&B, camping etc.

149
6.5 Holiday cottages
6.5.1 The online cottage reservation system of Matka-Ruka Oy, Kuusamo, Finland
Ruka is Finland’s most popular skiing resort, which is located next to the town ofKuusamo, close to the Arctic circle.197 The Matka-Ruka travel and cottage letting agencywas founded in 1988 and is situated in Kuusamo (Matka means travel agency). There are10 people employed at the agency during the winter and eight during the summer. Ofthese, up to four people work with the booking of cottages, two work with incentives andconferences and about three with general travel.
The Finnish market accounts for about 64% of Matka-Ruka’s cottage letting revenue. Theeastern countries (Russia and the three small Baltic countries) account for 12% and otherforeign markets for 24%. Winter is the high season for Matka-Ruka, and accounts forabout half of all bookings. In 1998 a total of 32 400 bookings were received, which, basedon the bookings realised for the Winter season, can be expected to increase by more than1000 in 1999.
Figure 6.11Total no. of bookings (all channels) received by Matka-Ruka per season1996-99
0
2000
4000
6000
8000
10000
12000
14000
16000
18000
1996 1997 1998 1999
To
tal n
um
ber
of
bo
oki
ng
s (a
ll ch
ann
els)
Winter (1/1-14/5)
Spring/Summer (15/5-30/9)
Autumn (1/10-31/12)
Source: Matka-Ruka Oy, Kuusamo, Finland.Note: Summer and autumn bookings 1999 are predictions (by the writer).
197 Kuusamo is reachable by direct flight from Helsinki, which is the convenient way of getting there and back
(www.finnair.fi), or for example by night train from Helsinki to Kajaani (www.vr.fi), and then four hours by amorning coach from there to Kuusamo (254 km), which is the scenic way of getting there (not mentioned onany website). Local buses then go several times a day the last 26 km from Kuusamo to Ruka (not mentioned onany website either).

150
Matka-Ruka in Kuusamo had an internal (stand-alone) electronic booking system for cot-tages from the very beginning in 1988. A text based DOS version of the current bookingsystem was installed at Matka-Ruka in 1992. The booking system was developed by thesoftware house Pehmo Oy, which is also based in Kuusamo in north Finland and has about22 employees. The booking system now comes in a Windows-based version, which Matka-Ruka has installed. The booking server may be connected with a Web server through a so-called Internet bridge, which was first implemented for Matka-Ruka. The Internet bridgewas developed jointly by Pehmo Oy and the Internet Service Provider JSOP Interactive Oyin Kuopio in the middle of Finland, which has about 20 employees. The booking systemitself is works with the languages Finnish, Swedish, English and German, between whichdifferent users are able to switch as or if needed. Additionally a Spanish language versionof the system exist, and a Russian version is being made.198 There are about 20 regions inFinland that use the Pehmo Travel Booking System, which is about a third of the regions,most of which use the system on a stand-alone basis only, i.e. not connected with the In-ternet. The system can be used for many different tourism and travel products, but here wefocus on cottages. The system can run on a normal Pentium PC, or a mini-computer, asserver, and then work-stations with standard Windows 95 or 98 operating systems. Thepreferred operating system for the server is Linux - and a MySQL database. Whenever abooking is made, a fax message is automatically sent to the product owner, i.e. the cottageowner or the hotel owner.199
198 To develop a new language version merely involves the translation of 1400 words, which would probably take
about two or three weeks, and for this procedure there is an application in the system. As a matter of curiosity atrainee from Spain made the Spanish version in six weeks, based on the existing list of the 1400 words in Eng-lish.
199 The product owner (who may have 10 identical cottages or a certain number of identical hotel rooms) may alsoinform the booking centre by a partly precoded fax page of changes in availability, which can be read automati-cally 24 hours a day at the booking centre by means of Optical Character Reading (OCR) technology. The faxsystem is being implemented, and is currently being used by Kuusamon Tropiikki ( a leisure spa), where it isworking fine.

151
Figure 6.12Basic components of an Internet based booking system - e.g. for cottages
Owners of cottages and/or other tourism / travel products
Web-server
Booking-serverw/availability data
Work-stations in local area network
WWW
Internet users
Min. 64 kbps fixed line
=Firewall
Photos, static info.
Auto. fax info. to product owners
The website of Matka-Ruka200 was established in January 1996 and was the first website inEurope where it became possible to book holiday cottages in real-time.201 The site includesall the functions of an Internet based booking system - except payment, but this is planned.By filling in a form the Internet can get a list of the available cottages for a selected period(starting at least one week ahead), in one of five sub-regions (if any preferences) sorted byprice, standard or size.202 The availability data of the cottage booking system is in real-time, extracted directly from the website. Only cottages which are available at the chosentimes are presented to the Internet user.
In 1998 Matka-Ruka received about 2000 Internet bookings and telephone bookings madeon a special telephone number only mentioned on the Internet, corresponding to about 6%of all bookings. Many customers prefer to make the actual booking by phone. The numberof pure Internet bookings - completed booking forms received by e-mail - was about three
200 www.matkaruka.com/ or www.ruka.fi/ or www.travel.fi/int/Ruka/ (+ click On-line reservation system).201 In the airline part of the travel and tourism industry British Midland was earlier, November 1995, and its
solution included payment from the beginning.202 The booking instructions can be found at http://linux.travel.fi/int/Kuusamo/reservation/ohjeita.html.

152
per day in 1998, i.e. about 1000 for the year. This is one of the finest results seen for anytravel and tourism related website in Europe in 1998. In the winter season (first four and ahalf months) of 1998, the Internet percentage was 6%, and in the winter season of 1999this had increased to 9%. For the whole year 1999 the Internet percentage may reach 12%,corresponding to about 4000 bookings.203 The average number of days per letting contractis four days for the whole year, a little longer during the winter season.
Table 6.11 Internet bookings for Matka-Ruka 1996-1999
Year 1996 1997 1998 est. 1999
Total no. of cottages and similar units 750 750
of which in catalogue and on Web 163 163
Average no. of days per booking 5 days 5 days
Available five day periods in total ~ 52 500 52 500
of which for cottages on the Web 11 410 11 410
Available weeks in total (~50 weeks) 37 500 37 500
of which for cottages on the Web 8150 8150
Total no. of bookings 25000 31400 32 400 33 600
Occupancy rate, of five day periods 62% 64%*
Occupancy rate, of available weeks 86% 90%*
Internet bookings in % of all bookings 1 2 6 12
Internet bookings ~ 250 625 1950 4025
Internet bookings in % of:
- available five day periods on the Web 17 35
- available weeks on the Web 24 49
Value per booking, FIM 1800 1900 2000 2100
Internet revenue, FIM mill. 0,5 1,2 3,9 8,5
Internet revenue, $ mill. 0,1 0,2 0,7 1,6
Source: Matka-Ruka Oy, Kuusamo according to JSOP Interactive Oy, Kuopio.* Note: The average occupancy rate for hotel rooms in Finland is 48%.
There are 163 cottages (or similar units) in the Ruka/Kuusamo region in the printed cata-logue of Matka-Ruka, which comprise most of the cottages which are also in the Internetbased booking system, in which one can find up to 103 available cottages in the low sea-son. Each available cottage is described by one to three photos and a ground plan of thebuilding, and there is information on mentioning of distances, the location, facilities of thecottage (14 tick boxes) and its surroundings (fishing, hunting, beach). However, not all the
203 Matka-Ruka itself actually mentions 14% as a target for all of 1999, but that is hardly achievable in light of the
1999 winter season, which accounts for about a year’s bookings.

153
cottages are in the printed catalogue or on the net, since as many as about 750 cottages arelet out by Matka-Ruka at least at some time during the year.
Skiers are typically young people who are heavy Internet users. The Internet is thereforeconsidered to be well suited as a sales/distribution channel for (winter) holiday cottages.
In 1998 break-even had not been reached by Matka-Ruka, but if the projected number ofInternet bookings are realised, break-even may be reached in 1999, as shown in Figure6.13. The straight line represents the initial investment (assumed to have been undertakenby the end of 1995) plus an annual fixed recurrent cost for the Internet Service Provider.The curved line has been generated by multiplying an approximate additional gross profitper Internet booking of 50 FIM with the number of Internet bookings per year mentionedin Table 6.11 for further explanation (see Appendix 6.7).
Figure 6.13Break-even chart for the Matka-Ruka Internet booking system
0
50000
100000
150000
200000
250000
300000
350000
1995 1996 1997 1998 1999
Fin
nish
Mar
ks (
FIM
)
Additional GP,accumulated
Initial investment+ annual costs,accumulated
Note: Interest, which would impact the above investment negatively, has not been taken into account. If an interestrate of about 8% p.a. had been taken into account the Net Present Value of the investment would have beenzero by the end of 1999. Graphically this would mean that the two lines in the above diagram would intersectnot during the year 1999, but by the end of 1999.
An Internet booking system similar to that of Matka-Ruka has also been implemented intwo other regions in Finland, namely Tahko and Pirkanmaa. Tahko appears to comprisejust as many cottages as Matku-Ruka, since it also returns up to about 100 available cot-tages for searches in the low season, and Pirkanmaa, which returns up to about 20 avail-able cottages. In North Sweden (Ammarnäs in the Västerbotten region), the booking form

154
has also been put up on a site, but this site returns no matches - irrespective of the searchcriteria used.204
Future visions - seen from the point of view of Pehmo - for the Internet based bookingsystem implemented by Matka-Ruka, Tahko, and Pirkanmaa in Finland - include the im-plementation of the following possibilities:1. Booking activities, such as ski lift cards, fishing trips, etc.2. Booking tickets for events - on a real-time basis.3. Booking of self-designed packages - including transport.4. Booking of round trips, with overnight stays at cottages and/or hotels in different
places in Finland, which would require the establishment of the systems in more placesin Finland.
5. Implementing systems internationally - more in Sweden, Russia, other countries.
The reasons for its success - as reflected in the high percentage of Internet bookings for theKuusamo cottage booking system at Matka-Ruka - include the following:• A significant incentive for making Internet bookings (FIM 60 ~3% for Finns, FIM 180 ~9% for foreigners).• A world record high Internet penetration in Finland in general (30%+), and even
higher among the young - skiing - population of Helsinki (from where the Finnairflight to Kuusamo leaves).
• And certainly: a super product and a well-functioning website - with no requirementfor payment online.
6.5.2 Danish holiday cottages - A general overviewHoliday cottages play an important role for tourism to and in Denmark. Out of about 44million tourist nights p.a., holiday cottages accounted for 16.6 million in 1998. The geo-graphic distribution of person-nights in Danish holiday cottages was as follows in 1998:Germans 80%, Danes 11%, Norwegians 4%, Swedes 2%, Dutch 2%, Others 1%.
The number of let out cottage-weeks by Danish agencies was 522 000 in 1998. In full-week equivalents it was exactly half a million. The number of contracts, i.e. bookings, was343 000. This means that each booking (contract) was for one and a half weeks on aver-age. Germans typically book two weeks, Danes typically one week.
There are about 124 cottage letting agencies in Denmark, which have a total of about35 000 cottages in their main catalogues. Four big cottage letting agencies have about 63%of these cottages: DanCenter 8000 (after the take-over of Larsen Ferienhäuser with 2000cottages late in 1997), dansommer 5000, Novasol 5000, and Sol & Strand 4000, i.e. 204 For links to all these four sites, please see www.travel.fi. 75% of the visitors to this domain are from Finland.

155
22 000 in total (which leaves some 13 000 for the remaining 120 small and medium-sizedagencies). The four large agencies probably account for about 2/3 of the let out weeks andmost likely at least 2/3 of revenue.
Additionally 10 000 Danish cottages are let out for at least some periods of the year, i.e.2000 were too late for the catalogue but are let out by Danish agencies anyway, some arelet out by foreign agencies (such as Wolters, 1000), and some are let out privately (7000).All in all about 45 000 Danish cottages are let out at least some periods of the year, where-as the rest of 194 000 holiday cottages in Denmark are for private use only.
Two of four large Danish cottage letting agencies started letting out via the Internet in thespring of 1998, namely dansommer, which came first with its booking site at the begin-ning of March; by the end of April 1998, Sol & Strand followed. dansommer (alwayswritten with a lower case d) marked the establishment of this function by a full-page ad-vertisement in a Danish national paper. It was too late for dansommer to mention functionin the catalogue for the 1998 season, which goes to print early. Sol & Strand did not makeany special efforts to make the new function known.
The two other large letting agencies DanCenter and Novasol opened their Internet bookingsites at the beginning of 1999. All the solutions are with real-time availability data,205
interactive search functions (which return only the available cottages for given periods),prices and reservation functions. None of the solutions comprise on-line payments. Theexplanation is that holidays (certainly in cottages) are typically booked a long time (4-5months) ahead and therefore there is plenty of time to settle payment by traditionalmeans.206 And in general, certainly in Europe, holiday-makers and travellers are to someextent reluctant to pass their credit card details across the net.207 For last minute bookings(defined by dansommer as the last two weeks), preliminary reservations which are validfor three days can be made. Within this specified period of time the customer must contacta travel agency or the letting agency directly to arrange for payment.The four large Danish cottage letting agencies have different sales strategies. Sol & Strandonly sells directly, whereas the other three exclusively or mainly sell through travel agents,for example on the main market, which is Germany. Therefore Sol & Strand is not
205 Or practically real-time. Sol & Strand updates its availability data every two minutes, according to Internet
developer Orla Mortensen, Sol & Strand, June 1999. Earlier on it was every five minutes, cf. Marcussen, Janu-ary 1999.
206 Additionally, the Internet payment situation as far as the Danish market is concerned was unsettled until changeof the Law of Payment Cards by the Danish parliament in April 1999, cf. Appendix 2.6.
207 In the UK it has been found that more people are willing to purchase holidays on the net if they do not have togive credit card details on the net (www.euinus.com/320.html, 1998 Consumer Survey Summary), cf. alsochapter 2.5. On top of the resistance against Internet payments on the part of the consumers, there is a cost in-volved on the part of the supplier for receiving credit card payments of around 1%-2% (going into the pocketsof third parties), which in the last resort would have to be paid by the consumer as well.

156
bookable through the travel agent booking system Start, whereas the three others are. Ineffect Danish cottages are distributed in practically the same way as tour packages. And infact dansommer and other large Danish cottage letting agencies are ranked high on the listof top tour operators in Germany - and in Europe - both by revenue and (especially) bynumber of participants.208
This sales/distribution strategy is also reflected in the booking solution implemented onthe dansommer website as well as on those of DanCenter, Novasol and many tour opera-tors in the German market, from which reservations can only be made after the Internetuser has chosen a travel agent to fulfil the purchase (issuing of documents and collectionof payment partly or in full, depending on how long there is until the start of the holiday).In 1998 dansommer got more bookings than Sol & Strand through the Internet, whereasDanCenter and Novasol had not started yet in 1998.209
6.5.3 dansommer - A Danish cottage letting agencyIn 1998 dansommer was the number one Danish cottage letting agency in terms of thenumber of bookings received. dansommer is keeping a relatively high profile in the Inter-net field, for example via a banner ad on the website of the German travel trade magazinefvw. The writer therefore holds that it can be taken for granted that dansommer is main-taining its leading position in terms of Internet bookings received in 1999.
208 Revenue per participant (i.e. not per booking) is relatively low for holiday cottages. DanCenter, which took
over the number five in the market in 1997 (Larsen Ferienhäuser) has a greater number of holiday cottages inDenmark than any other letting agency, but has traditionally not contributed data to the annual listings of Ger-man and European tour operators in the fvw magazine. Novasol, contrary to the other three major Danish cot-tage letting agencies, has more cottages outside Denmark than in it (as detailed in table 6.2 in a book in Danishby Marcussen, 1998, p. 99).
209 cf. Rørth, Charlotte, 1998, Succes med udlejning via Nettet, article in Danish in the national newspaper Jyl-lands-Posten, Digitalt section, 24 June, p. 2.

157
Table 6.12 Internet bookings for dansommer - realised and expected
Bookingyear
Total No.let outweeks
% of allweeks
booked viaInternet
No. ofInternetbookedweeks
Internetrevenueper week
DKK
Internetrevenue,
mill.DKK
Internetrevenue,mill. $
Weeks perInternetbooking
No. ofInternet book-
ings,approx.
1997 - 0 0 - 0
1998 0.8 700 4200 3 0.4 1.4 500
1999 80 000 7.5 6000 4400 26 3.9 1.5 4000
2000 15 12 000 4500 54 8.1 1.5 8000
2001 25 20 000 4600 92 13.7 1.5 13 300
Source: Based on dansommer statements (% columns and no. of booked weeks).Note: For the purposes of this case study the writer has assumed that the no. of weeks let out remains constant at 80
000. This is 16% of the full-week-equivalents let out by all Danish cottage letting agencies(500 000), generated via about 14% of the cottages let out by the Danish agencies (i.e. by about 5000 of 35000 cottages in main catalogues).
In the booking year 1998, dansommer received about 600 bookings for a total of 700weeks, generating revenue of DKK 3 million ($0.4 million; 1$ = DKK 6.7 in 1998). Thisin turn corresponded to about 0.8% of dansommer’s total revenue for the booking year1998.210 The booking year is somewhat earlier than the calendar year, running from aboutOctober to September. The dansommer site was opened late in the booking year 1998,which effectively only comprised a few Internet sales months, and therefore the 1998 and1999 booking year data cannot be compared directly. But for the booking year 1999 (thefirst full booking year) the expectation is that a total of 6000 weeks will be booked throughthe Net (~4000 bookings), corresponding to about 7.5% of total number of weeks as wellas of revenue. For the booking year 2000, the Internet is expected to account for 15%, andin the year 2001 for about 25%-28% (interpreted by the writer as 25%) of dansommer’sbookings (as measured by number of weeks and revenue). How high the percentage will bewill to a great extent be determined by how quickly the penetration of the Internet willincrease amongst the German population, and the willingness of Germans to make reser-vations for holidays on the net.
dansommer has no intention of deviating from its traditional distribution strategy - asreflected in its current Internet booking procedure for the German market211 with its finemeshed net of agents - as long as sales through travel agents continue to give satisfactoryresults.
210 In other words, total revenue for the dansommer group per year on all markets is around DKK 400 million ( ~
DM 100 million), which is confirmed in the annual listings by the fvw magazine, Europäische Veranstalter inZahlen, and Deutsche Veranstalter in Zahlen.
211 cf. the aforementioned procedure of selecting a travel agent to fulfil the Internet booking.

158
Table 6.13 shows the great importance of the Internet for dansommer, certainly from 1999and onwards, by market. The importance of the Internet increases so quickly that the In-ternet percentage is markedly greater for the calendar year 1999 (to date) than for thebooking year 1999, which includes three (slow) months from 1998, cf. the aforementioned7.5% for the booking year 1998 vs the 10% for the first five months of the calendar year1999. Let us call this result by its right name: a world-class result, only challenged by oneother cottage letting agency in Europe in relative terms (Matka-Ruka in Northern Finlandas described elsewhere), and in absolute terms dansommer looks set to become the numberone cottage letting agency in Europe in terms of Internet revenue in 1999 - and beyond themillennium.212 It is noteworthy that the Internet accounts for a marginally larger percent-age of revenue than of the booked number of weeks. This means the that Internet - in thecase of the dansommer product - is not just used by the customers to search for and tomake reservations for bargain holidays.
Table 6.13 The importance of the Internet for dansommer as a distribution channel -for the booking period January-May, 1999
Currency % of all weeks via % of value via Approx. weight, an
Market (1) Internet per market Internet per market educated guess (2)
Germany DM 6.9 7.0 77.5%
Denmark DKK 21.9 22.5 13.5%
Norway NOK 22.1 22.8 4%
Netherlands NLF 6.9 7.6 2%
Sweden SEK NA [~22] NA [~22.5] 2%
Others - NA [~22] NA [~22.5] 1%
Total 10.0 10.2 100%
Source: dansommer, for Germany, Denmark, Norway, NL and the total.The weight per market is the writer’s assumption, as is the importance of the Internet for Sweden and others.
Notes: (1) Strictly speaking, the percentages of weeks and value are per currency, not per market. For dansommerpart of its sales in DKK, based on the Danish language catalogue etc. is to non-Danes. For all practical pur-poses the currencies and the markets can be equalled as shown. Because of this detail, Denmark (dansommersales in Danish currency) carries a slightly higher weight for dansommer than one should otherwise assume -for example based on the general market statistics (for number of registered overnights by nationality). (2)This is the percentage-distribution of the total number of tourist nights registered by all Danish cottage lettingagencies (i.e. not alone for dansommer) in 1998 according to Denmark’s Statistical Office, as already men-tioned in the beginning of this case study, +2.5% for Denmark (DKK), and -2.5% DM, which makes the to-tals fit.
During the first few months after the implementation of the booking function in 1998, thehome market generated more Internet revenue than the main market. But in 1999 the
212 The Internet revenue of dansommer for 1998 (which was short for dansommer, especially if we look at the
booking year) was surpassed by the Matka-Ruka (winter) cottage letting agency in northern Finland. dansom-mer and Matka-Ruka are about equal in relative terms during the first half of 1999. But in absolute terms, dan-sommer is generally a much larger business than Matka-Ruka.

159
situation was reversed. Although Danes (and Norwegians) in relative terms generate threetimes more Internet revenue than Germans, in absolute terms Germans generate the great-est Internet revenue.213 The Internet has led to some, albeit few, bookings from marketswhich are not covered by dansommer’s general sales organisation, such as Switzerland, soin this sense the Internet has given distribution access to new markets.
dansommer has used one page - in its thick-as-a-brick (865 pages!) printed catalogue toexplain to (potential) customers how to make bookings via the net. This, together withadvertising and word-of-mouth, has meant that potential customers have become muchmore aware of the Internet booking possibility in the first half of 1999 than they were in1998, and during the same time web use in general has increased. German travel agentsinvariably make bookings for dansommer cottages via their START work-stations (soobviously they value their time more than the START booking fee), whereas a few of theDanish tourist bureaux, which have a relatively low volume of bookings for dansommercottages, use the net when booking dansommer cottages.
Disregarding businesses which are exclusively Internet based (and therefore by definitionget all their revenue through the net), and looking across all kinds of travel and tourismproducts in Europe, it is perhaps no coincidence that one finds the highest proportion ofInternet bookings among holiday cottage agencies. Three of the very highest Internetbooking percentages among traditional travel and tourism businesses in Europe (in 1998and in the first part of 1999) are all found within the holiday cottage category. How canthis be explained? There is a great proportion of repeat visitors among those who bookDanish (and probably also Finnish) holiday cottages. The question is, is part of the tre-mendous success (everybody will have to agree that this is an appropriate way for thewriter to describe the results demonstrated for the first part of 1999) of the medium fordansommer (as well as for Sol & Strand and for Matka Ruka) partly due to the fact thatthe guests know the product and perhaps even the individual cottage in advance fromprevious visits? By doing research among their customers dansommer itself could find aprecise answer to this question.
Reasons for success - certainly in the first half of the calendar year 1999 - for dansommer:• A high proportion of repeat visitors, perhaps even down to the individual cottage level.
Therefore many customers feel that they know the product quite well in advance.• A well-known brand, a classification system - and furthermore many luxury cottages.• A high penetration of web-use in Scandinavia.
213 This is evident when multiplying the percentages in the two columns to the right in Table 6.13, although the
weights are only approximate.

160
• Mention of the Internet booking function in the printed catalogue, which comes out inmultiple languages, in high volumes, as well as mention in many other forms of mar-ket communication broadly defined.
• High awareness among potential customers of the Internet booking function (cf.above).
• Possibly the tying-in of the travel agent link on the main market, which can reassurethe customer of the good choice of holiday and the specific holiday cottage.
• Payment off-line, by traditional means.
6.5.4 Sol & Strand - A Danish cottage letting agencyFrom May 1998 to end of May 1999 Sol & Strand received bookings for 3200 cottageweeks via the net. During the first five months of 1999 alone, bookings for 2200 weekswere received via the net, corresponding to 10% of all weeks booked during this period!There are about 1.5 weeks per booking.
A technical piece of information worth mentioning here is that Sol & Strand has imple-mented a Virtual Reality function on their site cottages. This means that the Internet usercan get a 360 degrees Virtual Reality (VR) view inside the cottage as well as of its sur-roundings. In the first instance the function has been implemented for 12 cottages (all withoutside and two with inside panoramas). The aim is to implement the function for as manyas 10% of the cottages from June to September or October 1999 (i.e. for 400 cottages).214
This must be interpreted as outside panoramas, since obviously it is relatively easy to makethe outside recordings without disturbing anyone.
The investment in the necessary software was only $60 which Sol & Strand undertookafter the firm’s Internet developer had participated in a cheap one-day course. Obviouslythere are considerably more costs involved in having two photographers or cameramendriving around the country (for about four months) to make the digital panoramas. Withinthe firm the danger of demystifying the holiday experience has been considered. But themain thing for Sol & Strand has been to make the customers as well informed as possiblebeforehand. The development within the Internet field will potentially be able to make alarge part of the normal marketing via catalogues superfluous. But the traditional cata-logue, of which Sol & Strand prints 240 000 copies p.a. (650 pp., 1.3 kilos each!) will bemaintained for many years to come in spite of the Internet booking and VR functions,according to Messrs. Kaj Frederiksen, MD, and Internet developer Orla Mortensen, Sol &Strand.
214 Norhagen, Poul, 1999, Kig ind på ferien (in Danish, meaning: Have a look into the holiday), Jyllands-Posten,
Digitalt section, 2 June 1999.

161
There may be some savings in the field of catalogue use because of the Internet. But nor-mally the printed catalogue is used in conjunction with the electronic catalogue on theWeb. Often customers go to the website and search for available cottages before theyphone the sales agents. It takes time to change customer behaviour towards less use ofprinted catalogue and to complete the booking via the net. But the change will come. Anincreasing number of people use the electronic catalogue either for looking or looking andbooking. Therefore the Internet shop is being extensively developed with regards to func-tionality and visual presentation, whereas the printed catalogue remains as it is. The signalto the customers is clear: If you want to know more, then use the electronic catalogue inthe self service shop.
6.6 Camping
6.6.1 Camping in Europe - An overviewAs shown in Appendix 2.1, camping is a popular form of holiday among Europeans, espe-cially for holidays within the holiday-makers’ home country. Every sub-sector - and everymajor company - in every industry from manufacturing to tourism seems to be able todefine themselves in such a way that they become number one or two. This also goes forcamping as a form of accommodation in Europe:
The camping/caravanning sector provides some 10.8 million tourist beds in Europe. It istherefore the largest single tourism reception network in Europe and in terms of provi-sion, comes ahead of traditional hotel business with 8.7 million beds.215
Let us check with Appendix 6.1 as to number of beds: independently of the above, thewriter has estimated and/or found almost exactly the same number of hotel beds in Europe,at least in 1995 where there were 8.9 million hotel beds in W.Europe, although this hadincreased to 9.4 million in 1997. This serves to verify both the above quote and the num-bers in Appendix 6.1. Also this cross-check serves to give confidence in the number of10.8 million tourist beds in the camping/caravanning sector in (Western) Europe - al-though many holiday-makers in this sector bring their own bed, so to speak.
The European Federation of Campingsite Organisations (EFCO) represents an industry ofsome 20 000 holiday parks within the EU - plus Croatia, Hungary, Norway and Switzer-land. EFCO claims that European Commission research indicates that the sector receivesno less than 22% of all holiday makers in Europe, on average each year.216 This claim,however, does not fit with another piece of EC research referred to by this writer in Ap-
215 www.campingeurope.com/ (EFCO’s website).216 The precise reference has been requested from EFCO.

162
pendix 2.1, namely the pie chart which showed that 14% of Western European holiday-makers used camping as their form of accommodation in 1997-8.217
Now we can begin to understand the 10.8 million tourist beds given for European campsites: with 20 000 sites there are 540 tourist beds at each (in tents, caravans, mobilehomes, etc.). About German camping sites we also know that there are some 3000 of them– two-thirds of which have less than 250 camping spots, with 100-200 as the most com-mon number, and 234 the average. This means that camp site owners frequently need asecond job to make a living.218 Since the average number of spaces at each camp site forEurope as a whole is probably about 200 (i.e. a little below the average for Germany), thismeans that it appears to have been assumed that there are 540/200=2.7 tourist beds percamping space (=the average party size), which seems a fair assumption (since few campalone, and many bring children).
It should be noted, that camping is characterised by:• a very short season (in Denmark, for example, 79% of camping tourist nights were
counted in June, July and August, with 44% in July alone);• low revenue per visitor;• few employees per camp site (including the owner), and camp sites are generally very
small businesses in terms of average annual revenue;• camp sites presumably have a similar or lower IT-level than youth hostels (where the
fax-machine is the most advanced piece of IT and telecom hardware installed);• camp sites places are often not booked in advance.
These typical characteristics of camp sites mean that sophisticated solutions will have littlechance of reaching any significant degree of acceptance among the proprietors in thissector. Today the majority of camp sites have a fax-machine. In Denmark fax machinepenetration among the 500+ camping sites is 99%, but this is partly because the presenceof a fax machine is one of the criteria used by the national classification authority in thecountry. For comparison, fax machine penetration is only about 80% among German campsites, which can probably be considered a maximum percentage for European camp siteson average.
From the descriptions of rental mobile homes and the facilities at camp sites provided onthe web, it is quite obvious that a camping holiday can be both a comfortable, affordableand child-friendly way of taking a holiday.
217 EC DG 23, Facts and Figures on the Europeans on Holidays, 1997-1998, Executive Summary, March 1998,
A Eurobarometer survey carried out on behalf of the European Commission Directorate General XXIII.218 www.ecamp.com/d/camparc/camppa5f.htm - Eine Strukturanalyse der deutschen Campingplätze.

163
6.6.2 eCamp, SASS GmbH, GermanyWe shall now focus on eCamp of SASS Unternehmensberatung GmbH, Hamburg. Thefirm was founded in 1986, currently has 12 employees, and develops guest managementsystems for camping sites.219 The eCamp website was opened in March 1997 and com-prises a directory of practically all the camp sites in Europe. Currently 19 500 camp sitesfrom all across Europe are included in the database.220 The Internet user can choose be-tween six languages.
Figure 6.14No. of camp sites per country on the eCamp website
0 5 0 0 1 0 0 0 1 5 0 0 2 0 0 0 2 5 0 0 3 0 0 0 3 5 0 0 4 0 0 0 4 5 0 0
U K
G e r m a n y
F r a n c e
I ta l y
N e t h e r l a n d s
S p a i n
S w e d e n
N o r w a y
D e n m a r k
S w i t z e r l a n d
G r e e c e
A u s t r i a
B e l g i u m
P o r t u g a l
F i n l a n d
L u x e m b o u r g
Rep . I r e l and
E . E u r o p e / T u r k e y
N o . o f c a m p s i tes in w w w . e c a m p . d e
Note: The total for the countries and regions shown is in fact about 19 300, as of June 1999.In France there should be a grand total of at least 6000 camp sites, of which only 2500 are included ineCamp. In Finland only 160 of 600 are included. In Turkey there should be 300, none of which is included.Further out around the Mediterranean, Israel, with about 125 sites is not included. In general there is the issueof defining exactly what a camp site is. There should at least be a telephone, otherwise it is hardly contac-table. But what about auto camper parking places, of which eCamp has 3500 addresses which are not in-cluded above?
219 Its main product remains the CAMPDAT system, www.sass.de/produkte/index.htm. The address of the cCamp
website is www.ecamp.com (and several synonyms).220 The number of camp sites listed by eCamp almost equals the total number of camp sites mentioned by EFCO,
but the EFCO number is largely for Western Europe only, whereas the eCamp website also includes manyEastern European countries.

164
One important thing (in an Internet distribution/sales/booking context) to mention here isthat it is possible to send booking enquiries as well as requests for general informationfrom the website via e-mail to the firm SASS GmbH in Hamburg, which in turn transmitsthe message via an automatic fax to e-mail translation mechanism on to the camp sitechosen by the Internet user. Those camp sites with no fax machine will receive the enquiryby ordinary mail. Camp site owners are charged ECU 1.50 (DM 3.00) per fax-enquiry, butonly those relatively few sites which have signed an advertising contract with eCamp, somost are free riders in the eCamp system. In the long run eCamp hopes on some return oninvestment via such things as making its name known through this service, and subse-quent sales of web advertising and products such as its (stand-alone) booking system forindividual camp sites.
For a fee it is possible for camp site owners to participate in eCamp in more visual waysthan the basic free listing. Thus at the moment 83 camp sites (0.4%) have chosen by buymore or less comprehensive electronic advertisements (home-pages) under the auspices ofeCamp, of which 56 are German. About 10 camp sites show last minute offers on theeCamp website.
Another important thing to mention is that 30 camp sites provide availability data on-line- in addition to all the basic details about the camp sites, including photos and prices. Theavailability data reside at an internal electronic bookings system running on a PC (whichin turn is connected with the eCamp Web server). The frequency of updating the avail-ability varies between the 30 on-line bookable sites, since this is up to the individual campsite managers. It is possible to make these camp sites’ website return available offers forgiven periods, and then to submit a booking request for one of these, but the booking is notvalid until the camp site owner has confirmed the request! 221
Table 6.14 Some statistics on the eCamp website
Year Webvisits per day
No. of e-mail to faxenquiries per day
(to one of all the 19,500 camps)
No. of Internet bookings per day (toone of 30 on-line bookable camps)
1997 100 ~10 01998 300 16 21999 (first 5 months) 1250 33 31999 (predicted) ~1250 33 3
221 Example: www.wulfenerhals.de, named by ADAC as one of nine super camp sites Germany, and one of 54 top
camp sites in Europe. Occasionally there seem to be some problems with making the site return available offers,irrespective of choices. But on 1 June the writer managed to make the site return 54 available offers for the pe-riod 10 to 12 June (mainly spaces for caravans at DM 78 for two nights, but also mobile homes at DM 128 orup to DM 168). Other top German camp sites with booking websites include: www.wallnau.de, also on the Isleof Femern.

165
eCamp considers itself to be the number one camping website in Europe - in terms ofInternet-generated sales on behalf of the camp sites involved (i.e. via the e-mail to faxservice and via the on-line booking function). The writer has found no reason to call thisinto question.222
The revenue generated for the firm SASS itself, which owns the eCamp website, has notbeen enough to reach break-even for its initial Internet and recurrent annual cost. All inall the costs have been about DM 250 000. The initial development costs were about DM100 000, traffic (telecom) costs are about DM 40 000 per year (~1998), and the annualcosts of updating and revising the website are about DM 25 000.
As to the outlook for eCamp for the year 2001 Mr. Sass has become very sceptical! Mr.Sass regards the application of the Internet by camp sites in Europe in general - as a pro-motion tool and sales channel - as being in a very embryonic stage in the middle of 1999.In spite of his scepticism about the relatively near future (until and including 2001), Mr.Sass does believe that the Internet will become a more important platform for sellingcamping holidays in general.
222 For example www.eurocamp.co.uk (of Holidaybreak plc, formerly Eurocamp plc) does not offer Internet
bookings for its over 200 sites in 11 countries. Neither does www.keycamp.co.uk/ (also of Holidaybreak plc),but is does offer an availability checking service for its 115 sites in eight countries. Group revenue of Holiday-break plc was £114 million and the group had over a million participants in 1997/8, including Eurocamp UKwhich had revenue of £48 million, and 260 000 participants in 1997/8 (fvw 13/99 pp. 14-15). Although Holi-daybreak plc (with Eurocamp and Keycamp) is huge within camping in general there is no camp site bookingfunction on the net under its auspices.

166

167
7. Distributing European package tours on thenet
7.1 Introduction to European tour operators on the net - Amarket overview
Revenue and participant numbers for each of the major European tour operators developall the time. The major players generally grow faster than the market average. Mergersand acquisitions take place nationally as well as across borders, and each of the travelgroups is frequently being restructured, and ownership changes. For the financial year1998 (running from late 1997 to late 1998), the situation was as shown below.
Figure 7.1 The top 10 tour operators in Europe (financial year 1998)
0 2 4 6 8 10
TUI, Germany
Airtours, UK
C&N, Germany
Thomson, UK
Kuoni, Switzerland
First Choice, UK
LTT, Germany
Nouv. Front.,France
Club Med, France
Hotelplan,Switzerland
Clients, 1998(millions)
Group turnover,1998 (* DMbillion)
Source: fvw - Europäische Veranstalter in Zahlen, Dokumentation 1997/98, 28 May 1999 (fvw 13/99).Note: The revenue and participant (client) numbers include not only the home market, but also foreign markets. For
Thomson, Kuoni and First Choice, the participant numbers are estimates only.

168
Now to the situation per market in UK, Germany, Switzerland and the Nordic countries.The following is largely based on fvw - Europäische Veranstalter in Zahlen, Dokumenta-tion 1997/98 (and 1996/97).
7.1.1 The UKWhen looking at the corresponding situation in some of the major markets, specifically theUK, there is at least one difference in the rankings, because the operators differ as to thedegree to which they get their revenue from their home market. Thus on the UK market,Thomson ranks ahead of Airtours, although for all markets under one, Airtours’ revenue isgreater than that of Thomson. Airtours PLC states in its 1998 annual accounts and on itswebsite that it is the largest package holiday company in the world. This is by number ofparticipants (not by revenue).223
The total package tour market in the UK should be 18 million participants per year(airbased), according to the CAA (fvw 13/98 pp. 5 and 22). Assuming that the air-basedtours account for 80% of all packages, the total was about 22.4 million packages. The totalvalue of the UK package tour market was about DM 22 billion (£7.4 billion or $12 bil-lion). The average price on the UK market was about DM 962 in 1998 (£330 or $547).
223 According to fvw 13/99 p. 13, the Airtours Group sold 9.4 million package tours in 1998 worldwide, which
tops the 8.5 million mentioned in its annual accounts of 1998, where it states that it is the world’s largest pro-vider of air inclusive holidays. The TUI Group had greater revenue in 1998 than the Airtours Group, cf.Figure 7.1, but the Airtours Group had more clients than the TUI Group.

169
Figure 7.2 Market shares among tour operators in the British market (by value,1998)
Thomson UK24%
Airtours UK18%
First Choice UK14%
Thomas Cook UK / Carlson Leisure
11%
Cosmos/Avro4%
Kuoni UK4%
Others25%
Source: Based on data from fvw 13/99 supplemented with own estimates for Thomas Cook, Carlson, and others.Note: Thomas Cook and Carlson Leisure Group UK have merged. After the merger the UK company carries over
2.5 million package holidaymakers a year (was stated by www.hotel-on-line.com, 4 Oct. 1998, and is re-peated at the Thomas Cook Web-site). According to CAA, the Civil Aviation Authority in the UK (cf. fvw14/98), Carlson Leisure Group UK was licensed to carry 0.4 million participants, and assuming it did that,this means that Thomas Cook carries 2.1 million. Assuming prices close to the market average, the revenuefigure and corresponding percentages for Thomas Cook and Carlson Leisure in the above figure have beenestimated.
Thomson Travel Group is the market leader in the UK - meaning it sends more Britons onpackage holiday tours than any other tour operator.224 Thomson Travel Group was floatedon the London Stock Exchange in May 1998. Before then it was part of The ThomsonCorporation, Canada. Thomson Travel comprises the tour operators Thomson Holidays,Skytours, Portland Direct and Crystal.225 Holiday Cottages Group (with 9000 cottages inthe UK, Rep. Ireland, and France), the travel agents Lunn Poly (with about 800 outlets),Budget Travel of Dublin (with another 50 outlets), and the charter airline Britannia Air
224 4.7 million from the UK in 1997, fvw 24/98, p. 70.225 www.thomson-holidays.com/. Crystal is Britain’s No. 1 Ski Specialist Tour Operator, and was acquired by
Thomson Travel in 1998. Crystal should have over a thousand employees (www.crystalholidays.co.uk/).

170
(the world’s biggest holiday airline - with 41 planes) are also included in the group. InDecember 1997 Thomson bought Fritidsresor, Sweden’s and Scandinavia’s second biggestoperator, which includes a wholly-owned Danish subsidiary, Star Tour. (ScandinavianLeisure Group - with Ving and several other brands - is the largest). The FritidsresorGroup in Scandinavia has 1.3 million participants per year. In the Thomson Travel Groupthere are a total of 10 333 employees (1998).226
Airtours is number two in the British package tour market, but internationally, Airtours islarger than Thomson. In the Airtours Group there were over 20 000 employees in 1998.Over 50% of the 8.5 million Airtours holidays in 1998 were sold outside the UK.227
7.1.2 GermanyIn the German market each of the top six tour operators has a turnover of more than DM1.2 billion and more than 1.2 million participants each in 1997/1998. The DER group,which ranks as number four on the German tour operator market, and is one of the top 20tour operators in Europe (by revenue), only gets a limited part of its revenue from the touroperating business, its main business being travel retailing. Thus, when looking at alltravel related business under one roof (tour operating plus retail, etc.), DER is one of thevery largest travel groups in Europe.228
In 1997/1998 the top six tour operators in the German market had almost 17 million par-ticipants per year, the top 10 had 19 million participants (of which about 70% were air-based tours), and the top 55 have 24 million participants (of which 65% were airbasedtours), and DM 25 billion in revenue.229 The total market back in 1997 was about 28 mil-lion package tours (Veranstalterreisen), which increased about 5% during 1998.230 Ger-many is the largest tour operating market of the world. For TUI the average price perparticipant was DM 1296 in 1997/1998. For the top six operators, the average price wasDM 1096; and for the whole German market the average price was DM 1046.
226 With 6000 employees, Lunn Poly, the UK’s No. 1 travel agent - with around 800 Holiday Shops throughout
the UK, is a major contributor to the total number of employees in the Thomson Travel Group (www.lunn-poly.co.uk).
227 Airtours Annual Report & Accounts 98.228 In fact only second to TUI by revenue in 1996/1997.229 fvw 28/98, p. 3 and fvw 28/97, pp. 3 and 11.230 Graph by shown by www.drv.de, based on Urlaub & Reisen ’98.

171
Figure 7.3 The top 10 tour operators in the German market 1997/1998
0 1 2 3 4 5 6 7
TUI Deutschland
NUR Deutschland
LTU Touristik
DER Tour
ITS
Frosch Touristik
Alltours
Öger
Kreutzer
Studiosus
Participants,million
Turnover,billion DM
Source: fvw 28/98, p. 3.
7.1.3 SwitzerlandThe total Swiss package tour market was worth DM 3.6 billion (SFr 3 billion), and hadjust under 3 million participants (clients) in 1998, and an average package price above theEuropean average. In Switzerland, the top three package tour operators (Kuoni, Hotelplan,and ITV) account for about 75% of the market. Another 13% is held by number four andfive, leaving 12% to the rest.

172
Figure 7.4 Distribution of the Swiss package tour market (by value, 1998)
Kuoni Switzerland30%
Hotelplan Switzerland
ITV19%
Reisebaumeister9%
SSR Reisen4%
Others12%
Source: Based on fvw 13/99, p. 12.
ITV, which is a new player on the Swiss market formed in 1997, consists of Imholz, thedirect seller Vögele and TUI Switzerland. Initially TUI only had a minority stake in ITV,but organisationally ITV is associated with TUI Germany. From June 1998 TUI’s share inITV was 60%. The new number three in the Swiss package tour market, ITV, is already asignificant player, and was not particularly welcomed by the number one and two in themarket, to say the very least.
However, in June 1999 it was announced that ITV and Kuoni from then on will be cooper-ating in a number of fields in the Swiss package tour market. At the same time with retro-spective effect from October 1998, it was agreed between Jelmoli, TUI and Vögele, theowners of ITV AG (the tour operator) and IVG AG (retail), that all shares of ITV/IVG aretaken over by TUI Suisse AG. TUI Suisse AG in turn is 100% owned by the Hapag Tour-istik Union (HTU). Finally, until the end of 1999 Kuoni Reisen Holding has the option toacquire 49% of the shares in ITV/IVG. 231
231 www.tui-presse.com, press release, Hannover, 17 June, 1999, cd. also fvw15/99, pp. 1 and 16-17.

173
7.1.4 The Nordic countries: Sweden, Denmark, Norway, FinlandThe Nordic market (here defined as the three Scandinavian countries plus Finland), thevolume of which is about 5.0 million packages p.a., is dominated by two British players,which hold 69% of the market. Airtours owns the Scandinavian Leisure Group, which hadjust over 2 million participants in 1997/8 (40% market share).232 Thomson owns the Fri-tidsresor Group, which had 1.45 million participants (29% market share). And with effectfrom 2 October 1998, Kuoni Travel Holding, acquired a group of three Danish operators,with had 148 000 participants p.a. in total.233 This gives Kuoni a 3% share of the Nordicmarket, but if looking at the Danish market only, the volume of which is about 1.2 millionpackages p.a., their share is 13%. So, now 72% of the Nordic package tour market is inforeign hands. Locally owned operators lead in the Finnish market (0.95 million partici-pants p.a.).234
Figure 7.5 Distribution of the Nordic market for package tours by owners(1997/1998-volumes)
Airtours (SLG)45%Finnair
subsidiaries8%
Kouni subsidiaries3%
Apollo6%
Others11%
Thomson (Fritidsresor
Group)27%
Source: Based on published data: The Association of Tour operators in Denmark according to Rasmussen (1999);fvw 13/98; www.aftenposten.no, 23 April 1998 (Holm, Per Annar, Loyalty program for charter holidays);www.ving.se; Airtours Annual Report & Accounts 98. For details see Appendix 7.1.
Note: The total volume was about 5.0 million packages.
232 Cf. Appendix 7.1.233 The largest one of these was Larsen Rejser, which had 59 000 participants in 1998. Simons Charter and Hern-
ing Rejser had about 45 000 participants each, according to the Association of Tour Operators in Denmark (JP17/4 99).
234 www.aurinkomatkat.fi/ and www.finnmatkat.fi, owned by Finnair.

174
7.2 Tour operator packages on the InternetThe relevance of the Internet as a direct sales channel from the tour operators to the con-sumers depends on whether or not direct sales are included in the sales strategy of each ofthe tour operators at all, and to what extent direct sales are considered a relevant strategynow or in the near future.
In the UK and Germany, the traditional sales channel for package tours is through travelagents. In the UK currently 90% of package tour sales go via travel agents (according tothe Monopolies and Mergers Commission (MMC), as well as statements by several touroperators). But all the tour operators have call centres or a direct sales subsidiary. Forexample, Thomson has a direct sales operation called Portland Direct, and Airtours hasrecently acquired the Glasgow-based Direct Holidays. This will take Airtours into directselling for the first time. First Choice has got the direct sales brand Eclipse. Finally, thelast of the big four in the UK package tour market, Thomas Cook, has two large call cen-tres each employing 500 people, which should make it the largest in the UK in this field.Kuoni UK formed a call centre in 1997 with 50 employees.
The 10% direct sales in the UK market corresponds to about 2.2 million package tours p.a.Of these, Direct Holidays accounts for 200 000 (7% of Airtours packages); Eclipse ac-counts for just as many, i.e. another 200 000 (9% of Airtours’ packages); Portland Directfor just as many as the first two together, i.e. 400 000 (9% of Thomson’s packages) -Clearly, Thomas Cook can only be the leader in the field of direct sales through call cen-tres if it sells more than 400 000 package tours p.a. through that channel. But if ThomasCook sells more than this number of packages through its call centres (its own brand +others, probably in the ratio 4:6), it is hardly much more. Portland Direct itself states onits website that it is the UK’s No.1 direct holiday company. As one of the arguments forbuying directly, Portland promises lower prices because you book direct, since you’llnever pay a penny in travel agent’s commission. Correspondingly Direct Holidays is evenmore explicit on its website: We cut out the travel agent and all of his commission. We cansave you around 19 percent. - If this is true for call centre-based travel businesses thereseems to be no reason why it should not apply to Internet-based travel businesses. Ofcourse it would also be an obvious solution to let the call centres, which all the major touroperators have, handle Internet bookings, if any manual checking and intervention is re-quired.
In Germany hardly any on the top 10 list of tour operators state any direct sales at all.235
And during the last couple of years, practically all tour operators and similar (such ascottage letting agencies) in the German market have stated repeatedly that they support the
235 The only exception is Frosch, which has some direct sales through the Franchise system Flugbörse, cf. FVW
28/97, p. 21), issued 19 December 1997.

175
traditional sales channel, in spite of the new possibilities for direct sales which are beingopened up by the advent of the Internet. Actually, many of the players, who have madeInternet sales solutions have either partly or fully tied the traditional sales channel, thetravel agents, into this solution (cf. the TUI case in this chapter, and the dansommer casein chapter 6.5.2). So, in light of this we would not expect many (if any) on the top 10 listof German tour operators to have established a website for direct bookings only.
The situation with respect to direct distribution on the smaller markets of Switzerland andespecially the Nordic countries, is completely opposite to the one in the UK and in Ger-many. Thus in the Nordic countries direct sales by the tour operators are the rule ratherthan the exception. In Switzerland each of the top three groups own travel agency chains,and none of the tour operators seems to have any policy of only selling through travelagents.
In the UK, the number of packages sold directly is relatively small at the moment, about2.2 million. The Internet currently plays a quite insignificant role in connection with di-rect sales of package tours in the UK. In the Nordic countries, at least half of the 4.5 mil-lion packages p.a. are sold directly (in fact for SLG there are 70% direct sales, accordingto Airtours). This mean that at the moment the direct sales market in the Nordic countriesas a whole is probably greater than in the UK. However, in the UK there are great expec-tations of increases in the direct sales proportion, primarily via telephone sales throughcall centres, and only secondarily via the Internet (cf. fvw 24/98, p. 78). Estimates go ashigh as to 25% direct sales for the year 2003.236 There seems to be no doubt about thetrend towards increased direct sales in the UK market: Buying a holiday directly from thetour operator, rather than through travel agents, is a fast-growing trend in the UK for air-inclusive tours.237 But the speed at which this change will take place may have been over-estimated. And as mentioned, most of the increase will be by phone via call centres ratherthan the Internet. Thomson, incidentally, is implementing webbased availability andbooking facilities oriented towards its travel agents.238
We will now list all the tour operators mentioned so far, by market, and see:
1. if they have a website at all;2. if availability is shown (and how frequently it is being updated);3. if bookings can be made on the website (and if there is instant confirmation);4. if payment can be undertaken via the net (as one of possibly several options);
and additionally, see
236 According to Nigel Hards, MD, Thomas Cook, fvw 24/98, p. 73.237 Airtours - Annual Report & Acccounts 98, p. 10.238 www.commercenet.org.uk/press/pr100898.html - UK's leading Tour Operator targets Web version of avail-
ability and booking systems for travel agents.

176
- if any incentives seem to be given for Internet bookings, and/or- if there are any offers presented on the website, which cannot be found elsewhere.
7.2.1 German tour operators on the net
Table 7.1 The websites of the top 10 tour operators in Germany
Operator Web-site? Availability? Net-booking? Net-payment?
1. TUI www.tui.de (and www.tui.com)
Yes Yes, to agent or directly
Yes, optional (TUI warns of risk)
2. NUR www.neckermann-reisen.de Yes Yes? ?
3. LTU Touristik www.ltu.de Yes (flights) Yes (flights) Yes, optional
4. DER Tour www.dertour.de No No No
5. ITS www.its.de Yes, last minute Yes, to agent No
6. Frosch Touris-tik
No - except www.lal.de. (Corporate site is planned)
No No No
7. Alltours www.alltours.de à www.reisecenteralltours.de
Yes
Yes
Yes
8. Öger Tours www.oeger.de Yes, last minute Yes, to agent No
9. Kreutzer www.kreutzer.de/ (basic) No No No
10. Studiosus www.studiosus.de/ (basic) No No No
11. Fischer www.fischer.de/ (basic) No No No
Practically all the top 10 tour operators in the German market have an Internet presence,although one of them only for a subsidiary, but a corporate site is planned, and two ofthem only have very basic sites, which at least one of them plan to extend.
1) TUI has a website, which will be described in some detail separately (in section 7.3).
2) NUR (Neckermann Reisen) is part of the C&N Touristic AG (Condor & NUR). The sitewas in a pilot phase in the first months of 1999, but was fully operational in August 1999,although the writer did not manage to finish the booking procedure after several attempts(because of an unforeseen failure situation occurring at a certain point in the process).Therefore it is not possible to tell exactly how the fulfilment takes place, but in the fullyoperational version of the site, the Internet user will probably be able to choose betweencontacting a travel agent (based on a post code-based search facility, which did not seem tobe functioning in the pilot phase), or send an enquiry to the Internet-Communication-Center of C&N Touristic.
3) In November 1998 LTU (Lufttransport-Union) became the first leisure airline in Ger-many to offer a fully automated ticket booking facility via the Internet for ordinary and lastminute tickets to holiday destinations. Once a week there is a ticket auction. And finally,

177
the chances of getting on the LTU shuttle from Düsseldorf to Palma de Majorca on astand-by ticked for DM 98 each per way are mentioned on the site, i.e. either a) very goodchances (tomorrow), b) good chances, c) a few places left, or d) fully booked.239 The Inter-net booking solution was developed in association with Amadeus, the GDS. As an incen-tive, the LTU Card was offered to the first 500 Internet bookers. Payment can, as an op-tion, be undertaken by credit card via the net. Although there are at least seven packagetour brands within the LTU Group (Jahn Reisen, Tjaereborg, Meier’s Weltreisen, HTRTours, Smile & Fly, Marlboro Reisen, and f6 kult) these are not searchable or bookable onthe LTU site, neither in one go or at the home-pages of each of these brands (which areprobably all stored at the LTU server, although they have individual www-addresses). Formost of the brands a top offer is mentioned, and for several brands catalogues can be or-dered via the net. All brands encourage the Internet user to contact a travel agent to re-ceive advice and to make bookings.
4) On the tour operator site www.dertour.de there is only availability data, and for book-ings the Internet user has to contact a travel agent. On the travel agency site www.der.de,there is for instance a button for last minute offers, but that part of the site was being re-worked in early 1999. So, obviously that facility had been there before, and will be estab-lished again. Standard holiday packages are not presented on the site www.der.de. It ispossible to book flights and hotels, which is a business traveller-oriented facility.
5) A top offer of the week is shown on the entry page. But the main content of the ITS siteis last-minute offers. The availability of given offers has to be checked, but those listedgenerally turn out to be available. It is stated on the site that as something new there issupplementary text and photo information for every offer.240 Internet bookings have to govia a travel agent of the user’s choice. There is a function for finding an ITS travel agent,e.g. nearby one’s home address.
6) Frosch Touristik (FTI) is the only tour operator among the top 10 in Germany - perhapsapart from Kreutzer and Fischer - which does not have a website. LAL language tripswithin the FTI Group does have a site though (www.lal.de), which includes informationabout the FTI Group in general, e.g. press releases and job announcements. And as a mat-ter of fact FTI is looking for an Internet person, whose responsibility it will be to establish
239 Hotels may be found at the site www.hvsl.es/.240 But an error message shows up when the button detail information is clicked This is probably a temporary
problem, since at an earlier visit at the site in some but not all instances there was a small photo of the hotel - orof nature in the surrounding area (!) - along with a brief text about the rooms.

178
and extend the Internet presence of FTI! The FTI Group website address will probably bewww.fti.de.241
7) The tour operator site www.alltours.de is still at the planning stage only. However, theInternet user is being transferred to the on-line (retail) travelcenter of Alltours, and mayfind tours from several other major tour operators such as Neckermann, Kreutzer Reisenand Tjaereborg Allkauf, as well as many speciality operators. Reisecenter alltours GmbHis an independent travel agency chain with over 90 outlets all across Germany belongingto the alltours group. On one day in the early spring of 1999, there were almost 90 000offers, i.e. flight only, last and first minute package tours and accommodation only offers,and on a day in August 1999 there was a similar number of offers. The first or last minuteoffers may be found using either a step-wise procedure or a search engine.
8) Öger Tours has a D-base with 6000-10 000 last minute offers. Booking enquiries arerouted to a travel agent of the choice of the traveller.
9) Kreutzer does not have any information on its current single-page site, but is planningto open a comprehensive website (was working on it in the spring of 1999, and is stillworking on it in August 1999).
10) Studiosus does have a website, but only for catalogue ordering. A travel retailer, thevirtual travel agency reise@flugcenter, does have a booking request form from Studiosustrips on its site.242
11) Fischer, which was in the top ten in 1996/1997, only mentions a few offers on a sin-gle-page site.
FTI, then, is building a corporate site, and so it seems is Kreutzer. After that hardly any ofthe top 10 German tour operators does not have a website.
The following pieces of information show the status of Internet booking with German touroperators by (the end of) 1998 - based on Com!Online 2/99, pp. 70-83.
• Only 4.4% of German holiday-makers use the Internet as one of several sources ofinformation in connection with planning their holiday (according to FUR, cf.Com!Online 2/99, p. 71).
241 Furthermore the FTI PR agency provides some general information about the group on the agency’s site, cf.
www.wilde.de/html-en/cp/index.html. Airtours acquired a 29% stake in FTI in May 1998, with the option tobuy the rest of the group in 2002, according to www.ukbusinesspark.co.uk/airtours.htm and Airtours’ AnnualReport & Accounts 98.
242 www.flugcenter.de/formularstudi.htm

179
• In general the German tour operators stress that provision of information about theirpackage tours via the Internet is the main function of the medium. Taking booking viathe Internet hardly plays any role at the moment. German holiday makers like to checkoffers on-line, but they prefer to go to a travel agent to make the actual booking.
As to the number and share of bookings of package tours via the Internet, the followingserves to illustrate that the Internet is in its infancy in the German market:
1a) According to TUI’s press officer, Gerd Rimele, at the moment on-line booking is notgenerating much business. TUI received 80 bookings in the six weeks before Christmas1998 (i.e. about 54 per month), of which 30 went directly to TUI, and 50 went via travelagents.243
Comment: TUI receives about 53 bookings via the net per month. With two packages soldper booking that corresponds to just over 100 packages per month. The six weeks up toChristmas must be a low season for TUI, since, as we shall see in the following case study,the average number of bookings per month in 1998 was about 450, corresponding to 900packages per month.
1b) The retail travel chain TUI Travelcenter’s Internet site called Travelland has received1000 bookings in almost two years (1997 and 1998). Obviously this is too little to justifybig investments.Comment: Assuming a doubling from the first to the second year, that corresponds to 667bookings, i.e. about 1330 packages in 1998.
1c) L’TUR (now taken over by TUI): online sales are a few packages per thousand.Comment: If we interpret that as maybe 0.2% - of half a million tours p.a. - that translatesto about 1000 packages p.a. - a third of the packages which L’TUR sells are TUI packages,two thirds are from more than 100 other brands.
2) Neckerman (NUR) expects that the Internet booking business will initially cost a lotmore in computer centres than what is saved in travel agency commission. Nobody knowshow many online bookers there will be in future. However, the Internet is one tool in thebattle for increased market share. The big tour operators are too scared of the travel agentlobby to offer direct bookings up front, although Neckermann signs say: tourists can alsocome to us through the Internet.
243 Com!Online 2/99, p. 78. Full reference: Mardelli, Michael, 1999, [email protected], Com!Online 2/99,
pp. 70-83 (www.com-online.de).

180
3) LTU considers the Internet to be too immature for real business. E-commerce has juststarted. LTU received about 100 bookings during the first four weeks of its booking facil-ity’s existence.
Comment: From the site it appears that each booking is for one flight-only return ticket.For a full year (~1998) that probably translates into at least 2000 return tickets. LTU car-ries seven million passengers p.a., corresponding to 3.5 million return-trips. So, for a startwe are talking about 0.06% of the trips which are booked via the Internet. Although this isbut a fraction of a percentage, it is not surprising that the fraction is greater that that ofTUI for packages, since those who buy flight only tickets are no doubt more organisedthan those who buy complete packages.
4) Dertour has a strong distribution net, and considers on-line bookings to be both unnec-essary and too complicated for the Internet user (e.g. when connecting flights etc. areneeded). However, Dertour will not disregard those few tourists who will book without atravel agent.
7.2.2 Major UK tour operators - and associated retail operations - onthe net
Table 7.2 Tour operators on the net - The UK market Part I (Thomson)
Thomson Travel GroupPLC
Websites Availability? Net-booking? Net-payment?
Corporate www.thomson-holidays.com/contacts/home.htm
No No No
Thomson Holidays, UK www.thomson-holidays.com/book/home.htm
No No No
Thomson Breakaway, UK www.thomson-breakaway.co.uk/(Ski and snowboarding)
Yes(weekly up-
dating)
No(telephone)
No
Crystal Int. Travel Group www.crystalholidays.co.uk/ No Yes, onrequestbasis
No
Portland Direct, UK www.portland-holidays.co.uk/ No No NoHoliday Cottages Group www.country-holidays.co.uk/ No Yes, on
requestbasis
No
and www.cheznous.com/ No No, bookingdirectly to
owner
No
Lunn Poly www.lunn-poly.co.uk/ No No No
The availability offers on the Thomson Ski & Snowboarding site is normally updated oncea week (Monday or Tuesday). Enquiries and bookings are taken by telephone. Last minuteskiing holidays seem to be very well suited to the Web medium, both because of the prod-

181
uct’s immediacy and because there is a good overlap between the demographic profile ofthe product’s target group and the typical Internet user. For Crystal Holidays, the Internetuser can e-mail a booking request. Crystal then phones back within 24 hours and advises ifthe booking can be confirmed. For Country Holidays it has previously been possible tosearch for those cottages which are available, but thanks to demand (of course from thecottage owners) all properties that fit the location and facilities will be shown whetherthey are actually available for the chosen date or not. (We dealt with letting of holidaycottages over the net in chapter 6.8 and 6.9). None of the UK websites of the ThomsonTravel Group have both real-time availability data and online (real-time) booking facili-ties. The Thomson-owned Fritidsresor Group in Scandinavia will be reviewed separately atthe end of this section.
Table 7.3 Tour operators on the net - The UK market Part II (Airtours)
Airtours PLC Websites Availability? Net booking? Net payment?Airtours Group www.airtours.com/Airtours Holidays, UK www.airtours.co.uk/ No No NoEuroSites, UK www.eurosites.co.uk/ No No NoBridge Travel, UK www.bridge-travel.co.uk/ No No NoCresta, UK sub-domain under airtours No No NoPanorama, UK www.panoramaholidays.co.uk/ Yes, list of
last minuteNo No
Direct Holidays, UK www.direct-holidays.co.uk/ Yes Yes YesGoing Places, UK www.going-places.co.uk/ No No No
Airtours’ corporate website was opened in the middle of February 1999, and it looks veryneat. - By the middle of August 1999, Direct Holidays became the first sub-site of Airtoursin the UK to offer availability data and booking facilities online for their packages, bothearly and late offers. Payment is by credit card on the site (SSL encrypted). No discountsare given for Internet bookings, but there is a lower deposit than for telephone bookings(£40 instead of £100 per person). If the holiday-maker cancels the booking, the deposit islost. The Airtours-owned SLG will be reviewed separately at the end of this section.

182
Table 7.4 Tour operators on the net - The UK market Part III (Other majors)
The numbers three to six among the tour operators on the UK market - and a few moreSupplier: Websites Availability? Net booking? Net pay?First Choice www.first-choice.com Late offers are listed,
but are subject to avai-lability(updated weekly only!)
No (bookingby phone)
No
Thomas Cook www.thomascook.co.uk Yes, late offers can befound by interactivesearch, but are subject toalteration (updatedevery morning)
No (but a call-backconcerning the chosenholiday can be requested- or bookingby phone)
No
Cosmos/Avro No public site yet - - -Kuoni UK www.kuoni.co.uk Yes, updating of a good
selection of availableoffers is undertakenseveral times a day
Yes Yes
Voyages Jules Verne(Kuoni)
www.vjv.co.uk/ No Yes Yes
Bargainholidays.com(online retail agent)
www.bargainholidays.com / or ...co.uk/(28 different brands)
Yes (conditional) Yes, booking enquiriescan be e-mailed. Avail-ability of offer will thenbe confirmed
No
First Choice shows late offers, which are updated once a week only. Subsequent booking isby phone.
On the Thomas Cook site early as well as late package holiday offers, which are updatedeach morning, can be found. Bookings cannot be undertaken on the site, but a request for acall-back from a Thomas Cook agent at a time chosen by the holiday-maker can be re-quested. Alternatively bookings of holidays, flights, and late offers can be undertaken byphone or in a Thomas Cook branch. Also Sunworld sailing-holidays packages (with lateoffers updated weekly), and point-to-point flights can be found on the site, both withphone booking only. In an earlier version the Thomas Cook website won the Enter ’99award in the tour operator category ahead of TUI of Germany and Kuoni of Switzerland!
Cosmos/Avro do not have a public website yet, but have registered at least six differentdomain addresses. A seventh address is already in use, but access is restricted by ID andpassword.244
On the Kuoni UK site there is a good selection of available holidays, which are updatedthroughout the day. The offers can be searched by destination, price or date. Booking and
244 The domains www.cosmosair.co.uk/, www.cosmosair.com/, www.cosmoscoach.co.uk/,
www.cosmoscoach.com/, www.avro-plc.co.uk/, and www.avro-plc.com are all registered. And access to the sitewww.avro.co.uk/ is restricted by user ID and password.

183
payment (SSL encrypted) can be undertaken online. - Kuoni acquired the direct sales op-eration Voyages Jules Verne, at the end of 1998, which has also got an Internet presence.There are general descriptions of the tours and there is a booking request form with creditcard payment fields.245
Bookings cannot be made on websites of the runners-up among the UK tour operators. Infact there do not seem to be any significant players among the UK tour operators, whohave a website for the UK market with both real-time availability data, on-line bookingfacility, and payment on the net. It would seem well justified to assume thatsales/distribution of package tours via the Internet, either directly from the tour operatorsor through retail agents, is a very limited phenomenon indeed at the moment.
All in all by the middle of August 1999 there is just a single brand of one of the major touroperators on the UK market which has a website with both real-time availability data andonline booking facilities (Direct Holidays of Airtours). However, on the sites of two addi-tional tour operators available holiday offers, which are updated at least once a day(Thomas Cook and Kuoni UK), can be found by interactive search functions.
There is a retailer site called Bargainholidays.com operated by EMAP Online (i.e. not runby a tour operator), which has a leading position in the UK. The data used for Bargain-holidays.com are supplied by Comtec (Europe), and ticket sales are handled by HolidayExpress (UK) Ltd. The site was opened in July 1997 and should be Britain’s largest onlineholiday store featuring holidays from every major tour operator in the UK. EMAP Onlinehas also the sites 1ski, A2Btravel, A2bAirports, A2bEurope, Aloud and whatson.com.
245 According to a press release of 15.12.1998 Kuoni expects that the acquisition of Voyages Jules Verne, which
has a strong Internet presence (http://www.vjv.co.uk) and a highly efficient processing system for directbookings, will furnish impulses for the development of direct selling in the United Kingdom and for the en-tire Group.

184
7.2.3 Tour operators in the Swiss market on the net
Table 7.5 Tour operators in the Swiss market - and their websites
Brand Website Availability? Net booking? Net payment?
1) Kuoni, in Switzerland www.kuoni.ch Yes, last minute Yes Yes, optional
2) Hotelplan, in Switzerland
www.hotelplan.ch Yes, last minute Yes Yes, optional
3) ITV:
3a) Imholz Reisen / TUI Switzerland
www.imholz.ch/or www.tui.ch/
Yes, last minute Yes,conditionally
Yes, optional
3b) Vögele reisemarkt.ch/voegele/ Only viaReisemarkt.ch
Yes, request No
4) Reisebaumeister (*) No Web-site - - -
5) SSR Reisen www.ssr.ch Yes, flights Yes, request No
Note: (*) Falcon Travel AG, Eurotrek, Sierra Mar; Opus Tours, Wettstein Reisen, Skytours, Carib Tours, SelinaTours. None of these brands appear to have Web-sites.
Four of the top five tour operators in the Swiss market have an Internet presence.
1) Kuoni shows, among other things, available last minute tours, with photos and infor-mation about the facilities. Payment is by mailed invoice or credit card.2) Hotelplan shows available last minute tours, but with no photos or information aboutthe facilities (except as indicated by number of stars). These can be booked on the net.Payment is by mailed invoice or credit card.3a) Imholz Reisen / TUI Switzerland state that confirmation of availability has to beawaited.246
3b) Available tours from Vögele, and eight other medium sized and small tour operators(i.e. not from Kuoni, Hotelplan or Imholz), can be found at the retail site ReisemarktSchweiz, and booking requests can be made. Updating takes place once a day, just aftermidnight.
In general, in the Swiss market the tour operators sell directly to the consumers as well asthrough travel agents. The top three brands have established direct distribution via the netbut only for last minute offers as far as package tours are concerned. And availability dataof a fourth major brand - as well a number of minor brands - may be found on the net viaan online travel agent.
All in all, Switzerland must be said to have developed quite far with respect to makingpackage tours available either directly from the major operators, and many of the smallerbrands are also on the net with availability data, etc. via an online travel agent. Contrary
246 Reservation vorbehältlich Verfügbarkeit, bzw. definitiver Bestätigung durch unsere Ferienberaterinnen.

185
to the German market there is no attempts among tour operators to try to tie the travelagents into the Internet sales process. Each of the top three operators, which account forabout 75% of the Swiss package tour market, offers last minute tours on the net, and thesecan be booked via the net, and the bookings go directly to the operators.
7.2.4 Tour operators in Scandinavia and Finland on the net
Table 7.6 SLG (Airtours)
Brand Clients x1000(F’97/8)
Web site Availability? Net booking? Net payment?
1) Ving (S, N, DK) 500240136
www.ving.sewww.ving.nowww.ving.dk
YesYesYes
YesYesYes
NoNoNo
2) Always (Sweden) 230 www.always.se Yes Yes No
3) Saga (Norway) 200 www.saga.solreiser.no No Yes, request No
4) Spies (DK, S, Finland)
21512575
www.spies.dkwww.spies.sewww.spies.fi
YesYesYes
YesYesYes
NoNoNo (?)
5) Tjaereborg (DK, Finland)
18376
www.tjaereborg.dkwww.tjareborg.fi
NoYes
NoYes
NoNo (?)
SLG, total 1980 Yes, in all instances ~Yes ~Yes No
1) There is a separate in-depth review of the Ving site(s) in chapter 7.5.
2) On the Always site, packages with departure at least one week ahead can be booked.The site also includes basic information about last minute offers. If less than five seats areleft, the number left is mentioned.
3) Saga’s newly established site is much like looking through a catalogue. Prices onlycome up half way through the booking procedure. The procedure can only be Finnished bygiving one’s ID and password. The booking confirmation is sent to the Internet user byordinary mail. Payment is by traditional methods (bank transfer or post giro).
4) Spies has ordinary as well as last minute offers on the three different language/marketversions of its site. The last minute offers are only described by the most basic data, butthey are updated several times during the day. If only a few seats are left this is indicatedby showing the price in red digits. Supplementary information about the last minute offersis provided by phone. There are separate versions of the site for the Danish, Swedish andFinnish markets. Prices show up half-way through the booking procedure, which can onlybe Finnished by mentioning ID and password. Payment on the Danish version of the site isby bank transfer or in one of Spies’ bureaux. Payment, certainly at the Swedish versionand probably also at the Finnish version of the site, is by post giro.

186
5) The Danish version of the Tjaereborg site contains last minute offers, and general de-scriptions of the main types of holidays. It does not comprise any booking facilities, al-though the Finnish version does. As for several other of the sites already mentioned, pricesshow up only half way through the booking procedure, which can only be finished by giv-ing one’s ID and password. Payment on the Finnish version of the Tjaereborg site isprobably by traditional means.
Table 7.7 Fritidsresor Group (Thomson)
Brand and market Clientsx 1000
Website Availability? Booking? Payment?
1) Fritidsresor (Sweden) 460 www.fritidsresor.se Yes Yes No
2) Star Tour (Norway) 300 www.startour.no Yes Yes No
3) Star Tour (Denmark) 193 www.startour.dk Yes, for lastminute(daily update)
No No
4) Fritidsresor (Finland) 140 No (*) - - -
5) Royal Tours (Sweden) 120 No - - -
6) Hasse (Finland) 80 No - - -
Other brands 137
Fritidsresor Group, total 1450 The large: YesThe small: No
Note: (*) Last minute offers from Fritidsresor are mentioned on the site http://www.lomalle.com/1fr.htm, updatedweekly. Lomalle is a general travel agent carrying many of the major brands. Other brands include Atlas Re-sor, Grand Cruises, Temarejser and Sportsrejser.
1) Fritidsresor in Sweden and Finland shows the normal available packages. For many ofthe hotels there are photos and key pieces of information. Last minute offers are alsolisted, but with only a minimum of information. The list of last minute offers is updateddaily. Only normal offers with departure at least three weeks ahead can be booked on thesite. In order to make a booking the Internet user must be registered with Fritidsresor.Payment is by post giro (i.e. traditional means). As is the case with offers from the com-petitors within the SLG group, prices are hidden until step three of a seven-step bookingprocedure. This makes it somewhat cumbersome to compare prices, and there is no directway of searching for offers by cheapest price.
2) Star Tour in Norway and Denmark has sites in both countries. Star Tour Norwayopened for booking of all offers - with departure at least four weeks ahead - via its site inthe spring of 1999.
3) Star Tour Denmark’s site comprises a list of last minute offers which is updated(almost) daily but does not comprise normal offers, and there is no booking function.
4, 5, 6) The three smallest brands within the Fritidsresor Group do not have websites.

187
Table 7.8 Finnair Travel Services (Finnish market only)
Brand Clients(x1000)
Website Availability? Net booking? Netpayment?
1) Aurinkomatkat -Suntours
283 www.aurinkomatkat.fi Yes, last minute Yes, on request basis(but not for last minute)
No
2) Finnmatkat 142 www.finnmatkat.fi No No No
Total 425
The two operators within the Finnair Group both have fine websites, but being in Finnishit is a little difficult to determine their functionality. With Aurinkomatkat it seems thatbooking requests for tours at least six weeks ahead can be made. There is no way of payingon-line. Also there is a list of last minute tours. These must probably be ordered through atravel agent, which may be found on the site, listed by towns.
Table 7.9 Apollo, Scandinavia (1998)
Brand Clients(x1000)
Website Availability? Net booking? Net payment?
Apollo SwedenApollo DenmarkApollo NorwayApollo
300 48 2
350
www.apollo.sewww.apollorejser.dkwww.apollo.no
YesYesYes
Yes, online for all tripsYes, online for all tripsYes, online for all trips
NoNoNo
Source: The Apollo Sweden site for the total, and the Association of tour operators in Denmark, according to Ras-mussen (1999), for Apollo DK. The total is from fvw 13/99 and is for F’97. The Apollo Sweden figure isfrom www.apollo.se.
Note: Apollo Norway was established in the autumn of 1998, with a programme for the summer of 1999.
There is a separate in-depth review of the Apollo site(s) in chapter 7.6.
Table 7.10 Kuoni - in the Danish market: Alletiders Group (1998)
Brand Clients(x1000)
Website Availability? Net booking? Net payment?
Larsen Rejser +Herning Charter andSimons Charter =Alletiders Group =
594544
148
www.larsen-rejser.dkwww.herningcharter.dk orwww.alletiders-rejser.dk
Yes, lastminute
Yes, on requestbasis
(subject toavailability)
No
Source: The Association of tour operators in Denmark, according to Rasmussen (1999) in Jyllands-Posten, 17 April1999.
The new Danish Kuoni group is now marketed under the Alletiders (Alletiders Rejser,Great Tours) brand name. The site functions much the same way as the Aurinkomatkatsite. The destinations and hotels are described. Prices may be found. Tours at least eightweeks ahead may be booked on request basis, i.e. subject to availability. And there is a listof last minute offers, which cannot be booked on the site (but by phone).

188
7.2.5 Rest of Europe - remaining players on the top 10 list of Euro-pean tour operators
Table 7.11 Leading tour operators in the rest of Europe: Little website functionality
Others (in top 10 -and just below)
Clients(x1000)
Website Availability? Net booking(for general public)?
Net payment?
Nouvelles Frontières,France
2,190 www.nouvelles-frontieres.com
No (only generaldescriptions)
Only brochure orderingand free-format en-
quiries.
No
Club Med, France ~600 www.clubmed.com No (only generaldescriptions)
Yes (but onrequest basis only)
No
Alpitour, Italy 760 www.alpitour.it Yes (from ’99) No No
TUI, Netherlands 1,200 www.arke.nl No (only generaldescriptions)
No No
JetAir (50% TUI)No. 1 in Belgium
519 www.jetair.be/ Yes (from ’99)last minute
No: Booking throughtravel agency
No
GTT (Gulet TouropaTouristik), Austria
~500 No Web-site!(34% market share)
- - -
Spain, top four: ~1,500 (~75% of the market)
Mundicolor(partly Iberia-owned)
www.mundicolor.es No No No
Soltour www.v-soltour.es Yes No, but agents can(ID and password)
No
Iberojet www.bdr.es/iberHTM/ No, but agents can(but only to Cuba)
No, but agents can(ID and password)
No
Travelplan c/o www.g-air-europa.es No No No
All the largest tour operators in the rest of Western Europe have websites, except theleader in Austria, GTT Gulet Touropa Touristik.247 However none of them has availabilitydata on its site, except Soltour of Spain. On the Soltour site only agents can make book-ings. Mundicolor and Soltour both claim the number one place in Spain, but Mundicoloris the largest by revenue.248
So, let us conclude this review of the Web presence of the main tour operators in Europe:The vast majority of the major tour operators have websites.
247 The address http://www.austria.eu.net/customer/customers-t.htm includes a link to www.touropa-
austria.at/touropa, which is under construction and leads directly on to the Austrian Airlines sitewww.aua.com/, which holds 50% of the shares in GTT, according to http://www.aua.com/GB97/1997e.htm(Highlights 1997 from the annual report - December 20, 1997: Establishment of Gulet Touropa Touristik, withAustrian Airlines holding 50 % of the shares in Austria`s largest tour operator.)
248 According to fvw 13/98, p. 15. Quotes from the respective sites: Mundicolor, Spain’s leading [international]tour operator. AND: SOLTOUR, primer touroperador español en vuelos charter …. The explanation may bethat Soltour is more focused on the tours within Spain.

189
Table 7.12 Functionality of major tour operator websites in Europe: The generalpicture
Total tours Checkedper market
% oftours
Availability? Net booking? Net pay-ment?
Germany 28 mill. Top 10operators
63 Yes, for most ofthe large players
Yes, via agent- or directly
Yes, as anoption
Switzerland 3 mill. Top 5groups
85 Yes, for lastminute tours
Yes, directly Yes, as anoption
Nordic countries 5 mill. Top 5 groups 88 Yes, for thelargest
Yes, directly No
The UK 22 mill. (max) Top 7 groups 64 Not real-time,if any at all
No, except onrequest basis.
In someinstances
Rest of Europe 22 mill. 10 largeoperators
33 Eight: NoTwo: Yes
No No
Total 80 mill.(air/other)
36 groups(~operators)
57
7.3 TUI, Germany, on the netIn 1996/97 the TUI Group was the largest tour operator in Europe measured by turnover,and it maintained this position in 1997/98 (fvw 13/99), cf. Figure 7.1. In 1996/97 the TUIGroup employed almost 9375 people, of whom 4443 (or 47%) within the tour operatingbusiness which is the focus here; 1635 in incoming agencies at the destinations; 1851 inhotels; and 1446 in travel agencies. Only a third of the employees work within Germany.In 1997/98 the number of employees in the Group had increased to 9812. Group revenuewas DM 8.9 billion ($5.1 billion) in 1997/98. The shareholders of the TUI Group are thefollowing: Hapag Touristik Union (HTU) 50.1%; West LB-Gruppe 24.9%; Preussag AG25%. There were seven million participants in 1997/98 within the TUI Group, of which5.1 million for TUI Germany. The latter is the important number in connection with In-ternet bookings. The main brand for TUI Germany is TUI Schöne Ferien, with about fourmillion participants per year.
Before we turn to the TUI website, it can be noted that TUI has issued four CD-ROMs, twofor 1997 and two for 1998, for TUI Schöne Ferien (mostly Mediteranean destinations),and for the Robinson brand (distant destinations). TUI has not issued any new CD-ROMsfor the 1999 season, since in future TUI will be using the Web for its interactive promotionand on-line booking facilities. The reasons are that web-based information may be updatedfrequently and at relatively low costs. Any future CD-ROMs from TUI will be fun-oriented.
TUI opened the first version of its website in 1996. The content has been gradually ex-tended. Last minute offers were present from the beginning, among other things. Also atan early stage it became possible to make real-time bookings at the TUI site. In connectionwith ITB in March 1999, a revamped site was introduced (TUI press release, 5 March

190
1999). The categories on the www.tui.de site are the following: Last Minute & More, On-line Catalogue, Destination Information, Meeting Point, and Service plus Corporate In-formation.
This means that the site should now be more service oriented, be faster, and contain moreinformation. TUI needs the travel agent just like the travel agent needs TUI. Therefore, atthe same time as revamping the site, TUI introduced a new Internet presence offer to theirtravel agents, which means that TUI will support travel agents in setting up websites.249
The prices for the consumer are the same on the Internet as in shops, and there are noprice differences between ordering via Internet from a travel agent or from TUI directly.Payment is by bank transfer, TUI Card or Visa Card: We will treat your payment dataconfidentially, but we remind you that at the moment payment with credit card over theInternet is still not completely secure. Travel documents are sent by ordinary mail, unlessthe Internet user choses to fulfil the transaction at a travel agent.
In 1998 TUI counted 2.2 million page impressions per month and received 600 000 visitsto its site per month (1998). This resulted in about 450 bookings per month via Internet,i.e. about 900 packages per month, i.e. 10 000-12 000 packages sold over the Internet in1998. For TUI it takes between 1200 and 1500 visits to get one Internet booking.250 Thisremarkably high number of visits per Internet booking received indicates that many ofthose who visit the TUI site make their bookings in travel agencies - since those who visittour operator sites must be assumed to have a fairly genuine interest in buying a packagetour. And as a matter of fact the main objective of TUI’s Internet presence is to provideinformation, not to generate a lot of Internet bookings.
Since TUI sells some 5.1 million packages per year in the German market, this means thatabout 0.2% of TUI Germany’s packages were sold via the net in 1998. Early in 1999 thenumber of page views had increased to over 2.8 million per month (TUI press release, 5March 1999).
249 Cf. TUI press release, 9 March 1999.250 Already at the beginning of 1997 (at ENTER’97 in January) it was stated that the lookers-to-bookers ratio of
TUI was about 1200:1. Since then the ratio has has slipped down to 1500:1 as the number of visits have in-creased faster than the bookings, but it was again about 1200:1 by the end of 1998.

191
Table 7.13 Some statistics on www.tui.de: Visits, bookings, revenue and forecast
Per month 1998 All of 1998 Per month, 1st quarter,1999
All of 2003
Page views, million 2.2 2.8
Page views per visit 3.7
Visits 600 000
No. of visits per booking 1333
Bookings via net 450 5400 130 000
Packages per booking 2 2 2
Packages via net 900 10 800 260 000
Total no. of packages 5.1 mill. ~5.2 mill.
% of packages via net 0.2% 5%
Revenue per package, DM 1000 1000
Internet revenue, DM mill. 0.9 10.8
Exchange rate, $ per DM 0.5687 0.5687
Internet revenue, $ mill. 0.5 6.1
Of which fulfilment viaagents
50% 50%
Travel agents are somewhat concerned about tour operators selling direct via the Internet,not least about TUI, being the market leader. But clearly, with 10 000-12 000 packagesbooked via the Internet in 1998, and half of these fulfilled by travel agents, the Internet asa booking channel has certainly not taken much business from travel agents. Perhaps onthe contrary: if only a small percentage of all those hundreds of thousands of people whovisit the TUI website every month subsequently go to a travel agent and book their TUIpackage, the travel agents win in two ways: they get commission, and those Internet userswho book at a travel agent are well informed, and therefore very likely to take up less ofthe travel agents’ time.
In future it is TUI’s intention to have every catalogue on the Web. Also in future somelook-around, quick-time Virtual Reality functions may be introduced. When the transmis-sion speed improves videos and sound files may be introduced to the site.
The Internet activities of TUI are split between TUI Infotec, and TUI New Media. TUIInfotec is now one of five divisions within TUI, and has 200 employees. About six of thesework with Internet programming. TUI New Media employs 10 people, whose responsibil-ity it is working out new concepts, marketing and handling the back office functions forInternet bookings.

192
By 2003 TUI expects that perhaps 5% of its bookings will come via the Internet.251 Thisincludes both those Internet bookings which are fulfilled via travel agents and those whichare fulfilled by TUI’s Internet Service Center. Obviously agents will remain highly im-portant channel for TUI for the foreseeable future.
To reach the 5% development must proceed roughly, as shown in Table 7.14 (percentagevia Internet):
Table 7.14 Stepping-stones for TUI to reach 5% via Internet in the year 2003
1997 ~01998 0.2%1999 1%2000 2%2001 3%2002 4%2003 5%
7.4 Kuoni, Switzerland, on the netKuoni was founded as early as 1906. In Switzerland alone it has 2000 employees. KuoniSwitzerland’s main activities are tour operating, business (+individual leisure) travelservices, and retailing. Thus Kuoni owns 155 retail travel agencies in Switzerland, and inaddition to this the Kuoni brand is sold through 1000 agents in the country. 252
251 According to the TUI press officer Gerd Rimele, com!Online 2/99, p. 78.252 Based on telephone interview with Mr. Andreas Waldis, Head of marketing services/New media and advertis-
ing, Kuoni Travel Ltd., Switzerland, April 1999, supplemented with published statements and information fromthe Kuoni website, www.kuoni.ch.

193
Figure 7.6 The activities of Kuoni at a glance (1997 data)
Tour operating
35%
Business travel23%
Retailing29%
Other13%
International33%
Kuoni UK16%
Kuoni Switzerland
44%
Incoming7%
The main activities of Kuoni Switzerland (1997)
Sales revenue of the Kuoni Group by Strategic Business Units (1997)
Note: Total revenue of Kuoni Switzerland was SFr 1.9 billion in 1997.
Note: Total revenue of the Kuoni Group was SFr 4.2 billion in 1997.
Back in 1997, 44% of the total sales of the Kuoni Group was accounted for by Kuoni Swit-zerland. With effect from the beginning of 1998 Kuoni took over the large (DM 1.07 bil-lion/SFr 0.9 billion) business travel agent chain Euro Lloyd of Germany. In October 1998Kuoni took over three minor tour operators in Denmark, which were then merged. The1998 revenue of the Kuoni Group was SFr 5.3 billion.
In March 1999 Kuoni was to be merged with the British major UK tour operator FirstChoice, which had revenue of £1.24 billion (SFr 2.9 billion) in 1998. The intention wasthat the Kuoni shareholders should hold 53% of the shares in the new Kuoni HoldingsPLC. However, the merger was called off since it did not receive sufficient support fromthe shareholders of First Choice (fvw 18/99 p. 23).
Kuoni is number one in Switzerland, both in the overall tour package market and withrespect to sales of tour packages over the net in Switzerland. Kuoni has a good functional-ity and among Swiss tour operators it has been on the web the longest. All the sales on theKuoni Switzerland site comes from the Swiss market.
Kuoni Switzerland’s website was first opened in December 1995, so by the spring of 1999it has already been in operation for three full years. The current features of the KuoniSwitzerland website are:

194
• Last minute sales of tour packages;• Special offers;• Scheduled airline tickets - at different special fares;• Catalogue ordering facility - for all the catalogues throughout the Kuoni Group;• Electronic travel guide - containing information about different destinations (in prog-
ress);• Currency converter;• Company information - annual reports, press releases, job openings.
The Kuoni site comprises all the (necessary) functions for Internet commerce: it has inter-active search functions, prices are shown, availability can be checked, bookings and pay-ments can be undertaken on the site.
As to payment the customer is given three choices:1. On-line using the SSL security standard.2. On-line using the SET security standard.3. Offline, by paying a mailed invoice.
The availability data provided to the Web users is completely real-time, extracted from thecentral computer reservation system (D-base), especially for the last minute package offersand the airline tickets. No discounts are given for orders placed over the website. There isa slightly reduced reservation fee for Internet bookings, SFr 25 instead of SFr 50.
In the year 2001 Kuoni Switzerland expect to get 1% - or 1.5% (optimistically) - of theirbookings over the net.
Despite the ease of buying a holiday over the net, many customers use the phone althoughthey can book directly over the net. So, the customers perceive some complexities. It maybe both because they are reluctant to place orders over the net and because they are notsure about how to do it. Kuoni has received additional orders because of its website, espe-cially thanks to its opening hours (24-hours a day). If the customers do not have any ques-tions in connection with the booking process (including payment) net booking savesmoney for Kuoni, although this is difficult to quantify. Kuoni believe it has (just about)reached break-even for its Internet investment. There are three people within Kuoni Swit-zerland working with developing and maintaining the website, and additionally one exter-nal person.
Kuoni does not believe that it is enough to have a basic information-only site to differenti-ate one supplier positively from its competitors - as far as tour packages are concerned -and neither do practically any other tourism and travel services suppliers.

195
In the near future Kuoni wants to do the following:• Improve the convenience and speed of the airline ticket booking function.• Improve the speed of the availability check of the last minute and special offers.• Install a destination travel guide (currently in progress).• Implement a destination weather guide.• Make some existing features of the site interactive (via D-bases), such as job opportu-
nities and press releases.• The site is currently in German language only. French is planned as a second language
for the site.
Furthermore, Kuoni is planning to put all its regular catalogue products onto the site, i.e.not only last minute and special offers. Finally, a call-back function is planned, connectedto the existing direct sales call centre.
7.5 Ving, Scandinavia, on the netVing was founded in 1956 in Sweden, where it remains the number one package tourbrand in terms of sales. Ving’s sole activity is tour operating. Ving sells a wide range oftour packages, and is the largest brand within the Scandinavian Leisure Group, SLG. Inturn, SLG is the largest tour operator group in each of three Scandinavian markets, Swe-den, Norway and Denmark.

196
Table 7.15 Estimated market shares for the Ving brand and major tour operatorgroups in the four Nordic markets
Market shares A B C D ABCD
(%) Sweden Norway Denmark Finland 4 Nordic
Ving (within SLG) 26 25 12 0 18
SLG Group (owned by Airtours) 45 46 46 16 40
Fritidsresor Group (Thomson) 34 35 19 25 29
Finnair Travel Group - - - 45 9
Apollo 16 0 4 0 7
Alletiders Group (Kuoni) - - 13 - 3
Top five groups 99 82 81 86 88
All others 5 18 19 14 12
Total (%) 100 100 100 100 100
Market volume (x1000) 1900 950 1172 950 4972
Typical market price per tour $ 616 695 569
Exchange rates: $ per 100 units 12.58 13.24 14.93
Source: Based on published data: The Association of Tour operators in Denmark, according to Rasmussen (1999);fvw 13/98 and fvw 13/99; www.aftenposten.no, 23 April 1998 (Holm, Per Annar, Loyalty program forcharter holidays); www.ving.se; Airtours Annual Report & Accounts 98. For details see Appendix 7.1.
Note: For the purposes of this case study these typical market prices will be assumed to apply for the Ving brandalso, both in general and for Internet sales. The European average is about DM 1000 per package ($569).
In the financial year 1998 SLG had revenue of £848 million ($1.4 billion), up 1.6% fromthe year before.253 SLG has about 3000 employees, and is owned by Airtours PLC of theUK. Airtours has over eight million participants per year, which makes it the world’slargest provider of air inclusive holidays.254
SLG had over two million participants in the financial year 1998255 (up from 1.8 millionin F’97). In Scandinavia the overall share of all the SLG brands together is 45%, slightlylower if Finland is included (40%), and a bit lower still if Poland is included (37%). In1997 the Ving brand counted 825 000 participants, which increased to about 866 000 in1998.256 In 1998 Ving Sweden alone sold 500 000 tours - in a market which approachestwo million package tours per year. Norway is the second largest market for the Vingbrand, since Ving holds a 25% share of the 950 000 Norwegian charter tour market, i.e.
253 Airtours Annual Report & Accounts 98. 1£ = $1.6565. Cf. also Appendix 7.1.254 Ibid.255 Ving Sweden press release (e.g. 8 March 1999). Cf. also Appendix 7.1.256 The German travel magazine FVW 13/98, p. 10. Europäische Veranstalter in Zahlen + Appendix 7.1.

197
240 000 tours for Ving Norway.257 Ving Denmark sold 136 000 packages in 1998.258 Vingwas introduced to the Polish market in February 1998, with the opening of seven outlets.During the first year Ving captured 3% of the 680 000 Polish market (where the leaderOrbis with 272 000 holds a 40% share259). In total Ving employees between 1000 and1500 people in Scandinavia and Poland.
Figure 7.7 Ving sales by market, in general (1998)
Sweden56%
Norway27%
Denmark15%
Poland2%
Sources: www.ving.se; www.aftenposten.no, 23 April 1998; The association of tour operators in Denmark, accordingto the Danish national newspaper Jyllands-Posten, 17 April 1999; Airtours Annual Report & Accounts 98.
Note: Total sales volume was about 888 000 packages.
Ving only sells direct through 64 wholly owned retail outlets in Sweden (33 outlets), Nor-way (18), Denmark (6 + three with telephone sales only) and Poland (seven) as well asthrough the Internet. Sixty-five percent of all Ving tours are sold via telephone, and theshare is increasing every year, and so will sales via the Internet to which we will return.Whether the share of telephone sales will continue increasing remains to be seen, since theInternet will mainly capture those customers who used to order by phone. Previously the
257 Holm, 1998. The expectations mentioned in this source are assumed to have been fulfilled. The 950 000 in
market size includes 150 000 package tours by scheduled flights (e.g. Prisma Tours).258 The Association of Tour Operators in Denmark, according to Rasmussen, 1999.259 fvw 13/99, p. 19.

198
customers had to wait on the phone if there was no available agent at the outlet to whichthe customer called. But now a virtual call centre has been established. This means thatthe calls are automatically - and at no extra costs for the customer - channelled to an outletwhere there are available sales persons.
The first version of the Ving Sweden website was opened in 1995. The current one is thethird version. It contains the following:• A digital catalogue, which is an adapted version of the printed catalogue, suited to the
Internet medium, i.e. less text - but in information style, with few superlatives. Manyphotos have been retained.
• Last minute tours (updated every two hours).• A booking function. Currently 80% of the product offerings can be booked via the net.
The objective is to reach 90%-100%. The remaining products, combination tours, arecomplex and therefore difficult to put on the net.
• Catalogue ordering.• Last minute information about trips, which is updated several times a day.• A customer service function, where the enquiry (fill-in-the-blanks type of form) is sent
from the website directly to the appropriate department. The objective is that repliesshould be sent within two hours, when the enquiry is received on work days between9.00 and 19.00 hours.
There are interactive search functions. Prices are shown. Availability can be checked.Bookings can be made on the net, after which the customer gets a confirmation on thescreen. Payment has to be undertaken by traditional means, though. The customer receivesthe invoice and travel documents by mail within three days. Only product offers which areactually available are presented to the Internet user. Booking enquiries from the net godirectly into the existing booking system. So the availability data is completely real-time.Ving started a Scandinavian payment project at the beginning of 1998 involving banks,also in Britain. Ving feared loosing Internet sales if payment could not be made on-line,but that does not actually appear to be a problem (perhaps on the contrary). Thus Ving willlet the Internet payment project take as long as needed to find a good solution for the cus-tomers. Ving has listed five criteria for a payment solution:
1. It must be simple for the customers.2. It must be secure for the customers and for Ving.3. It must require only a limited investment for Ving. (Today many solutions are rather
expensive.)4. The banks must approve (of) the solution.5. The solution must be usable for a great proportion of the population.

199
(Credit cards have a high penetration, but payment over the net by credit card paymentis currently not accepted by banks in Sweden260).
There are separate but similar websites for Ving in Sweden, Norway and Denmark, re-spectively. The Polish site was under construction in the first half of 1999. On the Swed-ish, Norwegian and Danish Ving sites, tours with departure one week or more ahead canbe booked. The Internet user must have a special Ving Card in order to make a booking.
The internal booking system (legacy system) dates back to the 1970s, and runs on a Tan-dem mainframe computer, with terminals attached. It is a stable and secure system withgreat capacity. Similar systems are frequently used by banks and insurance companies. Butthere are limitations to the system when it is to be connected with a contemporary com-munication technology like the Internet. It has not been without problems to couple thesetwo worlds, represented by different departments and people. On one hand there is theinternal computer department, with experienced (Cobol) programmers. On the other handthere are the young people from the Web consultants. These two groups of people mustcommunicate and learn to understand each other. So, there have been cultural and techni-cal barriers to overcome. The coupling of the Internet with internal systems is - or was -an untested route, and there was nobody to ask for advice. Therefore budgets and timeschedules were overrun. The process was a frustrating but instructive one.
In Sweden Ving does not give any discount for Internet orders - the argument being thatVing sells its packages direct (via its own shops and the Internet), and already has fairprices. In the summer of 1998 Ving in Norway did give a NOK 150 ($20) discount perpackage ordered via the net. But the Scandinavian management group has decided that nodiscounts will be given for Internet bookings. Ving tries to please its loyal customers.Research among these have shown that they look for high quality and good value-for-money products, which Ving provides, whereas a price difference of $10-20 is not thatimportant to them. It is questionable if is worth trying to please those customers who onlylook at the price ticket.
A number of impressive statements have been published about the Internet sales results ofVing Sweden and Ving Norway and about their expectations of future Internet sales:
• In April 1998 it was the expectation of Ving Sweden that the Internet would accountfor 3%-4% of sales in all of 1998.261 (~17 000 packages, Internet revenue of SEK 84million, ~$11 million).
260 For the Internet payment situation in Denmark, see Appendix 7.5.261 Dagens Nyheter, www.dn.se, 15 April 1998. Now the charter holiday can be booked on the net (In Swedish:
Charterresan kan du numera också boka på nätet).

200
• From April 1998 to December 1998 Ving actually achieved sales of SEK 60 million($7.5 million) through the Internet 262 ($7.5 million, ~12 300 packages ~2.5% of all the500 000 packages sold by Ving Sweden in 1998). So, the expectations were fulfilledmore than 70%, which is rather impressive by Internet commerce standards.
• In January 1999 the Internet actually accounted for 5% of Ving Sweden’s total revenuefor the month.263
• In April 1998 it was the expectation of Ving Sweden that the Internet would accountfor 6%-8% of sales in all of 1999. 264
• The Internet is a strategically important drive for Ving. A great increase within thenext three years is expected, and this applies to Ving in all of Scandinavia.265
• During the five months from April to the end of August 1998 Ving Norway sold itsfirst 1000 packages through its website (~ $0.7 million). This was 50% more than ex-pected for the period (the high season).266
• During all the nine months of 1998 in which the booking site was active, Ving Norwayachieved NOK 10 million in Internet sales 267 ($1.3 million ~ 1900 packages).
• In the beginning of 1999 Ving Norway projected Internet sales alone for the first eightmonths of 1999 of NOK 20-30 million 268 (~$3.3 million, 4800 packages).
• In the long run Ving Norway expect that the Internet will reach 20% of its sales. 269
From authoritative published sources it can thus be determined that Ving Sweden achievedInternet sales of $7.5 million in 1998, and Ving Norway $1.3 million, i.e. almost $9 mil-lion in total, corresponding to about 14 000 packages. In chapter 2 all Internet travel salesin (Western) Europe were estimated at about $250 million in 1998, of which tour packageswere estimated to account for 18%, i.e. about $45 million. This means that the Ving brandin Scandinavia accounted for 20% of the value - and 18% of the volume - of all Internetsales of tour packages in Europe in 1998. Ving Sweden alone accounted for about 17% ofpackage tour Internet sales by value. It must be taken for granted that Ving Sweden aloneranks among the top three Internet sellers of packages tours - directly from tour operatorsor through any Internet travel intermediary - on the European market in 1998.
262 Veckans Affärer, 22 February 1999. Special: Electronic commerce - The trading possibilities of the future are
already on the net (in Swedish), www.ad.se.263 Ving Notes, Stockholm, 8 March 1999, www.ving.se.264 Dagens Nyheter, www.dn.se, 15 April, 1998. Now the charter holiday can be booked on the net (In Swedish:
Charterresan kan du numera också boka på nätet). 265 Press release from Ving, 12 August 1998 (Eivor Andersson, VP, Ving Sweden), www.ving.se,266 Press release from Ving Norway, 2 September 1998 (Petter Asperud, MD, Ving Norway), www.ving.no. Ving
Norway gave NOK 100-150 in discount per package for Internet orders placed before 15 September 1998(2%-3%).
267 Stated in January 1999 in Oslo, when Ving Norway won first prize in the Internet category among travel andtourism organisations on the Norwegian market, at the annual conference in the Norwegian chapter of the Hos-pitality Sales & Marketing Association International (HSMAI), www.hsmai.no.
268 Ibid. 269 Press release from Ving Norway, 25 May 1998 (Petter Asperud, MD, Ving Norway), www.ving.no

201
Looking beyond the package tour category to European Internet travel service suppliers ingeneral, Ving Scandinavia and Ving Sweden alone also rank highly. For example, the$7.5 million sales achieved by Ving Sweden is slightly more than Lufthansa, whichachieved $7 million (DM 12.3 million) in 1998, less than a third of expectations.270 Vingcannot claim any of the top three positions among European Internet travel service suppli-ers overall, at least not if intermediaries are included,271 but Ving Sweden alone with its$7.5 million sales probably ranks in the top five among all suppliers to the $250 millionEuropean Internet travel service market in 1998. And what appears to be the main reasons why Ving, especially Ving Sweden, has beenable to perform so well on the net in 1998?• Ving is a very well known brand, and is a market leader in its field.• Ving only sells direct.• The Internet has a very high penetration in Ving’s main markets.• Payment can be undertaken off-line, by conventional means.
The number of Web users keeps increasing, even in Sweden. This mean that the 5% forJanuary is most likely to result in at least 6% of sales via the net for the full year 1999.
270 FVW 6/99, p. 26 (actual) vs ITB, March 1998 (expected). 271 One European travel service supplier (an airticket Internet intermediary, TISS of Germany, www.tiss.com)
managed to reach about $26 million in travel (airticket) sales over the Internet in 1998, a doubling from 1997. And TIScover of Austria (www.tiscover.at), managed to generate hotel reservations worth $20 million in actual revenue for the hoteliers, cf. Marcussen (1999). Apollo generated about $15 million in revenue via the Internet in 1998 (cf. chapter 7.6)

202
Table 7.16 Summary and interpretation of published statements about Ving’s pack-age tour sales via Internet - compared with European tour operators ingeneral: percentage of own volume and percentage of own revenue via thenet for 1998, 1999 and 2002
Tour operator 1998(actual)
1999(predicted)
2002(predicted)
Ving Sweden 2.5 6 18
Ving Norway 0.8 2 14
Ving Denmark 0.0 1 10
Ving Scandinavia 1.6 4 15
Other European 0.08 0.3 1.7
Europe total 0.10 0.30 1.9
Source: Own estimates based on Ving statements and own estimate and forecasts for Europe, cf. chapter 2, Appendix7.2 and Appendix 7.3.
Note: In Veckans Affärer, 22 February 1999, the SEK 60 million for Ving Sweden in 1998 is mentioned to corre-spond to 3% of total revenue, which is assumed to have been rounded up from about 2.5% (mentioned in theabove table).
Ving has one of the most popular Internet site for travel in Sweden (in terms of salesvalue), and is in the top 10 among the Swedish Internet shops overall (by value) in1998.272 In January 1999 www.ving.se counted 142 000 unique visitors. According to IDCthere were 2.52 million Web users in Sweden in January 1999 corresponding to 29% ofthe whole population, cf. Figure 2.3.273 This degree of Web penetration is only supersededby one other country in Europe, namely Finland. This means one in 18 of the SwedishWeb users visited the Ving Sweden site in January 1999. The result of this was that 5% ofVing’s total sales in January 1999 went via the Internet, which makes Internet the fifthlargest retail outlet for Ving Sweden.
As for lookers to bookers - or the number of visits per booking: the 142 000 unique visitorsto the Ving Sweden site in January 1999 covered 200 000 user sessions (visits), and gener-ated about 1000 Internet bookings (with two packages sold per booking, i.e. 2000 pack-ages). The ratio of visits to bookings per booking was thus 200:1. This is a rather impres-sive ratio, since a booking for a tour normally means two packages at a total price of at
272 The overall ranking for a number of Internet shops in Sweden for 1998 is mentioned in Appendix 7.3. Ving
ranks as number nine, according to Faktaruta in Veckans Affärer nr 8/99, www.va.se, also referred to in a VingSweden press release. Two major travel service players, SAS and Swedish Rail, do not appear on the list eventhough it goes down to under $1 million (SEK 5 million). Whether this is because they have chosen not to pro-vide data for the list or because their Internet revenue is less than 1$ million is not clear. A third major player,certainly in the Internet field, is the tour operator Apollo, which ought to have been on the list.
273 IDC, January 1999, European Internet Statistics: How many people are on-line in Europe?www.eurointernet.idc.dk/start.htm. Internet or Web use should not be confused with Internet access which isobviously even higher.

203
least $1000 on average, which is a lot more than a simple return ticket for a flight or along distance return ticket by train, or a couple of nights at a hotel, where ratios slightlybetter than this can be found. The explanation must lie in the following observation byVing: it is primarily travellers who know what they want who book via Internet.
Just before Ving started selling package tours over the net it was expected that the majorityof Internet sales would be last minute tours, yo-yos (flight only), packages with modestaccommodation, trips to Greece, i.e. low budget trips. These types of tours have certainlyalso been sold over the net, not least last minute offers, but what has sold best, relatively,are the most exclusive tours, called Sunwing, which have accounted for twice as great apercentage of Internet sales than of sales in the shops, i.e. 18% vs 9%. Package tours areconsidered well suited to be sold over the net, if the explanations are clear.
Ving has definitely received additional orders because of its website. Ving reaches newtypes of customers. Sometimes customers come into the shops with pages which they haveprinted from the Ving site, and sometimes they have booked over the net in the last min-ute, and then walked into an actual shop and paid for the trip, bringing their Internetbooking confirmation. The Internet appears as a virtual shop in Ving’s statistics with itsown number, and it can be seen from the booking number that it is an Internet booking.Therefore the sales agents know that the customer has booked over the net and are able toform an opinion about the typical profile of Internet bookers, i.e. they are relatively highlyeducated and high income customers.
The Internet drive has been a big investment for Ving, which plans on a three year pay-back period for the Internet investment in the three Scandinavian countries and Poland,i.e. in principle the years 1998-99-2000 (for Sweden and Norway - but the solutions forDenmark and Poland were not implemented in 1998). The actual magnitude of the Inter-net investment (initial investment and annual running costs) is difficult to estimate, sinceit involves percentages of the time of a great number of people, in addition to one full-timeperson, but it is a one-digit number of millions of SEK. Savings are made on the individ-ual Internet transaction. Considerations about the magnitude of these cost savings, break-even and pay-back are given in Appendix 7.4.
Those who send e-mail may be three-child families, and for these it is difficult to specifytheir booking over the net. Eighty percent of e-mails received are about booking. The restmay be about security risks at the destination, or the telephone number of a certain em-bassy. Ving are happy to respond to these sorts of questions by e-mail instead of customersoccupying telephone lines trying to get an answer.
The Internet project has affected the whole organisation. All the information on thewebsite is generated from a number of different databases, some of which are new, while

204
others existed before. In total there are 60 people employed in Ving’s IT department whichalso overlooks the IT side of SLG’s activities on the Finnish market.
Ving has high ambitions and visions for its web activities, and this goes for all the Scan-dinavian countries. As mentioned, Ving Norway has stated that in the long run it is ex-pected that 20% of Ving tours will be sold over the net. The projection must certainly beassumed to be valid for Ving Sweden - and Ving Denmark also. What is meant by the longrun is not defined but it is probably up to five years ahead for Ving Sweden and VingNorway (since Ving Sweden mention a three year horizon), and slightly longer for VingDenmark. Counting 1998 as year one for Ving Sweden and Ving Norway, year five wouldbe the year 2002. Ving Denmark will probably be two or three years behind the otherScandinavian countries in reaching the same high percentage of Internet sales, partlybecause the Internet commerce solution for Ving Denmark has been pending. Anotherreason why it will take longer to reach the same level in Denmark could be the generalreluctance of Danes to place Internet orders over the net in light of the year-long debate inthe media about Internet payments. This climate of solid scepticism about the security ofthe Internet could have a negative impact even on those Internet shops - like Ving Swe-den, Ving Norway and several players in the Danish travel and tourism market - even ifthey do not settle their payment over the net. Many Internet shops have been awaiting thepossibility to pay in Danish Internet shops by credit card and international payment card,which came into reality in April 1999 (cf. Appendix 2.6). Therefore, even for Internetshops which do not intend to allow customers to pay via the net, there are competitivereasons to establish themselves in Denmark as soon as possible.
There will be no new functions in the near future on the of Ving Sweden and Ving Nor-way sites. But there will be running adjustments, updating and maintenance. The nextmajor steps with respect to Ving’s Internet drive are to implement a sales solution forVing Denmark and Ving Poland. A currently limited but increasing part of the Polishpopulation is relatively well educated, with good salaries. When the functionality of allfour sub-sites has been pulled up to the same level, new functions may be considered. Forthis more distant future, things like Virtual Reality is technically a possibility - e.g. takinga look around the hotel room, etc. - but the general technological level of the users - whichis modest - must be taken into account. The search tools may be made more intelli-gent/flexible, e.g. searching by activity of interest for a given period.
7.6 Apollo, Sweden/ScandinaviaApollo was established as a tour operator in Sweden in 1986, as a specialist in tours toGreece. For this destination it maintains a 50% market share in Sweden, and 25% inDenmark. Apollo Denmark was established in 1994. Apollo claims to be the only Swedishowned tour operator left in the Swedish market.

205
Apollo has 150 employees in Sweden, 30 in Denmark, and between 70 and 170 seasonallyemployed travel guides.274 In 1997 Apollo sold 350 000 packages (fvw 13/99, p. 14),which is assumed also to be the level realised for 1998 (in all of Scandinavia). The averageprice per package is about SEK 4000 ($503). This means that revenue in 1998 is estimatedat SEK 1.4 billion ($176 million). The average price per package for Apollo is somewhatbelow the average for the market leader. Half of Apollo’s sales are made via a network of200 retail travel agencies in Sweden and 50 in Denmark, and the rest via Apollo’s ownshops, telephone and directly to end-consumers via the Internet. Apollo Norway was es-tablished in the autumn of 1998, with a programme for the summer of 1999.
Apollo was the first tour operator in Sweden to open an Internet booking site, which tookplace in January 1998. The Apollo site - in its Swedish, Danish, and Norwegian versions -contains all tours and flight-only offers and last minute offers. The last minute offers onthe Apollo Sweden site are updated constantly, and the site is integrated with Apollo’sinternal reservation system. On the Danish versions of the Apollo site the last minuteoffers appear to be infrequently updated (every two weeks). On the Norwegian version nolast minute offers as such are shown, but there is a list of this week’s departures with on-line availability data at least for the flights only. No hotels seems to be available for thisweek’s flight departures on the Norwegian version of the Apollo site.
In the middle of 1999 it was announced that Apollo had sold 100 000 packages (departedpassengers) via the Internet since the beginning of 1998, at an average price of $503 (SEK4000), i.e. about $50 million (SEK 400 million) in Internet revenue during the first 18months!
Table 7.17 Packages sold via Internet by Apollo (mainly www.apollo.se)
Year No. of packages sold via net Percent of packages via net1998 ~ 30 000 9% of 350 0001999 ~120 000 34% of about 354 000Note: The above is the writer’s estimate based on the statements published on the Apollo website as quoted above.
Since the beginning there had been steady increases in both the number of visits and thenumber of bookings, but the explosion came in January 1999. March 1999 was a recordmonth with 180 000 visits (user sessions), but the average during the first half of 1999 hasbeen 150 000. Most - if not all - of these visits are to the Apollo Sweden site, which has abetter functionality, and constantly updated last-minute offers - unlike Apollo Denmarkand Apollo Norway.
274 www.apollo.se

206
Since the very beginning of 1998 Apollo has offered discounts for Internet bookings,namely SEK 50 per participant at the Swedish site, corresponding to $6.30 or about 1.3%.This may perhaps not be much, but Apollo probably attracts relatively many price con-scious holiday-makers in general (cf. above). Apollo’s share of package tour sales in Swe-den and in Scandinavia in general is much higher that its overall market share. It must beassumed that the Internet discount - together with the constantly updated list of last minuteoffers on the Apollo Sweden site - is an important reason for the great success of ApolloSweden in the Internet sales field.

207
8. Summary, conclusions (accessing the proposi-tions) and reflections
8.1 Summary
8.1.1 The marketBy the end of 1998, about 50% of the world’s Internet users were from the US - and an-other 6% from Canada. Twenty-one percent were from Western Europe, and another 2%from Eastern Europe. The focus here is on Western Europe. Within Western Europe,Germany, the UK and the Nordic countries (the three Scandinavian countries and Finland)account for about 63% of Internet users as well as of Internet buyers. These countries werechosen from the beginning, but cases from four or five other European counties have alsobeen included. There were 37-40 million Internet users in Western Europe by the end of1998, which corresponds to about 10% of the whole Western European population. But inthe last quarter of 1998 only one in 10 of the Internet users bought anything via the net(with or without payment on-line). Therefore it is easy to understand that Internet com-merce was a limited phenomenon in Western Europe in 1998. But the number of Internetusers is set to double or triple by 2002. Internet buyers as a percentage of Internet userswill increase from 11% to 24%, and the average amount spent online will increase perhapsfive times. Therefore it is also easy to understand that Internet commerce in WesternEurope will increase dramatically until 2002 and beyond.
Travel and tourism products lend themselves very well to being sold over the net - and areone of the best sellers on the net measured by its share of business-to-consumer (B-to-C)Internet commerce, certainly in the US, and to some extent also in Western Europe. In1998 Internet travel sales were about $250 million in Western Europe, corresponding tojust 0.15% of selected and specific major categories of (pre-bookable) travel and tourismservices. This was just a tenth of the level in the US in 1998, but the percentage is set toincrease to 3% in 2002, i.e. a 20-fold increase in four years. With respect to the mix ofInternet travel sales in 1998, airtickets are the main category, both in the US and Europe.Intermediaries played a somewhat less important role for Internet travel sales in Europethan in the US (a third vs half of Internet travel sales), but intermediaries are likely toincrease their share in Europe. The main emphasis in this book is on the direct Internetsales opportunities. All examples within the transportation sector and package tours are ofprincipals selling direct via the net, whereas all examples from the accommodation sectorinvolve intermediaries. Clearly intermediaries play a central role in the accommodationsector in aggregating supply into volumes which make it technically and economicallyfeasible to distribute these services on a real-time online basis via the Internet/WWW.

208
Within the transportation sector - such as for airtickets - intermediaries can help ensurethe customer the lowest price from any supplier. Package tours are much more importantin the European market in general than in the US, and this is also reflected in packagetours accounting for a much larger part of Internet travel and tourism sales in Europe thanin the US. Train travel too (here delimited to long trips), is a much more important formof transport in Europe than in the US, and there is some emphasis on train operators - aswell as on tour operators - on the net in this book.
In the US payment by credit card is very common in general and on the net. In EuropeInternet users tend to prefer to settle payment off-line, which for travel and tourism serv-ices (such as package tours or holiday cottages) is unproblematic since these products aretypically booked well in advance and then paid for at least partly within a certain numberof days. SET is very secure, perhaps unnecessarily so. SET is cumbersome to implement,and it is unlikely that the standard will ever gain widespread acceptance - unlike the lesssecure but generally accepted standard SSL (now also in Denmark!).
8.1.2 TransportationAirlines: US airlines carry more than twice as many passengers per year than their West-ern European counterparts. Almost every airline in the world has a website. However,whereas bookings could be made on 19 of the top 20 US airline sites, this was only thecase for 12 of the top 20 European airline sites, and for just four of the sites of the 20 larg-est airlines in the rest of the world (end of 1998 status). Furthermore, among those airlinesites in the different parts of the world where bookings can be made, some kind of extraincentive for Internet bookings are used on more than half of the US sites. None of thosein Western Europe offers this, and neither do any of the largest airlines in the rest of theworld. No European airline was even close to getting 1% of its passenger revenue viaInternet in 1998, but at least one airline is likely to surpass 1% in 1999 (Braathens, ~1.5%of revenue on Norwegian routes in 1999). A number of the largest European airlines ex-pect increased direct sales, also via the Internet. Two are dreaming about the 50% level by2002 or 2003 (but not merely via the net). By the middle of 1999, status for booking capa-bilities is as follows: bookings can still be made on 19 of the top 20 US airline sites. Nowbookings can be made on 16 of the top 20 European airline sites, and on seven of the sitesof the 20 largest airlines in the rest of the world.
Train operators: railways should really be called train operators, since ownership of tracksand trains is being separated. We generally mean train operators, when using the commonterm railways. German Rail (Deutsche Bahn, DB), is clearly the largest railway by numberof passengers, followed by 25 UK train operators together, and French Rail. Most of theworld’s railways have established websites, and certainly all of the Western European oneshave. Bookings can be made on half the sites, partly only on an e-mail request basis. Five

209
of about 18 offer real-time seat availability information and online booking with instantconfirmation. On six of the 18 sites payments or transmission of payment detail are online.Four of 18 offer information about delays in arrivals. In Western Europe only the re-vamped site of Norwegian Rail, opened in the spring of 1999, offers all features, but con-tains no international timetables. However, the DB site does. It counts the highest numberof page views per month of any European travel and tourism site, namely 18 million, inMarch 1999. Several railways (train operators) are considering distributing electronicinformation (which is already on the net) via mobile phones as well. The Nordic countries,which have the highest Internet penetration in Western Europe, are also those with thehighest penetration of mobile phones. A website feature matrix, developed for and appliedto train operators, could be applied to other transportation service sites, and in modifiedform to accommodation service sites, etc. The categories of the matrix follow the (a) be-fore-the-purchase (b), before-and-during use (c) after-use/purchase phases and contain thefollowing main sections:
• Timeschedule/route functions (product information);• Incentives for Internet bookings;• Booking features and functionality;• Payment methods;• Ticket retrieval methods;• Punctually information;• Repeat sales promotion.
Coaches, rental cars, and ferry lines: in Western Europe, the only examples of up-frontdiscounts for Internet bookings were found with one coach operator and one car rentalfirm: National Express (Eurolines UK) and Europcar, Germany. Almost every major in-ternational ferry line in Europe already had a website in the spring of 1998. For the ferrylines - which should actually be called ferry operators since one operator typically hasmany routes (lines) - there appears to have been one of two directions into which to movefrom 1998 to 1999: either off the net (a weak trend)275 or to implement greater functional-ity such as Internet booking functions, real-time availability information, and on-linepayment (a strong trend). Scandlines received reservations for about 2.5% of its 5.8 mil-lion car crossings in 1998 via the Internet, and this will probably increase to 3.8% (of asomewhat lower number of car crossings - but with a higher average price) in 1999. StenaLine, is set to get about 2% of the reservations for all its 1.8 million car crossings in 1999via the Internet.
275 Discontinuation of the firm as such was the explanation in at least one instance.

210
8.1.3 AccommodationTechnically it is (of course) possible for an individual accommodation property to offerreal-time availability data from its internal booking system, but economically it is notfeasible. European hotels in general are small properties (frequently chain independent),European youth hostels are generally somewhat smaller than hotels measured by annualrevenue, camping sites are smaller than youth hostels - and one holiday cottage generatesonly a small supplement to the owners’ other incomes. The only technically and economi-cally feasible way to offer online booking of practically any form of accommodation goesvia an intermediary. The examples given in this book include:
1) a completely Internet-based hotel booking firm - which keeps availability data andtherefore is able to confirm Internet bookings instantly (break-even reached);
2) a traditional hotel booking firm, which does not make use of GDS distribution, butwhich has supplemented the conventional ways of taking bookings (fax, telephone,letter) with Internet distribution - and which keeps availability data (break-evenreached);
3) three cottage letting agencies - which all keep availability data (none of the three hadreached break-even in 1998) - but in the first half of 1999 all three of them receivedabout 10% (ten percent!) of their bookings via the net;
4) a booking request system of a national youth hostel association (break-even reached) -which does not keep availability data - and supplements the forwarding of the websitegenerated booking requests by e-mail with fax-forwarding;
5) a booking request system of an international camping site directory (break-even notreached) - which does not keep availability data - and only forwards the website gener-ated booking requests by telefax.
8.1.4 Package tours - tour operatorsIn Germany half the top 10 tour operators offer availability data and online booking op-portunities on their websites. Internet users
a) either get the choice of making the booking directly with the tour operator or choosinga travel agent for fulfilment;
b) or get no other option than going through a travel agent for fulfilment.
In Switzerland the top five tour operators offer on-line direct booking of last minute tours.In Scandinavia the largest tour operator brands (UK owned) offer online real-time direct-only booking of most of their programme. In Germany and Switzerland Internet users aregiven the option to settle payment by transmitting their payment details via the net, wherecredit card is one of several options, but in the Nordic countries payment is settled offline.

211
On the websites of the tour operators in the rest of Europe there is no real-time Internetbooking functionality.

212
8.1.5 Overview of case studiesThe following 26 examples of innovative websites from 10 European countries have beengiven, plus a brief mention of one Polish and some North American parallels:
Table 8.1 Overview of case studies
Firm Product
Principal
Intermediary
Germ
any
UK
Sweden
Norw
ay
Finland
Denm
ark
Switzerland
Netherlands
Spain
Rep.Ireland
Poland
USA
Canada Web address:
- (TISS) Planes x x www.tiss.com1 Deutsche Bahn Trains x x www.bahn.de2 Lufthansa Planes x x www.lufthansa.de3 TUI Packages x x www.tui.de4 Europcar Cars x x www.europcar.de5 HRS Hotels x x www.hrs.com6 eCamp Camping x x www.ecamp.de7 British Airways Planes x x british-airways.com8 Virgin Trains Trains x (+) x .thetrainline.co.uk9 National Express Coaches x x .eurolines.co.uk
10 Apollo Sweden Packages x x www.apollo.se
11 Ving Sweden Packages x x www.ving.se12 Swedish Rail Trains x x www.sj.se13 Stena Line Ferries x x www.stena-line.se- SAS Planes x x www.sas.se- (Ving Norway) Packages x x www.ving.no
14 Braathens Planes x x www.braathens.no15 Hostel. Norway Hostels x x www.vandrerhjem.no
16 Finnair Planes x x www.finnair.com17 Matka-Ruka Cottages (x) x .travel.fi/int/Ruka/18 Danish Rail Trains x (+) x www.dsb.dk19 Scandlines Ferries x x www.scandlines.dk20 dansommer Cottages (x) x www.dansommer.dk21 Sol & Strand Cottages (x) x www.sologstrand.dk
22 Kuoni Packages x x www.kuoni.ch23 Swiss Rail Trains x x www.sbb.ch24 Bookings NL Hotels x x www.bookings.org25 Iberia Planes x x www.iberia.es26 Irish Ferries Ferries x x irishferries.ie- LOT Polish Air. Planes x x www.lot.com
- AmTrak Trains x x www.amtrak.com- Greyhound Coaches x x greyhound.com- Royal Caribbean Cruising x x royalcaribbean.com - Carnival Cruising x x www.carnival.com- Via Rail Trains x x www.viarail.ca
Note: The sites of the firms in brackets are hardly described at all in this publication and are not given any number.Firms outside Western Europe are not given any number, and descriptions are brief only. The cottage lettingagencies act much like tour operators with respect to distribution and therefore have the sign (x) in the inter-mediary column.

213
8.2 Accessing the propositionsNow a series of propositions about the effects of the Internet will be presented, based onfindings from the case studies and other findings presented in this book, and their likeli-hood assessed. Where relevant this will be supplemented with reference to current litera-ture such as printed articles and reports, and especially information published on the Web.
8.2.1 Distribution over the net - and priceP1. Prices to the end-user of the most commodity-like tourist/travel products are - or will
be - lower than the same products being sold through traditional distribution chan-nels.
Prices for many commodities will fall throughout Europe, Jones predicted, because ofonline commerce and alternative distribution channels enabled by the Internet. Healso said the ability to compare prices will drive competition and lower prices fur-ther.276
In general, for the time being - in 1999 - prices are not lower than the same products beingsold through traditional distribution channels. Up-front discounts are very hard to find.However, early in 1999 two European examples of temporary up-front discounts werefound, namely, Europcar in Germany (up to 46% off list prices on a certain car-type, actu-ally a VW, which partly owns Europcar), and National Express coaches of the UK (10%off every fare for net bookings for a period of about three months). None of these offerswere available any longer in June 1999. In the US two examples of car rental companiesgiving discounts for Internet bookings were found (Hertz and Budget, both 20% off inNorth America). It is perhaps no coincidence that examples of discounts were found pre-cisely within the car rental industry, which is generally known for making companyagreements with discounts certainly in excess of 20%.
276 Sanchez-Klein, 1998.

214
However, one example of a permanent discount for Internet bookings was found, namelythe tour operator Apollo in Scandinavia. Apollo, whose main market is Sweden, gives$6.30 (SEK 50) in discount per participant, corresponding to about 1.3%.
For the time, however, being special discounts are generally not given for net bookings.Furthermore, no statements about plans for discounts for net bookings in future werefound. P1 as it stands must be clearly rejected. Travel and tourism service providers tendto think that convenience is enough to lure customers to make Internet bookings.
P2. Prices are not commonly reduced for tourist/travel products offered over the Web. Thisis impeding sales over the net.
It is definitely true that prices are not commonly reduced for Web bookings, as notedabove. It has also been shown that Internet travel sales, were very limited in Europe in1998 (0.15% - vs 1.5% in the US), and still low in 1999, although some encouraging ex-amples of growth from 1998 to 1999 were found. Common sense and general price theorytell that of course this impedes sales over the net depending on price elasticity of demand.However, every supplier tends to believe that precisely their service and brand is of a kindwhere price is not a main selection criteria.
Apollo, as mentioned under P1, is one of the most successful Internet marketers in Europe.It does give a small discount for Internet bookings, and is getting an astonishing percent-age of its sales via the Internet. Apollo’s customers, especially those buying via the Inter-net appear to be very price-sensitive. Apollo is getting a much greater share of Internetpackage tour sales in Sweden than its general market share would suggest. The (small)discount given by Apollo must be considered the main reason for Apollo’s tremendousInternet sales success. Clearly, suppliers who serve price-sensitive segments of any marketimpede their Internet sales by failing to give discounts for Internet orders, discounts whichcould possibly have been very well justified by cost savings (including e.g. travel agentcommission and/or less phone staff time) and gross profit from additional sales.
8.2.2 Distribution over the net - and promotionP3. Promotion (information provision) and distribution are closely linked.
Hopefully this is true. Typically there are 100 visits to a website per web-booking. Thenotion that Internet lookers tend to book elsewhere afterwards, although they do not bookonline, seems to be supported by at least some surveys, cf. the PhocusWright study - which

215
used frequent flying as one of its respondent selection criteria.277 More research is neededto investigate the degree to which mainstream Internet users who visit booking websitesmake their booking off-line through traditional channels afterwards, not least in Europewhere Internet users appear to be more reluctant to make purchases than in the US. Hereonly dispersed evidence can be supplied: the sales agents of Sol & Strand, a Danish holi-day cottage letting agency whose main sales office lies in Flensburg, Germany, report thatmany customers have been on-line to search for available offers before they make a call -to ask further questions and/or to make the booking by telephone.
P4. As the Internet matures as an advertising medium, reliable and comparable mediameasurements will be developed as for other media.
There is certainly evidence that the Internet is coming of age. Industry bodies are beingformed to set standards for Web traffic measurements, for example in Denmark.278 Obvi-Wously, websites which sell, e.g. adds have to demonstrate comparable measurements ofexposures.
8.2.3 Distribution over the net - which products?P5. The more standardised (commodity-like) the product, the more it is being sold over the
net.
Airtickets, which are the most commodity-like travel services, account for a greater per-centage of Internet travel sales than of the total market value for travel services(irrespective of sales channel). This is true in the US and appears also be true in WesternEurope (cf. Figure 2.6 and Appendix 2.1).
P6. In general, the lower the transportation costs, the more likely it is that products will besold over the net. Services - such as tourism and travel products - are ideal for sellingover the net, since there are no transportation costs.
277 PhocusWright, 1998. The survey reveals 18% of wired travellers book on-line, press release, 4 November,
www.phocuswright.com/WTN0498.HTM: Look-to-Book remains industry issue. The majority of those whouse the Internet to look at travel options do not purchase them electronically. Fifty-seven percent of wired trav-ellers have looked, not booked. Of those, 70% have bought the tickets later from another source, such as atravel agent or airline.
278 www.fakdis.dk; fakdis = The Association of Commercial Danish websites. Irrelevant hits and page impressions(page views) are being filtered away - using the WebTrends Log Analyzer Tool (4.0a build 146). But most re-cently there have been grumbling about these measurings being 20%-40% too low, among other things becauseof local document storage at proxy-servers, from which the documents are being retrieved after a document haspassed through the proxy-server once. Subsequent readers of the same document are thus not counted. Nielsen,Claus Thor, 1999, Mess in the visit numbers (in Danish: Rod i besøgstallene), Computerworld DK, 18 June, p.8).

216
Travel services account for a much larger share of Internet commerce than of commerce ingeneral, even within B-to-C markets. In Europe computer hard- and software dominatesB-to-C Internet commerce, in the US less so. On the other hand, in the US travel accountsfor as much as a fourth of B-to-C Internet commerce, vs roughly 15% in Europe, and ob-viously this a higher percentage than one would expect from their share of normal house-hold budgets, certainly in the US, but also in Europe.
8.2.4 Distribution/sales over the net - how much?P7. The lookers-to-bookers ratio will improve as the willingness of end-users to place
orders - and make payments - over the net increases.
TravelWeb’s Wacaser said more and more people are becoming comfortable buyingover the Internet, noting that her site's “look-to-book” ratio has improved in the pastyear. But exact figures are hard to come by because TravelWeb, like Southwest, In-ternet Travel Network and other sites, declined to quantify how many people boughttickets on their site, claiming that the information is proprietary.279
TUI found that the number of (Internet) visitors per (Internet) booking actually deterio-rated for a year or two after the beginning of 1997, since the number of website visitorsincreased faster than the number of Internet bookings. Then the ratio started improvingagain. Ving Sweden mentioned an improving ratio as well. A lot more longitudinal mate-rial which could illuminate trends in website visitors and Internet booking, and thereby theratio, will be collectable after the end of 1999. Forecasts suggest that the percentage in-crease in Internet buyers is much higher than the percentage increase in Internet users,which is hardly surprising. But the gap in percentage points between Internet users andInternet buyers is bound to increase for the next few years except perhaps in two or threecountries in the world with the very highest Internet penetration which are approachingmaturity.
P8. The willingness of end-users to purchase tourism/travel products over the net is posi-tively correlated with factors such as the penetration of the net (in percentage of thepopulation), and the penetration of international payment cards in different countries.
In Europe about one in 10 Internet users bought anything via the net in 1998, vs one infour in the US. By the end of 1998 Internet penetration in Europe was about 10%, vs about27% in the US. Penetration of international payment cards, of which the major ones areAmerican, is much higher in the US than in Europe. Within Europe, if P8 were true, thosecountries with a relatively high Internet penetration would tend to have an even higher
279 Chris Scribner, Chris (Times-Union business writer), 1998, On-line reservations,
http://www.jacksonville.com/tu-on-line/stories/053198/bus_webtrave.html
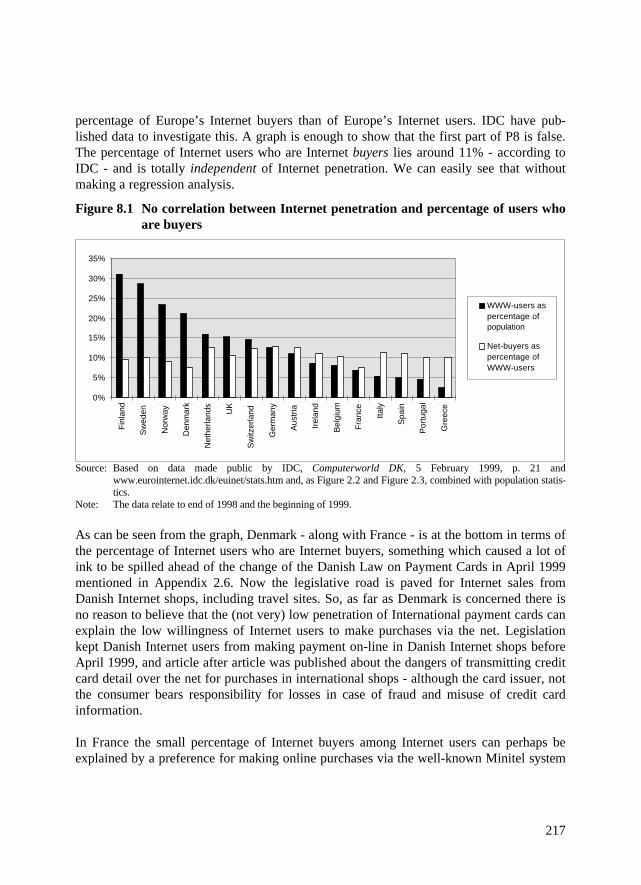
217
percentage of Europe’s Internet buyers than of Europe’s Internet users. IDC have pub-lished data to investigate this. A graph is enough to show that the first part of P8 is false.The percentage of Internet users who are Internet buyers lies around 11% - according toIDC - and is totally independent of Internet penetration. We can easily see that withoutmaking a regression analysis.
Figure 8.1 No correlation between Internet penetration and percentage of users whoare buyers
0%
5%
10%
15%
20%
25%
30%
35%
Fin
land
Sw
eden
Nor
way
Den
mar
k
Net
herla
nds
UK
Sw
itzer
land
Ger
man
y
Aus
tria
Irel
and
Bel
gium
Fra
nce
Italy
Spa
in
Por
tuga
l
Gre
ece
WWW-users aspercentage ofpopulation
Net-buyers aspercentage ofWWW-users
Source: Based on data made public by IDC, Computerworld DK, 5 February 1999, p. 21 andwww.eurointernet.idc.dk/euinet/stats.htm and, as Figure 2.2 and Figure 2.3, combined with population statis-tics.
Note: The data relate to end of 1998 and the beginning of 1999.
As can be seen from the graph, Denmark - along with France - is at the bottom in terms ofthe percentage of Internet users who are Internet buyers, something which caused a lot ofink to be spilled ahead of the change of the Danish Law on Payment Cards in April 1999mentioned in Appendix 2.6. Now the legislative road is paved for Internet sales fromDanish Internet shops, including travel sites. So, as far as Denmark is concerned there isno reason to believe that the (not very) low penetration of International payment cards canexplain the low willingness of Internet users to make purchases via the net. Legislationkept Danish Internet users from making payment on-line in Danish Internet shops beforeApril 1999, and article after article was published about the dangers of transmitting creditcard detail over the net for purchases in international shops - although the card issuer, notthe consumer bears responsibility for losses in case of fraud and misuse of credit cardinformation.
In France the small percentage of Internet buyers among Internet users can perhaps beexplained by a preference for making online purchases via the well-known Minitel system

218
rather than the net. Within Europe international payment cards have probably got thehighest penetration in the UK. And are a high percent of British Internet users then mak-ing Internet purchases? Not really, Britons conform to the European average in this re-spect. But in fact many UK Internet travel sites do take credit card details, unlike those inthe Nordic countries. So, even before attempting to establish the penetration of interna-tional payment cards per country there are several examples which point in the directionof a rejection also of the second part of P8.
8.2.5 Distribution over the net - and its effect on the different types ofactors in the distribution chainP9. Tour operators and other players at the wholesale level in markets which traditionally
rely heavily on retail sales through independent travel agents will start openingwebsites with the possibility of making bookings directly to them - thus bypassing thetravel agents.
This is overwhelmingly supported by the facts presented here.
P10. Airlines will start taking bookings for simple return tickets over the net - thus by-passing the travel agents and increasing their percentage of direct sales.
Yes certainly: many European airlines foresee and work in the direction stated in P10.One only needs to look at the annual reports of the airlines published on the net and sev-eral other sources such as newspaper articles. Examples: BA, SAS, Braathens, and manyothers.
Airlines ponder discounted Web fares: Major airlines may be on the verge of offeringtheir lowest fares to those who book from the airlines’ websites.280 Cf. also P2. Not a sin-gle airline, and certainly none in Europe are offering lowest fares (only) to those who bookon the airlines’ own sites.
8.2.6 The Internet and competitive advantageP11. Cost savings will only - to any measurable degree - be made by the big players.
Almost all the big players interviewed state that they save costs when customers use thewebsite of the given firm instead of contacting the firm in person or by phone - but so domost of the smaller players interviewed. On the other hand, only players of a certain sig-nificance in the Internet travel sales field have been involved in the research reported here.
280 http://www.usatoday.com/life/travel/business/t1102web.htm, 11/02/98.

219
P12. Advantages from a positive differentiation from competitors can no longer beachieved through simple (non-interactive, and non-transactional) websites. Alreadytoday making a positive differentiation from one’s competitors by means of the In-ternet requires more than just a basic website.
Positive differentiation can definitely no longer be achieved by a simple non-interactivenon-transactional, website.281 A simple website is hardly enough to stay even with com-petitors.
There are many opportunities for both principals and intermediaries to utilise the net.Only players who integrate (link) their legacy systems (internal reservations systemsand/or databases) with a webserver can offer the leading edge website functionality neededto gain a positive differentiation from competitors. This of course does not apply to new-comers, who do not have any legacy systems at all, but only an Internet-based bookingsystem.
Figure 8.2 Three basic architectures for Internet-based booking systems
Legacy system
Firewall
Inhouse Web-server
Web-users
Legacy system
Firewall (I)
Firewall (II)
External Web-server
Web-users
Internet only booking system
(with access restricted to certain fields)
Web-users
e.g. Stena Line e.g. Matka-Ruka e.g. Bookings NL
1. With inhouse server 2. With external server 3. Without legacy system
Real-time availability data and booking functionality with instant confirmation are quicklybecoming the norm within most parts of the travel and tourism industry (or industries) andtherefore something which is expected by customers now. A certain size or volume isneeded - to make the right connection to the net. For some, such as individual accommo-dation properties, it is technically possible, but hardly feasible, to establish on-line real- 281 Key informants were asked if a simple site was still enough? There was a resounding NO NO NO to this ques-
tion from all the key informants - except one, who may have misunderstood the question, despite efforts by thewriter to make sure that this was not the case.

220
time booking functionality themselves just for their own small business, but they maymake the connection via a (product and/or destination focused) intermediary who handlesthe technical side relating to online net bookings on behalf of the given individual - and ofmany other properties.
8.3 And the winners are...Here it would have been nice to have been able to say: the consumers. Although consumersdo get convenience, they rarely get any discounts for Internet orders. Internet marketerswill not get the Internet sales which many of them hope for unless compelling incentivesin the form of up-front discounts for Internet bookings are given to business and leisuretravellers/holiday-makers.
All the websites discussed in this publication are good in their own right, and in some wayinnovative. That is why they have been included. Obviously, as has been illustrated byexamples from a great number of different types of tourism and travel services, the Inter-net can be used by largely any type of actor, although in the accommodation sector indi-vidual properties have to go through some kind of intermediary to be able to offer Internetusers the possibility of making bookings via the Internet with instant confirmation. Evenin the case of booking request solutions, it seems to be an advantage for the accommoda-tion to be under the umbrella of a well-known entry point.
In terms of sales in absolute numbers - or seen in relation to the firms’ own total turnover.Table 8.2 provides a list of European Internet marketers who have been successful, as faras the writer has been able to determine.

221
Table 8.2 Some successful European-owned, European-oriented websites, 1998 and1999
Name Country Tourism / travel service $ Million % of Break-even
Internet sales revenue reached
generated 1998[and 1999]
1998[and 1999]
in 1998?
1 TISS GmbH Germany Intermediary - airtickets 26[ 52 ]
100[do]
Yes
2 TIScover.at Austria Destination based reserva-tion system
20[ 55 ]
? No
3 Apollo Sweden Tour operator 15[ 60 ]
9[34]
Yes
3b Ving Sweden Sweden Tour operator 7.5[ 18 ]
2.5[ 6 ]
No
3c TUI Germany Tour operator 6.1[ 24 ]
0.2[0.8]
No
4 Lufthansa Germany Airline 7[ 28 ]
0.08[0.3]
No
4b Braathens Norway Airline 0.9[ 5 ]
0.15 [ 1.5 ]
No
5 Scandlines Denmark[+Ger./Swe.]
Ferry lines (for cars) 5.9[ 7.2 ]
2.5[ 3.8 ]
Yes
5b Stena Line Sweden Ferry lines 0.6[ 2.8 ]
0.3[2.1]
No
6 DSB Denmark National train operator 3[ 6 ]
0.8[1.6]
Yes
6b DB Germany National train operator -[ ~4, min.]
0[ 0.2 ]
No
7 Bookings NL Netherlands Intermediary - hotels 2[ 7 ]
100[do]
Yes
8 Matka Ruka Finland Holiday cottages 0.7[ 1.6 ]
6[ 12 ]
No
8b dansommer Denmark Holiday cottages 0.4[ 4 ]
0.8[ 7.5 ]
No
9 National Express UK Long distance coaches 0.5[ 1.6 ]
0.07[0.22]
Yes
9b Svenska Buss Sweden Long distance coaches 0.07[ 0.14 ]
1.5[ 3 ]
Yes
10 eCamp Germany Camping 0.4[ 0.7 ]
Marginal No
11 Hostels Norway Norway Youth hostel association 0.3[ 0.5]
3.2 [ 5 ]
Yes
Sixteen players from eightcountries
Total, 1998:[Total, 1999:]
96[ 278 ]
Increase,98-99: 188%
Note: Criteria for inclusion: published or estimatable Internet revenue figures, and number one or two within acertain category. For package tours three are included, though. Not included: hotel chains and car rentals,BA, SAS, KLM and non-European-owned online travel agencies. For dansommer the percentages are for thebooking-year. For the calendar year the percentages are higher.

222
About 81 of the $96 million Internet travel sales in 1998 were generated by the Europeanmarket (i.e. by European residents) - out of a total Western European Internet travel mar-ket estimate of about $250 million for 1998. This means that about 33% of the estimatedtotal Internet travel revenue on the Western European market in 1998 is accounted for bythe players in Table 8.2.
TISS GmbH (Travel Information Software Systems GmbH of Germany) grabbed firstposition in Europe in 1998 in terms of Internet revenue generated, if sales to non-Europeans are included.
But for TISS GmbH (which is in no way connected with TIScover.at) as well as forBookings NL, about half of the revenue is generated by non-European markets, i.e.largely by US residents. 282 At least $13 + $1 million = 14 million of the 1998 Internetrevenue is thus not generated by the European market. Some of Lufthansa’s and TIS-cover’s Internet revenue is probably also generated by Americans. But all the Internetrevenue by the other players shown in Table 8.2 is generated by Europeans (i.e. theEuropean market). British Airways’ Internet sales figure for 1998 has not been pub-lished, but for BA a great part of its Internet revenue is probably generated by non-Europeans (Americans),283 and the same goes for KLM.
TIScover.at of Tyrol in Austria generated accommodation revenue of about $20 million in1998, which was the second highest of any European travel and tourism service siteknown by the writer. TIScover is set to keep its number two position in 1999, duringwhich year it is hoped that the system will reach break-even.
Within airtickets and hotels there are firms which are entirely Internet based, and profit-able as well.
Among the traditional businesses which have adopted the Internet as an additional distri-bution/sales channel, there are three tour operators, which have achieved remarkable re-sults:
1) Apollo (mainly Sweden - but also active in Denmark, and from 1999 in Norway),achieved Internet revenue of $50 million during its first 18 months of existencefrom the beginning of 1998 to the middle of 1999. In light of this, total Internetrevenue for 1999 could be $60 million for all of 1999 (or even considerably
282 For TISS about three times as much revenue is generated via e-mails to TISS fulfilment agents, based on
information from the TISS site (www.tiss.com - www.europe.ibm.com/nc/customer/case17x.html).283 Cf. Guglielmo, 1998.

223
more284), which would correspond to 35% of the roughly $170 million total annualrevenue. If Apollo reaches the $60 million mark in 1999 it looks set to becomenumber one in Europe in 1999 across all travel and tourism subsectors. Since thevery beginning Apollo has given discounts for Internet bookings.
2) Ving (Sweden and Norway) gets a mention because of actual Internet sales in ab-
solute and relative terms, and 3) TUI (Germany) not so much because of actual Internet sales, but because of the
great number of visitors to its site, who must be assumed to be inspired by the TUIoffers on the Internet, even though they may decide to make the booking off-line ina travel agency.
Among European airlines there are not really any success stories to tell in 1998, but twoget special mentions after all:
• Lufthansa and Braathens: LH because - although achieving far lower Internet salesin 1998 than expected - it has published the highest Internet sales figure in abso-lute terms in 1998 of any European airline. Furthermore, 1999 sales are set to in-crease to four times the 1998 level. Braathens did best in 1998 in relative terms,and is set to gain up to 1.5% of its revenue from routes to/from/in Norway via theInternet in 1999.
In the ferry line sector Scandlines generated almost $6 million worth of Internet bookedcar crossings in 1998 and is set to increase to over $7 million in 1999, although one majorroute was substituted by a bridge in the middle of 1998. Stena Line will certainly movebeyond the $1 million mark in terms of Internet sales in 1999.
Within the railways two operators also deserve a mention: Danish Rail (DSB) and GermanRail (Deutsche Bahn, DB):
• DSB’s Internet revenue of $3 million in 1998 was the highest of any Europeantrain operator, and this is set to double in 1999. DSB’s 1998 Internet sales wereabout a quarter of the level of Amtrak of the US in absolute terms and not far fromthe North American train operators in relative terms.
• The DB site has more visitors (and page views) than any other European traveland tourism website. Its international timetables are the undisputed best in Europe,a fact which is acknowledged by the other national train operators, who link to DB
284 Thus Apollo itself talks about breaking the $125 million limit (www.apollo.se, 22 June 1999), but this
cannot be achieved without winning a lot of market share.

224
for international schedules. Internet bookings on the DB site are bound to becomesignificant in absolute terms, which in the DB instance means a two-digit milliondollar revenue figure, probably for the year 2000 and onwards.
The tour operator Apollo and its very high percentage of Internet sales has already beenmentioned. Three other firms achieved a remarkably high percentage of their total salesvia the Internet during the first half of 1999. They are all from the same sector, namelyholiday cottages:
• dansommer, Denmark 10% Holiday cottages (summer)• Sol & Strand, Denmark 10% Holiday cottages (summer)
(Danish-owned, but main sales office actually located in Flensburg, Germany)• Matka Ruka, Finland 9% Holiday cottages (winter)
In the remaining sectors each of the top players were below the $1 million mark in termsof Internet sales in 1998, but within long-distance coaches National Express will certainlymove beyond this threshold in 1999.
Svenska Buss in Sweden is set to get 3% of its sales from the Internet in 1999, up from1.5% in 1998. In absolute numbers this translates into rather small $-sales. However, foran operator of multiple scheduled coach lines, the percentages achieved by Svenska Bussare high, also compared to what has been achieved by operators of other forms of sched-uled services by trains, planes or ferries in Europe and elsewhere in the world.

225
9. Bibliography
Airtours, 1999, Airtours Annual Report & Accounts 1998.Andersen, Jesper Troelstrup, 1999, Traininfo to the mobile phones of commuters (in Da-
nish), www.computerworld.dk, 12 July, also in printed version of Computerworld, 16July, p. 5 (cf. www.bane.dk/toginfo/toginfo.htm).
Archdale, Gilbert, 1993, Computer reservation systems and public tourist offices, TourismManagement, vol. 14, No.1, pp. 3-14.
Archdale, Gilbert, 1994, Destination databases: issues and priorities, in A.V. Seaton etal.Tourism: The State of the art, pp. 246-25.
Arriva, 1999, The European Bus Market, www.arriva.co.uk/passenger/index.htp.ASTA, 1999, Delta Internet scheme designed to lure consumers into ultimately paying
more for airfares, press release, 11 January, www.astanet.com/.Attach, 1999, Travel Made Easy, 14 June, www.attachusa.com/life/travel.htm.Birnbacher, Gert, 1998, Internet in praxis - experiences from one of Denmark’s largest
firms (in Danish: Internet i praksis - erfaring fra en af Danmarks største virksomheder)in Rask, Morten, 1998, Det kommercielle Internet, Summary from seminar held on 8January 1998 by IKOM at Kommunedata, Aalborg, Denmark,www.i4.auc.dk/rask/summary/ikom8198.htm.
Bloch, Michael and Arie Segev, 1996, The Impact of Electronic Commerce on the TravelIndustry: An Analysis Methodology and Case study, The Fisher Center for InformationTechnology and Management, Walter Haas School of Business, University of Califor-nia, www.stern.nyu.edu/~mbloch/docs/travel/travel.htm
BR (The Swedish Bus and Coach Federation), Statistics about the Swedish Bus Industry1998 (in Swedish, 21 pp.), www.bussbranschen.se/statistik.htm, pdf-format.
Buhalis, Dimitrios, 1993, RICIRMS as a strategic tool for small and medium tourismenterprises, Tourism Management, October, pp. 366-378.
Canniffe, Mary, 1997, FEXCO buys 74% of tourist system, The Irish Times, 9 July,www.fexco.com/ (hereunder, media, press release archive).
Castleberry, Jay A., C. Hempell and G. Kaufman, 1998, The battle for electronic shelfspace on the global distribution network, www.hotel-on-line.com.
Clampet, Elizabeth, 1999, Delta Revokes Offline Ticket Surcharge, 27 January, Internet-News.com, www.internetnews.com/ec-news/article/0,1087,4_33701,00.html.
CommerceNet / Nielsen Media Research, 1999, Spring 1999 Internet demographic Survey(North America), press release about the most recent study, 17 June,www.commerce.net/news/press/ann061699.html andwww.nielsenmedia.com/newsreleases/releases/1999/commercenet.html.
Connolly, Daniel J., Michael D. Olsen, and Richard G. Moore, 1998, The Internet as adistribution channel, Cornell Hotel and Restaurant Administration Quarterly, August,pp. 42-54.

226
Cornell, 1999, Cornell University European Hotel Industry Strategy Conference, May,London, www.imn.to/conference/cornell_europe/day1and2.html.
Cox, Beth, 1999, Delta Expanding Electronic Ticketing to Europe, 29 January, Internet-News.com, www.internetnews.com/ec news/article/0,1087,archive_4_33731,00.html
Crowsnest, 1998, Crowsnest British Railway Guide,www.crowsnest.co.uk/north/train.htm.
CyberAtlas, 1998, Security Stunts Online Travel Growth, 4 November,http://cyberatlas.internet.com/market/travel/slow_growth.html.
CyberAtlas, 1999, Internet hotel bookings taking off - US lodging companies missing out,13 January, http://cyberatlas.internet.com/market/travel/hotel.html
Datamonitor, 1999a, Online population set to top 250 million in the next five years, pressrelease, 1 March, www.datamonitor.com/.
Datamonitor, 1999b, Online sales of travel products in Europe set to reach $1.7 billion in2002, press release 24 May, www.datamonitor.com/.
Ebner, Arno, 1994, Tirol Informations System (TIS) - Die Konsequenz einer Idee, in W.Schertler (ed.), Tourismus als Informationsgeschäft - Strategische Bedeutung neuerInformations- und Kommunikationstechnologien im Tourismus, Ueberreuter, pp. 307-346.
EC DG 23, 1998, Facts and Figures on the Europeans on Holidays, 1997-1998, ExecutiveSummary, March 1998, A Eurobarometer survey carried out on behalf of the EuropeanCommission Directorate General XXIII, cf. www.inra.com/.
Economist, The, 1999, Why Internet shares will fall to earth, The Economist, 30 January,pp. 15, 16, 21-23.
Elmer, Stefan, 1999, Every third European Internet buyer is German (in Danish), Com-puterworld Denmark, 5 February 1999, p. 21.
Elliott, Christopher, 1999, Battling for bookings, January, www.abcnews.go.com/sections/travel/crabby/webtrav.html.
Ellsworth, Jill H. and Matthew V. Ellsworth, 1997, Marketing on the Internet, New York:John Wiley.
EMAP online, 1998a, Electronic Commerce, www.internet-sales.com/hot/commerce.shtml, in The Internet Marketing Hotlist, c/o www.emapon-line.com/hot.
EMAP online, 1998b, UK Market Overview, www.internet-sales.com/hot/ukover.shtml.EMAP online, 1998c, UK and World Market Size Predictions, www.internet-
sales.com/hot/size.shtml.Enterprise City, 1999, Flights, Holidays, Trains and Buses, links to 18 UK stores,
www.enterprisecity.co.uk/stores/travel/flightsb.shtml.Equant Research & Development, 1998a, The Benefits of Internet & Intranet Business,
White Paper, www.equant.com.Equant Research & Development, 1998b, A Trip to the Beach, Equant Style, White Paper,
www.equant.com.

227
Essick, Kristi, 1998a, Web surfers versus TV watchers: Who’s lazier?, 14 August,www.cnn.com, from The Industry Standard - an idg.net site.
Essick, Kristi, 1998b, Europe Set for E-commerce Explosion, The Industry Standard, 2November, http://thestandard.com/.
Essick, Kristi, 1999, More Europeans move online, www.computerworld.com, OnlineNews, 02/01/99.
Felkl, Beate, 1998, ÖBB, David Manna FS, Oliver Milzarek DB, Renato de Pieri FS,Jonas Strömberg SJ and Paul van de Werken NS, Interlinking Internet, SIAFI reportpresented at UIC’s Internet Club meeting, October 98, www.uic.asso.fr/uk/about/.
Fink, Karen, 1998, Internet Marketing in Danish Tourism Companies - A Case Study ofDFDS’ Internet Customers, Masters Thesis, Sheffield Hallam University, 4 December.
Forrester Research, 1998a, Consumers To Generate $29.5 Billion Booking Online LeisureTrips By 2003, www.forrester.com, press release, 30 September.
Forrester Research, 1998b, Report: Online leisure travel booking is booming - Consumersto generate $29.5 billion booking online leisure prips by 2003, Hotel Online SpecialReport, www.hotel-on-line.com.
Frangialli, Francesco, 1998, (Secretary General, World Tourism Organization), A new erain Information Technology for tourism, OECD Conference, A new era in InformationTechnology: Its implications for tourism policies, Seoul, 10-11 November,http://203.243.102.5/conf/oecd/panel/p12.htm, under http://203.243.102.5/conf/oecd/.
Frew, Andy (ed.), 1999, HITA 99 Conference Proceedings, Hospitality Information Tech-nology Association Worldwide Conference, Edinburgh.
Frew, Andy and Peter O’Connor, 1999a, Destination marketing system strategies in Scot-land and Ireland: An approach to assessment, Information Technology & Tourism,Vol. 2, pp. 3-13.
Frew, Andy and Peter O’Connor, 1999b, Destination marketing system strategies: Refin-ing and extending an assessment framework, in D. Buhalis and W. Schertler (eds.),Information and Communication Technologies in Tourism 1999, Berlin: SpringerVerlag, pp. 398-407.
fvw, 1999, Europäische Veranstalter in Zahlen, Dokumentation 1997/98, 28 May, (fvw13/99), and the same from 1996/97 (fvw 13/98).
Gallacher, Jackie (ed.), 1998, The airline top 100 (of 1997), Airline Business, September1998, pp. 29-38.
Garcia-Sierra, Adrian (BT Postgraduate Researcher, EC Innovation Centre), 1997, Elec-tronic Commerce and the Internet, http://info.cardiff.ac.uk/uwcc/masts/ecic/netcom.html
Gilbert, David C. etal., 1998, A Study of the hotel industry’s application of the Internet asa relationship marketing tool, www.hotel-on-line.com/, July.
Greenberg, Peter S., 1998, Globe-trotting in cyberspace, 12 October,www.msnbc.com/news/199824.asp.

228
Greenspun, Philip, 1997, Building Relational Database-Backed Web Sites, for the WebTools Review, http://photo.net/wtr/rdbms-backed.html.
Guglielmo, Connie, 1998, Travel business packs ‘em in on-line, Interactive Week, 18February, www4.zdnet.com/intweek/printhigh/21698/ds216b.html.
Gummesson, Evert, 1998, Relationship Marketing: From 4Ps to 30 Rs, Stockholm Uni-versity (350 pp.), cf. www.fek.su.se/grund/d/RM98.htm (or Swedish version from1995, 340 pp., described in Swedish at www.dinbokhandel.com/relmf.htm).
Harking, Joe, 1998, The Emperor’s New Clothes, 2 December,www.travelthe.net/columns/auction.htm.
Hoffman, D.L., W.D. Kalsbeek and T.P. Novak, 1996, Internet and Web Use in the UnitedStates: Baselines for Commercial Development, Special Section on Internet in theHome, Communications of the ACM, 39 (December), pp. 36-46,http://ecommerce.vanderbilt.edu/baseline/internet.demos.july9.1996.html.
Holloway, J C & C Robinson, 1995, Marketing for tourism.Holm, Per Annar, 1998, Loyalty program for charter holidays (in Norwegian),
www.aftenposten.no, 23 April.IATA, 1998, World Air Transport Statistics.IBM, 1997, IBM Customer Case Study: TISS, Travel Information Software Systems Con-
solidating on the Web, http://www.europe.ibm.com/nc/customer/case17x.html.IDC, 1998, Buyers on the Web to increase nearly tenfold by 2002, according to IDC’s
Internet Commerce Market Model, press release, 17 August, www.idcresearch.com/.IDC, 1999a, European Internet Statistics: How many people are online in Europe?
www.eurointernet.idc.dk/euinet/stats.htm, i.e. no. of web users by country, January.IDC, 1999b, Internet Commerce to follow in 2 years predicts IDC report, www.idc.com.IDC, 1999c, E-commerce set to explode, 5 March, www.yourbusinesson-
line.com/press/press.html.IDC, 1999d, Internet Commerce Will Rocket to More Than $1 Trillion by 2003, According
to IDC - Web Usage and Internet Commerce Are Becoming Less U.S.-Centric, 28June, www.idc.com.
IntelliQuest, 1999, IntelliQuest Internet Study Shows 100 Million Adults Online in 2000(79 million users in the USA early 1999) www.intelliquest.com/press/release72.asp.
Jegminat, Georg, 1999, ITB-Elektronik-Kongress zu Electronic Commerce - Das Innova-tionstempo stellt hohe Anforderungen, fvw 6/99, p. 26.
Jones, Del, 1998, Airlines ponder discounted Web fares, 2 November, USA Today,www.usatoday.com/life/travel/business/t1102web.htm.
Jung, Hyung-Soo, 1998, The Use of Internet as a Marketing Tool by National TourismOrganisations, masters thesis, School of Management Studies for the Service Sector,University of Surry.
Jupiter Communications, 1998a, European Online Markets,www.jup.com/store/studies/europe.

229
Jupiter Communications, 1998b, Germany to lead Europe in online sales, 28 July,http://sellitontheweb.com/ezine/news0108.shtml.
Jupiter Communications, 1998c, Online Travel: Five Year Outlook, Multiclient reportabout the US, March, summary at: www.jup.com/research/reports/travel.
Jupiter Communications, 1998d, Jupiter predicts on-line travel industry will open oppor-tunities “beyond air”, www.freesun.be/.
Jupiter Communications, 1999, 1999 Online Travel Report - Revenue Forecast, Distribu-tion Strategies, and Competitive Landscape, July, preview at,www.jup.com/store/studies/travel/index.html (and notice at www.nua.ie/surveys/, 17May: Online Travel Worth USD16.6 Billion by 2003).
Kontzer, Tony, 1998, Europe’s E-tailing future, review of IMRG report, E Business Ma-gazine, August, http://www.hp.com/Ebusiness/imrg.html.
Ka Kei Ng, Samuel, 1998, New Zealand tourism and the Internet: adoption, attitudes andkeys to effective use, Master’s Thesis, Victoria University of Wellington (195 pp.).
Kärcher, Karsten, 1997a, Reinventing the package holiday business, Deutscher Univer-sitäts Verlag.
Kärcher, Karsten, 1997b, Sonne, Sand und Spass? Bitte hier anklicken! - Ferien- undReiseanbieter - noch in der Pionierphase, Neue Zürcher Zeitung, 17 June,www.nzz.ch/on-line/02_dossiers/marktplatz_internet/mp_tourismus.htm.
Keegan, W.J., 1989, Global Marketing Management.Kotler, Philip, Marketing Management.Kotler, Philip, John Bowen and James Makens, 1999, Marketing for Hospitality and Tou-
rism, Englewood Cliffs, NJ: Prentice Hall.Krantz, Marshall, 1998, Airlines Upgrade Web Products, August, www.btnon-line.com.Krzepisz, Susan P., 1998, Travel and the Internet - A match made in heaven (mostly),
Nova Southeastern University, www.scis.nova.edu/~susankr/mmis654/ecassign3.html.Kristiansen, Thomas, 1998, Interactive Marketing - How New Interactive media can in-
crease marketing effectiveness and efficiency. An Application to European NationalTourist Organisations, Master’s Thesis, European School of Management, Berlin, 1April (79 pp.).
Ligerman, Hugo, 1998, How can technology help distribution and the service process?, 24March, www.firstconf.com/c48/hugo.html.
Lindsten, Per Olof and Weje, Sandén, 1999, Electronic commerce - The future way ofdoing business is already established on the Net (in Swedish), Veckans Affärer, 22February 1999, www.va.se.
Linjebuss AB, 1999, Ideas for the future, in pdf-format atwww.linjebuss.com/lbweb/home.nsf.
Machlis, Sharon, 1999, British Airways plans more online sales, Online News, 8 March,www.computerworld.com/.

230
Marcussen, Carl H. and Peter Morthorst, 1996, Public Tourist Information Offices asBooking-Centres for Accommodation, in Klein, Stefan etal. (eds), Information andCommunication Technologies in Tourism 1996, Berlin: Springer Verlag, pp 168-179.
Marcussen, Carl H., 1996a, Turistinformations- og bookingsystemer - en casesamling (inDanish), Nexø: Research Centre of Bornholm.
Marcussen, Carl H., 1996b, Hotel representation companies and the Internet, HITA 96conference proceedings pp. 1-28.
Marcussen, Carl H., 1997a, Electronic distribution of holiday and business hotels, in Tjoa(ed.), Information and Communication Technologies in Tourism 1997, Berlin:Springer Verlag, pp. 190-198.
Marcussen, Carl H., 1997b, Marketing European Tourism Products via Internet/WWW,Journal of Travel & Tourism Marketing, Vol. 6, No. 3/4, pp. 23-34.
Marcussen, Carl H. and Dorte Skjoldager, 1998, Extranets of National Tourist Organisa-tions, in D. Buhalis etal. (eds), Information and Communication Technologies inTourism 1998, Berlin: Springer Verlag, pp. 103-119.
Marcussen, Carl H., 1998, Distribution of Danish tourism products in Europe - status,trends and challenges (in Danish, 344 pp.), Nexø: Research Centre of Bornholm(www.rcb.dk). English Summary published in International Journal of ElectronicMarkets (www.electronicmarkets.org), special issue on Electronic Commerce inEurope, Vol. 8, No. 2 1998, pp. 27-29.
Marcussen, Carl H., 1999, Distribution of Danish holiday cottages via the Internet/WWW,in D. Buhalis and W. Schertler (eds), Information and Communication Technologies inTourism 1999, Berlin: Springer Verlag, pp. 259-269.
Mardelli, Michael, 1999, [email protected] (in German), Com!Online, 2/99, pp. 70-83.
McCarthy, J.E., 1960, Basic Marketing: A management Approach, Irwin, Homewook, IL.McNulty, Mary Ann and Cheryl Rosen, 1998, New Vision: The Web as CRS, Business
Travel News, 17 August, www.btnon-line.com.McNulty, Mary Ann, 1999, Corp. Web Spend To double, Business Travel News, 8 March,
www.btnon-line.com.Murphy, Gary Lawrence, 1998, New York Post: Forrester revises Online Travel Projec-
tions, 6 October, www.egroups.com/list/icg-L/14-html.Mutch, Alistair, 1995, IT and small tourism enterprises: a case study of cottage-letting
acencies, Tourism Management, Vol. 16, No. 7, pp. 533-539.Nielsen Media Research, 1998, Number of Internet users and shoppers surges in United
States and Canada - New Study Shows Users at 79 Million; Purchasers Double in NineMonths, press release, 24 August,www.nielsenmedia.com/newsreleases/releases/1998/commnet2.html, cf. also Commer-ceNet/Nielsen, 1999, for a press release about a later study,www.nielsenmedia.com/newsreleases/releases/1999/commercenet.html.
Nee, Eric, 1998, Welcome to my store, 19 October,

231
www.forbes.com/forbes/98/1019/6209140a.htm, click see table leading to What’s atstake (in the US) for home mortgages, cars and travel,www.forbes.com/forbes/98/1019/6209140tab1.htm.
Novell, 1999, Worldwide survey reveals that Europe is at the forefront of the E-Commercerevolution, Lufthansa heads list with on-line flight sales and reservation service, pressrelease, Nice, 19 May, www.novell.com/corp/intl/uk/company/www100report.html.
NUA, March 1999, How many online?, www.nua.ie, quoting sources from about October1998.
OECD, 1995, Tourism Policy and International Tourism in OECD Countries 1992-1993,Special Feature: Tourism and Employment.
O’Connor, Peter, 1999, Electronic Information Distribution in Tourism and Hospitality,CABI.
O’Connor, Peter and Patrick Horan, 1999, Failing to make the connection? - An analysisof Web reservations facilities in the top 50 international hotel chains, in Frew (ed.)1999, pp. 129-139.
O’Connor, Peter and John Rafferty, 1997, Gulliver - Distributing Irish tourism electroni-cally, the International Journal of Electronic Markets (www.electronicmarkets.org),Vol. 7, No. 2, 1997, pp. 40-45.
Ottesen, Otto, 1981, Innføring i markedskommunikasjon, Copenhagen: Erhvervsøkono-misk Forlag.
Palmer, Adrian, 1994, Principles of services marketing, McGraw-Hill.Palmeri, Christopher, 1998, This might not fly, Forbes, 20 April,
http://www.forbes.com/forbes/98/0420/6108200a.htm.PhocusWright, 1998, Survey reveals 18% of wired travellers book online, press release, 4
November, www.phocuswright.com/WTN0498.HTM.PhocusWright, 1999, European airlines slow to jump on the Internet eCommerce bandwa-
gon, press release, Brussels, Belgium, 7 May,www.phocuswright.com/EA050799.HTM.
PhocusWright, 1999b, The PhoCusWright Yearbook 1999: Analysis, Assumptions AndAssessments For The Online Travel Marketplace, preview,www.phocuswright.com/yearbook.htm.
Pinchler, Stefan, 1998, Direktvertrieb über den Lufthansa InfoFlyway, Lufthansa pressconference at the ITB, 8 March.
Porter Michael J., 1980, Competitive Stragegy, New York: Free Press.Porter Michael J., 1985, Competitive Advantage, New York: Free Press.Prescott, John (UK Department of the Environment, Transport and the Regions), 1998, A
New Deal for Transport: Better for Everyone, www.detr.gov.uk/itwp/paper/index.htm.Pröll, Birgit, Werner Retschitzegger, Roland Wagner, and Arno Ebner, 1998, Beyond
traditional tourism information systems: The webbased approach TIScover, Informati-on Technology and Tourism, Vol. 1, Inaugural Volume, pp. 15-31.

232
Pröll, Birgit, Werner Retschitzegger and Roland Wagner, 1999, Holiday packages on theWeb, in D. Buhalis and W. Schertler (eds), Information and Communication Tech-nologies in Tourism 1999, Berlin: Springer Verlag, pp. 108-118.
Rachman, Zulfikar M., 1999, Effective Tourism Web Sites: A Web-based Survey andTourism Web Sites Review, masters thesis, Te University of Waikato, School of Man-agement Studies, http://meltingpot.fortunecity.com/stark/134/tourism/indeks.html
Rasmussen, Jens Erik, 1999, Spies leads the charter war (in Danish), Jyllands-Posten, 17April.
Richer, Paul, 1996, Should travel companies be selling online?, Journal of Vacation Mar-keting, Vol. 2, No. 3, pp. 277-285.
Robinson, Teri, 1998, Do-It-Yourself Travel - Travel agencies face Internet threat,Emmerce, 9 January, www.computerworld.com.
Rosen, Cheryl, 1999, Online Sales Heat Market (re. US ’98), BTN Online, www.btnon-line.com/db_area/archives/1999/02/99022203.htm.
Sanchez-Klein, Jana, 1998, Gartner: Euro will help drive E-commerce. www.idg.net (On-line News), 16 July.
Sheldon, Pauline, 1993, Destination Information Systems, Annals of Tourism Research,Vol. 20, No. 4, pp. 633-649.
Sheldon, Pauline, 1997, Tourism Information Technology, Wallingford, UK: CABI.SJ, 1999, The SJ Group Annual Report 1998.Stoltz, Craig, 1998a, Nothing But Net: The Rundown on Travel-Booking Sites on the Web,
Washington Post Staff Writer, 13 September, http://www.washingtonpost.com/wp-srv/travel/on-line/capsulereviews.htm.
Stoltz, Craig, 1998b, The E-Travel Revolution is Over, Washington Post Staff Writer, 15November, p. E01, http://www.washingtonpost.com/wp-srv/travel/front.htm andhttp://www.washingtonpost.com/wp-srv/travel/on-line/phocus111598.htm.
Sussman, Silvia and Michael Baker, 1996, Responding to the electronic marketplace:Lessons from Destination Management Systems, International Journal of HospitalityManagement, Vol. 15, No. 2, pp. 99-112.
Thomson Travel Group plc, 1999, Report & Accounts 1998.Thompson, Maryann Jones, 1998, Airlines Dominate Online Travel, The Industry Stan-
dard - The Newsmagazine of the Internet Economy, http://thestandard.com, 12 Octo-ber.
Thompson, Maryann Jones, 1999, Spotlight: Why E-commerce Forecasters Don’t Get It“Right”, The Industry Standard - The Newsmagazine of the Internet Economy, 1March, www.industrystandard.net/metrics/display/0,1283,850,00.html.
Tomlin, Paul (Eurostar UK), 1998, GDS technology for rail,www.firstconf.com/c48/paul.html, March.
Travel Asia, 1998, Way of the future?, 27 March, www.travel-asia.com/03_27_98/stories/way.htm.

233
Travelocity, 1999, Travelocity.com Continues As Online Travel Industry Leader - Achie-ves $128 Million in First Quarter 1999, press release, 3 June,www3.travelocity.com/pressroom/pressrelease/0,1090,50,00.html.
TUI, Geschäftsbericht, Annual Report, 1996/7.UIC, 1998, Second Worldwide UIC Internet Club meeting on 22-23 October, CD-ROM,
and www.uic.asso.fr/uk/about/seminar_internet/som_club_internet.htm.UIC, 1998, Rail traffic statistics of the UIC European railways 1998, www.uic.asso.fr/.UIC, 1996, Member railway statistics - Synopsis 1996.Vallejo, Maria P., 1998, Hotels greet Web boom, BTN Online, www.btnon-
line.com/db_area/archives/1998/11/98111638.htm.Volgenau, Gerry, 1999, Travel Writer, The going things: More E-tickets, less luggage, 3
January, Free Press, www.freep.com/news/airtravel/qtrend3.htm.Waesche, Nico, 1998, How are Internet Forecasts Made?,
http://heise.xlink.de/tp/english/inhalt/te/1661/1.html.Werthner, Hannes, 1993, TIS - Tiroler Tourismus Information System, Wirtschaftsinfor-
matik, Vol. 35, No. 1, pp. 43-50.Werthner, Hannes and Stefan Klein, 1999, Information technology and tourism - A chal-
langing relationship, Berlin: Springer Verlag.Witt, Stephen F. and Luiz Moutinho (eds), 1994, Tourism marketing and management
handbook, Englewood Cliffs, NJ: Prentice-Hall.World Tourism Organization (WTO), 1999, Compendium of Tourism Statistics 1993-
1997.Annual accounts of a number of airlines - as well as national train operating compa-nies - in pdf-format from the Web: Lufthansa, British Airways, SAS, KLM, Swissair,Finnair, Braathens, Delta Airlines, United Airlines, Northwest Airlines.Various articles and news items from:www.computerworld.com, www.computerworld.no, www.computerworld.dk andwww.webworld.dk, http://domino.idg.se, all of the International Data Group, Inc.(IDG).
Links to all the websites mentioned in this publication can be found on the followingwebpage: http://www.rcb.dk/UK/staff/chm/book1999.htm.

234

235
10. Appendices
Appendix 1.1 General structure of the individual case studiesGeneral outline for the case studies - and agenda for meetings - or headlines in e-mailedquestionnaire:
Background information about the organisation or person behind the website- No. of employees- Year started- Main activities- Geographic breakdown of sales- The internal booking system
About the website:- First established- Current features- Statistics: hits, visits, bookings- Perceived benefits and costs of the website
Future plans and ideas for further development of the website:- Already planed extensions in the near future- Other ideas- General discussion about the future development of the Internet as a platform for distribution of European tourism services.
A more detailed questionnaire was developed to go along with the above.

236
Appendix 1.2 List of people and organisations interviewedSpecial thanks go to the following organisations and individuals, most of whom kindlygave a personal interview. In a few instance it was only possible to undertake a telephoneinterview or the respondent (key informant) preferred to reply in writing, but thank youvery much anyway:
• Equant, UK Mr Ian Ryder, Manager, Consultancy.• Deutsche Lufthansa AG Ms Nicole Paschold, Online Sales & Multimedia.• British Airways, UK Ms Patricia Crossley-Smith, Senior Distribution Manager.• Iberia, Spain Ms Nenuca Cenejo, VP Commercial Logistics.• Finnair, Finland Mr Timir Bhose, Product Manager, New Distribution
Systems.• Braathens, Norway Ms Kari Aanonsen, Senior Consultant, Commercial
Systems.• German Rail Ms Daniela Wenzel-Perlick, manager of marketing/sales
communication and Ms Claudia Wachowitz, Corporate communications, passenger transport.
• Swiss Federal Railways Mr Martin Krauchthaler, IT dept. and Mr Roger Krähenbühl, passenger traffic division (as
arranged by Mr Jörg Dreier, Internet manager).• Swedish Rail Mr Lars Thorwall, former Internet section manager, SJ
Data (now with a major telecom company), and Ulf Olsson, current Web master.
• Danish Rail Mr Gert Birnbacher, Internet section manager• HaCon GmbH, Germany Mr Werner Kretschmer, MD and part-owner• Europcar, Germany Ms Verena von Gehlen, press officer, and
Mr Kai Nikolaizig, responsible for Internet.• Stena Line, Sweden Mr Hans Björgborg, Information & Technology Director.• Irish Ferries Mr Declan Moynihan, Manager - Marketing Systems.• Scandlines, Denmark Ms Kit Lyngaa, Product Development Manager.• National Express, UK Mr Chris Brown, Director of IT & telesales and Mr David
Jones, Head of Distribution Systems.• Svenska Buss, Sweden Mr Allan Staalhand, Ramkvillabuss, Internet responsible• Bookings NL, Netherlands Mr Geert-Jan Bruinsma, Manager and owner.• HRS, Germany Mr H.J. Hessbrüggen, Head of Marketing.• IYHF, London, UK Mr Rawdon S C Lau, Secretary General, IYHF• Hostelling International
Norway Mr Roy Jacobsen, Administration Manager.

237
• Matka-Ruka, Finland Mr Hannu Larmila, JSOP Interactive, Kuopio, Mr Rauno Hannola, Manager, Pehmo Oy, Kuusamo, Mr Voitto Pitkänen, Accommodation and activities, Matka-Ruka, Kuusamo.
• dansommer, Denmark Mr Niels Svendsen, Sales Manager.• Sol & Strand, Denmark Mr Orla Mortensen, Internet Developer.• eCamp, SASS GmbH Mr Rolf Sass, MD and owner.• TUI, Germany Mr Alex Ketzler, New Media, Internet Service Center.• Kuoni, Switzerland Mr Andreas Waldis, Marketing Manager.• Ving, Sweden Ms Anette Gustafsson, project leader, with overall
responsibility for the Internet activities of Ving in Sweden, Norway, Denmark and Poland.
• Apollo, Sweden Mr Patrik Hagman, IT co-ordinator.• TISS GmbH, Germany Mr Rudi Weissmann, Manager and owner.• TIScover, Austria Mr Arno Ebner, MD, Tourism Info. Systems GmbH

238
Appendix 1.3. Exchange rates
Price per 100 units, in terms of USD, ECU, DEM, GBP and DKK - average for 1997.Country / Currency USD ECU DEM GBP DKK
Region Year: 1997 1997 1997 1997 1997
USA USD 100.00 88.56 173.47 61.06 660.86
EU ECU 112.92 100.00 195.89 68.95 746.26
Germany DEM 57.65 51.05 100.00 35.20 380.96
UK GBP 163.77 145.03 284.10 100.00 1082.32
Denmark DKK 15.13 13.40 26.25 9.24 100.00
Price per 100 units, in terms of USD, ECU, DEM, GBP and DKK - average for 1998.Country / Currency USD ECU DEM GBP DKK
Region Date: 1998 1998 1998 1998 1998
USA USD 100.00 89.13 175.85 60.37 669.70
EU ECU 112.20 100.00 197.29 67.73 751.37
Germany DEM 56.87 50.69 100.00 34.33 380.84
UK GBP 165.65 147.64 291.29 100.00 1109.36
Denmark DKK 14.93 13.31 26.26 9.01 100.00
Austria ATS 8.08 7.20 14.21 4.88 54.13
Belgium BEF 2.76 2.46 4.85 1.66 18.46
Finland FIM 18.72 16.68 32.92 11.30 125.36
France FRF 16.96 15.12 29.83 10.24 113.60
Greece GRD 0.34 0.30 0.60 0.20 2.27
Iceland ISK 1.41 1.25 2.47 0.85 9.41
Ireland IEP 142.42 126.94 250.45 85.98 953.82
Italy ITL 0.06 0.05 0.10 0.03 0.39
Netherlands NLG 50.45 44.97 88.71 30.46 337.86
Norway NOK 13.24 11.81 23.29 8.00 88.70
Portugal PTE 0.56 0.49 0.98 0.34 3.72
Spain ESP 0.67 0.60 1.18 0.40 4.49
Sweden SEK 12.58 11.21 22.12 7.59 84.23
Switzerland CHF 69.04 61.54 121.41 41.68 462.37
Japan JPY 0.77 0.68 1.35 0.46 5.13

239
Price per 100 units, in terms of USD, ECU, DEM, GBP and DKK - spring 1999.Country / Currency USD ECU DEM GBP DKK
Region Date: 99.06.30 99.06.30 99.06.30 99.06.30 99.06.30
USA USD 100.00 96.91 189.54 63.51 720.41
EU ECU 103.19 100.00 195.58 65.54 743.39
Germany DEM 52.76 51.13 100.00 33.51 380.09
UK GBP 157.45 152.58 298.42 100.00 1134.25
Denmark DKK 13.88 13.45 26.31 8.82 100.00
Source: Danish National Bank, www.nationalbanken.dk (the rates in DKK only).Note: Exchange rates in USD, ECU, DEM and GBP have been calculated based on the DKK rates.
Throughout this publication the 1998 exchange rates have been used unless it is explicitlystated in the accompanying text that the mid-1999 rate has been used (which has beendone only in one or two instances).

240
Appendix 2.1 Considerations behind Figure 2.6 - the assumedmix of Internet travel sales in Western Europe in 1998
Some differences between US and Western Europe may be assumed with respect to therelative importance of the different travel and tourism service categories. Furthermore itmay be assumed that these underlying market differences manifest themselves in the travelsales mix via the Internet:
• On one hand the air travel market in the US alone is 120% larger than the one inWestern Europe measured by the number of scheduled passengers carried per year (554million passengers for the top 18 US airlines - and another 24 million for the two larg-est Canadian Airlines - vs 252 million passengers for the top 20 Western Europeanairlines, cf. chapter 3), and the total passenger-revenue-km is almost twice as high inthe US as in Western Europe.
• The price (revenue) per segment (passenger) for major US airlines is only $145 vs
about $220 for scheduled flights by major European airlines, however (partly becauseof more km per segment and partly because there is a higher price per passenger-kmfor the European airlines than for their US counterparts). The average length per airtravel segment is about 1660 km for the US versus 2000 km for Western European air-lines. The price per passenger-km is about $0.09 by US scheduled airlines, vs about$0.11 by European airlines. This has been determined from an analysis of the revenuestructure of major airlines based of their annual accounts (breakdown of passenger,freight and other revenue) combined with knowledge about total revenue, passengerand freight volumes of all the scheduled airlines.
• Air travel is thus a relatively more important means of transport in the US than in
Europe (46% of market value in the US vs 34% in Western Europe). The share of airtravel in Internet travel sales in the Western European market is estimated at 48% (vs52% for the US).
• There are about 28% more hotel rooms in Western Europe (4.9 million rooms) than in
the US (3.8 million rooms). This is more than counteracted by a lower occupancy ratein Europe (44%) than in the US (64.5%), because of greater seasonality in Europe, cf.Appendix 6.1. The number of room nights sold in the US is therefore about 900 milli-on (each costing $75 in 1997), vs only 775 million room nights sold in Western Europep.a.
• Furthermore, when looking at distribution of individual hotel room nights via the In-
ternet, the element of the room nights which is being sold through tour operators (as

241
part of pre-packaged offers from tour operators), should be disregarded. This may besome $20 billion, leaving about $40 billion for individual room night revenue. Packagetours (typically air + hotel, etc.) are much more common in Europe than in the US.Therefore, when it comes to Internet sales of individual room nights, the differencebetween the US and Western Europe is considerably greater than indicated by the 900vs 775 million room nights p.a. mentioned above. Total accommodation revenue forEuropean hotels is about $60 billion, $40 billion of which was generated by individualroom nights (and $20 billion as the hotel element of tour packages). This $40 billion isconsiderably less than the corresponding US figure (which is $62 billion). So, the mar-ket in Western Europe for individual hotel room nights is much smaller than in the US,which is one reason why the share of hotels in Internet travel sales is smaller for We-stern Europe than for the US. Another reason is the structure of the European hotel in-dustry, which inhibits electronic distribution, including Internet sales: European hotelsare relatively small, and relatively many of them are not members of either large orsmall chains. The average number of rooms per hotel and similar establishment in We-stern Europe is only 26 (in some 188 000 establishments), whereas the average numberof rooms for US hotel properties is more than three times as high, namely 78 (in 49000 establishments). All other things being equal, it is easier for a large hotel propertythan for a small one to justify investments in electronic distribution.
• Another point is worth making about hotel chains - or lack of these - in Western Euro-pe. The top 50 hotel companies world-wide have a total of 3.91 million rooms, in 29461 properties, i.e. with 133 rooms on average (cf. Appendix 6.2). It seems that about70% of these properties are located in the US, and relatively few (15% or less) inEurope.285 If this rough estimate holds true, this means that 19 000 of 49 000 (=39%)of the hotel properties in the US are members of one of the top 50 hotel chains, where-as the same is true for only 4100 of the 188 000 (~2%) of the hotel properties in We-stern Europe. Additionally, there are of course many hotels both in the US and inEurope, which are members of the hundreds of small local hotel chains. E.g. in Den-mark, although only 4% of the hotel properties are members of one of the top 50 hotelchains (mainly Best Western), as many as 40% are members of some chain, large orsmall. Hotels in chains, and certainly hotels in large chains, are typically bookable re-
285 Of the 11 000 hotel properties belonging to chains ranked second, third, fourth or fifth on the top 50 list,
72% are located in the US, and 15% in Western Europe. The number one hotel company, Cendant Corp. (with Days Inn, Ramada, Super8 and several other brands), which currently has more than 6000 proper-ties world-wide, most of them in the US, established its first hotel in Europe as late as 1998. The geogra-phic distribution of the hotel properties of the remaining 45 hotel companies on the top 50 list (some of which cover several brands) has not been analysed by the writer. The reader can take a look at the top 50 list at www.ahma.com/. In a recent study by O’Connor and Horan, 1999, it was found that out of 38 hotel companies (all with websites) from a similar top 50 list, 61% were US-based, 24% were European, and the remaining from Asia. But this is a hotel company count. When counting hotel properties the percentage for the US is assumed to be higher.

242
al-time through Global Distribution Systems (GDSs), as well as real-time through theInternet. Only between 20% and 25% of the hotels in Denmark are bookable throughGDSs, which indicates that hotels in large chains are more likely than hotels in smallchains or hotels outside of chains to have acquired electronic distribution throughGDSs. Since hotel chains are much less common in Europe than in the US (and Cana-da), technically and especially organisationally it is much more difficult to offer real-time booking of hotel rooms in Europe than in North America, through GDSs and/orthe Internet. Any hotel can put up an e-mail box, of course, but this only enables a sortof off-line booking, where the Internet user e-mails a booking request without knowingif confirmation will ever be received. In 1998, rooms in about 22% of US hotels couldbe reserved over the Internet (press release from Bear Stearns, 12 January 1999).286
This means that a lot more than 22% of the (3.5 million) US hotel rooms (as stated insome secondary versions of the original press release) can be booked via the Internet,since the larger hotels are more likely to be on-line bookable than the smaller ones. Itwould be safe to assume that the percentage of hotels in Western Europe which arebookable via the Internet, is much less than 22%.
• For these reasons, the share of hotel booking of Internet travel sales must be consideredto be less in Europe than in the US, actually 23% (vs 36%) and must be assumed toremain lower in a foreseeable future.
• Packages (typically charter flights with hotel accommodation), account for 16% of theholidays taken by European holiday-makers.287 This is a considerably higher propor-tion than in the US. The share of market value is 28%, but their share of Internet saleson the Western European travel market in 1998 is estimated to be just 18%, sinceEuropeans are assumed to be rather unwilling to place orders for such an expensiveand advice-requiring product as a tour package (actually somewhat more unwillingthan Forrester seems to assume about the Americans).
• Camping accounts for as much as 16% of Western European holidays (of more than
four nights), but a camping holiday is much cheaper than a hotel holiday, so in valuethe share of camping is much smaller than 16%.288 Furthermore the penetration of In-ternet access among camping sites is less than for hotels. Camping is absent in the For-rester estimate and forecast for the US. But booking off-line by e-mail directly withcamp sites in Europe could account for at least 1% of the value of Internet travelbookings in Western Europe in 1998, and another 1% for youth hostels, whose guestsare heavy Internet users, i.e. 2% in total.
286 http://www.businesswire.com/webbox/bw.011299/951000.htm. 287 Facts and Figures on the Europeans on Holidays 1997-1998, Executive Summary, March 1998, EC DG
XXIII. 288 Ibid.

243
• 10% of European holiday-makers use the train as the most important means of trans-port whereas 31% use the plane (15% scheduled flights, 16% charter flights as men-tioned). Passenger transport by train is many times more important in Europe than inthe US, since the number of train passenger-kilometers p.a. is 33 times greater inWestern Europe than in the US.289 Even if we focus on very long trips only (of about400 km each), there were 17 times more of those made in Western Europe than in theUS, for a slightly lower price per km than in the US. This means that in Europe reve-nue for long train trips was about $15 billion vs just $1 billion in the US. Tickets soldover the net will therefore become of some importance in Europe, whereas the traincategory is absent from US estimates and forecasts, although Amtrak did get 1.2% ofits $1 billion passenger revenue via the Internet in 1998 (= $12 million), and so didVia Rail in Canada, cf. chapter 4.7. In Western Europe probably no more than 0.1% ofthe $15 billion revenue for long trips came via the Internet in 1998, i.e. about $15 mil-lion, which is 6% of the assumed total of Internet travel sales in Western Europe in1998. The most important feature of train websites is and will remain the provision oftimetable information, with booking facilities a secondary feature only.
• The total market for car rentals in Western Europe is probably only worth $6 billion vs
$16 billion for the US. One argument for this is that two-thirds of car-rentals are air-port based, and air transport is considerably less used in Europe than in the US. Carrental is estimated to account for 3% of the total Internet travel sales market in West-ern Europe.
• The market size for scheduled long-distance coach travel in the US (perhaps $1.5 bil-
lion) and Western Europe (perhaps slightly smaller, $1.3 billion) is discussed in Ap-pendix 5.1. But Internet sales of this travel service were nil in the US in 1998, and just$1 million in Western Europe, i.e. just 0.4% of total Internet sales in Western Europein 1998.
• Cruises (which account for a couple of percent of US holidays) will remain a largely
absent travel service category in the Western European market when it comes to Inter-net sales. The relatively few cruises which are sold in Europe can be regarded as in-cluded in the European tour package figures.
• On the other hand international car ferry crossings play a certain role in Western
Europe, unlike in North America. And it seems that reservations for these services
289 Thus Amtrak sells only 21 million trips p.a. (414 km each, i.e. rather long trips) vs 5300 million trips
p.a. for the Westen European railway operators (but with an average length of only 54 km), cf. Figure 4.1.

244
were already being undertaken fairly frequently via the Internet by 1998, mainly with acouple of ferry lines in Scandinavia.
Internet sales of selected major travel service categories, USA and Western EuropeUSA Internet Internet Internet Internet InternetForrester Research * Total Total * Direct Agents Agents (* Internet totals only) (%) Million $ Million $ Million $ (%)Type of travel service: 1998 1998 1998 1998 1998Airtravel, scheduled 52.0 1600 600 1000 63.0Hotel accom., ex. tours 36.0 1100 765 335 30.0Tour packages 5.7 175 130 45 26.0Car rentals 5.6 171 126 45 26.0+Rail 0.4 12 12 0 0.0+Scheduled coaches 0.0 0 0 0Cruises 0.0 0 0 0Total, max. 100.0 3058 1633 1425 47.0
Western Europe Internet Internet Internet Internet InternetMarcussen Total Total Direct Agents Agents
(%) Million $ Million $ Million $ (%)Type of travel service: 1998 1998 1998 1998 1998Airtravel, scheduled 46.0 114 57 57 50.0Hotel accom., ex. tours 23.0 57 39 18 32.0Tour packages 17.0 43 38 5 12.0Car rentals 3.0 8 7 1 13.0Rail, long trips 6.0 15 15 0 0.0Scheduled coaches, long 0.0 1 1 0 0.0Camping & youth hostels 2.0 5 5 0 0.0International car ferries 3.0 7 7 0 0.0Total 100.0 250 169 81 32.0
Not included: Transport in own car; private accommodation; entertainment (entry tickets).

245
Market estimates for selected major travel service categories, USA and WesternEuropeUSA Market Market Average Market Market Market MarketMarcussen Total volume price per Total Direct Agents Agents
(% of bn $) Million unit ($) Billion $ Billion $ Billion $ (%)Type of travel service: '97-data '97-data '97-data '97-data '97-data '97-data '97-estim.Airtravel, scheduled 46.0 578 145 84 8 75 90.0Hotel accom., ex. tours 34.0 824 75.2 62 43 19 30.0Tour packages 6.0 19 569 11 1 10 90.0Car rentals 9.0 104 153 16 11 5 30.0+Rail 0.5 21 47 1 1 0 10.0+Scheduled coaches 0.8 47 32 1.5 1 0 10.0Cruises 4.0 5.5 1250 7 0 7 95.0Total, max. 100.0 182 67 115 63.0
Western Europe Market Market Average Market Market Market MarketMarcussen Total volume price per Total Direct Agents Agents
(% of bn $) Million unit ($) Billion $ Billion $ Billion $ (%)Type of travel service: '97-data '97-data '97-data '97-data '97-data '97-data '97-estim.Airtravel, scheduled 33.0 252 220 55 6 50 90.0Hotel accom., ex. tours 24.0 495 80 40 28 12 30.0Tour packages 27.0 80 569 46 9 36 80.0Car rentals 4.0 43 139 6 4 2 30.0Rail, long trips 9.0 360 42 15 13.5 4.5 10.0Scheduled coaches, long 1.0 65 20 1.3 1 0 0.0Camping & youth hostels 2.0 250 15 4 4 0 0.0International car ferries 1.0 20 75 2 2 0 0.0Total 100.0 168 67 101 60.0
Not included: Transport in own car; private accommodation; entertainment (entry tickets).
A simple return ticket by air or rail includes two segments, e.g. the 554 million air seg-ments in Western Europe in 1997 correspond to 277 million simple return trips. The vol-ume and rates mentioned for hotels are room nights. The volume and rates mentioned forcamping/youth hostels in Europe are person nights. The volume and rates mentioned forcar rentals are per rental transaction (based on Avis data for North America and Europe).The average number of car rental days for cars in the US was about four days (HertzCorp.), but probably less in Europe (~3 days).
Since Stena Line carries 1.8 million cars per year, and Scandlines 5-7 million per year onewould guess that car crossings on international ferries could amount to roughly 20 million(market volume), each costing about $75 per segment, i.e. a total market value of about$1.5 billion.

246
The Internet’s share of selected major travel service categories, USA and WesternEurope (1998)USA Percentages of the channel Percentages of the marketMarcussen Total Direct Agents Total Direct Agents
Internet Internet Internet Internet Internet InternetType of travel service: 1998 1998 1998 1998 1998 1998Airtravel, scheduled 1.9 7.2 1.3 1.9 0.7 1.2Hotel accom., ex. tours 1.8 1.8 1.8 1.8 1.2 0.5Tour packages 1.6 12.2 0.5 1.6 1.2 0.4Car rentals 1.1 1.1 0.9 1.1 0.8 0.3+Rail 1.2 1.3 0.0 1.2 1.2 0.0+Scheduled coaches 0.0 0.0 0.0 0.0 0.0 0.0Cruises 0.0 0.0 0.0 0.0 0.0 0.0Total, max. 1.7 2.5 1.2 1.7 0.9 0.8
Western Europe Percentages of the channel Percentages of the marketMarcussen Total Direct Agents Total Direct Agents
Internet Internet Internet Internet Internet InternetType of travel service: 1998 1998 1998 1998 1998 1998Airtravel, scheduled 0.21 1.03 0.11 0.21 0.10 0.10Hotel accom., ex. tours 0.14 0.14 0.15 0.14 0.10 0.05Tour packages 0.09 0.42 0.01 0.09 0.08 0.01Car rentals 0.13 0.17 0.06 0.13 0.12 0.02Rail, long trips 0.10 0.11 0.00 0.10 0.10 0.00Scheduled coaches, long 0.08 0.08 - 0.08 0.08 0.00Camping & youth hostels 0.13 0.13 - 0.13 0.13 0.00International car ferries 0.47 0.47 - 0.47 0.47 0.00Total 0.15 0.25 0.08 0.15 0.10 0.05
See also diagrams below.

247
Means of transport for Western European holiday-makers (1997-8)
Ow n car58%
Plane, charter16%
Plane, scheduled15%
Train10%
Other1%
Note: Some of the transport by charter plane is flight-only, i.e. without hotel accommodation as part of the package.
Type of accommodation used by Western European holiday-makers (1997-8)
Hotels and holiday clubs42%
Staying w ith family16%
Camp site14%
Rented f lat13%
Other15%
Source: EC DG 23, 1998, Facts and Figures on the Europeans on Holidays 1997-1998, Executive Summary, March.Note: Only stays of more than four nights.

248
Appendix 2.2 Internet sales of cruises on the US market
Forrester predicts that sales of cruises via the Internet will go from zero in 1998 to $2.5billion in 2003, i.e. 8% of the total as shown in Figure 2.5. However, the total US cruisemarket was only $7 billion in 1997 (5.5 million participants, at an average price of$1250).290 The cruise market may increase by up to 7% p.a., up to $10.5 billion in 2003.The average price of a cruise is much (~three times) higher than a typical simple returnairticket. A high price deters website visitors from making bookings. Since cruises arehigh-price travel products, and since they had not even left the harbour in terms of Inter-net sales in 1998, it seems very unlikely that sales of cruises via the Internet will reach$2.5 billion in 2003, which would be at least 24% of the US cruise market. Forrester pre-dicts that 12% of the US leisure travel market will go via Internet in 2003, but it wouldseem more prudent to assume that no more than about 6% of cruises on the US marketwill be sold via the Internet in 2003, i.e. $0.6 billion, not $2.5 billion.
Approved travel agencies have been able to make bookings of the Royal Caribbean brandvia an Extranet since the beginning of 1998, and of Celebrity since October 1998. Carni-val has done the same, and additionally opened for on-line real-time Internet bookings forconsumers in March 1999 as the first cruise line in the industry.291 Royal Caribbean Inter-national and Carnival Corporation, whose vessels typically operate in the Americas andmust be assumed mainly to serve Americans, hold more than 50% of the US cruise mar-ket. Clearly it makes a tremendous difference whether tours booked by agents via this andsimilar Extranets are included in the Internet travel sales forecast or not. In principle theyshould not be included, and Forrester has no doubt not intended to include it. Leadingcruise lines such as Royal Caribbean and Carnival have no doubt been interviewed byForrester, but the cruise lines have probably not made a clear distinction between Internetbookings by end-users (consumers) and Extranet bookings by travel agents.
Carnival, which intended to introduce Web bookings to consumers (Internet) and agents(Extranet) by early 1999 expects that consumers will continue to seek the advice of travelagents to validate their (buying) decision. - Dickinson of Carnival expects at least 90% to95% of its business will continue to be generated by travel agents into the year 2002,292
290 Abels, Joel M (1998), Internet, Internet, Internet, www.traveltrade.com, 7 September - Royal Caribbean alone
had 1.3 million participants in 1997 (excluding 200 000 sailing with Celebrity Cruises since takeover by RoyalCaribbean during 1997), which according to the 1997 accounts should give Royal Caribbean a 25.5% marketshare, with another 7% for Celebrity (probably of the US market). There are separate websites for the twobrands: www.royalcaribbean.com and www.celebrity-cruises.com, the former introduced on 1 February 1996.Carnival Corporation is even larger than Royal Caribbean, and carries around 2 million passengers p.a.
291 Carnival press release, 22 March 1999.292 Special report, All-inclusives rage of the 90’s, subsection called Cruise companies going direct but agents
need not fear, in the Canadian Travel Press, www.travelpress.com/ctp/issues/1998-02-16/perspect.html.

249
compared to more than 98% in 1998,293 which underlines the assumption that no morethan 6% of cruises will be booked via the Internet by consumers in the year 2003, sincethere are also other direct booking channels than the Internet, such as the telephone (tocall centres, via 800-numbers).
293 According to Carnival Corp. Annual Accounts, 1998.

250
Appendix 2.3 Travel market sizes - in the US and WesternEurope.
$29.5 billion Internet travel sales will correspond to 12% of the leisure travel market in2003, which means that 100% equals $246 billion for the total leisure travel market. As-suming that the market is projected to increase (at least) 10% over the five years, the totalUS leisure travel market must have been about $223 billion in 1998, at the most. Thefigure of about $173 billion for holidays in the US market has been mentioned by the Na-tional Retail Federation for the year 1998 (thestandard.com/metrics, 22 November 1998).Obviously, if we include Internet leisure travel estimates like that of Forrester in relationto this lower number of $173 billion for holidays in the US in 1998, the Internet’s sharewill be larger. But there may be some leisure travel and related services which are notexactly holidays.
Travel and tourism includes 15 interrelated businesses, such as lodging establishments,airlines, restaurants (partly), cruise lines, car rental firms, travel agents, and tour opera-tors. Travel and tourism is the third largest industry in the US (after auto sales and foodretail sales) in terms of value, and the second largest industry (after health care) in termsof employment (www.ahma.com).
For the whole US travel and tourism industry including business travel, the figure $491billion for 1998 can be inferred (from 1997 data + 2% increase to 1998 and onwards peryear), of which lodging accounted for 18%, or $87 billion. $68 billion of this was roomnight revenue, a typical room night costing between $75 and $80.294 Since Forrester hasestimated Internet revenue for US hotels, etc. in 1998 to be $1.1 billion, this means thatthe Internet should account for 1.6% of room-night-revenue in 1998 - up from about 0.5%in 1997. If the Forrester Internet forecast for hotels of $10 billion in the year 2003 holdstrue, this means that 13.3% of hotel revenue should come via the Internet by then! Part ofthis will go via the on-line travel agents rather than directly to the hotels.
It is assumed that - when looking at the leisure travel market only, and all these differentservice categories that are included in this - the total Western European leisure travelmarket is slightly larger than the US counterpart, cf. Table 2.4. There are actually no hardfacts to support this particular assumption other than the fact that in absolute terms GDP
294 A very recent report compiled by Shifflet & Associates in 1999 (www.ahma.com/infocenter/eco_impact98.htm)
comes up with the figure $508 billion as the total direct economic impact of the US travel and tourism industryin 1998, including items such as food, shopping, entertainment and miscellaneous in addition to accommoda-tion and transportation. Of this total, $75 billion was hotel/motel room revenue.

251
in Western Europe is considerably higher that in the US, cf. first row of numbers, column(1) and (3) in Table 2.1.
But when looking at the travel market from the supply side it appears that the US marketfor selected business and leisure travel service categories is actually slightly larger than themarket for the same categories in Western Europe ($182 billion vs $168 billion, in 1997),cf. Appendix 2.1. Also the GDP-derived figures given in chapter 1.1 indicated that the USmarket value may exceed that for Western Europe. The most meaningful market values touse are the $182 billion for the US and $168 billion for Western Europe, since it has beenshown how these have been arrived at (in Appendix 2.1).

252
Appendix 2.4 Discussion of Internet travel sales in WesternEurope - 1998 and 2002 - cf. Table 2.4
Internet travel sales in Europe have reached a maximum of 3.4% in 2002. Firstly, thenumber of Internet users in Western Europe in the year 2002 forecast by IDC is 77%higher than the figure given by Datamonitor - for all of Europe, cf. Table 2.2. Secondly,there is no guarantee that the number of Internet buyers will increase as fast as predictedby IDC, and finally there is no guarantee that the average travel purchase value will in-crease from $100 per Internet buyer to $300 as assumed by this writer.
Jupiter Communications have published an estimate for Internet sales of airtickets inGermany, namely $38.5 million in 1998, increasing to $782 million in 2002. Assumingthat Germany accounts for 29.5% of total Internet (travel) sales in Western Europe in1998, as stated by IDC, and assuming air travel accounts for 53% of all Internet travelsales - as in the US - this gives Internet travel sales (or rather purchases) in WesternEurope of about $250 million in 1998. Actually, since Lufthansa only achieved a third ofthe expected Internet sales in 1998 the $250 million may not have been achieved.295
Therefore is seems more prudent to consider $200 million as the minimum estimate for1998. The previously mentioned estimate of $300 million for Internet travel sales in West-ern European in 1998 is a maximum. Could the true figure be between the two numbers,i.e. about $250 million?
Correspondingly, assuming Germany still accounts for at least 30% of total Internet travelsales in Western Europe in 2002, and assuming that the share of air travel has dropped, asin the US, to about 39% of all Internet travel sales, with 782 million air ticket sales in2002 in Germany, as forecast by Jupiter, that translates to (0.782/0.3)/0.39 = $6.7 billionin Internet travel sales in Western Europe in 2002. Alternatively, assuming that Germany,the UK and France together still account for 57.5% of European Internet travel sales in2002 - as IDC estimates for the end of 1998 - and assuming the 1.5 billion in Internet salesof airtickets account for 39% of all Internet travel sales in the three large countries, thattranslates to the same, i.e. (1.5/0.575)/0.39 = $6.7 billion in Internet travel sales in West-ern Europe in 2002. This is a maximum forecast for three reasons:1. Internet sales of airtickets may be lower than assumed;2. the share of airtickets of all Internet travel sales may be higher;3. and the share of Germany, the UK and France may be higher in 2002 than assumed.
295 At ITB’98 in April, Lufthansa stated that it expected revenue of DM 40 million via the Internet in all of 1998.
Later, at ITB’99 the actual Lufthansa figure for 1998 was stated, cf. FVW 6/99, p. 26: DM 1.3 million for4500 tickets in 25 on-line auctions in 1998 + DM 11 million for 40 000 segments (~20 000 round tickets) soldvia Lufthansa Info Flyway, i.e. DM 12.3 in total, corresponding to $7.4 million.

253
In a recent press release (24 May 1999) Datamonitor forecast European on-line travel salesof only $1.7 billion in 2002, which the writer considers a quite conservative estimate.
A medium (and even slightly optimistic) forecast for 2002 for Internet travel sales inWestern Europe would be $4 billion. This is a most significant increase from the 1998level, which the writer estimates to have been about $250 million (with $200 million as aminimum), cf. Table 2.4. An increase from $250 million to $4 billion in four years is asixteen-fold increase in absolute numbers, i.e. a doubling every year for four consecutiveyears, or an increase of 100% per year. At least some successful European players are setto increase their Internet travel sales by 188% from 1998 to 1999, cf. Table 8.2.
To substantiate the numbers in Table 2.4 for the US it can be mentioned that several majorUS airlines (Delta, Northwest)296 have stated that about 2% of their passenger revenue in1998 came directly from the Internet, the customers invariably being US residents, typi-cally buying tickets for travel within the US. Certainly part of this revenue must also havecome from business travellers. Online (Internet) sales to business travellers are assumed tobe included in the on-line travel market figures mentioned in Table 2.4, as previouslystated.297 But airtickets, be it from airlines directly or via on-line travel agents, especiallyin the US, are the great sales success on the Internet as far as travel and related servicesare concerned. If the the US hotel/lodging industry actually realised 1.1 billion in sales viaInternet in 1998 (directly + sales via the on-line travel agents), as Forrester has estimated,this means that Internet sales would account for 1.6% of a total room-night-revenue of $68billion in 1998.
296 www.usatoday.com, 2 November 1998 (Delta CEO);
www.nwa.com/lb/corpinfo/newsc/1998/pa061698b.shtml; also Air Canada reached the 2% mark (TorontoStar, 18 November 1998).
297 Internet sales of several top US airlines such as United, NWA, American, Southwest, US Airways, and perhapsContinental may even have exceeded 2% already in 1998 since several of these sites count more page viewsthan Delta (cf. www.100hot .com/travel), although Delta carries more passengers than the other airlines (or atleast did in 1997 according to IATA).

254
Appendix 2.5 Shares of the online players on the US Internettravel market 1998
It should be kept in mind that Internet travel sales comprise both sales by the principaltravel service providers (the product owners), and online travel agents. The well-knowntop four US travel intermediaries (Travelocity, Expedia, Preview Travel and ITN) hadtravel sales of about $900 million in total, most (~all) of which was for the US market - in1998.
However, 25% of Travelocity’s users were non-US, but this does not mean that 25% ofTravelocity’s travel sales are for markets other than the US (according to Terrell Jones,President of Sabre Interactive, at ENTER’99), for now Travelocity provides ticketingaround the world. Travelocity’s travel revenue was $285 million; Expedia $250 million;Preview Travel $200 million; ITN perhaps $160 million. United Airlines bought a minor-ity stake in ITN in 1998. Preview, Travelocity, and Expedia ranked 40th, 48th, and 50th
respectively on the Media Metrix Top 50 Web Sites in February 1999.298 Up to 25% of the$900 million sales were for business travellers. The 25% of business travel sales is true forPreview Travel (according to Jeffrey A. Lavender, VP of Preview Travel, at ENTER’99).It may also apply to the other on-line agencies, at least partly. It is part of Preview Travel’smission to serve the leisure and small business travellers. ITN states as part of the infor-mation it provides for advertisers on its site that 50% of its users visit the site to booktravel for business, which certainly shows that business travel sales are important for ITNalso (although business travel sales may be less important than leisure, in spite of thestatement).
Both Travelocity and Expedia opened UK versions of their sites in late 1998. Expedia UKreportedly achieved $0.6 million in online travel sales during its first month of opera-tion.299
298 www.relevantknowledge.com, press release dated 22 March 1999.299 www.forrester.com, 30 December 1998.

255
Rough estimate of the shares of the on-line players on the US market in 1998
A B C D=A+B+C A / D (B+C) / D
Type of travel Direct online Top four Other online Total online Online
service sales (max) Online agents agents (guess) (Forrester) Direct (%) Agents (%)
Airtickets 925 675 1,600 58 42
Hotels 765 135 200 1,100 70 30
Tour packages 130 45 175 74 26
Car rentals 126 45 171 74 26
Cruises 0 0 - -
Total 1946 900 200 3,046 64 36
Share 64% 29% 7%
E D E / D A / A (B+C) / E
Total Online sales Online sales Direct online Agents’ online
Type of travel service market (Forrester) 1998 sales 1998 sales
$ mill. $ mill. (%) (%) (%)
Airtickets (*) 71,000 1,600 2.3 1.3 1.0
Hotels (**) 67,000 1,100 1.6 1.1 0.5
Other travel services (***) 85,000 346 0.4 0.3 0.1
Total (leisure) ~223,000 3,046 1.4 0.9 0.5
Note: (*) Own estimate, based on Delta’s accounts, assuming that Delta’s share is ~18% of passengers and ofrevenue. Total market = 289 million round trips, $242 each = $70 billion (1997). 1998 ~ 1997 + 2% =$71.4 billion ~ $71 billion.(**) Own estimate, based on ahma.com: accommodation only: 900 million room nights x $76.50.(***) Residual. Other services include tour packages, car rentals, cruises etc.

256
Appendix 2.6. The Internet payment situation in DenmarkInternet users in Denmark have been the most reluctant in Europe to make Internet pur-chases, according to a comprehensive European survey by IDC in 1998.
After several years of disputes about the fees and security in connection with paymentsover the net, as of April 1999 ordinary bank cards as well international payment cards canbe used to settle payments for purchases made in Internet shops in Denmark. The securitystandards can either be SET or SSL. There is a fixed fee for the shops per transaction,irrespective of whether SET or SSL is used. On top of this there is a fee of 0.15% of thetransaction value if the security standard SSL is offered by the shops and chosen by thecustomers. The explanation given for this additional fee for SSL transactions is the fol-lowing: International experience shows that the security level is lower in connection withSSL payment than in connection with SET payment. The difference in security level isreflected in different prices.300 The shops carries the risk in case of misuse, and the secu-rity for the consumer is the same irrespective of what solution the shop chooses.
In Denmark there are twice as many ordinary bank cards (without Visa) as combinedbank/Visa cards. But when looking at Internet payment transactions the situation is theopposite: Twice as many Internet payment transactions are undertaken by combinedbank/Visa cards than by ordinary bank cards. Nevertheless, the ability to pay by bank cardadds to the actual and potential use of the Internet as a sales channel on the Danish mar-ket, including the payment function. The population of Denmark aged 17 or over is di-vided into three groups of equal size: one-third (32%) have an international payment card,including combined Dankort/Visa; one-third (35%) have a bank card (Dankort) but nointernational payment card and no combined Dankort/Visa either. The last third (34%)have neither a bank card nor an international payment card.
The ability to pay by bank cards only has more than doubled the number of adult Daneswho hold a payment card which can be used to settle payment for Internet purchases on-line (35/32 = +110%). Therefore it is easy to understand that there has been a great desirein the industry and among Danish politicians to implement the possibility of paying bybank card in Danish Internet shops.
Experience during the first three months of Internet payment to Danish Internet shops (9to 15 June 1999) shows the following: only 28% of the transactions (not 52%) were paidby holders of ordinary bank cards. Although not doubling the number of Internet pur-chases which are settled online, the ability to pay by ordinary bank card has added more
300 News release in Danish, 9 April 1999, www.pbs.dk/.

257
than a third (28/73 = 38%) to what the number of Internet payment transactions wouldhave been without this ability.
All in all it is now possible for Danish Internet shopkeepers to settle payments online. Butthose who have so far received payment for Internet sales off-line by traditional meansmay wish to continue the Internet business as usual. But certainly it requires a deliberatedecision about how to proceed. The most obvious thing to do for those Internet shopkeep-ers in Denmark who have so far received payment off-line (or had no Danish Internet shopat all) would be to let the customers have a choice of paying off-line or online.
Analysis of payment card data covering DenmarkA. % of No. of % of adultAdults in Denmark (aged 17 or older) Payments payments adults populationNo payment card 0 0 1 423 091 34Dankort only 4934 27 1 468 000 35Visa/Dankort 11181 62 986 000 23Eurocard/MasterCard 1275 7 246 000 6Other international payment cards 571 3 100 000 2Total 17961 100 4 223 091 100
B. % of % of adultThree groups of adults Payments payments Persons populationNo payment card 0 0 1 423 091 34Dankort only 4934 27 1 468 000 35Any international payment card 13027 73 1 332 000 32Total 17961 100 4 223 091 100
C. % of % ofType of payment card Payments payments Number cards(a) Dankort only 4934 27 1 468 000 52(b) Any international payment card 13027 73 1 332 000 48Total 17961 100 2 800 000 100
(b) / (a): 38 110Note: Based on the writer’s analysis of data published by www.pbs.dk (16.06.99), combined with official popula-
tion statistics. The data for other international payment cards is the writer’s own estimate. It has been as-sumed that those who hold a Eurocard/MasterCard or another international payment card (such as Diners) allhold a Dankort (without Visa).
Ironically, within a few weeks of the start of Internet payments by bank card in DanishInternet shops, there was a scandal involving copying of bank cards, which were thenmisused in automatic teller machines in and around Copenhagen.301 The false bank cardswere not used in the Internet shops; this would have made the technically successful intro-duction of this new Internet payment possibility a disaster from the very beginning, and
301 Munch-Andersen, Nina Z., 1999, 80 Dankort customers think they have been cheated for up to a million
DKK (in Danish), www.jp.dk (newspaper), 24 April; and Tranberg & Bauer, Dankort fraud out of control (inDanish), Politiken, 24 April, p. 1.

258
fortified the worst fears of the Internet payment sceptics. The Danish police is co-operatingwith the police in Sweden and Finland to solve similar frauds.
But consumers need not worry. They are secured in any case. And those Internet shop-keepers, who settle payments off-line need not worry either.

259
Appendix 3.1. On the criteria for selecting the three times 20major airlines in Table 3.1.
A couple of large airlines are not included on the IATA top 50 list, namely SouthwestAirlines of the US, which would have been ranked number 6 and Ansett Australia, whichwould have been ranked around 25th. Southwest do not appear on the IATA member list,which may be the reason it is not on the top 50 list, whereas Ansett is a member of IATA,but may not have submitted its statistics in time for inclusion. In Table 3.1 Southwest andAnsett have been inserted according to the information on their respective websites aboutnumbers of passengers carried.
Apart from the two airlines mentioned, the North American and Western European air-lines from the top 50 list have been supplemented with some other major airlines, in orderto form three times 20 airlines. The additional airlines were initially identified from anentirely different source, namely www.airsafe.com/airline.htm, which includes informa-tion about the accumulated number of flights since 1970 by airline. The actual number ofpassengers carried in 1997 by these additional airlines could typically be found on theindividual websites, and this information was then used to rank those airlines which werenot on the IATA top 50 list.
Only five airlines from the top 50 list have been omitted from the Table 3.1: these are IranAir (ranked as 35th), which does not have an active website at all and (50) Aviaco ofSpain, which has only a website with one photograph. Air China (43), Pakistan Interna-tional Airlines (45) and South African Airways (48) all have websites, but none of themwith online booking functions.
Links to all the individual airline websites mentioned, and all other sites mentioned in thisbook can be found on the following webpage:http://www.rcb.dk/UK/staff/chm/book1999.htm

260
Appendix 4.1. Overview of the 25 UK train operating units(franchises) + Eurostar
Passengers % of Million pas- % of Average Written % ofOwner Franchise 1997/98 passeng. senger km km length km complaints complaints
Connex Connex South Central 93.039.000 11 2211 6 24 23.112 4 Connex Connex South Eastern 117.218.000 14 2885 8 25 23.695 4
First Group First Great Eastern Railway 51.630.000 6 1586 5 31 7.717 1 First Group First Great Western Trains 16.445.517 2 2227 6 135 63.205 10 First Group First North Western Trains 27.783.000 3 776 2 28 16.635 3
MTL Rail Merseyrail Electrics 26.766.168 3 344 1 13 5.042 1 MTL Rail Northern Spirit 42.000.000 5 1332 4 32 26.595 4
Nat.Express Central Trains 32.409.000 4 1149 3 35 23.725 4 Nat.Express Gatwick Express 4.189.000 1 183 1 44 1.004 0 Nat.Express Midland MainLine 6.314.000 1 801 2 127 17.153 3 Nat.Express ScotRail Railways 56.700.000 7 1744 5 31 19.502 3 Nat.Express Silverlink Train Services 30.700.000 4 814 2 27 11.873 2
Prism Cardiff Railways 6.068.000 1 92 0 15 1.176 0 Prism LTS Rail 23.752.000 3 693 2 29 3.922 1 Prism Wales & West Pas. 13.646.000 2 772 2 57 20.745 3 Prism West Anglia Great Northern 52.817.000 6 1614 5 31 19.200 3
Virgin Rail Virgin CrossCountry 12.489.000 1 2016 6 161 78.665 12 Virgin Rail Virgin West Coast 14.985.000 2 3292 10 220 119.266 18
Others Anglia Railways 5.987.000 1 571 2 95 27.903 4 Others Chiltern Railways 8.808.000 1 367 1 42 4.352 1 Others Great North Eastern Railway 13.675.387 2 3572 10 261 82.361 13 Others Island Line 703.000 0 5 0 8 71 0 Others South West Trains 118.159.000 14 3487 10 30 31.958 5 Others Thames Trains 28.532.000 3 809 2 28 11.857 2 Others Thameslink Rail 30.247.000 4 1018 3 34 8.881 1
Total (ex. Eurostar) 835.062.072 100 34.362 100 41 649.615 100 Eurostar (1998) 6.300.000 * 2.646 420
Totals per owner group:Virgin 27.474.000 3,3 5.308 15,4 193 197.931 30,5 Connex 210.257.000 25,2 5.096 14,8 24 46.807 7,2 National Express 130.312.000 15,6 4.692 13,7 36 73.257 11,3 First 95.858.517 11,5 4.589 13,4 48 87.557 13,5 Prism 96.283.000 11,5 3.171 9,2 33 45.043 6,9 MTL 68.766.168 8,2 1.677 4,9 24 31.637 4,9 Others 206.111.387 24,7 9.830 28,6 48 167.383 25,8
Total (ex. Eurostar) 835.062.072 100 34.362 100 41 649.615 100
Sources: www.rail-reg.gov.uk/complain/bullet1/annexbc.htm + own supplementary calculations.* Press release, 18 January 1999, www.eurotunnel.co.uk

261
Appendix 4.2. Train operator website feature matrix - selec-ted countries
T r a i n o p e r a t o r i n :
F e a t u r e :
Germ
any
Sw
itzerland
Austria
Sw
eden
Denm
ark
Norw
ay
Finland
France
TheT
rainline - Virgin, U
K
Am
Trak, U
SA
Via R
ail, Canada
Nat. E
xpress bus, UK
T i m e s c h e d u l e / r o u t e f u n c t i o n s : | | |S t a t i o n s e a r c h b y | | | a ) f r e e t e x t + + + + + + + + | + | + | b ) d r a w d o w n c u r t a i n s + + | + | | c ) b y c l i c k a b l e m a p + | | |S h o w in g s e le c t e d r o u t e o n m a p + + + | | |I n t e r n a t i o n a l t i m e t a b l e s , m e g a + | | |T im e t a b l e i n t e g r a t e d w i t h b o o k i n g + + + + + + + + | + + | + |T im e t a b l e i n f o . a l s o m o b i l e S M S + . . | | |A ls o t i m e t a b l e i n f o . a b o u t b u s e s + + | | . . |
| | |I n c e n t i v e s f o r i n t e r n e t b o o k i n g s : | | |D is c o u n t s o n a l l I n t e r n e t b o o k i n g s | | + |A n y o t h e r s p e c i a l o f f e r s o n I n t e r n e t | | |
| | |B o o k i n g - f e a t u r e s : | | |S t d . t i c k e t p u r c h a s e + + + + + + + + | + + | + |S t d . s e a t r e s e r v a t i o n + + + + + + + + | + + | + |S le e p e r s p u r c h a s e / r e s e r v a t i o n + + | + + | |I n t e r n a t i o n a l t i c k e t s t o r e s i d e n t s + + | | + |I n t e r n a t i o n a l t i c k e t s t o f o r e i g n e r s + | | + |
| | |S u p p l e m e n t a r y f e a t u r e s : | | |B e s t - b u y i n t e r n a t i o n a l a i r t i c k e t s + | | |V id e o o n - d e m a n d + + | | |
| | |P a y m e n t m e t h o d s : | | |A t s t a t i o n c o u n t e r + + | | + |A t s t a t i o n , e l e c t r o n . k i o s k + + | | |
| | |C a s h o n ( m a i l ) d e l i v e r y + | | |G i r o c a r d ( i n v o i c e ) m a i l e d , d i r e c t l y + + + | | |I n v o i c e , m a i l e d , f r o m s h o p p i n g m a l l + | | |
| | |I n t e r n a t . p a y . c a r d , S E T + | | |I n t e r n a t . p a y . c a r d , S S L + + + + + + | + + | + |N a t io n a l b a n k c a r d , S E T . . | | |N a t io n a l b a n k c a r d , S S L . . | | |
| | |T i c k e t r e t r i e v a l m e t h o d s : | | |A t s t a t i o n , m a n u a l + + + + | + ? | + |A t s t a t i o n , e l e c t r o n . k i o s k + + | | |A t T A ' s o r o t h e r t h i r d p a r t y d e a l e r s + | + ? | |B y m a il + + + + + + + | + ? | + |
| | |P u n c t u a l i t y i n f o r m a t i o n : | | |I n f o . a b o u t d e l a y e d d e p a r t u r e s | | |I n f o . a b o u t d e l a y e d a r r i v a l s + . . | + | |D e la y a le r t s o n m o b i l e p h o n e s + | | |
| | |R e p e a t s a l e s c r e a t i o n b y : | | |F r e q u e n t t r a v e l l e r p r o g r a m | + + | |e - m a i l e d o f f e r s a n d / o r n e w s | | |

262
Supplement to the Train Operator website Feature Matrix:A parallel from the air transport sector: the Circle of Contact
Circle of contact - in theairtransport sector - according to KLM
Circle of contact - in theairtransport sector - according to KLM
1. MarketingCommunications
2. PurchaseTicket
3. Check-in3. Check-in
4. Lounge
5. Departure
6. In-flight
7. Arrival8. Baggagehandling
9. Loyaltyprogrammes
10. CustomerRelations
7a. Transfer
pre-journeyground servicespre-flight
ground servicespost-flight
flightpost-journey
Source: Ligerman, Hugo, 1998, How can technology help distribution and the service process?, 24 March, one of15 slides from a Power Point presentation by KLM at IT for Travel & Tourism ‘98, Holiday Inn, Amster-dam, 23-24 March 1998, www.firstconf.com/c37/. Reproduced here with permission from KLM.
An additional supplement to the Train Operator website Feature Matrix on the previouspage is a matrix showing an overview of Internet Projects for Railways, and their variousfunctions, prepared by Renato De Pieri of Italian Rail, FS, 31 July 1998, for the secondworldwide UIC Internet Club meeting on 22-23 October 1998, www.uic.ass.fr/, hereunderwww.uic.asso.fr/uk/about/seminar_internet/ci98/conference/uicsiafi.htm#chart, also inc-luded in Felkl et al. (1998), downloadable as a word-document underwww.uic.asso.fr/uk/about/.

263
Appendix 5.1 Discussion of the size of the US and WesternEuropean market for long-distance travel by scheduled coa-ches
• About long-distance express coach travel in the US is known: Greyhound Lines had arevenue of $846 million in 1998. Most of this, 86% (=$728 million), was revenue fromscheduled services, Greyhound Lines is thus not involved in non-scheduled passengertransport. This in turn means that if one knew the market share of Greyhound Lines inthe US, the total market for long-distance scheduled coach travel could be calculated.
• Greyhound is the only nationwide provider of scheduled intercity bus transportationservices in the US. The Company's primary business consists of scheduled passengerservice, package express service and food services at certain terminals, which accoun-ted for 86.0%, 4.0% and 3.7%, respectively, of the Company’s total operating revenuesfor 1998 (Annual accounts, 1998).
• This however, does not mean that Greyhound is alone on the scheduled intercity bustransportation services in the US since there are regional players as well. The marketshare of Greyhound Lines in the US has not been stated (in any accounts or other do-cuments which the writer could find on the net), but it could be at least 50%. Thereforea first estimate of the total scheduled long-distance coach market in the US would be$728x2=1.5 billion in 1998.
• From the 1998 Annual Report of Laidlaw Inc. the total North American market forvarious bus services is stated (in Canadian $), including intercity scheduled highwaycoach transport and non-scheduled tour coaches (CAD6 billion). Assuming that the USmarket accounts for 90% of that, this means that the US market for scheduled and non-scheduled long-distance coach travel is worth about US$ 3.5 billion (1998). It seemslikely that a little less than half (i.e. US$ 1.5) of this could be travel by long-distancescheduled coaches, and the balance being tour coaches (which are run by thousands ofoperators in a highly fragmented industry).
Percent of
market Billion US$
Billion US$
Billion US$
BillionCAD
Bus and coach travel segment value USA, 90%
Canada, 10% NorthAmerica
NorthAmerica
Education services (school busses) 45 8.7 1.0 9.7 15.0
Municipal, local busses 36 7.0 0.8 7.8 12.0
Highway coach transport, scheduled 8 ~1.5 0.2 1.6 2.5
Highway coach transport, non-scheduled 11 ~2.0 0.2 2.3 3.5
Total 100 19.2 2.1 21.3 33.0

264
• In Sweden the percentage for long-distance is 2.4% of the revenue of all bus and coachtraffic. And in the UK two long distance coach operators generate a total of about $300million p.a.. If the UK market represents up to 25% of the revenue of all long-distancescheduled coach traffic in Western Europe (although the UK only represents 15% ofthe population), 100% would equal (at least) $1.5 billion. The $1.5 billion would thencorrespond to 3.4% of the total (Western) European bus and coach market of up to $44billion. Another consideration: if the long-distance scheduled coach market in Sweden,which is worth $38 million p.a. (SEK 300 million) represents about 3% of the WesternEuropean market (although Sweden only represents 2.3% of the population), then thewhole market would be worth $1.3 million).
• A best guess of the value of the Western European market for scheduled long-distancecoach services is then about $1.3 billion.

265
Appendix 5.2 Revenue figures of some UK private sectorplayers in bus, coach and other forms of public transport
For National Express plc, revenue increased by 16.7% to £1.32 billion in 1998 (1997:£1.13 billion); http://thestandard.net/companies/company_display/0,1591,93628,00.html;
Stagecoach Holdings plc (revenue £1.38 billion in 1998, £1.55 billion in 1999 to the endof April);
Arriva plc (revenue of £1.56 billion in 1998, up from £1.42 in 1997, of which passengerservices accounted for £486 million in 1998, £439 million in 1997);
The Go-Ahead Group plc (£414 million in sales in 1998). Go-Ahead is, by the way, part ofa French-British-Swedish consortium (with Via-GTI holding 51% of the shares, and Go-Ahead 39%), which has won a contract for running the cummuter trains in the Stockholmarea, Sweden, from 1 January 2000 to 2010 (Storstockholms Lokaltrafik AB, SL,www.sl.se).
Metroline’s principal activity is provision of bus services under contract to London Trans-port Busses. - Turnover increased by 31% to £47.8 million in the year to 9 October 1998. -Metroline’s turnover was £42 million during the 24 weeks ending on 26 March 1999 (i.e.for less than half a year). Metroline plc took over Scottish Citylink from National Expressin August 1998. Scottish Citylink is Scotland’s leading brand for scheduled long-distancecoach services. In 1997 it carried 2.2 million passengers and generated £12 million inrevenue. The fact that Metroline carries as many as 150 million passengers p.a., but just2.2 million by long-distance coaches, namely by Scottish Citylink, reflects the dominanceof short bus trips over long-distance coach trips in terms of passenger volume.

266
Appendix 5.3 The world-wide car industry at a glance
Cars Number 1997 US Revenue Revenue 1997 Global car 1997 Global carin US of US rental revenue Europe ROW rental revenue rental revenue
Company fleet locations ($ million) ($ million) ($ million) ($ million) (%)a: National 145.000 968 1.750 - - 1.750 7b: Alamo (*) 110.000 175 1.100 150 50 1.300 5c: CarTemps 35.000 400 280 280 1d: Eurodollar, UK 178 178 1
a+b+c+d: AutoNation 290.000 1543 3.130 328 50 3.508 13
Hertz (**) 250.000 1.150 2.700 519 200 3.419 13Avis 200.000 1.000 2.000 847 300 3.147 12Enterprise 355.000 3.100 3.100 - - 3.100 12Budget 125.000 955 1.600 660 440 2.700 10Dollar / Europcar 62.000 229 707 737 - 1.444 5Thrifty 34.000 488 363 160 160 683 3
Major brands 1.316.000 8.465 13.600 3.251 1.150 18.001 68Others 614.000 12.535 2.800 2.749 2.850 8.399 32
Total 1.640.000 21.000 16.400 6.000 4.000 26.400 100
Sources: US major brands in the home market: Auto Rental News 1998 Fact Book, according to Faust, Fred, 1998,Enterprise is independent, at the top. Company eclipses Hertz, but challenge is not over yet,www.pickenterprise.com, St. Louis Post-Dispatch, 25 January 1998. Total for the US: Avis and Budgetwebsites. Europe and rest of world totals: Own rough estimate. European data: various websites.
Assumptions: (*) That $200 million in revenue, and 20 000 Alamo cars are located outside the US (1300 million - 200 =1100 million). (**) That Hertz revenue in the US in $300 million less than the 3000 estimated by AutoRental News - to allow for more international revenue.

267
Appendix 5.4 Looking for lowest prices on two differentEuropcar sitesBelow we try to find the total rental estimate - including insurance, taxes etc. - for a two-door economy car for tomorrow (Friday) for 24 hours from 9.00 a.m., with pickup andreturn of the car in central Hamburg. First we use the Europcar International site(www.europcar.com) - stating different countries of residence, and afterwards the corre-sponding lowest price is found on the www.europcar.de site:
The Europcar International site - www.europcar.com:
1a) The cheapest price (total rental estimate) found on the europcar.com site - givingDenmark as home country - was DKK 511 (~DM 134) - including taxes, airport sur-charges (although pick-up at railway station!), collision damage and theft waivers.
1b) Going through exactly the same procedure - giving USA as home country - results in atotal rental estimate of DM 152 (i.e. not in US$ !) - including taxes, airport charge (!) andairport surcharges (!) for one day. On top of this come options such as collision damagewaiver of DM 37 per day, and theft waiver of DM 14 per day which were included in offer1a), i.e. DM 152+37+14= DM 203.
1c) Giving Germany as country of residence results in a total rental estimate of DM 143 -including taxes and airport surcharges (but no airport charge) for one day. On top of thiscomes collision damage waiver of DM 37 per day, and theft waiver of DM 14 per day, i.e.DM 143+37+14= DM 194.
1d) Giving Afghanistan or Zimbabwe (the first and last on the list - which basically musttranslate to all others) as country of residence results in total rental estimate of US$ (!)80.25 (~ DM 144 for one day including the same as under 1a) (taxes, airport surcharges,collision damage and theft waivers).
1e) Giving the UK as country of residence results in total rental estimate of about £39 (DM113) for one day including the same as under 1a, 1c and the final amount under 1c.
The Europcar Germany site - www.europcar.de:
2) The lowest corresponding price found on the Europcar Germany site(www.europcar.de) was DM 54 plus DM 43 in full hull insurance (Vollkasko), i.e. onlyDM 97 in total, considerably lower than any of the offers found on the www.europcar.comsite.

268
1) In summary the lowest prices found on the Europcar International site were as follows:
- for Americans DM 203- for Germans DM 194- for Others DM 144- for Danes DM 134- for Britons DM 113
2) The corresponding lowest price found on the Europcar Germany site was:- for all DM 97
It is stated on the www.europcar.com site that rates are subject to change if reservation isnot confirmed. If you rent in a foreign country, the rate quoted in your currency is only forguidance. The rental rate is usually guaranteed in the renting country currency only. Inspite of (or because of) this explanation, and in spite of a some uncertainty as to exactlywhat currency exchange rates to use, given the great variance in prices found on theeuropcar.com site leaves the Internet user with an uncomfortable feeling of uncertainty asto how much one can rely on the prices generated by the site.
For those interested a more detailed breakdown is given below:
Details of the examples of cheapest rates found at the www.europcar.com siteCountry ofresidence
Pricequotedin
Price in DMfor 100 units:
Rate,one day(DM)
Plus Total rentalestimate(DM)
Collisiondamagewaiver DM
Theftwaiver(DM)
Totalinsurance(DM)
Grandtotal(DM)
USA DM ! 100.00 131.04 Airportcharge,airportsurcharges,taxes
152.01 37.07 13.79 50.86 202.87
Germany DM 100.00 123.35 Airportsurcharges,taxes
143.09 37.07 13.79 50.86 193.95
Others $ 179.40 143.97 Nothing 143.97 included included 0.00 143.97
Denmark DKK 26.31 134.46 Nothing 134.46 included included 0.00 134.46
UK £ 291.43 112.58 Nothing 112.58 included included 0.00 112.58
Details of the cheapest rate found at the www.europcar.de site Anybodywho knowsGerman
DM 100.00 54.00 Nothing 54.00 in the fullinsurance
in the fullinsurance
43.00 97.00

269
Appendix 5.5 Investment, costs and benefits of the Stena LineInternet booking site
Initial invest. Initial invest. Yearly Total costs Costs, acc.in booking in other parts maintain SEK mill. SEK mill.
Year SEK mill. SEK mill. SEK mill.1998 3.5 3.5 7 71999 2 2 92000 4 4 132001 6 6 19
~2003 10
Million Percent Segments Total no. of All Percent of Internetcar crossings of which per booking car bookings Net which car car bookings
Year booked million bookings bookings1998 1.78 90 1.8 0.89 3000 65 19501999 1.78 90 1.8 0.89 20 800 65 13 5202000 1.78 90 1.8 0.89 82 154 65 53 4002001 1.78 90 1.8 0.89 13 6923 65 89 000
Percent of Internet Price per Revenue Internet Percent Additional (extra)car bookings car crossing per booking rev., cars of which revenue, cars
Year via net bookings cars, SEK cars, SEK SEK mill. additional SEK mill.1998 0.22 1950 650 1170 2.3 10 0.231999 1.52 13 520 625 1125 15 10 1.52000 6 53 400 600 1080 58 10 5.82001 10 89 000 575 1035 92 10 9.2
Internet ~Price per Segments Net revenue, Percent Extra rev., Totalpassenger crossing per passenger passengers which passengers additional
Year bookings person, SEK book. (2*1,8) SEK mill. additional SEK mill. revenue, SEK1998 1050 100 3.6 0.4 10 0.04 0.31999 7280 95 3.6 2.5 10 0.2 1.82000 28 754 90 3.6 9.3 10 0.9 6.72001 47 923 80 3.6 13.8 10 1.4 10.6
ALL Cost Of which Savings+ Savings per Internet savings from cars/ additional Gross Profit (GP)
Year Internet booking bookings SEK mill. passengers SEK mill.1998 SEK 40 3000 0.1 65 / 35% 0.41999 SEK 40 20 800 0.8 66 / 35% 2.62000 SEK 40 82 154 3.3 67 / 35% 10.02001 SEK 40 136 923 5.5 68 / 35% 16.1
Acc. Acc. Acc. Applied Acc. Acc. Acc.Savings+ Investment + Net exchange Savings+ Investment + Netextra GP annual costs effect rate, $ per extra GP annual costs effect
Year SEK mill. SEK mill. SEK mill. SEK 100 $ mill. $ mill. $ mill.1998 0.4 7 -6.6 12.58 0.05 0.88 -0.831999 3.0 9 -6.0 12.58 0.38 1.13 -0.762000 13.0 13 0.0 12.58 1.63 1.64 0.002001 29.0 19 10.0 12.58 3.65 2.39 1.26

270
Appendix 5.6 The Stena Line Internet booking system ar-chitecture - Phoenix
OtherWin32clients
WWW
The Net
http
NT IISASP
firewall
BusinessObjects NT MTS
SQL Server
BMQ
Interface Legacy System
VMS
Legacy reservation system
WEB Server
Source: Stena Line.

271
Appendix 6.1 Number of hotels by country in Western Europeand the US
Hotels and No. of Occupancy Mill. room No. of ~Rooms Beds per ~Beds
Country similar rooms (‘97) rate (rooms) nights sold beds (‘97) pr. hotel room per hotel
UK 40,000 561,655 44% 90 1,072,762 14 ~1.9 27
Germany 37,162 859,642 32% 101 1,565,850 23 1.8 42
Italy 35,371 943,623 39% 135 1,724,100 27 1.8 49
France 20,582 608,353 54% 119 1,216,706 30 2.0 59
Austria 18,955 301,479 32% 36 633,601 16 2.1 33
Spain 9,792 576,514 62% 130 1,103,399 59 1.9 113
Greece 7,185 296,096 58% 63 561,068 41 1.9 78
Switzerland 6,400 141,826 39% 20 261,482 22 1.8 41
Belgium 1,914 61,052 30% 7 158,982 32 2.6 83
Portugal 1,777 93,460 40% 13 211,315 53 2.3 119
Sweden 2,251 102,146 32% 12 227,247 45 2.2 101
Netherlands 1,525 75,393 38% 10 144,000 49 ~1.9 94
Norway 1,183 62,233 38% 9 135,605 53 2.2 115
Finland 1,097 54,364 48% 10 117,906 50 2.2 107
Denmark 1,072 57,042 38% 8 108,950 53 ~1.9 102
Rep. Ireland 866 52,696 65% 13 116,463 61 2.2 134
Luxembourg 401 7,683 45% 1.3 14,675 19 ~1.9 37
WesternEurope
187,533 4,855,257 44% 775 9,374,111 26 1.93 50
USA (‘97) 49,000 3,800,000 65% 895 6,840,000 78 1.8 140
Comparison
W.Europe/USA
3.83 1.28 0.68 0.87 1.37 0.33 1.07 0.36
Sources: Eurostat 1994 (no. of establishments only); World Tourism Organization (WTO), 1999, Compendium ofTourism Statistics 1993-1997 (rooms, beds, occupancy rates); www.ahma.com (1997data for the US).
Note: Unfortunately no more current data for number of establishments per country in Western Europe is available.The number of hotels in Norway was exactly 1198 in 1997 (www.ssb.no), i.e. about the same as in 1995.The number of hotels in Sweden is actually from 1998 (according to www.scb.se). The number of hotels inDenmark is an estimate also including hotels with less than 40 beds.

272
Appendix 6.2 The Top 50 Hotel BrandsR o o m s p e r
C o m p a n y R o o m s Proper t ies p roper ty(1 ) Cendan t Corpo ra t ion (Days Inn , Ramada , Supe r 8 , 5 3 6 7 0 3 6 1 4 9 8 7Howard Johnson , T rave lodge , Kn igh t s , Winga te , V i l l age r ) (2 ) Bass Ho te l s & Resor t s (Ho l iday Inn , Crowne P laza ) 4 4 8 0 4 0 2 8 4 7 1 5 7(3) Choice Hote l s In te rna t iona l 3 0 5 3 7 2 3 6 6 5 8 3(4) Bes t Wes te rn In te rna t iona l 3 0 3 9 4 3 3 8 3 2 7 9(5) Marr io t t In terna t ional 3 0 0 2 6 4 1 5 4 2 1 9 5(6 ) She ra ton /Wes t in /S ta rwood 2 1 2 2 4 6 6 7 4 3 1 5(7 ) P romus Ho te l Corpo ra t ion 1 8 9 2 7 8 1 3 1 5 1 4 4(8) Accor (w/Novote l , Mercure , Sof i t e l ) 1 2 2 9 6 9 8 4 7 1 4 5(9 ) Pa t r io t Amer i can (w/ In t e r s t a t e & Wyndham) 1 1 3 2 5 8 4 9 2 2 3 0(10 ) Rad i s son Ho te l s Wor ldwide 9 1 0 9 2 3 8 0 2 4 0(11) Mote l 6 , L .P . 8 5 5 6 5 7 8 3 1 0 9(12) Hi l ton Hote l s Corp 8 0 7 2 2 2 2 2 3 6 4(13) Mer i s ta r Hosp i ta l i ty Corpora t ion 7 0 8 4 5 3 0 9 2 2 9(14) So l Mel i a 5 9 2 8 0 2 4 1 2 4 6(15) In te r -Cont inen ta l Hote l s & Resor t s 5 8 5 0 6 1 7 7 3 3 1(16 ) Un ive r sa l Group 5 6 2 0 0 4 7 2 1 1 9(17) Hya t t Ho te l s Corp 5 5 8 0 8 1 0 9 5 1 2(18) Fe lco r Lodg ing Trus t 5 0 1 5 2 1 9 4 2 5 9( 1 9 ) G o l d e n T u l i p W o r l d w i d e 4 8 9 2 6 3 8 2 1 2 8(20) Hi l ton In terna t ional 4 5 5 3 7 1 3 6 3 3 5(21 ) LaQuin t a Inns 3 9 1 3 6 3 0 6 1 2 8( 2 2 ) R e d R o o f I n n s 3 4 1 0 3 2 9 3 1 1 6( 2 3 ) O a k w o o d C o r p H o u s i n g 3 3 0 0 0 7 0 4 7 1(24) Br i s to l Hote l s & Resor t s 3 2 2 2 3 1 2 1 2 6 6(25) F lag In te rna t iona l Hote l s 2 9 3 0 6 5 0 2 5 8(26) Cho ice Hote l s In te rna t iona l Europe 2 6 2 5 8 3 3 5 7 8(27 ) Le Mer id i en Ho te l s & Reso r t s 2 6 2 2 0 9 3 2 8 2(28) Hya t t In te rna t iona l Corpora t ion 2 5 4 3 1 7 1 3 5 8(29 ) Lodg ian 2 5 3 7 8 1 3 6 1 8 7(30) Pr ime Hosp i ta l i ty Corpora t ion 2 4 8 5 3 1 8 3 1 3 6(31) Pr ince Hote l s 2 4 8 3 3 7 8 3 1 8(32) Ci rcus Ci rcus Ente rpr i ses 2 3 6 0 3 1 5 1 5 7 4( 3 3 ) R a d i s s o n S A S H o t e l s W o r l d w i d e 2 2 6 0 8 9 3 2 4 3(34) Hospi ta l i ty Proper t ies Trus t 2 2 3 6 7 1 6 7 1 3 4(35 ) Wa l t D i sney Wor ld Reso r t s 2 1 3 5 7 1 8 1 1 8 7(36 ) Tha ra ld son Lodg ing 2 0 7 1 3 3 0 8 6 7(37) Shangr i -La Ho te l s & Resor t s 2 0 2 4 9 4 0 5 0 6(38) U .S . F ranch i se Sys tems (Mic ro te l , Hawthorn , Bes t ) 1 9 5 6 0 2 2 3 8 8(39 ) Marcus Ho te l s & Reso r t s (w /Baymon t ) 1 9 1 8 1 1 7 3 1 1 1(40) Nikko Hote l s In te rna t iona l JAL Hote l s Co . 1 8 8 4 6 5 2 3 6 2(41 ) O lympus Rea l Es t a t e Corpo ra t i on 1 8 7 7 3 1 3 2 1 4 2(42 ) Wes tmon t Hosp i t a l i t y Group 1 8 4 9 1 9 2 2 0 1(43 ) Cho ice Ho te l s Europe 1 8 3 5 6 2 6 6 6 9(44 ) Cho ice Ho te l s Canada 1 7 9 3 4 2 1 3 8 4( 4 5 ) H o t e l s & C o m p a g n i e , F r a n c e 1 7 3 4 0 3 3 5 5 2( 4 6 ) O m n i H o t e l s 1 6 0 7 3 4 5 3 5 7(47) Canad ian Pac i f i c Hote l s 1 6 0 2 9 3 5 4 5 8(48) Cross roads Hosp i t a l i t y Company , L .L .C . 1 5 9 4 8 1 3 2 1 2 1(49 ) Homes t ead Vi l l age 1 5 2 5 4 1 2 2 1 2 5(50) ANA Hote l s In t e rna t iona l 1 5 1 3 2 4 4 3 4 4Tota l 3 9 1 3 2 6 1 2 9 4 6 1 1 3 3
Source: 1999 Directory of Hotel & Motel Companies, www.ahma.com.Note: Accor actually operates about 3000 hotel properties worldwide, including Motel 6, i.e. considerably more
than mentioned in the above Top 50 list.

273
Appendix 6.3 European Youth hostel statistics (1997)
Organisation No. ofhostels
Hostelsin IBN
% inIBN
No. of over-nights
Overnightsper hostel
% of hostelsin W.Europe
% of Euro-pean over-
nightsDJH, Germany 611 19 3 10,240,092 16,760 27 45
STF, Sweden ** 300 2 1 1,089,227 3,631 13 5
YHA England & Wales, UK 235 29 12 2,102,338 8,946 11 9
FUAJ, France 186 38 20 1,272,924 6,844 8 6
REAJ, Spain 179 4 2 1,524,939 8,519 8 7
SRM, Finland ** 132 1 1 382,062 2,894 6 2
DANHOSTEL, Denmark 103 3 3 1,072,086 10,409 5 5
ÖJHV/ÖJHW, Austria 93 13 14 1,179,759 12,686 4 5
Norwegian Youthhostels ** 92 2 2 400,000 4,348 4.1 1.7
SYHA, Scotland, UK 80 11 14 633,607 7,920 4 3
SJH, Switzerland * 70 22 31 799,610 11,423 3 3
AIG, Italy 54 6 11 715,646 13,253 2 3
An Oige, Ireland 37 5 14 203,644 5,504 2 1
NJHC, Netherlands 35 5 14 679,598 19,417 2 3
BÍF, Iceland ** 31 0 0 ~77,500 ~2,500 1 0,3
VJH, Belgium 22 5 23 253,986 11,545 1 1
MOVIJOVEM, Portugal 22 7 32 228,777 10,399 1 1
CAJL, Luxembourg 15 1 7 104,340 6,956 1 0.5
LAJ, Belgium 9 2 22 170,642 18,960 0.4 1
NINI, Northern Ireland 8 4 50 ~40,000 ~5,000 0.4 0.2
Greece 1 1 100 ~10,000 ~10,000 0.0 0.0
Western Europe 2315 180 8 23.180.777 10.013 100 100
Worldwide 4500 273 6 31.000.000 6.889 //////////// ////////////
Europe as % of world 51 66 ////// 75 //////////// //////////// ////////////
Sources: www.iyhf.org/eufed/, www.vandrerhjem.no, www.stf.se, www.mek.fi (+www.srmnet.org), andwww.itn.is/~gpalsson/aerr/ensk/bif_ensk.htm.
Note: * Associate member of The European Union Federation of Youth Hostel Associations EUFED. ** Not amember of EUFED. The numbers of hostel guest nights for Iceland, Northern Ireland and Greece are esti-mates only.The IBN numbers are as counted on the www.iyhf.org/ site on 14 May 1999. The hostel data for Sweden andFinland are from 1998.

274
Appendix 6.4 A review of (lack of) booking functionality forEuropean youth hostels
Country Web address Booking (request) function?Austria www.oejhv.or.at/ Yes, on request basis to the association’s office.Belgium NoDenmark www.danhostel.dk/ NoFinland www.srmnet.org/ NoFrance www.fuaj.org/ No - but 30 of 186 hostels have e-mail boxGermany www.djh.de/ NoGreece NoIceland www.itn.is/~gpalsson/aerr/
ensk/bif_ensk.htmNo
Ireland (Republic of) www.irelandyha.org/ NoItaly www.hostels-aig.org/ No.Luxembourg www.youthhostels.lu/ NoNetherlands www.njhc.org/ No - but all hostels described uniformlyNorway www.vandrerhjem.no/ YesPortugal NoSpain NoSweden www.stfturist.se/ NoSwitzerland www.youthhostel.ch/ Yes, standard mask to be filled in.United Kingdom:England & WalesNorthern IrelandScotland
www.yha.org.uk/www.hini.org.uk/www.syha.org.uk/
NoNoA free form e-mail can be sent to theScottish reservations centre.
Total: 20 organisations 16 with active Web addresses Only a few with booking request facilities.
On the Austrian site booking requests can be sent to Austrian Youth Hostel Association’soffice, both for domestic hostels and for foreign IBN hostels. There are no photos of theAustrian hostels, only basic contact details. Probably only a few people would send abooking request to the Austrian Youth Hostel Association on the basis of practically noinformation.
There were more than 10 000 visitors per month to the Italian site in the spring of 1999 302
- which is more than to the Norwegian site, where there were 8000 visitors per month.(Hostels in Italy count almost twice as many overnights as those in Norway). A computer-to-fax booking request system is established in a network of only four of the 54 Italianyouth hostels.There is good information and photo material on the Dutch hostels, presented in a uniformway, with photos, but bookings or booking requests cannot be made from the site.
302 20 303 visitors in eight weeks from 17 March 1999 to 11 May 1999, according to counter.

275
For most of the Swiss hostels the message Zu dieser Jugi sind sonst keine Infos vorhandenappears. But at least there is a photo of each of the hostels. And all the Swiss hostels ap-pear to have an e-mail box, to which a fill-in-the-blanks type of booking request can ap-parently be sent. In all instances the customer is required to state both telephone and fax-number, whereas e-mail address is not required! Although all the Swiss hostels have beengiven e-mail addresses, obviously not all of them are actually using and checking the e-mail box. As a matter of fact the Swiss Youth Hostel Association receives the e-mail in allinstances, since many, especially small, hostels no not have Internet access. Each bookingrequest is printed out by the Association, and manually faxed to the given hostel! Whenthe number of booking enquiries reaches a certain volume, its routing to the individualhostels’ fax-machine should at least be automated - since the staff of the Associationhardly have time for such manual handling - and/or the main hostels, measured by thenumber of booking requests, should be encouraged (or required) to get and use an e-mailbox, which would also greatly facilitate feedback from the hostels to the Internet users.
Outside Western Europe, but in the Mediterranean area, in Israel, a booking request formfor both hostel packages and individual hostel nights is placed on the site of HostellingInternational Israel.303 Payment is by credit card, but the customer will receive confirma-tion of the reservation before money is deducted from the credit card.
303 www.youth-hostels.org.il/

276
Appendix 6.5 Why the hostels in IYHF’s IBN system cannotbe booked through the Web
The current considerations of IYHF as to why the hostels in IBN cannot be booked via thenet for the time are given below.
In June 1999 IYHF raised a number of issues and considerations in connection with Inter-net bookings: Although security for payment raised some concerns, this was not the mainreason for not opening IBN to everybody over the Web. IBN is a system created for theFIT (Free Independent Travellers) market, and the FIT market is only a relatively smallproportion of the youth hostel market segment. Most FITs stay in key city hostels on theirarrival as their first point of entry and they do not necessarily reserve the whole journey.There are plenty of alternatives for them to make a booking once they reach their firstpoint of arrival, which are probably easier and cheaper. Credit card bookings for internati-onal travel also involve high bank charges, which is a disadvantage for budget travel-lers.304
The youth hostel movement involves more than 60% of domestic travel and even withinthe 10 million international overnights (about one in every three of the 31 million hostelovernights worldwide mentioned in Appendix 6.3 is international), the IYHF roughlyestimates that at least three million would involve groups. It is fairly obvious that groupbookings require a totally different set-up, which is quite different from IBN. Furthermore,most of the national Associations already have their own booking systems and some ofthem have already started Internet bookings. The IYHF is still evaluating the evolution ofits IBN booking system at the moment. If all national Associations gradually move toInternet bookings, IBN will probably not be needed in due course, or alternatively, theIYHF may co-ordinate the Internet bookings, but this will involve considerable negotiationbetween countries, and no development of such a kind can be achieved until an internatio-nal agreement has been reached. IYHF has consulted a wide range of key city hostel ma-nagers and the general consensus is that key city hostels already lack sufficient capacityduring peak periods. Opening IBN or any other system at this stage would only cause moredisappointment to the customer, according to IYHF.
304 30 June 1999, Mr. R. Lau, Secretary General, IYHF.

277
Appendix 6.6 Hostelling and train-travel in the Nordic coun-tries
The hostel in Stamsund, northern Norway, recently received a prize as the best hostel inthe world. Stamsund is located on the island of Lofoten, between Bodø and Narvik innorthern Norway. How to get there? Take the train to either Bodø or Narvik, and then sailfrom there. Train to Bodø: Express train Oslo-Trondheim, night train Trondheim-Bodø.Cheapest price second class ticket, one-way, sleeping in a three-bed carriage: NOK 1080($143 one-way, of which the sleeper supplement is $15, i.e. 128x2 = $256 for a returnticket excluding the sleepers).305 Then comes the coastal steamer trip from Bodø, depart-ing at 15.00, arriving Stamsund at 19.30.306 The price per night at Stamsund Hostel isNOK 80 ($11), and it is even free to use the boat and fishing equipment!307 Another veryrecommendable destination is Bergen. The harbour area is very beautiful, and so is thetrain journey there, which is ranked as one of the top 20 railway experiences in the worldby the magazine The International Railway Traveller. So, if you take the night train fromOslo, do get up early to enjoy the scenery. Seeing Norway by train, and staying at youthhostels is great, and affordable provided one travels on a rail-card with unlimited travel(such as InterRail or ScanRail, see below).
An InterRail card for 26+ covering each country in Europe costs DKK 3600 ($537) forunlimited 2nd class travel for a whole month, and if one travels only in Norway-Sweden-Finland the price is only $321, i.e. little more than a simple return ticket. The ScanRailbargain gives you unlimited travel by train for 21 days in the three countries mentionedplus in Denmark for $315 (age 26-59) 2nd class, or by 1st class for $100 extra. Clearly itmust be hard to sell full-price 2nd class individual rail-tickets to holiday-makers, when onecan get unlimited travel for such a bargain price!
Personal travel experience 1 (Norway, Sweden, Finland): the writer once bought a Scan-Rail card and travelled around the Nordic countries, stayed at many youth hostels (alsoseveral places in Norway), on several night trains, on one ferry and twice slept in the open(cf. allemansrätten), and had the experience of a lifetime. According to memory the tripwent as follows: Copenhagen - Stockholm - Mora - night train to Kiruna - Narvik (hostel)- Luleå (hostel) - Oulu - Helsinki (hostel) - night train to mid-Finland (hostel) - Turku(hostel) - via night ferry to Stockholm and straight on to Oslo (hostel) - night train to
305 www.nsb.no/persont/index_en.html - online train booking possible, but only for Norwegians! Off-season train
tickets were available 19 April - 5 May at about half price.306 www.hurtigruten.com/hr/us/5/ruteplan2.html - online booking not possible. No prices given.307 www.vandrerhjem.no.

278
Trondheim (hostel) - via Oslo and night train from there to Bergen (hostel) - via Oslo toStavanger - Kristianssand - via Hirtshals to home sweet home.
The InterRail zones InterRail zone B
Source: www.dsb.dk/rejser_udland/ - hereunder:www.dsb.dk/rejser_udland/produkter/interrail98/interrail_zonekort.jpgwww.dsb.dk/rejser_udland/produkter/interrail98/zone_b.gif
Note: ScanRail covers the same countries as InterRail zone B plus Denmark.
Personal travel experience 2 (Europe in general): now that InterRail has been mentionedin relation to Norway and the remaining Nordic countries, it should be noted that InterRailis not only a bargain (even for those 26+) for leisure travel but certainly also for businesstravel involving multiple destinations in several European countries. One business classreturn ticket by air between European cities may cost as much as two months’ unlimitedrail-travel, albeit by 2nd class. The night train will take you to a morning meeting in almostany city from almost anywhere in Europe.
Personal travel experience 3 (Norway by car): another way of experiencing Norway is bycar, combined with either hostel or hotel accommodation. At least the latter may be boughtas a package of ferry and stays at 5-6 different accommodations. The writer saw the Har-dangervidda, Hardangerfjorden and a bit of Sogneforden once that way, and to be fair toone of NIH’s hotel competitors, this was also a great experience (Larvik to Porsgrunn,Rauland, Norheimsund, Leikanger, Geilo, Rjukan to Larvik).308 Since, according to the
308 NIH may be pleased to know that one of the hotel bookings failed. But a room in another hotel was granted - in
which the bottom fell out of the bed! This was all part of the fun.

279
NIH site there are hostels in Geilo and Rjukan, and in 90 other places, clearly there areplenty of opportunities to make car/hostel round-trips in Norway.

280
Appendix 6.7 Costs and benefits seen from the point of view ofthe Matka-Ruka letting agency
(a) Initial investment, say FIM 200 000 (to systems developer, and for design of Webpages).
(b) Annual recurrent costs, say FIM 20 000 (to the ISP, Internet Service Provider).(c) Fee (cost) per booking, FIM 20 (payable by Matka-Ruka to developers).(d) Saved staff-time, 0.3 hours ((2x10)-2=18 minutes) x FIM 100 per hour = FIM 30.(e) Commission to agency is about FIM 400 per booking. Ten percent of the Internet
bookings could be additional. These two factors correspond to FIM 400 x 0.10 = FIM40 per Internet booking p.a.
(f) Extra Gross Profit per Internet booking = (d) + (e) - (c) = 30+40-20 = FIM 50 per netbooking.
Investment appraisal - Matka-RukaYear 1995 1996 1997 1998 1999
(Date) (Dec. 31) (Dec. 31) (Dec. 31) (Dec. 31) (Dec. 31)
Total no. of bookings - 25000 31400 32400 33600
Internet bookings as % 0 1 2 6 12
1 No. of Internet bookings 0 250 630 1950 4050
2 Extra GP per Internet booking, FIM - 50 50 50 50
3 Extra GP for Internet booking p.a., FIM 0 12500 31500 97500 202500
4 Additional GP, accumulated, FIM 0 12500 44000 141500 344000
5 Initial investment, FIM 200000
6 Annual fixed costs, FIM 20000 20000 20000 20000
7 Initial investment+annual costs, FIM (5+6) 200000 20000 20000 20000 20000
8 Initial investment + fixed costs accumulated 200000 220000 240000 260000 280000
9 Net cash flow p.a., FIM (3-7) -200000 -7500 11500 77500 182500
10 Net cash flow, accumulated, FIM (4-8) -200000 -207500 -196000 -118500 64000
11 Discount factor, ~8% p.a. (7.792% p.a.) 0,741 0,798 0,861 0,928 1,000
12 Net cash flow p.a. discounted ( 9 / 11 ) -270008 -9393 13362 83539 182500
13 Net cash flow, discounted, accumulated -270008 -279401 -266039 -182500 0
(a) Normally there would be an initial investment involved, which for Matka-Ruka has atleast partly been time-used as a participant in the development process of the bookingsystem.

281
For others, interested in acquiring a similar system there would be an up-front price forthe internal booking system, the Internet bridge, and the construction of Web pages. Theinternal booking system (with a firewall and Internet bridge), would cost anywhere be-tween FIM 100 000 and FIM 400 000. The price at the low end of the range will cover asystem for one or two internal operators - and it will be open towards the Internet. It is fora system with less than 200 hotel rooms or cottages. On top of this come costs for standardhardware (such as a pentium PC as booking server - whereas workstations probably exist).At the high end of the price range there can be an unlimited number of workstations andan unlimited number of cottages or hotel rooms. There will then be several user levels(administration-sales-maintenance-owner-additional sales offices (bookings only), i.e. inaddition to the normal sales office (like Matka-Ruka) there can be other sales terminalsthat can make the bookings (e.g. municipal travel information kiosks in various places).There will be a fax sending and an automatic fax reading facility.
(b) There will be certain recurrent annual costs for renting server space at the ISP. As apure guess this has been put at FIM 20 000 p.a.
(c) In the Matka-Ruka instance the arrangement is that Pehmo/JSOP gets a total of FIM20 from Matka-Ruka for every Internet booking, and in this way the former recoup theirdevelopment costs.
(d) Matka-Ruka saves costs when customers book through the net. It takes no more thantwo minutes to process a filled in cottage booking form received by e-mail, includingsending a confirmation manually by e-mail. To sell by phone takes the answering of twophone calls each lasting about 10 minutes, i.e. 20 minutes for answering two calls, 18minutes of which is saved.
(e) Matka-Ruka gets about 20% of the revenue per booking (20%x2000=FIM 400), leav-ing 80% for the cottage owner. The Internet booking site has resulted in additional book-ings. For example, some foreign customers who have never been to Kuusamo before, andwho have not been sent any brochures, have found Kuusamo on the Web and made theircottage booking. Not all Internet bookings are additional of course; the number which areis unknown. If, for instance 10% of the Internet bookings are additional, this means thatthe additional revenue (additional gross profit) per Internet booking is about FIM 400 x0.1 = FIM 40.
(x) In some cases Web usage substitutes a printed catalogue and postage. This has notbeen taken into account.

282
Appendix 7.1 The players in the Nordic package tour market -1998
A B C D E A+B+C ABCD ABCDE
Tour brand: Sweden Norway Denmark Finland Poland Scandinavia 4 Nordic 5 markets
Ving 500 240 136 22 876 876 898
Spies 125 215 75 340 415 415
Tjaereborg 183 76 183 259 259
Saga 200 200 200 200
Always 230 230 230 230
SLG Group 855 440 534 151 22 1829 1980 2002
Fritidsresor (est.) 460 140 460 600 600
Star Tour 300 193 493 493 493
Royal Tours (est.) 120 120 120 120
Hasse (est.) 80 0 80 80
Other brands (est.) 75 35 27 20 137 157 157
+Scan Holiday 85 0 0 85
Fritidsresor Group 655 335 220 240 85 1210 1450 1535
Aurinkomatkat - Sun-tours
283 0 283 283
Finnmatkat 142 0 142 142
Finnair Travel Serv. 425 0 425 425
Apollo 300 2 48 350 350 350
Larsen Rejser 59 59 59 59
Simons Charter 45 45 45 45
Herning Rejser 44 44 44 44
Alletiders (Kuoni) 148 148 148 148
Top five groups 1810 777 950 816 107 3537 4353 4460
Orbis Travel 272
All others 90 173 222 134 301 485 619 920
Total market 1900 950 1172 950 680 4022 4972 5380

283
Market shares (%) A B C D E A+B+C ABCD ABCDE
as in Table 7.15 Sweden Norway Denmark Finland Poland Scandinavia 4 Nordic 5 markets
Ving (within SLG) 26% 25% 12% 0% 3% 22% 18% 17%
SLG Group (Airtours) 45% 46% 46% 16% 3% 45% 40% 37%
Fritidsresor (Thomson) 34% 35% 19% 25% 13% 30% 29% 29%
Finnair Travel Group - - - 45% 9% 8%
Apollo 16% 0% 4% 0% 0% 9% 7% 7%
Alletiders (Kuoni) - - 13% - 4% 3% 3%
Top five groups 95% 82% 81% 86% 16% 88% 88% 83%
All others ~5% 18% 19% 14% 84% 12% 12% 17%
Total (%) 100% 100% 100% 100% 100% 100% 100% 100%
Market volume (x1000) 1900 950 1172 950 680 4022 4972 4972
Average marketprice per tour ($) 616 695 569 591
Exchange rates: SEK: NOK: DKK: DM: £:
$ per 100 units (1998) 12.58 13.24 14.93 56.87 165.65
Note: The prices and quantities mentioned for Norway were the expectations as of April 1998. The quantities onthe Norwegian market for the full year may have been negatively affected by a strike in June 1998(www.aftenposten.no – 14 June 1998 - 40 000 charter holiday makers hit by strike). And the average priceon the Norwegian market may have been negatively influenced by a price war in the autumn of 1998(www.aftenposten.no - Full price war on charter holidays). Fritidsresor and Star Tours are distinct brandsbut are perceived as being quite closely linked.
Comment:In Scandinavia almost 79% of the market is held by brands which have foreign owners. Other named tour op-erators on the Danish market are: Dansk Folkeferie (43k), Århus Charter (18k), and Club la Santa (12k).

284
Appendix 7.2 Ving’s Internet package tour sales - and Euro-pean totals – 1998-1999-2002, in volume and value (estimates)
1998-prices
Total packs (x 1000) 1998 1999 2002 $ per pack. Total $ mill. 1998 1999 2002
Ving Sweden 500 500 510 616 Ving Sweden 308 308 314
Ving Norway 240 250 255 695 Ving Norway 167 174 177
Ving Denmark 136 150 170 569 Ving Denmark 77 85 97
Ving Scandinavia 876 900 935 630 Ving Scandinavia 552 567 588
Other European 79124 79900 82265 568 Other European 44968 45408 46753
Europe total 80000 80800 83200 569 Europe total 45520 45975 47341
Packages via net (000) 1998 1999 2002 $ per pack. Net sales $ mill. 1998 1999 2002
Ving Sweden 12 30 92 616 Ving Sweden 7.5 18.5 57
Ving Norway 2 5 36 695 Ving Norway 1.3 3.3 25
Ving Denmark 0 1 17 569 Ving Denmark 0.0 0.6 10
Ving Scandinavia 14 36 145 630 Ving Scandinavia 8,9 22,4 91
Other European 65 210 1437 556 Other European 36 118 809
Europe total 79 246 1582 569 Europe total 45 140 900
Ving as % of Europe 18 15 9 Ving as % of Europe 20 16 10
% of packages via net 1998 1999 2002 % of $ sales via net 1998 1999 2002
Ving Sweden 2.5 6 18 Ving Sweden 2.5 6 18
Ving Norway 0.8 2 14 Ving Norway 0.8 2 14
Ving Denmark 0 1 10 Ving Denmark 0 1 10
Ving Scandinavia 1.6 4 15 Ving Scandinavia 1.6 4 15
Other European 0.08 0.3 1.7 Other European 0.08 0.3 1.7
Europe total 0.10 0.30 1.90 Europe total 0.10 0.30 1.90

285
Appendix 7.3 Internet commerce in Sweden 1998
Product SEK mill. SEK mill. SEK mill. % % %
category Consumer Business Total Consumer Business Total
Computer hard/soft 137 1453 1591 27 77 66
Paper products 0 400 400 0 21 17
CDs 100 0 100 20 0 4
Books 55 30 85 11 2 4
Gaming 60 0 60 12 0 3
Travel (Ving only) 60 0 60 12 0 3
Tickets 45 5 50 9 0 2
Tools, etc. 13 3 16 3 0 1
Food 14 2 15 3 0 1
Flowers 13 1 15 3 0 1
White goods 5 1 6 1 0 0
Cosmetics 3 0 3 0 0 0
Total 505 1895 2400 100 100 100
Percent 21% 79% 100%
Source: Based on Faktaruta, according to Veckans Affärer, 22 February 1999, www.va.se, cf. details below.

286
Swedish Internet commerce to consumers and businesses 1998
SEK mill. Started Consumer Business Net (%) Product category
Dell 650 10% 90% Large Computer products
WM-data/Owell 600 Jan., 97 0% 100% 8 Computer products
Pappersgruppen 400 Oct., 97 0% 100% 18 Paper products
Dustin 200 May, 95 10% 90% 30 Computer products
Apollo * Travel
24IT 103 38% 62% Computer products
Boxman ~90 Dec., 97 100% 0% 100 CDs
Bokus 80 Aug., 97 65% 35% 100 Books
ATG /Interbet 60 Feb., 98 100% 0% 0.6 Gaming
Ving 60 Apr., 98 100% 0% 3 Travel
SF 50 Dec., 97 ~90% ~10% 10 Tickets
PC-Express ~27.5 Apr., 98 30% 70% Large Computer products
Claes Ohlsson 16 ~80% ~20% 6 Tools etc.
PrisXtra 15 Aug., 97 ~90% ~10% 5 Food
Interflora ~14.5 Nov., 95 ~90% ~10% ~7.5 Flowers
Buyonet 10 50% 50% 100 Software
SJ * Travel
Vitvarumäklarna 6 Oct., 97 90% 10% 25 White goods
Skivhugget ~7.5 ~100% ~0% 15 CDs
Ad Libris 5 97 65% 35% 100 Books
Åhléns 5 Aug., 97 100% 0% Low Cosmetics / CDs
Total 2400 21% 79%
Source: Faktaruta, according to Lindsten, Per Olof and Weje, Sandén, 1999, Electronic commerce - The future wayof doing business is already established on the Net (in Swedish), Veckans Affärer, 22 February 1999,www.va.se.
Note: A few places the middle value of a range - or an estimate based on the text - are added, market by ‘~’. Missedby Lindsten and Sandén: Apollo (~SEK 120 mill.). SJ should have been in there (~SEK 6 mill., $0.8 million)as well. And so should SAS (probably).* Missing from source.

287
Appendix 7.4 Ving: cost savings, break-even and pay-back
Normally it takes five telephone conversations to sell a trip for Ving Sweden. The cost ofstaff time for such five telephone conversations may be SEK 275 ($35, since $1 = SEK 8).Now Ving gets an average of one e-mail per sold package. In 1998 Ving Sweden received35 e-mails per day, and it took about four hours to respond to them. The pure workingtime costs could then be SEK ~125 per hour x 4 = SEK 500 per 35 trips sold, i.e. SEK 15per trip, or only about $2! Now we are able to calculate that the pure time-saving per In-ternet booking is about SEK 275-15=SEK 260 ($33) per sold trip. Let us round down toSEK 250 ($31.45, say $30). This means that for every million SEK investment is requiredthe shifting of 4000 trips from telephone sales to Internet sale. With an investment of e.g.SEK 4 million ($0.5 million) the requirement is 16 000 trips - accumulated, disregardinginterest - to break-even, but this is a purely hypothetical investment figure only for VingSweden. In this example we have not taken account of the fact that some of those whoendeavour to make Internet bookings may have made a few telephone calls before makingthe booking, but to what extent this is the case can of course be investigated by Ving. TheVing Norway and Ving Denmark sites together could require the same amount, i.e. an-other SEK 4 million. And then comes Ving Poland, which could be an information onlysite initially, rather than a booking site, requiring less investment than the booking sitesfor each of the Scandinavian countries. The savings per package sold via the net would beless in Norway than in Sweden, and even less in Denmark, because of lower economies ofscale. Since the package tour market in Poland is rather small, and since the Internet hasvery low penetration in Poland, no measurable cost savings can be expected from a Polishsite. But some additional sales may be achieved in Poland through an information onlysite.
There will now follow some hypothetical break-even considerations, the conclusion ofwhich is that the benefits from the Ving Sweden site alone, given the conservative Internetsales indicated by Table 7.16 and the underlying Appendix 7.2, can pay back a SEK 9million investment in the sites of all four different countries in only two years (1998 to theend of 1999), although the booking sites were only in operation from April 1998, not thebeginning of 1998, so it could be argued that pay-back is only 21 months in the examplegiven. There are two main ways of justifying IT investments: either through savings orthrough extra gross profit because of additional sales. Clearly, savings may come from acombination of the two, but in the following example cost savings are included as the onlybenefit.

288
Break-even considerations - principles and hypothetical example
A) No. of units to reach break-even Investment . via cost savings = Cost saving per unit [sold through the Internet]
B) or ..... via Investment . additional sales: gross profit per additional unit [sold because of the website]
or: (Investment - gross profit for additional units sold because of the website) C) both Cost saving per unit [sold through the Internet]
Hypothetical example, based on cost savings
SEK 4 million Ving Sweden SEK 250 = 16 000 tours
SEK 2 million Ving Norway SEK 150 ~ 13 000 tours
SEK 2 million Ving Denmark SEK 125 = 16 000 tours
SEK 1 million Ving Poland No = No pay-back soon 309
SEK 9 million Ving, total: ~SEK 20 ~ 36 000 + 10% to be sure 310 = 40 000
309 Given the tremendous Internet penetration in Finland, from a Scandinavia Leisure Group point of view it might
be considered better to invest in establishing Internet booking sites for the SLG brands Spies and Tjaereborg onthe fair-sized Finnish tour package market, rather than providing a website - not to mention a full blown Inter-net booking site - for the rather small Polish market.
310 Interest should be taken into account in a real investment analysis (involving the calculation of the net PresentValue of the investment, etc.), which in simple break-even analyses can be done by using low estimates on thebenefit side and high estimates on the cost side.

289
11. Indeks
200114; 29; 50-51; 55; 70; 74; 77; 82; 86; 119; 146;157; 165; 192; 194
200211-12; 14; 26-29; 35-36; 48; 55; 74; 78; 82; 86;97; 115; 136; 177; 192; 202; 204; 207-208; 226;228; 249; 252-253; 282; 284
20039; 12; 15; 27; 29-30; 48; 175; 191-192; 208; 227-229; 248-250
4P18-19
accommodation1; 9; 11; 14; 16; 34; 90-91; 125-127; 134; 137-139; 148; 161-162; 178; 203; 207; 209; 218-219;221; 241-242; 247; 278
Accor111
ADAC164
Aer Lingus40
Aeromexico40
Africa111
Air Canada40; 253
Air China259
Air France32; 40
Air New Zealand40
Air UK40; 42
airbus102
airline14; 39; 40-42; 49-50; 52-55; 151; 169; 176; 194-195; 208; 213; 217; 222; 227; 259
airticket41; 50; 82; 201; 248; 252
Airtours12; 168; 170; 173-175; 177; 181; 185; 196-197;225; 283
AirTran40
Alamo
111; 266Alaska Airlines
40Alitalia
32; 40All Nippon Airways
40Alletiders
12; 187; 196; 282-283Alletiders Group
12; 187; 196Alltours
176; 178Aloha Airlines
40Alpitour
188Always
185; 282Amadeus
43-44; 49; 51; 55; 72; 112; 134; 177America West Airlines
40American
14-15; 29; 36; 39-41; 46; 48; 60-61; 65; 70; 90;92; 113; 137; 215; 222; 253; 259; 263
American Airlines40
American Trans Air40
Amsterdam262
Amtrak42; 59-61; 90; 92-94; 106; 113; 222; 243
annual accounts53; 69; 99; 105; 168; 240
annual report52; 61; 66; 73; 188; 194; 217
Ansett40; 259
AOL132
Apollo12; 187; 196; 201-202; 204-206; 212-213; 220-221; 223; 237; 282-283; 286
Arriva97-98; 225; 265
Asia232; 241
auction

290
43; 176; 228Aurinkomatkat
187; 282Australia 40; 91; 95; 106; 107; 108; 259Austria
59; 61; 95; 103; 128-129; 133-135; 188; 201;220-221; 237-238; 271; 273-274
Austrian40; 188; 274
Austrian Airlines40; 188
availability16; 18; 47; 50-51; 57; 59; 61; 68; 71; 75; 80-81;114-116; 124; 127; 129; 131; 133; 135-136; 150-151; 155; 164-165; 175; 177; 180-184; 187-188;194-195; 198; 205; 209-210; 218
Aviaco39; 259
Avis110-111; 113; 266
B&B126; 148
BA32; 42; 47-49; 217; 220-221
Baltic60; 91; 115; 149
bank36; 72; 105; 185; 190; 256-257; 276
Beijing91
Belgian61; 113
Belgium32; 58-59; 89; 95; 103; 128-129; 188; 231; 238;271; 273-274
benefit66; 69; 120; 287-288
Bergen142; 277-278
Berlin15; 92; 97; 229
best buy80; 82; 132
Best Western241
bookers20; 75; 132; 177; 179; 190; 202-203; 214
booking9-11; 14; 18; 39; 41-43; 46-47; 49-51; 54-55; 61;65; 67; 69; 71-76; 78; 80-81; 86-87; 89; 90; 92-94; 97; 99-101; 103-105; 107-108; 115-122;124-126; 129-135; 138-143; 145-161; 164-165;175-176; 178-191; 194-195; 198-200; 202-203;
205; 208-210; 213; 215; 218- 220; 222; 227;235; 242-243; 249; 259; 269-270; 274-277; 280-281; 287-288
booking system9-10; 42; 49; 69; 120; 122; 129-131; 134; 150-154; 156; 164; 175; 198-199; 209; 218; 235;270; 276; 280-281
Bookings NL9; 11; 128-131; 220-221; 236
Bord Failte134
BornholmsTrafikken115-116
brand12; 47; 135; 148; 159; 174; 183-184; 187; 189;192; 195-196; 200-201; 213; 248; 265; 282
Brazil40
Britain24; 106; 169; 183; 198
Britannia Air169
British10; 40-42; 46-48; 53; 59; 89; 111; 115; 117-118;151; 169; 170; 173; 193; 216; 221; 226; 229;233; 236; 265
British Airways40-42; 46-48; 53; 89; 221; 229; 233; 236
British Midland40; 42; 151
British Rail59; 226
Brittany Ferries116
Brussels32; 87; 89; 231
Braathens11; 32; 40; 42; 52-54; 71; 208; 217; 220; 222;233; 236
Btx65; 131
Budget113; 169; 212; 266
Budget Travel169
Bulgaria59; 104
bus11; 79; 89; 97-102; 104-108; 215; 263-265
bus operator11; 97; 99-102; 104
busabout102

291
C++68
cable TV70; 95
Caledonian Macbrayne116
call back116
call centre42; 72; 89; 132-133; 174-175; 195; 198; 249
camping10; 125; 137; 148; 161-165; 210; 242; 245
Canada30; 34; 40; 42; 59; 83; 91; 93; 95; 106-108; 169;207; 230; 242-243; 253; 263
Canadian40; 90-91; 240; 249; 263
Canadian Airlines40; 240
Cap Gemini113
car rental9; 34; 43; 97; 109-111; 113-115; 212; 220; 243;245; 250; 255
Caremar116
cargo68; 101
Carlson Leisure Group169
Carnival248-249
Cathay Pacific40
CGEA98; 99
cheep43
China40; 59; 91-92; 259
China Eastern Airlines40
China Southern Airlines40
Club Med188
coach88; 97-100; 102-103; 105-106; 108; 113; 149;209; 223; 243; 263-265
Cobol199
Color Line
116; 147competitive advantage
11; 16; 19; 21; 74; 94; 217
Compuserve132
Condor Ferries116-117
Continental Airlines40
Copenhagen19; 83; 101; 105; 123; 231; 257; 277
Corsica116
Cosmos182
cost11; 16; 52; 67; 69; 73; 75; 84; 90; 94; 105-106;127; 131; 145; 153; 155; 165; 179; 203; 213;217; 278; 280; 281; 287-288
cottage125; 149; 150-152; 154-160; 174; 180; 210-211;213; 230; 281
cottage letting agencies125; 154-158; 174; 210-211
cottage letting agency149; 156; 158; 160; 213
Country Holidays180
credit card37; 47; 50-51; 55; 65; 88; 102; 105; 107; 115-116; 118; 124; 129; 135-136; 155; 177; 181;183; 184; 190; 199; 204; 208; 210; 216; 256;257; 275
Croatia161
Croatian104
CRS230
cruise34; 248; 250
Crystal169; 180
Czech59-60; 103; 131
Dagens Nyheter199-200
DanCenter155-156
Danish

292
9; 12; 15; 24; 54-55; 59-61; 64; 73; 75; 78-81;83-84; 87; 92; 94-95; 105; 121-122; 126-127;134; 147; 154-160; 170; 173; 185-187; 197; 204-205; 213-214; 216; 222-223; 225-227; 230; 232;236; 239; 256-257; 283
Danish Rail9; 59; 61; 64; 73; 75; 78-80; 84; 87; 92; 94-95;222; 236
Danish Tourist Board126; 147
Dankort256-257
dansommer11; 75; 155-159; 175; 220; 223; 237
database47; 113; 122; 132; 134; 150; 163
Datamonitor9; 23; 26-28; 35; 44; 226; 252-253
DB9; 59; 61-67; 71; 78; 94; 208; 220; 222; 227
Delta40; 42; 46; 225-226; 233; 253; 255
Denmark9; 24; 37; 58-59; 62; 70; 78-79; 83; 85; 93-95;101; 103-104; 108; 115; 121; 131; 134; 141;145; 147; 154-156; 158; 162; 173; 186-187; 193;196-197; 199; 202-206; 208; 214; 216; 220-221;223; 225-226; 230; 232; 236-239; 241; 256-258;267-268; 271; 273-274; 277; 282-284; 287-288
DER170; 176
Dertour180
design101; 124; 280
destination18; 47; 79; 104; 118; 126-127; 133-134; 183;195; 203-204; 218; 277
Destination Management System15; 133-134; 232
Deutsche Bahn62; 66; 208; 222
deutschlandreise.de134
DFDS15; 116; 147; 227
differentiation11; 21; 94; 217-218
Digital122
Direct Holidays174; 181; 183
discount
97; 113; 120; 199-200; 206; 212-213Disneyland Paris
102distribution
11; 14-16; 19-21; 29-31; 33; 48; 52; 54; 57; 74;83; 95; 131-133; 153-154; 156-159; 164; 175;180; 183-184; 210-213; 217; 221; 225; 229; 230;235; 240-242; 262
distribution channel11; 14; 16; 20; 31; 33; 52; 74; 131; 133; 153;158; 212; 225
DMS134
Dollar111-112
Dollar Rent A Car111
DSB9; 11; 71; 73; 75; 79-86; 93-94; 121; 220; 222
Dutch36; 118; 131; 154; 275
Eastern Europe23; 25; 60-61; 102-103; 111; 163; 207
eCamp10; 12; 163-165; 220; 237
ecommerce28; 37; 228
Edinburgh88; 227; 230
electronic commerce36; 57
electronic kiosk81
Electronic Mall Bodensee134
electronic ticketing52; 68
employees17; 49-50; 54-55; 59-60; 62; 66-67; 70-71; 79;87-89; 98; 100-101; 104; 106-107; 111; 117;121; 123; 128; 131-132; 136; 150; 162-163; 169-170; 174; 189; 191-192; 196; 197; 205; 235
ENTER75; 190; 254
Enterprise226; 266
Equant41-43; 47; 90; 226; 236
Estonian104
EU36; 70; 161; 238-239
Eurocamp

293
165Eurocard
72; 257Eurolines
11; 99-106; 108; 209Europcar
9; 106; 110-115; 209; 212; 236; 267-268Europe
9-16; 23-30; 32-36; 41-42; 44; 48-50; 52-53; 55;59-61; 64; 70; 75; 80; 82; 94; 97; 101-104; 106;108; 110-113; 127-129; 132-138; 142; 151-152;155-156; 158-159; 161-165; 167; 170; 183; 188-189; 200; 202; 207-217; 221-223; 226-231; 240-243; 245; 250-253; 256; 264; 266; 271; 273;275; 277-278; 284
European1; 9; 11-16; 18; 23-24; 28-37; 39-42; 46; 50; 53-54; 57-61; 65-66; 70; 75; 78; 90; 92; 94-95; 97;99; 102-104; 106; 108; 110-111; 113; 115-116;125-127; 131; 133; 135; 137-138; 146-147; 156;161-162; 167; 171; 188; 196; 200-202; 207; 208;210-212; 216-217; 219-222; 225-231; 233; 235;240-243; 247; 250; 252-253; 256; 259; 263-264;266; 273-274; 278; 284
Europeans9; 15; 29; 30-32; 90; 125; 126; 131; 147; 161-162; 221; 226-227; 242; 247
Eurostar59; 61; 87-90; 232; 260
exchange rate123; 239; 268
Expedia46; 55; 254
express89; 97; 99; 101; 263
Express 2000101
ExpressBus101
external15
Extranet17; 248
Faroe Islands116
fax10; 65; 101; 127; 129; 135; 138-141; 145; 147-148; 150; 162; 164-165; 210; 274-275; 281
ferries79; 116; 121-122; 223; 245
Ferrimaroc116
ferry
11; 18; 34; 79; 88; 97; 115-117; 119; 121; 123;147; 209; 222; 243; 277-278
FEXCO134; 225
Finland24; 50; 52; 59; 95; 101-102; 104; 116; 149-150;152-154; 158; 163; 173; 185-186; 196; 202; 207;220; 223; 236-238; 258; 271; 273-274; 277; 282-283; 288
Finnair11-12; 40; 50-52; 154; 173; 187; 196; 233; 236;282-283
Finnish12; 61; 101; 149-150; 159; 173; 185-187; 204;288
Finnmatkat187; 282
First Choice167; 174; 182; 193
Fischer176-178
Fjord Line116
forecast12; 15; 27; 29; 30; 35; 77; 191; 242; 248; 250;252-253
Forrester15; 26; 28-30; 33-36; 78; 227; 230; 242; 248;250; 253; 255
fragmented127; 263
France32; 40; 58-59; 89; 95; 98-99; 103; 108; 110-112;116; 123-124; 128-129; 132; 163; 169; 188; 216;227; 231; 238; 252; 271; 273; 274
Frankfurt64; 131
French68; 89; 98; 113; 127; 195; 208; 265
French Rail89; 208
frequent flyer43; 49-50; 113
Fritidsresor12; 170; 173; 181; 186-187; 196; 282-283
Fritidsresor Group12; 170; 173; 181; 186-187; 196; 282
Frosch174; 176-177
FTI177-178
future

294
14; 28; 41-42; 45; 49; 52; 65; 66; 69; 72; 74; 81;83-84; 90-91; 97; 100-101; 108; 115; 120-121;131; 133; 165; 174; 179; 189; 191-192; 194;199; 200; 204; 212; 229; 232; 235; 242; 286
fvw44; 46; 66; 111-113; 115; 156-157; 165; 167-170; 172-173; 175; 187-189; 193; 196; 205; 227-228
Galileo112
Garuda40
Garuda Indonesian Airlines40
GDP13; 25-26; 238-239; 250-251
GDS18; 42; 89; 112; 177; 210; 232
German10; 37; 43; 59-62; 68; 75; 80; 94; 111; 113-114;121-122; 127; 131-134; 150; 156-157; 159; 162;164; 170-171; 174; 176; 178-179; 185; 190; 195-196; 208; 222; 226; 230; 236; 268
German Rail59; 60-62; 80; 94; 113; 121; 208; 222; 236
Germany9; 12; 16; 18; 24; 58; 59; 61-62; 64-66; 78; 94;95; 102-104; 111-116; 121; 126; 128-129; 131-132; 134; 145; 156; 158; 162-164; 167; 170;172; 174-178; 182; 189-190; 193; 201; 207; 209-210; 212-213; 220-223; 228; 236-239; 252; 267-268; 271; 273-274
giro72; 81; 185
Glasgow174
Global Distribution System242
goal48-49; 102; 115
Greece59; 95; 116-117; 203-204; 238; 271; 273-274
Greek60
Greyhound101-102; 106-108; 113; 263
Greyhound Canada106-107
Greyhound Lines106-108; 263
Greyhound Pioneer
106-108growth
55; 78; 108; 213; 226growth rate
78Graahundbus
101GTT
188guest nights
10; 137; 139; 142; 146; 273Gulet Touropa Touristik
188Gulliver
134-135; 231HaCon
61; 64; 236Hamburg
66; 113-114; 116; 163-164; 267Hapag Touristik Union (HTU)
172; 189Hasse
186; 282
Hawaiian Airlines40
Helsinki101; 131; 149; 154; 277
Herning Charter187
Hertz110-111; 113; 212; 245; 266
HIN10; 136-142; 144-148
hitbox132
holiday33-34; 37; 51-52; 102; 125-126; 151; 153-156;159-162; 168-169; 174-178; 181-183; 199-200;206; 208; 210; 213; 223; 229; 230; 242-243;277; 283
holiday cottage34; 151; 153-156; 159-160; 181; 208; 210; 213;223; 230
Holiday Cottages Group169; 180
Holiday Express183
Hong Kong92
hostel10; 135-139; 141-143; 145; 147-148; 210; 220;273; 275-278

295
Hostelling International10-11; 135-136; 138-139; 141; 145; 275
Hostelling International Israel275
Hostelling International Norway10-11; 136; 138-139; 141; 145
hotel9; 11; 14-15; 18; 29; 33; 34; 54; 102; 127-133;137-138; 148; 150; 161; 169; 177; 201; 203-204;210; 225-227; 231; 240-242; 247; 250; 253; 271;278; 281
hotel chain18; 34; 127; 231; 241
Hotelplan171; 184
Hover Speed Ferries116
HRS131-133; 236
HSMAI200
Hungary59; 104; 161
IATA13; 39; 40; 228; 253; 259
Iberia40; 49-50; 188; 236
Iberojet188
IBM70; 228
IBN11; 135-136; 142; 273-274; 276
IC67; 71; 78; 80
ICE66-67; 71; 78
Iceland24; 32; 95; 238; 273-274
IDC23-25; 27-29; 35; 202; 215-216; 226; 228; 252;256
India59; 91; 111
Indian Airlines40
InfoFlyway43-46; 231
information13; 15-16; 18; 20; 39; 42-44; 47; 49-54; 60-62;66; 68-70; 73-74; 78; 80-83; 87-90; 95; 114;117-118; 122; 127; 133-135; 164; 177-178; 184-186; 189-190; 192; 194; 198; 204; 209; 212;
215-216; 221; 225; 231; 235; 243; 254; 259;274-275; 281; 287
information technology54
intelligent83; 148; 204
Inter City66
Inter City Express66
Intercity73-74; 79
intermediary31; 125-127; 146; 200-201; 210; 218-219
internal15; 49; 69; 81-82; 108; 120; 131; 150; 164; 199;205; 209; 218; 235; 281
international10; 11; 13-14; 21; 40; 50; 53; 57; 61; 64-66; 69;79-80; 82; 86; 87; 97; 99-100; 102-104; 110;115-116; 126; 135; 146-148; 188; 204; 209-210;215-216; 222; 231; 243; 245; 256-257; 266; 276
Internet1; 9-21; 23-37; 39-55; 57; 60-63; 65-95; 97-108;111; 113-123; 126-127; 129-136; 138-139; 141-148; 150-160; 163-165; 174-181; 183-186; 189-192; 194; 196-210; 212-223; 225-233; 235-237;240; 242-243; 248; 250; 252-254; 256-257; 262;268-270; 275-276; 280-281; 284-288
Internet booking9-11; 32; 39-43; 45-47; 50-55; 61; 65; 67; 72;74-76; 79; 88; 90-91; 93-94; 100-102; 105-108;111; 113; 115-117; 119-120; 122; 126-127; 133;135-136; 138-139; 142-148; 151-157; 159-160;164-165; 174; 177-179; 181; 189-192; 194; 199;202-203; 205-206; 208-210; 212-213; 215; 219;222; 248; 269-270; 276; 280-281; 287-288
Internet commerce15; 28-29; 36; 85; 88; 133; 194; 200; 204; 207;214; 285-286
Internet world33
InterRail82; 277-278
Intranet17; 68-69; 89; 226
investment9-11; 42; 50; 66; 76; 85; 88; 106; 119; 130; 133-134; 143; 145; 153; 160; 164; 194; 198; 203;280; 287-288
Iran Air

296
39; 259Ireland
40; 59; 95; 103; 116; 123-124; 128-129; 134;169; 227; 238; 271; 273-274
Ireland (Republic of)274
Irish9; 116; 123-124; 134; 225; 231; 236
Irish Ferries9; 116; 123-124; 236
Irish Tourist Board134
Israel163; 275
IT13; 15; 49; 67; 71; 74; 76-77; 107; 133; 162;204; 230; 236-237; 262; 287
Italian68; 262; 274
Italy58-59; 64; 95; 103; 113; 116-117; 126; 131; 188;238; 271; 273-274
ITB44; 46; 190; 201; 228; 231; 252
ITN254
ITS176-177
ITV171-172; 184
IYHF135-136; 236; 276
Japan 40; 46; 59; 91; 95; 238Japan Air System 40Japan Airlines 40; 46Java 47; 68JetAir 188JSOP 150; 237; 281Jupiter 15; 28; 29; 34; 35; 228; 229;
252kiosk 66; 80KLM 32; 40; 42; 52; 53; 220; 221;
229; 233; 262KLM UK 40; 42Korean 40; 41Kotler 18; 19; 229Kreutzer 176; 177; 178Kuoni 10; 12; 167; 172; 173; 174;
182; 183; 184; 187; 192; 193; 194; 195; 196;237; 282; 283
Kuusamo 149; 150; 151; 152; 154; 237;281
L’TUR179
Laidlaw107; 263
LAL177
Larsen Rejser173; 187; 282
last minute43; 50-51; 155; 164; 176-178; 181; 184-189;194-195; 203; 205-206; 210
Latvian104
legacy system48; 82; 120; 199; 218
letting agencies125; 154-158; 174; 210-211
letting agency149; 155-156; 158; 160; 213; 280
LH63; 222
Linjebuss97; 99; 229
link42; 60-61; 80; 105; 108; 160; 188; 218; 222
Linux131; 150
local18; 53; 79; 97; 125; 141; 214; 241; 263
London46; 89; 92; 97-98; 102; 104-105; 127; 136; 142;169; 226; 231; 236; 265
long distance62; 65; 69; 71; 73; 75; 77-80; 82; 86; 97-99; 102-103; 108; 113; 203; 243; 263-265
lookers20; 75; 190; 202; 213-214
LTU176; 179
Lufthansa9; 11; 32; 40-46; 53; 63; 113; 201; 220-222; 231;233; 236; 252
Lunn Poly169-170; 180
Luxembourg59; 61; 95; 271; 273-274
mainframe199
Malaysia Airlines System40
market1; 9-14; 19; 28-36; 39; 41; 49; 52-53; 71; 75; 78;83; 97-98; 100; 106; 108-111; 119; 127; 131-132; 136; 145-146; 148-149; 155-160; 167-176;179-191; 193; 196-197; 200-201; 204-208; 212-

297
214; 221; 226; 240-243; 245; 248; 250-257; 263-264; 266; 276; 282-283; 286-288
marketing9; 15-16; 18-20; 46; 83; 101; 119; 121; 134; 145;160; 191-192; 227; 229; 231; 233; 236
MasterCard36; 55; 65; 72; 257
McCarthy18-19; 107; 230
Metroline98; 102; 265
Mexicana Airlines40
MICE17-18
Microsoft46; 55; 120
Middle East111
Midway Airlines40
Midwest Express40
Minitel132; 216
Minoan116
mobile11; 52; 61; 70; 73; 78-79; 81; 83-84; 86; 94-95;132; 162; 164; 209; 225
mobile phone11; 52; 61; 70; 73; 78; 81; 83-84; 86; 94-95; 209;225
Moscow64; 91
MSN132
Mundicolor188
national9-10; 18; 50; 57-58; 61; 64; 66; 70; 79-80; 91;97; 99-100; 102-103; 105; 107-108; 135-137;147-148; 155-156; 162; 197; 210; 232-233; 276
National Express9; 88-89; 98; 102; 104-106; 108; 113; 212; 220;223; 236; 265
Neckerman179
Net9; 11-16; 18; 20-21; 24; 28-37; 41-42; 48; 50-51;53-55; 57; 59-60; 62-63; 65-67; 69-70; 73-75;77-79; 81-82; 84; 86-87; 90; 93-94; 97; 100-102;105-108; 115-116; 118-120; 122; 125; 129; 136;
139; 142-143; 145-146; 153; 155; 157; 159-161;167; 175-177; 179-185; 187; 189-195; 198-205;207-210; 212-218; 229; 232; 243; 256; 263; 276;280-281; 284; 286-288
Netherlands11; 59; 61; 95; 103; 126; 128-130; 158; 188;220; 236; 238; 271; 273-274
network102; 106; 111; 132; 161; 205; 225; 274
New Zealand15; 40; 91; 95; 229
Nielsen28; 214; 225; 230
Nordic10; 12; 16; 18; 24; 80; 94; 104; 108; 142; 167;173; 175; 189; 196; 207; 209-210; 216; 226;277-278; 282-283
Nordkapp101
North America11; 13; 23; 25-26; 29-30; 39-41; 60-61; 90; 92;113; 127; 212; 222; 225; 242-243; 245; 259; 263
Northern Ireland134; 273-274
Northwest40; 52-53; 233; 253
Northwest Airlines40; 233
Northwest alliance52
NORTRA139
Norway10-11; 24; 40; 42; 52-54; 59; 64; 95; 100-101;104; 111; 116; 126; 136-148; 158; 161; 173;185-187; 196-197; 199-200; 202-206; 220-222;236-238; 271; 274; 277-278; 282-284; 287-288
Norwegian10-11; 19; 52-54; 61; 78; 100-101; 136-143;145-147; 196-197; 199-200; 205; 208-209; 228;273-274; 283
Novasol155-156
Novell46; 231
NSB61; 78
NUA23; 28; 35; 37; 231
NUR176; 179
occupancy rate240; 271

298
OECD13-14; 227; 231
Olympic Airways40
Onni Vilkas101
Oracle113; 122
Orbis Travel282
Oslo101; 136; 142; 200; 277
P&O116-117
package tour1; 10; 12; 115; 167-168; 170-175; 177-179; 183-184; 190; 195-197; 200-203; 206; 208; 213; 220;282-284; 287
packages14; 18; 33-34; 102; 154; 156; 168-169; 173-175;177; 179-182; 185-186; 190-191; 193-195; 197;199-200; 202-203; 205; 231; 241-242; 255; 275;284
page view9; 62-63; 67-69; 90; 129; 190; 209; 214; 222;253
Pakistan International Airlines259
Paris87; 89; 93; 102; 142
passenger11; 40; 42; 45-46; 51; 53-54; 57-58; 60; 62; 67;69-71; 78; 87-89; 92-94; 97; 101; 105-106; 117;122-123; 208; 225; 236; 240; 243; 253; 263; 265
payment16; 18; 21; 36; 37; 41-43; 47; 50-51; 55; 68; 72-75; 81; 102; 117-118; 124; 135; 151; 154-156;175-176; 180-181; 183-184; 187; 189-190; 194;198-199; 204; 207-210; 215-216; 256-258; 276
payment card21; 36; 68; 72; 204; 215-216; 256-257
Pehmo150; 154; 237; 281
penetration9-11; 16; 21; 23-26; 28-29; 35; 50; 78; 81; 86;94-95; 99; 104; 135; 140; 145; 148; 154; 159;162; 199; 201-202; 209; 215-216; 242; 287-288
PhoCusWright15; 31-33; 35; 231
phone37; 50; 66; 73; 81; 83-84; 88; 94; 101; 119; 127;129; 141; 145; 148; 151; 161; 175; 182; 185;187; 198; 213; 217; 281
phone call37; 66; 73; 281
pilot51; 70; 176
Poland55; 59; 196-197; 203-204; 237; 282-283; 287-288
Polferries116
Polish55; 61; 103; 197; 199; 204; 287
Polish Rail61
population11; 16; 21; 24-25; 28-29; 35; 37; 41; 50; 95; 106;148; 154; 157; 198; 202; 204; 207; 215-216;226; 256-257; 264
Portland Direct169; 174; 180
Portugal40-41; 58-59; 95; 103; 238; 271; 273-274
Preussag AG189
Preview Travel46; 254
price18; 20; 45-47; 55; 65; 75; 90; 93; 97; 100; 105-106; 114; 123; 132; 135; 137-138; 151; 168;170-171; 183; 185; 190; 196; 199-200; 203; 205-206; 208-209; 212-213; 240; 243; 248; 267-268;277; 281; 283
PriceBuster55
principal36; 254; 265
privacy36-37
privatised59; 98
product14; 20; 31; 33; 49; 54; 66; 75; 81-82; 86; 150;154; 158-159; 163; 180; 198; 209; 214; 218; 254
projected29; 78; 153; 200; 250
public54; 68; 70; 79; 97-98; 133; 136; 182; 188; 216;225; 265
Qantas40
quality102; 141; 148; 199

299
rail14; 57; 59; 61-62; 64-66; 69-71; 75; 78-81; 83;86-91; 94; 97-98; 106; 232; 245; 277-278
Railtrack66; 87
railway11; 57; 59-62; 66-69; 73; 79-81; 83; 86; 88; 90-95; 98; 208; 233; 243; 267; 277
ratio20; 67; 75; 129; 174; 190; 202; 214-215
RDBMS122
regional18; 61; 78-79; 108; 133; 225; 263
reise@flugcenter178
Reisebaumeister184
relational database management systems122
Reno Air40
Rep. Ireland40; 59; 116; 169; 271
reservation11; 18; 42-43; 57; 73; 81; 89; 91; 93; 100-101;104; 108; 113-114; 118-120; 122-124; 127-129;131; 133; 135; 149; 151; 155; 158; 194; 205;220; 225; 231; 268; 275
revenue9; 11-12; 29; 32; 45-47; 49; 51-54; 67; 69; 71;80; 88; 93-94; 97-101; 104; 106-107; 110-111;113; 123; 129; 131; 133-134; 137-138; 143; 149;152; 155-159; 162; 165; 167-170; 188-189; 191;193; 196; 199-202; 205; 208; 210; 220-222; 240-241; 243; 250; 252-255; 263-266; 281
road14; 97; 216
Romania59; 104
room14; 34; 129-131; 137-138; 147; 204; 240; 245;250; 253; 255; 271; 278
room night14; 34; 129-131; 137-138; 240; 245; 250; 255
Royal Caribbean248
Royal Tours186; 282
Russia23; 60-61; 92; 149; 154
Russian
59-61; 150Ryanair
40Sabena
32; 40Sabre
14; 112; 254Saga
185; 282sales
9-12; 14-16; 18; 20-21; 23; 29-35; 37; 41-42; 44-55; 57; 66-67; 69-71; 74; 78-83; 86; 89; 92-94;100; 106; 108; 121; 127; 132; 134; 143; 145-146; 153; 156-159; 161; 164-165; 174-175; 179;183; 185; 191; 193-209; 212-214; 216-217; 219-223; 226; 228-229; 231; 235-236; 240-243; 248;250; 252-257; 265; 281; 284; 287-288
Sardinia116
SAS32; 40-41; 53-55; 71; 202; 217; 220; 233; 286
SASS163-165; 237
Saudi Arabian Airlines40
save55; 66; 69; 114; 174; 217
saving41; 50; 66; 69; 75; 82; 84-85; 119; 127; 287-288
savings9; 11; 21; 42; 52; 73; 75; 77; 82; 84-85; 94; 119;127; 160; 203; 213; 217; 287-288
SBB9; 67-70; 94
Scandinavia12; 67; 71-72; 74; 117; 141; 145; 159; 170; 181;185; 187; 195-196; 200-202; 204-206; 210; 212;243; 282-284; 288
Scandinavian19; 54-55; 115-117; 170; 173; 195; 198-199;203-204; 207; 287
Scandinavian Leisure Group170; 173; 195
Scandinavian Seaways116
Scandlines9; 115-116; 121-123; 209; 220; 222; 236; 245
ScanRail277-278
schedule43; 64; 76-78; 82; 84; 97; 264
scheduled

300
32; 34; 39-40; 45-46; 50-51; 53; 97-103; 106;108; 124; 197; 223; 240; 243; 263-265
Scotland102; 134-135; 227; 230; 265; 273-274
search16; 50; 68; 80; 87; 101; 116; 118; 129; 131; 139;154-155; 158; 160; 176; 178; 180; 182-183; 194;198; 204; 213
seat47; 50; 57; 61; 67-68; 73-75; 80-81; 86-89; 91;101; 107; 209
Secure Economic Transaction71
Secure Socket Layer117
security36-37; 65; 74; 116; 194; 203-204; 256; 276
server43-44; 60; 66; 72; 81; 113-114; 116; 120-121;123; 150; 164; 177; 214; 218; 281
service18; 30; 33; 36; 43; 47; 52; 62; 66; 69; 74; 78; 81;83; 87-90; 101-102; 106; 108; 111; 116; 124;164-165; 190; 198; 201-202; 209; 212-213; 216;220-221; 229; 231; 240; 243; 250-251; 254-255;262-263
SET36; 54; 66; 69; 71; 74; 194; 208; 256
Shinkansen91
Short Message Service70
Silja Line116
Simons Charter173; 187; 282
Singapore40; 95
Singapore Airlines40
Sixt111-112
SJ9; 70-78; 94; 99; 227; 232; 236; 286
Skytours169; 184
SLG12; 175; 181; 185-186; 195-196; 204; 282-283;288
Slovak59
Slovakian104
SMART72
smart card57
SMS70; 83
SMT Bus108
Smyril Line116
sncf59; 89
Sol & Strand155-156; 159-160; 213; 223; 237
Soltour188
South African Airways259
Southwest39; 40; 215; 253; 259
Southwest Airlines39-40; 259
Spain49-50; 59; 95; 103; 116; 131; 150; 188; 236;238; 259; 271; 273-274
Spanish39; 49; 113; 150
speedlink102
Spies185; 197; 232; 282; 288
SSL36-37; 65-66; 70; 74; 88; 105; 115-117; 124;181; 183; 194; 208; 256
SSR Reisen184
St.Petersburg101
Stagecoach98-99; 102; 265
Stamsund277
Star Tour170; 186; 282-283
Start156
Stena9; 115-121; 209; 220; 222; 236; 245; 269; 270
Stena Line9; 115-121; 209; 220; 222; 236; 245; 269-270
Stockholm57; 97; 121; 200; 228; 265; 277
Storstockholms Lokaltrafik AB, SL

301
97; 265strategic
83; 121; 133; 225Studiosus
178Suntours
187; 282Superfast Ferries
117survey
87; 99; 162; 226; 231Svenska Buss
98-100; 108; 220; 223; 236Swebus
99-100Sweden
9; 11; 24; 53; 58-59; 62; 71; 73; 78; 94-95; 97-101; 103-104; 108; 116-118; 121; 126; 131; 141;145; 153-154; 158; 170; 173; 185-187; 195-206;212-213; 215; 220-221; 223; 236-238; 258; 264-265; 271; 273-274; 277; 282-285; 287-288
Swedish52-54; 70-71; 73; 94-95; 99-100; 121-122; 150;185; 199-200; 202; 205-206; 225; 228-229; 236;265; 286
Swedish Rail70; 94-95; 202; 236
Swiss10; 12; 67; 69-70; 91; 94-95; 132; 147; 171-172;184-185; 193; 236; 275
Swiss Federal Railways67; 236
Swiss Rail69; 91; 94-95
Swissair40; 233
Switzerland59; 61; 69-70; 94-95; 103; 131; 134; 159; 161;167; 171-172; 175; 182; 184; 189; 192-194; 210;237-238; 271; 273-274
TA42-43
Tandem199
TAP Air Portugal40
telecom26; 132; 162; 165
telephone42; 47; 55; 61; 72-73; 81-82; 84-86; 116; 122;132; 135-136; 141; 151; 163; 175; 180; 192;197; 203; 205; 210; 236; 249; 275; 287
text TV51-52; 122
Thai Airways40
Thomas Cook169; 174-175; 182-183
Thomson12; 167-170; 173-175; 180; 186; 196; 232; 283
ticket14; 41; 45-47; 49; 51-52; 55; 57; 68-69; 71; 73-75; 78; 80-81; 86; 88-91; 104-105; 108; 123;176; 179; 183; 195; 199; 203; 245; 277-278
ticketless travel52; 54; 73
timetable9; 11; 60-61; 63-64; 66; 67; 70; 80; 84-85; 87;90-91; 93; 104
TIScover133-134; 201; 220-221; 231; 237
TISS95; 201; 220-221; 228; 237
Tjaereborg177-178; 185-186; 282; 288
Torget71-72; 75
tour10; 12; 33; 108; 156; 167-180; 182-185; 187-197; 200-206; 208; 210-213; 221; 223; 240; 242-243; 250; 255; 263; 282-284; 287-288
tour operator10; 12; 156; 167; 169-172; 174-180; 182-185;187-191; 193; 195-197; 200; 202; 204-205; 208;210-212; 221; 223; 240; 250; 283
tourism1; 9; 11; 13-21; 29; 30; 31; 32; 33; 34; 35; 36;53; 62; 75; 78; 83; 86; 97; 121; 133; 134; 150;151; 152; 154; 159; 161; 194; 200; 204; 207;208; 209; 212; 214; 215; 218; 219; 221; 222;225; 227; 228; 229; 230; 231; 233; 235; 240;250; 252
tourist13; 20; 52; 98-99; 125; 133; 154; 158-159; 161-162; 212; 225
Tower Air40
trading13; 17; 36; 200
train42; 52; 59; 61-62; 64-66; 69-74; 77-79; 82; 87-90; 92; 97-99; 104; 106; 113; 149; 203; 208;220; 222; 226; 233; 243; 260; 277-278

302
transaction41; 122; 190; 203; 245; 256
transactional14; 21; 75; 217-218
transactions37; 54; 105; 134; 256
transport14; 18; 34; 53; 57; 60-62; 66; 68-72; 74-75; 78-79; 81; 97-100; 105-106; 110; 113; 123; 147;154; 208; 236; 240; 243; 247; 263; 265
travel1; 9; 11; 13-16; 19-21; 23; 27; 29-36; 41; 43-44;47-50; 52-55; 61-66; 69; 73-75; 78-81; 83-84;86-92; 97-99; 101-102; 105-106; 108; 113-114;121; 125; 131-132; 149-152; 154-157; 159-160;167; 169-170; 174-181; 184; 186-187; 189-196;198; 200-202; 204-205; 207-210; 212-222; 225-230; 232; 240-243; 248; 250-255; 263; 276-278;281
travel agency14; 50; 61; 73; 149; 155; 175; 177-179; 222
travel agent21; 30; 33-34; 42; 48; 52; 54; 66; 69; 92; 101;113; 156-157; 159-160; 169-170; 174-180; 184;186-187; 190-193; 210; 213; 217; 248; 250; 253-254
traveller41; 55; 60; 71; 73; 80-81; 83; 86; 177-178
Travelocity232; 254
Travelplan188
TravelWeb215
TUI12; 75; 168; 170; 172; 175-176; 179-180; 182;184; 188-192; 215; 220; 222; 232; 237
Turkey13; 103; 111; 163
Turkish40
Turkish Airlines40
Turku101; 277
turnover69; 71; 93; 123; 170; 189; 219; 265
TV48; 51; 52; 70; 95; 122
TWA40
Tyrol133; 221
UIC57-59; 87; 93; 227; 233; 262
UK12; 16; 18; 24; 37; 40; 42; 58-59; 61-62; 66; 70;87-89; 95; 98-99; 102-106; 108; 113; 116-118;126; 129; 155; 165; 167-170; 174-175; 180-183;189; 193; 196; 207-210; 212; 216; 220; 226;231-232; 236; 238-239; 252; 254; 260; 264-265;267-268; 271; 273; 305
Ukraine 60-61uncertainty
27; 268United Airlines
40; 48; 233; 254United Kingdom
128; 274UNIX
122US
9; 11; 13-15; 18; 23; 26; 29-30; 32-37; 39-42;46-48; 50; 55; 60-61; 63; 78; 93; 97; 102; 106-113; 127; 131; 207-208; 212-215; 221-222; 226;229-230; 232; 240-243; 245; 248; 250-255; 259;263; 266-267; 271
US Airways40; 253
USA11; 14; 26; 28; 35-36; 42; 59; 90; 93; 95; 106;131-132; 138; 228; 238-239; 241; 263; 267-268;271
user16; 20; 29; 41; 43; 47; 67; 74-75; 77; 81; 84-85;87; 91; 93; 113-114; 118; 122; 136; 139; 141-142; 151; 156; 160; 163-164; 176-178; 180; 182;185-186; 190; 198-199; 202; 205; 212; 242; 268;281
user session67; 75; 77; 84; 85; 91; 93; 202; 205
value9-10; 30-31; 33-36; 42; 55; 83; 85; 94; 100; 108-109; 158-159; 168-169; 172; 199-200; 202; 214;240; 242; 250-252; 256; 263-264; 284; 286
ValuJet40
Varig40
VIA Rail42; 83; 91; 93-94
Videotex131-132
Ving10; 12; 53; 170; 185; 195-204; 215; 220; 222;237; 282-288

303
Virgin32; 40; 42; 59; 88-89
Virgin Atlantic40; 42
Virgin Trains88
virtual Atlantic crossing14
virtual auctions41
virtual call centre72; 198
Virtual Reality160; 191; 204
virtual shop203
virtual world33
Visa36-37; 65; 190; 256-257
visit67; 113; 129; 139; 177; 190-191; 213-214; 254
visitor73; 84; 129; 162
visits47; 50-51; 67; 72-73; 75; 93; 106; 138-139; 159;164; 190-191; 202; 205; 213; 235
Voyages Jules Verne182-183
VR160
W.Europe26; 32; 34-35; 108; 161; 207-209; 214; 221; 240;243; 251; 263-264; 271; 273; 275
Wales273-274
Web9-18; 20-21; 23-25; 28-29; 37; 39-41; 43; 45-52;54-55; 57; 59-62; 64-66; 68-75; 77; 79; 82; 84-85; 87-94; 99-105; 107; 111; 114-116; 118; 120-
123; 129; 131-136; 138-140; 142; 145-146; 148-152; 154; 156; 159-160; 162-165; 168-169; 174-178; 180-194; 198-205; 208-210; 212-215; 217-220; 227-233; 235; 241; 248; 254; 259; 261-262;266; 274; 276; 280-281; 288; 305
Western Europe9; 11; 13-16; 23-36; 39-41; 55; 58; 60-61; 101;103; 111; 127-128; 135-137; 162-163; 188; 207;211; 240-243; 245; 250-253; 259; 264; 271; 273
Windows150
World Offers47
World Tourism Organization (WTO)233; 271
World Wide Web23; 131
Worldspan14; 112
WWW1; 16; 24; 44; 50; 207; 230
www. 9; 11-15; 23-25; 27-29; 32-34; 36-37; 39-40; 42;
44; 46-49; 53-55; 57-64; 66-68; 70-71; 73-76;78; 80; 83; 87-91; 95; 97-99; 101-103; 105; 107-108; 111-113; 115-116; 118; 121-123; 127-132;134-136; 139-140; 148-149; 151; 154-155; 161-165; 169-170; 172-173; 175-192; 196-197; 199-202; 205; 212-217; 221; 225-233; 239; 241-242;248-250; 253-254; 256-257; 259; 262; 265-268;271-275; 277-278; 283; 285-286; 305
youth hostel11; 34; 126; 135-138; 140; 142; 147-148; 162;210; 242; 245; 274; 276-277
Yugoslavian104
Zurich70
Öger176; 178
Links to all the websites mentioned in this book can be found on the following web page:http://www.rcb.dk/UK/staff/chm/book1999.htm.