Study on Council of Europe Member States on Appeal and Supreme Courts Lengths of Proceedings (2011)
241
EUROPEAN COMMISSION FOR THE EFFICENCY OF JUSTICE (CEPEJ) Steering Group of the SATURN Centre for judicial time management (CEPEJ-SATURN) Study on Council of Europe Member States Appeal and Supreme Courts’ Lengths of Proceedings Report prepared by Marco Velicogna IRSIG-CNR
Transcript of Study on Council of Europe Member States on Appeal and Supreme Courts Lengths of Proceedings (2011)

EUROPEAN COMMISSION FOR THE EFFICENCY OF JUSTICE (CEPEJ)
Steering Group of the SATURN Centre for judicial ti me management (CEPEJ-SATURN)
Study on Council of Europe Member States Appeal and Supreme Courts’ Lengths of Proceedings
Report prepared by Marco Velicogna
IRSIG-CNR

2

3
Study on Council of Europe Member States Appeal and Supreme Courts’ Lengths of Proceedings
Marco Velicogna
IRSIG-CNR 06-06-2011
“The length of judicial proceedings has been recognised as a priority within the objectives of the Council of Europe relating to human rights and the rule of law.”1 According to the indications provided by Cepej, this report looks in depth at lengths of proceedings and time taken to process pending cases in second instance (appeal) courts and highest instance (supreme) courts on the basis of the information gathered in the course of the 2008-2010 evaluation of judicial systems carried out by Cepej.2 As the “European judicial systems study, Edition 2010 (data 2008) states: Efficiency and quality of justice” has analysed the answers regarding first instance courts. An analysis has been asked for this report in relation to second and highest instance courts. In particular it has been asked to focus the production and analysis on the following figures for second and (where possible) highest instance courts:
• 9.9 Clearance rate of civil litigious and non-litigious cases in 2008
• 9.10 Evolution of the Clearance rate of civil litigious cases between 2006 and 2008
• 9.11 Disposition time of litigious and non-litigious civil (and commercial) cases in 2008
• 9.12 MAP showing Disposition time and Clearance rate of litigious civil (and commercial) cases in 2008
• 9.21 Clearance rate of administrative law cases in 2008
• 9.22 Evolution of the Clearance rate of administrative law cases between 2006 and 2008
• 9.23 MAP showing Clearance rate and Disposition time of the total number of civil, commercial and administrative law cases in 2008
• 9.24 Evolution of the Clearance rates of the total number of civil, commercial and administrative law cases between 2006 and 2008
• 9.25 Number of incoming criminal cases (severe criminal offences) and misdemeanour cases (minor offences). Absolute figures and per 100.000 inhabitants, in 2008
• 9.26 Part of incoming criminal cases - severe criminal offences vs. misdemeanour cases in 2008
• 9.27 Clearance rate of criminal cases (severe criminal offences) and misdemeanour cases (minor offences) in 2008,
• 9.27 MAP showing Clearance rate of criminal cases (severe criminal offences) in 2008,
• 9.28 Clearance rate of the total number of criminal cases in 2008
• 9.31 Average length of proceedings for litigious divorce cases between 2004 and 2008 (possible only for second instance courts)
In addition, the report presents a synthesis of first, second and highest instance courts case load to give a global vision of the situation of CoE member states. In line with Cepej indications, the synthesis focus on Clearance rate and Disposition time (for total number of civil, commercial and administrative law cases, and for total number of criminal cases) and on length of proceedings (for litigious divorce cases, possible only for first and second instance courts). As any explorative analysis on complex matters, this work has evidenced several areas for further analysis. In particular, an interesting area of analysis that this report touches but does not investigate in depth and which could be the scope of further research activities is the comparison of Disposition time data with not only the Clearance rate the Clearance rate evolution. Another is the comparison of Disposition time data, 1 CEPEJ(2006)13 Compendium of “best practices” on time management of judicial proceedings, p.4. 2 Data is based on reports by member states, which were invited to appoint national correspondents, entrusted with the coordination of the replies to the Cepej Evaluation Scheme for their respective states.
4
Clearance rate the Clearance rate evolution data with data available on CoE justice systems resources and organization. Also, working on clusters of countries could lead to further interesting results and better understanding of the CoE justice systems and of their evolution trend. A limited example is provided in the Synthesis section, with the comparison of Disposition time and Clearance rate values for Total of civil, commercial and administrative law cases in 2008, in a cluster of seven States. In looking at the data, analysis and proposals for further developments, three funding principles governing proper time management of judicial proceedings should be always kept in mind, providing a reference framework: “1) the principle of balance and overall quality of the judicial system, 2) the need to have efficient measuring and analysis tools defined by the stakeholders through consensus, 3) the need to reconcile all the requirements contributing to a fair trial, with a careful balance between procedural safeguards, which necessarily entail the existence of lengths that cannot be reduced, and a concern for prompt justice.” 3
3 CEPEJ(2006)13 Compendium of “best practices” on time management of judicial proceedings, p.4.

5
Contents Study on Council of Europe Member States Appeal and Supreme Courts’ Lengths of Proceedings............... 3 1. Methodological introduction......................................................................................................................... 10
1.1. Responding states.................................................................................................................................................. 10 1.2. Data quality ............................................................................................................................................................ 10 1.3. Definitions .............................................................................................................................................................. 10 1.4. Indicators................................................................................................................................................................ 11 1.5. Comparing data...................................................................................................................................................... 12 1.6. Suggestions for looking at the key indicators ......................................................................................................... 13
2. Second and highest instance courts data analysis ..................................................................................... 15 2.1. Clearance rate of civil (and commercial) litigious and non-litigious cases in 2008 ................................................. 15
2.1.1. Second instance courts .................................................................................................................. 15 2.1.2. Highest instance courts .................................................................................................................. 17
2.2. Evolution of the Clearance rate of civil (and commercial) litigious cases between 2006 and 2008 ........................ 18 2.2.1. Second instance courts .................................................................................................................. 18 2.2.2. Highest instance courts .................................................................................................................. 20
2.3. Disposition time of litigious and non-litigious civil (and commercial) cases ............................................................ 23 2.3.1. Second instance courts .................................................................................................................. 23 2.3.2. Highest instance courts .................................................................................................................. 24
2.4. Disposition time and Clearance rate of litigious civil (and commercial) cases........................................................ 25 2.4.1. Second instance courts .................................................................................................................. 25 2.4.2. Highest instance courts .................................................................................................................. 27
2.5. Clearance rate of administrative law cases in 2008 ............................................................................................... 29 2.5.1. Second instance courts .................................................................................................................. 29 2.5.2. Highest instance courts .................................................................................................................. 29
2.6. Evolution of the Clearance rate of administrative law cases between 2006 and 2008 ........................................... 31 2.6.1. Second instance courts .................................................................................................................. 31 2.6.2. Highest instance courts .................................................................................................................. 34
2.7. Disposition time and Clearance rate of the total number of civil, commercial and administrative law cases .......... 37 2.7.1. Second instance courts .................................................................................................................. 37 2.7.2. Highest instance courts .................................................................................................................. 39
2.8 Evolution of the Clearance rates of the total number of civil, commercial and administrative law cases between 2006 and 2008 .............................................................................................................................................................. 41
2.8.1. Second instance courts .................................................................................................................. 41 2.8.2. Highest instance courts .................................................................................................................. 44
2.9. Criminal law cases (severe criminal offences) and misdemeanor cases (minor offences)..................................... 50 2.9.1. Second instance courts .................................................................................................................. 50 2.9.2. Highest instance courts .................................................................................................................. 52
2.10. Clearance rate of criminal cases (severe criminal offences) and misdemeanour cases (minor offences) in 200855 2.10.1. Second instance courts ................................................................................................................ 55 2.10.2. Highest instance courts ................................................................................................................ 56
2.11. Disposition time and Clearance rate of severe criminal cases ............................................................................. 58 2.11.1. Second instance courts ................................................................................................................ 58 2.11.2. Highest instance courts ................................................................................................................ 60
2.12. Clearance rate of the total number of criminal cases in 2008............................................................................... 62 2.12.1. Second instance courts ................................................................................................................ 62 2.12.2. Highest instance courts ................................................................................................................ 63
2.13. Average length of proceedings for litigious divorce cases at second instance courts between 2004 and 2008 ... 65 3. Synthesis ..................................................................................................................................................... 69
3.1. Total of civil, commercial and administrative law cases at first, second and highest instance courts..................... 69 3.1.1. Clearance rate ................................................................................................................................ 69 3.1.2. Disposition time .............................................................................................................................. 72 3.1.3. Confronting Clearance rate and Disposition time........................................................................... 75
3.2. Total criminal cases at first, second and highest instance courts........................................................................... 79 3.2.1. Clearance rate ................................................................................................................................ 79 3.2.2. Disposition time .............................................................................................................................. 82
3.3. Litigious divorce cases average length at first and second instance courts ........................................................... 85 3.4. Possible alert tools ................................................................................................................................................. 88
Annex 1 - Member State Data ......................................................................................................................... 89 Annex 2 - Text of the questions from the Cepej Evaluation Scheme related to the report ............................. 91 Annex 3 - Additional tables .............................................................................................................................. 94

6
Compilation of replies from the member States concerning the questionnaire on........................................ 142 Lengths of Judicial Proceedings.................................................................................................................... 142 Albania ........................................................................................................................................................... 144 Albania ........................................................................................................................................................... 144 Andorra .......................................................................................................................................................... 146 Armenia.......................................................................................................................................................... 148 Austria............................................................................................................................................................ 150 Azerbaijan...................................................................................................................................................... 152 Belgium.......................................................................................................................................................... 154 Bosnia and Herzegovina................................................................................................................................ 156 Bulgaria.......................................................................................................................................................... 158 Croatia ........................................................................................................................................................... 160 Cyprus............................................................................................................................................................ 162 Czech Republic.............................................................................................................................................. 164 Denmark ........................................................................................................................................................ 166 Estonia ........................................................................................................................................................... 168 Finland ........................................................................................................................................................... 170 France............................................................................................................................................................ 172 FYROMacedonia ........................................................................................................................................... 174 Georgia .......................................................................................................................................................... 176 Germany ........................................................................................................................................................ 178 Greece ........................................................................................................................................................... 180 Hungary ......................................................................................................................................................... 182 Iceland ........................................................................................................................................................... 184 Ireland............................................................................................................................................................ 186 Italy ................................................................................................................................................................ 188 Latvia ............................................................................................................................................................. 190 Liechtenstein.................................................................................................................................................. 192 Lithuania ........................................................................................................................................................ 194 Luxembourg................................................................................................................................................... 196 Malta .............................................................................................................................................................. 198 Moldova ......................................................................................................................................................... 200 Monaco .......................................................................................................................................................... 202 Montenegro.................................................................................................................................................... 204 Netherlands ................................................................................................................................................... 206 Norway........................................................................................................................................................... 208 Poland............................................................................................................................................................ 210 Portugal.......................................................................................................................................................... 212 Romania ........................................................................................................................................................ 214 Russian Federation........................................................................................................................................ 216 San Marino .................................................................................................................................................... 218 Serbia............................................................................................................................................................. 220 Slovakia ......................................................................................................................................................... 222 Slovenia ......................................................................................................................................................... 224 Spain.............................................................................................................................................................. 226 Sweden.......................................................................................................................................................... 228 Switzerland .................................................................................................................................................... 230 Turkey............................................................................................................................................................ 232 UK-England and Wales ................................................................................................................................. 234 UK-Northern Ireland....................................................................................................................................... 236 UK-Scotland................................................................................................................................................... 238 Ukraine........................................................................................................................................................... 240
7
Index of Figures Figure 1 - Clearance rate of civil litigious and non-litigious cases in 2008, in% Appeal courts.......................................... 16 Figure 2 - Clearance rate of civil litigious and non-litigious cases in 2008, in% Highest courts......................................... 17 Figure 3 - Evolution of the Clearance rate of civil litigious cases between 2006 and 2008, appeal courts, in % (ordered by
CR variation) ................................................................................................................................................... 18 Figure 4 - Evolution of the Clearance rate of civil litigious cases between 2006 and 2008, appeal courts, differential in %
........................................................................................................................................................................ 19 Figure 5 - Evolution of the Clearance rate of civil litigious cases between 2006 and 2008, appeal courts, in % and change
in % ................................................................................................................................................................. 20 Figure 6 - Evolution of the Clearance rate of civil litigious cases between 2006 and 2008, Highest courts, in % (ordered
by CR variation)............................................................................................................................................... 21 Figure 7 - Evolution of the Clearance rate of civil litigious cases between 2006 and 2008, Highest courts, change in %. 22 Figure 8 - Evolution of the Clearance rate of civil litigious cases between 2006 and 2008, Highest instance courts, in %
and change in %.............................................................................................................................................. 22 Figure 9 - Disposition time of litigious and non-litigious civil (and commercial) cases, appeal courts, in days .................. 23 Figure 10 - Disposition time of litigious and non-litigious civil (and commercial) cases, highest instance courts, in days . 24 Figure 11 - Disposition time and Clearance rate of litigious civil (and commercial) cases at 2nd instance courts in 2008 25 Figure 12 - Disposition time and Clearance rate of litigious civil (and commercial) cases at highest instance courts in
2008 ................................................................................................................................................................ 27 Figure 13 - Clearance rate of administrative law cases, appeal courts, in 2008................................................................ 29 Figure 14 - Clearance rate of administrative law cases, highest instance courts, in 2008................................................. 30 Figure 15 - Evolution of the Clearance rate of administrative law cases between 2006 and 2008, appeal courts, in %
(ordered by CR variation) ................................................................................................................................ 31 Figure 16 - Evolution of the Clearance rate of administrative law cases between 2006 and 2008, appeal courts, change in
% ..................................................................................................................................................................... 32 Figure 17 - Evolution of the Clearance rate of administrative law cases between 2006 and 2008, second instance courts,
in % and change in %...................................................................................................................................... 33 Figure 18 - Evolution of the Clearance rate of administrative law cases between 2006 and 2008, highest instance courts,
in % (ordered by CR variation) ........................................................................................................................ 34 Figure 19 - Evolution of the Clearance rate of administrative law cases between 2006 and 2008, highest instance courts,
change in %..................................................................................................................................................... 35 Figure 20 - Evolution of the Clearance rate of administrative law cases between 2006 and 2008, highest instance courts,
in % and change in %...................................................................................................................................... 36 Figure 21 - Disposition time and Clearance rate of total number of civil, commercial and administrative law cases at
second instance courts in 2008 ....................................................................................................................... 37 Figure 22 - Disposition time and Clearance rate of total number of civil, commercial and administrative law cases at
highest instance courts in 2008 ....................................................................................................................... 39 Figure 23 - Evolution of the Clearance rates of the total number of appeal courts civil, commercial and administrative law
cases between 2006 and 2008, in % (ordered by CR variation) ..................................................................... 41 Figure 24 - Evolution of the Clearance rates of the total number of appeal courts civil, commercial and administrative law
cases between 2006 and 2008, in %............................................................................................................... 42 Figure 25 - Evolution of the Clearance rates of the total number of appeal courts civil, commercial and administrative law
cases between 2006 and 2008, change in %.................................................................................................. 43 Figure 26 - Evolution of the Clearance rate of the total number of civil, commercial and administrative law cases between
2006 and 2008, appeal courts, in % and change in % .................................................................................... 44 Figure 27 - Evolution of the Clearance rates of the total number of highest instance courts civil, commercial and
administrative law cases between 2006 and 2008, in % (ordered by CR variation) ........................................ 45 Figure 28 - Evolution of the Clearance rates of the total number of highest instance courts civil, commercial and
administrative law cases between 2006 and 2008, in % ................................................................................. 46 Figure 29 - Evolution of the Clearance rates of the total number of highest instance courts civil, commercial and
administrative law cases between 2006 and 2008, change in %..................................................................... 48 Figure 30 - Evolution of the Clearance rate of the total number of civil, commercial and administrative law cases between
2006 and 2008, highest instance courts, in % and change in % ..................................................................... 49 Figure 31 - Clearance rate of criminal cases (severe criminal offences) in 2008, in second instance courts.................... 55 Figure 32 - Clearance rate of misdemeanour cases (minor offences) in 2008, in second instance courts........................ 55 Figure 33 - Clearance rate of criminal cases (severe criminal offences) and misdemeanour cases (minor offences) in
2008, in second instance (appeal) courts........................................................................................................ 56 Figure 34- Clearance rate of criminal cases (severe criminal offences) in 2008, in Highest instance courts .................... 57 Figure 35 - Clearance rate of misdemeanour cases (minor offences) in 2008, in Highest instance courts ....................... 57 Figure 36 - Clearance rate of criminal cases (severe criminal offences) and misdemeanour cases (minor offences) in
2008, in highest instance courts ...................................................................................................................... 57 Figure 37 - Disposition time and Clearance rate of severe criminal cases at second instance courts in 2008.................. 58 Figure 38 - Disposition time and Clearance rate of severe criminal cases at highest instance courts in 2008.................. 60 Figure 39 - Clearance rate of the total number of criminal cases at second instance courts in 2008, %........................... 62 Figure 40 - Clearance rate of the total number of criminal cases at second instance courts in 2008, % compared with
incoming cases per 100.000 inhabitants ......................................................................................................... 63 Figure 41 - Clearance rate of the total number of criminal cases at highest instance courts in 2008, %........................... 64 Figure 42 - Clearance rate of the total number of criminal cases at highest instance courts in 2008, % compared with
incoming cases per 100.000 inhabitants ......................................................................................................... 65

8
Figure 43 - Second instance court litigious divorce proceedings average length (in days) in 2004, 2006 and 2008......... 66 Figure 44 - Second instance court litigious divorce proceedings average length (in days) in 2004 and 2008................... 66 Figure 45 - Second instance court litigious divorce proceedings average length (in days) in 2006 and 2008................... 67 Figure 46 - Average length of proceedings for litigious divorce cases at second instance courts between 2004 and 2008,
in days............................................................................................................................................................. 68 Figure 47 - First, second and highest instance courts total of civil, commercial and administrative law cases Clearance
rates (2008)..................................................................................................................................................... 70 Figure 48 - Aggregated first, second and highest instance courts total of civil, commercial and administrative law cases
Clearance rates map (2008)............................................................................................................................ 72 Figure 49 - First, second and highest instance courts total of civil, commercial and administrative law cases (2008)
Disposition time (in 27 states) ordered by 1s instance courts Disposition time ............................................... 73 Figure 50 - First, second and highest instance courts total of civil, commercial and administrative law cases (2008)
Disposition time (in 27 states) ordered by 1s+2nd instance courts Disposition time ....................................... 73 Figure 51 - First, second and highest instance courts total of civil, commercial and administrative law cases (2008)
Disposition time (in 27 states) ordered by 1s+2nd+3rd instance courts Disposition time................................ 73 Figure 52 - First, second and highest instance courts total of civil, commercial and administrative law cases (2008)
Disposition time............................................................................................................................................... 74 Figure 53 - Clearance rate and Disposition time for Total of civil, commercial and administrative law cases in 2008, in first
instance courts ................................................................................................................................................ 76 Figure 54 - Clearance rate and Disposition time for Total of civil, commercial and administrative law cases in 2008, in
second instance courts.................................................................................................................................... 77 Figure 55 - Clearance rate and Disposition time for Total of civil, commercial and administrative law cases in 2008, in
highest instance courts.................................................................................................................................... 78 Figure 56 - First, second and highest instance courts total criminal cases Clearance rates (2008) .................................. 80 Figure 57 – Aggregated first, second and highest instance courts total criminal cases Clearance rates map (2008)....... 82 Figure 58 - First, second and highest instance courts total criminal cases (2008) Disposition time (in 25 states) ordered
by 1s instance courts Disposition time ............................................................................................................ 83 Figure 59 - First, second and highest instance courts total criminal cases (2008) Disposition time (in 25 states) ordered
by 1s+2nd instance courts Disposition time .................................................................................................... 83 Figure 60 - First, second and highest instance courts total criminal cases (2008) Disposition time (in 25 states) ordered
by 1s+2nd+3rd instance courts Disposition time ............................................................................................. 83 Figure 61 - First, second and highest instance courts total criminal cases (2008) Disposition time.................................. 84 Figure 62 - First and second instance courts litigious divorce cases (2008) average length ordered by 1st instance courts
average length................................................................................................................................................. 86 Figure 63 - First and second instance courts litigious divorce cases (2008) average length ordered by 1st+2nd instance
courts average length...................................................................................................................................... 86 Figure 64 - First and second instance courts litigious divorce cases (2008) average length ordered by state name........ 87
9
Index of Tables Table 1 - Second instance courts 2008 civil and commercial litigious cases incoming, resolved and pending (on 31
December), Clearance rate, case turnover ratio and Disposition time ............................................................ 26 Table 2 - Highest instance courts 2008 civil and commercial litigious cases incoming, resolved and pending (on 31
December), Clearance rate, case turnover ratio and Disposition time ............................................................ 28 Table 3 - Second instance courts 2008 Total of civil, commercial and administrative law cases: incoming, resolved and
pending (on 31 December), Clearance rate, case turnover ratio and Disposition time.................................... 38 Table 4 - Highest instance courts 2008 Total of civil, commercial and administrative law cases: incoming, resolved and
pending (on 31 December), Clearance rate, case turnover ratio and Disposition time.................................... 40 Table 5 - Number of incoming criminal cases (severe criminal offences) and misdemeanour cases (minor offences) in
second instance (appeal) courts. Absolute figures and per 100.000 inhabitants, in 2008 ............................... 51 Table 6 - Part of second instance (appeal) courts incoming criminal cases (severe criminal offences) vs. misdemeanour
cases (minor offences) criminal in 2008 .......................................................................................................... 52 Table 7 - Number of incoming criminal cases (severe criminal offences) and misdemeanour cases (minor offences) in
highest instance courts. Absolute figures and per 100.000 inhabitants, in 2008 ............................................. 53 Table 8 - Part of highest instance courts incoming criminal cases (severe criminal offences) vs. misdemeanour cases
(minor offences) criminal in 2008 .................................................................................................................... 54 Table 9 - Second instance courts 2008 Criminal cases (severe criminal offences): incoming, resolved and pending (on 31
December), Clearance rate, case turnover ratio and Disposition time ............................................................ 59 Table 10 - Highest instance courts 2008 Criminal cases (severe criminal offences): incoming, resolved and pending (on
31 December), Clearance rate, case turnover ratio and Disposition time ....................................................... 61 Table 11 - Average length of proceedings for litigious divorce cases at second instance courts between 2006 and 200867 Table 12 Average length of proceedings for litigious divorce cases at second instance courts between 2004 and 2008 . 68 Table 13 - First, second and highest instance courts total of civil, commercial and administrative law cases (2008)
Clearance rate synthesis table ........................................................................................................................ 69 Table 14 - First, second and highest instance courts total of civil, commercial and administrative law cases Clearance
rates (2008)..................................................................................................................................................... 71 Table 15 - First, second and highest instance courts total of civil, commercial and administrative law cases (2008)
Disposition time (in days) synthesis table (27 states)...................................................................................... 73 Table 16 - First, second and highest instance courts total of civil, commercial and administrative law cases (2008)
Disposition time (in days) ................................................................................................................................ 75 Table 17 - Clearance rate and Disposition time for Total of civil, commercial and administrative law cases in 2008, in first
instance courts ................................................................................................................................................ 76 Table 18 - Clearance rate and Disposition time for Total of civil, commercial and administrative law cases in 2008, in
second instance courts.................................................................................................................................... 77 Table 19 - Clearance rate and Disposition time for Total of civil, commercial and administrative law cases in 2008, in
highest instance courts.................................................................................................................................... 78 Table 20 - First, second and highest instance courts total criminal cases (2008) Clearance rate synthesis table ............ 79 Table 21 - First, second and highest instance courts total criminal cases Clearance rates (2008) ................................... 81 Table 22 - First, second and highest instance courts total criminal cases (2008) Disposition time (in days) synthesis table
(25 states) ....................................................................................................................................................... 83 Table 23 - First, second and highest instance courts total criminal cases (2008) Disposition time (in days)..................... 85 Table 24 - First and second instance courts litigious divorce cases (2008) average length (in days) ............................... 87 Table 25 - Clearance rate and Clearance rate variation possible alert tool ....................................................................... 88

10
1. Methodological introduction 4 The report builds upon the methodological choices made by Cepej for its European Judicial Systems studies and on the definitions, indications and distinctions provided in particular in the European Judicial Systems, Edition 2010 (data 2008): Efficiency and quality of justice.
1.1. Responding states By May 2010, 45 member states ( had participated in the Cepej Evaluation process Edition 2010: Albania , Andorra , Armenia , Austria , Azerbaijan , Belgium , Bosnia and Herzegovina , Bulgaria , Croatia , Cyprus , Czech Republic , Denmark , Estonia , Finland , France , Georgia , Greece , Hungary , Iceland , Ireland , Italy , Latvia , Lithuania , Luxembourg , Malta , Moldova , Monaco , Montenegro , the Netherlands , Norway , Poland , Portugal , Romania , the Russian Federation , San Marino , Serbia , Slovakia , Slovenia , Spain , Sweden , Switzerland , "the former Yugoslav Republic of Macedonia" , Turkey , Ukraine and the United Kingdom (UK-England and Wales, UK-Northern Ireland and UK-Scotland) , for a total of 47 cases. For readability reasons, reference is made to the 47 cases with the term states instead of using the phrasing “states or entities” adopted in the European Judicial Systems, Edition 2010 (data 2008): Efficiency and quality of justice study.
1.2. Data quality As stated in the European Judicial Systems, Edition 2010 study, also here quality of the figures depends “on the type of questions asked in the data collection instrument, the definitions used by the countries, the system of registration in the countries, the efforts supplied by national correspondents, the national figures available to them and the manner in which the figures have been processed and analysed. In spite of the improvements resulting from previous experiences, it is reasonable to assume that some variations occurred when national correspondents interpreted the questions for their country and tried to match the questions to the information available to them. The reader should bear this in mind and always interpret the statistical figures given in the light of their attached narrative comments and the more detailed explanations given in the individual national replies”.5
1.3. Definitions Cepej European judicial systems data collection scheme makes a distinction between civil (and commercial) litigious cases and non-litigious cases, Enforcement cases, Land registry cases, Business register cases, Administrative law cases, other, Other, Criminal cases (severe criminal offences) and Misdemeanour (minor offences cases). Such categories cannot always be easily identified in the different judicial systems which take part in the data collection. For example, as indicated in a note of Cepej Scheme for evaluating judicial systems (2009-20010 cycle), “For the criminal law cases there may be a problem of classification of cases between severe criminal law cases and misdemeanour cases. Some countries might have other ways of addressing misdemeanour offences (for example via administrative law procedure)”. 6 However, there are some definitions from the Cepej “Compendium of ‘best practices’ on time management of judicial proceedings” glossary which have been followed in this document:
Backlog − number of cases that exceed the “allowed duration” (see also page 75 "European Judicial Systems – Edition 2006"). This term is frequently used as a synonym of delay and it can be quite ambiguous. The establishment of timeframes makes it possible to adopt a more precise definition of backlog, as the number or percentage of cases not decided within an established timeframe (or time standard). Caseload − it is the number of cases that a court has to deal with in a period of time. It is expressed by the sum of pending cases plus incoming cases in a certain period of time.
4 Based on the European Judicial Systems, Edition 2010 (data 2008): Efficiency and quality of justice study 5 European Judicial Systems, Edition 2010 (data 2008): Efficiency and quality of justice, p.8. 6 European Judicial Systems, Edition 2010 (data 2008): Efficiency and quality of justice, p.353.

11
Pending cases − it is the number of cases that still have to be dealt with by the court in a period of time. It may be expressed in numbers (e.g. Pending cases by January 1) or in a percentage (e.g. Percentage of pending cases of more than 3 years). Timeframe − a period of time during which an action occurs or will occur. Timeframes are targets to be used as inter-organisational means to pursue the timeliness of court proceedings. Time limit − a limit of time within which something must be done. In judicial proceedings, this term indicate mainly the limits established by procedural rules. These limits can be mandatory and with consequences in a specific proceeding (e.g. the prohibition of presenting evidences after a specific time) or simply intimation without consequence (as when a judge should write a sentence within a week after the decision but nothing happens if the provision is not fulfilled). On the contrary timeframes should not be specified by procedural rules. They are just inter-organisational goals with consequences at this level. Time standard − time required to complete a task. The time allowed carrying out a production task in a standard costing system. It may be expressed as the standard time allowed or alternatively, when expressed in standard hours, as the output achieved. From an organisational perspective a time standard is more rigid and focused on single activities than timeframes. However it is extensively adopted by the Anglo-Saxon literature with a meaning similar to timeframe. Therefore, it is possible to use time standard and timeframe as synonyms. Workload − it may be defined as the whole work that a court deals with, while the caseload only refers to the number of cases that a court deals with.
1.4. Indicators In line with the indications provided by Cepej and to the methodological choice made in the European judicial systems, the present report adopts the following indicators of tendency (European judicial systems study, Edition 2010 (data 2008) definitions are used): • Average : “represents the arithmetic mean which is the outcome of dividing the sum of the observations
of a distribution (data supplied) by the total number of countries which have indicated the information included into the distribution. The average is sensitive to extreme values (too high or too low)”. 7
• Median : “represents the middle point of a set of ordered observations (ranked according to an increasing or decreasing order). The median is the value that divides the data supplied by the countries concerned into two equal groups so that 50% of the countries are above this value and 50% are below it. When there is an odd number of observations, the median is the value that is just in the middle of these two groups. The median is sometimes better to use than the average, as it is less sensitive to extreme values. The effect of the extreme values is then neutralised”. 8
In addition to the average and the median, minimum and maximum values : • Minimum: “the lowest recorded value” 9 for a given variable. • Maximum: “the highest recorded value” 10 for a given variable. The Cepej has also adopted performance indicators of courts. The Clearance rate (CR): is a “relationship between the new cases and completed cases within a period, in percentage”.11 In this report is calculated as the number of resolved cases for a given year divided by the number of incoming cases for the same year, expressed as a percentage:
resolved casesClearanceRate(%) x100
incoming cases=
“A Clearance rate close to 100 % indicates the ability of the court or of a judicial system to resolve more or less as many cases as the number of incoming cases within the given time period. A Clearance rate above
7 European Judicial Systems, Edition 2010 (data 2008): Efficiency and quality of justice, p.10. 8 European Judicial Systems, Edition 2010 (data 2008): Efficiency and quality of justice, p.10. 9 European Judicial Systems, Edition 2010 (data 2008): Efficiency and quality of justice, p.10. 10 European Judicial Systems, Edition 2010 (data 2008): Efficiency and quality of justice, p.10. 11 "GOJUST" Guidelines (CEPEJ(2008)11), p. 10.
12
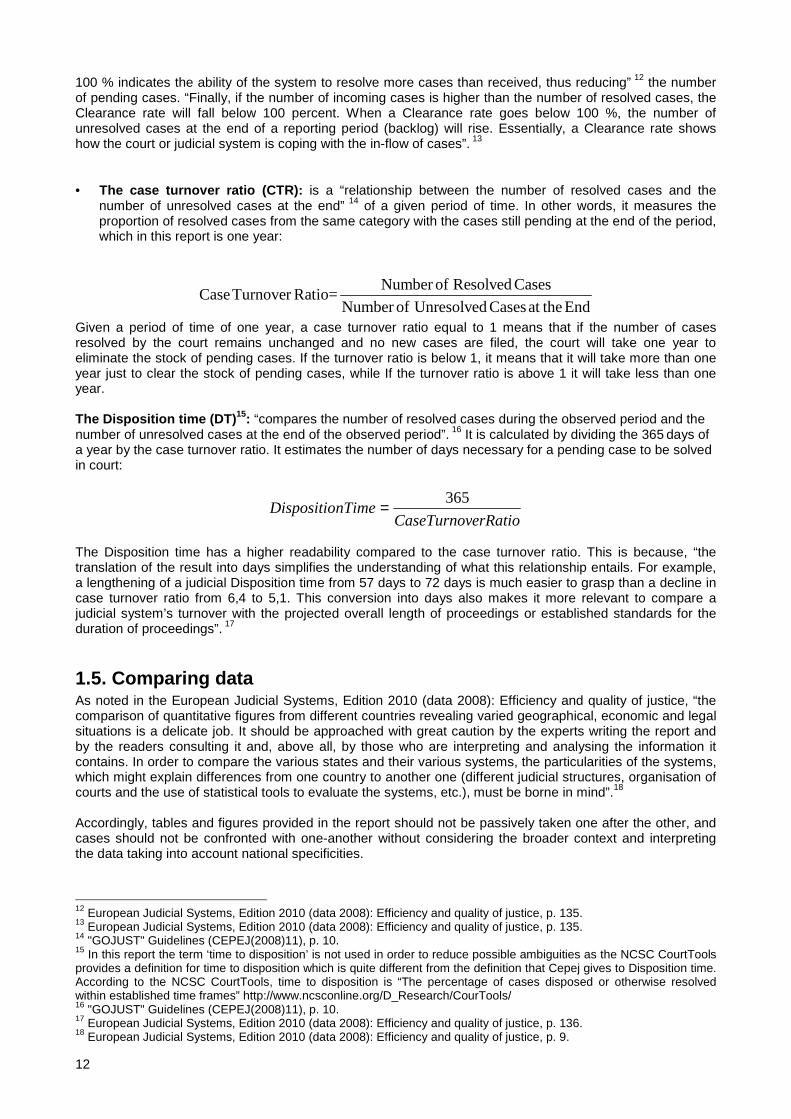
100 % indicates the ability of the system to resolve more cases than received, thus reducing” 12 the number of pending cases. “Finally, if the number of incoming cases is higher than the number of resolved cases, the Clearance rate will fall below 100 percent. When a Clearance rate goes below 100 %, the number of unresolved cases at the end of a reporting period (backlog) will rise. Essentially, a Clearance rate shows how the court or judicial system is coping with the in-flow of cases”. 13 • The case turnover ratio (CTR): is a “relationship between the number of resolved cases and the
number of unresolved cases at the end” 14 of a given period of time. In other words, it measures the proportion of resolved cases from the same category with the cases still pending at the end of the period, which in this report is one year:
Number of Resolved CasesCaseTurnover Ratio=
Number of Unresolved Casesat theEnd Given a period of time of one year, a case turnover ratio equal to 1 means that if the number of cases resolved by the court remains unchanged and no new cases are filed, the court will take one year to eliminate the stock of pending cases. If the turnover ratio is below 1, it means that it will take more than one year just to clear the stock of pending cases, while If the turnover ratio is above 1 it will take less than one year. The Disposition time (DT) 15: “compares the number of resolved cases during the observed period and the number of unresolved cases at the end of the observed period”. 16 It is calculated by dividing the 365 days of a year by the case turnover ratio. It estimates the number of days necessary for a pending case to be solved in court:
erRatioCaseTurnovnTimeDispositio
365=
The Disposition time has a higher readability compared to the case turnover ratio. This is because, “the translation of the result into days simplifies the understanding of what this relationship entails. For example, a lengthening of a judicial Disposition time from 57 days to 72 days is much easier to grasp than a decline in case turnover ratio from 6,4 to 5,1. This conversion into days also makes it more relevant to compare a judicial system’s turnover with the projected overall length of proceedings or established standards for the duration of proceedings”. 17
1.5. Comparing data As noted in the European Judicial Systems, Edition 2010 (data 2008): Efficiency and quality of justice, “the comparison of quantitative figures from different countries revealing varied geographical, economic and legal situations is a delicate job. It should be approached with great caution by the experts writing the report and by the readers consulting it and, above all, by those who are interpreting and analysing the information it contains. In order to compare the various states and their various systems, the particularities of the systems, which might explain differences from one country to another one (different judicial structures, organisation of courts and the use of statistical tools to evaluate the systems, etc.), must be borne in mind”.18 Accordingly, tables and figures provided in the report should not be passively taken one after the other, and cases should not be confronted with one-another without considering the broader context and interpreting the data taking into account national specificities.
12 European Judicial Systems, Edition 2010 (data 2008): Efficiency and quality of justice, p. 135. 13 European Judicial Systems, Edition 2010 (data 2008): Efficiency and quality of justice, p. 135. 14 "GOJUST" Guidelines (CEPEJ(2008)11), p. 10. 15 In this report the term ‘time to disposition’ is not used in order to reduce possible ambiguities as the NCSC CourtTools provides a definition for time to disposition which is quite different from the definition that Cepej gives to Disposition time. According to the NCSC CourtTools, time to disposition is “The percentage of cases disposed or otherwise resolved within established time frames” http://www.ncsconline.org/D_Research/CourTools/ 16 "GOJUST" Guidelines (CEPEJ(2008)11), p. 10. 17 European Judicial Systems, Edition 2010 (data 2008): Efficiency and quality of justice, p. 136. 18 European Judicial Systems, Edition 2010 (data 2008): Efficiency and quality of justice, p. 9.

13
Furthermore, the report aims to give an overview of the Europe member states lengths of proceedings situation with a specific focus on Appeal and Supreme Courts data, which were not analyzed in the European Judicial Systems, Edition 2010 (data 2008): Efficiency and quality of justice. It is “not to rank the best judicial systems in Europe, which would be scientifically inaccurate and would not be a useful tool for the public policies of justice. Indeed, comparing does not mean ranking”.19 As highlighted by Marco Fabri in his discussion paper for the 9th meeting of the Steering Committee of the Saturn Centre for Judicial Time Management of the Commission for the Efficiency of Justice of the Council of Europe, 20comparisons can take three forms:
• comparisons across time, • comparisons across countries, • comparisons across time and countries.
In the absence of a common data dictionary, even considering the effort made by Cepej through the Explanatory note of the European Judicial Systems evaluation scheme, comparisons must be done cautiously in order to deal with the “difficulties to make meaningful and not misleading comparisons about judicial time management across … [time and across] member States”.21 An example of this difficulty is provided by the complexity of clearly distinguish between litigious and non litigious cases. As Ronald Eshuis wrote to Frans van der Doelen when gathering data for the CEPEJ report in 2010 “There is no clear-cut definition of ‘litigious’ cases in the Cepej report. It is clarified by a few examples of non-litigious cases, consistent with what I remember from the discussions regarding the first Cepej report. The general idea was to count only real, contested cases, as ‘litigious’. … In my educated guess … I did include contested cases terminated by a friendly settlement. The examples in the Cepej report are not clear on whether they should or should not be included. I did include these cases, because they seem consistent with the general idea regarding ‘litigious cases’: there are conflicting parties, they start a court procedure to resolve the conflict, in which the conflict is resolved. … I wonder if the reports of the various countries are consistent in the way friendly settlements (and / or other terminations without a judicial decision) are counted… [furthermore, it] seems to me that the concept of ‘litigious’ / ‘non-litigious’ cases can only relate to terminated cases: only after termination of the case we know if it was defended and in which way it settled. We can not tell whether a new incoming case will be defended or how it will settle…” 22 Another example of this problem is the “impressive diversity in the definition of small claim - apparently a simple concept-”. As confronting the monetary value of a small claim in 2006 and 2008 (Q48) shows, differences are not just cross countries (in 2008 small claims limit values provided by the responding states ranges between a minimum of 74€ in Lithuania to a maximum of 50.000€ in San Marino ), but there are also considerable changes “in what some countries consider a small claim in 2006 and in 2008”.23 Finally, when looking at ‘comparisons across time’ presented in this report, it should be considered that: 1) comparisons are based on just two time sets (2008 and 2006),24 and 2) data do not consider the entire time period as 2007 data are not available. So, also for this reason relevant information could be missing and emerging trends could be misleading. While the first issue is going to be resolved with the future repetitions of the evaluation exercise, to solve the second it could be useful if Cepej could gather a limited subset of the quantitative data on a yearly basis.
1.6. Suggestions for looking at the key indicators In line with the choices made for the European Judicial Systems studies, with the mandate from the CEPEJ Secretariat and the indications of the Steering Group of the SATURN Centre for judicial time management, this work has a descriptive stance. The intent is to provide the reader with a useful tool to better grasp and confront the data and court systems output indicators such as Clearance rate and Disposition Time. At the same time, during the discussion of the present document at the 9th meeting of the Steering Committee of the Saturn Centre it emerged the need to have a short paragraph to provide some suggestions on how it could be possible to read the main indicators and look at their combined meaning. Indeed, the observation of 19 European Judicial Systems, Edition 2010 (data 2008): Efficiency and quality of justice, pp. 9-10. 20 (CEPEJ-SATURN(2011)6), p.3. 21 (CEPEJ-SATURN(2011)6), p.2. 22 E-mail text reported in F.C.J. van der Doelen “The plumber and his tools: Scrutinizing judicial budgets, length of divorce proceedings and workload of courts in the Netherlands”, Presentation at the CEPEJ plenary meeting, 9 December 2010, p. 7-8; italics in the original. 23 (CEPEJ-SATURN(2011)6), p.4. 24 With the exception of average length of proceedings for litigious divorce cases, where also 2004 data is analyzed

14
Clearance rate and Disposition Time, especially when done with a broader vision to other basic data such as absolute and per capita incoming, resolved and pending, can allow the reader “to come up with instructive questions and leads to a better understanding of how a judicial system operates and what challenges and obstacles it faces. … [These key indicators can also] be used to identify conspicuous trends and compare judicial performance in key areas between various judicial systems or courts”. 25 Quantitative values provided should be considered indicative and to be further tested maybe also through the involvement of the Network of Pilot Courts. A way to proceed could be to look firstly at the Disposition Time. As defined in section 1.4. Disposition Time measures “how frequently a judicial system (or a court) turns over the cases received – that is, how long it takes to resolve a case type”. 26 Furthermore, it indirectly provides “the answer to one of the questions most raised within a judicial system – what is the overall length of proceedings”.27 Disposition Time of a specific category of cases can be observed for each court instance (first, second and highest instance courts). Firstly looking at the absolute values: is the Disposition Time at each court instance below 100, 200 or 300 days? Is it above one, two or even three years? Then comparing the values to the average and median values of the same instance for that category of cases. These data can already provide an indication as far as the court instance(s) where problems exists and where attention should be focused. Disposition time values can also be looked at aggregated level (1st, 1st + 2nd and 1st + 2nd + 3rd level) to get an indication of how long it could be expected for a case to be disposed of if it is settled at first instance court level or if it is appealed at second or highest instance courts. The data can be compared to the average and median values for that category of cases. It can be also worth analysing both the absolute and the relative consistency (in terms of incoming and pending cases at each court instance) of each category in order to assess the quantitative impact of the Disposition Time values. The fact that for example second instance incoming cases are less than 5% or more than 10% of first instance incoming cases is an element that could be relevant in order to assess the overall Disposition Time a court user should expect. Once Disposition Time has been observed, the next step could be to look at it considering the Clearance Rate values. In this way it is possible to confront the DT “present situation” in light to what is happening to the pending cases: if they are increasing, and therefore there can be the expectancy of a growing DT or if they are decreasing, and therefore it could be expected for the DT to diminish. If the Disposition Time is considered good, a CR value slightly below 100% should be considered not worrisome (i.e. CR≥95%) as small fluctuations above and below 100% are consistent with a long period stability of the CR around 100%. Lower level of CR should be considered as an alert as will result in more consistent increases of pending cases. If the Disposition Time is not considered good, for example exceeding the year, or it is considered bad, exceeding the three years, a Clearance rate below 100% shows that the situation is worsening, while a value around 100% means that the situation is staying negative. Only a value above 100% shows that the situation is improving. In addition to the Clearance rate, this report also provides data and figures on the Clearance rate variation. Indeed, Clearance rate variation can also be taken into account when assessing the “present situation” and future expectancy. A possible alert tool considering Clearance rate and Clearance rate variation has been proposed in Section 3.4. Again, it should be stated that the quantitative values provided should be considered indicative and they need to be further tested.
25 A. Hodzic and G. Stawa “What can be said on clearance rate and disposition time (and some more relations)?” Presentation at the CEPEJ plenary meeting, 9 December 2010, p.2. 26 A. Hodzic and G. Stawa “What can be said on clearance rate and disposition time (and some more relations)?” Presentation at the CEPEJ plenary meeting, 9 December 2010, p.1. 27 A. Hodzic and G. Stawa “What can be said on clearance rate and disposition time (and some more relations)?” Presentation at the CEPEJ plenary meeting, 9 December 2010, p.1.

15
2. Second and highest instance courts data analysis It is in this section that the analysis carried out for first instance courts data in chapter 9 of the European Judicial Systems, Edition 2010 (data 2008): Efficiency and quality of justice study and in particular the figures indicated by the Cepej Secretariat have been analyzed for second (and where possible) for highest instance courts. Whenever deemed appropriate, additional tables and data have been provided in order to improve the reader access to useful information.
More in detail, this section analyses through descriptions, tables and figures, the second and highest instance courts Clearance rate, Evolution of the Clearance rate, Disposition time, and confronts Disposition time and Clearance rate for 1) civil litigious and non-litigious civil and commercial cases 2) administrative law cases. It also analyses second and highest instance courts criminal cases (severe criminal offences) and misdemeanour cases (minor offences): the number of incoming through absolute figures, per 100.000 inhabitants, and as part of total incoming criminal cases and the Clearance rate; confronts Disposition time and Clearance rate of severe criminal cases and analyses the Clearance rate of the total number of criminal cases. Finally, it analyses the average length of proceedings for litigious divorce cases between 2004 and 2008 in second instance courts.
2.1. Clearance rate of civil (and commercial) litigious and non-litigious cases in 2008
2.1.1. Second instance courts The figure below presents Clearance rate in second instance courts of civil and commercial litigious (29 states) and non litigious (10 states) cases.

16
243,9%
123,6%
120,4%
116,5%
107,8%
107,1%
104,5%
103,5%
102,7%
102,1%
100,4%
100,4%
99,6%
98,5%
98,5%
96,6%
94,7%
93,9%
91,6%
90,7%
90,5%
89,7%
88,4%
88,3%
88,1%
87,0%
81,7%
76,2%
60,5%
102,0%
95,4%
99,0%
121,1%
94,6%
108,8%
94,1%
98,3%
89,1%
113,0%
0,0% 50,0% 100,0% 150,0% 200,0% 250,0%
San Marino
Malta
Georgia
Slovenia
Armenia
Luxembourg
Moldova
Spain
Sw itzerland
Sw eden
Finland
Poland
France
Romania
Hungary
Croatia
Denmark
UK-England and Wales
FYROMacedonia
Latvia
Russian Federation
Bosnia and Herzegovina
Lithuania
Albania
Estonia
Italy
Monaco
Azerbaijan
UK-Scotland
Appeal -Civil andcommercial nonlitigious casesClearance Rate
Appeal -Civil andcommercial litigiouscases Clearance Rate
Figure 1 - Clearance rate of civil litigious and no n-litigious cases in 2008, in% Appeal courts
In 2008, second instance courts civil and commercial litigious pending cases raises in more than half (17 out of 29) of the states for which data are available. The CR for civil and commercial litigious cases is below 90% for almost one third of the states (Bosnia and Herzegovina, Lithuania, Albania, Estonia , Italy, Monaco, Azerbaijan, UK-Scotland ). In nine states the Clearance rate for civil and commercial litigious cases is more then 90% but less then 100% (Russian Federation, Latvia, FYROMacedonia, UK-Engla nd and Wales, Denmark, Croatia, Hungary, Romania and France ). The remaining twelve states (Poland, Finland, Sweden, Switzerland, Spain, Moldova, Luxembourg, Ar menia, Slovenia, Georgia, Malta, San Marino ) have a CR of over 100%, with Georgia and Malta over 120% and San Marino over 240%. It should be noted that the CR value of San Marino is the result of a relatively small number of cases (66 incoming and 161 resolved cases). In such cases, small differences in absolute numbers (i.e. 100 cases) may result in great variation in an index such as the CR. In the same period, the number of second instance courts civil and commercial non-litigious pending cases raises in 6 out of 10 states. Only one country, Italy , has a CR of less than 90% for civil and commercial non litigious cases. Albania and Hungary CR is just below 95% while for other three countries (Finland, Estonia

17
and Poland ) it ranges between 95% and 99%. Of the remaining four countries, two have a CR between 100% and 110% (Switzerland and Croatia ) while two have a CR higher than 110% (Latvia and Romania ). In four cases, the CR is below 100% both in litigious and non-litigious cases (Italy, Albania, Hungary, Estonia ), in two states it is over 100% in litigious but below it in non-litigious cases (Finland and Poland ), in three states it is below 100% in litigious and above it in non-litigious cases (Croatia, Latvia, Romania ), and only in Switzerland it is above 100% in both cases.
2.1.2. Highest instance courts
380,0%
127,1%
125,5%
124,1%
123,4%
123,2%
111,6%
104,2%
103,7%
101,6%
100,5%
100,2%
99,9%
98,7%
98,7%
96,6%
96,3%
96,0%
95,5%
93,2%
91,8%
91,4%
88,5%
86,7%
85,8%
78,3%
77,8%
73,5%
140,6%
102,2%
0,0% 50,0% 100,0% 150,0% 200,0% 250,0% 300,0% 350,0% 400,0%
San Marino
Spain
UK-England and Wales
Denmark
FYROMacedonia
Lithuania
Italy
Luxembourg
Montenegro
Sw itzerland
Georgia
Finland
Armenia
Serbia
France
Moldova
Sw eden
Bosnia and Herzegovina
Monaco
Czech Republic
Estonia
Hungary
Turkey
UK-Scotland
Slovenia
Latvia
Romania
Croatia
Highest instance Civiland commercial nonlitigious cases
Highest instance Civiland commerciallitigious cases
Figure 2 - Clearance rate of civil litigious and no n-litigious cases in 2008, in% Highest courts The above figure presents the Clearance rate in Highest instance courts of civil and commercial litigious cases in 28 states and in two states for non litigious cases (Finland and Montenegro , both with a CR above 100%). Clearance rate in Highest instance courts of civil and commercial litigious cases ranges from below 75% of Croatia up to 380% in San Marino . In nine cases (including Romania, Latvia, Slovenia, UK-Scotland, Turkey, Hungary, Estonia, Czech Republic ) the Clearance rate is below 95%, while in twelve states the

18
CR is within a ± 5% of 100% (Monaco, Bosnia and Herzegovina , Sweden, Moldova, F rance, Serbia, Armenia below 100%, Finland, Georgia, Switzerland, Montenegro, Luxembou rg above it). The five remaining countries have a CR above 110% (Italy, Lithuania, FYROMacedonia, Denmark, UK-Englan d and Wales, Spain, San Marino ). As in the second instance courts case, the CR value of San Marino is the result of a small number of cases (5 incoming and 19 resolved cases). As a consequence, a small difference in absolute numbers (14 cases) result in a very high CR value. Overall, the number of pending cases increases in 16 states in Highest instance courts of civil and commercial litigious cases, while it decreases in 12.
2.2. Evolution of the Clearance rate of civil (and commercial) litigious cases between 2006 and 2008
2.2.1. Second instance courts
0,0% 50,0% 100,0% 150,0% 200,0% 250,0%
San Marino
MaltaArmenia
Luxembourg
SwitzerlandSweden
Denmark
UK-England and WalesAlbaniaEstonia
AzerbaijanUK-Scotland
Lithuania
GeorgiaItaly
Croatia
SloveniaMonaco
Spain
HungaryRussian Federation
Poland
FranceFYROMacedonia
Finland
LatviaBosnia and Herzegovina
Romania
Moldova
Appeal -Civil andcommercial litigiouscases ClearanceRate (2006)
Appeal -Civil andcommercial litigiouscases ClearanceRate (2008)
Figure 3 - Evolution of the Clearance rate of civil litigious cases between 2006 and 2008, appeal
courts, in % (ordered by CR variation) The table above confronts the second instance courts evolution of the Clearance rate for litigious civil (and commercial) law cases between 2006 and 2008 in 17 states. 2008 data available for further 12 states (UK-Scotland, Azerbaijan, Estonia, Albania, Lithuania, UK-England and Wales, Denmark, Sweden, Switzerland, Luxembourg, Armenia, Malta, San Marino ) are presented only for information purposes as 2006 data is missing. For clarity purposes, 2006 data for the six states (Cyprus, Germany, Montenegro, Netherlands, Serbia, Slovakia ) which did not provide 2008 data have instead been omitted.

19
As it is evidenced in the figure below, in nine states out of 17 the Clearance rate decreases between 2006 and 2008, with one these case in which it decreases by -95,5% (Moldova ), four in which it decreases between -20% and -10% (Romania, Bosnia and Herzegovina, Latvia, Finland ) and in the other four cases between -10% and -3% (FYROMacedonia, France, Poland, Russian Federation ). In the remaining eight states (Hungary, Spain, Monaco, Slovenia, Croatia, Italy, G eorgia, Lithuania ) the CR increases from a 0,3% of Hungary to more than 30% of Georgia, Lithuania .
Lithuania; 44,8%
Georgia; 30,4%
Italy; 15,4%
Croatia; 12,8%
Slovenia; 11,0%
Monaco; 6,1%
Spain; 4,8%
Hungary; 0,3%
Russian Federation; -3,5%
Poland; -6,0%
France; -8,0%
FYROMacedonia; -9,1%
Finland; -10,4%
Latvia; -12,2%
Bosnia and Herzegovina ; -17,1%
Romania; -19,4%
Moldova; -95,5%
-120,0% -100,0% -80,0% -60,0% -40,0% -20,0% 0,0% 20,0% 40,0% 60,0%
Changebetween2006 and2008
Figure 4 - Evolution of the Clearance rate of civil litigious cases between 2006 and 2008, appeal
courts, differential in % At the same time, the increase and decrease of CR must be considered taking into account the 2008 situation. A negative result does not necessary imply a Clearance rate below 100% and a consequent increase in pending cases and a growth of the Disposition time. The situation should nevertheless be monitored in order to be sure the CR stabilizes around 100% if the Disposition time is considered acceptable, or acted upon if the Disposition time is too long. Looking only at the 2006-2008 Clearance rate variation and at the 2008 CR, while the CR decrease in Bosnia and Herzegovina, Russian Federation, Latvia and FYROMacedonia should be looked with attention as the 2008 CR was around 90% for all four states, the decrease in Romania, France, Poland, Finland, Spain, Moldova leads to a stabilization of the Disposition time, as 2008 CR was around 100%. At the same time, the CR rise in Monaco, Italy, Lithuania, Croatia, Hungary , while a positive indication, are coupled with Clearance rates which were still below 100% in 2008. Finally, Spain, Slovenia and Georgia show both a positive trend and a 2008 Clearance rate above 100%. The figure below provides both 2006 and 2008 second instance courts Clearance rate for litigious civil (commercial) law cases between the 17 (+12) states, both the value of the variation between the two dates.

20
200,
0%
118,
0%
106,
7%
102,
9%
110,
8%
100,
7%
107,
6%
106,
4%
94,1
%
98,1
%
98,7
%
75,6
%
105,
5%
83,8
%
71,7
% 90,0
%
43,7
%
104,
5%
98,5
%
89,7
%
90,7
%
100,
4%
91,6
%
99,6
%
100,
4%
90,5
%
98,5
%
103,
5%
81,7
%
116,
5%
96,6
%
87,0
%
120,
4%
88,4
%
60,5
% 76,2
% 88,1
%
88,3
%
93,9
%
94,7
%
102,
1%
102,
7%
107,
1%
107,
8% 123,
6%
243,
9%
44,8
%
30,4
%
15,4
%
12,8
%
11,0
%
6,1%
4,8%
0,3%
-3,5
%
-6,0
%
-8,0
%
-95,
5%
-9,1
%
-10,
4%
-12,
2%
-17,
1%
-19,
4%
0,0%
50,0%
100,0%
150,0%
200,0%
250,0%
300,0%
Mol
dova
Rom
ania
Bos
nia
and
Her
zego
vina
Latv
ia
Fin
land
FY
RO
Mac
edon
ia
Fra
nce
Pol
and
Rus
sian
Fed
erat
ion
Hun
gary
Spa
in
Mon
aco
Slo
veni
a
Cro
atia
Ital
y
Geo
rgia
Lith
uani
a
UK
-Sco
tland
Aze
rbai
jan
Est
onia
Alb
ania
UK
-Eng
land
and
Wal
es
Den
mar
k
Sw
eden
Sw
itzer
land
Luxe
mbo
urg
Arm
enia
Mal
ta
San
Mar
ino
-150,0%
-100,0%
-50,0%
0,0%
50,0%
100,0%
Appeal -Civil and commercial litigious cases Clearance Rate (2006)
Appeal -Civil and commercial litigious cases Clearance Rate (2008)
Change between 2006 and 2008
Figure 5 - Evolution of the Clearance rate of civil litigious cases between 2006 and 2008, appeal courts, in % and change in %
2.2.2. Highest instance courts Considering the data available, it is possible to asses the highest instance courts evolution of the Clearance rate for litigious civil (and commercial) law cases between 2006 and 2008 in 21 states. As for the second instance courts, the figure below presents highest instance courts 2008 data available for further seven states (UK-Scotland, Armenia, Luxembourg, Lithuania, Denmar k, UK-England and Wales, San Marino ) for which 2006 data is missing for information purposes.

21
0,0% 100,0% 200,0% 300,0% 400,0%
San Marino
UK-England and Wales
Denmark
Lithuania
Luxembourg
Armenia
UK-Scotland
Monaco
FYROMacedonia
Turkey
Italy
Slovenia
Czech Republic
Bosnia and Herzegovina
Switzerland
Spain
Estonia
Moldova
Hungary
Sweden
Serbia
Finland
Latvia
Montenegro
France
Georgia
Romania
Croatia
Highest instanceCivil andcommerciallitigious cases(2006)
Highest instanceCivil andcommerciallitigious cases(2008)
Figure 6 - Evolution of the Clearance rate of civil litigious cases between 2006 and 2008, Highest
courts, in % (ordered by CR variation) As the figure below clearly shows, between 2006 and 2008 Clearance rates drop in almost two thirds of the states (Croatia, Romania, Georgia, France, Montenegro, Latv ia, Finland, Serbia, Sweden, Hungary, Moldova, Estonia, Spain ), with one third of the states with a CR decrease of more than 10% (Croatia, Romania, Georgia, France, Montenegro, Latvia, Finla nd ). In two states the CR raise between 3% and 4% (Switzerland and Bosnia and Herzegovina ) while in the remaining five it raised more than 10% (Czech Republic, Slovenia, Italy, Turkey, FYROMacedonia, M onaco ), up to 44% in Turkey, 49% in FYROMacedonia , and almost 60% in Monaco . Crossing the Clearance rate variation between 2006 and 2008 with the 2008 situation it can be observed that the CR decrease in nine states, Croatia, Romania, Latvia, Hungary, Estonia, Sweden, Moldova, France, Serbia is related to a 2008 CR below 100%. It is worth noticing that in 2006 in six of these states the Clearance rate is above 100% (Croatia, Romania, Sweden, Moldova, France, Serbia ). The Clearance rate decrease Finland, Georgia, Montenegro, Spain is instead coupled with a 2008 CR above 100%. The CR rise in Slovenia, Turkey, Czech Republic, Monaco, Bosnia an d Herzegovina , while a positive indication (especially Turkey with a +44%), is coupled with Clearance rates which are still below 100% in 2008. Finally, Switzerland, Italy, FYROMacedonia show both a positive trend and a 2008 Clearance rate above 100%.

22
Monaco; 59,5%
FYROMacedonia; 48,5%
Turkey; 44,2%
Italy; 27,9%
Slovenia; 15,3%
Czech Republic; 13,2%
Bosnia & Herzegovina ; 4,0%
Switzerland; 3,3%
Spain; -0,6%
Estonia; -3,3%
Moldova; -5,5%
Hungary; -6,9%
Sweden; -7,9%
Serbia; -9,3%
Finland; -11,1%
Latvia; -13,1%
Montenegro; -14,5%
France; -19,3%
Georgia; -19,8%
Romania; -27,6%
Croatia; -40,7%
-60,0% -40,0% -20,0% 0,0% 20,0% 40,0% 60,0% 80,0%
Changebetween 2006and 2008
Figure 7 - Evolution of the Clearance rate of civil litigious cases between 2006 and 2008, Highest
courts, change in %
114,
2%
105,
5%
120,
3%
118,
0%
118,
2%
91,3
% 111,
3%
108,
0%
104,
1%
98,3
%
102,
0%
95,0
%
127,
7%
98,3
%
92,0
%
80,0
%
70,5
%
83,7
%
44,3
% 74,9
%
35,9
%
73,5
%
77,8
% 100,
5%
98,7
%
103,
7%
78,3
% 100,
2%
98,7
%
96,3
%
91,4
%
96,6
%
91,8
%
127,
1%
101,
6%
96,0
%
93,2
%
85,8
% 111,
6%
88,5
%
123,
4%
95,5
%
86,7
%
99,9
%
104,
2% 123,
2%
124,
1%
125,
5%
380,
0%
59,5
%
48,5
%
44,2
%
27,9
%
-27,
6%
-19,
8%
-19,
3%
-14,
5%
-13,
1%
-40,
7%
-11,
1%
-9,3
%
-7,9
%
-6,9
%
-5,5
%
-3,3
%
-0,6
%
3,3% 4,0% 13
,2%
15,3
%
0,0%
50,0%
100,0%
150,0%
200,0%
250,0%
300,0%
350,0%
400,0%
Cro
atia
Rom
ania
Geo
rgia
Fra
nce
Mon
tene
gro
Latv
ia
Fin
land
Ser
bia
Sw
eden
Hun
gary
Mol
dova
Est
onia
Spa
in
Sw
itzer
land
Bos
nia
and
Her
zego
vina
Cze
ch R
epub
lic
Slo
veni
a
Ital
y
Tur
key
FY
RO
Mac
edon
ia
Mon
aco
UK
-Sco
tland
Arm
enia
Luxe
mbo
urg
Lith
uani
a
Den
mar
k
UK
-Eng
land
and
Wal
es
San
Mar
ino
-150,0%
-100,0%
-50,0%
0,0%
50,0%
100,0%
Highest instance Civil and commercial litigious cases (2006)
Highest instance Civil and commercial litigious cases (2008)
Change between 2006 and 2008
Figure 8 - Evolution of the Clearance rate of civil litigious cases between 2006 and 2008, Highest instance courts, in % and change in %

23
The figure above provides both 2006 and 2008 highest instance courts Clearance rate for litigious civil (commercial) law cases between the 21 (+7) states, both the value of the variation between the two dates.
2.3. Disposition time of litigious and non-litigious civil (and commercial) cases
2.3.1. Second instance courts
1229
711
537
500
412
400
369
298
290
278
212
184
183
181
163
139
129
109
101
97
94
74
73
73
66
39
25
242
61
59
93
91
76
264
44
76
33
0 200 400 600 800 1000 1200 1400
Italy
Monaco
San Marino
Malta
Luxembourg
Albania
France
Latvia
Bosnia and Herzegovina
Croatia
Finland
Spain
Sweden
Estonia
Romania
Denmark
Switzerland
Lithuania
Hungary
Slovenia
FYROMacedonia
Azerbaijan
Armenia
Georgia
Moldova
Poland
Russian Federation
Second instance non Litigious casesDisposition time
Second instance Litigious casesDisposition time
Figure 9 - Disposition time of litigious and non-li tigious civil (and commercial) cases, appeal courts ,
in days Considering the data available, it has been possible to calculate the Disposition time (in days) of litigious civil (and commercial) cases at second instance courts for 27 states and for non litigious cases for 10 states. Only in the case of Romania the 2008 Disposition time is longer for non litigious cases than for the litigious ones. On an average, non litigious cases Disposition time is one third of the litigious one. Of the 10 states which provided data to calculate the Disposition time for non litigious cases, eight (Poland, Switzerland, Latvia, Albania, Estonia, Hungary, Finland, Croatia ) have a 2008 Disposition time of less than 100 days, while the remaining two (Italy and Romania ) have a Disposition time of approximately 250 days. The Disposition time of litigious civil (and commercial) cases at second instance courts presents a great variation, ranging from less than on month (25 days) of the Russian Federation to more than three years (1229 days) of Italy, with an average of 258 days and a median of 181. Eight states (Russian Federation, Poland, Moldova, Georgia, Armenia, Azerbaijan, FYRO Macedonia, Slovenia ) have a 2008 Disposition time of less than 100 days, further twelve of less than one year (Hungary, Lithuania, Switzerland, Denmark, Romania, Estonia, Sweden, Spain, Finland, Croatia, Bosnia and Herzegovina, Latvia ), six between one and two years (France, Albania, Luxembourg, Malta, San Marino, Mon aco ) and just one, Italy , over three years.
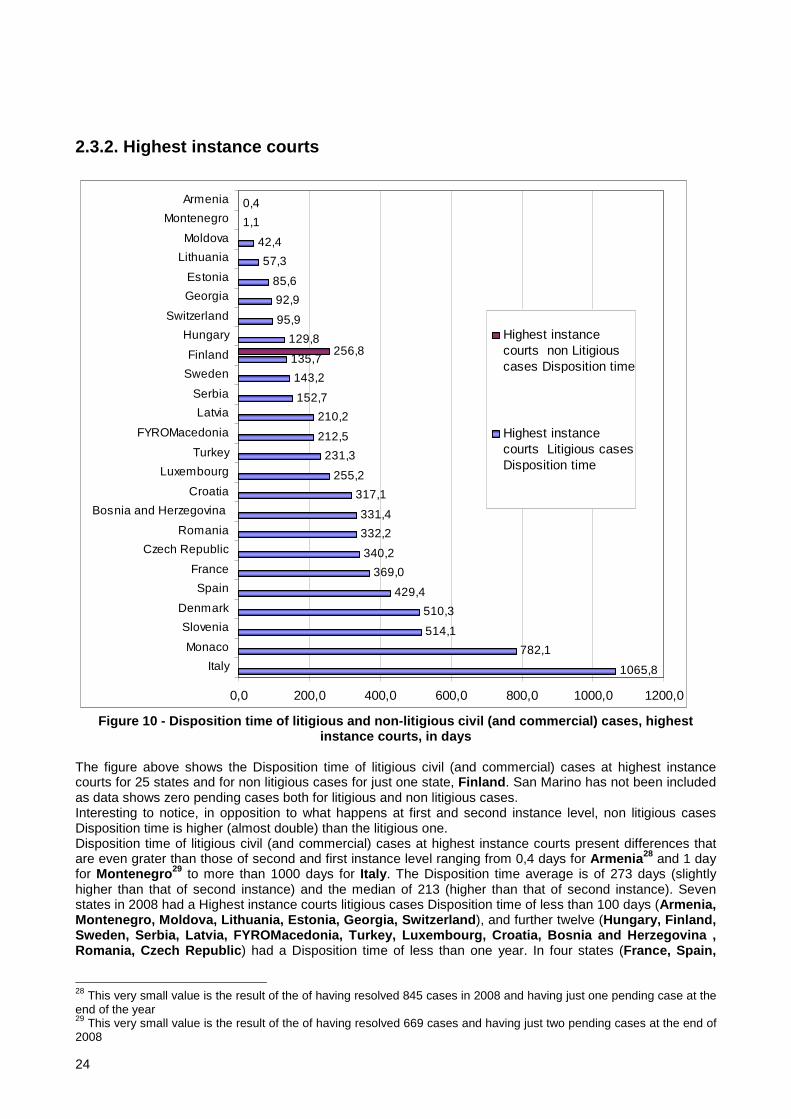
24
2.3.2. Highest instance courts
1065,8
782,1
514,1
510,3
429,4
369,0
340,2
332,2
331,4
317,1
255,2
231,3
212,5
210,2
152,7
143,2
135,7
129,8
95,9
92,9
85,6
57,3
42,4
1,1
0,4
256,8
0,0 200,0 400,0 600,0 800,0 1000,0 1200,0
Italy
Monaco
Slovenia
Denmark
Spain
France
Czech Republic
Romania
Bosnia and Herzegovina
Croatia
Luxembourg
Turkey
FYROMacedonia
Latvia
Serbia
Sweden
Finland
Hungary
Switzerland
Georgia
Estonia
Lithuania
Moldova
Montenegro
Armenia
Highest instancecourts non Litigiouscases Disposition time
Highest instancecourts Litigious casesDisposition time
Figure 10 - Disposition time of litigious and non-l itigious civil (and commercial) cases, highest
instance courts, in days The figure above shows the Disposition time of litigious civil (and commercial) cases at highest instance courts for 25 states and for non litigious cases for just one state, Finland . San Marino has not been included as data shows zero pending cases both for litigious and non litigious cases. Interesting to notice, in opposition to what happens at first and second instance level, non litigious cases Disposition time is higher (almost double) than the litigious one. Disposition time of litigious civil (and commercial) cases at highest instance courts present differences that are even grater than those of second and first instance level ranging from 0,4 days for Armenia 28 and 1 day for Montenegro 29 to more than 1000 days for Italy . The Disposition time average is of 273 days (slightly higher than that of second instance) and the median of 213 (higher than that of second instance). Seven states in 2008 had a Highest instance courts litigious cases Disposition time of less than 100 days (Armenia, Montenegro, Moldova, Lithuania, Estonia, Georgia, S witzerland ), and further twelve (Hungary, Finland, Sweden, Serbia, Latvia, FYROMacedonia, Turkey, Luxe mbourg, Croatia, Bosnia and Herzegovina , Romania, Czech Republic ) had a Disposition time of less than one year. In four states (France, Spain,
28 This very small value is the result of the of having resolved 845 cases in 2008 and having just one pending case at the end of the year 29 This very small value is the result of the of having resolved 669 cases and having just two pending cases at the end of 2008

25
Denmark, Slovenia ) litigious cases Disposition time was between one and two years while in the remaining two (Monaco and Italy ) it was between two and three years
2.4. Disposition time and Clearance rate of litigious civil (and commercial) cases
2.4.1. Second instance courts The map below shows litigious civil (and commercial) cases at second instance courts Disposition time for 27 states and Clearance rate for 29 states. Numerical values displayed on the map represent Disposition time for each state (in days). Of the eight states that have a Disposition time of less than 100 days, five have also a Clearance rate of 100% or higher (Poland, Moldova, Georgia, Armenia, Slovenia ), while three (Azerbaijan, Russian Federation, FYROMacedonia) have a Clearance rate between 76 and 92%. Of the twelve states with a Disposition time of less than on year, eight (Estonia, Lithuania, Bosnia and Herzegovina, Latvia, Denmark, Croatia, Hungary, Romania ) have a Clearance rate below 100%, while four (Finland, Sweden, Switzerland, Spain ) have a Clearance rate equal or higher than 100%. Two of the six states with a Disposition time between one and two years, Monaco and Albania , have a Clearance rate below 100% while the remaining four countries were all equal or above it (France, Luxembourg, Malta, San Marino ). Italy , with a Disposition time of over three years, has also a Clearance rate well below 100%. Both UK-England and Wales and UK-Scotland , for which Disposition time could not be provided, have a Clearance rate below 100%, especially in the UK-Scotland case (60%).
Figure 11 - Disposition time and Clearance rate of litigious civil (and commercial) cases at 2 nd
instance courts in 2008
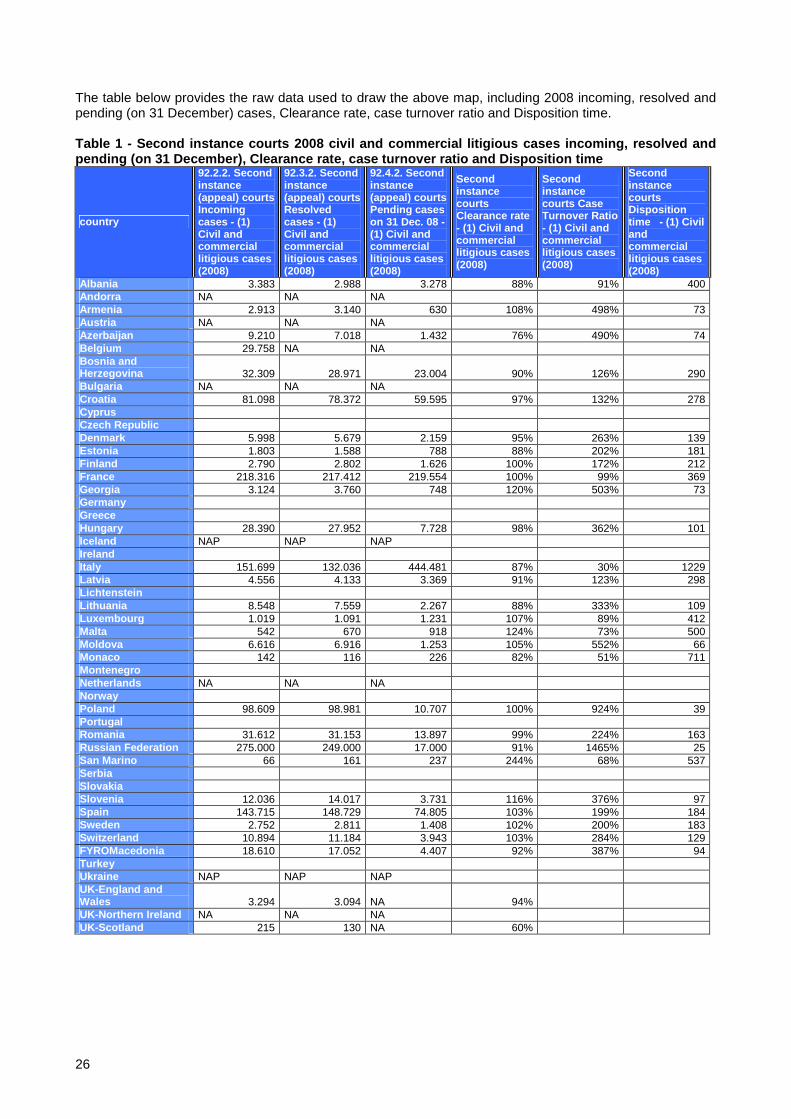
26
The table below provides the raw data used to draw the above map, including 2008 incoming, resolved and pending (on 31 December) cases, Clearance rate, case turnover ratio and Disposition time.
Table 1 - Second instance courts 2008 civil and com mercial litigious cases incoming, resolved and pending (on 31 December), Clearance rate, case turn over ratio and Disposition time
country
92.2.2. Second instance (appeal) courts Incoming cases - (1) Civil and commercial litigious cases (2008)
92.3.2. Second instance (appeal) courts Resolved cases - (1) Civil and commercial litigious cases (2008)
92.4.2. Second instance (appeal) courts Pending cases on 31 Dec. 08 - (1) Civil and commercial litigious cases (2008)
Second instance courts Clearance rate - (1) Civil and commercial litigious cases (2008)
Second instance courts Case Turnover Ratio - (1) Civil and commercial litigious cases (2008)
Second instance courts Disposition time - (1) Civil and commercial litigious cases (2008)
Albania 3.383 2.988 3.278 88% 91% 400 Andorra NA NA NA Armenia 2.913 3.140 630 108% 498% 73 Austria NA NA NA Azerbaijan 9.210 7.018 1.432 76% 490% 74 Belgium 29.758 NA NA Bosnia and Herzegovina 32.309 28.971 23.004 90% 126% 290 Bulgaria NA NA NA Croatia 81.098 78.372 59.595 97% 132% 278 Cyprus Czech Republic Denmark 5.998 5.679 2.159 95% 263% 139 Estonia 1.803 1.588 788 88% 202% 181 Finland 2.790 2.802 1.626 100% 172% 212 France 218.316 217.412 219.554 100% 99% 369 Georgia 3.124 3.760 748 120% 503% 73 Germany Greece Hungary 28.390 27.952 7.728 98% 362% 101 Iceland NAP NAP NAP Ireland Italy 151.699 132.036 444.481 87% 30% 1229 Latvia 4.556 4.133 3.369 91% 123% 298 Lichtenstein Lithuania 8.548 7.559 2.267 88% 333% 109 Luxembourg 1.019 1.091 1.231 107% 89% 412 Malta 542 670 918 124% 73% 500 Moldova 6.616 6.916 1.253 105% 552% 66 Monaco 142 116 226 82% 51% 711 Montenegro Netherlands NA NA NA Norway Poland 98.609 98.981 10.707 100% 924% 39 Portugal Romania 31.612 31.153 13.897 99% 224% 163 Russian Federation 275.000 249.000 17.000 91% 1465% 25 San Marino 66 161 237 244% 68% 537 Serbia Slovakia Slovenia 12.036 14.017 3.731 116% 376% 97 Spain 143.715 148.729 74.805 103% 199% 184 Sweden 2.752 2.811 1.408 102% 200% 183 Switzerland 10.894 11.184 3.943 103% 284% 129 FYROMacedonia 18.610 17.052 4.407 92% 387% 94 Turkey Ukraine NAP NAP NAP UK-England and Wales 3.294 3.094 NA 94% UK-Northern Ireland NA NA NA UK-Scotland 215 130 NA 60%

27
2.4.2. Highest instance courts In the map below are presented the Disposition time for 25 states and the Clearance rate for 28 states, for litigious civil (and commercial) cases at highest instance courts. Of the Seven states that in 2008 had a Highest instance courts litigious cases Disposition time of less than 100 days, two (Estonia and Moldova ) have a 2008 Clearance rate below 100% while five (Armenia, Georgia, Switzerland, Montenegro, Lithuania ) have a Clearance rate of 100% or higher. Of the twelve states with a Disposition time of more than 100 days but less than on year, three quarters (Croatia, Romania, Latvia, Turkey, Hungary, Czech Republic, Bosnia and Herzegovina, Sweden, Serbia ) have a Clearance rate below 100%, while three (Finland, Luxembourg, FYROMacedonia ) have a Clearance rate equal or higher than 100%. Of the six states with a Disposition time of over one year, three (Slovenia, Monaco, France), have a Clearance rate below 100% while the remaining three countries are above it (Italy, Denmark, Spain ). Of the three countries for which Disposition time could not be calculated, one (UK-Scotland ) has a Clearance rate below 100%, while the other two UK-England and Wale s and San Marino have a Clearance rate above it.
Figure 12 - Disposition time and Clearance rate of litigious civil (and commercial) cases at highest
instance courts in 2008

28
The table below provides the raw data used to draw the above map, including 2008 incoming, resolved and pending (on 31 December) cases, Clearance rate, case turnover ratio and Disposition time.
Table 2 - Highest instance courts 2008 civil and co mmercial litigious cases incoming, resolved and pending (on 31 December), Clearance rate, case turn over ratio and Disposition time
country
93.2.2. Highest instance courts Incoming cases - (1) Civil and commercial litigious cases (2008)
92.3.2. Highest instance courts Resolved cases - (1) Civil and commercial litigious cases (2008)
93.4.2. Highest instance courts Pending cases on 31 Dec. 08 - (1) Civil and commercial litigious cases (2008)
Highest instance courts Clearance rate - (1) Civil and commercial litigious cases (2008)
Highest instance courts Case Turnover Ratio - (1) Civil and commercial litigious cases (2008)
Highest instance courts Disposition time - (1) Civil and commercial litigious cases (2008)
Albania NAP NAP NAP Andorra Armenia 846 845 1 100% 84500% 0 Austria NA NA NA Azerbaijan Belgium NA NA NA Bosnia and Herzegovina 4.304 4.133 3.752 96% 110% 331 Bulgaria NA NA NA Croatia 2.625 1.929 1.676 73% 115% 317 Cyprus Czech Republic 6.510 6.066 5.654 93% 107% 340 Denmark 257 319 446 124% 72% 510 Estonia 158 145 34 92% 426% 86 Finland 985 987 367 100% 269% 136 France 18.932 18.684 18.890 99% 99% 369 Georgia 1.107 1.112 283 100% 393% 93 Germany Greece Hungary 2.840 2.596 923 91% 281% 130 Iceland NAP NAP NAP Ireland Italy 30.406 33.928 99.066 112% 34% 1066 Latvia 916 717 413 78% 174% 210 Lichtenstein Lithuania 496 611 96 123% 636% 57 Luxembourg 118 123 86 104% 143% 255 Malta Moldova 3.293 3.180 369 97% 862% 42 Monaco 22 21 45 95% 47% 782 Montenegro 645 669 2 104% 33450% 1 Netherlands NA NA NA Norway Poland Portugal Romania 15.602 12.146 11.056 78% 110% 332 Russian Federation 258000/10000 153000/10000 6000/500 San Marino 5 19 0 380% Serbia 8.891 8.775 3.671 99% 239% 153 Slovakia Slovenia 1.929 1.655 2.331 86% 71% 514 Spain 16.643 21.157 24.889 127% 85% 429 Sweden 588 566 222 96% 255% 143 Switzerland 1.506 1.530 402 102% 381% 96 FYROMacedonia 1.641 2.025 1.179 123% 172% 213 Turkey 480.568 425.393 269.551 89% 158% 231 Ukraine NAP NAP NAP UK-England and Wales 51 64 NA 125% UK-Northern Ireland NA NA NA UK-Scotland 3.904 3.385 NA 87%

29
2.5. Clearance rate of administrative law cases in 2008
2.5.1. Second instance courts 22 states were able to provide data needed to calculate the 2008 Clearance rate for administrative law cases at second instance courts, compared to 32 states that were able to provide such data for first instance courts. Administrative law cases at second instance courts Clearance rate ranges from 24% of Ukraine up to 166% of Georgia . While over half 2008 states are below 100%, almost two thirds have a Clearance rate of 98% or above.
Appeal -Administrative law cases Clearance Rate
166,0%
160,0%
151,4%
132,8%
112,3%
107,5%
102,6%
102,4%
101,9%
101,4%
99,7%
98,5%
98,3%
98,0%
94,9%
93,0%
88,4%
82,2%
74,8%
67,5%
66,3%
23,7%
0,0% 50,0% 100,0% 150,0% 200,0%
Georgia
San Marino
Slovakia
Slovenia
Luxembourg
Lithuania
Hungary
Sweden
Andorra
Switzerland
Russian Federation
Moldova
Bosnia and Herzegovina
France
Estonia
Latvia
Netherlands
Spain
UK-England and Wales
Cyprus
Albania
Ukraine
Figure 13 - Clearance rate of administrative law ca ses, appeal courts, in 2008
2.5.2. Highest instance courts More states, 26, were able to provide data needed to calculate the 2008 Clearance rate for administrative law cases at highest instance courts. Administrative law cases at highest instance courts Clearance rate ranges from 29% of Ukraine up to 142% of Slovenia . Interesting to notice, Georgia , which has the highest Clearance rate for appeal instance courts, has a Clearance rate of 80% for highest instance courts. Highest instance courts average Clearance rate is 91% while median is 93%. Overall, eleven countries have a Clearance rate equal or above 100% while fifteen are below it.

30
Highest instance courts -administrative cases Clearance Rate
141,7%
139,1%
118,8%
117,1%
115,3%
108,4%
107,6%
107,2%
100,2%
100,0%
100,0%
97,2%
96,2%
89,9%
89,3%
89,0%
87,9%
87,9%
86,9%
80,2%
76,2%
66,7%
61,7%
36,7%
36,0%
29,3%
0,0% 50,0% 100,0% 150,0%
Slovenia
Bosnia and Herzegovina
Sw eden
Montenegro
Spain
Sw itzerland
UK-Scotland
Serbia
France
Armenia
FYROMacedonia
Moldova
Poland
Slovakia
Estonia
Latvia
Romania
Hungary
Finland
Georgia
Turkey
San Marino
Croatia
Czech Republic
Albania
Ukraine
Figure 14 - Clearance rate of administrative law ca ses, highest instance courts, in 2008

31
2.6. Evolution of the Clearance rate of administrative law cases between 2006 and 2008
2.6.1. Second instance courts Only sixteen states have provided the data needed to calculate the Clearance rates for administrative law cases at second instance courts in 2006 and 2008. The figure below presents also 2008 CR for six further states (Albania, UK-England and Wales, Switzerland, Andorra , Sweden, San Marino ). This information is presented only for information purposes as lack of 2006 data did not allow their 2006 second instance courts administrative law cases Clearance rates.
160,0%
102,4%
101,9%
101,4%
74,8%
66,3%
166,0%
151,4%
132,8%
107,5%
112,3%
67,5%
99,7%
93,0%
102,6%
88,4%
82,2%
98,3%
94,9%
98,0%
23,7%
98,5%
69,4%
117,2%
98,7%
78,7%
84,7%
61,8%
94,7%
90,3%
104,6%
93,1%
87,9%
108,2%
112,2%
122,8%
76,0%
200,0%
0,0% 50,0% 100,0% 150,0% 200,0% 250,0%
San Marino
Sweden
Andorra
Switzerland
UK-England and Wales
Albania
Georgia
Slovakia
Slovenia
Lithuania
Luxembourg
Cyprus
Russian Federation
Latvia
Hungary
Netherlands
Spain
Bosnia and Herzegovina
Estonia
France
Ukraine
Moldova
Appeal -Administrative lawcases ClearanceRate 2006
Appeal -Administrative lawcases ClearanceRate 2008
Figure 15 - Evolution of the Clearance rate of admi nistrative law cases between 2006 and 2008,
appeal courts, in % (ordered by CR variation) Of the sixteen states for which the Evolution of the Clearance rate of administrative law cases has been calculated, half shows a negative trend (Moldova, Ukraine, France, Estonia, Bosnia and Herze govina , Spain, Netherlands, Hungary ) while the other half sows a positive one (Latvia, Russian Federation, Cyprus, Luxembourg, Lithuania, Slovenia, Slovakia, Georgia ). As clearly shown in the figure below, the

32
variation range from a -102% for Moldova to +96% for Georgia , with only six countries within a ±6% of variation (Spain, Netherlands, Hungary, Latvia, Russian Federa tion, Cyprus ).
Georgia; 96,5%
Slovakia; 34,2%
Slovenia; 34,0%
Lithuania; 28,7%
Luxembourg; 27,6%
Cyprus; 5,7%
Russian Federation; 5,0%
Latvia; 2,8%
Hungary; -2,0%
Netherlands; -4,7%
Spain; -5,7%
Bosnia and Herzegovina ; -9,8%
Estonia; -17,3%
France; -24,8%
Ukraine; -52,4%
Moldova; -101,5%
-150,0% -100,0% -50,0% 0,0% 50,0% 100,0% 150,0%
Changebetween2006 and2008
Figure 16 - Evolution of the Clearance rate of admi nistrative law cases between 2006 and 2008,
appeal courts, change in % Of the eight states with a negative 2006-2008 Clearance rate trend, seven have a 2008 Clearance rate below 100% (Ukraine, Spain, Netherlands, Estonia, France, Bosni a and Herzegovina, Moldova ). In three of these cases (France, Bosnia and Herzegovina, Moldova ), though, the 2008 Clearance rate is within two point percentage from 100%. The 8th state with a negative 2006-2008 Clearance rate trend, Hungary, has a 2008 Clearance rate of more than 102%. Of the eight states with a positive Clearance rate trend, three (Cyprus, Latvia, Russian Federation ) have a 2008 Clearance rate below 100%, and in particular, while the Russian Federation is just 0,3% below it, Cyprus 2008 CR is 67,5%. The remaining five countries (Lithuania, Luxembourg, Slovenia, Slovakia, Georgia ) have both a positive Clearance rate trend, both a 2008 Clearance rate above 100%.
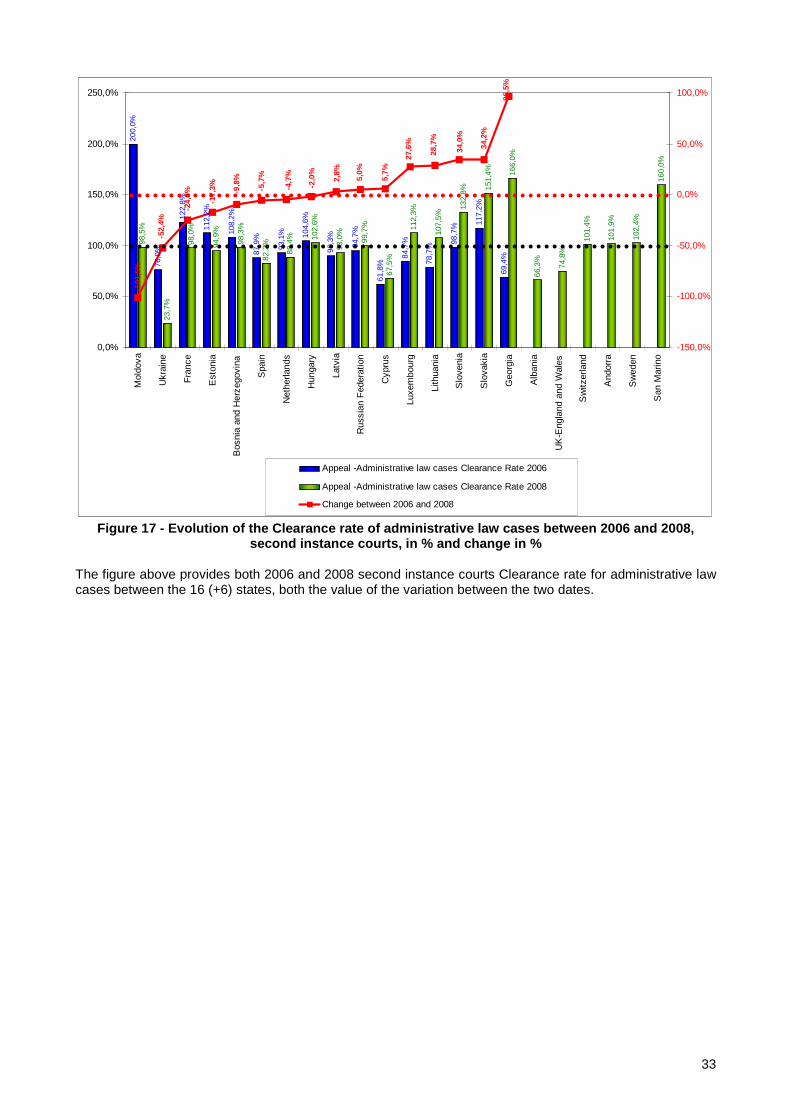
33
200,
0%
76,0
%
122,
8%
112,
2%
108,
2%
87,9
%
93,1
% 104,
6%
90,3
%
94,7
%
61,8
%
84,7
%
78,7
%
98,7
% 117,
2%
69,4
%
98,5
%
23,7
%
98,0
%
94,9
%
98,3
%
82,2
%
88,4
% 102,
6%
93,0
%
99,7
%
67,5
%
112,
3%
107,
5%
132,
8% 151,
4% 166,
0%
66,3
%
74,8
%
101,
4%
101,
9%
102,
4%
160,
0%
96,5
%
34,2
%
34,0
%
28,7
%
27,6
%
5,7%
5,0%
2,8%
-2,0
%
-4,7
%
-101
,5%
-5,7
%
-9,8
%
-17,
3%
-24,
8%
-52,
4%
0,0%
50,0%
100,0%
150,0%
200,0%
250,0%
Mol
dova
Ukr
aine
Fra
nce
Est
onia
Bos
nia
and
Her
zego
vina
Spa
in
Net
herla
nds
Hun
gary
Latv
ia
Rus
sian
Fed
erat
ion
Cyp
rus
Luxe
mbo
urg
Lith
uani
a
Slo
veni
a
Slo
vaki
a
Geo
rgia
Alb
ania
UK
-Eng
land
and
Wal
es
Sw
itzer
land
And
orra
Sw
eden
San
Mar
ino
-150,0%
-100,0%
-50,0%
0,0%
50,0%
100,0%
Appeal -Administrative law cases Clearance Rate 2006
Appeal -Administrative law cases Clearance Rate 2008
Change between 2006 and 2008
Figure 17 - Evolution of the Clearance rate of admi nistrative law cases between 2006 and 2008, second instance courts, in % and change in %
The figure above provides both 2006 and 2008 second instance courts Clearance rate for administrative law cases between the 16 (+6) states, both the value of the variation between the two dates.
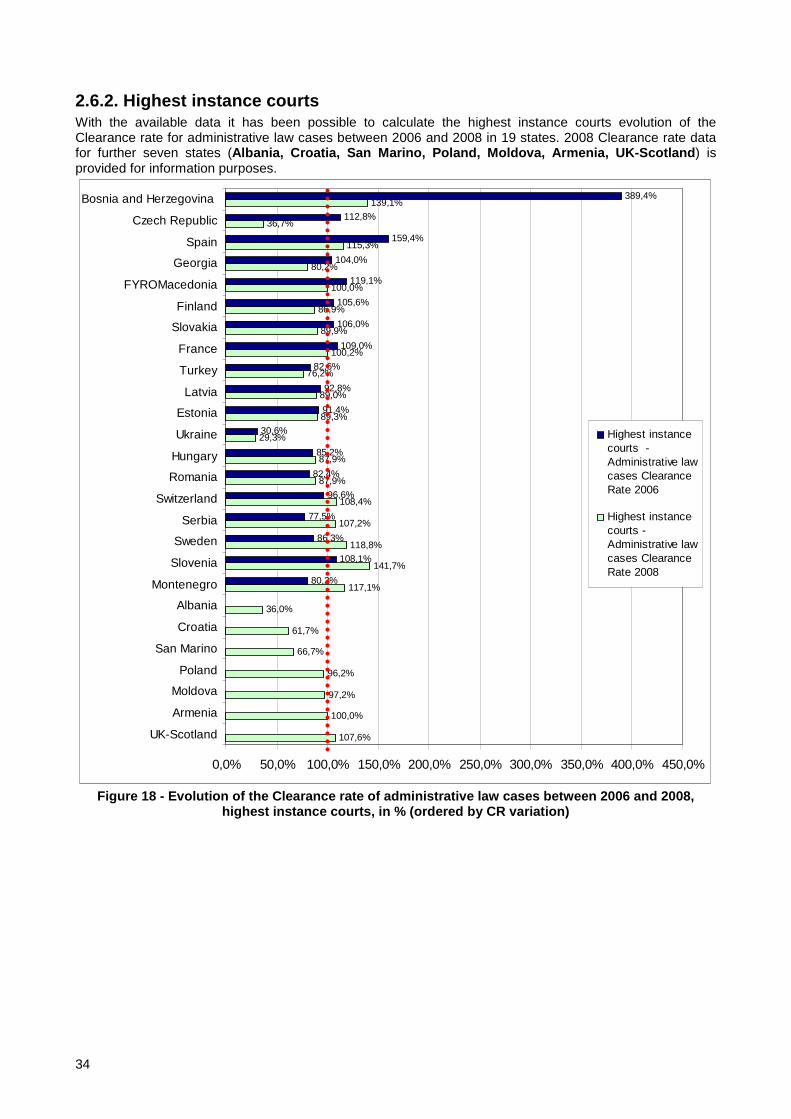
34
2.6.2. Highest instance courts With the available data it has been possible to calculate the highest instance courts evolution of the Clearance rate for administrative law cases between 2006 and 2008 in 19 states. 2008 Clearance rate data for further seven states (Albania, Croatia, San Marino, Poland, Moldova, Arme nia, UK-Scotland ) is provided for information purposes.
107,6%
100,0%
97,2%
96,2%
66,7%
61,7%
36,0%
117,1%
141,7%
118,8%
107,2%
108,4%
87,9%
87,9%
29,3%
89,3%
89,0%
76,2%
100,2%
89,9%
86,9%
100,0%
80,2%
115,3%
36,7%
139,1%
80,2%
108,1%
86,3%
77,5%
96,6%
82,4%
85,2%
30,6%
91,4%
92,8%
82,6%
109,0%
106,0%
105,6%
119,1%
104,0%
159,4%
112,8%
389,4%
0,0% 50,0% 100,0% 150,0% 200,0% 250,0% 300,0% 350,0% 400,0% 450,0%
UK-Scotland
Armenia
Moldova
Poland
San Marino
Croatia
Albania
Montenegro
Slovenia
Sweden
Serbia
Switzerland
Romania
Hungary
Ukraine
Estonia
Latvia
Turkey
France
Slovakia
Finland
FYROMacedonia
Georgia
Spain
Czech Republic
Bosnia and Herzegovina
Highest instancecourts -Administrative lawcases ClearanceRate 2006
Highest instancecourts -Administrative lawcases ClearanceRate 2008
Figure 18 - Evolution of the Clearance rate of admi nistrative law cases between 2006 and 2008,
highest instance courts, in % (ordered by CR variat ion)

35
Montenegro; 37,0%
Slovenia; 33,6%
Sw eden; 32,4%
Serbia; 29,7%
Sw itzerland; 11,8%
Romania; 5,5%
Hungary; 2,6%
Ukraine; -1,3%
Estonia; -2,1%
Latvia; -3,8%
Turkey; -6,4%
France; -8,8%
Slovakia; -16,1%
Finland; -18,7%
FYROMacedonia; -19,1%
Georgia; -23,7%
Spain; -44,1%
Czech Republic; -76,1%
Bosnia and Herzegovina ; -250,3%
-300,0% -250,0% -200,0% -150,0% -100,0% -50,0% 0,0% 50,0% 100,0%
Changebetween2006 and2008
Figure 19 - Evolution of the Clearance rate of admi nistrative law cases between 2006 and 2008,
highest instance courts, change in % As the above figure shows, in twelve out of nineteen states (almost two thirds) the Clearance rate of administrative law cases decreases between 2006 and 2008. The drop is quite consistent in several states and in particular in Bosnia and Herzegovina (-250%), Czech Republic (-76%) and Spain (-44%). At the same time, in the three of the six countries in which the Clearance rate raises between 2006 and 2008, the CR increment is of more than 30% (Sweden, Slovenia, Montenegro ). Observing the 2006-2008 Clearance rate trend of administrative law cases for highest instance courts taking into account 2008 Clearance rates, it emerges that in eight cases (Ukraine, Czech Republic, Turkey, Georgia, Finland, Latvia, Estonia, Slovakia ) Clearance rate decrease is linked with a 2008 CR below 100% while in 4 cases (FYROMacedonia, France, Spain, Bosnia and Herzegovin a) it is linked with a 2008 CR which is equal or higher than 100%. At the same time, in two of the states (Hungary and Romania ) which shows a Clearance rate rise in the 2006-2008 period, the 2008 Clearance rate is still below 90%. Five states, Switzerland, Serbia, Sweden, Slovenia and Montenegro , show both a positive trend and a 2008 Clearance rate of administrative law cases above 100%.

36
389,
4%
112,
8%
159,
4%
104,
0%
119,
1%
105,
6%
106,
0%
109,
0%
82,6
%
92,8
%
91,4
%
30,6
%
85,2
%
82,4
%
96,6
%
77,5
%
86,3
% 108,
1%
80,2
%
139,
1%
36,7
%
115,
3%
80,2
% 100,
0%
86,9
%
89,9
%
100,
2%
76,2
%
89,0
%
89,3
%
29,3
%
87,9
%
87,9
% 108,
4%
107,
2%
118,
8% 141,
7%
117,
1%
36,0
% 61,7
%
66,7
%
96,2
%
97,2
%
100,
0%
107,
6%
37,0
%
33,6
%
-76,
1%
-44,
1% -23,
7%
-19,
1%
-18,
7%
-250
,3%
-16,
1%
-8,8
%
-6,4
%
-3,8
%
-2,1
%
-1,3
%
2,6%
5,5% 11
,8%
29,7
%
32,4
%
0,0%
50,0%
100,0%
150,0%
200,0%
250,0%
300,0%
350,0%
400,0%
Bos
nia
and
Her
zego
vina
Cze
ch R
epub
lic
Spa
in
Geo
rgia
FY
RO
Mac
edon
ia
Fin
land
Slo
vaki
a
Fra
nce
Tur
key
Latv
ia
Est
onia
Ukr
aine
Hun
gary
Rom
ania
Sw
itzer
land
Ser
bia
Sw
eden
Slo
veni
a
Mon
tene
gro
Alb
ania
Cro
atia
San
Mar
ino
Pol
and
Mol
dova
Arm
enia
UK
-Sco
tland
-350,0%
-300,0%
-250,0%
-200,0%
-150,0%
-100,0%
-50,0%
0,0%
50,0%
100,0%
Highest instance courts -Administrative law cases Clearance Rate 2006
Highest instance courts -Administrative law cases Clearance Rate 2008
Change between 2006 and 2008
Figure 20 - Evolution of the Clearance rate of admi nistrative law cases between 2006 and 2008,
highest instance courts, in % and change in % The figure above provides both 2006 and 2008 highest instance courts Clearance rate for administrative law cases between the 19 (+7) states, both the value of the variation between the two dates.

37
2.7. Disposition time and Clearance rate of the total number of civil, commercial and administrative law cases
2.7.1. Second instance courts The map below shows the total number of civil, commercial and administrative law cases at second instance courts Disposition time for 35 states and Clearance rate for 41 states. Numerical values displayed on the map represent Disposition time for each state expressed in days. Of the eleven states that have a Disposition time of less than 100 days, seven have also a Clearance rate of 100% or higher (Czech Republic, Poland, Sweden, Moldova, Armenia, S lovenia, Georgia ), while four (FYROMacedonia, Russian Federation, Hungary, Austria ) have a Clearance rate between 91 and 99%. Of the remaining seventeen states with a Disposition time of less than on year, eight (Portugal, Switzerland, Norway, Slovakia, Serbia, Bulgaria, An dorra, Montenegro ) have a 2008 Clearance rate above 100%, while nine (Lithuania, Bosnia and Herzegovina, Estonia, Latvia, Denmark, Croatia, Spain, Romania, Finland, ) have a Clearance rate lower than 100%. It should be mentioned, though, that in three of the latter cases (Lithuania, Bosnia and Herzegovina, Estonia) the Clearance rate is 99%. Of the five states with a Disposition time between one and two years, three (France, Greece and Albania ) have a Clearance rate below 100% while two, Malta and San Marino ) have a Clearance rate of 121% and 221% respectively. Italy and Cyprus , with a Disposition time of over three years have both a Clearance rate well below 100% (respectively 87% and 65%) Five of the six states for which Disposition time could not be calculated (Ukraine, UK-Scotland, Monaco, UK-England and Wales, Netherlands ) have a Clearance rate below 100%, while the remaining one, Luxembourg has a Clearance rate of 108%.
Figure 21 - Disposition time and Clearance rate of total number of civil, commercial and
administrative law cases at second instance courts in 2008

38
The table below provides the raw data used to draw the above map, including 2008 incoming, resolved and pending (on 31 December) cases, Clearance rate, case turnover ratio and Disposition time. Table 3 - Second instance courts 2008 Total of civi l, commercial and administrative law cases: incoming, resolved and pending (on 31 December), Cl earance rate, case turnover ratio and Disposition time
country
92.2.1. Second instance (appeal) courts Incoming cases - Total of civil, commercial and administrative law cases (1-7) (2008)
92.3.1. Second instance (appeal) courts Resolved cases - Total of civil, commercial and administrative law cases (1-7) (2008)
92.4.1. Second instance (appeal) courts Pending cases on 31 Dec. 08 - Total of civil, commercial and administrative law cases (1-7) (2008)
Second instance courts Clearance rate - Total of civil, commercial and administrative law cases (1-7) (2008)
Second instance courts Case Turnover Ratio - Total of civil, commercial and administrative law cases (1-7) (2008)
Second instance courts Disposition time - Total of civil, commercial and administrative law cases (1-7) (2008)
Albania 4.997 4.148 4.205 83% 99% 370 Andorra 491 544 199 111% 273% 134 Armenia 2.913 3.140 630 108% 498% 73 Austria 34.251 33.777 6.791 99% 497% 73 Azerbaijan NAP NAP NAP Belgium NA NA NA Bosnia and Herzegovina 40.723 37.246 29.233 91% 127% 286 Bulgaria 23.397 24.922 10.854 107% 230% 159 Croatia 81.089 78.372 59.595 97% 132% 278 Cyprus 222 145 524 65% 28% 1319 Czech Republic 72.788 73.488 17.086 101% 430% 85 Denmark 5.998 5.679 2.159 95% 263% 139 Estonia 3.869 3.559 1.384 92% 257% 142 Finland 3.918 3.890 1.917 99% 203% 180 France 246.118 244.647 248.112 99% 99% 370 Georgia 6.456 8.540 1.677 132% 509% 72 Germany Greece 34.900 29.800 41.196 85% 72% 505 Hungary 46.620 45.332 11.482 97% 395% 92 Iceland NAP NAP NAP Ireland Italy 159.187 138.707 448.906 87% 31% 1181 Latvia 6.861 6.435 5.016 94% 128% 285 Lichtenstein Lithuania 16.752 13.374 7.709 80% 173% 210 Luxembourg 1.328 1.438 NA 108% Malta 578 697 965 121% 72% 505 Moldova 9.686 9.941 1.515 103% 656% 56 Monaco 142 116 NA 82% Montenegro 6.354 7.384 5.254 116% 141% 260 Netherlands 26.494 25.419 NA 96% Norway 3.222 3.288 1.161 102% 283% 129 Poland 158.843 161.052 23.449 101% 687% 53 Portugal 17.751 17.869 5.950 101% 300% 122 Romania 32.390 32.006 14.243 99% 225% 162 Russian Federation 872.000 845.000 45.000 97% 1878% 19 San Marino 91 201 237 221% 85% 430 Serbia 81.353 84.742 39.711 104% 213% 171 Slovakia 31.534 32.451 9.521 103% 341% 107 Slovenia 21.502 23.322 5.809 108% 401% 91 Spain 193.520 191.064 119.391 99% 160% 228 Sweden 23.632 24.128 6.484 102% 372% 98 Switzerland 43.665 44.352 25.729 102% 172% 212 FYROMacedonia 23.332 21.252 5.393 91% 394% 93 Turkey Ukraine 248.848 95.023 38% UK-England and Wales 3.294 3.094 NA 94% UK-Northern Ireland NA NA NA UK-Scotland 215 130 NA 60%
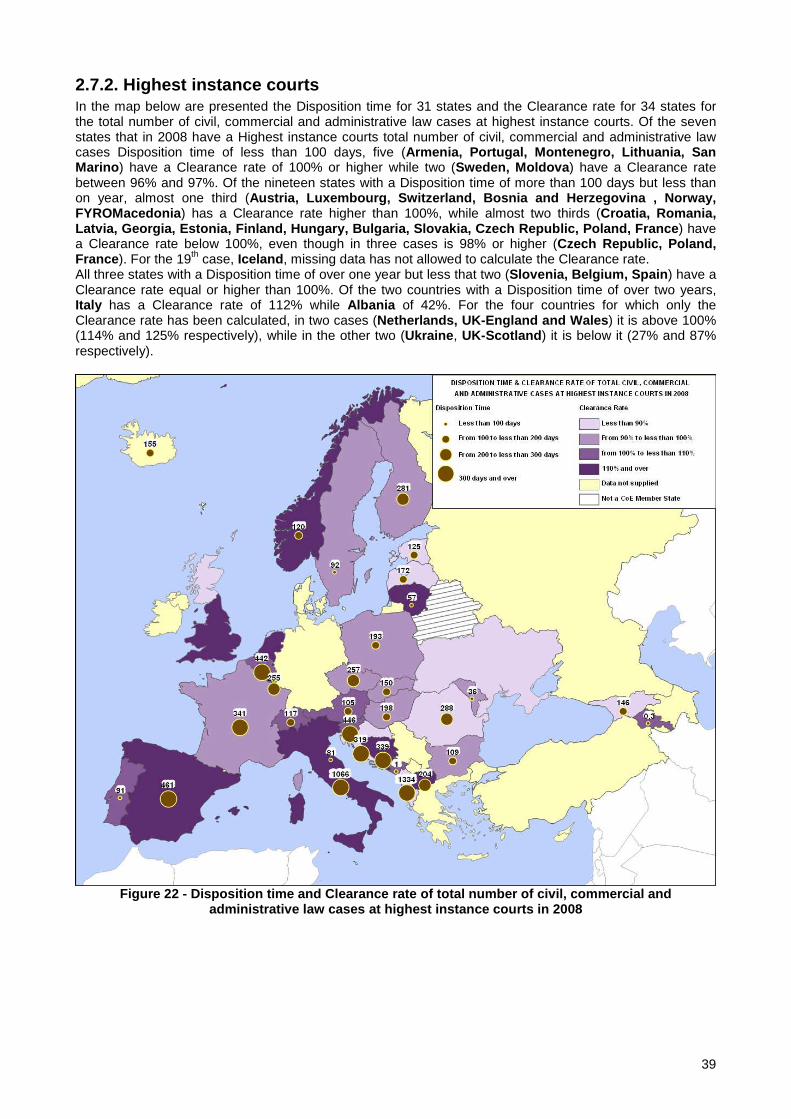
39
2.7.2. Highest instance courts In the map below are presented the Disposition time for 31 states and the Clearance rate for 34 states for the total number of civil, commercial and administrative law cases at highest instance courts. Of the seven states that in 2008 have a Highest instance courts total number of civil, commercial and administrative law cases Disposition time of less than 100 days, five (Armenia, Portugal, Montenegro, Lithuania, San Marino ) have a Clearance rate of 100% or higher while two (Sweden, Moldova ) have a Clearance rate between 96% and 97%. Of the nineteen states with a Disposition time of more than 100 days but less than on year, almost one third (Austria, Luxembourg, Switzerland, Bosnia and Herzeg ovina , Norway, FYROMacedonia ) has a Clearance rate higher than 100%, while almost two thirds (Croatia, Romania, Latvia, Georgia, Estonia, Finland, Hungary, Bulgari a, Slovakia, Czech Republic, Poland, France ) have a Clearance rate below 100%, even though in three cases is 98% or higher (Czech Republic, Poland, France ). For the 19th case, Iceland , missing data has not allowed to calculate the Clearance rate. All three states with a Disposition time of over one year but less that two (Slovenia, Belgium, Spain ) have a Clearance rate equal or higher than 100%. Of the two countries with a Disposition time of over two years, Italy has a Clearance rate of 112% while Albania of 42%. For the four countries for which only the Clearance rate has been calculated, in two cases (Netherlands, UK-England and Wales ) it is above 100% (114% and 125% respectively), while in the other two (Ukraine , UK-Scotland ) it is below it (27% and 87% respectively).
Figure 22 - Disposition time and Clearance rate of total number of civil, commercial and
administrative law cases at highest instance courts in 2008

40
The table below provides the raw data used to draw the above map, including 2008 incoming, resolved and pending (on 31 December) cases, Clearance rate, case turnover ratio and Disposition time.
Table 4 - Highest instance courts 2008 Total of civ il, commercial and administrative law cases: incoming, resolved and pending (on 31 December), Cl earance rate, case turnover ratio and Disposition time
country
93.2.1. Highest instance courts Incoming cases - Total of civil, commercial and administrative law cases (1-7) (2008)
93.3.1. Highest instance courts Resolved cases - Total of civil, commercial and administrative law cases (1-7) (2008)
93.4.1. Highest instance courts Pending cases on 31 Dec. 08 - Total of civil, commercial and administrative law cases (1-7) (2008)
Highest instance courts Clearance rate - Total of civil, commercial and administrative law cases (1-7) (2008)
Highest instance courts Case Turnover Ratio - Total of civil, commercial and administrative law cases (1-7) (2008)
Highest instance courts Disposition time - Total of civil, commercial and administrative law cases (1-7) (2008)
Albania 2.788 1.184 4.326 42% 27% 1334 Andorra Armenia 1.069 1.068 1 100% 106800% 0,3 Austria 2.857 2.882 827 101% 348% 105 Azerbaijan NAP NAP NAP Belgium 877 924 1.119 105% 83% 442 Bosnia and Herzegovina 8.741 10.307 9.568 118% 108% 339 Bulgaria 16.402 15.095 4.491 92% 336% 109 Croatia 2.672 1.958 1.711 73% 114% 319 Cyprus Czech Republic 10.137 9.938 6.986 98% 142% 257 Denmark Estonia 283 251 86 89% 292% 125 Finland 5.999 5.399 4.162 90% 130% 281 France 29.182 28.954 27.039 99% 107% 341 Georgia 2.830 2.494 995 88% 251% 146 Germany Greece Hungary 4.249 3.829 2.078 90% 184% 198 Iceland 353 150 235% 155 Ireland Italy 30.406 33.928 99.066 112% 34% 1066 Latvia 1.898 1.579 742 83% 213% 172 Lichtenstein Lithuania 496 611 96 123% 636% 57 Luxembourg 118 123 86 104% 143% 255 Malta NAP NAP NAP Moldova 5.648 5.470 543 97% 1007% 36 Monaco NA NA NA Montenegro 855 930 2 109% 46500% 1 Netherlands 1.334 1.520 NA 114% Norway 72 88 29 122% 303% 120 Poland 20.705 20.323 10.728 98% 189% 193 Portugal 2.969 3.025 755 102% 401% 91 Romania 21.099 16.979 13.394 80% 127% 288 Russian Federation 258000/10000 153000/56000 6000/500 San Marino 17 27 6 159% 450% 81 Serbia Slovakia 7.466 7.148 2.944 96% 243% 150 Slovenia 3.696 3.698 4.518 100% 82% 446 Spain 24.620 30.357 38.319 123% 79% 461 Sweden 5.420 5.221 1.318 96% 396% 92 Switzerland 5.729 6.106 1.962 107% 311% 117 FYROMacedonia 1.726 2.110 1.179 122% 179% 204 Turkey Ukraine 102.500 27.500 NA 27% UK-England and Wales 51 64 NA 125% UK-Northern Ireland NA NA NA UK-Scotland 3.904 3.385 NA 87%

41
2.8 Evolution of the Clearance rates of the total number of civil, commercial and administrative law cases between 2006 and 2008
2.8.1. Second instance courts 29 states have provided the data needed to calculate the Clearance rates of the total number of civil, commercial and administrative law cases at second instance courts in both 2006 and 2008. In addition to these Clearance rates, the figure below presents also 2008 Clearance rate for 11 further states (Ukraine, UK-Scotland, Cyprus, Albania, UK-England and Wales, Sweden, Serbia, Bulgaria, Montenegro, Malta, San Marino ). The CR of these 11 states is presented only for information purposes as lack of 2006 data did not allow to calculate their 2006 Clearance rates. The three figures just below present such 2006 and 2008 clearance data ordered respectively by state name, 2008 Clearance rate and 2006-2008 Clearance rate variation.
221%
121%
116%
107%
104%
102%
94%
83%
65%
60%
38%
132%
108%
111%
80%
87%
108%
97%
103%
102%
82%
108%
97%
101%
101%
97%
99%
99%
102%
96%
101%
92%
94%
95%
99%
99%
91%
91%
99%
103%
79%
65%
72%
56%
72%
96%
84%
94%
94%
76%
104%
94%
99%
100%
98%
100%
102%
105%
100%
106%
97%
100%
103%
108%
109%
101%
108%
117%
200%
0% 50% 100% 150% 200% 250%
San Marino
Malta
Montenegro
Bulgaria
Serbia
Sweden
UK-England and Wales
Albania
Cyprus
UK-Scotland
Ukraine
Georgia
Armenia
Andorra
Lithuania
Italy
Luxembourg
Croatia
Slovakia
Switzerland
Monaco
Slovenia
Russian Federation
Czech Republic
Portugal
Hungary
Austria
Spain
Norway
Netherlands
Poland
Estonia
Latvia
Denmark
Finland
France
FYROMacedonia
Bosnia and Herzegovina
Romania
Moldova
Appeal courts, totalof civil, commercialand administrativelaw casesClearance Rate2006
Appeal courts, totalof civil, commercialand administrativelaw casesClearance Rate2008
Figure 23 - Evolution of the Clearance rates of the total number of appeal courts civil, commercial
and administrative law cases between 2006 and 2008, in % (ordered by CR variation)

42
221%
132%
121%
116%
111%
108%
108%
108%
107%
104%
103%
103%
102%
102%
102%
101%
101%
101%
99%
99%
99%
99%
99%
97%
97%
97%
96%
95%
94%
94%
92%
91%
91%
87%
83%
82%
80%
65%
60%
38%
79%
72%
104%
96%
65%
94%
200%
105%
94%
106%
99%
100%
109%
108%
117%
102%
100%
98%
94%
84%
100%10
3%
100%
97%
108%
101%
72%76
%
56%
0%50
%10
0%15
0%20
0%25
0%
San
Mar
ino
Geo
rgia
Mal
ta
Mon
tene
gro
Ando
rra
Slo
veni
a
Luxe
mbo
urg
Arm
enia
Bulg
aria
Ser
bia
Slov
akia
Mol
dova
Sw
eden
Nor
way
Sw
itzer
land
Pol
and
Cze
ch R
epub
lic
Portu
gal
Fran
ce
Finl
and
Rom
ania
Spa
in
Aust
ria
Hun
gary
Rus
sian
Fed
erat
ion
Cro
atia
Net
herla
nds
Den
mar
k
UK
-Eng
land
and
Wal
es
Latvi
a
Esto
nia
Bos
nia
and
Her
zego
vina
FYR
OM
aced
onia
Italy
Alba
nia
Mon
aco
Lith
uani
a
Cyp
rus
UK
-Sco
tland
Ukr
aine
App
eal c
ourts
, tot
alof
civi
l, co
mm
erci
alan
d ad
min
istra
tive
law
cas
esC
lear
ance
Rat
e20
06
App
eal c
ourts
, tot
alof
civi
l, co
mm
erci
alan
d ad
min
istra
tive
law
cas
esC
lear
ance
Rat
e20
08
221%
121%
116%
107%
104%
102%
94%
83%
65%
60%
38%
132%
108%11
1%
80%87
%
108%
97%10
3%
102%
82%
108%
97%10
1%
101%
97%
99%
99%10
2%
96%10
1%
92%
94%
95%99
%
99%
91%
91%99
%103%
79%
65%72
%
56%
72%
96%
84%
94%
94%
76%
104%
94%99
%
100%
98%
100%
102%10
5%
100%10
6%
97%10
0%103%10
8%
109%
101%10
8%117%
200%
0%50
%10
0%15
0%20
0%25
0%
San
Mar
ino
Mal
ta
Mon
tene
gro
Bul
garia
Ser
bia
Sw
eden
UK
-Eng
land
and
Wal
es
Alba
nia
Cyp
rus
UK
-Sco
tland
Ukr
aine
Geo
rgia
Arm
enia
Ando
rra
Lith
uani
a
Italy
Luxe
mbo
urg
Cro
atia
Slo
vaki
a
Switz
erla
nd
Mon
aco
Slo
veni
a
Rus
sian
Fed
erat
ion
Cze
ch R
epub
lic
Por
tuga
l
Hun
gary
Aust
ria
Spa
in
Nor
way
Net
herla
nds
Pola
nd
Est
onia
Latv
ia
Den
mar
k
Finl
and
Fran
ce
FYR
OM
aced
onia
Bos
nia
and
Her
zego
vina
Rom
ania
Mol
dova
App
eal c
ourts
, tot
alof
civi
l, co
mm
erci
alan
d ad
min
istra
tive
law
cas
esC
lear
ance
Rat
e20
06
App
eal c
ourts
, tot
alof
civi
l, co
mm
erci
alan
d ad
min
istra
tive
law
cas
esC
lear
ance
Rat
e20
08
60%
38%
94%10
2%
102%
99%
108%
103%
104%
221%
97%
99%
101%
101%
102%
96%
116%
82%
103%
121%
108%
80%
94%
87%
97%
132%
91%99
%
99%
92%95
%101%
65%
97%
107%
91%99
%
108%11
1%
83%
94%10
2%104%
94%
94%
117%
100%10
6%
105%
100%
76%
200%
96%
56%
100%
72%
98%
79%
101%10
9%
108%
97%10
3%
99%
84%
108%
100%
65%72
%
0%50
%10
0%15
0%20
0%25
0%
UK-
Sco
tland
Ukr
aine
UK
-Eng
land
and
Wal
es
Sw
itzer
land
Sw
eden
Spa
in
Slo
veni
a
Slov
akia
Ser
bia
San
Mar
ino
Rus
sian
Fed
erat
ion
Rom
ania
Portu
gal
Pol
and
Nor
way
Net
herla
nds
Mon
tene
gro
Mon
aco
Mol
dova
Mal
ta
Luxe
mbo
urg
Lith
uani
a
Latv
ia
Italy
Hun
gary
Geo
rgia
FYR
OM
aced
onia
Fran
ce
Finl
and
Esto
nia
Den
mar
k
Cze
ch R
epub
lic
Cyp
rus
Cro
atia
Bulg
aria
Bosn
ia a
nd H
erze
govi
na
Aust
ria
Arm
enia
Ando
rra
Alba
nia
App
eal c
ourts
, tot
alof
civi
l, co
mm
erci
alan
d ad
min
istra
tive
law
cas
esC
lear
ance
Rat
e20
06
App
eal c
ourts
, tot
alof
civi
l, co
mm
erci
alan
d ad
min
istra
tive
law
cas
esC
lear
ance
Rat
e20
08
Ord
ered
by
2006
-200
8 C
lear
ance
rate
va
riatio
nO
rder
ed b
y st
ate
nam
eO
rder
ed b
y 20
08 C
lear
ance
rat
e
221%
132%
121%
116%
111%
108%
108%
108%
107%
104%
103%
103%
102%
102%
102%
101%
101%
101%
99%
99%
99%
99%
99%
97%
97%
97%
96%
95%
94%
94%
92%
91%
91%
87%
83%
82%
80%
65%
60%
38%
79%
72%
104%
96%
65%
94%
200%
105%
94%
106%
99%
100%
109%
108%
117%
102%
100%
98%
94%
84%
100%10
3%
100%
97%
108%
101%
72%76
%
56%
0%50
%10
0%15
0%20
0%25
0%
San
Mar
ino
Geo
rgia
Mal
ta
Mon
tene
gro
Ando
rra
Slo
veni
a
Luxe
mbo
urg
Arm
enia
Bulg
aria
Ser
bia
Slov
akia
Mol
dova
Sw
eden
Nor
way
Sw
itzer
land
Pol
and
Cze
ch R
epub
lic
Portu
gal
Fran
ce
Finl
and
Rom
ania
Spa
in
Aust
ria
Hun
gary
Rus
sian
Fed
erat
ion
Cro
atia
Net
herla
nds
Den
mar
k
UK
-Eng
land
and
Wal
es
Latvi
a
Esto
nia
Bos
nia
and
Her
zego
vina
FYR
OM
aced
onia
Italy
Alba
nia
Mon
aco
Lith
uani
a
Cyp
rus
UK
-Sco
tland
Ukr
aine
App
eal c
ourts
, tot
alof
civi
l, co
mm
erci
alan
d ad
min
istra
tive
law
cas
esC
lear
ance
Rat
e20
06
App
eal c
ourts
, tot
alof
civi
l, co
mm
erci
alan
d ad
min
istra
tive
law
cas
esC
lear
ance
Rat
e20
08
221%
121%
116%
107%
104%
102%
94%
83%
65%
60%
38%
132%
108%11
1%
80%87
%
108%
97%10
3%
102%
82%
108%
97%10
1%
101%
97%
99%
99%10
2%
96%10
1%
92%
94%
95%99
%
99%
91%
91%99
%103%
79%
65%72
%
56%
72%
96%
84%
94%
94%
76%
104%
94%99
%
100%
98%
100%
102%10
5%
100%10
6%
97%10
0%103%10
8%
109%
101%10
8%117%
200%
0%50
%10
0%15
0%20
0%25
0%
San
Mar
ino
Mal
ta
Mon
tene
gro
Bul
garia
Ser
bia
Sw
eden
UK
-Eng
land
and
Wal
es
Alba
nia
Cyp
rus
UK
-Sco
tland
Ukr
aine
Geo
rgia
Arm
enia
Ando
rra
Lith
uani
a
Italy
Luxe
mbo
urg
Cro
atia
Slo
vaki
a
Switz
erla
nd
Mon
aco
Slo
veni
a
Rus
sian
Fed
erat
ion
Cze
ch R
epub
lic
Por
tuga
l
Hun
gary
Aust
ria
Spa
in
Nor
way
Net
herla
nds
Pola
nd
Est
onia
Latv
ia
Den
mar
k
Finl
and
Fran
ce
FYR
OM
aced
onia
Bos
nia
and
Her
zego
vina
Rom
ania
Mol
dova
App
eal c
ourts
, tot
alof
civi
l, co
mm
erci
alan
d ad
min
istra
tive
law
cas
esC
lear
ance
Rat
e20
06
App
eal c
ourts
, tot
alof
civi
l, co
mm
erci
alan
d ad
min
istra
tive
law
cas
esC
lear
ance
Rat
e20
08
60%
38%
94%10
2%
102%
99%
108%
103%
104%
221%
97%
99%
101%
101%
102%
96%
116%
82%
103%
121%
108%
80%
94%
87%
97%
132%
91%99
%
99%
92%95
%101%
65%
97%
107%
91%99
%
108%11
1%
83%
94%10
2%104%
94%
94%
117%
100%10
6%
105%
100%
76%
200%
96%
56%
100%
72%
98%
79%
101%10
9%
108%
97%10
3%
99%
84%
108%
100%
65%72
%
0%50
%10
0%15
0%20
0%25
0%
UK-
Sco
tland
Ukr
aine
UK
-Eng
land
and
Wal
es
Sw
itzer
land
Sw
eden
Spa
in
Slo
veni
a
Slov
akia
Ser
bia
San
Mar
ino
Rus
sian
Fed
erat
ion
Rom
ania
Portu
gal
Pol
and
Nor
way
Net
herla
nds
Mon
tene
gro
Mon
aco
Mol
dova
Mal
ta
Luxe
mbo
urg
Lith
uani
a
Latv
ia
Italy
Hun
gary
Geo
rgia
FYR
OM
aced
onia
Fran
ce
Finl
and
Esto
nia
Den
mar
k
Cze
ch R
epub
lic
Cyp
rus
Cro
atia
Bulg
aria
Bosn
ia a
nd H
erze
govi
na
Aust
ria
Arm
enia
Ando
rra
Alba
nia
App
eal c
ourts
, tot
alof
civi
l, co
mm
erci
alan
d ad
min
istra
tive
law
cas
esC
lear
ance
Rat
e20
06
App
eal c
ourts
, tot
alof
civi
l, co
mm
erci
alan
d ad
min
istra
tive
law
cas
esC
lear
ance
Rat
e20
08
221%
132%
121%
116%
111%
108%
108%
108%
107%
104%
103%
103%
102%
102%
102%
101%
101%
101%
99%
99%
99%
99%
99%
97%
97%
97%
96%
95%
94%
94%
92%
91%
91%
87%
83%
82%
80%
65%
60%
38%
79%
72%
104%
96%
65%
94%
200%
105%
94%
106%
99%
100%
109%
108%
117%
102%
100%
98%
94%
84%
100%10
3%
100%
97%
108%
101%
72%76
%
56%
0%50
%10
0%15
0%20
0%25
0%
San
Mar
ino
Geo
rgia
Mal
ta
Mon
tene
gro
Ando
rra
Slo
veni
a
Luxe
mbo
urg
Arm
enia
Bulg
aria
Ser
bia
Slov
akia
Mol
dova
Sw
eden
Nor
way
Sw
itzer
land
Pol
and
Cze
ch R
epub
lic
Portu
gal
Fran
ce
Finl
and
Rom
ania
Spa
in
Aust
ria
Hun
gary
Rus
sian
Fed
erat
ion
Cro
atia
Net
herla
nds
Den
mar
k
UK
-Eng
land
and
Wal
es
Latvi
a
Esto
nia
Bos
nia
and
Her
zego
vina
FYR
OM
aced
onia
Italy
Alba
nia
Mon
aco
Lith
uani
a
Cyp
rus
UK
-Sco
tland
Ukr
aine
App
eal c
ourts
, tot
alof
civi
l, co
mm
erci
alan
d ad
min
istra
tive
law
cas
esC
lear
ance
Rat
e20
06
App
eal c
ourts
, tot
alof
civi
l, co
mm
erci
alan
d ad
min
istra
tive
law
cas
esC
lear
ance
Rat
e20
08
221%
121%
116%
107%
104%
102%
94%
83%
65%
60%
38%
132%
108%11
1%
80%87
%
108%
97%10
3%
102%
82%
108%
97%10
1%
101%
97%
99%
99%10
2%
96%10
1%
92%
94%
95%99
%
99%
91%
91%99
%103%
79%
65%72
%
56%
72%
96%
84%
94%
94%
76%
104%
94%99
%
100%
98%
100%
102%10
5%
100%10
6%
97%10
0%103%10
8%
109%
101%10
8%117%
200%
0%50
%10
0%15
0%20
0%25
0%
San
Mar
ino
Mal
ta
Mon
tene
gro
Bul
garia
Ser
bia
Sw
eden
UK
-Eng
land
and
Wal
es
Alba
nia
Cyp
rus
UK
-Sco
tland
Ukr
aine
Geo
rgia
Arm
enia
Ando
rra
Lith
uani
a
Italy
Luxe
mbo
urg
Cro
atia
Slo
vaki
a
Switz
erla
nd
Mon
aco
Slo
veni
a
Rus
sian
Fed
erat
ion
Cze
ch R
epub
lic
Por
tuga
l
Hun
gary
Aust
ria
Spa
in
Nor
way
Net
herla
nds
Pola
nd
Est
onia
Latv
ia
Den
mar
k
Finl
and
Fran
ce
FYR
OM
aced
onia
Bos
nia
and
Her
zego
vina
Rom
ania
Mol
dova
App
eal c
ourts
, tot
alof
civi
l, co
mm
erci
alan
d ad
min
istra
tive
law
cas
esC
lear
ance
Rat
e20
06
App
eal c
ourts
, tot
alof
civi
l, co
mm
erci
alan
d ad
min
istra
tive
law
cas
esC
lear
ance
Rat
e20
08
60%
38%
94%10
2%
102%
99%
108%
103%
104%
221%
97%
99%
101%
101%
102%
96%
116%
82%
103%
121%
108%
80%
94%
87%
97%
132%
91%99
%
99%
92%95
%101%
65%
97%
107%
91%99
%
108%11
1%
83%
94%10
2%104%
94%
94%
117%
100%10
6%
105%
100%
76%
200%
96%
56%
100%
72%
98%
79%
101%10
9%
108%
97%10
3%
99%
84%
108%
100%
65%72
%
0%50
%10
0%15
0%20
0%25
0%
UK-
Sco
tland
Ukr
aine
UK
-Eng
land
and
Wal
es
Sw
itzer
land
Sw
eden
Spa
in
Slo
veni
a
Slov
akia
Ser
bia
San
Mar
ino
Rus
sian
Fed
erat
ion
Rom
ania
Portu
gal
Pol
and
Nor
way
Net
herla
nds
Mon
tene
gro
Mon
aco
Mol
dova
Mal
ta
Luxe
mbo
urg
Lith
uani
a
Latv
ia
Italy
Hun
gary
Geo
rgia
FYR
OM
aced
onia
Fran
ce
Finl
and
Esto
nia
Den
mar
k
Cze
ch R
epub
lic
Cyp
rus
Cro
atia
Bulg
aria
Bosn
ia a
nd H
erze
govi
na
Aust
ria
Arm
enia
Ando
rra
Alba
nia
App
eal c
ourts
, tot
alof
civi
l, co
mm
erci
alan
d ad
min
istra
tive
law
cas
esC
lear
ance
Rat
e20
06
App
eal c
ourts
, tot
alof
civi
l, co
mm
erci
alan
d ad
min
istra
tive
law
cas
esC
lear
ance
Rat
e20
08
Ord
ered
by
2006
-200
8 C
lear
ance
rate
va
riatio
nO
rder
ed b
y st
ate
nam
eO
rder
ed b
y 20
08 C
lear
ance
rat
e
Figure 24 - Evolution of the Clearance rates of the total number of appeal courts civil, commercial
and administrative law cases between 2006 and 2008, in % The trend of the Clearance rate for the total number of appeal courts civil, commercial and administrative law cases is presented in the figure below. The average variation between 2006 and 2008 Clearance rates is

43
1,2% while the median is -1,2%. If the minimum and maximum values (-97% and +53% respectively) are excluded, the average rises to 2,9%. As it can be clearly observed in the data representation, just over half states (15 out of 29) present a negative trend when comparing 2006 and 2008 Clearance rates. With the exception of Moldova , with a -97%, and two other states with a decrease between -20% and -10% (Romania and Bosnia and Herzegovina ), the other states with a negative trend have it contained within a -10% (FYROMacedonia, France, Finland, Denmark, Latvia, Es tonia, Poland, Netherlands, Norway, Spain, Austria, Hungary ). Of the fourteen states in which the trend is positive, seven (Portugal, Czech Republic, Russian Federation, Slovenia, Monaco, Swi tzerland, Slovakia ) have an increase between 0% and 10%, three (Croatia, Luxembourg, Italy ), between 10% and 20%, two (Lithuania, Andorra ) between 20% and 40% and two (Armenia, Georgia ) above it Observing the 2006-2008 Clearance rate trend of the total number of appeal courts civil, commercial and administrative law cases for second instance courts while taking into account 2008 Clearance rates, it emerges that in twelve cases (FYROMacedonia, Bosnia and Herzegovina, Estonia, Lat via, Denmark, Netherlands, Hungary, Austria, Spain, Romania, Finl and, France ) Clearance rate decrease is linked with a 2008 Clearance rate below 100%. At the same time, in five of these twelve states (Austria, Spain, Romania, Finland, France ) the 2008 Clearance rate is 99%. In the remaining three cases (Poland, Norway, Moldova ) the negative Clearance rate trend it is linked with a 2008 Clearance rate which is higher than 100% and therefore the situation should be monitored but is not worrisome. Of the fourteen states which show a Clearance rate rise in the 2006-2008 period, the 2008 Clearance rate is still below 100% in five states (Lithuania, Monaco, Italy, Croatia, Russian Federati on ). As a consequence, while the trend is the right one, the number of pending cases is still increasing and efforts should be made to keep increasing the Clearance rate. The remaining nine states, (Portugal, Czech Republic, Switzerland, Slovakia, Armenia, Luxembourg, Slovenia, Andorra, G eorgia ), show both a positive trend and a 2008 Clearance rate above 100% for the total number of appeal courts civil, commercial and administrative law cases.
Georgia; 53,3%
Armenia; 43,0%
Andorra; 39,0%
Lithuania; 23,5%
Italy; 14,8%
Luxembourg; 12,6%
Croatia; 12,4%
Slovakia; 9,4%
Sw itzerland; 7,9%
Monaco; 6,1%
Slovenia; 4,5%
Russian Federation; 2,6%
Czech Republic; 2,4%
Portugal; 0,6%
Hungary; -1,2%
Austria; -1,4%
Spain; -2,8%
Norw ay; -3,1%
Netherlands; -3,7%
Poland; -4,8%
Estonia; -5,0%
Latvia; -6,6%
Denmark; -8,4%
Finland; -9,2%
France; -9,6%
FYROMacedonia; -9,6%
Bosnia and Herzegovina ; -16,9%
Romania; -18,0%
Moldova; -97,4%
-120,0% -100,0% -80,0% -60,0% -40,0% -20,0% 0,0% 20,0% 40,0% 60,0% 80,0%
Changebetween2006 and2008
Figure 25 - Evolution of the Clearance rates of the total number of appeal courts civil, commercial and administrative law cases between 2006 and 2008, change in %

44
200%
117%
108%
101% 10
9%
108%
103%
100%
97% 10
6%
100% 10
5%
102%
100%
98%
100%
99%
94% 10
4%
76%
94%
94%
84%
96%
72%
56%
72%
65%
79%
103%
99%
91%
91% 99
%
99%
95%
94%
92% 10
1%
96% 10
2%
99%
99%
97% 101%
101%
97%
108%
82%
102%
103%
97%
108%
87%
80%
111%
108%
132%
38%
60% 65
%
83%
94% 10
2%
104%
107% 11
6% 121%
53,3
%
43,0
%
39,0
%
7,9%
6,1%
4,5%
2,6%
-18,
0%
-16,
9% -9,6
%
-9,6
%
-9,2
%
-97,
4%
-8,4
%
-6,6
%
-5,0
%
-4,8
%
-3,7
%
-3,1
%
-2,8
%
-1,4
%
-1,2
%0,
6% 2,4% 9,
4%
12,4
%
12,6
%
14,8
%
23,5
%
0%
50%
100%
150%
200%M
oldo
va
Rom
ania
Bos
nia
and
Her
zego
vina
FY
RO
Mac
edon
ia
Fra
nce
Fin
land
Den
mar
k
Latv
ia
Est
onia
Pol
and
Net
herla
nds
Nor
way
Spa
in
Aus
tria
Hun
gary
Por
tuga
l
Cze
ch R
epub
lic
Rus
sian
Fed
erat
ion
Slo
veni
a
Mon
aco
Sw
itzer
land
Slo
vaki
a
Cro
atia
Luxe
mbo
urg
Ital
y
Lith
uani
a
And
orra
Arm
enia
Geo
rgia
Ukr
aine
UK
-Sco
tland
Cyp
rus
Alb
ania
UK
-Eng
land
and
Wal
es
Sw
eden
Ser
bia
Bul
garia
Mon
tene
gro
Mal
ta
San
Mar
ino
-200,0%
-150,0%
-100,0%
-50,0%
0,0%
50,0%
Appeal courts, total of civil, commercial and administrative law cases Clearance Rate 2006
Appeal courts, total of civil, commercial and administrative law cases Clearance Rate 2008
Change between 2006 and 2008
Figure 26 - Evolution of the Clearance rate of the total number of civil, commercial and administrativ e law cases between 2006 and 2008, appeal courts, in % and change in % The figure above provides both 2006 and 2008 second instance courts Clearance rate of the total number of civil, commercial and administrative law cases between the 29 (+11) states, both the value of the variation between the two dates.
2.8.2. Highest instance courts With the available data it has been possible to calculate the highest instance courts evolution of the Clearance rate of the total number of civil, commercial and administrative law cases between 2006 and 2008 in 26 states. 2008 Clearance rate data for further 8 states (San Marino, UK-England and Wales, Netherlands, Montenegro, Luxembourg, UK-Scotland, A lbania, Ukraine ) is provided for information purposes. The three figures just below present such 2006 and 2008 clearance data ordered respectively by state name, 2008 Clearance rate and 2006-2008 Clearance rate variation.
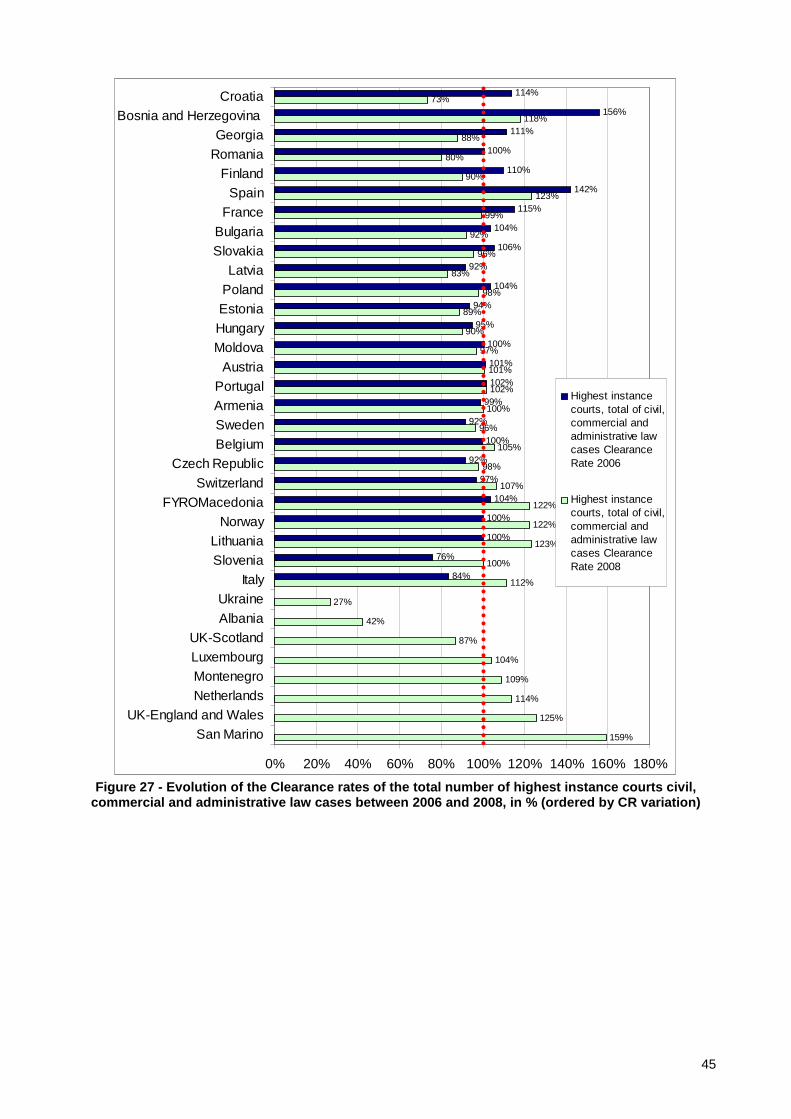
45
159%
125%
114%
109%
104%
87%
42%
27%
112%
100%
123%
122%
122%
107%
98%
105%
96%
100%
102%
101%
97%
90%
89%
98%
83%
96%
92%
99%
123%
90%
80%
88%
118%
73%
84%
76%
100%
100%
104%
97%
92%
100%
92%
99%
102%
101%
100%
95%
94%
104%
92%
106%
104%
115%
142%
110%
100%
111%
156%
114%
0% 20% 40% 60% 80% 100% 120% 140% 160% 180%
San MarinoUK-England and Wales
NetherlandsMontenegroLuxembourgUK-Scotland
Albania
UkraineItaly
SloveniaLithuania
NorwayFYROMacedonia
Switzerland
Czech RepublicBelgiumSwedenArmeniaPortugal
Austria
MoldovaHungaryEstoniaPolandLatvia
SlovakiaBulgaria
FranceSpain
FinlandRomaniaGeorgia
Bosnia and Herzegovina Croatia
Highest instancecourts, total of civil,commercial andadministrative lawcases ClearanceRate 2006
Highest instancecourts, total of civil,commercial andadministrative lawcases ClearanceRate 2008
Figure 27 - Evolution of the Clearance rates of the total number of highest instance courts civil,
commercial and administrative law cases between 200 6 and 2008, in % (ordered by CR variation)

46
87%
27%
125%
107%
96%
123%
100%
96%
159%
80%
102%
98%
122%
114%
109%
97%
104%
123%
83%
112%
90%
88%
122%
99%
90%
89%
98%
73%
92%
118%
105%
101%
100%
42%
97%
92%
142%
76%
106%
100%
102%104%
100%
100%
100%
92%
84%
95%
111%
104%
115%
110%
94%
92%
114%
104%
156%
100%
101%
99%
0%20
%40
%60
%80
%10
0%12
0%14
0%16
0%18
0%
UK
-Sco
tland
Ukr
aine
UK
-Eng
land
and
Wal
es
Sw
itzer
land
Sw
eden
Spa
in
Slo
veni
a
Slo
vaki
a
San
Mar
ino
Rom
ania
Port
ugal
Pola
nd
Nor
way
Net
herla
nds
Mon
tene
gro
Mol
dova
Luxe
mbo
urg
Lith
uani
a
Latv
ia
Italy
Hun
gary
Geo
rgia
FYR
OM
aced
onia
Fran
ce
Finl
and
Esto
nia
Cze
ch R
epub
lic
Cro
atia
Bul
garia
Bos
nia
and
Her
zego
vina
Bel
gium
Aus
tria
Arm
enia
Alb
ania
Hig
hest
inst
ance
cour
ts, t
otal
of c
ivil,
com
mer
cial
and
adm
inis
trativ
e la
wca
ses
Cle
aran
ceR
ate
2006
Hig
hest
inst
ance
cour
ts, t
otal
of c
ivil,
com
mer
cial
and
adm
inis
trativ
e la
wca
ses
Cle
aran
ceR
ate
2008
159%
125%
123%
123%
122%
122%
118%
114%
112%
109%
107%
105%
104%
102%
101%
100%
100%
99%
98%
98%
97%
96%
96%
92%
90%
90%
89%
88%
87%
83%
80%
73%
42%
27%
142%
100%10
4%
100%
156%
84%
97%10
0%
102%
101%
76%
99%
115%
104%
92%
100%
92%
106%
104%
95%
110%
94%
111%
92%
100%
114%
0%20
%40
%60
%80
%10
0%12
0%14
0%16
0%18
0%
San
Mar
ino
UK
-Eng
land
and
Wal
es
Spa
in
Lith
uani
a
FYR
OM
aced
onia
Nor
way
Bos
nia
and
Her
zego
vina
Net
herla
nds
Italy
Mon
tene
gro
Sw
itzer
land
Bel
gium
Luxe
mbo
urg
Port
ugal
Aus
tria
Slo
veni
a
Arm
enia
Fran
ce
Pola
nd
Cze
ch R
epub
lic
Mol
dova
Sw
eden
Slo
vaki
a
Bul
garia
Hun
gary
Finl
and
Esto
nia
Geo
rgia
UK
-Sco
tland
Latv
ia
Rom
ania
Cro
atia
Alb
ania
Ukr
aine
Hig
hest
inst
ance
cour
ts, t
otal
of c
ivil,
com
mer
cial
and
adm
inis
trativ
e la
wca
ses
Cle
aran
ceR
ate
2006
Hig
hest
inst
ance
cour
ts, t
otal
of c
ivil,
com
mer
cial
and
adm
inis
trativ
e la
wca
ses
Cle
aran
ceR
ate
2008
159%
125%
114%
109%
104%
87%
42%
27%
112%
100%
123%
122%
122%
107%
98%10
5%
96%10
0%
102%
101%
97%
90%
89%
98%
83%
96%
92%99
%
123%
90%
80%
88%
118%
73%
84%
76%
100%
100%10
4%
97%
92%
100%
92%99
%102%
101%
100%
95%
94%
104%
92%
106%
104%
115%
142%
110%
100%
111%
156%
114%
0%20
%40
%60
%80
%10
0%12
0%14
0%16
0%18
0%
San
Mar
ino
UK
-Eng
land
and
Wal
esN
ethe
rland
s
Mon
tene
gro
Luxe
mbo
urg
UK
-Sco
tland
Alb
ania
Ukr
aineItaly
Slo
veni
a
Lith
uani
aN
orw
ay
FYR
OM
aced
onia
Sw
itzer
land
Cze
ch R
epub
licB
elgi
um
Sw
eden
Arm
enia
Por
tuga
lA
ustri
a
Mol
dova
Hun
gary
Est
onia
Pol
and
Latv
iaS
lova
kia
Bul
garia
Fra
nce
Spa
inF
inla
nd
Rom
ania
Geo
rgia
Bos
nia
and
Her
zego
vina
Cro
atia
Hig
hest
inst
ance
cour
ts, t
otal
of c
ivil,
com
mer
cial
and
adm
inis
trativ
e la
wca
ses
Cle
aran
ceR
ate
2006
Hig
hest
inst
ance
cour
ts, t
otal
of c
ivil,
com
mer
cial
and
adm
inis
trativ
e la
wca
ses
Cle
aran
ceR
ate
2008
Ord
ered
by
2006
-200
8 C
lear
ance
rat
e va
riatio
nO
rder
ed b
y 20
08 C
lear
ance
rat
eO
rder
ed b
y st
ate
nam
e
87%
27%
125%
107%
96%
123%
100%
96%
159%
80%
102%
98%
122%
114%
109%
97%
104%
123%
83%
112%
90%
88%
122%
99%
90%
89%
98%
73%
92%
118%
105%
101%
100%
42%
97%
92%
142%
76%
106%
100%
102%104%
100%
100%
100%
92%
84%
95%
111%
104%
115%
110%
94%
92%
114%
104%
156%
100%
101%
99%
0%20
%40
%60
%80
%10
0%12
0%14
0%16
0%18
0%
UK
-Sco
tland
Ukr
aine
UK
-Eng
land
and
Wal
es
Sw
itzer
land
Sw
eden
Spa
in
Slo
veni
a
Slo
vaki
a
San
Mar
ino
Rom
ania
Port
ugal
Pola
nd
Nor
way
Net
herla
nds
Mon
tene
gro
Mol
dova
Luxe
mbo
urg
Lith
uani
a
Latv
ia
Italy
Hun
gary
Geo
rgia
FYR
OM
aced
onia
Fran
ce
Finl
and
Esto
nia
Cze
ch R
epub
lic
Cro
atia
Bul
garia
Bos
nia
and
Her
zego
vina
Bel
gium
Aus
tria
Arm
enia
Alb
ania
Hig
hest
inst
ance
cour
ts, t
otal
of c
ivil,
com
mer
cial
and
adm
inis
trativ
e la
wca
ses
Cle
aran
ceR
ate
2006
Hig
hest
inst
ance
cour
ts, t
otal
of c
ivil,
com
mer
cial
and
adm
inis
trativ
e la
wca
ses
Cle
aran
ceR
ate
2008
159%
125%
123%
123%
122%
122%
118%
114%
112%
109%
107%
105%
104%
102%
101%
100%
100%
99%
98%
98%
97%
96%
96%
92%
90%
90%
89%
88%
87%
83%
80%
73%
42%
27%
142%
100%10
4%
100%
156%
84%
97%10
0%
102%
101%
76%
99%
115%
104%
92%
100%
92%
106%
104%
95%
110%
94%
111%
92%
100%
114%
0%20
%40
%60
%80
%10
0%12
0%14
0%16
0%18
0%
San
Mar
ino
UK
-Eng
land
and
Wal
es
Spa
in
Lith
uani
a
FYR
OM
aced
onia
Nor
way
Bos
nia
and
Her
zego
vina
Net
herla
nds
Italy
Mon
tene
gro
Sw
itzer
land
Bel
gium
Luxe
mbo
urg
Port
ugal
Aus
tria
Slo
veni
a
Arm
enia
Fran
ce
Pola
nd
Cze
ch R
epub
lic
Mol
dova
Sw
eden
Slo
vaki
a
Bul
garia
Hun
gary
Finl
and
Esto
nia
Geo
rgia
UK
-Sco
tland
Latv
ia
Rom
ania
Cro
atia
Alb
ania
Ukr
aine
Hig
hest
inst
ance
cour
ts, t
otal
of c
ivil,
com
mer
cial
and
adm
inis
trativ
e la
wca
ses
Cle
aran
ceR
ate
2006
Hig
hest
inst
ance
cour
ts, t
otal
of c
ivil,
com
mer
cial
and
adm
inis
trativ
e la
wca
ses
Cle
aran
ceR
ate
2008
159%
125%
114%
109%
104%
87%
42%
27%
112%
100%
123%
122%
122%
107%
98%10
5%
96%10
0%
102%
101%
97%
90%
89%
98%
83%
96%
92%99
%
123%
90%
80%
88%
118%
73%
84%
76%
100%
100%10
4%
97%
92%
100%
92%99
%102%
101%
100%
95%
94%
104%
92%
106%
104%
115%
142%
110%
100%
111%
156%
114%
0%20
%40
%60
%80
%10
0%12
0%14
0%16
0%18
0%
San
Mar
ino
UK
-Eng
land
and
Wal
esN
ethe
rland
s
Mon
tene
gro
Luxe
mbo
urg
UK
-Sco
tland
Alb
ania
Ukr
aineItaly
Slo
veni
a
Lith
uani
aN
orw
ay
FYR
OM
aced
onia
Sw
itzer
land
Cze
ch R
epub
licB
elgi
um
Sw
eden
Arm
enia
Por
tuga
lA
ustri
a
Mol
dova
Hun
gary
Est
onia
Pol
and
Latv
iaS
lova
kia
Bul
garia
Fra
nce
Spa
inF
inla
nd
Rom
ania
Geo
rgia
Bos
nia
and
Her
zego
vina
Cro
atia
Hig
hest
inst
ance
cour
ts, t
otal
of c
ivil,
com
mer
cial
and
adm
inis
trativ
e la
wca
ses
Cle
aran
ceR
ate
2006
Hig
hest
inst
ance
cour
ts, t
otal
of c
ivil,
com
mer
cial
and
adm
inis
trativ
e la
wca
ses
Cle
aran
ceR
ate
2008
Ord
ered
by
2006
-200
8 C
lear
ance
rat
e va
riatio
nO
rder
ed b
y 20
08 C
lear
ance
rat
eO
rder
ed b
y st
ate
nam
e
Figure 28 - Evolution of the Clearance rates of the total number of highest instance courts civil,
commercial and administrative law cases between 200 6 and 2008, in %

47
The differential between the Highest instance courts 2006 and 2008 Clearance rates for the total number of appeal courts civil, commercial and administrative law cases is presented in the figure below. The average variation between 2006 and 2008 Clearance rates is -3,1% (compared to +1,2% at second instance courts) while the median is -4,3 (compared to -1,2% at second instance courts). The most consistent decrease is in Croatia , with a -41% while the highest increase take place in Italy , with a +28%. Fifteen out of twenty-six states present a negative trend when comparing 2006 and 2008 Clearance rates. In three of these cases the decrease is more than -20% (Croatia, Bosnia and Herzegovina, Georgia ), in five cases the Clearance rate decreases between -20% and -10% (Romania, Finland, Spain, France, Bulgaria ), while in the other seven states the negative trend is below -10% (Slovakia, Latvia, Poland, Estonia, Hungary, Moldova, Austria ). Of the eleven states characterized by a positive trend, six (Portugal, Armenia, Sweden, Belgium, Czech Republic, Switzerla nd ) have an increase between 0% and 10%, one between 10% and 20%(FYROMacedonia ),and four (Norway, Lithuania, Slovenia, Italy ) between 20% and 30%. Crossing the 2006-2008 highest instance courts Clearance rate trend for the total number of appeal courts civil, commercial and administrative law cases with the 2008 Clearance rates, it emerges that in twelve cases (Croatia, Romania, Latvia, Georgia, Estonia, Finland , Hungary, Bulgaria, Slovakia, Moldova, Poland, France ) Clearance rate decrease is linked with a 2008 Clearance rate below 100%. Especially in cases where both values are particularly low, the situation should be addressed (i.e. Croatia, Romania, Latvia, Georgia, Estonia, Finland ). In the remaining three cases (Austria, Bosnia and Herzegovina, Spain ) the negative Clearance rate trend it is linked with a 2008 Clearance rate which is higher than 100% and therefore the trend require observation but does not necessarily indicate a difficulty. Of the eleven states which show a Clearance rate rise in the 2006-2008 period, the 2008 Clearance rate is still below 100% in two states (Sweden, Czech Republic, ). In both cases, if the present trend is kept, 2010 data should show a Clearance rates equal or higher 100%. The situation though still needs to be monitored as at present the number of pending cases is still increasing. The remaining nine states, (Armenia, Slovenia, Portugal, Belgium, Switzerland, Italy, No rway, FYROMacedonia, Lithuania ), show both a positive trend and a 2008 Clearance rate above 100% for the total number of appeal courts civil, commercial and administrative law cases.

48
Italy; 27,9%
Slovenia; 24,3%
Lithuania; 23,2%
Norw ay; 22,2%
FYROMacedonia; 18,7%
Sw itzerland; 9,8%
Czech Republic; 6,3%
Belgium; 5,5%
Sw eden; 4,7%
Armenia; 1,0%
Portugal; 0,1%
Austria; -0,3%
Moldova; -3,6%
Hungary; -4,9%
Estonia; -4,9%
Poland; -5,6%
Latvia; -8,6%
Slovakia; -9,8%
Bulgaria; -11,8%
France; -15,6%
Spain; -18,8%
Finland; -19,6%
Romania; -19,9%
Georgia; -23,1%
Bosnia and Herzegovina ; -38,0%
Croatia; -40,7%
-50,0% -40,0% -30,0% -20,0% -10,0% 0,0% 10,0% 20,0% 30,0% 40,0%
Changebetween2006 and2008
Figure 29 - Evolution of the Clearance rates of the total number of highest instance courts civil, commercial and administrative law cases between 200 6 and 2008, change in %

49
114%
156%
111%
100%
110%
142%
115%
104%
106%
92%
104%
94%
95% 10
0%
101%
102%
99%
92% 10
0%
92% 97
% 104%
100%
100%
76% 84
%
73%
118%
88%
80%
90%
123%
99%
92% 96
%
83%
98%
89%
90% 97
% 101%
102%
100%
96% 10
5%
98% 10
7%
122%
122%
123%
100%
112%
27%
42%
87%
104% 10
9% 114%
125%
159%
27,9
%
24,3
%
23,2
%
22,2
%
18,7
%
1,0%
0,1%-0,3
%
-3,6
%
-4,9
%
-4,9
%
-5,6
%
-8,6
%
-9,8
%
-11,
8%
-15,
6%
-40,
7%
-18,
8%
-19,
6%
-19,
9%
-23,
1%
-38,
0%
4,7%
5,5% 6,3% 9,8%
0%
50%
100%
150%
200%
Cro
atia
Bos
nia
and
Her
zego
vina
Geo
rgia
Rom
ania
Fin
land
Spa
in
Fra
nce
Bul
garia
Slo
vaki
a
Latv
ia
Pol
and
Est
onia
Hun
gary
Mol
dova
Aus
tria
Por
tuga
l
Arm
enia
Sw
eden
Bel
gium
Cze
ch R
epub
lic
Sw
itzer
land
FY
RO
Mac
edon
ia
Nor
way
Lith
uani
a
Slo
veni
a
Ital
y
Ukr
aine
Alb
ania
UK
-Sco
tland
Luxe
mbo
urg
Mon
tene
gro
Net
herla
nds
UK
-Eng
land
and
Wal
es
San
Mar
ino
-200,0%
-150,0%
-100,0%
-50,0%
0,0%
50,0%
Highest instance courts, total of civil, commercial and administrative law cases Clearance Rate 2006Highest instance courts, total of civil, commercial and administrative law cases Clearance Rate 2008Change between 2006 and 2008
Figure 30 - Evolution of the Clearance rate of the total number of civil, commercial and administrativ e law cases between 2006 and 2008, highest instance c ourts, in % and change in % The figure above provides both 2006 and 2008 highest instance courts Clearance rate of the total number of civil, commercial and administrative law cases between the 26 (+8) states, both the value of the variation between the two dates.

50
2.9. Criminal law cases (severe criminal offences) and misdemeanor cases (minor offences) The following tables present data on the total number of incoming criminal cases and of two sub groups of this category of cases: severe criminal offences and minor offences. As pointed out in the Cepej European judicial systems study, Edition 2010 (data 2008), criminal law cases “are categorized by the CEPEJ into two types corresponding to the way of classifying in a majority of member states or entities: severe criminal cases and minor offences (misdemeanours). Examples of severe criminal cases are: murder, rape, organised crime, fraud, drugs trafficking, trafficking of human beings, etc. Minor offences may be shoplifting, certain categories of driving offences, disturbance of the public order, etc. However, it should be noted that for both types of cases there is a possibility that states classify criminal law cases in a different manner”.
2.9.1. Second instance courts The table below provides information on second instance courts total number of incoming criminal cases in 37 states, incoming severe criminal offences in 23 states and incoming minor offences in 20 states. Data is provided both in absolute values, both per 100.000 inhabitants. Absolutes values range from a minimum of second instance courts total number of incoming criminal cases 26 cases (San Marino ) to a maximum of 355.000 (Russian Federation ), with an average of 29.935 cases and a median of 10.951. Incoming severe criminal offences vary between a minimum of 2 (Monaco ) to a maximum of 111.121 (Poland though it should be noted that Russian Federation does not provide the specific data), with an average of 12.367 cases and a median of 4.794. Finally, incoming minor offences range from a minimum of 26 cases (Andorra ) to a maximum of 52.608 (Croatia ), with an average of 6.778 cases and a median of 2.634. Second instance courts total number of incoming criminal cases per 100.000 inhabitants ranges from a minimum 25 cases (Russian Federation ) to a maximum of 1398 (Croatia ), with an average of 211 cases and a median of 137. Incoming severe criminal offence cases per 100.000 inhabitants ranges from a minimum 6 of cases (Malta ) to a maximum of 342 (Hungary ), with an average of 113 cases and a median of 93. Finally, incoming minor offences per 100.000 inhabitants ranges from a minimum 6 of cases (Hungary ) to a maximum of 1186 (Croatia ), with an average of 156 cases and a median of 32 Over all, 13 states have a comparatively low number of second instance courts total number of incoming criminal cases per 100.000 inhabitants (less than 100: Russian Federation, Azerbaijan, UK-England and Wales, UK-Scotland, Armenia, Moldova, Slovakia, Rom ania, Georgia, San Marino, Albania, Andorra, Sweden ) while four states have comparatively high number of them (over 500: Slovenia, FYROMacedonia, Montenegro, Croatia )

51
Table 5 - Number of incoming criminal cases (severe criminal offences) and misdemeanour cases (minor offences) in second instance (appeal) courts . Absolute figures and per 100.000 inhabitants, in 2008
Per 100,000 inhabitants
Country
Second instance
(appeal) courts Incoming cases - Total criminal
cases
Second instance
(appeal) courts Incoming cases
- Severe criminal offences
Second instance (appeal) courts
Incoming cases -
Misdemeanour and/or minor
offences' cases
Total criminal cases
Severe criminal offences
Misdemeanour and/or minor
offences
Albania 2809 1854 955 88,6 58,5 30,1 Andorra 75 49 26 88,8 58,0 30,8 Armenia 1573 49,2 Austria 11628 8943 2685 139,5 107,3 32,2 Azerbaijan 2241 700 1894 26,0 8,1 21,9 Belgium 16716 7466 9248 156,7 7 86,7 Bosnia and Herzegovina
13774 8154 5620 358,5 212,2 146,3
Bulgaria 7922 103,7 Croatia 62002 9394 52608 1398,2 211,8 1186,3 Czech Republic 15263 146,3 Denmark 6860 6860 125,3 125,3 Estonia 2311 2143 168 172,3 159,8 12,5 Finland 11539 217,7 France 53298 83,4 Georgia 3309 2402 907 75,5 54,8 20,7 Hungary 34915 34361 554 347,6 342,1 5,5 Italy 88751 148,9 Latvia 2595 2115 480 114,3 93,1 21,1 Lithuania 6845 203,6 Malta 418 26 392 101,1 6,3 94,8 Moldova 2117 59,3 Monaco 2 6,4 Montenegro 4658 2582 751,1 416,4 Netherlands 37910 231,1 Norway 6826 144,1 Poland 119263 111121 8142 312,7 291,4 21,3 Portugal 13297 13297 125,2 125,2 Romania 16024 74,4 Russian Federation 355000 25 San Marino 26 26 83,1 83,1 Serbia 19310 262,7 Slovakia 3697 68,5 Slovenia 10951 4794 6157 540,6 236,6 303,9 Spain 144530 319,2 Sweden 9030 98,3 Switzerland 10563 4742 784 137,1 61,6 10,2 FYROMacedonia 12122 4663 7459 592,7 228,0 364,7 Ukraine 46427 100,2 UK-England and Wales
21259 7240 14019 39,1 13,3 25,8
UK-Scotland 2347 786 1561 45,4 15,2 30,2
Country Second Second Second

52
Per 100,000 inhabitants
instance (appeal) courts
Incoming cases - Total
criminal cases
instance (appeal) courts Incoming cases
- Severe criminal offences
instance (appeal) courts
Incoming cases -
Misdemeanour and/or minor
offences' cases
Total criminal cases
Severe criminal offences
Misdemeanour and/or minor
offences Average 211,05135 112,54348 156,205 Median 137,1 93,1 31,5
Minimum 25 6,3 5,5 Maximum 1398,2 342,1 1186,3
The table below presents the proportion of the severe and misdemeanour incoming cases in 2008 in second instance (appeal) courts in 22 states. In half of these states severe criminal cases are the majority of incoming total criminal cases (Bosnia and Herzegovina , Andorra, Albania, Georgia, Austria, Latvia, Estonia, Poland, Hungary, Denmark, Portugal, San Ma rino ), while in ten states the opposite is true (Malta, Croatia, Azerbaijan, UK-Scotland, UK-England and Wales, FYROMacedonia, Slovenia, Belgium, Montenegro ). Switzerland data needs to be checked as of the total criminal cases only 45% result as severe criminal cases while 7% is classified misdemeanour cases. The proportion of the severe and misdemeanour incoming cases ranges between a minimum of 6% severe criminal cases Vs 94% misdemeanour to a maximum of 100% severe criminal cases. Average proportion of severe criminal cases is 61% and median 62%. Table 6 - Part of second instance (appeal) courts i ncoming criminal cases (severe criminal offences) vs. misdemeanour cases (minor offences) criminal in 2008
Country
Second instance (appeal) courts
Incoming cases - Total criminal
cases
Second instance (appeal) courts
Incoming cases - Severe criminal
offences
Second instance (appeal) courts
Incoming cases - Misdemeanour and/or minor
offences' cases
Part of severe criminal offences
in the total number of criminal cases
Part of Misdemeanour and/or minor
offences in the total number of criminal cases
Albania 1854 955 2809 66% 34% Andorra 49 26 75 65% 35% Austria 8943 2685 11628 77% 23%
Azerbaijan 700 1894 2241 31% 85% Belgium 7466 9248 16716 45% 55%
Bosnia and Herzegovina
8154 5620 13774 59% 41%
Croatia 9394 52608 62002 15% 85% Denmark 6860 6860 100% 0% Estonia 2143 168 2311 93% 7% Georgia 2402 907 3309 73% 27% Hungary 34361 554 34915 98% 2%
Latvia 2115 480 2595 82% 18% Malta 26 392 418 6% 94%
Montenegro 2582 4658 45% 55% Poland 111121 8142 119263 93% 7%
Portugal 13297 13297 100% 0% San Marino 26 26 100% 0%
Slovenia 4794 6157 10951 44% 56% Switzerland 4742 784 10563 45% 7%
FYROMacedonia 4663 7459 12122 38% 62% UK-England and
Wales 7240 14019 21259 34% 66%
UK-Scotland 786 1561 2347 33% 67%
Average 11006 6118 16097 61% 38%
Median 4742 1894 8712 62% 34%
Minimum 26 26 26 6% 0%
Maximum 111121 52608 119263 100% 94%
2.9.2. Highest instance courts

53
As regards to data concerning highest instance courts criminal cases, it is possible to provide information on total number of incoming criminal cases in 34 states, incoming severe criminal offences in 14 states and incoming minor offences in 5 states. Data is provided both in absolute values, both per 100.000 inhabitants. Absolutes values range from a minimum of highest instance courts total number of incoming criminal cases 11 cases (UK-England and Wales ) to a maximum of 245.604 (Turkey ), with an average of 10371 cases and a median of 1077. Incoming severe criminal offences vary between a minimum of 11 cases (UK-England and Wales ) to a maximum of 44.029 (Italy ), with an average of 4538 cases and a median of 949. Finally, incoming minor offences range from a minimum of 0 cases (UK-England and Wales ) to a maximum of 1022 (Georgia ), with an average of 282 cases and a median of 125. Highest instance courts total number of incoming criminal cases per 100.000 inhabitants ranges from a minimum of 0,02 cases (UK-England and Wales ) to a maximum of 343 (Turkey ), with an average of 42 cases and a median of 20. Incoming severe criminal offence cases per 100.000 inhabitants ranges from a minimum of 0,02 cases (UK-England and Wales ) to a maximum of 74 (Italy ), with an average of 24 cases and a median of 17. Finally, incoming minor offences per 100.000 inhabitants ranges from a minimum of 0 cases (UK-England and Wales ) to a maximum of 23 (Georgia ), with an average of 156 cases and a median of 32 Over all, eight states have a total number of incoming criminal cases per 100.000 inhabitants at highest instance courts of ten or less (UK-England and Wales, Romania, Denmark, Norway, Arm enia, Estonia, Poland, Spain ) while another eight states have over 50 of them (Slovenia, Bosnia and Herzegovina, Italy, Moldova, Monaco, Serbia, Montenegro, Turkey ). Table 7 - Number of incoming criminal cases (severe criminal offences) and misdemeanour cases (minor offences) in highest instance courts. Absolu te figures and per 100.000 inhabitants, in 2008
Per 100,000 inhabitants
country
Highest instance courts
Incoming cases - Total
criminal cases
Highest instance courts Incoming cases
- Severe criminal offences
Highest instance courts Incoming cases - Misdemeanour
and/or minor offences
Total criminal cases
Severe criminal offences
Misdemeanour and/or minor
offences Albania 912 28,8 Armenia 88 2,8 Austria 942 11,3
Azerbaijan 972 11,3 Belgium 1939 18,2
Bosnia and Herzegovina
2320 2320 60,4 60,4
Croatia 999 999 22,5 22,5 Czech Republic 2718 26,1
Denmark 59 59 1,1 1,1 Estonia 96 51 45 7,2 3,8 3,4 Finland 1220 23,0 France 8348 13,1 Georgia 1575 553 1022 35,9 12,6 23,3 Hungary 1131 1131 11,3 11,3
Italy 44029 44029 73,9 73,9 Latvia 711 491 220 31,3 21,6 9,7
Lithuania 509 15,1 Moldova 2842 79,5 Monaco 35 112,5
Montenegro 925 149,2 Netherlands 3683 22,4
Norway 88 1,9 Poland 2827 7,4
Portugal 1221 1221 11,5 11,5 Romania 42 0,2
Serbia 9720 132,2 Slovakia 1190 22,0 Slovenia 1023 898 125 50,5 44,3 6,2
Spain 4470 9,9 Sweden 1554 16,9
Switzerland 1418 18,4 FYROMacedonia 700 700 34,2 34,2
Turkey 245604 343,4 Ukraine 16800 36,3
UK-England and Wales
11 11 0 0,02 0,02 0

54
UK-Scotland 951 18,4
Per 100,000 inhabitants
country
Highest instance courts
Incoming cases - Total
criminal cases
Highest instance courts Incoming cases
- Severe criminal offences
Highest instance courts
Incoming cases -
Misdemeanour and/or minor
offences Total criminal
cases
Severe criminal offences
Misdemeanour and/or minor
offences Average 41,8 24,0 8,5 Median 20,2 17,35 6,2
Minimum 0,02 0,02 0 Maximum 343,4 73,9 23,3
The table below presents the proportion of the severe and misdemeanour incoming cases in 2008 in highest instance courts in 12 states. In all cases but one state (Georgia ) severe criminal cases are the majority of incoming total criminal cases (Estonia, Latvia, Slovenia, Bosnia and Herzegovina, Croatia, Denmark, Hungary, Italy, Portugal, FYROMacedonia, UK-England and Wales ). In eight states (Bosnia and Herzegovina, Croatia, Denmark, Hungary, Italy, Port ugal, FYROMacedonia, UK-England and Wales ) severe criminal cases constitute the totality of criminal cases dealt by the highest instance courts. The proportion of the severe and misdemeanour incoming cases ranges between a minimum of 35% severe criminal cases Vs 65% misdemeanour to a maximum of 100% severe criminal cases. Average proportion of severe criminal cases is 87% and median is 100%. Table 8 - Part of highest instance courts incoming criminal cases (severe criminal offences) vs. misdemeanour cases (minor offences) criminal in 200 8
Country
Highest instance courts Incoming
cases - Total criminal cases
Highest instance courts Incoming cases - Severe
criminal offences
Highest instance courts Incoming
cases - Misdemeanour and/or minor
offences
Part of severe criminal offences
in the total number of
criminal cases
Part of Misdemeanour and/or minor
offences in the total number of criminal cases
Bosnia and Herzegovina
2320 2320 100% 0%
Croatia 999 999 100% 0% Denmark 59 59 100% 0% Estonia 51 45 96 53% 47% Georgia 553 1022 1575 35% 65% Hungary 1131 1131 100% 0%
Italy 44029 44029 100% 0% Latvia 491 220 711 69% 31%
Portugal 1221 1221 100% 0% Slovenia 898 125 1023 88% 12%
FYROMacedonia 700 700 100% 0% UK-England and Wales 11 0 11 100% 0%
Average 4372 282 4490 87% 13% Median 799 125 1011 100% 0%
Minimum 11 0 11 35% 0% Maximum 44029 1022 44029 100% 65%

55
2.10. Clearance rate of criminal cases (severe criminal offences) and misdemeanour cases (minor offences) in 2008
2.10.1. Second instance courts The figures below show the 2008 Clearance rate in second instance courts for severe criminal cases (22 states) and misdemeanour cases (19 states) first separately and then together. Severe criminal cases Clearance rate ranges between a minimum of 68,4% (Albania ) and a maximum of 177,7%. Sixteen states have a Clearance rate above 95,0% (UK-Scotland, San Marino, Slovenia, Switzerland, Georgia, Poland, Croatia, Belgium, Hun gary, Monaco -with a CR equal or higher than 100,0%, Bosnia and Herzegovina, Denmark, France, FYROMace donia, Portugal, Estonia -with a CR lower than 100,0%) while in six cases it is below it (Latvia, Austria, Malta, UK-England and Wales, Andorra, Albania ). Misdemeanour cases Clearance rate ranges between a minimum of 53,4% (UK-Scotland ) and a maximum of 135,8%(Croatia ). Thirteen states have a Clearance rate above 95,0% (Croatia, Serbia, Bosnia and Herzegovina , Malta, Austria, Hungary, Montenegro -with a CR equal or higher than 100,0%, UK-England and Wales, Georgia, Poland, Estonia, FYROMa cedonia, Switzerland -with a CR lower than 100,0%). Of the eighteen states for which it has been possible to calculate both severe criminal cases and misdemeanour cases Clearance rates, only two have a value equal or higher than 100% in both (Hungary, Croatia ). Two more have a severe criminal cases Clearance rate higher than 100% and a misdemeanour cases Clearance rate very near to it (within 1%) (Poland, Georgia ) while another (Bosnia and Herzegovina ) has a misdemeanour cases Clearance rate higher than 100% and a severe criminal cases Clearance rate very close to 100% (99,7%). Only three countries (Andorra, Albania, Latvia ) have both Clearance rates below 95%
Second instance courts, severe criminal offences, 2008 Clearance Rate
177,7%
111,5%
102,5%
102,4%
101,5%
101,2%
100,7%
100,5%
100,5%
100,0%
99,7%
99,0%
98,9%
97,5%
97,4%
97,4%
94,1%
94,0%
80,8%
79,8%
75,5%
68,4%
0,0% 20,0% 40,0% 60,0% 80,0% 100,0% 120,0% 140,0% 160,0% 180,0% 200,0%
UK-Scotland
San Marino
Slovenia
Switzerland
Georgia
Poland
Croatia
Belgium
Hungary
Monaco
Bosnia and Herzegovina
Denmark
France
FYROMacedonia
Portugal
Estonia
Latvia
Austria
Malta
UK-England and Wales
Andorra
Albania
Second instance courts, Misdemeanour and/or minor offences' cases, 2008 Clearance Rate
135,8%
128,2%
119,4%
110,5%
103,1%
100,7%
100,0%
99,9%
99,8%
99,2%
97,6%
96,2%
95,9%
94,8%
93,3%
86,8%
82,6%
73,1%
53,4%
0,0% 20,0% 40,0% 60,0% 80,0% 100,0% 120,0% 140,0% 160,0% 180,0% 200,0%
Croatia
Serbia
Bosnia and Herzegovina
Malta
Austria
Hungary
Montenegro
UK-England and Wales
Georgia
Poland
Estonia
FYROMacedonia
Switzerland
Latvia
Belgium
Slovenia
Albania
Andorra
UK-Scotland
Figure 31 - Clearance rate of criminal cases (sever e
criminal offences) in 2008, in second instance cour ts Figure 32 - Clearance rate of misdemeanour cases (minor offences) in 2008, in second instance courts
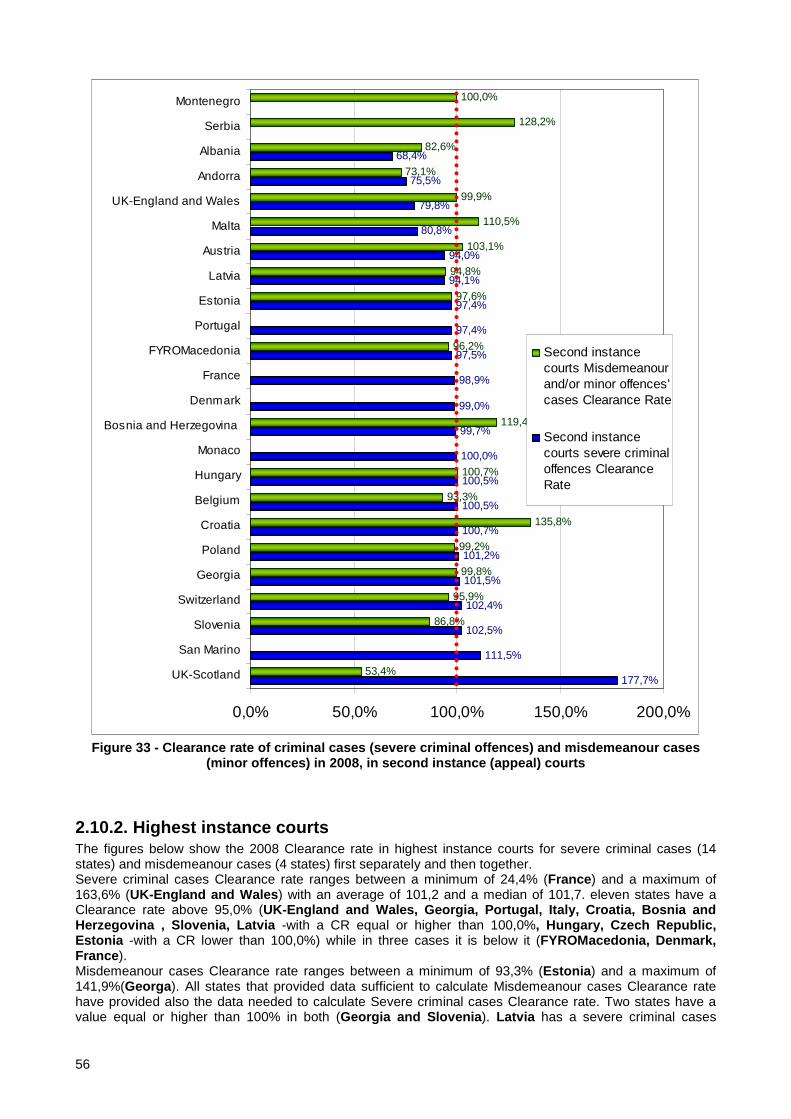
56
177,7%
111,5%
102,5%
102,4%
101,5%
101,2%
100,7%
100,5%
100,5%
100,0%
99,7%
99,0%
98,9%
97,5%
97,4%
97,4%
94,1%
94,0%
80,8%
79,8%
75,5%
68,4%
53,4%
86,8%
95,9%
99,8%
99,2%
135,8%
93,3%
100,7%
119,4%
96,2%
97,6%
94,8%
103,1%
110,5%
99,9%
73,1%
82,6%
128,2%
100,0%
0,0% 50,0% 100,0% 150,0% 200,0%
UK-Scotland
San Marino
Slovenia
Switzerland
Georgia
Poland
Croatia
Belgium
Hungary
Monaco
Bosnia and Herzegovina
Denmark
France
FYROMacedonia
Portugal
Estonia
Latvia
Austria
Malta
UK-England and Wales
Andorra
Albania
Serbia
Montenegro
Second instancecourts Misdemeanourand/or minor offences'cases Clearance Rate
Second instancecourts severe criminaloffences ClearanceRate
Figure 33 - Clearance rate of criminal cases (sever e criminal offences) and misdemeanour cases
(minor offences) in 2008, in second instance (appea l) courts
2.10.2. Highest instance courts The figures below show the 2008 Clearance rate in highest instance courts for severe criminal cases (14 states) and misdemeanour cases (4 states) first separately and then together. Severe criminal cases Clearance rate ranges between a minimum of 24,4% (France ) and a maximum of 163,6% (UK-England and Wales ) with an average of 101,2 and a median of 101,7. eleven states have a Clearance rate above 95,0% (UK-England and Wales, Georgia, Portugal, Italy, Cro atia, Bosnia and Herzegovina , Slovenia, Latvia -with a CR equal or higher than 100,0%, Hungary, Czech Republic, Estonia -with a CR lower than 100,0%) while in three cases it is below it (FYROMacedonia, Denmark, France ). Misdemeanour cases Clearance rate ranges between a minimum of 93,3% (Estonia ) and a maximum of 141,9%(Georga ). All states that provided data sufficient to calculate Misdemeanour cases Clearance rate have provided also the data needed to calculate Severe criminal cases Clearance rate. Two states have a value equal or higher than 100% in both (Georgia and Slovenia ). Latvia has a severe criminal cases

57
Clearance rate higher than 100% and a misdemeanour cases Clearance rate below 95% while Estonia has both Clearance rates below 100% and misdemeanour cases Clearance rate below 95%
Highest instance courts severe criminal offences Cl earance Rate
163,6%
130,0%
110,7%
110,6%
108,3%
103,4%
102,9%
100,4%
99,2%
96,4%
96,1%
91,7%
79,7%
24,4%
0,0% 50,0% 100,0% 150,0% 200,0%
UK-England and Wales
Georgia
Portugal
Italy
Croatia
Bosnia and Herzegovina
Slovenia
Latvia
Hungary
Czech Republic
Estonia
FYROMacedonia
Denmark
France
Highest instance courts misdemeanour and/or minor o ffences' cases Clearance Rate
141,9%
124,8%
93,6%
93,3%
0,0% 50,0% 100,0% 150,0%
Georgia
Slovenia
Latvia
Estonia
Figure 34- Clearance rate of criminal cases (severe
criminal offences) in 2008, in Highest instance cou rts Figure 35 - Clearance rate of misdemeanour cases
(minor offences) in 2008, in Highest instance court s
163,6%
130,0%
110,7%
110,6%
108,3%
103,4%
102,9%
100,4%
99,2%
96,4%
96,1%
91,7%
79,7%
24,4%
141,9%
124,8%
93,6%
93,3%
0,0% 20,0% 40,0% 60,0% 80,0% 100,0% 120,0% 140,0% 160,0% 180,0%
UK-England and Wales
Georgia
Portugal
Italy
Croatia
Bosnia and Herzegovina
Slovenia
Latvia
Hungary
Czech Republic
Estonia
FYROMacedonia
Denmark
FranceHighest instancecourts Misdemeanourand/or minor offences'cases Clearance Rate
Highest instancecourts severe criminaloffences ClearanceRate
Figure 36 - Clearance rate of criminal cases (sever e criminal offences) and misdemeanour cases (minor offences) in 2008, in highest instance court s
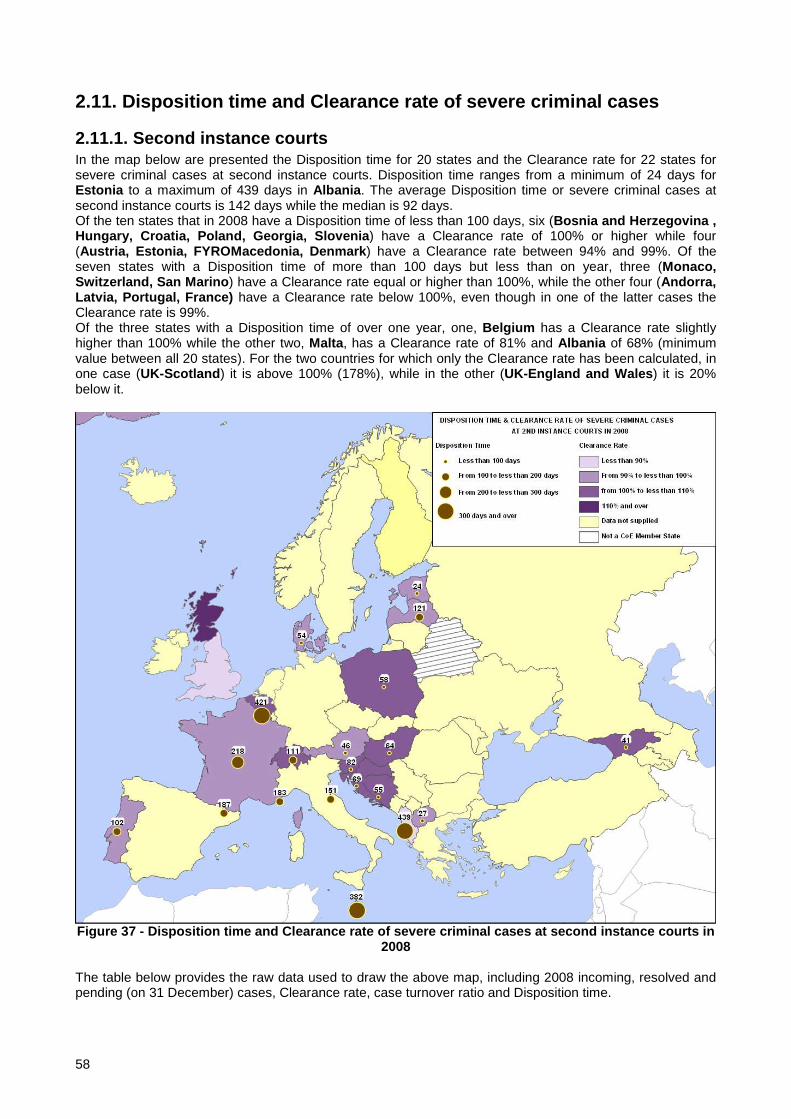
58
2.11. Disposition time and Clearance rate of severe criminal cases
2.11.1. Second instance courts In the map below are presented the Disposition time for 20 states and the Clearance rate for 22 states for severe criminal cases at second instance courts. Disposition time ranges from a minimum of 24 days for Estonia to a maximum of 439 days in Albania . The average Disposition time or severe criminal cases at second instance courts is 142 days while the median is 92 days. Of the ten states that in 2008 have a Disposition time of less than 100 days, six (Bosnia and Herzegovina , Hungary, Croatia, Poland, Georgia, Slovenia ) have a Clearance rate of 100% or higher while four (Austria, Estonia, FYROMacedonia, Denmark ) have a Clearance rate between 94% and 99%. Of the seven states with a Disposition time of more than 100 days but less than on year, three (Monaco, Switzerland, San Marino ) have a Clearance rate equal or higher than 100%, while the other four (Andorra, Latvia, Portugal, France) have a Clearance rate below 100%, even though in one of the latter cases the Clearance rate is 99%. Of the three states with a Disposition time of over one year, one, Belgium has a Clearance rate slightly higher than 100% while the other two, Malta , has a Clearance rate of 81% and Albania of 68% (minimum value between all 20 states). For the two countries for which only the Clearance rate has been calculated, in one case (UK-Scotland ) it is above 100% (178%), while in the other (UK-England and Wales ) it is 20% below it.
Figure 37 - Disposition time and Clearance rate of severe criminal cases at second instance courts in
2008 The table below provides the raw data used to draw the above map, including 2008 incoming, resolved and pending (on 31 December) cases, Clearance rate, case turnover ratio and Disposition time.

59
Table 9 - Second instance courts 2008 Criminal case s (severe criminal offences): incoming, resolved and pending (on 31 December), Clearance rate, case turnover ratio and Disposition time
country
92.2.10. Second instance (appeal) courts Incoming cases - (8) Criminal cases (severe criminal offences) (2008)
92.3.10. Second instance (appeal) courts Resolved cases - (8) Criminal cases (severe criminal offences) (2008)
92.4.10. Second instance (appeal) courts Pending cases on 31 Dec. 08 - (8) Criminal cases (severe criminal offences) (2008)
Second instance courts Clearance rate - (8) Criminal cases (severe criminal offences) (2008)
Second instance courts Case Turnover Ratio - (8) Criminal cases (severe criminal offences) (2008)
Second instance courts Disposition time - (8) Criminal cases (severe criminal offences) (2008)
Albania 1.854 1.268 1.524 68% 83% 439 Andorra 49 37 19 76% 195% 187 Armenia Austria 8.943 8.404 1.065 94% 789% 46 Azerbaijan 700 NA NA Belgium 7.466 7.507 8.664 101% 87% 421 Bosnia and Herzegovina 8.154 8.133 1.236 100% 658% 55 Bulgaria NA NA NA Croatia 9.394 9.459 1.794 101% 527% 69 Cyprus Czech Republic Denmark 6.860 6.788 999 99% 679% 54 Estonia 2.143 2.087 135 97% 1546% 24 Finland NAP NAP NAP France 53.298 52.718 31.418 99% 168% 218 Georgia 2.402 2.437 274 101% 889% 41 Germany Greece Hungary 34.361 34.522 6.079 100% 568% 64 Iceland NAP NAP NAP Ireland Italy NA NA NA Latvia 2.115 1.990 660 94% 302% 121 Lichtenstein Lithuania Luxembourg NA NA NA Malta 26 21 22 81% 95% 382 Moldova Monaco 2 2 1 100% 200% 183 Montenegro Netherlands NA NA NA Norway Poland 111.121 112.413 17.730 101% 634% 58 Portugal 13.297 12.957 3.634 97% 357% 102 Romania NAP NAP NAP Russian Federation NA NA NA San Marino 26 29 12 112% 242% 151 Serbia Slovakia Slovenia 4.794 4.916 1.100 103% 447% 82 Spain Sweden NAP NAP NAP Switzerland 4.742 4.858 1.481 102% 328% 111 FYROMacedonia 4.663 4.546 339 97% 1341% 27 Turkey Ukraine NAP NAP NAP UK-England and Wales 7.240 5.774 NA 80% UK-Northern Ireland NA NA NA UK-Scotland 786 1.397 NA 178%
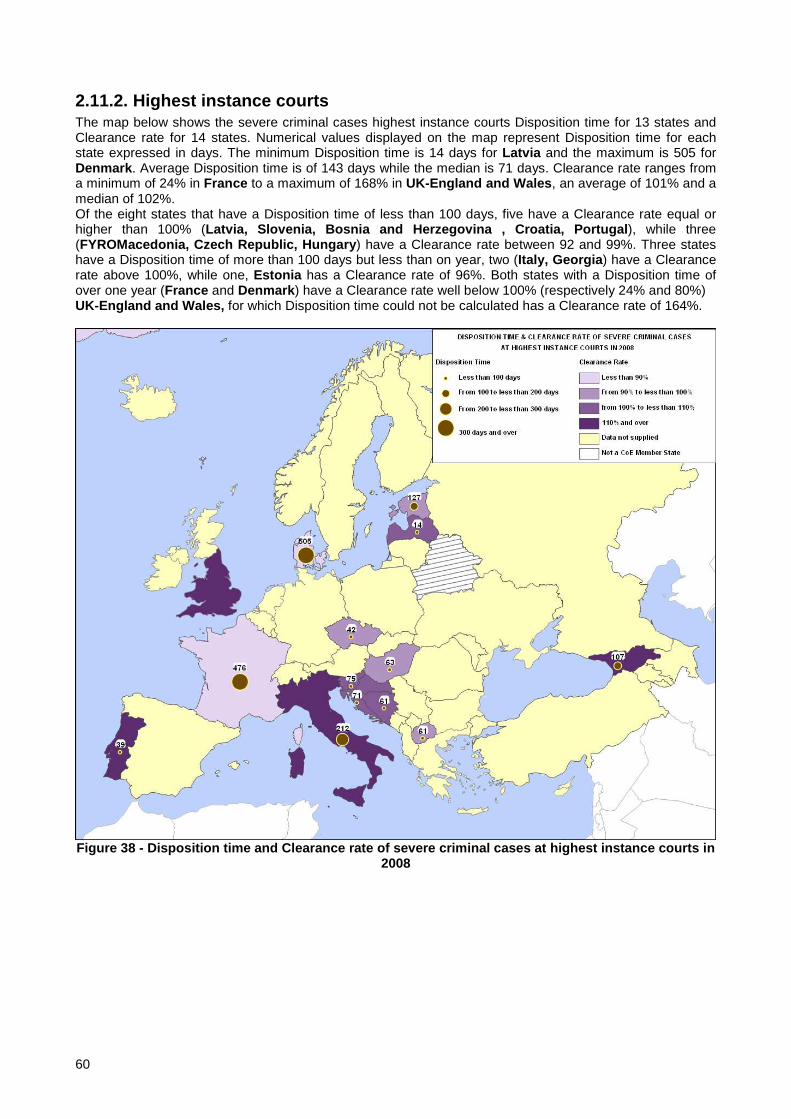
60
2.11.2. Highest instance courts The map below shows the severe criminal cases highest instance courts Disposition time for 13 states and Clearance rate for 14 states. Numerical values displayed on the map represent Disposition time for each state expressed in days. The minimum Disposition time is 14 days for Latvia and the maximum is 505 for Denmark . Average Disposition time is of 143 days while the median is 71 days. Clearance rate ranges from a minimum of 24% in France to a maximum of 168% in UK-England and Wales , an average of 101% and a median of 102%. Of the eight states that have a Disposition time of less than 100 days, five have a Clearance rate equal or higher than 100% (Latvia, Slovenia, Bosnia and Herzegovina , Croatia, Portugal ), while three (FYROMacedonia, Czech Republic, Hungary ) have a Clearance rate between 92 and 99%. Three states have a Disposition time of more than 100 days but less than on year, two (Italy, Georgia ) have a Clearance rate above 100%, while one, Estonia has a Clearance rate of 96%. Both states with a Disposition time of over one year (France and Denmark ) have a Clearance rate well below 100% (respectively 24% and 80%) UK-England and Wales, for which Disposition time could not be calculated has a Clearance rate of 164%.
Figure 38 - Disposition time and Clearance rate of severe criminal cases at highest instance courts in
2008

61
The table below provides the raw data used to draw the above map, including 2008 incoming, resolved and pending (on 31 December) cases, Clearance rate, case turnover ratio and Disposition time. Table 10 - Highest instance courts 2008 Criminal ca ses (severe criminal offences): incoming, resolved and pending (on 31 December), Clearance ra te, case turnover ratio and Disposition time
country
93.2.10. Highest instance courts Incoming cases - (8) Criminal cases (severe criminal offences) (2008)
93.3.10. Highest instance courts Resolved cases - (8) Criminal cases (severe criminal offences) (2008)
93.4.10. Highest instance courts Pending cases on 31 Dec. 08 - (8) Criminal cases (severe criminal offences) (2008)
Highest instance courts Clearance rate - (8) Criminal cases (severe criminal offences) (2008)
Highest instance courts Case Turnover Ratio - (8) Criminal cases (severe criminal offences) (2008)
Highest instance courts Disposition time - (8) Criminal cases (severe criminal offences) (2008)
Albania NAP NAP NAP Andorra Armenia Austria NA NA NA Azerbaijan NA NA NA Belgium NA NA NA Bosnia and Herzegovina 2.320 2.399 399 103% 601% 61 Bulgaria NA NA NA Croatia 999 1.082 209 108% 518% 71 Cyprus Czech Republic 2.718 2.619 304 96% 862% 42 Denmark 59 47 65 80% 72% 505 Estonia 51 49 17 96% 288% 127 Finland NAP NAP NAP France 8.348 2.037 2.654 24% 77% 476 Georgia 553 719 211 130% 341% 107 Germany Greece Hungary 1.131 1.122 195 99% 575% 63 Iceland NAP NAP NAP Ireland Italy 44.029 48.683 28.340 111% 172% 212 Latvia 491 493 19 100% 2595% 14 Lichtenstein Lithuania Luxembourg NA NA NA Malta Moldova Monaco NA NA NA Montenegro Netherlands NA NA NA Norway NA NA NA Poland Portugal 1.221 1.352 146 111% 926% 39 Romania NAP NAP NAP Russian Federation NA NA NA San Marino Serbia Slovakia Slovenia 898 924 191 103% 484% 75 Spain Sweden NAP NAP NAP Switzerland NA NA NA FYROMacedonia 700 642 107 92% 600% 61 Turkey NAP NAP NAP Ukraine NAP NAP NAP UK-England and Wales 11 18 NA 164% UK-Northern Ireland NA NA NA UK-Scotland NA NA NA

62
2.12. Clearance rate of the total number of criminal cases in 2008
2.12.1. Second instance courts Of the 37 states which provided the data needed to calculate, nine (Albania, Andorra, Armenia, Italy, Czech Republic, Russian Federation, UK-England and Wales, Slovenia, Latvia ) have a Clearance rate lower than 95%, fourteen equal or higher than 95% but lower than 100% (Montenegro, Netherlands, UK-Scotland, Austria, Azerbaijan, Belgium, FYROMacedon ia, Estonia, Portugal, Norway, Lithuania, Spain, Denmark, Romania ) and the remaining 14 have a Clearance rate higher than 100% (Slovakia, Ukraine, Hungary, Georgia, Poland, Switzerland, Mol dova, Finland, Bulgaria, Sweden, Bosnia and Herzegovina, Malta, San Marino, Croatia ). Both average and median Clearance rate are 98%.
Second instance (appeal) courts total criminal cases Clearance Rate
73%
75% 84
%
86%
88% 93
%
93%
94%
94%
95%
96%
96%
96%
96%
97%
97%
97%
97%
98%
98%
98%
99%
99%
100%
100%
100%
101%
101%
101%
101%
101%
101%
103% 10
8%
109%
112%
130%
0,00%
20,00%
40,00%
60,00%
80,00%
100,00%
120,00%
140,00%
Alb
ania
And
orra
Arm
enia
Ital
y
Cze
ch R
epub
lic
Rus
sian
UK
-Eng
land
and
Slo
veni
a
Latv
ia
Mon
tene
gro
Net
herla
nds
UK
-Sco
tland
Aus
tria
Aze
rbai
jan
Bel
gium
FY
RO
Mac
edon
ia
Est
onia
Por
tuga
l
Nor
way
Lith
uani
a
Spa
in
Den
mar
k
Rom
ania
Slo
vaki
a
Ukr
aine
Hun
gary
Geo
rgia
Pol
and
Sw
itzer
land
Mol
dova
Fin
land
Bul
garia
Sw
eden
Bos
nia
and
Mal
ta
San
Mar
ino
Cro
atia
Figure 39 - Clearance rate of the total number of c riminal cases at second instance courts in 2008, % The figure below presents the Clearance rate of the total number of criminal cases allowing confronting it with the number of cases per 100.000 inhabitants in 2008. Both the Clearance rate and the volume of cases present a great variation. The Clearance rate varies from a minimum of 73% in Albania , which has approximately 89 cases per 100.000 inhabitants to 131% of Croatia , which has approximately 1398 cases per 100.000 inhabitants. At the same time, the number of cases per 100.000 inhabitants ranges between 26 of Azerbaijan , with a Clearance rate of 96% to the 1398 cases of Croatia . Similarly to what noted for fist instance courts, at CoE level, the capacity of dealing with cases does not seems to be strictly related to the number of cases per fixed number of inhabitants but to be more dependent from other variables, such as organization of the work, human and technological resources and so on and so forth. Further analysis in this direction and with a more limited number of states characterized by similar justice administration structures and procedures could result in interesting results.

63
26,0
39,1
45,4
49,2
59,3
68,5
74,4
75,5
83,1
88,6
88,8
98,3
100,
2
101,
1
103,
7
114,
3
125,
2
125,
3
137,
1
139,
5
144,
1
146,
3
148,
9
156,
7
172,
3
203,
6
217,
7
231,
1
250,
0 312,
7
319,
2
347,
6
358,
5
592,
7
751,
1
1398
,2
0,02
96,5
%
93,7
%
107,
8%10
0,5%
98,5
%
101,
0%
92,7
%
95,9
%
101,
3%
98,3
%
97,4
%86,3
%
87,7
%
97,9
%
96,1
%
101,
2%
99,0
%
97,4
%
94,2
%
101,
5%108,
6%
100,
1%
102,
7%
74,7
%
96,3
%
96,0
%
83,7
%
101,
3%
99,8
%
99,2
%
101,
0%
111,
5%
73,2
%
93,1
%
96,7
%
94,5
%13
0,5%
0
200
400
600
800
1000
1200
1400
1600
Aze
rbai
jan
UK
-Eng
land
and
Wal
es
UK
-Sco
tland
Arm
enia
Mol
dova
Slo
vaki
a
Rom
ania
Geo
rgia
San
Mar
ino
Alb
ania
And
orra
Sw
eden
Ukr
aine
Mal
ta
Bul
garia
Latv
ia
Por
tuga
l
Den
mar
k
Sw
itzer
land
Aus
tria
Nor
way
Cze
ch R
epub
lic
Italy
Bel
gium
Est
onia
Lith
uani
a
Fin
land
Net
herla
nds
Rus
sian
Fed
erat
ion
Pol
and
Spa
in
Hun
gary
Bos
nia
and
Her
zego
vina
Slo
veni
a
FY
RO
Mac
edon
ia
Mon
tene
gro
Cro
atia
0%
20%
40%
60%
80%
100%
120%
140%
Second instance (appeal) courts total incoming criminal cases per100000 inhabitants
Second instance (appeal) courts total criminal cases Clearance Rate
Figure 40 - Clearance rate of the total number of c riminal cases at second instance courts in 2008, % compared with incoming cases per 100.000 inhabitant s
2.12.2. Highest instance courts The figure below shows the highest instance courts 2008 Clearance rate for the total of criminal cases for 35 states. The Clearance rate values range between 64% of Albania and 164% of UK-England and Wales . The average Clearance rate is 100% while the median is 99%. More than one fourth of the states have a Clearance rate below 95% (Albania, Azerbaijan, Denmark, Turkey, Spain, UK-Sco tland, Armenia, Netherlands, FYROMacedonia ), over one third have a Clearance rate equal or higher than 95% but lower than 100% (Belgium, Estonia, Sweden, Ukraine, Norway, Monaco, S erbia, Latvia, Poland, Finland, Hungary, Austria, Switzerland ) and also a bit more than one third have a Clearance rate equal or higher than 100% (Montenegro, Moldova, Lithuania, Bosnia and Herzegov ina , Slovenia, Slovakia, Croatia, Italy, Portugal, Romania, Georgia, UK-England and W ales ).

64
Highest instance courts total criminal cases Clearance Rate
64% 78
%
80%
80%
83%
85%
86% 92%
92%
95%
95%
96%
96%
97%
97%
98%
98%
99%
99%
99%
99%
99%
100%
102%
102%
103%
106%
108%
108%
111%
111%
136%
138%
164%
0,00%
20,00%
40,00%
60,00%
80,00%
100,00%
120,00%
140,00%
160,00%
180,00%
Alb
ania
Aze
rbai
jan
Den
mar
k
Tur
key
Spa
in
UK
-Sco
tland
Arm
enia
Net
herla
nds
FY
RO
Mac
edon
ia
Bel
gium
Est
onia
Sw
eden
Ukr
aine
Nor
way
Mon
aco
Ser
bia
Latv
ia
Pol
and
Fin
land
Hun
gary
Aus
tria
Sw
itzer
land
Mon
tene
gro
Mol
dova
Lith
uani
a
Bos
nia
and
Slo
veni
a
Slo
vaki
a
Cro
atia
Ital
y
Por
tuga
l
Rom
ania
Geo
rgia
UK
-Eng
land
and
Figure 41 - Clearance rate of the total number of c riminal cases at highest instance courts in 2008, % The figure below presents the Clearance rate of the total number of criminal cases at highest instance courts allowing confronting it with the number of cases per 100.000 inhabitants in 2008. As in the case of first and second instance courts both the Clearance rate and the volume of cases present a great variation. The Clearance rate ranges from a minimum 64% of Albania (which also has the lowest Clearance rate at second instance level), which has approximately 29 cases per 100.000 inhabitants to 164% of UK-England and Wales , which has approximately 0,02 cases per 100.000 inhabitants. At the same time, the number of cases per 100.000 inhabitants ranges between 0,02 cases per 100.000 inhabitants of UK-England and Wales , 96% to the 343 cases of Turkey with a Clearance rate of 80%. Again, as for first and second instance courts, there does not seem to be a strong correlation between Clearance rate of the total number of criminal cases and the number of cases per 100.000 inhabitants.

65
0,02
0,2
1,1
1,9
2,8 7,2
7,4
9,9
11,3
11,3
11,3
11,5
15,1
16,9
18,2
18,4
18,4
22,0
22,4
22,5
23,0 28,8
31,3
34,2
35,9
36,3 50
,5 60,4 73
,9 79,5
112,
5 132,
2 149,
2
343,
4
91,7
%
135,
7%
78,2
%
99,2
%
82,8
%
98,9
%
94,8
%
86,4
%96,6
%
79,7
%
163,
6%
99,4
% 110,
7%
102,
2%
96,1
%
94,6
%
84,5
%
99,4
% 107,
8%
91,5
%
108,
3%
99,2
%
64,0
%
98,3
%
137,
7%
96,4
%10
5,6%
103,
4% 110,
6%
102,
0%
97,1
%
98,3
%10
0,0%
80,4
%
0
50
100
150
200
250
300
350
400
UK
-Eng
land
and
Wal
es
Rom
ania
Den
mar
k
Nor
way
Arm
enia
Est
onia
Pol
and
Spa
in
Hun
gary
Aze
rbai
jan
Aus
tria
Por
tuga
l
Lith
uani
a
Sw
eden
Bel
gium
UK
-Sco
tland
Sw
itzer
land
Slo
vaki
a
Net
herla
nds
Cro
atia
Fin
land
Alb
ania
Latv
ia
FY
RO
Mac
edon
ia
Geo
rgia
Ukr
aine
Slo
veni
a
Bos
nia
and
Her
zego
vina
Italy
Mol
dova
Mon
aco
Ser
bia
Mon
tene
gro
Tur
key
0%
20%
40%
60%
80%
100%
120%
140%
160%
180%
Highest instance courts total incoming criminal cases per 100000 inhabitants
Highest instance courts total criminal cases Clearance Rate
Figure 42 - Clearance rate of the total number of c riminal cases at highest instance courts in 2008, %
compared with incoming cases per 100.000 inhabitant s
2.13. Average length of proceedings for litigious divorce cases at second instance courts between 2004 and 2008 According to CEPEJ "GOJUST" Guidelines (CEPEJ(2008)11) on which the Evaluation Scheme builds upon, Litigious divorce cases are defined as “the dissolution of a marriage contract between two persons, by the judgement of a court of a competent jurisdiction. The data should not include: divorce ruled by an agreement between the parties concerning the separation of the spouses and all its consequences (procedure of mutual consent, even if they are processed by the court) or ruled through an administrative procedure”.30 As observed in the Cepej European Judicial Systems study, the length of litigious divorce proceedings “varies in between the states and entities concerned according to the family law (civil law) procedure and the volume of cases filed in courts”. 31 For a more detailed analysis of the specificities of such procedures, see the Cepej European Judicial Systems study pp.172-173. Second instance courts data is available for 12 states in 2004 (Russian Federation, Armenia, Czech Republic, Azerbaijan, Portugal, Montenegro, Romania , Netherlands, Cyprus, France, Italy ), 10 states in 2006 (Slovenia, Latvia, Poland, Azerbaijan, Denmark, Port ugal, Monaco, France, Belgium ) and for 15 states in 2008 (Belgium, France, Albania, Monaco, Netherlands, Mont enegro, Portugal, Bosnia and Herzegovina , Denmark, Latvia, Slovenia, Poland, FY ROMacedonia, Estonia, Finland ). In only two cases, Portugal and France , data is available in all three dates showing a decreasing trend.
30 "GOJUST" Guidelines (CEPEJ(2008)11), p. 8. 31 European Judicial Systems, Edition 2010 (data 2008): Efficiency and quality of justice, p.171.

66
106
441
114
396
101
393
0
50
100
150
200
250
300
350
400
450
500
Po
rtu
gal
Fra
nce
2nd instance (average length) -Litigious divorce cases (2004)
2nd instance (average length) -Litigious divorce cases (2006)
2nd instance (average length) -Litigious divorce cases (2008)
Figure 43 - Second instance court litigious divorce proceedings average length (in days) in 2004, 2006 and 2008 2004 and 2008 data, as shown in the figure below, are available in four cases, Portugal, Montenegro, Netherlands, France . In all four cases the average length decreases.
441
237
165
106
393
217
120
101
0
50
100
150
200
250
300
350
400
450
500
France Netherlands Montenegro Portugal
2nd instance (average length) - Litigiousdivorce cases (2004)
2nd instance (average length) - Litigiousdivorce cases (2008)
Figure 44 - Second instance court litigious divorce proceedings average length (in days) in 2004 and 2008 2006 and 2008 data, presented in the figure below, are available for eight states, Belgium, France, Monaco, Portugal, Denmark, Latvia, Slovenia, Poland . In all cases but two (Monaco and Denmark ), where the average length remains the same, it decreases. The average length of the eight states second instance court litigious cases is 207 days in 2006 and drops to 186 days in 2008 with a -21 days variation (slightly more than -10%). In the same period the median decrease between 102 and 96 days, with a variation of -13 days.

67
564
396
240
114
90 84 78 89
479
393
240
101
90 72 60 50
0
100
200
300
400
500
600
Belgium France Monaco Portugal Denmark Latvia Slovenia Poland
2nd instance (average length) - Litigiousdivorce cases (2006)
2nd instance (average length) - Litigiousdivorce cases (2008)
Figure 45 - Second instance court litigious divorce proceedings average length (in days) in 2006 and 2008 Table 11 - Average length of proceedings for litigi ous divorce cases at second instance courts between 2006 and 2008
country
2nd instance (average length) - Litigious divorce cases (2006)
2nd instance (average length) - Litigious divorce cases (2008)
average length variation between 2006 and 2008
Belgium 564 479 -85 France 396 393 -3 Monaco 240 240 0 Portugal 114 101 -13 Denmark 90 90 0 Latvia 84 72 -12 Slovenia 78 60 -18 Poland 89 50 -39 Average 207 186 -21 Median 102 96 -13
The figure below shows all data available on average length of litigious divorce cases between 2004 and 2008 (22 states). Over all, average length of cases decreases from 199 days in 2004 to 194 days in 206 to 150 days in 2008. In the same period the median value varies from 165 to 90 to 98 days.

68
441
237
165
106
60
502
365
183
55
40 30
564
396
240
114
90 84 78 89 90
479
393
246
240
217
120
101
98 90
72 60 50 47
30
00
100
200
300
400
500
600
Bel
gium
Fra
nce
Alb
ania
Mon
aco
Net
herla
nds
Mon
tene
gro
Por
tuga
lB
osni
a an
dH
erze
govi
na
Den
mar
k
Latv
ia
Slo
veni
a
Pol
and
FY
RO
Mac
edon
ia
Est
onia
Fin
land
Aze
rbai
jan
Ital
y
Cyp
rus
Rom
ania
Cze
ch R
epub
lic
Arm
enia
Rus
sian
Fed
erat
ion
2nd instance (averagelength) - Litigious divorcecases (2004)
2nd instance (averagelength) - Litigious divorcecases (2006)
2nd instance (averagelength) - Litigious divorcecases (2008)
Figure 46 - Average length of proceedings for litig ious divorce cases at second instance courts between 2004 and 2008, in days. The same data is provided organized by state in the table below. Table 12 Average length of proceedings for litigiou s divorce cases at second instance courts between 2004 and 2008
country
2nd instance (average length) - Litigious divorce cases (2004)
2nd instance (average length) - Litigious divorce cases (2006)
2nd instance (average length) - Litigious divorce cases (2008)
Albania 246 Armenia 40 Azerbaijan 60 90 Belgium 564 479 Bosnia and Herzegovina 98 Cyprus 365 Czech Republic 55 Denmark 90 90 Estonia 30 Finland 0 France 441 396 393 FYROMacedonia 47 Italy 502 Latvia 84 72 Monaco 240 240 Montenegro 165 120 Netherlands 237 217 Poland 89 50 Portugal 106 114 101 Romania 183 Russian Federation 30 Slovenia 78 60 Average 199 194 150 Median 165 90 98
An analysis considering both first and second instance average length of proceedings for litigious divorce cases is carried out in the synthesis section.

69
3. Synthesis The synthesis analysis that follows investigates 2008 data on total of civil, commercial and administrative law cases and total criminal cases at first, second and highest instance level. In particular, two indicators are discussed, the Clearance rate and the Disposition time as they have been the main focus of the present work, in accordance with the indications provided by Cepej. Follows an analysis of litigious divorce cases at first and second instance in relation to the average length of proceedings, also in line with the Cepej selection of this category between the four indicated by the "GOJUST" Guidelines -CEPEJ(2008)11.
3.1. Total of civil, commercial and administrative law cases at first, second and highest instance courts
3.1.1. Clearance rate Data on total of civil, commercial and administrative law cases allowed calculating the first instance courts Clearance rate for 39 states, second instance courts Clearance rate for 40 states and highest instance courts Clearance rate for 34 states. First instance courts Clearance rate ranges between a minimum of 71% (Bosnia and Herzegovina ) and a maximum of 257% (FYROMacedonia ) with an average of 106% and a median of 99%. The Clearance rate is below 95% in seven states (Bosnia and Herzegovina, Spain, Armenia, Latvia, And orra, Estonia, Albania ), equal or higher than 95% but lower than 100% in fourteen states (Moldova, Portugal, Norway, Ukraine, France, Romania, Italy, Turkey, Monaco, Li thuania, Hungary, Finland, Poland, Netherlands ) and equal or higher than 100% in the remaining eighteen (Denmark, Switzerland, Malta, Czech Republic, Austria, Russian Federation, Montenegro, San Marino , Croatia, Slovakia, Slovenia, Sweden, Bulgaria, Georgia, Cyprus, Serbia, Luxembourg, FYROMacedonia ). Second instance courts Clearance rate ranges between a minimum of 38% (Ukraine ) and a maximum of 221% (San Marino ) with an average of 100% and a median of 99%. The Clearance rate is below 95% in twelve states (Ukraine, UK-Scotland, Cyprus, Lithuania, Monaco, Al bania, Italy, FYROMacedonia, Bosnia and Herzegovina , Estonia, Latvia, UK-Englan d and Wales ), equal or higher than 95% but lower than 100% in nine states (Denmark, Netherlands, Croatia, Russian Federation, Hungary, Austria, Spain, Romania, Finland, France ) and higher than 100% in the remaining nineteen (Portugal, Czech Republic, Poland, Switzerland, Norway, Sweden, Moldova, Slova kia, Serbia, Bulgaria, Armenia, Luxembourg, Slovenia, Andorra, Montenegro, Malta, Georgia, San Marino, Turkey ). Highest instance courts Clearance rate ranges between a minimum of 27% (Ukraine ) and a maximum of 159% (San Marino ) with an average of 99% and a median of 100%. The Clearance rate is below 95% in eleven states (Ukraine, Albania, Croatia, Romania, Latvia, UK-Scot land, Georgia, Estonia, Finland, Hungary, Bulgaria ), equal or higher than 95% but lower than 100% in six states (Slovakia, Sweden, Moldova, Czech Republic, Poland, France ) and equal or higher than 100% in the remaining seventeen (Armenia, Slovenia, Austria, Portugal, Luxembourg, B elgium, Switzerland, Montenegro, Italy, Netherlands, Bosnia and Herzegovina , Norway, FYROM acedonia, Lithuania, Spain, UK-England and Wales, San Marino ). The table below presents the percentages of states with a first, second and highest instance courts Clearance rate below 95%, equal or higher than 95% but lower than 100% and equal or higher than 100% over the total of states that provided the data for that instance. Table 13 - First, second and highest instance court s total of civil, commercial and administrative law cases (2008) Clearance rate synthesis table
States with Clearance rate below 95%
States with Clearance rate equal or higher than 95% but lower than 100%
States with Clearance rate equal or higher than 100%
Total
% of states with Clearance rate below 95%
% of states with Clearance rate equal or higher than 95% but lower than 100%
% of states with Clearance rate equal or higher than 100%
First instance courts 7 14 18 39 18% 36% 46%
Second instance courts 12 9 19 40 30% 23% 48%
Highest instance courts 11 6 17 34 32% 18% 50%
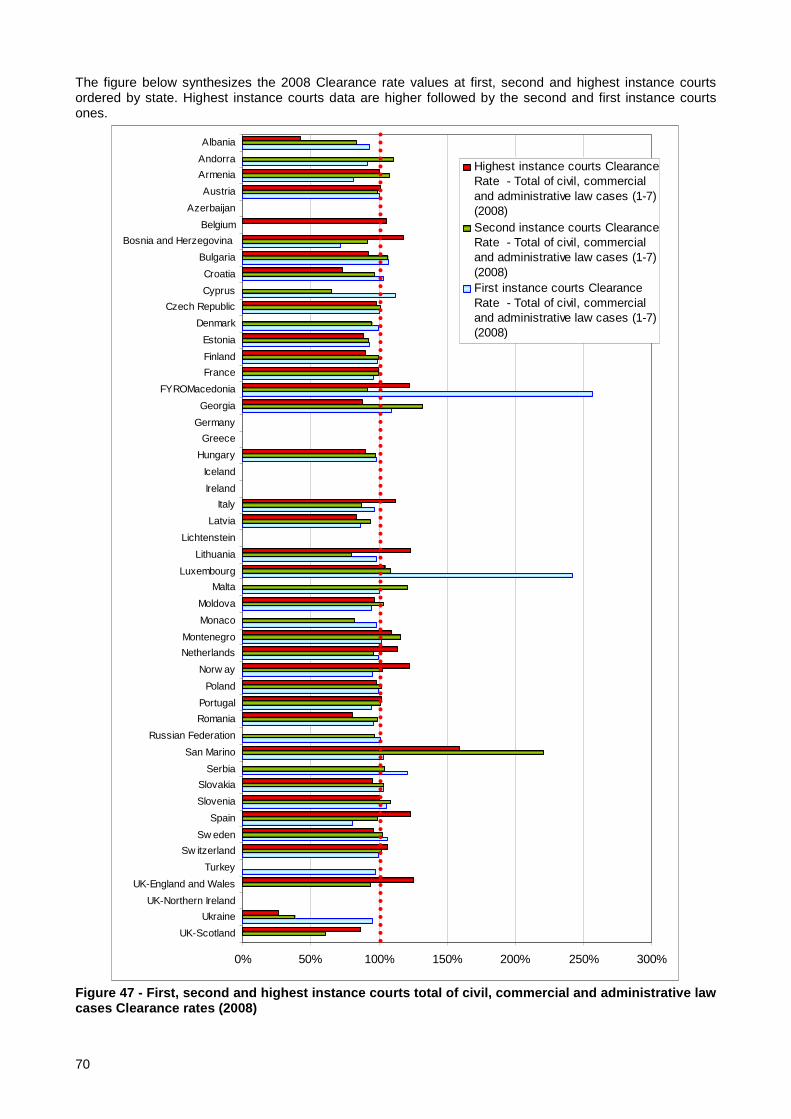
70
The figure below synthesizes the 2008 Clearance rate values at first, second and highest instance courts ordered by state. Highest instance courts data are higher followed by the second and first instance courts ones.
0% 50% 100% 150% 200% 250% 300%
UK-Scotland
Ukraine
UK-Northern Ireland
UK-England and Wales
Turkey
Sw itzerland
Sw eden
Spain
Slovenia
Slovakia
Serbia
San Marino
Russian Federation
Romania
Portugal
Poland
Norw ay
Netherlands
Montenegro
Monaco
Moldova
Malta
Luxembourg
Lithuania
Lichtenstein
Latvia
Italy
Ireland
Iceland
Hungary
Greece
Germany
Georgia
FYROMacedonia
France
Finland
Estonia
Denmark
Czech Republic
Cyprus
Croatia
Bulgaria
Bosnia and Herzegovina
Belgium
Azerbaijan
Austria
Armenia
Andorra
Albania
Highest instance courts ClearanceRate - Total of civil, commercialand administrative law cases (1-7)(2008)Second instance courts ClearanceRate - Total of civil, commercialand administrative law cases (1-7)(2008)First instance courts ClearanceRate - Total of civil, commercialand administrative law cases (1-7)(2008)
Figure 47 - First, second and highest instance cour ts total of civil, commercial and administrative la w cases Clearance rates (2008)

71
The table below provides the raw data used to draw the above figure. Table 14 - First, second and highest instance court s total of civil, commercial and administrative law cases Clearance rates (2008)
Total of civil, commercial and administrative law c ases (1-7) (2008)
Country First instance courts Clearance rate-
Second instance courts Clearance rate
Highest instance courts Clearance rate
Albania 93% 83% 42% Andorra 91% 111% Armenia 81% 108% 100% Austria 100% 99% 101% Azerbaijan Belgium 105% Bosnia and Herzegovina 71% 91% 118% Bulgaria 107% 107% 92% Croatia 103% 97% 73% Cyprus 112% 65% Czech Republic 100% 101% 98% Denmark 100% 95% Estonia 93% 92% 89% Finland 99% 99% 90% France 96% 99% 99% Georgia 109% 132% 88% Germany Greece Hungary 98% 97% 90% Iceland Ireland Italy 97% 87% 112% Latvia 86% 94% 83% Lichtenstein Lithuania 98% 80% 123% Luxembourg 242% 108% 104% Malta 100% 121% Moldova 95% 103% 97% Monaco 98% 82% Montenegro 101% 116% 109% Netherlands 99% 96% 114% Norway 95% 102% 122% Poland 99% 101% 98% Portugal 95% 101% 102% Romania 96% 99% 80% Russian Federation 101% 97% San Marino 103% 221% 159% Serbia 121% 104% Slovakia 103% 103% 96% Slovenia 105% 108% 100% Spain 81% 99% 123% Sweden 106% 102% 96% Switzerland 100% 102% 107% FYROMacedonia 257% 91% 122% Turkey 97% Ukraine 96% 38% 27% UK-England and Wales 94% 125% UK-Northern Ireland UK-Scotland 60% 87%
The figure below provides an additional tool to help the reader visualize the Clearance rate situation at an aggregated level. For each state which provided the needed data it has been assessed in how many cases between first, second and highest instance courts the total of civil, commercial and administrative law cases Clearance rates (2008) are equal or above 95%. If Clearance rates are equal or above 95% at all three court instances, the state is colored green; if the Clearance rates are equal or above 95% at two out of three court instances, the state is colored yellow. If the Clearance rate is equal or above 95% only in one case and below 95% in the other two, out of three court instances, the state is colored orange. Finally, if Clearance rates are equal or above 95% at all three court instances, the state is colored red. This figure provides an indication of the variation of the pending cases in 2008. It should be noted, though, that without looking also at the disposition time and at the absolute numbers of pending cases, the assessment of the situation can be misleading. For example, while Estonia is “red” its first instance courts Disposition time is of 133 days, the second instance of 142 days and the highest instance of 125 days. On

72
the contrary, while Italy is “yellow”, its first instance courts Disposition time is of 378 days, the second instance of 1181 days and the highest instance of 1066 days. Furthermore, looking at these data it should be considered that the focus of the attention is on just one year and therefore they could be subject to short term deviation.
Figure 48 - Aggregated first, second and highest in stance courts total of civil, commercial and
administrative law cases Clearance rates map (2008)
3.1.2. Disposition time With the available data, it has been possible to calculate the Disposition time for first instance courts in 35 states, for second instance courts in 34 states and for highest instance courts in 30 states. Furthermore, it has been possible to calculate the Disposition time for all three court levels in 27 states. The three figures below allow to check with one glance the differences in Disposition time considering a case which is resolved at first instance level (figure on the left) at second level (figure in the center) or at highest court level (figure on the right). In some countries the justice system is relatively fast compared to the others in dealing with first instance cases, while perform less speedily for cases which are appealed. See for example the case of Albania , which shows a first instance courts Disposition time of 80 days compared to the average 234 days for the 27 states for which it has been possible to calculate the Disposition time for all three court levels. Summing up first and second instance courts Disposition time shows a less positive Disposition time situation (450 days, a value equal to the average for the 27 states for which it has been possible to calculate the Disposition time for all three court levels). When adding all three Disposition times, the total is 1784 days, more than twice the average 714 of the 27 states for which it has been possible to calculate such value.

73
Time to disposition ordered by 1st instance courts TD
0 500 1000 1500 2000 2500 3000
Bosnia and Herzegovina
Portugal
San Marino
Spain
FYROMacedonia
Italy
France
Slovenia
Norway
Czech Republic
Montenegro
Latvia
Croatia
Bulgaria
Sweden
Slovakia
Estonia
Switzerland
Romania
Moldova
Albania
Poland
Finland
Hungary
Austria
Lithuania
Georgia
First instance courts DispositionTime - Total of civil, commercial andadministrative law cases (1-7) (2008)
Second instance courts DispositionTime - Total of civil, commercial andadministrative law cases (1-7) (2008)
Highest instance courts DispositionTime - Total of civil, commercial andadministrative law cases (1-7) (2008)
Time to disposition ordered by 1st +2nd instance courts TD
0 500 1000 1500 2000 2500 3000
Italy
Bosnia and Herzegovina
San Marino
Portugal
Spain
France
FYROMacedonia
Albania
Latvia
Croatia
Montenegro
Switzerland
Slovenia
Norway
Bulgaria
Estonia
Romania
Lithuania
Czech Republic
Slovakia
Sweden
Finland
Hungary
Moldova
Austria
Georgia
Poland
First instance courts DispositionTime - Total of civil, commercial andadministrative law cases (1-7) (2008)
Second instance courts DispositionTime - Total of civil, commercial andadministrative law cases (1-7) (2008)
Highest instance courts DispositionTime - Total of civil, commercial andadministrative law cases (1-7) (2008)
Time to disposition ordered by 1st + 2nd + 3rd inst ance courts TD
0 500 1000 1500 2000 2500 3000
Italy
Albania
Bosnia and Herzegovina
San Marino
Spain
Portugal
France
Slovenia
Croatia
FYROMacedonia
Latvia
Romania
Finland
Czech Republic
Switzerland
Norway
Montenegro
Bulgaria
Estonia
Slovakia
Hungary
Sweden
Lithuania
Poland
Georgia
Austria
Moldova
First instance courts DispositionTime - Total of civil, commercial andadministrative law cases (1-7) (2008)
Second instance courts DispositionTime - Total of civil, commercial andadministrative law cases (1-7) (2008)
Highest instance courts DispositionTime - Total of civil, commercial andadministrative law cases (1-7) (2008)
Figure 49 - First, second and
highest instance courts total of civil, commercial and administrative law cases (2008) Disposition time (in 27
states) ordered by 1 s instance courts Disposition time
Figure 50 - First, second and highest instance courts total of civil, commercial and administrative law cases (2008) Disposition time (in 27 states) ordered by 1 s+2nd instance
courts Disposition time
Figure 51 - First, second and highest instance courts total of civil, commercial and administrative law cases (2008) Disposition time (in 27
states) ordered by 1 s+2nd+3rd instance courts Disposition time
The table below provides average, median, minimum and maximum values for first, second and highest court level Disposition time of the 27 states, but also for 1st +2nd court level (as to say the total Disposition time for a case which is defined at second court level) and for 1st +2nd +3rd court level (total Disposition time for a case defined at highest level). Table 15 - First, second and highest instance court s total of civil, commercial and administrative law cases (2008) Disposition time (in days) synthesis t able (27 states)
country
First instance courts Disposition time - Total of civil, commercial and administrative law cases (1-7) (2008)
Second instance courts Disposition time - Total of civil, commercial and administrative law cases (1-7) (2008)
Highest instance courts Disposition time - Total of civil, commercial and administrative law cases (1-7) (2008)
1st +2nd instance courts Disposition time - Total of civil, commercial and administrative law cases (1-7) (2008)
1st +2nd +3rd instance courts Disposition time - Total of civil, commercial and administrative law cases (1-7) (2008)
Average 234 216 264 450 714 Median 148 159 172 313 509 Min 40 53 1 111 173 Max 932 1181 1334 1559 2625
In a future analysis it could be interesting to cross this data with the data on the percentage of cases that are defined at each level.

74
0 500 1000 1500 2000 2500 3000
UK-Scotland
Ukraine
UK-Northern Ireland
UK-England and WalesTurkey
Switzerland
Sweden
Spain
SloveniaSlovakia
Serbia
San Marino
Russian FederationRomania
Portugal
Poland
Norway
NetherlandsMontenegro
Monaco
Moldova
MaltaLuxembourg
Lithuania
Lichtenstein
Latvia
ItalyIreland
Iceland
Hungary
GreeceGermany
Georgia
FYROMacedonia
France
FinlandEstonia
Denmark
Czech Republic
CyprusCroatia
Bulgaria
Bosnia and Herzegovina
Belgium
AzerbaijanAustria
Armenia
Andorra
Albania
First instance courts Disposition Time - Total of civil, commercial andadministrative law cases (1-7) (2008)
Second instance courts DispositionTime - Total of civil, commercial andadministrative law cases (1-7) (2008)
Highest instance courts DispositionTime - Total of civil, commercial andadministrative law cases (1-7) (2008)
Figure 52 - First, second and highest instance cour ts total of civil, commercial and administrative la w cases (2008) Disposition time
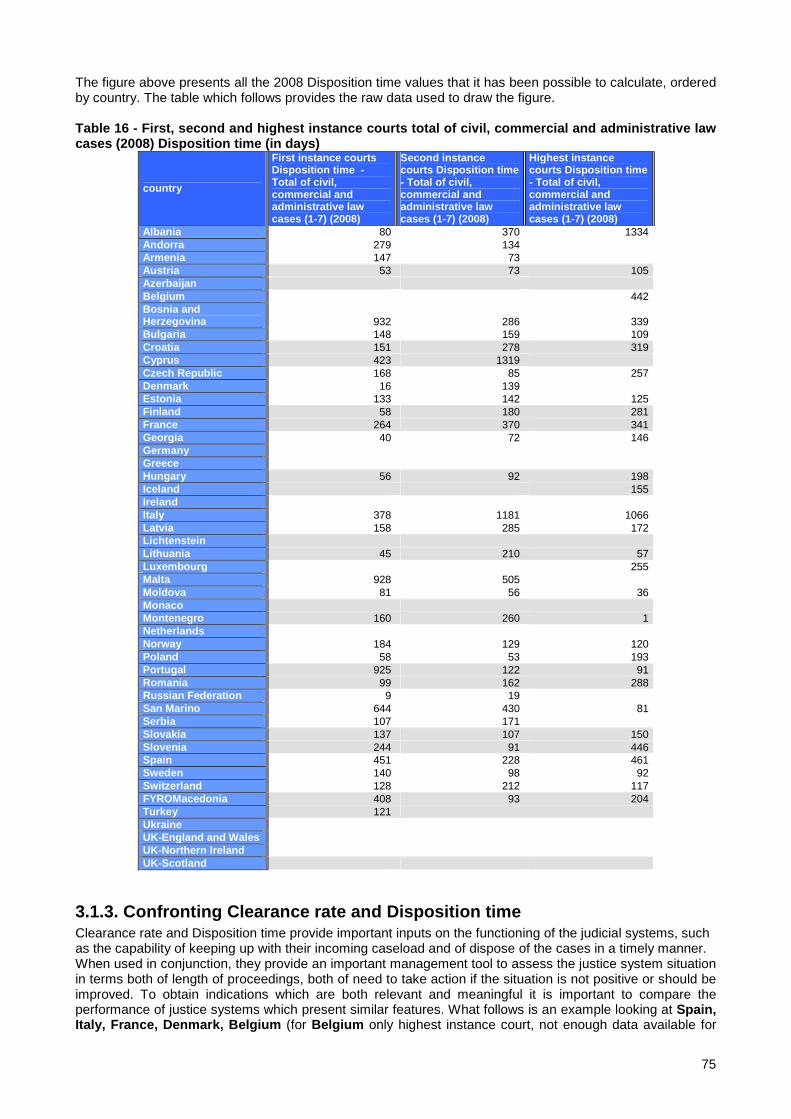
75
The figure above presents all the 2008 Disposition time values that it has been possible to calculate, ordered by country. The table which follows provides the raw data used to draw the figure. Table 16 - First, second and highest instance court s total of civil, commercial and administrative law cases (2008) Disposition time (in days)
country
First instance courts Disposition time - Total of civil, commercial and administrative law cases (1-7) (2008)
Second instance courts Disposition time - Total of civil, commercial and administrative law cases (1-7) (2008)
Highest instance courts Disposition time - Total of civil, commercial and administrative law cases (1-7) (2008)
Albania 80 370 1334 Andorra 279 134 Armenia 147 73 Austria 53 73 105 Azerbaijan Belgium 442 Bosnia and Herzegovina 932 286 339 Bulgaria 148 159 109 Croatia 151 278 319 Cyprus 423 1319 Czech Republic 168 85 257 Denmark 16 139 Estonia 133 142 125 Finland 58 180 281 France 264 370 341 Georgia 40 72 146 Germany Greece Hungary 56 92 198 Iceland 155 Ireland Italy 378 1181 1066 Latvia 158 285 172 Lichtenstein Lithuania 45 210 57 Luxembourg 255 Malta 928 505 Moldova 81 56 36 Monaco Montenegro 160 260 1 Netherlands Norway 184 129 120 Poland 58 53 193 Portugal 925 122 91 Romania 99 162 288 Russian Federation 9 19 San Marino 644 430 81 Serbia 107 171 Slovakia 137 107 150 Slovenia 244 91 446 Spain 451 228 461 Sweden 140 98 92 Switzerland 128 212 117 FYROMacedonia 408 93 204 Turkey 121 Ukraine UK-England and Wales UK-Northern Ireland UK-Scotland
3.1.3. Confronting Clearance rate and Disposition t ime Clearance rate and Disposition time provide important inputs on the functioning of the judicial systems, such as the capability of keeping up with their incoming caseload and of dispose of the cases in a timely manner. When used in conjunction, they provide an important management tool to assess the justice system situation in terms both of length of proceedings, both of need to take action if the situation is not positive or should be improved. To obtain indications which are both relevant and meaningful it is important to compare the performance of justice systems which present similar features. What follows is an example looking at Spain, Italy, France, Denmark, Belgium (for Belgium only highest instance court, not enough data available for

76
first and second instance courts calculations), Portugal and Austria, considering Clearance rate and Disposition time at first second and highest instance courts. Once again, it must be stressed out that how the variable are measured in the different countries may consistently influence the outcome. First instance courts Table 17 - Clearance rate and Disposition time for Total of civil, commercial and administrative law cases in 2008, in first instance courts
First instance courts Clearance rate - Total of civil, commercial and administrative law cases (1-7) (2008)
First instance courts Disposition time - Total of civil, commercial and administrative law cases (1-7) (2008)
Spain 81% 451 Italy 97% 378 France 96% 264 Denmark 100% 16 Belgium Portugal 95% 925 Austria 100% 53
Portu
gal 9
25; 95%
Spain
451; 8
1%Ita
ly 37
8; 97%
Franc
e 264; 9
6%
Austria
53; 1
00%
Denm
ark 1
6; 100%
70%
80%
90%
100%
110%
120%
130%
0 200 400 600 800 1000
Disposition Time (days)
Cle
aran
ce R
ate
(%)
Figure 53 - Clearance rate and Disposition time for Total of civil, commercial and administrative law
cases in 2008, in first instance courts The above figure allows to immediately visualizing Disposition time and Clearance rate of each of the five states (Austria, Denmark, France, Italy, Portugal and Spain ) for which it has been possible to calculate both values for first instance courts. Denmark and Austria can be seen as a first subgroup, with a Disposition time much below 100 days and a Clearance rate of 100%. A second subgroup can be identified, including France, Italy and Spain . France , with a Disposition time which is still well below one year, has a Clearance rate which is only 96%. The Italian situation is a bit worst, with a Disposition time just over one year and a Clearance rate which, even if slightly better than the French one, is still below 100%. Spain , the third member of this subgroup has a Disposition time which is the highest of the three, but also a Clearance rate which is very low. As mentioned in the Cepej European judicial systems study, Edition 2010 (data 2008), this Clearance rate is “linked to a prolonged strike of personnel of the justice administration which took place during 2008” and therefore should be looked as the effect of a spot event and not as a structural condition. Portugal is a subgroup on its own, with a Disposition time well over the two year and a Clearance rate which is still below 95% which means that the number of pending cases is increasing. Second instance courts

77
Table 18 - Clearance rate and Disposition time for Total of civil, commercial and administrative law cases in 2008, in second instance courts
country
Second instance courts Clearance rate - Total of civil, commercial and
administrative law cases (1-7) (2008)
Second instance courts Disposition time - Total of civil, commercial and administrative law cases (1-7) (2008)
Spain 99% 228 Italy 87% 1181 France 99% 370 Denmark 95% 139 Belgium Portugal 101% 122 Austria 99% 73
Portu
gal 1
22; 1
01%
Italy
1181
; 87%Fra
nce
370;
99%
Spain
228;
99%
Denmar
k 139
; 95%
Austri
a 73
; 99%
70%
80%
90%
100%
110%
120%
130%
0 200 400 600 800 1000 1200 1400
Disposition Time (days)
Cle
aran
ce R
ate
(%)
Figure 54 - Clearance rate and Disposition time for Total of civil, commercial and administrative law
cases in 2008, in second instance courts Within the cluster, it has been possible to calculate Disposition time and Clearance rate in second instance courts of Austria, Denmark, France, Italy, Portugal and Spain . Four of the six countries (Austria, Denmark, Portugal, Spain ) constitute the main group, with a Disposition time well below the year and a Clearance rate near or above 100%. France follows this group not by far, with a Disposition time just over the year and a clearance rat very near to 100%. Italy , on the other hand is quite distant, with a Disposition time of over three years and a Clearance rate below 90%, which means that the number of pending cases is consistently increasing. Highest Instance courts

78
Table 19 - Clearance rate and Disposition time for Total of civil, commercial and administrative law cases in 2008, in highest instance courts
country Highest instance courts Clearance
rate - Total of civil, commercial and administrative law cases (1-7) (2008)
Highest instance courts Disposition time - Total of civil, commercial and administrative law cases (1-7) (2008)
Spain 123% 461 Italy 112% 1066 France 99% 341 Denmark Belgium 105% 442 Portugal 102% 91 Austria 101% 105
Austri
a 105
; 101
%
Franc
e 34
1; 9
9%
Spain
461
; 123
%
Belgium
442;
105
%
Italy
1066
; 112
%
Portu
gal 9
1; 10
2%
70%
80%
90%
100%
110%
120%
130%
0 200 400 600 800 1000 1200
Disposition Time (days)
Cle
aran
ce R
ate
(%)
Figure 55 - Clearance rate and Disposition time for Total of civil, commercial and administrative law
cases in 2008, in highest instance courts Again, for Highest instance courts, it has been possible to calculate Clearance rate and Disposition time for only six seven out of seven, in this case Austria, Belgium, France, Italy, Portugal and Spain . As with the first instance court, three groups can be identified: one with states with a Disposition time near to 100 days and a Clearance rate slightly over 100% (Portugal and Austria ), one including states with a Disposition time of approximately one year (France, Belgium and Spain ). It is worth noticing that Spain , the state with the highest Disposition time of the three has also a Clearance rate which is much higher than 100%, relating to a consistent reduction of pending cases). Finally, Italy , while with a Clearance rate which is positive, shows a Disposition time which is very near to three years.

79
3.2. Total criminal cases at first, second and highest instance courts
3.2.1. Clearance rate Data on total criminal cases allowed calculating the first instance courts Clearance rate for 40 states, second instance courts Clearance rate for 37 states and highest instance courts Clearance rate for 34 states. First instance courts Clearance rate ranges between a minimum of 27% (Luxembourg ) and a maximum of 160% (FYROMacedonia ) with an average of 105% and a median of 101%. The Clearance rate is below 95% in two states, equal or higher than 95% but lower than 100% in eleven and equal or higher than 100% in the remaining 27. Second instance courts Clearance rate ranges between a minimum of 73% (Albania ) and a maximum of 130% (Croatia ) with an average of 98% and a median of 98%. The Clearance rate is below 95% in nine states, equal or higher than 95% but lower than 100% in fourteen, and higher than 100% also in fourteen states. Highest instance courts Clearance rate ranges between a minimum of 64% (Albania ) and a maximum of 164% (UK-England and Wales ) with an average of 100% and a median of 99%. The Clearance rate is below 95% in nine states, equal or higher than 95% but lower than 100% in thirteen states, and equal or higher than 100% in the remaining twelve. The table below presents the percentages of states with a first, second and highest instance courts Clearance rate below 95%, equal or higher than 95% but lower than 100% and equal or higher than 100% over the total of states that provided the data for that instance. Table 20 - First, second and highest instance court s total criminal cases (2008) Clearance rate synthesis table
States with Clearance rate below 95%
States with Clearance rate equal or higher than 95% but lower than 100%
States with Clearance rate equal or higher than 100%
total
% of states with Clearance rate below 95%
% of states with Clearance rate equal or higher than 95% but lower than 100%
% of states with Clearance rate equal or higher than 100%
First instance courts 2 11 27 40 5% 28% 68%
Second instance courts 9 14 14 37 24% 38% 38%
Highest instance courts 9 13 12 34 26% 38% 35%
The figure below synthesizes the 2008 Clearance rate values at first, second and highest instance courts ordered by state. Highest instance courts data are higher followed by the second and first instance courts ones.
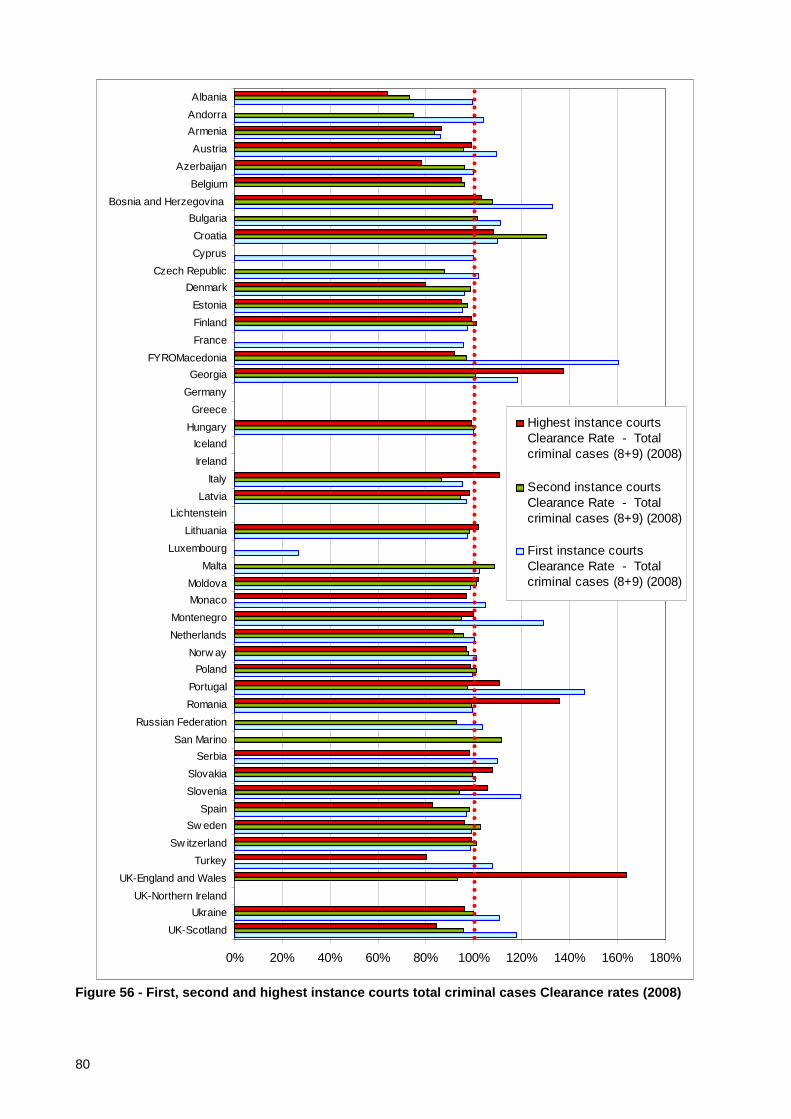
80
0% 20% 40% 60% 80% 100% 120% 140% 160% 180%
UK-Scotland
Ukraine
UK-Northern Ireland
UK-England and Wales
Turkey
Sw itzerland
Sw eden
Spain
Slovenia
Slovakia
Serbia
San Marino
Russian Federation
Romania
Portugal
Poland
Norw ay
Netherlands
Montenegro
Monaco
Moldova
Malta
Luxembourg
Lithuania
Lichtenstein
Latvia
Italy
Ireland
Iceland
Hungary
Greece
Germany
Georgia
FYROMacedonia
France
Finland
Estonia
Denmark
Czech Republic
Cyprus
Croatia
Bulgaria
Bosnia and Herzegovina
Belgium
Azerbaijan
Austria
Armenia
Andorra
Albania
Highest instance courtsClearance Rate - Totalcriminal cases (8+9) (2008)
Second instance courtsClearance Rate - Totalcriminal cases (8+9) (2008)
First instance courtsClearance Rate - Totalcriminal cases (8+9) (2008)
Figure 56 - First, second and highest instance cour ts total criminal cases Clearance rates (2008)

81
The table below provides the raw data used to draw the above figure. Table 21 - First, second and highest instance court s total criminal cases Clearance rates (2008)
Total criminal cases (8+9) (2008)
Country First instance courts Clearance rate
Second instance courts Clearance rate
Highest instance courts Clearance rate
Albania 100% 73% 64% Andorra 104% 75% Armenia 86% 84% 86% Austria 110% 96% 99% Azerbaijan 100% 96% 78% Belgium 97% 95% Bosnia and Herzegovina 133% 108% 103% Bulgaria 111% 101% Croatia 110% 130% 108% Cyprus 100% Czech Republic 102% 88% Denmark 96% 99% 80% Estonia 96% 97% 95% Finland 97% 101% 99% France 96% Georgia 118% 101% 138% Germany Greece Hungary 100% 100% 99% Iceland Ireland Italy 95% 86% 111% Latvia 97% 94% 98% Lichtenstein Lithuania 98% 98% 102% Luxembourg 27% Malta 103% 109% Moldova 99% 101% 102% Monaco 105% 97% Montenegro 129% 95% 100% Netherlands 100% 96% 92% Norway 101% 98% 97% Poland 100% 101% 99% Portugal 146% 97% 111% Romania 100% 99% 136% Russian Federation 104% 93% San Marino 112% Serbia 110% 98% Slovakia 101% 100% 108% Slovenia 120% 94% 106% Spain 97% 98% 83% Sweden 99% 103% 96% Switzerland 99% 101% 99% FYROMacedonia 160% 97% 92% Turkey 108% 80% Ukraine 110% 100% 96% UK-England and Wales 93% 164% UK-Northern Ireland UK-Scotland 118% 96% 85%
The figure below helps to visualize the Clearance rate situation at an aggregated level. For each state which provided the needed data it has been assessed in how many cases between first, second and highest instance courts the total of civil, commercial and administrative law cases Clearance rates (2008) are equal or above 95%. If Clearance rates are equal or above 95% at all three court instances, the state is colored green; if the Clearance rates are equal or above 95% at two out of three court instances, the state is colored yellow. If the Clearance rate is equal or above 95% only in one case and below 95% in the other two, out of three court instances, the state is colored orange. Finally, if Clearance rates are equal or above 95% at all three court instances, the state is colored red. Again, as mentioned discussing figure 48, the Clearance rate situation should be looked considering also the Disposition time and the number of pending cases.

82
Figure 57 – Aggregated first, second and highest in stance courts total criminal cases Clearance rates
map (2008)
3.2.2. Disposition time With the available data, it has been possible to calculate the Disposition time for first instance courts in 35 states, for second instance courts in 32 states and for highest instance courts in 29 states. Furthermore, it has been possible to calculate the Disposition time for all three court levels in 25 states. The three figures below allow to check with one glance the differences in Disposition time considering a case which is resolved at first instance level (figure on the left) at second level (figure in the center) or at highest court level (figure on the right). As with the Disposition time of total of civil, commercial and administrative law cases, this representation of the data allow to compare total Disposition time for cases which are defined at first second or highest instance court level. Again, some countries, while performing quite well at first or first and second instance, perform quite poorly -compared to the average- at higher level (such as in the case of Romania ). In other cases (i.e. Italy and Slovenia on the low end, Poland in the middle and Estonia, Azerbaijan and Moldova on the high end) the performance is quite similar at all levels. While looking at figures below it should be borne in mind that these data do not include the pre-trial phase, which is also important and should be also taken into account when assessing the performance of a criminal justice system. It would be indeed useful to have also data on this part of the procedure though the are are several difficulties to the collection of such data,

83
Time to disposition ordered by 1st instance courts TD
0 200 400 600 800 1000 1200 1400
Italy
Slovenia
Croatia
Bosnia and Herzegovina
Portugal
Slovakia
FYROMacedonia
Spain
Sweden
Denmark
Austria
Albania
Hungary
Finland
Poland
Lithuania
Armenia
Georgia
Norway
Romania
Moldova
Latvia
Switzerland
Estonia
Azerbaijan
First instance courtsDisposition Time - Totalcriminal cases (8+9) (2008)
Second instance courtsDisposition Time - Totalcriminal cases (8+9) (2008)
Highest instance courtsDisposition Time - Totalcriminal cases (8+9) (2008)
Time to disposition ordered by 1st + 2nd instance courts TD
0 200 400 600 800 1000 1200 1400
Italy
Croatia
Albania
Slovenia
Portugal
Slovakia
Bosnia and Herzegovina
Sweden
Latvia
Spain
Finland
FYROMacedonia
Denmark
Romania
Switzerland
Hungary
Austria
Armenia
Poland
Lithuania
Norway
Georgia
Moldova
Estonia
Azerbaijan
First instance courtsDisposition Time - Totalcriminal cases (8+9) (2008)
Second instance courtsDisposition Time - Totalcriminal cases (8+9) (2008)
Highest instance courtsDisposition Time - Totalcriminal cases (8+9) (2008)
Time to disposition ordered by 1st + 2nd + 3rd instance courts TD
0 200 400 600 800 1000 1200 1400
Italy
Albania
Romania
Denmark
Croatia
Spain
Slovenia
Portugal
Slovakia
Bosnia and Herzegovina
Sweden
Finland
Switzerland
Poland
FYROMacedonia
Austria
Latvia
Hungary
Norway
Lithuania
Armenia
Georgia
Estonia
Moldova
Azerbaijan
First instance courtsDisposition Time - Totalcriminal cases (8+9) (2008)
Second instance courtsDisposition Time - Totalcriminal cases (8+9) (2008)
Highest instance courtsDisposition Time - Totalcriminal cases (8+9) (2008)
Figure 58 - First, second and highest instance courts total
criminal cases (2008) Disposition time (in 25 states) ordered by 1 s instance courts Disposition time
Figure 59 - First, second and highest instance courts total
criminal cases (2008) Disposition time (in 25 states) ordered by 1 s+2nd
instance courts Disposition time
Figure 60 - First, second and highest instance courts total
criminal cases (2008) Disposition time (in 25 states) ordered by
1s+2nd+3rd instance courts Disposition time
The table below provides average, median, minimum and maximum values for first, second and highest court level Disposition time of the 25 states, but also for 1st +2nd court level (as to say the total Disposition time for a case which is defined at second court level) and for 1st +2nd +3rd court level (total Disposition time for a case defined at highest level). In 18 states Disposition time for 1st +2nd +3rd court level is less than one year while in four cases it is between one and two years (Slovenia, Spain, Croatia, Denmark ) and in the remaining three countries it is over than two (Romania, Albania, Italy ). As for the above figures, looking at these values, the reader should keep in mind that they do not include the pre-trial phase.
Table 22 - First, second and highest instance court s total criminal cases (2008) Disposition time (in days) synthesis table (25 states)
country
First instance courts Disposition time - Total criminal cases (8+9) (2008)
Second instance courts Disposition time - Total criminal cases (8+9) (2008)
Highest instance courts Disposition time - Total criminal cases (8+9) (2008)
1st +2nd instance courts Disposition time - Total criminal cases (8+9) (2008)
1st +2nd +3rd instance courts Disposition time - Total criminal cases (8+9) (2008)
Average 129 123 162 252 414 Median 101 70 81 178 255 Min 37 23 18 66 130 Max 334 805 826 1139 1352
On average, comparing states that provide data for all three court levels, first instance courts dealing with the total of criminal cases show a Disposition time which is half of that of total of first instance courts dealing with the total of civil, commercial and administrative law cases, (129 Vs 234 days). The Median value is still better for total of criminal cases Disposition time than for the total of civil, commercial and administrative law cases, though not as much (101 Vs 148). This is consistent with the fact that total criminal cases Disposition time ranges between a minimum of 37 days for Azerbaijan and a maximum of 334 days for Italy , while total civil, commercial and administrative law cases Disposition time ranges between a minimum of 40 days for Georgia and a maximum of 932 days for Bosnia and Herzegovina . The trend is similar when comparing the sum of first and second instance courts Disposition time (average of 252 Vs 450 days and median 178 Vs 313 days) and the sum of all three court level Disposition times (average of 414 Vs 714 days and median 255 Vs 503 days).

84
0 200 400 600 800 1000 1200 1400 1600
UK-Scotland
Ukraine
UK-Northern Ireland
UK-England and Wales
Turkey
Sw itzerland
Sw eden
Spain
Slovenia
Slovakia
Serbia
San Marino
Russian Federation
Romania
Portugal
Poland
Norw ay
Netherlands
Montenegro
Monaco
Moldova
Malta
Luxembourg
Lithuania
Lichtenstein
Latvia
Italy
Ireland
Iceland
Hungary
Greece
Germany
Georgia
FYROMacedonia
France
Finland
Estonia
Denmark
Czech Republic
Cyprus
Croatia
Bulgaria
Bosnia and Herzegovina
Belgium
Azerbaijan
Austria
Armenia
Andorra
Albania
First instance courts DispositionTime - Total criminal cases (8+9)(2008)
Second instance courts DispositionTime - Total criminal cases (8+9)(2008)
Highest instance courts DispositionTime - Total criminal cases (8+9)(2008)
Figure 61 - First, second and highest instance cour ts total criminal cases (2008) Disposition time

85
The figure above presents all the 2008 Disposition time values that it has been possible to calculate, ordered by country. The values do not include the pre-trial phase. The table which follows provides the raw data used to draw the figure. Table 23 - First, second and highest instance court s total criminal cases (2008) Disposition time (in days)
country
First instance courts Disposition time - Total criminal cases (8+9) (2008)
Second instance courts Disposition time - Total criminal cases (8+9) (2008)
Highest instance courts Disposition time - Total criminal cases (8+9) (2008)
Albania 103 337 772 Andorra 59 196 Armenia 83 76 58 Austria 114 48 83 Azerbaijan 37 30 64 Belgium 109 Bosnia and Herzegovina 222 55 61 Bulgaria 149 81 Croatia 239 369 71 Cyprus 207 Czech Republic 73 39 Denmark 125 54 505 Estonia 52 23 104 Finland 93 112 126 France Georgia 80 35 82 Germany Greece Hungary 101 63 63 Iceland 58 Ireland Italy 334 805 212 Latvia 56 167 18 Lichtenstein Lithuania 92 47 81 Luxembourg Malta 288 219 Moldova 70 41 57 Monaco Montenegro 229 145 Netherlands Norway 76 42 107 Poland 93 56 103 Portugal 213 102 39 Romania 72 100 826 Russian Federation 36 14 San Marino 151 Serbia 310 84 Slovakia 195 87 65 Slovenia 267 84 71 Spain 144 70 267 Sweden 136 131 69 Switzerland 56 116 84 FYROMacedonia 162 24 61 Turkey 239 449 Ukraine 22 UK-England and Wales UK-Northern Ireland UK-Scotland
3.3. Litigious divorce cases average length at first and second instance courts Nineteen states provided data on 2008 average length of litigious divorce cases at first instance courts, while fourteen provided such data for second instance courts. In thirteen cases data is available at both instance court levels. Below are two figures presenting the data for the cases in which both values have been

86
provided. In the left figure cases are ordered by the average length of first instance court procedure, while the figure on the right present the data arranged by the total of first and second instance procedures. In this selection of cases, first instance litigious divorce cases average length ranges between a minimum of 73 days (Albania ) and a maximum of 564 days (France ) while the sum of first and second instance average lengths ranges between 121 days (Estonia ) and a maximum of 957 days (France ). On average, first instance litigious divorce cases have a length of 214 days and a median of 164 while the average of the sums of first and second instance litigious divorce cases lengths is 342 days and the median 243.
Average length (ordered by 1st instance courts aver age length)
0 200 400 600 800 1000
France
Netherlands
Bosnia and Herzegovina
Monaco
Finland
Slovenia
Poland
Denmark
FYROMacedonia
Latvia
Montenegro
Estonia
Albania
1st instance(average length) -Litigious divorcecases (2008) (indays)
2nd instance(average length) -Litigious divorcecases (2008)
Average length (ordered by 1st +2nd instance courts average length)
0 200 400 600 800 1000
France
Netherlands
Monaco
Bosnia and Herzegovina
Albania
Slovenia
Finland
Denmark
Montenegro
Poland
Latvia
FYROMacedonia
Estonia
1st instance(average length) -Litigious divorcecases (2008) (indays)
2nd instance(average length) -Litigious divorcecases (2008)
Figure 62 - First and second instance courts litigi ous
divorce cases (2008) average length ordered by 1 st instance courts average length
Figure 63 - First and second instance courts litigi ous divorce cases (2008) average length ordered by 1 st+2nd
instance courts average length

87
0 100 200 300 400 500 600 700 800 900 1000
Albania
Austria
Belgium
Bosnia and Herzegovina
Denmark
Estonia
Finland
France
Italy
Latvia
Lithuania
Monaco
Montenegro
Netherlands
Poland
Portugal
Slovenia
Spain
Sw eden
FYROMacedonia
Turkey
UK-England and Wales
1st instance(average length) -Litigious divorcecases (2008) (indays)
2nd instance(average length) -Litigious divorcecases (2008)
Figure 64 - First and second instance courts litigi ous divorce cases (2008) average length ordered by state name The table below provides the raw data used to draw the above figure. Table 24 - First and second instance courts litigio us divorce cases (2008) average length (in days)
country 1st instance (average length) - Litigious divorce cases (2008) (in days)
2nd instance (average length) - Litigious divorce cases (2008)
Albania 73 246 Austria 180 NA Belgium NA 479 Bosnia and Herzegovina 329 98 Denmark 153 90 Estonia 91 30 Finland 243 0 France 564 393 Italy 682 NA Latvia 135 72 Lithuania 69 Monaco 270 240 Montenegro 104 120 Netherlands 331 217 Poland 164 50 Portugal 101 Slovenia 191 60 Spain 261 NA Sweden 234 NAP FYROMacedonia 136 47 Turkey 152 NA UK-England and Wales 225 NA

88
3.4. Possible alert tools The data analysis evidenced the possibility to develop a number of possible “alert tools” which could be used to more or less automatically point the attention on critical information which can be extrapolated from the Cepej growing database. Below, as an example, a possible scheme for monitoring Clearance rate variation in relation to the current Clearance rate, providing four level of alert. The levels are just indicative; the example is based on highest instance courts, total of civil, commercial and administrative law cases data. In this example the levels dependent on a combination of both Clearance rate and Clearance rate variation (i.e. Finland CR 90% ,CRV -19,6% red; Hungary CR 90% CRV -4,9% orange). Table 25 - Clearance rate and Clearance rate variat ion possible alert tool
States with a negative Clearance rate 2006-2008 trend
Highest instance courts, total of civil, commercial and administrative law cases Clearance rate 2008
Clearance rate variation between 2006 and 2008
States with a positive Clearance rate 2006-2008 trend
Highest instance courts, total of civil, commercial and administrative law cases Clearance rate 2008
Clearance rate variationbetween 2006 and 2008
Croatia 73% -40,7% Sweden 96% 4,7% Romania 80% -19,9% Czech Republic 98% 6,3% Latvia 83% -8,6% Armenia 100% 1,0% Georgia 88% -23,1% Slovenia 100% 24,3% Estonia 89% -4,9% Portugal 102% 0,1% Finland 90% -19,6% Belgium 105% 5,5% Hungary 90% -4,9% Switzerland 107% 9,8% Bulgaria 92% -11,8% Italy 112% 27,9% Slovakia 96% -9,8% Norway 122% 22,2% Moldova 97% -3,6% FYROMacedonia 122% 18,7% Poland 98% -5,6% Lithuania 123% 23,2% France 99% -15,6% Austria 101% -0,3% Bosnia and Herzegovina 118% -38,0% Spain 123% -18,8%

89
Annex 1 - Member State Data During the elaboration of the data it has emerged the idea that it could be useful to have synthetic State tables. the tables provides a vision of the State main length of proceeding related data and indicators by category of cases, at first, second and highest court level, both in 2006 and 2008. The tables can be downloaded from the Cepej website. What follows is an anonimized example of the synthetic court proceedings’ State tables.
CoE Member State
CoE Member State Total of civil, commercial and ad ministrative law cases (1-7)
Incoming cases Resolved cases Pending cases on 31 Dec.
First instance courts
Second instance courts
Highest instance courts
First instance courts
Second instance courts
Highest instance courts
First instance courts
Second instance courts
Highest instance courts
2.006 1339889 70.963 11.700 1.353.285 69.977 10.731 331.216 17.177 6.789 2.008 1454606 72.788 10.137 1.457.268 73.488 9.938 669.252 17.086 6.986
Clearance rate Case Turnover Ratio Disposition time
First instance courts
Second instance courts
Highest instance courts
First instance courts
Second instance courts
Highest instance courts
First instance courts
Second instance courts
Highest instance courts
2.006 101% 99% 92% 409% 407% 158% 89 90 231 2.008 100% 101% 98% 218% 430% 142% 168 85 257
CoE Member State Civil and commercial litigious cas es (1)
Incoming cases Resolved cases Pending cases on 31 Dec.
First instance courts
Second instance courts
Highest instance courts
First instance courts
Second instance courts
Highest instance courts
First instance courts
Second instance courts
Highest instance courts
2.006 327.964 7.507 332.478 6.002 164.694 4.091 2.008 360.945 6.510 368.048 6.066 155.472 5.654
Clearance rate Case Turnover Ratio Disposition time
First instance courts
Second instance courts
Highest instance courts
First instance courts
Second instance courts
Highest instance courts
First instance courts
Second instance courts
Highest instance courts
2.006 101% 80% 202% 147% 181 249 2.008 102% 93% 237% 107% 154 340
CoE Member State Total criminal cases (8+9)
Incoming cases Resolved cases Pending cases on 31 Dec.
First instance courts
Second instance courts
Highest instance courts
First instance courts
Second instance courts
Highest instance courts
First instance courts
Second instance courts
Highest instance courts
2.006 100.233 13.545 2.351 101.252 13.584 2.350 24.304 1.574 199 2.008 103.329 15.263 105.367 13.392 20.958 1.444
Clearance rate Case Turnover Ratio Disposition time
First instance courts
Second instance courts
Highest instance courts
First instance courts
Second instance courts
Highest instance courts
First instance courts
Second instance courts
Highest instance courts
2.006 101% 100% 100% 417% 863% 12 88 42 31 2.008 102% 88% 503% 927% 73 39
CoE Member State Criminal cases, severe criminal of fences (8)
Incoming cases Resolved cases Pending cases on 31 Dec.
First instance courts
Second instance courts
Highest instance courts
First instance courts
Second instance courts
Highest instance courts
First instance courts
Second instance courts
Highest instance courts
2.006 - - - - - 0 2.008 NA 2.718 NA 2.619 NA 304
Clearance rate Case Turnover Ratio Disposition time
First instance courts
Second instance courts
Highest instance courts
First instance courts
Second instance courts
Highest instance courts
First instance courts
Second instance courts
Highest instance courts
2.006 2.008 96% 862% 42

90
CoE Member State
Litigious divorce cases
1st instance (average length)
2nd instance (average length)
Total procedure (average total length)
2.004 228 55 284 2.006 - - 602 2.008 NA NA NA
Employment dismissal cases
1st instance (average length)
2nd instance (average length)
Total procedure (average total length)
2.004 628 138 628 2.006 - - 284 2.008 NA NA 1009
Robbery cases
1st instance (average length)
2nd instance (average length)
Total procedure (average total length)
2.004 373 52 409 2.006 362 436 206,5 2.008 344 443 349
Intentional homicide
1st instance (average length)
2nd instance (average length)
Total procedure (average total length)
2.004 210 53 285 2.006 289 289 161,5 2.008 227 NA 227

91
Annex 2 - Text of the questions from the Cepej Eval uation Scheme related to the report 1. 1. 1. Inhabitants and economic information 1. Number of inhabitants 4. 2. 2. Penal, civil and administrative law cases 90. Total number of cases in the first instance cou rts (litigious and non-litigious): please complete the table. If the data are not available ( NA) or not applicable (NAP) please indicate it in t he table with the relevant abbreviations.
Pending
cases on 1 Jan. ‘08
Incoming cases
Resolved cases
Pending cases on 31
Dec. ‘08
Total of civil, commercial and administrative law cases (litigious and non litigious)*
1 Civil (and commercial) litigious cases*
2 Civil (and commercial) non-litigious cases*
3 Enforcement cases
4 Land registry cases**
5 Business register cases**
6 Administrative law cases
7 Other
Total criminal cases (8+9)
8 Criminal cases (severe criminal offences)
9 Misdemeanour and / or minor offences cases
* Please indicate (in the comments below) which types of cases are included in the total figures of civil, commercial and administrative law cases. ** if applicable Note 1 : the cases mentioned in categories 3 to 5 (enforcement, land registry, business register) should be presented separately in the table. The cases mentioned in category 6 (administrative law cases) should also be separately mentioned for the countries which have specialised administrative courts or units in the courts of general jurisdiction. For the criminal law cases there may be a problem of classification of cases between severe criminal law cases and misdemeanour cases. Some countries might have other ways of addressing misdemeanour offences (for example via administrative law procedure). Please indicate if possible what case categories are included under "severe criminal cases" and the cases included under "misdemeanour cases and /or minor offences".
Note 2: please check if the figures submitted are consistent (horizontal and vertical). Horizontal consistent data means that: "(pending cases on 1 Jan 08 + incoming cases) – resolved cases" should give the correct number of pending cases on 31 Dec 08. Vertical consistency of data means that the sum of the individual case categories for civil, commercial and administrative cases (categories 1 to 7) should be the figure presented at the second row (total civil, commercial and
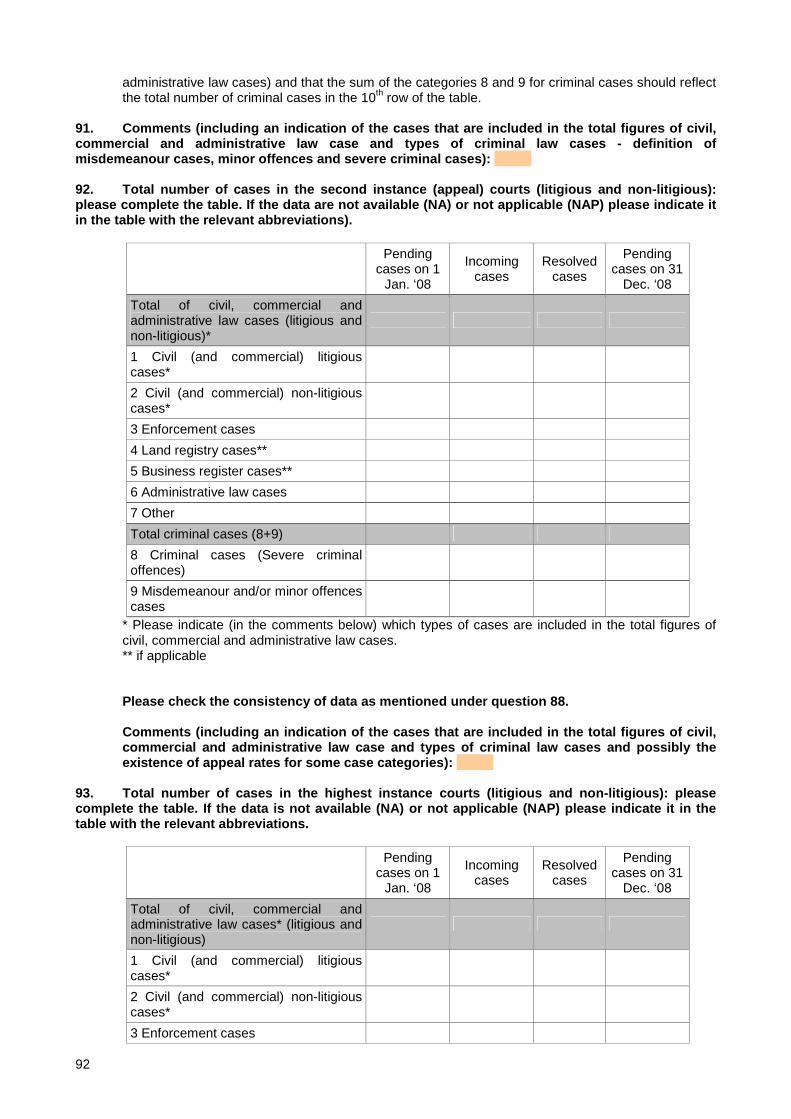
92
administrative law cases) and that the sum of the categories 8 and 9 for criminal cases should reflect the total number of criminal cases in the 10th row of the table.
91. Comments (including an indication of the cases that are included in the total figures of civil, commercial and administrative law case and types of criminal law cases - definition of misdemeanour cases, minor offences and severe crimi nal cases): 92. Total number of cases in the second instance (a ppeal) courts (litigious and non-litigious): please complete the table. If the data are not avai lable (NA) or not applicable (NAP) please indicate it in the table with the relevant abbreviations).
Pending
cases on 1 Jan. ‘08
Incoming cases
Resolved cases
Pending cases on 31
Dec. ‘08
Total of civil, commercial and administrative law cases (litigious and non-litigious)*
1 Civil (and commercial) litigious cases*
2 Civil (and commercial) non-litigious cases*
3 Enforcement cases
4 Land registry cases**
5 Business register cases**
6 Administrative law cases
7 Other
Total criminal cases (8+9)
8 Criminal cases (Severe criminal offences)
9 Misdemeanour and/or minor offences cases
* Please indicate (in the comments below) which types of cases are included in the total figures of civil, commercial and administrative law cases. ** if applicable Please check the consistency of data as mentioned u nder question 88. Comments (including an indication of the cases that are included in the total figures of civil, commercial and administrative law case and types of criminal law cases and possibly the existence of appeal rates for some case categories) :
93. Total number of cases in the highest instance c ourts (litigious and non-litigious): please complete the table. If the data is not available (N A) or not applicable (NAP) please indicate it in th e table with the relevant abbreviations.
Pending
cases on 1 Jan. ‘08
Incoming cases
Resolved cases
Pending cases on 31
Dec. ‘08
Total of civil, commercial and administrative law cases* (litigious and non-litigious)
1 Civil (and commercial) litigious cases*
2 Civil (and commercial) non-litigious cases*
3 Enforcement cases

93
4 Land registry cases**
5 Business register cases**
6 Administrative law cases
7 Other
Total criminal cases (8+9)
8 Criminal cases (severe criminal offences)
9 Misdemeanour cases (minor offences)
* Please indicate (in the comments below) which types of cases are included in the total figures of civil, commercial and administrative law cases. ** if applicable
Please check the consistency of data as mentioned u nder question 88.
Comments (including an indication of the cases that are included in the total figures of civil, commercial and administrative law case and on possi ble limitations to the appeal to the highest instance court):
94. Number of litigious divorce cases, employment d ismissal cases, robbery cases and intentional homicide cases received and treated by first instance courts: please complete the table. If the data are not available (NA) or not applicable ( NAP) please indicate it in the table with the relev ant abbreviations.
Pending cases on 1 Jan. ‘08
Incoming cases
Resolved cases
Pending cases on 31 Jan. ‘08
Litigious divorce cases*
Employment dismissal cases*
Robbery cases
Intentional homicide 95. Average length of proceeding (from the date of lodging of court proceedings) in days, number of pending cases more than 3 years and perce ntage of cases subject to appeal: please complete the tale. If the data is not available (NA ) or not applicable (NAP) please indicate it in the table with the relevant abbreviations.
% of decisions subject to
appeal
% pending cases more than 3 years
1st instance (average length)
2d instance (average length)
Total procedure
(average total length)
Litigious divorce cases*
Employment dismissal cases*
Robbery cases
Intentional homicide
Please provide comments to explain the answers to q uestion 92:

94
Annex 3 - Additional tables This annex provides for first, second and highest instance courts: 2006 and 2008 incoming, resolved and pending (on 31 Dec.) cases data, Clearance rate, Disposition time and 2006-2008 Clearance rate variation for the following categories of cases: Total of civil, commercial and administrative law cases (1-7), Civil and commercial litigious cases (1), Civil and commercial non-litigious cases (2), Administrative law cases (6), Total criminal cases (8+9), Severe criminal offences (8), Misdemeanour and/or minor offences' cases (9). Comments on first, second and highest instance courts data are also provided. In addition, this annex provides also 2004, 2006 and 2006 average length of proceedings data for litigious divorce cases and comments on the methods of calculation of the average length of proceedings. List of additional tables: Table 26 - First instance courts Total of civil, commercial and administrative law cases (1-7) data....................................................................................................95 Table 27 - First instance courts Civil and commercial litigious cases (1) data.....................................................................................................................................96 Table 28 - First instance courts Civil and commercial non-litigious cases (2) data..............................................................................................................................97 Table 29 - First instance courts Administrative law cases (6) data ......................................................................................................................................................98 Table 30 - First instance courts Total criminal cases (8+9) data..........................................................................................................................................................99 Table 31 - First instance courts Criminal cases (severe criminal offences) (8) data..........................................................................................................................100 Table 32 - First instance courts Misdemeanour and/or minor offences' cases (9).............................................................................................................................101 Table 33 - Comments to first instance court cases data ....................................................................................................................................................................103 Table 34 - Second instance (appeal) courts Total of civil, commercial and administrative law cases (1-7) data ..............................................................................114 Table 35 - Second instance (appeal) courts Civil and commercial litigious cases (1) data ...............................................................................................................115 Table 36 - Second instance (appeal) courts Civil and commercial non-litigious cases (2) data ........................................................................................................116 Table 37 - Second instance (appeal) courts Administrative law cases (6) data.................................................................................................................................117 Table 38 - Second instance (appeal) courts Total criminal cases (8+9) data ....................................................................................................................................118 Table 39 - Second instance (appeal) courts Criminal cases (severe criminal offences) (8) data ......................................................................................................119 Table 40 - Second instance (appeal) courts Misdemeanour and/or minor offences' cases (9) data .................................................................................................120 Table 41 - Comments to second instance court cases data ..............................................................................................................................................................122 Table 42 - Highest instance courts Total of civil, commercial and administrative law cases (1-7) data ............................................................................................125 Table 43 - Highest instance courts Civil and commercial litigious cases (1) data..............................................................................................................................126 Table 44 - Highest instance courts Civil and commercial non-litigious cases (2) data ......................................................................................................................127 Table 45 - Highest instance courts Administrative law cases (6) data...............................................................................................................................................128 Table 46 - Highest instance courts Total criminal cases (8+9) data ..................................................................................................................................................129 Table 47 - Highest instance courts Criminal cases (severe criminal offences) (8) data ....................................................................................................................130 Table 48 - Highest instance courts Misdemeanour and/or minor offences' cases (9) data ...............................................................................................................131 Table 49 - Comments to highest instance court cases data ..............................................................................................................................................................133 Table 50 - Litigious divorce cases average length .............................................................................................................................................................................136 Table 51 - Description of the calculation method of the length of proceedings (not limited to litigious divorce cases, it also include comments on employment dismissal, robbery and intentional homicide cases) ...........................................................................................................................................................................138

95
Table 26 - First instance courts Total of civil, co mmercial and administrative law cases (1-7) data
country
90.2.1. First instance courts Incoming cases - Total of civil,
commercial and
administrative law cases (1-7)
(2006) [q88]
90.2.1. First instance courts Incoming cases - Total of civil,
commercial and
administrative law cases (1-7)
(2008)
90.3.1. First instance courts Resolved cases - Total of civil,
commercial and
administrative law cases (1-7)
(2006) [q88]
90.3.1. First instance courts Resolved cases - Total of civil,
commercial and
administrative law cases (1-7)
(2008)
90.4.1. First instance courts Pending cases on 31 Dec. 06 - Total of civil, commercial
and administrative law cases (1-7)
(2006) [q88]
90.4.1. First instance courts Pending cases on 31 Dec. 08 - Total of civil, commercial
and administrative law cases (1-7)
(2008)
Clearance Rate (2006)
Clearance Rate (2008)
Clearance Rate
variation (2006-2008)
Disposition Time (2006)
Disposition Time (2008)
Albania 54.393 50.714 11.174 93,24% 80,4 Andorra 3.321 5.735 3.266 5.242 3.354 4.000 98,34% 91,40% -6,94% 374,8 278,5 Armenia 39.218 40.942 43.611 33.176 5.788 13.378 111,20% 81,03% -30,17% 48,4 147,2 Austria 966.929 3.625.816 969.836 3.635.938 205.534 528.771 100,30% 100,28% -0,02% 77,4 53,1 Azerbaijan NAP NAP NAP Belgium NA NA NA NA NA NA Bosnia and Herzegovina 763.590 1.043.238 545.157 744.475 1.480.722 1.901.129 71,39% 71,36% -0,03% 991,4 932,1 Bulgaria 266.907 140.700 267.899 150.786 70.371 61.026 100,37% 107,17% 6,80% 95,9 147,7 Croatia 1.157.377 1.104.436 1.589.727 1.136.502 576.920 471.529 137,36% 102,90% -34,45% 132,5 151,4 Cyprus 22.639 25.407 29.436 112,23% 422,9 Czech Republic 1.339.889 1.454.606 1.353.285 1.457.268 331.216 669.252 101,00% 100,18% -0,82% 89,3 167,6 Denmark NA 3.117.753 NA 3.103.306 NA 133.458 99,54% 15,7 Estonia 33.619 279.192 34.901 259.078 20.564 94.275 103,81% 92,80% -11,02% 215,1 132,8 Finland 750.936 642.751 741.361 635.813 100.597 100.217 98,72% 98,92% 0,20% 49,5 57,5 France 2.182.342 2.228.746 2.107.976 2.136.181 1.417.978 1.542.191 96,59% 95,85% -0,75% 245,5 263,5 Georgia 33.908 57.231 29.633 62.430 14.729 6.785 87,39% 109,08% 21,69% 181,4 39,7 Germany 3.617.025 22.250.438 2.687.295 615,16% 44,1 Greece 156000* 137000* 182.856 87,82% 487,2 Hungary 607.254 1.184.162 601.006 1.165.201 128.939 180.331 98,97% 98,40% -0,57% 78,3 56,5 Iceland 12.832 11.714 1.478 91,29% 46,1 Ireland 103.919 NA NA NA Italy 3.625.035 4.591.018 3.436.728 4.431.317 4.347.177 4.590.715 94,81% 96,52% 1,72% 461,7 378,1 Latvia 57.047 96.783 57.291 83.706 21.442 36.187 100,43% 86,49% -13,94% 136,6 157,8 Lichtenstein Lithuania 221.185 276.855 213.940 272.045 29.544 33.317 96,72% 98,26% 1,54% 50,4 44,7 Luxembourg NA 4.098 NA 9.923 NA NA 242,14% Malta 3.733 4.067 4.663 4.064 10.660 10.335 124,91% 99,93% -24,99% 834,4 928,2 Moldova 175.041 66.848 181.927 63.411 11.708 14.064 103,93% 94,86% -9,08% 23,5 81,0 Monaco 682 1.090 627 1.070 1.261 NA 91,94% 98,17% 6,23% 734,1 Montenegro 76.298 77.371 33.951 101,41% 160,2 Netherlands 1.197.690 1.270.290 1.188.670 1.263.920 NA 99,25% 99,50% 0,25% Norway 40.878 45.765 42.253 43.671 19.570 22.066 103,36% 95,42% -7,94% 169,1 184,4 Poland 4.171.029 8.419.031 4.047.701 8.374.441 874.992 1.321.712 97,04% 99,47% 2,43% 78,9 57,6 Portugal 575.325 572.657 593.718 544.515 1.357.323 1.380.012 103,20% 95,09% -8,11% 834,4 925,1 Romania 1.202.168 1.558.687 1.152.328 1.495.976 278.776 405.429 95,85% 95,98% 0,12% 88,3 98,9 Russian Federation 12.575.000 16.036.000 112.569.000 16.135.000 506.000 417.000 895,18% 100,62% -794,56% 1,6 9,4 San Marino 1.118 1.148 2.025 102,68% 643,8 Serbia 918.108 1.108.702 324.632 120,76% 106,9 Slovakia 248.507 1.014.863 281.862 1.046.081 239.740 392.728 113,42% 103,08% -10,35% 310,5 137,0 Slovenia 575.494 581.904 594.693 613.598 449.540 410.639 103,34% 105,45% 2,11% 275,9 244,3 Spain 2.024.371 2.607.873 1.833.225 2.105.604 2.012.079 2.604.034 90,56% 80,74% -9,82% 400,6 451,4 Sweden 64.264 172.206 65.212 182.808 35.773 70.136 101,48% 106,16% 4,68% 200,2 140,0 Switzerland 347.295 156.936 325.448 156.666 173.583 54.970 93,71% 99,83% 6,12% 194,7 128,1 FYROMacedonia 82.950 99.419 85.117 255.091 38.513 284.962 102,61% 256,58% 153,97% 165,2 407,7 Turkey 1.774.747 3.572.324 1.702.445 3.473.868 960.948 1.150.594 95,93% 97,24% 1,32% 206,0 120,9

96
Ukraine 2.749.654 2.626.449 95,52% UK-England and Wales 2.157.361 2.426.357 64.520 NA NA 2,99% UK-Northern Ireland NA NA NA UK-Scotland 240.000 165.500 NA NA
Table 27 - First instance courts Civil and commerci al litigious cases (1) data
country
90.2.2. First instance courts Incoming cases
- (1) Civil and commercial
litigious cases (2006) [q88]
90.2.2. First instance courts Incoming cases
- (1) Civil and commercial
litigious cases (2008)
90.3.2. First instance courts Resolved cases
- (1) Civil and commercial
litigious cases (2006) [q88]
90.3.2. First instance courts Resolved cases
- (1) Civil and commercial
litigious cases (2008)
90.4.2. First instance courts Pending cases on 31 Dec. 06 -
(1) Civil and commercial
litigious cases (2006) [q88]
90.4.2. First instance courts Pending cases on 31 Dec. 08 -
(1) Civil and commercial
litigious cases (2008)
Clearance Rate (2006)
Clearance Rate (2008)
Clearance Rate
variation (2006-2008)
Disposition Time (2006)
Disposition Time (2008)
Albania 19.980 18.418 6.369 92,18% 126,2 Andorra 1.321 3.255 1.177 3.129 1.765 1.175 89,10% 96,13% 7,03% 547,3 137,1 Armenia 31.373 26.991 9.994 86,03% 135,1 Austria 113.774 110.497 110.302 111.245 40.732 39.227 96,95% 100,68% 3,73% 134,8 128,7 Azerbaijan 55.431 70.593 54.612 70.119 6.225 8.157 98,52% 99,33% 0,81% 41,6 42,5 Belgium 317.290 661.149 NA NA NA NA Bosnia and Herzegovina 138.598 147.807 136.439 136.664 261.980 292.476 98,44% 92,46% -5,98% 700,8 781,1 Bulgaria NA NA NA Croatia 133.421 140.283 148.134 145.069 217.778 198.067 111,03% 103,41% -7,62% 536,6 498,3 Cyprus 27.114 16296* 30.008 60,10% 672,1 Czech Republic 327.964 360.945 332.478 368.048 164.694 155.472 101,38% 101,97% 0,59% 180,8 154,2 Denmark 63.171 59.670 62.427 58.366 28.036 32.873 98,82% 97,81% -1,01% 163,9 205,6 Estonia 25.943 19.778 28.118 19.630 NA 12.466 108,38% 99,25% -9,13% 231,8 Finland 9.200 9.703 9.072 9.399 5.368 5.929 98,61% 96,87% -1,74% 216,0 230,2 France 1.688.367 1.744.350 1.624.484 1.645.161 1.165.592 1.287.706 96,22% 94,31% -1,90% 261,9 285,7 Georgia 21.877 9.105 20.299 12.513 11.995 4.162 92,79% 137,43% 44,64% 215,7 121,4 Germany 1.104.828 1.588.198 544.751 143,75% 125,2 Greece Hungary 178.338 189.644 179.317 191.002 86.760 88.769 100,55% 100,72% 0,17% 176,6 169,6 Iceland Ireland NA NA NA Italy 2.825.543 2.842.668 2.653.113 2.693.564 3.687.965 3.932.259 93,90% 94,75% 0,86% 507,4 532,9 Latvia 34.010 50.318 35.972 36.914 15.496 30.718 105,77% 73,36% -32,41% 157,2 303,7 Lichtenstein Lithuania 70.284 185.878 71.219 180.071 8.103 27.172 101,33% 96,88% -4,45% 41,5 55,1 Luxembourg NA 3.144 NA 4.378 NA NA 139,25% Malta 3.567 3.950 4.500 3.901 9.859 9.500 126,16% 98,76% -27,40% 799,7 888,9 Moldova 5.397 61.427 9.987 58.007 1.075 12.649 185,05% 94,43% -90,61% 39,3 79,6 Monaco 428 723 490 689 NA 1.252 114,49% 95,30% -19,19% 663,3 Montenegro 15.739 14.680 17.707 16.273 14.384 11.752 112,50% 110,85% -1,65% 296,5 263,6 Netherlands 950.450 NA 230.000 200.000 NA 24,20% Norway 13.335 16.104 13.737 16.928 7.050 6.861 103,01% 105,12% 2,10% 187,3 147,9 Poland 1.019.912 746.926 1.006.947 719.296 395.878 326.809 98,73% 96,30% -2,43% 143,5 165,8 Portugal 282.590 314.729 316.649 311.797 389.168 367.573 112,05% 99,07% -12,98% 448,6 430,3 Romania 546.222 706.381 522.112 664.608 141.931 287.768 95,59% 94,09% -1,50% 99,2 158,0 Russian Federation 7.133.000 10.164.000 7.126.000 10.263.000 480.000 391.000 99,90% 100,97% 1,07% 24,6 13,9 San Marino 837 880 1.601 105,14% 664,1 Serbia 144.356 191.862 158.036 222.818 100.236 1.398.556 109,48% 116,13% 6,66% 231,5 2291,0 Slovakia 122.002 128.924 139.767 140.626 148.276 133.416 114,56% 109,08% -5,48% 387,2 346,3 Slovenia 34.683 31.221 35.880 33.788 52.210 42.612 103,45% 108,22% 4,77% 531,1 460,3 Spain 1.169.750 1.620.717 1.094.505 1.324.577 781.754 1.074.748 93,57% 81,73% -11,84% 260,7 296,2 Sweden 32.514 51.348 31.501 50.845 17.765 27.433 96,88% 99,02% 2,14% 205,8 196,9

97
Switzerland 87.232 88.114 40.636 101,01% 168,3 FYROMacedonia 45.816 47.357 45.458 55.113 33.371 33.843 99,22% 116,38% 17,16% 267,9 224,1 Turkey 1.307.698 1.117.212 1.264.886 1.069.043 724.998 NA 96,73% 95,69% -1,04% 209,2 Ukraine NA NA NA UK-England and Wales 2.127.928 298.769 46.198 NA NA 2,17% UK-Northern Ireland NA NA NA UK-Scotland 140.000 NA NA NA
Table 28 - First instance courts Civil and commerci al non-litigious cases (2) data
country
90.2.3. First instance courts Incoming cases
- (2) Civil and commercial non-litigious cases (2006)
[q88]
90.2.3. First instance courts Incoming cases
- (2) Civil and commercial non-litigious cases (2008)
90.3.3. First instance courts Resolved cases
- (2) Civil and commercial non-litigious cases (2006)
[q88]
90.3.3. First instance courts Resolved cases
- (2) Civil and commercial non-litigious cases (2008)
90.4.3. First instance courts Pending cases on 31 Dec. 06 -
(2) Civil and commercial non-litigious cases (2006)
[q88]
90.4.3. First instance courts Pending cases on 31 Dec. 08 -
(2) Civil and commercial non-litigious cases (2008)
Clearance Rate (2006)
Clearance Rate (2008)
Clearance Rate
variation (2006-2008)
Disposition Time (2006)
Disposition Time (2008)
Albania 29.259 27.943 2.716 95,50% 35,5 Andorra 451 627 446 628 56 126 98,89% 100,16% 1,27% 45,8 73,2 Armenia Austria 853.155 827.066 859.534 822.941 164.802 154.089 100,75% 99,50% -1,25% 70,0 68,3 Azerbaijan NAP NAP NAP Belgium PA NAP NAP NAP NAP NAP Bosnia and Herzegovina 56.542 54.039 56.106 56.478 55.377 48.399 99,23% 104,51% 5,28% 360,3 312,8 Bulgaria NA NA NA Croatia 210.233 230.297 212.882 230.245 26.556 24.817 101,26% 99,98% -1,28% 45,5 39,3 Cyprus Czech Republic 100.232 107.130 103.012 105.011 31.912 32.220 102,77% 98,02% -4,75% 113,1 112,0 Denmark 69.537 5.049 67.649 5.174 15.149 3.458 97,28% 102,48% 5,19% 81,7 243,9 Estonia 17.574 73.615 9.820 50.522 NA 62.741 55,88% 68,63% 12,75% 453,3 Finland 188.984 268.554 183.361 255.592 42.858 58.889 97,02% 95,17% -1,85% 85,3 84,1 France 127.721 101.837 128.722 105.099 12.540 5.840 100,78% 103,20% 2,42% 35,6 20,3 Georgia 7.909 9.056 394 114,50% 15,9 Germany 1.931.275 10.614.058 1.543.969 549,59% 53,1 Greece Hungary 413.159 565.136 405.984 549.952 36.268 72.409 98,26% 97,31% -0,95% 32,6 48,1 Iceland Ireland NA NA NA Italy 375.593 1.271.191 345.499 1.229.822 101.627 146.870 91,99% 96,75% 4,76% 107,4 43,6 Latvia 53.941 104.363 55.258 85.902 2.063 681 102,44% 82,31% -20,13% 13,6 2,9 Lichtenstein Lithuania 75.421 74.067 9.636 98,20% 47,5 Luxembourg NA NA NA NA NA NA Malta NAP NAP NAP NAP NAP NAP Moldova 64.405 128.810 9.057 200,00% 25,7 Monaco 153 346 136 356 NA NA 88,89% 102,89% 14,00% Montenegro 1.433 11.883 1.382 12.503 447 4.110 96,44% 105,22% 8,78% 118,1 120,0 Netherlands 101.580 NA 943.000 947.570 NA 928,33% Norway 11.636 12.019 11.712 10.140 5.488 6.706 100,65% 84,37% -16,29% 171,0 241,4 Poland 1.622.544 1.961.280 1.522.585 1.923.632 308.564 215.320 93,84% 98,08% 4,24% 74,0 40,9 Portugal NA 8.533 NA NA Romania - 547.401 - 538.830 - 21.490 98,43% 14,6 Russian Federation 438.000 458.000 439.000 458.000 26.000 26.000 100,23% 100,00% -0,23% 21,6 20,7 San Marino 139 142 75 102,16% 192,8

98
Serbia 303.227 184.649 303.579 193.355 38.473 10.417 100,12% 104,71% 4,60% 46,3 19,7 Slovakia 115.984 124.705 130.491 124.214 81.957 72.165 112,51% 99,61% -12,90% 229,2 212,1 Slovenia 29.893 32.004 29.481 31.697 18.264 18.143 98,62% 99,04% 0,42% 226,1 208,9 Spain 262.932 219.654 252.735 223.310 92.283 84.365 96,12% 101,66% 5,54% 133,3 137,9 Sweden 31.750 21.098 33.711 20.940 18.008 8.777 106,18% 99,25% -6,93% 195,0 153,0 Switzerland 5.456 5.447 1.308 99,84% 87,6 FYROMacedonia 18.944 12.329 18.744 12.809 2.693 3.011 98,94% 103,89% 4,95% 52,4 85,8 Turkey - 503.581 - 499.127 NAP NA 99,12% Ukraine NA NA NA UK-England and Wales 2.127.561 NA NA UK-Northern Ireland NA NA NA UK-Scotland NA NA NA
Table 29 - First instance courts Administrative law cases (6) data
country
90.2.7. First instance courts Incoming cases
- (6) Administrative
law cases (2006) [q88]
90.2.7. First instance courts Incoming cases
- (6) Administrative
law cases (2008)
90.3.7. First instance courts Resolved cases
- (6) Administrative
law cases (2006) [q88]
90.3.7. First instance courts Resolved cases
- (6) Administrative
law cases (2008)
90.4.7. First instance courts Pending cases on 31 Dec. 06 -
(6) Administrative
law cases (2006) [q88]
90.4.7. First instance courts Pending cases on 31 Dec. 08 -
(6) Administrative
law cases (2008)
Clearance Rate (2006)
Clearance Rate (2008)
Clearance Rate
variation (2006-2008)
Disposition Time (2006)
Disposition Time (2008)
Albania 4.327 3.565 1.898 82,39% 194,3 Andorra 171 388 182 305 92 246 106,43% 78,61% -27,82% 184,5 294,4 Armenia 7.225 9.569 9.198 6.185 1.726 3.384 127,31% 64,64% -62,67% 68,5 199,7 Austria NAP NAP NAP Azerbaijan NA NA NA Belgium NA NAP NA NAP NA NAP Bosnia and Herzegovina 1.639 8.414 1.111 8.275 1.665 6.229 67,79% 98,35% 30,56% 547,0 274,8 Bulgaria 24.281 23.349 22.195 21.964 15.279 7.429 91,41% 94,07% 2,66% 251,3 123,5 Croatia 14.068 13.298 13.388 14.847 39.899 36.871 95,17% 111,65% 16,48% 1087,8 906,4 Cyprus 2.470 1.965 674 1.532 3.711 3.912 27,29% 77,96% 50,68% 2009,7 932,0 Czech Republic 11.901 11.849 11.631 11.301 8.197 9.280 97,73% 95,38% -2,36% 257,2 299,7 Denmark NA 5.465 1.986 132,6 Estonia 2.552 2.736 2.542 2.757 921 912 99,61% 100,77% 1,16% 132,2 120,7 Finland 35.083 28.369 33.574 32.931 30.145 18.677 95,70% 116,08% 20,38% 327,7 207,0 France 166.785 176.313 164.342 183.811 211.990 199.495 98,54% 104,25% 5,72% 470,8 396,1 Georgia 12.031 8.059 9.334 8.925 2.734 2.007 77,58% 110,75% 33,16% 106,9 82,1 Germany 580.922 591.468 598.575 101,82% 369,4 Greece 4500* Hungary 15.757 14.971 15.705 14.741 5.911 6.387 99,67% 98,46% -1,21% 137,4 158,1 Iceland Ireland NA NA NA Italy NA NAP NA NAP NA NA Latvia 3.104 4.196 2.039 3.050 3.878 4.783 65,69% 72,69% 7,00% 694,2 572,4 Lichtenstein Lithuania 26.781 4.703 20.123 6.574 9.335 1.592 75,14% 139,78% 64,64% 169,3 88,4 Luxembourg 1.024 954 949 829 NA NA 92,68% 86,90% -5,78% Malta NA NA NA NA NA NA Moldova 105.239 5.421 210.478 5.404 1.576 1.415 200,00% 99,69% -100,31% 2,7 95,6 Monaco NA NA NA Montenegro 10.046 2.088 10.038 1.987 1.458 1.620 99,92% 95,16% -4,76% 53,0 297,6 Netherlands 145.660 116.290 143.500 116.350 NA 98,52% 100,05% 1,53% Norway NA NA NA Poland 63.260 58.129 79.541 59.380 27.688 18.109 125,74% 102,15% -23,58% 127,1 111,3 Portugal NA NA NA

99
Romania 141.879 208.327 134.975 200.124 39.470 69.429 95,13% 96,06% 0,93% 106,7 126,6 Russian Federation 5.005.000 5.415.000 5.005.000 5.415.000 NA NA 100,00% 100,00% 0,00% San Marino 32 41 36 128,13% 320,5 Serbia 5.163 10.938 4.700 5.207 1.513 15.246 91,03% 47,60% -43,43% 117,5 1068,7 Slovakia 10.521 10.883 11.604 10.485 9.507 9.082 110,29% 96,34% -13,95% 299,0 316,2 Slovenia 4.678 4.299 4.481 4.931 5.407 4.285 95,79% 114,70% 18,91% 440,4 317,2 Spain 155.403 179.794 113.937 160.400 129.171 164.594 73,32% 89,21% 15,90% 413,8 374,5 Sweden 103.784 96.759 104.647 107.939 45.094 31.200 100,83% 111,55% 10,72% 157,3 105,5 Switzerland 15.361 15.339 4.584 99,86% 109,1 FYROMacedonia 5.204 3.555 7.424 68,31% 762,2 Turkey 255.464 330.738 246.180 337.528 140.370 144.723 96,37% 102,05% 5,69% 208,1 156,5 Ukraine 110.929 568.996 77.325 406.955 18.915 NA 69,71% 71,52% 1,81% 89,3 UK-England and Wales NAP NAP NAP UK-Northern Ireland NA NA NA UK-Scotland 100.000 NA NA NA
Table 30 - First instance courts Total criminal cas es (8+9) data
country
90.2.9. First instance courts Incoming cases - Total criminal
cases (8+9) (2006) [q88]
90.2.9. First instance courts Incoming cases - Total criminal
cases (8+9) (2008)
90.3.9. First instance courts Resolved cases - Total criminal
cases (8+9) (2006) [q88]
90.3.9. First instance courts Resolved cases - Total criminal
cases (8+9) (2008)
90.4.9. First instance courts Pending cases on 31 Dec. 06 - Total criminal cases (8+9) (2006) [q88]
90.4.9. First instance courts Pending cases on 31 Dec. 08 - Total criminal cases (8+9)
(2008)
Clearance Rate (2006)
Clearance Rate (2008)
Clearance Rate
variation (2006-2008)
Disposition Time (2006)
Disposition Time (2008)
Albania 7.365 7.349 2.082 99,78% 103,4 Andorra 4.590 4.781 771 104,16% 58,9 Armenia 3.421 2.994 3.396 2.575 544 589 99,27% 86,01% -13,26% 58,5 83,5 Austria 86.144 59.812 87.857 65.538 26.838 20.405 101,99% 109,57% 7,58% 111,5 113,6 Azerbaijan 13.649 14.910 11.715 14.930 1.656 1.494 85,83% 100,13% 14,30% 51,6 36,5 Belgium NA NA 304.020 318.017 NA NA Bosnia and Herzegovina 154.320 242.057 158.351 321.898 412.177 195.623 102,61% 132,98% 30,37% 950,1 221,8 Bulgaria 116.857 26.295 120.119 29.192 22.385 11.942 102,79% 111,02% 8,23% 68,0 149,3 Croatia 507.089 365.311 530.550 400.684 308.817 262.632 104,63% 109,68% 5,06% 212,5 239,2 Cyprus 101.002 93.170 55.447 93.202 46.643 52.758 54,90% 100,03% 45,14% 307,0 206,6 Czech Republic 100.233 103.329 101.252 105.367 24.304 20.958 101,02% 101,97% 0,96% 87,6 72,6 Denmark 115.791 106.720 113.206 102.784 23.290 35.086 97,77% 96,31% -1,46% 75,1 124,6 Estonia 16.538 33.550 13.940 32.080 4.070 4.582 84,29% 95,62% 11,33% 106,6 52,1 Finland 62.796 65.244 63.573 63.575 15.993 16.258 101,24% 97,44% -3,80% 91,8 93,3 France 1.059.822 1.124.074 1.046.033 1.079.175 NA 98,70% 96,01% -2,69% Georgia 15.849 15.184 14.882 17.978 6.677 3.921 93,90% 118,40% 24,50% 163,8 79,6 Germany 1.236.815 1.254.114 375.325 101,40% 109,2 Greece 420.059 Hungary 315.743 262.113 318.917 261.831 71.448 72.343 101,01% 99,89% -1,11% 81,8 100,8 Iceland 2.808 2.378 606 84,69% 93,0 Ireland 332.442 NA NA NA Italy 1.309.534 1.504.521 1.228.039 1.427.847 1.289.127 1.308.335 93,78% 94,90% 1,13% 383,2 334,4 Latvia 9.706 38.085 33.796 36.779 3.236 5.669 348,20% 96,57% -251,63% 34,9 56,3 Lichtenstein Lithuania 17.245 16.472 17.225 16.082 3.279 4.036 99,88% 97,63% -2,25% 69,5 91,6 Luxembourg NA 49.441 12.011 13.397 NA NA 27,10% Malta 453 15.373 11.094 15.763 11.425 12.438 2449,01% 102,54% 375,9 288,0 Moldova 13.517 9.912 27.034 9.808 2.470 1.877 200,00% 98,95% -101,05% 33,3 69,9 Monaco NA 891 554 934 NA NA 104,83% Montenegro 26.025 33.521 21.070 128,80% 229,4 Netherlands 499.847 434.950 501.910 NA 100,41%
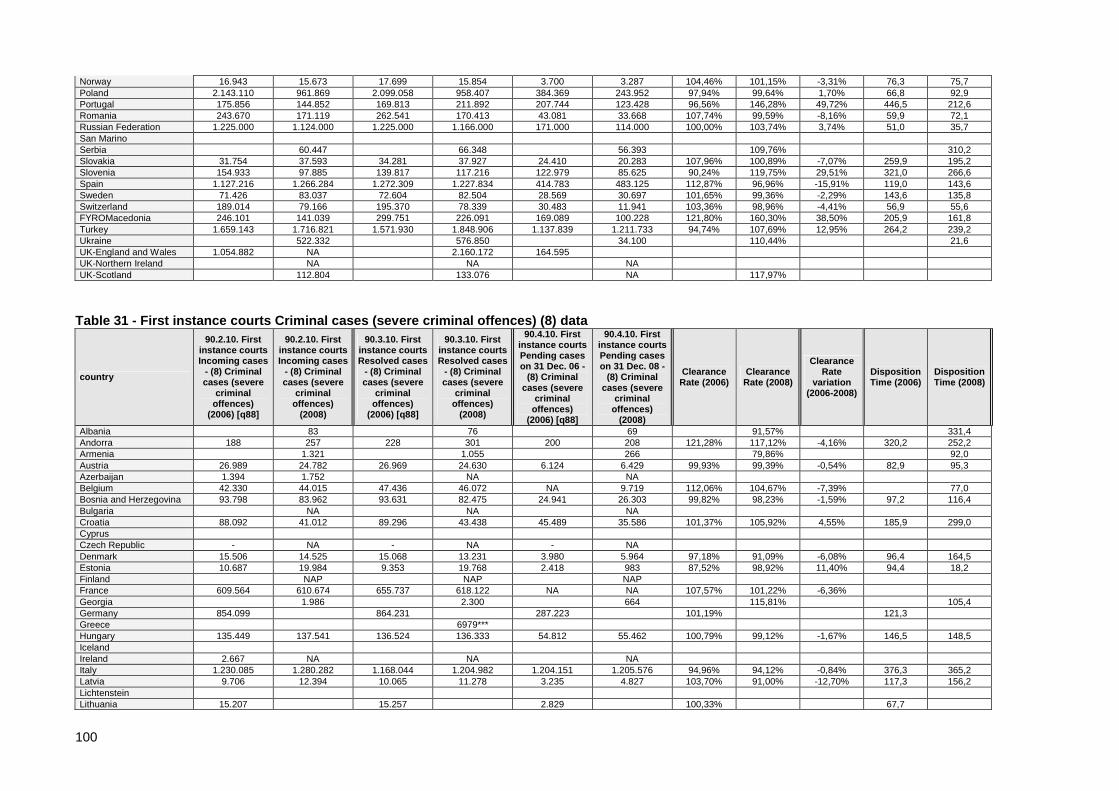
100
Norway 16.943 15.673 17.699 15.854 3.700 3.287 104,46% 101,15% -3,31% 76,3 75,7 Poland 2.143.110 961.869 2.099.058 958.407 384.369 243.952 97,94% 99,64% 1,70% 66,8 92,9 Portugal 175.856 144.852 169.813 211.892 207.744 123.428 96,56% 146,28% 49,72% 446,5 212,6 Romania 243.670 171.119 262.541 170.413 43.081 33.668 107,74% 99,59% -8,16% 59,9 72,1 Russian Federation 1.225.000 1.124.000 1.225.000 1.166.000 171.000 114.000 100,00% 103,74% 3,74% 51,0 35,7 San Marino Serbia 60.447 66.348 56.393 109,76% 310,2 Slovakia 31.754 37.593 34.281 37.927 24.410 20.283 107,96% 100,89% -7,07% 259,9 195,2 Slovenia 154.933 97.885 139.817 117.216 122.979 85.625 90,24% 119,75% 29,51% 321,0 266,6 Spain 1.127.216 1.266.284 1.272.309 1.227.834 414.783 483.125 112,87% 96,96% -15,91% 119,0 143,6 Sweden 71.426 83.037 72.604 82.504 28.569 30.697 101,65% 99,36% -2,29% 143,6 135,8 Switzerland 189.014 79.166 195.370 78.339 30.483 11.941 103,36% 98,96% -4,41% 56,9 55,6 FYROMacedonia 246.101 141.039 299.751 226.091 169.089 100.228 121,80% 160,30% 38,50% 205,9 161,8 Turkey 1.659.143 1.716.821 1.571.930 1.848.906 1.137.839 1.211.733 94,74% 107,69% 12,95% 264,2 239,2 Ukraine 522.332 576.850 34.100 110,44% 21,6 UK-England and Wales 1.054.882 NA 2.160.172 164.595 UK-Northern Ireland NA NA NA UK-Scotland 112.804 133.076 NA 117,97%
Table 31 - First instance courts Criminal cases (se vere criminal offences) (8) data
country
90.2.10. First instance courts Incoming cases
- (8) Criminal cases (severe
criminal offences)
(2006) [q88]
90.2.10. First instance courts Incoming cases
- (8) Criminal cases (severe
criminal offences)
(2008)
90.3.10. First instance courts Resolved cases
- (8) Criminal cases (severe
criminal offences)
(2006) [q88]
90.3.10. First instance courts Resolved cases
- (8) Criminal cases (severe
criminal offences)
(2008)
90.4.10. First instance courts Pending cases on 31 Dec. 06 -
(8) Criminal cases (severe
criminal offences)
(2006) [q88]
90.4.10. First instance courts Pending cases on 31 Dec. 08 -
(8) Criminal cases (severe
criminal offences)
(2008)
Clearance Rate (2006)
Clearance Rate (2008)
Clearance Rate
variation (2006-2008)
Disposition Time (2006)
Disposition Time (2008)
Albania 83 76 69 91,57% 331,4 Andorra 188 257 228 301 200 208 121,28% 117,12% -4,16% 320,2 252,2 Armenia 1.321 1.055 266 79,86% 92,0 Austria 26.989 24.782 26.969 24.630 6.124 6.429 99,93% 99,39% -0,54% 82,9 95,3 Azerbaijan 1.394 1.752 NA NA Belgium 42.330 44.015 47.436 46.072 NA 9.719 112,06% 104,67% -7,39% 77,0 Bosnia and Herzegovina 93.798 83.962 93.631 82.475 24.941 26.303 99,82% 98,23% -1,59% 97,2 116,4 Bulgaria NA NA NA Croatia 88.092 41.012 89.296 43.438 45.489 35.586 101,37% 105,92% 4,55% 185,9 299,0 Cyprus Czech Republic - NA - NA - NA Denmark 15.506 14.525 15.068 13.231 3.980 5.964 97,18% 91,09% -6,08% 96,4 164,5 Estonia 10.687 19.984 9.353 19.768 2.418 983 87,52% 98,92% 11,40% 94,4 18,2 Finland NAP NAP NAP France 609.564 610.674 655.737 618.122 NA NA 107,57% 101,22% -6,36% Georgia 1.986 2.300 664 115,81% 105,4 Germany 854.099 864.231 287.223 101,19% 121,3 Greece 6979*** Hungary 135.449 137.541 136.524 136.333 54.812 55.462 100,79% 99,12% -1,67% 146,5 148,5 Iceland Ireland 2.667 NA NA NA Italy 1.230.085 1.280.282 1.168.044 1.204.982 1.204.151 1.205.576 94,96% 94,12% -0,84% 376,3 365,2 Latvia 9.706 12.394 10.065 11.278 3.235 4.827 103,70% 91,00% -12,70% 117,3 156,2 Lichtenstein Lithuania 15.207 15.257 2.829 100,33% 67,7

101
Luxembourg NA NA 6.567 4.251 NA NA Malta 24 25 22 23 38 67 91,67% 92,00% 0,33% 630,5 1063,3 Moldova 7.856 15.712 1.620 200,00% 37,6 Monaco NA 40 318 43 NA 1 107,50% 8,5 Montenegro 7.304 8.501 7.176 10.752 8.554 6.097 98,25% 126,48% 28,23% 435,1 207,0 Netherlands 220.634 156.160 219.393 NA 99,44% Norway NA NA NA Poland 560.539 496.855 542.346 499.014 189.277 167.100 96,75% 100,43% 3,68% 127,4 122,2 Portugal 115.934 116.178 110.977 130.962 146.466 109.387 95,72% 112,73% 17,00% 481,7 304,9 Romania NAP NAP NAP Russian Federation 437.000 347.000 437.000 360.000 61.000 35.000 100,00% 103,75% 3,75% 50,9 35,5 San Marino 524 651 469 124,24% 263,0 Serbia 60.951 6.049 59.881 6.360 47.684 5.024 98,24% 105,14% 6,90% 290,7 288,3 Slovakia NA NA NA Slovenia 19.145 19.386 20.035 20.505 23.260 21.903 104,65% 105,77% 1,12% 423,8 389,9 Spain 240.345 345.707 388.317 310.280 205.898 259.358 161,57% 89,75% -71,81% 193,5 305,1 Sweden NAP NAP NAP Switzerland 17.966 16.819 9.263 93,62% 201,0 FYROMacedonia 15.116 14.885 15.165 17.213 9.785 10.718 100,32% 115,64% 15,32% 235,5 227,3 Turkey 692.987 796.920 725.418 758.610 697.686 720.127 104,68% 95,19% -9,49% 351,0 346,5 Ukraine NAP NAP NAP UK-England and Wales 392.288 131.696 129.072 70.610 41.582 98,01% 117,6 UK-Northern Ireland NA NA NA UK-Scotland 6.130 46.785 NA 763,21%
Table 32 - First instance courts Misdemeanour and/o r minor offences' cases (9)
country
90.2.11. First instance courts Incoming cases
- (9) Misdemeanour and/or minor
offences' cases (2006) [q88]
90.2.11. First instance courts Incoming cases
- (9) Misdemeanour and/or minor
offences' cases (2008)
90.3.11. First instance courts Resolved cases
- (9) Misdemeanour and/or minor
offences' cases (2006) [q88]
90.3.11. First instance courts Resolved cases
- (9) Misdemeanour and/or minor
offences' cases (2008)
90.4.11. First instance courts Pending cases on 31 Dec. 06 -
(9) Misdemeanour and/or minor
offences' cases (2006) [q88]
90.4.11. First instance courts Pending cases on 31 Dec. 08 -
(9) Misdemeanour and/or minor
offences' cases (2008)
Clearance Rate (2006)
Clearance Rate (2008)
Clearance Rate
variation (2006-2008)
Disposition Time (2006)
Disposition Time (2008)
Albania 7.282 7.273 2.013 99,88% 101,0 Andorra 544 4.333 456 4.480 246 563 83,82% 103,39% 19,57% 196,9 45,9 Armenia 1.673 1.520 323 90,85% 77,6 Austria 59.155 35.030 60.888 40.908 20.714 13.976 102,93% 116,78% 13,85% 124,2 124,7 Azerbaijan 13.721 13.158 NA NA Belgium NA NA 256.584 271.945 NA Bosnia and Herzegovina 60.522 158.095 64.720 239.423 387.236 169.320 106,94% 151,44% 44,51% 2183,9 258,1 Bulgaria NA NA NA Croatia 418.997 324.299 441.254 357.246 263.328 227.046 105,31% 110,16% 4,85% 217,8 232,0 Cyprus Czech Republic - NA - NA - NA Denmark 100.285 92.195 98.138 89.553 19.310 29.122 97,86% 97,13% -0,72% 71,8 118,7 Estonia 5.851 13.566 4.587 12.312 1.652 3.599 78,40% 90,76% 12,36% 131,5 106,7 Finland NAP NAP NAP France 450.258 513.400 390.296 461.053 NA NA 86,68% 89,80% 3,12% Georgia 13.198 15.678 3.257 118,79% 75,8 Germany 382.716 389.883 88.102 101,87% 82,5 Greece 413080*** Hungary 180.294 124.572 182.393 125.498 16.636 16.881 101,16% 100,74% -0,42% 33,3 49,1 Iceland Ireland 329.775 NA NA NA

102
Italy 79.449 224.239 59.995 222.865 84.976 102.759 75,51% 99,39% 23,87% 517,0 168,3 Latvia NA 25.689 23.731 25.501 NA 840 99,27% 12,0 Lichtenstein Lithuania 2.038 1.968 450 96,57% 83,5 Luxembourg NA NA 5.444 9.146 NA NA Malta 13.024 15.348 11.072 15.740 11.387 12.371 85,01% 102,55% 17,54% 375,4 286,9 Moldova 5.661 11.322 850 200,00% 27,4 Monaco NA 851 236 891 NA NA 104,70% Montenegro 17.524 22.769 14.973 129,93% 240,0 Netherlands 279.440 279.213 278.790 282.517 45.660 NA 99,77% 101,18% 1,42% 59,8 Norway NA NA NA Poland 1.582.561 465.014 1.556.712 459.393 195.092 76.852 98,37% 98,79% 0,42% 45,7 61,1 Portugal 59.922 28.674 58.836 80.930 61.278 14.041 98,19% 282,24% 184,05% 380,1 63,3 Romania NAP NAP NAP Russian Federation 788.000 776.000 788.000 805.000 110.000 78.000 100,00% 103,74% 3,74% 51,0 35,4 San Marino NAP 49 NAP Serbia 6.535 54.398 7.291 59.988 4.216 51.369 111,57% 110,28% -1,29% 211,1 312,6 Slovakia NA NA NA Slovenia 135.788 78.499 119.782 96.711 99.719 63.722 88,21% 123,20% 34,99% 303,9 240,5 Spain 886.871 920.577 883.992 917.554 208.885 223.767 99,68% 99,67% 0,00% 86,2 89,0 Sweden NAP NAP NAP Switzerland 61.200 61.520 2.678 100,52% 15,9 FYROMacedonia 230.985 126.154 284.586 208.878 186.304 89.510 123,21% 165,57% 42,37% 238,9 156,4 Turkey 966.156 919.901 846.512 1.090.296 440.153 491.606 87,62% 118,52% 30,91% 189,8 164,6 Ukraine NAP NAP NAP UK-England and Wales 662.624 NA 2.031.100 93.985 NA UK-Northern Ireland NA NA NA UK-Scotland 106.674 86.291 NA 80,89%

103
Table 33 - Comments to first instance court cases d ata country
91 Comments to q90 [q88] (including an indication o f the cases that are included in the total figures of civil, commercial and administrative law case and types of criminal law cases - definition of misdemeanour cases, minor offences an d severe criminal cases) (2006) [q89]
91 Comments to q90 (including an indication of the cases that are included in the total figures of civil, commercial and administrative law case and t ypes of criminal law cases - definition of
misdemeanour cases, minor offences and severe crimi nal cases) (2008) Albania Civil cases (=Contract law cases, property law cases,, unjust enrichment law case, tort law cases,
insurance law cases, intellectual property law cases, company law cases, heritage law cases); Administrative cases (= appeals against an administrative act to the court); Minor offences cases(= cases with pecuniary penalties or prison up to max 2 years, all other cases are severe criminal cases).
Andorra Le code pénal andorran fait une distinction fondamentale entre les délits majeurs, les déklits mineurs et contraventions pénales (petites infractions). Nous avons inclu dans le concepte "affaires graves" les délits majeurs auquels le code pénal andorran prévoit une peine allant jusqu'à 25 ans de prison et dans le concept "petites infractions" les délits mineurs auquels le code pénal andorran prévoit jusqu'à 2 ans de prisons et les contraventions pénales (petites infractions.
En matière pénale nous avons inclu dans la case 8 'Affaires pénales infractions graves' les affaires qui sont traitées par le Tribunal de Batlles pour les délits dits mineurs et du Tribunal de Corts pour les délits majeurs.
Armenia Crimes are established in the criminal code of the RA. There isn't any other legal act including crimes except for the criminal code. The classification of crimes is established in the Article 19 of the Criminal Code of the RA, for which degree of penalty is taken as a standard that can be established in the sanction. As for the administrative misconducts, then they are established in the Code of RA on Administrative violations. They differ from the crimes due to the objective and subjective features. Especially with the subject and object and also with the nature of violation especially by the given damage and other consequences.
Austria Line 1: Out from the 110.302 decisions on the merits 41.195 of them had written verdicts. Line 2 includes semi-automated pay-orders: 570.457 incoming and 571.445 decided on the merits. Line 5: Only incoming cases counted, other values in that line set to keep the logic. Line 8: Out from the 26.969 decisions on the merits 21.512 of them had written verdicts. Line 9: Out from the 60.888 decisions on the merits 27.780 of them had written verdicts. A89 - minor offences include cases with pecuniary penalties or prison up to max. 1 year and are dealt by the "District Courts", Severe criminal cases include all other criminal cases, dealt by the "Regional Courts" or Courts of Assize or Juror's Courts both allocated at the "Regional Courts".
Line 1: Out from the 111.245 decisions on the merits 40.402 of them had written verdicts. Line 2 includes semi-automated pay-orders: 516.561 incoming and 522.953 decided on the merits. Line 5: Only incoming cases counted; other values in that line set to keep the vertical consistancy. Line 8: Out from the 24.630 decisions on the merits 20.496 of them had written verdicts. Line 9: Out from the 40.908 decisions on the merits 23.192 of them had written verdicts.
Azerbaijan According to the article 15 of the Criminal Code of the Republic of Azerbaijan criminal offences are divided into: criminal offences which are not of high social danger, less grave criminal offences, grave criminal offences and very grave criminal offences.
According to the article 15 of the Criminal Code of the Republic of Azerbaijan criminal offences are divided into: criminal offences which are not of high social danger, less grave criminal offences, grave criminal offences and very grave criminal offences.
Belgium La catégorie 1 regroupe aussi les affaires jugées par les tribunaux de travail, mais ne concerne pas les affaires civiles de la jeunesse. Cette catégorie ne concerne pas des affaires jugées en deuxième instance par des tribunaux de première instance (intervenant comme juridictions d’appel pour des affaires civiles jugées en première instance par des justices des paix et des tribunaux de police). Ne pouvant pas distinguer les affaires des catégories 1 et 2, elles se trouvent toutes regroupées dans la catégorie 1. Catégories 3, 4 et 6 : données non disponibles. Catégorie 5 : pas d’application. Catégorie 8 : concerne les affaires en 1ère instance jugées par les tribunaux correctionnels (tribunaux de première instance) Catégorie 9 : concerne les affaires jugées par les tribunaux de police. Concernant 2ième instance: - La catégorie 1 regroupe aussi les affaires civiles de la jeunesse traitées par les Cours d’appel et les affaires traitées par les Cours du travail. Cette catégorie concerne aussi des affaires jugées en deuxième instance par des tribunaux de première instance (intervenant comme juridictions d’appel pour des affaires civiles jugées en première instance par des justices des paix et des tribunaux de police). Ne pouvant pas distinguer les affaires des catégories 1 et 2, elles se trouvent toutes regroupées dans la catégorie 1.- La catégorie 9 concerne des affaires jugées en deuxième instance par des tribunaux correctionnels de première instance (intervenant comme juridictions d’appel pour des affaires pénales jugées en première instance par des tribunaux de police)
*chiffre calculé, non issue des statistiques officielles La catégorie 1 regroupe les affaires à juger par les tribunaux de première instance, les tribunaux de commerce (incl. des créances contestées), les tribunaux de travail, les justices de paix et les affaires civiles des tribunaux de police, mais ne concerne pas les affaires civiles de la jeunesse. Cette catégorie ne concerne pas des affaires à juger en deuxième instance par des tribunaux de première instance (intervenant comme juridictions d’appel pour des affaires civiles jugées en première instance par des justices des paix et des tribunaux de police). Ne pouvant pas distinguer les affaires des catégories 1 et 2, elles se trouvent toutes regroupées dans la catégorie 1. Catégories 3, 4 et 6 : données non disponibles. Catégorie 5 : pas d’application. Catégorie 8 : concerne les affaires en 1ère instance jugées par les tribunaux correctionnels (tribunaux de première instance). Ne concerne pas les affaires protectionnels de la jeunesse et les affaires traitées par les Chambres de conseil. Les affaires clôturées sont des affaires ou la procédure pénale a été achevée à l’égard d’au moins 1 prévenu. Catégorie 9 : concerne les affaires jugées par les tribunaux de police (excl. des affaires civiles).
Bosnia and Herzegovina
In Bosnia and Herzegovina there is no separation or classification of criminal cases into categories of severe and not severe. A criminal case is an unlawful act that is prescribed as a criminal offence by law, the characteristics of which are specified by law and for which a criminal sanction is prescribed by law. On the other hand, a minor offence is a violation of the public order or economic and financial regulations as provided in laws. In addition to this, a procedure for determining criminal liability is different from that of determining liability in minor offence cases.
Civil cases encompass all civil disputes, apart from commercial cases, involving: contracts, real estates, domestic (family) relations, accidents, negligence, unpaid debt, small claims etc. Additionally, the first instance courts decide on non-contentious court matters (e.g. inheritance proceedings, non-contentious proceedings for settling relationships between co-owners including dissolution of co-ownership, settlement of boundary lines, voluntary sales, establishing that a person does not have legal competence etc.). Finally, the first instance courts conduct enforcement proceedings. Commercial cases include: disputes related to the rights and obligations arising from legal transactions involving goods, services, securities, ownership or other property rights in real estate, or the rights and obligations arising from securities, in which both parties in the proceedings are either a legal entity or a physical person who, in

104
the capacity of an independent entrepreneur or in another capacity, performs business or other registered activity as his main or additional profession; disputes related to copyrights, related rights and other rights relating to intellectual property; disputes arising from acts alleged to constitute unfair competition or monopolistic agreements; bankruptcy and liquidation proceedings, as prescribed by law, and all disputes arising during and related to bankruptcy and liquidation proceedings.Criminal cases include: first instance jurisdiction over: - adjudicating criminal offences for which the law prescribes as main punishment a fine or sentence of imprisonment up to 10 years, unless the jurisdiction of another court is prescribed by a separate law;- adjudicating criminal offences for which the jurisdiction of the first instance court is prescribed by a separate law;- adjudicating all criminal proceedings against juveniles; conducting proceedings during the investigation and after the bringing of the indictment in accordance with law; adopting decisions on extraordinary legal remedies when provided by law; anddeciding on proceedings upon requests for pardon in accordance with law.A criminal offense is an act which is illicit, which is proclaimed by law as a criminal offense, the characteristics of which are described by law, and for which a criminal sanction is prescribed by law. Some of the punishments that may be pronounced against of perpetrators of criminal offenses are: imprisonment, long term imprisonment, fine, susepended sentences, security measures etc. Minor offences are violations of public order or of regulations on economic and financial operations defined as such by laws or other regulations, whose characteristics are described and for which sanctions are prescribed. Minor offence sanctions are: fines, suspended sentences, reprimands, and protective measures. Comments on the data presented in the above table:Majority of enforcement cases are uncontested claims for unpaid utility bills (i.e. heating, water, state television subscription etc.). There were 1.464.464 of these cases or 98% of total number of unresolved enforcement cases on 31 December 2008.On 31 December 2008 there were 100.819 cases of enforcement of minor offence sanctions (mostly fines) or 60% of the total “misdemeanour and / or minor offences cases” category.
Bulgaria Besides the special rules described under the preceding question the Criminal Procedure Code make no difference of the cases in terms of the degree of social danger of the crime – there are no “severe criminal cases” and “misdemeanour cases”. There are various methods for initiating prosecution on case of publicly actionable criminal offence which are initiated by the prosecutor as State accuser, cases of privately actionable offences which are instituted on the basis of a complaint lodges by the aggrieved party and cases of privately-publicly actionable offences in which criminal proceeding start only in case where there is a complaint lodged by the aggrieved party before the prosecutor and where the proceedings have been already instituted the aggrieved party cannot make a request for the termination thereof. The definition of “severe crime” is made in Art. 93, p. 7 of the Criminal Code – ”Severe crime” is any crime for which the law provides punishment by deprivation of liberty for more than five years, life imprisonment or life imprisonment without substitution.” According to Art. 93, p. 9 of the Criminal Code "minor case" is “that in which the crime perpetrated, in view of the lack of or insignificance of the harmful consequences, or in view of other attenuating circumstances, constitutes a lower degree of social danger, as compared with ordinary crime cases of the respective kind.”
Total number of civil and commercial cases is a sum of the civil cases of all Regional courts and the I-st instance civil and commercial cases of the District courts (from the annual activity report). The data on the administrative cases is taken from the activity report of the Administrative courts in Bulgaria. The same refers to the criminal cases, the criminal cases of the Regional and the I-st instance criminal cases of the District and Military courts.
Croatia As regards enforcement cases: we would like to point out that the reason why the number of cases in which on 31 December 2006 the proceedings were still pending was so much smaller than the number of new cases and the number of cases in which proceedings were pending on 1 January 2006 is the fact that at the end of 2006 the Project for the Reduction of the Backlog of Enforcement Cases was launched. It was also implemented in 2006. Within this Project, various measures were undertaken with a view to reducing the number of unresolved cases and achieving increased efficiency of enforcement proceedings. Accordingly, monthly statistical monitoring of the work of the courts was introduced for this type of case, unified templates were drawn up for procedure by the courts, judges and court clerks underwent training, overtime work by clerks was introduced, a certain number of clerks were employed on a temporary basis, the courts received additional IT equipment, and the Ministry of Justice conducted inspections of the organization of the work on enforcement cases. All these measures resulted in a significant reduction in the number of enforcement cases. As regards the land registry cases: the large number of land registry cases resolved in 2006 was the result of the successful implementation of the Project to Re-organize the Land Registry and Cadastre, as part of which a large number of clerks were employed on a temporary basis, judges and court clerks working on this type of case underwent professional and IT training, land registry data was transcribed into digital form, the organization of the work in land registry departments was improved and continuous supervision of the work of land registry departments was conducted by the Ministry of Justice. As regards the cases from the court register: Ministry of Justice does not collect or record information on cases from the court register of the commercial courts, and question 75.5 remained unanswered for this reason. All the data provided relate to the situation on 31 December 2006. Source: Ministry of justice, Directorate for Human Resources
In the category of civil and commercial litigious cases, there are included the litigious cases at the municipal and commercial courts / commercial disputes / and cases of payment orders initiated by these courts. In the category of civil and commercial non-litigious cases there are included non-litigious cases at the municipal and commercial courts (commercial register are excluded as those are not recorded at the Ministry of Justice) as well as the cases related to inheritance. The administrative cases include the cases of the administrative court as a consequence of administrative suits, cases of request for protection of the constitutionally guaranteed rights and freedoms of men and citizens / quasi administrative proceedings / and cases related to the request of renewal of administrative proceedings. The criminal cases include criminal first-instance cases at the municipal and county courts as well as the cases of court panels at these courts.
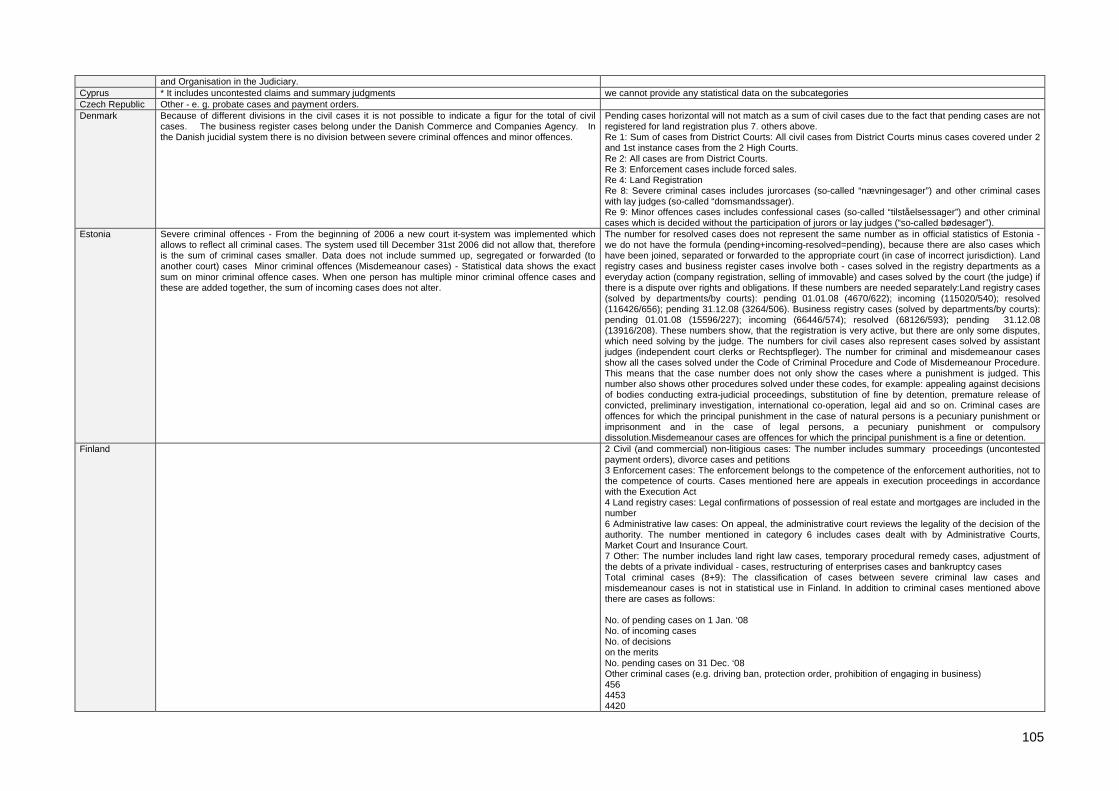
105
and Organisation in the Judiciary. Cyprus * It includes uncontested claims and summary judgments we cannot provide any statistical data on the subcategories Czech Republic Other - e. g. probate cases and payment orders. Denmark Because of different divisions in the civil cases it is not possible to indicate a figur for the total of civil
cases. The business register cases belong under the Danish Commerce and Companies Agency. In the Danish jucidial system there is no division between severe criminal offences and minor offences.
Pending cases horizontal will not match as a sum of civil cases due to the fact that pending cases are not registered for land registration plus 7. others above. Re 1: Sum of cases from District Courts: All civil cases from District Courts minus cases covered under 2 and 1st instance cases from the 2 High Courts. Re 2: All cases are from District Courts. Re 3: Enforcement cases include forced sales. Re 4: Land Registration Re 8: Severe criminal cases includes jurorcases (so-called “nævningesager”) and other criminal cases with lay judges (so-called “domsmandssager). Re 9: Minor offences cases includes confessional cases (so-called “tilståelsessager”) and other criminal cases which is decided without the participation of jurors or lay judges (“so-called bødesager”).
Estonia Severe criminal offences - From the beginning of 2006 a new court it-system was implemented which allows to reflect all criminal cases. The system used till December 31st 2006 did not allow that, therefore is the sum of criminal cases smaller. Data does not include summed up, segregated or forwarded (to another court) cases Minor criminal offences (Misdemeanour cases) - Statistical data shows the exact sum on minor criminal offence cases. When one person has multiple minor criminal offence cases and these are added together, the sum of incoming cases does not alter.
The number for resolved cases does not represent the same number as in official statistics of Estonia - we do not have the formula (pending+incoming-resolved=pending), because there are also cases which have been joined, separated or forwarded to the appropriate court (in case of incorrect jurisdiction). Land registry cases and business register cases involve both - cases solved in the registry departments as a everyday action (company registration, selling of immovable) and cases solved by the court (the judge) if there is a dispute over rights and obligations. If these numbers are needed separately:Land registry cases (solved by departments/by courts): pending 01.01.08 (4670/622); incoming (115020/540); resolved (116426/656); pending 31.12.08 (3264/506). Business registry cases (solved by departments/by courts): pending 01.01.08 (15596/227); incoming (66446/574); resolved (68126/593); pending 31.12.08 (13916/208). These numbers show, that the registration is very active, but there are only some disputes, which need solving by the judge. The numbers for civil cases also represent cases solved by assistant judges (independent court clerks or Rechtspfleger). The number for criminal and misdemeanour cases show all the cases solved under the Code of Criminal Procedure and Code of Misdemeanour Procedure. This means that the case number does not only show the cases where a punishment is judged. This number also shows other procedures solved under these codes, for example: appealing against decisions of bodies conducting extra-judicial proceedings, substitution of fine by detention, premature release of convicted, preliminary investigation, international co-operation, legal aid and so on. Criminal cases are offences for which the principal punishment in the case of natural persons is a pecuniary punishment or imprisonment and in the case of legal persons, a pecuniary punishment or compulsory dissolution.Misdemeanour cases are offences for which the principal punishment is a fine or detention.
Finland 2 Civil (and commercial) non-litigious cases: The number includes summary proceedings (uncontested payment orders), divorce cases and petitions 3 Enforcement cases: The enforcement belongs to the competence of the enforcement authorities, not to the competence of courts. Cases mentioned here are appeals in execution proceedings in accordance with the Execution Act 4 Land registry cases: Legal confirmations of possession of real estate and mortgages are included in the number 6 Administrative law cases: On appeal, the administrative court reviews the legality of the decision of the authority. The number mentioned in category 6 includes cases dealt with by Administrative Courts, Market Court and Insurance Court. 7 Other: The number includes land right law cases, temporary procedural remedy cases, adjustment of the debts of a private individual - cases, restructuring of enterprises cases and bankruptcy cases Total criminal cases (8+9): The classification of cases between severe criminal law cases and misdemeanour cases is not in statistical use in Finland. In addition to criminal cases mentioned above there are cases as follows: No. of pending cases on 1 Jan. ‘08 No. of incoming cases No. of decisions on the merits No. pending cases on 31 Dec. ‘08 Other criminal cases (e.g. driving ban, protection order, prohibition of engaging in business) 456 4453 4420

106
489 Coercive means cases 2063 8355 6761 3657 Conversion imprisonment for non-payment of fines cases - 15413 15413 -
France Infractions graves = crimes et délits (cours d’assises, tribunaux correctionnels, tribunaux et juges pour enfants) – source : Cadres des parquets, tableaux de bord des tribunaux pour enfants - SDSEDInfractions légères = contraventions des quatre premières classes et cinquième classe tribunaux de police et juridictions de proximité - (hors amendes forfaitaires) source : Cadres des parquets, - SDSED En matière pénale : affaires nouvelles = orientation du parquet, Décisions au fond = jugements portant condamnations ou relaxes et acquittements Stock affaires pénales : tribunaux correctionnels uniquement Colonne 3 contient le nombre total d'affaires terminées et pas seulement le nombre de décisions au fond
Infractions graves = crimes et délits (cours d’assises, tribunaux correctionnels, tribunaux et juges pour enfants) Infractions légères = contraventions des quatre premières classes et cinquième classe (tribunaux de police et juridictions de proximité - hors amendes forfaitaires) En matière pénale : affaires nouvelles = orientation du parquet (source : Cadres des parquets), Décisions au fond = jugements portant condamnation ou relaxe et acquittement (source : Cadres des parquets, tableaux de bord des tribunaux pour enfants)
Georgia According to Article 12 of Georgian Criminal Code according to maximum terms of imprisonment provided by article or paragraph of article of this Code a crime may belong to each of the following three categories: a. Minor crime, b. Serious crime, c. Grave crime. Minor crime is a deliberate or unintentional crime for which the maximum punishment provided by this Code is 5 years of imprisonment. Serious crime is a deliberate crime for which maximum punishment provided by this code is 10 years of imprisonment, or unintentional crime for which the maximum punishment provided by this Code is 5 years of imprisonment. Grave crime is a deliberate crime for which maximum punishment provided by this code is 10 years of imprisonment or life imprisonment.
Civil and commercial Cases include disputes among natural and/or legal persons over contractual obligations, torts, matrimonial and heritage cases, real estate and labour disputes etc. Administrative cases include disputes about legality of administrative acts issued by administrative bodies including customs and tax disputes. In other category we included administrative violations i.e. cases which are not that severe offences that may cause criminal prosecution. For example, parking of a car in a wrong place, turning to the street with car where it was not allowed by traffic marks etc.
Germany “Severe criminal offences” (# 8) mean cases on the basis of the Criminal Code and other criminal by-laws. "Minor offences" (# 9) are understood to be cases prosecuted by the administrative authorites as breaches of administrative rules (misdemeanours) (Ordnungswidrigkeiten)..
Greece * PROVISIONAL DATA –SOURCE : NATIONAL STATISTICAL SERVICE OF GREECE (NSSG)** DATA REFER TO CASES OF ADMINISTRATIVE NATURE AND DERIVE FROM THE FIRST INSTANCE COURTS (ADMINISTRATIVE SOURCE) AND NOT FROM THE ADMINISTRATIVE COURTS, AS THERE IS NO SUCH SPECIAL SURVEY BEING CONDUCTED SO FAR BY THE NSSG. (SOURCE: NATIONAL STATISTICAL SERVICE OF GREECE)*** SOURCE OF THE DATA IS THE HELLENIC POLICE
Hungary The severe criminal cases are defined by the Act IV of 1978 on the Criminal Code, the misdemeanour cases are defined by the Act LXIX of 1999 on the offences and other laws. Criminal offences are defined in Section 11 of the Act IV of 1978 on the Criminal Code. Section 11 provides that severe criminal offence is an act of crime perpetrated intentionally and punishable by imprisonment of two or more years. Every other act of crime enumerated in the Criminal Code is a minor criminal offence. Criminal offences are punishable by imprisonment, community service work or fines, as well as by some ancillary punishments. Misdemeanour offences are dealt with in administrative law procedure, therefore misdemeanour offences are not regarded as acts of crime. The misdemeanour cases are defined by the Act LXIX of 1999 on the offences and other laws. Sanctions for the perpetrators of such offences are of administrative nature.
Act 4 of 1978 on the Criminal Code regulates criminal offences and Act 69 of 1999 on Offences regulates misdemeanours.
Iceland There is no official definition of severe and minor criminal offences in icelandic criminal law. (In 1980 and 1990 and before that time it was presumed that severe criminal offences where covered by the general penal code no. 19 from 1940 but it is not absolute to day.)
Ireland The 2,667 'severe' cases are made up of Murder, Rape and Sexual Assault cases in the Central Criminal Court, and all criminal cases heard in the Dublin and Provincial Circuit Criminal Courts in 2006. The figure of 329,775 represents summary cases disposed of in the District Court in 2006.
Italy About criminal cases: Crimes and contraventions are detected at an aggregate level then it is not possible to distinguish For the point number 1 Civil (and commercial) litigious cases decisions: 2004's data regarding only cases decided by judgment. 2006's data are: decided by judgment 1.239.700, other wise decided 1.763.061: total 3.002.761. For the point number 8 + 9: the total data regards cases charged by the public prosecutor before the courts and cases sent to the courts to acquittal.
Latvia Criminal cases are cases heard according to criminal law procedure, Misdemeanour cases are cases heard in the first instance in district (city) courts according to administrative code procedure.
Criminal cases are cases heard according to Criminal Procedure Law. Misdemeanor cases are cases heard in the first instance in district (city) courts according to Administrative Code procedure.

107
New comment added (@ 14.05.10): Latvia has no other cases than administrative, civil and criminal. If the case involves issues on Land registry, Enforcement cases or commercial register, depending on the nature of case they are categorized as administrative, civil or criminal. Apart from the court Latvia has separate registers: Land registry, Registry of Companies, Registry of enforcement cases. There are claims that can be adjudicated by the Registry officials (for example in Land registry they are also titled as judges) without involvement of the court.
Lichtenstein Lithuania According to the Criminal Code of the Republic of Lithuania the criminal act is divided into crime and
misdemeanour. Therefore the cases 8 category also includes cases with the comission of crime, whereas the cases of 9th category involve only cases with comission of the misdemeanour.
Other - cases that have been heard in district and regional administrative courts. According to the Criminal Code of the Republic of Lithuania the criminal act is divided into crime and misdemeanour. Therefore the cases 8 category also includes cases with the comission of crime, whereas the cases of 9th category involve only cases with comission of the misdemeanour.
Luxembourg Une infraction pénale dite "petite" est soit une contravention, soit un délit décorrectionnalisé juge devant le juge de police. Toutes les autres infractions figurent sous la catégorie des infractions dites "graves".
Nouvellesaffaires pénales = chiffre des nouveaux dossiers, toutes matièresconfondues, entrées au parquet.Affaires pénales terminées = affaires ayant donné lieu à une décisiond'un juge du fond, à l'exclusion de celles ayant donné lieu à une autredécision du parquet (enquête complémentaire, classement, etc.)Affaires pénales pendantes: il n'y a pas d'affaires pendantes au niveaudes juridictions pénales, où les affaires sont fixées à datedéterminée, au niveau des parquets il existe un certain stock au senscommercial du terme.Nouvelles affaires civiles : affaires nouvellement enrôlées pendantl'année sous examenAffaires civiles terminées : Affaires ayant donné lieu à un jugement
Malta Please note that there are other cases that are categorzed under headings such as: Withdrawn, Deserted and Sie Die. this applies for bothe 1st and 2nd instance courts
This information was obtained from statistics published by the Courts on an annual basis. Item 1 includes statistics referring to the First Hall of the Civil Courts, Family Court, Magistrates Court in its Civil jurisdiction and the Small Claims Tribunal. Item 4 includes statistics referred to the Land Arbitration Board, the Rent regulation Board and Agricultural Leases Board. The Administrative Tribunal was set up in 2009. It is to be noted that there could be a discrepancy between the pending cases of the beginning of the year and the end of the year, once the number of incoming cases and resolved cases are catered for, and this is due to the fact that a number of cases would be adjourned 'Sine Die', as a result of which, they would be no longer continue to be considered as pending, however they are neither considered to be resolved.
Moldova Selon l'article 16 du Code pénal, les insfractions sont classifiées comme suit: infractions légères - les faits pénaux punis d'une peine privative de liberté allant jusqu'à 2 ans infractions moins graves - les faits pénaux punis d'une peine privative de liberté allant jusqu'à 5 ans infractions graves - les faits pénaux punis d'une peine privative de liberté allant jusqu'à 15 ans infractions extrêmement graves - les faits pénaux intentionnels punis d'une peine privative de liberté excédant 15 ans infractions exceptionnellement graves - les faits pénaux intentionnels punis avec réclusion à perpetuité.
Selon l'article 16 du Code pénal, les insfractions sont classifiées comme suit: infractions légères - les faits pénaux punis d'une peine privative de liberté allant jusqu'à 2 ans; infractions moins graves - les faits pénaux punis d'une peine privative de liberté allant jusqu'à 5 ans; infractions graves - les faits pénaux punis d'une peine privative de liberté allant jusqu'à 15 ans; infractions extrêmement graves - les faits pénaux intentionnels punis d'une peine privative de liberté excédant 15 ans; infractions exceptionnellement graves - les faits pénaux intentionnels punis avec réclusion à perpetuité.
Monaco Pour le point du tableau -affaires relatives au registre du commerce: Loi n°721 du 27.12.1961 : deman de d’inscription présentée au Ministre d’Etat. Les contestations relèvent de la compétence du Président du TPI. Appel devant la Cour d’appel. Pour le nombre total d'affaires pénales: 554 affaires pénalement jugées + 36 sur intérêts civils. Les affaires relatives au registre financier ne sont pas traitées par les tribunaux.Les affaires administratives sont traitées par le Tribunal de première instance amis ne sont pas pour les statistiques individualisées par rapport aux affaires civiles ou commerciales. Il faudrait consulter chaque dossier. En l’absence de manipulation individuelle, ces affaires ne peuvent être décomptées. Pour les affires administratives (6), elles ne sont pas individualisées.
Le nombre total d’affaires pénales comprend les crimes, délits et certaines contraventions pour lesquelles le Parquet Général a été saisi. Il ne comprend pas la majorité des contraventions qui sont traitées par la Direction de la Sûreté Publique, l’officier du Ministère public puis le cas échéant par le tribunal de simple police.
Montenegro Category 1: -out of 16352, 1174 cases are litigious proceedings in Commercial courts - out of 15739, 1439 cases are litigious proceedings in Commercial courts - out of 17707 solved cases, 1698 are litigious proceedings in Commercial courts - out of 12666 cases, 915 are litigious proceedings in Commercial courts Category 3: In 2006., before the courts of general jurisdiction, there were 43840 enforcement cases in progress. Out of that number, the number of pending cases on 01/01/06 was 27212, of new cases was 16628. Until 31/12/2006, 19399 cases were solved (44,25%). Before the Commercial courts, there were 5851 enforcement cases in progress. Out of that number, the number of pending cases on 01/01/06 was 441, of new cases 5410. Until 31/12/06, 5276 cases were solved (90%). Category 8: - out of 8426 cases, 552 are first-instance procceedings before Higher courts - out of 7367 cases, 386 are first-instance procceedings before Higher courts - out of 7176 cases, 321 are first-instance procceedings before Higher courts - out of 8554 cases, 617 are first-instance procceedings before Higher courts Note: In 2008., the adoption of New law on legal offences/misdeminors is planned, which will reform this area in grand measure. GENERAL INFORMATION Annual income of cases in montenegrian courts ( in all types of cases) was 216335. Monthly income was 18029. Number of solved cases in 2006. was 217919, which shows that in 2006. number of solved cases was larger than number of incoming cases. General number of cases in progress in 2006. was 361103, which number shows that, in average, each judge in
a) Civil cases are the cases in disputes concerning proprietary, marital, family, personal-legal, copyright and other relations. b) in disputes due to a correction or reply to a piece of information contained in public information media and about requests regarding violation of personal rights done in public information media. c) in labour legal cases (from a labour relation; on conclusion and implementation of collective bargaining agreements, as well as all disputes between an employer and the trade union, on implementation of regulations about strike; on appointment and dismissal of bodies in companies and other entities). Commercial legal cases are the cases formed due to disputes between domestic companies, foreign companies, other legal entities and entrepreneurs concerning their commercial-legal relations, as well as in disputes in which the parties are not economic entities, but they are in the relation of material joinder of parties with economic entities; in disputes concerning copyrights and industrial property rights between domestic companies, foreign companies, other legal entities and entrepreneurs; in disputes concerning the rights of artists, rights of reproduction, re-recording and trading with audio-visual works, as well as in disputes concerning computer programs and their use and transfer between domestic companies, foreign companies, other legal entities and entrepreneurs; with regard to disturbance of possession between the

108
Montenegro, in 2006., was in charge for 1563 cases. Based on analysis of all relevant data, average quota that judges fulfiled in all the courts was 151%.
above mentioned parties; with reference to distortion of competition, abuse of monopolistic and dominating position in the market and conclusion of monopolistic agreements; in disputes regarding vessels and sailing at sea and in internal waters, as well as in disputes in which maritime law applies, except for disputes concerning transportation of passengers; in disputes which refer to aircrafts and in disputes to which air law applies, except for disputes concerning transportation of passengers; in other legal matters put under the jurisdiction of the commercial court by the law. Administrative legal cases are the cases formed due to claims which contest lawfulness of an individual administrative act or other individual act in other legal matters, when different court protection is not provided for. Data on 'cadastral cases' are provided only in part – the number of cases of this type concluded during 2008 is stated. This is due to the fact that such cases are registered as per the indicted body, and the indicted body here is a second-instance body – the Ministry of Finance, and therefore it is not possible to determine from the register the number of received cases and the number of cases being processed, that refer to 'cadastral cases'. In these cases the first-instance administration body is the Real-Estate Administration. The number of completed cases has been determined in accordance with the records of completed cases, these records being maintained with the Administrative Court of Montenegro per fields due to the needs of the website. Misdemeanours are not under jurisdiction of ordinary courts of justice and are not registered as criminal cases. The total number of criminal cases that were processed by courts of first instance and high courts is stated. **Clarification of the category 9 – Misdemeanours in Montenegro Misdemeanour proceedings are conducted at first-instance level by local misdemeanour bodies, ministries and other administration bodies and local administration bodies. Misdemeanour proceedings at second-instance level are conducted by the Misdemeanour Council of the Republic of Montenegro. Bodies of local administration conduct misdemeanour proceedings for demeanours defined by a decision of the assembly of a local self-administration unit, as well as for demeanours defined by the law or a decree directly implemented by a local self-government unit. Bodies that conduct misdemeanour proceedings independently decide thereon on the basis of the Constitution, law and other regulations. The category 9 contains the number of cases that local misdemeanour bodies were processing, assorted in 2 categories: requests to institute misdemeanour proceedings (2471/5255/6554/1172) and requests of other bodies for execution of a sanction, safeguard measures and correctional measures ruled in misdemeanour proceedings, as well as costs of misdemeanour proceedings, and requests for execution made by other bodies that conduct misdemeanour proceedings (17747/12269/16215/13801). Figures in this column stand for the sum of these two categories of cases.
Netherlands 2. non-litigious is not complete. Only cases from the 'kantongerechten' Cases from the Council of State (about 700) are excluded.1. these are cases where there was a judgement in a defended action.6.Administrative = administrative cases in general, cases on taxes and immigration. 8.Severe criminal cases = criminal cases court, hearing in chamber and elaboration of sentence included (raadskamer en uitwerken vonnis)9.Minor cases = district cases (kantonzaken), i.e. misdemeanors and traffic offences in Dutch 'Mulderzaken'. Pending cases on 31-12-2008 cannot be provided due to registration difficulties.
Norway The numbers presented for "Total criminal cases" includes only cases conducted in court of co-adjudication. The number of pending cases, incoming cases and decisions in confession cases cannot be separated from remand hearings.
The numbers presented for “1 Civil (and commercial) litigious cases” include civil disputes, debt restructure arrangements and judicial assessments. The numbers presented for “2 Civil (and commercial) non-litigious cases” include bankruptcy proceedings and probate cases. The numbers presented for “3 Enforcement cases” includes compulsory sales, possession orders, provisional security etc. The numbers presented for 'Total criminal cases' includes only composite court cases, that is all criminal cases without an unconditional guilty plea, as well as the most serious guilty plea cases. The court is then composed of a district court judge and two lay judges – one woman and one man. Each judge has one vote and all decisions are reached through voting – the majority vote decides.
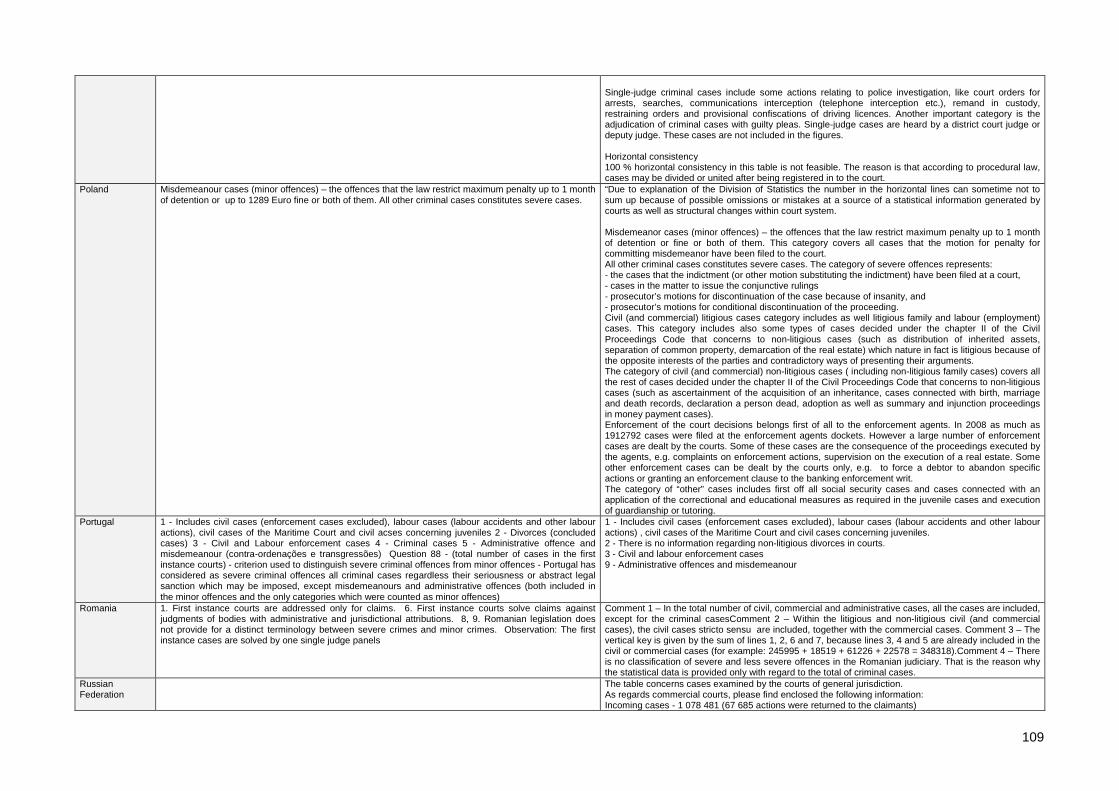
109
Single-judge criminal cases include some actions relating to police investigation, like court orders for arrests, searches, communications interception (telephone interception etc.), remand in custody, restraining orders and provisional confiscations of driving licences. Another important category is the adjudication of criminal cases with guilty pleas. Single-judge cases are heard by a district court judge or deputy judge. These cases are not included in the figures. Horizontal consistency 100 % horizontal consistency in this table is not feasible. The reason is that according to procedural law, cases may be divided or united after being registered in to the court.
Poland Misdemeanour cases (minor offences) – the offences that the law restrict maximum penalty up to 1 month of detention or up to 1289 Euro fine or both of them. All other criminal cases constitutes severe cases.
“Due to explanation of the Division of Statistics the number in the horizontal lines can sometime not to sum up because of possible omissions or mistakes at a source of a statistical information generated by courts as well as structural changes within court system. Misdemeanor cases (minor offences) – the offences that the law restrict maximum penalty up to 1 month of detention or fine or both of them. This category covers all cases that the motion for penalty for committing misdemeanor have been filed to the court. All other criminal cases constitutes severe cases. The category of severe offences represents: - the cases that the indictment (or other motion substituting the indictment) have been filed at a court, - cases in the matter to issue the conjunctive rulings - prosecutor’s motions for discontinuation of the case because of insanity, and - prosecutor’s motions for conditional discontinuation of the proceeding. Civil (and commercial) litigious cases category includes as well litigious family and labour (employment) cases. This category includes also some types of cases decided under the chapter II of the Civil Proceedings Code that concerns to non-litigious cases (such as distribution of inherited assets, separation of common property, demarcation of the real estate) which nature in fact is litigious because of the opposite interests of the parties and contradictory ways of presenting their arguments. The category of civil (and commercial) non-litigious cases ( including non-litigious family cases) covers all the rest of cases decided under the chapter II of the Civil Proceedings Code that concerns to non-litigious cases (such as ascertainment of the acquisition of an inheritance, cases connected with birth, marriage and death records, declaration a person dead, adoption as well as summary and injunction proceedings in money payment cases). Enforcement of the court decisions belongs first of all to the enforcement agents. In 2008 as much as 1912792 cases were filed at the enforcement agents dockets. However a large number of enforcement cases are dealt by the courts. Some of these cases are the consequence of the proceedings executed by the agents, e.g. complaints on enforcement actions, supervision on the execution of a real estate. Some other enforcement cases can be dealt by the courts only, e.g. to force a debtor to abandon specific actions or granting an enforcement clause to the banking enforcement writ. The category of “other” cases includes first off all social security cases and cases connected with an application of the correctional and educational measures as required in the juvenile cases and execution of guardianship or tutoring.
Portugal 1 - Includes civil cases (enforcement cases excluded), labour cases (labour accidents and other labour actions), civil cases of the Maritime Court and civil acses concerning juveniles 2 - Divorces (concluded cases) 3 - Civil and Labour enforcement cases 4 - Criminal cases 5 - Administrative offence and misdemeanour (contra-ordenações e transgressões) Question 88 - (total number of cases in the first instance courts) - criterion used to distinguish severe criminal offences from minor offences - Portugal has considered as severe criminal offences all criminal cases regardless their seriousness or abstract legal sanction which may be imposed, except misdemeanours and administrative offences (both included in the minor offences and the only categories which were counted as minor offences)
1 - Includes civil cases (enforcement cases excluded), labour cases (labour accidents and other labour actions) , civil cases of the Maritime Court and civil cases concerning juveniles. 2 - There is no information regarding non-litigious divorces in courts. 3 - Civil and labour enforcement cases 9 - Administrative offences and misdemeanour
Romania 1. First instance courts are addressed only for claims. 6. First instance courts solve claims against judgments of bodies with administrative and jurisdictional attributions. 8, 9. Romanian legislation does not provide for a distinct terminology between severe crimes and minor crimes. Observation: The first instance cases are solved by one single judge panels
Comment 1 – In the total number of civil, commercial and administrative cases, all the cases are included, except for the criminal casesComment 2 – Within the litigious and non-litigious civil (and commercial cases), the civil cases stricto sensu are included, together with the commercial cases. Comment 3 – The vertical key is given by the sum of lines 1, 2, 6 and 7, because lines 3, 4 and 5 are already included in the civil or commercial cases (for example: 245995 + 18519 + 61226 + 22578 = 348318).Comment 4 – There is no classification of severe and less severe offences in the Romanian judiciary. That is the reason why the statistical data is provided only with regard to the total of criminal cases.
Russian Federation
The table concerns cases examined by the courts of general jurisdiction. As regards commercial courts, please find enclosed the following information: Incoming cases - 1 078 481 (67 685 actions were returned to the claimants)

110
Resolved cases - 970 152. San Marino En ce qui concerne le secteur civil - administrative:
- les causes commerciaux et les terrains sont inclus dans l'Article 1, car il n'existe pas de documents spécifiques et des détails sur ces matériaux. - L'article 'altro' se réfère à d'autres procédures et de procédures ouvertes, respectivement, et par conséquent, être le premier de Janvier, ces commencé en 2008, à ceux conclus en 2008, et ouverte à ceux qui vont au 31/12. En ce qui concerne les affaires pénales: - Il n'existe aucune donnée de faire la distinction entre les crimes graves et les infractions moins graves, la procédure pénale permet au juge d'instruction de définir un procès pénal, s'il est établi que la constatation de fait entraîne l'application de la peine de lui seul l'amende, par décret pénal acte unilatéral de la Cour appliquant précisément la peine sans donner lieu à des processus d'audience publique. La personne peut être accusée de ce décret, auquel cas vous placez le processus d'audience publique. ne peut donc pas a priori de distinguer les deux catégories, qui se distinguent lors de la définition de la procédure (colonne 3 affaires termineés); - Les chiffres sont donnés hors dossiers ouverts contre des personnes inconnues et a conclu contre inconnu, où les enquêtes n'ont pas réussi à identifier l'auteur de l'infraction reprochée, il est en tout cas les hypothèses de crimes contre les biens et insignifiante de la nature. En 2008, il y avait 565 cas enregistrés pénale contre le nombre inconnu ont été stockés n 677 procédures pénales contre des personnes inconnues, étaient en instance n 227 procédures pénales contre des personnes inconnues sur Janvier 1 et n 115 procédures pénales contre des personnes inconnues sur Décembre 31. Lorsque l'enquête a permis d'identifier l'auteur du crime présumé, l'affaire a été compté au point indiqué sur la table.
Serbia The data relate to the High Commercial Court, Municipal and District Courts. Slovakia For the criminal cases there are not available data for distinguish the number of the cases in line 8 and 9 Slovenia Misdemeanour cases are within jurisdiction of the local courts since 1.1.2005. A major reform of the
misdemeanour penal law was made, so that it merged with the "regular" judiciary: thats why the steep increase of the number of judges (q. 49) and also the number of incoming cases. In regard with the statistics of misdemeanour cases it should be kept in mind, that within the reform of this field of law the abolition took place, so we have to be careful in intrepreting the statistical data for the year 2006, especially when comaparing with previous years. As to the administrative cases, it should be cautione, that the numbers of cases in the second instance represent cases, that are actually delt with by the Supreme Court, which is also the court of appeal in this kind of cases (but also the court of the last resort, that's why some cases appear also in the table 91. In our opinion, also the total number of cases that are delt with by the courts should be given: pending cases on 1.1.2006: 612926, incoming cases: 801607, decisions/resolved cases: 807321, pending cases on 31.12.2006: 607212.
Total of civil, commercial and administrative law cases (litigious and non litigious) – Due to fluctuation in data of civil and commercial non-litigious cases (in particular inheritance cases) and in data of enforcement cases there is no horizontal consistency of figures. 2 Civil (and commercial) non-litigious cases: Due to fluctuation in data of inheritance cases, which are included among these cases, there is no horizontal consistency of figures. 3 Enforcement cases: Due to fluctuation in data of many enforcement cases, which are considered among these cases, there is no horizontal consistency of figures. Civil and commercial litigious cases in the first instance courts include all civil litigious cases dealt with by the local and district courts and all commercial litigious cases dealt with by the district courts. All the data is taken from the Court Statistics of the Ministry of Justice. The horizontal inconsistency of figures in the mentioned three categories is already present in the Court statistics of the Ministry of Justice. In particular, the horizontal inconsistency derives from the data on Civil (and commercial) non-litigious cases and Enforcement cases. In some types of cases the sum of incoming and pending cases on 1 Jan. 2008 was higher than the sum of resolved and pending cases on 31 Dec. 2008, namely in the cases with codes VL (difference of 908 cases), D (1 case) and R-i (1 case). In other types of cases the sum of incoming and pending cases on 1 Jan. 2008 was lower than the sum of resolved and pending cases on 31 Dec. 2008, namely in cases with codes I-vl (difference of –32 cases), I-ns (-11 cases), Ig-vl (-4 cases), Ig-ns (-2 cases), In (-59 cases) and Nt (-2 cases). All the data are official data as published by the Slovenian Ministry of Justice on its website, in particular on its web page http://www.mp.gov.si/fileadmin/mp.gov.si/pageuploads/2005/PDF/publikacije/BILTEN_SS_2008-12_junij_09.pdf. The sum of all differences in horizontal sums of data on these cases thus amounts to 800 cases. This means that there were altogether 800 more cases incoming and pending on 1 Jan. 2008 than there were resolved and pending cases on 31 Dec 2008. Civil and commercial non-litigious cases in the first instance include all non-litigious civil cases dealt with by the local and district courts, non-litigious commercial cases dealt with by the district courts, cases pursuant to the Inheritance Act dealt with by the local courts, insolvency cases including bankruptcy, liquidation and compulsory composition cases pursuant to the Financial Operations, Insolvency

111
Proceedings and Compulsory Dissolution Act dealt with by the district courts. Enforcement cases in the first instance include all enforcement and commercial enforcement cases pursuant to the Execution of Judgments in Civil Matters and Insurance of Claims Act, which are dealt with by the local courts. Administrative law cases in the first instance include administrative disputes pursuant to the Administrative Disputes Act, which are dealt with by the Administrative Court, with the exception of other administrative law cases and free legal aid cases. Other civil law cases in the first instance include other civil and commercial law cases in the first instance courts. Criminal law cases concerning severe criminal offences include all such criminal cases as defined by the Criminal Code. Misdemeanour cases and minor offences cases include all minor offences cases as defined by the Minor Offences Act.
Spain Explanation: Article 13 of the Spanish Criminal Code establishes a three-fold clasification of criminal offences: serious crimes, less serious crimes and misdemeanours. Such clasification is to a great extent of a formal character in the sense it depends on the different types of penalties envisaged. • Serious crimes are those punished with serious penalties (namely imprisonment and disqualifications of more than 5 years) • Less serious crimes are those punished with less serious penalties (namely imprisonment of 3 months to 5 years, most criminal fines and, with some exceptions, disqualifications under 5 years). Both categories of criminal cases represent the vast majority of offences in the Spanish Criminal Code. • Misdemeanours are punished with minor penalties (for example small fines or driving disqualifications up to one year) which do not include imprisonment. This fundamental difference between crimes and misdemeanours, that also has procedural consequences, is important to interpret the tables. Misdemeanours have been included in category 9 (misdemeanour cases) whereas all crimes have been included in category 8 (Criminal cases). Category 8 therefore covers the vast majority of offences under the Spanish Criminal Code, punished with penalties that may include imprisonment from 3 months to 20 years or more. Finally, Spain also knows administrative sanctions (ie. police fines for speeding or parking tickets) that are not criminal cases and are treated outside the criminal law system.
Civil cases include those of Courts of First Instance and First Instance and Enquiry (without measures and preliminary issues), family cases from Violence against Women Courts, Labour Courts and Labour Chamber of the Audiencia Nacional, Verbal cases from Juvenile Courts, and Comercial Courts (Banckrupcy, including all cases from art 86 ter 1, y ter 2 and preliminary issues, social files, and community trade marks).Non-litigious cases include, in addition to non-litigious divorces, cases of voluntary jurisdiction and internments. Enforcement of judgments include, civil cases from Courts of First Instance and First Instance and Enquiry, from Commercial, administrative and labour courts, civil cases from Juvenile courts, civil cases from High Superior Courts and from the Labour Chamber of the National Court. Administrative cases include cases in Administrative Courts and Central Administrative Courts.Misdemeanours include cases in Magistrates’s courts, Courts of First Instance and Enquiry and Violence against Women´s Courts.The explanation regarding criminal cases is more complex:As pending cases the following have been taken into account : criminal full jury and simplified proceedings in Magistrates’s courts, Courts of First Instance and Enquiry and Violence against Women´s Courts. Criminal full and simplified proceedings in Criminal Courts and Central Enquiry Courts.As incoming cases the following have been taken into account: simplified proceedings and those solved by means of an agreement (in urgent proceedings) in Magistrates’s courts, Courts of First Instance and Enquiry and Violence against Women´s Courts. Criminal full and simplified proceedings in Central Enquiry Courts.As resolved cases:For Magistrates’s courts, Courts of First Instance and Enquiry and Violence against Women´s Courts, solved criminal proceedings except those appealed, solved Jury trials not appealed, cases solved by agreement, solved simplified proceedings minus appealed, minus incoming proceedings minus jury proceedings. For Central Enquiry Courts solved full criminal proceedings minus appealed.For Central Criminal Courts, solved simplified proceedings.For the criminal chamber of the National Court, solved full and simplified criminal proceedings.Regarding types of criminal cases the Spanish Criminal Code establishes a 3-fold clasification of criminal offences: serious crimes, less serious crimes and misdemeanours. Such clasification is to a great extent of a formal character as it depends on the different types of penalties envisaged:- Serious crimes are those punished with serious penalties (namely imprisonment and disqualifications of more that 5 years)- Less serious crimes are those punished with less serious penalties (namely imprisonment until 5 years and most criminal fines)-Misdemeanours are punished with minor penalties (for example small fines)Serious and less serious crimes therefore represent the vast majority of offences in the Spanish Criminal Code, which only dedicates around 20 articles to misdemeanours.Finally, Spain also knows administrative sanctions (ie.police fines for speeding or parking tickets) that are not criminal cases and are treated outside the criminal law system.
Sweden The category 'Civil and commercial litigious cases' include small claims cases, ordinary civil cases and 'family cases'. The category 'Civil and commercial non-litigious cases' include only non-litigious divorce cases. Included in the category 'Other' are environmental cases and land cases. Please note that administrative law cases are only accounted for in category 6, and are thus not included in category 1. Those cases are handled separately by the county administrative courts while the other

112
cases are handled by the district courts. Switzerland La classification proposée dans le tableau ci-dessus ne correspond pas à la classification en usage dans
la plupart des tribunaux cantonaux et de la Confédération. C'est pourquoi seuls les grands types de procédure ont pu être indiqués. Deux très petits cantons n'ont pas fourni de chiffres (UR et OW) ce qui n'a qu'une influence minime sur l'ordre de grandeur au niveau national. Il convient également de relever que toute la procédure de recouvrement forcé des créances pécuniaires ne passe pas par les tribunaux mais par des offices spécialisés (Offices des poursuites et des faillites) selon les dispositions de la loi fédérale sur la poursuite pour dettes et la faillite. Seules quelques décisions majeures de cette procédure d'exécution forcée incombent aux tribunaux (mainlevée d'opposition, prononcé de faillite, etc.). Il convient d'en tenir compte pour la comparaison avec les autres pays européens.
Les chiffres ci-dessus résultent de la consolidation des données cantonales. Les chiffres du canton de Berne, qui avec Zürich traite le plus grand nombre d'affaires, n'ont pas été livrés. Les chiffres concernant le canton de Zürich n'ont été livrés que partiellement. Des demandes sont en cours pour obtenir les chiffres manquants d'ici la réunion du 5 mai 2010 des correspondants nationaux. Pour le reste, les lignes sont cohérentes (col. 1 + col.2 - col.3 = col.4). En revanche, le total vertical des lignes 1 à 7 et 8 à 9 ne correspond pas aux chiffres indiqués dans les lignes 'Nombre total car certains cantons n'ont fourni que le nombre total sans aucun détail. C'est pourquoi le total est en règle générale plus élevé que la somme des chiffres qu'il est censé additionner.
FYROMacedonia Regarding the point 1. Civil (and commercial) litigious cases, we have also available separate data for civil and commercial cases. Namely in 2006 situation in Macedonian courts regarding civil cases is as following: Pending cases on 1 January 2006-27002 cases, Incoming cases - 36802, Decisions - 37384, Pending cases on 31 December 2006 - 26420. Commercial cases: Pending cases on 1 January 2006-6011 cases, Incoming cases - 9014, Decisions - 8074, Pending cases on 31 December 2006 - 6951. In mentioned point 1 of table above are presented total nmber of presented civil + commercial cases. In point 7 of the Table "Other" also are included bankruptcy cases and other civil cases. In point 8 "Criminal cases" there are presented data for adult + juveniles criminal cases Regarding the point 3 - "Enforcement cases" we would like to clarify that there are presented enforcement cases before courts. Namely in 2006 enforcement agents started to work according to new Law on execution. Therefore in reference year we have mixed system of enforcement of civil verdicts (courts and enforcement agents). In this table we do not present administrative disputes because that time Supreme court had the competence for sloving these kind of cases. In 2007 new Administrative court was established and all administrative disputes were transfered to this new court.
Regarding the point 1. Civil (and commercial) litigious cases, we have also available separate data for civil and commercial cases. Namely in 2008 situation in Macedonian basic courts regarding civil cases is as following: Pending cases on 1 January 2008-32781cases, Incoming cases - 35614, Decisions - 43983, Pending cases on 31 December 2008 - 24412. Commercial cases: Pending cases on 1 January 2008-8811 cases, Incoming cases - 11743, Decisions - 11130, Pending cases on 31 December 2008 - 9431. In mentioned point 1 of table above are presented total number of presented civil + commercial cases. In point 7 of the Table 'Other' also are included bankruptcy cases, labour disputes and other civil cases. In point 8 'Criminal cases' there are presented data for adult + juveniles criminal cases Regarding the point 3 - 'Enforcement cases' we would like to clarify that in the Republic of Macedonia there are enforcement agents. Therefore we did not fill that point. Regarding the data in point 6 there are presented administrative disputes before Adiministrative Court. According to the explanation, that cases are not included in total number at the beginig of the table. Regarding the point 5 'Business register cases', there are in the competence on the Central Registar.
Turkey Business registry cases are especially carried out by the commercial courts. So, special statistic is not available. Special statistic for non-litigious civil and commercial cases is not available. The mentioned information includes both litigious and non-litigious civil and commercial cases. The total number of administrative cases includes the number of cases handled by the Administrative Courts and Tax Courts. The cases handled by the Peace Criminal Courts, Enforcement Criminal Courts and Traffic Courts are included under “misdemeanour cases (minor offences). The other case categories are included under “severe criminal cases”. Please note that, The Act of Misdemeanours (Law number: 5326) was adopted in 30 March 2005 and pursuant to Article 2 of this Act “misdemeanour” means, injustice which is punished by an administrative sanction. The number of such misdemeanours is not available and the number of misdemeanours (minor offences) mentioned in the 88th question does not include the misdemeanours sentenced by administrative sanctions.
The total of civil, commercial and administrative law cases includes all civil, commercial and administrative cases. Criminal cases (severe criminal offences) include cases addressed by High Criminal Courts, High Criminal Courts assigned by Article 250 of the Criminal Procedure Code and Juvenile Assize Courts. Misdemeanor and/or simple offences cases include cases performed by Criminal Courts of First Instance, Criminal Courts of Peace, Criminal Courts of Enforcement, Juvenile Courts, Traffic Courts and Courts for Intellectual and Industrial Property Rights.
Ukraine UK-England and Wales
Crown Court cases are classified in three categories: Class 1 - the most serious crimes such as murder and treason Class 2 - serious cases such as rape Class 3 - all other offences such as burglary, grievous bodily harm and robbery. Summary cases are those which are dealt with in Magistrate Courts. These are offences which will attract a maimum six month sentence or a maximum £5,000 fine. Either-way cases are slightly more serious and can be dealt with in the Magistrate Courts or the defendant can elect for trial by jury. Indictable offences are committed to the Crown or High Court. 95% of offences begin and conclude in the Magistrate Courts.
Contested claims (Civil (and commercial) litigious cases) - note civil court cases can be finalised without court knowledge so no pending New (@14.5.10): "The 298,796 given for incoming Civil (and commercial) litigious cases is actually the number of incoming defences. The pending figure of 60 000 on 31 Dec 2008 is a very rough estimate based on 20% of the incoming defences." Enforcement = Excludes Magistrates (criminal) enforcement - data by fine amount not case based & Criminal Statistics 2008 figures not published until February 2009. Figures for family courts are placed in OTHER - note that o/s figures are not published and internal figures are for certain types of work only so not supplied Criminal cases (severe criminal offences) = Figures for Severe are taken from Crown Court data Misdemeanour and/or minor offences cases = Figures for Misdemeanour are taken from Magistrates court data.
UK-Northern Ireland
UK-Scotland Severe criminal count is those cases raised on indictment in solemn proceedings – e.g. murder, rape, serious fraud, serious assault and serious drug offences. The remainder under section 9 are less serious assaults, theft, drug offences, road traffic, minor breaches of the peace and other lesser statutory contraventions.

113

114
Table 34 - Second instance (appeal) courts Total of civil, commercial and administrative law cases (1- 7) data
country
92.2.1. Second instance
(appeal) courts Incoming cases - Total of civil, commercial & administrative law cases (1-7)
(2006) [q90]
92.2.1. Second instance
(appeal) courts Incoming cases - Total of civil, commercial & administrative law cases (1-7)
(2008)
92.3.1. Second instance
(appeal) courts Resolved cases - Total of civil, commercial & administrative law cases (1-7)
(2006) [q90]
92.3.1. Second instance
(appeal) courts Resolved cases - Total of civil, commercial & administrative law cases (1-7)
(2008)
92.4.1. Second instance
(appeal) courts Pending cases on 31 Dec. 06 - Total of civil, commercial & administrative law cases (1-7)
(2006) [q90]
92.4.1. Second instance
(appeal) courts Pending cases on 31 Dec. 08 - Total of civil, commercial & administrative law cases (1-7)
(2008)
Clearance Rate (2006)
Clearance Rate (2008)
Clearance Rate
variation (2006-2008)
Disposition Time (2006)
Disposition Time (2008)
Albania 4.997 4.148 4.205 83,01% 370,0 Andorra 372 491 267 544 199 71,77% 110,79% 39,02% 133,5 Armenia 5.474 2.913 3.549 3.140 1.678 630 64,83% 107,79% 42,96% 172,6 73,2 Austria 35.391 34.251 35.410 33.777 6.234 6.791 100,05% 98,62% -1,44% 64,3 73,4 Azerbaijan 9.211 NAP 8.918 NAP 1.301 NAP 96,82% 53,2 Belgium NA NA NA NA NA NA Bosnia and Herzegovina 30.988 40.723 33.578 37.246 26.977 29.233 108,36% 91,46% -16,90% 293,2 286,5 Bulgaria 23.397 24.922 10.854 106,52% 159,0 Croatia 83.177 81.089 70.083 78.372 56.569 59.595 84,26% 96,65% 12,39% 294,6 277,6 Cyprus 222 145 524 65,32% 1319,0 Czech Republic 70.963 72.788 69.977 73.488 17.177 17.086 98,61% 100,96% 2,35% 89,6 84,9 Denmark 6.973 5.998 7.186 5.679 4.230 2.159 103,05% 94,68% -8,37% 214,9 138,8 Estonia 3.171 3.869 3.075 3.559 930 1.384 96,97% 91,99% -4,98% 110,4 141,9 Finland 3.666 3.918 3.976 3.890 2.387 1.917 108,46% 99,29% -9,17% 219,1 179,9 France 228.976 246.118 249.504 244.647 246.209 248.112 108,97% 99,40% -9,56% 360,2 370,2 Georgia 6.719 6.456 5.306 8.540 3.626 1.677 78,97% 132,28% 53,31% 249,4 71,7 Germany 57.270 180.113 52.011 314,50% 105,4 Greece 34900* 29800* 41.196 85,39% 504,6 Hungary 39.989 46.620 39.375 45.332 10.403 11.482 98,46% 97,24% -1,23% 96,4 92,4 Iceland NAP NAP NAP Ireland Italy 155.567 159.187 112.519 138.707 391.524 448.906 72,33% 87,13% 14,81% 1270,1 1181,3 Latvia 6.483 6.861 6.506 6.435 3.868 5.016 100,35% 93,79% -6,56% 217,0 284,5 Lichtenstein Lithuania 12.661 16.752 7.128 13.374 3.456 7.709 56,30% 79,84% 23,54% 177,0 210,4 Luxembourg 1.206 1.328 1.154 1.438 NA NA 95,69% 108,28% 12,59% Malta 706 578 NA 697 1.149 965 120,59% 505,3 Moldova 7.675 9.686 15.350 9.941 984 1.515 200,00% 102,63% -97,37% 23,4 55,6 Monaco 119 142 90 116 202 NA 75,63% 81,69% 6,06% 819,2 Montenegro 6.354 7.384 5.254 116,21% 259,7 Netherlands 32.930 26.494 32.820 25.419 NA 99,67% 95,94% -3,72% Norway 3.160 3.222 3.323 3.288 1.415 1.161 105,16% 102,05% -3,11% 155,4 128,9 Poland 234.399 158.843 249.007 161.052 42.161 23.449 106,23% 101,39% -4,84% 61,8 53,1 Portugal 18.756 17.751 18.766 17.869 8.004 5.950 100,05% 100,66% 0,61% 155,7 121,5 Romania 35.799 32.390 41.804 32.006 15.322 14.243 116,77% 98,81% -17,96% 133,8 162,4 Russian Federation 651.404 872.000 614.015 845.000 26.986 45.000 94,26% 96,90% 2,64% 16,0 19,4 San Marino 91 201 237 220,88% 430,4 Serbia 81.353 84.742 39.711 104,17% 171,0 Slovakia 28.412 31.534 26.576 32.451 11.240 9.521 93,54% 102,91% 9,37% 154,4 107,1 Slovenia 27.151 21.502 28.227 23.322 11.340 5.809 103,96% 108,46% 4,50% 146,6 90,9 Spain 194.721 193.520 197.746 191.064 129.573 119.391 101,55% 98,73% -2,82% 239,2 228,1 Sweden 37.870 23.632 24.128 16.224 6.484 102,10% 98,1 Switzerland 32.778 43.665 30.701 44.352 14.449 25.729 93,66% 101,57% 7,91% 171,8 211,7 FYROMacedonia 22.444 23.332 22.590 21.252 2.724 5.393 100,65% 91,09% -9,57% 44,0 92,6 Turkey

115
Ukraine 248.848 95.023 38,19% UK-England and Wales 3.294 3.094 NA 93,93% UK-Northern Ireland NA NA NA UK-Scotland 215 130 NA 60,47%
Table 35 - Second instance (appeal) courts Civil an d commercial litigious cases (1) data
country
92.2.2. Second instance
(appeal) courts Incoming cases
- (1) Civil and commercial
litigious cases (2006) [q90]
92.2.2. Second instance
(appeal) courts Incoming cases
- (1) Civil and commercial
litigious cases (2008)
92.3.2. Second instance
(appeal) courts Resolved cases
- (1) Civil and commercial
litigious cases (2006) [q90]
92.3.2. Second instance
(appeal) courts Resolved cases
- (1) Civil and commercial
litigious cases (2008)
92.4.2. Second instance
(appeal) courts Pending cases on 31 Dec. 06 -
(1) Civil and commercial
litigious cases (2006) [q90]
92.4.2. Second instance
(appeal) courts Pending cases on 31 Dec. 08 -
(1) Civil and commercial
litigious cases (2008)
Clearance Rate (2006)
Clearance Rate (2008)
Clearance Rate
variation (2006-2008)
Disposition Time (2006)
Disposition Time (2008)
Albania 3.383 2.988 3.278 88,32% 400,4 Andorra NA NA NA Armenia 2.913 3.140 630 107,79% 73,2 Austria NA NA NA Azerbaijan 9.210 7.018 1.432 76,20% 74,5 Belgium 32.822 29.758 NA NA NA NA Bosnia and Herzegovina 21.271 32.309 22.703 28.971 18.921 23.004 106,73% 89,67% -17,06% 304,2 289,8 Bulgaria NA NA NA Croatia 80.430 81.098 67.410 78.372 55.381 59.595 83,81% 96,64% 12,83% 299,9 277,6 Cyprus 433 342 719 78,98% 767,4 Czech Republic - - - Denmark NA 5.998 NA 5.679 NA 2.159 94,68% 138,8 Estonia NA 1.803 NA 1.588 NA 788 88,08% 181,1 Finland 2.749 2.790 3.047 2.802 2.143 1.626 110,84% 100,43% -10,41% 256,7 211,8 France 207.893 218.316 223.614 217.412 219.056 219.554 107,56% 99,59% -7,98% 357,6 368,6 Georgia 3.122 3.124 2.809 3.760 1.350 748 89,97% 120,36% 30,38% 175,4 72,6 Germany 89.719 129.551 29.671 144,40% 83,6 Greece Hungary 23.690 28.390 23.246 27.952 7.493 7.728 98,13% 98,46% 0,33% 117,7 100,9 Iceland NAP NAP NAP Ireland Italy 149.341 151.699 107.027 132.036 388.115 444.481 71,67% 87,04% 15,37% 1323,6 1228,7 Latvia 4.815 4.556 4.955 4.133 2.576 3.369 102,91% 90,72% -12,19% 189,8 297,5 Lichtenstein Lithuania 7.071 8.548 3.087 7.559 1.572 2.267 43,66% 88,43% 44,77% 185,9 109,5 Luxembourg NA 1.019 NA 1.091 NA 1.231 107,07% 411,8 Malta 542 670 918 123,62% 500,1 Moldova 292 6.616 584 6.916 31 1.253 200,00% 104,53% -95,47% 19,4 66,1 Monaco 119 142 90 116 202 226 75,63% 81,69% 6,06% 819,2 711,1 Montenegro 5.980 4.835 5.695 80,85% 429,9 Netherlands 22.770 NA 23.360 NA 16.580 NA 102,59% 259,1 Norway Poland 206.401 98.609 219.659 98.981 37.698 10.707 106,42% 100,38% -6,05% 62,6 39,5 Portugal Romania 24.093 31.612 28.421 31.153 11.529 13.897 117,96% 98,55% -19,42% 148,1 162,8 Russian Federation 443.041 275.000 416.731 249.000 16.414 17.000 94,06% 90,55% -3,52% 14,4 24,9 San Marino 66 161 237 243,94% 537,3 Serbia 78.329 70.010 24.087 89,38% 125,6 Slovakia 23.865 22.127 9.955 92,72% 164,2 Slovenia 19.677 12.036 20.759 14.017 8.544 3.731 105,50% 116,46% 10,96% 150,2 97,2 Spain 150.888 143.715 148.958 148.729 78.947 74.805 98,72% 103,49% 4,77% 193,4 183,6
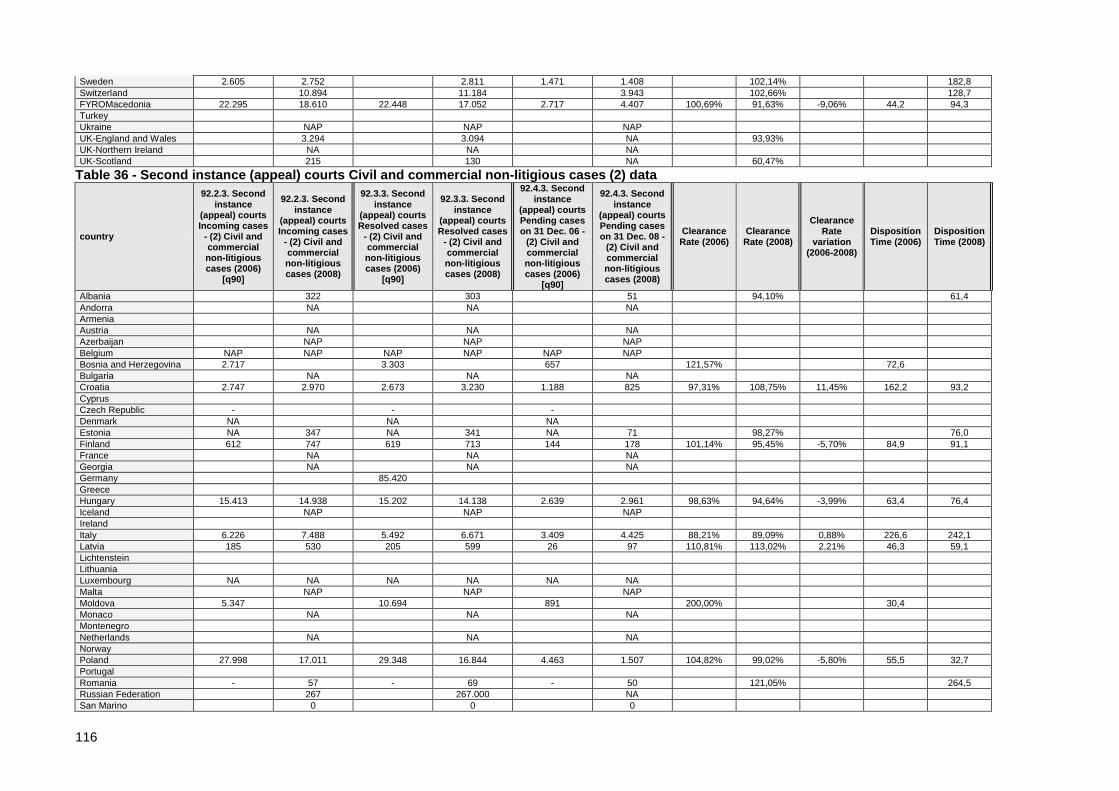
116
Sweden 2.605 2.752 2.811 1.471 1.408 102,14% 182,8 Switzerland 10.894 11.184 3.943 102,66% 128,7 FYROMacedonia 22.295 18.610 22.448 17.052 2.717 4.407 100,69% 91,63% -9,06% 44,2 94,3 Turkey Ukraine NAP NAP NAP UK-England and Wales 3.294 3.094 NA 93,93% UK-Northern Ireland NA NA NA UK-Scotland 215 130 NA 60,47%
Table 36 - Second instance (appeal) courts Civil an d commercial non-litigious cases (2) data
country
92.2.3. Second instance
(appeal) courts Incoming cases
- (2) Civil and commercial non-litigious cases (2006)
[q90]
92.2.3. Second instance
(appeal) courts Incoming cases
- (2) Civil and commercial non-litigious cases (2008)
92.3.3. Second instance
(appeal) courts Resolved cases
- (2) Civil and commercial non-litigious cases (2006)
[q90]
92.3.3. Second instance
(appeal) courts Resolved cases
- (2) Civil and commercial non-litigious cases (2008)
92.4.3. Second instance
(appeal) courts Pending cases on 31 Dec. 06 -
(2) Civil and commercial non-litigious cases (2006)
[q90]
92.4.3. Second instance
(appeal) courts Pending cases on 31 Dec. 08 -
(2) Civil and commercial non-litigious cases (2008)
Clearance Rate (2006)
Clearance Rate (2008)
Clearance Rate
variation (2006-2008)
Disposition Time (2006)
Disposition Time (2008)
Albania 322 303 51 94,10% 61,4 Andorra NA NA NA Armenia Austria NA NA NA Azerbaijan NAP NAP NAP Belgium NAP NAP NAP NAP NAP NAP Bosnia and Herzegovina 2.717 3.303 657 121,57% 72,6 Bulgaria NA NA NA Croatia 2.747 2.970 2.673 3.230 1.188 825 97,31% 108,75% 11,45% 162,2 93,2 Cyprus Czech Republic - - - Denmark NA NA NA Estonia NA 347 NA 341 NA 71 98,27% 76,0 Finland 612 747 619 713 144 178 101,14% 95,45% -5,70% 84,9 91,1 France NA NA NA Georgia NA NA NA Germany 85.420 Greece Hungary 15.413 14.938 15.202 14.138 2.639 2.961 98,63% 94,64% -3,99% 63,4 76,4 Iceland NAP NAP NAP Ireland Italy 6.226 7.488 5.492 6.671 3.409 4.425 88,21% 89,09% 0,88% 226,6 242,1 Latvia 185 530 205 599 26 97 110,81% 113,02% 2,21% 46,3 59,1 Lichtenstein Lithuania Luxembourg NA NA NA NA NA NA Malta NAP NAP NAP Moldova 5.347 10.694 891 200,00% 30,4 Monaco NA NA NA Montenegro Netherlands NA NA NA Norway Poland 27.998 17.011 29.348 16.844 4.463 1.507 104,82% 99,02% -5,80% 55,5 32,7 Portugal Romania - 57 - 69 - 50 121,05% 264,5 Russian Federation 267 267.000 NA San Marino 0 0 0

117
Serbia Slovakia 4.483 4.374 1.253 97,57% 104,6 Slovenia NA NA NA Spain Sweden NAP NAP NAP Switzerland 646 659 79 102,01% 43,8 FYROMacedonia Turkey Ukraine NAP NAP NAP UK-England and Wales NAP NAP NAP UK-Northern Ireland NA NA NA UK-Scotland NAP NAP NAP
Table 37 - Second instance (appeal) courts Administ rative law cases (6) data
country
92.2.7. Second instance
(appeal) courts Incoming cases
- (6) Administrative
law cases (2006) [q90]
92.2.7. Second instance
(appeal) courts Incoming cases
- (6) Administrative
law cases (2008)
92.3.7. Second instance
(appeal) courts Resolved cases
- (6) Administrative
law cases (2006) [q90]
92.3.7. Second instance
(appeal) courts Resolved cases
- (6) Administrative
law cases (2008)
92.4.7. Second instance
(appeal) courts Pending cases on 31 Dec. 06 -
(6) Administrative
law cases (2006) [q90]
92.4.7. Second instance
(appeal) courts Pending cases on 31 Dec. 08 -
(6) Administrative
law cases (2008)
Clearance Rate (2006)
Clearance Rate (2008)
Clearance Rate
variation (2006-2008)
Disposition Time (2006)
Disposition Time (2008)
Albania 1.292 857 876 66,33% 373,1 Andorra 157 160 59 101,91% 134,6 Armenia Austria NAP NAP NAP Azerbaijan NA NA NA Belgium NA NA NA NA NA NA Bosnia and Herzegovina 7.000 8.414 7.572 8.275 7.399 6.229 108,17% 98,35% -9,82% 356,7 274,8 Bulgaria NA NA NA Croatia NA NA NA Cyprus 152 197 94 133 471 489 61,84% 67,51% 5,67% 1828,9 1342,0 Czech Republic - - - Denmark NA NA NA Estonia 959 1.161 1.076 1.102 308 401 112,20% 94,92% -17,28% 104,5 132,8 Finland France 21.083 27.802 25.890 27.235 27.153 28.825 122,80% 97,96% -24,84% 382,8 386,3 Georgia 3.597 2.612 2.497 4.335 2.276 570 69,42% 165,96% 96,55% 332,7 48,0 Germany 57.270 56.651 52.011 98,92% 335,1 Greece 50* Hungary 886 1.935 927 1.986 325 407 104,63% 102,64% -1,99% 128,0 74,8 Iceland NAP NAP NAP Ireland Italy NA NAP NA NAP NA NAP Latvia 1.283 1.551 1.158 1.443 1.240 1.530 90,26% 93,04% 2,78% 390,8 387,0 Lichtenstein Lithuania 5.590 2.824 4.401 3.035 1.884 1.620 78,73% 107,47% 28,74% 156,3 194,8 Luxembourg 367 309 311 347 NA NA 84,74% 112,30% 27,56% Malta NA NA NA Moldova 2.036 3.070 4.072 3.025 62 262 200,00% 98,53% -101,47% 5,6 31,6 Monaco été individua lisées Montenegro Netherlands 10.160 11.890 9.460 10.510 NA 93,11% 88,39% -4,72% Norway Poland 16.157 NA 14.675 NA 8.330 NA 90,83% 207,2

118
Portugal NA NA NA Romania - NAP - NAP - NAP Russian Federation 208.363 330.000 197.264 329.000 10.572 15.000 94,67% 99,70% 5,02% 19,6 16,6 San Marino 25 40 0 160,00% Serbia Slovakia 64 37 75 56 32 16 117,19% 151,35% 34,16% 155,7 104,3 Slovenia 1.830 610 1.807 810 2.745 325 98,74% 132,79% 34,04% 554,5 146,5 Spain 27.055 42.514 23.777 34.926 22.416 34.859 87,88% 82,15% -5,73% 344,1 364,3 Sweden 24.087 26.158 26.791 13.184 12.068 102,42% 164,4 Switzerland 27.400 27.776 20.645 101,37% 271,3 FYROMacedonia Turkey 69.578 67.294 15.464 96,72% 83,9 Ukraine 32.672 117.312 24.839 27.773 3.266 73.700 76,03% 23,67% -52,35% 48,0 968,6 UK-England and Wales 12.316 9.208 NAP 74,76% UK-Northern Ireland NA NA NA UK-Scotland NA NA NA
Table 38 - Second instance (appeal) courts Total cr iminal cases (8+9) data
country
92.2.9. Second instance
(appeal) courts Incoming cases - Total criminal
cases (8+9) (2006) [q90]
92.2.9. Second instance
(appeal) courts Incoming cases - Total criminal
cases (8+9) (2008)
92.3.9. Second instance
(appeal) courts Resolved cases - Total criminal
cases (8+9) (2006) [q90]
92.3.9. Second instance
(appeal) courts Resolved cases - Total criminal
cases (8+9) (2008)
92.4.9. Second instance
(appeal) courts Pending cases on 31 Dec. 06 - Total criminal cases (8+9) (2006) [q90]
92.4.9. Second instance
(appeal) courts Pending cases on 31 Dec. 08 - Total criminal cases (8+9)
(2008)
Clearance Rate (2006)
Clearance Rate (2008)
Clearance Rate
variation (2006-2008)
Disposition Time (2006)
Disposition Time (2008)
Albania 2.809 2.057 1.900 73,23% 337,1 Andorra 75 56 30 74,67% 195,5 Armenia 653 1.573 663 1.316 47 274 101,53% 83,66% -17,87% 25,9 76,0 Austria 9.399 11.628 9.509 11.173 1.013 1.477 101,17% 96,09% -5,08% 38,9 48,3 Azerbaijan 2.242 2.241 2.199 2.158 195 175 98,08% 96,30% -1,79% 32,4 29,6 Belgium NA 16.716 NA 16.134 NA 11765* 96,52% 266,2 Bosnia and Herzegovina 44.533 13.774 43.178 14.844 4.661 2.255 96,96% 107,77% 10,81% 39,4 55,4 Bulgaria 7.922 8.038 1.778 101,46% 80,7 Croatia 77.353 62.002 31.917 80.895 89.053 81.889 41,26% 130,47% 89,21% 1018,4 369,5 Cyprus 288 258 226 89,58% 319,7 Czech Republic 13.545 15.263 13.584 13.392 1.574 1.444 100,29% 87,74% -12,55% 42,3 39,4 Denmark 3.046 6.860 NA 6.788 1.384 999 98,95% 53,7 Estonia 1.947 2.311 1.862 2.251 134 142 95,63% 97,40% 1,77% 26,3 23,0 Finland 8.188 11.539 8.437 11.688 4.505 3.574 103,04% 101,29% -1,75% 194,9 111,6 France Georgia 3.932 3.309 3.581 3.342 750 318 91,07% 101,00% 9,92% 76,4 34,7 Germany 69.860 70.378 21.139 100,74% 109,6 Greece Hungary 34.443 34.915 33.993 35.080 6.494 6.098 98,69% 100,47% 1,78% 69,7 63,4 Iceland NAP NAP NAP Ireland Italy 85.340 88.751 71.144 76.622 153.180 168.944 83,37% 86,33% 2,97% 785,9 804,8 Latvia 2.498 2.595 2.684 2.445 775 1.119 107,45% 94,22% -13,23% 105,4 167,0 Lichtenstein Lithuania 5.699 6.845 3.332 6.731 715 874 58,47% 98,33% 39,87% 78,3 47,4 Luxembourg NA NA 647 577 NA NA Malta 14.263 418 14.104 454 9.606 273 98,89% 108,61% 9,73% 248,6 219,5 Moldova 2.553 2.117 2.586 2.144 272 243 101,29% 101,28% -0,02% 38,4 41,4 Monaco NA NA 55 NA NA NA Montenegro 4.658 4.402 1.753 94,50% 145,4

119
Netherlands 37.910 36.367 NA 95,93% Norway 1.389 6.826 1.448 6.682 519 761 104,25% 97,89% -6,36% 130,8 41,6 Poland 361.845 119.263 361.025 120.491 32.892 18.572 99,77% 101,03% 1,26% 33,3 56,3 Portugal 10.986 13.297 10.992 12.957 6.004 3.634 100,05% 97,44% -2,61% 199,4 102,4 Romania 26.340 16.024 26.216 15.888 4.399 4.363 99,53% 99,15% -0,38% 61,2 100,2 Russian Federation 333.372 355.000 304.942 329.000 12.052 13.000 91,47% 92,68% 1,20% 14,4 14,4 San Marino 26 29 12 111,54% 151,0 Serbia Slovakia 4.744 3.697 4.938 3.689 1.248 878 104,09% 99,78% -4,31% 92,2 86,9 Slovenia 10.888 10.951 10.930 10.261 2.092 2.375 100,39% 93,70% -6,69% 69,9 84,5 Spain 144.530 142.348 27.289 98,49% 70,0 Sweden 8.767 9.030 9.276 3.603 3.341 102,72% 131,5 Switzerland 13.964 10.563 12.448 10.691 3.783 3.399 89,14% 101,21% 12,07% 110,9 116,0 FYROMacedonia 15.427 12.122 15.567 11.725 197 783 100,91% 96,72% -4,18% 4,6 24,4 Turkey Ukraine 46.427 46.463 NA 100,08% UK-England and Wales 21.259 19.782 NA 93,05% UK-Northern Ireland NA NA NA UK-Scotland 2.347 2.254 NA 96,04%
Table 39 - Second instance (appeal) courts Criminal cases (severe criminal offences) (8) data
country
92.2.10. Second instance
(appeal) courts Incoming cases
- (8) Severe criminal
offences (2006) [q90]
92.2.10. Second instance
(appeal) courts Incoming cases
- (8) Severe criminal
offences (2008)
92.3.10. Second instance
(appeal) courts Resolved cases
- (8) Severe criminal
offences (2006) [q90]
92.3.10. Second instance
(appeal) courts Resolved cases
- (8) Severe criminal
offences (2008)
92.4.10. Second instance
(appeal) courts Pending cases on 31 Dec. 06 -
(8) Severe criminal
offences (2006) [q90]
92.4.10. Second instance
(appeal) courts Pending cases on 31 Dec. 08 -
(8)Severe criminal
offences (2008)
Clearance Rate (2006)
Clearance Rate (2008)
Clearance Rate
variation (2006-2008)
Disposition Time (2006)
Disposition Time (2008)
Albania 1.854 1.268 1.524 68,39% 438,7 Andorra 51 49 45 37 14 19 88,24% 75,51% -12,73% 113,6 187,4 Armenia Austria 6.726 8.943 6.728 8.404 539 1.065 100,03% 93,97% -6,06% 29,2 46,3 Azerbaijan 640 700 NA NA Belgium NA 7.466 NA 7.507 NA 8.664 100,55% 421,3 Bosnia and Herzegovina 44.533 8.154 43.178 8.133 4.661 1.236 96,96% 99,74% 2,79% 39,4 55,5 Bulgaria NA NA NA Croatia 13.197 9.394 12.214 9.459 4.617 1.794 92,55% 100,69% 8,14% 138,0 69,2 Cyprus Czech Republic - - - Denmark 110 6.860 NA 6.788 58 999 98,95% 53,7 Estonia 1.778 2.143 1.708 2.087 127 135 96,06% 97,39% 1,32% 27,1 23,6 Finland NAP NAP NAP France 50.222 53.298 37.517 52.718 NA 31.418 74,70% 98,91% 24,21% 217,5 Georgia 2.402 2.437 274 101,46% 41,0 Germany 61.792 62.235 20.189 100,72% 118,4 Greece Hungary 33.926 34.361 33.469 34.522 6.477 6.079 98,65% 100,47% 1,82% 70,6 64,3 Iceland NAP NAP NAP Ireland Italy NA NA NA NA NA NA Latvia 1.907 2.115 2.156 1.990 524 660 113,06% 94,09% -18,97% 88,7 121,1 Lichtenstein Lithuania

120
Luxembourg NA NA 49 NA NA NA Malta 33 26 20 21 37 22 60,61% 80,77% 20,16% 675,3 382,4 Moldova Monaco NA 2 17 2 NA 1 100,00% 182,5 Montenegro 3.385 3.084 1.363 91,11% 161,3 Netherlands NA 24.740 NA 13.510 NA 199,3 Norway Poland 104.373 111.121 103.139 112.413 13.121 17.730 98,82% 101,16% 2,34% 46,4 57,6 Portugal 10.986 13.297 10.992 12.957 6.004 3.634 100,05% 97,44% -2,61% 199,4 102,4 Romania - NAP - NAP - NAP Russian Federation NA NA NA San Marino 26 29 12 111,54% 151,0 Serbia Slovakia 4.680 Slovenia 4.975 4.794 4.995 4.916 1.544 1.100 100,40% 102,54% 2,14% 112,8 81,7 Spain 126.614 124.930 20.674 98,67% 60,4 Sweden NAP NAP NAP Switzerland 4.742 4.858 1.481 102,45% 111,3 FYROMacedonia 4.914 4.663 5.035 4.546 144 339 102,46% 97,49% -4,97% 10,4 27,2 Turkey Ukraine NAP NAP NAP UK-England and Wales 109.524 7.240 5.774 52.542 NA 79,75% UK-Northern Ireland NA NA NA UK-Scotland 786 1.397 NA 177,74%
Table 40 - Second instance (appeal) courts Misdemea nour and/or minor offences' cases (9) data
country
92.2.11. Second instance
(appeal) courts Incoming cases
- (9) Misdemeanour and/or minor
offences' cases (2006) [q90]
92.2.11. Second instance
(appeal) courts Incoming cases
- (9) Misdemeanour and/or minor
offences' cases (2008)
92.3.11. Second instance
(appeal) courts Resolved cases
- (9) Misdemeanour and/or minor
offences' cases (2006) [q90]
92.3.11. Second instance
(appeal) courts Resolved cases
- (9) Misdemeanour and/or minor
offences' cases (2008)
92.4.11. Second instance
(appeal) courts Pending cases on 31 Dec. 06 -
(9) Misdemeanour and/or minor
offences' cases (2006) [q90]
92.4.11. Second instance
(appeal) courts Pending cases on 31 Dec. 08 -
(9) Misdemeanour and/or minor
offences' cases (2008)
Clearance Rate (2006)
Clearance Rate (2008)
Clearance Rate
variation (2006-2008)
Disposition Time (2006)
Disposition Time (2008)
Albania 955 789 376 82,62% 173,9 Andorra 119 26 110 19 64 11 92,44% 73,08% -19,36% 212,4 211,3 Armenia Austria 2.673 2.685 2.781 2.769 474 412 104,04% 103,13% -0,91% 62,2 54,3 Azerbaijan 1.754 1.894 NA NA Belgium 9.197 9.248 8.577 8.625 NA 3101* 93,26% 93,26% 0,00% 131,2 Bosnia and Herzegovina 0 5.620 0 6.711 0 1.019 119,41% 55,4 Bulgaria NA NA NA Croatia 64.156 52.608 76.917 71.436 84.436 80.095 119,89% 135,79% 15,90% 400,7 409,2 Cyprus Czech Republic - - - Denmark 2.936 NA 1.326 Estonia 169 168 154 164 7 7 91,12% 97,62% 6,49% 16,6 15,6 Finland NAP NAP NAP France NA NA NA Georgia 907 905 43 99,78% 17,3 Germany 8.068 8.143 950 100,93% 42,6 Greece Hungary 517 554 524 558 17 19 101,35% 100,72% -0,63% 11,8 12,4 Iceland NAP NAP NAP Ireland
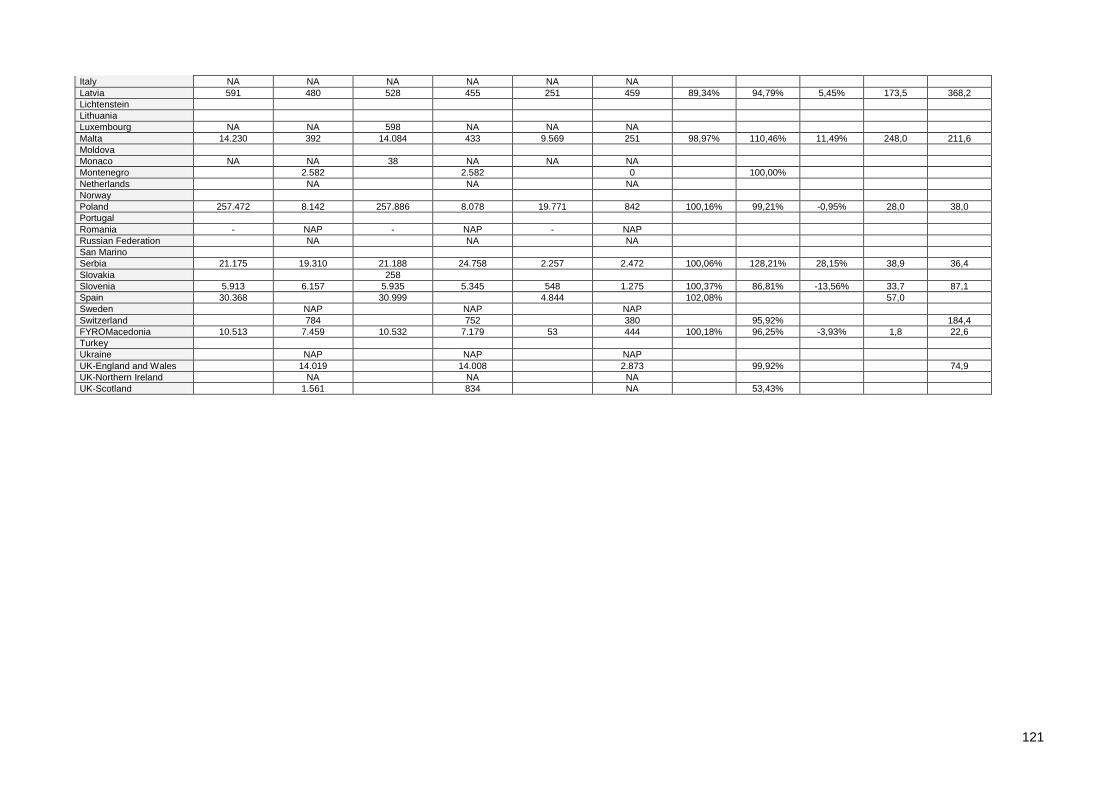
121
Italy NA NA NA NA NA NA Latvia 591 480 528 455 251 459 89,34% 94,79% 5,45% 173,5 368,2 Lichtenstein Lithuania Luxembourg NA NA 598 NA NA NA Malta 14.230 392 14.084 433 9.569 251 98,97% 110,46% 11,49% 248,0 211,6 Moldova Monaco NA NA 38 NA NA NA Montenegro 2.582 2.582 0 100,00% Netherlands NA NA NA Norway Poland 257.472 8.142 257.886 8.078 19.771 842 100,16% 99,21% -0,95% 28,0 38,0 Portugal Romania - NAP - NAP - NAP Russian Federation NA NA NA San Marino Serbia 21.175 19.310 21.188 24.758 2.257 2.472 100,06% 128,21% 28,15% 38,9 36,4 Slovakia 258 Slovenia 5.913 6.157 5.935 5.345 548 1.275 100,37% 86,81% -13,56% 33,7 87,1 Spain 30.368 30.999 4.844 102,08% 57,0 Sweden NAP NAP NAP Switzerland 784 752 380 95,92% 184,4 FYROMacedonia 10.513 7.459 10.532 7.179 53 444 100,18% 96,25% -3,93% 1,8 22,6 Turkey Ukraine NAP NAP NAP UK-England and Wales 14.019 14.008 2.873 99,92% 74,9 UK-Northern Ireland NA NA NA UK-Scotland 1.561 834 NA 53,43%

122
Table 41 - Comments to second instance court cases data Country
92 Comments (including an indication of the cases t hat are included in the total figures of civil, com mercial and administrative law case and types of cr iminal law cases and possibly the existence of appeal rates for some case categories) (2008)
Albania Land registry and business registry cases are assigned to administrative bodies. Appeal to court in these cases against the administrative act is possible; however in the statistics they are included under administrative case law. As enforcement cases in this questionnaire are presented those cases in which a party has the right to appeal to court against bailiff’s behaviour in an enforcement procedure.
Andorra Armenia Austria Azerbaijan Belgium *chiffre calculé, non issue des statistiques officielles
La catégorie 1 regroupe les affaires civiles à juger par les tribunaux de première instance (appels des justices de paix et des tribunaux de police) et les cours du travail. Ne pouvant pas distinguer les affaires des catégories 1 et 2, elles se trouvent toutes regroupées dans la catégorie 1. Catégories 3, 4 et 6 : données non disponibles. Catégorie 5 : pas d’application. Catégorie 8 : concerne les affaires traitées par les cours d’appel. Ne concerne pas les affaires jugées par les Chambres des mises en accusation. Catégorie 9 : concerne les affaires jugées par les tribunaux de première instance (appels de police).
Bosnia and Herzegovina The second instance courts have combined jurisdiction, namely they act as both first instance and second instance courts. First instance jurisdiction includes: adjudicating administrative cases (i.e. judicial overseeing of final decisions of administrative bodies) and adjudicating criminal cases for which more than 10 years of imprisonment or a long-term imprisonment (more than 20 years of imprisonment) is prescribed, unless the competence of another court is prescribed by law proceedings during the investigation and after the bringing of the indictment in accordance with law. Second instance jurisdiction includes deciding on appeals against decisions (criminal and civil) of first instance courts, in addition these courts have jurisdiction over deciding on other ordinary and extraordinary legal remedies, if so stipulated by law.
Bulgaria The civil and commercial cases of the Courts of Appeal and the II-nd instance civil and commercial cases of the District courts make the total number of the civil and commercial cases. The same is the situation with the criminal cases. The criminal cases of the Courts of Appeal and the II-nd instance criminal cases of the District courts make the total number of the criminal cases.
Croatia Cyprus Czech Republic Denmark Due to lack of information on pending cases at High courts the overall figures of both civil cases and criminal cases on pending cases do not ad up.
Re 1: Consist of cases from District Courts to High Courts plus second instance cases from High Courts and Commercial and Maritime Court. Re 2-7: Cannot be identified Re 8: Consist of cases from District Courts to High Courts plus second instance cases from High Courts to Supreme Court Re 9: Cannot be identified
Estonia Same comments for criminal cases apply as for question 91. Other cases (nr 7) mentioned here, are the cases, which are presented directly to the court of second instance: petitions for annulment of a decision of an arbitral tribunal and complaints on the decision of appeal committee located by the Public Procurement Office.
Finland 2 Civil (and commercial) non-litigious cases: The number includes petitions. 3 Enforcement cases: The enforcement belongs to the competence of the enforcement authorities, not to the competence of courts. Cases mentioned here are appeals in execution proceedings in accordance with the Execution Act7 Other: The number includes land right law cases, temporary procedural remedy cases, adjustment of the debts of a private individual - cases, restructuring of enterprises cases and bankruptcy cases Total criminal cases (8+9): The classification of cases between severe criminal law cases and misdemeanour cases is not in statistical use in Finland.
France Affaires pénales = cours d’appel et cours d’assises d’appel Georgia Germany Greece *PROVISIONAL DATA
SOURCE: NATIONAL STATISTICAL SERVICE OF GREECE (NSSG) Hungary Iceland Ireland None of this data is available in the format outlined here.
Some of the data is not available in any format. Italy

123
Latvia Data concerns second instance courts and data from the Supreme Court chambers. The chambers - Criminal Cases and Civil Cases are the appeals body which review cases that have been decided by the regional courts, as the court of the first instance.
Lichtenstein Lithuania Other - cases that have been heard in the Supreme Administrative Court of Lithuania. Luxembourg Malta This information was obtained from statistics published by the Courts on an annual basis. Item 1 includes statistics referring to the Court of Appeal in its Superior Jurisdiction as well as in its Inferior
Jurisdiction. Item 7 includes statistics referred to the Constitutional Court, which is the highest Court in Malta and which is presided by the same members of the Judicature who preside over the Court of Appeal, and no appeal is possible from its decision. It is to be noted that there could be a discrepancy between the pending cases of the beginning of the year and the end of the year, once the number of incoming cases and resolved cases are catered for, and this is due to the fact that a number of cases would be adjourned 'Sine Die', as a result of which, they would be no longer continue to be considered as pending, however they are neither considered to be resolved.
Moldova Monaco Montenegro Second-instance courts of justice in Montenegro are the Appellate Court of Montenegro and high courts (the High Court in Podgorica and the High Court in Bijelo Polje).
The Appellate Court of Montenegro decides on appeals against first-instance decisions of high courts and on appeals against decisions of the commercial courts. Since the high courts are courts of first instance only in criminal matters, the Appellate Court of Montenegro decides on appeals against first-instance decisions of high courts in criminal matters. The high courts decide at second-instance level on appeals against decisions of courts of first instance in criminal and civil matters. Having regard to divided jurisdiction between the Appellate Court of Montenegro and high courts, we stated hereunder separate data for these courts in 4 time categories: The Appellate Court of Montenegro Total number of commercial legal cases - 377/728/844/261 Total number of criminal cases - 214/761/752/223 The High courts Total number of civil legal cases of appeal - 5907/5626/6540/4993 Total number of criminal cases of appeal - 1283/3897/3650/1530 In the tables above, commercial legal cases include all the cases under jurisdiction of the commercial court, since all of them are registered under the designation 'Pž' with the Appellate Court. Cases denoted as civil legal cases under jurisdiction of high courts include all the cases from that subject matter under jurisdiction of courts of first instance, all of them are registered under the designation 'Gž'. The right to appeal against decisions of the Administrative Court of Montenegro is not provided for by the Law on Administrative Dispute, and therefore there are no administrative legal cases of appeal. There are two extraordinary legal remedies allowed against decisions of the Administrative Court – a request for extraordinary reconsidering of a court decision and a request for repetition of proceedings. The Supreme Court of Montenegro decides upon requests for extraordinary reconsidering of a court decision, while the Administrative Court of Montenegro decides upon requests for repetition of proceedings. ** Clarification of the category 9 – Misdemeanours in Montenegro In Montenegro, in accordance with the law, misdemeanour proceedings at second-instance level are conducted by the Misdemeanour Council of the Republic of Montenegro. In the course of 2008, the Misdemeanour Council had 2582 cases under processing, all of them received in that year. There was no backlog of cases from previous years. On the day of 31 December 2008 all cases of the Misdemeanour Council were resolved, so there was no carrying forward of cases into the year 2009.
Netherlands Cases from the Council of State are excluded. Norway The total figures for civil cases include ordinary appeals and interlocutory appeals, reopenings, valuation appeals and appeals on decisions from the Social Security Tribunal.The total figures for criminal
cases include ordinary appeals, interlocutory appeals and reopenings. The figures includes appeals that are disallowed or decided without an appeal hearing. (The Court of Appeal may disallow the appeal if the court unanimously considers it obvious that the appeal will not succeed.)
Poland New comment (@14.5.10): Due to explanation of the Division of Statistics the number in the horizontal lines can sometime not to sum up because of possible omissions or mistakes at source statistical information generated by courts as well as structural changes within court system. The category of severe criminal offences dealt by the courts of the second instance represents cases where an appeal have been lodged against the judgment of the first instance court, complaints lodged against courts decisions on discontinuation of the case and complaints against discontinuation of proceeding or refusal to initiate criminal proceeding issued by the prosecutor (or other authorized body). The category of minor offences represents District Court’s decisions in misdemeanor cases being appealed and complaints against decisions of the District Courts that close the legal way to issue a judgment. Enforcement cases and land registry cases filed in the courts of the second instance are not demonstrated separately at the statistical data colleted by the Division of Statistics. The number of enforcement cases are included at the “other” cases category and land registry cases constitute a part of the number of “civil litigious” cases and both of them can not be presented in a separate manner. However it can be assessed that they do not constitute any significant number. Former comment: Due to explanation of the Division of Statistics the number in the horizontal lines can sometime not to sum up because of possible omissions or mistakes at source statistical information generated by courts as well as structural changes within court system.
Portugal 1 - Includes civil, labour and juveniles cases in the Appellates Courts 8 - Criminal cases in the Appellates Courts
Romania The Romanian judiciary has the institution of 'second appeal', but the questionnaire did not allow us to introduce a new table with the date for this kind of cases. Data can be provided at request. Russian Federation The table concerns cases examined by the courts of general jurisdiction.
As regards commercial courts, please find enclosed the following information:

124
Incoming cases (appeal and cassational instance courts) - 146 591 + 95 999 Resolved cases (appeal and cassational instance courts) - 127 627 + 84 529
San Marino Les affaires concernant les commerciaux et les terrains sont inclus dans l'Article 1, car il n'existe pas de documents spécifiques et surtout ce domaine Serbia Slovakia Slovenia Civil and commercial litigious cases include all civil litigious cases and all commercial litigious cases in the second instance courts, namely the higher courts.
Enforcement cases in the second instance include all enforcement and commercial enforcement cases in the second instance courts, namely the higher courts. Administrative law cases in the second instance include appeals in administrative disputes, which are lodged with and dealt with by the highest instance court, namely the Supreme Court of the Republic of Slovenia. Other civil law cases include other civil and commercial law cases in the second instance courts. Criminal law cases concerning severe criminal offences include all criminal cases in the second instance with the exception of other criminal cases and misdemeanour and/or minor offences cases.
Spain In civil and comercial cases, civil appeals before the Provincial courts and special appeals before the Labour chambers of the High Courts of Justice have been taken into account. Sweden The category 'Other' include environmental cases'.
Regarding administrative law cases, please see answer to question 91. The administrative law cases are handled by the administrative courts of appeal while the other cases are handled by the 'regular' courts of appeal.
Switzerland même commentaire que pour la question 91 FYROMacedonia Regarding the point 1. Civil (and commercial) litigious cases, we have also available separate data for civil and commercial cases. Namely in 2008 situation in Macedonian appelate courts regarding civil
cases is as following: Pending cases on 1 January 2008 - 2310 cases, Incoming cases - 13789, Decisions - 12715?, Pending cases on 31 December 2008 - 3384. Commercial cases: Pending cases on 1 January 2008-539 cases, Incoming cases - 4821, Decisions - 4337, Pending cases on 31 December 2008 - 1023. In mentioned point 1 of table above are presented total number of presented civil + commercial cases.In point 7 of the Table 'Other' also are included labour disputes and other civil cases.In point 8 'Criminal cases' there are presented data for adult + juveniles criminal cases
Turkey The system of court of appeal is adopted but not in force yet. Ukraine UK-England and Wales 1) Assume all contested claims in JCS tbl 1.10
5) Heard originally at Magistrates and Crown courts but not in table 90 8) Crown Court appeals to Court of Appeal - incoming includes case that will be refused. 9) Magistrates court appeals to Crown Court - note that consistency check fails BUT published figures used. Admin system used for data allows this to occur
UK-Northern Ireland UK-Scotland Civil appeal cases include appeals from the local sheriff courts, tribunals and a range of statutory appeals e.g. asylum & immigration, planning etc

125
Table 42 - Highest instance courts Total of civil, commercial and administrative law cases (1-7) data
country
93.2.1. Highest instance courts Incoming cases - Total of civil,
commercial and
administrative law cases (1-7)
(2006) [q91]
93.2.1. Highest instance courts Incoming cases - Total of civil,
commercial and
administrative law cases (1-7)
(2008)
93.3.1. Highest instance courts Resolved cases - Total of civil,
commercial and
administrative law cases (1-7)
(2006) [q91]
93.3.1. Highest instance courts Resolved cases - Total of civil,
commercial and
administrative law cases (1-7)
(2008)
93.4.1. Highest instance courts Pending cases on 31 Dec. 06 - Total of civil, commercial
and administrative law cases (1-7)
(2006) [q91]
93.4.1. Highest instance courts Pending cases on 31 Dec. 08 - Total of civil, commercial
and administrative law cases (1-7)
(2008)
Clearance Rate (2006)
Clearance Rate (2008)
Clearance Rate
variation (2006-2008)
Disposition Time (2006)
Disposition Time (2008)
Albania 2.788 1.184 4.326 42,47% 1333,6 Andorra Armenia 1.805 1.069 1.785 1.068 45 1 98,89% 99,91% 1,01% 9,2 0,3 Austria 2.914 2.857 2.947 2.882 838 827 101,13% 100,88% -0,26% 103,8 104,7 Azerbaijan 3.272 NAP 3.366 NAP 334 NAP 102,87% 36,2 Belgium 2.957 877 2.953 924 1.646 1.119 99,86% 105,36% 5,49% 203,5 442,0 Bosnia and Herzegovina 4.013 8.741 6.258 10.307 9.419 9.568 155,94% 117,92% -38,03% 549,4 338,8 Bulgaria 13.928 16.402 14.464 15.095 13.110 4.491 103,85% 92,03% -11,82% 330,8 108,6 Croatia 2.408 2.672 2.745 1.958 693 1.711 114,00% 73,28% -40,72% 92,1 319,0 Cyprus Czech Republic 11.700 10.137 10.731 9.938 6.789 6.986 91,72% 98,04% 6,32% 230,9 256,6 Denmark 456 452 449 99,12% 362,6 Estonia 266 283 249 251 54 86 93,61% 88,69% -4,92% 79,2 125,1 Finland 5.465 5.999 5.991 5.399 3.490 4.162 109,62% 90,00% -19,63% 212,6 281,4 France 29.305 29.182 33.659 28.954 28.817 27.039 114,86% 99,22% -15,64% 312,5 340,9 Georgia 1.959 2.830 2.179 2.494 788 995 111,23% 88,13% -23,10% 132,0 145,6 Germany 14.113 13.607 9.987 96,41% 267,9 Greece Hungary 6.146 4.249 5.838 3.829 1.585 2.078 94,99% 90,12% -4,87% 99,1 198,1 Iceland 425 326 353 120 150 76,71% 134,4 155,1 Ireland 15.433 Italy 35.169 30.406 29.445 33.928 100.805 99.066 83,72% 111,58% 27,86% 1249,6 1065,8 Latvia 1.690 1.898 1.551 1.579 383 742 91,78% 83,19% -8,58% 90,1 171,5 Lichtenstein Lithuania 665 496 665 611 7 96 100,00% 123,19% 23,19% 3,8 57,3 Luxembourg NA 118 62 123 NA 86 104,24% 255,2 Malta 31 NAP NA NAP 37 NAP Moldova 4.095 5.648 4.115 5.470 487 543 100,49% 96,85% -3,64% 43,2 36,2 Monaco 75 NA 42 NA NA NA 56,00% Montenegro 855 930 2 108,77% 0,8 Netherlands 1.334 1.520 NA 113,94% Norway 91 72 91 88 49 29 100,00% 122,22% 22,22% 196,5 120,3 Poland 6.318 20.705 6.554 20.323 1.470 10.728 103,74% 98,16% -5,58% 81,9 192,7 Portugal 3.499 2.969 3.562 3.025 823 755 101,80% 101,89% 0,09% 84,3 91,1 Romania 183.863 21.099 184.495 16.979 40.929 13.394 100,34% 80,47% -19,87% 81,0 287,9 Russian Federation 258000/10000 153000/56000 6000/500 San Marino 17 27 6 158,82% 81,1 Serbia Slovakia 8.386 7.466 8.850 7.148 3.526 2.944 105,53% 95,74% -9,79% 145,4 150,3 Slovenia 2.390 3.696 1.811 3.698 1.944 4.518 75,77% 100,05% 24,28% 391,8 445,9 Spain 17.717 24.620 25.179 30.357 34.225 38.319 142,12% 123,30% -18,82% 496,1 460,7 Sweden 11.796 5.420 10.813 5.221 8.854 1.318 91,67% 96,33% 4,66% 298,9 92,1 Switzerland 7.239 5.729 7.004 6.106 3.291 1.962 96,75% 106,58% 9,83% 171,5 117,3 FYROMacedonia 4.657 1.726 4.823 2.110 4.877 1.179 103,56% 122,25% 18,68% 369,1 204,0 Turkey 412.519 390.141 171.161 94,58% 160,1

126
Ukraine 16.000 102.500 27.500 36.000 NA 26,83% UK-England and Wales 51 64 NA 125,49% UK-Northern Ireland NA NA NA UK-Scotland 3.904 3.385 NA 86,71%
Table 43 - Highest instance courts Civil and commer cial litigious cases (1) data
country
93.2.2. Highest instance courts Incoming cases
- (1) Civil and commercial
litigious cases (2006) [q91]
93.2.2. Highest instance courts Incoming cases
- (1) Civil and commercial
litigious cases (2008)
93.3.2. Highest instance courts Resolved cases
- (1) Civil and commercial
litigious cases (2006) [q91]
92.3.2. Highest instance courts Resolved cases
- (1) Civil and commercial
litigious cases (2008)
93.4.2. Highest instance courts Pending cases on 31 Dec. 06 -
(1) Civil and commercial
litigious cases (2006) [q91]
93.4.2. Highest instance courts Pending cases on 31 Dec. 08 -
(1) Civil and commercial
litigious cases (2008)
Clearance Rate (2006)
Clearance Rate (2008)
Clearance Rate
variation (2006-2008)
Disposition Time (2006)
Disposition Time (2008)
Albania NAP NAP NAP Andorra Armenia 846 845 1 99,88% 0,4 Austria NA NA NA Azerbaijan Belgium NA NA NA Bosnia and Herzegovina 2.918 4.304 2.684 4.133 2.836 3.752 91,98% 96,03% 4,05% 385,7 331,4 Bulgaria NA NA NA Croatia 2.382 2.625 2.721 1.929 688 1.676 114,23% 73,49% -40,75% 92,3 317,1 Cyprus Czech Republic 7.507 6.510 6.002 6.066 4.091 5.654 79,95% 93,18% 13,23% 248,8 340,2 Denmark NA 257 NA 319 NA 446 124,12% 510,3 Estonia 161 158 153 145 32 34 95,03% 91,77% -3,26% 76,3 85,6 Finland 1.010 985 1.124 987 324 367 111,29% 100,20% -11,08% 105,2 135,7 France 19.034 18.932 22.461 18.684 20.250 18.890 118,00% 98,69% -19,31% 329,1 369,0 Georgia 872 1.107 1.049 1.112 348 283 120,30% 100,45% -19,85% 121,1 92,9 Germany 5.906 2.895 5.229 49,02% 659,3 Greece Hungary 4.580 2.840 4.503 2.596 793 923 98,32% 91,41% -6,91% 64,3 129,8 Iceland NAP NAP NAP Ireland Italy 35.169 30.406 29.445 33.928 100.805 99.066 83,72% 111,58% 27,86% 1249,6 1065,8 Latvia 994 916 908 717 204 413 91,35% 78,28% -13,07% 82,0 210,2 Lichtenstein Lithuania 496 611 96 123,19% 57,3 Luxembourg NA 118 NA 123 NA 86 104,24% 255,2 Malta Moldova 1.881 3.293 1.919 3.180 181 369 102,02% 96,57% -5,45% 34,4 42,4 Monaco 64 22 23 21 NA 45 35,94% 95,45% 59,52% 782,1 Montenegro 11 645 13 669 10 2 118,18% 103,72% -14,46% 280,8 1,1 Netherlands 507 NA 446 NA NA 87,97% Norway Poland - - - Portugal Romania 112.141 15.602 118.275 12.146 27.824 11.056 105,47% 77,85% -27,62% 85,9 332,2 Russian Federation 258000/10000 153000/10000 6000/500 San Marino 5 19 0 380,00% Serbia 8.352 8.891 9.019 8.775 3.355 3.671 107,99% 98,70% -9,29% 135,8 152,7 Slovakia Slovenia 1.537 1.929 1.084 1.655 1.591 2.331 70,53% 85,80% 15,27% 535,7 514,1 Spain 9.637 16.643 12.310 21.157 16.918 24.889 127,74% 127,12% -0,61% 501,6 429,4 Sweden 558 588 581 566 200 222 104,12% 96,26% -7,86% 125,6 143,2
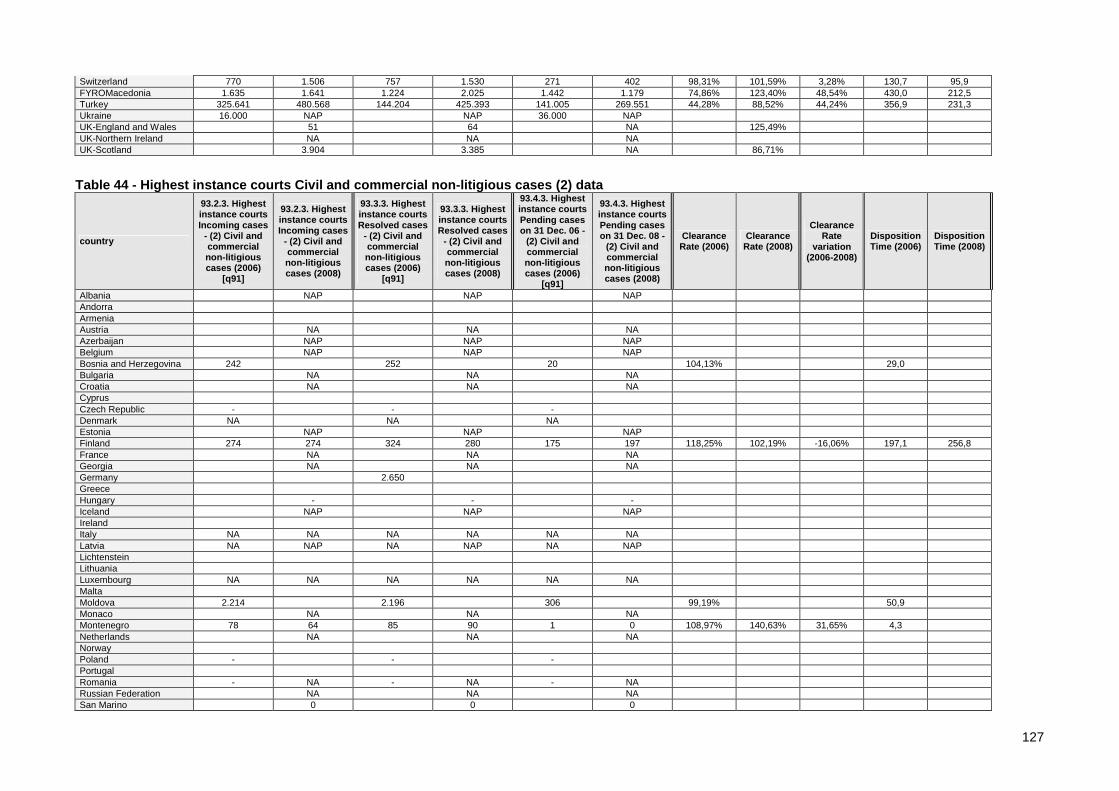
127
Switzerland 770 1.506 757 1.530 271 402 98,31% 101,59% 3,28% 130,7 95,9 FYROMacedonia 1.635 1.641 1.224 2.025 1.442 1.179 74,86% 123,40% 48,54% 430,0 212,5 Turkey 325.641 480.568 144.204 425.393 141.005 269.551 44,28% 88,52% 44,24% 356,9 231,3 Ukraine 16.000 NAP NAP 36.000 NAP UK-England and Wales 51 64 NA 125,49% UK-Northern Ireland NA NA NA UK-Scotland 3.904 3.385 NA 86,71%
Table 44 - Highest instance courts Civil and commer cial non-litigious cases (2) data
country
93.2.3. Highest instance courts Incoming cases
- (2) Civil and commercial non-litigious cases (2006)
[q91]
93.2.3. Highest instance courts Incoming cases
- (2) Civil and commercial non-litigious cases (2008)
93.3.3. Highest instance courts Resolved cases
- (2) Civil and commercial non-litigious cases (2006)
[q91]
93.3.3. Highest instance courts Resolved cases
- (2) Civil and commercial non-litigious cases (2008)
93.4.3. Highest instance courts Pending cases on 31 Dec. 06 -
(2) Civil and commercial non-litigious cases (2006)
[q91]
93.4.3. Highest instance courts Pending cases on 31 Dec. 08 -
(2) Civil and commercial non-litigious cases (2008)
Clearance Rate (2006)
Clearance Rate (2008)
Clearance Rate
variation (2006-2008)
Disposition Time (2006)
Disposition Time (2008)
Albania NAP NAP NAP Andorra Armenia Austria NA NA NA Azerbaijan NAP NAP NAP Belgium NAP NAP NAP Bosnia and Herzegovina 242 252 20 104,13% 29,0 Bulgaria NA NA NA Croatia NA NA NA Cyprus Czech Republic - - - Denmark NA NA NA Estonia NAP NAP NAP Finland 274 274 324 280 175 197 118,25% 102,19% -16,06% 197,1 256,8 France NA NA NA Georgia NA NA NA Germany 2.650 Greece Hungary - - - Iceland NAP NAP NAP Ireland Italy NA NA NA NA NA NA Latvia NA NAP NA NAP NA NAP Lichtenstein Lithuania Luxembourg NA NA NA NA NA NA Malta Moldova 2.214 2.196 306 99,19% 50,9 Monaco NA NA NA Montenegro 78 64 85 90 1 0 108,97% 140,63% 31,65% 4,3 Netherlands NA NA NA Norway Poland - - - Portugal Romania - NA - NA - NA Russian Federation NA NA NA San Marino 0 0 0

128
Serbia Slovakia Slovenia NA NA NA Spain Sweden NAP NAP NAP Switzerland NA NA NA FYROMacedonia Turkey NAP NAP NAP Ukraine NAP NAP NAP UK-England and Wales 0 0 NA UK-Northern Ireland NA NA NA UK-Scotland NAP NAP NAP
Table 45 - Highest instance courts Administrative l aw cases (6) data
country
93.2.7. Highest instance courts Incoming cases
- (6) Administrative
law cases (2006) [q91]
93.2.7. Highest instance courts Incoming cases
- (6) Administrative
law cases (2008)
93.3.7. Highest instance courts Resolved cases
- (6) Administrative
law cases (2006) [q91]
93.3.7. Highest instance courts Resolved cases
- (6) Administrative
law cases (2008)
93.4.7. Highest instance courts Pending cases on 31 Dec. 06 -
(6) Administrative
law cases (2006) [q91]
93.4.7. Highest instance courts Pending cases on 31 Dec. 08 -
(6) Administrative
law cases (2008)
Clearance Rate (2006)
Clearance Rate (2008)
Clearance Rate
variation (2006-2008)
Disposition Time (2006)
Disposition Time (2008)
Albania 580 209 746 36,03% 1302,8 Andorra Armenia 223 223 0 100,00% Austria NAP NAP NAP Azerbaijan NA NA NA Belgium NA NA NA Bosnia and Herzegovina 853 4.437 3.322 6.174 6.563 5.816 389,45% 139,15% -250,30% 721,1 343,8 Bulgaria 12.914 NA 13.604 NA 3.302 NA 105,34% 88,6 Croatia 47 29 35 61,70% 440,5 Cyprus Czech Republic 4.193 3.627 4.729 1.332 2.698 112,78% 36,72% -76,06% 208,2 Denmark NA 55 NA NA Estonia 105 103 96 92 22 42 91,43% 89,32% -2,11% 83,6 166,6 Finland 3.793 4.298 4.006 3.734 2.866 3.438 105,62% 86,88% -18,74% 261,1 336,1 France 10.271 10.250 11.198 10.270 11.198 8.149 109,03% 100,20% -8,83% 365,0 289,6 Georgia 1.087 1.723 1.130 1.382 442 712 103,96% 80,21% -23,75% 142,8 188,0 Germany 8.207 8.062 4.758 98,23% 215,4 Greece Hungary 1.566 1.387 1.335 1.219 792 1.146 85,25% 87,89% 2,64% 216,5 343,1 Iceland NAP NAP NAP Ireland Italy NA NAP NA NAP NA NAP Latvia 613 830 569 739 154 275 92,82% 89,04% -3,79% 98,8 135,8 Lichtenstein Lithuania Luxembourg NA NAP NA NAP NA NAP Malta Moldova 2.355 2.290 174 97,24% 27,7 Monaco 11 NA 19 NA NA NA 172,73% Montenegro 116 146 93 171 32 0 80,17% 117,12% 36,95% 125,6 Netherlands 6.743 NA 7.043 NA 1.833 NA 104,45% 95,0 Norway Poland - 14.642 - 14.085 - 9.027 96,20% 233,9 Portugal NA NA NA
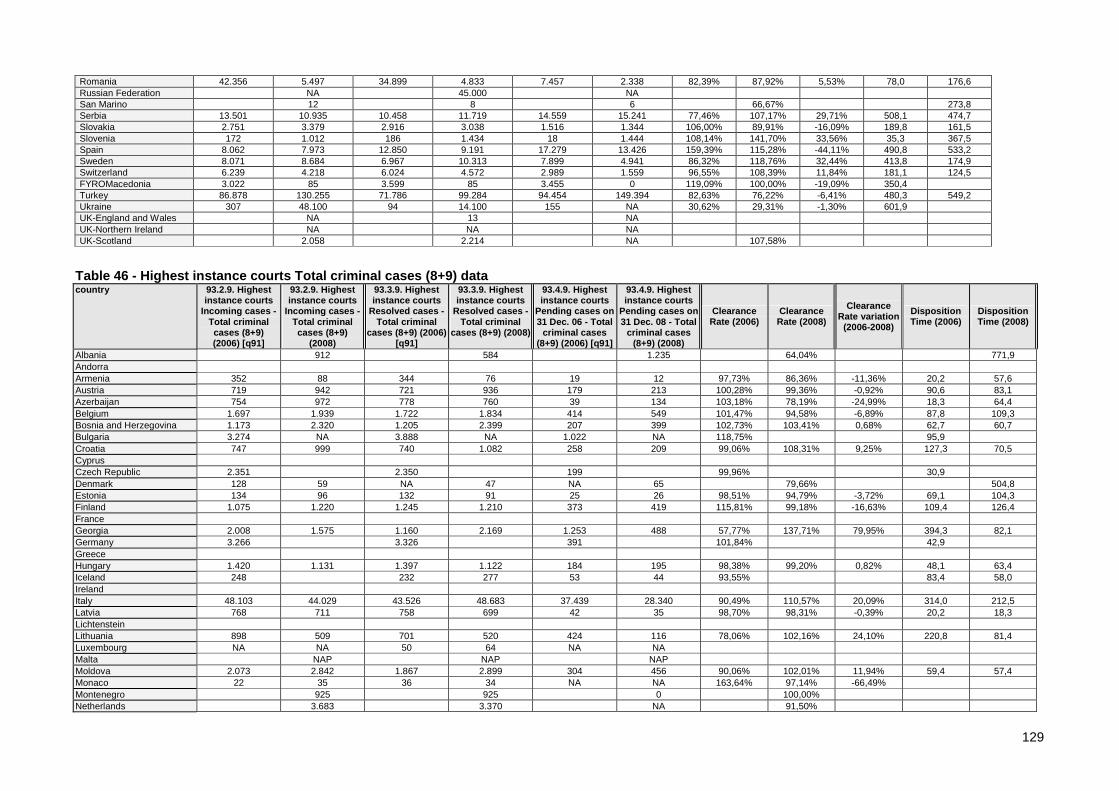
129
Romania 42.356 5.497 34.899 4.833 7.457 2.338 82,39% 87,92% 5,53% 78,0 176,6 Russian Federation NA 45.000 NA San Marino 12 8 6 66,67% 273,8 Serbia 13.501 10.935 10.458 11.719 14.559 15.241 77,46% 107,17% 29,71% 508,1 474,7 Slovakia 2.751 3.379 2.916 3.038 1.516 1.344 106,00% 89,91% -16,09% 189,8 161,5 Slovenia 172 1.012 186 1.434 18 1.444 108,14% 141,70% 33,56% 35,3 367,5 Spain 8.062 7.973 12.850 9.191 17.279 13.426 159,39% 115,28% -44,11% 490,8 533,2 Sweden 8.071 8.684 6.967 10.313 7.899 4.941 86,32% 118,76% 32,44% 413,8 174,9 Switzerland 6.239 4.218 6.024 4.572 2.989 1.559 96,55% 108,39% 11,84% 181,1 124,5 FYROMacedonia 3.022 85 3.599 85 3.455 0 119,09% 100,00% -19,09% 350,4 Turkey 86.878 130.255 71.786 99.284 94.454 149.394 82,63% 76,22% -6,41% 480,3 549,2 Ukraine 307 48.100 94 14.100 155 NA 30,62% 29,31% -1,30% 601,9 UK-England and Wales NA 13 NA UK-Northern Ireland NA NA NA UK-Scotland 2.058 2.214 NA 107,58%
Table 46 - Highest instance courts Total criminal c ases (8+9) data country 93.2.9. Highest
instance courts Incoming cases -
Total criminal cases (8+9) (2006) [q91]
93.2.9. Highest instance courts
Incoming cases - Total criminal cases (8+9)
(2008)
93.3.9. Highest instance courts
Resolved cases - Total criminal
cases (8+9) (2006) [q91]
93.3.9. Highest instance courts
Resolved cases - Total criminal
cases (8+9) (2008)
93.4.9. Highest instance courts
Pending cases on 31 Dec. 06 - Total
criminal cases (8+9) (2006) [q91]
93.4.9. Highest instance courts
Pending cases on 31 Dec. 08 - Total
criminal cases (8+9) (2008)
Clearance Rate (2006)
Clearance Rate (2008)
Clearance Rate variation
(2006-2008)
Disposition Time (2006)
Disposition Time (2008)
Albania 912 584 1.235 64,04% 771,9 Andorra Armenia 352 88 344 76 19 12 97,73% 86,36% -11,36% 20,2 57,6 Austria 719 942 721 936 179 213 100,28% 99,36% -0,92% 90,6 83,1 Azerbaijan 754 972 778 760 39 134 103,18% 78,19% -24,99% 18,3 64,4 Belgium 1.697 1.939 1.722 1.834 414 549 101,47% 94,58% -6,89% 87,8 109,3 Bosnia and Herzegovina 1.173 2.320 1.205 2.399 207 399 102,73% 103,41% 0,68% 62,7 60,7 Bulgaria 3.274 NA 3.888 NA 1.022 NA 118,75% 95,9 Croatia 747 999 740 1.082 258 209 99,06% 108,31% 9,25% 127,3 70,5 Cyprus Czech Republic 2.351 2.350 199 99,96% 30,9 Denmark 128 59 NA 47 NA 65 79,66% 504,8 Estonia 134 96 132 91 25 26 98,51% 94,79% -3,72% 69,1 104,3 Finland 1.075 1.220 1.245 1.210 373 419 115,81% 99,18% -16,63% 109,4 126,4 France Georgia 2.008 1.575 1.160 2.169 1.253 488 57,77% 137,71% 79,95% 394,3 82,1 Germany 3.266 3.326 391 101,84% 42,9 Greece Hungary 1.420 1.131 1.397 1.122 184 195 98,38% 99,20% 0,82% 48,1 63,4 Iceland 248 232 277 53 44 93,55% 83,4 58,0 Ireland Italy 48.103 44.029 43.526 48.683 37.439 28.340 90,49% 110,57% 20,09% 314,0 212,5 Latvia 768 711 758 699 42 35 98,70% 98,31% -0,39% 20,2 18,3 Lichtenstein Lithuania 898 509 701 520 424 116 78,06% 102,16% 24,10% 220,8 81,4 Luxembourg NA NA 50 64 NA NA Malta NAP NAP NAP Moldova 2.073 2.842 1.867 2.899 304 456 90,06% 102,01% 11,94% 59,4 57,4 Monaco 22 35 36 34 NA NA 163,64% 97,14% -66,49% Montenegro 925 925 0 100,00% Netherlands 3.683 3.370 NA 91,50%

130
Norway 89 88 81 85 30 25 91,01% 96,59% 5,58% 135,2 107,4 Poland 2.552 2.827 2.672 2.795 887 788 104,70% 98,87% -5,83% 121,2 102,9 Portugal 1.387 1.221 1.405 1.352 284 146 101,30% 110,73% 9,43% 73,8 39,4 Romania 62.584 42 61.804 57 5.998 129 98,75% 135,71% 36,96% 35,4 826,1 Russian Federation 335000/25000 245000/25000 11000/1000 San Marino NAP NAP NAP Serbia 9.720 9.555 2.209 98,30% 84,4 Slovakia 1.835 1.190 1.847 1.283 266 228 100,65% 107,82% 7,16% 52,6 64,9 Slovenia 938 1.023 1.026 1.080 296 211 109,38% 105,57% -3,81% 105,3 71,3 Spain 4.345 4.470 4.762 3.703 2.108 2.705 109,60% 82,84% -26,76% 161,6 266,6 Sweden 1.524 1.554 1.583 1.494 196 281 103,87% 96,14% -7,73% 45,2 68,7 Switzerland 621 1.418 622 1.409 164 323 100,16% 99,37% -0,80% 96,2 83,7 FYROMacedonia 781 700 770 642 70 107 98,59% 91,71% -6,88% 33,2 60,8 Turkey 149.974 245.604 144.204 197.375 141.005 242.547 96,15% 80,36% -15,79% 356,9 448,5 Ukraine 25.488 16.800 26.496 16.200 3.112 NA 103,95% 96,43% -7,53% 42,9 UK-England and Wales 11 18 NA 163,64% UK-Northern Ireland NA NA NA UK-Scotland 951 804 NA 84,54%
Table 47 - Highest instance courts Criminal cases ( severe criminal offences) (8) data
country
93.2.10. Highest instance courts Incoming cases
- (8) Criminal cases (severe
criminal offences)
(2006) [q91]
93.2.10. Highest instance courts Incoming cases
- (8) Criminal cases (severe
criminal offences)
(2008)
93.3.10. Highest instance courts Resolved cases
- (8) Criminal cases (severe
criminal offences)
(2006) [q91]
93.3.10. Highest instance courts Resolved cases
- (8) Criminal cases (severe
criminal offences)
(2008)
93.4.10. Highest instance courts Pending cases on 31 Dec. 06 -
(8) Criminal cases (severe
criminal offences)
(2006) [q91]
93.4.10. Highest instance courts Pending cases on 31 Dec. 08 -
(8) Criminal cases (severe
criminal offences)
(2008)
Clearance Rate (2006)
Clearance Rate (2008)
Clearance Rate
variation (2006-2008)
Disposition Time (2006)
Disposition Time (2008)
Albania NAP NAP NAP Andorra Armenia Austria NA NA NA Azerbaijan 274 NA NA NA Belgium NA NA NA Bosnia and Herzegovina 1.173 2.320 1.205 2.399 207 399 102,73% 103,41% 0,68% 62,7 60,7 Bulgaria NA NA NA Croatia 747 999 740 1.082 258 209 99,06% 108,31% 9,25% 127,3 70,5 Cyprus Czech Republic - 2.718 - 2.619 - 304 96,36% 42,4 Denmark NA 59 NA 47 NA 65 79,66% 504,8 Estonia 80 51 74 49 22 17 92,50% 96,08% 3,58% 108,5 126,6 Finland NAP NAP NAP France 9.205 8.348 2.297 2.037 2.903 2.654 24,95% 24,40% -0,55% 461,3 475,6 Georgia 553 719 211 130,02% 107,1 Germany 3.265 3.326 390 101,87% 42,8 Greece Hungary 1.131 1.122 195 99,20% 63,4 Iceland NAP NAP NAP Ireland 1.263 Italy 48.103 44.029 43.526 48.683 37.439 28.340 90,49% 110,57% 20,09% 314,0 212,5 Latvia 527 491 518 493 25 19 98,29% 100,41% 2,12% 17,6 14,1 Lichtenstein

131
Lithuania Luxembourg NA NA NA NA NA NA Malta Moldova 1.243 1.125 176 90,51% 57,1 Monaco NA NA NA NA NA NA Montenegro 280 280 0 100,00% Netherlands 3.540 NA 3.079 NA NA 86,98% Norway NA NA NA Poland - - - Portugal 1.387 1.221 1.405 1.352 284 146 101,30% 110,73% 9,43% 73,8 39,4 Romania - NAP - NAP - NAP Russian Federation NA NA NA San Marino Serbia 7.750 7.606 2.036 98,14% 97,7 Slovakia Slovenia 896 898 989 924 266 191 110,38% 102,90% -7,48% 98,2 75,4 Spain Sweden NAP NAP NAP Switzerland NA NA NA FYROMacedonia 781 700 770 642 70 107 98,59% 91,71% -6,88% 33,2 60,8 Turkey 149.974 NAP 144.204 NAP 141.005 NAP 96,15% 356,9 Ukraine NAP NAP NAP UK-England and Wales 13.523 11 18 3.566 NA 163,64% UK-Northern Ireland NA NA NA UK-Scotland NA NA NA
Table 48 - Highest instance courts Misdemeanour and /or minor offences' cases (9) data
country
93.2.11. Highest instance courts Incoming cases
- (9) Misdemeanour and/or minor
offences' cases (2006) [q91]
93.2.11. Highest instance courts Incoming cases
- (9) Misdemeanour and/or minor
offences' cases (2008)
93.3.11. Highest instance courts Resolved cases
- (9) Misdemeanour and/or minor
offences' cases (2006) [q91]
93.3.11. Highest instance courts Resolved cases
- (9) Misdemeanour and/or minor
offences' cases (2008)
93.4.11. Highest instance courts Pending cases on 31 Dec. 06 -
(9) Misdemeanour and/or minor
offences' cases (2006) [q91]
93.4.11. Highest instance courts Pending cases on 31 Dec. 08 -
(9) Misdemeanour and/or minor
offences' cases (2008)
Clearance Rate (2006)
Clearance Rate (2008)
Clearance Rate
variation (2006-2008)
Disposition Time (2006)
Disposition Time (2008)
Albania NAP NAP NAP Andorra Armenia Austria NA NA NA Azerbaijan 543 NA NA NA Belgium NA NA NA Bosnia and Herzegovina 0 0 0 Bulgaria NA NA NA Croatia NA NA NA Cyprus Czech Republic - - - Denmark NA NA NA Estonia 54 45 58 42 3 9 107,41% 93,33% -14,07% 18,9 78,2 Finland NAP NAP NAP France Georgia 1.022 1.450 287 141,88% 72,2 Germany 1 1 Greece Hungary - - - Iceland NAP NAP NAP

132
Ireland 0 0 0 Italy NA NAP NA NAP NA NAP Latvia 241 220 240 206 17 16 99,59% 93,64% -5,95% 25,9 28,3 Lichtenstein Lithuania Luxembourg NA NA NA NA NA NA Malta Moldova 830 742 128 89,40% 63,0 Monaco NA NA NA NA NA NA Montenegro Netherlands NA NA NA Norway NA NA NA Poland - - - Portugal Romania - NAP - NAP - NAP Russian Federation NA NA NA San Marino Serbia Slovakia Slovenia 42 125 37 156 30 20 88,10% 124,80% 36,70% 295,9 46,8 Spain Sweden NAP NAP NAP Switzerland NA NA NA FYROMacedonia Turkey NAP NAP NAP Ukraine NAP NAP NAP UK-England and Wales 0 0 NA UK-Northern Ireland NA NA NA UK-Scotland NA NA NA

133
Table 49 - Comments to highest instance court cases data Country
93 Comments (including an indication of the cases t hat are included in the total figures of civil, com mercial and administrative law case and on possible limitations to the appeal to the highest instance court) (2008)
Albania The number presented at total of civil row includes all civil law cases,(litigious and non-litigious) administrativ law cases and commercial law cases. The number presented at total of penal row includes all criminal cases (severe criminal offences) and misdemeanour cases (minor offences).
Andorra Le système andorran ne dispose pas de Cour Suprême Armenia Austria Azerbaijan Belgium le nombre total d’affaires civiles, commerciales et administratives compte aussi les affaires sociales et fiscales à la Cour de cassation (affaires du rôle C,F et S de la Cour de cassation) Bosnia and Herzegovina The highest instance courts have jurisdiction over the following matters:
- deciding on appeals against the decisions (mostly in criminal cases) of the second instance courts, and - deciding on extraordinary legal remedies submitted against final rulings (in criminal, administrative, and civil cases) of lower courts.
Bulgaria The data refers only to the Supreme Administrative Court. The numbers in the table are sum of the total number of I-st instance cases and the total of cassation cases. (from the report of the SAC for 2008) Croatia In the tables are entered data on cases that are being led at the Supreme Court as the highest court. The category of civil litigation cases includes data for civil cases in stage II competence of the Supreme
Court, and information about cases of the extraordinary remedies (request for protection of legality and audit). The category of administrative and legal cases includes data on subjects for protection of legality in administrative disputes, and the category of criminal cases includes data on third instance criminal cases, as well cases in this court that are being led for extraordinary remedies (protection laws, demand for extraordinary mitigation of the sentence, the request for extraordinary review of a final verdict)
Cyprus The supreme court is the final appelate court. Czech Republic Denmark All data in table 93 are taken from the Supreme Court’s Annual Account statement.
Re 1: Pending cases prime and ultimo 2008 only includes cases where the whole case is appealed, not a minor decisions in a case that is appealed. 1 above is all appeal cases (including minor decisions in a case) from which 6, administrative cases have been deducted as administrative cases has its own category. Pending ultimo does not measure up as definitions of incoming and resolved cases are different from the definitions used on pending cases. Pending cases are found as residuals.
Estonia The Supreme Court is the court of cassation, therefore only those cases are heard which have been given leave to appeal. The data presented shows the number of incoming/resolved/pending cases which have been actually heard by the Supreme Court (e.g. those cases have been granted the leave to appeal, they are declared admissible). Records are maintained on court cases, not appeals, i.e. there may be several appeals in one court case. Comments: Line 2 of the table – the Supreme Court of Estonia does not collect statistical data separately for litigious and non-litigious cases. Line 8 of the table - a criminal offence is a serious offence the principal punishment prescribed for which is a pecuniary punishment or imprisonment. Line 9 of the table - a misdemeanour offence is an offence the principal punishment prescribed for which is a fine or detention.
Finland 6 Administrative law cases: Cases mentioned in category 6 are dealt with by the Supreme Administrative Court, cases mentioned in other categories are dealt with by the Supreme Court. Cases mentioned in category 7 are following: Case categoriesNo. Pending cases on 1 Jan. ‘08No. of incoming casesNo. of decisionsNo. pending cases on 31 Dec. ‘08Insurance cases5325723377Land right law cases 6315213382Petitions for a pardon 033321Total criminal cases (8+9): The classification of cases between severe criminal law cases and misdemeanour cases is not in statistical use in Finland.
France Affaires pénales : Le nombre total d’affaires terminées correspond aux arrêts de cassation, de cassation sans renvoi et de rejet du pourvoi. Les autres arrêts rendus par la chambre criminelle de la Cour de cassation ne sont pas comptabilisés. Il n’est pas possible de distinguer le contentieux de la Cour de cassation selon le type d’infractions. Sous le terme « affaires pénales (infractions graves) sont repris l’ensemble des pourvois. Il est à noter que les pourvois concernent essentiellement des crimes et des délits. La part des contraventions est résiduelle. Les données sont issues du rapport annuel d’activité de la Cour de cassation.
Georgia Germany Greece THERE ARE NO DATA AVAILABLE, AS THERE IS NO RELEVANT SURVEY CONDUCTED
BY THE NATIONAL STATISTICAL SERVICE OF GREECE (NSSG). Hungary Iceland Ireland Italy Latvia Data concerns Senate of the Supreme Court. Total number of civil, commercial and administrative cases has been formed from all cases reviewed by the Department of Civil Cases of the Senate and the
Department of Administrative Cases of the Senate (1+6+7) Row 7 – other cases, inter alia: 1) new reviews of civil cases due to significant infringements of material law and procedural law standards

134
2) new reviews of civil cases due to newly discovered circumstances 3) new reviews of administrative cases due to newly discovered circumstances 4) cases that have been reviewed by the Department of Administrative cases of the Senate as by the court of the first instance All cases that have been reviewed in the Department of Criminal Cases of the Senate, have been included in total number of criminal cases
Lichtenstein Lithuania Luxembourg Malta The Court of Appeal is the court of second instance and is the Highest Court of Malta, so the data requested herein is the same as that provided for in question 92. Moldova Monaco Montenegro The Supreme Court of Montenegro, as the highest court in Montenegro, is in charge of deciding per reviews against enforceable decisions in civil and commercial matters.
Review is allowed in proprietary legal matters in which the statement of claim refers to monetary claim, surrender of an asset or execution of some other obligation, as well as in proprietary legal disputes in which the statement of claim does not refer to monetary claim, surrender of an asset or execution of some other obligation if the value of the subject matter of the dispute exceeds 10,000 euros. Notwithstanding the value of a dispute, review is always allowed: - in disputes concerning maintenance when maintenance is established and revoked for the first time, - in disputes concerning compensation of damages for lost maintenance due to the death of maintenance provider and due to lost earnings or other income from labour when these compensations are established or revoked for the first time, - in proprietary disputes arisen due to anti-constitutional and unlawful individual acts and actions which put legal entities or natural persons, depending on their registered office i.e. residence, to unequal position in the market or which disturb the market in another manner, including also disputes over compensation of damages caused by the above said acts or actions. In labour relation disputes review is allowed only in disputes concerning entering into employment, existence of the employment and termination of the employment. In commercial disputes review is allowed if the value of the subject matter of the dispute of the refuted part of the enforceable verdict exceeds the amount of 30,000 euros. Civil legal cases include all cases from that field in which review has been appealed for. Commercial legal cases include all cases in which review has been appealed for against decisions of commercial courts. Administrative legal cases include all cases in which a request for extraordinary reconsideration of an enforceable decision of the Administrative Court is submitted. In criminal matters the Supreme Court decides on appeals at third-instance level, when such legal instrument is allowed by the law, and on extraordinary legal remedies – a request for protection of lawfulness, a request for examination of lawfulness of an enforceable verdict and extraordinary mitigation of sentence. The Supreme Court is in charge of deciding on extension of detention period prior to bringing an indictment when three months of detention have passed, which is the period for which a court of first instance may order i.e. extend detention. Also, the Supreme Court is in charge of deciding on devolving of territorial jurisdiction and to determine a court which shall have territorial jurisdiction when jurisdiction of courts in Montenegro is not precluded and when it is not possible to determine on the basis of the rules on territorial jurisdiction which court has territorial jurisdiction over certain matter. The table above contains a figure referring to all criminal cases which the Supreme Court processed during 2008.
Netherlands Cases from the Council of State are excluded. Norway Poland Statistics of the Superior court are held in separate manner the the lower courts. The number are calculated with taking account kind of action (cassation, appeal etc.) but not the specific kind of case. Portugal 1 - Includes civil, labour and juveniles cases in the Supreme Court
8 - Criminal cases in the Supreme Court Romania Russian Federation The first amount is the number of cases examined by a judge of a supervisory review instance court in order to establish whether the matter is to be referred to the supervisory review instance court or not
and the second amount is the number of cases referred to the supervisory review instance court and examined. The table concerns cases examined by the courts of general jurisdiction. As regards commercial courts, please find enclosed the following information: Incoming cases - 21023 Resolved cases - 17 334/324
San Marino En ce qui concerne civiles et administratives: - il ya une Cour suprême, mais un tribunal de troisième instance d'experts en matière civile, qui intervient si la décision en première instance et la phrase du second degré sont entre eux, même s'il n'est que partiellement déformée. L'opération est automatiquement le cas d'un recours administratif, à la demande de la partie perdante en appel si, au lieu qu'il est litiges civils. Le tribunal de troisième instance est résolu que dans le choix entre les chefs des jugements divergents, sans la possibilité de tribunal de troisième instance de mettre en place une solution autre que ceux donnés dans les classes précédentes. - Les affaires concernant les commerciaux et les terrains sont inclus dans l'Article 1, car il n'ya pas de dossiers spécifiques et en particulier pour ces questions. En ce qui concerne les affaires pénales: - il existe un tribunal de troisième degré de juridiction pénale de troisième instance pénale n'a compétence qu'à l'égard des plaintes dans les procédures pénales et inhérents à la légitimité des mesures réelles ou personnelles et de protection pour la mise en œuvre de la phrase.
Serbia Slovakia Slovenia Civil and commercial litigious cases include all civil litigious cases and all commercial litigious cases in the highest instance court, namely in the Supreme Court of the Republic of Slovenia.Administrative

135
law cases include all administrative cases in the highest instance court with the exception of appeals in administrative disputes. The latter are considered as the cases in the second instance.Other cases among civil cases in the highest instance court include cases governed by employment and social (security) law.Limitations to the appeal to the highest instance court – There are limitations to appeal to the Supreme Court in almost all procedures, excluding the criminal procedure. In labour and social disputes law it was introduced in 2005, in administrative law in 2007 and for civil law disputes in 2008. Regarding civil law, the results of the introduction of the limitation have yet to be seen.
Spain Cases corresponding to the Military and special chambers of the Supreme Court hasve been included in the figures for civil and commercial cases and enforcement. Sweden Administrative law cases are only indicated in section 6 (thus, they are not included in section 1 'Total of civil, commercial...'). The administrative law cases are handled by the Supreme Administrative
Court, while the other cases in the table are dealt with by the Supreme Court. Switzerland Chiffres tirés du rapport de gestion 2008 du Tribunal Fédéral Suisse. Les détails ne sont pas disponibles, le Tribunal utilisant une autre typologie. FYROMacedonia In addition to presented figures, Supreme Court has the competence to deal with application of citizens regarding the delay of procedure. In that field, Supreme Court in 2008 received 106 applications, 58
of them were solved while 48 were pending cases on 31 december 2008. Turkey Ukraine UK-England and Wales Table 1.4 JCS 08 Used to include those without judgment
Table 1.5 JCS 08 UK-Northern Ireland UK-Scotland Administrative law cases include judicial review, company insolvency, trusts, enforcement of foreign judgments etc. Civil and commercial cases include family, commercial, personal injury and other
ordinary disputes.

136
Table 50 - Litigious divorce cases average length
country 95.3.1. 1st instance (average
length) - Litigious divorce cases (2004) [q69] (in days)
95.3.1. 1st instance (average length) - Litigious divorce
cases (2006) [q93] (in days)
95.3.1. 1st instance (average length) - Litigious divorce
cases (2008) (in days)
95.4.1. 2nd instance (average length) - Litigious divorce
cases (2004) [q69]
95.4.1. 2nd instance (average length) - Litigious divorce
cases (2006) [q93]
95.4.1. 2nd instance (average length) - Litigious divorce
cases (2008) Albania 120 73 246 Andorra Armenia 55 40 Austria 183 180 NA Azerbaijan 175 90 60 90 Belgium NA NA 564 479 Bosnia and Herzegovina 329 98 Bulgaria NA NA Croatia NA NA Cyprus 365 365 Czech Republic 228 - NA 55 - NA Denmark 100 90 153 90 90 Estonia 91 30 Finland 240 243 243 0 France 423 477 564 441 396 393 Georgia NA NA NA NA Germany 302 321 Greece 13000* Hungary NA NA Iceland NA NA Ireland Italy 582 634 682 502 NA NA Latvia 117 135 84 72 Lichtenstein Lithuania 39 69,3 Luxembourg NA NA NA NA Malta NAP NAP NAP NAP NAP NAP Moldova NA NA NA NA Monaco 270 270 240 240 Montenegro 98 103,86 165 120,46 Netherlands 308 308 331 237 217 Norway NAP NAP Poland 204 179 164,1 89 50,4 Portugal 308 325 106 114 101 Romania 189 NA 183 NA Russian Federation 30 NA 30 NA San Marino NA NA Serbia NA NA NA NA Slovakia Slovenia 173 206 191 78 60 Spain 251 227 261 NA Sweden 183 234 NAP Switzerland NA NA FYROMacedonia 136 47 Turkey 153 152 NA Ukraine UK-England and Wales 225 NA UK-Northern Ireland NA NA UK-Scotland NA NA

137

138
Table 51 - Description of the calculation method of the length of proceedings (not limited to litigiou s divorce cases, it also include comments on employment dismissal, robbery and intentional homic ide cases)
country
97 Description of the
calculation method of the
length of proceedings
(2004) NQ
97 Description of the calculation method of the len gth of proceedings (2006) [q95] 97 Description of the calculation method of the len gth of proceedings (2008)
Albania Calculation of the case turnover ratio ? dividing 365 according to the GOJUST Guidelines formula for the calculation of the disposition time.
Andorra Armenia Austria Average length (median) of procedures from filing to final close. Average length (median) of procedures from filing to final close. Azerbaijan The length of investigation for these two kinds of criminal cases is 3 month, but the term may
be extended till 12 month. As the criminal case enters the court the judge should appoint preparatory process no later than 15 days and from this date should start to court consideration of the criminal case in 15 days. In legislation there is no time framework for consideration of criminal cases. According to article 6 of the Convention “On protection of human rights and fundamental freedoms”, the judge should consider the criminal case in reasonable time. From the date of the delivering judgment the appeal may be submitted to the court in 20 days. The preliminary consideration of the criminal case in the appellate court are to carried out by the judge within 15 days, in case of high number of accused persons or complicity of the criminal case within 30 days. The judge should appoints consideration of the criminal case in 30 days, but in case of high number of accused persons or complicity of the criminal case this term may be extended till 45 days.
Note: The length of investigation for these two kinds of criminal cases is 3 month, but the term may be extended till 12 month. As the criminal case enters the court the judge should appoint preparatory process no later than 15 days and from this date should start to court consideration of the criminal case in 15 days. In legislation there is no time framework for consideration of criminal cases. According to article 6 of the Convention “On protection of human rights and fundamental freedoms”, the judge should consider the criminal case in reasonable time. From the date of the delivering judgment the appeal may be submitted to the court in 20 days. The preliminary consideration of the criminal case in the appellate court are to carried out by the judge within 15 days, in case of high number of accused persons or complicity of the criminal case within 30 days. The judge should appoints consideration of the criminal case in 30 days, but in case of high number of accused persons or complicity of the criminal case this term may be extended till 45 days.
Belgium Le délai de procédure correspond à la durée moyenne totale, exprimée en nombre de jours, des affaires clôturées durant l'année civile considérée, mesurant le laps de temps écoulé entre leur introduction et leur clôture. A noter que si une affaire est clôturée le même jour que son introduction, notre méthode de calcul considère que son délai de procédure est d’1 jour. Par conséquent, chaque durée de procédure est augmentée d’un jour. Par exemple, si une affaire est introduite le 20 octobre 2006 et qu’un arrêt est prononcé le 22 octobre 2006, la durée totale de son traitement est calculée de la manière suivante : (22-20)+1= 3 jours.
La durée de l’output concerne les affaires pour lesquelles une décision mettant un terme à l’affaire (décision définitive) a été prise pendant la période statistique. Elle représente le nombre de jours entre l’inscription et la décision définitive. Moyenne et médiane La durée moyenne est la moyenne de toutes les durées. Pour la calculer, la somme de toutes les durées est divisée par le nombre d’affaires. Lorsqu’il y a un déséquilibre entre les durées, par exemple lorsqu’un grand nombre d’affaires affichent une courte durée et un petit nombre d’affaires s’étendent sur une très longue durée, la médiane constitue un meilleur indicateur pour la durée d’une affaire moyenne. La durée médiane est la durée centrale de toutes les affaires. La moitié des affaires durent moins longtemps que la médiane, l’autre moitié plus longtemps. Par exemple, pour les cinq affaires dont la durée est de 50, 60, 70, 80 et 150 jours, la durée moyenne est de 82 jours et la durée médiane est de 70 jours. Actuellement, la durée médiane n’est pas encore disponible.
Bosnia and Herzegovina Relevant laws contain provisions regarding deadlines for undertaking particular actions in cases, however in the vast majority of cases courts are not able to respect the given deadlines due to overwhelming number of cases.
The length of proceedings for litigious divorce and employment dismissal cases is reported by courts as the simple average of time needed to resolve a case for cases resolved during the year. More than two thirds (69%) of courts reported while remaining 31% did not provide that figure. The average length at the national level is calculated as the weighted average with number of resolved cases at the court level as weights. Data on length of proceedings, at this point, is not available for robbery and intentional homicide cases. However, the data for such cases will be available for the next evaluation cycle.
Bulgaria Croatia The lenght of proceedings is calculated from the date of receiving a court file till the legal
validity of the judicial decision. From the day the lawsuit is filed until the day the decision becomes final.
Cyprus In all cases exept criminal time starts from the dae of filling the case. Czech Republic From filing the action until the decision is legal effective. From filing the action until the decision is legaly effective. Denmark From the date of incoming cases to the date of decisions.
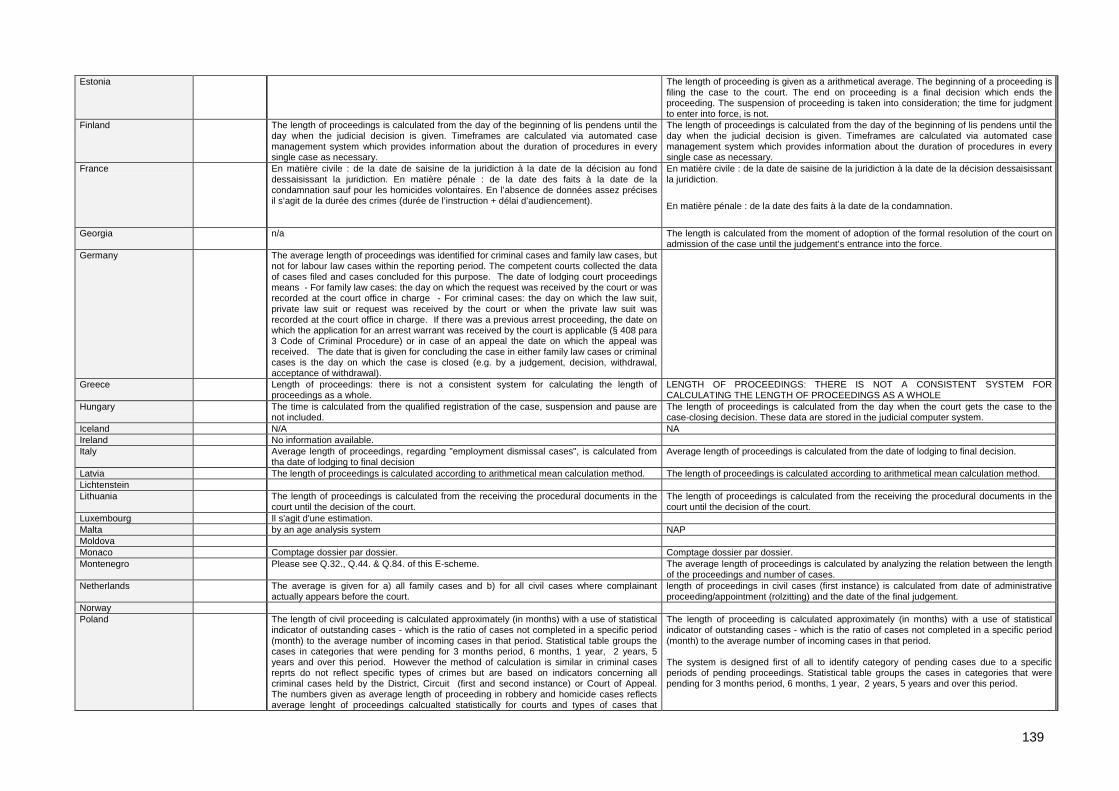
139
Estonia The length of proceeding is given as a arithmetical average. The beginning of a proceeding is filing the case to the court. The end on proceeding is a final decision which ends the proceeding. The suspension of proceeding is taken into consideration; the time for judgment to enter into force, is not.
Finland The length of proceedings is calculated from the day of the beginning of lis pendens until the day when the judicial decision is given. Timeframes are calculated via automated case management system which provides information about the duration of procedures in every single case as necessary.
The length of proceedings is calculated from the day of the beginning of lis pendens until the day when the judicial decision is given. Timeframes are calculated via automated case management system which provides information about the duration of procedures in every single case as necessary.
France En matière civile : de la date de saisine de la juridiction à la date de la décision au fond dessaisissant la juridiction. En matière pénale : de la date des faits à la date de la condamnation sauf pour les homicides volontaires. En l’absence de données assez précises il s’agit de la durée des crimes (durée de l’instruction + délai d’audiencement).
En matière civile : de la date de saisine de la juridiction à la date de la décision dessaisissant la juridiction.
En matière pénale : de la date des faits à la date de la condamnation.
Georgia n/a The length is calculated from the moment of adoption of the formal resolution of the court on admission of the case until the judgement’s entrance into the force.
Germany The average length of proceedings was identified for criminal cases and family law cases, but not for labour law cases within the reporting period. The competent courts collected the data of cases filed and cases concluded for this purpose. The date of lodging court proceedings means - For family law cases: the day on which the request was received by the court or was recorded at the court office in charge - For criminal cases: the day on which the law suit, private law suit or request was received by the court or when the private law suit was recorded at the court office in charge. If there was a previous arrest proceeding, the date on which the application for an arrest warrant was received by the court is applicable (§ 408 para 3 Code of Criminal Procedure) or in case of an appeal the date on which the appeal was received. The date that is given for concluding the case in either family law cases or criminal cases is the day on which the case is closed (e.g. by a judgement, decision, withdrawal, acceptance of withdrawal).
Greece Length of proceedings: there is not a consistent system for calculating the length of proceedings as a whole.
LENGTH OF PROCEEDINGS: THERE IS NOT A CONSISTENT SYSTEM FOR CALCULATING THE LENGTH OF PROCEEDINGS AS A WHOLE
Hungary The time is calculated from the qualified registration of the case, suspension and pause are not included.
The length of proceedings is calculated from the day when the court gets the case to the case-closing decision. These data are stored in the judicial computer system.
Iceland N/A NA Ireland No information available. Italy Average length of proceedings, regarding "employment dismissal cases", is calculated from
tha date of lodging to final decision Average length of proceedings is calculated from the date of lodging to final decision.
Latvia The length of proceedings is calculated according to arithmetical mean calculation method. The length of proceedings is calculated according to arithmetical mean calculation method. Lichtenstein Lithuania The length of proceedings is calculated from the receiving the procedural documents in the
court until the decision of the court. The length of proceedings is calculated from the receiving the procedural documents in the court until the decision of the court.
Luxembourg Il s'agit d'une estimation. Malta by an age analysis system NAP Moldova Monaco Comptage dossier par dossier. Comptage dossier par dossier. Montenegro Please see Q.32., Q.44. & Q.84. of this E-scheme. The average length of proceedings is calculated by analyzing the relation between the length
of the proceedings and number of cases. Netherlands The average is given for a) all family cases and b) for all civil cases where complainant
actually appears before the court. length of proceedings in civil cases (first instance) is calculated from date of administrative proceeding/appointment (rolzitting) and the date of the final judgement.
Norway Poland The length of civil proceeding is calculated approximately (in months) with a use of statistical
indicator of outstanding cases - which is the ratio of cases not completed in a specific period (month) to the average number of incoming cases in that period. Statistical table groups the cases in categories that were pending for 3 months period, 6 months, 1 year, 2 years, 5 years and over this period. However the method of calculation is similar in criminal cases reprts do not reflect specific types of crimes but are based on indicators concerning all criminal cases held by the District, Circuit (first and second instance) or Court of Appeal. The numbers given as average length of proceeding in robbery and homicide cases reflects average lenght of proceedings calcualted statistically for courts and types of cases that
The length of proceeding is calculated approximately (in months) with a use of statistical indicator of outstanding cases - which is the ratio of cases not completed in a specific period (month) to the average number of incoming cases in that period. The system is designed first of all to identify category of pending cases due to a specific periods of pending proceedings. Statistical table groups the cases in categories that were pending for 3 months period, 6 months, 1 year, 2 years, 5 years and over this period.

140
include these two specific types of crime. However this is not a accurate answer in this question, this allows to give the statisticly closest answers to questions asked.
Portugal Length of time: it starts to be measured from the day the case enters a court until it reaches a final decision in that instance, even if later there may occur an appeal on the decision before a higher court. Data related to 2nd instance decisions refer not only to the appeal courts but to the Supreme High Court (3rd instance) as well.
The data regarding the length of time in the first instance judicial courts for 2007 and 2008 is still being validated. Nevertheless, the length of proceedings starts to be measured from the day the case enters a court until it reaches a final decision in that instance, even if later it may occur an appeal on the decision before a higher court.
Romania The solving term is counted distinctly for each cycle of the trial (first instance, appeal, second appeal). We don’t collect statistics regarding the length for each file from the first instance procedure to the highest court procedure. The duration are an average for those types of cases for first instance procedure and for appealing procedure (appeal and second appeal).
The comment from question 95 is valid.
Russian Federation According to article 154 of Civil procedure code of Russian federation civil cases shall be examined and adjudicated by court before expiring 2 months beginning from the date on which the application reached a court, by the justice of the peace – before expiring of 1 month beginning from the date on which the application was accepted for examination. Cases on restoration at work, on collection of alimonies are examined and adjudicated by court before expiring of 1 month.
The aerage length of proceeding is calculated in the basis of the the amount of cases examined:
- to 1,5 month inslusive,
- over 1,5 month to 3 months inclusive,
- over 3 month to 1year inclusive,
- over 1 year to 2 years inclusive,
- over 2 years to 3 years inclusive,
- over 3 years to 4 years inclusive.
San Marino Serbia Slovakia The length of proceedings is calculated from the date of lodging the case to the final valid
decision, it means, that it includes the length of the proceedings before both first intance and appeal court.
The length of proceedings is calculated from the date of lodging the case to the final valid decision, it means, that it includes the length of the proceedings before both first instance and appeal court.
Slovenia The lenght of the proceedings is calculated for each case from the date of lodging the plaint, to the date of the judgement. Since this calculations are made for each instance separately, we are not able (yet) to give the aggregate numbers.
The average length of the court proceedings of each category given is calculated as arithmetic mean of the lengths of all the proceedings of certain category resolved in the year observed, wherein the length of each proceeding is calculated in number of days counted from the date of initiation/lodging of the proceeding up to the date of its resolution. Arithmetic mean is calculated by the formulae as follows: “Ya = (y1 + y2 + ... + yN) / N”, wherein Ya is arithmetic mean of the lengths of the proceedings, y1 is length of proceeding No 1, y2 is length of proceeding No 2, yN is length of proceeding No N and N is the number of all proceedings.
Spain As direct data on lenght of proceedings is not available, it is calculated in accordance to a mathematical model that takes into account the number of incoming, pending and solved cases at the end of each year and gives an estimate of the average lenght of cases that are filed each year.
Sweden Average length of proceedings in divorce cases calculated from the date when the application of summons is reveived by the court until the date of the judgment.
Average length of proceedings in divorce cases is calculated from the date when the application of summons is received by the court until the date of the judgment.
Switzerland En Suisse, les durées moyennes de procédure sont rarement indiquées dans les rapports de gestion. La charge moyenne des affaires leur permet de liquider les affaires dans des délais raisonnables, le gros des affaires en moins d'une année par instance et la quasi-totalité en moins de deux ans par instance. Des difficultés particulières ou des demandes des parties justifient des durées plus longues. Les condammations de la Suisse pour une durée excessive de procédure par la Cour européenne des droits de l'homme restent rares et ne nécessitent en règle générale aucune modification ni de l'organisation judiciaire ni du droit de procédure mais constituent des exceptions qu'ils convient de combattre par des contrôles de durée de procédure. La méthode de calcul généralement utilisée pour calculer la durée de la procédure: A = date de dépôt du mémoire principal ou date de saisine du juge pénal B = date de la décision (= communication orale lors de l'audience ou, en cas de procédure écrite,
La durée totale de la procédure pour les affaires pénales a été calculée par l'Office fédéral de la statistique pour les délits mentionnés sur la base des informations disponibles dans le casier judiciaire; la durée est calculée depuis la commission de l'infraction jusqu'à l'entrée en force du jugement (y compris la dernière instance en cas de recours); afin de disposer d'un plus grand nombre d'affaires, le calcul repose sur les affaires entrées en force en 2008 et 2009. Ces données sont fiables et donnent une information correcte sur le plan national. La durée située entre la commission du délit et le début de la procédure judiciaire peut être considéré comme négligeable vu la gravité des délits.
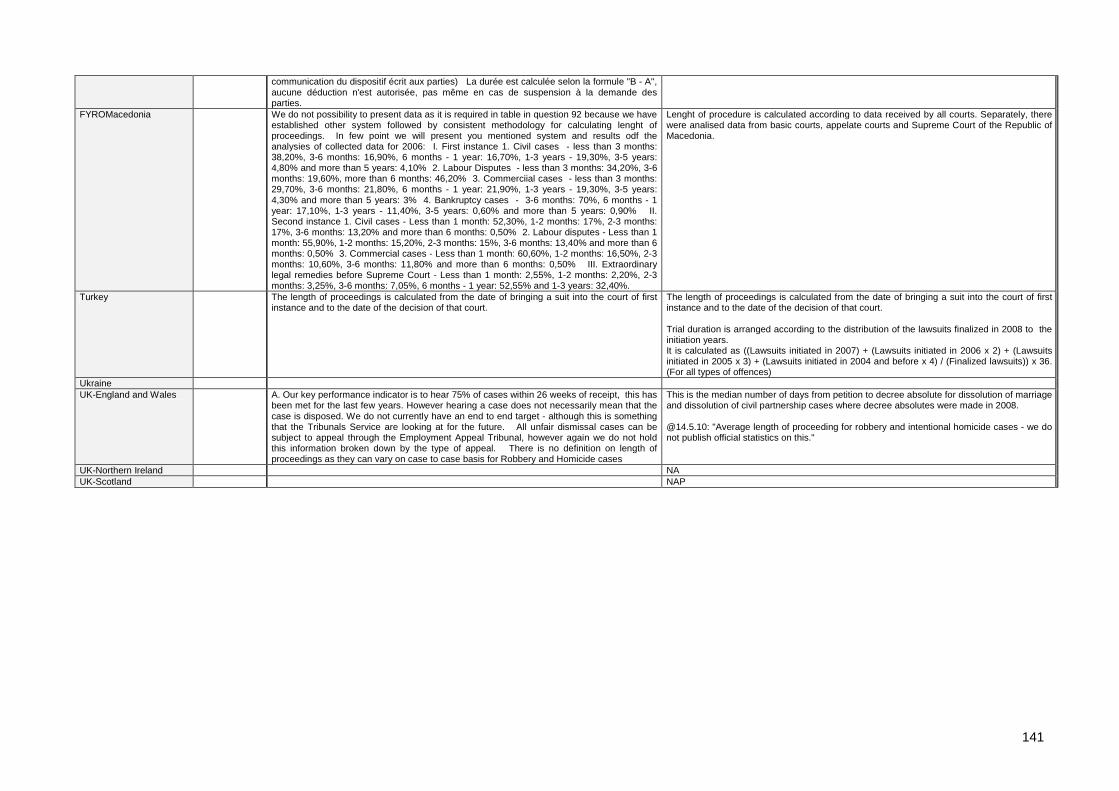
141
communication du dispositif écrit aux parties) La durée est calculée selon la formule "B - A", aucune déduction n'est autorisée, pas même en cas de suspension à la demande des parties.
FYROMacedonia We do not possibility to present data as it is required in table in question 92 because we have established other system followed by consistent methodology for calculating lenght of proceedings. In few point we will present you mentioned system and results odf the analysies of collected data for 2006: I. First instance 1. Civil cases - less than 3 months: 38,20%, 3-6 months: 16,90%, 6 months - 1 year: 16,70%, 1-3 years - 19,30%, 3-5 years: 4,80% and more than 5 years: 4,10% 2. Labour Disputes - less than 3 months: 34,20%, 3-6 months: 19,60%, more than 6 months: 46,20% 3. Commerciial cases - less than 3 months: 29,70%, 3-6 months: 21,80%, 6 months - 1 year: 21,90%, 1-3 years - 19,30%, 3-5 years: 4,30% and more than 5 years: 3% 4. Bankruptcy cases - 3-6 months: 70%, 6 months - 1 year: 17,10%, 1-3 years - 11,40%, 3-5 years: 0,60% and more than 5 years: 0,90% II. Second instance 1. Civil cases - Less than 1 month: 52,30%, 1-2 months: 17%, 2-3 months: 17%, 3-6 months: 13,20% and more than 6 months: 0,50% 2. Labour disputes - Less than 1 month: 55,90%, 1-2 months: 15,20%, 2-3 months: 15%, 3-6 months: 13,40% and more than 6 months: 0,50% 3. Commercial cases - Less than 1 month: 60,60%, 1-2 months: 16,50%, 2-3 months: 10,60%, 3-6 months: 11,80% and more than 6 months: 0,50% III. Extraordinary legal remedies before Supreme Court - Less than 1 month: 2,55%, 1-2 months: 2,20%, 2-3 months: 3,25%, 3-6 months: 7,05%, 6 months - 1 year: 52,55% and 1-3 years: 32,40%.
Lenght of procedure is calculated according to data received by all courts. Separately, there were analised data from basic courts, appelate courts and Supreme Court of the Republic of Macedonia.
Turkey The length of proceedings is calculated from the date of bringing a suit into the court of first instance and to the date of the decision of that court.
The length of proceedings is calculated from the date of bringing a suit into the court of first instance and to the date of the decision of that court. Trial duration is arranged according to the distribution of the lawsuits finalized in 2008 to the initiation years. It is calculated as ((Lawsuits initiated in 2007) + (Lawsuits initiated in 2006 x 2) + (Lawsuits initiated in 2005 x 3) + (Lawsuits initiated in 2004 and before x 4) / (Finalized lawsuits)) x 36. (For all types of offences)
Ukraine UK-England and Wales A. Our key performance indicator is to hear 75% of cases within 26 weeks of receipt, this has
been met for the last few years. However hearing a case does not necessarily mean that the case is disposed. We do not currently have an end to end target - although this is something that the Tribunals Service are looking at for the future. All unfair dismissal cases can be subject to appeal through the Employment Appeal Tribunal, however again we do not hold this information broken down by the type of appeal. There is no definition on length of proceedings as they can vary on case to case basis for Robbery and Homicide cases
This is the median number of days from petition to decree absolute for dissolution of marriage and dissolution of civil partnership cases where decree absolutes were made in 2008. @14.5.10: "Average length of proceeding for robbery and intentional homicide cases - we do not publish official statistics on this."
UK-Northern Ireland NA UK-Scotland NAP

142
Compilation of replies from the member States
concerning the questionnaire on
Lengths of Judicial Proceedings

143
Table of contents
Compilation of replies from the member States ...... ................................................................................ 142 concerning the questionnaire on.................... ........................................................................................... 142 Lengths of Judicial Proceedings .................... ........................................................................................... 142 Table of contents .................................. ....................................................................................................... 143 Albania ............................................ .............................................................................................................. 144 Andorra ............................................ ............................................................................................................. 146 Armenia............................................ ............................................................................................................. 148 Austria............................................ ............................................................................................................... 150 Azerbaijan......................................... ............................................................................................................ 152 Belgium............................................ ............................................................................................................. 154 Bosnia and Herzegovina ............................. ................................................................................................ 156 Bulgaria........................................... .............................................................................................................. 158 Croatia............................................ ............................................................................................................... 160 Cyprus............................................. .............................................................................................................. 162 Czech Republic ..................................... ....................................................................................................... 164 Denmark ............................................ ........................................................................................................... 166 Estonia ............................................ .............................................................................................................. 168 Finland ............................................ .............................................................................................................. 170 France ............................................. .............................................................................................................. 172 FYROMacedonia ...................................... .................................................................................................... 174 Georgia ............................................ ............................................................................................................. 176 Germany ............................................ ........................................................................................................... 178 Greece............................................. .............................................................................................................. 180 Hungary ............................................ ............................................................................................................ 182 Iceland............................................ ............................................................................................................... 184 Ireland ............................................ ............................................................................................................... 186 Italy.............................................. .................................................................................................................. 188 Latvia............................................. ................................................................................................................ 190 Liechtenstein...................................... .......................................................................................................... 192 Lithuania.......................................... ............................................................................................................. 194 Luxembourg ......................................... ........................................................................................................ 196 Malta.............................................. ................................................................................................................ 198 Moldova ............................................ ............................................................................................................ 200 Monaco ............................................. ............................................................................................................ 202 Montenegro ......................................... ......................................................................................................... 204 Netherlands ........................................ .......................................................................................................... 206 Norway............................................. ............................................................................................................. 208 Poland ............................................. .............................................................................................................. 210 Portugal ........................................... ............................................................................................................. 212 Romania............................................ ............................................................................................................ 214 Russian Federation ................................. .................................................................................................... 216 San Marino ......................................... .......................................................................................................... 218 Serbia ............................................. ............................................................................................................... 220 Slovakia ........................................... ............................................................................................................. 222 Slovenia ........................................... ............................................................................................................. 224 Spain .............................................. ............................................................................................................... 226 Sweden ............................................. ............................................................................................................ 228 Switzerland........................................ ........................................................................................................... 230 Turkey ............................................. .............................................................................................................. 232 UK-England and Wales ............................... ................................................................................................ 234 UK-Northern Ireland ................................ .................................................................................................... 236 UK-Scotland ........................................ ......................................................................................................... 238 Ukraine............................................ .............................................................................................................. 240
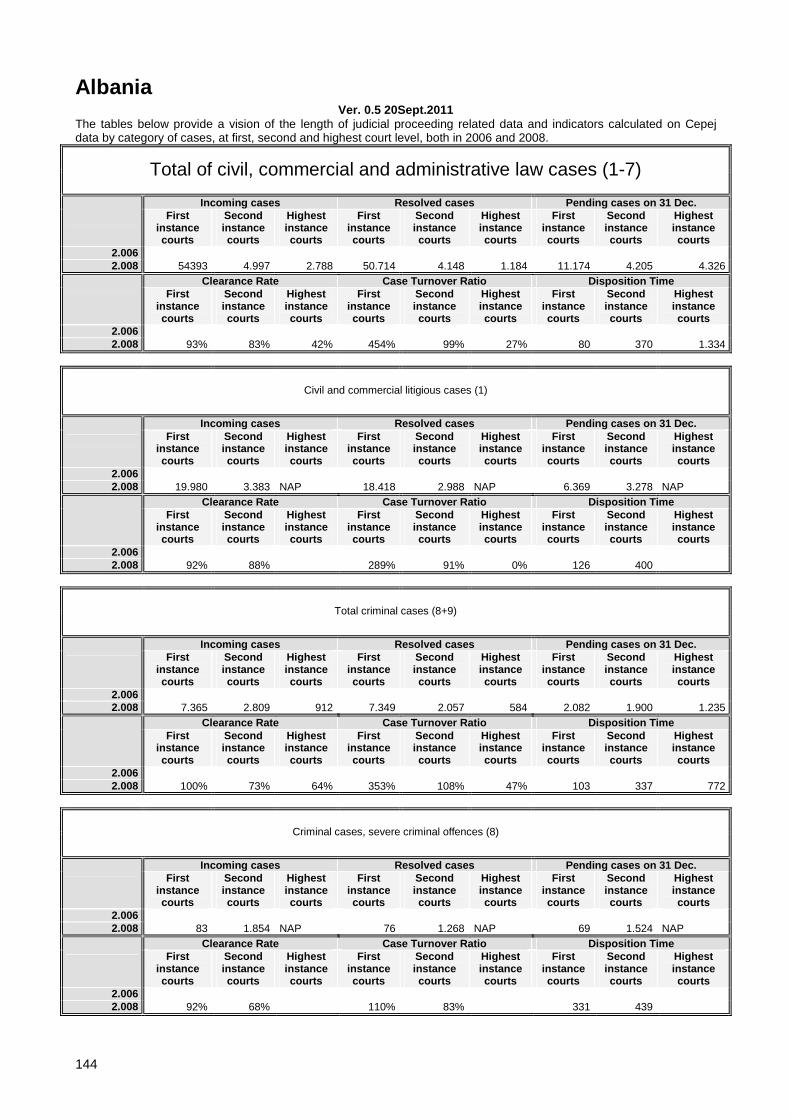
144
Albania Ver. 0.5 20Sept.2011
The tables below provide a vision of the length of judicial proceeding related data and indicators calculated on Cepej data by category of cases, at first, second and highest court level, both in 2006 and 2008.
Total of civil, commercial and administrative law cases (1-7)
Incoming cases Resolved cases Pending cases on 31 Dec.
First instance courts
Second instance courts
Highest instance courts
First instance courts
Second instance courts
Highest instance courts
First instance courts
Second instance courts
Highest instance courts
2.006 2.008 54393 4.997 2.788 50.714 4.148 1.184 11.174 4.205 4.326
Clearance Rate Case Turnover Ratio Disposition Time
First instance courts
Second instance courts
Highest instance courts
First instance courts
Second instance courts
Highest instance courts
First instance courts
Second instance courts
Highest instance courts
2.006 2.008 93% 83% 42% 454% 99% 27% 80 370 1.334
Civil and commercial litigious cases (1)
Incoming cases Resolved cases Pending cases on 31 Dec.
First instance courts
Second instance courts
Highest instance courts
First instance courts
Second instance courts
Highest instance courts
First instance courts
Second instance courts
Highest instance courts
2.006 2.008 19.980 3.383 NAP 18.418 2.988 NAP 6.369 3.278 NAP
Clearance Rate Case Turnover Ratio Disposition Time
First instance courts
Second instance courts
Highest instance courts
First instance courts
Second instance courts
Highest instance courts
First instance courts
Second instance courts
Highest instance courts
2.006 2.008 92% 88% 289% 91% 0% 126 400
Total criminal cases (8+9)
Incoming cases Resolved cases Pending cases on 31 Dec.
First instance courts
Second instance courts
Highest instance courts
First instance courts
Second instance courts
Highest instance courts
First instance courts
Second instance courts
Highest instance courts
2.006 2.008 7.365 2.809 912 7.349 2.057 584 2.082 1.900 1.235
Clearance Rate Case Turnover Ratio Disposition Time
First instance courts
Second instance courts
Highest instance courts
First instance courts
Second instance courts
Highest instance courts
First instance courts
Second instance courts
Highest instance courts
2.006 2.008 100% 73% 64% 353% 108% 47% 103 337 772
Criminal cases, severe criminal offences (8)
Incoming cases Resolved cases Pending cases on 31 Dec.
First instance courts
Second instance courts
Highest instance courts
First instance courts
Second instance courts
Highest instance courts
First instance courts
Second instance courts
Highest instance courts
2.006 2.008 83 1.854 NAP 76 1.268 NAP 69 1.524 NAP
Clearance Rate Case Turnover Ratio Disposition Time
First instance courts
Second instance courts
Highest instance courts
First instance courts
Second instance courts
Highest instance courts
First instance courts
Second instance courts
Highest instance courts
2.006 2.008 92% 68% 110% 83% 331 439

145
Albania
Litigious divorce cases
1st instance (average length)
2nd instance (average length)
Total procedure (average total length)
2.004 120
2.006
2.008 73 246 319
Employment dismissal cases
1st instance (average length)
2nd instance (average length)
Total procedure (average total length)
2.004
2.006
2.008 153 588 741
Robbery cases
1st instance (average length)
2nd instance (average length)
Total procedure (average total length)
2.004 60 60
2.006
2.008 73 365 438
Intentional homicide
1st instance (average length)
2nd instance (average length)
Total procedure (average total length)
2.004
2.006
2.008 246 258 504

146
Andorra Ver. 0.5 20Sept.2011
The tables below provide a vision of the length of judicial proceeding related data and indicators calculated on Cepej data by category of cases, at first, second and highest court level, both in 2006 and 2008.
Total of civil, commercial and administrative law cases (1-7)
Incoming cases Resolved cases Pending cases on 31 Dec.
First instance courts
Second instance courts
Highest instance courts
First instance courts
Second instance courts
Highest instance courts
First instance courts
Second instance courts
Highest instance courts
2.006 3321 372 3.266 267 3.354 2.008 5735 491 5.242 544 4.000 199
Clearance Rate Case Turnover Ratio Disposition Time
First instance courts
Second instance courts
Highest instance courts
First instance courts
Second instance courts
Highest instance courts
First instance courts
Second instance courts
Highest instance courts
2.006 98% 72% 97% 375 2.008 91% 111% 131% 273% 279 134
Civil and commercial litigious cases (1)
Incoming cases Resolved cases Pending cases on 31 Dec.
First instance courts
Second instance courts
Highest instance courts
First instance courts
Second instance courts
Highest instance courts
First instance courts
Second instance courts
Highest instance courts
2.006 1.321 1.177 1.765 2.008 3.255 NA 3.129 NA 1.175 NA
Clearance Rate Case Turnover Ratio Disposition Time
First instance courts
Second instance courts
Highest instance courts
First instance courts
Second instance courts
Highest instance courts
First instance courts
Second instance courts
Highest instance courts
2.006 89% 67% 547 2.008 96% 266% 137
Total criminal cases (8+9)
Incoming cases Resolved cases Pending cases on 31 Dec.
First instance courts
Second instance courts
Highest instance courts
First instance courts
Second instance courts
Highest instance courts
First instance courts
Second instance courts
Highest instance courts
2.006 2.008 4.590 75 4.781 56 771 30
Clearance Rate Case Turnover Ratio Disposition Time
First instance courts
Second instance courts
Highest instance courts
First instance courts
Second instance courts
Highest instance courts
First instance courts
Second instance courts
Highest instance courts
2.006 2.008 104% 75% 620% 187% 59 196
Criminal cases, severe criminal offences (8)
Incoming cases Resolved cases Pending cases on 31 Dec.
First instance courts
Second instance courts
Highest instance courts
First instance courts
Second instance courts
Highest instance courts
First instance courts
Second instance courts
Highest instance courts
2.006 188 51 228 45 200 14 2.008 257 49 301 37 208 19
Clearance Rate Case Turnover Ratio Disposition Time
First instance courts
Second instance courts
Highest instance courts
First instance courts
Second instance courts
Highest instance courts
First instance courts
Second instance courts
Highest instance courts
2.006 121% 88% 114% 321% 320 114 2.008 117% 76% 145% 195% 252 187

147
Andorra
Litigious divorce cases
1st instance (average length)
2nd instance (average length)
Total procedure (average total length)
2.004
2.006
2.008
Employment dismissal cases
1st instance (average length)
2nd instance (average length)
Total procedure (average total length)
2.004
2.006
2.008
Robbery cases
1st instance (average length)
2nd instance (average length)
Total procedure (average total length)
2.004
2.006
2.008
Intentional homicide
1st instance (average length)
2nd instance (average length)
Total procedure (average total length)
2.004
2.006
2.008

148
Armenia Ver. 0.5 20Sept.2011
The tables below provide a vision of the length of judicial proceeding related data and indicators calculated on Cepej data by category of cases, at first, second and highest court level, both in 2006 and 2008.
Total of civil, commercial and administrative law cases (1-7)
Incoming cases Resolved cases Pending cases on 31 Dec.
First instance courts
Second instance courts
Highest instance courts
First instance courts
Second instance courts
Highest instance courts
First instance courts
Second instance courts
Highest instance courts
2.006 39218 5.474 1.805 43.611 3.549 1.785 5.788 1.678 45 2.008 40942 2.913 1.069 33.176 3.140 1.068 13.378 630 1
Clearance Rate Case Turnover Ratio Disposition Time
First instance courts
Second instance courts
Highest instance courts
First instance courts
Second instance courts
Highest instance courts
First instance courts
Second instance courts
Highest instance courts
2.006 111% 65% 99% 753% 212% 3967% 48 173 9 2.008 81% 108% 100% 248% 498% 106800% 147 73 0,3
Civil and commercial litigious cases (1)
Incoming cases Resolved cases Pending cases on 31 Dec.
First instance courts
Second instance courts
Highest instance courts
First instance courts
Second instance courts
Highest instance courts
First instance courts
Second instance courts
Highest instance courts
2.006 2.008 31.373 2.913 846 26.991 3.140 845 9.994 630 1
Clearance Rate Case Turnover Ratio Disposition Time
First instance courts
Second instance courts
Highest instance courts
First instance courts
Second instance courts
Highest instance courts
First instance courts
Second instance courts
Highest instance courts
2.006 2.008 86% 108% 100% 270% 498% 84500% 135 73 0,4
Total criminal cases (8+9)
Incoming cases Resolved cases Pending cases on 31 Dec.
First instance courts
Second instance courts
Highest instance courts
First instance courts
Second instance courts
Highest instance courts
First instance courts
Second instance courts
Highest instance courts
2.006 3.421 653 352 3.396 663 344 544 47 19 2.008 2.994 1.573 88 2.575 1.316 76 589 274 12
Clearance Rate Case Turnover Ratio Disposition Time
First instance courts
Second instance courts
Highest instance courts
First instance courts
Second instance courts
Highest instance courts
First instance courts
Second instance courts
Highest instance courts
2.006 99% 102% 98% 624% 1411% 1811% 58 26 20 2.008 86% 84% 86% 437% 480% 633% 83 76 58
Criminal cases, severe criminal offences (8)
Incoming cases Resolved cases Pending cases on 31 Dec.
First instance courts
Second instance courts
Highest instance courts
First instance courts
Second instance courts
Highest instance courts
First instance courts
Second instance courts
Highest instance courts
2.006 2.008 1.321 1.055 266
Clearance Rate Case Turnover Ratio Disposition Time
First instance courts
Second instance courts
Highest instance courts
First instance courts
Second instance courts
Highest instance courts
First instance courts
Second instance courts
Highest instance courts
2.006 2.008 80% 397% 92

149
Armenia
Litigious divorce cases
1st instance (average length)
2nd instance (average length)
Total procedure (average total length)
2.004 55 40 2.006 2.008
Employment dismissal cases
1st instance (average length)
2nd instance (average length)
Total procedure (average total length)
2.004 35 2.006 2.008
Robbery cases
1st instance (average length)
2nd instance (average length)
Total procedure (average total length)
2.004 2.006 2.008
Intentional homicide
1st instance (average length)
2nd instance (average length)
Total procedure (average total length)
2.004 2.006 2.008

150
Austria Ver. 0.5 20Sept.2011
The tables below provide a vision of the length of judicial proceeding related data and indicators calculated on Cepej data by category of cases, at first, second and highest court level, both in 2006 and 2008.
Total of civil, commercial and administrative law cases (1-7)
Incoming cases Resolved cases Pending cases on 31 Dec.
First instance courts
Second instance courts
Highest instance courts
First instance courts
Second instance courts
Highest instance courts
First instance courts
Second instance courts
Highest instance courts
2.006 966929 35.391 2.914 969.836 35.410 2.947 205.534 6.234 838 2.008 3625816 34.251 2.857 3.635.938 33.777 2.882 528.771 6.791 827
Clearance Rate Case Turnover Ratio Disposition Time
First instance courts
Second instance courts
Highest instance courts
First instance courts
Second instance courts
Highest instance courts
First instance courts
Second instance courts
Highest instance courts
2.006 100% 100% 101% 472% 568% 352% 77 64 104 2.008 100% 99% 101% 688% 497% 348% 53 73 105
Civil and commercial litigious cases (1)
Incoming cases Resolved cases Pending cases on 31 Dec.
First instance courts
Second instance courts
Highest instance courts
First instance courts
Second instance courts
Highest instance courts
First instance courts
Second instance courts
Highest instance courts
2.006 113.774 110.302 40.732 2.008 110.497 NA NA 111.245 NA NA 39.227 NA NA
Clearance Rate Case Turnover Ratio Disposition Time
First instance courts
Second instance courts
Highest instance courts
First instance courts
Second instance courts
Highest instance courts
First instance courts
Second instance courts
Highest instance courts
2.006 97% 271% 135 2.008 101% 284% 129
Total criminal cases (8+9)
Incoming cases Resolved cases Pending cases on 31 Dec.
First instance courts
Second instance courts
Highest instance courts
First instance courts
Second instance courts
Highest instance courts
First instance courts
Second instance courts
Highest instance courts
2.006 86.144 9.399 719 87.857 9.509 721 26.838 1.013 179 2.008 59.812 11.628 942 65.538 11.173 936 20.405 1.477 213
Clearance Rate Case Turnover Ratio Disposition Time
First instance courts
Second instance courts
Highest instance courts
First instance courts
Second instance courts
Highest instance courts
First instance courts
Second instance courts
Highest instance courts
2.006 102% 101% 100% 327% 939% 403% 111 39 91 2.008 110% 96% 99% 321% 756% 439% 114 48 83
Criminal cases, severe criminal offences (8)
Incoming cases Resolved cases Pending cases on 31 Dec.
First instance courts
Second instance courts
Highest instance courts
First instance courts
Second instance courts
Highest instance courts
First instance courts
Second instance courts
Highest instance courts
2.006 26.989 6.726 26.969 6.728 6.124 539 2.008 24.782 8.943 NA 24.630 8.404 NA 6.429 1.065 NA
Clearance Rate Case Turnover Ratio Disposition Time
First instance courts
Second instance courts
Highest instance courts
First instance courts
Second instance courts
Highest instance courts
First instance courts
Second instance courts
Highest instance courts
2.006 100% 100% 440% 1248% 83 29 2.008 99% 94% 383% 789% 95 46

151
Austria
Litigious divorce cases
1st instance (average length)
2nd instance (average length)
Total procedure (average total length)
2.004 2.006 183 2.008 180 NA NA
Employment dismissal cases
1st instance (average length)
2nd instance (average length)
Total procedure (average total length)
2.004 2.006 177 2.008 171 NA NA
Robbery cases
1st instance (average length)
2nd instance (average length)
Total procedure (average total length)
2.004 2.006 2.008 NA NA NA
Intentional homicide
1st instance (average length)
2nd instance (average length)
Total procedure (average total length)
2.004 2.006 2.008 NA NA NA

152
Azerbaijan Ver. 0.5 20Sept.2011
The tables below provide a vision of the length of judicial proceeding related data and indicators calculated on Cepej data by category of cases, at first, second and highest court level, both in 2006 and 2008.
Total of civil, commercial and administrative law cases (1-7)
Incoming cases Resolved cases Pending cases on 31 Dec.
First instance courts
Second instance courts
Highest instance courts
First instance courts
Second instance courts
Highest instance courts
First instance courts
Second instance courts
Highest instance courts
2.006 9.211 3.272 8.918 3.366 1.301 334 2.008 NAP NAP NAP NAP NAP NAP NAP NAP NAP
Clearance Rate Case Turnover Ratio Disposition Time
First instance courts
Second instance courts
Highest instance courts
First instance courts
Second instance courts
Highest instance courts
First instance courts
Second instance courts
Highest instance courts
2.006 97% 103% 685% 1008% 53 36 2.008
Civil and commercial litigious cases (1)
Incoming cases Resolved cases Pending cases on 31 Dec.
First instance courts
Second instance courts
Highest instance courts
First instance courts
Second instance courts
Highest instance courts
First instance courts
Second instance courts
Highest instance courts
2.006 55.431 54.612 6.225 2.008 70.593 9.210 70.119 7.018 8.157 1.432
Clearance Rate Case Turnover Ratio Disposition Time
First instance courts
Second instance courts
Highest instance courts
First instance courts
Second instance courts
Highest instance courts
First instance courts
Second instance courts
Highest instance courts
2.006 99% 877% 42 2.008 99% 76% 860% 490% 42 74
Total criminal cases (8+9)
Incoming cases Resolved cases Pending cases on 31 Dec.
First instance courts
Second instance courts
Highest instance courts
First instance courts
Second instance courts
Highest instance courts
First instance courts
Second instance courts
Highest instance courts
2.006 13.649 2.242 754 11.715 2.199 778 1.656 195 39 2.008 14.910 2.241 972 14.930 2.158 760 1.494 175 134
Clearance Rate Case Turnover Ratio Disposition Time
First instance courts
Second instance courts
Highest instance courts
First instance courts
Second instance courts
Highest instance courts
First instance courts
Second instance courts
Highest instance courts
2.006 86% 98% 103% 707% 1128% 1995% 52 32 18 2.008 100% 96% 78% 999% 1233% 567% 37 30 64
Criminal cases, severe criminal offences (8)
Incoming cases Resolved cases Pending cases on 31 Dec.
First instance courts
Second instance courts
Highest instance courts
First instance courts
Second instance courts
Highest instance courts
First instance courts
Second instance courts
Highest instance courts
2.006 1.394 640 274 2.008 1.752 700 NA NA NA NA NA NA NA
Clearance Rate Case Turnover Ratio Disposition Time
First instance courts
Second instance courts
Highest instance courts
First instance courts
Second instance courts
Highest instance courts
First instance courts
Second instance courts
Highest instance courts
2.006 2.008
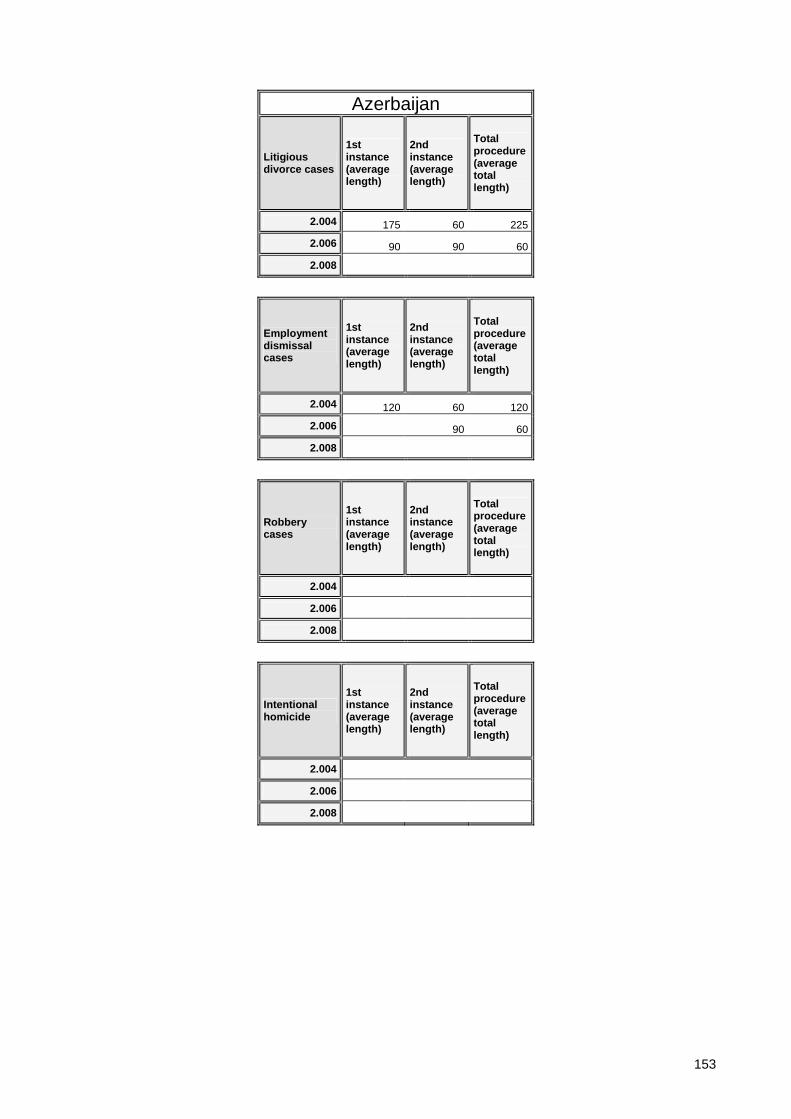
153
Azerbaijan
Litigious divorce cases
1st instance (average length)
2nd instance (average length)
Total procedure (average total length)
2.004 175 60 225
2.006 90 90 60
2.008
Employment dismissal cases
1st instance (average length)
2nd instance (average length)
Total procedure (average total length)
2.004 120 60 120
2.006 90 60
2.008
Robbery cases
1st instance (average length)
2nd instance (average length)
Total procedure (average total length)
2.004
2.006
2.008
Intentional homicide
1st instance (average length)
2nd instance (average length)
Total procedure (average total length)
2.004
2.006
2.008

154
Belgium Ver. 0.5 20Sept.2011
The tables below provide a vision of the length of judicial proceeding related data and indicators calculated on Cepej data by category of cases, at first, second and highest court level, both in 2006 and 2008.
Total of civil, commercial and administrative law cases (1-7)
Incoming cases Resolved cases Pending cases on 31 Dec.
First instance courts
Second instance courts
Highest instance courts
First instance courts
Second instance courts
Highest instance courts
First instance courts
Second instance courts
Highest instance courts
2.006 NA NA 2.957 NA NA 2.953 NA NA 1.646 2.008 NA NA 877 NA NA 924 NA NA 1.119
Clearance Rate Case Turnover Ratio Disposition Time
First instance courts
Second instance courts
Highest instance courts
First instance courts
Second instance courts
Highest instance courts
First instance courts
Second instance courts
Highest instance courts
2.006 100% 179% 203 2.008 105% 83% 442
Civil and commercial litigious cases (1)
Incoming cases Resolved cases Pending cases on 31 Dec.
First instance courts
Second instance courts
Highest instance courts
First instance courts
Second instance courts
Highest instance courts
First instance courts
Second instance courts
Highest instance courts
2.006 317.290 32.822 NA NA NA NA 2.008 661.149 29.758 NA NA NA NA NA NA NA
Clearance Rate Case Turnover Ratio Disposition Time
First instance courts
Second instance courts
Highest instance courts
First instance courts
Second instance courts
Highest instance courts
First instance courts
Second instance courts
Highest instance courts
2.006 2.008
Total criminal cases (8+9)
Incoming cases Resolved cases Pending cases on 31 Dec.
First instance courts
Second instance courts
Highest instance courts
First instance courts
Second instance courts
Highest instance courts
First instance courts
Second instance courts
Highest instance courts
2.006 NA NA 1.697 304.020 NA 1.722 NA NA 414 2.008 NA 16.716 1.939 318.017 16.134 1.834 NA 11765* 549
Clearance Rate Case Turnover Ratio Disposition Time
First instance courts
Second instance courts
Highest instance courts
First instance courts
Second instance courts
Highest instance courts
First instance courts
Second instance courts
Highest instance courts
2.006 101% 416% 88 2.008 97% 95% 334% 109
Criminal cases, severe criminal offences (8)
Incoming cases Resolved cases Pending cases on 31 Dec.
First instance courts
Second instance courts
Highest instance courts
First instance courts
Second instance courts
Highest instance courts
First instance courts
Second instance courts
Highest instance courts
2.006 42.330 NA 47.436 NA NA NA 2.008 44.015 7.466 NA 46.072 7.507 NA 9.719 8.664 NA
Clearance Rate Case Turnover Ratio Disposition Time
First instance courts
Second instance courts
Highest instance courts
First instance courts
Second instance courts
Highest instance courts
First instance courts
Second instance courts
Highest instance courts
2.006 112% 2.008 105% 101% 474% 87% 77 421

155
Belgium
Litigious divorce cases
1st instance (average length)
2nd instance (average length)
Total procedure (average total length)
2.004 2.006 NA 564 NA 2.008 NA 479 NA
Employment dismissal cases
1st instance (average length)
2nd instance (average length)
Total procedure (average total length)
2.004 2.006 NA NA NA 2.008 NA NA NA
Robbery cases
1st instance (average length)
2nd instance (average length)
Total procedure (average total length)
2.004 2.006 NA 2.008 NA 277 NA
Intentional homicide
1st instance (average length)
2nd instance (average length)
Total procedure (average total length)
2.004 2.006 NA 2.008 NA 364 NA
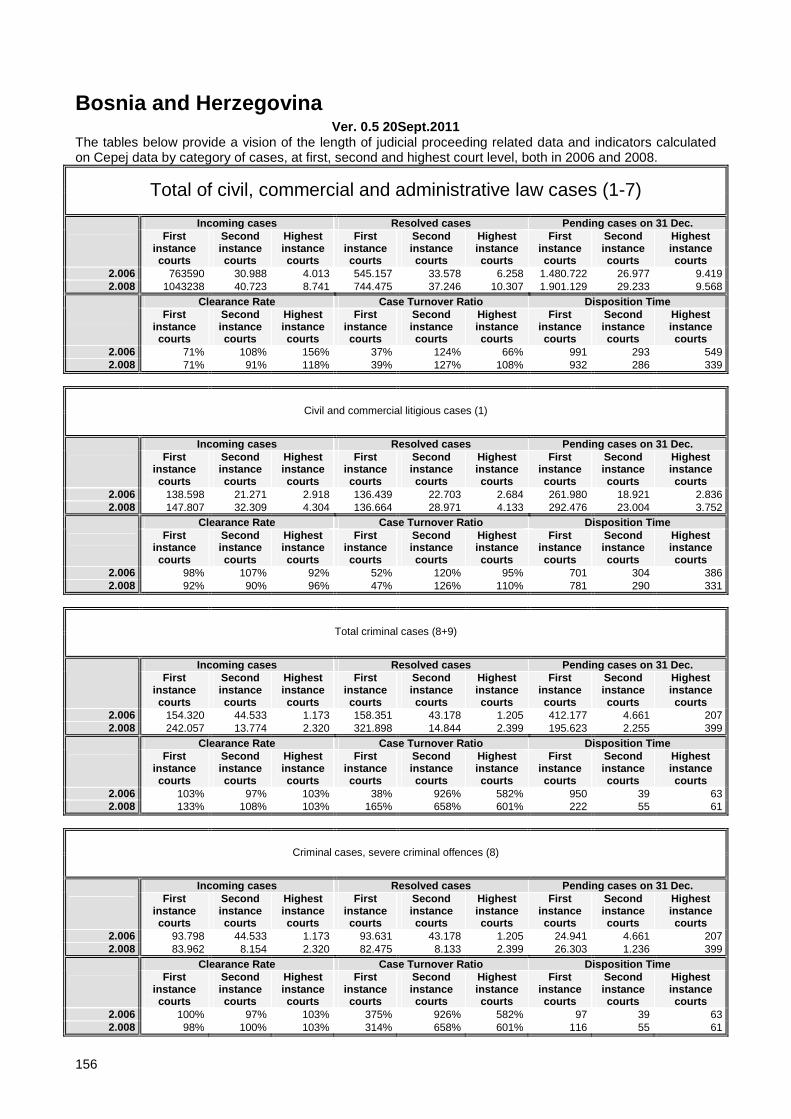
156
Bosnia and Herzegovina Ver. 0.5 20Sept.2011
The tables below provide a vision of the length of judicial proceeding related data and indicators calculated on Cepej data by category of cases, at first, second and highest court level, both in 2006 and 2008.
Total of civil, commercial and administrative law cases (1-7)
Incoming cases Resolved cases Pending cases on 31 Dec.
First instance courts
Second instance courts
Highest instance courts
First instance courts
Second instance courts
Highest instance courts
First instance courts
Second instance courts
Highest instance courts
2.006 763590 30.988 4.013 545.157 33.578 6.258 1.480.722 26.977 9.419 2.008 1043238 40.723 8.741 744.475 37.246 10.307 1.901.129 29.233 9.568
Clearance Rate Case Turnover Ratio Disposition Time
First instance courts
Second instance courts
Highest instance courts
First instance courts
Second instance courts
Highest instance courts
First instance courts
Second instance courts
Highest instance courts
2.006 71% 108% 156% 37% 124% 66% 991 293 549 2.008 71% 91% 118% 39% 127% 108% 932 286 339
Civil and commercial litigious cases (1)
Incoming cases Resolved cases Pending cases on 31 Dec.
First instance courts
Second instance courts
Highest instance courts
First instance courts
Second instance courts
Highest instance courts
First instance courts
Second instance courts
Highest instance courts
2.006 138.598 21.271 2.918 136.439 22.703 2.684 261.980 18.921 2.836 2.008 147.807 32.309 4.304 136.664 28.971 4.133 292.476 23.004 3.752
Clearance Rate Case Turnover Ratio Disposition Time
First instance courts
Second instance courts
Highest instance courts
First instance courts
Second instance courts
Highest instance courts
First instance courts
Second instance courts
Highest instance courts
2.006 98% 107% 92% 52% 120% 95% 701 304 386 2.008 92% 90% 96% 47% 126% 110% 781 290 331
Total criminal cases (8+9)
Incoming cases Resolved cases Pending cases on 31 Dec.
First instance courts
Second instance courts
Highest instance courts
First instance courts
Second instance courts
Highest instance courts
First instance courts
Second instance courts
Highest instance courts
2.006 154.320 44.533 1.173 158.351 43.178 1.205 412.177 4.661 207 2.008 242.057 13.774 2.320 321.898 14.844 2.399 195.623 2.255 399
Clearance Rate Case Turnover Ratio Disposition Time
First instance courts
Second instance courts
Highest instance courts
First instance courts
Second instance courts
Highest instance courts
First instance courts
Second instance courts
Highest instance courts
2.006 103% 97% 103% 38% 926% 582% 950 39 63 2.008 133% 108% 103% 165% 658% 601% 222 55 61
Criminal cases, severe criminal offences (8)
Incoming cases Resolved cases Pending cases on 31 Dec.
First instance courts
Second instance courts
Highest instance courts
First instance courts
Second instance courts
Highest instance courts
First instance courts
Second instance courts
Highest instance courts
2.006 93.798 44.533 1.173 93.631 43.178 1.205 24.941 4.661 207 2.008 83.962 8.154 2.320 82.475 8.133 2.399 26.303 1.236 399
Clearance Rate Case Turnover Ratio Disposition Time
First instance courts
Second instance courts
Highest instance courts
First instance courts
Second instance courts
Highest instance courts
First instance courts
Second instance courts
Highest instance courts
2.006 100% 97% 103% 375% 926% 582% 97 39 63 2.008 98% 100% 103% 314% 658% 601% 116 55 61

157
Bosnia and Herzegovina
Litigious divorce cases
1st instance (average length)
2nd instance (average length)
Total procedure (average total length)
2.004 2.006 2.008 329 98 214
Employment dismissal cases
1st instance (average length)
2nd instance (average length)
Total procedure (average total length)
2.004 2.006 2.008 313 144 229
Robbery cases
1st instance (average length)
2nd instance (average length)
Total procedure (average total length)
2.004 2.006 2.008
Intentional homicide
1st instance (average length)
2nd instance (average length)
Total procedure (average total length)
2.004 2.006 2.008
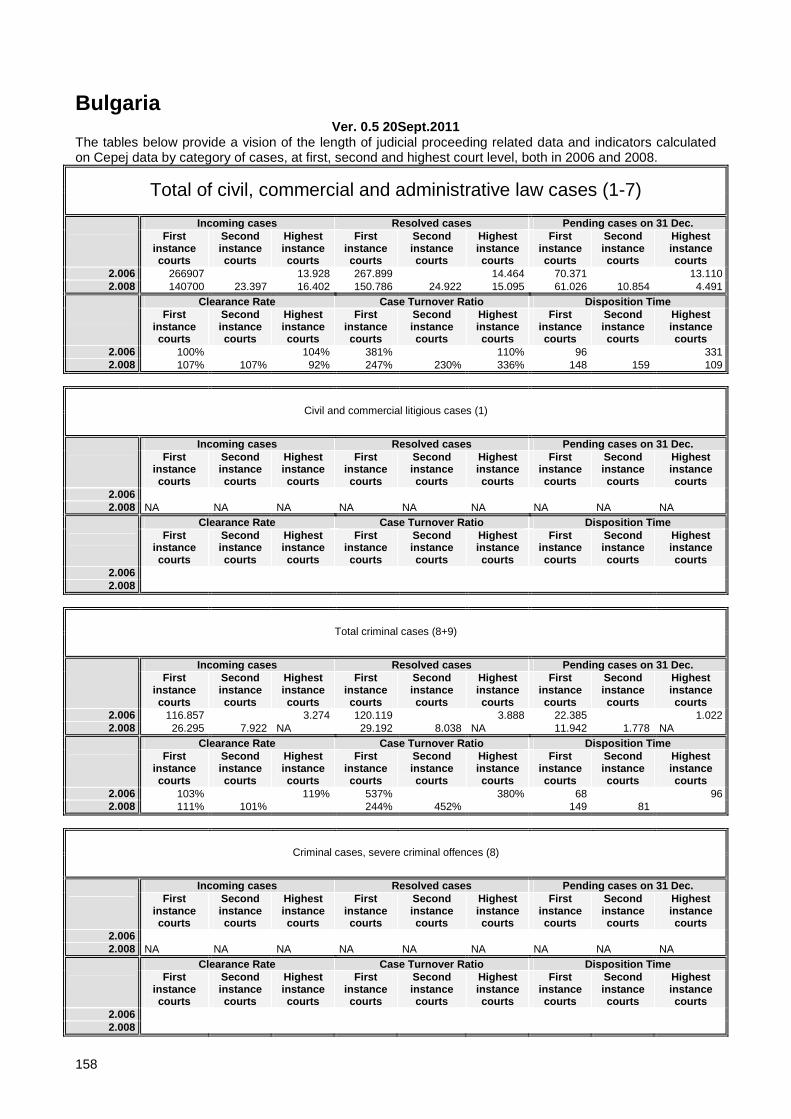
158
Bulgaria Ver. 0.5 20Sept.2011
The tables below provide a vision of the length of judicial proceeding related data and indicators calculated on Cepej data by category of cases, at first, second and highest court level, both in 2006 and 2008.
Total of civil, commercial and administrative law cases (1-7)
Incoming cases Resolved cases Pending cases on 31 Dec.
First instance courts
Second instance courts
Highest instance courts
First instance courts
Second instance courts
Highest instance courts
First instance courts
Second instance courts
Highest instance courts
2.006 266907 13.928 267.899 14.464 70.371 13.110 2.008 140700 23.397 16.402 150.786 24.922 15.095 61.026 10.854 4.491
Clearance Rate Case Turnover Ratio Disposition Time
First instance courts
Second instance courts
Highest instance courts
First instance courts
Second instance courts
Highest instance courts
First instance courts
Second instance courts
Highest instance courts
2.006 100% 104% 381% 110% 96 331 2.008 107% 107% 92% 247% 230% 336% 148 159 109
Civil and commercial litigious cases (1)
Incoming cases Resolved cases Pending cases on 31 Dec.
First instance courts
Second instance courts
Highest instance courts
First instance courts
Second instance courts
Highest instance courts
First instance courts
Second instance courts
Highest instance courts
2.006 2.008 NA NA NA NA NA NA NA NA NA
Clearance Rate Case Turnover Ratio Disposition Time
First instance courts
Second instance courts
Highest instance courts
First instance courts
Second instance courts
Highest instance courts
First instance courts
Second instance courts
Highest instance courts
2.006 2.008
Total criminal cases (8+9)
Incoming cases Resolved cases Pending cases on 31 Dec.
First instance courts
Second instance courts
Highest instance courts
First instance courts
Second instance courts
Highest instance courts
First instance courts
Second instance courts
Highest instance courts
2.006 116.857 3.274 120.119 3.888 22.385 1.022 2.008 26.295 7.922 NA 29.192 8.038 NA 11.942 1.778 NA
Clearance Rate Case Turnover Ratio Disposition Time
First instance courts
Second instance courts
Highest instance courts
First instance courts
Second instance courts
Highest instance courts
First instance courts
Second instance courts
Highest instance courts
2.006 103% 119% 537% 380% 68 96 2.008 111% 101% 244% 452% 149 81
Criminal cases, severe criminal offences (8)
Incoming cases Resolved cases Pending cases on 31 Dec.
First instance courts
Second instance courts
Highest instance courts
First instance courts
Second instance courts
Highest instance courts
First instance courts
Second instance courts
Highest instance courts
2.006 2.008 NA NA NA NA NA NA NA NA NA
Clearance Rate Case Turnover Ratio Disposition Time
First instance courts
Second instance courts
Highest instance courts
First instance courts
Second instance courts
Highest instance courts
First instance courts
Second instance courts
Highest instance courts
2.006 2.008

159
Bulgaria
Litigious divorce cases
1st instance (average length)
2nd instance (average length)
Total procedure (average total length)
2.004
2.006
2.008 NA NA NA
Employment dismissal cases
1st instance (average length)
2nd instance (average length)
Total procedure (average total length)
2.004
2.006
2.008 NA NA NA
Robbery cases
1st instance (average length)
2nd instance (average length)
Total procedure (average total length)
2.004
2.006
2.008 NA NA NA
Intentional homicide
1st instance (average length)
2nd instance (average length)
Total procedure (average total length)
2.004
2.006
2.008 NA NA NA

160
Croatia Ver. 0.5 20Sept.2011
The tables below provide a vision of the length of judicial proceeding related data and indicators calculated on Cepej data by category of cases, at first, second and highest court level, both in 2006 and 2008.
Total of civil, commercial and administrative law cases (1-7)
Incoming cases Resolved cases Pending cases on 31 Dec.
First instance courts
Second instance courts
Highest instance courts
First instance courts
Second instance courts
Highest instance courts
First instance courts
Second instance courts
Highest instance courts
2.006 1157377 83.177 2.408 1.589.727 70.083 2.745 576.920 56.569 693 2.008 1104436 81.089 2.672 1.136.502 78.372 1.958 471.529 59.595 1.711
Clearance Rate Case Turnover Ratio Disposition Time
First instance courts
Second instance courts
Highest instance courts
First instance courts
Second instance courts
Highest instance courts
First instance courts
Second instance courts
Highest instance courts
2.006 137% 84% 114% 276% 124% 396% 132 295 92 2.008 103% 97% 73% 241% 132% 114% 151 278 319
Civil and commercial litigious cases (1)
Incoming cases Resolved cases Pending cases on 31 Dec.
First instance courts
Second instance courts
Highest instance courts
First instance courts
Second instance courts
Highest instance courts
First instance courts
Second instance courts
Highest instance courts
2.006 133.421 80.430 2.382 148.134 67.410 2.721 217.778 55.381 688 2.008 140.283 81.098 2.625 145.069 78.372 1.929 198.067 59.595 1.676
Clearance Rate Case Turnover Ratio Disposition Time
First instance courts
Second instance courts
Highest instance courts
First instance courts
Second instance courts
Highest instance courts
First instance courts
Second instance courts
Highest instance courts
2.006 111% 84% 114% 68% 122% 395% 537 300 92 2.008 103% 97% 73% 73% 132% 115% 498 278 317
Total criminal cases (8+9)
Incoming cases Resolved cases Pending cases on 31 Dec.
First instance courts
Second instance courts
Highest instance courts
First instance courts
Second instance courts
Highest instance courts
First instance courts
Second instance courts
Highest instance courts
2.006 507.089 77.353 747 530.550 31.917 740 308.817 89.053 258 2.008 365.311 62.002 999 400.684 80.895 1.082 262.632 81.889 209
Clearance Rate Case Turnover Ratio Disposition Time
First instance courts
Second instance courts
Highest instance courts
First instance courts
Second instance courts
Highest instance courts
First instance courts
Second instance courts
Highest instance courts
2.006 105% 41% 99% 172% 36% 287% 212 1.018 127 2.008 110% 130% 108% 153% 99% 518% 239 369 71
Criminal cases, severe criminal offences (8)
Incoming cases Resolved cases Pending cases on 31 Dec.
First instance courts
Second instance courts
Highest instance courts
First instance courts
Second instance courts
Highest instance courts
First instance courts
Second instance courts
Highest instance courts
2.006 88.092 13.197 747 89.296 12.214 740 45.489 4.617 258 2.008 41.012 9.394 999 43.438 9.459 1.082 35.586 1.794 209
Clearance Rate Case Turnover Ratio Disposition Time
First instance courts
Second instance courts
Highest instance courts
First instance courts
Second instance courts
Highest instance courts
First instance courts
Second instance courts
Highest instance courts
2.006 101% 93% 99% 196% 265% 287% 186 138 127 2.008 106% 101% 108% 122% 527% 518% 299 69 71

161
Croatia
Litigious divorce cases
1st instance (average length)
2nd instance (average length)
Total procedure (average total length)
2.004
2.006
2.008 NA NA NA
Employment dismissal cases
1st instance (average length)
2nd instance (average length)
Total procedure (average total length)
2.004
2.006
2.008 NA NA NA
Robbery cases
1st instance (average length)
2nd instance (average length)
Total procedure (average total length)
2.004
2.006
2.008 NA NA NA
Intentional homicide
1st instance (average length)
2nd instance (average length)
Total procedure (average total length)
2.004
2.006
2.008 NA NA NA

162
Cyprus Ver. 0.5 20Sept.2011
The tables below provide a vision of the length of judicial proceeding related data and indicators calculated on Cepej data by category of cases, at first, second and highest court level, both in 2006 and 2008.
Total of civil, commercial and administrative law cases (1-7)
Incoming cases Resolved cases Pending cases on 31 Dec.
First instance courts
Second instance courts
Highest instance courts
First instance courts
Second instance courts
Highest instance courts
First instance courts
Second instance courts
Highest instance courts
2.006 2.008 22639 222 25.407 145 29.436 524
Clearance Rate Case Turnover Ratio Disposition Time
First instance courts
Second instance courts
Highest instance courts
First instance courts
Second instance courts
Highest instance courts
First instance courts
Second instance courts
Highest instance courts
2.006 2.008 112% 65% 86% 28% 423 1.319
Civil and commercial litigious cases (1)
Incoming cases Resolved cases Pending cases on 31 Dec.
First instance courts
Second instance courts
Highest instance courts
First instance courts
Second instance courts
Highest instance courts
First instance courts
Second instance courts
Highest instance courts
2.006 27.114 433 16296* 342 30.008 719 2.008
Clearance Rate Case Turnover Ratio Disposition Time
First instance courts
Second instance courts
Highest instance courts
First instance courts
Second instance courts
Highest instance courts
First instance courts
Second instance courts
Highest instance courts
2.006 79% 48% 767 2.008
Total criminal cases (8+9)
Incoming cases Resolved cases Pending cases on 31 Dec.
First instance courts
Second instance courts
Highest instance courts
First instance courts
Second instance courts
Highest instance courts
First instance courts
Second instance courts
Highest instance courts
2.006 101.002 288 55.447 258 46.643 226 2.008 93.170 93.202 52.758
Clearance Rate Case Turnover Ratio Disposition Time
First instance courts
Second instance courts
Highest instance courts
First instance courts
Second instance courts
Highest instance courts
First instance courts
Second instance courts
Highest instance courts
2.006 55% 90% 119% 114% 307 320 2.008 100% 177% 207
Criminal cases, severe criminal offences (8)
Incoming cases Resolved cases Pending cases on 31 Dec.
First instance courts
Second instance courts
Highest instance courts
First instance courts
Second instance courts
Highest instance courts
First instance courts
Second instance courts
Highest instance courts
2.006 2.008
Clearance Rate Case Turnover Ratio Disposition Time
First instance courts
Second instance courts
Highest instance courts
First instance courts
Second instance courts
Highest instance courts
First instance courts
Second instance courts
Highest instance courts
2.006 2.008

163
Cyprus
Litigious divorce cases
1st instance (average length)
2nd instance (average length)
Total procedure (average total length)
2.004 365 365 730 2.006 2.008
Employment dismissal cases
1st instance (average length)
2nd instance (average length)
Total procedure (average total length)
2.004 665 365 665 2.006 2.008
Robbery cases
1st instance (average length)
2nd instance (average length)
Total procedure (average total length)
2.004 2.006 2.008
Intentional homicide
1st instance (average length)
2nd instance (average length)
Total procedure (average total length)
2.004 2.006 2.008

164
Czech Republic Ver. 0.5 20Sept.2011
The tables below provide a vision of the length of judicial proceeding related data and indicators calculated on Cepej data by category of cases, at first, second and highest court level, both in 2006 and 2008.
Total of civil, commercial and administrative law cases (1-7)
Incoming cases Resolved cases Pending cases on 31 Dec.
First instance courts
Second instance courts
Highest instance courts
First instance courts
Second instance courts
Highest instance courts
First instance courts
Second instance courts
Highest instance courts
2.006 1339889 70.963 11.700 1.353.285 69.977 10.731 331.216 17.177 6.789 2.008 1454606 72.788 10.137 1.457.268 73.488 9.938 669.252 17.086 6.986
Clearance Rate Case Turnover Ratio Disposition Time
First instance courts
Second instance courts
Highest instance courts
First instance courts
Second instance courts
Highest instance courts
First instance courts
Second instance courts
Highest instance courts
2.006 101% 99% 92% 409% 407% 158% 89 90 231 2.008 100% 101% 98% 218% 430% 142% 168 85 257
Civil and commercial litigious cases (1)
Incoming cases Resolved cases Pending cases on 31 Dec.
First instance courts
Second instance courts
Highest instance courts
First instance courts
Second instance courts
Highest instance courts
First instance courts
Second instance courts
Highest instance courts
2.006 327.964 7.507 332.478 6.002 164.694 4.091 2.008 360.945 6.510 368.048 6.066 155.472 5.654
Clearance Rate Case Turnover Ratio Disposition Time
First instance courts
Second instance courts
Highest instance courts
First instance courts
Second instance courts
Highest instance courts
First instance courts
Second instance courts
Highest instance courts
2.006 101% 80% 202% 147% 181 249 2.008 102% 93% 237% 107% 154 340
Total criminal cases (8+9)
Incoming cases Resolved cases Pending cases on 31 Dec.
First instance courts
Second instance courts
Highest instance courts
First instance courts
Second instance courts
Highest instance courts
First instance courts
Second instance courts
Highest instance courts
2.006 100.233 13.545 2.351 101.252 13.584 2.350 24.304 1.574 199 2.008 103.329 15.263 105.367 13.392 20.958 1.444
Clearance Rate Case Turnover Ratio Disposition Time
First instance courts
Second instance courts
Highest instance courts
First instance courts
Second instance courts
Highest instance courts
First instance courts
Second instance courts
Highest instance courts
2.006 101% 100% 100% 417% 863% 12 88 42 31 2.008 102% 88% 503% 927% 73 39
Criminal cases, severe criminal offences (8)
Incoming cases Resolved cases Pending cases on 31 Dec.
First instance courts
Second instance courts
Highest instance courts
First instance courts
Second instance courts
Highest instance courts
First instance courts
Second instance courts
Highest instance courts
2.006 - - - - - 0 2.008 NA 2.718 NA 2.619 NA 304
Clearance Rate Case Turnover Ratio Disposition Time
First instance courts
Second instance courts
Highest instance courts
First instance courts
Second instance courts
Highest instance courts
First instance courts
Second instance courts
Highest instance courts
2.006 2.008 96% 862% 42

165
Czech Republic
Litigious divorce cases
1st instance (average length)
2nd instance (average length)
Total procedure (average
total length)
2.004 228 55 284
2.006 - - 602
2.008 NA NA NA
Employment dismissal
cases
1st instance (average length)
2nd instance (average length)
Total procedure (average
total length)
2.004 628 138 628
2.006 - - 284
2.008 NA NA 1009
Robbery cases
1st instance (average length)
2nd instance (average length)
Total procedure (average
total length)
2.004 373 52 409
2.006 362 436 206,5
2.008 344 443 349
Intentional homicide
1st instance (average length)
2nd instance (average length)
Total procedure (average
total length)
2.004 210 53 285
2.006 289 289 161,5
2.008 227 NA 227
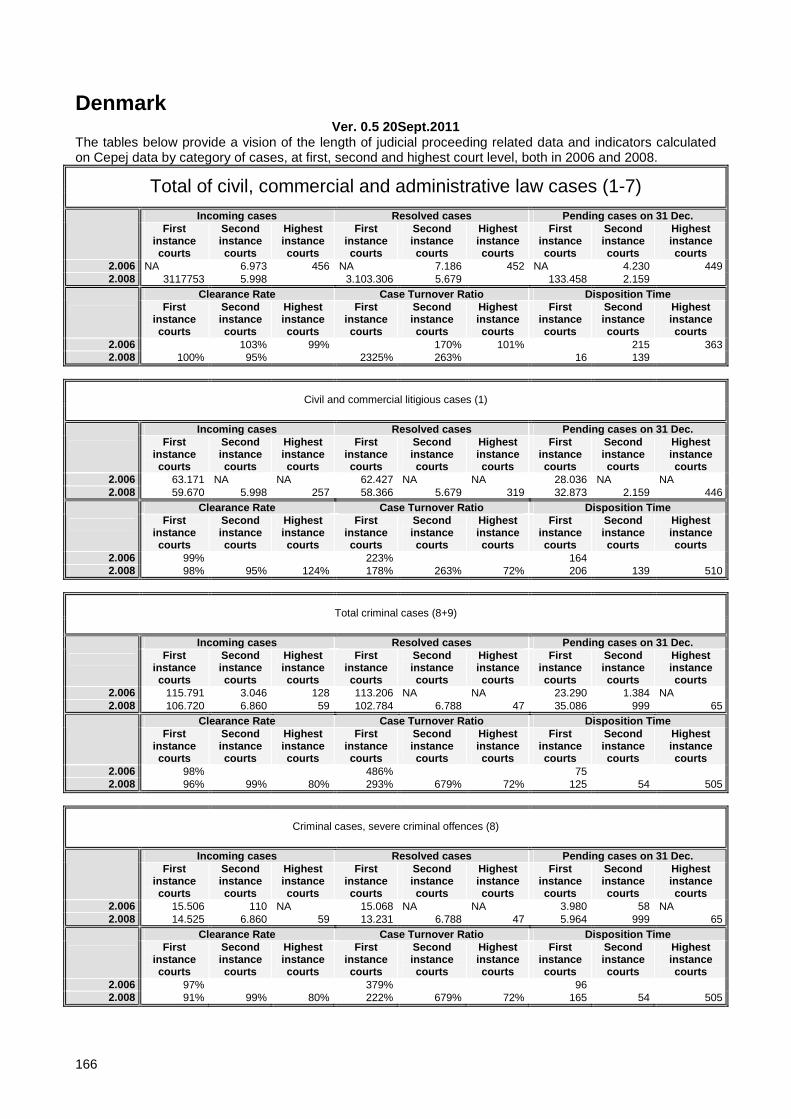
166
Denmark Ver. 0.5 20Sept.2011
The tables below provide a vision of the length of judicial proceeding related data and indicators calculated on Cepej data by category of cases, at first, second and highest court level, both in 2006 and 2008.
Total of civil, commercial and administrative law cases (1-7)
Incoming cases Resolved cases Pending cases on 31 Dec.
First instance courts
Second instance courts
Highest instance courts
First instance courts
Second instance courts
Highest instance courts
First instance courts
Second instance courts
Highest instance courts
2.006 NA 6.973 456 NA 7.186 452 NA 4.230 449 2.008 3117753 5.998 3.103.306 5.679 133.458 2.159
Clearance Rate Case Turnover Ratio Disposition Time
First instance courts
Second instance courts
Highest instance courts
First instance courts
Second instance courts
Highest instance courts
First instance courts
Second instance courts
Highest instance courts
2.006 103% 99% 170% 101% 215 363 2.008 100% 95% 2325% 263% 16 139
Civil and commercial litigious cases (1)
Incoming cases Resolved cases Pending cases on 31 Dec.
First instance courts
Second instance courts
Highest instance courts
First instance courts
Second instance courts
Highest instance courts
First instance courts
Second instance courts
Highest instance courts
2.006 63.171 NA NA 62.427 NA NA 28.036 NA NA 2.008 59.670 5.998 257 58.366 5.679 319 32.873 2.159 446
Clearance Rate Case Turnover Ratio Disposition Time
First instance courts
Second instance courts
Highest instance courts
First instance courts
Second instance courts
Highest instance courts
First instance courts
Second instance courts
Highest instance courts
2.006 99% 223% 164 2.008 98% 95% 124% 178% 263% 72% 206 139 510
Total criminal cases (8+9)
Incoming cases Resolved cases Pending cases on 31 Dec.
First instance courts
Second instance courts
Highest instance courts
First instance courts
Second instance courts
Highest instance courts
First instance courts
Second instance courts
Highest instance courts
2.006 115.791 3.046 128 113.206 NA NA 23.290 1.384 NA 2.008 106.720 6.860 59 102.784 6.788 47 35.086 999 65
Clearance Rate Case Turnover Ratio Disposition Time
First instance courts
Second instance courts
Highest instance courts
First instance courts
Second instance courts
Highest instance courts
First instance courts
Second instance courts
Highest instance courts
2.006 98% 486% 75 2.008 96% 99% 80% 293% 679% 72% 125 54 505
Criminal cases, severe criminal offences (8)
Incoming cases Resolved cases Pending cases on 31 Dec.
First instance courts
Second instance courts
Highest instance courts
First instance courts
Second instance courts
Highest instance courts
First instance courts
Second instance courts
Highest instance courts
2.006 15.506 110 NA 15.068 NA NA 3.980 58 NA 2.008 14.525 6.860 59 13.231 6.788 47 5.964 999 65
Clearance Rate Case Turnover Ratio Disposition Time
First instance courts
Second instance courts
Highest instance courts
First instance courts
Second instance courts
Highest instance courts
First instance courts
Second instance courts
Highest instance courts
2.006 97% 379% 96 2.008 91% 99% 80% 222% 679% 72% 165 54 505

167
Denmark
Litigious divorce cases
1st instance (average length)
2nd instance (average length)
Total procedure (average total length)
2.004 100 2.006 90 90 180 2.008 153 90 240
Employment dismissal cases
1st instance (average length)
2nd instance (average length)
Total procedure (average total length)
2.004 2.006 2.008
Robbery cases
1st instance (average length)
2nd instance (average length)
Total procedure (average total length)
2.004 2.006 2.008
Intentional homicide
1st instance (average length)
2nd instance (average length)
Total procedure (average total length)
2.004 2.006 2.008

168
Estonia Ver. 0.5 20Sept.2011
The tables below provide a vision of the length of judicial proceeding related data and indicators calculated on Cepej data by category of cases, at first, second and highest court level, both in 2006 and 2008.
Total of civil, commercial and administrative law cases (1-7)
Incoming cases Resolved cases Pending cases on 31 Dec.
First instance courts
Second instance courts
Highest instance courts
First instance courts
Second instance courts
Highest instance courts
First instance courts
Second instance courts
Highest instance courts
2.006 33619 3.171 266 34.901 3.075 249 20.564 930 54 2.008 279192 3.869 283 259.078 3.559 251 94.275 1.384 86
Clearance Rate Case Turnover Ratio Disposition Time
First instance courts
Second instance courts
Highest instance courts
First instance courts
Second instance courts
Highest instance courts
First instance courts
Second instance courts
Highest instance courts
2.006 104% 97% 94% 170% 331% 461% 215 110 79 2.008 93% 92% 89% 275% 257% 292% 133 142 125
Civil and commercial litigious cases (1)
Incoming cases Resolved cases Pending cases on 31 Dec.
First instance courts
Second instance courts
Highest instance courts
First instance courts
Second instance courts
Highest instance courts
First instance courts
Second instance courts
Highest instance courts
2.006 25.943 NA 161 28.118 NA 153 NA NA 32 2.008 19.778 1.803 158 19.630 1.588 145 12.466 788 34
Clearance Rate Case Turnover Ratio Disposition Time
First instance courts
Second instance courts
Highest instance courts
First instance courts
Second instance courts
Highest instance courts
First instance courts
Second instance courts
Highest instance courts
2.006 108% 95% 478% 76 2.008 99% 88% 92% 157% 202% 426% 232 181 86
Total criminal cases (8+9)
Incoming cases Resolved cases Pending cases on 31 Dec.
First instance courts
Second instance courts
Highest instance courts
First instance courts
Second instance courts
Highest instance courts
First instance courts
Second instance courts
Highest instance courts
2.006 16.538 1.947 134 13.940 1.862 132 4.070 134 25 2.008 33.550 2.311 96 32.080 2.251 91 4.582 142 26
Clearance Rate Case Turnover Ratio Disposition Time
First instance courts
Second instance courts
Highest instance courts
First instance courts
Second instance courts
Highest instance courts
First instance courts
Second instance courts
Highest instance courts
2.006 84% 96% 99% 343% 1390% 528% 107 26 69 2.008 96% 97% 95% 700% 1585% 350% 52 23 104
Criminal cases, severe criminal offences (8)
Incoming cases Resolved cases Pending cases on 31 Dec.
First instance courts
Second instance courts
Highest instance courts
First instance courts
Second instance courts
Highest instance courts
First instance courts
Second instance courts
Highest instance courts
2.006 10.687 1.778 80 9.353 1.708 74 2.418 127 22 2.008 19.984 2.143 51 19.768 2.087 49 983 135 17
Clearance Rate Case Turnover Ratio Disposition Time
First instance courts
Second instance courts
Highest instance courts
First instance courts
Second instance courts
Highest instance courts
First instance courts
Second instance courts
Highest instance courts
2.006 88% 96% 93% 387% 1345% 336% 94 27 109 2.008 99% 97% 96% 2011% 1546% 288% 18 24 127

169
Estonia
Litigious divorce cases
1st instance (average length)
2nd instance (average length)
Total procedure (average total length)
2.004 2.006 2.008 91 30 90
Employment dismissal cases
1st instance (average length)
2nd instance (average length)
Total procedure (average total length)
2.004 2.006 2.008 387 150 553
Robbery cases
1st instance (average length)
2nd instance (average length)
Total procedure (average total length)
2.004 2.006 2.008 113 141 254
Intentional homicide
1st instance (average length)
2nd instance (average length)
Total procedure (average total length)
2.004 2.006 2.008 275 289 478

170
Finland Ver. 0.5 20Sept.2011
The tables below provide a vision of the length of judicial proceeding related data and indicators calculated on Cepej data by category of cases, at first, second and highest court level, both in 2006 and 2008.
Total of civil, commercial and administrative law cases (1-7)
Incoming cases Resolved cases Pending cases on 31 Dec.
First instance courts
Second instance courts
Highest instance courts
First instance courts
Second instance courts
Highest instance courts
First instance courts
Second instance courts
Highest instance courts
2.006 750936 3.666 5.465 741.361 3.976 5.991 100.597 2.387 3.490 2.008 642751 3.918 5.999 635.813 3.890 5.399 100.217 1.917 4.162
Clearance Rate Case Turnover Ratio Disposition Time
First instance courts
Second instance courts
Highest instance courts
First instance courts
Second instance courts
Highest instance courts
First instance courts
Second instance courts
Highest instance courts
2.006 99% 108% 110% 737% 167% 172% 50 219 213 2.008 99% 99% 90% 634% 203% 130% 58 180 281
Civil and commercial litigious cases (1)
Incoming cases Resolved cases Pending cases on 31 Dec.
First instance courts
Second instance courts
Highest instance courts
First instance courts
Second instance courts
Highest instance courts
First instance courts
Second instance courts
Highest instance courts
2.006 9.200 2.749 1.010 9.072 3.047 1.124 5.368 2.143 324 2.008 9.703 2.790 985 9.399 2.802 987 5.929 1.626 367
Clearance Rate Case Turnover Ratio Disposition Time
First instance courts
Second instance courts
Highest instance courts
First instance courts
Second instance courts
Highest instance courts
First instance courts
Second instance courts
Highest instance courts
2.006 99% 111% 111% 169% 142% 347% 216 257 105 2.008 97% 100% 100% 159% 172% 269% 230 212 136
Total criminal cases (8+9)
Incoming cases Resolved cases Pending cases on 31 Dec.
First instance courts
Second instance courts
Highest instance courts
First instance courts
Second instance courts
Highest instance courts
First instance courts
Second instance courts
Highest instance courts
2.006 62.796 8.188 1.075 63.573 8.437 1.245 15.993 4.505 373 2.008 65.244 11.539 1.220 63.575 11.688 1.210 16.258 3.574 419
Clearance Rate Case Turnover Ratio Disposition Time
First instance courts
Second instance courts
Highest instance courts
First instance courts
Second instance courts
Highest instance courts
First instance courts
Second instance courts
Highest instance courts
2.006 101% 103% 116% 398% 187% 334% 92 195 109 2.008 97% 101% 99% 391% 327% 289% 93 112 126
Criminal cases, severe criminal offences (8)
Incoming cases Resolved cases Pending cases on 31 Dec.
First instance courts
Second instance courts
Highest instance courts
First instance courts
Second instance courts
Highest instance courts
First instance courts
Second instance courts
Highest instance courts
2.006 2.008 NAP NAP NAP NAP NAP NAP NAP NAP NAP
Clearance Rate Case Turnover Ratio Disposition Time
First instance courts
Second instance courts
Highest instance courts
First instance courts
Second instance courts
Highest instance courts
First instance courts
Second instance courts
Highest instance courts
2.006 2.008

171
Finland
Litigious divorce cases
1st instance (average length)
2nd instance (average length)
Total procedure (average total length)
2.004 240 240 2.006 243 243 2.008 243 243
Employment dismissal cases
1st instance (average length)
2nd instance (average length)
Total procedure (average total length)
2.004 380 2.006 249 410 476 2.008 249 366 0
Robbery cases
1st instance (average length)
2nd instance (average length)
Total procedure (average total length)
2.004 147 215 2.006 147 249 360 2.008 129 264
Intentional homicide
1st instance (average length)
2nd instance (average length)
Total procedure (average total length)
2.004 126 272 2.006 90 185 342 2.008 93 216
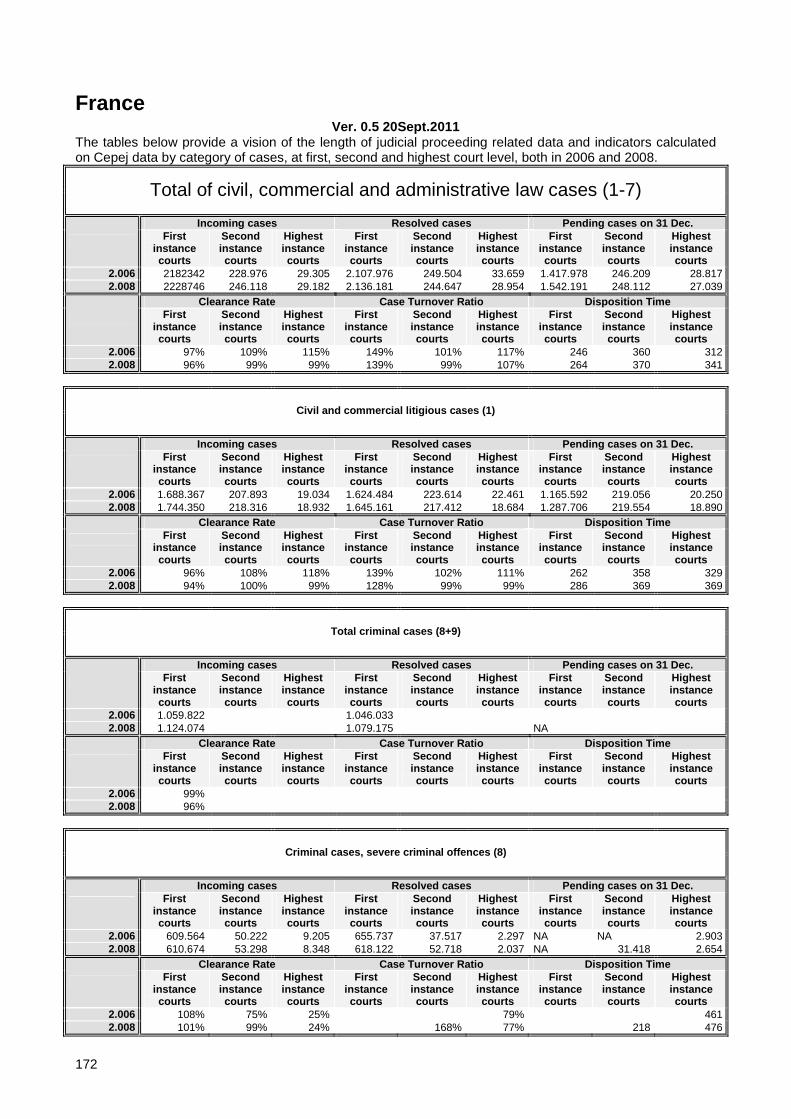
172
France Ver. 0.5 20Sept.2011
The tables below provide a vision of the length of judicial proceeding related data and indicators calculated on Cepej data by category of cases, at first, second and highest court level, both in 2006 and 2008.
Total of civil, commercial and administrative law cases (1-7)
Incoming cases Resolved cases Pending cases on 31 Dec.
First instance courts
Second instance courts
Highest instance courts
First instance courts
Second instance courts
Highest instance courts
First instance courts
Second instance courts
Highest instance courts
2.006 2182342 228.976 29.305 2.107.976 249.504 33.659 1.417.978 246.209 28.817 2.008 2228746 246.118 29.182 2.136.181 244.647 28.954 1.542.191 248.112 27.039
Clearance Rate Case Turnover Ratio Disposition Time
First instance courts
Second instance courts
Highest instance courts
First instance courts
Second instance courts
Highest instance courts
First instance courts
Second instance courts
Highest instance courts
2.006 97% 109% 115% 149% 101% 117% 246 360 312 2.008 96% 99% 99% 139% 99% 107% 264 370 341
Civil and commercial litigious cases (1)
Incoming cases Resolved cases Pending cases on 31 Dec.
First instance courts
Second instance courts
Highest instance courts
First instance courts
Second instance courts
Highest instance courts
First instance courts
Second instance courts
Highest instance courts
2.006 1.688.367 207.893 19.034 1.624.484 223.614 22.461 1.165.592 219.056 20.250 2.008 1.744.350 218.316 18.932 1.645.161 217.412 18.684 1.287.706 219.554 18.890
Clearance Rate Case Turnover Ratio Disposition Time
First instance courts
Second instance courts
Highest instance courts
First instance courts
Second instance courts
Highest instance courts
First instance courts
Second instance courts
Highest instance courts
2.006 96% 108% 118% 139% 102% 111% 262 358 329 2.008 94% 100% 99% 128% 99% 99% 286 369 369
Total criminal cases (8+9)
Incoming cases Resolved cases Pending cases on 31 Dec.
First instance courts
Second instance courts
Highest instance courts
First instance courts
Second instance courts
Highest instance courts
First instance courts
Second instance courts
Highest instance courts
2.006 1.059.822 1.046.033 2.008 1.124.074 1.079.175 NA
Clearance Rate Case Turnover Ratio Disposition Time
First instance courts
Second instance courts
Highest instance courts
First instance courts
Second instance courts
Highest instance courts
First instance courts
Second instance courts
Highest instance courts
2.006 99% 2.008 96%
Criminal cases, severe criminal offences (8)
Incoming cases Resolved cases Pending cases on 31 Dec.
First instance courts
Second instance courts
Highest instance courts
First instance courts
Second instance courts
Highest instance courts
First instance courts
Second instance courts
Highest instance courts
2.006 609.564 50.222 9.205 655.737 37.517 2.297 NA NA 2.903 2.008 610.674 53.298 8.348 618.122 52.718 2.037 NA 31.418 2.654
Clearance Rate Case Turnover Ratio Disposition Time
First instance courts
Second instance courts
Highest instance courts
First instance courts
Second instance courts
Highest instance courts
First instance courts
Second instance courts
Highest instance courts
2.006 108% 75% 25% 79% 461 2.008 101% 99% 24% 168% 77% 218 476

173
France
Litigious divorce cases
1st instance (average length)
2nd instance (average length)
Total procedure (average total length)
2.004 423 441 465 2.006 477 396 515 2.008 564 393 595
Employment dismissal cases
1st instance (average length)
2nd instance (average length)
Total procedure (average total length)
2.004 668 537 668 2.006 369 423 515 2.008 476 433 568
Robbery cases
1st instance (average length)
2nd instance (average length)
Total procedure (average total length)
2.004 240 552 2.006 267 333 294 2.008 265 284 285
Intentional homicide
1st instance (average length)
2nd instance (average length)
Total procedure (average total length)
2.004 1.179 2.006 1077 501 1149 2.008 NA NA NA
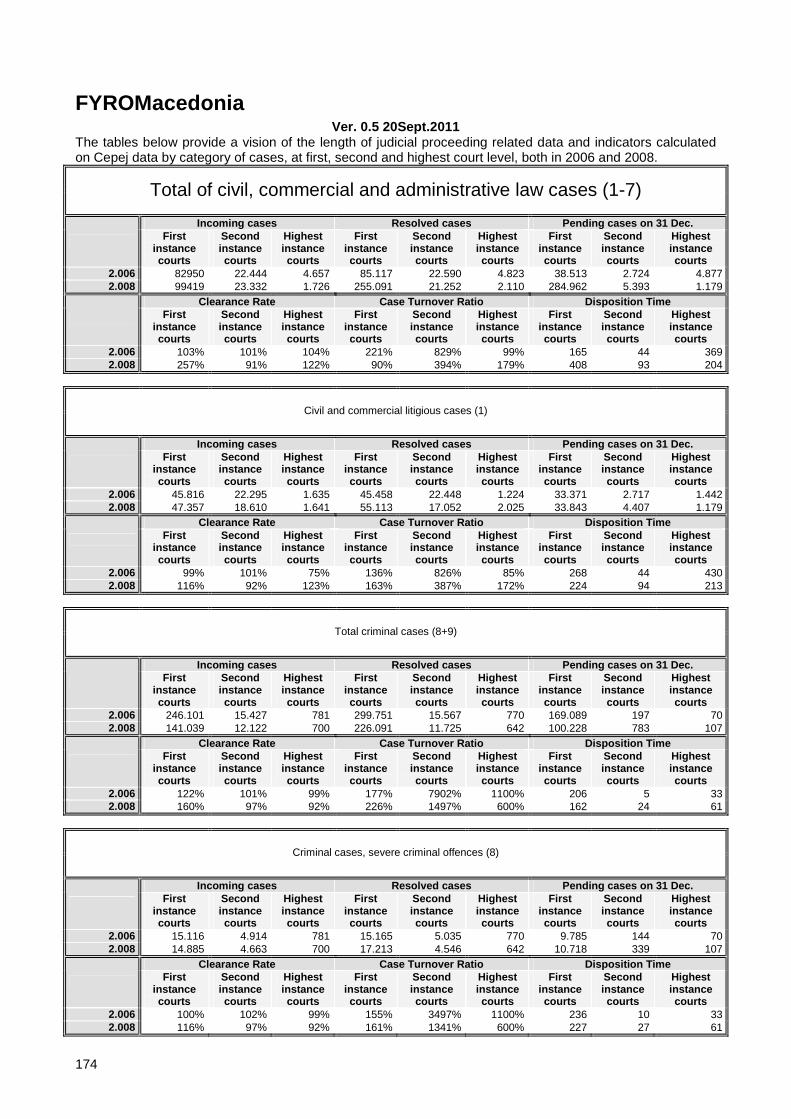
174
FYROMacedonia Ver. 0.5 20Sept.2011
The tables below provide a vision of the length of judicial proceeding related data and indicators calculated on Cepej data by category of cases, at first, second and highest court level, both in 2006 and 2008.
Total of civil, commercial and administrative law cases (1-7)
Incoming cases Resolved cases Pending cases on 31 Dec.
First instance courts
Second instance courts
Highest instance courts
First instance courts
Second instance courts
Highest instance courts
First instance courts
Second instance courts
Highest instance courts
2.006 82950 22.444 4.657 85.117 22.590 4.823 38.513 2.724 4.877 2.008 99419 23.332 1.726 255.091 21.252 2.110 284.962 5.393 1.179
Clearance Rate Case Turnover Ratio Disposition Time
First instance courts
Second instance courts
Highest instance courts
First instance courts
Second instance courts
Highest instance courts
First instance courts
Second instance courts
Highest instance courts
2.006 103% 101% 104% 221% 829% 99% 165 44 369 2.008 257% 91% 122% 90% 394% 179% 408 93 204
Civil and commercial litigious cases (1)
Incoming cases Resolved cases Pending cases on 31 Dec.
First instance courts
Second instance courts
Highest instance courts
First instance courts
Second instance courts
Highest instance courts
First instance courts
Second instance courts
Highest instance courts
2.006 45.816 22.295 1.635 45.458 22.448 1.224 33.371 2.717 1.442 2.008 47.357 18.610 1.641 55.113 17.052 2.025 33.843 4.407 1.179
Clearance Rate Case Turnover Ratio Disposition Time
First instance courts
Second instance courts
Highest instance courts
First instance courts
Second instance courts
Highest instance courts
First instance courts
Second instance courts
Highest instance courts
2.006 99% 101% 75% 136% 826% 85% 268 44 430 2.008 116% 92% 123% 163% 387% 172% 224 94 213
Total criminal cases (8+9)
Incoming cases Resolved cases Pending cases on 31 Dec.
First instance courts
Second instance courts
Highest instance courts
First instance courts
Second instance courts
Highest instance courts
First instance courts
Second instance courts
Highest instance courts
2.006 246.101 15.427 781 299.751 15.567 770 169.089 197 70 2.008 141.039 12.122 700 226.091 11.725 642 100.228 783 107
Clearance Rate Case Turnover Ratio Disposition Time
First instance courts
Second instance courts
Highest instance courts
First instance courts
Second instance courts
Highest instance courts
First instance courts
Second instance courts
Highest instance courts
2.006 122% 101% 99% 177% 7902% 1100% 206 5 33 2.008 160% 97% 92% 226% 1497% 600% 162 24 61
Criminal cases, severe criminal offences (8)
Incoming cases Resolved cases Pending cases on 31 Dec.
First instance courts
Second instance courts
Highest instance courts
First instance courts
Second instance courts
Highest instance courts
First instance courts
Second instance courts
Highest instance courts
2.006 15.116 4.914 781 15.165 5.035 770 9.785 144 70 2.008 14.885 4.663 700 17.213 4.546 642 10.718 339 107
Clearance Rate Case Turnover Ratio Disposition Time
First instance courts
Second instance courts
Highest instance courts
First instance courts
Second instance courts
Highest instance courts
First instance courts
Second instance courts
Highest instance courts
2.006 100% 102% 99% 155% 3497% 1100% 236 10 33 2.008 116% 97% 92% 161% 1341% 600% 227 27 61

175
FYROMacedonia
Litigious divorce cases
1st instance (average length)
2nd instance (average length)
Total procedure (average total length)
2.004
2.006
2.008 136 47 199
Employment dismissal cases
1st instance (average length)
2nd instance (average length)
Total procedure (average total length)
2.004
2.006
2.008 176 53 229
Robbery cases
1st instance (average length)
2nd instance (average length)
Total procedure (average total length)
2.004
2.006
2.008 182 45 227
Intentional homicide
1st instance (average length)
2nd instance (average length)
Total procedure (average total length)
2.004
2.006
2.008 184 49 233

176
Georgia Ver. 0.5 20Sept.2011
The tables below provide a vision of the length of judicial proceeding related data and indicators calculated on Cepej data by category of cases, at first, second and highest court level, both in 2006 and 2008.
Total of civil, commercial and administrative law cases (1-7)
Incoming cases Resolved cases Pending cases on 31 Dec.
First instance courts
Second instance courts
Highest instance courts
First instance courts
Second instance courts
Highest instance courts
First instance courts
Second instance courts
Highest instance courts
2.006 33908 6.719 1.959 29.633 5.306 2.179 14.729 3.626 788 2.008 57231 6.456 2.830 62.430 8.540 2.494 6.785 1.677 995
Clearance Rate Case Turnover Ratio Disposition Time
First instance courts
Second instance courts
Highest instance courts
First instance courts
Second instance courts
Highest instance courts
First instance courts
Second instance courts
Highest instance courts
2.006 87% 79% 111% 201% 146% 277% 181 249 132 2.008 109% 132% 88% 920% 509% 251% 40 72 146
Civil and commercial litigious cases (1)
Incoming cases Resolved cases Pending cases on 31 Dec.
First instance courts
Second instance courts
Highest instance courts
First instance courts
Second instance courts
Highest instance courts
First instance courts
Second instance courts
Highest instance courts
2.006 21.877 3.122 872 20.299 2.809 1.049 11.995 1.350 348 2.008 9.105 3.124 1.107 12.513 3.760 1.112 4.162 748 283
Clearance Rate Case Turnover Ratio Disposition Time
First instance courts
Second instance courts
Highest instance courts
First instance courts
Second instance courts
Highest instance courts
First instance courts
Second instance courts
Highest instance courts
2.006 93% 90% 120% 169% 208% 301% 216 175 121 2.008 137% 120% 100% 301% 503% 393% 121 73 93
Total criminal cases (8+9)
Incoming cases Resolved cases Pending cases on 31 Dec.
First instance courts
Second instance courts
Highest instance courts
First instance courts
Second instance courts
Highest instance courts
First instance courts
Second instance courts
Highest instance courts
2.006 15.849 3.932 2.008 14.882 3.581 1.160 6.677 750 1.253 2.008 15.184 3.309 1.575 17.978 3.342 2.169 3.921 318 488
Clearance Rate Case Turnover Ratio Disposition Time
First instance courts
Second instance courts
Highest instance courts
First instance courts
Second instance courts
Highest instance courts
First instance courts
Second instance courts
Highest instance courts
2.006 94% 91% 58% 223% 477% 93% 164 76 394 2.008 118% 101% 138% 459% 1051% 444% 80 35 82
Criminal cases, severe criminal offences (8)
Incoming cases Resolved cases Pending cases on 31 Dec.
First instance courts
Second instance courts
Highest instance courts
First instance courts
Second instance courts
Highest instance courts
First instance courts
Second instance courts
Highest instance courts
2.006 2.008 1.986 2.402 553 2.300 2.437 719 664 274 211
Clearance Rate Case Turnover Ratio Disposition Time
First instance courts
Second instance courts
Highest instance courts
First instance courts
Second instance courts
Highest instance courts
First instance courts
Second instance courts
Highest instance courts
2.006 2.008 116% 101% 130% 346% 889% 341% 105 41 107
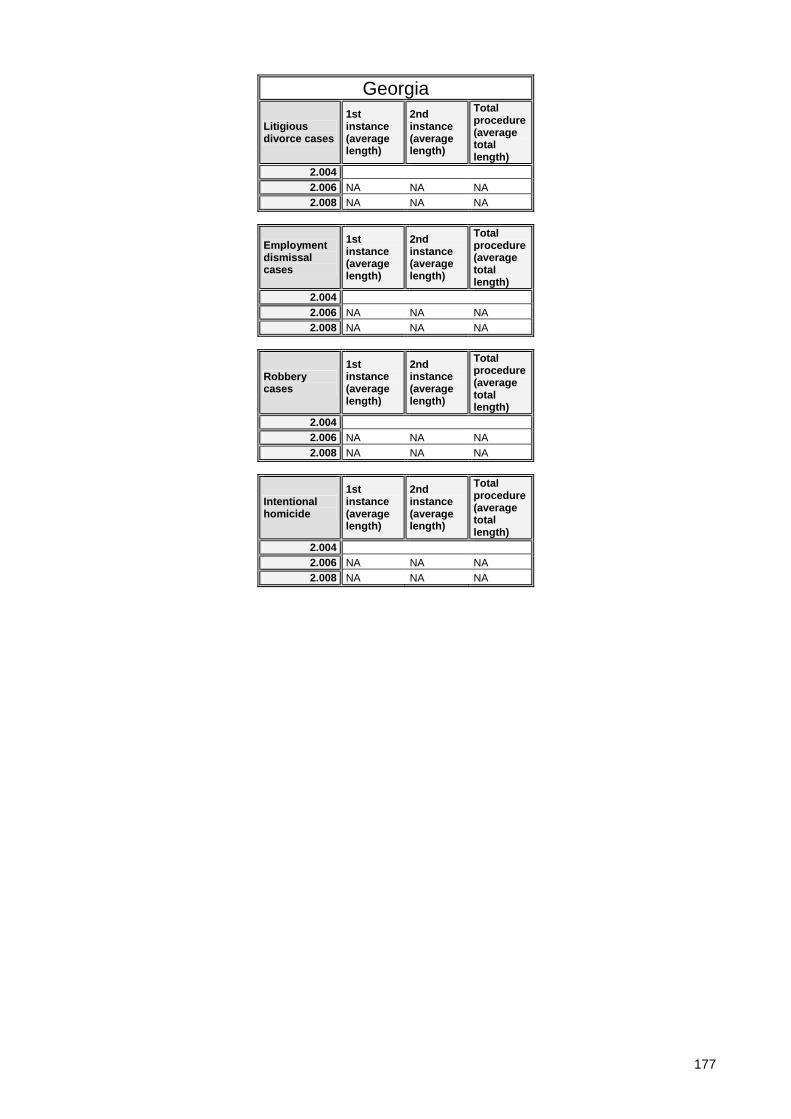
177
Georgia
Litigious divorce cases
1st instance (average length)
2nd instance (average length)
Total procedure (average total length)
2.004 2.006 NA NA NA 2.008 NA NA NA
Employment dismissal cases
1st instance (average length)
2nd instance (average length)
Total procedure (average total length)
2.004 2.006 NA NA NA 2.008 NA NA NA
Robbery cases
1st instance (average length)
2nd instance (average length)
Total procedure (average total length)
2.004 2.006 NA NA NA 2.008 NA NA NA
Intentional homicide
1st instance (average length)
2nd instance (average length)
Total procedure (average total length)
2.004 2.006 NA NA NA 2.008 NA NA NA

178
Germany Ver. 0.5 20Sept.2011
The tables below provide a vision of the length of judicial proceeding related data and indicators calculated on Cepej data by category of cases, at first, second and highest court level, both in 2006 and 2008.
Total of civil, commercial and administrative law cases (1-7)
Incoming cases Resolved cases Pending cases on 31 Dec.
First instance courts
Second instance courts
Highest instance courts
First instance courts
Second instance courts
Highest instance courts
First instance courts
Second instance courts
Highest instance courts
2.006 3617025 57.270 14.113 22.250.438 180.113 13.607 2.687.295 52.011 9.987 2.008
Clearance Rate Case Turnover Ratio Disposition Time
First instance courts
Second instance courts
Highest instance courts
First instance courts
Second instance courts
Highest instance courts
First instance courts
Second instance courts
Highest instance courts
2.006 615% 314% 96% 828% 346% 136% 44 105 268 2.008
Civil and commercial litigious cases (1)
Incoming cases Resolved cases Pending cases on 31 Dec.
First instance courts
Second instance courts
Highest instance courts
First instance courts
Second instance courts
Highest instance courts
First instance courts
Second instance courts
Highest instance courts
2.006 1.104.828 89.719 5.906 1.588.198 129.551 2.895 544.751 29.671 5.229 2.008
Clearance Rate Case Turnover Ratio Disposition Time
First instance courts
Second instance courts
Highest instance courts
First instance courts
Second instance courts
Highest instance courts
First instance courts
Second instance courts
Highest instance courts
2.006 144% 144% 49% 292% 437% 55% 125 84 659 2.008
Total criminal cases (8+9)
Incoming cases Resolved cases Pending cases on 31 Dec.
First instance courts
Second instance courts
Highest instance courts
First instance courts
Second instance courts
Highest instance courts
First instance courts
Second instance courts
Highest instance courts
2.006 1.236.815 69.860 3.266 1.254.114 70.378 3.326 375.325 21.139 391 2.008
Clearance Rate Case Turnover Ratio Disposition Time
First instance courts
Second instance courts
Highest instance courts
First instance courts
Second instance courts
Highest instance courts
First instance courts
Second instance courts
Highest instance courts
2.006 101% 101% 102% 334% 333% 851% 109 110 43 2.008
Criminal cases, severe criminal offences (8)
Incoming cases Resolved cases Pending cases on 31 Dec.
First instance courts
Second instance courts
Highest instance courts
First instance courts
Second instance courts
Highest instance courts
First instance courts
Second instance courts
Highest instance courts
2.006 854.099 61.792 3.265 864.231 62.235 3.326 287.223 20.189 390 2.008
Clearance Rate Case Turnover Ratio Disposition Time
First instance courts
Second instance courts
Highest instance courts
First instance courts
Second instance courts
Highest instance courts
First instance courts
Second instance courts
Highest instance courts
2.006 101% 101% 102% 301% 308% 853% 121 118 43 2.008

179
Germany
Litigious divorce cases
1st instance (average length)
2nd instance (average length)
Total procedure (average total length)
2.004 302 2.006 321 2.008
Employment dismissal cases
1st instance (average length)
2nd instance (average length)
Total procedure (average total length)
2.004 2.006 2.008
Robbery cases
1st instance (average length)
2nd instance (average length)
Total procedure (average total length)
2.004 2.006 2.008
Intentional homicide
1st instance (average length)
2nd instance (average length)
Total procedure (average total length)
2.004 2.006 2.008
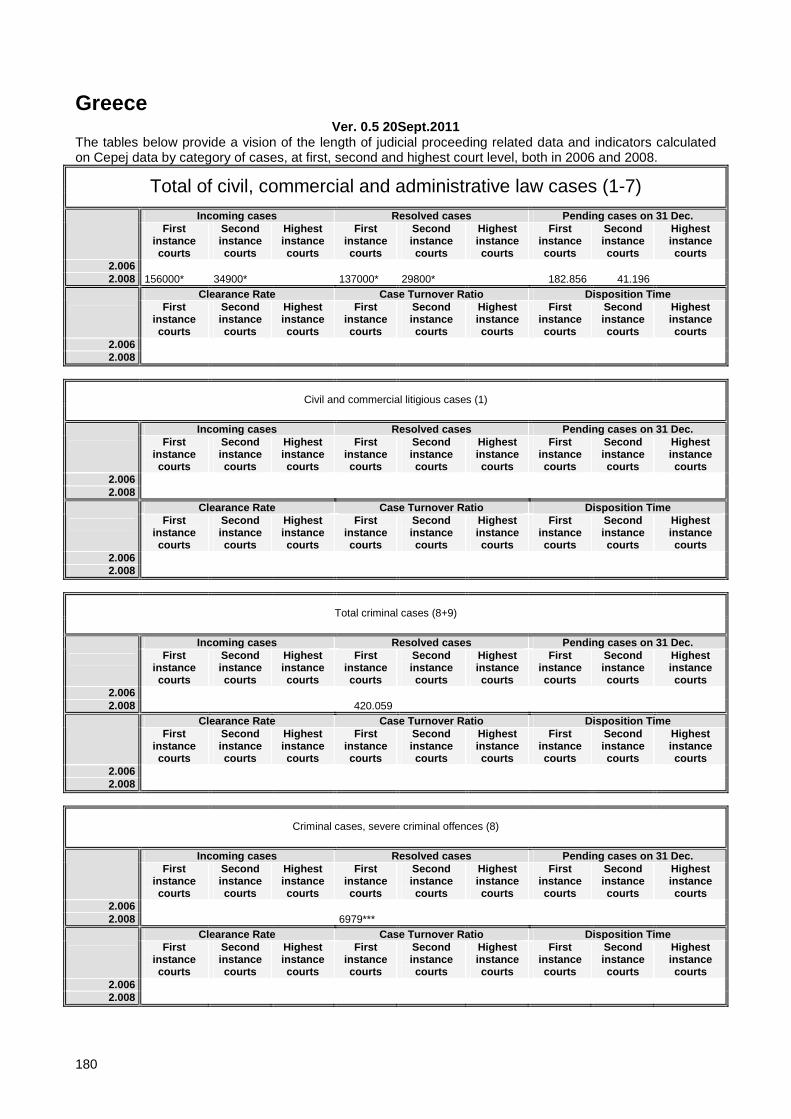
180
Greece Ver. 0.5 20Sept.2011
The tables below provide a vision of the length of judicial proceeding related data and indicators calculated on Cepej data by category of cases, at first, second and highest court level, both in 2006 and 2008.
Total of civil, commercial and administrative law cases (1-7)
Incoming cases Resolved cases Pending cases on 31 Dec.
First instance courts
Second instance courts
Highest instance courts
First instance courts
Second instance courts
Highest instance courts
First instance courts
Second instance courts
Highest instance courts
2.006 2.008 156000* 34900* 137000* 29800* 182.856 41.196
Clearance Rate Case Turnover Ratio Disposition Time
First instance courts
Second instance courts
Highest instance courts
First instance courts
Second instance courts
Highest instance courts
First instance courts
Second instance courts
Highest instance courts
2.006 2.008
Civil and commercial litigious cases (1)
Incoming cases Resolved cases Pending cases on 31 Dec.
First instance courts
Second instance courts
Highest instance courts
First instance courts
Second instance courts
Highest instance courts
First instance courts
Second instance courts
Highest instance courts
2.006 2.008
Clearance Rate Case Turnover Ratio Disposition Time
First instance courts
Second instance courts
Highest instance courts
First instance courts
Second instance courts
Highest instance courts
First instance courts
Second instance courts
Highest instance courts
2.006 2.008
Total criminal cases (8+9)
Incoming cases Resolved cases Pending cases on 31 Dec.
First instance courts
Second instance courts
Highest instance courts
First instance courts
Second instance courts
Highest instance courts
First instance courts
Second instance courts
Highest instance courts
2.006 2.008 420.059
Clearance Rate Case Turnover Ratio Disposition Time
First instance courts
Second instance courts
Highest instance courts
First instance courts
Second instance courts
Highest instance courts
First instance courts
Second instance courts
Highest instance courts
2.006 2.008
Criminal cases, severe criminal offences (8)
Incoming cases Resolved cases Pending cases on 31 Dec.
First instance courts
Second instance courts
Highest instance courts
First instance courts
Second instance courts
Highest instance courts
First instance courts
Second instance courts
Highest instance courts
2.006 2.008 6979***
Clearance Rate Case Turnover Ratio Disposition Time
First instance courts
Second instance courts
Highest instance courts
First instance courts
Second instance courts
Highest instance courts
First instance courts
Second instance courts
Highest instance courts
2.006 2.008

181
Greece
Litigious divorce cases
1st instance (average length)
2nd instance (average length)
Total procedure (average total length)
2.004 2.006 2.008 13000*
Employment dismissal cases
1st instance (average length)
2nd instance (average length)
Total procedure (average total length)
2.004 2.006 2.008 5700*
Robbery cases
1st instance (average length)
2nd instance (average length)
Total procedure (average total length)
2.004 2.006 2.008 3099**
Intentional homicide
1st instance (average length)
2nd instance (average length)
Total procedure (average total length)
2.004 2.006 2.008 250**

182
Hungary Ver. 0.5 20Sept.2011
The tables below provide a vision of the length of judicial proceeding related data and indicators calculated on Cepej data by category of cases, at first, second and highest court level, both in 2006 and 2008.
Total of civil, commercial and administrative law cases (1-7)
Incoming cases Resolved cases Pending cases on 31 Dec.
First instance courts
Second instance courts
Highest instance courts
First instance courts
Second instance courts
Highest instance courts
First instance courts
Second instance courts
Highest instance courts
2.006 607254 39.989 6.146 601.006 39.375 5.838 128.939 10.403 1.585 2.008 1184162 46.620 4.249 1.165.201 45.332 3.829 180.331 11.482 2.078
Clearance Rate Case Turnover Ratio Disposition Time
First instance courts
Second instance courts
Highest instance courts
First instance courts
Second instance courts
Highest instance courts
First instance courts
Second instance courts
Highest instance courts
2.006 99% 98% 95% 466% 378% 368% 78 96 99 2.008 98% 97% 90% 646% 395% 184% 56 92 198
Civil and commercial litigious cases (1)
Incoming cases Resolved cases Pending cases on 31 Dec.
First instance courts
Second instance courts
Highest instance courts
First instance courts
Second instance courts
Highest instance courts
First instance courts
Second instance courts
Highest instance courts
2.006 178.338 23.690 4.580 179.317 23.246 4.503 86.760 7.493 793 2.008 189.644 28.390 2.840 191.002 27.952 2.596 88.769 7.728 923
Clearance Rate Case Turnover Ratio Disposition Time
First instance courts
Second instance courts
Highest instance courts
First instance courts
Second instance courts
Highest instance courts
First instance courts
Second instance courts
Highest instance courts
2.006 101% 98% 98% 207% 310% 568% 177 118 64 2.008 101% 98% 91% 215% 362% 281% 170 101 130
Total criminal cases (8+9)
Incoming cases Resolved cases Pending cases on 31 Dec.
First instance courts
Second instance courts
Highest instance courts
First instance courts
Second instance courts
Highest instance courts
First instance courts
Second instance courts
Highest instance courts
2.006 315.743 34.443 1.420 318.917 33.993 1.397 71.448 6.494 184 2.008 262.113 34.915 1.131 261.831 35.080 1.122 72.343 6.098 195
Clearance Rate Case Turnover Ratio Disposition Time
First instance courts
Second instance courts
Highest instance courts
First instance courts
Second instance courts
Highest instance courts
First instance courts
Second instance courts
Highest instance courts
2.006 101% 99% 98% 446% 523% 759% 82 70 48 2.008 100% 100% 99% 362% 575% 575% 101 63 63
Criminal cases, severe criminal offences (8)
Incoming cases Resolved cases Pending cases on 31 Dec.
First instance courts
Second instance courts
Highest instance courts
First instance courts
Second instance courts
Highest instance courts
First instance courts
Second instance courts
Highest instance courts
2.006 135.449 33.926 136.524 33.469 54.812 6.477 2.008 137.541 34.361 1.131 136.333 34.522 1.122 55.462 6.079 195
Clearance Rate Case Turnover Ratio Disposition Time
First instance courts
Second instance courts
Highest instance courts
First instance courts
Second instance courts
Highest instance courts
First instance courts
Second instance courts
Highest instance courts
2.006 101% 99% 249% 517% 147 71 2.008 99% 100% 99% 246% 568% 575% 148 64 63

183
Hungary
Litigious divorce cases
1st instance (average length)
2nd instance (average length)
Total procedure (average total length)
2.004 2.006 2.008 NA NA NA
Employment dismissal cases
1st instance (average length)
2nd instance (average length)
Total procedure (average total length)
2.004 2.006 2.008 NA NA NA
Robbery cases
1st instance (average length)
2nd instance (average length)
Total procedure (average total length)
2.004 2.006 2.008 NA NA NA
Intentional homicide
1st instance (average length)
2nd instance (average length)
Total procedure (average total length)
2.004 2.006 2.008 NA NA NA

184
Iceland Ver. 0.5 20Sept.2011
The tables below provide a vision of the length of judicial proceeding related data and indicators calculated on Cepej data by category of cases, at first, second and highest court level, both in 2006 and 2008.
Total of civil, commercial and administrative law cases (1-7)
Incoming cases Resolved cases Pending cases on 31 Dec.
First instance courts
Second instance courts
Highest instance courts
First instance courts
Second instance courts
Highest instance courts
First instance courts
Second instance courts
Highest instance courts
2.006 12832 425 11.714 326 1.478 120 2.008 NAP NAP 353 NAP 150
Clearance Rate Case Turnover Ratio Disposition Time
First instance courts
Second instance courts
Highest instance courts
First instance courts
Second instance courts
Highest instance courts
First instance courts
Second instance courts
Highest instance courts
2.006 91% 77% 793% 272% 46 134 2.008 235% 155
Civil and commercial litigious cases (1)
Incoming cases Resolved cases Pending cases on 31 Dec.
First instance courts
Second instance courts
Highest instance courts
First instance courts
Second instance courts
Highest instance courts
First instance courts
Second instance courts
Highest instance courts
2.006 2.008 NAP NAP NAP NAP NAP NAP
Clearance Rate Case Turnover Ratio Disposition Time
First instance courts
Second instance courts
Highest instance courts
First instance courts
Second instance courts
Highest instance courts
First instance courts
Second instance courts
Highest instance courts
2.006 2.008
Total criminal cases (8+9)
Incoming cases Resolved cases Pending cases on 31 Dec.
First instance courts
Second instance courts
Highest instance courts
First instance courts
Second instance courts
Highest instance courts
First instance courts
Second instance courts
Highest instance courts
2.006 2.808 248 2.378 232 606 53 2.008 NAP NAP 277 NAP 44
Clearance Rate Case Turnover Ratio Disposition Time
First instance courts
Second instance courts
Highest instance courts
First instance courts
Second instance courts
Highest instance courts
First instance courts
Second instance courts
Highest instance courts
2.006 85% 94% 392% 438% 93 83 2.008 630% 58
Criminal cases, severe criminal offences (8)
Incoming cases Resolved cases Pending cases on 31 Dec.
First instance courts
Second instance courts
Highest instance courts
First instance courts
Second instance courts
Highest instance courts
First instance courts
Second instance courts
Highest instance courts
2.006 2.008 NAP NAP NAP NAP NAP NAP
Clearance Rate Case Turnover Ratio Disposition Time
First instance courts
Second instance courts
Highest instance courts
First instance courts
Second instance courts
Highest instance courts
First instance courts
Second instance courts
Highest instance courts
2.006 2.008

185
Iceland
Litigious divorce cases
1st instance (average length)
2nd instance (average length)
Total procedure (average total length)
2.004 2.006 2.008 NA NA NA
Employment dismissal cases
1st instance (average length)
2nd instance (average length)
Total procedure (average total length)
2.004 2.006 2.008
Robbery cases
1st instance (average length)
2nd instance (average length)
Total procedure (average total length)
2.004 107 2.006 2.008
Intentional homicide
1st instance (average length)
2nd instance (average length)
Total procedure (average total length)
2.004 63 2.006 2.008

186
Ireland Ver. 0.5 20Sept.2011
The tables below provide a vision of the length of judicial proceeding related data and indicators calculated on Cepej data by category of cases, at first, second and highest court level, both in 2006 and 2008.
Total of civil, commercial and administrative law cases (1-7)
Incoming cases Resolved cases Pending cases on 31 Dec.
First instance courts
Second instance courts
Highest instance courts
First instance courts
Second instance courts
Highest instance courts
First instance courts
Second instance courts
Highest instance courts
2.006 103919 15.433 2.008 NA NA NA
Clearance Rate Case Turnover Ratio Disposition Time
First instance courts
Second instance courts
Highest instance courts
First instance courts
Second instance courts
Highest instance courts
First instance courts
Second instance courts
Highest instance courts
2.006 2.008
Civil and commercial litigious cases (1)
Incoming cases Resolved cases Pending cases on 31 Dec.
First instance courts
Second instance courts
Highest instance courts
First instance courts
Second instance courts
Highest instance courts
First instance courts
Second instance courts
Highest instance courts
2.006 2.008 NA NA NA
Clearance Rate Case Turnover Ratio Disposition Time
First instance courts
Second instance courts
Highest instance courts
First instance courts
Second instance courts
Highest instance courts
First instance courts
Second instance courts
Highest instance courts
2.006 2.008
Total criminal cases (8+9)
Incoming cases Resolved cases Pending cases on 31 Dec.
First instance courts
Second instance courts
Highest instance courts
First instance courts
Second instance courts
Highest instance courts
First instance courts
Second instance courts
Highest instance courts
2.006 332.442 2.008 NA NA NA
Clearance Rate Case Turnover Ratio Disposition Time
First instance courts
Second instance courts
Highest instance courts
First instance courts
Second instance courts
Highest instance courts
First instance courts
Second instance courts
Highest instance courts
2.006 2.008
Criminal cases, severe criminal offences (8)
Incoming cases Resolved cases Pending cases on 31 Dec.
First instance courts
Second instance courts
Highest instance courts
First instance courts
Second instance courts
Highest instance courts
First instance courts
Second instance courts
Highest instance courts
2.006 2.667 1.263 2.008 NA NA NA
Clearance Rate Case Turnover Ratio Disposition Time
First instance courts
Second instance courts
Highest instance courts
First instance courts
Second instance courts
Highest instance courts
First instance courts
Second instance courts
Highest instance courts
2.006 2.008

187
Ireland
Litigious divorce cases
1st instance (average length)
2nd instance (average length)
Total procedure (average total length)
2.004 2.006 2.008
Employment dismissal cases
1st instance (average length)
2nd instance (average length)
Total procedure (average total length)
2.004 2.006 2.008
Robbery cases
1st instance (average length)
2nd instance (average length)
Total procedure (average total length)
2.004 2.006 2.008
Intentional homicide
1st instance (average length)
2nd instance (average length)
Total procedure (average total length)
2.004 2.006 2.008
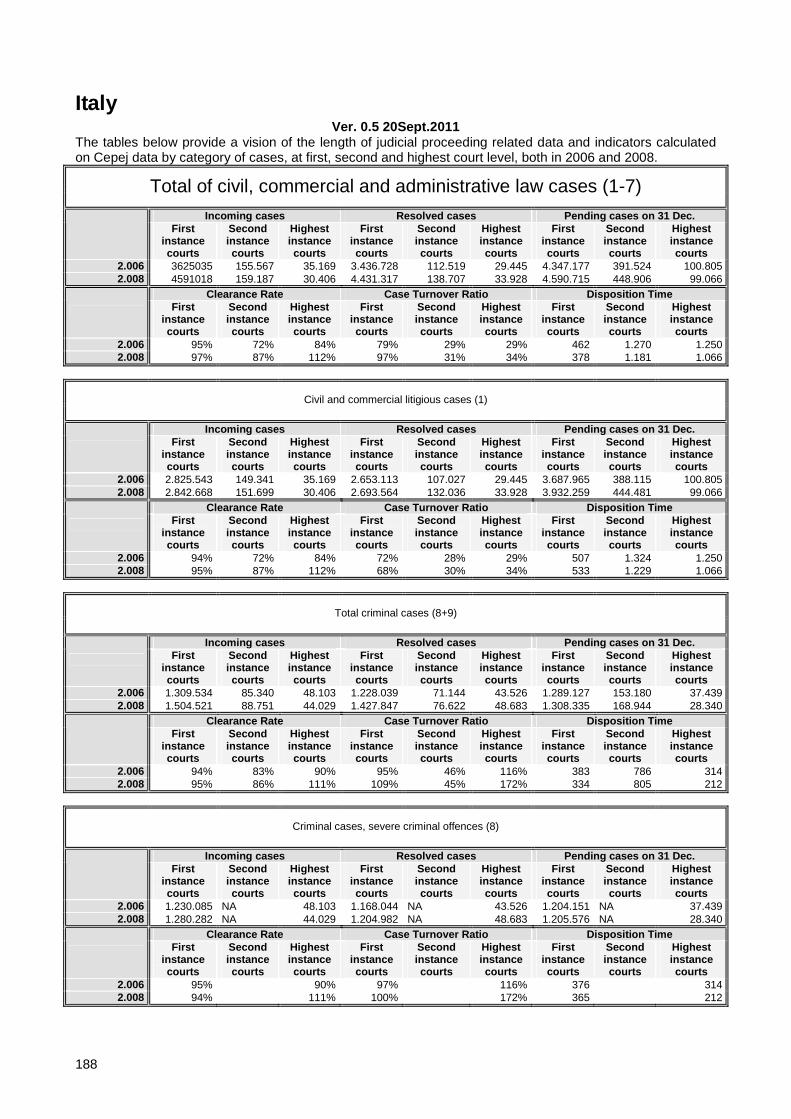
188
Italy Ver. 0.5 20Sept.2011
The tables below provide a vision of the length of judicial proceeding related data and indicators calculated on Cepej data by category of cases, at first, second and highest court level, both in 2006 and 2008.
Total of civil, commercial and administrative law cases (1-7)
Incoming cases Resolved cases Pending cases on 31 Dec.
First instance courts
Second instance courts
Highest instance courts
First instance courts
Second instance courts
Highest instance courts
First instance courts
Second instance courts
Highest instance courts
2.006 3625035 155.567 35.169 3.436.728 112.519 29.445 4.347.177 391.524 100.805 2.008 4591018 159.187 30.406 4.431.317 138.707 33.928 4.590.715 448.906 99.066
Clearance Rate Case Turnover Ratio Disposition Time
First instance courts
Second instance courts
Highest instance courts
First instance courts
Second instance courts
Highest instance courts
First instance courts
Second instance courts
Highest instance courts
2.006 95% 72% 84% 79% 29% 29% 462 1.270 1.250 2.008 97% 87% 112% 97% 31% 34% 378 1.181 1.066
Civil and commercial litigious cases (1)
Incoming cases Resolved cases Pending cases on 31 Dec.
First instance courts
Second instance courts
Highest instance courts
First instance courts
Second instance courts
Highest instance courts
First instance courts
Second instance courts
Highest instance courts
2.006 2.825.543 149.341 35.169 2.653.113 107.027 29.445 3.687.965 388.115 100.805 2.008 2.842.668 151.699 30.406 2.693.564 132.036 33.928 3.932.259 444.481 99.066
Clearance Rate Case Turnover Ratio Disposition Time
First instance courts
Second instance courts
Highest instance courts
First instance courts
Second instance courts
Highest instance courts
First instance courts
Second instance courts
Highest instance courts
2.006 94% 72% 84% 72% 28% 29% 507 1.324 1.250 2.008 95% 87% 112% 68% 30% 34% 533 1.229 1.066
Total criminal cases (8+9)
Incoming cases Resolved cases Pending cases on 31 Dec.
First instance courts
Second instance courts
Highest instance courts
First instance courts
Second instance courts
Highest instance courts
First instance courts
Second instance courts
Highest instance courts
2.006 1.309.534 85.340 48.103 1.228.039 71.144 43.526 1.289.127 153.180 37.439 2.008 1.504.521 88.751 44.029 1.427.847 76.622 48.683 1.308.335 168.944 28.340
Clearance Rate Case Turnover Ratio Disposition Time
First instance courts
Second instance courts
Highest instance courts
First instance courts
Second instance courts
Highest instance courts
First instance courts
Second instance courts
Highest instance courts
2.006 94% 83% 90% 95% 46% 116% 383 786 314 2.008 95% 86% 111% 109% 45% 172% 334 805 212
Criminal cases, severe criminal offences (8)
Incoming cases Resolved cases Pending cases on 31 Dec.
First instance courts
Second instance courts
Highest instance courts
First instance courts
Second instance courts
Highest instance courts
First instance courts
Second instance courts
Highest instance courts
2.006 1.230.085 NA 48.103 1.168.044 NA 43.526 1.204.151 NA 37.439 2.008 1.280.282 NA 44.029 1.204.982 NA 48.683 1.205.576 NA 28.340
Clearance Rate Case Turnover Ratio Disposition Time
First instance courts
Second instance courts
Highest instance courts
First instance courts
Second instance courts
Highest instance courts
First instance courts
Second instance courts
Highest instance courts
2.006 95% 90% 97% 116% 376 314 2.008 94% 111% 100% 172% 365 212

189
Italy
Litigious divorce cases
1st instance (average length)
2nd instance (average length)
Total procedure (average total length)
2.004 582 502 2.006 634 NA NA 2.008 682 NA NA
Employment dismissal cases
1st instance (average length)
2nd instance (average length)
Total procedure (average total length)
2.004 790 2.006 619 682 NA 2.008 NA NA NA
Robbery cases
1st instance (average length)
2nd instance (average length)
Total procedure (average total length)
2.004 2.006 NA NA NA 2.008 NA NA NA
Intentional homicide
1st instance (average length)
2nd instance (average length)
Total procedure (average total length)
2.004 2.006 NA NA NA 2.008 NA NA NA

190
Latvia Ver. 0.5 20Sept.2011
The tables below provide a vision of the length of judicial proceeding related data and indicators calculated on Cepej data by category of cases, at first, second and highest court level, both in 2006 and 2008.
Total of civil, commercial and administrative law cases (1-7)
Incoming cases Resolved cases Pending cases on 31 Dec.
First instance courts
Second instance courts
Highest instance courts
First instance courts
Second instance courts
Highest instance courts
First instance courts
Second instance courts
Highest instance courts
2.006 57047 6.483 1.690 57.291 6.506 1.551 21.442 3.868 383 2.008 96783 6.861 1.898 83.706 6.435 1.579 36.187 5.016 742
Clearance Rate Case Turnover Ratio Disposition Time
First instance courts
Second instance courts
Highest instance courts
First instance courts
Second instance courts
Highest instance courts
First instance courts
Second instance courts
Highest instance courts
2.006 100% 100% 92% 267% 168% 405% 137 217 90 2.008 86% 94% 83% 231% 128% 213% 158 285 172
Civil and commercial litigious cases (1)
Incoming cases Resolved cases Pending cases on 31 Dec.
First instance courts
Second instance courts
Highest instance courts
First instance courts
Second instance courts
Highest instance courts
First instance courts
Second instance courts
Highest instance courts
2.006 34.010 4.815 994 35.972 4.955 908 15.496 2.576 204 2.008 50.318 4.556 916 36.914 4.133 717 30.718 3.369 413
Clearance Rate Case Turnover Ratio Disposition Time
First instance courts
Second instance courts
Highest instance courts
First instance courts
Second instance courts
Highest instance courts
First instance courts
Second instance courts
Highest instance courts
2.006 106% 103% 91% 232% 192% 445% 157 190 82 2.008 73% 91% 78% 120% 123% 174% 304 298 210
Total criminal cases (8+9)
Incoming cases Resolved cases Pending cases on 31 Dec.
First instance courts
Second instance courts
Highest instance courts
First instance courts
Second instance courts
Highest instance courts
First instance courts
Second instance courts
Highest instance courts
2.006 9.706 2.498 768 33.796 2.684 758 3.236 775 42 2.008 38.085 2.595 711 36.779 2.445 699 5.669 1.119 35
Clearance Rate Case Turnover Ratio Disposition Time
First instance courts
Second instance courts
Highest instance courts
First instance courts
Second instance courts
Highest instance courts
First instance courts
Second instance courts
Highest instance courts
2.006 348% 107% 99% 1044% 346% 1805% 35 105 20 2.008 97% 94% 98% 649% 218% 1997% 56 167 18
Criminal cases, severe criminal offences (8)
Incoming cases Resolved cases Pending cases on 31 Dec.
First instance courts
Second instance courts
Highest instance courts
First instance courts
Second instance courts
Highest instance courts
First instance courts
Second instance courts
Highest instance courts
2.006 9.706 1.907 527 10.065 2.156 518 3.235 524 25 2.008 12.394 2.115 491 11.278 1.990 493 4.827 660 19
Clearance Rate Case Turnover Ratio Disposition Time
First instance courts
Second instance courts
Highest instance courts
First instance courts
Second instance courts
Highest instance courts
First instance courts
Second instance courts
Highest instance courts
2.006 104% 113% 98% 311% 411% 2072% 117 89 18 2.008 91% 94% 100% 234% 302% 2595% 156 121 14

191
Latvia
Litigious divorce cases
1st instance (average length)
2nd instance (average length)
Total procedure (average total length)
2.004 2.006 117 84 NA 2.008 135 72 NA
Employment dismissal cases
1st instance (average length)
2nd instance (average length)
Total procedure (average total length)
2.004 2.006 171 84 NA 2.008 174 87 NA
Robbery cases
1st instance (average length)
2nd instance (average length)
Total procedure (average total length)
2.004 2.006 192 117 NA 2.008 204 105 NA
Intentional homicide
1st instance (average length)
2nd instance (average length)
Total procedure (average total length)
2.004 2.006 189 210 NA 2.008 156 150 NA

192
Liechtenstein Ver. 0.5 20Sept.2011
The tables below provide a vision of the length of judicial proceeding related data and indicators calculated on Cepej data by category of cases, at first, second and highest court level, both in 2006 and 2008.
Total of civil, commercial and administrative law cases (1-7)
Incoming cases Resolved cases Pending cases on 31 Dec.
First instance courts
Second instance courts
Highest instance courts
First instance courts
Second instance courts
Highest instance courts
First instance courts
Second instance courts
Highest instance courts
2.006 2.008
Clearance Rate Case Turnover Ratio Disposition Time
First instance courts
Second instance courts
Highest instance courts
First instance courts
Second instance courts
Highest instance courts
First instance courts
Second instance courts
Highest instance courts
2.006 2.008
Civil and commercial litigious cases (1)
Incoming cases Resolved cases Pending cases on 31 Dec.
First instance courts
Second instance courts
Highest instance courts
First instance courts
Second instance courts
Highest instance courts
First instance courts
Second instance courts
Highest instance courts
2.006 2.008
Clearance Rate Case Turnover Ratio Disposition Time
First instance courts
Second instance courts
Highest instance courts
First instance courts
Second instance courts
Highest instance courts
First instance courts
Second instance courts
Highest instance courts
2.006 2.008
Total criminal cases (8+9)
Incoming cases Resolved cases Pending cases on 31 Dec.
First instance courts
Second instance courts
Highest instance courts
First instance courts
Second instance courts
Highest instance courts
First instance courts
Second instance courts
Highest instance courts
2.006 2.008
Clearance Rate Case Turnover Ratio Disposition Time
First instance courts
Second instance courts
Highest instance courts
First instance courts
Second instance courts
Highest instance courts
First instance courts
Second instance courts
Highest instance courts
2.006 2.008
Criminal cases, severe criminal offences (8)
Incoming cases Resolved cases Pending cases on 31 Dec.
First instance courts
Second instance courts
Highest instance courts
First instance courts
Second instance courts
Highest instance courts
First instance courts
Second instance courts
Highest instance courts
2.006 2.008
Clearance Rate Case Turnover Ratio Disposition Time
First instance courts
Second instance courts
Highest instance courts
First instance courts
Second instance courts
Highest instance courts
First instance courts
Second instance courts
Highest instance courts
2.006 2.008

193
Liechtenstein
Litigious divorce cases
1st instance (average length)
2nd instance (average length)
Total procedure (average total length)
2.004 2.006 2.008
Employment dismissal cases
1st instance (average length)
2nd instance (average length)
Total procedure (average total length)
2.004 2.006 2.008
Robbery cases
1st instance (average length)
2nd instance (average length)
Total procedure (average total length)
2.004 2.006 2.008
Intentional homicide
1st instance (average length)
2nd instance (average length)
Total procedure (average total length)
2.004 2.006 2.008

194
Lithuania Ver. 0.5 20Sept.2011
The tables below provide a vision of the length of judicial proceeding related data and indicators calculated on Cepej data by category of cases, at first, second and highest court level, both in 2006 and 2008.
Total of civil, commercial and administrative law cases (1-7)
Incoming cases Resolved cases Pending cases on 31 Dec.
First
instance courts
Second instance courts
Highest instance courts
First instance courts
Second instance courts
Highest instance courts
First instance courts
Second instance courts
Highest instance courts
2.006 221185 12.661 665 213.940 7.128 665 29.544 3.456 7 2.008 276855 16.752 496 272.045 13.374 611 33.317 7.709 96
Clearance Rate Case Turnover Ratio Disposition Time
First
instance courts
Second instance courts
Highest instance courts
First instance courts
Second instance courts
Highest instance courts
First instance courts
Second instance courts
Highest instance courts
2.006 97% 56% 100% 724% 206% 9500% 50 177 4 2.008 98% 80% 123% 817% 173% 636% 45 210 57
Civil and commercial litigious cases (1)
Incoming cases Resolved cases Pending cases on 31 Dec.
First instance courts
Second instance courts
Highest instance courts
First instance courts
Second instance courts
Highest instance courts
First instance courts
Second instance courts
Highest instance courts
2.006 70.284 7.071 71.219 3.087 8.103 1.572 2.008 185.878 8.548 496 180.071 7.559 611 27.172 2.267 96
Clearance Rate Case Turnover Ratio Disposition Time
First instance courts
Second instance courts
Highest instance courts
First instance courts
Second instance courts
Highest instance courts
First instance courts
Second instance courts
Highest instance courts
2.006 101% 44% 879% 196% 42 186 2.008 97% 88% 123% 663% 333% 636% 55 109 57
Total criminal cases (8+9)
Incoming cases Resolved cases Pending cases on 31 Dec.
First instance courts
Second instance courts
Highest instance courts
First instance courts
Second instance courts
Highest instance courts
First instance courts
Second instance courts
Highest instance courts
2.006 17.245 5.699 898 17.225 3.332 701 3.279 715 424 2.008 16.472 6.845 509 16.082 6.731 520 4.036 874 116
Clearance Rate Case Turnover Ratio Disposition Time
First instance courts
Second instance courts
Highest instance courts
First instance courts
Second instance courts
Highest instance courts
First instance courts
Second instance courts
Highest instance courts
2.006 100% 58% 78% 525% 466% 165% 69 78 221 2.008 98% 98% 102% 398% 770% 448% 92 47 81
Criminal cases, severe criminal offences (8)
Incoming cases Resolved cases Pending cases on 31 Dec.
First instance courts
Second instance courts
Highest instance courts
First instance courts
Second instance courts
Highest instance courts
First instance courts
Second instance courts
Highest instance courts
2.006 15.207 15.257 2.829 2.008
Clearance Rate Case Turnover Ratio Disposition Time
First instance courts
Second instance courts
Highest instance courts
First instance courts
Second instance courts
Highest instance courts
First instance courts
Second instance courts
Highest instance courts
2.006 100% 539% 68 2.008

195
Lithuania
Litigious divorce cases
1st instance (average length)
2nd instance (average length)
Total procedure (average total length)
2.004 2.006 39 2.008 69,3
Employment dismissal cases
1st instance (average length)
2nd instance (average length)
Total procedure (average total length)
2.004 2.006 131 2.008
Robbery cases
1st instance (average length)
2nd instance (average length)
Total procedure (average total length)
2.004 2.006 76 2.008 128,4
Intentional homicide
1st instance (average length)
2nd instance (average length)
Total procedure (average total length)
2.004 2.006 118 2.008 136,8

196
Luxembourg Ver. 0.5 20Sept.2011
The tables below provide a vision of the length of judicial proceeding related data and indicators calculated on Cepej data by category of cases, at first, second and highest court level, both in 2006 and 2008.
Total of civil, commercial and administrative law cases (1-7)
Incoming cases Resolved cases Pending cases on 31 Dec.
First instance courts
Second instance courts
Highest instance courts
First instance courts
Second instance courts
Highest instance courts
First instance courts
Second instance courts
Highest instance courts
2.006 NA 1.206 NA NA 1.154 62 NA NA NA 2.008 4098 1.328 118 9.923 1.438 123 NA NA 86
Clearance Rate Case Turnover Ratio Disposition Time
First instance courts
Second instance courts
Highest instance courts
First instance courts
Second instance courts
Highest instance courts
First instance courts
Second instance courts
Highest instance courts
2.006 96% 2.008 242% 108% 104% 143% 255
Civil and commercial litigious cases (1)
Incoming cases Resolved cases Pending cases on 31 Dec.
First instance courts
Second instance courts
Highest instance courts
First instance courts
Second instance courts
Highest instance courts
First instance courts
Second instance courts
Highest instance courts
2.006 NA NA NA NA NA NA NA NA NA 2.008 3.144 1.019 118 4.378 1.091 123 NA 1.231 86
Clearance Rate Case Turnover Ratio Disposition Time
First instance courts
Second instance courts
Highest instance courts
First instance courts
Second instance courts
Highest instance courts
First instance courts
Second instance courts
Highest instance courts
2.006 2.008 139% 107% 104% 89% 143% 412 255
Total criminal cases (8+9)
Incoming cases Resolved cases Pending cases on 31 Dec.
First instance courts
Second instance courts
Highest instance courts
First instance courts
Second instance courts
Highest instance courts
First instance courts
Second instance courts
Highest instance courts
2.006 NA NA NA 12.011 647 50 NA NA NA 2.008 49.441 NA NA 13.397 577 64 NA NA NA
Clearance Rate Case Turnover Ratio Disposition Time
First instance courts
Second instance courts
Highest instance courts
First instance courts
Second instance courts
Highest instance courts
First instance courts
Second instance courts
Highest instance courts
2.006 2.008 27%
Criminal cases, severe criminal offences (8)
Incoming cases Resolved cases Pending cases on 31 Dec.
First instance courts
Second instance courts
Highest instance courts
First instance courts
Second instance courts
Highest instance courts
First instance courts
Second instance courts
Highest instance courts
2.006 NA NA NA 6.567 49 NA NA NA NA 2.008 NA NA NA 4.251 NA NA NA NA NA
Clearance Rate Case Turnover Ratio Disposition Time
First instance courts
Second instance courts
Highest instance courts
First instance courts
Second instance courts
Highest instance courts
First instance courts
Second instance courts
Highest instance courts
2.006 2.008

197
Luxembourg
Litigious divorce cases
1st instance (average length)
2nd instance (average length)
Total procedure (average total length)
2.004 2.006 NA NA NA 2.008 NA NA NA
Employment dismissal cases
1st instance (average length)
2nd instance (average length)
Total procedure (average total length)
2.004 2.006 60-80 jours NA NA 2.008 NA NA NA
Robbery cases
1st instance (average length)
2nd instance (average length)
Total procedure (average total length)
2.004 2.006 NA NA NA 2.008 NA NA NA
Intentional homicide
1st instance (average length)
2nd instance (average length)
Total procedure (average total length)
2.004 2.006 NA NA NA 2.008 NA NA NA

198
Malta Ver. 0.5 20Sept.2011
The tables below provide a vision of the length of judicial proceeding related data and indicators calculated on Cepej data by category of cases, at first, second and highest court level, both in 2006 and 2008.
Total of civil, commercial and administrative law cases (1-7)
Incoming cases Resolved cases Pending cases on 31 Dec.
First instance courts
Second instance courts
Highest instance courts
First instance courts
Second instance courts
Highest instance courts
First instance courts
Second instance courts
Highest instance courts
2.006 3733 706 31 4.663 NA NA 10.660 1.149 37 2.008 4067 578 NAP 4.064 697 NAP 10.335 965 NAP
Clearance Rate Case Turnover Ratio Disposition Time
First instance courts
Second instance courts
Highest instance courts
First instance courts
Second instance courts
Highest instance courts
First instance courts
Second instance courts
Highest instance courts
2.006 125% 44% 834 2.008 100% 121% 39% 72% 928 505
Civil and commercial litigious cases (1)
Incoming cases Resolved cases Pending cases on 31 Dec.
First instance courts
Second instance courts
Highest instance courts
First instance courts
Second instance courts
Highest instance courts
First instance courts
Second instance courts
Highest instance courts
2.006 3.567 4.500 9.859 2.008 3.950 542 3.901 670 9.500 918
Clearance Rate Case Turnover Ratio Disposition Time
First instance courts
Second instance courts
Highest instance courts
First instance courts
Second instance courts
Highest instance courts
First instance courts
Second instance courts
Highest instance courts
2.006 126% 46% 800 2.008 99% 124% 41% 73% 889 500
Total criminal cases (8+9)
Incoming cases Resolved cases Pending cases on 31 Dec.
First instance courts
Second instance courts
Highest instance courts
First instance courts
Second instance courts
Highest instance courts
First instance courts
Second instance courts
Highest instance courts
2.006 453 14.263 11.094 14.104 11.425 9.606 2.008 15.373 418 NAP 15.763 454 NAP 12.438 273 NAP
Clearance Rate Case Turnover Ratio Disposition Time
First instance courts
Second instance courts
Highest instance courts
First instance courts
Second instance courts
Highest instance courts
First instance courts
Second instance courts
Highest instance courts
2.006 2449% 99% 97% 147% 376 249 2.008 103% 109% 127% 166% 288 219
Criminal cases, severe criminal offences (8)
Incoming cases Resolved cases Pending cases on 31 Dec.
First instance courts
Second instance courts
Highest instance courts
First instance courts
Second instance courts
Highest instance courts
First instance courts
Second instance courts
Highest instance courts
2.006 24 33 22 20 38 37 2.008 25 26 23 21 67 22
Clearance Rate Case Turnover Ratio Disposition Time
First instance courts
Second instance courts
Highest instance courts
First instance courts
Second instance courts
Highest instance courts
First instance courts
Second instance courts
Highest instance courts
2.006 92% 61% 58% 54% 630 675 2.008 92% 81% 34% 95% 1.063 382
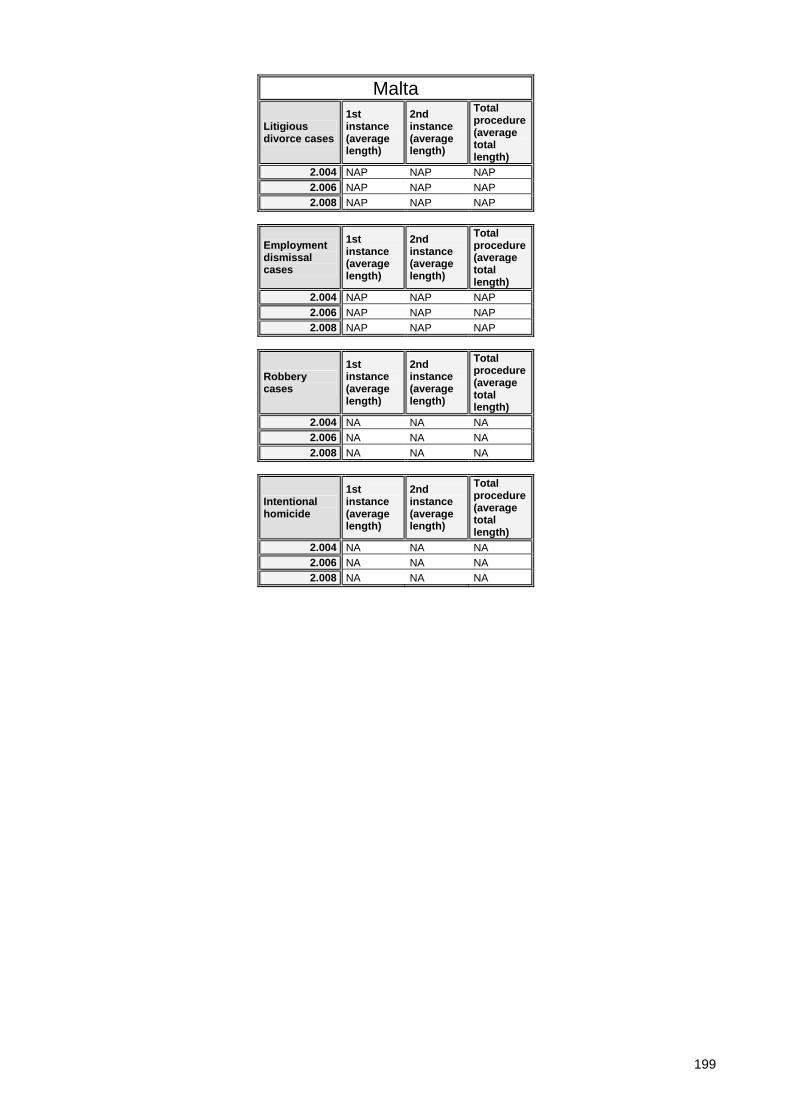
199
Malta
Litigious divorce cases
1st instance (average length)
2nd instance (average length)
Total procedure (average total length)
2.004 NAP NAP NAP 2.006 NAP NAP NAP 2.008 NAP NAP NAP
Employment dismissal cases
1st instance (average length)
2nd instance (average length)
Total procedure (average total length)
2.004 NAP NAP NAP 2.006 NAP NAP NAP 2.008 NAP NAP NAP
Robbery cases
1st instance (average length)
2nd instance (average length)
Total procedure (average total length)
2.004 NA NA NA 2.006 NA NA NA 2.008 NA NA NA
Intentional homicide
1st instance (average length)
2nd instance (average length)
Total procedure (average total length)
2.004 NA NA NA 2.006 NA NA NA 2.008 NA NA NA

200
Moldova Ver. 0.5 20Sept.2011
The tables below provide a vision of the length of judicial proceeding related data and indicators calculated on Cepej data by category of cases, at first, second and highest court level, both in 2006 and 2008.
Total of civil, commercial and administrative law cases (1-7)
Incoming cases Resolved cases Pending cases on 31 Dec.
First instance courts
Second instance courts
Highest instance courts
First instance courts
Second instance courts
Highest instance courts
First instance courts
Second instance courts
Highest instance courts
2.006 175041 7.675 4.095 181.927 15.350 4.115 11.708 984 487 2.008 66848 9.686 5.648 63.411 9.941 5.470 14.064 1.515 543
Clearance Rate Case Turnover Ratio Disposition Time
First instance courts
Second instance courts
Highest instance courts
First instance courts
Second instance courts
Highest instance courts
First instance courts
Second instance courts
Highest instance courts
2.006 104% 200% 100% 1554% 1560% 845% 23 23 43 2.008 95% 103% 97% 451% 656% 1007% 81 56 36
Civil and commercial litigious cases (1)
Incoming cases Resolved cases Pending cases on 31 Dec.
First instance courts
Second instance courts
Highest instance courts
First instance courts
Second instance courts
Highest instance courts
First instance courts
Second instance courts
Highest instance courts
2.006 5.397 292 1.881 9.987 584 1.919 1.075 31 181 2.008 61.427 6.616 3.293 58.007 6.916 3.180 12.649 1.253 369
Clearance Rate Case Turnover Ratio Disposition Time
First instance courts
Second instance courts
Highest instance courts
First instance courts
Second instance courts
Highest instance courts
First instance courts
Second instance courts
Highest instance courts
2.006 185% 200% 102% 929% 1884% 1060% 39 19 34 2.008 94% 105% 97% 459% 552% 862% 80 66 42
Total criminal cases (8+9)
Incoming cases Resolved cases Pending cases on 31 Dec.
First instance courts
Second instance courts
Highest instance courts
First instance courts
Second instance courts
Highest instance courts
First instance courts
Second instance courts
Highest instance courts
2.006 13.517 2.553 2.073 27.034 2.586 1.867 2.470 272 304 2.008 9.912 2.117 2.842 9.808 2.144 2.899 1.877 243 456
Clearance Rate Case Turnover Ratio Disposition Time
First instance courts
Second instance courts
Highest instance courts
First instance courts
Second instance courts
Highest instance courts
First instance courts
Second instance courts
Highest instance courts
2.006 200% 101% 90% 1094% 951% 614% 33 38 59 2.008 99% 101% 102% 523% 882% 636% 70 41 57
Criminal cases, severe criminal offences (8)
Incoming cases Resolved cases Pending cases on 31 Dec.
First instance courts
Second instance courts
Highest instance courts
First instance courts
Second instance courts
Highest instance courts
First instance courts
Second instance courts
Highest instance courts
2.006 7.856 1.243 15.712 1.125 1.620 176 2.008
Clearance Rate Case Turnover Ratio Disposition Time
First instance courts
Second instance courts
Highest instance courts
First instance courts
Second instance courts
Highest instance courts
First instance courts
Second instance courts
Highest instance courts
2.006 200% 91% 970% 639% 38 57 2.008

201
Moldova
Litigious divorce cases
1st instance (average length)
2nd instance (average length)
Total procedure (average total length)
2.004 2.006 NA NA NA 2.008 NA NA NA
Employment dismissal cases
1st instance (average length)
2nd instance (average length)
Total procedure (average total length)
2.004 2.006 NA NA NA 2.008 NA NA NA
Robbery cases
1st instance (average length)
2nd instance (average length)
Total procedure (average total length)
2.004 NA 2.006 NA NA NA 2.008 NA NA NA
Intentional homicide
1st instance (average length)
2nd instance (average length)
Total procedure (average total length)
2.004 2.006 NA NA NA 2.008 NA NA NA

202
Monaco Ver. 0.5 20Sept.2011
The tables below provide a vision of the length of judicial proceeding related data and indicators calculated on Cepej data by category of cases, at first, second and highest court level, both in 2006 and 2008.
Total of civil, commercial and administrative law cases (1-7)
Incoming cases Resolved cases Pending cases on 31 Dec.
First instance courts
Second instance courts
Highest instance courts
First instance courts
Second instance courts
Highest instance courts
First instance courts
Second instance courts
Highest instance courts
2.006 682 119 75 627 90 42 1.261 202 NA 2.008 1090 142 NA 1.070 116 NA NA NA NA
Clearance Rate Case Turnover Ratio Disposition Time
First instance courts
Second instance courts
Highest instance courts
First instance courts
Second instance courts
Highest instance courts
First instance courts
Second instance courts
Highest instance courts
2.006 92% 76% 56% 50% 45% 734 819 2.008 98% 82%
Civil and commercial litigious cases (1)
Incoming cases Resolved cases Pending cases on 31 Dec.
First instance courts
Second instance courts
Highest instance courts
First instance courts
Second instance courts
Highest instance courts
First instance courts
Second instance courts
Highest instance courts
2.006 428 119 64 490 90 23 NA 202 NA 2.008 723 142 22 689 116 21 1.252 226 45
Clearance Rate Case Turnover Ratio Disposition Time
First instance courts
Second instance courts
Highest instance courts
First instance courts
Second instance courts
Highest instance courts
First instance courts
Second instance courts
Highest instance courts
2.006 114% 76% 36% 45% 819 2.008 95% 82% 95% 55% 51% 47% 663 711 782
Total criminal cases (8+9)
Incoming cases Resolved cases Pending cases on 31 Dec.
First instance courts
Second instance courts
Highest instance courts
First instance courts
Second instance courts
Highest instance courts
First instance courts
Second instance courts
Highest instance courts
2.006 NA NA 22 554 55 36 NA NA NA 2.008 891 NA 35 934 NA 34 NA NA NA
Clearance Rate Case Turnover Ratio Disposition Time
First instance courts
Second instance courts
Highest instance courts
First instance courts
Second instance courts
Highest instance courts
First instance courts
Second instance courts
Highest instance courts
2.006 164% 2.008 105% 97%
Criminal cases, severe criminal offences (8)
Incoming cases Resolved cases Pending cases on 31 Dec.
First instance courts
Second instance courts
Highest instance courts
First instance courts
Second instance courts
Highest instance courts
First instance courts
Second instance courts
Highest instance courts
2.006 NA NA NA 318 17 NA NA NA NA 2.008 40 2 NA 43 2 NA 1 1 NA
Clearance Rate Case Turnover Ratio Disposition Time
First instance courts
Second instance courts
Highest instance courts
First instance courts
Second instance courts
Highest instance courts
First instance courts
Second instance courts
Highest instance courts
2.006 2.008 108% 100% 4300% 200% 8 183

203
Monaco
Litigious divorce cases
1st instance (average length)
2nd instance (average length)
Total procedure (average total length)
2.004 2.006 270 240 510 2.008 270 240 510
Employment dismissal cases
1st instance (average length)
2nd instance (average length)
Total procedure (average total length)
2.004 2.006 25 NA NA 2.008 750 NA NA
Robbery cases
1st instance (average length)
2nd instance (average length)
Total procedure (average total length)
2.004 2.006 NA NA NA 2.008 NA NA NA
Intentional homicide
1st instance (average length)
2nd instance (average length)
Total procedure (average total length)
2.004 2.006 NA NA NA 2.008 NA NA NA

204
Montenegro Ver. 0.5 20Sept.2011
The tables below provide a vision of the length of judicial proceeding related data and indicators calculated on Cepej data by category of cases, at first, second and highest court level, both in 2006 and 2008.
Total of civil, commercial and administrative law cases (1-7)
Incoming cases Resolved cases Pending cases on 31 Dec.
First instance courts
Second instance courts
Highest instance courts
First instance courts
Second instance courts
Highest instance courts
First instance courts
Second instance courts
Highest instance courts
2.006 2.008 76298 6.354 855 77.371 7.384 930 33.951 5.254 2
Clearance Rate Case Turnover Ratio Disposition Time
First instance courts
Second instance courts
Highest instance courts
First instance courts
Second instance courts
Highest instance courts
First instance courts
Second instance courts
Highest instance courts
2.006 2.008 101% 116% 109% 228% 141% 46500% 160 260 1
Civil and commercial litigious cases (1)
Incoming cases Resolved cases Pending cases on 31 Dec.
First instance courts
Second instance courts
Highest instance courts
First instance courts
Second instance courts
Highest instance courts
First instance courts
Second instance courts
Highest instance courts
2.006 15.739 5.980 11 17.707 4.835 13 14.384 5.695 10 2.008 14.680 645 16.273 669 11.752 2
Clearance Rate Case Turnover Ratio Disposition Time
First instance courts
Second instance courts
Highest instance courts
First instance courts
Second instance courts
Highest instance courts
First instance courts
Second instance courts
Highest instance courts
2.006 113% 81% 118% 123% 85% 130% 297 430 281 2.008 111% 104% 138% 33450% 264 1
Total criminal cases (8+9)
Incoming cases Resolved cases Pending cases on 31 Dec.
First instance courts
Second instance courts
Highest instance courts
First instance courts
Second instance courts
Highest instance courts
First instance courts
Second instance courts
Highest instance courts
2.006 2.008 26.025 4.658 925 33.521 4.402 925 21.070 1.753
Clearance Rate Case Turnover Ratio Disposition Time
First instance courts
Second instance courts
Highest instance courts
First instance courts
Second instance courts
Highest instance courts
First instance courts
Second instance courts
Highest instance courts
2.006 2.008 129% 95% 100% 159% 251% 229 145
Criminal cases, severe criminal offences (8)
Incoming cases Resolved cases Pending cases on 31 Dec.
First instance courts
Second instance courts
Highest instance courts
First instance courts
Second instance courts
Highest instance courts
First instance courts
Second instance courts
Highest instance courts
2.006 7.304 3.385 280 7.176 3.084 280 8.554 1.363 2.008 8.501 10.752 6.097
Clearance Rate Case Turnover Ratio Disposition Time
First instance courts
Second instance courts
Highest instance courts
First instance courts
Second instance courts
Highest instance courts
First instance courts
Second instance courts
Highest instance courts
2.006 98% 91% 100% 84% 226% 435 161 2.008 126% 176% 207
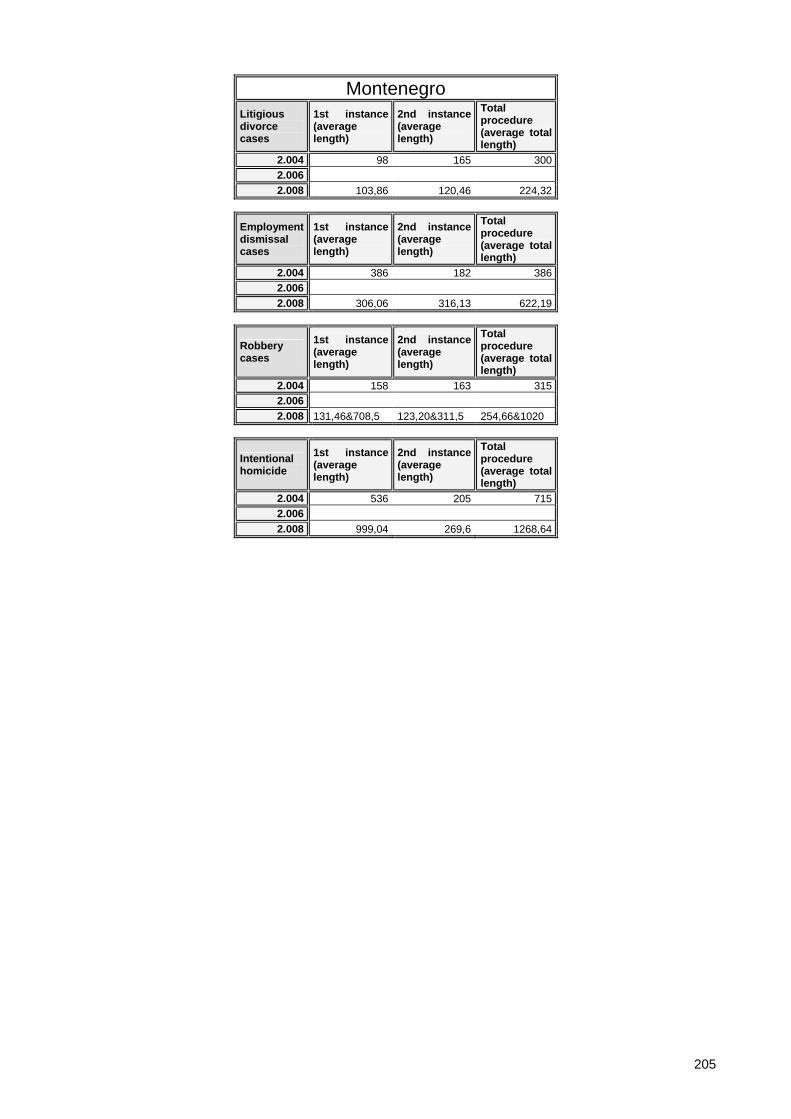
205
Montenegro Litigious divorce cases
1st instance (average length)
2nd instance (average length)
Total procedure (average total length)
2.004 98 165 300 2.006 2.008 103,86 120,46 224,32
Employment dismissal cases
1st instance (average length)
2nd instance (average length)
Total procedure (average total length)
2.004 386 182 386 2.006 2.008 306,06 316,13 622,19
Robbery cases
1st instance (average length)
2nd instance (average length)
Total procedure (average total length)
2.004 158 163 315 2.006 2.008 131,46&708,5 123,20&311,5 254,66&1020
Intentional homicide
1st instance (average length)
2nd instance (average length)
Total procedure (average total length)
2.004 536 205 715 2.006 2.008 999,04 269,6 1268,64

206
Netherlands Ver. 0.5 20Sept.2011
The tables below provide a vision of the length of judicial proceeding related data and indicators calculated on Cepej data by category of cases, at first, second and highest court level, both in 2006 and 2008.
Total of civil, commercial and administrative law cases (1-7)
Incoming cases Resolved cases Pending cases on 31 Dec.
First instance courts
Second instance courts
Highest instance courts
First instance courts
Second instance courts
Highest instance courts
First instance courts
Second instance courts
Highest instance courts
2.006 1197690 32.930 1.188.670 32.820 2.008 1270290 26.494 1.334 1.263.920 25.419 1.520 NA NA NA
Clearance Rate Case Turnover Ratio Disposition Time
First instance courts
Second instance courts
Highest instance courts
First instance courts
Second instance courts
Highest instance courts
First instance courts
Second instance courts
Highest instance courts
2.006 99% 100% 2.008 99% 96% 114%
Civil and commercial litigious cases (1)
Incoming cases Resolved cases Pending cases on 31 Dec.
First instance courts
Second instance courts
Highest instance courts
First instance courts
Second instance courts
Highest instance courts
First instance courts
Second instance courts
Highest instance courts
2.006 950.450 22.770 507 230.000 23.360 446 16.580 2.008 NA NA NA 200.000 NA NA NA NA NA
Clearance Rate Case Turnover Ratio Disposition Time
First instance courts
Second instance courts
Highest instance courts
First instance courts
Second instance courts
Highest instance courts
First instance courts
Second instance courts
Highest instance courts
2.006 24% 103% 88% 141% 259 2.008
Total criminal cases (8+9)
Incoming cases Resolved cases Pending cases on 31 Dec.
First instance courts
Second instance courts
Highest instance courts
First instance courts
Second instance courts
Highest instance courts
First instance courts
Second instance courts
Highest instance courts
2.006 434.950 2.008 499.847 37.910 3.683 501.910 36.367 3.370 NA NA NA
Clearance Rate Case Turnover Ratio Disposition Time
First instance courts
Second instance courts
Highest instance courts
First instance courts
Second instance courts
Highest instance courts
First instance courts
Second instance courts
Highest instance courts
2.006 2.008 100% 96% 92%
Criminal cases, severe criminal offences (8)
Incoming cases Resolved cases Pending cases on 31 Dec.
First instance courts
Second instance courts
Highest instance courts
First instance courts
Second instance courts
Highest instance courts
First instance courts
Second instance courts
Highest instance courts
2.006 3.540 156.160 24.740 3.079 13.510 2.008 220.634 NA NA 219.393 NA NA NA NA NA
Clearance Rate Case Turnover Ratio Disposition Time
First instance courts
Second instance courts
Highest instance courts
First instance courts
Second instance courts
Highest instance courts
First instance courts
Second instance courts
Highest instance courts
2.006 87% 183% 199 2.008 99%

207
Netherlands
Litigious divorce cases
1st instance (average length)
2nd instance (average length)
Total procedure (average total length)
2.004 308 237 2.006 308 2.008 331 217 NA
Employment dismissal cases
1st instance (average length)
2nd instance (average length)
Total procedure (average total length)
2.004 2.006 80 2.008 21 NAP NA
Robbery cases
1st instance (average length)
2nd instance (average length)
Total procedure (average total length)
2.004 150 2.006 2.008 35 231 NA
Intentional homicide
1st instance (average length)
2nd instance (average length)
Total procedure (average total length)
2.004 2.006 2.008 105 231 NA

208
Norway Ver. 0.5 20Sept.2011
The tables below provide a vision of the length of judicial proceeding related data and indicators calculated on Cepej data by category of cases, at first, second and highest court level, both in 2006 and 2008.
Total of civil, commercial and administrative law cases (1-7)
Incoming cases Resolved cases Pending cases on 31 Dec.
First instance courts
Second instance courts
Highest instance courts
First instance courts
Second instance courts
Highest instance courts
First instance courts
Second instance courts
Highest instance courts
2.006 40878 3.160 91 42.253 3.323 91 19.570 1.415 49 2.008 45765 3.222 72 43.671 3.288 88 22.066 1.161 29
Clearance Rate Case Turnover Ratio Disposition Time
First instance courts
Second instance courts
Highest instance courts
First instance courts
Second instance courts
Highest instance courts
First instance courts
Second instance courts
Highest instance courts
2.006 103% 105% 100% 216% 235% 186% 169 155 197 2.008 95% 102% 122% 198% 283% 303% 184 129 120
Civil and commercial litigious cases (1)
Incoming cases Resolved cases Pending cases on 31 Dec.
First instance courts
Second instance courts
Highest instance courts
First instance courts
Second instance courts
Highest instance courts
First instance courts
Second instance courts
Highest instance courts
2.006 13.335 13.737 7.050 2.008 16.104 16.928 6.861
Clearance Rate Case Turnover Ratio Disposition Time
First instance courts
Second instance courts
Highest instance courts
First instance courts
Second instance courts
Highest instance courts
First instance courts
Second instance courts
Highest instance courts
2.006 103% 195% 187 2.008 105% 247% 148
Total criminal cases (8+9)
Incoming cases Resolved cases Pending cases on 31 Dec.
First instance courts
Second instance courts
Highest instance courts
First instance courts
Second instance courts
Highest instance courts
First instance courts
Second instance courts
Highest instance courts
2.006 16.943 1.389 89 17.699 1.448 81 3.700 519 30 2.008 15.673 6.826 88 15.854 6.682 85 3.287 761 25
Clearance Rate Case Turnover Ratio Disposition Time
First instance courts
Second instance courts
Highest instance courts
First instance courts
Second instance courts
Highest instance courts
First instance courts
Second instance courts
Highest instance courts
2.006 104% 104% 91% 478% 279% 270% 76 131 135 2.008 101% 98% 97% 482% 878% 340% 76 42 107
Criminal cases, severe criminal offences (8)
Incoming cases Resolved cases Pending cases on 31 Dec.
First instance courts
Second instance courts
Highest instance courts
First instance courts
Second instance courts
Highest instance courts
First instance courts
Second instance courts
Highest instance courts
2.006 2.008 NA NA NA NA NA NA
Clearance Rate Case Turnover Ratio Disposition Time
First instance courts
Second instance courts
Highest instance courts
First instance courts
Second instance courts
Highest instance courts
First instance courts
Second instance courts
Highest instance courts
2.006 2.008

209
Norway
Litigious divorce cases
1st instance (average length)
2nd instance (average length)
Total procedure (average total length)
2.004 2.006 2.008 NAP NAP NAP
Employment dismissal cases
1st instance (average length)
2nd instance (average length)
Total procedure (average total length)
2.004 2.006 2.008 NA NA NA
Robbery cases
1st instance (average length)
2nd instance (average length)
Total procedure (average total length)
2.004 2.006 2.008 NA NA NA
Intentional homicide
1st instance (average length)
2nd instance (average length)
Total procedure (average total length)
2.004 2.006 2.008 NA NA NA
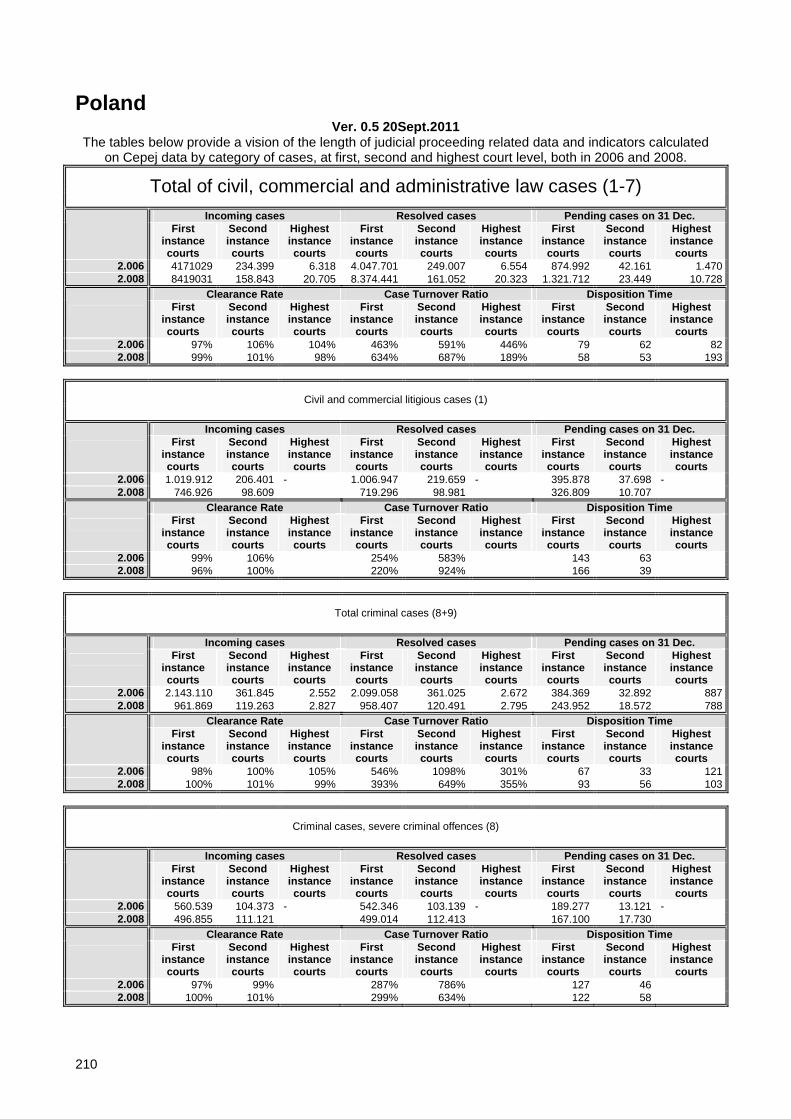
210
Poland Ver. 0.5 20Sept.2011
The tables below provide a vision of the length of judicial proceeding related data and indicators calculated on Cepej data by category of cases, at first, second and highest court level, both in 2006 and 2008.
Total of civil, commercial and administrative law cases (1-7)
Incoming cases Resolved cases Pending cases on 31 Dec.
First instance courts
Second instance courts
Highest instance courts
First instance courts
Second instance courts
Highest instance courts
First instance courts
Second instance courts
Highest instance courts
2.006 4171029 234.399 6.318 4.047.701 249.007 6.554 874.992 42.161 1.470 2.008 8419031 158.843 20.705 8.374.441 161.052 20.323 1.321.712 23.449 10.728
Clearance Rate Case Turnover Ratio Disposition Time
First instance courts
Second instance courts
Highest instance courts
First instance courts
Second instance courts
Highest instance courts
First instance courts
Second instance courts
Highest instance courts
2.006 97% 106% 104% 463% 591% 446% 79 62 82 2.008 99% 101% 98% 634% 687% 189% 58 53 193
Civil and commercial litigious cases (1)
Incoming cases Resolved cases Pending cases on 31 Dec.
First instance courts
Second instance courts
Highest instance courts
First instance courts
Second instance courts
Highest instance courts
First instance courts
Second instance courts
Highest instance courts
2.006 1.019.912 206.401 - 1.006.947 219.659 - 395.878 37.698 - 2.008 746.926 98.609 719.296 98.981 326.809 10.707
Clearance Rate Case Turnover Ratio Disposition Time
First instance courts
Second instance courts
Highest instance courts
First instance courts
Second instance courts
Highest instance courts
First instance courts
Second instance courts
Highest instance courts
2.006 99% 106% 254% 583% 143 63 2.008 96% 100% 220% 924% 166 39
Total criminal cases (8+9)
Incoming cases Resolved cases Pending cases on 31 Dec.
First instance courts
Second instance courts
Highest instance courts
First instance courts
Second instance courts
Highest instance courts
First instance courts
Second instance courts
Highest instance courts
2.006 2.143.110 361.845 2.552 2.099.058 361.025 2.672 384.369 32.892 887 2.008 961.869 119.263 2.827 958.407 120.491 2.795 243.952 18.572 788
Clearance Rate Case Turnover Ratio Disposition Time
First instance courts
Second instance courts
Highest instance courts
First instance courts
Second instance courts
Highest instance courts
First instance courts
Second instance courts
Highest instance courts
2.006 98% 100% 105% 546% 1098% 301% 67 33 121 2.008 100% 101% 99% 393% 649% 355% 93 56 103
Criminal cases, severe criminal offences (8)
Incoming cases Resolved cases Pending cases on 31 Dec.
First instance courts
Second instance courts
Highest instance courts
First instance courts
Second instance courts
Highest instance courts
First instance courts
Second instance courts
Highest instance courts
2.006 560.539 104.373 - 542.346 103.139 - 189.277 13.121 - 2.008 496.855 111.121 499.014 112.413 167.100 17.730
Clearance Rate Case Turnover Ratio Disposition Time
First instance courts
Second instance courts
Highest instance courts
First instance courts
Second instance courts
Highest instance courts
First instance courts
Second instance courts
Highest instance courts
2.006 97% 99% 287% 786% 127 46 2.008 100% 101% 299% 634% 122 58

211
Poland
Litigious divorce cases
1st instance (average length)
2nd instance (average length)
Total procedure (average total length)
2.004 204 2.006 179 89 NA 2.008 164,1 50,4 NA
Employment dismissal cases
1st instance (average length)
2nd instance (average length)
Total procedure (average total length)
2.004 2.006 154 84 NA 2.008 4,77 62,4 NA
Robbery cases
1st instance (average length)
2nd instance (average length)
Total procedure (average total length)
2.004 2.006 129 84 NA 2.008 333 324 NA
Intentional homicide
1st instance (average length)
2nd instance (average length)
Total procedure (average total length)
2.004 2.006 129 27 NA 2.008 141 45 NA

212
Portugal Ver. 0.5 20Sept.2011
The tables below provide a vision of the length of judicial proceeding related data and indicators calculated on Cepej data by category of cases, at first, second and highest court level, both in 2006 and 2008.
Total of civil, commercial and administrative law cases (1-7)
Incoming cases Resolved cases Pending cases on 31 Dec.
First instance courts
Second instance courts
Highest instance courts
First instance courts
Second instance courts
Highest instance courts
First instance courts
Second instance courts
Highest instance courts
2.006 575325 18.756 3.499 593.718 18.766 3.562 1.357.323 8.004 823 2.008 572657 17.751 2.969 544.515 17.869 3.025 1.380.012 5.950 755
Clearance Rate Case Turnover Ratio Disposition Time
First instance courts
Second instance courts
Highest instance courts
First instance courts
Second instance courts
Highest instance courts
First instance courts
Second instance courts
Highest instance courts
2.006 103% 100% 102% 44% 234% 433% 834 156 84 2.008 95% 101% 102% 39% 300% 401% 925 122 91
Civil and commercial litigious cases (1)
Incoming cases Resolved cases Pending cases on 31 Dec.
First instance courts
Second instance courts
Highest instance courts
First instance courts
Second instance courts
Highest instance courts
First instance courts
Second instance courts
Highest instance courts
2.006 282.590 316.649 389.168 2.008 314.729 311.797 367.573
Clearance Rate Case Turnover Ratio Disposition Time Civil and commercial litigious cases (1)
First instance courts
Second instance courts
Highest instance courts
First instance courts
Second instance courts
Highest instance courts
First instance courts
Second instance courts
Highest instance courts
2.006 112% 81% 449 2.008 99% 85% 430
Total criminal cases (8+9)
Incoming cases Resolved cases Pending cases on 31 Dec.
First instance courts
Second instance courts
Highest instance courts
First instance courts
Second instance courts
Highest instance courts
First instance courts
Second instance courts
Highest instance courts
2.006 175.856 10.986 1.387 169.813 10.992 1.405 207.744 6.004 284 2.008 144.852 13.297 1.221 211.892 12.957 1.352 123.428 3.634 146
Clearance Rate Case Turnover Ratio Disposition Time Total criminal cases (8+9)
First instance courts
Second instance courts
Highest instance courts
First instance courts
Second instance courts
Highest instance courts
First instance courts
Second instance courts
Highest instance courts
2.006 97% 100% 101% 82% 183% 495% 447 199 74 2.008 146% 97% 111% 172% 357% 926% 213 102 39
Criminal cases, severe criminal offences (8)
Incoming cases Resolved cases Pending cases on 31 Dec.
First instance courts
Second instance courts
Highest instance courts
First instance courts
Second instance courts
Highest instance courts
First instance courts
Second instance courts
Highest instance courts
2.006 115.934 10.986 1.387 110.977 10.992 1.405 146.466 6.004 284 2.008 116.178 13.297 1.221 130.962 12.957 1.352 109.387 3.634 146
Clearance Rate Case Turnover Ratio Disposition Time Criminal cases, severe criminal offences (8)
First instance courts
Second instance courts
Highest instance courts
First instance courts
Second instance courts
Highest instance courts
First instance courts
Second instance courts
Highest instance courts
2.006 96% 100% 101% 76% 183% 495% 482 199 74 2.008 113% 97% 111% 120% 357% 926% 305 102 39

213
Portugal
Litigious divorce cases
1st instance (average length)
2nd instance (average length)
Total procedure (average total length)
2.004 308 106 2.006 325 114 2.008 101
Employment dismissal cases
1st instance (average length)
2nd instance (average length)
Total procedure (average total length)
2.004 167 2.006 297 175 2.008 154
Robbery cases
1st instance (average length)
2nd instance (average length)
Total procedure (average total length)
2.004 346 102 2.006 349 104 2.008 78
Intentional homicide
1st instance (average length)
2nd instance (average length)
Total procedure (average total length)
2.004 292 115 2.006 363 132 2.008 92

214
Romania Ver. 0.5 20Sept.2011
The tables below provide a vision of the length of judicial proceeding related data and indicators calculated on Cepej data by category of cases, at first, second and highest court level, both in 2006 and 2008.
Total of civil, commercial and administrative law cases (1-7)
Incoming cases Resolved cases Pending cases on 31 Dec.
First instance courts
Second instance courts
Highest instance courts
First instance courts
Second instance courts
Highest instance courts
First instance courts
Second instance courts
Highest instance courts
2.006 1202168 35.799 183.863 1.152.328 41.804 184.495 278.776 15.322 40.929 2.008 1558687 32.390 21.099 1.495.976 32.006 16.979 405.429 14.243 13.394
Clearance Rate Case Turnover Ratio Disposition Time
First instance courts
Second instance courts
Highest instance courts
First instance courts
Second instance courts
Highest instance courts
First instance courts
Second instance courts
Highest instance courts
2.006 96% 117% 100% 413% 273% 451% 88 134 81 2.008 96% 99% 80% 369% 225% 127% 99 162 288
Civil and commercial litigious cases (1)
Incoming cases Resolved cases Pending cases on 31 Dec.
First instance courts
Second instance courts
Highest instance courts
First instance courts
Second instance courts
Highest instance courts
First instance courts
Second instance courts
Highest instance courts
2.006 546.222 24.093 112.141 522.112 28.421 118.275 141.931 11.529 27.824 2.008 706.381 31.612 15.602 664.608 31.153 12.146 287.768 13.897 11.056
Clearance Rate Case Turnover Ratio Disposition Time
First instance courts
Second instance courts
Highest instance courts
First instance courts
Second instance courts
Highest instance courts
First instance courts
Second instance courts
Highest instance courts
2.006 96% 118% 105% 368% 247% 425% 99 148 86 2.008 94% 99% 78% 231% 224% 110% 158 163 332
Total criminal cases (8+9)
Incoming cases Resolved cases Pending cases on 31 Dec.
First instance courts
Second instance courts
Highest instance courts
First instance courts
Second instance courts
Highest instance courts
First instance courts
Second instance courts
Highest instance courts
2.006 243.670 26.340 62.584 262.541 26.216 61.804 43.081 4.399 5.998 2.008 171.119 16.024 42 170.413 15.888 57 33.668 4.363 129
Clearance Rate Case Turnover Ratio Disposition Time
First instance courts
Second instance courts
Highest instance courts
First instance courts
Second instance courts
Highest instance courts
First instance courts
Second instance courts
Highest instance courts
2.006 108% 100% 99% 609% 596% 1030% 60 61 35 2.008 100% 99% 136% 506% 364% 44% 72 100 826
Criminal cases, severe criminal offences (8)
Incoming cases Resolved cases Pending cases on 31 Dec.
First instance courts
Second instance courts
Highest instance courts
First instance courts
Second instance courts
Highest instance courts
First instance courts
Second instance courts
Highest instance courts
2.006 - - - - - - 2.008 NAP NAP NAP NAP NAP NAP NAP NAP NAP
Clearance Rate Case Turnover Ratio Disposition Time
First instance courts
Second instance courts
Highest instance courts
First instance courts
Second instance courts
Highest instance courts
First instance courts
Second instance courts
Highest instance courts
2.006 2.008

215
Romania
Litigious divorce cases
1st instance (average length)
2nd instance (average length)
Total procedure (average total length)
2.004 189 183 2.006 2.008 NA NA NA
Employment dismissal cases
1st instance (average length)
2nd instance (average length)
Total procedure (average total length)
2.004 183 2.006 2.008 NA NA NA
Robbery cases
1st instance (average length)
2nd instance (average length)
Total procedure (average total length)
2.004 2.006 2.008 NA NA NA
Intentional homicide
1st instance (average length)
2nd instance (average length)
Total procedure (average total length)
2.004 2.006 2.008 NA NA NA

216
Russian Federation Ver. 0.5 20Sept.2011
The tables below provide a vision of the length of judicial proceeding related data and indicators calculated on Cepej data by category of cases, at first, second and highest court level, both in 2006 and 2008.
Total of civil, commercial and administrative law cases (1-7)
Incoming cases Resolved cases Pending cases on 31 Dec.
First instance courts
Second instance courts
Highest instance courts
First instance courts
Second instance courts
Highest instance courts
First instance courts
Second instance courts
Highest instance courts
2.006 12575000 651.404 112.569.000 614.015 506.000 26.986 2.008 16036000 872.000 258000/10000 16.135.000 845.000 153000/56000 417.000 45.000 6000/500
Clearance Rate Case Turnover Ratio Disposition Time
First instance courts
Second instance courts
Highest instance courts
First instance courts
Second instance courts
Highest instance courts
First instance courts
Second instance courts
Highest instance courts
2.006 895% 94% 22247% 2275% 2 16 2.008 101% 97% 3869% 1878% 9 19
Civil and commercial litigious cases (1)
Incoming cases Resolved cases Pending cases on 31 Dec.
First instance courts
Second instance courts
Highest instance courts
First instance courts
Second instance courts
Highest instance courts
First instance courts
Second instance courts
Highest instance courts
2.006 7.133.000 443.041 7.126.000 416.731 480.000 16.414 2.008 10.164.000 275.000 258000/10000 10.263.000 249.000 153000/10000 391.000 17.000 6000/500
Clearance Rate Case Turnover Ratio Disposition Time
First instance courts
Second instance courts
Highest instance courts
First instance courts
Second instance courts
Highest instance courts
First instance courts
Second instance courts
Highest instance courts
2.006 100% 94% 1485% 2539% 25 14 2.008 101% 91% 2625% 1465% 14 25
Total criminal cases (8+9)
Incoming cases Resolved cases Pending cases on 31 Dec.
First instance courts
Second instance courts
Highest instance courts
First instance courts
Second instance courts
Highest instance courts
First instance courts
Second instance courts
Highest instance courts
2.006 1.225.000 333.372 1.225.000 304.942 171.000 12.052 2.008 1.124.000 355.000 335000/25000 1.166.000 329.000 245000/25000 114.000 13.000 11000/1000
Clearance Rate Case Turnover Ratio Disposition Time
First instance courts
Second instance courts
Highest instance courts
First instance courts
Second instance courts
Highest instance courts
First instance courts
Second instance courts
Highest instance courts
2.006 100% 91% 716% 2530% 51 14 2.008 104% 93% 1023% 2531% 36 14
Criminal cases, severe criminal offences (8)
Incoming cases Resolved cases Pending cases on 31 Dec.
First instance courts
Second instance courts
Highest instance courts
First instance courts
Second instance courts
Highest instance courts
First instance courts
Second instance courts
Highest instance courts
2.006 437.000 437.000 61.000 2.008 347.000 NA NA 360.000 NA NA 35.000 NA NA
Clearance Rate Case Turnover Ratio Disposition Time
First instance courts
Second instance courts
Highest instance courts
First instance courts
Second instance courts
Highest instance courts
First instance courts
Second instance courts
Highest instance courts
2.006 100% 716% 51 2.008 104% 1029% 35
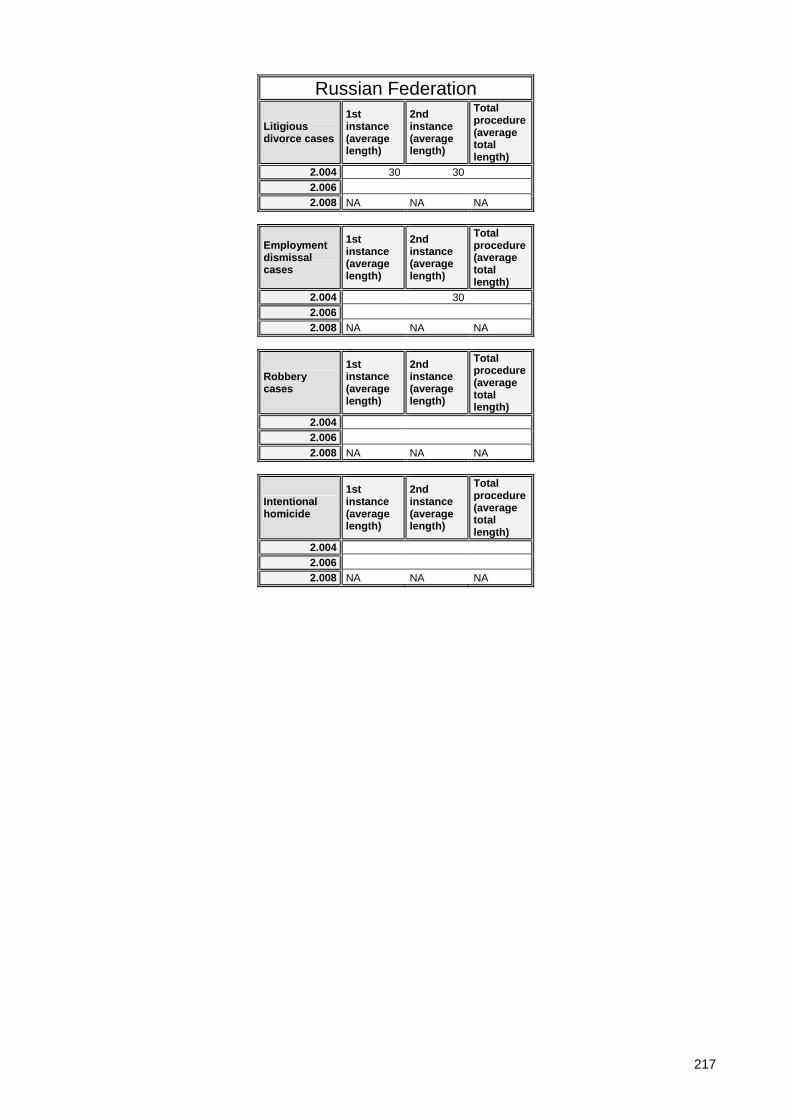
217
Russian Federation
Litigious divorce cases
1st instance (average length)
2nd instance (average length)
Total procedure (average total length)
2.004 30 30 2.006 2.008 NA NA NA
Employment dismissal cases
1st instance (average length)
2nd instance (average length)
Total procedure (average total length)
2.004 30 2.006 2.008 NA NA NA
Robbery cases
1st instance (average length)
2nd instance (average length)
Total procedure (average total length)
2.004 2.006 2.008 NA NA NA
Intentional homicide
1st instance (average length)
2nd instance (average length)
Total procedure (average total length)
2.004 2.006 2.008 NA NA NA

218
San Marino Ver. 0.5 20Sept.2011
The tables below provide a vision of the length of judicial proceeding related data and indicators calculated on Cepej data by category of cases, at first, second and highest court level, both in 2006 and 2008.
Total of civil, commercial and administrative law cases (1-7)
Incoming cases Resolved cases Pending cases on 31 Dec.
First instance courts
Second instance courts
Highest instance courts
First instance courts
Second instance courts
Highest instance courts
First instance courts
Second instance courts
Highest instance courts
2.006 2.008 1118 91 17 1.148 201 27 2.025 237 6
Clearance Rate Case Turnover Ratio Disposition Time
First instance courts
Second instance courts
Highest instance courts
First instance courts
Second instance courts
Highest instance courts
First instance courts
Second instance courts
Highest instance courts
2.006 2.008 103% 221% 159% 57% 85% 450% 644 430 81
Civil and commercial litigious cases (1)
Incoming cases Resolved cases Pending cases on 31 Dec.
First instance courts
Second instance courts
Highest instance courts
First instance courts
Second instance courts
Highest instance courts
First instance courts
Second instance courts
Highest instance courts
2.006 2.008 837 66 5 880 161 19 1.601 237
Clearance Rate Case Turnover Ratio Disposition Time
First instance courts
Second instance courts
Highest instance courts
First instance courts
Second instance courts
Highest instance courts
First instance courts
Second instance courts
Highest instance courts
2.006 2.008 105% 244% 380% 55% 68% 664 537
Total criminal cases (8+9)
Incoming cases Resolved cases Pending cases on 31 Dec.
First instance courts
Second instance courts
Highest instance courts
First instance courts
Second instance courts
Highest instance courts
First instance courts
Second instance courts
Highest instance courts
2.006 2.008 26 NAP 29 NAP 12 NAP
Clearance Rate Case Turnover Ratio Disposition Time
First
instance courts
Second instance courts
Highest instance courts
First instance courts
Second instance courts
Highest instance courts
First instance courts
Second instance courts
Highest instance courts
2.006 2.008 112% 242% 151
Criminal cases, severe criminal offences (8)
Incoming cases Resolved cases Pending cases on 31 Dec.
First instance courts
Second instance courts
Highest instance courts
First instance courts
Second instance courts
Highest instance courts
First instance courts
Second instance courts
Highest instance courts
2.006 2.008 524 26 651 29 469 12
Clearance Rate Case Turnover Ratio Disposition Time
First instance courts
Second instance courts
Highest instance courts
First instance courts
Second instance courts
Highest instance courts
First instance courts
Second instance courts
Highest instance courts
2.006 2.008 124% 112% 139% 242% 263 151

219
San Marino
Litigious divorce cases
1st instance (average length)
2nd instance (average length)
Total procedure (average total length)
2.004 2.006 2.008 NA NA NA
Employment dismissal cases
1st instance (average length)
2nd instance (average length)
Total procedure (average total length)
2.004 2.006 2.008 NA NA NA
Robbery cases
1st instance (average length)
2nd instance (average length)
Total procedure (average total length)
2.004 2.006 2.008 NA NA NA
Intentional homicide
1st instance (average length)
2nd instance (average length)
Total procedure (average total length)
2.004 2.006 2.008 NAP NAP NAP

220
Serbia Ver. 0.5 20Sept.2011
The tables below provide a vision of the length of judicial proceeding related data and indicators calculated on Cepej data by category of cases, at first, second and highest court level, both in 2006 and 2008.
Total of civil, commercial and administrative law cases (1-7)
Incoming cases Resolved cases Pending cases on 31 Dec.
First instance courts
Second instance courts
Highest instance courts
First instance courts
Second instance courts
Highest instance courts
First instance courts
Second instance courts
Highest instance courts
2.006 2.008 918108 81.353 1.108.702 84.742 324.632 39.711
Clearance Rate Case Turnover Ratio Disposition Time
First instance courts
Second instance courts
Highest instance courts
First instance courts
Second instance courts
Highest instance courts
First instance courts
Second instance courts
Highest instance courts
2.006 2.008 121% 104% 342% 213% 107 171
Civil and commercial litigious cases (1)
Incoming cases Resolved cases Pending cases on 31 Dec.
First instance courts
Second instance courts
Highest instance courts
First instance courts
Second instance courts
Highest instance courts
First instance courts
Second instance courts
Highest instance courts
2.006 144.356 78.329 8.352 158.036 70.010 9.019 100.236 24.087 3.355 2.008 191.862 8.891 222.818 8.775 1.398.556 3.671
Clearance Rate Case Turnover Ratio Disposition Time
First instance courts
Second instance courts
Highest instance courts
First instance courts
Second instance courts
Highest instance courts
First instance courts
Second instance courts
Highest instance courts
2.006 109% 89% 108% 158% 291% 269% 232 126 136 2.008 116% 99% 16% 239% 2.291 153
Total criminal cases (8+9)
Incoming cases Resolved cases Pending cases on 31 Dec.
First instance courts
Second instance courts
Highest instance courts
First instance courts
Second instance courts
Highest instance courts
First instance courts
Second instance courts
Highest instance courts
2.006 2.008 60.447 9.720 66.348 9.555 56.393 2.209
Clearance Rate Case Turnover Ratio Disposition Time
First instance courts
Second instance courts
Highest instance courts
First instance courts
Second instance courts
Highest instance courts
First instance courts
Second instance courts
Highest instance courts
2.006 2.008 110% 98% 118% 433% 310 84
Criminal cases, severe criminal offences (8)
Incoming cases Resolved cases Pending cases on 31 Dec.
First instance courts
Second instance courts
Highest instance courts
First instance courts
Second instance courts
Highest instance courts
First instance courts
Second instance courts
Highest instance courts
2.006 60.951 7.750 59.881 7.606 47.684 2.036 2.008 6.049 6.360 5.024
Clearance Rate Case Turnover Ratio Disposition Time
First instance courts
Second instance courts
Highest instance courts
First instance courts
Second instance courts
Highest instance courts
First instance courts
Second instance courts
Highest instance courts
2.006 98% 98% 126% 374% 291 98 2.008 105% 127% 288

221
Serbia
Litigious divorce cases
1st instance (average length)
2nd instance (average length)
Total procedure (average
total length)
2.004 NA NA NA 2.006 2.008 NA NA
Employment dismissal
cases
1st instance (average length)
2nd instance (average length)
Total procedure (average
total length)
2.004 n/a NA NA 2.006 2.008 NA NA
Robbery cases
1st instance (average length)
2nd instance (average length)
Total procedure (average
total length)
2.004 NA 2.006 2.008 NA NA
Intentional homicide
1st instance (average length)
2nd instance (average length)
Total procedure (average
total length)
2.004 2.006 2.008 NA NA

222
Slovakia Ver. 0.5 20Sept.2011
The tables below provide a vision of the length of judicial proceeding related data and indicators calculated on Cepej data by category of cases, at first, second and highest court level, both in 2006 and 2008.
Total of civil, commercial and administrative law cases (1-7)
Incoming cases Resolved cases Pending cases on 31 Dec.
First instance courts
Second instance courts
Highest instance courts
First instance courts
Second instance courts
Highest instance courts
First instance courts
Second instance courts
Highest instance courts
2.006 248507 28.412 8.386 281.862 26.576 8.850 239.740 11.240 3.526 2.008 1014863 31.534 7.466 1.046.081 32.451 7.148 392.728 9.521 2.944
Clearance Rate Case Turnover Ratio Disposition Time
First instance courts
Second instance courts
Highest instance courts
First instance courts
Second instance courts
Highest instance courts
First instance courts
Second instance courts
Highest instance courts
2.006 113% 94% 106% 118% 236% 251% 310 154 145 2.008 103% 103% 96% 266% 341% 243% 137 107 150
Civil and commercial litigious cases (1)
Incoming cases Resolved cases Pending cases on 31 Dec.
First instance courts
Second instance courts
Highest instance courts
First instance courts
Second instance courts
Highest instance courts
First instance courts
Second instance courts
Highest instance courts
2.006 122.002 23.865 139.767 22.127 148.276 9.955 2.008 128.924 140.626 133.416
Clearance Rate Case Turnover Ratio Disposition Time
First instance courts
Second instance courts
Highest instance courts
First instance courts
Second instance courts
Highest instance courts
First instance courts
Second instance courts
Highest instance courts
2.006 115% 93% 94% 222% 387 164 2.008 109% 105% 346
Total criminal cases (8+9)
Incoming cases Resolved cases Pending cases on 31 Dec.
First instance courts
Second instance courts
Highest instance courts
First instance courts
Second instance courts
Highest instance courts
First instance courts
Second instance courts
Highest instance courts
2.006 31.754 4.744 1.835 34.281 4.938 1.847 24.410 1.248 266 2.008 37.593 3.697 1.190 37.927 3.689 1.283 20.283 878 228
Clearance Rate Case Turnover Ratio Disposition Time
First instance courts
Second instance courts
Highest instance courts
First instance courts
Second instance courts
Highest instance courts
First instance courts
Second instance courts
Highest instance courts
2.006 108% 104% 101% 140% 396% 694% 260 92 53 2.008 101% 100% 108% 187% 420% 563% 195 87 65
Criminal cases, severe criminal offences (8)
Incoming cases Resolved cases Pending cases on 31 Dec.
First instance courts
Second instance courts
Highest instance courts
First instance courts
Second instance courts
Highest instance courts
First instance courts
Second instance courts
Highest instance courts
2.006 4.680 2.008 NA NA NA
Clearance Rate Case Turnover Ratio Disposition Time
First instance courts
Second instance courts
Highest instance courts
First instance courts
Second instance courts
Highest instance courts
First instance courts
Second instance courts
Highest instance courts
2.006 2.008

223
Slovakia
Litigious divorce cases
1st instance (average length)
2nd instance (average length)
Total procedure (average total length)
2.004 2.006 222 2.008 186
Employment dismissal cases
1st instance (average length)
2nd instance (average length)
Total procedure (average total length)
2.004 764 764 2.006 882,6 2.008 1109
Robbery cases
1st instance (average length)
2nd instance (average length)
Total procedure (average total length)
2.004 284 2.006 387 2.008 308
Intentional homicide
1st instance (average length)
2nd instance (average length)
Total procedure (average total length)
2.004 150 2.006 582 2.008 429

224
Slovenia Ver. 0.5 20Sept.2011
The tables below provide a vision of the length of judicial proceeding related data and indicators calculated on Cepej data by category of cases, at first, second and highest court level, both in 2006 and 2008.
Total of civil, commercial and administrative law cases (1-7)
Incoming cases Resolved cases Pending cases on 31 Dec.
First instance courts
Second instance courts
Highest instance courts
First instance courts
Second instance courts
Highest instance courts
First instance courts
Second instance courts
Highest instance courts
2.006 575494 27.151 2.390 594.693 28.227 1.811 449.540 11.340 1.944 2.008 581904 21.502 3.696 613.598 23.322 3.698 410.639 5.809 4.518
Clearance Rate Case Turnover Ratio Disposition Time
First instance courts
Second instance courts
Highest instance courts
First instance courts
Second instance courts
Highest instance courts
First instance courts
Second instance courts
Highest instance courts
2.006 103% 104% 76% 132% 249% 93% 276 147 392 2.008 105% 108% 100% 149% 401% 82% 244 91 446
Civil and commercial litigious cases (1)
Incoming cases Resolved cases Pending cases on 31 Dec.
First instance courts
Second instance courts
Highest instance courts
First instance courts
Second instance courts
Highest instance courts
First instance courts
Second instance courts
Highest instance courts
2.006 34.683 19.677 1.537 35.880 20.759 1.084 52.210 8.544 1.591 2.008 31.221 12.036 1.929 33.788 14.017 1.655 42.612 3.731 2.331
Clearance Rate Case Turnover Ratio Disposition Time
First instance courts
Second instance courts
Highest instance courts
First instance courts
Second instance courts
Highest instance courts
First instance courts
Second instance courts
Highest instance courts
2.006 103% 105% 71% 69% 243% 68% 531 150 536 2.008 108% 116% 86% 79% 376% 71% 460 97 514
Total criminal cases (8+9)
Incoming cases Resolved cases Pending cases on 31 Dec.
First instance courts
Second instance courts
Highest instance courts
First instance courts
Second instance courts
Highest instance courts
First instance courts
Second instance courts
Highest instance courts
2.006 154.933 10.888 938 139.817 10.930 1.026 122.979 2.092 296 2.008 97.885 10.951 1.023 117.216 10.261 1.080 85.625 2.375 211
Clearance Rate Case Turnover Ratio Disposition Time
First instance courts
Second instance courts
Highest instance courts
First instance courts
Second instance courts
Highest instance courts
First instance courts
Second instance courts
Highest instance courts
2.006 90% 100% 109% 114% 522% 347% 321 70 105 2.008 120% 94% 106% 137% 432% 512% 267 84 71
Criminal cases, severe criminal offences (8)
Incoming cases Resolved cases Pending cases on 31 Dec.
First instance courts
Second instance courts
Highest instance courts
First instance courts
Second instance courts
Highest instance courts
First instance courts
Second instance courts
Highest instance courts
2.006 19.145 4.975 896 20.035 4.995 989 23.260 1.544 266 2.008 19.386 4.794 898 20.505 4.916 924 21.903 1.100 191
Clearance Rate Case Turnover Ratio Disposition Time
First instance courts
Second instance courts
Highest instance courts
First instance courts
Second instance courts
Highest instance courts
First instance courts
Second instance courts
Highest instance courts
2.006 105% 100% 110% 86% 324% 372% 424 113 98 2.008 106% 103% 103% 94% 447% 484% 390 82 75

225
Slovenia
Litigious divorce cases
1st instance (average length)
2nd instance (average length)
Total procedure (average total length)
2.004 173 2.006 206 78 NA 2.008 191 60 NA
Employment dismissal cases
1st instance (average length)
2nd instance (average length)
Total procedure (average total length)
2.004 2.006 289 344 NA 2.008 236 255 NA
Robbery cases
1st instance (average length)
2nd instance (average length)
Total procedure (average total length)
2.004 2.006 NA NA NA 2.008 NA NA NA
Intentional homicide
1st instance (average length)
2nd instance (average length)
Total procedure (average total length)
2.004 2.006 NA NA NA 2.008 NA NA NA

226
Spain Ver. 0.5 20Sept.2011
The tables below provide a vision of the length of judicial proceeding related data and indicators calculated on Cepej data by category of cases, at first, second and highest court level, both in 2006 and 2008.
Total of civil, commercial and administrative law cases (1-7)
Incoming cases Resolved cases Pending cases on 31 Dec.
First instance courts
Second instance courts
Highest instance courts
First instance courts
Second instance courts
Highest instance courts
First instance courts
Second instance courts
Highest instance courts
2.006 2024371 194.721 17.717 1.833.225 197.746 25.179 2.012.079 129.573 34.225 2.008 2607873 193.520 24.620 2.105.604 191.064 30.357 2.604.034 119.391 38.319
Clearance Rate Case Turnover Ratio Disposition Time
First instance courts
Second instance courts
Highest instance courts
First instance courts
Second instance courts
Highest instance courts
First instance courts
Second instance courts
Highest instance courts
2.006 91% 102% 142% 91% 153% 74% 401 239 496 2.008 81% 99% 123% 81% 160% 79% 451 228 461
Civil and commercial litigious cases (1)
Incoming cases Resolved cases Pending cases on 31 Dec.
First instance courts
Second instance courts
Highest instance courts
First instance courts
Second instance courts
Highest instance courts
First instance courts
Second instance courts
Highest instance courts
2.006 1.169.750 150.888 9.637 1.094.505 148.958 12.310 781.754 78.947 16.918 2.008 1.620.717 143.715 16.643 1.324.577 148.729 21.157 1.074.748 74.805 24.889
Clearance Rate Case Turnover Ratio Disposition Time
First instance courts
Second instance courts
Highest instance courts
First instance courts
Second instance courts
Highest instance courts
First instance courts
Second instance courts
Highest instance courts
2.006 94% 99% 128% 140% 189% 73% 261 193 502 2.008 82% 103% 127% 123% 199% 85% 296 184 429
Total criminal cases (8+9)
Incoming cases Resolved cases Pending cases on 31 Dec.
First instance courts
Second instance courts
Highest instance courts
First instance courts
Second instance courts
Highest instance courts
First instance courts
Second instance courts
Highest instance courts
2.006 1.127.216 4.345 1.272.309 4.762 414.783 2.108 2.008 1.266.284 144.530 4.470 1.227.834 142.348 3.703 483.125 27.289 2.705
Clearance Rate Case Turnover Ratio Disposition Time
First instance courts
Second instance courts
Highest instance courts
First instance courts
Second instance courts
Highest instance courts
First instance courts
Second instance courts
Highest instance courts
2.006 113% 110% 307% 226% 119 162 2.008 97% 98% 83% 254% 522% 137% 144 70 267
Criminal cases, severe criminal offences (8)
Incoming cases Resolved cases Pending cases on 31 Dec.
First instance courts
Second instance courts
Highest instance courts
First instance courts
Second instance courts
Highest instance courts
First instance courts
Second instance courts
Highest instance courts
2.006 240.345 126.614 388.317 124.930 205.898 20.674 2.008 345.707 310.280 259.358
Clearance Rate Case Turnover Ratio Disposition Time
First instance courts
Second instance courts
Highest instance courts
First instance courts
Second instance courts
Highest instance courts
First instance courts
Second instance courts
Highest instance courts
2.006 162% 99% 189% 604% 194 60 2.008 90% 120% 305

227
Spain
Litigious divorce cases
1st instance (average length)
2nd instance (average length)
Total procedure (average total length)
2.004 251 2.006 227 2.008 261 NA NA
Employment dismissal cases
1st instance (average length)
2nd instance (average length)
Total procedure (average total length)
2.004 217 2.006 81 2.008 84 NA NA
Robbery cases
1st instance (average length)
2nd instance (average length)
Total procedure (average total length)
2.004 2.006 2.008 NA NA NA
Intentional homicide
1st instance (average length)
2nd instance (average length)
Total procedure (average total length)
2.004 2.006 2.008 NA NA NA

228
Sweden Ver. 0.5 20Sept.2011
The tables below provide a vision of the length of judicial proceeding related data and indicators calculated on Cepej data by category of cases, at first, second and highest court level, both in 2006 and 2008.
Total of civil, commercial and administrative law cases (1-7)
Incoming cases Resolved cases Pending cases on 31 Dec.
First instance courts
Second instance courts
Highest instance courts
First instance courts
Second instance courts
Highest instance courts
First instance courts
Second instance courts
Highest instance courts
2.006 64264 37.870 11.796 65.212 10.813 35.773 16.224 8.854 2.008 172206 23.632 5.420 182.808 24.128 5.221 70.136 6.484 1.318
Clearance Rate Case Turnover Ratio Disposition Time
First instance courts
Second instance courts
Highest instance courts
First instance courts
Second instance courts
Highest instance courts
First instance courts
Second instance courts
Highest instance courts
2.006 101% 92% 182% 122% 200 299 2.008 106% 102% 96% 261% 372% 396% 140 98 92
Civil and commercial litigious cases (1)
Incoming cases Resolved cases Pending cases on 31 Dec.
First instance courts
Second instance courts
Highest instance courts
First instance courts
Second instance courts
Highest instance courts
First instance courts
Second instance courts
Highest instance courts
2.006 32.514 2.605 558 31.501 581 17.765 1.471 200 2.008 51.348 2.752 588 50.845 2.811 566 27.433 1.408 222
Clearance Rate Case Turnover Ratio Disposition Time
First instance courts
Second instance courts
Highest instance courts
First instance courts
Second instance courts
Highest instance courts
First instance courts
Second instance courts
Highest instance courts
2.006 97% 104% 177% 291% 206 126 2.008 99% 102% 96% 185% 200% 255% 197 183 143
Total criminal cases (8+9)
Incoming cases Resolved cases Pending cases on 31 Dec.
First instance courts
Second instance courts
Highest instance courts
First instance courts
Second instance courts
Highest instance courts
First instance courts
Second instance courts
Highest instance courts
2.006 71.426 8.767 1.524 72.604 1.583 28.569 3.603 196 2.008 83.037 9.030 1.554 82.504 9.276 1.494 30.697 3.341 281
Clearance Rate Case Turnover Ratio Disposition Time
First instance courts
Second instance courts
Highest instance courts
First instance courts
Second instance courts
Highest instance courts
First instance courts
Second instance courts
Highest instance courts
2.006 102% 104% 254% 808% 144 45 2.008 99% 103% 96% 269% 278% 532% 136 131 69
Criminal cases, severe criminal offences (8)
Incoming cases Resolved cases Pending cases on 31 Dec.
First instance courts
Second instance courts
Highest instance courts
First instance courts
Second instance courts
Highest instance courts
First instance courts
Second instance courts
Highest instance courts
2.006 2.008 NAP NAP NAP NAP NAP NAP NAP NAP NAP
Clearance Rate Case Turnover Ratio Disposition Time
First instance courts
Second instance courts
Highest instance courts
First instance courts
Second instance courts
Highest instance courts
First instance courts
Second instance courts
Highest instance courts
2.006 2.008

229
Sweden
Litigious divorce cases
1st instance (average length)
2nd instance (average length)
Total procedure (average total length)
2.004 2.006 183 2.008 234 NAP NA
Employment dismissal cases
1st instance (average length)
2nd instance (average length)
Total procedure (average total length)
2.004 2.006 2.008 NA NA NA
Robbery cases
1st instance (average length)
2nd instance (average length)
Total procedure (average total length)
2.004 2.006 2.008 NAP NAP NAP
Intentional homicide
1st instance (average length)
2nd instance (average length)
Total procedure (average total length)
2.004 2.006 2.008 NAP NAP NAP

230
Switzerland Ver. 0.5 20Sept.2011
The tables below provide a vision of the length of judicial proceeding related data and indicators calculated on Cepej data by category of cases, at first, second and highest court level, both in 2006 and 2008.
Total of civil, commercial and administrative law cases (1-7)
Incoming cases Resolved cases Pending cases on 31 Dec.
First instance courts
Second instance courts
Highest instance courts
First instance courts
Second instance courts
Highest instance courts
First instance courts
Second instance courts
Highest instance courts
2.006 347295 32.778 7.239 325.448 30.701 7.004 173.583 14.449 3.291 2.008 156936 43.665 5.729 156.666 44.352 6.106 54.970 25.729 1.962
Clearance Rate Case Turnover Ratio Disposition Time
First instance courts
Second instance courts
Highest instance courts
First instance courts
Second instance courts
Highest instance courts
First instance courts
Second instance courts
Highest instance courts
2.006 94% 94% 97% 187% 212% 213% 195 172 172 2.008 100% 102% 107% 285% 172% 311% 128 212 117
Civil and commercial litigious cases (1)
Incoming cases Resolved cases Pending cases on 31 Dec.
First instance courts
Second instance courts
Highest instance courts
First instance courts
Second instance courts
Highest instance courts
First instance courts
Second instance courts
Highest instance courts
2.006 770 757 271 2.008 87.232 10.894 1.506 88.114 11.184 1.530 40.636 3.943 402
Clearance Rate Case Turnover Ratio Disposition Time
First instance courts
Second instance courts
Highest instance courts
First instance courts
Second instance courts
Highest instance courts
First instance courts
Second instance courts
Highest instance courts
2.006 98% 279% 131 2.008 101% 103% 102% 217% 284% 381% 168 129 96
Total criminal cases (8+9)
Incoming cases Resolved cases Pending cases on 31 Dec.
First instance courts
Second instance courts
Highest instance courts
First instance courts
Second instance courts
Highest instance courts
First instance courts
Second instance courts
Highest instance courts
2.006 189.014 13.964 621 195.370 12.448 622 30.483 3.783 164 2.008 79.166 10.563 1.418 78.339 10.691 1.409 11.941 3.399 323
Clearance Rate Case Turnover Ratio Disposition Time
First instance courts
Second instance courts
Highest instance courts
First instance courts
Second instance courts
Highest instance courts
First instance courts
Second instance courts
Highest instance courts
2.006 103% 89% 100% 641% 329% 379% 57 111 96 2.008 99% 101% 99% 656% 315% 436% 56 116 84
Criminal cases, severe criminal offences (8)
Incoming cases Resolved cases Pending cases on 31 Dec.
First instance courts
Second instance courts
Highest instance courts
First instance courts
Second instance courts
Highest instance courts
First instance courts
Second instance courts
Highest instance courts
2.006 2.008 17.966 4.742 NA 16.819 4.858 NA 9.263 1.481 NA
Clearance Rate Case Turnover Ratio Disposition Time
First instance courts
Second instance courts
Highest instance courts
First instance courts
Second instance courts
Highest instance courts
First instance courts
Second instance courts
Highest instance courts
2.006 2.008 94% 102% 182% 328% 201 111
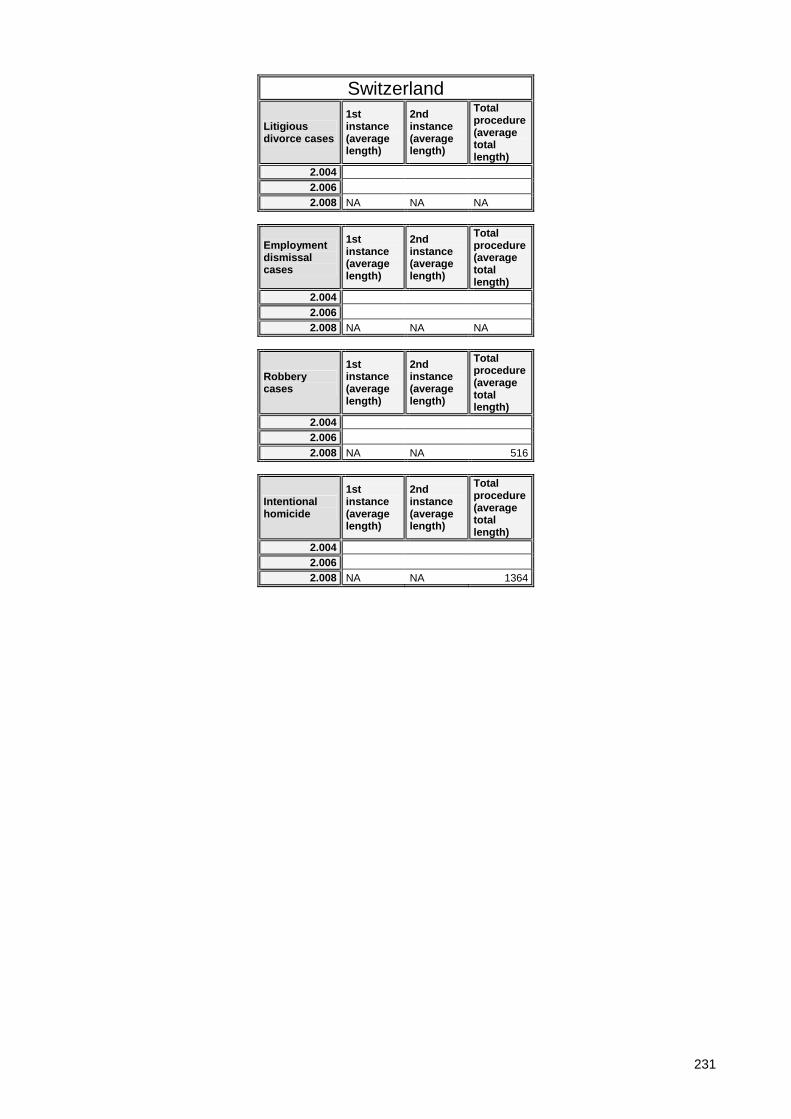
231
Switzerland
Litigious divorce cases
1st instance (average length)
2nd instance (average length)
Total procedure (average total length)
2.004 2.006 2.008 NA NA NA
Employment dismissal cases
1st instance (average length)
2nd instance (average length)
Total procedure (average total length)
2.004 2.006 2.008 NA NA NA
Robbery cases
1st instance (average length)
2nd instance (average length)
Total procedure (average total length)
2.004 2.006 2.008 NA NA 516
Intentional homicide
1st instance (average length)
2nd instance (average length)
Total procedure (average total length)
2.004 2.006 2.008 NA NA 1364

232
Turkey Ver. 0.5 20Sept.2011
The tables below provide a vision of the length of judicial proceeding related data and indicators calculated on Cepej data by category of cases, at first, second and highest court level, both in 2006 and 2008.
Total of civil, commercial and administrative law cases (1-7)
Incoming cases Resolved cases Pending cases on 31 Dec.
First instance courts
Second instance courts
Highest instance courts
First instance courts
Second instance courts
Highest instance courts
First instance courts
Second instance courts
Highest instance courts
2.006 1774747 412.519 1.702.445 390.141 960.948 171.161 2.008 3572324 3.473.868 1.150.594
Clearance Rate Case Turnover Ratio Disposition Time
First instance courts
Second instance courts
Highest instance courts
First instance courts
Second instance courts
Highest instance courts
First instance courts
Second instance courts
Highest instance courts
2.006 96% 95% 177% 228% 206 160 2.008 97% 302% 121
Civil and commercial litigious cases (1)
Incoming cases Resolved cases Pending cases on 31 Dec.
First instance courts
Second instance courts
Highest instance courts
First instance courts
Second instance courts
Highest instance courts
First instance courts
Second instance courts
Highest instance courts
2.006 1.307.698 325.641 1.264.886 144.204 724.998 141.005 2.008 1.117.212 480.568 1.069.043 425.393 NA 269.551
Clearance Rate Case Turnover Ratio Disposition Time
First instance courts
Second instance courts
Highest instance courts
First instance courts
Second instance courts
Highest instance courts
First instance courts
Second instance courts
Highest instance courts
2.006 97% 44% 174% 102% 209 357 2.008 96% 89% 158% 231
Total criminal cases (8+9)
Incoming cases Resolved cases Pending cases on 31 Dec.
First instance courts
Second instance courts
Highest instance courts
First instance courts
Second instance courts
Highest instance courts
First instance courts
Second instance courts
Highest instance courts
2.006 1.659.143 149.974 1.571.930 144.204 1.137.839 141.005 2.008 1.716.821 245.604 1.848.906 197.375 1.211.733 242.547
Clearance Rate Case Turnover Ratio Disposition Time
First instance courts
Second instance courts
Highest instance courts
First instance courts
Second instance courts
Highest instance courts
First instance courts
Second instance courts
Highest instance courts
2.006 95% 96% 138% 102% 264 357 2.008 108% 80% 153% 81% 239 449
Criminal cases, severe criminal offences (8)
Incoming cases Resolved cases Pending cases on 31 Dec.
First instance courts
Second instance courts
Highest instance courts
First instance courts
Second instance courts
Highest instance courts
First instance courts
Second instance courts
Highest instance courts
2.006 692.987 149.974 725.418 144.204 697.686 141.005 2.008 796.920 NAP 758.610 NAP 720.127 NAP
Clearance Rate Case Turnover Ratio Disposition Time
First instance courts
Second instance courts
Highest instance courts
First instance courts
Second instance courts
Highest instance courts
First instance courts
Second instance courts
Highest instance courts
2.006 105% 96% 104% 102% 351 357 2.008 95% 105% 346

233
Turkey
Litigious divorce cases
1st instance (average length)
2nd instance (average length)
Total procedure (average total length)
2.004 2.006 153 2.008 152 NA NA
Employment dismissal cases
1st instance (average length)
2nd instance (average length)
Total procedure (average total length)
2.004 2.006 NA 2.008 NA NA NA
Robbery cases
1st instance (average length)
2nd instance (average length)
Total procedure (average total length)
2.004 2.006 311 2.008 433 NA NA
Intentional homicide
1st instance (average length)
2nd instance (average length)
Total procedure (average total length)
2.004 2.006 333 2.008 334 NA NA

234
UK-England and Wales Ver. 0.5 20Sept.2011
The tables below provide a vision of the length of judicial proceeding related data and indicators calculated on Cepej data by category of cases, at first, second and highest court level, both in 2006 and 2008.
Total of civil, commercial and administrative law cases (1-7)
Incoming cases Resolved cases Pending cases on 31 Dec.
First instance courts
Second instance courts
Highest instance courts
First instance courts
Second instance courts
Highest instance courts
First instance courts
Second instance courts
Highest instance courts
2.006 2157361 64.520 2.008 2426357 3.294 51 NA 3.094 64 NA NA NA
Clearance Rate Case Turnover Ratio Disposition Time
First instance courts
Second instance courts
Highest instance courts
First instance courts
Second instance courts
Highest instance courts
First instance courts
Second instance courts
Highest instance courts
2.006 3% 2.008 94% 125%
Civil and commercial litigious cases (1)
Incoming cases Resolved cases Pending cases on 31 Dec.
First instance courts
Second instance courts
Highest instance courts
First instance courts
Second instance courts
Highest instance courts
First instance courts
Second instance courts
Highest instance courts
2.006 2.127.928 46.198 2.008 298.769 3.294 51 NA 3.094 64 NA NA NA
Clearance Rate Case Turnover Ratio Disposition Time
First instance courts
Second instance courts
Highest instance courts
First instance courts
Second instance courts
Highest instance courts
First instance courts
Second instance courts
Highest instance courts
2.006 2% 2.008 94% 125%
Total criminal cases (8+9)
Incoming cases Resolved cases Pending cases on 31 Dec.
First instance courts
Second instance courts
Highest instance courts
First instance courts
Second instance courts
Highest instance courts
First instance courts
Second instance courts
Highest instance courts
2.006 1.054.882 164.595 2.008 NA 21.259 11 2.160.172 19.782 18 0 NA NA
Clearance Rate Case Turnover Ratio Disposition Time
First instance courts
Second instance courts
Highest instance courts
First instance courts
Second instance courts
Highest instance courts
First instance courts
Second instance courts
Highest instance courts
2.006 2.008 93% 164%
Criminal cases, severe criminal offences (8)
Incoming cases Resolved cases Pending cases on 31 Dec.
First instance courts
Second instance courts
Highest instance courts
First instance courts
Second instance courts
Highest instance courts
First instance courts
Second instance courts
Highest instance courts
2.006 392.288 109.524 13.523 70.610 52.542 3.566 2.008 131.696 7.240 11 129.072 5.774 18 41.582 NA NA
Clearance Rate Case Turnover Ratio Disposition Time
First instance courts
Second instance courts
Highest instance courts
First instance courts
Second instance courts
Highest instance courts
First instance courts
Second instance courts
Highest instance courts
2.006 2.008 98% 80% 164% 310% 118

235
UK-England and Wales
Litigious divorce cases
1st instance (average length)
2nd instance (average length)
Total procedure (average total length)
2.004 2.006 2.008 225 NA NA
Employment dismissal cases
1st instance (average length)
2nd instance (average length)
Total procedure (average total length)
2.004 2.006 2.008 NAP NAP NAP
Robbery cases
1st instance (average length)
2nd instance (average length)
Total procedure (average total length)
2.004 2.006 2.008 NA NA NA
Intentional homicide
1st instance (average length)
2nd instance (average length)
Total procedure (average total length)
2.004 2.006 2.008 NA NA NA

236
UK-Northern Ireland Ver. 0.5 20Sept.2011
The tables below provide a vision of the length of judicial proceeding related data and indicators calculated on Cepej data by category of cases, at first, second and highest court level, both in 2006 and 2008.
Total of civil, commercial and administrative law cases (1-7)
Incoming cases Resolved cases Pending cases on 31 Dec.
First instance courts
Second instance courts
Highest instance courts
First instance courts
Second instance courts
Highest instance courts
First instance courts
Second instance courts
Highest instance courts
2.006 2.008 NA NA NA NA NA NA NA NA NA
Clearance Rate Case Turnover Ratio Disposition Time
First instance courts
Second instance courts
Highest instance courts
First instance courts
Second instance courts
Highest instance courts
First instance courts
Second instance courts
Highest instance courts
2.006 2.008
Civil and commercial litigious cases (1)
Incoming cases Resolved cases Pending cases on 31 Dec.
First instance courts
Second instance courts
Highest instance courts
First instance courts
Second instance courts
Highest instance courts
First instance courts
Second instance courts
Highest instance courts
2.006 2.008 NA NA NA NA NA NA NA NA NA
Clearance Rate Case Turnover Ratio Disposition Time
First instance courts
Second instance courts
Highest instance courts
First instance courts
Second instance courts
Highest instance courts
First instance courts
Second instance courts
Highest instance courts
2.006 2.008
Total criminal cases (8+9)
Incoming cases Resolved cases Pending cases on 31 Dec.
First instance courts
Second instance courts
Highest instance courts
First instance courts
Second instance courts
Highest instance courts
First instance courts
Second instance courts
Highest instance courts
2.006 2.008 NA NA NA NA NA NA NA NA NA
Clearance Rate Case Turnover Ratio Disposition Time
First instance courts
Second instance courts
Highest instance courts
First instance courts
Second instance courts
Highest instance courts
First instance courts
Second instance courts
Highest instance courts
2.006 2.008
Criminal cases, severe criminal offences (8)
Incoming cases Resolved cases Pending cases on 31 Dec.
First instance courts
Second instance courts
Highest instance courts
First instance courts
Second instance courts
Highest instance courts
First instance courts
Second instance courts
Highest instance courts
2.006 2.008 NA NA NA NA NA NA NA NA NA
Clearance Rate Case Turnover Ratio Disposition Time
First instance courts
Second instance courts
Highest instance courts
First instance courts
Second instance courts
Highest instance courts
First instance courts
Second instance courts
Highest instance courts
2.006 2.008

237
UK-Northern Ireland
Litigious divorce cases
1st instance (average length)
2nd instance (average length)
Total procedure (average total length)
2.004 224 2.006 2.008 NA NA NA
Employment dismissal cases
1st instance (average length)
2nd instance (average length)
Total procedure (average total length)
2.004 2.006 2.008 NA NA NA
Robbery cases
1st instance (average length)
2nd instance (average length)
Total procedure (average total length)
2.004 2.006 2.008 NA NA NA
Intentional homicide
1st instance (average length)
2nd instance (average length)
Total procedure (average total length)
2.004 2.006 2.008 NA NA NA

238
UK-Scotland Ver. 0.5 20Sept.2011
The tables below provide a vision of the length of judicial proceeding related data and indicators calculated on Cepej data by category of cases, at first, second and highest court level, both in 2006 and 2008.
Total of civil, commercial and administrative law cases (1-7)
Incoming cases Resolved cases Pending cases on 31 Dec.
First instance courts
Second instance courts
Highest instance courts
First instance courts
Second instance courts
Highest instance courts
First instance courts
Second instance courts
Highest instance courts
2.006 240000 2.008 165500 215 3.904 NA 130 3.385 NA NA NA
Clearance Rate Case Turnover Ratio Disposition Time
First instance courts
Second instance courts
Highest instance courts
First instance courts
Second instance courts
Highest instance courts
First instance courts
Second instance courts
Highest instance courts
2.006 2.008 60% 87%
Civil and commercial litigious cases (1)
Incoming cases Resolved cases Pending cases on 31 Dec.
First instance courts
Second instance courts
Highest instance courts
First instance courts
Second instance courts
Highest instance courts
First instance courts
Second instance courts
Highest instance courts
2.006 140.000 2.008 NA 215 3.904 NA 130 3.385 NA NA NA
Clearance Rate Case Turnover Ratio Disposition Time
First instance courts
Second instance courts
Highest instance courts
First instance courts
Second instance courts
Highest instance courts
First instance courts
Second instance courts
Highest instance courts
2.006 2.008 60% 87%
Total criminal cases (8+9)
Incoming cases Resolved cases Pending cases on 31 Dec.
First instance courts
Second instance courts
Highest instance courts
First instance courts
Second instance courts
Highest instance courts
First instance courts
Second instance courts
Highest instance courts
2.006 2.008 112.804 2.347 951 133.076 2.254 804 NA NA NA
Clearance Rate Case Turnover Ratio Disposition Time
First instance courts
Second instance courts
Highest instance courts
First instance courts
Second instance courts
Highest instance courts
First instance courts
Second instance courts
Highest instance courts
2.006 2.008 118% 96% 85%
Criminal cases, severe criminal offences (8)
Incoming cases Resolved cases Pending cases on 31 Dec.
First instance courts
Second instance courts
Highest instance courts
First instance courts
Second instance courts
Highest instance courts
First instance courts
Second instance courts
Highest instance courts
2.006 2.008 6.130 786 NA 46.785 1.397 NA NA NA NA
Clearance Rate Case Turnover Ratio Disposition Time
First instance courts
Second instance courts
Highest instance courts
First instance courts
Second instance courts
Highest instance courts
First instance courts
Second instance courts
Highest instance courts
2.006 2.008 763% 178%

239
UK-Scotland
Litigious divorce cases
1st instance (average length)
2nd instance (average length)
Total procedure (average total length)
2.004 2.006 2.008 NA NA NA
Employment dismissal cases
1st instance (average length)
2nd instance (average length)
Total procedure (average total length)
2.004 2.006 2.008 NA NA NA
Robbery cases
1st instance (average length)
2nd instance (average length)
Total procedure (average total length)
2.004 2.006 2.008 NA NA NA
Intentional homicide
1st instance (average length)
2nd instance (average length)
Total procedure (average total length)
2.004 2.006 2.008 NA NA NA

240
Ukraine Ver. 0.5 20Sept.2011
The tables below provide a vision of the length of judicial proceeding related data and indicators calculated on Cepej data by category of cases, at first, second and highest court level, both in 2006 and 2008.
Total of civil, commercial and administrative law cases (1-7)
Incoming cases Resolved cases Pending cases on 31 Dec.
First instance courts
Second instance courts
Highest instance courts
First instance courts
Second instance courts
Highest instance courts
First instance courts
Second instance courts
Highest instance courts
2.006 16.000 36.000 2.008 2749654 248.848 102.500 2.626.449 95.023 27.500 NA
Clearance Rate Case Turnover Ratio Disposition Time
First instance courts
Second instance courts
Highest instance courts
First instance courts
Second instance courts
Highest instance courts
First instance courts
Second instance courts
Highest instance courts
2.006 2.008 96% 38% 27%
Civil and commercial litigious cases (1)
Incoming cases Resolved cases Pending cases on 31 Dec.
First instance courts
Second instance courts
Highest instance courts
First instance courts
Second instance courts
Highest instance courts
First instance courts
Second instance courts
Highest instance courts
2.006 16.000 36.000 2.008 NA NAP NAP NA NAP NAP NA NAP NAP
Clearance Rate Case Turnover Ratio Disposition Time
First instance courts
Second instance courts
Highest instance courts
First instance courts
Second instance courts
Highest instance courts
First instance courts
Second instance courts
Highest instance courts
2.006 2.008
Total criminal cases (8+9)
Incoming cases Resolved cases Pending cases on 31 Dec.
First instance courts
Second instance courts
Highest instance courts
First instance courts
Second instance courts
Highest instance courts
First instance courts
Second instance courts
Highest instance courts
2.006 25.488 26.496 3.112 2.008 522.332 46.427 16.800 576.850 46.463 16.200 34.100 NA NA
Clearance Rate Case Turnover Ratio Disposition Time
First instance courts
Second instance courts
Highest instance courts
First instance courts
Second instance courts
Highest instance courts
First instance courts
Second instance courts
Highest instance courts
2.006 104% 851% 43 2.008 110% 100% 96% 1692% 22
Criminal cases, severe criminal offences (8)
Incoming cases Resolved cases Pending cases on 31 Dec.
First instance courts
Second instance courts
Highest instance courts
First instance courts
Second instance courts
Highest instance courts
First instance courts
Second instance courts
Highest instance courts
2.006 2.008 NAP NAP NAP NAP NAP NAP NAP NAP NAP
Clearance Rate Case Turnover Ratio Disposition Time
First instance courts
Second instance courts
Highest instance courts
First instance courts
Second instance courts
Highest instance courts
First instance courts
Second instance courts
Highest instance courts
2.006 2.008

241
Ukraine
Litigious divorce cases
1st instance (average length)
2nd instance (average length)
Total procedure (average total length)
2.004 2.006 2.008
Employment dismissal cases
1st instance (average length)
2nd instance (average length)
Total procedure (average total length)
2.004 2.006 2.008
Robbery cases
1st instance (average length)
2nd instance (average length)
Total procedure (average total length)
2.004 2.006 2.008
Intentional homicide
1st instance (average length)
2nd instance (average length)
Total procedure (average total length)
2.004 2.006 2.008


![[Eng] Topic Training - Buckling lengths for steel 14.0](https://static.fdokumen.com/doc/165x107/63135415c72bc2f2dd03fc03/eng-topic-training-buckling-lengths-for-steel-140.jpg)