Characterizing multisegment foot kinematics during gait in diabetic foot patients
Upload
khangminh22Category
view
2download
0
Occupational Ergonomics 13 (2016) 53–66 53DOI 10.3233/OER-160236IOS Press
Study of the biodynamic response of the footto vibration exposure
Katie Gogginsa,b,c,∗, Alison Godwinb,c, Celine Lariviereb,c and Tammy Egerb,caBharti School of Engineering, Laurentian University, Sudbury, ON, CanadabSchool of Human Kinetics, Laurentian University, Sudbury, ON, CanadacCentre for Research in Occupational Safety and Health, Laurentian University, Sudbury, ON, Canadas
Abstract.BACKGROUND: Exposure to foot-transmitted vibration (FTV) has been linked to injury; however, the biodynamic responseof the foot to FTV has not been quantified.OBJECTIVE: The objective was to measure vibration transmissibility from the floor-to-ankle, and the floor-to-metatarsal,during exposure to FTV while standing, and to determine if FTV exposure frequency, or participant mass or arch index (AI)influence the transmission of FTV through the foot.METHODS: Participants’ AI was measured. Four ADXL326, tri-axial accelerometers were utilized to measure vibration onthe platform medial to distal head of first metatarsal, on the distal head of first metatarsal, on the platform paralleling the medialmalleolus, and on the lateral malleolus. Participants were randomly exposed to FTV at 25 Hz, 30 Hz, 35 Hz, 40 Hz, 45 Hz, and50 Hz for 45 seconds.RESULTS: Neither the three-way interaction of location*frequency*AI [λ = 0.816, F(5,24) = 1.080, p = 0.396] or loca-tion*frequency*mass [λ = 0.959, F(5,24) = 0.203, p = 0.958] were significant (p < 0.05). The location*frequency interactionwas significant [λ = 0.246, F(5,25) = 15.365, p = 0.0001]. Differences in mean transmissibility between the ankle andmetatarsal were significant at 40 Hz, 45 Hz, and 50 Hz (p < 0.001).CONCLUSIONS: The greatest transmissibility magnitude measured at the metatarsal and ankle occurred at 50 Hz and 25–30 Hz respectively, suggesting the formation of a local resonance at each location.
Keywords: Foot-transmitted vibration, standing vibration, biodynamic response, vibration-induced white-feet
1. Introduction
Exposure to foot-transmitted vibration (FTV) occurs when vibration enters the body at the feet andis transmitted through the feet and legs from vibrating tools, vibrating machinery, or standing on vi-brating platforms or surfaces [1–3]. FTV exposure has been reported in mining, farming, forestry andconstruction [2,4–6]. Miners can be exposed to FTV when operating locomotives, bolters, jumbo drills,or drills attached to platforms workers stand on [2] and several researchers have published reports indi-cating miners have reported pain, discomfort, and blanching in the toes more often than co-workers notexposed to vibration via the feet [2,3,7].
Researchers studying the effects of hand-arm-vibration syndrome (HAVS) have found a correlationbetween the neurological and vascular symptoms observed in the upper extremities and symptoms ob-served in the feet of workers affected by HAVS. Raynaud’s phenomenon of the feet has been examined
∗Corresponding author: Katie Goggins, Centre for Research in Occupational Safety and Health, 935 Ramsey Lake Road,Sudbury, ON, Canada. Tel.: +1 705 919 5359; E-mail: [email protected].
1359-9364/16/$35.00 c© 2016 – IOS Press and the authors. All rights reservedThis article is published online with Open Access and distributed under the terms of the Creative Commons Attribution Non-Commercial License.

54 K. Goggins et al. / Study of the biodynamic response of the foot to vibration exposure
mostly in conjunction with HAVS [7–13]. Given the similarities between the anatomy of the handsand feet it is not unreasonable to speculate that their resonant frequencies would be in the same range.The literature suggests the finger-hand-arm system is most susceptible to vibration at higher frequen-cies (40–100 Hz for the hand-arm system, >100 Hz for the fingers [14]). Furthermore, the prevalenceof vascular-induced disorders associated with hand-transmitted vibration (HTV) tends to be greater inworkers using tools that have dominant frequencies greater than 63 Hz [15]. Determining potential healthrisks associated with FTV are problematic as the current standard for evaluating exposure to vibrationwhen standing, ISO 2631-1 [16] might not be appropriate for FTV exposures observed in mining [3];however, the standard for evaluating segmental exposure to vibration, ISO 5349-1 [17] does not considerFTV. In order to determine the most appropriate standard for assessing health risks associated with FTVfurther information regarding the biodynamic response and resonant frequency of the foot is required.
Biodynamic response is the relationship between human physiology and environmental stimuli. Anumber of intrinsic and extrinsic factors influence human response to vibration. Intrinsic variables caninclude population type (age, sex, size, and health), experience, body posture, and types of activities [16].Conversely extrinsic variables can include vibration magnitude, vibration frequency, vibration axis, vi-bration input position, vibration duration, and other influences such as noise, heat, acceleration, andlight [16,18,19]. When evaluating the biodynamic response of the human body to vibration, an under-standing of the resonant frequency and transmissibility is required. Resonant frequency is the point atwhich maximum displacement between organs and skeletal structures occurs, thereby placing strain onthe body tissue involved [20], causing vibration exposure at resonance to be directly linked with in-creased injury risk. Maximal transmissibility occurs at a structure’s resonant frequency. Transmissibilityis a measure of the ability of the body to either amplify or suppress input vibration. A variety of biody-namic responses, particularly those between the point at which vibration enters the body and the point atwhich it is measured are reflected in the transmissibility of the human body [21]. Transmissibility is de-fined as the ratio of the vibration measured between two points [22], where amplification is representedby a transmissibility value higher than 1.0, and attenuation is considered to occur with a transmissibilityvalue lower than 1.0.
Due to differences in structure, each region of the body has a different resonant frequency. The fre-quency at which the hand-arm system is believed to be at greatest risk of injury is in the 20–40 Hz range,while the fingers are at greater risk above 100 Hz [14,19], because exposure at these frequencies leadsto vibration amplification. In a study examining the absolute threshold of the feet, for a seated personexposed to FTV, Forta et al. [23] found the absolute threshold to occur between 8–25 Hz and all partici-pants indicated they felt vibration most at the sole of the feet when exposed to FTV at 125 Hz. Althoughthis study offered some evidence of the biodynamic response, of the foot to FTV, it did not evaluateabsolute threshold when a person was standing nor did it measure transmissibility or report resonancevalues for the feet. Singh [24] examined vibration transmissibility via the feet in standing individualsand reported the z-axis vibration was lower at the ankle in all but one male participant, suggesting thatanatomical structures such as the heel fat pad may play a role in attenuating FTV from the floor to theankle. Harazin and Grzesik [25] examined the transmission of vertical WBV in ten standing subjects forten postures at six body segments and found the magnitude of vibration being transmitted by the footto be amplified in the frequency range of 31.5–125 Hz at the metatarsus and at 25–63 Hz at the ankle(malleolus medialis), implying the formation of a local resonance within the foot. However, the Harazinand Grzesik study [25] was limited to ten subjects and did not take into account any anthropometricmeasurements of the foot.

K. Goggins et al. / Study of the biodynamic response of the foot to vibration exposure 55
A number of variables can potentially affect the biodynamic response of the body to FTV, includingparticipant mass and arch type. The surface area of the foot in contact with the floor surface can vary de-pending on arch type; individuals with a higher arch will have less area in direct contact with a vibratingsurface than those with a low arch. Absolute threshold is the lowest intensity at which vibration stimulican be detected 50% of the time [26]. Morioka and Griffin [26] examined mean vibration perceptionthresholds as a function of frequency at three locations on the hand; distal finger, distal palm, and prox-imal palm. Findings indicated that thresholds reduced systematically as the contact area increased fromthe fingertip to the whole hand. The palm had a larger surface area for vibration to be transmitted throughresulting in lower vibration sensitivity. The same mechanoreceptive afferent nerve fibres are present inthe feet as well as the hands; therefore, the reported differences between transmission at the fingers andthe palm of the hand [26] suggests vibration might transmit through the foot differently at the toes andthe heel.
Therefore, the primary purpose of this study was to measure the transmission of vibration from thefloor-to-ankle (FTA), and the floor-to-metatarsal (FTM), during exposure to FTV while standing. Theinfluence of FTV exposure frequency, participant mass and participant arch index on FTA and FTMtransmissibility was also examined. It was hypothesized that FTM transmissibility will be greater thanFTA transmissibility because there is more mass distributed through the ankle than the metatarsals andthe toes can move more freely when standing. FTM transmissibility was also hypothesized to be greaterthan FTA transmissibility at higher frequencies (45 and 50 Hz) compared to lower frequencies (25 and30 Hz) based on the response of the fingers and palm to similar exposure frequencies [14]. Furthermore,it was hypothesized that participants with higher arches (lower foot surface area in contact with thevibrating surface) would have lower FTA transmissibility than participants with lower arches.
2. Methods
Laurentian University’s Research Ethics Board approved the procedures in this study and all partici-pants gave informed consent prior to study participation.
2.1. Participants
Thirty male participants with an average age of 28 (± 9.5) years, height of 180.6 (± 8.7) cm, andmass of 85.65 (± 12.4) kg were recruited from a sample of convenience (Table 1). Participants had nohistory of musculoskeletal injury, vasculopathy, neuropathy, motion sickness, diabetes, or head injury inthe 6-months prior to testing. Participants with a previous head injury were excluded because the FTVexposures evaluated in this study can travel through the body and be amplified at the head, which couldincrease discomfort in individuals recovering from a head injury.
2.2. Arch type assessment
Prior to the vibration exposure protocol, each participant’s foot arch type was classified using the footimprint technique developed by Cavanagh and Rogers [27]. Arch index (AI) is defined as the ratio of thearea of the middle third of the toeless footprint (truncated foot) to the total footprint area [27]. An AI ofless than 0.21 indicates a high arch while an AI of greater than 0.26 indicates a low arch (Table 1). Tocalculate the AI participants were required to immerse the bottom portion of their right foot into a boxcontaining edible colorant and then step onto graph paper consisting of 0.36 cm2 grids with their full

56 K. Goggins et al. / Study of the biodynamic response of the foot to vibration exposure
Table 1Summary of participant demographic information
Participant # Age (years) Height (cm) Mass (kg) Arch index1 20 178 81.4 0.222 21 186 90.7 0.263 22 189 90.7 0.264 33 167 87.0 0.255 24 181 88.4 0.346 21 193 104.3 0.287 38 194 93.4 0.208 21 189 97.2 0.279 26 188 97.0 0.22
10 56 179 82.5 0.3111 30 167 85.2 0.3212 28 185 85.2 0.2513 22 175 57.6 0.2614 28 161 83.6 0.2615 43 200 121.5 0.3016 19 177 63.2 0.2017 21 180 77.1 0.2618 20 180 75.2 0.2619 46 184 85.2 0.1820 28 173 93.4 0.3021 34 178 90.7 0.2622 21 174 74.8 0.2023 32 181 80.7 0.1224 23 170 72.1 0.2625 25 190 90.0 0.2526 20 181 69.4 0.2727 45 183 97.7 0.2228 19 173 89.3 0.2929 20 185 77.5 0.2230 23 178 86.1 0.28
Mean 27.6 180.6 85.65 0.25SD 9.5 8.7 12.37 0.05
body weight, leaving their functional foot impression on the paper. Once the graph paper dried the AIwas calculated according to Eq. (1) using the surface area divisions from Fig. 1 [27].
Arch Index (AI) =B
(A+B + C)(1)
Where A is the surface area of the forefoot, B is the surface area of the midfoot, and C is the surfacearea of the hind foot [27].
2.3. Vibration exposure
An exercise vibration platform (Power Plate North American, Inc., Irvine, CA) was utilized to generatesix different frequencies of vibration, including: 25 Hz, 30 Hz, 35 Hz, 40 Hz, 45 Hz and 50 Hz (Table 2).The vibration platform was calibrated to confirm the corresponding running root-mean-squared (RMS)un-weighted average acceleration values and coherence at each frequency. These particular frequencieswere selected to simulate the range of vibration frequencies experienced by miners exposed to FTVwhen drilling off platforms and raises used in underground mining [3]. Participants were randomlyexposed to each vibration frequency for 20 seconds (with one repeat) to become accustomed to the

K. Goggins et al. / Study of the biodynamic response of the foot to vibration exposure 57
Table 2FTV exposure profile characteristics
Dominant z-axis (vertical) FTV Running RMS un-weighted mean z-axis (vertical)exposure frequency (Hz) acceleration (m/s2)
25 830 1035 1240 1345 1450 14
Forefoot
Midfo
Hind foo
t
oot
ot
Fig. 1. Footprint divisions used for the arch index measurement [29].
exposure. Participants were then randomly exposed to each of the six frequencies of vibration for 45seconds. During the 45 second exposure period FTM and FTA vibration transmissibility was measured.Participants rested for 10-seconds after each 45 second vibration exposure [4].
2.4. Vibration measurement equipment and data collection
Four ADXL326, 19 g tri-axial accelerometers (custom design University of Windsor, ON) were uti-lized to measure vibration, at the following locations:
(1) Directly on the vibration platform medial to the distal head of the first metatarsal;(2) Directly on the skin at the distal head of the first metatarsal;(3) Directly on the vibration platform paralleling the medial malleolous; and(4) Directly on the skin at the lateral malleolus (Fig. 2).Data were collected at a sampling frequency of 1000 Hz and stored on two portable dataloggers, Dat-
aLOG II P3X8 (Biometrics, Gwent, UK). Participants were instructed to stand on the vibration platformin a comfortable neutral posture and align their heels over two marked positions. Participants were theninstructed to stand with a slight bend in their knees and to relax their shoulders and place their handscomfortably to their sides. Finally, participants were reminded not to hold onto the handles above the
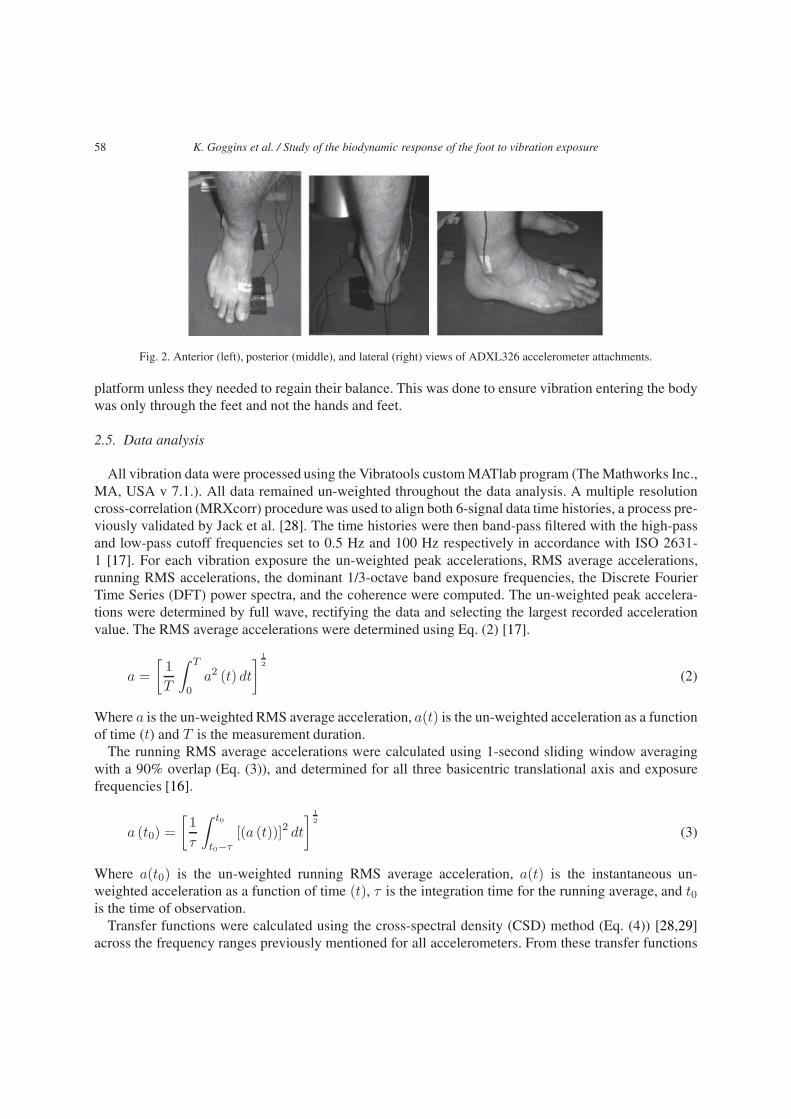
58 K. Goggins et al. / Study of the biodynamic response of the foot to vibration exposure
Fig. 2. Anterior (left), posterior (middle), and lateral (right) views of ADXL326 accelerometer attachments.
platform unless they needed to regain their balance. This was done to ensure vibration entering the bodywas only through the feet and not the hands and feet.
2.5. Data analysis
All vibration data were processed using the Vibratools custom MATlab program (The Mathworks Inc.,MA, USA v 7.1.). All data remained un-weighted throughout the data analysis. A multiple resolutioncross-correlation (MRXcorr) procedure was used to align both 6-signal data time histories, a process pre-viously validated by Jack et al. [28]. The time histories were then band-pass filtered with the high-passand low-pass cutoff frequencies set to 0.5 Hz and 100 Hz respectively in accordance with ISO 2631-1 [17]. For each vibration exposure the un-weighted peak accelerations, RMS average accelerations,running RMS accelerations, the dominant 1/3-octave band exposure frequencies, the Discrete FourierTime Series (DFT) power spectra, and the coherence were computed. The un-weighted peak accelera-tions were determined by full wave, rectifying the data and selecting the largest recorded accelerationvalue. The RMS average accelerations were determined using Eq. (2) [17].
a =
[1
T
∫ T
0a2 (t) dt
] 1
2
(2)
Where a is the un-weighted RMS average acceleration, a(t) is the un-weighted acceleration as a functionof time (t) and T is the measurement duration.
The running RMS average accelerations were calculated using 1-second sliding window averagingwith a 90% overlap (Eq. (3)), and determined for all three basicentric translational axis and exposurefrequencies [16].
a (t0) =
[1
τ
∫ t0
t0−τ[(a (t))]2 dt
] 1
2
(3)
Where a(t0) is the un-weighted running RMS average acceleration, a(t) is the instantaneous un-weighted acceleration as a function of time (t), τ is the integration time for the running average, and t0is the time of observation.
Transfer functions were calculated using the cross-spectral density (CSD) method (Eq. (4)) [28,29]across the frequency ranges previously mentioned for all accelerometers. From these transfer functions

K. Goggins et al. / Study of the biodynamic response of the foot to vibration exposure 59
the dominant transmission frequency (frequency with the greatest transfer function modulus magnitude)was determined for all three basicentric translational axis at the metatarsal and ankle.
Tio (f) =CSDio (f)
PSDii (f)(4)
Where Tio is the complex transfer function between the platform metatarsal or ankle input (ii) acceler-ations and the metatarsal and ankle output (oo) accelerations at frequency f. CSDio indicates a cross-spectral density function between the platform input accelerations and accelerations for the output of themetatarsal and ankle. PSDii represents the power-spectral density of the platform input.
Transmissibility was defined as the ratio of the running RMS acceleration output to input. Transmis-sibility was calculated at the metatarsal (Eq. (5)) and the ankle (Eq. (6)) in the z-axis for comparison.
Tmetatarsal =az (TD02)
az (TD01)(5)
Where Tmetatarsal is the transmissibility at the metatarsal, az(TD02) is the un-weighted running RMSaverage acceleration on top of the metatarsal, and az(TD01) is the un-weighted running RMS averageacceleration on the platform at the metatarsal.
Tankle =az (TD04)
az (TD03)(6)
Where Tankle is the transmissibility at the ankle, az(TD04) is the un-weighted running RMS averageacceleration on the lateral ankle, and az(TD03) is the un-weighted running RMS average accelerationon the platform at the ankle.
In addition to 1/3-octave bandwidth running RMS average acceleration spectra [16] and DiscreteFourier Time Series (DFT) power spectra were also determined using a 1-second Hanning window withthe same 90% overlap as the 1/3-octave band running RMS average acceleration analysis.
The degree of the correlation between the input and output was expressed in terms of the coherence(Eq. (7)). Coherence being a value between 0 and 1, the greater the coherence the greater the correlationbetween the two signals being analyzed [30].
coherence (f)2 =|CSDinput-output (f)|2
PSDinput (f)x PSDoutput (f)(7)
Where CSD is the cross-spectral density and PSD is the power spectral density.For the purpose of this paper the RMS average accelerations, the dominant 1/3-octave band exposure
frequencies, FTA transmissibility, FTM transmissibility, and the coherence were evaluated.
2.6. Statistical analysis
For all statistical analyses, the dependent variable was transmissibility, measured as a ratio betweenthe running RMS acceleration input to output. The independent variables were location with two levels(toe; ankle), arch index with two levels (high; low) and frequency with six levels (25 Hz; 30 Hz; 35 Hz;40 Hz; 45 Hz; 50 Hz). Prior to any statistical analysis, the data were transformed using a logarithmictransformation (Eq. (8)) [31,32], to ensure the assumption of normality was met.
NEWX = LG10 (X + C) (8)
Where X is the original variable and C is a constant added to each score so that the smallest score is 1.

60 K. Goggins et al. / Study of the biodynamic response of the foot to vibration exposure
0.00
0.10
0.20
0.30
0.40
0.50
0.60
0.70
0.80
0.90
1.00
1.10
25 30 35 40 45 50
Tra
nsm
issi
bilit
y
Exposure Frequency (Hz)
Ankle
Toe
Fig. 3. Average transmissibility of 30 male subjects from floor-to-ankle (grey) and floor-to-metatarsal (black) at six FTV expo-sure frequencies (25, 30, 35, 40, 45 and 50 Hz).
2.6.1. Effects of arch index on transmissibilityA two-way repeated measures analysis of covariance (RM ANCOVA) was conducted to determine the
effect of frequency (independent variable) and location (independent variable) while accounting for thevariability due to arch index (covariate) on vibration transmissibility magnitude (dependent variable) atthe metatarsal (toe) and ankle. Significance was achieved when p < 0.05.
2.6.2. Effects of mass on transmissibilityA two-way repeated measures analysis of covariance (RM ANCOVA) was conducted to determine the
effect of frequency (independent variable) and location (independent variable) while accounting for thevariability due to mass (covariate) on vibration transmissibility magnitude (dependent variable) at themetatarsal (toe) and ankle. Significance was achieved when p < 0.05.
2.6.3. Effects of location and frequency on transmissibilityA two-way repeated measures analysis of variance (ANOVA) was conducted to examine the effects
of location and frequency (independent variables) on vibration transmissibility magnitude (dependentvariable). Significance was achieved when p < 0.05.
3. Results
The mean FTA and FTM transmissibility results for thirty participants are displayed in Fig. 3, and in-dividual transmissibility values are summarized in Table 3. In general, FTA transmissibility was greaterat the lower frequencies and FTM transmissibility was greater at higher frequencies. Mean FTA trans-missibility was highest (0.86) at 30 Hz and mean FTM transmissibility was highest (1.01) at 50 Hz. The

K. Goggins et al. / Study of the biodynamic response of the foot to vibration exposure 61
Table 3Summary of FTA and FTM transmissibility for each participant at 25, 30, 35, 40, 45 and 50 Hz. Mean transmissibility valuesgreater than 1 are bolded
Participant # FTA transmissibility calculated FTM transmissibility calculatedFTV exposure frequency Hz FTV exposure frequency Hz
25 30 35 40 45 50 25 30 35 40 45 501 0.96 0.74 0.74 0.75 0.61 0.63 0.77 0.66 0.84 0.84 0.98 1.022 1.35 1.72 1.20 0.77 0.58 0.30 0.33 0.69 1.05 1.08 1.12 1.163 0.59 0.83 0.96 0.72 0.47 0.51 0.85 0.91 0.88 0.95 0.98 0.984 0.92 1.11 0.89 0.39 0.27 0.12 0.88 0.97 0.96 0.76 0.75 0.775 0.24 0.98 0.48 0.30 0.23 0.17 0.61 0.52 0.73 0.77 0.92 0.906 0.89 0.70 0.58 0.53 0.43 0.34 0.47 0.68 0.89 1.03 1.02 1.057 0.84 0.90 0.78 0.75 0.60 0.53 0.65 0.66 0.89 1.00 1.05 1.078 0.36 0.58 0.45 0.22 0.15 0.14 0.81 0.76 0.95 0.99 1.06 1.109 0.83 0.58 0.87 1.11 1.24 1.15 0.52 0.39 0.42 0.66 0.88 0.9810 0.89 0.48 0.39 0.27 0.24 0.13 0.57 0.68 0.79 0.94 1.04 1.0411 0.88 0.77 0.89 0.71 1.30 1.39 0.82 0.82 0.81 1.19 0.82 0.6412 1.00 0.90 0.84 0.50 0.32 0.21 0.38 0.43 0.55 0.85 0.92 0.9813 0.62 0.96 0.61 0.64 0.45 0.59 0.73 0.82 0.95 0.91 0.91 0.7814 0.61 0.70 0.59 0.52 0.41 0.22 0.67 0.62 0.77 0.85 0.95 1.0415 0.30 0.27 0.26 0.13 0.14 0.15 0.64 0.73 0.81 0.92 0.94 0.9816 0.72 0.76 0.71 0.40 0.23 0.19 0.52 0.79 0.90 0.92 0.93 0.9517 1.50 1.72 0.65 1.04 0.32 0.22 0.84 0.85 0.92 0.77 0.89 1.0018 0.39 0.48 0.73 0.54 0.41 0.36 0.77 0.84 0.98 1.01 0.96 0.9819 1.00 1.04 1.13 1.09 0.78 0.65 0.71 0.64 0.56 0.62 1.11 1.3320 1.05 0.69 0.71 0.51 0.34 0.27 0.56 0.63 0.69 0.86 0.99 1.0821 1.15 1.12 0.92 1.01 0.86 0.30 0.76 0.69 0.60 0.73 0.66 1.0122 0.95 1.02 0.83 0.77 0.61 0.39 0.55 0.54 0.73 1.04 1.03 1.0923 1.00 0.76 0.52 0.59 0.48 0.43 0.66 0.68 0.80 0.96 1.02 1.0124 0.60 0.64 0.63 0.59 0.51 0.49 0.45 0.69 0.84 0.91 0.94 1.0025 0.89 0.78 0.65 0.51 0.32 0.32 0.82 0.92 1.29 1.30 1.35 1.4226 1.52 1.46 0.71 0.44 0.19 0.13 0.41 0.69 1.00 1.11 1.08 1.0127 0.63 0.37 0.19 0.12 0.06 0.09 0.74 0.80 0.88 0.94 0.98 0.9928 0.93 1.23 1.01 1.12 1.04 0.80 0.71 0.68 0.64 0.66 0.69 0.8129 0.67 0.57 0.73 0.64 0.50 0.42 0.66 0.65 0.70 0.83 0.93 0.9830 1.16 0.80 0.84 1.02 0.85 0.93 1.03 0.54 0.56 0.73 0.81 1.02Mean 0.85 0.86 0.72 0.62 0.50 0.42 0.66 0.70 0.81 0.90 0.96 1.01SD 0.32 0.35 0.23 0.29 0.31 0.31 0.16 0.14 0.18 0.16 0.13 0.15
results of a two-way repeated measures ANOVA indicated the location frequency interaction was signif-icant (λ = 0.246, F(5,25) = 15.365, p = 0.0001). More specifically, differences in mean transmissibilitybetween the ankle and metatarsal were highly significant at 40 Hz (p < 0.001), 45 Hz (p < 0.001), and50 Hz (p < 0.001) (Fig. 3).
Peak FTA transmissibility above one, implying amplification, occurred at 25 Hz for three participants(20, 21, 30), at 30 Hz for six participants (2, 4, 17, 19, 22, 28), at 45 Hz for one participant (9) and50 Hz for one participant (11) (Table 3). Furthermore, peak FTM transmissibility above one occurred at50 Hz for thirteen participants, while only one participant (30) had a peak greater than one at 25, 30 or35 Hz (Table 3). These results are in accordance with the hypothesis that FTM transmissibility would begreater than FTA transmissibility especially at the higher frequencies (45, and 50 Hz).
3.1. Effects of Arch Index (AI) on transmissibility
The two-way repeated measures ANCOVA revealed that neither the three-way interaction of loca-tion*frequency*AI [λ = 0.816, F(5,24) = 1.080, p = 0.396] or the two-way interaction with location*AI

62 K. Goggins et al. / Study of the biodynamic response of the foot to vibration exposure
[λ = 0.989, F(1,28) = 0.323, p = 0.575] and frequency*AI [λ = 0.932, F(5,24) = 0.349, p = 0.877]were significant (p < 0.05). This finding does not support our hypothesis that participants with higherarches would have lower FTA transmissibility than participants with lower arches.
3.2. Effects of mass on transmissibility
The two-way repeated measures ANCOVA revealed that neither the three-way interaction of loca-tion*frequency*mass [λ = 0.959, F(5,24) = 0.203, p = 0.958] or the two-way interaction with loca-tion*mass [λ = 0.967, F(1,28) = 0.959, p = 0.336] and frequency*mass [λ = 0.884, F(5,24) = 0.627,p = 0.680] were significant (p < 0.05).
3.3. Effects of location and frequency on transmissibility
A two-way repeated measures ANOVA was conducted to evaluate the effect of location and frequencyon vibration transmissibility. The location and frequency main effects and location frequency interactioneffect were tested using the multivariate criterion of Wilks’ lambda (λ). The location frequency interac-tion was significant [λ = 0.246, F(5,25) = 15.365, p = 0.0001], the location main effect was significant,[λ = 0.644, F(1,29) = 16.032, p =0.0001], and the frequency main effect was significant [λ = 0.513,F(5,25) = 4.754, p = 0.003].
Six paired-samples t-tests were conducted to follow up the significant location main effect. Familywiseerror rate was controlled for across the tests using Holm’s sequential Bonferroni approach. Differencesin mean transmissibility between the two locations were significant between FTM at 40 Hz and FTAat 40 Hz (t(29) = 4.116, p < 0.001), between FTM at 45 Hz and the FTA at 45 Hz (t(29) = 6.599,p <0.001), and between FTM at 50 Hz and FTA at 50 Hz (t(29) = 8.828, p < 0.001).
Thirty paired-samples t-tests were computed to assess the significant frequency main effect. Differ-ences between the six frequencies were evaluated at both locations separately, controlling for Familywiseerror rate using Holm’s sequential Bonferroni approach. For FTA transmissibility, twelve of the fifteenpaired-samples were significant, the three pairs which were not significantly different were those at thelower frequencies FTA at 25 Hz – FTA at 30 Hz (t(29)=-0.114, p = 0.910), FTA at 25 Hz – FTA at35 Hz (t(29) = 2.094, p = 0.045), and FTA at 30 Hz – FTA at 35 Hz (t(29) = 2.402, p = 0.022). Finally,fifteen paired-samples t-tests were completed using tetrad comparisons, involving four means to evalu-ate whether the mean differences between the two locations are the same between any two frequencies,again controlling for Familywise error rate using Holm’s sequential Bonferroni approach. All pairs weresignificantly different, except for the differences between FTM at 25 Hz – FTA at 25 Hz and FTM at30 Hz – FTA at 30 Hz.
4. Discussion
In order to measure the biodynamic response of the foot to vibration, participants were exposed toFTV at 25 Hz, 30 Hz, 35 Hz, 40 Hz, 45 Hz, and 50 Hz. An interaction between FTV exposure frequencyand the location of transmissibility measurement (FTM compared with FTA) was found (Fig. 3). Theinteraction suggests FTM and FTA transmissibility at 25 and 30 Hz are not significantly different; how-ever, FTM transmissibility is significantly greater than FTA transmissibility at 40, 45 and 50 Hz. In thecurrent study the mean peak FTM transmissibility (1.01) occurred at 50 Hz and the mean peak FTAtransmissibility (0.86) occurred at 30 Hz.

K. Goggins et al. / Study of the biodynamic response of the foot to vibration exposure 63
FTM transmissibility values reported in this study are in line with values reported in Harazin andGrzesik; however, reported FTA transmissibility values are lower than those reported by the same au-thors [25]. Harazin and Grzesik, measured floor to metatarsus transmissibility and floor to ankle trans-missibility at frequencies between 4–250 Hz in one-third octave bands while participants adopted astanding posture with slightly bent knees. The authors reported mean floor to metatarsus transmissibilitybetween 0.6–1.0 and mean floor to ankle transmissibility greater than one. However, it should be notedthat FTA transmissibility measurements in the current study were taken at the lateral malleolus, where asHarazin and Grzesik took their measures at the medial malleolus of the ankle [25]. Differences in mea-surement location may account for the lower FTA transmissibility values reported in the current study.The medial malleolus is the medial head of the tibia, and the lateral malleolus is the lateral head of thefibula, and both articulate with the talus. The tibia is the second largest bone in the body and it bears asignificantly larger percentage of the body’s weight when standing than the fibula [33]. Therefore, it ispossible that FTA transmissibility was higher when measured at the medial malleolus given the increasedweight transmitted through the tibia (medial malleolus) than the fibula (lateral malleolus). Furthermore,the heel fat pad is typically thicker posterior-laterally than posterior-medially [34], which could accountfor increased attenuation laterally and thus a decrease in FTA when measured at the lateral malleolus.
Morioka and Griffin (2005) [26] examined differences in absolute thresholds for the perception ofvibration at the fingertip with thresholds for the whole hand over the frequency range 8–500 Hz. Overthe three conditions (palm, grip and fingertip), there were significant differences in absolute threshold atall frequencies (Friedman, p < 0.005), except at 31.5 Hz (Friedman, p = 0.21). It is interesting to notein the current study that the mean FTA and FTM transmissibility are almost the same at 31.5 Hz (Fig. 3).As the FTV exposure frequency increases beyond this point the difference in transmissibility measuredat the metatarsal continues to increase and transmissibility measured at the ankle decreases.
The transmissibility results are not strictly limited to the interaction between frequency and location.The greatest mean FTM and FTA transmissibility occurred at 50 Hz and 30 Hz respectfully (Fig. 3), sug-gesting the formation of a local resonance at each location. Theses findings are in line with Harazin andGrzesik [26] who reported 1/3 octave band resonance frequency between 31.5–125 Hz for the metatarsaland between 25–63 Hz for the ankle. Similarly, Singh [35] reported greater transmissibility between thefloor and ankle at lower FTV exposure frequencies (3.15–10 Hz) than higher FTV exposure frequen-cies (40 Hz). At the low frequency (3.15–10 Hz), FTA transmissibility averaged 1.06 with a standarddeviation of ± 0.09.
The secondary objective of this study was to determine whether AI or mass influence vibration trans-missibility through the foot. Results from two separate ANCOVAs indicate neither AI nor mass had asignificant effect (p < 0.05) on vibration transmissibility through the foot. A recent study by Singh [35]examined FTA transmissibility to determine whether gender, arch type or mass played a role in trans-missibility at both low and high frequency FTV. Eight male and eight female participants with varyingarch types and mass, were exposed to FTV with a dominant frequency below 10 Hz and a dominant fre-quency between 30–40 Hz. Similarly, no differences in vibration transmissibility through the foot werefound for gender or arch type [35]. Randall and colleagues [20] also examined the resonant frequenciesof standing humans and found no significant relationship between the mass, height, or mass to heightratio and measured resonant frequency. Furthermore, a study by [24] found no significant difference inFTA transmissibility based on body mass.
4.1. Limitations of the study
There are several limitations in the study design that should be considered when interpreting the re-sults. First, vibration exposure magnitude and exposure frequency were not controlled independently.

64 K. Goggins et al. / Study of the biodynamic response of the foot to vibration exposure
Unfortunately the research team was not able to maintain the same vibration exposure magnitude forall vibration exposure frequencies. Therefore, changes in transmissibility reported in this study may notstrictly be due to changes in frequency, since vibration exposure magnitude also increased when ex-posure frequency increased. Furthermore, several researchers have reported transmissibility increaseswith increasing magnitude [9,36,37]. Second, although participants’ foot placement was controlled andall were given the same instruction with regard to how to stand, it could not be confirmed that all par-ticipants’ maintained the same posture throughout the 45-second FTV exposure period. Deviations inposture can influence vibration transmissibility due to changes in the surface contact area with the vibrat-ing surface, which can influence the position of the bony structures and the degree of tension in differentmuscle groups of the trunk and the extremities, in turn changing the resonant frequency of the bodystructure [1,19,21,25,36,38–41]. Thus, variations in the ankle and knee angles could have influenced thetransmission of vibration from the platform through the feet and into the lower limbs. Third, there werealso limitations with the AI measurement because the centre of pressure location during foot-transmittedvibration exposure could not be confirmed.
5. Conclusions
This study was conducted to gain a better understanding of the biodynamic response of the foot tovibration exposure by measuring transmissibility from the FTA and FTM. There were significant differ-ences in mean FTM and FTA transmissibility at 40 Hz, 45 Hz, and 50 Hz. The greatest FTM and FTAtransmissibility occurred at 50 Hz and 30 Hz respectively, indicating the formation of a local resonanceat each location.
6. Future research
Future research should evaluate the transmission of vibration through the feet to the lower limbs acrossa broader range of exposure frequencies while controlling for FTV exposure magnitude and the standingposture of the participants. Confirming the resonant frequencies at different locations on the foot willhelp determine exposure frequencies that are most likely to lead to health risks [41] in workers exposedto FTV. A greater understanding of the transmissibility properties of the foot is also needed to designcontrols such as isolation platforms, anti-vibration drills, and personal protective equipment such as matsand insoles for workers exposed to FTV [42]. Knowing the resonant frequency of the foot is also neededto establish standards for measuring, evaluating and determining health risks for workers exposed toFTV.
Acknowledgements
The Workplace Safety and Insurance Board of Ontario and Natural Sciences and Engineering Re-search Council provided funding for this study. The research team would also like to thank the study par-ticipants, and Dr. Joel Jack for early assistance with data analysis calculations in MatLab. The WilliamShaver Masters Scholarship in Mining Health and Safety also supported the lead author.

K. Goggins et al. / Study of the biodynamic response of the foot to vibration exposure 65
Conflict of interest
The authors have no conflict of interest to report.
References
[1] Eger, T., Stevenson, J., Boileau, P.-É., Salmoni, A., VibRG. Predictions of health risks associated with the operationof load-haul-dump mining vehicles: Part 2 – Evaluation of operator driving postures and associated postural loading.International Journal of Industrial Ergonomics, 2008, 38, pp. 801-815.
[2] Thompson, A., House, R., Eger, T., & Krajnak, K. Vibration-white foot: A case report. Occupational Medicine, 2010,60, pp. 572-574.
[3] Leduc, M., Eger, T., Godwin, A., Dickey, J.P., & House, R. Examination of vibration characteristics, and reported mus-culoskeletal discomfort for workers exposed to vibration via the feet. Journal of Low Frequency Noise, Vibration andActive Control, 2011, 30(2), pp. 197-206.
[4] Dickey, J., Oliver, M., Boileau, P.-E., Eger, T., Trick, L., & Edwards, M. Multi-axis sinusoidal whole-body vibrations:Part I – How long should the vibration and rest exposures be for reliable discomfort measures? Journal of Low FrequencyNoise, Vibration and Active Control, 2006, 25(3), pp. 175-184.
[5] Laeger, U. Vibration-induced white toes. Herning Centralsygehus, arbejdsmedicinsk klinik, 1994, 156(34), pp. 4836-8.[6] Toibana, N., Ishikawa, N., Sakakaibara, H., Yamada, S. Raynaud’s phenomenon of fingers and toes among vibration-
exposed patients. Nagoya Journal of Medical Science, 1994, 57, pp. 121-128.[7] Hedlund, U. Raynaud’s Phenonmenon of fingers and toes of miners exposed to local and whole-body vibration and cold.
International Archives of Occupational and Environmental Health, 1989, 61, pp. 457-461.[8] Bovenzi, M. Health effects of mechanical vibration. G Ital Med Lav Erg, 2005, 27(1), pp. 58-64.[9] Griffin, M.J. Measurement, evaluation, and assessment of peripheral neurological disorders caused by hand-transmitted
vibration. International Archives of Occupational and Environmental Health, 2008, 81, pp. 559-573.[10] Hagberg, M., Burstrom, L., Lundstrom, R., & Nilsson, T. Incidence of Raynaud’s phenomenon in relation to hand-arm
vibration exposure among male workers at an engineering plant a cohort study. Journal of Occupational Medicine andToxicology, 2008, 3(13).
[11] Hashiguchi, T., Yanagi, H., Kinugawa, Y., Sakakibara, H., & Yamada, S. Pathological changes of finger and toe inpatients with vibration syndrome. Nagoya Journal of Medical Science, 1994, 57, pp. 129-136.
[12] Sakakibara, H., Akamatsu, Y., Miyao, M., Kondo, T., Furuta, M., Yamada, S., et al. Correlation between vibration-induced white finger and symptoms of upper and lower extremities in vibration syndrome. International Archives ofOccupational and Environmental Health, 1998, 60, pp. 285-289.
[13] Sakakibara, H., Hashiguchi, T., Furuta, M., Kondo, T., Miyao, M., & Yamada, S. Circulatory disturbances of the foot invibration syndrome. International Archives of Occupational and Environmental Health, 1991, 63, pp. 145-148.
[14] Dong, R.G., Schopper, A.W., McDowell, T.W., Welcome, D.E., Wu, J.Z., Smutz, W.P., Warren, C., Rakheja, S. Vibrationenergy absorption (VEA) in human fingers-hand-arm system. Medical Engineering & Physics, 2004, 26(6), pp. 483-492.
[15] Bovenzi, M. A prospective cohort study of exposure-response relationship for vibration-induced white finger. OccupEnviron Med, 2010, 67(1), pp. 38-46.
[16] International Organization for Standardization. ISO 2631: Mechanical vibration and shock – Evaluation of human expo-sure to whole-body vibration – whole-body vibration – Part 1: General Requirements. Geneva, 1997.
[17] International Organization for Standardization. ISO 5349-1: Mechanical vibration – Guidelines for the measurement andthe assessment of human exposure to hand-transmitted vibration. Geneva, 2004.
[18] Bovenzi, M. Exposure-response relationship in the hand-arm vibration syndrome: An overview of current epidemiologyresearch. International Archives of Occupational and Environmental Health, 1998, 71, pp. 509-519.
[19] Griffin, M.J. Handbook of Human Vibration. Academic Press, London, 1990.[20] Randall, J.M., Matthews, R.T., & Stiles, M.A. Resonant frequencies of standing humans. Ergonomics, 1997, 40(9), pp.
879-886.[21] Paddan, G.S., & Griffin, M.J. A review of the transmission of translational seat vibration to the head. Journal of Sound
and Vibration, 1998, 215(4), pp. 863-882.[22] Mansfield, N.J. Human response to vibration. CRC, Press, New York, 2005.[23] Forta, N.G., Griffin, M.J., & Morioka, M. Difference thresholds for vibration of the foot: Dependence on frequency and
magnitude of vibration. Journal of Sound and Vibration, 2011, 330, pp. 805-815.[24] Singh, P. Evaluation of foot-transmitted vibration and transmissibility characteristics of mining boots and insoles. Un-
published Masters Thesis, Laurentian University, Sudbury, Ontario, Canada, 2013.

66 K. Goggins et al. / Study of the biodynamic response of the foot to vibration exposure
[25] Harazin, B., & Grzesik, J. The transmission of vertical whole-body vibration to the body segments of standing subjects.Journal of Sound and Vibration, 1998, 215(4), pp. 775-787.
[26] Morioka, M., & Griffin, M.J. Frequency weightings for fore-and-aft vibration at the back: Effect of contact location,contact area, and body posture. Industrial Health, 2005, 48, pp. 538-549.
[27] Cavanagh, P.R., & Rogers, M.M. The arch index: A useful measure from footprints. J Biomech, 1987, 20(5), pp. 541-551.[28] Jack, R.J., Oliver, M., Dony, R., Dickey, J.P. The use of multiple resolution cross-correlations to align simultaneously
collected whole-body vibration data. Journal of Low Frequency Noise, Vibration and Active Control, 2008, 27(2), pp.121-133.
[29] Smith, S.W. The scientist and engineer’s guide to digital signal processing, 2nd edition. California Technical Publishing.San Diego, California, 1999.
[30] Mansfield, N.J. Impedance methods (apparent mass, driving point mechanical impedance and absorbed power) for as-sessment of the biomechanical response of the seated person to whole-body vibration. Industrial Health, 2005, 43, pp.378-389.
[31] Tabachnick, B.G., & Fidell, L.S. Using multivariate statistics (5th ed.). Boston: Allyn and Bacon, 2007.[32] Howell, D.C. Statistical methods for psychology (6th ed.). Thomson Wadsworth, 2007.[33] Wang, Q., Whittle, M., Cunningham, J., & Kenwright, J. Fibula and its ligaments in load transmission and ankle joint
stability. Clinical Orthopaedics and Related Research, 1996, Sept(330), pp. 261-270.[34] Sopher, R., Nixon, J., McGinnis, E., & Gefen, A. The influence of foot posture, support stiffness, heel pad loading and
tissue mechanical properties on biomechanical factors associated with a risk of heel ulceration. Journal of the MechanicalBehavior of Biomedical Materials, 2011, 4, pp. 572-582.
[35] Singh, P., Eger, T., Dickey, J., House, R., & Oliver, M. Evaluation of gender differences in foot-transmitted vibration.Canadian Acoustics, 2011, 39(2), pp. 62-63.
[36] Mansfield, N.J., Holmlund, P., Lundstrom, R., Lenzuni, P., Nataletti, P. Effect of vibration magnitude, vibration spectrmand muscle tension on apparent mass and cross axis transfer functions during whole-body vibration exposure. Journal ofBiomechanics, 2006, 39, pp. 3062-3070.
[37] Dong, R.G., Welcome, D.E., Xu, X.S., Warren, C., McDowell, T.W., Wu, J.Z. 3-D mechanical impredances distributed atthe fingers and palm of the hand. Proceedings for the Canadian Acoustics: 12th International Conference on Hand-ArmVibration. Ottawa, Canada. 2011, 39(2), pp. 46-47.
[38] Zimmerman, C.L., Cook, T.M. Effects of vibration frequency and postural changes on human responses to seated wholebody vibration exposure. Int Arch occup Environ Health, 1997, 9, pp. 165-179.
[39] Adewusi, S., Rakheja, S., Marcotte, P. Analyses of distributed absorbed power responses of the human hand-arm systemin the bent- and extended-arm postures. Proceedings for the Canadian Acoustics: 12th International Conference onHand-Arm Vibration. Ottawa, Canada. 2011, 39(2), pp. 50-51.
[40] Kitazaki, S., & Griffin, M.J. A modal analysis of whole-body vertical vibration, using a finite element model of thehuman body. Journal of Sound and Vibration, 1997, 200(1), pp. 83-103.
[41] Furuta, M., Sakakibara, H., Miyao, M., Kondo, T., Yamada, S. Effects of vibration frequency on finger blood flow. IntArch Occup Environ Health, 1991, 63, pp. 221-224.
[42] Leduc, M., Eger, T., Godwin, A., Dickey, J.P., & Oliver, M. Evaluation of properties of anti-fatigue mats used by workersexposed to foot-transmitted vibration. Proceedings from Canadian Acoustics, 2011, 39(2), pp. 88-89.
Copyright © 2022 FDOKUMEN