Agent-based Large Scale Simulation of Pedestrians With Adaptive Realistic Navigation Vector Fields

Abstract—Current traffic microsimulation tools are usually of limit use for evaluating the operations of pedestrian-involved systems, especially under unsignalized conditions (e.g. jaywalking and mid-block pedestrian crossings are not typically modeled), due to insufficient understandings of Pedestrian-Vehicle Interaction (PVI) behavior at such locations. This paper studies pedestrians’ gap acceptance behavior when they jaywalk outside crossing facilities, which is regarded as the most basic and important part to improve current PVI behavior models. A field study was conducted to collect the data of pedestrians’ decisions and concurrent traffic status using a set of synchronized video cameras on a typical unsignalized urban road section. The data were used to develop and validate a pedestrian gap acceptance model based on discrete choice approach. The initial results with the model are appealing when considered in combination of simplicity and accuracy. The results can be used to supplement existing guidelines for pedestrian-involved problems, or to form a knowledge base to incorporate pedestrians into current vehicle-dominated microsimulation models in a more realistic way.
I. INTRODUCTION ALKING as a transport mode is healthy, environmentally beneficial and sustainable to human
society. Nowadays travelers increasingly are being encouraged to walk more, either as a main mode of travel or as part of a multimodal trip. However, roads can be barriers to pedestrian movement. Pedestrian interaction with motor vehicles, focused around the road crossing activities, is found to be one of the major constraints to pedestrians [1]. Vehicular traffic can cause additional delays to pedestrians and pedestrians are extremely vulnerable when they are crossing vehicular lanes. Meanwhile, pedestrian crossing activities also have impacts on the vehicle flow. Such impacts include increased delays, decreased capacity, and harmful environmental influence. For example, although the pedestrian crossing facilities can separate the interaction
Manuscript received April 12, 2010. T. Wang is with the Transportation Research Group, School of Civil
Engineering and the Environment, University of Southampton, United Kingdom, SO17 1BJ (phone: +44 7515684935; e-mail: [email protected]).
J. Wu is with the Transportation Research Group, School of Civil Engineering and the Environment, University of Southampton, United Kingdom, SO17 1BJ.
P. Zheng is with the Transportation Research Group, School of Civil Engineering and the Environment, University of Southampton, United Kingdom, SO17 1BJ.
M. McDonald is with the Transportation Research Group, School of Civil Engineering and the Environment, University of Southampton, United Kingdom, SO17 1BJ.
between the pedestrians and motor vehicles, it is argued that too many such facilities, inappropriate set-up locations and signal timings can only marginally improve the safety but can significantly lower the efficiency for vehicle traffic and produce more fuel consumption and emissions due to more inconstant flow and stop-and-go phenomena [2]. Besides, the high cost of installation and maintenance for some advanced signalized crossing facilities is also a factor that the decision makers need to consider.
In urban traffic system, addressing the Pedestrian-Vehicle Interaction (PVI) related problems is a multi-criteria trade-off that the traffic engineers have tackled for a long time. Over the past decades, many innovative treatments (e.g. different pedestrian crossing facilities) have been developed to balance between these two modes. The emerging of various treatments demands proper methods for analyzing, evaluating and comparing the performances among one another so that engineers can decide which plan is the best fit for the specific scenario.
Typically, the selection of different treatments is determined by some engineering guidelines and the evaluation of such treatments is carried out through empirical before-after studies. A before-after comparison is often carried out to evaluate the effectiveness of the treatment, in terms of efficiency, safety and environmental impact. While these types of methods are adequate, some researchers argue that the drawbacks of these methods are that the evaluation is time-consuming and lacks microscopic detail [3]; it is impossible to evaluate all potential solutions by implementing them in real systems [4]; and there is a lack of feel what the system will behave if a treatment is adopted before its implementation in reality.
More recently, engineers start to apply the microsimulation as a supplement for existing methods for such evaluation/ prediction task to overcome the drawbacks mentioned above. Given a simulation model that mirrors the system in reality, it is possible to derive information about the real system’s behavior just by studying the model’s behavior [5]. If properly modeled and validated, the microsimulation can provide detailed evaluation/ prediction results for different sites to assist existing methods for decision making. The performance of the real traffic system being studied can be measured with several model indicators, in terms of efficiency, safety and environmental impact. This provides a non-intrusive and cost-effective way to investigate a real traffic system and permits traffic engineers to have a bird-eye view and an instant feel for the
Study of Pedestrians’ Gap Acceptance Behavior when They Jaywalk outside Crossing Facilities
Tianjiao Wang, Jianping Wu, Pengjun Zheng, and Mike McDonald
W
2010 13th International IEEEAnnual Conference on Intelligent Transportation SystemsMadeira Island, Portugal, September 19-22, 2010
TC3.1
978-1-4244-7659-6/10/$26.00 ©2010 Crown 1295

problems and possible solutions [6]. Apparently, a sound credible simulation model is the key
tool for all simulation studies on traffic systems. The core of the microsimulation is the road users’ behavior models. In recent years, although microsimulation models for traffic applications have undergone a long development and most of the motorists’ behavior have been studied and modeled, there are still relatively few studies around pedestrian behavior and modeling, especially on the PVI process [7]. Therefore, there are still many limitations for current microsimulation tools to evaluate the operations of pedestrian related traffic systems. For example, common microsimulation tools are of limited use for evaluating the interaction of pedestrians and vehicles at unsignalized locations. The models in current simulation softwares typically ignore the more complex interaction of the two modes in which pedestrians accept gaps in traffic and drivers react to the crossing pedestrians, due to insufficient knowledge to build the microscopic behavior model. [8] Thus, while most of the existing microsimulation tools may be capable for studying signalized pedestrian crossing, they do not offer a way of studying the PVI behavior at unsignalized areas or comparing the operations of signalized scenarios to unsignalized scenarios. For these types of studies, some researchers claim that there are needs to develop and integrate separate pedestrian algorithms in traffic microsimulation or to develop new microsimulation software that fully meet the needs to incorporate pedestrians with vehicular traffic. To make this possible there is also a need for better quality and more comprehensive data on pedestrian movement and behavioral characteristics [9].
Based on the discussion above, a PhD research has been being conducted by the authors around the study of PVI behavior in the microsimulation environment. This paper presents some parts of this research – it discusses the analyzing and modeling of pedestrians’ gap acceptance behavior at pure unsignalized urban road sections.
II. METHODOLOGY As shown in Fig. 1, when a pedestrian crossing demand is
generated on the curbside in a mid-block area where there is no nearby crossing facilities, some pedestrians will choose to jaywalk rather than searching an alternative route with a crossing facility. Existing literature [10]-[17] suggests that the pedestrian’s decision whether to step onto the vehicular lane to start to cross or to stop or walk along the edge of the vehicular lane to wait for the next available crossing opportunity is related to some concurrent traffic dynamics and the pedestrian’s characteristics. Since the pedestrian has two alternatives: to accept and get ready to start to cross or to reject, a discrete choice approach is appropriate to model this process.
Discrete choice models have gained attention for studying
similar problems [16]. For example, Sun et al [17] studied the pedestrians’ gap acceptance behavior at a zebra crossing using a binary logit model. However, the gap acceptance behavior in pure unsignalized conditions (e.g. jaywalking) has not been studied as explicitly as those with certain types of pedestrian crossing facilities. In this study, the pedestrian decision making process is described with the binary logit model (an individual choice with two alternative outputs). The probability of choosing an alternative is based on a linear combination function (utility function) expressed as:
nin22i11iii XXXU β++β+β+α= L (1)
where Ui = the utility of choosing the alternative i; i = the alternative i; n = the number of independent variables; α = constant; β1,… βn = coefficients.
The utility of alternative i has to be transformed into a
probability in order to predict whether a particular alternative will be chosen or not. The probability of choosing alternative i is then calculated with the following function:
)]exp(/[)( iU11iP −+= (2)
For a decision making involving two choices A and B, the
probability of choosing A is given as:
)]}(exp[/{)]exp()/[exp()exp(
BiAi
BiAiAiAiUU11
UUUP−−+=
+= (3)
where UAi - UBi = β(ZAi-ZBi) = βZi; β = row vector of parameters (coefficient of variables) to be estimated; Zji = column vector of attributes of individual i and characteristics of mode j.
The calibration and validation of the binary logit model
involves the determining the parameter vector β, which is achieved by using the data collected onsite. In this study, we incorporate six possible influencing variables to calculate
Fig. 1. A schematic diagram of an unsignalized urban road section
1296
the utility function that captures the decision making process (PGA = 0: rejecting a gap, PGA = 1: accepting a gap), including:
- Age: pedestrian’s age category (0: YOUNGER, 1:
OLDER); - Gender: pedestrian’s gender category (0: MALE, 1:
FEMALE); - WTime: pedestrian’s waiting time (s); - PedNum: number of pedestrians in a crossing group; - NearGap: near-side (relative to pedestrian crossing
direction) gap time in the vehicle lane (s); - FarGap: far-side (relative to pedestrian crossing
direction) gap time in the vehicle lane (s). Hence, the general form of the binary logit model for
pedestrian gap acceptance is:
⎪⎩
⎪⎨
⎧
−+==
β+β+β+β+β+β+α=
)]exp(/[)( 1
654
3211
U111PGAP
FarGapNearGapPedNumWTimeGenderAgeU
(4)
Then the idea is to test the relationship between the
pedestrians’ decision output and the above behavioral factors. The data required for analyzing and modeling the pedestrian gap acceptance include the static site characteristics and the microscopic dynamics of the pedestrians and vehicles. The former can be easily obtained through field survey with measuring tools, while the latter can be collected by video camera recording with manual data extraction, which promises a good trade-off among flexibility, accuracy and efficiency, and also provides the opportunity for the researcher to trace back to the original event scenarios. The data collection details are discussed in the next section.
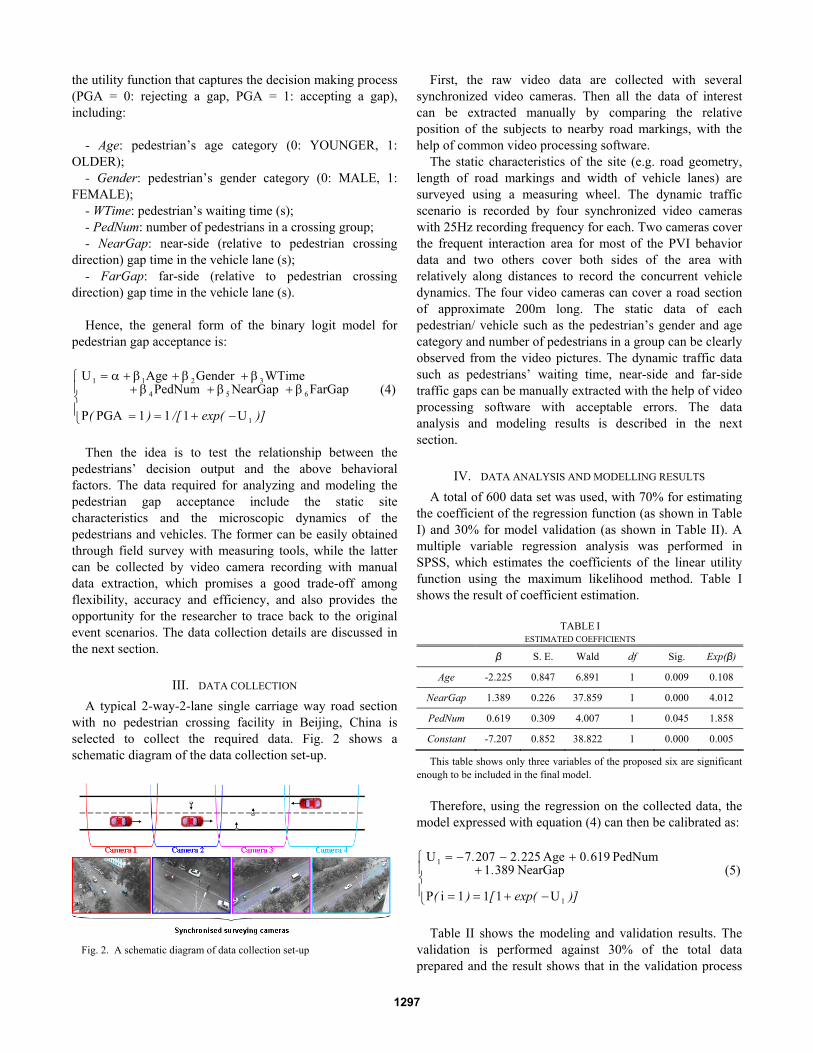
III. DATA COLLECTION A typical 2-way-2-lane single carriage way road section
with no pedestrian crossing facility in Beijing, China is selected to collect the required data. Fig. 2 shows a schematic diagram of the data collection set-up.
First, the raw video data are collected with several synchronized video cameras. Then all the data of interest can be extracted manually by comparing the relative position of the subjects to nearby road markings, with the help of common video processing software.
The static characteristics of the site (e.g. road geometry, length of road markings and width of vehicle lanes) are surveyed using a measuring wheel. The dynamic traffic scenario is recorded by four synchronized video cameras with 25Hz recording frequency for each. Two cameras cover the frequent interaction area for most of the PVI behavior data and two others cover both sides of the area with relatively along distances to record the concurrent vehicle dynamics. The four video cameras can cover a road section of approximate 200m long. The static data of each pedestrian/ vehicle such as the pedestrian’s gender and age category and number of pedestrians in a group can be clearly observed from the video pictures. The dynamic traffic data such as pedestrians’ waiting time, near-side and far-side traffic gaps can be manually extracted with the help of video processing software with acceptable errors. The data analysis and modeling results is described in the next section.
IV. DATA ANALYSIS AND MODELLING RESULTS A total of 600 data set was used, with 70% for estimating
the coefficient of the regression function (as shown in Table I) and 30% for model validation (as shown in Table II). A multiple variable regression analysis was performed in SPSS, which estimates the coefficients of the linear utility function using the maximum likelihood method. Table I shows the result of coefficient estimation.
TABLE I
ESTIMATED COEFFICIENTS
β S. E. Wald df Sig. Exp(β)
Age -2.225 0.847 6.891 1 0.009 0.108
NearGap 1.389 0.226 37.859 1 0.000 4.012
PedNum 0.619 0.309 4.007 1 0.045 1.858
Constant -7.207 0.852 38.822 1 0.000 0.005
This table shows only three variables of the proposed six are significant enough to be included in the final model.
Therefore, using the regression on the collected data, the
model expressed with equation (4) can then be calibrated as:
⎪⎩
⎪⎨
⎧
−+==
++−−=
)]exp([)(
....
1
1
U111iP
NearGap3891PedNum6190Age22522077U
(5)
Table II shows the modeling and validation results. The
validation is performed against 30% of the total data prepared and the result shows that in the validation process
Fig. 2. A schematic diagram of data collection set-up
1297

the percentage of the overall correct prediction of the above binary logit model is 91.0%.
TABLE II
MODELLING AND VALIDATION RESULTS Predicted
Cases for modeling Cases for validation PGA PGA
Observed
0 1 Correct %
0 1 Correct %
0 300 10 96.8 98 8 92.5 PGA
1 20 114 85.1 6 44 88.0 Overall % N/A N/A 93.2 N/A N/A 91.0
V. DISCUSSION For the pedestrian gap acceptance model under pure
unsignalized condition, three factors including near-side traffic gap, pedestrian’s age category and number of pedestrians in a crossing group, out of six proposed ones, are identified significant enough to be included into the binary logit model. The fact that the factor of pedestrian’s waiting time is left out is not surprising because it has been found by different researchers when they studied the pedestrians’ gap acceptance behavior at marked crossing facilities that the increase of waiting time could result in either shorter or larger accepted gaps. Some researchers explained it as that pedestrians tend to exhibit more risky behavior when waiting a longer time while others are in favor that the pedestrians who still wait at the curbside after long waiting time tend to be careful in nature and therefore would hardly accept a short or risky gap.
A. The effect of traffic gap time on gap acceptance: The near-side gap time is a significant influencing factor
to the pedestrians’ gap acceptance behavior. If the variable PedNum is fixed to 1, the predicted probability of accepting a gap for a single pedestrian in the binary logit model is shown in Fig. 3. Compared to the near-side gap, the far-side gap is not significant. This means that in reality the jaywalking pedestrians hardly pay attention to the far-side incoming vehicles when they start to cross the first lane. In fact, when we traced back to the raw video data, we found that many pedestrians cross the road regardless of the far-side gap, even when the far-side gap is too small to be utilized, resulting in the fact that such pedestrians wait at the middle of the road for the next possible gaps in the far-side lane to continue to cross the road. And this can be regarded as a potential dangerous behavior as there are no special facilities providing protection to the on-road crossing pedestrians.
B. The effect of age on gap acceptance: To analyze the difference in the gaps accepted by age
groups, we divided the data based on age into two groups: older pedestrians (i.e. those who appear to be 65 years or older) and younger pedestrians (i.e. those who appear to be between 20 and 50 years). A pedestrian’s age category is estimated by the researchers conducting the data collection, excluding those whose age group can not easily be determined by the researchers. Although this method is subjective than the pedestrians’ self reported data, it is by far the practical way to obtain those data when the subjects to be surveyed are kept unaware and it is accepted by peers in this research area. Fig. 4 shows the results from gaps accepted by both these groups of pedestrians (for a single pedestrian). It can be seen that when other factors are kept constant, older pedestrians are more cautious and wait for a longer near-side gap time to start the crossing, resulting in more pedestrians’ delays when there are no sufficient number of available gaps on the near-side vehicle lanes during busy hours.
C. The effect of group size on gap acceptance: The effect of group size on pedestrians’ gap acceptance
behavior is shown in Fig. 5. It can be seen that as the number in a waiting group increases, the pedestrians become more aggressive and thus may accept smaller gaps. One possible explanation is that when a particular pedestrian is
Fig. 4. Probability of the pedestrian’s gap acceptance (PedNum = 1)
Fig. 3. Probability of the pedestrian’s gap acceptance (PedNum = 1, Age = YOUNGER)
1298

surrounded by several other pedestrians, he/ she may feel protected by others and then may act more aggressively. However, the more complex effect of the grouping behavior on the gap acceptance has not been extensively studied at current stage. For example, the position of a pedestrian in a waiting group may have different effects on the gap acceptance behavior. Further exploration needs more data sets with the pedestrians’ grouping behavior.
D. Limitations and future research: The main limitation of the results is the spatial
transferability. Like most of other similar researches on road users’ behavior, it is argued that the road users’ behavior is closely related to the local culture. The validity of the results of such researches is usually limited to a certain area that shares the same culture in transportation. For example, most of existing simulation models developed using the data collected in developed countries are not appropriate to the situations in developing countries, where mixed traffic is more common. Intuitively, people living in a same area or city share the same culture so that the model is at least valid in a city-wide level; however, the extent of the model transferability still needs to be examined quantitatively, possibly by model validation from data collected at some other sites within the city. If the validity of the model drops significantly, the researchers then need to go through the calibration process to adjust its parameters or logic, or even to develop new models. As to the model itself, future research may also involve the inclusion of more possible influencing factors and larger data sets. In addition, the pedestrian gap acceptance is only one part of the whole PVI process, more behavior studies are to be carried out to fully incorporate the PVI into existing traffic microsimulation.
VI. SUMMARY This paper analyzed and modeled the pedestrians’ gap
acceptance behavior when they jaywalk outside crossing facilities, based on non-intrusive observations from real PVI scenarios, using binary logit technique. Three factors including near-side traffic gap time, pedestrian’s age category and number of pedestrians in a crossing group, out
of six proposed ones, are identified to be significant enough to be included into the binary logit model. The initial results with the logit model are appealing when considered in combination of its simplicity and accuracy. The benefits of such researches are twofold. First, some fundamental understanding of PVI behavior will be gained and this knowledge can form guidelines for planning and engineering strategies for pedestrian related transport in the future. For example, with such studies and together with studies on pedestrians’ behavior at signal controlled crossing facilities, it is possible to compare the operational performances of various pedestrian related treatments such as “do-nothing”, fixed-time signal control and pedestrian activated signal control, etc, considering multi-criteria trade-off among efficiency (usually indicated by delays of pedestrians and vehicles), safety (usually indicated by number of conflicts of pedestrians and vehicles) and environmental impact (usually indicated by emissions and fuel consumption, which can be obtained by linking the behavior models with emission and fuel consumption models). Therefore, current guidelines, such as described in Design Manual for Roads and Bridges (DMRB) [18] and Manual of Uniform Traffic Control Devices (MUTCD) [19], etc on whether and where to install a new pedestrian crossing facility on a certain part of urban road areas or what type of crossing facility to be used can be supplemented. Second, this knowledge can be interpreted and integrated into current microsimulation models, with which various design, management and control plans can be tested and evaluated. Considering both pedestrians and vehicles, detailed indicators of efficiency, safety and environmental impact can be generated and presented vividly and cost-effectively, in a microsimulation environment, as a supplement for existing engineering tools.
REFERENCES [1] J. Hine, “Pedestrian travel experiences: assessing the impact of traffic
on behaviour and perceptions of safety using an in-depth interview technique”, Journal of Transport Geography, vol. 4, pp. 179-199, 1996.
[2] B. Hamiltion-Baillie, “Shared Space: Reconciling People, Places and Traffic”, Built environment, vol. 34 (2), pp. 161-181, 2008.
[3] B. J. Schroeder, A Behaviour-Based Methodology for Evaluating Pedestrian-Vehicle Interaction at Crosswalks. Dissertation (PhD (Civil Engineering)), North Carolina State University, United States, 2008.
[4] Y. Du, Simulation Study of Different Operations of Mixed Traffic With Motor Vehicles and Bicycles at AT-grade Intersections in Beijing, China. Dissertation (PhD (Civil Engineering)), University of Southampton, United Kingdom, 2008, pp. 6-7.
[5] C. V. Negoita, and D. Ralescu, Simulation, Knowledge-based computing, and Fuzzy Statistics. New York: Van Nostrand Reinhold Company Inc, 1987, pp. 6-8.
[6] S. Algers, et al, Review of microsimulation models. SMARTEST Project Deliverable D3, Institute for Transport Studies, University of Leeds, Leeds, United Kingdom, 1997. Available: http://www.its.leeds.ac.uk/projects/smartest/deliv3.html#a2 [Accessed 25 June 2008].
[7] D. Harney, “Pedestrian modelling: Current methods and future directions”, Road & Transport Research: Journal of Australian and New Zealand Research and Practice, vol. 11 (4), pp. 38-48, 2002.
Fig. 5. Probability of the pedestrian’s gap acceptance (Age = YOUNGER)
1299

[8] D. Gettman, and L. Head, Surrogate Safety Measures From Traffic Simulation Models: Final Report. US: Federal Highway Administration, 2003.
[9] M. M. Ishaque, Policies for Pedestrian Access: a Multi-modal Trade-off Analysis using Micro-simulation Techniques. Dissertation (PhD (Civil Engineering)). University of London, United Kingdom, 2006.
[10] B. J. Schroeder, and N. M. Rouphail, “A Framework for Evaluating Pedestrian-Vehicle Interactions at Unsignalized Crossing Facilities in a Microscopic Modeling Environment”, Presented at the 86th Annual Meeting of the Transportation Research Board, Washington DC, United States, 2007.
[11] R. Dunn, and R. Petty, “Mid-Block Pedestrian Crossings – An Examination of Delay”, 12th Annual Australian Road Research Board Conference Proceedings, Hobart, Tasmania, Australia. August 1984.
[12] H. F. Huang, M. J. Cynecki, “Effects of Traffic Calming Measure on Pedestrian and Motorist Behavior”, Transportation Research Record, vol. 1773, pp. 69-74, 2001.
[13] P. D. Pant and P. Balakrishnan, “Neural Network for Gap Acceptance at Stop-controlled Intersections”, ASCE Journal of Transportation Engineering, vol. 120 (3), pp. 432-446, 1994.
[14] A. Poulos, “Gap acceptance characteristics at unsignalized urban intersections”, Traffic Engineering and Control, vol. 23 (2), pp. 88-92, 1983.
[15] C. V. Zeeger et al, “Safety Effects of Marked versus Unmarked Crosswalk at Uncontrolled Locations: Analysis of Pedestrian Crashes in 30 Cities”, Transportation Research Record, vol. 1773, pp. 56-68, 2001.
[16] H. Timmermans (Editor), Pedestrian Behavior, Models, Data Collection and Applications. UK: Emerald Group Publishing Limited, 2009.
[17] D. Sun, et al, “Modeling of Motorist-Pedestrian Interaction at Uncontrolled Mid-block Crosswalks”, Submitted for Publication in Transportation Reseach Record, TRB 2003 Annual Meeting CD-ROM. Washington, DC, 2003.
[18] Highways Agency (2009) Design Manual for Roads and Bridges. Available from: http://www.standardsforhighways.co.uk/dmrb/index.htm [Accessed 15 July 2010].
[19] FHWA (2003) Manual on Uniform Traffic Control Devices. FHWA, U.S. Department of Transportation. Available from: http://mutcd.fhwa.dot.gov [Accessed 15 July 2010].
1300
Copyright © 2022 FDOKUMEN