Studies on microbial causes of mastitis in buffaloes Thesis Presented by Badia Saad EL-Sayed ...
55
Studies on microbial causes of mastitis in buffaloes Thesis Presented by Badia Saad EL-Sayed Moshref Under the supervision of Prof. Dr. Mohamed Kamal Refai Professor of Microbiology Faculty of Veterinary Medicine Cairo University Prof. Dr. Salah Abd-EL-Hamid Youssef Dr. Nagat Ahmed Saleh Prof. of Pharmacology Chief Researcher Faculty of Veterinary Medicine Buffalo Diseases Research Depart Cairo University Animal Health Research Institute 2004
Transcript of Studies on microbial causes of mastitis in buffaloes Thesis Presented by Badia Saad EL-Sayed ...
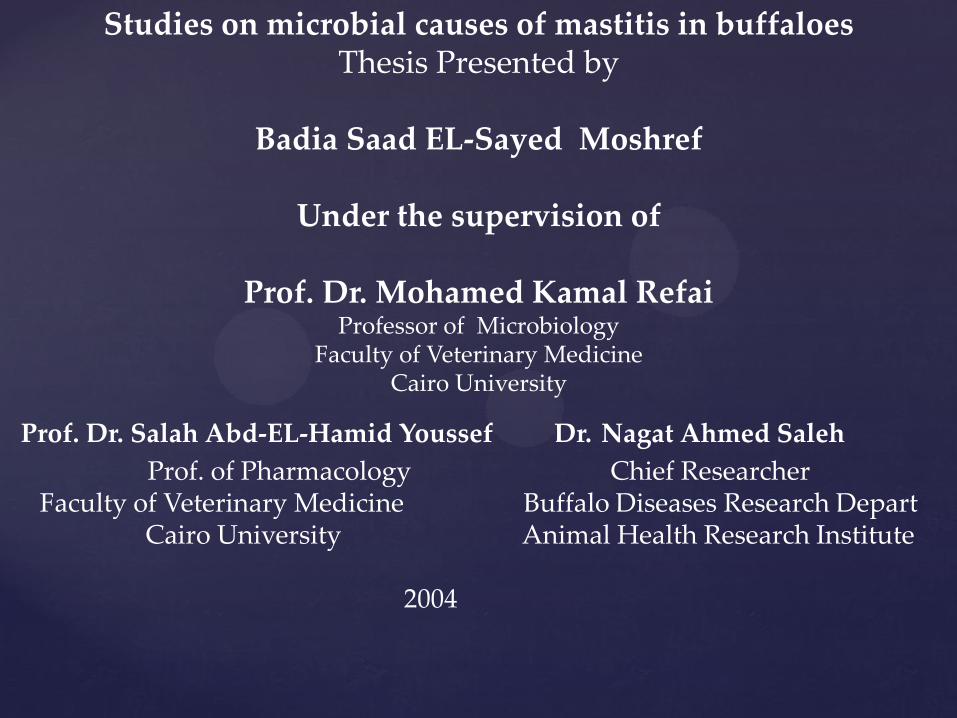
Studies on microbial causes of mastitis in buffaloes Thesis Presented by
Badia Saad EL-Sayed Moshref
Under the supervision of
Prof. Dr. Mohamed Kamal Refai
Professor of Microbiology Faculty of Veterinary Medicine
Cairo University
Prof. Dr. Salah Abd-EL-Hamid Youssef Dr. Nagat Ahmed Saleh
Prof. of Pharmacology Chief Researcher Faculty of Veterinary Medicine Buffalo Diseases Research Depart Cairo University Animal Health Research Institute
2004
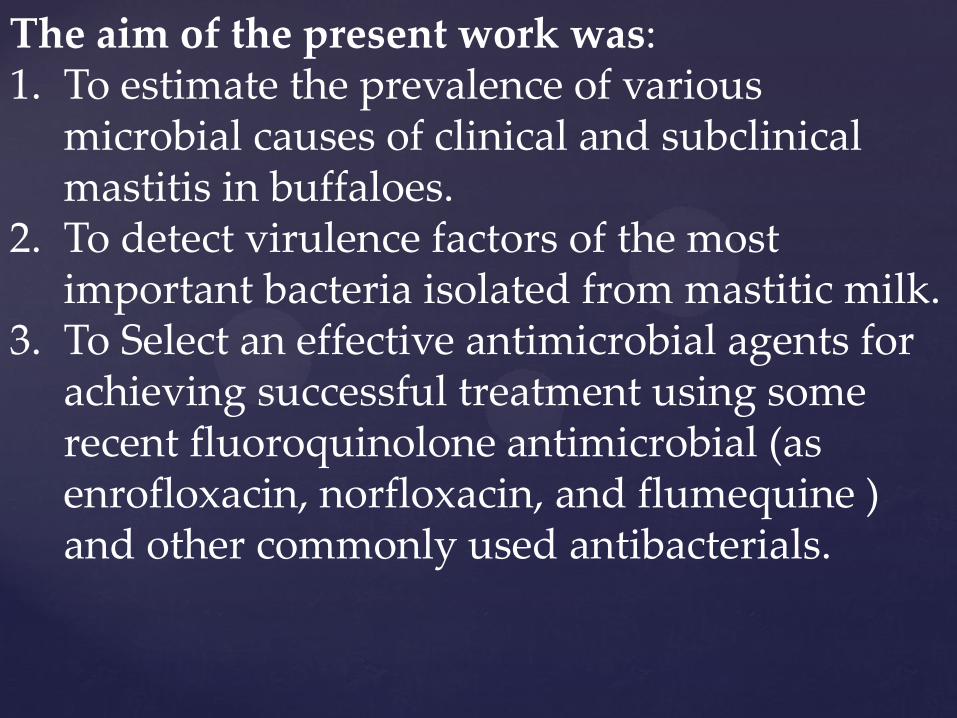
The aim of the present work was: 1. To estimate the prevalence of various
microbial causes of clinical and subclinical mastitis in buffaloes.
2. To detect virulence factors of the most important bacteria isolated from mastitic milk.
3. To Select an effective antimicrobial agents for achieving successful treatment using some recent fluoroquinolone antimicrobial (as enrofloxacin, norfloxacin, and flumequine ) and other commonly used antibacterials.

MATERIAL AND METHODS Animals: A total of 157 dairy buffaloes in 4 herds from different farms were examined for mastitis. According to clinical observation and California mastitis test (Schalm et al., 1971), the mastitic cases (104) were classified into clinical (47) and subclinical (57). Samples: A total of 393 individual quarter milk samples were collected from 104 lactating buffaloes, 169 quarter milk samples from clinically infected animals (47 buffaloes) and 224 samples from subclinically mastitic animals (57 buffaloes).

The diagnostic “O” sera 51 vials
(polyvalent, 8 vials and monovalent , 43 vials)
Polyvalent 1: O1, O26, O86A, O111, O119, O127A , O128. Polyvalent 2: O44, O55, O125, O126 and O146, O166. Polyvalent 3: O18, O114, O142, O151, O157, O158. Polyvalent 4: O6, O27, O78, O148, O159, O168. Polyvalent 5: O20, O25, O63, O513, O167. Polyvalent 6: O8, O15, O115, O169. Polyvalent 7: O28ac, O112AC, O124, O136, O144. Polyvalent 8: O29, O143, O152, O164
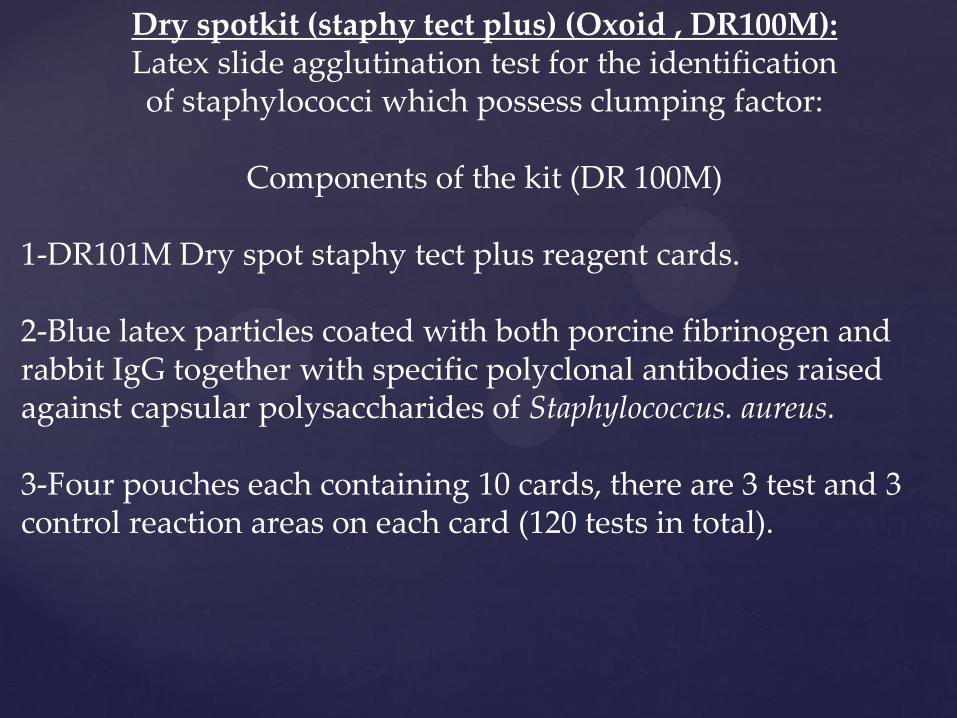
Dry spotkit (staphy tect plus) (Oxoid , DR100M): Latex slide agglutination test for the identification of staphylococci which possess clumping factor:
Components of the kit (DR 100M)
1-DR101M Dry spot staphy tect plus reagent cards. 2-Blue latex particles coated with both porcine fibrinogen and rabbit IgG together with specific polyclonal antibodies raised against capsular polysaccharides of Staphylococcus. aureus. 3-Four pouches each containing 10 cards, there are 3 test and 3 control reaction areas on each card (120 tests in total).

Antibiotic sensitivity discs (Bio-Merieux): Reagents and products of such discs containing the following antibiotics: amikacin (30µg), streptomycin(10µg), chloramphenicol (30µg), cefotaxim (30µg), colistin sulphate (25µg), norfloxacin (10µg), flumequine (30µg), gentamicin (10µg), enrofloxacin (10µg) , kanamycin (30µg), cefacetril (30 µg) and nitrofurantoin (300 µg).
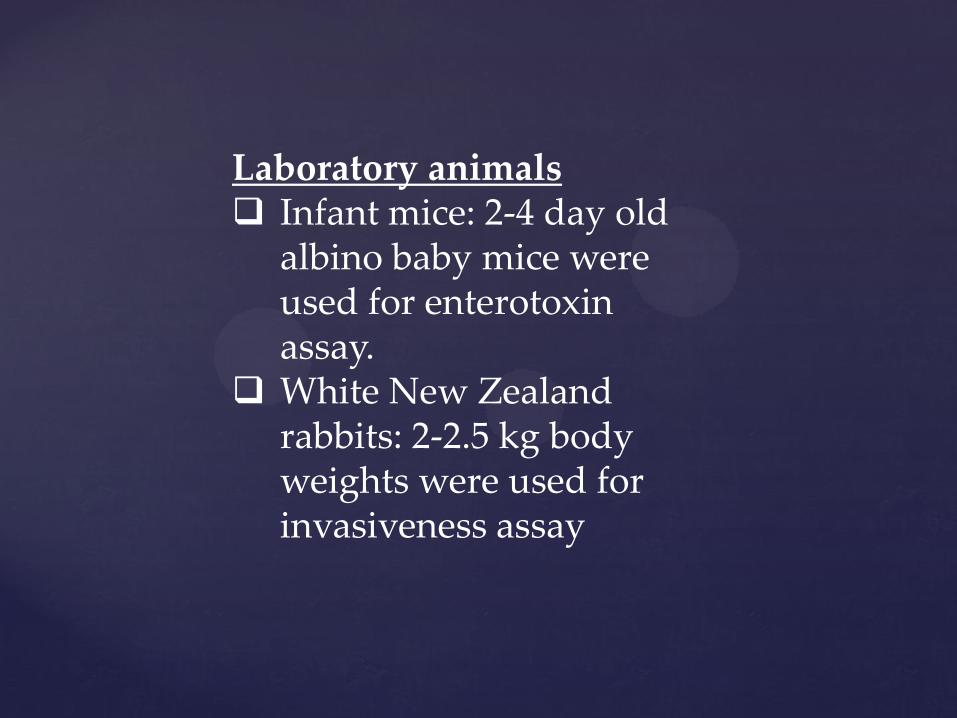
Laboratory animals Infant mice: 2-4 day old
albino baby mice were used for enterotoxin assay.
White New Zealand rabbits: 2-2.5 kg body weights were used for invasiveness assay

Methods Rapid diagnostic tests: • Modified White Side test (MWT): This test depends directly or indirectly on the presence of leucocytes, which cause a precipitate on adding sodium hydroxide solution. • California mastitis test (CMT) Schalm et al. (1971) The CMT reagents consist of a detergent plus pH indicator (brown cresol purple). The reaction between the detergent and DNA of cell nuclei is a measure of the number of somatic cell in the milk Bacteriological examination of milk samples (Quinn et al. , 1994): Mycological examination of milk samples (Refai, 1988) • Identification of the isolates Studies of virulence factors of the isolates
Test
S.a
gal
acti
ae
S.d
ysa
gal
acti
ae
S.f
aeca
lis
S.u
ber
is
S. p
neu
mo
nia
e
S. p
yo
gen
es
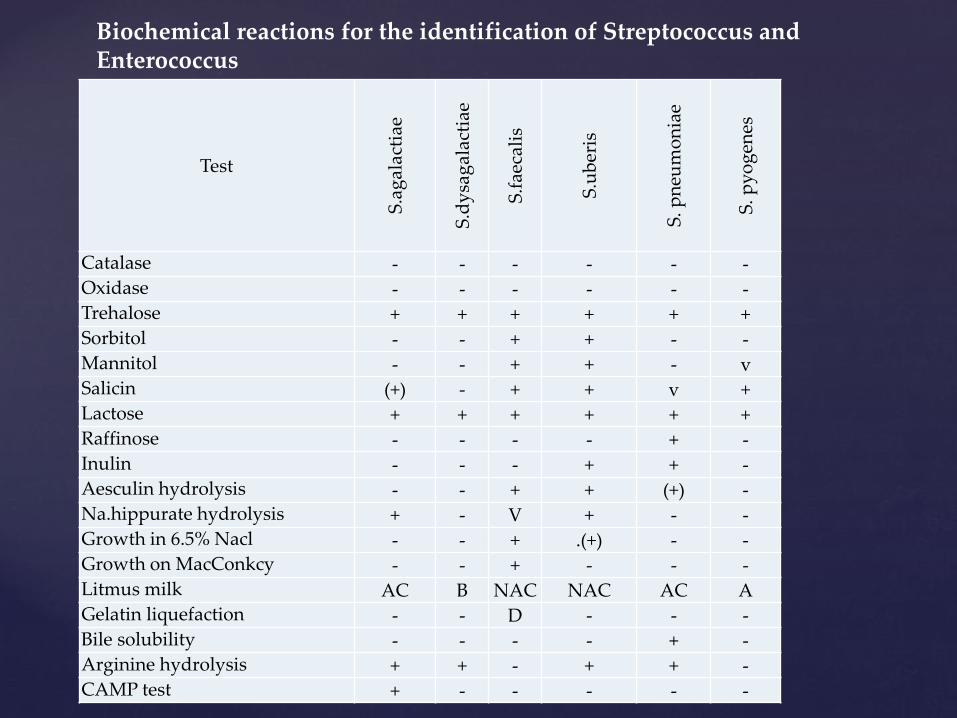
Catalase - - - - - -
Oxidase - - - - - - Trehalose + + + + + +
Sorbitol - - + + - - Mannitol - - + + - v
Salicin (+) - + + v +
Lactose + + + + + +
Raffinose - - - - + -
Inulin - - - + + - Aesculin hydrolysis - - + + (+) -
Na.hippurate hydrolysis + - V + - - Growth in 6.5% Nacl - - + .(+) - -
Growth on MacConkcy - - + - - -
Litmus milk AC B NAC NAC AC A
Gelatin liquefaction - - D - - -
Bile solubility - - - - + -
Arginine hydrolysis + + - + + -
CAMP test + - - - - -
Biochemical reactions for the identification of Streptococcus and Enterococcus

Test
S.a
gal
acti
ae
S.d
ysa
gal
acti
ae
S.f
aeca
lis
S.u
ber
is
S. p
neu
mo
nia
e
S. p
yo
gen
es
Catalase - - - - - -
Oxidase - - - - - - Trehalose + + + + + +
Sorbitol - - + + - - Mannitol - - + + - v
Salicin (+) - + + v +
Lactose + + + + + +
Raffinose - - - - + -
Inulin - - - + + - Aesculin hydrolysis - - + + (+) -
Na.hippurate hydrolysis + - V + - - Growth in 6.5% Nacl - - + .(+) - -
Growth on MacConkcy - - + - - -
Litmus milk AC B NAC NAC AC A
Gelatin liquefaction - - D - - -
Bile solubility - - - - + -
Arginine hydrolysis + + - + + -
CAMP test + - - - - -
Biochemical reactions for the identification of Streptococcus and Enterococcus

Differentiation of members of family Enterobacteriaceae
Test
Esc
her
ich
ia
coli
Kle
bsi
ella
p
neu
mo
ni
ae
En
tero
bac
ter
ae
rog
enes
Ser
rati
a m
arce
scen
s
Catalase + + + +
Oxidase - - - -
Indole production + - - -
MR( Methyl red) + (-) - (-)
VP(Voges Proskauer ) - + 4- +
Citrate - + + +
TSl A/A A/A A/A A/A
Hzs - - - -
Mannose + + + +
Lactose + + + -
Glucose(gas) + + + +
Sucrose D + 4- +
Dulcitol D d - -
Maltose + + + +
Mannitol + + + +
Xylose + + + -
Urease test - + - (-)
EMB Metallic sheen - - -
Mucoid colonies (-) + + -

Detection of virulence factors of Staphylococcus aureus: 1. Serum soft agar technique 2. Coagulase tests 3. Detection of haemolysin titre 4. Detection of enterotoxins producing
isolates (Igarashi et al. , 1986) 5. Pathogenicity in mice (Yoshida and
Takuchi,1970) 6. Capsular polysaccharide Assay
(Tollesuran et al. , 2000). 7. SDS-PAGE of Capsular polysaccharide

Detection of virulence factors of E. coli isolates: 1. Haemagglutination test (HA Evans et al. , 1977) 2. Serum resistance 3. Survival of E. coli in serum 4. Growth of E.coli in serum 5. Detection of heat stable enterotoxin (STa) of
E.coli 6. Verocytotoxin assay ( Emery et al. , 1991 ) 7. Invasiveness assay: (Bailey and Scott, 1990) 8. Extraction and purification of LPS 9. LPS lethality (Johns et al. , 1983) 10. Susceptibility of the isolated strains to various
antibiotics

Antimicrobial agents Disk potency Diameter of inhibition
Resistant Sensitive
Enrofloxacin 5 µg <12 >16
Norfloxacin 5 µg <15 >21
Amikacin µg < 14 > 17
Cefacetrile 30 µg < 14 >23
Gentamicin 10 µg < 12 > 15
Nitrofurantoin 300 µg <14 > 17
Cefataxime 30 µg < 14 > 23
Streptomycin 10 µg < 11 > 15
Chloramphenicol 30 µg < 12 > 18
Colistin sulphate 10 µg < 8 > 11
Flumequine 30 µg <16 > 16
Kanamycin 30 µg < 13 > 18
Interpretation of zone diameter of growth inhibition
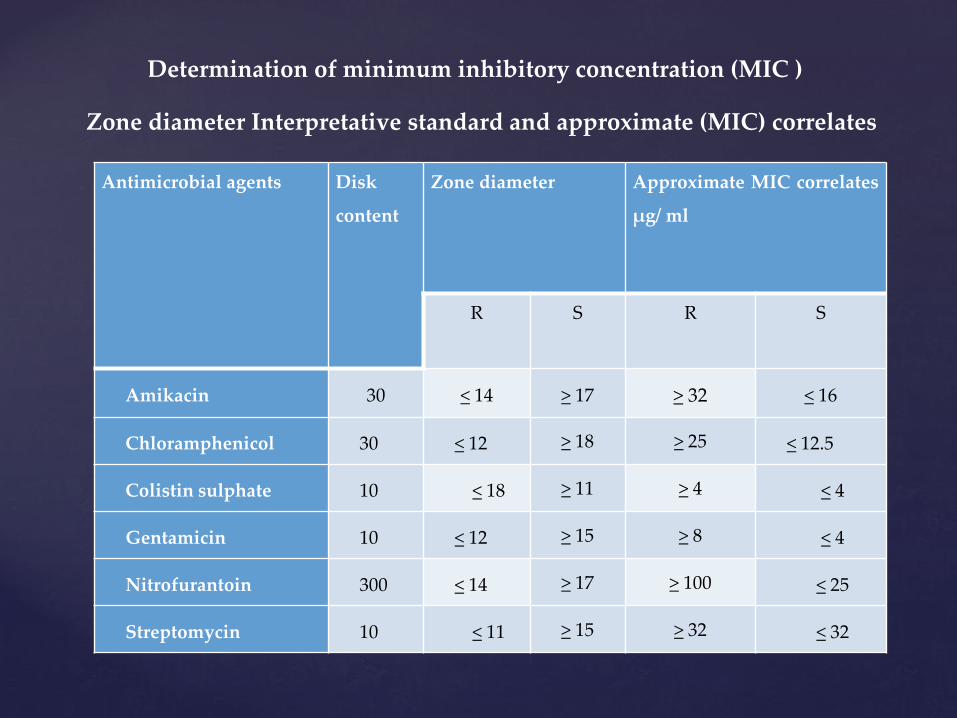
Zone diameter Interpretative standard and approximate (MIC) correlates
Determination of minimum inhibitory concentration (MIC )
Antimicrobial agents Disk
content
Zone diameter Approximate MIC correlates
µg/ ml
R S R S
Amikacin 30 < 14 > 17 > 32 < 16
Chloramphenicol 30 < 12 > 18 > 25 < 12.5
Colistin sulphate 10 < 18 > 11 > 4 < 4
Gentamicin 10 < 12 > 15 > 8 < 4
Nitrofurantoin 300 < 14 > 17 > 100 < 25
Streptomycin 10 < 11 > 15 > 32 < 32

Results

No of
animals
examined
No of
mastitic
animals
%
Types of mastitis
Clinical Subclinical
No % No %
157 104 66.24 47 29.94 57 36.30
Table (7): Prevalence of mastitis among buffaloes

Table 8: Distribution of positive quarters among mastitic buffaloes
Types of
mastitis
No of
animals
Distribution of infected quarters
One quarter
Two quarters
Three
quarters
Four
quarters No of
examined
quarters
No of
positive
quarter
s
%
No % No % % No %
Clinical 47 5 10.6 8 17.02 18 38.29 16 34.04 169 139 82.25
Subclinic
al 57 13 22.81 21 36.84 15 26.32 8 14.03 224 132 58.93
Total 104 18 17.30 29 27.88 33 31.73 24 23.07 393 271 68.96

TABLE 9: MICROORGANISMS ISOLATED FROM MASTITIC BUFFALOES
TYPES OF
MASTITIS BACTERIA YEASTS MOULDS
TOTAL
NUMBER OF
ISOLATES
CLINICAL
169 QUARTERS 147 48 17 212
SUBCLINICAL 109 52 21 182
TOTAL 256
(64.97%)
100
(25.38%)
38
(9.64%)
394
(100%)

TABLE (10): BACTERIA ISOLATED FROM MASTITIC BUFFALOES
TYPES OF ISOLATES CLINICAL SUBCLINICAL TOTAL
NO. % NO. % NO. %
E. COLI
STAPHYLOCOCCI
S. AUREUS
S. EPIDERMIDIS.
S. INTERMEDIUS
S. HYICUS
STREPTOCOCCI
S. DYSGALACTIAE
S. AGALACTIAE
60
62
40
11
8
3
25
13
12
40.82
42.18
27.21
8.16
5.44
2.04
17.01
8.84
7.48
45
41
14
13
11
3
23
13
10
41.28
37.61
12.84
11.93
9.17
2.75
21.10
11.93
10.09
105
103
54
24
19
6
48
26
22
41.02
40.23
21.09
9.38
7.42
2.34
18.75
10.16
8.59
TOTAL 147 57.42 109 42.58 256 100

TABLE 11: PREVALENCE OF SINGLE AND MIXED BACTERIA FROM MASTITIC BUFFALOES
TYPES OF ISOLATES
CLINICAL
(139)
SUBCLINICAL
(132)
TOTAL
(271)
NO. % NO. % NO. %
SINGLE INFECTION
E. COLI
S. AUREUS
S. DYSGALACTIAE
S. AGALACTIAE
S. EPIDERMIDIS.
S. INTERMEDIUS
S. HYICUS
22
17
9
6
5
3
1
15.83
12.23
6.47
4.32
3.60
2.16
0.72
19
4
11
6
4
10
2
14.39
3.03
8.33
4.55
3.03
7.58
1.52
41
21
20
12
9
13
3
15.13
7.75
7.38
4.43
3.32
4.80
1.11
TOTAL 63 45.32 56 42.42 119 43.91
MIXED INFECTION
S. AGALACTIAE + E. COLI
S. AUREUS + E. COLI
S. INTERMEDIUS + E. COLI
S. DYSGALACTIAE + E. COLI
6
8
3
2
5.76
4.32
2.16
1.45
4
0
1
1
3.03
0.0
0.76
0.76
12
6
4
3
4.43
2.21
1.48
1.11
TOTAL 19 13.67 6 4.55 25 9.23

TABLE 12: PREVALENCE OF BACTERIAL ISOLATES FROM CLINICAL MASTITIC MILK SAMPLES IN SINGLE AND MIXED INFECTION
TYPES OF
ISOLATES SINGLE MIXED TOTAL
NO % NO % NO %
E. COLI
S. AUREUS
S.DYSGALACTIA
E
S. AGALACTIAE
STAPH
EPIDERMIDIS
S. INTERMEDIUS
S. HYICUS
22
17
9
6
5
3
1
34.92
26.98
14.29
9.52
7.94
4.76
1.59
38
23
4
6
6
5
2
45.24
27.38
4.76
7.14
7.14
5.95
2.38
60
40
13
12
11
8
3
40.82
27.21
8.84
8.16
7.48
5.44
2.04
TOTAL 63 42.86 84 57.14 147 100
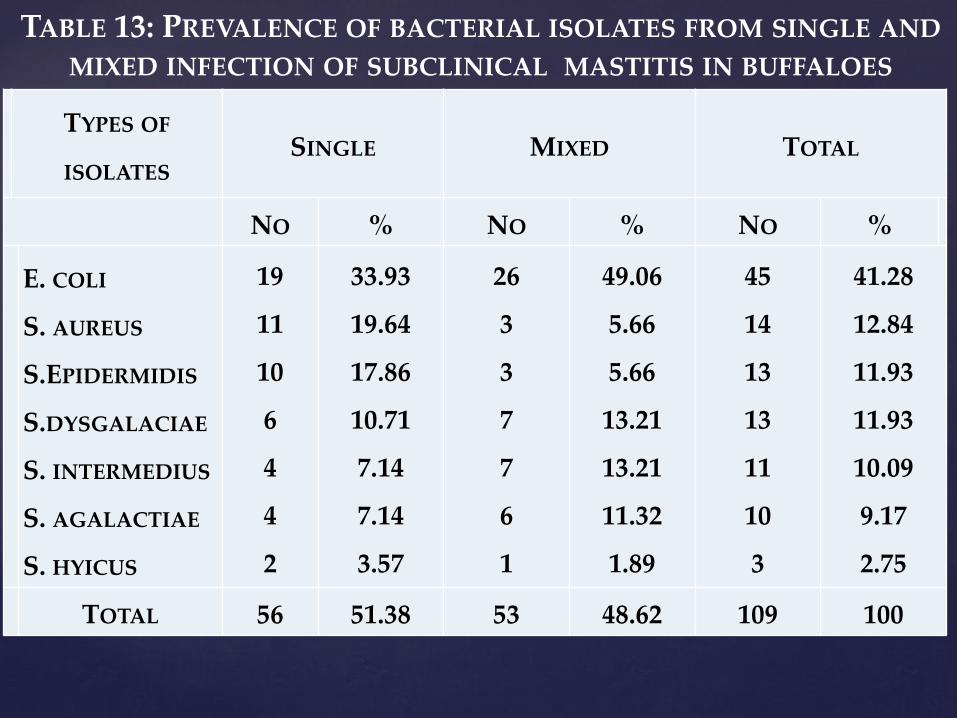
TABLE 13: PREVALENCE OF BACTERIAL ISOLATES FROM SINGLE AND MIXED INFECTION OF SUBCLINICAL MASTITIS IN BUFFALOES
TYPES OF
ISOLATES SINGLE MIXED TOTAL
NO % NO % NO %
E. COLI
S. AUREUS
S.EPIDERMIDIS
S.DYSGALACIAE
S. INTERMEDIUS
S. AGALACTIAE
S. HYICUS
19
11
10
6
4
4
2
33.93
19.64
17.86
10.71
7.14
7.14
3.57
26
3
3
7
7
6
1
49.06
5.66
5.66
13.21
13.21
11.32
1.89
45
14
13
13
11
10
3
41.28
12.84
11.93
11.93
10.09
9.17
2.75
TOTAL 56 51.38 53 48.62 109 100
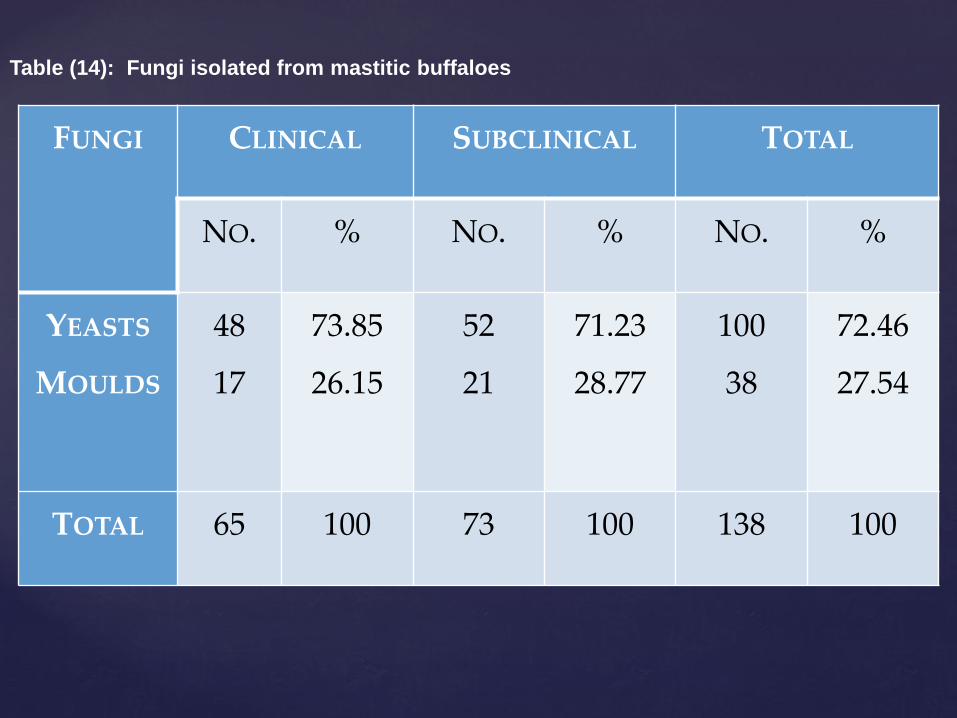
FUNGI CLINICAL SUBCLINICAL TOTAL
NO. % NO. % NO. %
YEASTS
MOULDS
48
17
73.85
26.15
52
21
71.23
28.77
100
38
72.46
27.54
TOTAL 65 100 73 100 138 100
Table (14): Fungi isolated from mastitic buffaloes

TYPES OF
ISOLATES
CLINICAL SUBCLINICAL TOTAL
NO % NO % NO %
Yeasts
Candida albicans
Candida tropicalis
Candida parapsillosis
Candida krusei
Saccharomyces
C.rugosa
Trichosporon
Rodotorulla
12
11
4
6
5
5
3
2
25.0
22.92
8.33
12.5
10.42
10.42
6.25
4.17
15
10
9
7
4
3
2
2
28.85
19.23
17.30
13.46
7.69
5.77
3.85
3.85
27
21
13
13
9
8
5
4
27.0
21.0
13.0
13.0
9.0
8.0
5.0
4.0
Total 48 48.0 52 52.0 100 100.0
Moulds
A. fumigatus
A. flavus
A . niger
Mucor
7
4
4
2
41.18
23.53
23.53
11.76
4
5
5
7
19.05
23.81
23.81
33.33
11
9
9
9
28.95
23.68
23.68
23.68
Total 17 44.74 21 55.26 38 100
Overall total 65 47.10 73 52.9 138 100
Table (15) : Prevalence of fungi isolated from both clinical and
subclinical mastitis in buffaloes

TYPES OF ISOLATES SINGLE TOTAL
NO % NO % NO %
Yeast Candida albicans Candida tropicalis Candida krusei C.rugosa Saccharomyces Candida parapsillosis Trichosporon spp. Rhodotorulla spp.
6 2 0 0 0 2 1 0
54.55 18.18 0.00 0.00 0.00
18.18 9.09 0.00
6 9 6 5 5 2 2 2
16.22 24.32 16.22 13.51 13.51 5.41 5.41 5.41
12 11 6 5 5 4 3 2
25.0 22.9 12.5 10.42 10.42 8.33 6.25 4.17
Total 11 22.92 37 77.08 48 100
Moulds A. fumigatus A. flavus A . niger Mucor spp.
2 0 0 0
100.0 0.00 0.0 0.0
5 4 4 2
33.33 26.67 26.67 13.33
7 4 4 2
41.18 23.53 23.53 11.76
Total 2 11.76 15 88.24 17 100
Overall total 13 20.0 52 80.0 65 100
Table (16): Identification and prevalence of fungi isolated from
clinical mastitic milk samples in single and mixed infection

Types of isolates Single Mixed Total
No % No % No %
Yeasts
Candida albicans
Candida tropicalis
Candida parapsillosis
Candida krusei
Saccharomyces spp.
Candida rugosa
Trichosporon spp.
Rhodotorulla
2
6
2
0
2
1
0
2
13.33
40.0
13.33
0.0
13.33
6.67
0.0
13.33
13
4
7
7
2
2
2
0
35.14
10.81
18.92
18.92
5.41
5.41
5.41
0.0
15
10
9
7
4
3
2
2
28.85
19.23
17.31
13.46
7.69
5.77
3.85
3.85
Total 15 28.85 37 71.15 52 100
Moulds
Mucor spp.
A . niger
A. flavus
A. fumigatus
5
2
4
3
35.71
14.29
28.57
21.43
2
3
1
1
28.57
42.86
14.29
14.29
7
5
5
4
33.33
23.81
23.81
19.05
Total 14 66.67 7 33.33 21 100
Overall total 29 39.73 44 60.27 73 100
Table (17): Identification and prevalence of fungi isolated from subclinical mast
itic milk samples in single and mixed infection

Types of infection No %
Double infection
E. coli +C. albicans
S. aureus +C. tropicalis
S. epidermidis + C. krusei
S. aureus + Sacchromyces spp.
S. aureus A. fumigatus
S. aureus + A. niger
E. coli + A. niger
E. coli + C. parapsillosis
E. col+ A. fumigatus
E. coli + C. rugosa
S. epidermidis + C. rugosa
S.hyicus + C. krusei
E. coli+ C. tropicalis
S.aureus +C.rugosa
Triple infection
E. coli + C. tropicalis+ A. flavus
S. dysgalactiae + Trichosporon + Mucor spp.
S. aureus + Rhodotorulla + Saccharomyces spp.
S. intermedius + E. coli + C.albicans
4
4
4
3
3
2
2
2
2
2
2
2
1
1
4
2
2
2
2.88
2.88
2.88
2.16
2.16
1.44
1.44
1.44
1.44
1.44
1.44
1.44
0.72
0.72
2.88
1.44
1.44
1.44
Overall total 44 31.65
Table (18): Prevalence of mixed infection of bacteria and fungi isolated from clinical mastitis

Types of infection No %
Double infection
E. coli + C.krusei
E. coli +C. albicans
S. agalactiae + C. albicans
S. dysgalactiae + C. parapsillosis
S. epidermidis + C. parapsillosis
S. aureus +C. tropicalis
S. intermedius + C. albicans
E.coli + A.niger
E.coli + Saccharomyces spp.
S. intermedius + C. rugosa
S. intermedius + C. parapsillosis
E. coli + A. fumigatus
Triple infection
E. coli + Trichosporon spp. + Mucor spp.
S. hyicus + A. flavus++C. tropicalis
7
5
5
3
3
3
3
3
2
2
1
1
2
1
5.30
3.79
3.79
2.27
2.27
2.27
2.27
2.27
1.52
1.52
0.76
0.76
1.52
0.76
Overall total 41 31.06
Table 19: Prevalence of mixed infection of bacteria and fungi isolated from subclinical mastitis
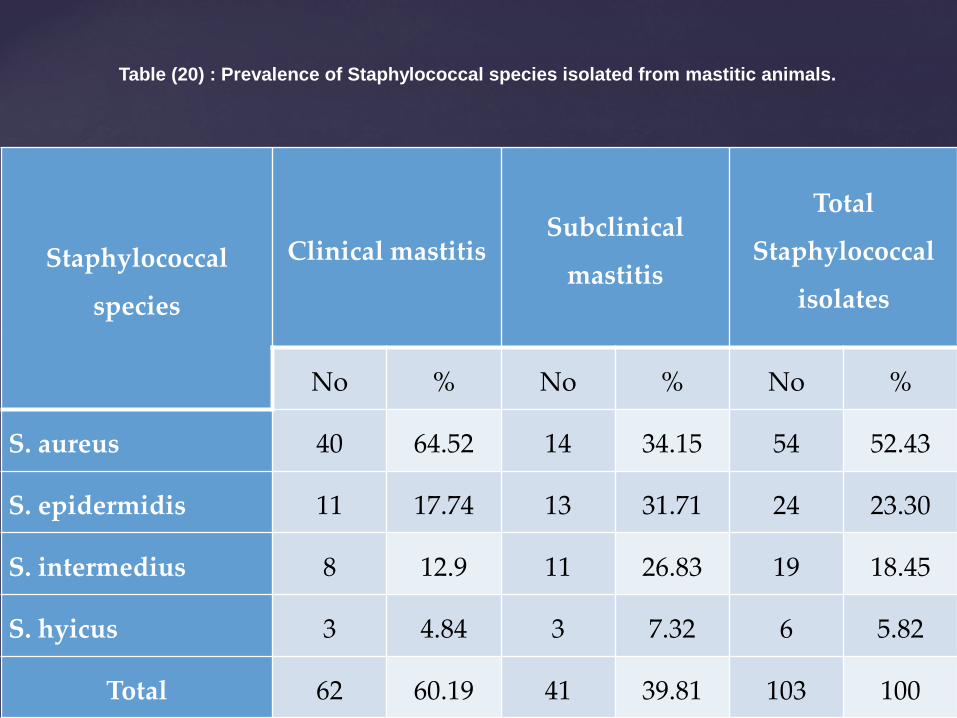
Staphylococcal
species
Clinical mastitis Subclinical
mastitis
Total
Staphylococcal
isolates
No % No % No %
S. aureus 40 64.52 14 34.15 54 52.43
S. epidermidis 11 17.74 13 31.71 24 23.30
S. intermedius 8 12.9 11 26.83 19 18.45
S. hyicus 3 4.84 3 7.32 6 5.82
Total 62 60.19 41 39.81 103 100
Table (20) : Prevalence of Staphylococcal species isolated from mastitic animals.

Source of isolates Total
Growth pattern
Diffuse growth Compact growth
No. % No. %
Clinical mastitis 40 26 65 14 35.7
Subclinical
mastitis 14 5 35.7 9 64.3
Total 54 31 57.4 23 42.6
Table (21): Growth pattern of S. aureus strains isolated from clinical
and subclinical mastitic milk in S.S.A
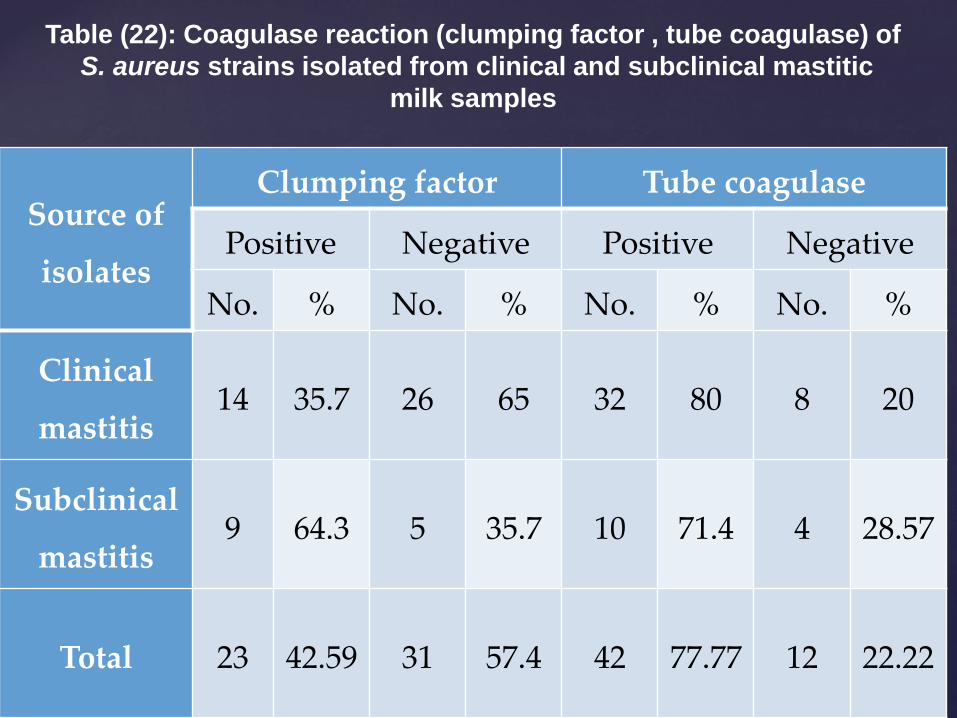
Source of
isolates
Clumping factor Tube coagulase
Positive Negative Positive Negative
No. % No. % No. % No. %
Clinical
mastitis 14 35.7 26 65 32 80 8 20
Subclinical
mastitis 9 64.3 5 35.7 10 71.4 4 28.57
Total 23 42.59 31 57.4 42 77.77 12 22.22
Table (22): Coagulase reaction (clumping factor , tube coagulase) of
S. aureus strains isolated from clinical and subclinical mastitic
milk samples
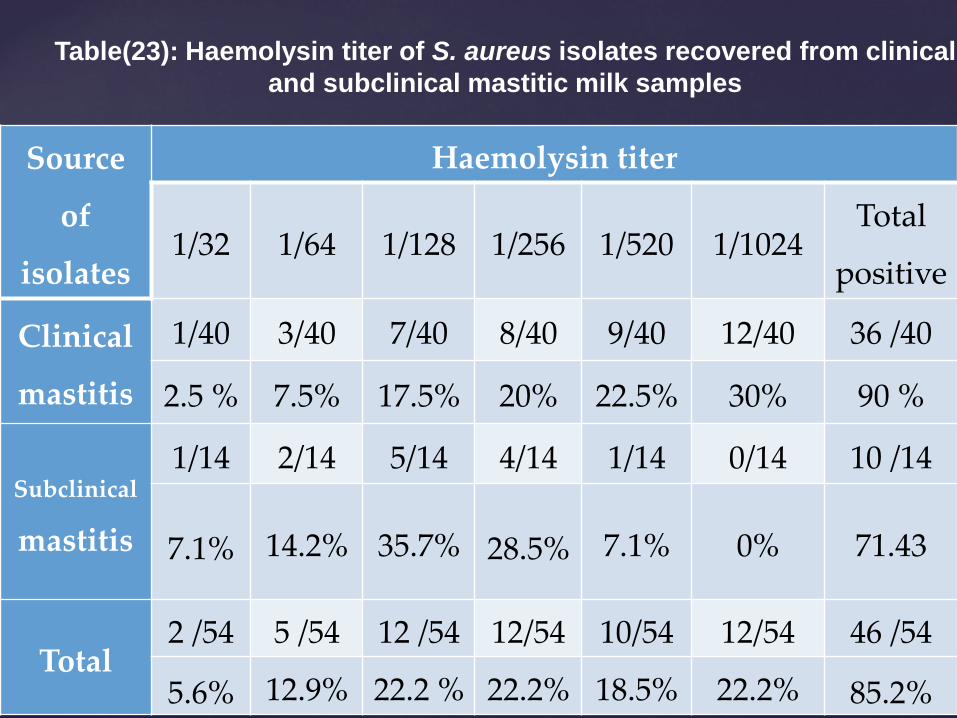
Source
of
isolates
Haemolysin titer
1/32 1/64 1/128 1/256 1/520 1/1024 Total
positive
Clinical
mastitis
1/40 3/40 7/40 8/40 9/40 12/40 36 /40
2.5 % 7.5% 17.5% 20% 22.5% 30% 90 %
Subclinical
mastitis
1/14 2/14 5/14 4/14 1/14 0/14 10 /14
7.1% 14.2% 35.7% 28.5% 7.1% 0% 71.43
Total 2 /54 5 /54 12 /54 12/54 10/54 12/54 46 /54
5.6% 12.9% 22.2 % 22.2% 18.5% 22.2% 85.2%
Table(23): Haemolysin titer of S. aureus isolates recovered from clinical
and subclinical mastitic milk samples

Source of
isolates Total
Toxigenic
strains
Types of enterotoxin
A B C
Clinical mastitis 40 27
(67.5%)
7
(17.5%)
5
(12.5%)
15
(37.5%)
Subclinical
mastitis
14 7
(50%)
1
(7.1%)
2
(14.2%)
4
(28.57%)
Total 54 34
62.96%
8
(14.8%)
7
(12.96%)
19
(35.19%)
Table (24): Frequency percentage of toxigenic S. aureus isolates
recovered from clinical and subclinical
mastitic milk samples

Source of
isolates
Total
No
. of
ino
cula
ted
mic
e No dead
mice
Mortality
rate
Clinical
mastitis 40 240 176 73.7%
Subclinical
mastitis 14 64 44 68.3%
Total 54 304 220 72.37%
Table (25) : Pathogenicity of S. aureus isolates recovered from clinical
and subclinical mastitic milk samples in mice

Virulence
attributes
Clinical mastitis Subclinicalmastits Total
(54)
No. % No %
Diffuse growth 26 65 5 35.7
31
(57.4%)
Compact growth 14 35 9 64.28
(23)
(42.59%)
Clumping factor 14 35 9 64.28
23
(42.59%)
Tube coagulase 32 80 10 71.42
42
(77.77%)
Hemolysin 36* 90 10 71.43
46
(85.19%)
Toxin production 27 67.5 7 50
34
(62.96%)
Pathogenicity to mice 31** 77.5 7 50
38
(70.37%)
Table (26) : Collective virulence attributes of S. aureus recovered
from clinical and subclinical mastitis

STRAINS NO. COLONIAL MORPHOLOGY
ON S.S.A. C.F. COAGULASE HEMOLYSIN TOXIN PRODUCTION
MORTALITY RATE
(%)
1 DIFFUSE - - 1/256 B 83.3
2 DIFFUSE - - 1/521 C 100
3 DIFFUSE - - 1/256 C 100
4 DIFFUSE - - 1/64 - 66.6
5 DIFFUSE - - 1/1024 C 83.3
6 DIFFUSE - - 1/32 C 83.3
7 DIFFUSE - - 1/521 C 100
8 DIFFUSE - - 1/64 A 83.3
9 DIFFUSE - + 1/128 C 100
10 DIFFUSE - + 1/521 B 100
11 DIFFUSE - + 1/1024 A 100
12 DIFFUSE - + 1/521 - 83.3
13 DIFFUSE - + 1/128 C 100
14 DIFFUSE - + 1/521 A 100
15 DIFFUSE - + 1/521 C 83.3
16 DIFFUSE - + 1/1024 A 83.3
17 DIFFUSE - + 1/256 B 83.3
18 DIFFUSE - + 1/521 A 83.3
19 DIFFUSE - + 1/64 C 83.3
20 DIFFUSE - + 1/1024 - 83.3
TABLE (27) : RELATIONSHIP OF COLONIAL MORPHOLOGY IN S.S.A , CLUMPING FACTOR, TUBE COAGULASE , HEMOLYSIN , TOXIN PRODUCTION AND MORTALITY RATE IN MICE OF S.AUREUS ISOLATES RECOVERED FROM CLINICAL MASTITIC MILK
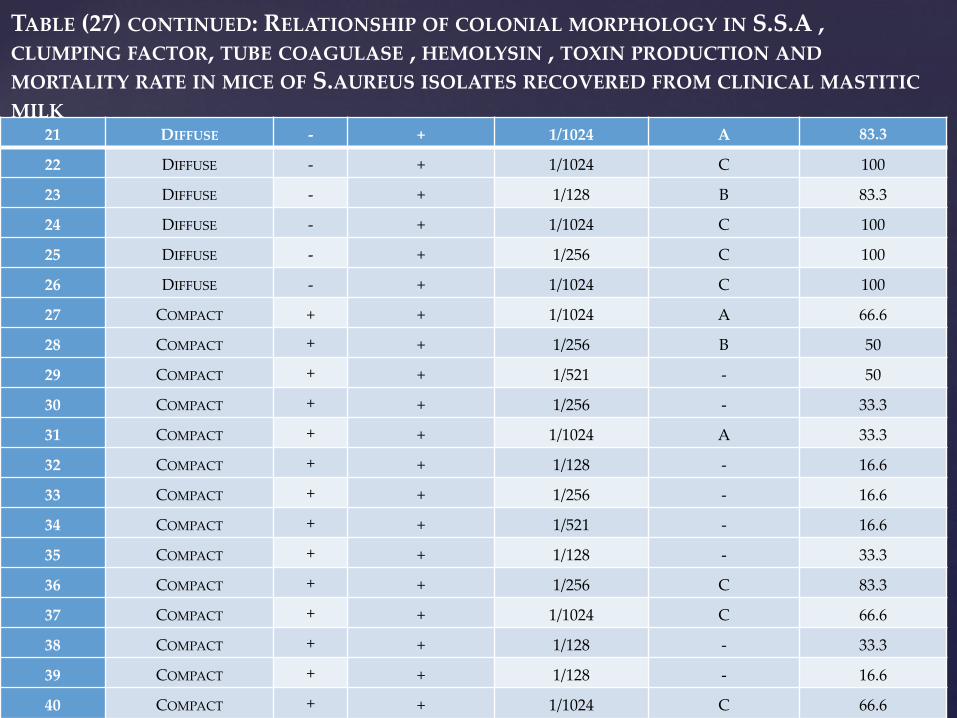
TABLE (27) CONTINUED: RELATIONSHIP OF COLONIAL MORPHOLOGY IN S.S.A , CLUMPING FACTOR, TUBE COAGULASE , HEMOLYSIN , TOXIN PRODUCTION AND MORTALITY RATE IN MICE OF S.AUREUS ISOLATES RECOVERED FROM CLINICAL MASTITIC MILK
21 DIFFUSE - + 1/1024 A 83.3
22 DIFFUSE - + 1/1024 C 100
23 DIFFUSE - + 1/128 B 83.3
24 DIFFUSE - + 1/1024 C 100
25 DIFFUSE - + 1/256 C 100
26 DIFFUSE - + 1/1024 C 100
27 COMPACT + + 1/1024 A 66.6
28 COMPACT + + 1/256 B 50
29 COMPACT + + 1/521 - 50
30 COMPACT + + 1/256 - 33.3
31 COMPACT + + 1/1024 A 33.3
32 COMPACT + + 1/128 - 16.6
33 COMPACT + + 1/256 - 16.6
34 COMPACT + + 1/521 - 16.6
35 COMPACT + + 1/128 - 33.3
36 COMPACT + + 1/256 C 83.3
37 COMPACT + + 1/1024 C 66.6
38 COMPACT + + 1/128 - 33.3
39 COMPACT + + 1/128 - 16.6
40 COMPACT + + 1/1024 C 66.6

STRAINS
NO.
COLONY
MORPHOLOGY IN
S.S.A.
C.F. COAGULASE HEMOLYSIN TOXIN
PRODUCTION
MORTALITY
RATE
(%)
1 DIFFUSE - - 1/521 B 66.6
2 DIFFUSE - - 1/256 C 100
3 DIFFUSE - - 1/128 A 66.6
4 DIFFUSE - - 1/256 C 83.3
5 DIFFUSE - + 1/128 C 83.3
6 Compact + + 1/256 - 16.6
7 Compact + + 1/64 - 33.2
8 Compact + + 1/128 C 82.3
9 Compact + + 1/64 - 16.6
10 Compact + + 1/128 - 16.6
11 Compact + + 1/256 B 66.6
12 Compact + + 1/128 - 33.3
13 Compact + + 1/23 - 0
14 Compact + + 1/256 C 66.6
TABLE (28) : RELATIONSHIP OF COLONIAL MORPHOLOGY IN S.S.A , CLUMPING FACTOR, TUBE COAGULASE , HEMOLYSIN , TOXIN PRODUCTION AND MORTALITY
RATE IN MICE OF S.AUREUS ISOLATES FROM SUBCLINICAL MASTITIC MILK

Types
of mastitis
Mortality per day
Total
mortality 1-3
days
3-6
days
6-9
days
9-12
days
12-
14 days
Clinical
mastitis 0 0 0 0 2 20%
Subclin
ical mastitis 0 0 0 1 0 10%
Table (29): Lethality of capsular polysaccharides of S.aureus in mice
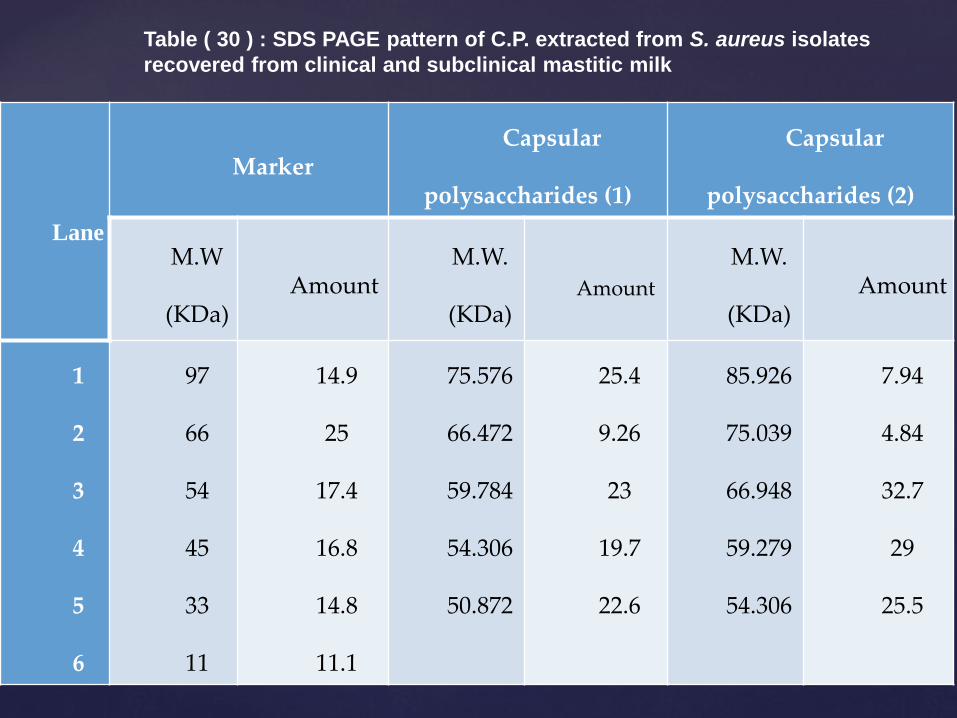
Lane
Marker
Capsular
polysaccharides (1)
Capsular
polysaccharides (2)
M.W
(KDa) Amount
M.W.
(KDa) Amount
M.W.
(KDa) Amount
1
2
3
4
5
6
97
66
54
45
33
11
14.9
25
17.4
16.8
14.8
11.1
75.576
66.472
59.784
54.306
50.872
25.4
9.26
23
19.7
22.6
85.926
75.039
66.948
59.279
54.306
7.94
4.84
32.7
29
25.5
Table ( 30 ) : SDS PAGE pattern of C.P. extracted from S. aureus isolates
recovered from clinical and subclinical mastitic milk

E. coli
serogroups
Total
No. of
isolates
E. coli isolates recovered from
Clinical mastitic milk Subclinical mastitic
milk
No % No %
O114 13 7 11.67 6 13.33
O125 11 7 11.67 4 8.89
O44 10 5 8.33 5 11.11
O128 8 2 3.33 6 13.33
O 126 6 3 5.00 3 6.67
O 86 6 6 10.00 0 0.0
Untypable 51 30 50.00 21 46.67
Total 105 57.14 100 45 42.86
Table (31) : Incidence and distribution of pathogenic E. coli serovars
obtained from diseased cases

Table 32: Haemagglutination pattern of E.coli serogroups recovered from examined mastitic milk samples of buffaloes
RBCs species
Type of HA
Clinical mastitis Subclinical mastitis
Serogroups isolated Total (30) Serogroups isolated Total (24) O114
(7) O125
(7) O86 (6)
O44 (5)
O126 (3)
O128 (2)
No. % O114
(6) O125
(4) O44 (5)
O126 (3)
O128 (6)
No. %
Bovine
MSHA 4 6 6 5 1 1 23 76.7 4 4 3 1 3 15 62.5
MRHA
2 0 0 0 2 1 5 16.7 2 0 2 2 3 9 37.5
HA+ 6 6 6 5 3 2 28 93.3 6 4 5 3 6 24 100
Sheep
MSHA 0 0 0 1 0 0 1 3.3 0 0 0 0 0 0 0
MRHA
2 0 0 0 0 0 2 6.7 0 0 0 0 0 0 0
HA+ 2 0 0 1 0 0 3 10 0 0 0 0 0 0 0
Guinea pigs
MSHA 6 7 6 4 1 1 25 83.3 5 3 2 2 6 18 75
MRHA
1 0 0 0 0 1 2 6.7 0 0 3 0 0 3 12.5
HA+ 7 7 6 4 1 2 27 90 5 3 5 2 6 21 87.5
Chickens
MSHA 0 0 0 0 0 0 0 0 0 0 0 0 0 0 0
MRHA
0 0 0 0 0 0 0 0 0 0 0 0 0 0 0
HA+ 0 0 0 0 0 0 0 0 0 0 0 0 0 0 0

Table 33: Serum resistance of E.coli serogroups recovered from mastitic milk samples of buffaloes
E. c
oli
ser
og
rou
ps
Clinical mastitis (30) Subclinical mastitis (24)
No
. of
iso
late
s
Positive serum resistance
No
. of
sero
gro
up
s
Positive serum resistance
Survival in
serum
Growth in
serum Survival in
serum Growth in serum
N
No. %
N
No. %
O114 7 7 23.3 7 23.3 6 4 16.6 4 16.6
O125 7 6 20 5 16.7 4 4 16.6 4 16.6
O86 6 6 20 6 20 0 0 0 0 0
O44 5 4 13.3 4 13.3 5 5 20.8 4 16.6
O126 3 3 10 1 3.3 3 3 12.5 3 12.5
O128 2 1 3.3 1 3.3 6 3 12.5 2 8.3
Total 30 2
7
89.9
6 24 80 24 19 79.1 17 70.8
E.c
oli
ser
og
rou
ps
Clinical mastitis Subclinical mastitis
Total
No
. of
sero
gro
up
s
Enterotoxin +ve
No
. of
sero
gro
up
s Enterotoxin
+ve
No % No % No. %
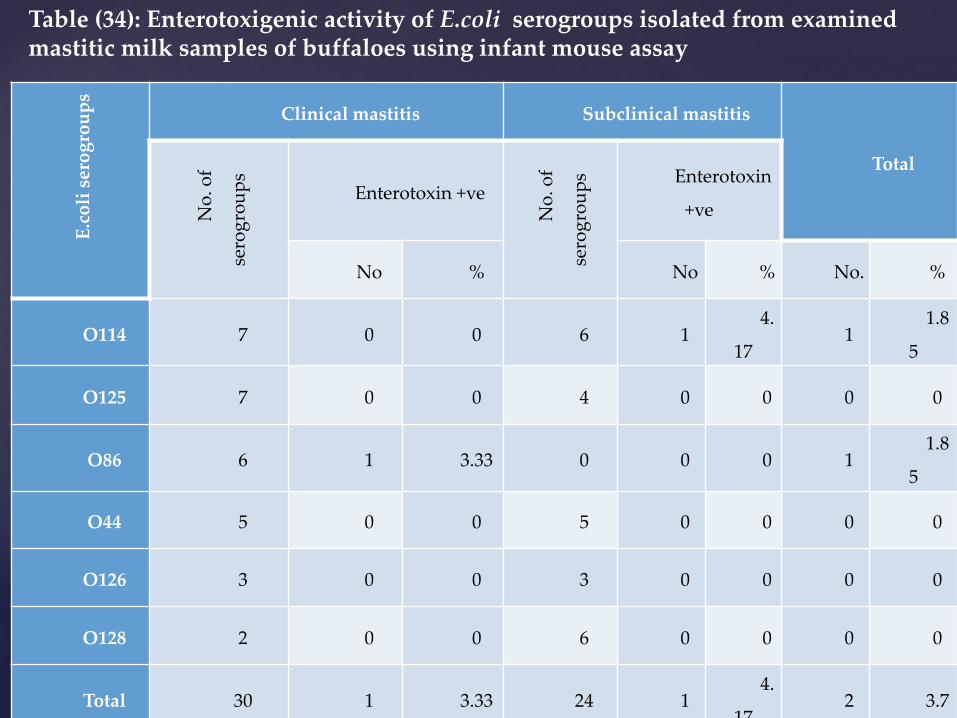
O114 7 0 0 6 1 4.
17 1
1.8
5
O125 7 0 0 4 0 0 0 0
O86 6 1 3.33 0 0 0 1 1.8
5
O44 5 0 0 5 0 0 0 0
O126 3 0 0 3 0 0 0 0
O128 2 0 0 6 0 0 0 0
Total 30 1 3.33 24 1 4.
17 2 3.7
Table (34): Enterotoxigenic activity of E.coli serogroups isolated from examined mastitic milk samples of buffaloes using infant mouse assay

E.coli
serogroups
Clinical mastitis Subclinical mastitis
Total
(54)
No
. of
iso
late
s
Cytotoxic
activity
No
. of
iso
late
s
Cytotoxic
activity
No.
of +ve %
+ve
No. %
No.
tested
+ve
No. %
O114 7 0 0 6 0 0 13 0 0
O125 7 0 0 4 0 0 11 0 0
O86 6 1 3.33 0 0 0 6 1 1.85
O44 5 0 0 5 0 0 10 0 0
O126 3 1 3.33 3 1 4.1 6 2 3.7
O128 2 0 0 6 0 0 8 0 0
Total 3 0
0 2 66.6 24 1 4.1 54 3 5.56
Table (35) : Detection of cytotoxic activity of E.coli serogroups isolated from examined mastitic milk samples of buffaloes using vero-cells

E.c
oli
sero
gro
up
s
Clinical mastitis Subclinical mastitis
Total N
o. o
f
iso
late
s Positive
No
. of
iso
late
s Positive
No. % No. % No. %
O114 7 0 0 6 0 0 0 0
O125 7 0 0 4 0 0 0 0
O86 6 1 3.33 0 0 0 1 1.85
O44 5 0 0 5 0 0 0 0
O126 3 0 0 3 0 0 0 0
O128 2 0 0 6 0 0 0 0
Total 30 1 3.33 24 0 0 1 1.85
Table (36) : Invasive capacity of E.coli serogroups using Sereny test

Source of
isolates
Virulence
Attributes
Clinical mastitis Subclinical mastitis
No.
(30)
%
No.
(24)
%
HA activity using
Bovine RBCs
Sheep RBCs
Guinea pigs RBCs
Chicken RBCs
28
3
30
0
93.3
10
100
0
24
0
24
0
100
0
100
0
MRHA using
Bovine RBCs
Sheep RBCs
Guinea pigs RBCs
Chicken RBCs
23
1
27
0
76.7
3.3
90
0
15
0
18
0
62.5
0
75
0
Serum resistance
Survival in serum 27 89.9 18 75
Growth in serum 24 80 17 70.8
Heat stable enterotoxin 1 3.3 1 4.16
Verocytotoxin 2 6.66 1 4.16
Invasion using Sereny test 1 3.33 0 0
Table (37) : Virulence attributes of E.coli isolates recovered from clinical and subclinical mastitic milk samples
Source of isolates
virulence attributes
Clinical mastitis (30) Subclinical mastitis (24) Serogroups isolated
Total Serogroups isolated
Total O114 (7)
O125 (7)
O86 (6)
O44 (5)
O126 (3)
O128 (2)
O114 (6)
O125 (4)
O44 (5)
O126 (3)
O128 (6)
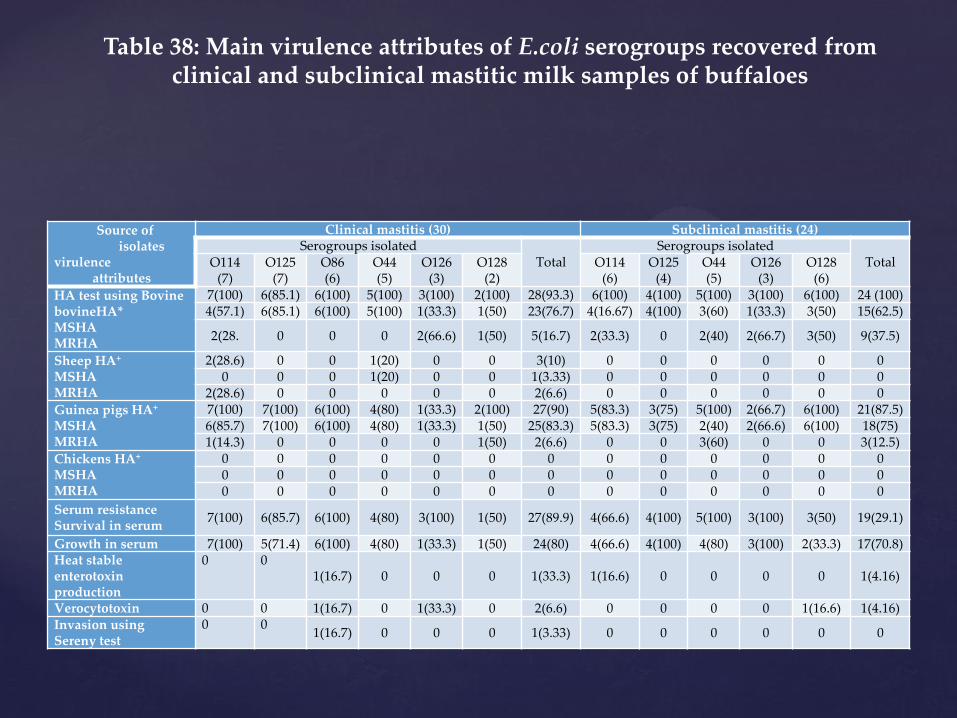
HA test using Bovine bovineHA* MSHA MRHA
7(100) 6(85.1) 6(100) 5(100) 3(100) 2(100) 28(93.3) 6(100) 4(100) 5(100) 3(100) 6(100) 24 (100) 4(57.1) 6(85.1) 6(100) 5(100) 1(33.3) 1(50) 23(76.7) 4(16.67) 4(100) 3(60) 1(33.3) 3(50) 15(62.5)
2(28. 0 0 0 2(66.6) 1(50) 5(16.7) 2(33.3) 0 2(40) 2(66.7) 3(50) 9(37.5)
Sheep HA+ MSHA MRHA
2(28.6) 0 0 1(20) 0 0 3(10) 0 0 0 0 0 0
0 0 0 1(20) 0 0 1(3.33) 0 0 0 0 0 0
2(28.6) 0 0 0 0 0 2(6.6) 0 0 0 0 0 0
Guinea pigs HA+ MSHA MRHA
7(100) 7(100) 6(100) 4(80) 1(33.3) 2(100) 27(90) 5(83.3) 3(75) 5(100) 2(66.7) 6(100) 21(87.5) 6(85.7) 7(100) 6(100) 4(80) 1(33.3) 1(50) 25(83.3) 5(83.3) 3(75) 2(40) 2(66.6) 6(100) 18(75) 1(14.3) 0 0 0 0 1(50) 2(6.6) 0 0 3(60) 0 0 3(12.5)
Chickens HA+ MSHA MRHA
0 0 0 0 0 0 0 0 0 0 0 0 0
0 0 0 0 0 0 0 0 0 0 0 0 0
0 0 0 0 0 0 0 0 0 0 0 0 0
Serum resistance Survival in serum
7(100) 6(85.7) 6(100) 4(80) 3(100) 1(50) 27(89.9) 4(66.6) 4(100) 5(100) 3(100) 3(50) 19(29.1)
Growth in serum 7(100) 5(71.4) 6(100) 4(80) 1(33.3) 1(50) 24(80) 4(66.6) 4(100) 4(80) 3(100) 2(33.3) 17(70.8) Heat stable enterotoxin production
0 0
1(16.7) 0 0 0 1(33.3) 1(16.6) 0 0 0 0 1(4.16)
Verocytotoxin 0 0 1(16.7) 0 1(33.3) 0 2(6.6) 0 0 0 0 1(16.6) 1(4.16) Invasion using Sereny test
0 0 1(16.7) 0 0 0 1(3.33) 0 0 0 0 0 0
Table 38: Main virulence attributes of E.coli serogroups recovered from clinical and subclinical mastitic milk samples of buffaloes
Lan
es b
and
s
M a r k e r s
O 1 1 4 O 1 2 5 O 4 4 O 1 2 8 O 1 2 6 O 8 6
MW
(K
.Da)
Am
ou
nt
MW
(K
.Da)
Am
ou
nt
MW
(K
.Da)
Am
ou
nt
MW
(K
.Da)
Am
ou
nt
MW
(K
.Da)
Am
ou
nt
MW
(K
.Da)
Am
ou
nt
MW
(K
.Da)
Am
ou
nt
1
2
3
4
5
6
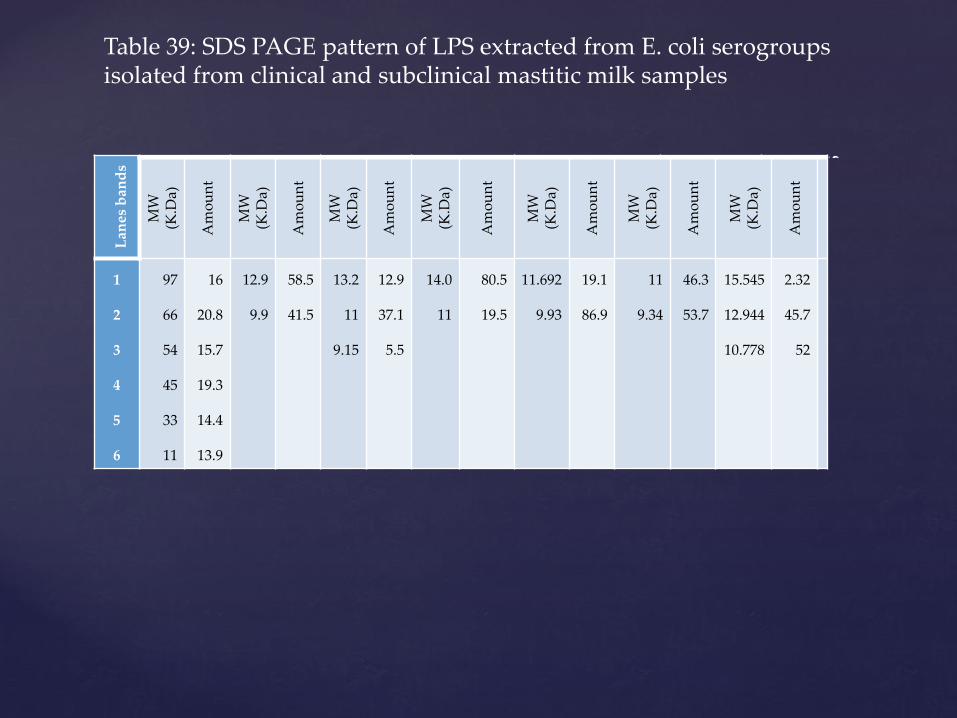
97
66
54
45
33
11
16
20.8
15.7
19.3
14.4
13.9
12.9
9.9
58.5
41.5
13.2
11
9.15
12.9
37.1
5.5
14.0
11
80.5
19.5
11.692
9.93
19.1
86.9
11
9.34
46.3
53.7
15.545
12.944
10.778
2.32
45.7
52
Table 39: SDS PAGE pattern of LPS extracted from E. coli serogroups isolated from clinical and subclinical mastitic milk samples
Antibiotics
O groups
Ami Enroflo Chloram Coli Genta Nitrofur Strep
mic sy mic sy mic sy mic
sy mic sym mic sy mic sy
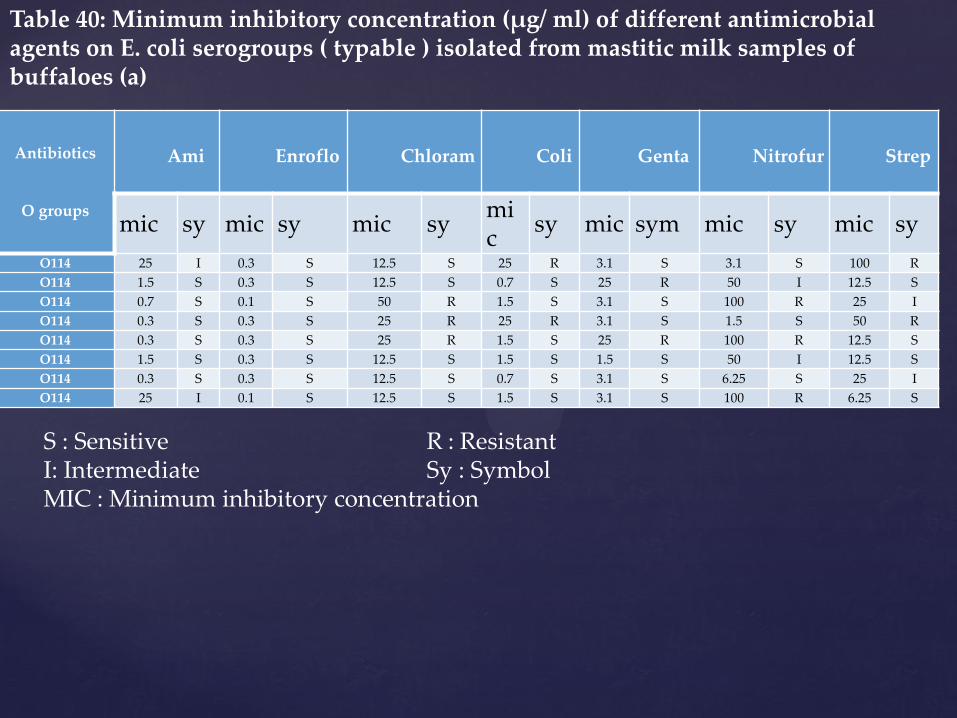
O114 25 I 0.3 S 12.5 S 25 R 3.1 S 3.1 S 100 R
O114 1.5 S 0.3 S 12.5 S 0.7 S 25 R 50 I 12.5 S
O114 0.7 S 0.1 S 50 R 1.5 S 3.1 S 100 R 25 I
O114 0.3 S 0.3 S 25 R 25 R 3.1 S 1.5 S 50 R
O114 0.3 S 0.3 S 25 R 1.5 S 25 R 100 R 12.5 S
O114 1.5 S 0.3 S 12.5 S 1.5 S 1.5 S 50 I 12.5 S
O114 0.3 S 0.3 S 12.5 S 0.7 S 3.1 S 6.25 S 25 I
O114 25 I 0.1 S 12.5 S 1.5 S 3.1 S 100 R 6.25 S
Table 40: Minimum inhibitory concentration (µg/ ml) of different antimicrobial agents on E. coli serogroups ( typable ) isolated from mastitic milk samples of buffaloes (a)
S : Sensitive R : Resistant I: Intermediate Sy : Symbol MIC : Minimum inhibitory concentration

Antibiotics
O groups
Ami Enroflo Chloram Coli Genta Nitrofu Strep
mic sy mic sy mic sy mic sy mic sym mic sy mic sy
O125 0.3 S 0.3 S 100 R 12.5 R 25 R 50 I 50 R
O125 0.7 S 0.1 S 6.25 S 3.1 S 3.1 S 1.5 S 12.5 S
O125 25 I 0.1 S 50 R 3.1 S 3.1 S 3.1 S 100 R
O125 6.25 S 0.3 S 6.25 S 3.1 S 0.7 S 100 R 100 R
O125 25 I 0.3 S 50 R 12.5 R 0.7 S 50 I 12.5 S
O125 3.1 S 0.3 S 6.25 S 3.1 S 3.1 S 100 R 50 R
S : Sensitive R : Resistant I: Intermediate Sy : Symbol MIC : Minimum inhibitory concentration
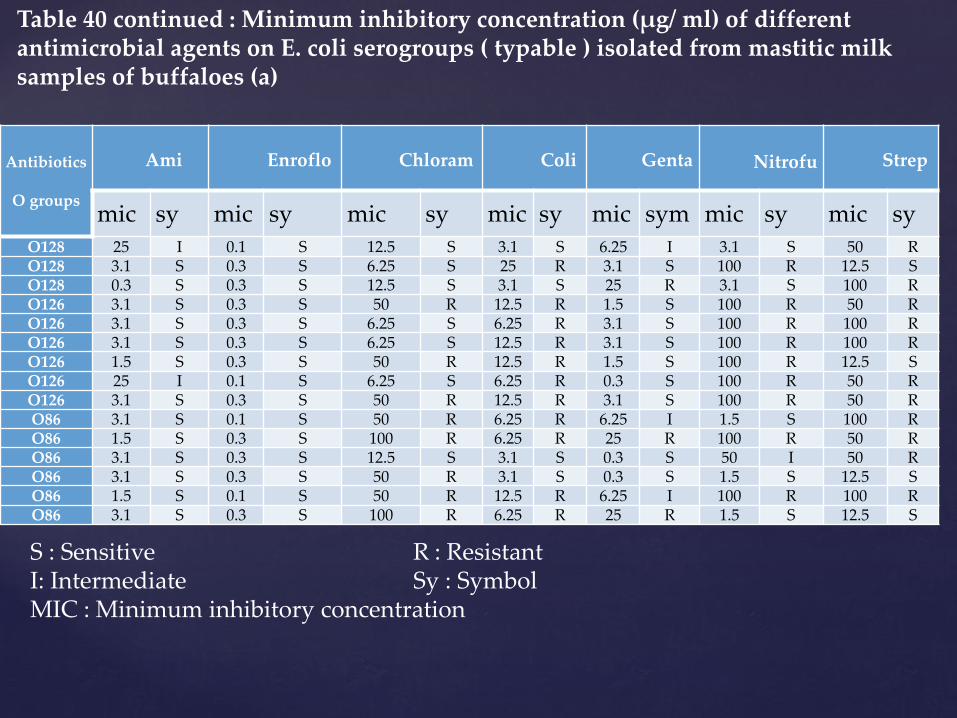
Table 40 continued : Minimum inhibitory concentration (µg/ ml) of different antimicrobial agents on E. coli serogroups ( typable ) isolated from mastitic milk samples of buffaloes (a)

Antibiotics
O groups
Ami Enroflo Chloram Coli Genta Nitrofu Strep
mic sy mic sy mic sy mic sy mic sym mic sy mic sy
O44 25 I 0.3 S 6.25 S 3.1 S 6.25 I 3.1 S 12.5 S
O44 50 R 0.3 S 6.25 S 25 R 50 R 50 I 25 S
O44 1.5 S 0.3 S 50 R 0.7 S 0.3 S 3.1 S 100 R
O44 3.1 S 0.1 S 3.1 S 3.1 S 1.5 S 100 R 25 S
O44 3.1 S 0.3 S 100 R 25 R 6.25 I 100 R 25 S
Table 40 continued : Minimum inhibitory concentration (µg/ ml) of different antimicrobial agents on E. coli serogroups ( typable ) isolated from mastitic milk samples of buffaloes (a)
S : Sensitive R : Resistant I: Intermediate Sy : Symbol MIC : Minimum inhibitory concentration
Antibiotics
O groups
Ami Enroflo Chloram Coli Genta Nitrofu Strep
mic sy mic sy mic sy mic sy mic sym mic sy mic sy
O128 25 I 0.1 S 12.5 S 3.1 S 6.25 I 3.1 S 50 R
O128 3.1 S 0.3 S 6.25 S 25 R 3.1 S 100 R 12.5 S
O128 0.3 S 0.3 S 12.5 S 3.1 S 25 R 3.1 S 100 R
O126 3.1 S 0.3 S 50 R 12.5 R 1.5 S 100 R 50 R
O126 3.1 S 0.3 S 6.25 S 6.25 R 3.1 S 100 R 100 R
O126 3.1 S 0.3 S 6.25 S 12.5 R 3.1 S 100 R 100 R
O126 1.5 S 0.3 S 50 R 12.5 R 1.5 S 100 R 12.5 S
O126 25 I 0.1 S 6.25 S 6.25 R 0.3 S 100 R 50 R
O126 3.1 S 0.3 S 50 R 12.5 R 3.1 S 100 R 50 R
O86 3.1 S 0.1 S 50 R 6.25 R 6.25 I 1.5 S 100 R
O86 1.5 S 0.3 S 100 R 6.25 R 25 R 100 R 50 R
O86 3.1 S 0.3 S 12.5 S 3.1 S 0.3 S 50 I 50 R
O86 3.1 S 0.3 S 50 R 3.1 S 0.3 S 1.5 S 12.5 S
O86 1.5 S 0.1 S 50 R 12.5 R 6.25 I 100 R 100 R
O86 3.1 S 0.3 S 100 R 6.25 R 25 R 1.5 S 12.5 S
Table 40 continued : Minimum inhibitory concentration (µg/ ml) of different antimicrobial agents on E. coli serogroups ( typable ) isolated from mastitic milk samples of buffaloes (a)
S : Sensitive R : Resistant I: Intermediate Sy : Symbol MIC : Minimum inhibitory concentration

Thank you