STSAspects Change Albania07 EMA revised
37
Jansen, L.J.M., et al., 2005. Analysis of the spatio-temporal and semantic aspects of land-cover/use change 1/37 Analysis of the spatio-temporal and semantic aspects of land-cover/use change 1 dynamics 1991-2001 in Albania at national and district levels 2 3 Louisa J.M. Jansen a , Giancarlo Carrai b , Luca Morandini c , Paolo O. Cerutti d , Andrea Spisni e 4 a Land/natural resources consultant, Via Girolamo Dandini 21, 00154 Rome, Italy. 5 E-mail: [email protected] , Tel.: +39-065757719. 6 b Managing director, SVALTEC S.r.l., Via del Campofiore 106, 50136 Florence, Italy. 7 E-mail: [email protected] , Tel./Fax: +39-0556236003. 8 c GIS/IT Consultant, Via V. Alfieri 12, 05100 Terni, Italy. E-mail: [email protected] . 9 d Research fellow, CIFOR Center for international forestry research, Central and West Africa office, Yaoundé, 10 Cameroon. E-mail: [email protected] . 11 e Research, development and remote sensing unit, ARPA Regional agency for health prevention and environmental 12 protection in Emilia-Romagna, Bologna, Italy. E-mail: [email protected] . 13 14 15 Abstract 16 17 In the turmoil of a rapidly changing economy the Albanian government needs accurate and timely 18 information for management of their natural resources and formulation of land-use policies. The 19 transformation of the forestry sector has required major changes in the legal, regulatory and 20 management framework. The World Bank financed Albanian National Forest Inventory 1 project 21 provides an analysis of spatially explicit land-cover/use change dynamics in the period 1991-2001 using 22 the FAO/UNEP Land Cover Classification System for codification of classes, satellite remote sensing 23 and field survey for data collection and elements of the object-oriented geo-database approach to handle 24 changes as an evolution of land-cover/use objects, i.e. polygons, over time to facilitate change dynamics 25 analysis. 26 Analysis results at national level show the trend of natural resources depletion in the form of 27 modifications and conversions that lead to a gradual shift from land-cover/use types with a tree cover to 28 less dense tree covers or even a complete removal of trees. Policy failure (e.g., corruption, lack of law 29 enforcement) is seen as the underlying cause. Another major trend is urbanisation of areas near large 30 urban centres that change urban-rural linkages. Furthermore, after privatisation agricultural areas 31 increased in the hills where environmental effects may be detrimental, while prime agricultural land in 32 the plains is lost to urbanisation. 33 1 The authors worked as consultants in the ANFI project: Louisa J.M. Jansen as Remote Sensing and Land Cover/Use Expert, Giancarlo Carrai as GIS Expert, Luca Morandini as EDP Expert, Paolo O. Cerutti and Andrea Spisni as Remote Sensing and Image Interpretation Experts.
-
Upload
independent -
Category
Documents
-
view
4 -
download
0
Transcript of STSAspects Change Albania07 EMA revised
Jansen, L.J.M., et al., 2005. Analysis of the spatio-temporal and semantic aspects of land-cover/use change 1/37
Analysis of the spatio-temporal and semantic aspects of land-cover/use change 1
dynamics 1991-2001 in Albania at national and district levels 2
3
Louisa J.M. Jansena, Giancarlo Carraib, Luca Morandinic, Paolo O. Ceruttid, Andrea Spisnie 4 a Land/natural resources consultant, Via Girolamo Dandini 21, 00154 Rome, Italy. 5
E-mail: [email protected], Tel.: +39-065757719. 6 b Managing director, SVALTEC S.r.l., Via del Campofiore 106, 50136 Florence, Italy. 7
E-mail: [email protected], Tel./Fax: +39-0556236003. 8 c GIS/IT Consultant, Via V. Alfieri 12, 05100 Terni, Italy. E-mail: [email protected]. 9
d Research fellow, CIFOR Center for international forestry research, Central and West Africa office, Yaoundé, 10
Cameroon. E-mail: [email protected]. 11 e Research, development and remote sensing unit, ARPA Regional agency for health prevention and environmental 12
protection in Emilia-Romagna, Bologna, Italy. E-mail: [email protected]. 13
14
15
Abstract 16
17
In the turmoil of a rapidly changing economy the Albanian government needs accurate and timely 18
information for management of their natural resources and formulation of land-use policies. The 19
transformation of the forestry sector has required major changes in the legal, regulatory and 20
management framework. The World Bank financed Albanian National Forest Inventory1 project 21
provides an analysis of spatially explicit land-cover/use change dynamics in the period 1991-2001 using 22
the FAO/UNEP Land Cover Classification System for codification of classes, satellite remote sensing 23
and field survey for data collection and elements of the object-oriented geo-database approach to handle 24
changes as an evolution of land-cover/use objects, i.e. polygons, over time to facilitate change dynamics 25
analysis. 26
Analysis results at national level show the trend of natural resources depletion in the form of 27
modifications and conversions that lead to a gradual shift from land-cover/use types with a tree cover to 28
less dense tree covers or even a complete removal of trees. Policy failure (e.g., corruption, lack of law 29
enforcement) is seen as the underlying cause. Another major trend is urbanisation of areas near large 30
urban centres that change urban-rural linkages. Furthermore, after privatisation agricultural areas 31
increased in the hills where environmental effects may be detrimental, while prime agricultural land in 32
the plains is lost to urbanisation. 33
1 The authors worked as consultants in the ANFI project: Louisa J.M. Jansen as Remote Sensing and Land Cover/Use Expert, Giancarlo Carrai as GIS Expert, Luca Morandini as EDP Expert, Paolo O. Cerutti and Andrea Spisni as Remote Sensing and Image Interpretation Experts.

Jansen, L.J.M., et al., 2005. Analysis of the spatio-temporal and semantic aspects of land-cover/use change 2/37
At district level, the local variability of spatially explicit land-cover/use changes shows different types 34
of natural resources depletion. The distribution of changes indicates a regional prevalence, thus a 35
decentralised approach to the natural resources management could be advocated. 36
37
Keywords: Agriculture; Deforestation; Land-cover/use change dynamics; Object-oriented approach; 38
Urbanisation. 39
40
41
1. Introduction 42
43
In the early 1990s, Albania entered a period of transition from a central-based planned economy to a 44
market economy. Early efforts to introduce democracy and build a market economy were severely 45
undermined by the socio-economic crisis and generalised unrest that followed the financial collapse of 46
1997. The lack of a democratic culture, the absence of dialogue between different political tendencies 47
and a limited understanding of the concept of national interest amongst political leaders have often 48
prevented the development and implementation of sound policies to address the many issues that 49
Albania faces (CEC, 2002). 50
51
Despite disruptions in production caused by energy shortages (e.g., even in the capital Tirana there is no 52
24 hours regular power supply), real Gross Domestic Product (GDP) growth in 2001 reached the target 53
of 7.3%. However, GDP per capita remains one of the lowest in Europe (around 1,400 €) and the overall 54
impact of economic growth remains limited on the poorest layers of the population (CEC, 2002). 55
Around a quarter of the population is considered to be living below the poverty line (World Fact Book, 56
2005). Construction and services mainly contributed to the GDP increase, with growth rates of 17% and 57
12% respectively. Industrial production grew around 6% but this sector is weak and its contribution to 58
the overall GDP growth limited. Industries are often obsolete, non-viable and incapable of competing 59
with European industry. Efforts of government to improve the poor national road and railway networks, 60
a long-standing barrier to sustained economic growth, are very slow. Agriculture, which still accounts 61
for slightly more than 50% of Albania’s GDP, grew by 3.5%. The privatisation process led to the break 62
up of the former 550 collective farms, which catered for the state processing and marketing agencies, 63
into 467,000 smallholder farms that operate very often at little more than subsistence level. Although for 64
their type quite productive, they are not price competitive and about 75% of farm production is home 65
consumed. These growth figures are not fully reliable, since official figures provide inadequate coverage 66
of private sector activity (CEC, 2002). 67
68
Jansen, L.J.M., et al., 2005. Analysis of the spatio-temporal and semantic aspects of land-cover/use change 3/37
In Albania, the post-collectivisation ownership status was identical for collective and state farmlands 69
due to the nationalisation of all land after the Second World War. Therefore the government could apply 70
the same land reform procedures to collective and state farmlands: (physical) distribution of collective 71
(76% of Total Agricultural Lands (TAL)) and state farmlands (24% of TAL) (Swinnen, 1999). The pre-72
collectivisation land ownership distribution was highly unequal (3% of the population owned the land) 73
resulting in historical justice and social equity being conflicting objectives. Being the poorest and most 74
rural economy of the Central and Eastern European Countries, Albania has 50% of its working 75
population employed in agriculture and agriculture has a prominent economic role. Government decided 76
to redistribute the land to the rural households on an equal per capita basis with partial financial 77
compensation for former owners. This choice is consistent with equity considerations in choosing a land 78
reform procedure. The distribution of even a small piece of land to farm workers has had an important 79
effect on their income and food security situation. Land distribution was also a preferable choice from 80
the efficiency point of view: low technology agriculture, labour-intensive farming structures and 81
imperfect (or missing) capital markets (Swinnen, 2000). 82
83
The change to a market-oriented economy had also an impact on the natural resources and their 84
management, not only due to privatisation, but also because of the strong land fragmentation as a result 85
of the land distribution and increased urbanisation. For the first time in 50 years people were free to 86
move around. The rural population, particularly in mountainous areas, sharply decreased because of 87
urban drift or migration abroad. The increasing pastoral economy and husbandry caused landscape 88
degradation and natural resources depletion in many regions of the country. Uncontrolled timber 89
harvesting, overgrazing and overexploitation of wood (in a country with a permanent energy shortage) 90
and other forest products have changed environmental assets. The depletion of forest resources, 91
particularly in accessible areas, has become alarming. Scarce possibilities of control and a lenient policy 92
caused severe, sometimes even irremediable, damages to the natural resources of Albania. 93
94
The agrarian reform in its first phase led to a fast increase in the construction of (illegal) buildings and 95
new roads. In a subsequent phase many new small farms were abandoned followed by rapid 96
urbanisation as more and more people left the rural areas to become resident in urban centres. These 97
urban centres, however, were not prepared to receive the massive influx of people. In the turmoil of 98
such a changing economy and the spatial and temporal dynamics of land cover/use that are continuously 99
evolving, it is important for the Albanian government to have accurate and timely information for 100
natural resources management, land-use planning and policy development, as a prerequisite for 101
monitoring and modelling land-use and environmental change and as a basis for land-use statistics. 102
Land-cover/use change, as one of the main driving forces of (global) environmental change, is central to 103
sustainable development (Meyer and Turner, 1994; Walker and Steffen, 1997; Walker, 1998; Lambin et 104

Jansen, L.J.M., et al., 2005. Analysis of the spatio-temporal and semantic aspects of land-cover/use change 4/37
al., 2000). In spite of the many achievements in institutional and policy reform, reliable estimates are 105
missing and great uncertainty exists on the actual, real economic potentialities of the natural resources. 106
The quality and quantity of resources at various points in time, the rates by which they have changed, 107
the overall distribution of the land-cover/use types, etc., are not precisely known. Therefore, there are 108
many uncertainties about the strategy to be adopted by government in order to plan a sustainable use of 109
natural resources while preserving biological richness and diversity. 110
111
The objective of the study presented in this paper was an inventory of the land-cover/use types in 112
Albania, their location, extent and distribution and an understanding of the change dynamics in the 113
period 1991-2001 at both national and district levels in order to provide to government spatially explicit 114
data and information for a sustainable management of natural resources. While natural resources 115
management policies are formulated at the national level by different ministries, they are mostly 116
executed at district or even commune level. The responsibility for forests and pastures is with the 117
Directorate General of Forests and Pastures (DGFP) of the Ministry of Agriculture and Food (MoAF). 118
The DGFP has District Forest Service Directories (DFSD) in the 36 districts. The Albanian Forestry 119
Project, of which the Albanian National Forest Inventory (ANFI) project that executed the study is a 120
sub-component, is carried out under agreement between the World Bank and MoAF and will transfer 121
the responsibility of about 40% of the forest area directly to the communes. This transfer process is 122
based on the Law “On Forests and Forest Service Police” (No. 7623 dated 13 October 1992) and 123
Regulation “On the Transfer of Forests and Pastures in Use to Communes (No. 308, dated January 124
1996). According to these legal acts “the communal forests and pastures would be given to users who 125
are permanent inhabitants of the Commune. The agreement –signed contract between the Commune and 126
the users- gives the latter the full rights to all benefits from communal forests and pastures transferred to 127
the Commune” (SDC/FAO/World Bank/Ministero degli Affari Esteri, 2003). 128
129
130
2. Materials and methods 131
132
2.1 Remote sensing materials used 133
134
Digital Landsat 7 Enhanced Thematic Mapper (ETM+) imagery has been used to produce the baseline 135
interpretation of 2001 using on-screen digitising and visual interpretation. For the 1991 visual 136
interpretation use has been made of Landsat 5 Thematic Mapper (TM) images (Table 1). For 137
interpretation purposes the multiple view approach was selected combining multi-stage sensing (i.e. 138
high-resolution satellite data is analysed in combination with low altitude data such as topographic 139
maps, forest type maps and field survey data), multi-spectral sensing (i.e. data are acquired 140

Jansen, L.J.M., et al., 2005. Analysis of the spatio-temporal and semantic aspects of land-cover/use change 5/37
simultaneously in several spectral bands) and multi-temporal sensing (i.e. data about the terrain is 141
collected at different dates). The 2001 images have been geo-referenced using the topographic maps of 142
the Albanian Military Geographic Institute at scale 1:100,000 (image-to-map approach) and the 1991 143
images have been geo-referenced according to the geo-referenced 2001 October set (image-to-image 144
approach). 145
146
Insert Table 1 and 2. 147
148
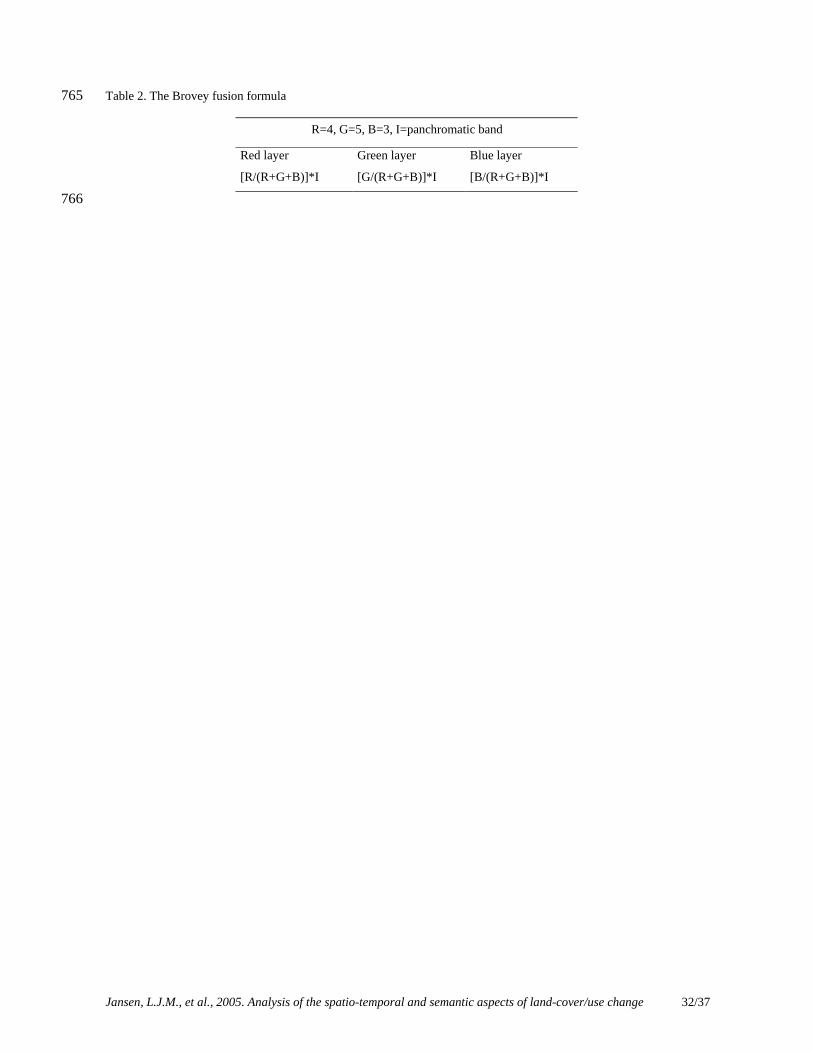
A Brovey fusion procedure was applied to the False Colour Composite (FCC) 453 multi-spectral 149
imagery at 30m resolution with panchromatic band at 15m resolution (Table 2). The result is imagery 150
that is characterised by the pixel resolution of 15m of the panchromatic band and the spectral resolution 151
of the multi-spectral bands of the FCC. The procedure enhances the visual quality of the imagery and 152
consequently facilitates detection of different vegetation types. In addition, band 3 has been filtered with 153
an edge-sharpening filter, kernel 3x3, to reduce fuzzy noise. The same procedure has been applied to the 154
FCC 432 (Agrotec S.p.A., 2003a). 155
156
In the interpretation process various levels of complexity exist, from simple direct recognition of objects 157
in the scene to inference of site conditions. The interpreters use the process of convergence of evidence 158
to successfully increase the accuracy and detail of the interpretations. During the interpretation process 159
special attention was paid to: (1) the spatial coherence of polygons, i.e. are the boundaries in the 160
appropriate place and have the same logical and functional thinking been applied in a consistent manner 161
in the area of interpretation; and (2) the thematic coherence, i.e. is the label given to the polygons 162
correctly describing their contents and are other areas with similar features described in the same 163
manner. A continuous crosschecking of the 1991 and 2001 interpretations was necessary in order to 164
guarantee spatial and thematic coherence within the interpretations and between them. The 2001 165
interpretation has been validated using 431 field observations and 111 additional observations. The 166
overall thematic accuracy of the 2001 interpretation at the level of LCCS domains and land cover 167
groups, discussed in the next section, is 85 % (Agrotec S.p.A., 2003a). 168
169
2.2 Land-cover/use classification applied 170
171
The 1991 and 2001 land-cover/use interpretations apply the FAO/UNEP Land Cover Classification 172
System (LCCS), endorsed by the Land Use and Cover Change (LUCC) program element of the 173
International Biosphere-Geosphere Programme (IGBP) and International Human Dimensions 174
Programme (IHDP) on Global Environmental Change, for definition of classes to ensure harmonisation 175
of the data with existing data sets at international level while at the same time standardising the method 176

Jansen, L.J.M., et al., 2005. Analysis of the spatio-temporal and semantic aspects of land-cover/use change 6/37
used for description of land-cover/use features (Di Gregorio and Jansen, 2000; LANES, 1998; 177
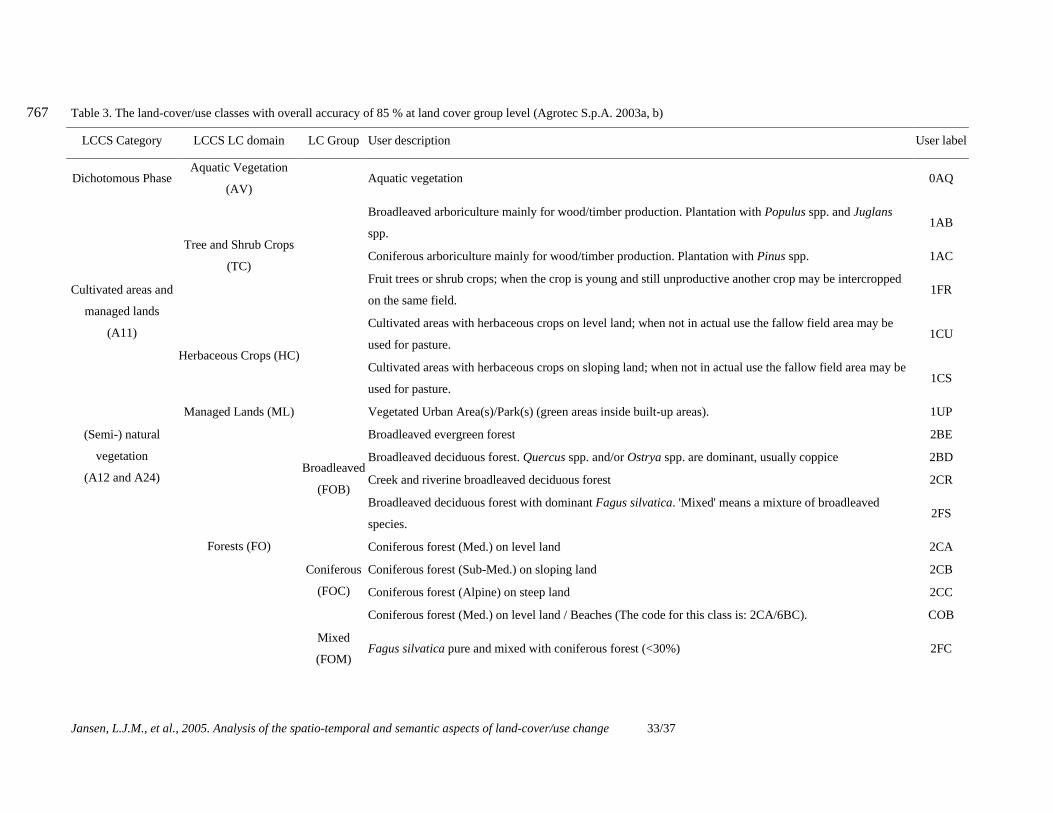
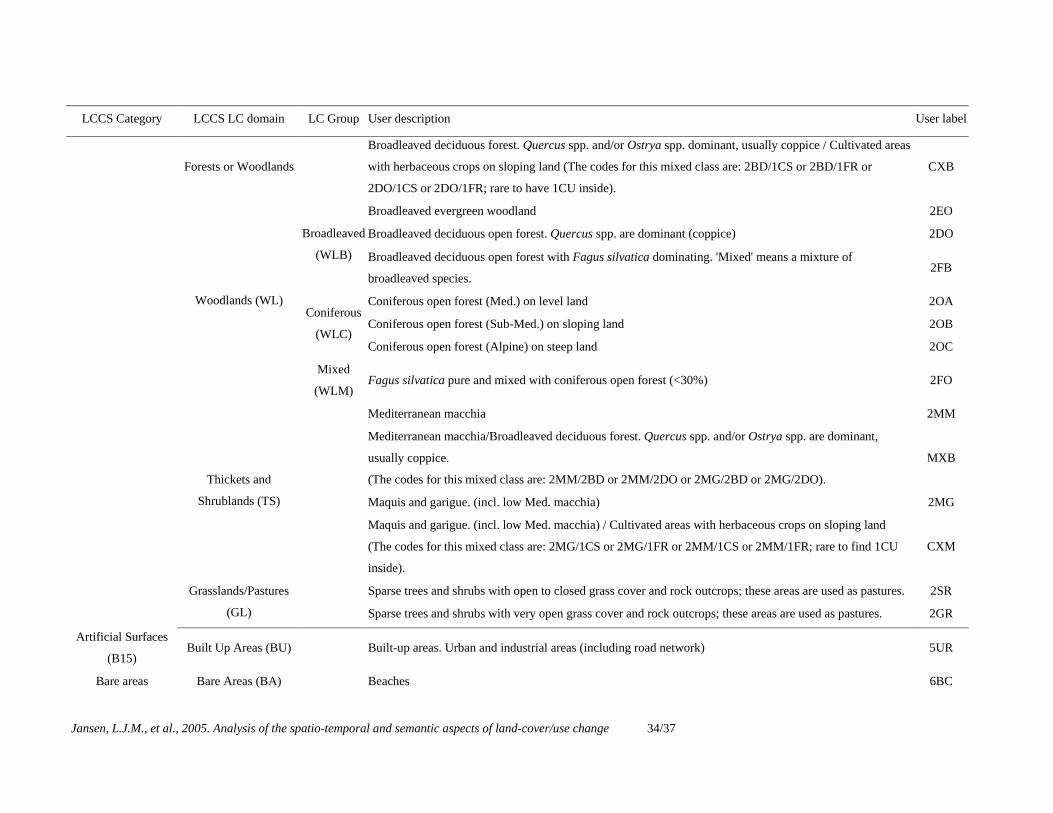
McConnell and Moran, 2001; FAO, 2002; Jansen and Di Gregorio, 2002). The defined classes used in 178
both interpretations are shown in Table 3 with their groupings at different levels of aggregation (Agrotec 179
S.p.A., 2003a, b). 180
181
Land-cover/use change has to recognise that changes come in two types: (1) conversion from one land 182
cover category to another (e.g., from cultivated to built-up area); and (2) Modification within one 183
category (e.g., from forest to woodland, from thicket to shrubland, etc.). These two types of change have 184
implications for the methodology used to describe and classify land cover/use (Jansen and Di Gregorio, 185
2002). Conversion implies an evident change, whereas modifications are much less apparent. The latter 186
requires a greater level of detail to be accommodated. With a system based upon class names the latter 187
type of change cannot be captured unless the system contains an ample set of classes. 188
In the past the emphasis of change studies has been on conversions, whereas more recently there has 189
been increased recognition of the processes of modification (Lambin et al., 2003). 190
191
Insert Tables 3 and 4. 192
193
The logical ordering of classes in the LCCS Legend Module facilitates the analysis phase because 194
classes are grouped according to major land cover category, followed by occurring land cover domains. 195
A matrix with these groupings of classes filled with change dynamics statistics facilitates the 196
interpretation of identified changes. Three different areas can be identified in the matrix (Table 4): (1) 197
the areas where no land-cover/use change occurred; (2) the areas where modifications within or between 198
domains occurred; and (3) various types of conversion (e.g., reforestation or deforestation). The same 199
matrix can be used for the interpretation of the likely causes of land-cover/use change such as 200
deforestation, forest fragmentation, afforestation, reforestation, etc. 201
202
The analysis of the spatial extent of the different types of land-cover/use changes will permit a further 203
inside in the prevailing land-cover/use change trends. The spatial and temporal land-cover changes 204
should be linked to socio-economic developments in order to understand land-use changes. Land-use 205
characterises the human use of the land-cover type. For example, forests can be used for selective 206
logging, for recreation, or not at all. 207
208
2.3 Applied change mapping procedure in the geo-database 209
210
In most change studies the state of land cover at a certain point in time is compared to the state at a later 211
moment. This approach is basically focussing on a representation of temporal data in which snapshots 212

Jansen, L.J.M., et al., 2005. Analysis of the spatio-temporal and semantic aspects of land-cover/use change 7/37
(e.g., satellite image interpretations) are created for each moment in time. In what one could call a 213
Geographic Information System (GIS) Overlay Approach this means that the land cover state at t1 is 214
overlain with t2, t2 with t3, t3 with t3+k, etc. The result of such overlays (in raster format) is a sequential 215
representation of the dispersion of a class in other classes. However, such representations usually do not 216
contain the immediate link between the spatial and temporal dimensions of the changes that occurred 217
between t1 and t1+k. 218
219
The approach to spatial and temporal analyses is more integrated when developing a different approach 220
to databases that do not only store the state of land cover/use at different moments in time but also 221
documents the relationships between such states (Figure 1). Thus, the database may not only contain 222
relationships but also the processes that led up to these relationships. Versions are described in relation 223
to a key state that can be located at a certain time, and through version identifiers one can store just 224
changes instead of a complete version. The events and states are modelled as object classes with 225
different roles; “events” are used to describe what happened, is happening or will happen during the 226
lifespan of an object, whereas “states” certify what has changed, is changing or will change. Events can 227
be modelled independently from these states; the object is depicted by different instances to different 228
classes of events and states. Furthermore, if all this information is contained in a database one can 229
reduce the amount of data to be stored and easily track the history of a polygon. This Object-Oriented 230
Analysis (OOA) approach is closely linked to databases and data modelling. 231
232
Insert Figures 1 and 2. 233
234
Polygons are defined by a set of boundaries. Land-cover/use boundaries are linear objects demarcating 235
different land-cover/use faces that experience a succession of changes in their positions during their 236
lifespan. The history of each Land-Cover/use Boundary (LCB) is unique and shows the geographical, 237
i.e. in the sense of relative position referenced to a baseline map, significance of a LCB over the 238
development of environments, landscapes, anthropological activities, socio-economic aspects, etc. Each 239
LCB has its own space-time path that represents its lifespan (Figure 2). A LCB begins to exist when it is 240
for the first time mapped (creation) and has an existence period (existence) along which alterations can 241
occur due to the evolution of the environment; it may happen that a LCB ceases to exist (demise) when 242
it shares common characteristics on both of its sides (i.e. left area has the same semantic attribute of 243
right area). The detection of change in LCB involves the description of the evolution of LCB at an 244
earlier time (i.e. 1991) that accounts for the LCB being the way it is at a later point in time (i.e. 2001). 245
The development of the boundary follows a longitudinal configuration (or a sequential one) without any 246
branching; in other words, a boundary can only be alive and unique but it cannot become something 247
else. 248

Jansen, L.J.M., et al., 2005. Analysis of the spatio-temporal and semantic aspects of land-cover/use change 8/37
249
A combination of the GIS Overlay approach and the OOA approach has been adopted at polygon level 250
for the land-cover/use change analysis in order to be able to handle changes as an evolution of land-251
cover/use objects over time. The 1991 polygons are described by what has changed in their state, i.e. the 252
spatial extent of the polygon formed by a set of land-cover/use boundaries and/or the polygon label 253
(land-cover/use class) vis-à-vis their state in 2001. This allows quick identification of “hotspots” of 254
change. The GIS approach has been applied for a quick general overview, whereas the OOA approach 255
has been used to understand the relationships between changes. 256
257
Past land cover/use (i.e. 1991) has been interpreted starting from the present validated land-cover/use 258
layer (i.e. 2001). In practice, the interpretation of 2001 has been overlain on the 1991 satellite images. 259
Where change was identified polygon boundaries and/or labels were updated in order to match the 1991 260
land cover/use and the change in state of the polygons recorded. This approach allowed minimising 261
errors induced by creating a new layer. In fact, a certain amount of difference in physically drawing a 262
new layer is to be accounted for (Figure 1). This would lead to an overestimation of change in terms of 263
especially spatial extent. 264
265
266
3. Different aspects of land-cover/use changes 267
268
Land-cover/use changes are the results of many interacting processes and each of these operates over a 269
range of scales in space and time (Verburg et al., 2003). Methods for detection and measuring of 270
spatially explicit land-cover/use changes from remote sensing depend on comparisons between data sets 271
acquired at known intervals of time, i.e. 1991 and 2001 in the case of this study. The accuracy of these 272
data sets influences the analysis that can be made. Various sources of potential error exist such as spatial 273
and temporal effects and the extent to which a given land-cover/use class may be recognised 274
unambiguously from its radiometric properties. The key issue is that not only the right combination of 275
data acquisition and data interpretation techniques must be selected, but also the right mixture of remote 276
sensing with conventional techniques must be identified. Remote sensing is a tool and like any other 277
tool its capacity to detect change is limited. This limit is related both to the accuracy with which the land 278
cover/use will be identified on the image and consequently mapped at a certain point in time tk and also 279
to the rate and extent of change on the ground (Wyatt, 2000). 280
281
Land-cover/use change analysis should consider the following aspects: 282
• Changes in geometry (area and perimeter), i.e. spatial aspects x and y; 283
• Rate of change, i.e. temporal aspect t; and 284

Jansen, L.J.M., et al., 2005. Analysis of the spatio-temporal and semantic aspects of land-cover/use change 9/37
• Changes in class label, i.e. semantic aspect s that in a parametric approach may range from a 285
change in the composition of characteristics measured to a change in any of the measured 286
characteristics. 287
288
Spatial aspects influence the capacity to detect change in two ways. First, one should consider the 289
spatial resolution of the images in relation to the scale of the changes to be observed: Landsat 5TM and 290
7ETM+ both at 30m resolution. Furthermore, the high degree of fragmentation of the landscape in 291
Albania is important in the choice of imagery to detect changes. The occurrence of mixed pixels on 292
different images of the same area may suggest change when there is no apparent change on the ground. 293
Second, geo-referencing of images will cause errors however slight. This type of error is independent of 294
the manner in which geo-referencing is undertaken, i.e. image-to-map (2001 images) or image-to-image 295
(1991 images). Consequently, a proportion of apparent differences between images is due to mis-296
registration. The interpretations have an actual positional accuracy of not more than 34.5 meters on the 297
ground as average with a standard deviation of 18.6 meters (Agrotec S.p.A., 2003a). 298
299
Temporal aspects should be considered when one tries to reconcile time and frequency of remote 300
sensing data acquisition with the rate of change in the features of interest, i.e. the natural resources. 301
Another problem to be considered is cloud incidence. Therefore the set of images used for a vast area 302
usually covers different periods of time and it is difficult to establish a precise baseline against which to 303
measure changes. Table 1 shows the used images for 1991 from September, whereas the 2001 images 304
are all from October except one image that is from the year before. 305
306
The semantic aspects in a parametric approach may range from a change in the composition of 307
characteristics measured or a change in a single characteristic measured. For example, vegetation 308
changes through the seasons or in the case of cultivated areas there exists an alternation between crops 309
and the land lying bare but such changes are not considered to be of the type of a land-cover/use change. 310
However, due to various reasons the canopy cover of a vegetation type can become less dense, so the 311
characteristic of canopy cover changed. At the same time it is possible that due to the more open canopy 312
cover the species composition changed. 313
314
A parametric classification such as the FAO/UNEP LCCS facilitates land-cover/use change studies 315
because the criteria used to define classes function at the same time as the parameters to be observed 316
over time (Jansen and Di Gregorio, 2002 and 2004; Jansen, 2004). It therefore assists in determining the 317
s aspect of change. Most existing classifications and legends in Europe (UN-ECE, 1989; CEC, 1995 and 318
1999) are based upon class names thereby not facilitating the use of these systems for monitoring 319
purposes. It is more difficult to interpret a change in class names than comparing two sets of parameters. 320

Jansen, L.J.M., et al., 2005. Analysis of the spatio-temporal and semantic aspects of land-cover/use change 10/37
321
322
4. Change dynamics in the period 1991-2001 323
324
4.1 Analysis of changes at national level 325
326
At aggregated data levels the local variability of spatially explicit land-cover/use changes may be 327
obscured, whereas patterns can be showed that at more detailed data levels may remain invisible and 328
vice versa (Veldkamp et al., 2001). The change dynamics show that at national level an area of almost 329
330,000 Ha of the territory, i.e. 11.5 %, is subject to land-cover/use change. The results at aggregated 330
land cover group or LCCS domain levels show immediately that the most significant changes occur in 331
the vegetation type classes (Figure 3). The area subject to land-cover/use change dynamics in the 332
vegetation groups and domains comprises 91.2 %, whereas 70.0 % of this change is redistributed over 333
these classes as modifications. This means that 21.2 % is related to change that is unrelated to 334
vegetation, thus changes that can be attributed to land-cover/use conversion. The domains comprising 335
the Cultivated Areas have an area of 7.9 % subject to land-cover/use change dynamics and 19.6 % of the 336
total land-cover/use change has become agricultural area. The net gain is significant with 11.7 %. The 337
two LCCS major land cover categories (Semi-) Natural Vegetation (A12) and Cultivated Areas and 338
Managed Lands (A11) (Table 3) explain 99.1 % of total change with a redistribution of the areas subject 339
to change of 89.6 % to the same categories. 340
341
Figure 3 indicates clearly that two types of changes are spatio-temporally dominant: (1) from 342
Broadleaved Forests into Broadleaved Woodlands (50,352 Ha); and (2) from Broadleaved Forests into 343
Herbaceous Crops (56,977 Ha). These changes are followed by changes of a more limited extent like 344
Broadleaved Woodlands into Grasslands (20,660 Ha), Broadleaved Forests into Grasslands (14,545 Ha) 345
and Herbaceous Crops into Built-up Areas (14,121Ha). Broadleaved Forests are the land cover group 346
with the largest spatio-temporal aspect of change dynamics (139,829 Ha). 347
348
Insert Figure 3 and Table 5. 349
350
A closer look at the land-cover domains is taken by calculating the type of change, i.e. modification 351
within its domain or across related domains, or conversion between non-related domains. The interest of 352
the study is in particular in the forest and woodland (open forest) vegetation types, as well as in those 353
types that can be used for pasture. A better insight is gained by studying what type of change prevails in 354
these LCCS domains in order to discover possible trends (Table 5): 355
Jansen, L.J.M., et al., 2005. Analysis of the spatio-temporal and semantic aspects of land-cover/use change 11/37
• In the Forest (FO) domain modification into Woodland (WL) is prevalent as 25.6 % of change 356
can be explained by it. The second most important change as mentioned above, consisting of 357
17.3 %, is conversion into Herbaceous Crops (HC). 358
• In the Woodland domain the modification to Grassland (GL) consist of 7.2 %. 359
• In the Thicket and Shrubland (TS) domain the most important change is modification within the 360
domain with 3.9 %, followed by modification into Forest with 3.2 %. 361
• In the Grassland domain conversion to Bare Areas (BA) with 1.6 % and modification within the 362
domain with 1.4 % are the most significant among the changes. 363
364
From the above it seems that there is a gradual shift from Forests to Woodlands, Woodlands to 365
Grasslands and Grasslands to Bare Areas. The highest percentages of change are found in the vegetation 366
types were trees were, or still are but to a (much) lesser degree, dominant. In each of these vegetation 367
types especially -but not only!- the tree layer has become less dense with time. Analysis of the semantic 368
aspects of the LCCS parameter options reveals that in all cases the parameter canopy cover of the life 369
form trees has changed either from closed to open, closed to sparse, or from open to sparse. Since the 370
change study is based upon remote sensing no statement can be made about the height and state of the 371
vegetation. A logical explanation would be that these natural resources have been depleted as a result of 372
deforestation (e.g., illegal cutting). Forests also show that a considerable part of them have been 373
converted into agricultural fields, a change with a more permanent character. The Thickets and 374
Shrublands, though, show a different development and sometimes even a return to a tree dominated 375
vegetation type. Human or animal pressure on the environment may sustain certain vegetation types; if 376
this pressure falls away, the vegetation might regenerate. 377
378
Analysis of the Broadleaved Forests and Woodlands (Open Forests) at the class level improves the 379
understanding of their change dynamics, especially since Broadleaved Forests change into Broadleaved 380
Woodlands and the latter in turn change into Grasslands. The following classes are involved (note that 381
percentages given concern total change and are not relative to the country territory): 382
1. “Broadleaved deciduous forest (Quercus spp. and/or Ostrya spp. are dominant) usually coppice” 383
mixed with “Cultivated areas with herbaceous crops on sloping land” (CXB) with 21.0 % (17.1 384
% converted into “Cultivated areas with herbaceous crops on sloping land” (1CS)); 385
2. “Broadleaved deciduous forest (Quercus spp. and/or Ostrya spp. are dominant) usually coppice” 386
(2BD) with 15.0 % (10.0 % going to “Broadleaved deciduous open forest (Quercus spp. are 387
dominant) usually coppice” (2DO)); 388
3. “Broadleaved deciduous open forest (Quercus spp. are dominant) usually coppice” (2DO) with 389
11.5 % (with 3.8 and 2.0 % going to “Sparse trees and shrubs with open to closed grass cover 390

Jansen, L.J.M., et al., 2005. Analysis of the spatio-temporal and semantic aspects of land-cover/use change 12/37
and rock outcrops (pastures)” (2SR) and “Sparse trees and shrubs with very open grass cover 391
and rock outcrops (pastures)” (2GR) respectively); 392
4. “Fagus silvatica pure and mixed with coniferous forest” (2FC) with 7.8 % (with 3.2 % going to 393
“Fagus silvatica pure and mixed with coniferous open forest” (2FO)); and 394
5. “Broadleaved deciduous forest with dominant Fagus silvatica” (2FS) with 5.9 % (with 3.6 % 395
going to “Broadleaved deciduous open forest with Fagus silvatica dominating” (2FB)). 396
397
The only other significant change dynamic at class level is the conversion from “Cultivated areas with 398
herbaceous crops on level land” (1CU) to “Built-up areas” (5UR), comprising 3.3 % of total change, 399
where cultivated fields have been replaced by constructions. This is an important change as in case 1 400
above the cultivated areas on slopes are increasing, whereas the cultivated field areas on level land are 401
decreasing. This means that especially in the sloping and hilly areas of Albania particular land-cover/use 402
types have changed in favour of cultivated areas. At the same time this may mean that this change 403
occurred where less favourable environmental conditions exist (e.g., shallow soils, steep(er) slopes, 404
difficult access, etc.) and where environmental effects may be detrimental (e.g., land degradation and 405
soil erosion). 406
407
But if certain classes lost area to change, other classes can be attributed large parts of the areas subject 408
to change. Such classes are: 409
• “Cultivated areas with herbaceous crops on sloping land” (1CS) with 18.3 % (17.1 % coming 410
from “Broadleaved deciduous forest (Quercus spp. and/or Ostrya spp. are dominant) usually 411
coppice” mixed with “Cultivated areas with herbaceous crops on sloping land” (CXB)); 412
• “Broadleaved deciduous open forest (Quercus spp. are dominant) usually coppice” (2DO) with 413
14.1 % (10 % coming from “Broadleaved deciduous forest (Quercus spp. and/or Ostrya spp. are 414
dominant) usually coppice” (2BD)); 415
• “Sparse trees and shrubs with open to closed grass cover and rock outcrops (pastures)” (2SR) 416
with 12.4 % (3.8 % from “Broadleaved deciduous open forest (Quercus spp. are dominant) 417
usually coppice” (2DO)); 418
• “Maquis and garigue (incl. low Med. macchia)” (2MG) with 8.5 %; 419
• “Sparse trees and shrubs with very open grass cover and rock outcrops (pastures)” (2GR) with 420
8.2 %; 421
• “Broadleaved deciduous forest (Quercus spp. and/or Ostrya spp. are dominant) usually coppice” 422
(2BD) with 6.4 % (2.8 % from “Mediterranean macchia/Broadleaved deciduous forest (Quercus 423
spp. and/or Ostrya spp. are dominant) usually coppice” (MXB) and 1.9 % from “Broadleaved 424
deciduous open forest (Quercus spp. are dominant) usually coppice” (2DO)); 425

Jansen, L.J.M., et al., 2005. Analysis of the spatio-temporal and semantic aspects of land-cover/use change 13/37
• “Broadleaved deciduous open forest with Fagus silvatica dominating” (2FB) with 6.4 % (3.6 % 426
from “Broadleaved deciduous forest with dominant Fagus silvatica” (2FS)); and 427
• “Built-up areas” (5UR) with 6.0 % (3.3 % from “Cultivated areas with herbaceous crops on 428
level land” (1CU)). 429
430
Insert Figures 4, 5 and 6. 431
432
A number of figures illustrate where the main land-cover/use changes are found in Albania. The Figures 433
4, 5 and 6 show the spatial distribution of the three main changes at class level with the areas where the 434
change in class occurs in dark colour and with all polygons subject to change shown in light grey (they 435
do not concern the total area of change but polygons where the boundaries and/or label changed). Figure 436
4 shows the change “Broadleaved deciduous forest (Quercus spp. and/or Ostrya spp. are dominant) 437
usually coppice” mixed with “Cultivated areas with herbaceous crops on sloping land” (CXB) converted 438
into “Cultivated areas with herbaceous crops on sloping land” (1CS) that occurs mainly in part of the 439
south of the territory. Figure 5 shows the change “Broadleaved deciduous forest (Quercus spp. and/or 440
Ostrya spp. are dominant) usually coppice” (2BD) into “Broadleaved deciduous open forest (Quercus 441
spp. are dominant) usually coppice” (2DO) that occurs mainly in the north and south, whereas Figure 6 442
shows two related change types “Broadleaved deciduous open forest (Quercus spp. are dominant) 443
usually coppice” (2DO) into “Sparse trees and shrubs with open to closed grass cover and rock outcrops 444
(pastures)” (2SR) and “Sparse trees and shrubs with very open grass cover and rock outcrops (pastures)” 445
(2GR) respectively that occur mainly in the south. From these figures as well as further analysis of 446
where certain change types are found, it seems that changes are regional in their occurrence. The class 447
“Broadleaved deciduous open forest” is in the south subject to two types of changes: in part it occurs 448
where before the forest canopy cover was closed and in part it is transformed into Grasslands. 449
450
It is not sufficient to look at the area subject to change dynamics alone. The changes should also be 451
analysed in relation to the presence of a land-cover/use type in the country territory. Figure 7 shows the 452
land-cover groups or domains in 1991 and 2001. From this figure it becomes clear that Albania is 453
dominated by Broadleaved Forests, Herbaceous Crops and Grasslands. Changes in any of these land-454
cover/use types may have replications to the full area covered by these land-cover/use types. In fact 455
from the analysis of the area subject to change it has become clear that all these land-cover groups or 456
domains are indeed subject to significant change dynamics. 457
458
However, the change dynamics of the individual land-cover/use group or domains becomes clearer 459
when one calculates their absolute increase or decrease over the period 1991-2001 irrespective of how 460
much of the country territory they occupy as is illustrated in Figure 8a. The percentages of absolute 461

Jansen, L.J.M., et al., 2005. Analysis of the spatio-temporal and semantic aspects of land-cover/use change 14/37
increase or decrease are much more pronounced. Forests decrease most, followed by Thickets that 462
decrease at a lower rate; Built-up Areas clearly increase followed by Woodlands and Grasslands, but the 463
latter two at a much lesser magnitude. Figure 8a shows clearly that urbanisation is one of the main land-464
cover/use changes in the country though the area subject to this change is relatively small. However, if 465
cultivated land with high crop production capacities is lost, these area losses may have relatively 466
important consequences for the total agricultural crop production. The increase in Water Bodies, due to 467
the class Artificial Water Bodies, is neglected in this interpretation as the water levels in the reservoirs 468
depend more on meteorological factors and/or water uses than on change. Many irrigation systems are 469
malfunctioning or have even broken down after the change in economy, thus the amounts of water used 470
have diminished. This change seems more related to the change in agricultural practises than to any real 471
land-cover change, but likely it has greatly influenced the agricultural production of irrigated crops. 472
473
Insert Figures 7 and 8ab. 474
475
Since the better understanding of the change dynamics concerns in particular the Forests and 476
Woodlands, a closer analysis is made. The growth percentages of these land-cover/use domains, as 477
shown in Figure 8A, may hide individual differences at group level. Figure 8b shows that the Forests 478
groups are subject to a decrease in the range of 16 to 32 % with the Mixed Forests occupying only a 479
small part of the country territory but suffering relative greater losses than the Coniferous and 480
Broadleaved Forests respectively. The Broadleaved and Coniferous Woodlands show an increase 481
around 13 % while the Mixed Woodlands show an enormous increase of 295 %. However, the spatial 482
extent of Broadleaved Woodlands is many times that of Mixed Woodlands (270,444 Ha versus 15,797 483
Ha; see also Figure 7). Figures 8a and b show that the change dynamics may have a greater effect on 484
relative minor land covers/uses in the country territory and consequently may indicate priority areas for 485
the sustainable management of those land-cover/use types that show an unwanted development and 486
where policy interventions may be required (e.g., land cover/use with a great risk to disappear or growth 487
rates with environmental implications). 488
489
4.2 Analysis of changes at district level 490
491
The land-cover/use change dynamics at district level have been analysed in order to examine local 492
variability and an overview is provided of the most significant changes (Figure 9). The percentages 493
provided are related to total change within the district and not to the district territory. As expected the 494
most significant change dynamics at national level are also found at district level: changes related to the 495
depletion of natural resources, in particular deforestation, such as the change from Broadleaved Forests 496
into Broadleaved Woodlands (FOB to WLB), or into Grasslands (FOB to GL), or into Herbaceous 497

Jansen, L.J.M., et al., 2005. Analysis of the spatio-temporal and semantic aspects of land-cover/use change 15/37
Crops (FOB to HC), and the change from Broadleaved Woodlands into Grasslands (WLB to GL). But 498
also the change from Coniferous Forests into Grasslands (FOC to GL) is important at district level. 499
500
Furthermore, the change related to urbanisation is found, i.e. from Cultivated Areas into Built-up Areas 501
(HC to BU), in those regions where large urban centres are found: the Durres-Kavaja-Tirana triangle, 502
which is the economic centre of the country, but also around Lushnja, Fier and Kucova. 503
504
Insert Figure 9. 505
506
In several districts the most important change dynamic does not correspond to a change that is 507
particularly pronounced at national level. Examples are the change from Broadleaved Forests into 508
Shrublands in Shkoder (30%) and from Mixed Forests into Mixed Woodlands in Diber and Kukes (both 509
35%). These two changes once again illustrate deforestation. Furthermore, there is the change from 510
Shrublands into Grasslands in Kukove (50%) that may be related to pasture and, finally, the change 511
from Thickets into Broadleaved Forests in Elbasan and Gramsh (48 and 50% respectively) where the 512
tree canopy cover increases substantially. 513
514
Modifications within the Broadleaved Forests are important in Has, Librazhd and Tropoje (21, 17 and 515
11% respectively), within the Grasslands in Durres and Devoll (28 and 31% respectively) and within 516
Shrublands in Fier (25%). 517
518
These districts, all of them close together in a specific part of the country, could approach one another 519
when designing and implementing policies and plans for natural resources management. Neighbouring 520
districts that may have experienced, or are experiencing, the same type of change to a lesser degree 521
could learn from such experiences. A decentralised approach seems justified by the data of the study, 522
especially as the Albanian government is transferring the responsibility for forest areas. 523
524
525
5. Conclusions and discussion 526
527
The spatio-temporal and semantic aspects of land-cover/use dynamics in the period 1991-2001 have 528
been analysed for the first time for the whole of Albania through an analysis of spatially explicit data 529
collected through remotely sensed data interpretation and field validation. This analysis has confirmed 530
the major trends of natural resources depletion, in particular deforestation, and urbanisation while at the 531
same time showing that trends are location specific in the country. 532
533

Jansen, L.J.M., et al., 2005. Analysis of the spatio-temporal and semantic aspects of land-cover/use change 16/37
The analysis of underlying causes of the observed changes in Albania is limited by the scarce or 534
unavailable spatially explicit data. As a result of not being able to perform a quantitative driver analysis, 535
the interpretation of underlying causes is mostly speculative or based upon other studies. 536
537
The transformation of the Albanian forestry sector from the centrally planned and state-implemented 538
model to a market-oriented economy has required major changes in the legal, regulatory and 539
management framework for the sector. Policy failure seems to be one of the essential underlying causes 540
for the widespread natural resources depletion (e.g., corruption, weak or no law enforcement) though 541
policy reforms are progressing and operational and management capacities are being strengthened with 542
international assistance programs (REC for Central and Eastern Europe, 2000; SDC/FAO/World 543
Bank/Ministero degli Affari Esteri, 2003). However, the conditions of the forests as measured by the 544
forest inventory of the ANFI project give reason for concern. The changes in structure of the forests 545
(e.g., from closed forests to more open forests and from high forests to coppice to shrubs) and the 546
unbalanced age class distribution indicate over-utilisation of the forest resources thus jeopardising the 547
sustainability. Albania is one of few European countries where forest resources declined in recent 548
decades, in particular during the transition period, as reported by UN-ECE (2001) and the Forestry 549
Project (SDC/FAO/World Bank/Ministero degli Affari Esteri, 2003). According to The State of 550
Environment Report almost 30% of the forests and about 50% of the pastures were turned into 551
cultivated areas between 1960 and 1980 showing that forest and pasture resources in the past have been 552
sacrificed to economic development based on intensive agriculture (UNEP, 1999). Government has put 553
less and less fuel wood for sale on the market in the 1990s and as a result, given the lack of alternatives 554
for energy supply and the widespread rural poverty, induced the rural population to cut illegally (UNEP, 555
1999; UN-ECE, 2001). 556
557
Furthermore, a notable increase in pasture activities has taken place and the increased grazing intensity 558
has caused other forms of natural resources depletion, namely deterioration of the productive 559
capabilities of pastoral areas and environmental degradation (e.g., as a result of low vegetation cover 560
and the trampling of animals the increased manifestation of run-off and soil erosion) and consequently a 561
demand for new pastoral areas. The special study on grazing impact on wooded lands carried out in the 562
context of the ANFI project reports that pastures and meadows have a poor range condition and the 563
stocking rates are four times the grazing capacity, having thus not only implications for the pastures but 564
also for animal productivity (Agrotec S.p.A., 2003c). Important in this context is also the increased 565
cropping of alfalfa for periods of up to five years on the same plot and the increased use of cultivated 566
areas for grazing. This may alleviate in part the pressure on the pastures. 567
568

Jansen, L.J.M., et al., 2005. Analysis of the spatio-temporal and semantic aspects of land-cover/use change 17/37
Though the ANFI project confirmed and quantified the poor state of forests and pastures in Albania, this 569
pessimistic situation also provides opportunities. The young stage of forests can be taken as starting 570
point for increasing carbon stocks in Albanian forests through sustainable forest use. Also degraded 571
lands and abandoned cultivated areas form potential areas for afforestation and reforestation. Although 572
Albania adopted the United Nations Framework Convention on Climate Change in 1995, it did ratify the 573
Kyoto Protocol only on the 1st of April 2005. Ratification is a necessary step to enter into the emission 574
trading schemes, including carbon credits, generated by afforestation and reforestation programmes. If 575
these activities are conducted on the basis of synergies among environmental principles, i.e. biodiversity 576
conservation, combating land degradation and carbon sequestration, these may contribute to develop 577
win-win opportunities between environmental protection and conservation, sustainable development and 578
economic growth. 579
580
Urbanisation occupies only a small area in the country but changes in spatial extent of built-up areas per 581
se do not appear to be central to this type of land-cover/use change. It is a misconception to think that a 582
change can be ignored if the area involved is only small. The importance of urbanisation lies in the fact 583
that it changes urban-rural linkages (Lambin et al., 2001). Consumption expectations in urban centres 584
are higher and will have an impact on areas much bigger than the cities themselves and located at 585
distance (e.g., fuel wood that will need to be brought from the forested areas). 586
587
With the present data on land-cover/use dynamics no statements can be made as to the state of land-588
cover/use classes because the tool of remote sensing is not sufficient. For the (Semi-) Natural 589
Vegetation classes one should consider that factors such as plant species composition (pastures), plant 590
height or wood volumes (forestry) very likely have changed over time. Nothing can be said in the 591
executed change analysis about the state of vegetation types (e.g., degenerated or not, decrease in tree 592
height or not, deterioration in species composition or not, etc.), the state of cultivated fields (e.g., in 593
active use, fallow or abandoned), or the state of urbanisation (e.g., increase in the number of floors of 594
buildings, decrease in the number of habitants per house, etc.) because these features cannot be derived 595
from satellite remote sensing. However, the forest inventory and grazing impact studies carried out in 596
the context of the ANFI project have provided information on the current state of forests and pastures 597
that can be used for monitoring purposes. 598
599
Privatisation of agricultural land has changed agricultural production considerably. Changes in the 600
intensity of use, (mal-) functioning of irrigation systems and land fragmentation should be considered 601
when analysing changes at the level of land-use. However, these factors cannot be measured with 602
remote sensing. Combination of the present study results with socio-economic data may provide more 603
conclusive evidence. 604
Jansen, L.J.M., et al., 2005. Analysis of the spatio-temporal and semantic aspects of land-cover/use change 18/37
605
Land-cover/use changes do not always occur in a progressive or gradual manner, but they may show 606
periods of rapid and abrupt change followed either by a quick recovery of ecosystems or a non-607
equilibrium trajectory (Lambin et al., 2003). In the present study only two years are available: 1991 608
describing the land-cover/use situation under the centralised government and 2001 in a market-oriented 609
economy. The mid 1990s are not represented but stand for the moment in which the land was distributed 610
to rural households and registration as private property took place. It would have been interesting to see 611
how the change dynamics evolved before and after registration as a study at detailed level indicates 612
(Jansen et al., 2005). 613
614
Considering the above-described limitations of remote sensing for analysis of land-cover/use dynamics, 615
one could state that the present results are more likely an underestimation of change than an 616
overestimation. If more land-use aspects and information would be integrated into the study, the area 617
subject to change would be likely to be more extensive. 618
619
The establishment of permanent forest inventory plots by the ANFI project together with the remote 620
sensing based national inventory of land-cover/use types provides DGFP and DSFD with the technical 621
capability to continue state-of-the-art forest and pasture resources assessments and monitoring 622
programs. The applied inventorying system allows replication of measurements and observations both in 623
the field and through remote sensing. The results show that it is not only important to monitor the extent 624
of natural resources areas but also the quality of these resources. This monitoring should be executed at 625
regular intervals, which hitherto has not been the case. The monitoring system should have a national 626
and a district component as the first is the level at which policies are formulated and the latter is the 627
level at which management takes place and laws should be enforced. Collaboration with the National 628
Environmental Monitoring Program of the Ministry of Environment should be strengthened in order to 629
apply international monitoring methodologies and to enhance the use of limited monitoring equipment. 630
The monitoring and information flow, however, should be focussed on the production of elements for 631
decision making in natural resources management. People’s participation in this democratic dialogue 632
should be promoted by increasing the influence of civil society in the decision-making processes. 633
634
635
Acknowledgements 636
637
The authors would like to gratefully acknowledge the World Bank financed Albanian National Forest 638
Inventory (Loan/credit 2846 ALB) project (www.anfiproject.org) of the Directorate General of Forests 639
and Pastures of the Ministry of Agriculture and Food, Tirana, Albania, and Agrotec S.p.A. 640

Jansen, L.J.M., et al., 2005. Analysis of the spatio-temporal and semantic aspects of land-cover/use change 19/37
(www.agrotec-spa.net), Rome, Italy, which executed the project in association with the Department of 641
Forest Science and Environment of the University La Tuscia, Viterbo, Italy. 642
643
644
References 645
646
Agrotec S.p.A.: 2003a, Interpretation of remote sensing imagery for land cover/use mapping. World 647
Bank Albanian National Forest Inventory project. Technical report 1. Agrotec S.p.A., Rome. 62p. 648
(authors: Jansen, L.J.M., Cerutti, P.O., Spisni, A., Carrai, G. and Morandini, L.). 649
Agrotec S.p.A.: 2003b, Analysis of the spatio-temporal and semantic aspects of land cover/use 650
dynamics. Technical report 2. World Bank Albanian National Forest Inventory project. Agrotec 651
S.p.A., Rome. 40p. (authors: Jansen, L.J.M., Carrai, G., Morandini, L., Cerutti, P.O. and Spisni, A.). 652
Agrotec S.p.A.: 2003c, Special study on grazing impact on wooded lands, including fuel wood 653
consumption assessment. Technical report. World Bank Albanian National Forest Inventory project. 654
Agrotec S.p.A., Rome. 68p. (author : Papanastasis, V.). 655
CEC: 1995, CORINE – Guide technique. Commission of the European Communities, Brussels. 656
CEC: 1999, Corine land cover. Commission of the European Communities, Brussels. 657
CEC: 2002, Albania - stabilisation and association report. Commission Staff Working Paper, 4 April 658
2002, Commission of the European Communities, Brussels. 659
Di Gregorio, A. and Jansen, L.J.M.: 2000, Land Cover Classification System (LCCS): classification 660
concepts and user manual. FAO/UNEP/Cooperazione italiana, Rome. 661
FAO: 2002, Proceedings of the FAO/UNEP expert consultation on strategies for global land cover 662
mapping and monitoring. Artimino, 6-8 May 2002. FAO, Rome. 663
Jansen, L.J.M.: 2004, Thematic harmonisation and analyses of Nordic data sets into Land Cover 664
Classification System (LCCS) terminology. In: Groom, G. (Ed.): 2004, Developments in strategic 665
landscape monitoring for the Nordic countries. Nordic Council of Ministers of Environment. ANP 666
2004/705:91-118. 667
Jansen, L.J.M., Carrai, G. and Petri, M.: 2005, Land-use change dynamics 1991-2003 at cadastral parcel 668
level in Albania: an object-oriented geo-database approach. Submitted to Environmental Modelling 669
and Assessment. 670
Jansen, L.J.M. and Di Gregorio, A.: 2002, Parametric land cover and land-use classification as tools for 671
environmental change detection. Agriculture, Ecosystems & Environment, 91(1-3): 89-100. 672
Jansen, L.J.M. and Di Gregorio, A.: 2004, Land Cover Classification System: basic concepts, main 673
software functions and overview of the “land system” approach. In: Groom, G. (Ed.): 2004, 674
Developments in strategic landscape monitoring for the Nordic countries. Nordic Council of 675
Ministers of Environment. ANP 2004/705: 64-73. 676

Jansen, L.J.M., et al., 2005. Analysis of the spatio-temporal and semantic aspects of land-cover/use change 20/37
Jansen, L.J.M., Mahamadou, H. and Sarfatti, P.: 2003, Land-cover change analyses using LCCS. 677
Journal of Agriculture and Environment for International Development, Vol. 97(1-2): 47-68. 678
Lambin, E.F., Geist, H.J. and Lepers, E.: 2003, Dynamics of land-use and land-cover change in tropical 679
regions. Annual Reviews of Environmental Resources, Vol. 28: 205-241. 680
Lambin, E.F., Rounsevell, M.D.A. and Geist, H.J.: 2000, Are agricultural land-use models able to 681
predict changes in land-use intensity? Agriculture, Ecosystems and Environment, Vol. 82: 321-331. 682
Lambin, E.F., Turner, B.L., Geist, H.J., Agbola, S.B., Angelsen, A., Bruce, J.W., Coomes, O.T., Dirzo, 683
R., Fischer, G., Folke, C., George, P.S., Homewood, K., Imbernon, J., Leemans, R., Li, X., Moran, 684
E.F., Mortimore, M., Ramakrishnan, P.S., Richards, J.F., Skånes, H., Steffen, W., Stone, G.D., 685
Svedin, U., Veldkamp. T.A., Vogel, C. and Xu, J.: 2001, The causes of land-use and land-cover 686
change: moving beyond the myths. Global environmental change, Vol. 11: 261-269. 687
LANES: 1998, Development of a harmonised framework for multi-purpose land cover/land use 688
information systems derived from earth observation data. Final Report. Concerted Action of the 689
European Commission, Research Programme on the Environment and Climate. CESD-690
Communautaire, Luxembourg. 691
McConnell, W.J. and Moran, E.F. (Eds.): 2001, Meeting in the middle: the challenge of meso-level 692
integration. An international workshop on the harmonization of land use and land cover 693
classification. LUCC Report Series No. 5. Anthropological Center for Training and Research on 694
Global Environmental Change - Indiana University and LUCC International Project Office, Louvain-695
la-Neuve. 696
Meyer, W.B. and Turner, B.L. (Eds.): 1994, Changes in land use and land cover: a global perspective. 697
Cambridge University Press, Cambridge, UK. 698
REC for Central and Eastern Europe: 2000, Strategic environmental analysis of Albania, Bosnia & 699
Herzegovina, Kosovo and Macedonia. Annex 1 – Country report Albania. Regional Environmental 700
Center for Central and Eastern Europe. 701
SDC/FAO/World Bank/Ministero degli Affari Esteri: 2003, Forestry project Albania. Swiss Agency for 702
Development and Cooperation/Food and Agricultural Organization of the United Nations, World 703
Bank/Italian Ministry of Foreign Affairs. 704
Swinnen, J.F.M.: 1999, The political economy of land reform choices in Central and Eastern Europe. 705
Economic of Transition, Vol. 7 (3): 637-664. 706
Swinnen, J.F.M.: 2000, Political and economic aspects of land reform and privatization in Central and 707
Eastern Europe. Paper prepared for the UDMS Conference Land Markets and Land Consolidation in 708
Central Europe, Delft. 709
UN-ECE: 1989, Proposed ECE standard international classification of land use. United Nations 710
Economic Commission for Europe, Geneva. 711

Jansen, L.J.M., et al., 2005. Analysis of the spatio-temporal and semantic aspects of land-cover/use change 21/37
UN-ECE: 2001, Environmental performance review of Albania. Report prepared for the eight session of 712
the Committee on Environmental Policy, November 2002. United Nations Economic Commission 713
for Europe, Geneva. 714
UNEP: 1999, State of the environment report Albania. United Nations Environmental Programme, 715
Nairobi. (Available at http://enrin.grida.no/allsoe.cfm) 716
Veldkamp, A, Kok, K., De Koning, G.H.J., Verburg, P.H. and Bergsma, A.R.: 2001, The need for 717
multi-scale approaches in spatial specific land-use change modelling. Environmental Modelling and 718
Assessment, Vol. 6: 111-121. 719
Verburg, P.H., De Groot, W.T. and Veldkamp, A.: 2003, Methodology for multi-scale land-use change 720
modelling - concepts and challenges. In: Dolman, A.J., Verhagen, A. and Rovers, C.A.: 2003, 721
Global environmental change and land-use. Kluwer Academic Publishers, Dordrecht. pp. 17-51. 722
Walker, B.: 1998, GCTE and LUCC – a natural and timely partnership. LUCC Newsletter 3. pp 3-4. 723
Walker, B., Steffen, W., Canadell, J. and Ingram, J. (Eds.): 1997, The terrestrial biosphere and global 724
change: implications for natural and managed ecosystems. Synthesis volume. IGBP Book Series 4. 725
Cambridge University Press, Cambridge, UK. 726
World Fact Book: 2005, Available at http://www.odci.gov/cia/publications/factbook/geos/al.html. 727
Wyatt, B.K.: 2000, Remote sensing of land cover and land-cover change. In: Verstraete, M.M., Menenti, 728
M. and Peltoniemi, J.: 2000, Observing land from space: science, customers and technology, 1-2. 729
Kluwer Academic Publishers, Dordrecht. 730
731

Jansen, L.J.M., et al., 2005. Analysis of the spatio-temporal and semantic aspects of land-cover/use change 22/37
Figure 1. Physical implications of land-cover/use change mapping 731
D.
Overestimated change
q
r
q
o
p
A.
Baseline landcover
a
b
c
C.
Change: m, e, g
d
m
e
g
f
n
Past land cover (aggregated view)
p
r
q
oE.
B.
b1
Edited border
Past land cover (disaggregated view)
a1
c1
Edited border
b3
a2
a3 b2
732

Jansen, L.J.M., et al., 2005. Analysis of the spatio-temporal and semantic aspects of land-cover/use change 23/37
Figure 2. A possible space-time path for a Land Cover Boundary (LCB) 733
734
space
time
interpretation
verification
validation
revision
draft
new
old
obsolete
creation
existence
demise

Jansen, L.J.M., et al., 2005. Analysis of the spatio-temporal and semantic aspects of land-cover/use change 24/37
Figure 3. Land-cover/use change by LCCS domain or land cover groupa 734
AV
HC
FO
B
FO
M
WLC
TS
BU
WB
AV
HC
FOB
FOM
WLCTS
BUWB
0
10000
20000
30000
40000
50000
60000
Cha
nge
(in H
a)
Land cover/use domains/groups 2001
Land cover/use
domains/groups 1991
AV
TC
HC
ML
FOB
FOC
FOM
WLB
WLC
WLM
TS
GL
BU
BA
WB
735 a AV=Aquatic vegetation, TC=Tree and shrub crops, HC=Herbaceous crops, ML=Managed lands, FOB=Broadleaved 736
forests, FOC=Coniferous forests, FOM=Mixed forests, WLB=Broadleaved woodlands, WLC=Coniferous woodlands, 737
WLM=Mixed woodlands, TS=Thickets and shrublands, GL=Grasslands, BU=Built-up areas, BA=Bare areas, 738
WB=Water bodies. 739
740

Jansen, L.J.M., et al., 2005. Analysis of the spatio-temporal and semantic aspects of land-cover/use change 25/37
Figure 4. Spatial distribution of the change “Broadleaved deciduous (open) forest, usually coppice” mixed with 740 “Cultivated areas with herbaceous crops on sloping land” into “Cultivated areas with herbaceous crops on sloping 741 land”(dark colour) 742
743 744
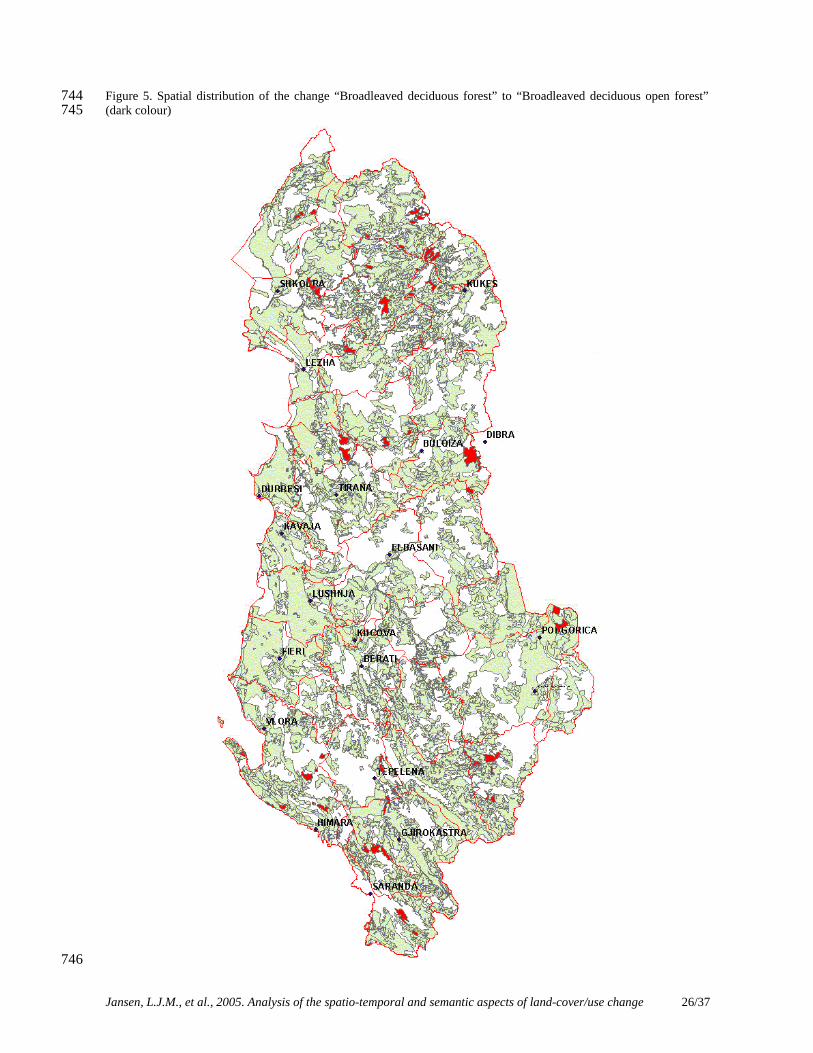
Jansen, L.J.M., et al., 2005. Analysis of the spatio-temporal and semantic aspects of land-cover/use change 26/37
Figure 5. Spatial distribution of the change “Broadleaved deciduous forest” to “Broadleaved deciduous open forest” 744 (dark colour) 745
746

Jansen, L.J.M., et al., 2005. Analysis of the spatio-temporal and semantic aspects of land-cover/use change 27/37
Figure 6. Spatial distribution of the changes “Broadleaved deciduous open forest” into “Sparse trees and shrubs with 747 open to closed grass cover and rock outcrops” and into “Sparse trees and shrubs with very open grass cover and rock 748 outcrops” (dark colour) 749
750

Jansen, L.J.M., et al., 2005. Analysis of the spatio-temporal and semantic aspects of land-cover/use change 28/37
Figure 7. Changes in spatial extent of the LCCS domainsa 751
0
5
10
15
20
25
AV TC HC ML FOB FOC FOM WLB WLC WLM TH SL GL BU BA WB
Land cover/use group or domain
Are
a (%
)
1991 2001 752
a For explanation of the codes see Figure 3. 753
754

Jansen, L.J.M., et al., 2005. Analysis of the spatio-temporal and semantic aspects of land-cover/use change 29/37
Figure 8. Absolute changes in spatial extent of the LCCS domains (A) and the Forest and Woodland groups in 754 particular (B) a 755
(a) 756
-40
-20
0
20
40
60
80
100
FO TH ML TC HC BA SL AV GL WL WB BU
Land cover/use domains
Gro
wth
(in
%)
757 (b) 758
-50
0
50
100
150
200
250
300
350
FOB FOC FOM WLB WLC WLM
Forest and Woodland groups
Gro
wth
(%
)
759 a For the codes used see Figure 3. 760

Jansen, L.J.M., et al., 2005. Analysis of the spatio-temporal and semantic aspects of land-cover/use change 30/37
Figure 9. Overview of the most important change dynamics at district level (percentages refer to total change within the district) 761
FOB to GL FOB to HCFOB to WLB
FOC to GLWLB to GL HC to BU762

Jansen, L.J.M., et al., 2005. Analysis of the spatio-temporal and semantic aspects of land-cover/use change 31/37
Table 1. Landsat 7 ETM+ and 5 TM frames used for interpretation 763
Acquisition Date Landsat Path-Row
Landsat 7 ETM+ Landsat 5 TM
185-032 25 October 2000 19 June 2000 23 September 1991
9 September 1992
3 June 1991
186-031 3 October 2001 9 May 2000 30 September 1991 9 May 1991
186-032 3 October 2001 28 May 2001 14 September 1991 9 May 1991
764
765
Jansen, L.J.M., et al., 2005. Analysis of the spatio-temporal and semantic aspects of land-cover/use change 32/37
Table 2. The Brovey fusion formula 765
R=4, G=5, B=3, I=panchromatic band
Red layer Green layer Blue layer
[R/(R+G+B)]*I [G/(R+G+B)]*I [B/(R+G+B)]*I
766
Jansen, L.J.M., et al., 2005. Analysis of the spatio-temporal and semantic aspects of land-cover/use change 33/37
Table 3. The land-cover/use classes with overall accuracy of 85 % at land cover group level (Agrotec S.p.A. 2003a, b) 767
LCCS Category LCCS LC domain LC Group User description User label
Dichotomous Phase Aquatic Vegetation
(AV) Aquatic vegetation 0AQ
Broadleaved arboriculture mainly for wood/timber production. Plantation with Populus spp. and Juglans
spp. 1AB
Coniferous arboriculture mainly for wood/timber production. Plantation with Pinus spp. 1AC Tree and Shrub Crops
(TC)
Fruit trees or shrub crops; when the crop is young and still unproductive another crop may be intercropped
on the same field. 1FR
Cultivated areas with herbaceous crops on level land; when not in actual use the fallow field area may be
used for pasture. 1CU
Herbaceous Crops (HC)
Cultivated areas with herbaceous crops on sloping land; when not in actual use the fallow field area may be
used for pasture. 1CS
Cultivated areas and
managed lands
(A11)
Managed Lands (ML) Vegetated Urban Area(s)/Park(s) (green areas inside built-up areas). 1UP
Broadleaved evergreen forest 2BE
Broadleaved deciduous forest. Quercus spp. and/or Ostrya spp. are dominant, usually coppice 2BD
Creek and riverine broadleaved deciduous forest 2CR Broadleaved
(FOB) Broadleaved deciduous forest with dominant Fagus silvatica. 'Mixed' means a mixture of broadleaved
species. 2FS
Coniferous forest (Med.) on level land 2CA
Coniferous forest (Sub-Med.) on sloping land 2CB
Coniferous forest (Alpine) on steep land 2CC
Coniferous
(FOC)
Coniferous forest (Med.) on level land / Beaches (The code for this class is: 2CA/6BC). COB
(Semi-) natural
vegetation
(A12 and A24)
Forests (FO)
Mixed
(FOM) Fagus silvatica pure and mixed with coniferous forest (<30%) 2FC
Jansen, L.J.M., et al., 2005. Analysis of the spatio-temporal and semantic aspects of land-cover/use change 34/37
LCCS Category LCCS LC domain LC Group User description User label
Forests or Woodlands
Broadleaved deciduous forest. Quercus spp. and/or Ostrya spp. dominant, usually coppice / Cultivated areas
with herbaceous crops on sloping land (The codes for this mixed class are: 2BD/1CS or 2BD/1FR or
2DO/1CS or 2DO/1FR; rare to have 1CU inside).
CXB
Broadleaved evergreen woodland 2EO
Broadleaved deciduous open forest. Quercus spp. are dominant (coppice) 2DO Broadleaved
(WLB) Broadleaved deciduous open forest with Fagus silvatica dominating. 'Mixed' means a mixture of
broadleaved species. 2FB
Coniferous open forest (Med.) on level land 2OA
Coniferous open forest (Sub-Med.) on sloping land 2OB Coniferous
(WLC) Coniferous open forest (Alpine) on steep land 2OC
Woodlands (WL)
Mixed
(WLM) Fagus silvatica pure and mixed with coniferous open forest (<30%) 2FO
Mediterranean macchia 2MM
Mediterranean macchia/Broadleaved deciduous forest. Quercus spp. and/or Ostrya spp. are dominant,
usually coppice.
(The codes for this mixed class are: 2MM/2BD or 2MM/2DO or 2MG/2BD or 2MG/2DO).
MXB
Maquis and garigue. (incl. low Med. macchia) 2MG
Thickets and
Shrublands (TS)
Maquis and garigue. (incl. low Med. macchia) / Cultivated areas with herbaceous crops on sloping land
(The codes for this mixed class are: 2MG/1CS or 2MG/1FR or 2MM/1CS or 2MM/1FR; rare to find 1CU
inside).
CXM
Sparse trees and shrubs with open to closed grass cover and rock outcrops; these areas are used as pastures. 2SR
Grasslands/Pastures
(GL) Sparse trees and shrubs with very open grass cover and rock outcrops; these areas are used as pastures. 2GR
Artificial Surfaces
(B15) Built Up Areas (BU) Built-up areas. Urban and industrial areas (including road network) 5UR
Bare areas Bare Areas (BA) Beaches 6BC

Jansen, L.J.M., et al., 2005. Analysis of the spatio-temporal and semantic aspects of land-cover/use change 35/37
LCCS Category LCCS LC domain LC Group User description User label
(B16)
Bare rocks and/or soils (includes bare areas due to human activities such as mining or environmental
degradation). 6RS
Artificial perennial water bodies 7AA Water bodies
(B27 and B28) Water Bodies (WB)
Natural perennial water bodies 8AN
768
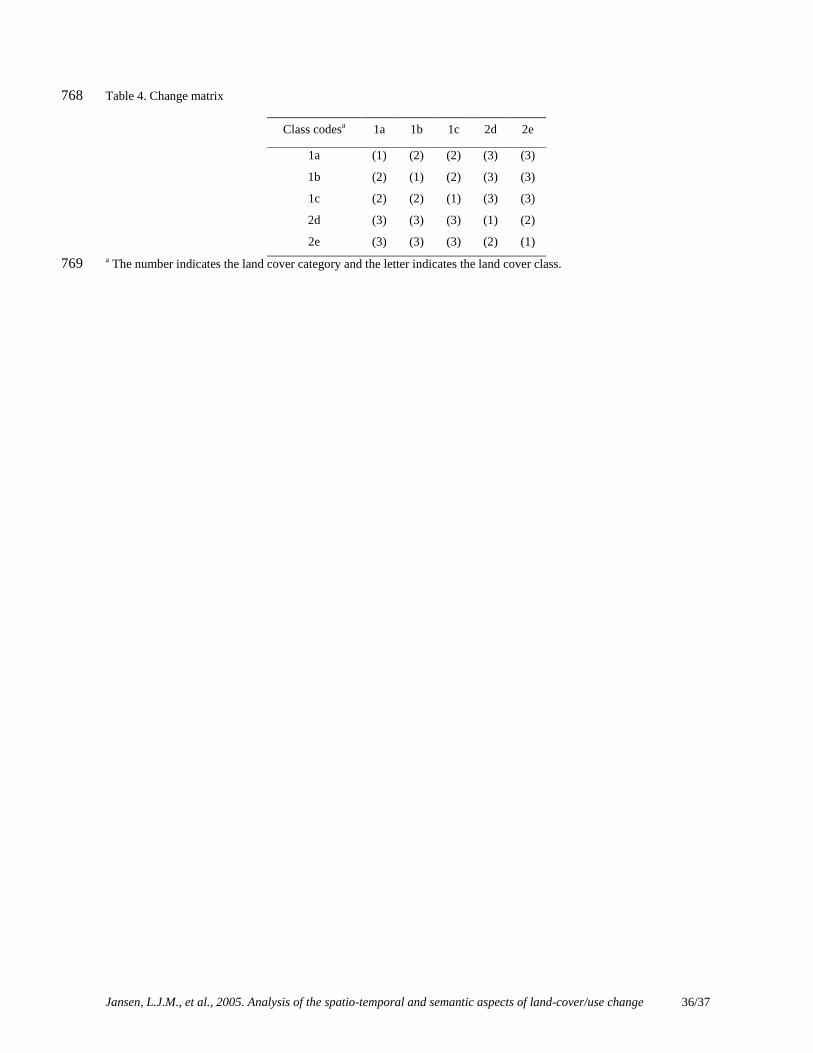
Jansen, L.J.M., et al., 2005. Analysis of the spatio-temporal and semantic aspects of land-cover/use change 36/37
Table 4. Change matrix 768
Class codesa 1a 1b 1c 2d 2e
1a (1) (2) (2) (3) (3)
1b (2) (1) (2) (3) (3)
1c (2) (2) (1) (3) (3)
2d (3) (3) (3) (1) (2)
2e (3) (3) (3) (2) (1) a The number indicates the land cover category and the letter indicates the land cover class. 769

Jansen, L.J.M., et al., 2005. Analysis of the spatio-temporal and semantic aspects of land-cover/use change 37/37
Table 5. Modification and conversion of the vegetated areas subject to change at LCCS domain levela 770
Area Area LCCS Domains Modifications
Ha % Conversions*
Ha %
Forests within FO 10351 3.1 from FO to HC 56977 17.3
from FO to WL 84390 25.6 from FO to BU 2518 0.8
from FO to TS 12026 3.7 from FO to BA 3384 1.0
from FO to GL 25896 7.9
Woodlands within WL 983 0.3 from WL to HC 1161 0.4
from WL to FO 6621 2.0 from WL to BU 367 0.1
from WL to TS 8417 2.6 from WL to BA 3457 1.0
from WL to GL 23717 7.2
Thickets & Shrublands within TS 12683 3.9 from TS to HC 1802 0.5
from TS to FO 10456 3.2 from TS to BU 663 0.2
from TS to WL 4281 1.3 from TS to BA 334 0.1
from TS to GL 6937 2.1
Grasslands within GL 7760 2.4 from GL to HC 397 0.1
from GL to FO 817 0.2 from GL to BU 742 0.2
from GL to WL 2223 0.7 from GL to BA 5346 1.6
from GL to TS 4702 1.4 a For the codes used see Figure 3. 771